
Volume calculation of subsurface structures and traps in ...

Contributions to Geophysics and Geodesy Vol. 41/1, 2011 (45–72)
Subsurface structural mapping ofNorthern Nasser Lake region, Aswan,Egypt, using Bouguer data
Salah SALEH1
1National Research Institute of Astronomy and Geophysics; Helwan, Cairo, Egypt;e-mail: [email protected]
Abstract: In this study, we attempt to delineate the subsurface structures for thetectonic active region of Northern Nasser Lake using integrated interpretation techniquesof gravity data with seismicity. The depths to the gravity sources, and the locations of thecontacts of density contrast were estimated. Two methods were used for estimating sourcedepths and contact locations: horizontal gradient (HG) and Euler deconvolution methods.Moreover, power spectral analysis, bandpass and upward continuation techniques wereapplied to evaluate the shallow and deep seated structures. Shallow depth structureswere ranging between 0.30 km and 0.80 km. However, two average levels (interfaces) atdepth 3.1 km and 7.2 km below the measuring level were revealed for the intermediateand deep seated structures respectively. Results of Euler deconvolution method suggestedthat, in the eastern part of the area, the basement could be observed on the ground and hasbecome deeper in the central part. The interpreted structural map reveals that the area isaffected by a set of faults trending mainly in the NW, E–W, N–S and NE–SW directions.Actually, this map has confirmed the idea that the intersections between the N–S and E–W striking faults along Nasser Lake area have generated seismic pulses. Moreover, threeseismic zones (Z1, Z2 and Z3) are well correlated with the fault trends of the subsurfacestructures as derived from the horizontal gradient map. The present results suggest thatthere exist seismically-active fault east of High Dam, passing throughout Aswan reservoirfrom north to south. This fault is occupying region of high stress values which maygenerate large earthquakes in future, as it has long extension over several kilometers.Furthermore, the evaluated intruded volcanic bodies are found almost at the intersectionsbetween the E–W and NW oriented faults. Finally, the area is dissected by basementuplifts and troughs controlled mainly by the NW–SE faults.
Key words: Aswan reservoir Lake Egypt, Bouguer data, Euler deconvolution, horizontalgradient, power spectral analysis, filtering
1. Introduction
The study area is occupied by northern part of Nasser Lake (Fig. 1), which
45doi: 10.2478/v10126-011-0003-2

Saleh S.: Subsurface structural mapping of Northern. . . (45–72)
has started to fill due to the Aswan High Dam construction early in 1964,and to form one of the largest man-made reservoirs in the world. It isextended over 500 km in southern Egypt and northern Sudan along themain course of the River Nile. The Aswan High Dam is considered as aunique structure among all large irrigation and electric power projects inthe world. It was evident through previous geological and geophysical stud-ies that Nasser Lake has affected the tectonic stability of the Aswan region,since water penetration through open fractures and other tectonically weakzones in the submerged land has significantly contributed to further fractur-
Fig. 1. Location map of the area of study. The E–W and the N–S fault systems are alsoshown. The location of subsurface lithologic log of drilled well (W1) is also shown (seeFig. 3).
46

Contributions to Geophysics and Geodesy Vol. 41/1, 2011 (45–72)
ing and reactivation of some pre-existing faults (Kamel and Elsirafe, 1993).The gravity method is one of the best geophysical techniques for de-
lineating subsurface structures. The present study is based on qualitativeand quantitative analysis of the gravity data to delineate both shallow anddeep basement structures and present a new perspective on the subsur-face structural setting at Nasser Lake area. For that purpose, the gravitydata were subjected to spectral analysis in order to distinguish deep sourcesfrom shallow sources. The data were transformed to the frequency domainand regional/residual separation was made using bandpass filter based onthe power spectrum. We attempt also to map the subsurface structureand estimate the depth to the basement and the location of some intruded(volcanic) bodies which erupted beneath the area of Nasser Lake (in theUpper Cretaceous era) during the regional uplift associated with the north-ern Red Sea rifting. This study is based on the analysis and interpretationof the Bouguer gravity data applications of gradients (filtering, horizontalgradient, and Euler deconvolution) and also on the available surface andsubsurface geologic information. The advantage of these techniques is thatthey provide source location parameters using only a few assumptions.As far as earthquakes are concerned, it is necessary to correlate between
the seismicity and subsurface structures for seismic sources identification;especially if the study area includes the High Dam. As the populationof Aswan is getting agglomerated in the form of urban clusters and greatprojects, the risk of economic and human loss due to seismic hazard is in-creasing. This study provides the seismic segments in north Aswan area,where the High Dam exists, as an important requirement for earthquakeengineering and in seismic micro-zonation study.
2. Surface geology, structural setting and seismicity of thereservoir area
Nasser Lake overlies mainly the basement rocks (Precambrian rocks), whichis outcropping on the eastern bank of the Lake. Igneous and metamorphicrocks made up the Precambrian formation (Fig. 2). The Nubian Sandstoneis flat lying, relatively unreformed and gently dipping west, while it rangesin thickness from 250 to 400 m beneath the western extent of the reservoir
47

Saleh S.: Subsurface structural mapping of Northern. . . (45–72)
Fig. 2. Simplified geological map of the studied region (modified from Issawi, 1969). Theactive seismic zones are shown in the figures. Also, the location of subsurface lithologiclog of drilled well (W1) is shown.
(Issawi, 1969; 1978; 1982). Most of the southwestern part of Aswan regionis covered with forel and sediments ranging in age from Cretaceous to Qua-ternary, with some exposures of igneous and metamorphic rocks (Fig. 2).The sedimentary section in the studied area is thin and consists of a succes-sion which unconformable overlies the basement rocks (Fig. 3). The studiedarea belongs to the stable shelf (Said 1962). In other modified classification,it is included in the Archican Nubian shelf (Meshref, 1990; Fig. 4).Structurally, the region is cut by a coupled set of E–W and N–S faults
(Figs. 2 and 5), which appear to be vertical and extending into the graniticbasement (Issawi, 1978). These two sets intersect beneath the Gebel Marawaarea (Fig. 2). The Kalabsha E–W fault strikes through the center of WadiKalabsha, passing south of the Limestone plateau (Sinn El-Kaddab plateau).The most prominent topographic feature in the Nubian plane is GebelMarawa, an outlying remnant of the limestone plateau, which lies in a slightsynclinal depression on the Kalabsha fault directly above the most activezone of seismicity (Fig. 5). A number of the synclines are found along thefault, associated with minor pull-apart structure, which may be related tothe offset, strike-slip segments of the Kalabsha fault. Some of the faulttrends show surface topographic expression as lineation of highly resistant
48

Contributions to Geophysics and Geodesy Vol. 41/1, 2011 (45–72)
ridges. These ridges are formed of iron-rich material that permeates thefault zones. This material is of lower permeability than the surroundingsandstone, so that the fault segments may form vertical dykes and preventhorizontal water spreading towards west. The November 1981 earthquakeand the subsequent seismicity have occurred mainly on the Kalabsha faulttrends, beneath the largest embayment (Wadi Kalabsha), which extendswestward 30 km from the main body of the reservoir.
Fig. 3. Subsurface lithologic log of W1drilled well (location is shown in Figs. 1and 2).
The Aswan High Dam is located ina region of very infrequent earthquakesoccurrence as revealed by the long his-torical record extending to Pharaonictimes (Kebeasy, 1990; WCC, 1985). Onthe other hand, instrumental cataloguesreport no events within 20 km aroundthe Aswan area (Kebeasy and Gharib,1991). However, it appears that somelow magnitude seismic activity may haveoccurred near the reservoir, after fillingbegan and prior to November 1981 (Ke-beasy et al., 1982). On 14 November1981, an earthquake of magnitude Ms =5.3 took place in the Kalabsha area, fol-lowed by numerous aftershocks. Mainly,the seismicity of the area is concentratedalong Kalabsha fault, including someseismic swarms occurred in 1982, 1983,1984 and 1987.Seismic active zone of Aswan is the
closest active seismic zone to the HighDam, the main project of Egypt thatcontrols the electricity and irrigation.Because of the presence of the first lo-
cal seismic network around the area, some detailed studies were carried outconcerning the seismic activity in the area, for the safety purpose of theHigh Dam, e.g. Mohamed (1997; 2001).Mohamed et al. (2008) have modified the seismicity map of Aswan area
49

Saleh S.: Subsurface structural mapping of Northern. . . (45–72)
Fig. 4. Sketch of the structural aspects of Egypt (compiled after Meshrif, 1990).
during the period 1981–2006, which shows the following eight seismic clus-ters (Fig. 5); these zones were grouped according to spatial distribution andthe level of the seismicity as what follows:1 – West High Dam zone, 2 – Northern old stream channel zone, 3 – South-ern old stream channel zone, 4 – Gable Marawa zone (GMR), 5 – East GableMarawa, 6 – East – East Gable Marawa, 7 – Khor El-Ramla zone, 8 – Abu
50
Contributions to Geophysics and Geodesy Vol. 41/1, 2011 (45–72)
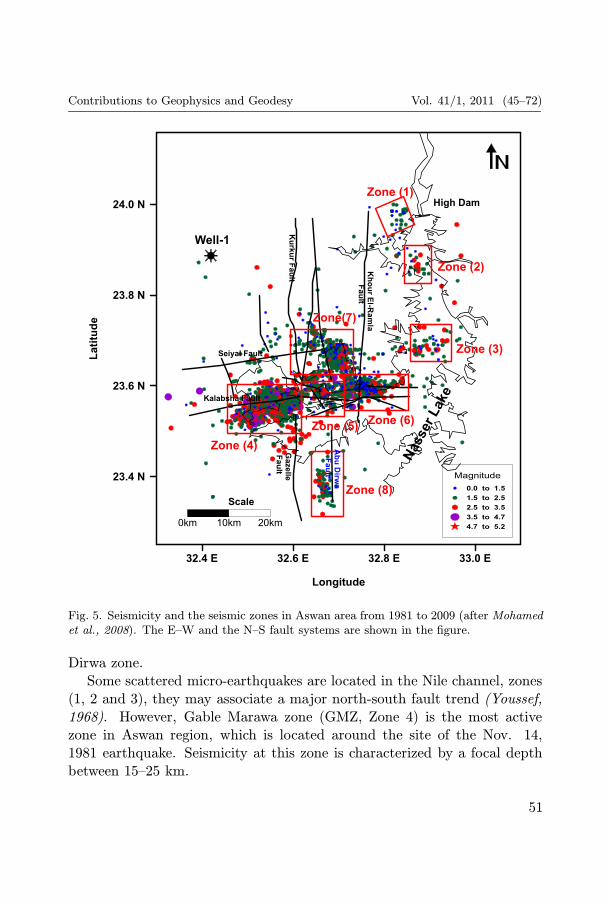
Fig. 5. Seismicity and the seismic zones in Aswan area from 1981 to 2009 (after Mohamedet al., 2008). The E–W and the N–S fault systems are shown in the figure.
Dirwa zone.Some scattered micro-earthquakes are located in the Nile channel, zones
(1, 2 and 3), they may associate a major north-south fault trend (Youssef,1968). However, Gable Marawa zone (GMZ, Zone 4) is the most activezone in Aswan region, which is located around the site of the Nov. 14,1981 earthquake. Seismicity at this zone is characterized by a focal depthbetween 15–25 km.
51

Saleh S.: Subsurface structural mapping of Northern. . . (45–72)
Zone 5 lies to the east of GMR seismic zone and is characterized by afocal depth ranging from 2–7 km. To the east of zone 5, zone 6 is located; itis characterized by shallow seismic events, with the focal depth in the rangeof 1–3 km. The zone 7 is the second active zone in the area; it representsthe activity along Khor El-Ramla fault beneath Khore El-Ramla depres-sion, the edge of water container closet to the original channel (Fig. 5). It ischaracterized by a seismic activity of focal depth extending down to 8 km.Also, others are scattered around Abu Dirwa fault, representing zone 8.
3. Gravity data analysis
In 2000 National Research Institute of Astronomy and Geophysics car-ried out detailed gravity survey of the area surrounding the northern partof Nasser Lake using Lacoste-Romberg G-type gravitymeter with an accu-racy of 0.01 mGal (10−5 m/s2). The elevation of gravity stations are mea-sured using geodetic leveling and in some cases electronic altimeter with anoverall accuracy of better than ±0.2 mGal in computed Bouguer anomaly.The gravity data is processed using IGSN, 1971, for a standard densityof 2670 kg/m3 for the Bouguer slab15. The overall accuracy of Bougueranomaly map prepared from this data is about ±0.01 mGal and is goodenough for the present study.New Bouguer anomaly map was compiled for Aswan active region based
on Bouguer data which have been surveyed in 1989 and 2000 by the Na-tional Research Institute of Astronomy and Geophysics (NRIAG, Fig. 6).The compiled Bouguer gravity map (Fig. 6) is now available for eval-
uating subsurface structures using different techniques. This map can bedivided into a number of distinct areas based on the anomaly size, trendand gradient, which can be related to the geological subsurface structures.This map shows pronounced gravity highs and lows, representing the
structural trends of this region. It remarkably shows the gravity gradientsexpressed by the faults of subsurface structures. The predominant trends ofanomalies are generally striking in E–W, NW–SE and NE–SW directions.The anomaly map depicts a northern gravity high (H1) with a relief of
around –20 to –30 mGal coinciding with the northern part of High Damwith a width of nearly 15 km. Two other high anomalies (H2 and H3) with
52

Contributions to Geophysics and Geodesy Vol. 41/1, 2011 (45–72)
Fig. 6. Bouguer anomaly map of northern part of Nasser Lake. The E–W and the N–Sfault systems are shown in the figure.
gravity values exceeding –15 mGal occupy the north western parts of thestudy region. Their trends are E–W and NNW–SSE, respectively.A zone of negative gravity value extends in the western region containing
three low anomalies, two of them (L1 and L2) form an elongated NE–SWnegative gravity anomaly (–34 mGal).Moreover, the third low anomaly (L3) is located at the northern end of
Kurkur fault systems. Whereas the fourth low anomaly (L4) with a gravityvalue less than –35 mGals is trending in NW-SE direction as shown in Fig. 6.Further south an alternative gravity high and low anomalies were observed,covering Kalabsha and Seiyal active region in the southern western corner
53

Saleh S.: Subsurface structural mapping of Northern. . . (45–72)
for the region of study.Eastern area of Nasser Lake is occupied by negative low anomaly (L5)
striking in NE–SW direction. This low gravity zone has a Bouguer anomalyvalue of about –30 mGal. The circular gravity highs (H1) and (H2) witha relief of around mGal is pointing out the existence of intrusive bodies inthis area, similar to volcanic plugs of Aswan active region and coincidentallythese highs are located near the epicenters of the most earthquakes in thisregion.
3.1. Spectral analysis and filtering of gravity data
The power spectral analysis yields the depths of significant density con-trasts in the crust, where there is little information on the crustal structure.Spector and Bhattacharyya (1966) studied the energy spectrum calculatedfrom different 3-D model configurations; Spector and Grant (1970) studiedthe statistical ensemble of 3-D maps. They concluded that the general formof the spectrum displays contributions from different factors and can beexpressed as:
E(r, ϑ) = 〈H(h, r)〉 〈S(a, b, r, ϑ)〉 〈C(t,Φ, r)〉, (1)
whereE – total energy;r = 2π(f 2x + f2y )
1/2 – radial wave number (r = 2πf , where frequency f canbe measured in any direction in the x-y plane);θ = tan−1(fx/fy) – azimuth of the radial wave number;〈〉 – expresses ensemble average;h – depth;H – depth factor;S – horizontal size (width) factor;C – vertical size (thickness or depth extent) factor;a, b – parameters related to the horizontal dimensions of the source;t,Φ – parameters related to the vertical depth extent of the source.It is clear that only three factors (H,S, and C) are functions of the radial
frequency r; thus in the case of profile form, Eq. (1) can be written as:
lnE(q) = lnH(h, q) + lnS(a, q) + lnC(t,Φ, q) + constant, (2)
54
Contributions to Geophysics and Geodesy Vol. 41/1, 2011 (45–72)
where h, a, t are the average depth, half width and thickness of a sourceensemble, and q = 2πf .This equation demonstrates that contributions from the depth, width
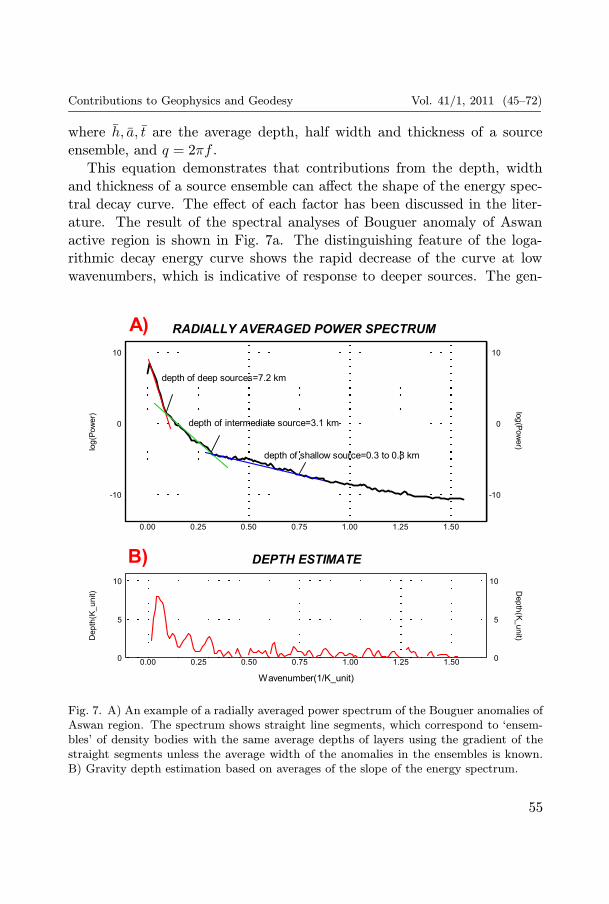
and thickness of a source ensemble can affect the shape of the energy spec-tral decay curve. The effect of each factor has been discussed in the liter-ature. The result of the spectral analyses of Bouguer anomaly of Aswanactive region is shown in Fig. 7a. The distinguishing feature of the loga-rithmic decay energy curve shows the rapid decrease of the curve at lowwavenumbers, which is indicative of response to deeper sources. The gen-
Fig. 7. A) An example of a radially averaged power spectrum of the Bouguer anomalies ofAswan region. The spectrum shows straight line segments, which correspond to ‘ensem-bles’ of density bodies with the same average depths of layers using the gradient of thestraight segments unless the average width of the anomalies in the ensembles is known.B) Gravity depth estimation based on averages of the slope of the energy spectrum.
55

Saleh S.: Subsurface structural mapping of Northern. . . (45–72)
tler decline of the remainder of the curve relates to the near-surface sources.The spectrum consists essentially of three components: a very steep part atlow wavenumbers (0 km−1 ≤ wavenumber ≤ 0.0750 km−1) and a less steeppart at moderate wavenumbers (0.075 km−1 ≤ wavenumber ≤ 0.325 km−1).Moreover, a gentle part at high wavenumbers (0.325 km−1 ≤ wavenumber≤ 1.55 km−1) was observed. This negative asymptotic character shows thatthe gravity data has three components:
– A regional component of long wavelength from deep-seated sources.– An intermediate component of middle wavelength from intermediate-seated sources.
– A local component caused by sources at shallow depth, e.g., basementand/or volcanic rocks.
Between 0 km−1 and 0.0750 km−1, the contribution of the regional com-ponent decreases as the wavenumber value increases at the near-surfacecomponent. At wavenumber equal to 1.050 km−1, the curve describes thenoise, produced by the digitization errors and finite sample interval, as fluc-tuations about a constant level of energy. The depth of the gravity sourcescan be estimated and the field components can be separated by bandpassfiltering of the field.
3.2. Effect of the source depth
The depth to the source ensemble is the main factor which controls theshape of the energy spectral decay curve. It is expressed as
H(h, q) = e2hq. (3)
Depths to deeper and shallower sources are described by the decay slopes ofthe curve at lower and higher frequencies, respectively. The slope of the linefitted to any linear segment of the curve can be used to compute either thedepth to the causative source or the mean depth to a corresponding groupof sources having comparable depths.It is clear from Eq. (2) that if S = C = 1(a > h and t < h), then the
equation will be reduced to
lnE(q) = lnH(h, q) + constant, (4)
56

Contributions to Geophysics and Geodesy Vol. 41/1, 2011 (45–72)
but from Eq. (3)
lnH(h, q) = −2hq. (5)
Hence the depth to the top of the source (h) can be computed from theslope as follows: h = −s/2 if E is plotted against q or h = −s/4π if E isplotted against f .h is the depth, s is the slope of the log (energy) spectrum and q is thewavenumber at frequency f (spatial frequency), where slope = lnE(q) andq = 2π f .Two different approaches can be used to interpret the investigated depth:
1) the point average calculation from the slope of the energy curve; 2) thelinear segments of the energy decay curve, with distinguishable slopes, thatare attributed to contributions in the gravity data from sources at variousdepths, which is used in this paper. Figure 7b shows the gravity depthestimated from the power spectral analyses of Bouguer anomaly of Aswanregion. Three different layers can be separated: the first layer is charac-terized by the near surface contribution, the depth may vary from 0.3 to0.8 km; the second layer is characterized by the intermediate-seated con-tributions, the depth is from 0.8–3.1 km and the deep-seated contribution,the depth may change from 3.1. to about 7.2 km depth. The estimateddepth value of deep seated structures (the high velocity layer) using thistechnique is well correlated with 3D velocity structural results of Haggag etal. (2009).
3.3. Horizontal gradient (HG) gravity map
The horizontal gradient method has been used intensively to locate bound-aries of density contrast from gravity data or pseudogravity data statedthat the horizontal gradient of the gravity anomaly caused by a tabularbody tends to overlie the edges of the body if the edges are vertical and wellseparated from each other (Cordell, 1979; 1985).The gravity data were employed for making interpretations about sub-
surface geology in terms of density contrast, which is typically not directlyrecognized on the surface. Analysis of the gravity data contributes to imag-ing the subsurface structure of the study area. As such, two filters were
57

Saleh S.: Subsurface structural mapping of Northern. . . (45–72)
used in order to enhance the gravity, including the horizontal gradient fil-ter and the Euler deconvolution. The horizontal-gradient method has beenused since 1982 to locate density/magnetic boundaries from gravity dataor pseudogravity data (Cordell and Grauch, 1985). The method is basedon the principle that a near-vertical fault-like boundary produces a gravityanomaly with a horizontal gradient that is largest directly over the top edgeof the boundary.The greatest advantage of the horizontal gradient method is that it is
least susceptible to noise in the data, because it only requires the calcu-lations of the two first-order horizontal derivatives of the field (Phillips,1998). The method is also appropriate in delineating both shallow and deepsources, in comparison with the vertical gradient method, which is usefulonly in identifying shallower structures. The amplitude of the horizontalgradient (Cordell and Grauch, 1985) is expressed as:
HGg(x, y) =
√(∂g
∂x
)2+
(∂g
∂y
)2, (6)
where ∂g/∂x and ∂g/∂y and are the horizontal derivatives of the gravityfield in the x and y directions. The amplitude of the horizontal gradient forthe regional data of the Aswan area was calculated in the frequency domainand is illustrated in Fig. 8.Generally, magnetic data can be transformed to pseudo-gravity data us-
ing Fourier techniques (Blakely and Simpson, 1986) such that they behavelike gravity data. Thus, the horizontal gradient of pseudo-gravity also hasa maximum magnitude directly over the boundary. The horizontal gradientcontour lines mark the top edges of magnetic or density boundaries.In this study, the horizontal gradient filter provides high values over the
faults or contacts. Blakley and Simpson (1986) proposed a method to selectthe highest values of the gridded data at which the faults or contacts arelocated.Figure 8 shows the horizontal gradient map for the gravity data in the
study area using Fourier techniques (Blakely and Simpson, 1986). The bluelines represent the boundaries/contacts that were interpreted from the map.The interpreted structural map using HG reveals that the area is affectedby a set of faults trending mainly in the NW, E–W, N–S and NE–SW di-rections.
58

Contributions to Geophysics and Geodesy Vol. 41/1, 2011 (45–72)
High gradient values were observed around the low gravity at north ofKalabsha active region extending to the northeastern side of the area ofstudy. It is observed that the pattern of the high gradient anomalies isbroad, not like the sharp anomalies of ideal vertical boundaries of contrast-
Fig. 8. The horizontal gradient map of the gravity data of Aswan active region. Blacklines indicate the main active faults from previous studies, and the blue lines show thefaults from the horizontal gradient filter based on the work of Blakely and Simpson (1986).The inferred N–S trending fault (F1) intersects with three main significant E–W strikingfaults (F2, F3 and F4) which have generated seismic clustering (zones) around theirintersections. Seismicity and the seismic zones Z1, Z2 and Z3, which are related to thesame active fault trending in the N–S direction (F1) in the study region, are also shown.
59

Saleh S.: Subsurface structural mapping of Northern. . . (45–72)
ing density. One explanation of this pattern is that the boundaries in thenorth western part of Nasser Lake Aswan area are not vertical and are rel-atively deep, and/or the anomalies are produced by several boundaries.Grauch and Cordell (1987) discussed the limitations of the horizontal
gradient method for gravity data. They concluded that the horizontal gra-dient magnitude maxima can be offset from a position directly over theboundaries if the boundaries are not near-vertical and close to each other.
3.4. Euler deconvolution
The Euler deconvolution method is applied to the residual gravity data ofAswan active region from the range 0 to more than 3 km of depth. Eulerdeconvolution is used to estimate depth and location of the gravity sourceanomalies. The 3D equation of Euler deconvolution given by Reid et al.(1990) is
(x − x0)∂g
∂x+ (y − y0)
∂g
∂y+ (z − z0)
∂g
∂z= −n(β − g). (7)
Eq. (7) can be rewritten as
x0∂g
∂x+ y0
∂g
∂y+ z0
∂g
∂z+ nβ = x
∂g
∂x+ y
∂g
∂y+ z
∂g
∂z+ ng, (8)
where (x0, y0, z0) is the position of a source whose total gravity is detectedat (x, y, z), ß is the regional value of the gravity, and n is the structuralindex (SI) which can be defined as the rate of attenuation of the anomalywith distance. The SI must be chosen according to prior knowledge of thesource geometry. For example, SI = 2 for a sphere, SI = 1 for a horizontalcylinder, SI = 0 for a fault, and SI = –1 for a contact (FitzGerald et al.,2004). The horizontal (∂g/∂x, ∂g/∂y) and vertical (∂g/∂z) derivatives areused to compute anomalous source locations. By considering four or moreneighboring observations at a time (an operating window), source location(x0, y0, z0) and ß can be computed by solving a linear system of equationsgenerated from Eq. (8). Then by moving the operating window from one lo-cation to the next over the anomaly, multiple solutions for the same sourceare obtained. In our study, Euler deconvolution has been applied to the
60

Contributions to Geophysics and Geodesy Vol. 41/1, 2011 (45–72)
gravity data using a moving window of 0.5 km × 0.5 km (grid space is50 m).We have assigned several structural indices values, and found that SI =
0 gives good clustering solutions. Reid et al. (1990; 2003), and Reid (2003)presented a structural index equal to zero for the gravity field for detectingfaults. Results of the Euler deconvolution for gravity data are shown inFig. 9.The High Dam region is the most folded area in Aswan region. This
may be due to the existence of some shallow intruded bodies. Most of thecontact solutions (Fig. 9) are trending in the NNW and NW directions,
Fig. 9. Euler solutions from the residual gravity data of Aswan region. Structural Index= 0; tolerance = 15%; window size = 500 m× 500 m.
61

Saleh S.: Subsurface structural mapping of Northern. . . (45–72)
associated approximately with the main trend of the Red Sea. In a fewlocations, solutions are found to be trending in the NE–SW direction. Thistrend is related to the transformed faults, which is associated with the RedSea rifting (Said, 1992). Generally the solutions delineate boundaries ofintrusive narrow density bodies scattered in the study area with differentwidth and length. The wider one (6 km) with a length of 10 km is locatedaround the High Dam. The depths associated with the Euler solutions forthese bodies range between 1.2 km and about 3 km. These bodies are mostprobably representing intrusions that are associated with the Red Sea rift.Such scattered intrusions in the basement would be expected to producestructures higher up in the sedimentary section. We are currently investi-gating 3D modeling techniques to obtain more accurate information aboutthe shape and density of the intruded bodies. Meanwhile, the depths esti-mated for the near-surface structures range from 250 to 1200 m, decreasingto the southeast of High Dam.
3.5. Upward continued gravity map
The resultant Bouguer anomaly map (upward continued at 7 km depth) isshown in Fig. 10. This map reflects many anomalies with different polari-ties and trends. In the western part of the study area (northwest of Seiyaland Baraka faults), it is represented by large amplitude of negative Bougueranomalies (–31 to – 27.5 mGal), generally lineated in WNW–ESE direction.This may attribute to relatively thick sedimentary cover in this region. Thecentral part of the study area is associated with relatively flat broad ex-tended anomalies with extended values (–27 to –26 mGal) that strike in theE–W, direction. It is characterized by oval shape, low sharpness, and lowgradient. This illustrates a continuous tectonic activity in this region (basinor the basement rocks seem to be of relatively acidic rock types intruded bybasic ones probably of mantle composition at different depth). Moreover,three broad elongated positive anomalies of different closures that strikein the N-S, NNE–SSW and NE directions are observed in different sites ofthe Regional Bouguer map that occupying northern part of Kurkur fault,around Aswan High Dam to the north and in the south eastern corner ofthe studied region, respectively.
62

Contributions to Geophysics and Geodesy Vol. 41/1, 2011 (45–72)
Fig. 10. Regional anomaly map of the study area deduced from upward continuation toa level of 7 km.
3.6. Bandpass filtered gravity map
An important step in the interpretation of Bouguer data is the study of theanomaly of a special shape. Linear anomalies correspond to dikes and (or)faults, and circular anomalies correspond to intrusive bodies. The structuralelements can be detected simply by inspecting the alignment of anomaliesand by distinguishing the noticeable abrupt change between positive andnegative anomalies, particularly at the location of sharp gradients. The en-hancement of Bouguer anomalies associated with faults and other structural
63

Saleh S.: Subsurface structural mapping of Northern. . . (45–72)
discontinuities (volcanic or intruded bodies) was achieved by the applicationof bandpass filter of the Bouguer data.Most of the volcanic rocks are exposed on both flanks of the Nile Valley
rift whereas the rift trough has less and scattered volcanic bodies. The NileValley rift and the other continental rifts, such as Taupo rift of North Is-land, New Zealand; Rungwe volcanic field and parts of the western arm ofthe East African rift system are characterized by the flank volcanism.Ellis and King (1991) attribute the occurrence of the flank volcanisms
to the dilation strain at the base of the upper crust during normal faultingand to uplift of the rift flanks at depth.Continental rifts do not usually form single, straight structural entities,
but they occur commonly as systems of isolated rift segments, which areseparated by several transfer zones (Corti et al., 2003 and Corti, 2004). Inthe Nile Valley rift, the interactions between the pre-existing faults havecontrolled the volcanic activity at and around the transfer zones (Fig. 11).Bandpass filter parameters have been selected (0–5 km) after extensive
testing of several bandpass ranges which was well fitted with the estimatedsource depth values using other techniques in this work. Figure 12 showsthe bandpass filtered map, of Bouguer map overlain with interpreted struc-tural aspects and intrusions. The map shows some intruded bodies whichwere observed scattered on the intersections between the E–W and NW ori-ented faults. These bodies tend to be aligned along NE trending directionas shown in Fig. 12 [related to the transformed faults, which is associatedwith the Red Sea rifting (Said, 1992)].
4. Interpreted structure map
The results (locations and depths) obtained from the data analysis werecompared and integrated to construct the basement tectonic map (Fig. 13).The deep-seated structures, interpreted from the regional map, are displayedin bold black lines. Most of these structures are traced in confirmation byall Bouguer analysis methods. However, some structures were interpretedfollowing the disruption and discontinuity of the method’s solutions.The near-surface lineaments and anticline folds are shown in blue lines,
were traced by the application of the analysis methods to the residual com-ponent map. These lineaments show good agreement with the geologically
64

Contributions to Geophysics and Geodesy Vol. 41/1, 2011 (45–72)
Fig. 11. Structures map of the eastern part of Egypt showing the Nile Valley rift and itsinternal Mesozoic basalt (modified after Abd-Allah, 2008). The Location of the NasserLake basins after Taha (1992) is represented. Red stars are the locations of Basalticintrusions.
mapped linear features and main valleys cut across the area (Fig. 2). Ac-cordingly, these lineaments might reveal top basement and intra-sediment
65

Saleh S.: Subsurface structural mapping of Northern. . . (45–72)
Fig. 12. 1–7 km band-pass filter of Bouguer anomaly map overlain with interpretedintrusions. The white triangles and circles mark location of volcanoes identified fromfiltered map. Strike slip and normal dextral oblique faults were estimated using all gravitytechniques in this study.
structures.Close inspection of the interpreted structure map (Fig. 13) reveals that
the area is affected by four sets of deep-seated and near-surface structurallineaments oriented in NW–SE, E–W, N–S and NE–SW directions. TheNW–SE (Red Sea) trend is more strongly developed than the other iden-tified trends. It represents the prevailing tectonic trend in the area, andplayed an important role in the formation of its tectonic framework. It was
66

Contributions to Geophysics and Geodesy Vol. 41/1, 2011 (45–72)
Fig. 13. Interpreted deep-seated (solid black lines) structural map. Blue lines are anti-clines; while the red lines are the previous investigated faults (after Issawi, 1969). Theestimated map shows E–W oriented faults and their relationship with the N–S and NWtrending faults. White triangles (1, 2 and 3) mark location of volcanoes identified fromfiltered map. Earthquake distributions with black colored circles are also observed.
noticed that this trend is greatly responsible for the formation of the ma-jor basin that trends in the same direction and occupies the western andsouthwestern parts of the area. Kamel and Elsirafe (1993) stated that theNW and N–S trends represent the prevalent directional orientations of thesurface structural lineaments in north Nasser lake area.The E–W (Tethyan) and N–S (East African rift System) trends come
in the second precedence as deep-seated and near-surface structures in the
67

Saleh S.: Subsurface structural mapping of Northern. . . (45–72)
study area. These two trends have been proved from interpretation of grav-ity survey data to be the deepest and oldest Precambrian tectonic trends insouth Egypt. The E–W trend is represented by boundaries of uplifted andsubsided blocks. The N–S trend is represented by strike slip faults affectingthe central and eastern parts of the area and dislocating the E–W trendingstructures. This fault system is well identified in the area and extendedfor long distance northward controlling the primary extent of Nasser Lakeand Nile valley in Upper Egypt. These tectonic trends have been shownto have a significant control on the distribution of seismic activity in theAswan region. Most of the recorded earthquake activities in the westernside of Nasser Lake are associated with the intersections of these two trends(El Shazly and Abdel Hady, 1984; Kebeasy et al., 1987; Kamel and Elsirafe,1993).The NE trend is common in the interpreted near-surface structure in
good agreement with the geologic map (Fig. 2). However, this trend is rel-atively scarce in the interpreted deep-seated structure. The E-W orientedfaults are associated with several Oligocene and Miocene volcanic cones anddikes (Schandelmeier et al., 1987; Meneisy, 1990).The obtained results imply the estimation of some volcanic bodies (tri-
angles 1, 2 and 3, Fig. 12) which have almost found at the intersectionsbetween the E–W and NW oriented faults.The intersections between the N–S and E–W striking faults in the area
around Nasser Lake have generated seismic pulses (Kebeasy, 1990). Actu-ally, the acquired results are almost identical with the previous statement,where the inferred N–S trending fault (F1) intersects with three main sig-nificant E–W striking faults (F2, F3 and F4) generating seismic clusteringaround their intersections as shown in Figs. 8 and 12.
5. Discussion and conclusions
In this paper, quantitative and qualitative analysis techniques were appliedto Bouguer and seismicity data to estimate the location and depth of theburied source and subsurface structural interpretation. These techniquesare power spectrum, horizontal gradient, Euler Deconvolution, upward con-tinuations and bandpass filtering.
68

Contributions to Geophysics and Geodesy Vol. 41/1, 2011 (45–72)
These methods were then applied to obtain the regional and residualcomponents of the gravity field for the area of study. The HG methodcould map the deep-seated and near-surface density structure of the studyarea. The Euler solutions provide tracing of linear segments and the depthto these features. Results of Euler Deconvolution method suggested that onthe eastern part of the area, the basement could be observed on the ground(50 m over the ground) and has become more deeper in the central partto attain more than 3 km depth to the west. This illustrates a continuoustectonic activity in this region (basin with thick sedimentary cover or thebasement rocks seem to be of relatively acidic rock types intruded by basicones probably of mantle composition at different depth).Shallow depth estimation to the top of basement complex and/or intru-
sions is ranging between 0.3 km and 0.8 km. However, two average levels(interfaces) at depth 3.1 km and 7.2 km below the measuring level wererevealed for the intermediate and deep seated structures, respectively.Mostly, epicenters are located on the borders between the high and low
Bouguer anomaly values. Seismic activity is concentrated along eight de-fined seismic active zones (Z1-Z8, see Fig. 5), where Zone4 is the most activeone in Aswan region, where it is located around the site of the Nov. 14, 1981earthquake. Seismicity distributions depicted that some low magnitude seis-mic activity may have occurred near the reservoir, after filling began andprior to November 1981 (Kebeasy et al., 1982) which led to occurrence ofseismic pulses around seismic zone1 (Fig. 8). An additional two scatteredmicro-earthquakes (were distributed in zone 2 and zone 3, extending to thesouth) are located in the Nile channel.In the present work, the three seismic zones (Z1, Z2 and Z3 as shown
in Figs. 5 and 8) are well correlated with the fault trends of the subsurfacestructures as derived from the Horizontal Gradient map (Fig. 8) and alsofrom Fig. 13 (tectonic of the basement rocks). These active zones are relatedto the same active fault trending in the N–S direction (F1). The inferredmajor fault trend-F1 depicted in Fig. 8, is well correlated with the majornorth-south structural trend discussed by Youssef (1968).Saleh (2004) estimated the resultant stress values for the same area of
study using seismological and Bouguer data analyses. The estimated highstress anomalies values were occupying the northern, northwestern and east-ern regions, which may not be related to any co-seismic and/or post seismic
69

Saleh S.: Subsurface structural mapping of Northern. . . (45–72)
movements. However, the seismic active zones have been located in thebrittle zone over the low stress ductile one (along Kalabsha active region).Application of two geophysical methods in this paper such as seismicity andBouguer analysis are strongly suggesting that seismically-active fault existseast of High Dam passes across Aswan reservoir from north to south. Thisfault is occupying a region of high stress value (Saleh, 2004) which maygenerate large earthquakes in future as it has long extension over severalkilometers.Integration of the results attained from these methods facilitates map-
ping the interpreted basement tectonic map of the area. This map showsthat the area is affected by sets of faults trending in NW–SE, E–W, N–Sand NE–SW directions. Moreover, the area is dissected by a set of basementuplifts and troughs controlled mainly by the NW–SE faults.
Acknowledgments. The author acknowledges his colleagues at the NationalResearch Institute of Astronomy and Geophysics (NRIAG), for their kind help in obser-vations.
References
Abd-Allah A. M. A., 2008: Structural evolution of the intercontinental Nile Valley rift,Egypt. J. Appl. Geophys., 7, 1, 49–75.
Blakely R. J., Simpson R. W., 1986: Approximating edges of source bodies from magneticor gravity anomalies. Geophysics, 51, 7, 1494–1498.
Cordell L., 1979: Gravimetric expression of graben faulting in Santa Fe Country andthe Espanola Basin, New Mexico, New Mexico. Geol. Soc. Guidebook, 30th FieldConf., 59–64.
Cordell L., Grauch V. J. S., 1985: Mapping basement magnetization zones from aeromag-netic data in the San Juan Basin, New Mexico. In Hinze W. J., Ed.: The utility ofregional gravity and magnetic anomaly maps. Soc. Explor. Geophys., 181–197.
Corti G., 2004: Centrifuge modeling of the influence of crustal fabrics on the developmentof transfer zones: insights into the mechanics of continental rifting architecture.Tectonophysics, 384, 191–208.
Corti G., Bonini M., Conticelti S., Innocenti F., Manetti P., Sokoutis D., 2003: Analoguemodeling of continental extension: a review focused on the relations between thepatterns of deformations and the presence of magma. Earth-Science Reviews, 63,169–247.
Dixon T. H., Stern R. J., Hussein I. M., 1987: Control of Red-Sea rift geometry byPrecambrian structures. Tectonics, 6, 551–571.
70

Contributions to Geophysics and Geodesy Vol. 41/1, 2011 (45–72)
El Shazly E. M., Abdel Hady M. A., 1984: Earthquake studies in Aswan environs, Egypt,applying space-borne imagery interpretation and other techniques. Remote SensingCenter, Academy of Scientific Research and Technology, Cairo, Egypt.
Ellis M., King G., 1991: Structural control of flank volcanism in continental rifts. Science,254, 839–842.
Grauch V. J. S., Cordell L., 1987: Short note, Limitations of determining density ormagnetic boundaries from the horizontal gradient of gravity or pseudogravity data.Geophysics, 52, 118–121.
Haggag H. M., Pankaj M., Bhattacharya S., Kamal, Kayal J. R., 2009: Seismicity and 3Dvelocity structure in the Aswan Reservoir Lake area, Egypt. Tectonophysics, 476,450–459.
Issawi B., 1969: The Geology of Kurkur-Dungul area. General Egyptian Organization forgeological Research and Mining. Geological Survey, Cairo, 46 p.
Issawi B., 1978: Geology of Nubia west area, Western Desert. Annuls of the GeologicalSurvey of Egypt.
Issawi B., 1982: Geology of the southwestern desert of Egypt. Ann. Geol. Survey Egypt.Kamel A. F., Elsirafe A. M., 1993: Delineation and analysis of the surface and subsurface
structural lineament patterns in the North Lake Nasser area and its surroundings,Aswan, Upper Egypt. Int. J. Remote Sensing, 15, 7, 1471–1493.
Kebeasy R. M., 1990: Seismicity. In: Said R. (ed.), Geology of Egypt. Rotterdam, 51–59.Kebeasy R. M., Gharib A. A., 1991: Active faults and water loading are important factors
in triggering earthquake activity around Aswan Lake. J. Geodynamics, 14, 73–85.Kebeasy R. M., Maamoun M., Ibrahim E., 1982: Aswan Lake induced earthquakes. Bull.
Int. Inst. Seismology and Earthquake Engng., Japan, 19, 155–160.Kebeasy R. M., Maamoun M., Ibrahim E., Megahed A., Simpson D. W., Leith W. S.,
1987: Earthquake studies at Aswan reservoir. In: Recent crustal movement inAfrica. Edited by A. M. Wassef, Boud A., Vyskocial P. V.: Journal of Geophysics,7, 173–193.
Meneisy M., 1990: Volcancity. In: Said R. (Ed.), The geology of Egypt, Balkema Rotter-dam, 157–174.
Meshref W. M., 1990: Tectonic framework. In: Said R. (Ed.), The Geology of Egypt, A.A. Balkema, Rotterdam, 113–155.
Mohamed H. H., Gaber H. H., Sayed A. D., EZZAT M. E., 2008: A review of therecent seismic activity in the southern part of Egypt (Upper Egypt). Acta Geodyn.Geomater., 5, 1 (149), 19–29.
Mohamed H. H., 1997: A study about the characteristics of the seismic activity at Kal-absha area and Aswan reservoir, Aswan. Ph. D. thesis, Qena Faculty of Science,South Valley University.
Mohamed H. H., 2001: Focal mechanism determination based on the polarity and sv/pamplitude ratio in the Kalabsha area, Aswan Egypt. Geosciences Journal, 5, 2,165–171.
Phillips J. D., 1998: Processing and interpretation of aeromagnetic data for the SantaCruz Basin-Patahonia Mountains area, South-Central Arizona, U. S. GeologicalSurvey Open-File Report 02-98.
71

Saleh S.: Subsurface structural mapping of Northern. . . (45–72)
Reid A. B., 2003: Short note, Euler magnetic structural index of a thin bed fault. Geo-physics. Published electronically.
Reid A. B., Allsop J. M., Granser H., Millet A. J., Somerton I. W., 1990: Magneticinterpretation in three dimensions using Euler deconvolution. Geophysics, 55, 80–91.
Reid A., FitzGerald D., McInerney P., 2003: Euler deconvolution of gravity data. SEGAnnual Meeting, Dallas, accepted for presentation.
Said R., 1962: The Geology of Egypt. Elsevier Pub. Comp. Amsterdam and New York,337 p.
Said R., 1992: The Geology of Egypt. Elsevier Science Ltd., Rotterdam, Netherlands.Saleh S., 2004: Crustal stresses around the northern part of the Nasser Lake, Egypt as
derived from gravity and seismological observations. NRIAG, Journal of Geophysics,Special Issue, 97–127.
Schandelmeir H., Richter A., Harms U., 1987: Proterozoic deformation of the east Sahrancraton in SE-Libya, S-Egypt and N-Sudan. Tectonophysics, 140, 233–246.
Spector A., Bhattacharyya B. K., 1966: Energy density spectrum and autocorrelationfunction of anomalies due to simple magnetic models. Geophysical Prospecting, 14,242–272.
Spector A., Grant F. E., 1970: Statistical models for interpreting aeromagnetic data.Geophysics, 35, 293–302.
Taha A., 1992: Mesozoic rift basins in Egypt: their southern extension and impact onfuture exploration. Egyptian General Petrolum corpotion. 11th Exploration Con-ference, Egypt, 1–19.
WCC (Woodward-Clyde Consultants, 1985: Earthquake activity and Dam stability eval-uations for the Aswan High Dam, Egypt, For the High and Aswan Dams Authority,Egypt, internal report, Subtask 1-G, 69 p.
Youssef M. I., 1968: Structural pattern of Egypt and its interpretation. Bull. Amer.Associ. Petroleum Geologists, 52, 5, 60–614.
72
Copyright © 2022 FDOKUMEN