GIS-based recharge estimation by coupling surface–subsurface water balances
20
This article was originally published in a journal published by Elsevier, and the attached copy is provided by Elsevier for the author’s benefit and for the benefit of the author’s institution, for non-commercial research and educational use including without limitation use in instruction at your institution, sending it to specific colleagues that you know, and providing a copy to your institution’s administrator. All other uses, reproduction and distribution, including without limitation commercial reprints, selling or licensing copies or access, or posting on open internet sites, your personal or institution’s website or repository, are prohibited. For exceptions, permission may be sought for such use through Elsevier’s permissions site at: http://www.elsevier.com/locate/permissionusematerial
Transcript of GIS-based recharge estimation by coupling surface–subsurface water balances

This article was originally published in a journal published byElsevier, and the attached copy is provided by Elsevier for the
author’s benefit and for the benefit of the author’s institution, fornon-commercial research and educational use including without
limitation use in instruction at your institution, sending it to specificcolleagues that you know, and providing a copy to your institution’s
administrator.
All other uses, reproduction and distribution, including withoutlimitation commercial reprints, selling or licensing copies or access,
or posting on open internet sites, your personal or institution’swebsite or repository, are prohibited. For exceptions, permission
may be sought for such use through Elsevier’s permissions site at:
http://www.elsevier.com/locate/permissionusematerial

Autho
r's
pers
onal
co
pyGIS-based recharge estimation by couplingsurface–subsurface water balances
O. Batelaan a,b,*, F. De Smedt a
a Department of Hydrology and Hydraulic Engineering, Vrije Universiteit Brussel, Brussels, Belgiumb Department of Geography and Geology, Hydrogeology and Engineering Geology, Katholieke Universiteit Leuven,Leuven, Belgium
Received 28 July 2005; received in revised form 13 December 2006; accepted 1 February 2007
KEYWORDSRecharge;GIS;Water balance model-ling;
Baseflow separation;Belgium
Summary A spatially distributed water balance model is developed to simulate long-termaverage recharge depending on land cover, soil texture, topography and hydrometeorolog-ical parameters. The model simulates recharge iteratively connected to a groundwatermodel, such that the recharge estimate is also influenced by the groundwater depth andvice versa. Parameter estimation for the model is performed on the basis of literature val-ues of water balance fluxes from mainly Belgium and The Netherlands. By graphical andnon-linear baseflow separation for 17 catchments it is shown that recharge spatially variesconsiderably. The water balance model coupled to a regional groundwater model is appliedand successfully tested on the 17 catchments. The application shows that the resultingrecharge has a spatial complex pattern, depending to a large extend on the soil textureand land cover. Moreover, shallow groundwater levels in valleys cause negative rechargeconditions as a result of evapotranspiration by abundant phreatophytic vegetation. GISanalysis shows how recharge strongly varies for different combinations of land cover andsoil texture classes. The performed analysis provides a better insight into the sustenanceand management of groundwater resources.ª 2007 Elsevier B.V. All rights reserved.
Introduction
Recharge is the entry into the saturated zone of water madeavailable at the water table surface, together with the asso-
ciated flow away from the water table within the saturatedzone (Freeze, 1969). Methods for determining rechargehave been intensively discussed in literature (Simmers,1988; Lerner et al., 1990; de Vries and Simmers, 2002; Scan-lon et al., 2002). These can be classified as either pointbased or lumped areal methodologies. Cherkauer and Ansari(2005) present a lumped areal recharge estimation proce-dure in which regression relationships are established be-tween recharge, as derived from baseflow, and catchment
0022-1694/$ - see front matter ª 2007 Elsevier B.V. All rights reserved.doi:10.1016/j.jhydrol.2007.02.001
* Corresponding author. Tel.: +32 2 6293039; fax: +32 2 6293022.E-mail address: [email protected] (O. Batelaan).URL: http://homepages.vub.ac.be/~batelaan/ (O. Batelaan).
Journal of Hydrology (2007) 337, 337–355
ava i lab le a t www.sc iencedi rec t . com
journal homepage: www.elsevier .com/ locate / jhydrol
Autho
r's
pers
onal
co
py
average topography, hydrogeology and land cover charac-teristics. Fazal et al. (2005) estimate recharge using aconceptual rainfall–runoff model, which requires only rain-fall, evaporation and groundwater level data. Chloridemass-balance approach (Flint et al., 2002), isotopes(Guimera and Candela, 1999; Scanlon et al., 2002), soilwater balance modelling (Meiresonne et al., 2003; Ladekarlet al., 2005) and estimates on basis of groundwater levelfluctuations (Sophocleous, 1991; Healy and Cook, 2002;Dickinson et al., 2004) are all point estimates of recharge.However, extrapolation or regionalization of point esti-mates is not evident (Sophocleous, 1992), and it is arguedthat distributed approaches as remote sensing based tech-niques offer chances for improvements in spatial estimates(Jackson, 2002). Regional mean annual distributed rechargeis determined by Szilagyi et al. (2005) using the DRASTICmethodology. Zhang et al. (1999) apply a biophysicallybased distributed ecohydrological model to simulate re-charge for a small catchment. Armbruster and Leibundgut(2001) also use for a small area a distributed SVAT-model,however combined with a conceptual soil model to simulatetemporal and spatial recharge. Cherkauer (2004) tests thedeterministic, distributed parameter model PRMS for quan-tifying recharge per hydrological response units on a catch-ment scale of 50–500 km2.
Regional groundwater models for analyzing groundwatersystems (infiltration–discharge relations) are often steadystate (Carrera and Medina, 1999) and therefore need long-term average recharge input. Also the spatial variation inthe recharge, due to distributed land cover, soil texture,slope, etc., can be significant and should therefore be ac-counted for in these regional groundwater models. Chap-man (1999) clearly shows the spatial variability ofrecharge by stream flow recession analysis.
Recharge rates are one of the most poorly constrainedhydraulic parameters in almost all groundwater flow andtransport models (Lerner et al., 1990; Anderson and Woess-ner, 1992). Therefore, in practice, recharge is often used asan adjustable parameter during model calibration (Andersonand Woessner, 1992; Sanford, 2002). However, becausehydraulic conductivity can vary over 13 orders of magnitude(Freeze and Cherry, 1979), a practically infinite number ofcombinations of hydraulic conductivities and recharge ratesthat span a wide range could all match the target head dis-tribution for a flow model calibration (Zhu, 2000). Conse-quently, inadequate control of recharge rates can lead toa situation of non-uniqueness of flow model solutions, whichmay render many water resource management models unus-able (Brooks et al., 1994). However, Chardigny (1999) showsthat, by coupling the aquifer and river mass balances, theoverall calibration of a regional groundwater model couldbe improved.
The first motivation for this paper arose from the factthat in recent years many countries provided spatial vari-able land cover and soil data in digital form. Moreover, re-mote sensing furnishes us with a strongly increasingamount of high resolution spatial data. Therefore, it wouldbe desirable to have an approach that directly takes into ac-count the influence of the spatial variability of soil texture,land cover, slope and meteorological conditions in rechargeestimation. Secondly, spatially distributed estimates ofthe recharge are needed for a better understanding of
recharge–discharge systems and for a more reliable calibra-tion of groundwater flow models. Thirdly, adopting sustain-able groundwater use should lead to improved managementof groundwater quantity and quality, but will be sub-ordi-nate to improved knowledge of spatial estimates of re-charge (Sophocleous, 2005). Hence, the purpose of thispaper is to develop a methodology which is flexible andopen, i.e., GIS based, and consisting of a distributed waterbalance model coupled to a regional groundwater model forassessing spatially variable recharge. The results of themethodology will be tested and optimized with literaturederived point estimates of water balance fluxes for similarhydro-meteorological and pedological conditions. Accep-tance testing of the estimated water balance fluxes (Bogenaet al., 2005) will be performed by comparing the water bal-ances of 17 sub-catchments of the humid temporal Dijle,Demer, and Nete catchments in Belgium. Additionally, thedistributed water balance is constrained by coupling to aregional groundwater model. Spatial statistics are used todescribe and analyze the correlation between the waterbalance fluxes and the distributed land cover and soilmaps, pointing to the need for a distributed modellingapproach.
Methodology
A methodology for estimating spatially distributed, long-term average, recharge under humid temporal conditionswas developed. This model, termed WetSpass, an acronymfor Water and Energy Transfer between Soil, Plants andAtmosphere under quasi Steady State, integrates a waterbalance in a geographical information system (GIS) (Bate-laan and De Smedt, 2001). The model has been applied tostudy the influence of long-term effects of land coverchanges on the water regime in a basin (Batelaan et al.,2003; De Smedt and Batelaan, 2003). By using long-termaverage standard hydrometeorological parameters as in-puts, the model simulates the temporal average and spatialdifferences of surface runoff, actual evapotranspiration,and groundwater recharge. Since evapotranspiration fromshallow groundwater can be significant, especially ingroundwater dependent wetlands, the position of thegroundwater table should be taken into account in the esti-mation of recharge. Therefore, WetSpass is iteratively con-nected to a groundwater model, which provides the positionof the water table, while WetSpass returns a recharge esti-mate accordingly.
The model treats a basin or region as a regular pattern ofraster cells. Every raster cell is further sub-divided in a veg-etated, bare soil, open water, and impervious surface frac-tion, for which independent water balances are maintained(Fig. 1). This allows to account for sub-cell land cover het-erogeneity, depending on the resolution of the raster cell.Multi-resolution remote sensing classification offers possi-bilities to quantify sub-cell information (Van de Voordeet al., 2006). The bare soil fraction of a raster cell is alsoused to describe the part of the surface, which is not fullycovered by vegetation. Especially, in the non-growing sea-son this percentage can increase considerably for certaincovers. The processes in each cell are simulated seasonally,while semi-temporal information is brought into the
338 O. Batelaan, F. De Smedt

Autho
r's
pers
onal
co
pyapproach by assuming a cascading of the precipitation, inter-ception, runoff, evapotranspiration and recharge processes.
The seasonal water balance for a vegetated fraction of araster cell is
P ¼ Iþ Sv þ Tv þ Rv ð1Þ
where P is the precipitation [L], I the interception [L], Sv thesurface runoff [L], Tv the actual transpiration [L] and Rv thegroundwater recharge [L] in the vegetated fraction of theraster cell. The total actual evapotranspiration, ETtot [L],is the sum of I, Tv and the evaporation from the bare soil,Es [L]. The actual evapotranspiration, ETv [L], is the sumof Tv and Es. Interception has been shown to be reasonablyconstant at a given annual precipitation value and exhibits aconsistent decrease with increasing annual rainfall total(Roberts, 1983). Therefore, the interception is parameter-ized as a constant fraction of precipitation depending onthe vegetation type (Calder, 1979; Nonhebel, 1987; Dolmanand Nonhebel, 1988; Grossmann, 1998).
The surface runoff, Sv, is simulated in two stages. First,the potential surface runoff, Sv-pot [L], is calculated as
Sv-pot ¼ f1ðV; ST;S;DÞðP � IÞ ð2Þ
where f1 is a runoff factor from a lookup table whose valueis dependent on vegetation type (V), soil texture (ST),slope (S) and groundwater saturated areas (D) and is basedon characteristic values derived from Smedema and Ry-croft (1988), Pilgrim and Cordery (1992), USDA-NRCS(1972), Chow et al. (1988). However, this potential surfacerunoff is conceptualized to occur only on groundwater
saturated areas. Hence, in a second stage, the potentialsurface runoff is adjusted for recharge areas by taking intoaccount the seasonal precipitation intensity distribution(Pi) in relation to the soil infiltration capacity (Ic) (Rubin,1966).
Sv ¼ f2ðPi; Ic;DÞSv-pot ð3Þ
where f2 is a factor from a soil texture lookup table thatpartitions the precipitation for a hydrological season, inan effective and non-effective part for contribution to thesurface runoff. It can be derived from estimating the frac-tion of seasonal precipitation with an intensity higher thanthe infiltration capacity of a particular soil type. It there-fore characterizes the precipitation fraction contributingto the Hortonian surface runoff process for each soil tex-ture. However, in groundwater discharge areas all potentialsurface runoff is assumed to contribute to surface runoff(Dunne and Black, 1970a,b), while in infiltration areas onlyhigh intensity storms will generate surface runoff.
Evapotranspiration is simulated with seasonal climaticdata, essentially in a ‘top-down’ approach, similar as inZhang et al. (2001), however in this case not on a catchmentbut on a grid level. The reference or unstressed transpira-tion (Federer, 1979) is defined as
Trv ¼ cEo ð4Þ
where Trv is the reference transpiration of a vegetated sur-face [L], Eo is the potential evaporation of open water [L],and c is a vegetation coefficient [�]. The vegetation coeffi-cient can be determined as the ratio of the reference vege-tation transpiration equation, as given by the Penman–Monteith equation, over the equation for Penman openwater evaporation, and result in
c ¼1þ c
D
1þ cD ð1þ rc=raÞ
ð5Þ
where D [ML�1T�2H�1] is the proportionality constantor the slope of the saturation vapor pressure curve,c [ML�1T�2H�1] is the psychometric constant, ra [TL�1] isthe aerodynamic resistance, and rc [TL�1] is the canopyresistance (Monteith, 1965). Dingman (2002) gives a similarvegetation coefficient as in Eq. (5), but includes a soil mois-ture dependent canopy resistance function from Stewart(1988).
In vegetated groundwater discharge areas, the actualtranspiration, Tv, is equal to the reference transpiration,since there is no limitation of soil water presence. In vege-tated areas where the groundwater level is below the rootzone the actual transpiration is determined as
Tv ¼ fðhÞTrv if Gd > Rd þ ht ð6Þ
where f(h) is a function of the water content (h) in root zone[�], Gd is the phreatic groundwater depth [L], ht is the ten-sion saturated height [L] (Brooks and Corey, 1964; Rawlset al., 1992) and Rd is the rooting depth [L] (Dickinsonet al., 1993; Dingman, 2002; Famiglietti and Wood, 1994;Gehrels, 1999). For f(h) a formulation based on Vandewieleet al. (1991) and Xu (1992) is used
fðhÞ ¼ 1� awTrv ð7Þ
where a is a calibrated parameter related to the soil tex-ture, which increases with decreasing saturated hydraulic
Figure 1 Schematic water balance of an hypothetical rastercell.
GIS-based recharge estimation by coupling surface–subsurface water balances 339

Autho
r's
pers
onal
co
py
conductivity, and w is the available water for transpiration[L]
w ¼ P þ nðhfc � hpwpÞRd ð8Þ
where P is the precipitation of a hydrological season consist-ing of n [�] months, hpwp and hfc are respectively the watercontent in root zone at permanent wilting point [�] and atfield capacity [�], and hfc � hpwp is the plant availablewater content.
The soil classification for the WetSpass model is based onthe classification of the US Department of Agriculture, SoilSurvey Staff (1951). For each soil texture clay and sand frac-tions have been determined as midpoint values of each tex-tural class (Cosby et al., 1984). With these fractions thefield capacity, permanent wilting point and plant availablewater content are calculated based on generalized soilwater characteristic equations (Saxton et al., 1986). Com-parison of these parameter values with Rawls et al.(1992), Dingman (2002), ASCE (1990), and Kabat andBeekma (1994) shows a good correspondence.
Change in storage is introduced in the model by allowingdifferent groundwater levels for winter and summer condi-tions and by assuming that during winter the plant availablesoil moisture reservoir is filled up so that during summer thisreservoir can be depleted.
Groundwater recharge can be determined as the residualof the water balance (Eq. (1)). The presented methodologyresults in an estimation of spatially distributed recharge as afunction of vegetation, soil texture, slope, groundwaterdepth and precipitation regime. Even in groundwater dis-charge areas some recharge will be simulated, which is inagreement with the conceptual idea that a thin unsaturatedzone is generally still present in discharge areas, allowingsome recharge. However, in summer the simulated rechargein discharge areas will often be negative as a result of thehigh transpiration of the vegetation due to the presenceof shallow groundwater.
A procedure for the bare soil surfaces can be developedin a similar manner as for the vegetated surfaces. Rechargeis determined from the water balance for bare soil surfacesas
P ¼ Ss þ Es þ Rs ð9Þ
where the index s refers to bare soil surfaces. The surfacerunoff, Ss, is simulated in a similar way to the vegetatedarea fraction in two stages (Eqs. (2) and (3)). The bare soilevaporation is determined as
Es ¼ fðhÞEo ð10Þ
where f(h) is a factor, which is defined by Eq. (7) and inwhich Trv is replaced by Eps, a Penman evaporation ratefor a wet soil.
The water balance for the open water area fraction of acell is defined as
P ¼ Eo þ So þ Ro ð11Þ
where the index o stands for open water surfaces. It is as-sumed that the recharge, Ro, derived from the precipitationon the open water fraction, is negligible compared to thepossible recharge from the surface water body itself. Ifthe Penman open water evaporation, Eo, is smaller than
the precipitation, the remaining water will contribute tothe surface runoff, So.
The water balance for impervious surfaces is given as
P ¼ Si þ E i þ Ri ð12Þ
where the index i refers to impervious surfaces. Due to thewide range of possible types of impervious surfaces andtheir physical characteristics, the percentage of surfacerunoff and evaporation has to be specified by the user basedon knowledge and observations of the characteristics ofthese surfaces.
The total water balance, per raster cell and hydrologicalseason, can now be stated as
ETc ¼ avETv þ asEs þ aoEo þ aiEi ð13ÞSc ¼ avSv þ asSs þ aoSo þ aiSi ð14ÞRc ¼ avRv þ asRs þ aiRi ð15Þ
where the index c refers to raster cell, with ETc, Sc, Rc [L]respectively, the total evapotranspiration, surface runoffand recharge in a raster cell and av, as, ao and ai respec-tively the vegetated, bare soil, open water and imperviousarea fractions of a raster cell.
The simulated distributed recharge can now serve as in-put for a groundwater model, and the resulting groundwaterlevel or depth can consequently return as input for WetS-pass as illustrated in Fig. 2. In general, iteration betweenthe groundwater model and WetSpass will converge in afew iterations (Batelaan et al., 2003). The WetSpass and re-gional groundwater model are spatially coupled and param-eters are estimated jointly. Hence, it is more important toassure that the water balance is spatially realistic asopposed to blindly optimizing model parameters over the
Figure 2 Schematic representation of the iterative processbetween WetSpass and a groundwater model.
340 O. Batelaan, F. De Smedt

Autho
r's
pers
onal
co
py
entire basin in order to match one stream flow gauge nearthe outlet of the basin (Arnold et al., 2000).
WetSpass is tightly integrated in ArcView and ArcGIS andcoded respectively in Avenue and Visual Basic. The GIS ras-ter model structure is very appropriate since it enables toconnect GIS easily with a numerical groundwater model aswell as with input data derived from satellite imagery. GISdata structures are used efficiently since spatial informationis stored in raster layers while parameter information isstored in attribute tables. From the attributes new rasterlayers can be derived to use in spatial calculations. Theattribute tables also allow to define easily new land coveror soil types, as well as changes in the parameter values,which permits analysis of future land and water manage-ment scenarios.
Parameter estimation with point fluxes
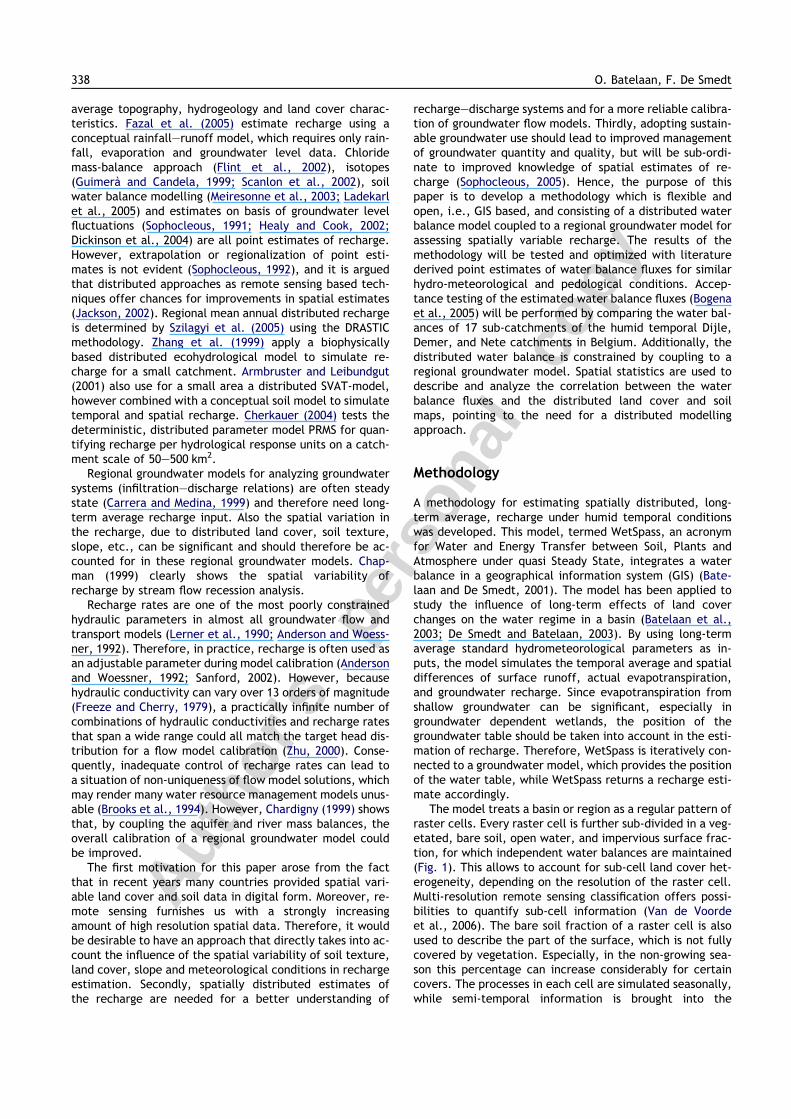
Parameter estimation of the WetSpass methodology is per-formed on the basis of literature values of interception,evapotranspiration and recharge studies from mainly Bel-gium and The Netherlands. These literature values are com-pared to simulated WetSpass water balance fluxes fortypical combinations of land cover, soil texture, averagetopographic and long-term meteorological conditions ofUkkel, Belgium. WetSpass input data for this test are sum-marized in Table 1. The groundwater depth is set at 4 m,in order to simulate infiltrating conditions. The simulationresults for these climatological conditions and all possiblecombinations of typical land cover types and the 12 USDAsoil textures are given in Fig. 3. The figure shows for eachland cover the simulated average and standard deviationof the surface runoff and the recharge, while for intercep-tion, transpiration and (soil) evaporation only the averageis given as a stacked bar diagram.
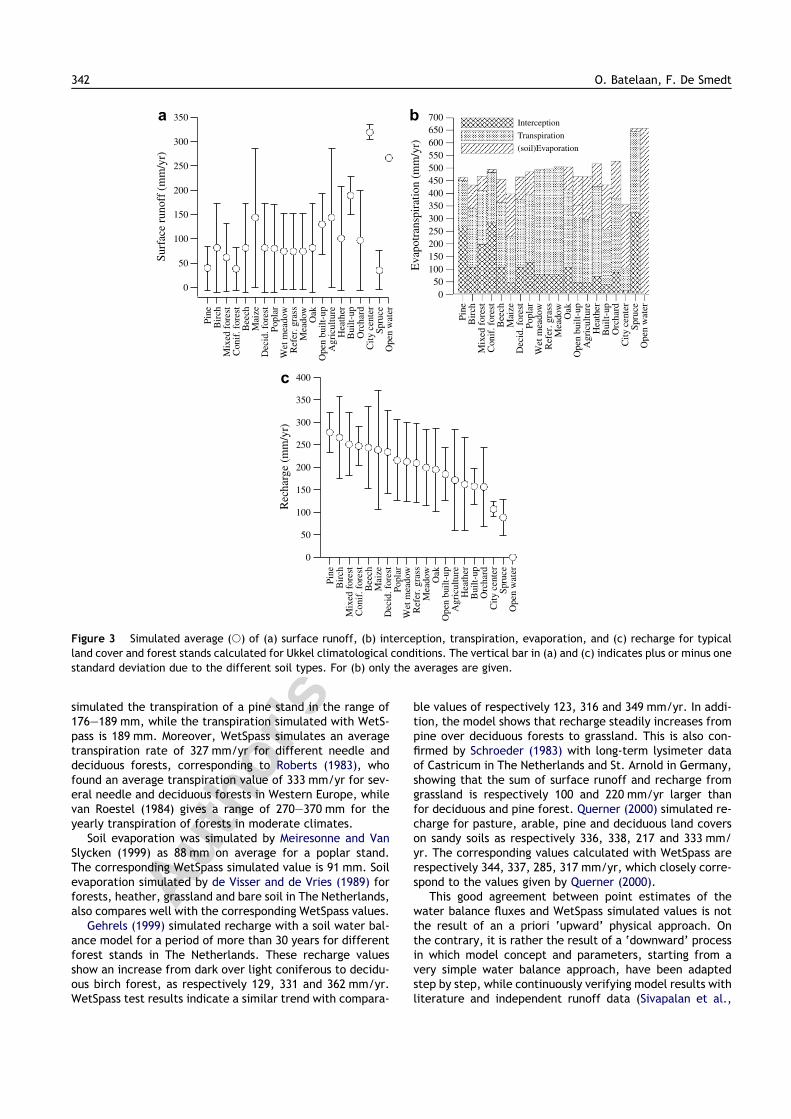
The effectively determined interception by WetSpass de-pends on the parameterized winter and summer intercep-tion percentages, but also on the Penman wet-surfaceevapotranspiration and the fraction of soil surface coveredby vegetation. The resulting effective interception percent-ages for different vegetation types, presented in Fig. 4,compare well with values obtained from literature (Molcha-
nov, 1960; Leyton et al., 1967; Schnock, 1971; van Roestel,1984; Nonhebel, 1987; de Visser and de Vries, 1989;Hendriks et al., 1990; Moors et al., 1996; Meiresonneet al., 1999). In Nonhebel (1987), simulated forest standsgave consistently higher interception values with the Muldermodel (Mulder, 1985) than with the Gash model (Gash,1979). Moors et al. (1996) summarize the interception mea-surements for forests in the Netherlands as 20% of precipita-tion (26% in summer, 10% in winter) for deciduous forestsand 39% of precipitation for non-deciduous forests.WetSpass calculates very similar interception values. Fur-ther confirmation of the WetSpass interception values isprovided by van Roestel (1984), who finds for needle foresta range of 30–40%, for deciduous forest 20–30% in hydrolog-ical summer and 10–20% in hydrological winter. Shuttle-worth (1992) indicates that for deciduous forests, the lossof leaves in winter reduces the fractional interception losstypically by a factor of 2–3, which is in accordance withthe parameterized interception values. The interceptionlosses for short crops are lower than for forests, primarilybecause of increased atmospheric transport of water vaporfrom their aerodynamically rough surfaces (Calder, 1998).Summarizing, it can be concluded that interception simu-lated with WetSpass corresponds well with values cited inliterature. The resulting interception values range fromabout 15 to 325 mm for the following land covers, cited inincreasing order of interception: crops and urban areas,shrub, heather, grass, orchard, mixed and deciduous forest(poplar, oak, birch, beech), coniferous (spruce, pine).
The simulated average transpiration (Fig. 3) for the dif-ferent land cover types has a low standard deviation, indi-cating that the transpiration is not very dependent on thesoil texture, as was also shown by Zhang et al. (2004). deVisser and de Vries (1989) also noted small differences intranspiration of about 50 mm due to different soil textures,Nonhebel (1987) reported a difference of 20 mm. Simulatedtranspiration for oak is 306 mm/yr, which is close to therange 277–293 mm as reported by Nonhebel (1987). Mei-resonne et al. (1999) calculated the transpiration for a pop-lar stand in East Flanders during four years as 278 mm/yr,using the soil water balance model WAVE (Vancloosteret al., 1994). For the same soil texture the transpiration cal-culated with WetSpass was 267 mm/yr. Nonhebel (1987)
Table 1 WetSpass input data for the test example
# Soil Value
1 Precipitationa 400 mm (summer), 380 mm (winter)2 Penman ETb 543 mm (summer), 114 mm (winter)3 Windspeedc 3.84 m/s (summer), 3.27 m/s (winter)4 Temperaturec 14.1 �C (summer), 5.0 �C (winter)5 Land coverd 20 Types6 Soile 12 Standard USDA textures7 Slope <0.5%8 Groundwater depth 4 m (infiltration condition)a Average Ukkel 1833–1975 (Dupriez and Sneyers, 1978; Sneyers and Vandiepenbeeck, 1995).b Average Ukkel 1967–1986 (Gellens-Meulenberghs and Gellens, 1992).c Long-term average Ukkel (Sneyers and Vandiepenbeeck, 1995).d OC GIS-Vlaanderen (1996).e Original Belgian soil map (Van Ranst and Sys, 2000; OC GIS-Vlaanderen, 2001) converted to textures of USDA (1951).
GIS-based recharge estimation by coupling surface–subsurface water balances 341
Autho
r's
pers
onal
co
pysimulated the transpiration of a pine stand in the range of176–189 mm, while the transpiration simulated with WetS-pass is 189 mm. Moreover, WetSpass simulates an averagetranspiration rate of 327 mm/yr for different needle anddeciduous forests, corresponding to Roberts (1983), whofound an average transpiration value of 333 mm/yr for sev-eral needle and deciduous forests in Western Europe, whilevan Roestel (1984) gives a range of 270–370 mm for theyearly transpiration of forests in moderate climates.
Soil evaporation was simulated by Meiresonne and VanSlycken (1999) as 88 mm on average for a poplar stand.The corresponding WetSpass simulated value is 91 mm. Soilevaporation simulated by de Visser and de Vries (1989) forforests, heather, grassland and bare soil in The Netherlands,also compares well with the corresponding WetSpass values.
Gehrels (1999) simulated recharge with a soil water bal-ance model for a period of more than 30 years for differentforest stands in The Netherlands. These recharge valuesshow an increase from dark over light coniferous to decidu-ous birch forest, as respectively 129, 331 and 362 mm/yr.WetSpass test results indicate a similar trend with compara-
ble values of respectively 123, 316 and 349 mm/yr. In addi-tion, the model shows that recharge steadily increases frompine over deciduous forests to grassland. This is also con-firmed by Schroeder (1983) with long-term lysimeter dataof Castricum in The Netherlands and St. Arnold in Germany,showing that the sum of surface runoff and recharge fromgrassland is respectively 100 and 220 mm/yr larger thanfor deciduous and pine forest. Querner (2000) simulated re-charge for pasture, arable, pine and deciduous land coverson sandy soils as respectively 336, 338, 217 and 333 mm/yr. The corresponding values calculated with WetSpass arerespectively 344, 337, 285, 317 mm/yr, which closely corre-spond to the values given by Querner (2000).
This good agreement between point estimates of thewater balance fluxes and WetSpass simulated values is notthe result of an a priori ‘upward’ physical approach. Onthe contrary, it is rather the result of a ‘downward’ processin which model concept and parameters, starting from avery simple water balance approach, have been adaptedstep by step, while continuously verifying model results withliterature and independent runoff data (Sivapalan et al.,
eniP
hcriB
tserofdexi
Mtserof.fino
Chcee
Bezia
Mtserof.dice
DralpoP
wodaemte
Wssarg.ref e
Rwodae
Mka
Opu-tliub
nepO
erutl ucir gA
rehtaeH
pu-t liuB
drahcrO
retnecyti
Ce cu rp
Sreta
wnep
O
0
50
100
150
200
250
300
350
400
)ry/m
m(egrahce
R
eniPhcri
Btserof
dexiM
tserof.finoC
hceeB
eziaM
tserof.diceD
ralpoP
wodaemte
Wssarg.refe
Rwodae
Mka
Opu-tliub
nepO
erutlucirgA
rehtaeH
pu-tliuB
drahcrO
retnecyti
CecurpSreta
wnep
O
0
50
100
150
200
250
300
350
)ry/m
m(ffonur
ecafruS
050
100150200250300350400450500550600650700
)ry/m
m(noitaripsnartopav
E
Interception
Transpiration
(soil)Evaporation
eniPhcri
Btserof
dex iM
tserof.fi noC
hceeB
ez iaM
t serof.diceD
r alpoPw odae
mteW
ssarg.refeR
wodaeM
kaO
p u-tl iubnep
Oerutlucirg
Areh tae
Hpu-tliu
Bdrahcr
Oretnec
ytiC
ecur pSr eta
wnep
O
a b
c
Figure 3 Simulated average (s) of (a) surface runoff, (b) interception, transpiration, evaporation, and (c) recharge for typicalland cover and forest stands calculated for Ukkel climatological conditions. The vertical bar in (a) and (c) indicates plus or minus onestandard deviation due to the different soil types. For (b) only the averages are given.
342 O. Batelaan, F. De Smedt
Autho
r's
pers
onal
co
py
2003). The result is a tool that is able to evaluate the spatialdifferences in recharge and other water balance fluxes onthe basis of relevant distributed data layers.
Study area and data
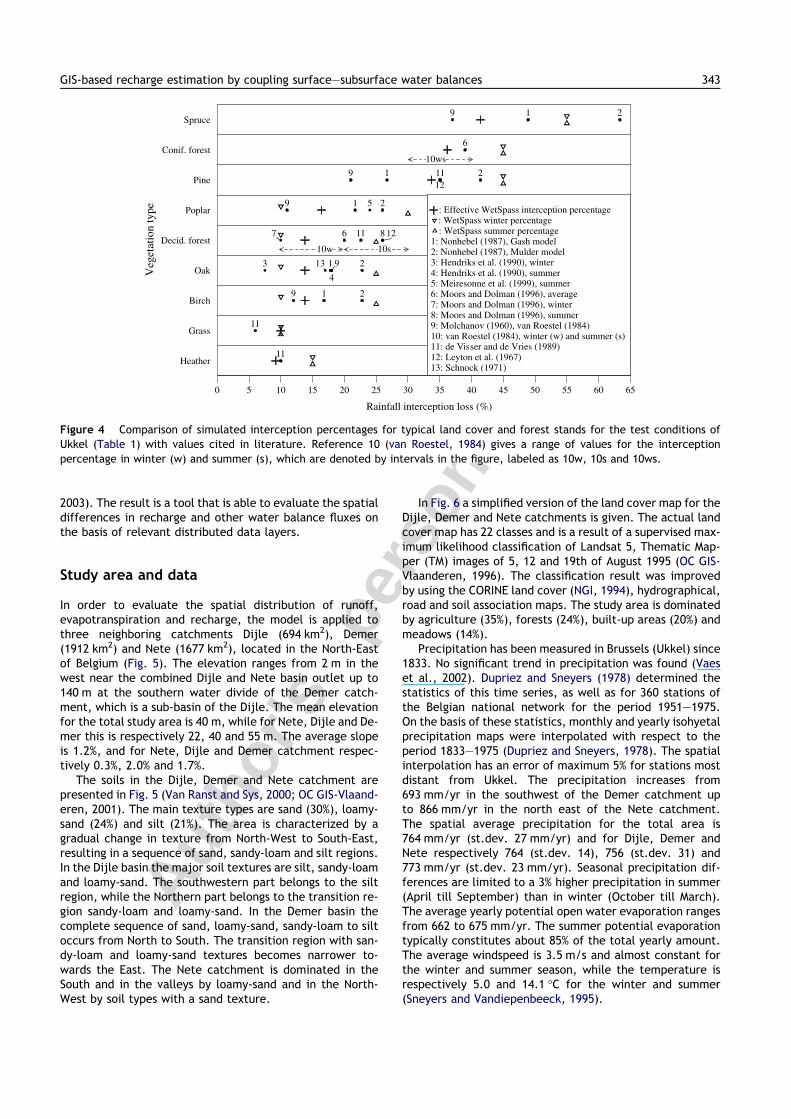
In order to evaluate the spatial distribution of runoff,evapotranspiration and recharge, the model is applied tothree neighboring catchments Dijle (694 km2), Demer(1912 km2) and Nete (1677 km2), located in the North-Eastof Belgium (Fig. 5). The elevation ranges from 2 m in thewest near the combined Dijle and Nete basin outlet up to140 m at the southern water divide of the Demer catch-ment, which is a sub-basin of the Dijle. The mean elevationfor the total study area is 40 m, while for Nete, Dijle and De-mer this is respectively 22, 40 and 55 m. The average slopeis 1.2%, and for Nete, Dijle and Demer catchment respec-tively 0.3%, 2.0% and 1.7%.
The soils in the Dijle, Demer and Nete catchment arepresented in Fig. 5 (Van Ranst and Sys, 2000; OC GIS-Vlaand-eren, 2001). The main texture types are sand (30%), loamy-sand (24%) and silt (21%). The area is characterized by agradual change in texture from North-West to South-East,resulting in a sequence of sand, sandy-loam and silt regions.In the Dijle basin the major soil textures are silt, sandy-loamand loamy-sand. The southwestern part belongs to the siltregion, while the Northern part belongs to the transition re-gion sandy-loam and loamy-sand. In the Demer basin thecomplete sequence of sand, loamy-sand, sandy-loam to siltoccurs from North to South. The transition region with san-dy-loam and loamy-sand textures becomes narrower to-wards the East. The Nete catchment is dominated in theSouth and in the valleys by loamy-sand and in the North-West by soil types with a sand texture.
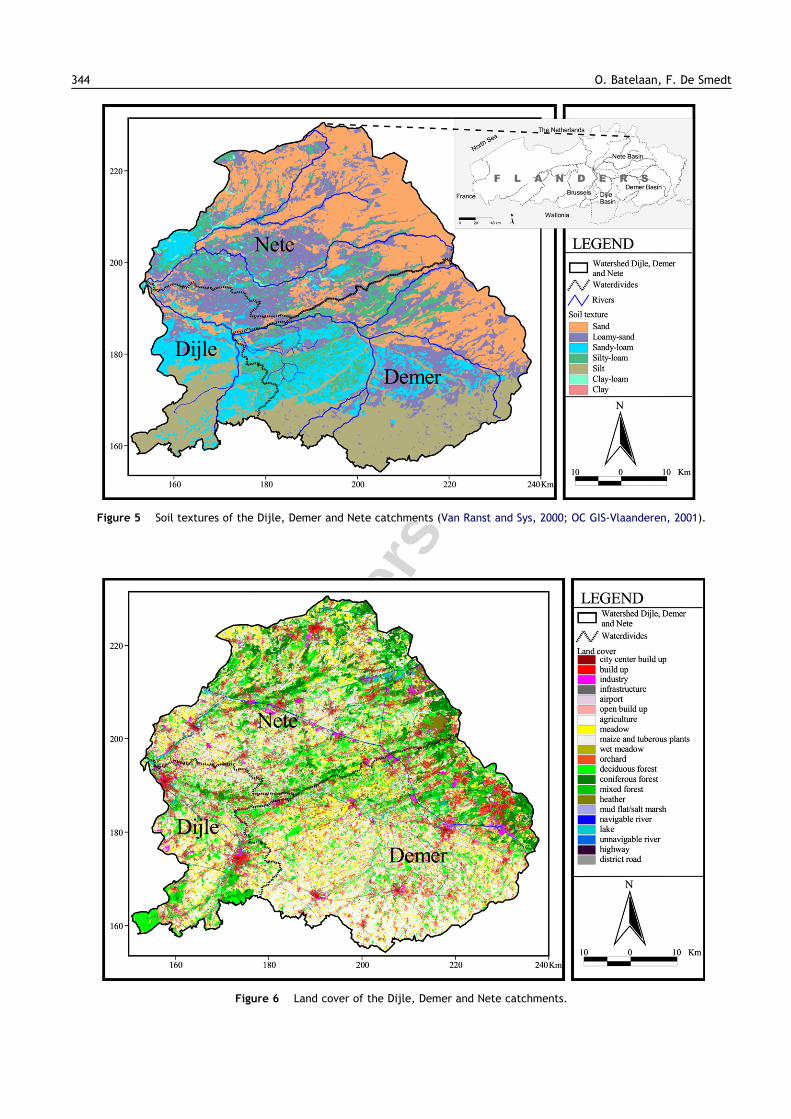
In Fig. 6 a simplified version of the land cover map for theDijle, Demer and Nete catchments is given. The actual landcover map has 22 classes and is a result of a supervised max-imum likelihood classification of Landsat 5, Thematic Map-per (TM) images of 5, 12 and 19th of August 1995 (OC GIS-Vlaanderen, 1996). The classification result was improvedby using the CORINE land cover (NGI, 1994), hydrographical,road and soil association maps. The study area is dominatedby agriculture (35%), forests (24%), built-up areas (20%) andmeadows (14%).
Precipitation has been measured in Brussels (Ukkel) since1833. No significant trend in precipitation was found (Vaeset al., 2002). Dupriez and Sneyers (1978) determined thestatistics of this time series, as well as for 360 stations ofthe Belgian national network for the period 1951–1975.On the basis of these statistics, monthly and yearly isohyetalprecipitation maps were interpolated with respect to theperiod 1833–1975 (Dupriez and Sneyers, 1978). The spatialinterpolation has an error of maximum 5% for stations mostdistant from Ukkel. The precipitation increases from693 mm/yr in the southwest of the Demer catchment upto 866 mm/yr in the north east of the Nete catchment.The spatial average precipitation for the total area is764 mm/yr (st.dev. 27 mm/yr) and for Dijle, Demer andNete respectively 764 (st.dev. 14), 756 (st.dev. 31) and773 mm/yr (st.dev. 23 mm/yr). Seasonal precipitation dif-ferences are limited to a 3% higher precipitation in summer(April till September) than in winter (October till March).The average yearly potential open water evaporation rangesfrom 662 to 675 mm/yr. The summer potential evaporationtypically constitutes about 85% of the total yearly amount.The average windspeed is 3.5 m/s and almost constant forthe winter and summer season, while the temperature isrespectively 5.0 and 14.1 �C for the winter and summer(Sneyers and Vandiepenbeeck, 1995).
0 5 10 15 20 25 30 35 40 45 50 55 60 65
Rainfall interception loss (%)
Heather
Grass
Birch
Oak
Decid. forest
Poplar
Pine
Conif. forest
Spruce
epytnoitatege
V
1
1
1
1
1
2
2
2
2
2
3
4
5
6
6
7 8
9
9
9
9
9
11
11
11
11
12
12
13
10ws
10s10w
: Effective WetSpass interception percentage: WetSpass winter percentage: WetSpass summer percentage
1: Nonhebel (1987), Gash model2: Nonhebel (1987), Mulder model3: Hendriks et al. (1990), winter4: Hendriks et al. (1990), summer5: Meiresonne et al. (1999), summer6: Moors and Dolman (1996), average7: Moors and Dolman (1996), winter8: Moors and Dolman (1996), summer9: Molchanov (1960), van Roestel (1984)10: van Roestel (1984), winter (w) and summer (s)11: de Visser and de Vries (1989)12: Leyton et al. (1967)13: Schnock (1971)
Figure 4 Comparison of simulated interception percentages for typical land cover and forest stands for the test conditions ofUkkel (Table 1) with values cited in literature. Reference 10 (van Roestel, 1984) gives a range of values for the interceptionpercentage in winter (w) and summer (s), which are denoted by intervals in the figure, labeled as 10w, 10s and 10ws.
GIS-based recharge estimation by coupling surface–subsurface water balances 343
Autho
r's
pers
onal
co
py
Figure 5 Soil textures of the Dijle, Demer and Nete catchments (Van Ranst and Sys, 2000; OC GIS-Vlaanderen, 2001).
Figure 6 Land cover of the Dijle, Demer and Nete catchments.
344 O. Batelaan, F. De Smedt

Autho
r's
pers
onal
co
pyIn total 17 river gauging stations, 5 in Dijle, 8 in Demer
and 4 in Nete catchment, were selected for hydrographanalysis (Fig. 7), each with 10 years or more of daily dis-charge data available. The watersheds belonging to thegauging stations were derived from a digital elevation mod-el, based on contour levels of a 1:100,000 scale map, andvary in size between 6 and 2260 km2, as shown in Fig. 7.
The WetSpass model was set-up for the Dijle, Demer andNete catchment with a grid resolution of 50 · 50 m. Addi-tionally, a MODFLOW groundwater flow model was devel-oped with the same resolution (Batelaan and De Smedt,2004). This model was extended with a new MODFLOW pack-age for a better simulation of seepage areas, as discussed byBatelaan and De Smedt (2004).
Results
Baseflow analysis
Despite the conceptual problems and negative opinion to-wards the use of hydrograph separation tools (Hewlett andHibbert, 1967; Appleby, 1970; Nathan and McMahon, 1990;Tallaksen, 1995; Chapman, 1999, 2003), the technique re-mains popular and justified (Dingman, 2002) to estimatespatial averaged recharge. Traditionally, graphical tech-niques to separate the hydrograph in baseflow and surfacerunoff are used. More recently, these techniques have beenautomated by applying algorithms to systematically identifybaseflow of a stream hydrograph (Nathan and McMahon,1990; Sloto and Crouse, 1996; Rutledge, 1998), e.g., Sloto
and Crouse (1996) presented the HYSEP program in whichfixed interval, sliding interval, and local minimum algo-rithms are used. Wittenberg (1999) developed a non-linearstorage–discharge relationship equivalent to the differen-tial non-linear power recession formulation based on solu-tions of the Dupuit–Boussinesq hydraulic theory (Brutsaertand Nieber, 1977; Troch et al., 1993).
The baseflow for the 17 stations is separated with themethods of Sloto and Crouse (1996) and Wittenberg (1999).The comparison of the estimated baseflow percentages re-veals a correlation coefficient of r = 0.64. A non-parametricsign test shows that there is a significant difference(p < 0.01) between the average baseflow percentage of allstations obtained with the Sloto and Crouse (1996) and Wit-tenberg (1999) methodology. Wittenberg (1999) noted thatthe flexibility of the non-linear baseflow separation tech-nique yields a computed baseflow closer to the total dis-charge hydrograph than can be achieved with classicallinear approaches. A non-parametric Kruskal–Wallis testshows significant differences (p < 0.01) in the baseflow be-tween the catchments. These differences can be observedin Fig. 7, which shows the spatial distribution of the baseflowpercentages for the 17 sub-catchments calculated with theSloto and Crouse (1996) methodology. The parts of the Dijle,Demer and Nete River catchments belonging to the moredownstream stations show a lower baseflow percentage.This can be explained by the shallow groundwater conditionsand higher urbanization downstream, causing higher runoffand evapotranspiration and consequently reducing the base-flow in the more downstream parts of the catchments.
Figure 7 Baseflow percentages in different sub-catchments of Dijle, Demer and Nete, determined by the discharge separationtechnique of Sloto and Crouse (1996).
GIS-based recharge estimation by coupling surface–subsurface water balances 345

Autho
r's
pers
onal
co
py
Distributed water balance
The simulated runoff ranges from 1 to 636 mm/yr. The aver-age runoff is 49 mm/yr as observed from the areal cumula-tive distribution in Fig. 8, while for Dijle, Demer and Nete
this is respectively 56, 53 and 42 mm/yr. Fig. 9a gives thesynopsis of the origin of the runoff. It is striking that about55% of the total runoff is produced on impervious surfaces,while much smaller contributions are obtained from vege-tated, bare soil and open water surfaces.
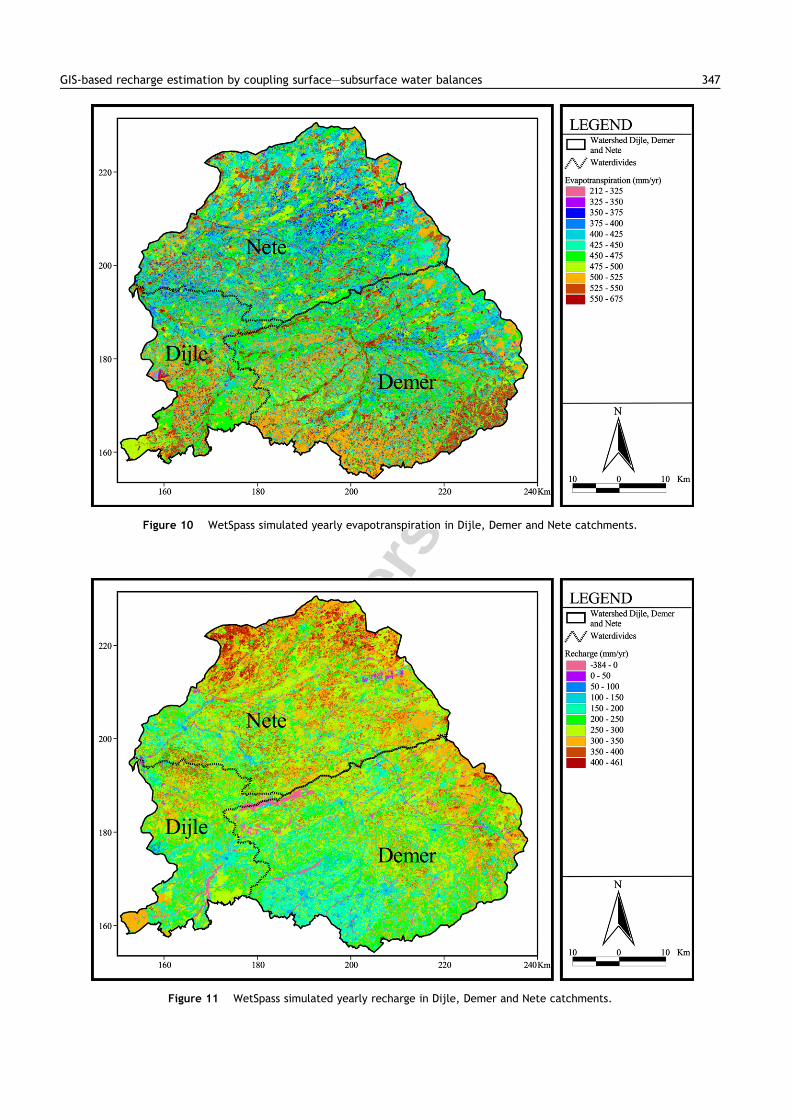
Fig. 10 shows the estimated yearly evapotranspiration.The map shows a complex distributed pattern, with valuesranging from 212 to 675 mm/yr. The average is 465 mm/yrfor the total study area (Fig. 8), and respectively 475, 473and 453 mm/yr for Dijle, Demer and Nete. The componentsof the evapotranspiration in the different catchments aresummarized in Fig. 9b. On yearly basis the total evapotrans-piration consists for about 55% of transpiration, while baresoil evaporation, interception and evaporation from imper-vious and open water surfaces play a much smaller role,that is respectively 19%, 17%, 6% and 2%. On a seasonal basisthe picture looks quite different. In summer the transpira-tion comprises 68%, while in winter this is only 19% of thetotal evapotranspiration. On the other hand, bare soil evap-oration contributes only 8% in summer, while this increasesto 53% in winter.
Fig. 11 shows the yearly groundwater recharge estimatedwith WetSpass. The values range from �384 to 462 mm/yr;the average amounts to 251 mm/yr (Fig. 8) and for Dijle,Demer and Nete this is respectively 236, 231 and 280 mm/yr. Fig. 9c shows that the recharge from bare soil is a majorcomponent in the total recharge. The recharge in the Dijleand Demer catchment occurs for more than 99% during thewinter. In the Nete, however, only 87% of the yearly re-charge occurs in the winter, due to the influence of thesandier soils in this catchment.
0 10 20 30 40 50 60 70 80 90 100
Cumulative area (%)
-400
-300
-200
-100
0
100
200
300
400
500
600
700
Run
off
(),
Eva
potr
ansp
irat
ion
(),
Rec
harg
e(
)(m
m/y
r)
Areal avg ET
Areal avg RO
Areal avg RE
Figure 8 Areal cumulative distributions of simulated runoff,evapotranspiration and recharge fluxes for combined Dijle,Demer and Nete area.
0
50
100
150
200
250
300
350
400
450
500
Eva
potr
ansp
irat
ion
(mm
/yr)
Dij
le
Dem
er
Net
e
Impervious evaporation
Open water evaporation
Bare soil evaporation
Transpiration
Interception
0
10
20
30
40
50
60
Sur
face
runo
ff(m
m/y
r)
Dij
le
Dem
er
Net
e
Impervious runoff
Open water runoff
Bare soil runoff
Vegetated runoff
0
50
100
150
200
250
300
Rec
harg
e(m
m/y
r)
Dijl
e
Dem
er
Net
e
CatchmentCatchmentCatchment
Impervious recharge
Bare soil recharge
Vegetated recharge
a b c
Figure 9 Areal averages for Dijle, Demer and Nete catchments of WetSpass simulated: (a) surface runoff; (b) evapotranspiration;and (c) recharge fluxes.
346 O. Batelaan, F. De Smedt
Autho
r's
pers
onal
co
pyFigure 10 WetSpass simulated yearly evapotranspiration in Dijle, Demer and Nete catchments.
Figure 11 WetSpass simulated yearly recharge in Dijle, Demer and Nete catchments.
GIS-based recharge estimation by coupling surface–subsurface water balances 347

Autho
r's
pers
onal
co
py
Linked groundwater and surface water balancemodelling
The set-up and calibration of the groundwater model hasbeen extensively described by Batelaan and De Smedt(2004). Here only the results are given of the coupling ofthe model with WetSpass for simulation of the water balancein Dijle, Demer and Nete catchments, and comparison withmeasured river discharges in the 17 sub-catchments.Fig. 12a and b shows scatter plots of respectively measuredversus simulated total discharge and measured baseflow ver-sus simulated recharge. The correlation coefficients (R2) fora regression with intercept 0 are respectively 0.95 and 0.93,which indicates that the agreement between model resultsand observations is very good. In order to evaluate the modelperformance, five global error measures were used to com-pare the simulated and measured total discharge: the rela-tive mean and mean absolute error are respectively 10%and 19%, the Nash–Sutcliffe model efficiency (Nash andSutcliffe, 1970) is 0.89, and the coefficient of determinationis 0.69. All these error measures indicate that the fit be-tween observations and model estimates is very good.
Discussion
Notwithstanding the good comparison between the modelresults and the observations, obviously differences remain.These errors can be attributed to uncertainties in the com-plexity of the model-data space, i.e., model concept,observation errors and uncertainties in land cover, soil clas-sifications, slope and precipitation maps. For some catch-ments the assumed correspondence of topographic andgroundwater divides might not be correct. Also, the topo-graphic catchment divide might not be representative forthe actual river catchment, because artificial transfers ofwater by channels, ditches, sewer systems and pumpedgroundwater can disturb the natural water balance. Anothershortcoming is the non-representativeness of present daysoil and land cover conditions to simulate long-term averagewater balances.
In order to understand the spatial recharge distribution,it is useful to first analyze evapotranspiration and surfacerunoff, which occur prior to the recharge. From Fig. 10 itis observed that in the southern part of the Dijle and Demercatchments the average evapotranspiration is high, while inthe northern part of the Dijle and Demer catchments and inthe Nete catchment this is lower. The southern high valuesare the result of silty soil types, which are able to hold moresoil water and yield more evapotranspiration. This is alsothe case for the high evapotranspiration values in the(wet) valleys, which usually consist of more clayey type ofsoils. Especially, in the Demer basin the difference betweenvalleys and surrounding areas is obvious, due to silty valleysoils in contrast to loamy sand and sandy loam soils on theinterfluves. On the eastern rim of the Nete and Demercatchment several coniferous forests are clearly noticeableby their relatively high evapotranspiration.
Differences in evapotranspiration between the basins,shown in Fig. 9b, indicate that the total evapotranspirationfor Dijle and Demer is very similar, while it is about 5% lowerin the Nete basin. This difference occurs mainly in summer,since in winter evapotranspiration is very small, as solar en-ergy is limited. In summer, energy is not the limiting factor,but rather the water availability. This explains why theNete, with sandier soils, has a lower transpiration and baresoil evaporation than the other two catchments. On theother hand, the interception and open water evaporationin the Nete catchment is about 30% higher than in Dijleand Demer. This is mainly due to the higher forest cover,which is 29.0% in Nete, 24.6% in Dijle, and 19.9% in Demercatchment.
It would be interesting to reveal the correlation betweenthe evapotranspiration map and one or more of its relatedfactors, as soil, land cover, precipitation, etc. The covari-ance of one map with another can be measured and de-scribed quantitatively, however the significance of aparticular correlation value in a probabilistic sense is muchmore difficult to evaluate with spatial data than with non-spatial data. Instead of using the term ‘significant’, it issafer to talk about ‘unusual’ or ‘interesting’ correlations,drawing the attention to an association, rather than
0 4 8 12 16 20
Observed total discharge (m3/s)
0
4
8
12
16
20
Sim
ulat
edto
tald
isch
arge
(m3 /
s)
R2 = 0.95
0 4 8 12 16
Observed baseflow (m3/s)
0
4
8
12
16
Sim
ulat
edre
char
ge(m
3 /s)
R2 = 0.93a b
Figure 12 Comparison of observed total yearly average discharge (a) and baseflow (b) with WetSpass simulation results.
348 O. Batelaan, F. De Smedt

Autho
r's
pers
onal
co
py
implying that a correlation can be rejected at some level ofprobability (Bonham-Carter, 1994).
Also, global correlations between mapped variables areusually not very high, and correlations often appear locallyonly under a given set of conditions. Bonham-Carter (1994)and Whitman et al. (1999) describe a method to quantizethe mapped variables into a finite number of discrete clas-ses and then compare the degree of overlap between clas-ses by means of a cross-area tabulation. This results in aChi-square statistic, which has a lower limit of 0 and a var-iable upper limit. Its value is further dependent on the unitof measurement. Therefore, Cramer’s coefficient V is oftenused instead (Eastman, 1999). V varies from 0, no correla-tion between maps, to 1, perfect correlation.
The maps of precipitation, potential evaporation, totalactual evapotranspiration, runoff and recharge are slicedin intervals of 5 mm/yr, while the slope is sliced in intervalsof 0.25%, and the groundwater depth in intervals of 0.5 m.The Cramer’s V correlation coefficients determined withthe GIS IDRISI32 (Eastman, 1999) are given in Table 2. Thisreveals that evapotranspiration has a high, interesting, cor-relation with land cover. The soil and potential open waterevaporation maps show lower correlations, while the othermaps are less correlated with evapotranspiration. Runoffshows an interesting association with land cover, but alsowith soil texture, while other maps are less correlated. Onthe other hand, recharge is only moderately correlated withland cover and soil texture. Overall, land cover seems tohave the highest impact on the distribution of the differentwater balance components, while soil texture is the secondmost important. The slope has very little impact, which canbe explained by the rather gentle topography of the studyarea. The moderate impact of the precipitation and poten-tial evapotranspiration can be explained similarly, i.e.,these show relatively little variation over the study area.In the lower part of Table 2, correlations are also givenbetween the WetSpass output maps. It follows that thesecorrelations are similar and moderate, however evapotrans-piration has slightly higher correlations with the otheroutput maps, obviously an effect of the influence of theland cover, as discussed above.
Since the land cover and soil map display the highest cor-relation with the resulting WetSpass output maps, it is use-ful to investigate the means and standard deviations of theevapotranspiration, runoff and recharge for the different
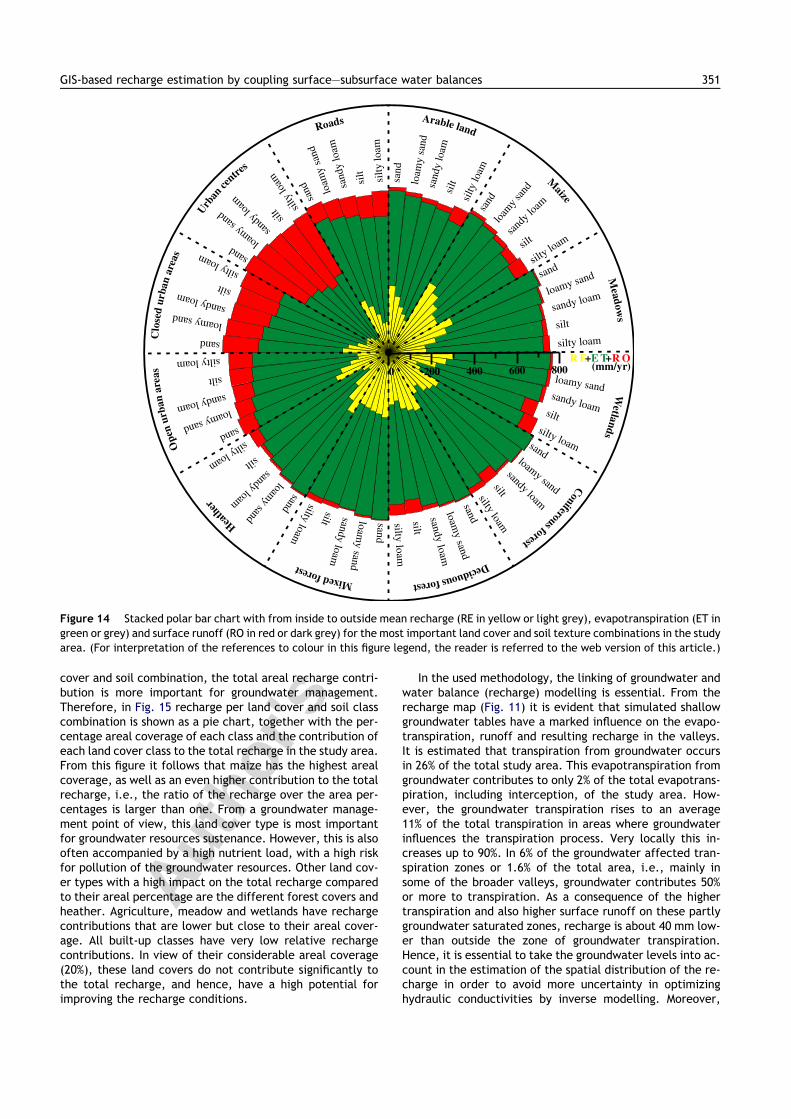
land cover and soil texture classes of the Dijle, Demer andNete catchments. Fig. 13 presents the mean and standarddeviation of WetSpass simulated runoff, evapotranspirationand recharge per land cover and soil texture class for the to-tal study area. It is noticeable from this figure that land cov-er has a stronger influence on evapotranspiration than soiltexture. The evapotranspiration also has smaller standarddeviations for each land cover class, which implies less im-pact of other factors. Most of the variability in the evapo-transpiration for a particular land cover is due todifferences in soil texture. Therefore, in Fig. 14, the meanevapotranspiration is given for each combination of landcover and soil class, together with recharge and runoff. Inthis figure, less frequent combinations, as land cover withclayloam and clay soil texture, are left out. Notice thatthe evapotranspiration values increase about 75 mm/yrwithin each land cover class going from sandy to silty soil,likewise runoff increases markedly. These increases ofevapotranspiration and runoff with finer soil textures arecompensated by a reduction of recharge values. Fig. 14shows also that there are large differences in runoff be-tween on the one hand natural and agricultural landusesand on the other hand the urbanized areas, which have run-off values of factor 2–5 larger.
Overall, the large range in runoff values can be explainedby the large impact of the land cover and soil texture(Fig. 13) on the generation of runoff. Intermediate runoff,i.e., 50–200 mm/yr, is mainly produced by urban areas,roads, etc., while large runoff, more than 200 mm/yr, oc-curs on open waters and groundwater saturated areas. Inthe Demer and especially the Nete catchment, the lowestrunoff values occur on sandy soil textures in the northeast-ern part of these catchments. Although the correlation be-tween on the one hand runoff and on the other land coverand soil textures is by far the most important (Table 2), lo-cal influences of slope and precipitation can be noticed. Theseasonal difference in the runoff is relatively small,although the runoff is slightly higher in summer than in win-ter. This is mainly due to higher runoff in summer from veg-etated surfaces; this effect is reduced in winter due tohigher runoff from bare soil and open water.
Fig. 9c indicates that the recharge on bare soils is animportant component of the total recharge. However, baresoil should be understood as the parts of grid cells with a landcover class like deciduous forest or agricultural fields, whichespecially in winter have a large non-vegetated (bare) cover.Hence, since the leaf area is low in the non-growing seasonand moreover the precipitation intensity, transpiration andevaporation are low, the recharge in these bare soil partsof otherwise vegetated areas is high. Since recharge is a re-sult of evapotranspiration and runoff processes it incorpo-rates all influences and spatial patterns of these processes.This causes a complex spatial distribution pattern of the re-charge (Fig. 11). Negative recharge values are found in thevalleys, especially in Dijle and Demer, but constitute lessthan 2% of the total area. These areas are groundwater dis-charge locations with high runoff and high evapotranspira-tion by abundant phreatophytic vegetation, resulting innegative recharge, which is balanced by the inflowinggroundwater. On the other hand, high recharge rates, i.e.,larger than 400 mm/yr, also occur in less than 1.5% ofthe area. These are located close to the northern and
Table 2 Cramer’s V correlation coefficient between Wet-Spass result maps and the WetSpass input maps (ET standsfor total actual evapotranspiration)
Map ET Runoff Recharge
Land cover 0.50 0.56 0.33Soil 0.37 0.50 0.36Slope 0.05 0.08 0.04Precipitation 0.19 0.16 0.26Potential ET 0.36 0.23 0.21Groundwater depth 0.07 0.07 0.06Actual ET 1.00 0.31 0.32Runoff 0.31 1.00 0.25Recharge 0.32 0.25 1.00
GIS-based recharge estimation by coupling surface–subsurface water balances 349

Autho
r's
pers
onal
co
py
north-eastern water divides of the Nete and Demer basin onsandy soils and mostly maize land cover. Furthermore, re-charge is lower than average in the southern part of the Dijleand Demer catchments, especially in several valley andurban locations. Similarly, in the western part of the Demercatchment, lower recharge values occur due to higherevapotranspiration. Larger than average recharge valuesare found in the sandy soil region in the northeastern partof the Demer and Nete catchment. This results in larger re-charge values for the Nete catchment than for the two othercatchments. Fig. 9 shows that higher recharge for the Nete isnot the result of a relatively low evapotranspiration, but of alower runoff compared to the two other catchments. Thisagain can be attributed to soil texture, but also in particularto less built-up areas in the Nete (22%) compared to theDemer (24%) and especially Dijle (34%) catchment.
Overall, the spatial distribution of recharge is not specif-ically related to either land cover, soil or any other inputmaps, as can be observed from the relatively small Cramer’sV coefficients (Table 2). The highest correlation for the re-charge map is given by the soil map. Fig. 13 shows that thedifferent soil textures cause a somewhat larger variation inrecharge values than the land cover classes, which explainsthe higher correlation between the recharge and soil tex-ture map than with the land cover map. Fig. 14 shows thatrecharge decreases markedly with finer soil texture irre-spective of the land cover classes. Agriculture, grasslandand heather result in high recharge only on sandy soils. Onthe other hand, deciduous and mixed forests show also rel-atively high recharge but their dependence on soil texture isclearly less significant. Although Fig. 14 allows a good inter-pretation of the relative importance of recharge per land
Mai
ze
Mix
edfo
rest
Hea
ther
Dec
iduo
usfo
rest
Con
ifer
ous
fore
st
Mea
dow
s
Ara
ble
land
Wet
land
s
Roa
ds
Ope
nur
ban
area
s
Indu
stri
alar
ea
Clo
sed
urba
nar
eas
Urb
ance
ntre
s
Air
port
Ope
nw
ater
Land cover
-100
0
100
200
300
400
Rec
harg
e(m
m/y
r)
San
d
Loa
my
sand
San
dylo
am
Silt
ylo
am Sil
t
Cla
yloa
m
Cla
y
Soil texture
300
400
500
600
Eva
potr
ansp
irat
ion
(mm
/yr)
-100
0
100
200
300
400
Run
off
(mm
/yr)
Figure 13 Mean and standard deviation of WetSpass simulated runoff, total evapotranspiration and recharge per land cover andsoil texture class for the total study area.
350 O. Batelaan, F. De Smedt
Autho
r's
pers
onal
co
pycover and soil combination, the total areal recharge contri-bution is more important for groundwater management.Therefore, in Fig. 15 recharge per land cover and soil classcombination is shown as a pie chart, together with the per-centage areal coverage of each class and the contribution ofeach land cover class to the total recharge in the study area.From this figure it follows that maize has the highest arealcoverage, as well as an even higher contribution to the totalrecharge, i.e., the ratio of the recharge over the area per-centages is larger than one. From a groundwater manage-ment point of view, this land cover type is most importantfor groundwater resources sustenance. However, this is alsooften accompanied by a high nutrient load, with a high riskfor pollution of the groundwater resources. Other land cov-er types with a high impact on the total recharge comparedto their areal percentage are the different forest covers andheather. Agriculture, meadow and wetlands have rechargecontributions that are lower but close to their areal cover-age. All built-up classes have very low relative rechargecontributions. In view of their considerable areal coverage(20%), these land covers do not contribute significantly tothe total recharge, and hence, have a high potential forimproving the recharge conditions.
In the used methodology, the linking of groundwater andwater balance (recharge) modelling is essential. From therecharge map (Fig. 11) it is evident that simulated shallowgroundwater tables have a marked influence on the evapo-transpiration, runoff and resulting recharge in the valleys.It is estimated that transpiration from groundwater occursin 26% of the total study area. This evapotranspiration fromgroundwater contributes to only 2% of the total evapotrans-piration, including interception, of the study area. How-ever, the groundwater transpiration rises to an average11% of the total transpiration in areas where groundwaterinfluences the transpiration process. Very locally this in-creases up to 90%. In 6% of the groundwater affected tran-spiration zones or 1.6% of the total area, i.e., mainly insome of the broader valleys, groundwater contributes 50%or more to transpiration. As a consequence of the highertranspiration and also higher surface runoff on these partlygroundwater saturated zones, recharge is about 40 mm low-er than outside the zone of groundwater transpiration.Hence, it is essential to take the groundwater levels into ac-count in the estimation of the spatial distribution of the re-charge in order to avoid more uncertainty in optimizinghydraulic conductivities by inverse modelling. Moreover,
0 800
sand
silty loam
sand
y loam
silt
loam
ysa
nd
sand
silty
loam
sand
ylo
amsi
ltloam
ysa
nd
600400200
sand
silty
loam
sand
ylo
am
silt
loam
ysa
nd
sand
silty
loam
sand
yloam
silt
loamysan
d
sand
siltyloam
sandyloam silt
loamysand
sand
silty loam
sandy loam
silt
loamy sand
sand
siltyloamsandyloam
silt
loamy
sand
sand
siltyloam
sandyloam
silt loamy
sand
sandsiltyloam
sandyloam
silt
loamy
sand
sand
siltyloam
sandy loam
silt
loamy sand
silty loam
sandy loamsilt
loamy sand
sand
siltyloam
sandyloam
silt
loamysand
M
aize
Meadow
sW
etlands
Arable land
Coniferousforest
DeciduousforestMixedforest
Heath
er
Ope
nur
ban
area
sC
lose
dur
ban
area
s
Urban
centre
s
Roads
R E+ +E T R O(mm/yr)
Figure 14 Stacked polar bar chart with from inside to outside mean recharge (RE in yellow or light grey), evapotranspiration (ET ingreen or grey) and surface runoff (RO in red or dark grey) for the most important land cover and soil texture combinations in the studyarea. (For interpretation of the references to colour in this figure legend, the reader is referred to the web version of this article.)
GIS-based recharge estimation by coupling surface–subsurface water balances 351

Autho
r's
pers
onal
co
pythe use of the MODFLOW evapotranspiration package is notneeded since the present methodology also accounts for theevapotranspiration losses from groundwater.
The advantage of embedding the methodology in GIS isthat it allows easy evaluation of the effects of land coverchanges on recharge. Additionally, the GIS approach provesto be very useful in the spatial analysis of the simulatedrecharge, and could be used to optimize the recharge con-ditions and improve groundwater protection and sustain-ability. Moreover, the GIS structure of the model withparameters as attribute tables has been shown to beadvantageous in transferring it to other environments.The model is modest in its data requirements and hasthe possibility that remote sensing derived data layerscan be used. WetSpass was successfully applied in Belgiumas well as in other type of environments like in the Upper-Biebrza catchment, Poland (Thijs, 2002) and the Geba Ba-sin, Tigray, Ethiopia (Asfaw, 2005).
Conclusions
Spatial distribution of recharge is seldom taken into accountin groundwater simulations, although poorly parameterizedrecharge can increase significantly the uncertainty in mod-elling results and calibration, especially the estimation ofthe hydraulic conductivity. Baseflow separation techniques
for the Dijle, Demer and Nete catchments indicate a signif-icant spatial distribution of the recharge, which proves theneed for distributed spatial simulation of recharge. With theadvent of Geographic Information Systems and the availabil-ity of spatial and remotely derived data sets, a logical stepis to estimate recharge as a result of a surface water bal-ance simulation. The developed GIS-based WetSpass meth-odology is therefore a tool that, in conjunction with agroundwater model, can simulate accurately the spatial dis-tribution of long-term average recharge. The developmentof the model and the parameter estimation is not the resultof an a priori ‘upward’ physical approach, but rather a‘downward’ process, starting from a simple water balanceapproach, which subsequently evolved by introducing rele-vant concepts and input data step by step (Sivapalanet al., 2003). The model results correspond well with pointestimates of water balance fluxes in Belgium and The Neth-erlands. The combined WetSpass and groundwater modelwas applied to the Dijle, Demer and Nete catchments andon the basis of five global error measures was acceptablyverified with measured discharges and estimated baseflowsin 17 sub-catchments. The model concept can relativelyeasy be transferred to other areas due to its open GIS basedconcept.
In about 25% of the study area shallow water table con-ditions cause transpiration from groundwater, on average
0 100 200 300 400
RE (mm/yr)
Wetlands
Deciduousforest
14.2 %
Coniferousforest
6.3 %2.0 %
Mixedforest 5.7 %
Arableland
14.6 %
Maize24.9 %
Meadows14.3 %
Other
4.9 %
Heather2.0 %
Openurbanareas
6.3 %
Closed urbanareas
3.6 %
Urban centres
Roads0.5%
sand
silty loam
sand
ylo
amsil
t
loam
ysa
nd
16.2 %
19.3 %
14.2 %
2.3 %5.9 %
13.2 %
4.9 %
1.8 %
7.6 %
5.0 %
1.8% 0.4%0.8%
7.3 %
Figure 15 Pie chart of the areas of the different land cover and soil texture combinations in the study area. Soil textures areindicated by different colors or grey shades. The radius of the pies are scaled according to the amount of average recharge of aparticular land cover and soil combination. Percentages on the outside of the circle indicate the relative area of the land coverclass, while the italic percentage inside the circle is the contribution of the land cover class to the total recharge of the study area.
352 O. Batelaan, F. De Smedt

Autho
r's
pers
onal
co
py
11% of total transpiration. Recharge in these areas is re-duced by 15% compared to the overall average. However,with shallow groundwater conditions and abundant vegeta-tion the recharge can locally reduce to negative values,indicating the importance of taking the simulated ground-water level into account in a recharge estimation proce-dure. Although these seepage areas with negativerecharge values constitute less than 2% of the total area,they give structure to the simulated complex spatial distri-bution of recharge in the Dijle, Demer and Nete catch-ments. Cramer’s Chi square statistics show that althoughthe recharge pattern has no particularly high correlationwith any input map, soil texture and land cover have themost impact. However, simulated evapotranspiration andsurface runoff show higher correlations with land cover.Surface runoff is for about 55% produced on impervious sur-faces, which is 2–5 times higher than runoff from natu-ral and agricultural land covers. Total evapotranspirationconsists for about 55% of transpiration. Recharge appearsto be strongly seasonal, i.e., almost exclusively occurringin winter, except in the sandier Nete catchment where13% of the recharge occurs in summer. The Nete catch-ment also has a recharge, which on average is consider-ably higher than in the other catchments. This is causedby a lower runoff, which is due to a flatter terrain, sandiersoils, and less built-up area. Recharge on bare soils as apart of vegetated areas, i.e., deciduous forest and agricul-tural fields in winter, is shown to be an important compo-nent of total recharge. GIS analysis of recharge per landcover shows that agriculture, grassland and heather onsand produce the highest recharge, while deciduous andmixed forests also produce high recharge, but are lessdependent on the soil texture. Obviously, impervious sur-faces exhibit the lowest recharge values. Taking the arealsurface of a land cover into account, maize fields contrib-ute the most to the total recharge. Hence, from ground-water quantity management point of view, maize fieldsare very important for the groundwater resources. How-ever, maize fields on the other hand are a high risk withrespect to groundwater pollution by nutrients and threa-ten therefore severely the sustainability of the groundwa-ter resources. Likewise, positively contributing to thegroundwater resources are forest and heather. Other agri-culture, meadow and wetlands are average recharge con-tributors. Urbanized areas in combination with their 20%areal coverage are the worst with respect to recharge,but as such have the highest potential for improving re-charge conditions. The presented GIS-embedded method-ology to estimate recharge has the significant advantagethat it allows optimization of recharge conditions andimprovement of groundwater management.
References
Anderson, M.P., Woessner, W.W., 1992. Applied GroundwaterModeling, Simulation of Flow and Advective Transport. Aca-demic Press, San Diego, CA.
Appleby, V.C., 1970. Recession and the baseflow problem. WaterResources Research 6 (5), 1398–1403.
Armbruster, V., Leibundgut, C., 2001. Determination of spatiallyand temporally highly detailed groundwater recharge in porousaquifers by a SVAT model. Physics and Chemistry of the Earth
Part B – Hydrology Oceans and Atmosphere 26 (7–8), 607–611.
Arnold, J.G., Muttiah, R.S., Srinivasan, R., Allen, P.M., 2000.Regional estimation of base flow and groundwater recharge inthe upper Mississippi river basin. Journal of Hydrology 227, 21–40.
ASCE, 1990. Evapotranspiration and irrigation water requirements.In: Jensen, M.E., Burman, R.D., Allen, R.G. (Eds.), ASCE Manualsand Reports on Engineering Practice, vol. 70. ASCE, New York.
Asfaw, M.G., 2005. Groundwater recharge and water balanceassessment in Geba basin, Tigray, Ethiopia. MSc-thesis IUPWARE,Vrije Universiteit Brussel, Katholieke Universiteit Leuven.
Batelaan, O., De Smedt, F., 2001. Wetspass: a flexible, GIS based,distributed recharge methodology for regional groundwatermodelling. In: Gehrels, H., Peters, J., Hoehn, E., Jensen, K.,Leibundgut, C., Griffioen, J., Webb, B., Zaadnoordijk, W.-J.(Eds.), Impact of Human Activity on Groundwater Dynamics, vol.Publ. No. 269. IAHS, Wallingford, pp. 11–17.
Batelaan, O., De Smedt, F., 2004. Seepage, a new modflow drainpackage. Ground Water 42 (4), 576–588.
Batelaan, O., De Smedt, F., Triest, L., 2003. Regional groundwaterdischarge: phreatophyte mapping, groundwater modelling andimpact analysis of land-use change. Journal of Hydrology 275(1–2), 86–108.
Bogena, H., Kunkel, R., Schobel, T., Schrey, H.P., Wendland, F.,2005. Distributed modeling of groundwater recharge at themacroscale. Ecological Modelling 187 (1), 15–26.
Bonham-Carter, G.F., 1994. Geographic Information Systems forGeoscientists: Modelling with GIS, first ed. Pergamon,Kidlington.
Brooks, R.H., Corey, A.T., 1964. Hydraulic properties of porousmedia. Technical Report. Hydrology Paper 3, Colorado StateUniversity.
Brooks, R.J., Lerner, D.N., Tobias, A.M., 1994. Determining therange of predictions of a groundwater model which arises fromalternative calibrations. Water Resources Research 30 (11),2993–3000.
Brutsaert, W.H., Nieber, J.L., 1977. Regionalized drought flowhydrographs from a mature glaciated plateau. Water ResourcesResearch 13 (3), 637–643.
Calder, I.R., 1979. Do trees use more water than grass? WaterServices 1, 4p.
Calder, I.R., 1998. Water-resource and land-use issues. TechnicalReport SWIM Paper 3, International Water ManagementInstitute.
Carrera, J., Medina, A., 1999. A discussion on the calibration ofregional groundwater models. In: Feyen, J., Wiyo, K. (Eds.),Modelling of Transport Processes in Soils. Wageningen Pers,Wageningen, pp. 629–640.
Chapman, T.G., 1999. A comparison of algorithms for stream flowrecession and baseflow separation. Hydrological Processes 13,701–714.
Chapman, T.G., 2003. Modelling stream recession flows. Environ-mental Modelling & Software 18 (8–9), 683–692.
Chardigny, E., 1999. Modilisation de l’hydrodynamique des eauxsouterraines: de la conception du modele a l’estimation desparametres par approche inverse. Phd thesis, Universite LouisPasteur, Strasbourg.
Cherkauer, D.S., 2004. Quantifying ground water recharge atmultiple scales using PRMS and GIS. Ground Water 42 (1), 97–110.
Cherkauer, D.S., Ansari, S.A., 2005. Estimating ground waterrecharge from topography, hydrogeology, and land cover.Ground Water 43 (1), 102–112.
Chow, V.T., Maidment, D.R., Mays, L.W., 1988. Applied Hydrology.McGraw-Hill, New York.
Cosby, B.J., Hornberger, G.M., Clapp, R.B., Ginn, T.R., 1984. Astatistical exploration of the relationships of soil moisture
GIS-based recharge estimation by coupling surface–subsurface water balances 353

Autho
r's
pers
onal
co
py
characteristics to the physical properties of soils. WaterResources Research 20 (6), 682–690.
De Smedt, F., Batelaan, O., 2003. Investigation of the humanimpact on regional groundwater systems. In: Tiezzi, E., Brebbia,C.A., Uso, J.L. (Eds.), Ecosystems and Sustainable Development,Advances in Ecological Sciences, vol. 19. WIT Press, pp. 1145–1153.
de Visser, P.H.B., de Vries, W., 1989. De gemiddeld jaarlijksewaterbalans van bos-, heide- en graslandvegetaties. TechnicalReport 2085, Stichting voor Bodemkartering,Wageningen.
de Vries, J.J., Simmers, I., 2002. Groundwater recharge: anoverview of processes and challenges. Hydrogeology Journal 10(1), 5–17.
Dickinson, J.E., Hanson, R.T., Ferre, T.P.A., Leake, S.A., 2004.Inferring time-varying recharge from inverse analysis of long-term water levels. Water Resources Research 40, W07403.doi:10.1029/2003WR002650.
Dickinson, R.E., Henderson-Sellers, A., Kennedy, P.J., 1993.Biosphere–atmosphere transfer scheme (BATS) version 1e ascoupled to the NCAR community climate model. NCAR technicalnote NCAR/TN-387+STR, National Center for AtmosphericResearch, Boulder, CO.
Dingman, S.L., 2002. Physical Hydrology, second ed. Prentice-Hall,Upper Saddle River, NJ.
Dolman, A.J., Nonhebel, S., 1988. Modelling forest water consump-tion in The Netherlands. Agricultural Water Management 14,413–422.
Dunne, T., Black, R.D., 1970a. An experimental investigation ofrunoff production in permeable soils. Water Resources Research6 (2), 478–490.
Dunne, T., Black, R.D., 1970b. Partial area contributions to stormrunoff in a small new England watershed. Water ResourcesResearch 6 (5), 1297–1311.
Dupriez, G.L., Sneyers, R., 1978. Les normales du reseau pluv-iometrique Belge. Vol. Publications, Serie A, No. 101. L’InstitutRoyal Meteorologique de Belgique, Brussels.
Eastman, J.R., 1999. Manual Geographic Information SystemIDRISI32. Clark Labs, Clark University.
Famiglietti, J.S., Wood, E.F., 1994. Multiscale modeling of spatiallyvariable water and energy balance processes. Water ResourcesResearch 30 (11), 3061–3078.
Fazal, M.A., Imaizumi, M., Ishida, S., Kawachi, T., Tsuchihara, T.,2005. Estimating groundwater recharge using the SMAR concep-tual model calibrated by genetic algorithm. Journal of Hydrology303 (1–4), 56–78.
Federer, C.A., 1979. A soil–plant–atmosphere model for transpi-ration and availability of soil water. Water Resources Research15 (3), 555–562.
Flint, A.L., Flint, L.E., Kwicklis, E.M., Fabryka-Martin, J.T., Bod-varsson, G.S., 2002. Estimating recharge at yucca mountain,Nevada, USA: comparison of methods. Hydrogeology Journal 10(1), 180–204.
Freeze, R.A., 1969. The mechanism of natural ground-waterrecharge and discharge 1. one-dimensional, vertical, unsteady,unsaturated flow above a recharging or discharging ground-water flow system. Water Resources Research 5 (1), 153–171.
Freeze, R.A., Cherry, J.A., 1979. Groundwater. Prentice-Hall,Englewood Cliffs, NJ.
Gash, J.H., 1979. An analytical model of rainfall interception byforests. Quarterly Journal Royal Meteorological Society 105, 43–55.
Gehrels, J.C., 1999. Groundwater level fluctuations, separation ofnatural from anthropogenic influences and determination ofgroundwater recharge in the Veluwe area, The Netherlands. Phdthesis, Vrije Universiteit.
Gellens-Meulenberghs, F., Gellens, D., 1992. L’evapotranspirationpotentielle en Belgique variabilite spatiale et temporelle. Vol.
Publications, Serie A, no. 130. L’Institut Royal Meteorologiquede Belgique, Brussels.
Grossmann, J., 1998. Berechnung der Grundwasserneubildung ausNiederschlag, Beschreibung eines Verfahrens. Technical Report,Hamburger Wasserwerke GmbH.
Guimera, J., Candela, L., 1999. Comparison of different tracermethods to assess natural recharge. Physics and Chemistry ofthe Earth Part B – Hydrology Oceans and Atmosphere 24 (4),343–347.
Healy, R.W., Cook, P.G., 2002. Using groundwater levels toestimate recharge. Hydrogeology Journal 10 (1), 91–109.
Hendriks, M.J., Kabat, P., Homma, F., Postma, J., 1990. Onderzoeknaar de verdamping van een loofbos; meetresultaten en enkelemodelberekeningen. Technical Report 90, Staring Centrum,Wageningen.
Hewlett, J.D., Hibbert, A.R., 1967. Factors affecting the responseof small watersheds to precipitation in humid areas. In: Sopper,W.E., Lull, H.W. (Eds.), International Symposium on ForestHydrology. Pergamon, New York, pp. 275–290.
Jackson, T.J., 2002. Remote sensing of soil moisture: implicationsfor groundwater recharge. Hydrogeology Journal 10 (1), 40–51.
Kabat, P., Beekma, J., 1994. Water in the unsaturated zone. In:Ritzema, H.P. (Ed.), Drainage Principles and Applications. Vol.ILRI Publication 16. Wageningen, pp. 383–434.
Ladekarl, U.L., Rasmussen, K.R., Christensen, S., Jensen, K.H.,Hansen, B., 2005. Groundwater recharge and evapotranspirationfor two natural ecosystems covered with oak and heather.Journal of Hydrology 300 (1–4), 76–99.
Lerner, D.N., Issar, A.S., Simmers, I., 1990. Groundwater recharge aguide to understanding and estimating natural recharge. Interna-tional Contributions to Hydrogeology, vol. 8. International Asso-ciation of Hydrogeologists, Verlag Heinz Heise, Hannover.
Leyton, L., Reynolds, E.R.C., Thompson, F.B., 1967. Rainfallinterception in forest and moorland. In: Sopper, W.E., Lull,H.W. (Eds.), Forest Hydrology: International Symposium onForest Hydrology. Pergamon, Exford, pp. 163–178.
Meiresonne, L., Nadezhdin, N., Cermak, J., Van Slycken, J.,Ceulemans, R., 1999. Transpiration of a poplar stand: modelcalibration and validation by soil water and sap flow measure-ments. In: Feyen, J., Wiyo, K. (Eds.), Modelling of TransportProcesses in Soils. Wageningen Pers, Wageningen, pp. 406–415.
Meiresonne, L., Sampson, D.A., Kowalski, A.S., Janssens, I.A.,Nadezhdina, N., Cermak, J., Van Slycken, J., Ceulemans, R.,2003. Water flux estimates from a Belgian scots pine stand: acomparison of different approaches. Journal of Hydrology 270(3–4), 230–252.
Meiresonne, L., Van Slycken, J., 1999. Biogeochemical cycles ofBelgian forest ecosystems related to global change and sustain-able development. Technical Report. Annual report 3, 1999,Institute for Forestry and Game Management, IBW.
Molchanov, A.A., 1960. The hydrological role of forests. TechnicalReport. Academy of science, USSR. Institute of forestry (Trans-lation from Russian, 1963).
Monteith, J.L., 1965. Evaporation and the environment. In: Fogg,G.E. (Ed.), The State and Movement of Water in LivingOrganisms. Cambridge University Press, Cambridge, pp. 205–234.
Moors, E.J., Dolman, A.J., Bouten, W., Veen, A.W.L., 1996. Deverdamping van bossen. H2O 29 (16), 462–466.
Mulder, J.P.M., 1985. Simulating interception loss using standardmeteorological data. In: Hutchison, B.A., Hicks, B.B. (Eds.), TheForest–Atmosphere Interaction. Reidel, Dordrecht, pp. 177–196.
Nash, J.E., Sutcliffe, J.V., 1970. River flow forecasting throughconceptual models, i., a discussion of principles. Journal ofHydrology 10, 282–290.
Nathan, R.J., McMahon, T.A., 1990. Evaluation of automatedtechniques for baseflow and recession analyses. WaterResources Research 26 (7), 1465–1473.
354 O. Batelaan, F. De Smedt
Autho
r's
pers
onal
co
py
NGI, 1994. Corine 1990 land cover data of Belgium, NationaalGeografisch Instituut, Brussels. Technical Report.
Nonhebel, S., 1987. Waterverbruik van Nederlandse bossen: eenmodellen studie. Vol. 7g Bos en water. Studiecommissie water-beheer natuur, bos en landschap, Groningen.
OC GIS-Vlaanderen, 1996. Land use. Small scale land use of Flandersand Brussels, derived from Landsat TM satellite images (1995).Technical Report. Produced by OC-GIS Vlaanderen.
OC GIS-Vlaanderen, 2001. Digital version of the soil map ofFlanders, Iwt, version 2001, scale 1/20,000.
Pilgrim, D.H., Cordery, I., 1992. Flood runoff. In: Maidment, D.R.(Ed.), Handbook of Hydrology. McGraw-Hill, New York, pp. 9.1–9.41.
Querner, E.P., 2000. The effects of human intervention in the waterregime. Ground Water 38 (2), 167–171.
Rawls, W.J., Ahuja, L.R., Brakensiek, D.L., Shirmohammadi, A.,1992. Infiltration and soil water movement. In: Maidment, D.R.(Ed.), Handbook of Hydrology. McGraw-Hill, New York, pp. 5.1–5.51.
Roberts, J., 1983. Forest transpiration: a conservative hydrologicalprocess? Journal of Hydrology 66, 133–141.
Rubin, J., 1966. Theory of rainfall uptake by soils initially drier thantheir field capacity and its applications. Water ResourcesResearch 2 (4), 739–749.
Rutledge, A.T., 1998. Computer programs for describing therecession of ground-water discharge and for estimating meanground-water recharge and discharge from streamflow records –update. Technical Report. Water-resources investigations report98-4148, US Geological Survey.
Sanford, W., 2002. Recharge and groundwater models: an overview.Hydrogeology Journal 10 (1), 110–120.
Saxton, K.E., Rawls, W.J., Romberger, J.S., Papendick, R.I., 1986.Estimating generalized soil-water characteristics from texture.Soil Science Society American Journal 50 (4), 1031–1036.
Scanlon, B.R., Healy, R.W., Cook, P.G., 2002. Choosing appropriatetechniques for quantifying groundwater recharge. HydrogeologyJournal 10 (1), 18–39.
Schnock, G., 1971. Le bilan d’eau dans l’ecosysteme foret.Application a une chenaie melangee de haute Belgique. In:Duvigneaud, P. (Ed.), Productivite des ecosystemes forestiers.Actes Coll. Bruxelles, 1969. UNESCO.
Schroeder, M., 1983. Neue Werte zur Grundwasserneubildung unterWald fur das Munsterland. Deutsche Gewasserkundliche Mitteil-ungen 27, 121–124.
Shuttleworth, W.J., 1992. Evaporation. In: Maidment, D.R. (Ed.),Handbook of Hydrology. McGraw-Hill, New York, pp. 4.1–4.53.
Simmers, I. (Ed.), 1988. Estimation of Natural GroundwaterRecharge. Reidel, Boston.
Sivapalan, M., Bloschl, G., Zhang, L., Vertessy, R., 2003. Downwardapproach to hydrological prediction. Hydrological Processes 17(11), 2101–2111.
Sloto, R.A., Crouse, M.Y., 1996. Hysep: A computer program forstreamflow hydrograph separation and analysis. TechnicalReport. Water-Resources Investigations report 96-4040, USGeological Survey.
Smedema, L.K., Rycroft, D.W., 1988. Land Drainage. B.T. BatsfordLtd., London.
Sneyers, R., Vandiepenbeeck, M., 1995. Notice sur le climat de laBelgique. Vol. Publication scientifique et technique no. 002.L’Institut Royal Meteorologique de Belgique, Brussels.
Sophocleous, M.A., 1991. Combining the soilwater balance andwater-level fluctuationmethods to estimate natural groundwaterrecharge – practical aspects. Journal of Hydrology 124 (3–4),229–241.
Sophocleous, M.A., 1992. Groundwater recharge estimation andregionalization: the Great Bend Prairie of central Kansas and itsrecharge statistics. Journal of Hydrology 137 (1–4), 113–140.
Sophocleous, M.A., 2005. Groundwater recharge and sustainabilityin the High Plains aquifer in Kansas, USA. Hydrogeology Journal13 (2), 351–365.
Stewart, J.B., 1988. Modelling surface conductance of pine forest.Agricultural and Forest Meteorology 43, 19–35.
Szilagyi, J., Harvey, F.E., Ayers, J.F., 2005. Regional estimation oftotal recharge to ground water in Nebraska. Ground Water 43(1), 63–69.
Tallaksen, L.M., 1995. A review of baseflow recession analysis.Journal of Hydrology 165, 349–370.
Thijs, G., 2002. Calibration and sensitivity analysis of groundwaterdischarge modelling of the Upper-Biebrza catchment, Poland (inDutch). MSc-thesis, Vrije Universiteit Brussel, Faculty ofEngineering.
Troch, P.A., De Troch, F.P., Brutsaert, W.H., 1993. Effective watertable depth to describe initial conditions prior to storm rainfallin humid regions. Water Resources Research 29 (2), 427–434.
USDA, 1951. Soil survey manual. Technical Report. Handbook no.18, US Department of Agriculture Soil Survey Staff.
USDA-NRCS, 1972. National Engineering Handbook. Vol. HydrologySection 4.
Vaes, G., Willems, P., Berlamont, J., 2002. 100 years of Belgianrainfall: are there trends? Water Science and Technology 45 (2),55–61.
Van de Voorde, T., Chormanski, J., Batelaan, O., Canters, F., 2006.Multi-resolution impervious surface mapping for improved runoffestimation at catchment level. In: Hostert, P., Damm, A.,Schiefer, S. (Eds.), First Workshop of the EARSeL Special InterestGroup on Urban Remote Sensing ‘‘Challenges and Solutions’’, 2–3 March 2006. EARSeL, Humboldt-Universitat zu Berlin, p. 9.
Van Ranst, E., Sys, C., 2000. Unambiguous legend for the digital soilmap of Flanders (scale 1:20,000) (in Dutch). Technical Report.Laboratory of soil science, University Ghent.
van Roestel, J., 1984. Transpiratie en interceptie van bos: eenliteratuur studie. Technical Report. 7b Bos en Water, Studie-commissie Waterbeheer Natuur Bos en Landschap.
Vanclooster, M., Viaene, P., Diels, J., Christiaens, K., 1994. Wave: amathematical model for simulating water and agrochemicals inthe soil and vadose environment. Reference and users’s manual.Technical Report. Institute for Land and Water Management,Catholic University of Leuven.
Vandewiele, G.L., Xu, C.-Y., Ni-Lar-Win, 1991. Methodology forConstructing Monthly Water Balance Models on Basin Scale, vol.VUB-Hydrologie 20. Vrije Universiteit Brussel, Brussels.
Whitman, D., Gubbels, T., Powell, L., 1999. Spatial interrelation-ships between lake elevations, water tables, and sinkholeoccurrence in central Florida: a GIS approach. PhotogrammetricEngineering & Remote Sensing 65 (10), 1169–1178.
Wittenberg, H., 1999. Baseflow recession and recharge asnonlinear storage processes. Hydrological Processes 13, 715–726.
Xu, C.-Y., 1992. Monthly water balance models in different climaticregions. Phd thesis, Laboratory of Hydrology, Vrije UniversiteitBrussel, Brussels.
Zhang, L., Dawes, W.R., Hatton, T.J., Reece, P.H., Beale, G.T.H.,Packer, I., 1999. Estimation of soil moisture and groundwaterrecharge using the topog_irm model. Water Resources Research35 (1), 149–161.
Zhang, L., Dawes, W.R., Walker, G.R., 2001. Response of meanannual evapotranspiration to vegetation changes at catchmentscale. Water Resources Research 37 (3), 701–708.
Zhang, L., Hickel, K., Dawes, W.R., Chiew, F.H.S., Western, A.W.,Briggs, P.R., 2004. A rational function approach for estimatingmean annual evapotranspiration. Water Resources Research 40,W02502. doi:10.1029/2003WR002710.
Zhu, C., 2000. Estimate of recharge from radiocarbon dating ofgroundwater and numerical flow and transport modeling. WaterResources Research 36 (9), 2607–2620.
GIS-based recharge estimation by coupling surface–subsurface water balances 355