Carbon Balances and Energy Impacts of the Management of ...
33
Delivering sustainable solutions in a more competitive world Carbon Balances and Energy Impacts of the Management of UK Wastes Defra R&D Project WRT 237 Annex B December 2006
-
Upload
khangminh22 -
Category
Documents
-
view
0 -
download
0
Transcript of Carbon Balances and Energy Impacts of the Management of ...
Delivering sustainable solutions in a more competitive world
Carbon Balances and Energy Impacts of the Management of UK Wastes Defra R&D Project WRT 237 Annex B December 2006

Annex B
Scenario Development and Modelling Assumptions

ENVIRONMENTAL RESOURCES MANAGEMENT DEFRA
B1
B1 SCENARIO DEVELOPMENT AND MODELLING ASSUMPTIONS
B1.1 CURRENT WASTE ARISINGS AND MANAGEMENT ROUTES – BASELINE SCENARIO
Best estimates of current waste arisings and management were compiled as a first stage of the research and are presented in Annex A. Final estimates of baseline arisings and management for the materials under assessment were developed from these sources and are shown in Table B1.1.
Table B1.1 Baseline Arisings and Management (Million Tonnes)
Waste Fraction Recycling & reuse9
Windrow Comp1 IVC2 AD10 MBT Combustion3 Landfill
Landspread/ recovery/
reclamation Disposal
at sea Total
Paper & card 4 6.4 0.04 0.9 6.4 13.7 Kitchen/food waste 0.2 0.6 0.05 0.07 1.6 9.2 0.1 11.8 Green waste (excl agric) 0.03 1.7 0.05 0.9 7.9 minimal 10.6 Agricultural crop waste 0.2 6.4 6.6 Other organic (excl agric) 0.2 0.0.2 0.6 0.3 2.8 4.0 Agricultural manure/slurry 0.05 0.2 82.8 83.0 Wood 5 1.2 0.01 0.3 6.0 7.5 Textiles 0.2 0.01 0.1 1.1 minimal 1.4 Plastic (dense) 0.1 0.01 0.2 2.4 2.8 Plastic (film) 0.3 0.01 0.2 2.6 3.1 Ferrous 6 2.4 0.01 0.2 1.5 minimal 4.1 Non-ferrous metal 6 1.5 0.002 0.03 0.5 minimal 2.0 Silt/soil (excl. min& quarry and marine dredgings) 7 1.0 13.6 36.2 50.7 Mining and quarrying and marine dredged silt/soil 7 48.4 11.6 60.0 Aggregate materials (excl. min& quarry and marine dredgings) 7 50.6 0.01 0.1 3.4 5.8 59.9 Mining and quarrying and marine dredged aggregate 7 0.5 48.0 11.6 60.0 Misc. combustibles 4.2 0.01 2.0 5.6 1.0 12.7 Total 68.9 1.7 0.6 0.1 0.2 7.4 60.5 231.4 23.1 393.9
1. This currently represents 85% of the reported 2Mt of UK composting (European Composting Network). Most statistics suggest that the majority of green waste is currently windrow composted. It is unknown how much green waste passes to in-vessel composters and so this is assumed to be zero currently. During scenario modelling,. it is assumed that green waste passing to in-vessel composting facilities increases linearly to 50%, to reflect the need for green waste input in addition to food waste at these facilities. 2. All food waste assumed to be composted via in-vessel composting (IVC) 3. Includes combustion with and without energy recovery. It is assumed that 67% of this total is combusted with energy recovery (all MSW combustion and 50% of commercial/industrial wastes to thermal treatment) 4. WRAP, personal communication. Based on CEPI statistics. 5. WRAP (2005). Review of Wood Waste Arisings and Management in the UK. M.E.L Research Ltd. 6. Dahlstrom et al (2004). Iron, Steel and Aluminium in the UK: Material Flows and their Economic Dimensions. Biffaward Programme on Sustainable Resource Use. 8. Aggregate and soil from C&D waste based on ODPM survey data and SEPA/NIEHS estimates. Assumed 50% of inland dredgings are sand and recycled as aggregate, with the remainder silt to landfill. Assumed all marine dredging returned to sea. Assumed 1% of mining and quarrying aggregate is recycled. 9. Estimates of ‘re-use’ derive predominantly from commercial and industrial waste statistics (Environment Agency Commercial and Industrial Waste Survey, 2002/03) and refer to wastes that are transported off-site for re-use. For the purposes of modelling, these were treated as recycled wastes. 10. Current estimates from Holsworthy Anaerobic Digestion plant.

ENVIRONMENTAL RESOURCES MANAGEMENT DEFRA
B2
B1.2 ALTERNATIVE SCENARIOS
Of interest for the development of alternative scenarios was the maximum performance theoretically achievable in the absence of current policy or infrastructural barriers. Recovery/recycling rates were considered ‘theoretically achievable’ only where a similar level of performance has been demonstrated elsewhere in Europe. For example, the ban on the landfill of combustible waste in Denmark has led to a significant increase in energy recovery and recycling, such that only 8% of total wastes were sent to landfill in 2004 (1). Denmark therefore serves as a maximum for the majority of recovery rates. The Netherlands, Sweden, Austria, Belgium and Luxembourg are also high performers, currently diverting more than 70% of wastes from landfill (2). Based on performance and experience across Europe, a set of maximum recycling and recovery limits were developed. These are shown in Table B1.2 and form the basis of the alternative scenarios for modelling.
Table B1.2 Recycling and Recovery Upper Limits
Material Fraction Recovery Upper Limit
Reference Recycling Upper Limit
Reference
Paper & card 90% >90% recovery of total waste (not inc agric) currently achieved across Denmark (Danish Waste Statistics, 2004) 1
85% 80-90% paper and cardboard recycling achieved in Austria, Belgium and Germany (CRN, 2002) 2
Organic/food waste (non-agric)
90% >90% recovery of total waste (not inc agric) currently achieved across Denmark (Danish Waste Statistics, 2004) 1
75% >75% source separation of organic MSW achieved in Austria and Germany (CRN, 2002) 2
Other organic waste (predominantly sewage sludge)
90% >90% recovery of total waste (not inc agric) currently achieved across Denmark (Danish Waste Statistics, 2004) 1
55% 55% recycling of sewage sludge currently achieved in Denmark (Danish Waste Statistics, 2004) 1
Garden/ plant waste (non-agric)
90% >90% garden waste composting achieved in Denmark (Danish Waste Statistics, 2004) 1
90% >90% garden waste composting achieved in Denmark (Danish Waste Statistics, 2004) 1
Organic (agric) 50% EC report estimates 50% maximum collection of agricultural wastes 3
50% EC report estimates 50% maximum collection of agricultural wastes 3
Biomass (agric) 50% EC report estimates 50% maximum collection of agricultural wastes 3
50% EC report estimates 50% maximum collection of agricultural wastes 3
(1) Statistics do not include agricultural wastes. Danish Waste Statistics, 2004 (2) http://news.bbc.co.uk/2/hi/europe/4620041.stm

ENVIRONMENTAL RESOURCES MANAGEMENT DEFRA
B3
Material Fraction Recovery Upper Limit
Reference Recycling Upper Limit
Reference
Wood 90% >90% recovery of total waste (not inc agric) currently achieved across Denmark (Danish Waste Statistics, 2004) 1
50% >50% recycling of wood packaging in UK and Italy (EEA, 2005) 4
Textiles 90% >90% recovery of total waste (not inc agric) currently achieved across Denmark (Danish Waste Statistics, 2004) 1
50% 50% household textiles currently recycled in Switzerland 5
Plastic (dense) 90% >90% recovery of total waste (not inc agric) currently achieved across Denmark (Danish Waste Statistics, 2004) 1
60% >60% recycling of plastics packaging achieved in Germany (CRN, 2002) 2
Plastic (film) 90% >90% recovery of total waste (not inc agric) currently achieved across Denmark (Danish Waste Statistics, 2004) 1
60% >60% recycling of plastics packaging achieved in Germany (CRN, 2002) 2
Non-ferrous metal 95% EAA – 95% recycling achieved in building and automotive sectors across Europe
95% EAA – 95% recycling achieved in building and automotive sectors across Europe
Ferrous metal 95% Assumed equivalent to non-ferrous metals
95% Assumed equivalent to non-ferrous metals
Aggregate materials 95% 94% recycling of building and construction waste achieved in Denmark (comprises approx 50% aggregate, 50% soil) (Danish Waste Statistics, 2004) 1 Netherlands - reuse and recycling rate of approx 95% achieved for C&D waste due to ban on the landfill of recoverable C&D waste (EC, 2005) 6
95% 94% recycling of building and construction waste achieved in Denmark (comprises approx 50% aggregate, 50% soil) (Danish Waste Statistics, 2004) 1 Netherlands - reuse and recycling rate of approx 95% achieved for C&D waste due to ban on the landfill of recoverable C&D waste (EC, 2005) 6
Silt/soil 95% 94% recycling of building and construction waste achieved in Denmark (comprises approx 50% aggregate, 50% soil) (Danish Waste Statistics, 2004) 1
95% 94% recycling of building and construction waste achieved in Denmark (comprises approx 50% aggregate, 50% soil) (Danish Waste Statistics, 2004) 1
Misc combustibles (predominantly from industrial sources)
90% >90% recovery of industrial waste currently achieved in the Netherlands (EC, 2005) 6
80% Approx 80% recycling of industrial waste currently achieved in the Netherlands (EC, 2005) 6
Reference Sources: 1. Danish Ministry of the Environment, Environmental Protection Agency (2006). Waste Statistics 2004.
Environmental Review No.1 2. CRN (2002). Maximising Recycling Rates: Tackling Residuals. Resource Publishing Ltd. 3. http://europa.eu.int/comm/energy_transport/atlas/htmlu/adpost1.html 4. http://reports.eea.eu.int/eea_report_2005_3/en 5. http://www.umwelt-schweiz.ch/buwal/eng/fachgebiete/fg_abfall/anlagen/recycling/textilien/ 6. European Communities (2005). Waste Generated and Treated in Europe – Data 1995-2003. 2005 Edition. ISBN
92-894-9996-6

ENVIRONMENTAL RESOURCES MANAGEMENT DEFRA
B4
Based on the current levels of arisings and management shown in Table B1.1 and the upper limit values in Table B1.2, four core modelling scenarios were developed:
1. baseline scenario – reflecting best current estimates of waste material arisings and management;
2. high resource recovery scenario – upper limit recycling rates are achieved via materials recycling & composting;
3. high energy recovery – upper limit recovery rates are achieved via thermal processing technologies (with energy recovery) or anaerobic digestion, where applicable; and
4. combined recovery – upper limit recovery rates are achieved through recycling & composting (to maximum recycling rate) and additional thermal processing/anaerobic digestion, where applicable.
A breakdown of the four scenarios by material and management route is shown in Table B1.3. It was assumed that recovery and recycling will increase in a linearly fashion over the study period, to meet these upper limits in 2031. Similarly, current treatment capacities were phased out in a linearly fashion over this period, wherever applicable. For some materials, such as aggregates, soil and metals, it is not appropriate to use energy recovery methods and so the high energy scenario does not apply. Furthermore, for some materials, such as garden waste, upper recovery and recycling limits are the same. For these materials, the high resource recovery and combined scenarios will be the same and so the latter was not assessed. At Defra’s request, a further scenario reflecting the effect of current policies on recycling, composting and energy recovery rates was modelled. This scenario is termed the baseline policy scenario. With no reliable data or evidence on which to base future growth scenarios, it was decided that waste arisings should remain static over the assessment period (2005 – 2031) for the four core scenarios and the Defra policy scenario. An additional scenario was developed to investigate the implication of this assumption. Defra estimates for growth in MSW arisings and differential growth in wastes from alterative commercial and industrial waste sectors were obtained. These were applied to the baseline policy scenario recycling/composting/recovery rates. This scenario is termed the policy growth scenario.

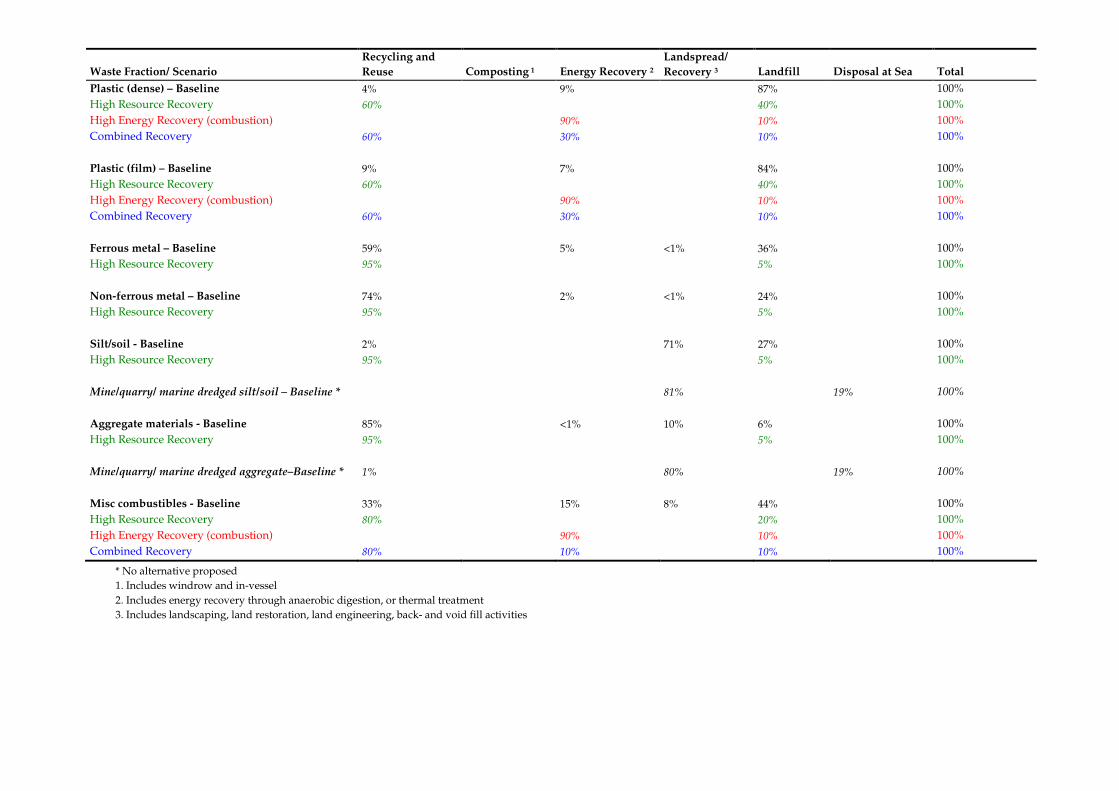
Table B1.3 Alternative Scenario Management Routes (% by Material)
Waste Fraction/ Scenario Recycling and Reuse Composting 1 Energy Recovery 2
Landspread/ Recovery 3 Landfill Disposal at Sea Total
Paper & card - Baseline 47% 7% 47% 100% High Resource Recovery 85% 15% 100% High Energy Recovery (combustion) 90% 10% 100% Combined Recovery 85% 5% 10% 100% Kitchen/food waste - Baseline 2% 5% 14% 1% 78% 100% High Resource Recovery 2% 73% 25% 100% High Energy Recovery (anaerobic digestion) 2% 88% 10% 100% Combined Recovery 2% 73% 15% 10% 100% Green/plant waste (non-agriculture) - Baseline <1% 16% 9% <1% 74% 100% High Resource Recovery 0.3% 90% 10% 100% High Energy Recovery (anaerobic digestion) 0.3% 90% 10% 100% Agricultural crop waste - Baseline 3% 97% 100% High Resource Recovery 50% 50% 100% High Energy Recovery (combustion) 50% 50% 100% Other organic - Baseline 6% 0.4% 14% 71% 8% 100% High Resource Recovery 6% 49% 37% 8% 100% High Energy Recovery (combustion) 6% 84% 2% 8% 100% Combined Recovery 6% 49% 35% 2% 8% 100% Agricultural manure/slurry - Baseline 0.3% 99.7% 100% High Resource Recovery 50% 50% 100% High Energy Recovery (anaerobic digestion) 50% 50% 100% Wood - Baseline 16% 4% 80% 100% High Resource Recovery 50% 50% 100% High Energy Recovery (combustion) 90% 10% 100% Combined Recovery 50% 40% 10% 100% Textiles - Baseline 13% 11% <1% 76% 100%
High Resource Recovery 50% 50% 100% High Energy Recovery (combustion) 90% 10% 100%
Combined Recovery 50% 40% 10% 100%
Waste Fraction/ Scenario Recycling and Reuse Composting 1 Energy Recovery 2
Landspread/ Recovery 3 Landfill Disposal at Sea Total
Plastic (dense) – Baseline 4% 9% 87% 100% High Resource Recovery 60% 40% 100% High Energy Recovery (combustion) 90% 10% 100% Combined Recovery 60% 30% 10% 100% Plastic (film) – Baseline 9% 7% 84% 100% High Resource Recovery 60% 40% 100% High Energy Recovery (combustion) 90% 10% 100% Combined Recovery 60% 30% 10% 100% Ferrous metal – Baseline 59% 5% <1% 36% 100% High Resource Recovery 95% 5% 100% Non-ferrous metal – Baseline 74% 2% <1% 24% 100% High Resource Recovery 95% 5% 100% Silt/soil - Baseline 2% 71% 27% 100% High Resource Recovery 95% 5% 100% Mine/quarry/ marine dredged silt/soil – Baseline * 81% 19% 100% Aggregate materials - Baseline 85% <1% 10% 6% 100% High Resource Recovery 95% 5% 100% Mine/quarry/ marine dredged aggregate–Baseline * 1% 80% 19% 100% Misc combustibles - Baseline 33% 15% 8% 44% 100% High Resource Recovery 80% 20% 100% High Energy Recovery (combustion) 90% 10% 100% Combined Recovery 80% 10% 10% 100%
* No alternative proposed 1. Includes windrow and in-vessel 2. Includes energy recovery through anaerobic digestion, or thermal treatment 3. Includes landscaping, land restoration, land engineering, back- and void fill activities

ENVIRONMENTAL RESOURCES MANAGEMENT DEFRA
B7
B1.3 KEY MODELLING ASSUMPTIONS
A number of assumptions were required in order to model waste throughputs and to determine carbon, greenhouse gas and energy balances. Key assumptions are presented in the following sections.
B1.4 MASS BALANCES
To enable the modelling of carbon and energy flows through the waste management system, it was necessary to draw up mass balances describing the fate of each material passing through each treatment route. Assumed balances for alternative treatment routes are shown in Table B1.4 to Table B1.6. Recycling and Composting
When developing mass balance assumptions for recycling and composting processes, consideration was given to how increased collection rates may influence the rate of reject materials, for example through increased co-mingled materials collections. To this end, residues rate were assumed to increase linearly over the assessment period (where recycling or composting rates also increased), from a relatively low rate of 5%, to a more significant 10%. There has been very little research carried out to investigate how increasing recycling/composting rate might bring about a change such as this. What little that has been done suggests that a switch to bulk collection systems does bring about an increase in rejects (1). Results were examined for their sensitivity to these assumptions. A standard 10% processing residue rate has been assumed for materials recycling. This was developed following assessment of a number of datasets for material processing in the Ecoinvent Life Cycle Inventory Database (2), and is considered to be a reasonable estimate across the range of materials. Processing residues for composting processes were sourced from primary plant data, collected as part of the development of WRATE. Data for the Sita Lounts open windrow composting plant were used to represent windrow composting of green waste. Plant data document an input of 19,743 tonnes of feedstock waste, with an output of 5809 tonnes of compost. We have taken this to represent a product output of approximately 30% (and assumed that this would decrease to 25% with increasing collection rates and potential contamination). An output of 5490 tonnes of residue to landfill or landfill cover is also documented, and we have taken this to represent a residue rate of approximately 20% residue rate.
(1) For example, Garuda Resource Group (1995) http://www.p2pays.org/ref/06/05946.pdf (2) http://ecoinvent.ch/

ENVIRONMENTAL RESOURCES MANAGEMENT DEFRA
B8
Data for the Vital Earth batch mobile composting process for source segregated kitchen and green waste were used to represent in-vessel composting. Data for this plant document a 50% output of compost per tonne of waste input, with negligible process waste. 5% primary sorting residues were (initially) assumed, and the remaining 45% mass lost in process.
Table B1.4 Recycling/Composting Mass Balance
Waste Fraction
Primary sorting residues (2005) *
Primary sorting residues (2031) *
Processing residues
Lost in Process (degraded)
Total product (2005) *
Total product (2031) *
Paper & Card 5% 10% 10% 85.5% 81% Wood 5% 10% 10% 85.5% 81% Textiles 5% 10% 10% 85.5% 81% Plastic (dense) 5% 10% 10% 85.5% 81% Plastic (film) 5% 10% 10% 85.5% 81% Ferrous metal 5% 10% 10% 85.5% 81% Non-ferrous metal 5% 10% 10% 85.5% 81% Silt/soil 5% 10% 10% 85.5% 81% Aggregate materials 5% 10% 10% 85.5% 81% Misc combustibles 5% 10% 10% 85.5% 81% Organic wastes to windrow composting 5% 10% 20% 45% 30% 25% Organic wastes to in-vessel composting 5% 10% 45% 50% 45%
Source: ERM and Environment Agency development of WRATE and ERM assumptions
Thermal Treatment
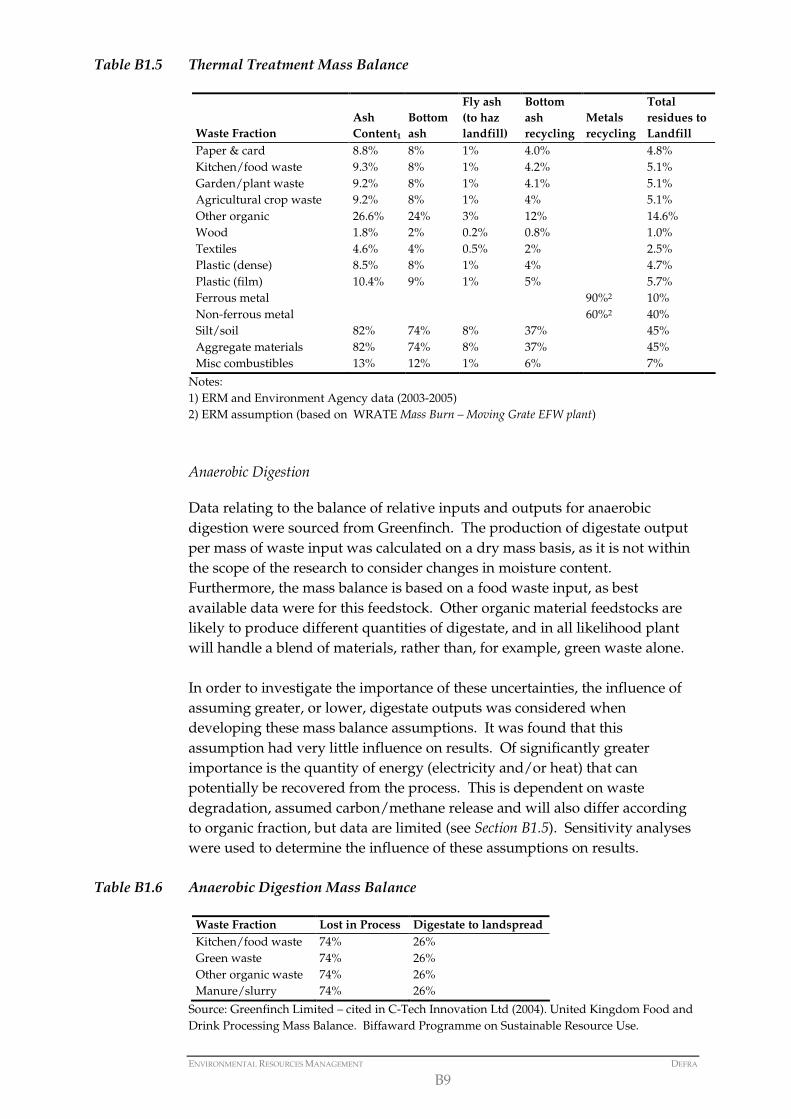
Available technologies and processes for thermally treating waste materials are many and varied and will result in different products according to technology and waste fraction. In order to represent a generic thermal treatment process, we took the approach that ash residues from treatment would be related directly to the ash content of the waste fraction. It was also further assumed that 90% of ash residues constitute bottom ash, of which 50% is recycled. The proportions of these may differ from technology to technology, but within the context of the relative greenhouse gas and energy impacts/benefits of energy consumption and recovery associated with thermal treatment, these assumptions are likely to be of minor significance.
ENVIRONMENTAL RESOURCES MANAGEMENT DEFRA
B9
Table B1.5 Thermal Treatment Mass Balance
Waste Fraction Ash Content1
Bottom ash
Fly ash (to haz landfill)
Bottom ash recycling
Metals recycling
Total residues to Landfill
Paper & card 8.8% 8% 1% 4.0% 4.8% Kitchen/food waste 9.3% 8% 1% 4.2% 5.1% Garden/plant waste 9.2% 8% 1% 4.1% 5.1% Agricultural crop waste 9.2% 8% 1% 4% 5.1% Other organic 26.6% 24% 3% 12% 14.6% Wood 1.8% 2% 0.2% 0.8% 1.0% Textiles 4.6% 4% 0.5% 2% 2.5% Plastic (dense) 8.5% 8% 1% 4% 4.7% Plastic (film) 10.4% 9% 1% 5% 5.7% Ferrous metal 90%2 10% Non-ferrous metal 60%2 40% Silt/soil 82% 74% 8% 37% 45% Aggregate materials 82% 74% 8% 37% 45% Misc combustibles 13% 12% 1% 6% 7%
Notes: 1) ERM and Environment Agency data (2003-2005) 2) ERM assumption (based on WRATE Mass Burn – Moving Grate EFW plant)
Anaerobic Digestion
Data relating to the balance of relative inputs and outputs for anaerobic digestion were sourced from Greenfinch. The production of digestate output per mass of waste input was calculated on a dry mass basis, as it is not within the scope of the research to consider changes in moisture content. Furthermore, the mass balance is based on a food waste input, as best available data were for this feedstock. Other organic material feedstocks are likely to produce different quantities of digestate, and in all likelihood plant will handle a blend of materials, rather than, for example, green waste alone. In order to investigate the importance of these uncertainties, the influence of assuming greater, or lower, digestate outputs was considered when developing these mass balance assumptions. It was found that this assumption had very little influence on results. Of significantly greater importance is the quantity of energy (electricity and/or heat) that can potentially be recovered from the process. This is dependent on waste degradation, assumed carbon/methane release and will also differ according to organic fraction, but data are limited (see Section B1.5). Sensitivity analyses were used to determine the influence of these assumptions on results.
Table B1.6 Anaerobic Digestion Mass Balance
Waste Fraction Lost in Process Digestate to landspread Kitchen/food waste 74% 26% Green waste 74% 26% Other organic waste 74% 26% Manure/slurry 74% 26%
Source: Greenfinch Limited – cited in C-Tech Innovation Ltd (2004). United Kingdom Food and Drink Processing Mass Balance. Biffaward Programme on Sustainable Resource Use.

ENVIRONMENTAL RESOURCES MANAGEMENT DEFRA
B10
B1.5 CARBON BALANCES
To enable the modelling of carbon flows through alternative systems, and to develop carbon balances, it was necessary to make a number of assumptions regarding their concentration in input materials and subsequent fate. Fate assumptions are detailed below and assumed waste fraction properties are presented in Table B1.7. • Recycling – the carbon content of the input waste fraction was assumed
either to be maintained in recovered products (carbon in products), or passed to landfill in residues.
• Windrow Composting – due to a lack of data with regard to carbon loss associated with composting processes, we have assumed a 50% percent carbon loss from input waste materials. This has been based on data collected as part of the development of the Environment Agency WRATE tool. All other carbon either passes to landfill in primary rejects or process resides, or remains in compost.
• In-vessel Composting – due to a lack of data with regard to carbon loss associated with composting processes, we have assumed a 50% percent carbon loss from input waste materials. This has been based on data collected as part of the development of the Environment Agency WRATE tool. All other carbon either passes to landfill in primary rejects or process resides, or remains in compost.
• Anaerobic Digestion – carbon losses in processing are equivalent to those assumed for composting. Carbon was assumed to be released as biogenic CO2 on combustion of biogas.
• Thermal Treatment – with the exception of carbon remaining in ash residues (assumed 7% carbon content), all carbon was assumed to be released as CO2 on combustion.
• Landspread – 98% of carbon in landspread wastes was assumed to be mineralised to biogenic CO2 over a 100 year period (1). This has been modelled as an instantaneous release in the year of application.
(1) Smith et al (2001). Waste Management Option and Climate Change, Final Report to DGENV. AEA Technology.
ENVIRONMENTAL RESOURCES MANAGEMENT DEFRA
B11
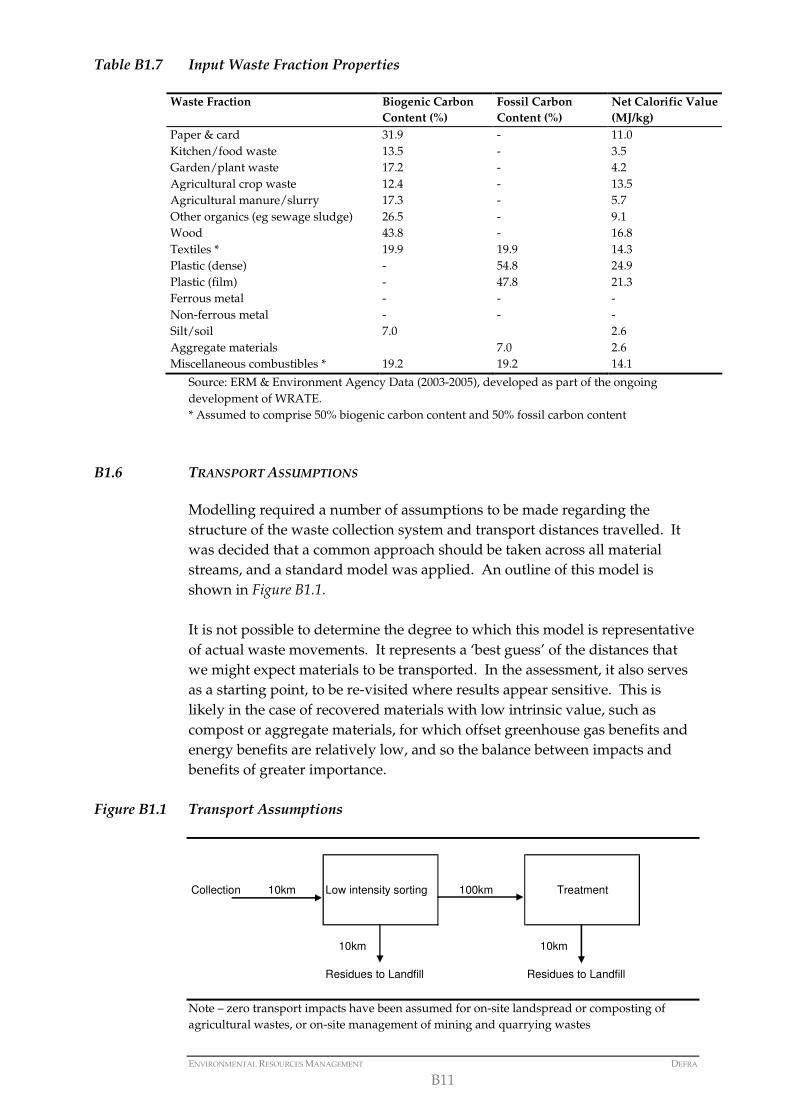
Table B1.7 Input Waste Fraction Properties
Waste Fraction Biogenic Carbon Content (%)
Fossil Carbon Content (%)
Net Calorific Value (MJ/kg)
Paper & card 31.9 - 11.0 Kitchen/food waste 13.5 - 3.5 Garden/plant waste 17.2 - 4.2 Agricultural crop waste 12.4 - 13.5 Agricultural manure/slurry 17.3 - 5.7 Other organics (eg sewage sludge) 26.5 - 9.1 Wood 43.8 - 16.8 Textiles * 19.9 19.9 14.3 Plastic (dense) - 54.8 24.9 Plastic (film) - 47.8 21.3 Ferrous metal - - - Non-ferrous metal - - - Silt/soil 7.0 2.6 Aggregate materials 7.0 2.6 Miscellaneous combustibles * 19.2 19.2 14.1
Source: ERM & Environment Agency Data (2003-2005), developed as part of the ongoing development of WRATE. * Assumed to comprise 50% biogenic carbon content and 50% fossil carbon content
B1.6 TRANSPORT ASSUMPTIONS
Modelling required a number of assumptions to be made regarding the structure of the waste collection system and transport distances travelled. It was decided that a common approach should be taken across all material streams, and a standard model was applied. An outline of this model is shown in Figure B1.1. It is not possible to determine the degree to which this model is representative of actual waste movements. It represents a ‘best guess’ of the distances that we might expect materials to be transported. In the assessment, it also serves as a starting point, to be re-visited where results appear sensitive. This is likely in the case of recovered materials with low intrinsic value, such as compost or aggregate materials, for which offset greenhouse gas benefits and energy benefits are relatively low, and so the balance between impacts and benefits of greater importance.
Figure B1.1 Transport Assumptions
Note – zero transport impacts have been assumed for on-site landspread or composting of agricultural wastes, or on-site management of mining and quarrying wastes
Collection 10km Low intensity sorting 100km
10km 10km
Residues to Landfill Residues to Landfill
Treatment

ENVIRONMENTAL RESOURCES MANAGEMENT DEFRA
B12
It has been assumed in the transport of waste that all waste fractions cause equivalent emissions per km travelled (through vehicle use), such that the only variable is the mass of the waste transported.
B1.7 GREENHOUSE GAS EMISSION AND ENERGY FACTORS
Greenhouse gas and energy factors have been used to quantify the potential climate change impacts of alternative scenarios and management of materials. Greenhouse gas emission factors have been developed using IPCC characterisation factors for the direct global warming potential of specified air emissions (100 year timeframe) (1). Both biogenic CO2 uptake and subsequent release (on combustion or degradation) were considered to have a carbon-neutral impact and therefore incurred neither burden nor benefit. Cumulative fossil energy demand factors have been used as a proxy for energy impacts. These were developed based on the Ecoinvent method for cumulative energy demand. Overall greenhouse gas and energy demand impacts were calculated using a series of steps: 1. Ancillary impact factors (greenhouse gas emissions/energy demand per
tonne of diesel produced and combusted, per kWh of electricity generated, per tonne-kilometre of waste transported) were sourced from published life cycle inventory databases. These impact factors are presented in Section B1.7.1.
2. The ancillary inputs (tonnes of diesel, kWh of electricity, tonne-kilometres of residues transported, etc) and direct emissions associated with the management of one tonne of waste were determined for each treatment process, using data developed as part on the ongoing update of the Environment Agency life cycle tool, WRATE. These inputs and emissions are presented in Section B1.7.2 and B1.7.3.
3. Avoided burdens (tonnes of material separated for recycling, kWh electricity recovered, etc) were calculated using both the mass balance assumptions presented in Section B1.4 and further calculations, described in Section B1.7.4.
4. Ancillary impacts, direct process emissions and avoided burdens were combined and multiplied by process throughputs to give a total greenhouse gas/energy demand.
Impact factors form a key part of the analyses carried out. The main sources of data for used for developing impact factors were the Environment Agency work on the WRATE life cycle tool and life cycle inventories for material production and energy generation systems produced by Ecoinvent (2).
(1) Climate Change 2001. IPCC Third Assessment Report. The Scientific Basis. (2) http://ecoinvent.ch/

ENVIRONMENTAL RESOURCES MANAGEMENT DEFRA
B13
Ecoinvent is a state-of-the art, peer-reviewed database, containing life cycle inventory data for over 2500 processes in the energy, transport, building materials, chemicals, paper/board, agriculture and waste management sectors. Data relate predominantly to Western European process technologies and, as such, will confer differences from equivalent UK systems. Assuming that technologies will not differ, the most significant difference in terms of potential greenhouse gas/energy impacts is with respect to energy mix. We have addressed this by manipulating all datasets used to represent UK electricity mix (average over 25 year period). It was considered that another key difference may lie in transport networks. This was investigated for a number of key datasets and it was found that altering assumed transport distances did not have a significant influence on resulting impact factors. Thus it is not considered that this will have a significant affect on resulting estimates. The following sources were also drawn upon for guidance and data in support of the work: • ERM (2006). Impact of Energy from Waste and Recycling Policy on UK
Greenhouse Gas Emisisons. Report for Defra; • WRAP (2006). Environmental Benefits of Recycling. An International Review
of Life Cycle Comparisons for Key Materials in the UK Recycling Sector. WRAP, Banbury;
• Biomass Task Force Report to Government, October 2005; • C-Tech Innovation Ltd (2003). Thermal Methods of Municipal Waste
Treatment. Biffaward Programme on Sustainable Resource Use; • McDougal et al (2001). Integrated Solid Waste Management: A Life Cycle
Inventory. Blackwell Science; • Hischier (2004). Life Cycle Inventories of Packaging and Graphical Papers.
Ecoinvent Report No. 11; • Enviros (2006). Resource Efficiency and Greenhouse Gas Emissions. Report for
Yorkshire Forward; and • other relevant work on greenhouse gas emissions including the energy
projections developed by the Department of Trade and Industry (DTI) and the UK Greenhouse Gas Inventory (produced annually under contract to Defra by AEAT to meet legal reporting requirements to the EU and the United Nations Framework Convention on Climate Change).
B1.7.1 Ancillary Impact Factors – Energy Production and Use, Transport
Impact factors for the production of diesel and electricity and for the transport of wastes have been taken from published sources. Those for electricity production and distribution change over time, taking into account predicted changes in UK grid electricity mix (1), and are based upon the DTI’s latest energy projection data (2005). Projections are made for electricity mixes from
(1) Taken from the updates to the Environment Agency’s WISARD tool (ERM, (2005). WRATE Electricity Database Manual. Environmental Resources Management. Unpublished.)
ENVIRONMENTAL RESOURCES MANAGEMENT DEFRA
B14
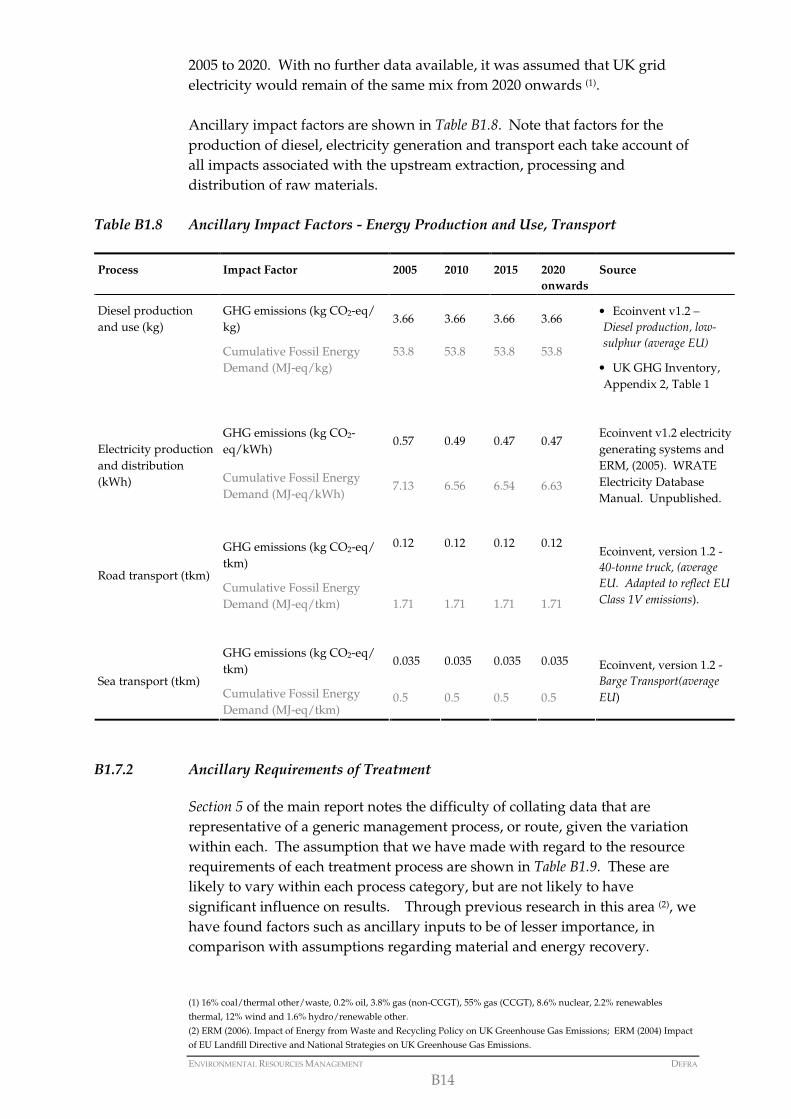
2005 to 2020. With no further data available, it was assumed that UK grid electricity would remain of the same mix from 2020 onwards (1). Ancillary impact factors are shown in Table B1.8. Note that factors for the production of diesel, electricity generation and transport each take account of all impacts associated with the upstream extraction, processing and distribution of raw materials.
Table B1.8 Ancillary Impact Factors - Energy Production and Use, Transport
Process Impact Factor 2005 2010 2015 2020 onwards
Source
GHG emissions (kg CO2-eq/ kg)
3.66 3.66 3.66 3.66 Diesel production and use (kg)
Cumulative Fossil Energy Demand (MJ-eq/kg)
53.8 53.8 53.8 53.8
• Ecoinvent v1.2 – Diesel production, low-sulphur (average EU)
• UK GHG Inventory, Appendix 2, Table 1
GHG emissions (kg CO2-eq/kWh)
0.57 0.49 0.47 0.47 Electricity production and distribution (kWh) Cumulative Fossil Energy
Demand (MJ-eq/kWh) 7.13 6.56 6.54 6.63
Ecoinvent v1.2 electricity generating systems and ERM, (2005). WRATE Electricity Database Manual. Unpublished.
GHG emissions (kg CO2-eq/ tkm)
0.12 0.12 0.12 0.12
Road transport (tkm) Cumulative Fossil Energy Demand (MJ-eq/tkm)
1.71 1.71 1.71 1.71
Ecoinvent, version 1.2 - 40-tonne truck, (average EU. Adapted to reflect EU Class 1V emissions).
GHG emissions (kg CO2-eq/ tkm)
0.035 0.035 0.035 0.035
Sea transport (tkm) Cumulative Fossil Energy Demand (MJ-eq/tkm)
0.5 0.5 0.5 0.5
Ecoinvent, version 1.2 - Barge Transport(average EU)
B1.7.2 Ancillary Requirements of Treatment
Section 5 of the main report notes the difficulty of collating data that are representative of a generic management process, or route, given the variation within each. The assumption that we have made with regard to the resource requirements of each treatment process are shown in Table B1.9. These are likely to vary within each process category, but are not likely to have significant influence on results. Through previous research in this area (2), we have found factors such as ancillary inputs to be of lesser importance, in comparison with assumptions regarding material and energy recovery. (1) 16% coal/thermal other/waste, 0.2% oil, 3.8% gas (non-CCGT), 55% gas (CCGT), 8.6% nuclear, 2.2% renewables thermal, 12% wind and 1.6% hydro/renewable other. (2) ERM (2006). Impact of Energy from Waste and Recycling Policy on UK Greenhouse Gas Emissions; ERM (2004) Impact of EU Landfill Directive and National Strategies on UK Greenhouse Gas Emissions.
ENVIRONMENTAL RESOURCES MANAGEMENT DEFRA
B15
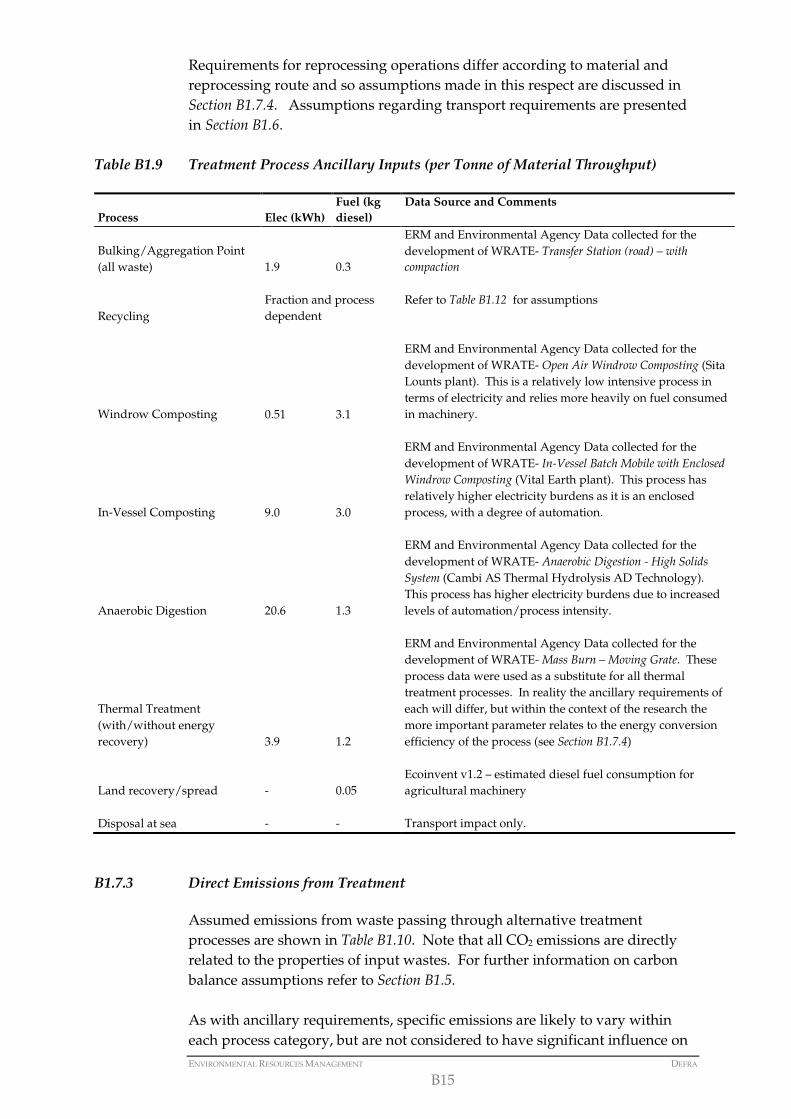
Requirements for reprocessing operations differ according to material and reprocessing route and so assumptions made in this respect are discussed in Section B1.7.4. Assumptions regarding transport requirements are presented in Section B1.6.
Table B1.9 Treatment Process Ancillary Inputs (per Tonne of Material Throughput)
Process Elec (kWh) Fuel (kg diesel)
Data Source and Comments
Bulking/Aggregation Point (all waste) 1.9 0.3
ERM and Environmental Agency Data collected for the development of WRATE- Transfer Station (road) – with compaction
Recycling
Fraction and process dependent
Refer to Table B1.12 for assumptions
Windrow Composting 0.51 3.1
ERM and Environmental Agency Data collected for the development of WRATE- Open Air Windrow Composting (Sita Lounts plant). This is a relatively low intensive process in terms of electricity and relies more heavily on fuel consumed in machinery.
In-Vessel Composting 9.0 3.0
ERM and Environmental Agency Data collected for the development of WRATE- In-Vessel Batch Mobile with Enclosed Windrow Composting (Vital Earth plant). This process has relatively higher electricity burdens as it is an enclosed process, with a degree of automation.
Anaerobic Digestion 20.6 1.3
ERM and Environmental Agency Data collected for the development of WRATE- Anaerobic Digestion - High Solids System (Cambi AS Thermal Hydrolysis AD Technology). This process has higher electricity burdens due to increased levels of automation/process intensity.
Thermal Treatment (with/without energy recovery) 3.9 1.2
ERM and Environmental Agency Data collected for the development of WRATE- Mass Burn – Moving Grate. These process data were used as a substitute for all thermal treatment processes. In reality the ancillary requirements of each will differ, but within the context of the research the more important parameter relates to the energy conversion efficiency of the process (see Section B1.7.4)
Land recovery/spread - 0.05
Ecoinvent v1.2 – estimated diesel fuel consumption for agricultural machinery
Disposal at sea - - Transport impact only.
B1.7.3 Direct Emissions from Treatment
Assumed emissions from waste passing through alternative treatment processes are shown in Table B1.10. Note that all CO2 emissions are directly related to the properties of input wastes. For further information on carbon balance assumptions refer to Section B1.5. As with ancillary requirements, specific emissions are likely to vary within each process category, but are not considered to have significant influence on

ENVIRONMENTAL RESOURCES MANAGEMENT DEFRA
B16
results. Through previous research in this area (1), we have found factors such as this to be of lesser importance, in comparison with assumptions regarding material and energy recovery.
(1) ERM (2006). Impact of Energy from Waste and Recycling Policy on UK Greenhouse Gas Emissions; ERM (2004) Impact of EU Landfill Directive and National Strategies on UK Greenhouse Gas Emissions.

ENVIRONMENTAL RESOURCES MANAGEMENT DEFRA
B17
Table B1.10 Treatment Process Outputs (per Tonne of Material Throughput)
Process CH4 (kg)
N2O (kg)
Biogenic CO2 (kg)
Fossil CO2 (kg)
Data Source and Comments
Bulking/Aggregation Point (all waste) - - - -
Windrow Composting 0.030 0.017
Proportional to the biogenic C content of input waste (assumed 50% loss of carbon on degradation) -
ERM and Environmental Agency Data collected for the development of WRATE- Open Air Windrow Composting (Sita Lounts plant). Process emissions of methane and N2O are relatively higher than in-vessel composting as the process is less automated and resultantly less well aerated.
In-Vessel Composting 0.018 0.0099
Proportional to the biogenic carbon content of input waste (assumed 50% loss of carbon on degradation) -
ERM and Environmental Agency Data collected for the development of WRATE- In-Vessel Batch Mobile with Enclosed Windrow Composting (Vital Earth plant). Process emissions are low as the process is aerated, thereby reducing the potential for anaerobic biological activity and associated by-products, such as methane.
Anaerobic Digestion 0.021 0.012
Proportional to the biogenic carbon content of input waste (assumed 50% loss of carbon on degradation)
ERM and Environmental Agency Data collected for the development of WRATE- Anaerobic Digestion - High Solids System (Cambi AS Thermal Hydrolysis AD Technology). Process emissions are intermediate. The process is entirely anaerobic and the majority of gases are captured and utilised as biogas. However there is some escape of greenhouse gases.
Thermal Treatment (with/without energy recovery) - 0.0057
Proportional to the biogenic carbon content of input waste (all carbon is released with the exception of that contained in ash residues)
Proportional to the fossil carbon content of input waste (all carbon is released with the exception of that contained in ash residues)
ERM and Environmental Agency Data collected for the development of WRATE- Mass Burn – Moving Grate . These emissions were used as a substitute for all thermal treatment processes. In reality they will differ for alternative technologies, but within the context of the research the more important parameter relates to the energy conversion efficiency of the process (see Section B1.7.4)
Land recovery/spread * *
Proportional to the biogenic carbon content of input waste (assumed 98% loss of carbon over 100 year period) - Assumed negligible (ERM assumption)
Disposal at sea - - - -
ENVIRONMENTAL RESOURCES MANAGEMENT DEFRA
B18
B1.7.4 Avoided Burdens
Energy
The combustion of waste in thermal treatment processes, such as EfW and gasification, is widely used to recover energy from wastes with an appropriate calorific value. Energy is recovered as heat, and either used directly, or for generating electricity. Anaerobic digestion can also be used as an energy recovery process for biowastes with high moisture content and low calorific value, such as food, green waste and animal manures and slurries. A methane-containing ‘biogas’ is generated during the process, which can be combusted on site to recover heat. Again, this can be used either directly, or for generating electricity. For energy recovery processes, the key influencing factors with regard to quantifying greenhouse gas and energy impacts and benefits relate to the efficiency at which the calorific/carbon content of waste can be converted into usable electrical energy or heat. Given the wide variation in efficiency that can be realised from energy recovery processes, a potential maximum and minimum was modelled. The quantity of energy recovered from wastes sent to thermal treatment was calculated on the basis of their inherent calorific value and assumed process efficiency. Maximum and minimum conversion efficiencies are based on findings in literature of approximately 20-27%(1) for conventional incineration with steam cycle electricity generation, 40-45%(2) for gasification with combined cycle gas turbine and up to 50-70% for combined heat and electricity recovery (CHP) (3): • Maximum: combined power - 40% (electricity), 30% (heat). Total = 70% • Minimum: electricity only – 20% The quantity of energy recovered from wastes sent to anaerobic digestion was calculated on the basis of their biodegradable carbon content, assumed conversion of carbon into methane (50% of carbon in waste converted to biogas (ERM assumption), of which approximately 66% assumed to be methane (4)) and the assumed efficiency of converting methane to heat/electricity. Maximum and minimum conversion efficiencies are based on those quoted in the Biomass Task Force to Government (2005): • Maximum: combined power - 40% (electricity), 45% (heat). Total = 85% • Minimum: electricity only – 30%
(1) C-Tech Innovation Ltd (2003). Thermal Methods of Municipal Waste Treatment. Biffaward (2) C-Tech Innovation Ltd (2003). Thermal Methods of Municipal Waste Treatment. Biffaward (3) http://www.environment-agency.gov.uk/wtd/981058/981100/?version=1&lang=_e (4) C-Tech Innovation Ltd (2004). United Kingdom Food and Drink Processing Mass Balance. Biffaward Programme on Sustainable Resource Use.
ENVIRONMENTAL RESOURCES MANAGEMENT DEFRA
B19
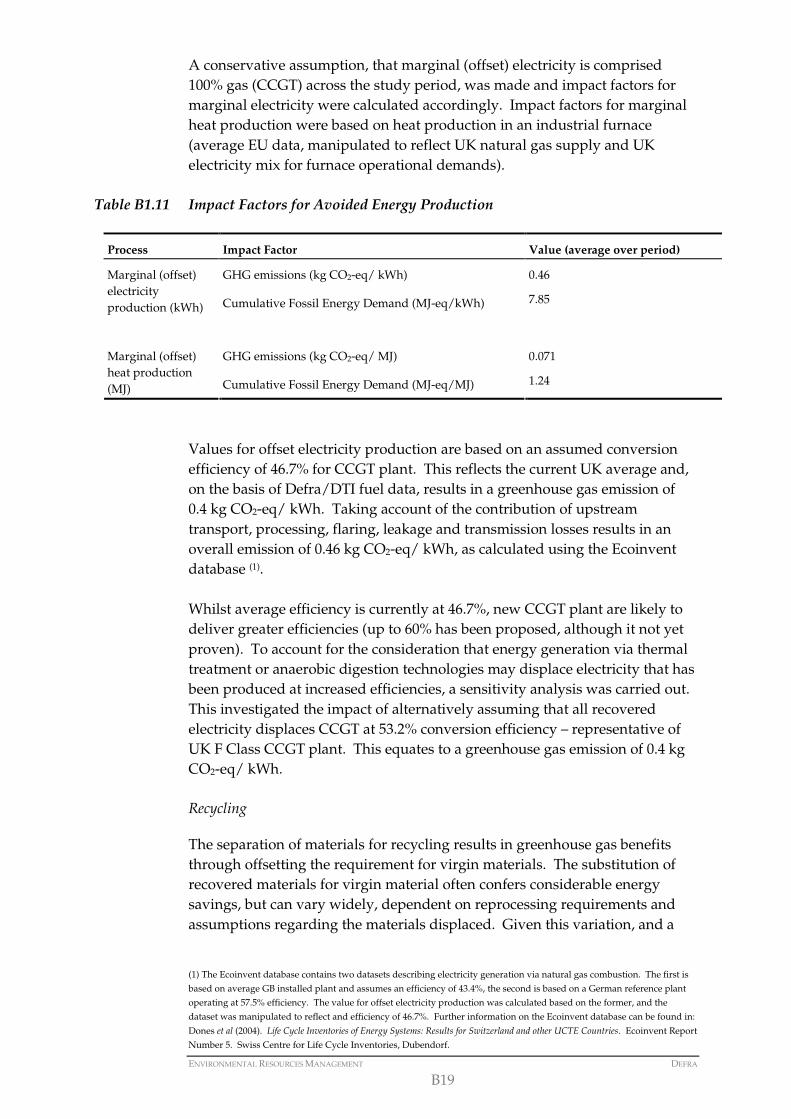
A conservative assumption, that marginal (offset) electricity is comprised 100% gas (CCGT) across the study period, was made and impact factors for marginal electricity were calculated accordingly. Impact factors for marginal heat production were based on heat production in an industrial furnace (average EU data, manipulated to reflect UK natural gas supply and UK electricity mix for furnace operational demands).
Table B1.11 Impact Factors for Avoided Energy Production
Process Impact Factor Value (average over period)
GHG emissions (kg CO2-eq/ kWh) 0.46 Marginal (offset) electricity production (kWh) Cumulative Fossil Energy Demand (MJ-eq/kWh) 7.85
GHG emissions (kg CO2-eq/ MJ) 0.071
Marginal (offset) heat production (MJ) Cumulative Fossil Energy Demand (MJ-eq/MJ) 1.24
Values for offset electricity production are based on an assumed conversion efficiency of 46.7% for CCGT plant. This reflects the current UK average and, on the basis of Defra/DTI fuel data, results in a greenhouse gas emission of 0.4 kg CO2-eq/ kWh. Taking account of the contribution of upstream transport, processing, flaring, leakage and transmission losses results in an overall emission of 0.46 kg CO2-eq/ kWh, as calculated using the Ecoinvent database (1). Whilst average efficiency is currently at 46.7%, new CCGT plant are likely to deliver greater efficiencies (up to 60% has been proposed, although it not yet proven). To account for the consideration that energy generation via thermal treatment or anaerobic digestion technologies may displace electricity that has been produced at increased efficiencies, a sensitivity analysis was carried out. This investigated the impact of alternatively assuming that all recovered electricity displaces CCGT at 53.2% conversion efficiency – representative of UK F Class CCGT plant. This equates to a greenhouse gas emission of 0.4 kg CO2-eq/ kWh. Recycling
The separation of materials for recycling results in greenhouse gas benefits through offsetting the requirement for virgin materials. The substitution of recovered materials for virgin material often confers considerable energy savings, but can vary widely, dependent on reprocessing requirements and assumptions regarding the materials displaced. Given this variation, and a
(1) The Ecoinvent database contains two datasets describing electricity generation via natural gas combustion. The first is based on average GB installed plant and assumes an efficiency of 43.4%, the second is based on a German reference plant operating at 57.5% efficiency. The value for offset electricity production was calculated based on the former, and the dataset was manipulated to reflect and efficiency of 46.7%. Further information on the Ecoinvent database can be found in:
Dones et al (2004). Life Cycle Inventories of Energy Systems: Results for Switzerland and other UCTE Countries. Ecoinvent Report Number 5. Swiss Centre for Life Cycle Inventories, Dubendorf.
ENVIRONMENTAL RESOURCES MANAGEMENT DEFRA
B20
considerable unknown regarding current and future reprocessing routes and recyclate fates, a potential maximum and minimum greenhouse gas emission and energy saving was modelled. Maxima and minima are based on the range of potential fates for recovered materials, for example recovery of plastics and reprocessing into granulate to replace virgin material versus recovery of plastics and reprocessing into plastic lumber for use in street furniture and replacement of wood inputs. As a general rule, the potential savings are higher where recovered materials are of higher quality, material integrity can be maintained and virgin material production is avoided (closed loop). However, the relationship is not a straightforward one for all materials, and so maxima and minima have been developed on a fraction-by-fraction basis. Resulting impact factors for the assumed avoided burdens of recycling are shown in Table B1.12. Taking a maximum/minimum avoided burdens approach is intended to present the range of potential savings associated with recycling alternative materials. Sensitivity analyses were carried out to investigate the influence on results should increased recycling rates influence the quality of materials recovered, and hence the application to which they can be put.
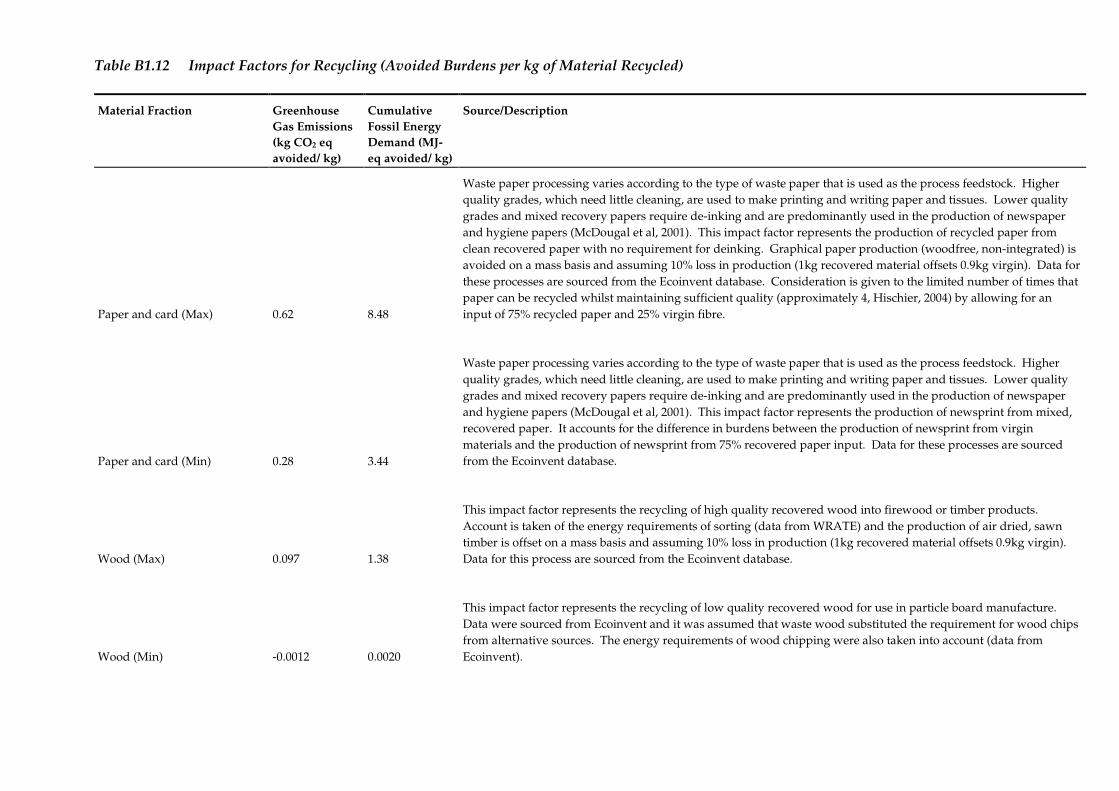
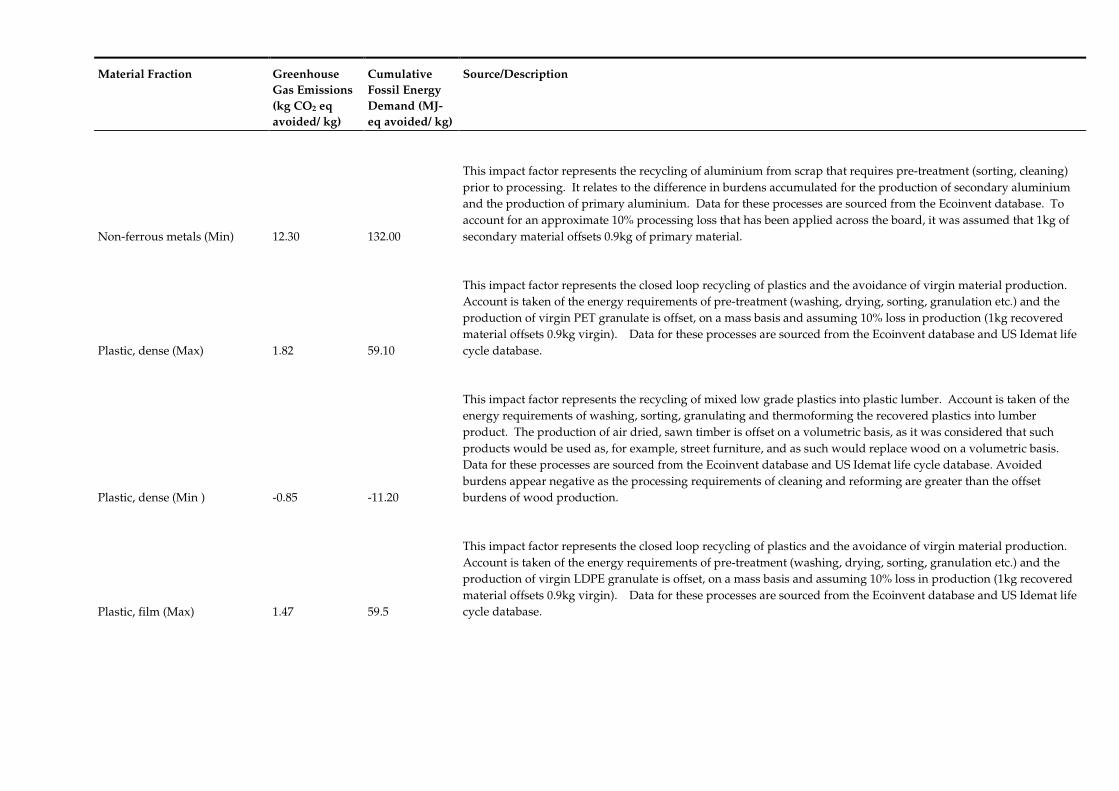
Table B1.12 Impact Factors for Recycling (Avoided Burdens per kg of Material Recycled)
Material Fraction Greenhouse Gas Emissions (kg CO2 eq avoided/ kg)
Cumulative Fossil Energy Demand (MJ-eq avoided/ kg)
Source/Description
Paper and card (Max) 0.62 8.48
Waste paper processing varies according to the type of waste paper that is used as the process feedstock. Higher quality grades, which need little cleaning, are used to make printing and writing paper and tissues. Lower quality grades and mixed recovery papers require de-inking and are predominantly used in the production of newspaper and hygiene papers (McDougal et al, 2001). This impact factor represents the production of recycled paper from clean recovered paper with no requirement for deinking. Graphical paper production (woodfree, non-integrated) is avoided on a mass basis and assuming 10% loss in production (1kg recovered material offsets 0.9kg virgin). Data for these processes are sourced from the Ecoinvent database. Consideration is given to the limited number of times that paper can be recycled whilst maintaining sufficient quality (approximately 4, Hischier, 2004) by allowing for an input of 75% recycled paper and 25% virgin fibre.
Paper and card (Min) 0.28 3.44
Waste paper processing varies according to the type of waste paper that is used as the process feedstock. Higher quality grades, which need little cleaning, are used to make printing and writing paper and tissues. Lower quality grades and mixed recovery papers require de-inking and are predominantly used in the production of newspaper and hygiene papers (McDougal et al, 2001). This impact factor represents the production of newsprint from mixed, recovered paper. It accounts for the difference in burdens between the production of newsprint from virgin materials and the production of newsprint from 75% recovered paper input. Data for these processes are sourced from the Ecoinvent database.
Wood (Max) 0.097 1.38
This impact factor represents the recycling of high quality recovered wood into firewood or timber products. Account is taken of the energy requirements of sorting (data from WRATE) and the production of air dried, sawn timber is offset on a mass basis and assuming 10% loss in production (1kg recovered material offsets 0.9kg virgin). Data for this process are sourced from the Ecoinvent database.
Wood (Min) -0.0012 0.0020
This impact factor represents the recycling of low quality recovered wood for use in particle board manufacture. Data were sourced from Ecoinvent and it was assumed that waste wood substituted the requirement for wood chips from alternative sources. The energy requirements of wood chipping were also taken into account (data from Ecoinvent).
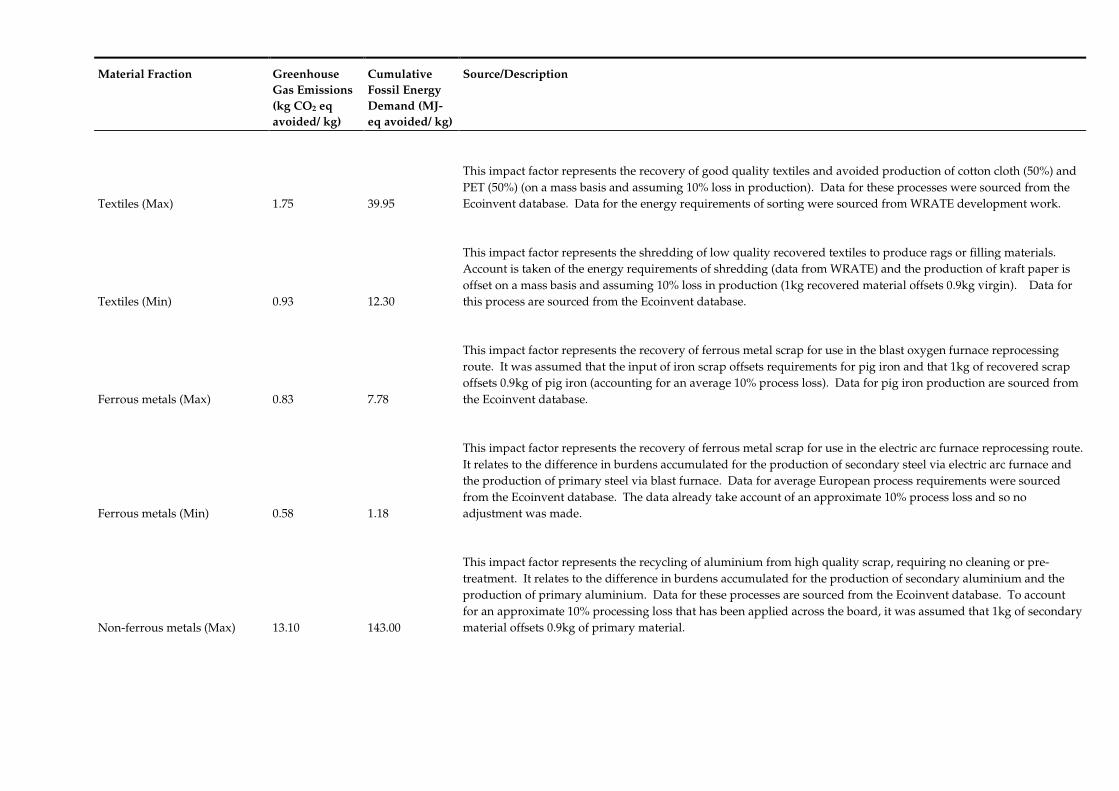
Material Fraction Greenhouse Gas Emissions (kg CO2 eq avoided/ kg)
Cumulative Fossil Energy Demand (MJ-eq avoided/ kg)
Source/Description
Textiles (Max) 1.75 39.95
This impact factor represents the recovery of good quality textiles and avoided production of cotton cloth (50%) and PET (50%) (on a mass basis and assuming 10% loss in production). Data for these processes were sourced from the Ecoinvent database. Data for the energy requirements of sorting were sourced from WRATE development work.
Textiles (Min) 0.93 12.30
This impact factor represents the shredding of low quality recovered textiles to produce rags or filling materials. Account is taken of the energy requirements of shredding (data from WRATE) and the production of kraft paper is offset on a mass basis and assuming 10% loss in production (1kg recovered material offsets 0.9kg virgin). Data for this process are sourced from the Ecoinvent database.
Ferrous metals (Max) 0.83 7.78
This impact factor represents the recovery of ferrous metal scrap for use in the blast oxygen furnace reprocessing route. It was assumed that the input of iron scrap offsets requirements for pig iron and that 1kg of recovered scrap offsets 0.9kg of pig iron (accounting for an average 10% process loss). Data for pig iron production are sourced from the Ecoinvent database.
Ferrous metals (Min) 0.58 1.18
This impact factor represents the recovery of ferrous metal scrap for use in the electric arc furnace reprocessing route. It relates to the difference in burdens accumulated for the production of secondary steel via electric arc furnace and the production of primary steel via blast furnace. Data for average European process requirements were sourced from the Ecoinvent database. The data already take account of an approximate 10% process loss and so no adjustment was made.
Non-ferrous metals (Max) 13.10 143.00
This impact factor represents the recycling of aluminium from high quality scrap, requiring no cleaning or pre-treatment. It relates to the difference in burdens accumulated for the production of secondary aluminium and the production of primary aluminium. Data for these processes are sourced from the Ecoinvent database. To account for an approximate 10% processing loss that has been applied across the board, it was assumed that 1kg of secondary material offsets 0.9kg of primary material.
Material Fraction Greenhouse Gas Emissions (kg CO2 eq avoided/ kg)
Cumulative Fossil Energy Demand (MJ-eq avoided/ kg)
Source/Description
Non-ferrous metals (Min) 12.30 132.00
This impact factor represents the recycling of aluminium from scrap that requires pre-treatment (sorting, cleaning) prior to processing. It relates to the difference in burdens accumulated for the production of secondary aluminium and the production of primary aluminium. Data for these processes are sourced from the Ecoinvent database. To account for an approximate 10% processing loss that has been applied across the board, it was assumed that 1kg of secondary material offsets 0.9kg of primary material.
Plastic, dense (Max) 1.82 59.10
This impact factor represents the closed loop recycling of plastics and the avoidance of virgin material production. Account is taken of the energy requirements of pre-treatment (washing, drying, sorting, granulation etc.) and the production of virgin PET granulate is offset, on a mass basis and assuming 10% loss in production (1kg recovered material offsets 0.9kg virgin). Data for these processes are sourced from the Ecoinvent database and US Idemat life cycle database.
Plastic, dense (Min ) -0.85 -11.20
This impact factor represents the recycling of mixed low grade plastics into plastic lumber. Account is taken of the energy requirements of washing, sorting, granulating and thermoforming the recovered plastics into lumber product. The production of air dried, sawn timber is offset on a volumetric basis, as it was considered that such products would be used as, for example, street furniture, and as such would replace wood on a volumetric basis. Data for these processes are sourced from the Ecoinvent database and US Idemat life cycle database. Avoided burdens appear negative as the processing requirements of cleaning and reforming are greater than the offset burdens of wood production.
Plastic, film (Max) 1.47 59.5
This impact factor represents the closed loop recycling of plastics and the avoidance of virgin material production. Account is taken of the energy requirements of pre-treatment (washing, drying, sorting, granulation etc.) and the production of virgin LDPE granulate is offset, on a mass basis and assuming 10% loss in production (1kg recovered material offsets 0.9kg virgin). Data for these processes are sourced from the Ecoinvent database and US Idemat life cycle database.

Material Fraction Greenhouse Gas Emissions (kg CO2 eq avoided/ kg)
Cumulative Fossil Energy Demand (MJ-eq avoided/ kg)
Source/Description
Plastic, film (Min) -0.85 -11.20
This impact factor represents the recycling of mixed low grade plastics into plastic lumber. Account is taken of the energy requirements of washing, sorting, granulating and thermoforming the recovered plastics into lumber product. The production of air dried, sawn timber is offset on a volumetric basis, as it was considered that such products would be used as, for example, street furniture, and as such would replace wood on a volumetric basis. Data for these processes are sourced from the Ecoinvent database and US Idemat life cycle database. Avoided burdens appear negative as the processing requirements of cleaning and reforming are greater than the offset burdens of wood production.
Soil (Max) 0.0023 0.027
This impact factor represents the recycling of soil for use as an aggregate or fill material. Account is taken of the energy requirements of low intensity sorting (data from WRATE) and the mining of gravel is offset, on a mass basis and assuming 10% loss in processing (1kg recovered material offsets 0.9kg gravel). Data for these processes are sourced from the Ecoinvent database.
Soil (Min) -0.0021 -0.031
This impact factor represents the sorting of recovered materials (data from WRATE), but assumes that no product of value is displaced.
Minerals (Max) 0.0023 0.027
This impact factor represents the recycling of mineral materials for use as an aggregate or fill material. Account is taken of the energy requirements of low intensity sorting (data from WRATE) and the mining of gravel is offset, on a mass basis and assuming 10% loss in processing (1kg recovered material offsets 0.9kg gravel). Data for these processes are sourced from the Ecoinvent database.
Minerals (Min) -0.0021 -0.031
This impact factor represents the sorting of recovered materials (data from WRATE), but assumed that no product of value is displaced.
Misc Combustibles (Max) 0.0023 0.027
This impact factor represents the recycling of miscellaneous materials for use as an aggregate or fill material. Account is taken of the energy requirements of low intensity sorting (data from WRATE) and the mining of gravel is offset, on a mass basis and assuming 10% loss in processing (1kg recovered material offsets 0.9kg gravel). Data for these processes are sourced from the Ecoinvent database.

Material Fraction Greenhouse Gas Emissions (kg CO2 eq avoided/ kg)
Cumulative Fossil Energy Demand (MJ-eq avoided/ kg)
Source/Description
Misc Combustibles (Min) -0.0021 -0.031
This impact factor represents the sorting of recovered materials (data from WRATE), but assumed that no product of value is displaced.
Compost (Max) 0.0067 1.33
This impact factor represents the production of high grade compost (according to APEX standards) and its use and offset alternatives according to standard practice. Avoided burdens were developed as part of work carried out for the development of WRATE. Data for offset processes (wood chips, peat etc.) were sourced from the Ecoinvent database.
Compost (Min) 0.0011 0.015
This impact factor represents the production of low grade compost, offsetting the production of low quality topsoil. Avoided burdens were developed as part of work carried out for the development of WRATE. Data for offset processes (transport of topsoil from alternative sources) were sourced from the Ecoinvent database.
ENVIRONMENTAL RESOURCES MANAGEMENT DEFRA
B26
B1.8 LANDFILL ASSUMPTIONS
Scenarios have been evaluated by taking individual material fractions and assessing each of these in isolation. In this way, the time dependent releases of carbon to the environment can be considered for each component of waste. The GasSim model has been used to perform the bulk of the assessment work, but because GasSim only consider the mass balance of the degradable carbon entering the landfill, another spreadsheet model was also designed to calculate the mass balance of the non-degradable carbon which remains sequestrated in the landfill. GasSim defaults for the fraction of degradable and non degradable cellulosic material in each component of each waste stream were used. Default average degradation rates were also used, but these rates are one of the most significant factors in terms of the sensitivity analysis, and so additional evaluation of the base case with wet decay rates were used to show the relative impact of this model parameter. Time dependent release of landfill gas and the greenhouse gas equivalent (as tonnes CO2) are calculated within GasSim. Landfill Gas Capture
The collection efficiency of landfill gas was assumed to be 75% over a 100 year period (1). Collection efficiency will vary at a site level, depending on where in an individual landfill site’s life the gas is being generated, but the 75% value has been agreed from previous Defra research to be representative of the amount of gas recoverable from a single landfill over this timescale (2), and so this is therefore a suitable assumption for the population of UK, PPC-permitted landfills at a given moment in time. The efficiency of collection of landfill gas emissions is dependent on many site specific factors. A landfill with a high rate of gas generation may have a higher potential gas collection efficiency (as a percentage), but at the same time, more gas (in tonnes) is likely to be lost to atmosphere than a landfill with a lower rate of gas generation, where the collection efficiency may be not as good in percentage terms. Factors which move the value of collection efficiency up (or down) are: 1. whether the landfill has no cap, a temporary cap, or a permanent cap; 2. whether the landfill has no gas collection, sacrificial/temporary gas
collection, or a permanent gas collection infrastructure; 3. how much degradable waste is in the landfill; 4. the rate of filling of that degradable waste; and 5. how far in time, along the gas production curve is the site.
(1) This is assumed to be for current, PPC-permitted landfills. (2) Golder Associates (2005). UK Landfill Methane Emissions: Evaluation of Waste Polices and Projections to 2050. Report for Defra, London.

ENVIRONMENTAL RESOURCES MANAGEMENT DEFRA
B27
GasSim models a range of collection efficiencies for gas utilisation resource assessment purposes, ranging from 30% for temporary gas collection systems with no temporary or permanent cap present, up to 95% for a fully engineered and capped utilisation system. The Environment Agency expects a permitted landfill to perform to at least 85% collection efficiency during the active gas management phase (1) (this value corresponds to the GasSim value for a utilisation scheme comprising permanent gas infrastructure and a temporary cap). When a landfill cell is first filling, there will be no gas collection, and so all the methane will be emitted. Similarly, when the gas generation rate drops to below the practicable level of collection, all the methane will be emitted. The 75% value determined in previous work for Defra’s Global Atmosphere Division acknowledges that, over a population of landfills, not all will be managed at the 95%, or even the 85%, collection efficiency level, as some will be accepting fresh waste with no gas collection system, while others will be beyond the practicable gas collection stage (approximately 50m3 LFG/Ha). Annex E explores the use of 75% as a 100-year gas collection value and it assesses the effect that the gas generation tail (post 100 years) if considered would have on the results. This modelling shows that a 100-year gas collection value of 75% could result in a lower lifetime (150 year) collection efficiency of approximately 59%. It should be realised that the nature of gas generation and emissions in the late stages of a landfill’s life will be very site specific, and are not well understood or known. Electricity Production
With regard to electricity generation from landfill gas, a nominal assumption was made that 570-600m3 of landfill gas at 50% methane is required to generate 1MW of power. This value varies according to gas quality and engine efficiency, but is sufficiently accurate for the calculations performed. Fuel Consumption
The generic landfill site fuel consumption (1.4 kg diesel /tonne waste) is taken from the Environment Agency’s WRATE model. There is a small amount of electricity consumption as well as production from a landfill, and this has been conservatively estimated at 1% of the production level. Carbon Remaining in Landfill
The fraction of carbon remaining within the landfill is also time dependent. In any given year, this will comprise two forms of carbon: (1) the degradable carbon that has not yet degraded from the waste deposited in current and previous years (this amount will increase as the site is filling and will then decrease exponentially towards zero as the amount of degradable carbon is degraded); plus (2) the carbon that has been landfilled in previous years plus the current year that is not available for degradation, and so remains
(1) Environment Agency (2004) Guidance on the Management of Landfill gas. Environment Agency, Bristol.

ENVIRONMENTAL RESOURCES MANAGEMENT DEFRA
B28
sequestrated within the landfill. This carbon rises year on year to a peak which then remains constant. Greenhouse Gas Emissions to Atmosphere (Emission Factors)
As one of its key inputs, GasSim will accept a detailed description of the composition of waste, in terms of tonnages and sources of the waste (for example MSW, commercial, civic amenity, industrial, etc). Within the model, these waste streams are defined by the different amounts of degradable cellulosic materials they contain, the water content of each fraction, the amount of cellulose and hemicellulose, and the degradability of that cellulose. The alternative properties each have influence on material degradation. For example, both paper and food waste have high cellulose contents and degradabilities, but food waste contains a significantly higher percentage of water and so, on a per tonne basis (as deposited to landfill), there will be a greater yield of methane from the paper waste stream than from the food waste stream. The following graphs present the quantities of greenhouse gas emissions released to atmosphere over a period of 100 years following the deposit of one tonne of each waste fraction in landfill and thereby serve as greenhouse gas emission factors for the landfill of alternative materials. Note that they are not net emissions, in that they do not take account of the avoided burdens of electricity generation. A red line has been marked on each graph at approximately 0.002 tonnes CO2-eq. This has been drawn to highlight the relative scale of emissions for alternative fractions.
Figure B1.2 Landfill of One Tonne of Paper/Card - Greenhouse Gas Emissions over Time
0
0.005
0.01
0.015
0.02
0.025
0.03
0.035
0.04
0.045
2000 2020 2040 2060 2080 2100 2120
Year
Tonn
es C
O2-
eq

ENVIRONMENTAL RESOURCES MANAGEMENT DEFRA
B29
Figure B1.3 Landfill of One Tonne of Kitchen Waste - Greenhouse Gas Emissions over Time
Figure B1.4 Landfill of One Tonne of Green Waste - Greenhouse Gas Emissions over Time
0
0.005
0.01
0.015
0.02
0.025
0.03
0.035
0.04
0.045
2000 2020 2040 2060 2080 2100 2120
Year
Tonn
es C
O2-
eq
0
0.005
0.01
0.015
0.02
0.025
0.03
0.035
0.04
0.045
2000 2020 2040 2060 2080 2100 2120
Year
Tonn
es C
O2-
eq

ENVIRONMENTAL RESOURCES MANAGEMENT DEFRA
B30
Figure B1.5 Landfill of One Tonne of ‘Other’ Organic Waste - Greenhouse Gas Emissions over Time
Figure B1.6 Landfill of One Tonne of Wood - Greenhouse Gas Emissions over Time
0
0.005
0.01
0.015
0.02
0.025
0.03
0.035
0.04
0.045
2000 2020 2040 2060 2080 2100 2120
Year
Tonn
es C
O2-
eq
0.00
0.02
0.04
0.06
0.08
0.10
0.12
0.14
2000 2020 2040 2060 2080 2100 2120
Year
Tonn
es C
O2-
eq

ENVIRONMENTAL RESOURCES MANAGEMENT DEFRA
B31
Figure B1.7 Landfill of One Tonne of Textiles - Greenhouse Gas Emissions over Time
Figure B1.8 Landfill of One Tonne of Miscellaneous Combustibles/Stabilised Waste - Greenhouse Gas Emissions over Time
0
0.005
0.01
0.015
0.02
0.025
0.03
0.035
0.04
0.045
2000 2020 2040 2060 2080 2100 2120
Year
Tonn
es C
O2-
eq
0
0.005
0.01
0.015
0.02
0.025
0.03
0.035
0.04
0.045
2000 2020 2040 2060 2080 2100 2120
Year
Tonn
es C
O2-
eq