Application of the SWAT Model to assess climate change impacts on water balances and crop yields in...
18
July 17-19, 2013 Paul Sabatier University, Toulouse, France Conference Proceedings
-
Upload
independent -
Category
Documents
-
view
3 -
download
0
Transcript of Application of the SWAT Model to assess climate change impacts on water balances and crop yields in...
July 17-19, 2013
Paul Sabatier University, Toulouse, France
Conference Proceedings
1
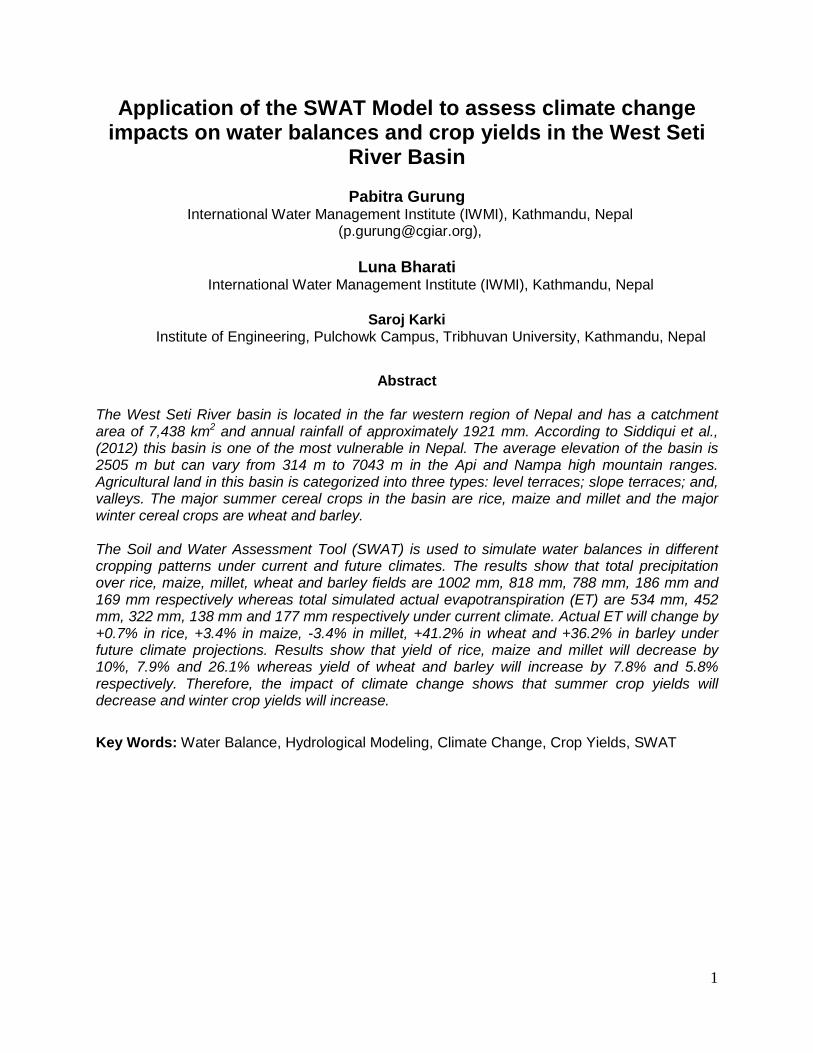
Application of the SWAT Model to assess climate change impacts on water balances and crop yields in the West Seti
River Basin
Pabitra Gurung International Water Management Institute (IWMI), Kathmandu, Nepal
Luna Bharati International Water Management Institute (IWMI), Kathmandu, Nepal
Saroj Karki
Institute of Engineering, Pulchowk Campus, Tribhuvan University, Kathmandu, Nepal
Abstract The West Seti River basin is located in the far western region of Nepal and has a catchment area of 7,438 km2 and annual rainfall of approximately 1921 mm. According to Siddiqui et al., (2012) this basin is one of the most vulnerable in Nepal. The average elevation of the basin is 2505 m but can vary from 314 m to 7043 m in the Api and Nampa high mountain ranges. Agricultural land in this basin is categorized into three types: level terraces; slope terraces; and, valleys. The major summer cereal crops in the basin are rice, maize and millet and the major winter cereal crops are wheat and barley. The Soil and Water Assessment Tool (SWAT) is used to simulate water balances in different cropping patterns under current and future climates. The results show that total precipitation over rice, maize, millet, wheat and barley fields are 1002 mm, 818 mm, 788 mm, 186 mm and 169 mm respectively whereas total simulated actual evapotranspiration (ET) are 534 mm, 452 mm, 322 mm, 138 mm and 177 mm respectively under current climate. Actual ET will change by +0.7% in rice, +3.4% in maize, -3.4% in millet, +41.2% in wheat and +36.2% in barley under future climate projections. Results show that yield of rice, maize and millet will decrease by 10%, 7.9% and 26.1% whereas yield of wheat and barley will increase by 7.8% and 5.8% respectively. Therefore, the impact of climate change shows that summer crop yields will decrease and winter crop yields will increase.
Key Words: Water Balance, Hydrological Modeling, Climate Change, Crop Yields, SWAT
2
Introduction
The Himalayan region is considered sensitive to climate change (CC), and developing countries,
such as Nepal, are more vulnerable to CC because they have limited capacity to adapt to it (IPCC
2001). The Fourth Assessment of the Intergovernmental Panel on CC (IPCC 2007) states that
due to increasing concentration of greenhouse gases in the atmosphere, a warming of about
0.2°C per decade is projected for the next two decades for a range of Special Report on
Emissions Scenarios (SRES). The mountain regions of Nepal are the major source of water
storage in the form of ice and snow. Between 1977 and 2000, the mean maximum temperature of
Nepal increased by 0.06°C per year (Hua, 2009). The rise in temperature will affect the
hydrological cycle, which in turn will have an impact on water availability, evapotranspiration,
runoff and the discharge regime of rivers (Sayari et al., 2011).
Water has been identified as the key resource for development and economic growth of Nepal
(WECS, 2011), therefore managing spatial and temporal water resources variability is critical in
river basins that are vulnerable to climate change. In Nepal, most of the agricultural land in the
hills and middle mountains depends on the rainfall and only few lands have irrigation access
from local streams. The irrigation water management should be balanced with soil fertility
management to increase the monsoonal crop yields and increasing soil fertility without
considering the irrigation could result in crop failure (Shrestha et al., 2013). Consequently,
agricultural production depends on the water availability in the local streams; and on the amount
and timing of rainfall. Therefore, the central idea of this paper is to evaluate the impact of
climate change on the soil water balance in the agricultural lands of the West Seti River sub-
basins and subsequently to measure change in the yields of cereal crops. The spatially distributed
agro-hydrological models are widely used to simulate hydrological parameters and crop yields in
the river basin scale. Thus Soil and Water Assessment Tool (SWAT) is used to simulate water
balance and crop yields in this study.
3
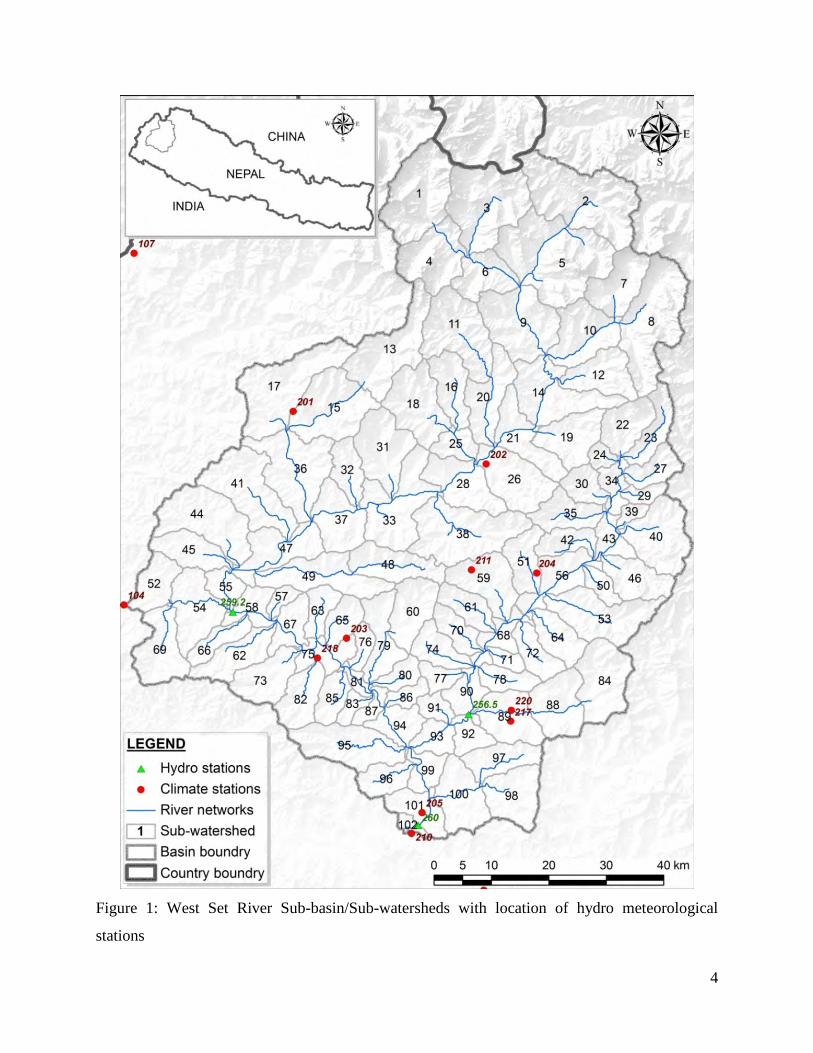
STUDY AREA: the West River Sub-basin
According to a study on climate change vulnerability in the middle and high mountain regions of
Nepal (Siddiqui et al., 2012), the West Seti sub-basin was identified as one of the most
vulnerable sub-basins in relation to climate change. The West Seti River Sub-basin is located in
the far western region of Nepal (Figure 1) and has a catchment area of 7,438 km2 and has
confluence point with the Karnali River as the basin outlet. The sub-basin originates from the
snow fields and glaciers around the twin peaks of Api and Nampa in the south facing slopes of
the main Himalayas. The average elevation of the sub-basin is 2505 m but it varies from 314 m
at sub-basin outlet, to 7043 m of Api and Nampa high mountain ranges. The West Seti River is
one of the major tributaries of Sapta Karnali River (the longest river of Nepal). In the period of
1981 to 2010, the average annual rainfall within the sub-basin was 1921 mm whereas seasonal
precipitation was 137 mm in the winter; 261 mm in the pre-monsoon; 1449 mm in the monsoon;
and, 74 mm in the post-monsoon seasons. Therefore, in this sub-basin almost 75% of annual
rainfall occurred during the monsoon season. In the period 1981-2010, the daily maximum
temperature varied from -17.3°C to +46.7°C and minimum temperature varied from -23.4°C to
+31.3°C. The projected climate result shows that the average daily maximum temperature will
change by -0.62°C to +0.66°C per decade and minimum temperature will change by -1.14°C to
+0.03°C per decade in this study area. This shows an average day becomes hotter and night
becomes colder.
4
Figure 1: West Set River Sub-basin/Sub-watersheds with location of hydro meteorological
stations
5
DATA AND SOURCES
Hydro-Meteorological Data
SWAT requires time series of observed climate data i.e. rainfall, minimum and maximum
temperature, solar radiation, wind speed and relative humidity. In this study, time series climate
data from 1981to 2010 from Department of Hydrology and Meteorological (DHM) of Nepal was
used for model input. In addition, daily observed hydrological data obtained from DHM was
used to calibrate and validate the model output. Altogether, data from 15 climate stations and 3
hydro stations was used for this study.
In this study, projected climate data from DHM (downscaled from PRECIS, and WRF regional
climate models) were used to model future scenarios. The downscaled climate variables were
based on the five global climate models (GCMs): ECHAM5, and HadCM3 in PRECIS; and,
Era40, CCSM, ECHAM5, GFDL, and HadCM3 in WRF. The average of projected climate data
from these seven projections, under A1B scenario, was used to assess climate change impacts.
The projected climate time series data covered the periods from 1971 to 2000 as base line and
2031 to 2060 as the future projection.
Spatial Data
SWAT requires three basic files for delineating the basin into sub-basins and hydrologic
response units: Digital Elevation Model (DEM); Soil map; and, Land Use/Land Cover (LULC)
map. The Advanced Space borne Thermal Emission and Reflection Radiometer (ASTER) Global
Digital Elevation Model Version 2 (GDEM V2) with 1-arc second (approximately 30 m at the
equator) resolution is used for the DEM in this study. This ASTER GDEM was jointly developed
by the Ministry of Economy, Trade, and Industry (METI) of Japan and the United States
National Aeronautics and Space Administration (NASA). The sources of the land cover map and
soil map are from National Land Use Project (NLUP), Ministry of Land Reform and
Management (MoLRM), Nepal.
Agricultural Data
Based on MoAC (2005), the crops considered in this study are: rice, maize, wheat, barley, millet,
potato, oilseed, sugarcane and vegetables. Agricultural fields in level terraces are classified into
6
rice (19%), millet (16%), sugarcane (1%) and vegetables (64%) whereas agricultural fields in
slope terraces are classified into maize (36%), oilseeds (6%), potato (8%) and vegetables (50%).
All the agricultural fields in river valleys are classified as rice fields. Wheat and barley are
considered as winter crops in rotation with summer crops such as rice, maize, millet, oilseeds and
vegetables; whereas sugarcane and potato do not contain a second crop.
METHODS
Soil and Water Assessment Tool (SWAT)
SWAT is a process-based continuous hydrological model that predicts the impact of land
management practices on water, sediment and agricultural chemical yields in complex sub-basins
with varying soils, land use and management conditions (Arnold et al., 1998; Neitsch et al.,
2011; Srinivasan et al., 1998). The main components of the model include: climate, hydrology,
erosion, soil temperature, plant growth, nutrients, pesticides, land management, and, channel and
reservoir routing. Conceptually SWAT divides a basin into sub-basins. Each sub-basin is
connected through a stream channel and further divided in to Hydrologic Response Unit (HRU).
HRUs are a unique combination of a soil and a vegetation type in a sub watershed, and SWAT
simulates hydrology, vegetation growth, and management practices at the HRU level.
The hydrologic cycle as simulated by SWAT is based on the water balance equation:
∑=
−−−−+=n
igwseepasurfdayot QwEQRSWSW
1)( (1)
Where,
tSW : Final soil water content (mm)
oSW : Initial soil water content (mm)
t : Time (day)
dayR : Amount of precipitation on day i (mm)
surfQ : Amount of surface runoff on day i (mm)
7
aE : Amount of actual evapotranspiration on day i (mm)
seepw : Amount of percolation on day i (mm)
gwQ : Amount of return flow on day i (mm)
Since the model maintains a continuous water balance, the subdivision of the basin enables the
model to reflect differences in ET for various crops and soils. Thus, runoff is predicted
separately for each sub-basin and routed to obtain the total runoff for the basin. This increases
the accuracy and gives a much better physical description of the water balance. More detailed
descriptions of the model can be found in Arnold et al. (2011) and Neitsch et al. (2011).
The SWAT model partitions crop yield from the total biomass on a daily basis (Arnold et al.,
2011). The partitioning is based on the fraction of the above-ground plant dry biomass removed
as dry economic yield and this fraction is known as harvest index (Neitsch et al., 2011). The
harvest and kill operation is enabled to evaluate the crop yields in the modeling. The equations
for the crop yield are;
HIbioYLD ag ×= , when 1≤HI (2)
+−×=
HIbioYLD
111 , when 1>HI (3)
Where,
YLD = Crop yield (kg/ha),
agbio = Above-ground biomass on the day of harvest (kg/ha),
HI = Harvest index on the day of harvest, and
bio = Total plant biomass on the day of harvest (kg/ha)
In this study, the harvest index considered for optimal growing conditions are: rice, 0.50; maize,
0.50; millet, 0.25; wheat, 0.40; and, barley, 0.54. Whereas the harvest index considered under
highly stressed growing conditions are 0.25, 0.30, 0.10, 0.20, and 0.20 for rice, maize, millet,
wheat and barley respectively. The potential harvest index for a given day is depend of the
8
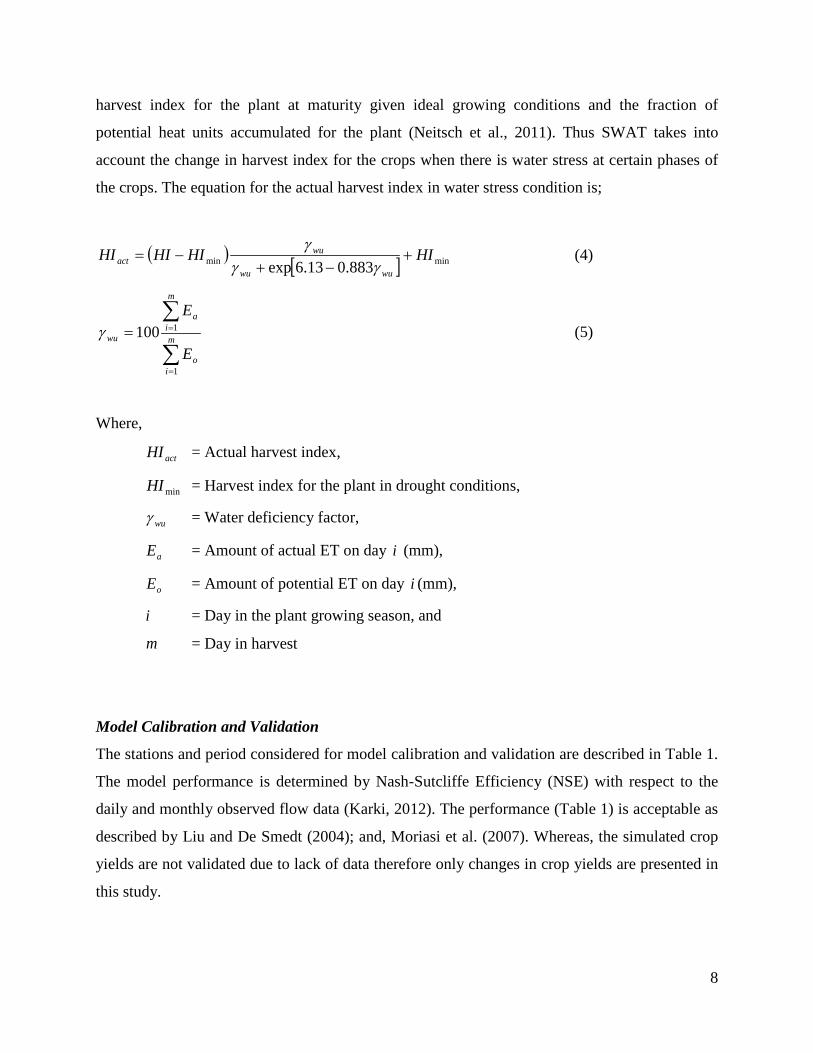
harvest index for the plant at maturity given ideal growing conditions and the fraction of
potential heat units accumulated for the plant (Neitsch et al., 2011). Thus SWAT takes into
account the change in harvest index for the crops when there is water stress at certain phases of
the crops. The equation for the actual harvest index in water stress condition is;
( ) [ ] minmin 883.013.6expHIHIHIHI
wuwu
wuact +
−+−=
γγγ
(4)
∑
∑
=
== m
io
m
ia
wu
E
E
1
1100γ (5)
Where,
actHI = Actual harvest index,
minHI = Harvest index for the plant in drought conditions,
wuγ = Water deficiency factor,
aE = Amount of actual ET on day i (mm),
oE = Amount of potential ET on day i (mm),
i = Day in the plant growing season, and
m = Day in harvest
Model Calibration and Validation
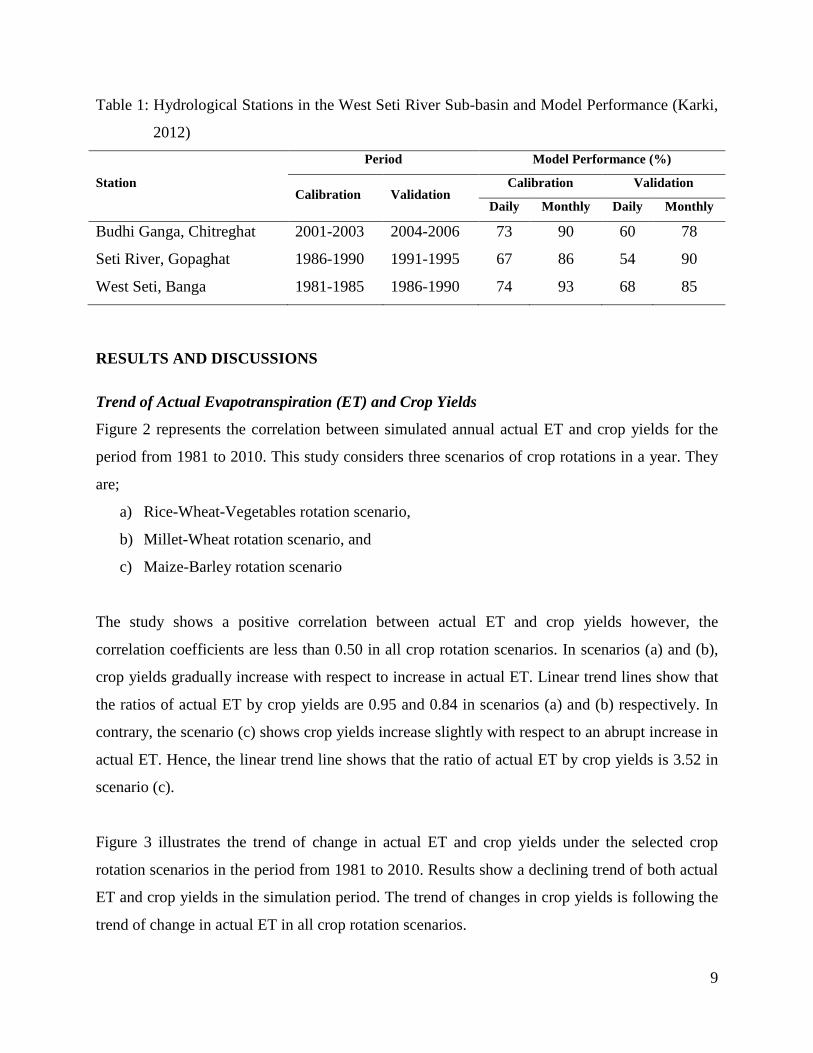
The stations and period considered for model calibration and validation are described in Table 1.
The model performance is determined by Nash-Sutcliffe Efficiency (NSE) with respect to the
daily and monthly observed flow data (Karki, 2012). The performance (Table 1) is acceptable as
described by Liu and De Smedt (2004); and, Moriasi et al. (2007). Whereas, the simulated crop
yields are not validated due to lack of data therefore only changes in crop yields are presented in
this study.
9
Table 1: Hydrological Stations in the West Seti River Sub-basin and Model Performance (Karki,
2012)
Station
Period Model Performance (%)
Calibration Validation Calibration Validation
Daily Monthly Daily Monthly
Budhi Ganga, Chitreghat 2001-2003 2004-2006 73 90 60 78
Seti River, Gopaghat 1986-1990 1991-1995 67 86 54 90
West Seti, Banga 1981-1985 1986-1990 74 93 68 85
RESULTS AND DISCUSSIONS
Trend of Actual Evapotranspiration (ET) and Crop Yields
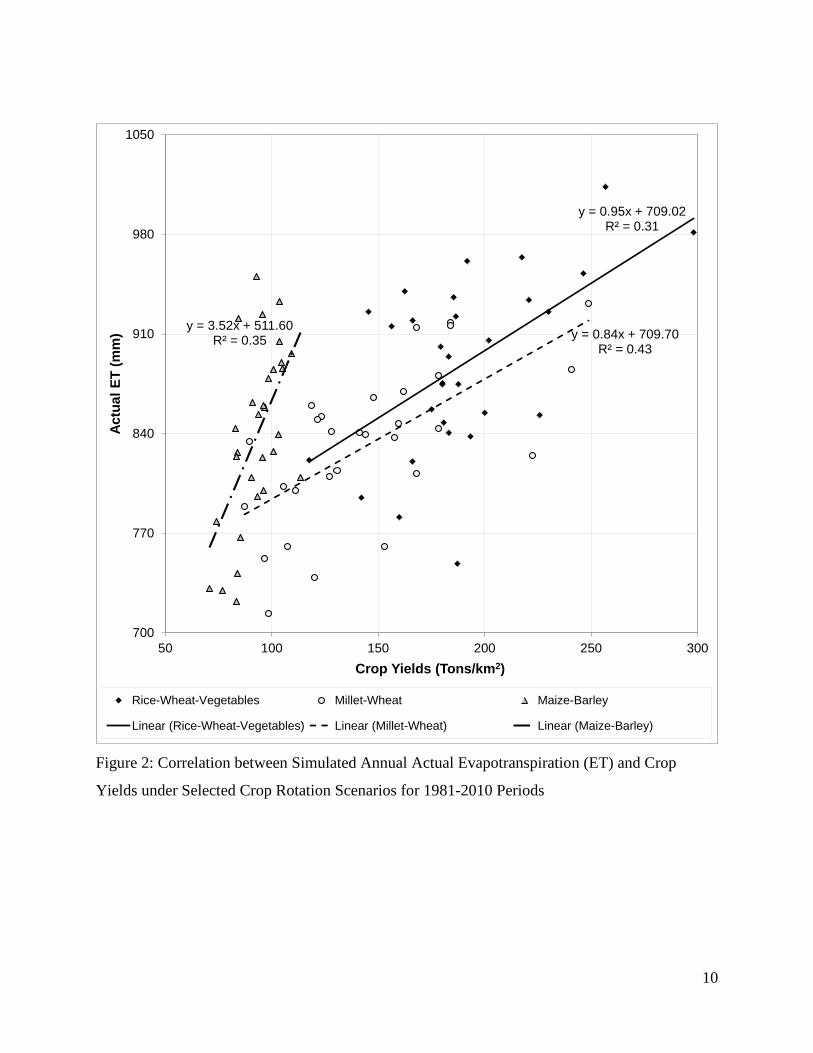
Figure 2 represents the correlation between simulated annual actual ET and crop yields for the
period from 1981 to 2010. This study considers three scenarios of crop rotations in a year. They
are;
a) Rice-Wheat-Vegetables rotation scenario,
b) Millet-Wheat rotation scenario, and
c) Maize-Barley rotation scenario
The study shows a positive correlation between actual ET and crop yields however, the
correlation coefficients are less than 0.50 in all crop rotation scenarios. In scenarios (a) and (b),
crop yields gradually increase with respect to increase in actual ET. Linear trend lines show that
the ratios of actual ET by crop yields are 0.95 and 0.84 in scenarios (a) and (b) respectively. In
contrary, the scenario (c) shows crop yields increase slightly with respect to an abrupt increase in
actual ET. Hence, the linear trend line shows that the ratio of actual ET by crop yields is 3.52 in
scenario (c).
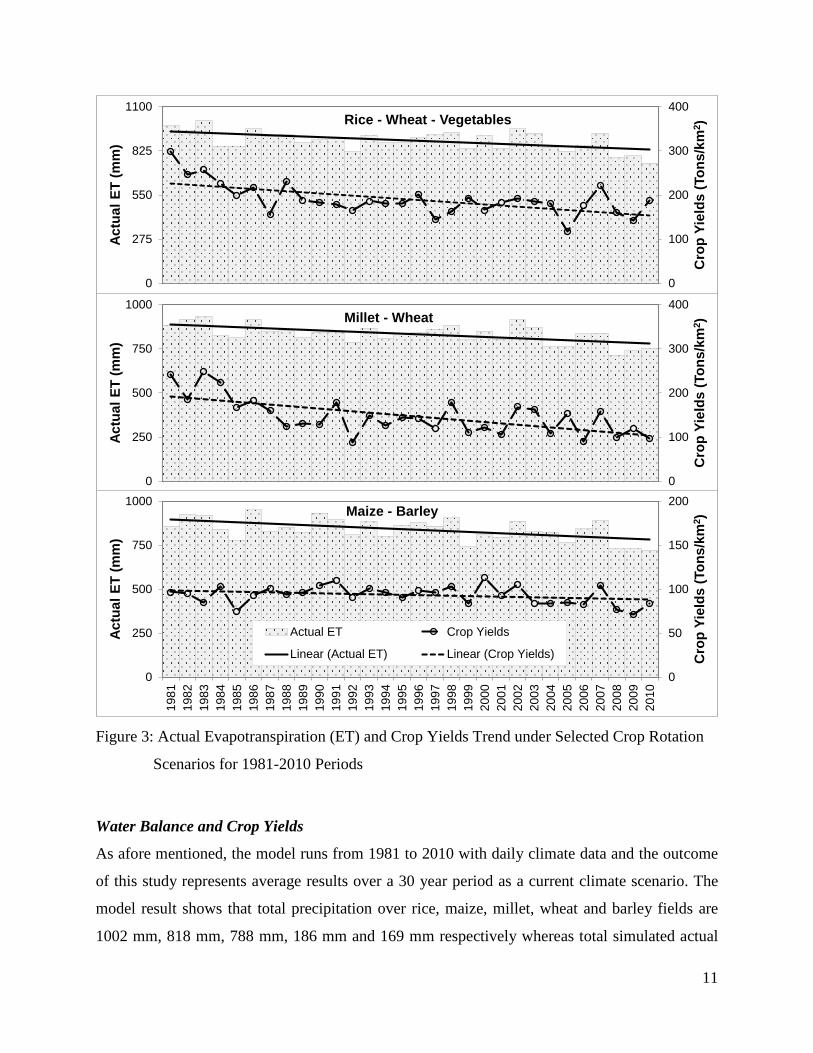
Figure 3 illustrates the trend of change in actual ET and crop yields under the selected crop
rotation scenarios in the period from 1981 to 2010. Results show a declining trend of both actual
ET and crop yields in the simulation period. The trend of changes in crop yields is following the
trend of change in actual ET in all crop rotation scenarios.
10
Figure 2: Correlation between Simulated Annual Actual Evapotranspiration (ET) and Crop
Yields under Selected Crop Rotation Scenarios for 1981-2010 Periods
y = 0.95x + 709.02R² = 0.31
y = 0.84x + 709.70R² = 0.43
y = 3.52x + 511.60R² = 0.35
700
770
840
910
980
1050
50 100 150 200 250 300
Actu
al E
T (m
m)
Crop Yields (Tons/km2)
Rice-Wheat-Vegetables Millet-Wheat Maize-Barley
Linear (Rice-Wheat-Vegetables) Linear (Millet-Wheat) Linear (Maize-Barley)
11
Figure 3: Actual Evapotranspiration (ET) and Crop Yields Trend under Selected Crop Rotation
Scenarios for 1981-2010 Periods
Water Balance and Crop Yields
As afore mentioned, the model runs from 1981 to 2010 with daily climate data and the outcome
of this study represents average results over a 30 year period as a current climate scenario. The
model result shows that total precipitation over rice, maize, millet, wheat and barley fields are
1002 mm, 818 mm, 788 mm, 186 mm and 169 mm respectively whereas total simulated actual
0
100
200
300
400
0
275
550
825
1100
Cro
p Yi
elds
(Ton
s/km
2 )
Actu
al E
T (m
m)
Rice - Wheat - Vegetables
0
100
200
300
400
0
250
500
750
1000
Cro
p Yi
elds
(Ton
s/km
2 )
Actu
al E
T (m
m)
Millet - Wheat
0
50
100
150
200
0
250
500
750
1000
1981
1982
1983
1984
1985
1986
1987
1988
1989
1990
1991
1992
1993
1994
1995
1996
1997
1998
1999
2000
2001
2002
2003
2004
2005
2006
2007
2008
2009
2010
Cro
p Yi
elds
(Ton
s/km
2 )
Actu
al E
T (m
m)
Maize - Barley
Actual ET Crop Yields
Linear (Actual ET) Linear (Crop Yields)
12
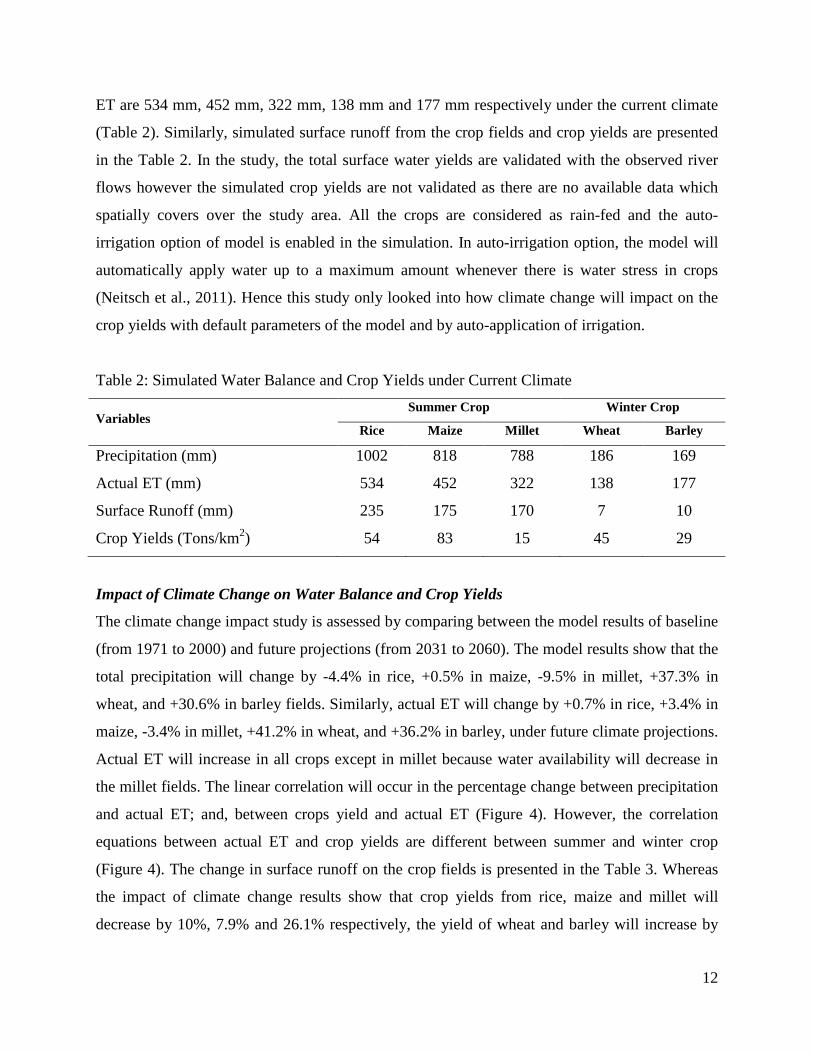
ET are 534 mm, 452 mm, 322 mm, 138 mm and 177 mm respectively under the current climate
(Table 2). Similarly, simulated surface runoff from the crop fields and crop yields are presented
in the Table 2. In the study, the total surface water yields are validated with the observed river
flows however the simulated crop yields are not validated as there are no available data which
spatially covers over the study area. All the crops are considered as rain-fed and the auto-
irrigation option of model is enabled in the simulation. In auto-irrigation option, the model will
automatically apply water up to a maximum amount whenever there is water stress in crops
(Neitsch et al., 2011). Hence this study only looked into how climate change will impact on the
crop yields with default parameters of the model and by auto-application of irrigation.
Table 2: Simulated Water Balance and Crop Yields under Current Climate
Variables Summer Crop Winter Crop
Rice Maize Millet Wheat Barley
Precipitation (mm) 1002 818 788 186 169
Actual ET (mm) 534 452 322 138 177
Surface Runoff (mm) 235 175 170 7 10
Crop Yields (Tons/km2) 54 83 15 45 29
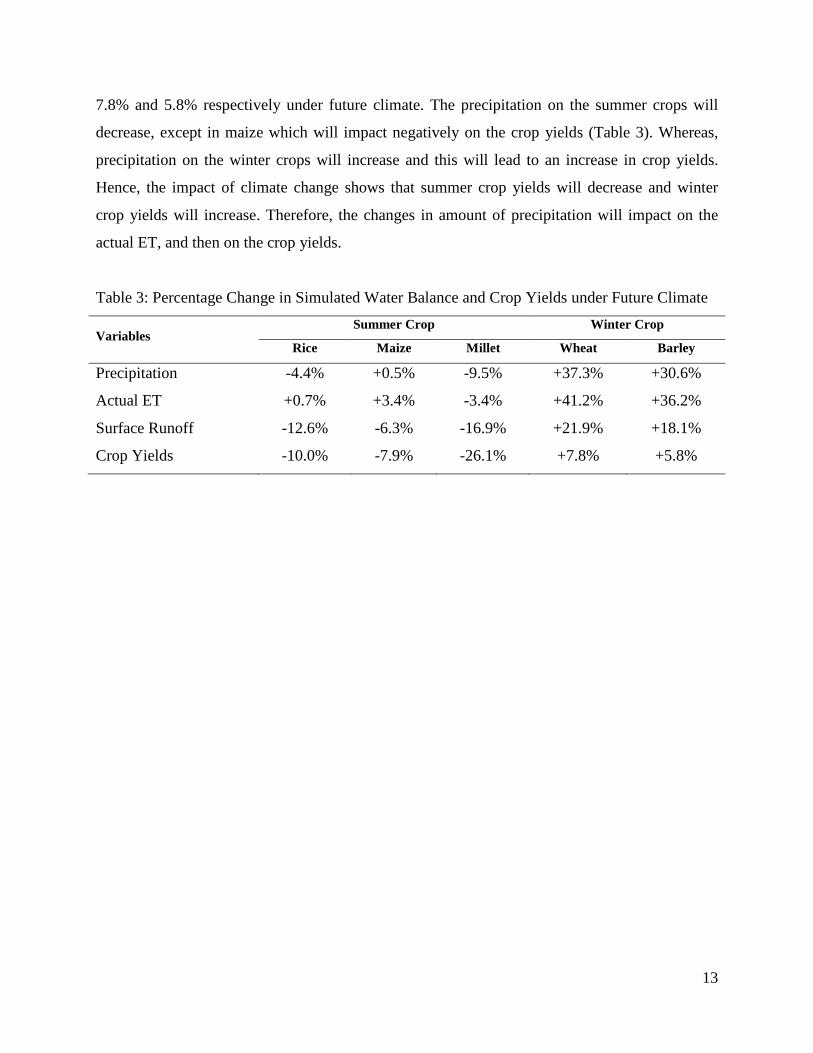
Impact of Climate Change on Water Balance and Crop Yields
The climate change impact study is assessed by comparing between the model results of baseline
(from 1971 to 2000) and future projections (from 2031 to 2060). The model results show that the
total precipitation will change by -4.4% in rice, +0.5% in maize, -9.5% in millet, +37.3% in
wheat, and +30.6% in barley fields. Similarly, actual ET will change by +0.7% in rice, +3.4% in
maize, -3.4% in millet, +41.2% in wheat, and +36.2% in barley, under future climate projections.
Actual ET will increase in all crops except in millet because water availability will decrease in
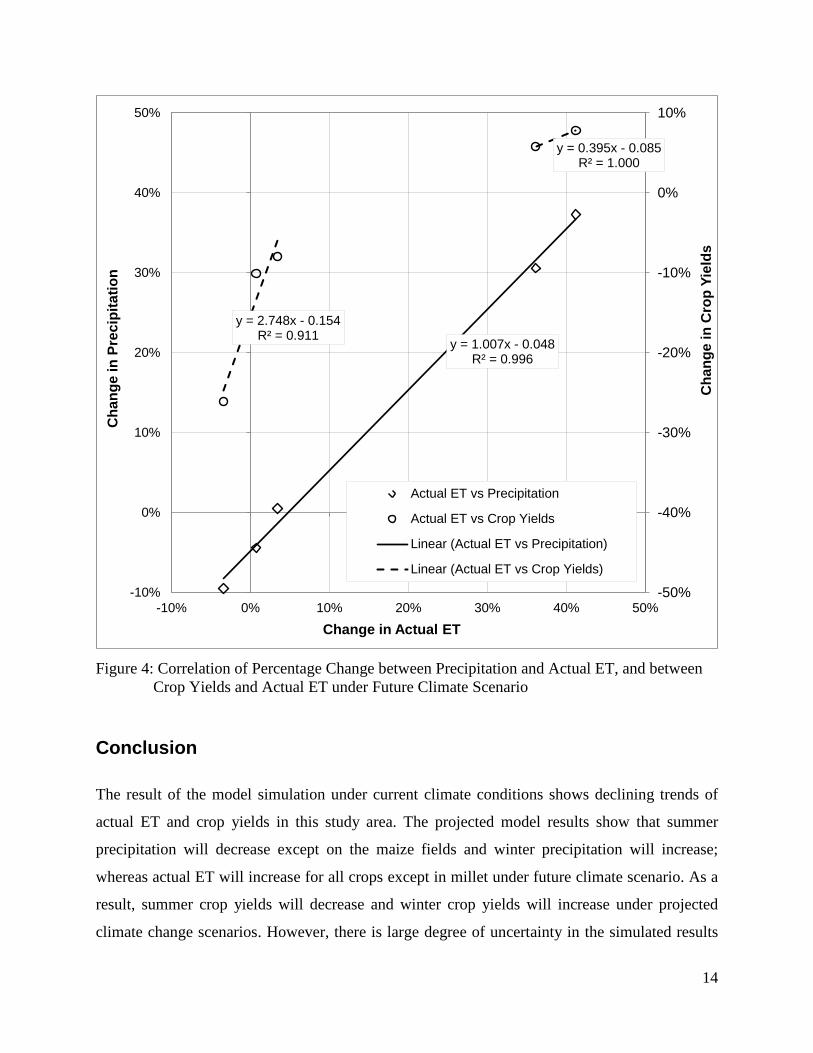
the millet fields. The linear correlation will occur in the percentage change between precipitation
and actual ET; and, between crops yield and actual ET (Figure 4). However, the correlation
equations between actual ET and crop yields are different between summer and winter crop
(Figure 4). The change in surface runoff on the crop fields is presented in the Table 3. Whereas
the impact of climate change results show that crop yields from rice, maize and millet will
decrease by 10%, 7.9% and 26.1% respectively, the yield of wheat and barley will increase by
13
7.8% and 5.8% respectively under future climate. The precipitation on the summer crops will
decrease, except in maize which will impact negatively on the crop yields (Table 3). Whereas,
precipitation on the winter crops will increase and this will lead to an increase in crop yields.
Hence, the impact of climate change shows that summer crop yields will decrease and winter
crop yields will increase. Therefore, the changes in amount of precipitation will impact on the
actual ET, and then on the crop yields.
Table 3: Percentage Change in Simulated Water Balance and Crop Yields under Future Climate
Variables Summer Crop Winter Crop
Rice Maize Millet Wheat Barley
Precipitation -4.4% +0.5% -9.5% +37.3% +30.6%
Actual ET +0.7% +3.4% -3.4% +41.2% +36.2%
Surface Runoff -12.6% -6.3% -16.9% +21.9% +18.1%
Crop Yields -10.0% -7.9% -26.1% +7.8% +5.8%
14
Figure 4: Correlation of Percentage Change between Precipitation and Actual ET, and between
Crop Yields and Actual ET under Future Climate Scenario
Conclusion
The result of the model simulation under current climate conditions shows declining trends of
actual ET and crop yields in this study area. The projected model results show that summer
precipitation will decrease except on the maize fields and winter precipitation will increase;
whereas actual ET will increase for all crops except in millet under future climate scenario. As a
result, summer crop yields will decrease and winter crop yields will increase under projected
climate change scenarios. However, there is large degree of uncertainty in the simulated results
y = 1.007x - 0.048R² = 0.996
y = 2.748x - 0.154R² = 0.911
y = 0.395x - 0.085R² = 1.000
-50%
-40%
-30%
-20%
-10%
0%
10%
-10%
0%
10%
20%
30%
40%
50%
-10% 0% 10% 20% 30% 40% 50%
Cha
nge
in C
rop
Yiel
ds
Cha
nge
in P
reci
pita
tion
Change in Actual ET
Actual ET vs Precipitation
Actual ET vs Crop Yields
Linear (Actual ET vs Precipitation)
Linear (Actual ET vs Crop Yields)
15
due to disagreement among the projected future climate scenarios (Bharati et al., 2012) and this
uncertainty can reliably be reduced by using only a selection of GCMs that shows high inter-
model similarity for the current and future climate (Sperna Weiland et al., 2012).
The SWAT model is found to be a good tool to simulate the water balances and crop yields
under current and future climate scenarios. However, the model’s performance will depend on
the model inputs and availability of observed data to validate output. In this study, simulated
water balance components are more precise due to the availability of observed river flow data.
Whereas, due to unavailability of spatially coverage of crop yields data, the study is confident to
present only changes in crop yields under future climate scenario.
References
Arnold, J. G., Kiniry, J. R., Srinivasan, R., Williams, J. R., Haney, E. B., and Neitsch, S. L.
2011. Soil and Water Assessment Tool Input/Output File Documentation Version 2009.
Texas Water Resources Institute Technical Report No. 365, Texas A&M University System,
College Station, Texas.
Arnold, J. G., R. Srinivasan, R. S. Muttiah, and J. R. Williams. 1998. Large area hydrologic
modeling and assessment, Part I: Model development. Journal of the American Water
Resources Association. 34(1): 73 – 89.
Bharati, L., P. Gurung, and P. Jayakody. 2012. Hydrologic Characterization of the Koshi Basin
and the Impact of Climate Change. Hydro Nepal: Journal of Water, Energy and
Environment. Special issue on “Proceedings of National Conference on Water, Food
Security and Climate Change in Nepal”. 23 – 29.
Hua, O. 2009. The Himalayas - water storage under threat. Water Storage - A strategy for
climate change adaptation in the Himalayas. Sustainable Mountain Development No. 56,
ICIMOD. 3 - 5.
IPCC. 2007. Climate Change 2007: Impacts, Adaptation and Vulnerability, Contribution of
Working Group II to the Fourth Assessment Report of the Intergovernmental Panel on
Climate Change. Cambridge, UK: Cambridge University Press.
16
IPCC. 2001. J. McCarthy; O. Canziani ; N. Leary ; D. Dokken and K. White (eds) in Cimate
Change 2001: Impacts, Adaptation and Vulnareability. Cambridge: Cambridge University
Press.
Karki, S. 2012. Application of uncertainty analysis techniques to SWAT model: a case study of
West Seti River basin, Nepal. MSc thesis. Department of Civil Engineering, Institute of
Engineering, Pulchowk Campus, Tribhuvan University, Nepal.
Liu, Y.B., and F. De Smedt. 2004. WetSpa Extension, Documentation and User Manual.
Department of Hydrology and Hydraulic Engineering, Vrije Universiteit Brussel, Belgium.
108p.
Moriasi, D.N., J. G. Arnold, M. W. van Liew, R. L. Bingner, R. D. Harmel, and T. L. Veith.
2007. Model Evaluation Guidelines for Systematic Quantification of Accuracy in Watershed
Simulations. American Society of Agricultural and Biological Engineers. 50(3): 885-900.
MoAC. 2005. Statistical Information on Nepalese Agriculture (Time Series Information). Agri
Statistics Section, Agri-Business Promotion and Statistics Division, Ministry of Agriculture
and Co-operatives (MoAC), Government of Nepal.
Neitsch, S.L., J. G. Arnold, J. R. Kiniry, and J. R. Williams. 2011. Soil and Water Assessment
Tool Theoretical Documentation Version 2009. Texas Water Resources Institute Technical
Report No. 406, Texas A&M University System, College Station, Texas.
Sayari, N., M. Bannayan, A. Farid, A. Alizadeh, and M. R. H. Kermani. 2011. Crop Water
Consumption and Crop Yield Prediction under Climate Change Conditions at Northest of
Iran. International Conference on Environmental and Computer Science. IACSIT Press,
Singapore. IPCBEE. 19: 112 – 117.
Shrestha, N., D. Raes, E. Vanuytrecht, and S. K. Sah, S.K. 2013. Cereal yield stabilization in
Terai (Nepal) by water and soil fertility management modeling. Agricultural Water
Management. 122: 53 – 62.
Siddiqui, S., L. Bharati, M. Panta, P. Gurung, B. Rakhal, and L. D. Maharjan. 2012. Nepal:
Building Climate Resilience in Watersheds in Mountain Eco-Regions. Technical Assistance
Consultant’s Report for Department of Soil Conservation and Watershed Management
(DSCWM), Government of Nepal. International Water Management Institute (IWMI).
17
Sperna Weiland, F. C., L. P. H. van Beek, A. H. Weerts, and M. F. P. Bierkens. 2012. Extracting
information from an ensemble of GCMs to reliably assess future global runoff change.
Journal of Hydrology. 412-413: 66 – 75.
Srinivasan, R., T. S. Ramanarayanan, J. G. Arnold, and S. T. Bednarz. 1998. Large area
hydrologic modeling and assessment Part II: Model application. Journal of the American
Water Resources Association. 34(1): 91 – 101.
WECS. 2011. Water resources of Nepal in the context of climate change. Water and Energy
Commission Secretariat, Government of Nepal, Kathmandu, Nepal.