Potential state shifts in terrestrial ecosystems related to ...
Upload
independentCategory
view
0download
0
Global Environmental Change 9 (1999) S21}S30
Climate change impacts on ecosystems and the terrestrial carbon sink:a new assessment
Andrew White*, Melvin G.R. Cannell, Andrew D. Friend1
Institute of Terrestrial Ecology, Bush Estate, Penicuik, Midlothian EH26 0QB, UK
Received 21 May 1999
Abstract
Climate output from the UK Hadley Centre's HadCM2 and HadCM3 experiments for the period 1860 to 2100, with IS92agreenhouse gas forcing, together with predicted patterns of N deposition and increasing CO
2, were input (o%ine) to the dynamic
vegetation model, Hybrid v4.1 (Friend et al., 1997; Friend and White, 1999). This model represents biogeochemical, biophysical andbiogeographical processes, coupling the carbon, nitrogen and water cycles on a sub-daily timestep, simulating potential vegetationand transient changes in annual growth and competition between eight generalized plant types in response to climate.
Global vegetation carbon was predicted to rise from about 600 to 800 PgC (or to 650 PgC for HadCM3) while the soil carbon poolof about 1100 PgC decreased by about 8%. By the 2080s, climate change caused a partial loss of Amazonian rainforest, C
4grasslands
and temperate forest in areas of southern Europe and eastern USA, but an expansion in the boreal forest area. These changes wereaccompanied by a decrease in net primary productivity (NPP) of vegetation in many tropical areas, southern Europe and eastern USA(in response to warming and a decrease in rainfall), but an increase in NPP of boreal forests. Global NPP increased from 45 to50 PgC y~1 in the 1990s to about 65 PgC y~1 in the 2080s (about 58 PgC y~1 for HadCM3). Global net ecosystem productivity(NEP) increased from about 1.3 PgC y~1 in the 1990s to about 3.6 PgC y~1 in the 2030s and then declined to zero by 2100 owing toa loss of carbon from declining forests in the tropics and at warm temperate latitudes* despite strengthening of the carbon sink atnorthern high latitudes. HadCM3 gave a more erratic temporal evolution of NEP than HadCM2, with a dramatic collapse in NEP inthe 2050s. ( 1999 Elsevier Science Ltd. All rights reserved.
Keywords: Carbon sink; Climate change; Elevated CO2
1. Introduction
In Article 2 of the Framework Convention on ClimateChange (FCCC), climate change is considered &danger-ous', and thus to be avoided, if it is likely to cause damageto global ecosystems. In this paper we o!er a new assess-ment of the e!ects of climate change on the geographicdistribution of ecosystems, their productivities and theirroles as carbon sinks. Climate change which caused thedisappearance or reversal of the putative terrestrial car-bon sink of about 1.6 Pg y~1 (Houghton et al., 1998)would of itself constitute a dangerous positive feedbackto the climate system, so we pay special attention to
*Corresponding author. Current address: Department of Mathe-matics, Heriot-Watt University, Edinburgh EH14 4AS, UK.
E-mail address: [email protected] (A. White)1Andrew Friend is currently located at the NASA-GISS in New
York.
changes in the amount of carbon stored in global vegeta-tion and soils.
It is only in the last few years that it has been possibleto estimate the impact of climate change on ecosystems ina reliable and meaningful way. First, it required thedevelopment of &dynamic global vegetation models'(DGVMs) which couple plant}soil carbon, N and watercycles, which include atmosphere}vegetation interac-tions and represent competitive processes that determinetransient shifts in vegetation types and properties (Hurttet al., 1998). Hybrid v4.1 is one of a few DGVMs whichful"ls those requirements (Friend et al., 1997; Crameret al., 1999). Second, it required transient output fromGCMs, which has only recently become available (Xiaoet al., 1998; Foley et al., 1998). And thirdly, it has beenincreasingly apparent that consideration has to be givento the controversial role of atmospheric N deposition(Hudson et al., 1994; Townsend et al., 1996; Hollandet al., 1997; Nadelho!er et al., 1999).
0959-3780/99/$ - see front matter ( 1999 Elsevier Science Ltd. All rights reserved.PII: S 0 9 5 9 - 3 7 8 0 ( 9 9 ) 0 0 0 1 6 - 3
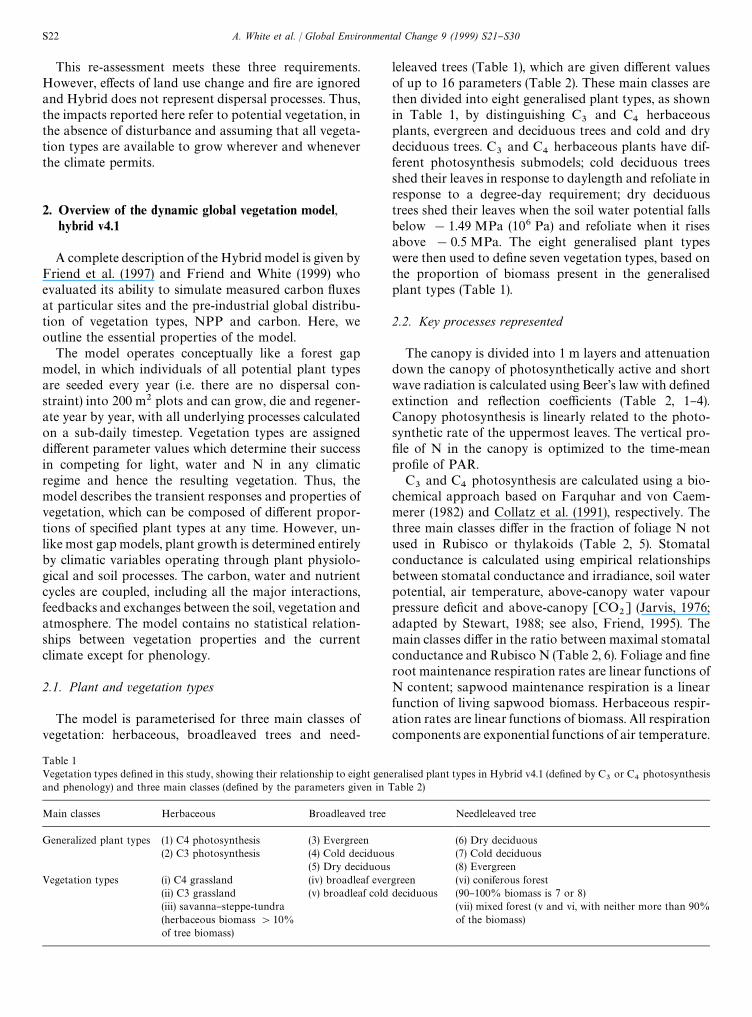
Table 1Vegetation types de"ned in this study, showing their relationship to eight generalised plant types in Hybrid v4.1 (de"ned by C
3or C
4photosynthesis
and phenology) and three main classes (de"ned by the parameters given in Table 2)
Main classes Herbaceous Broadleaved tree Needleleaved tree
Generalized plant types (1) C4 photosynthesis (3) Evergreen (6) Dry deciduous(2) C3 photosynthesis (4) Cold deciduous (7) Cold deciduous
(5) Dry deciduous (8) EvergreenVegetation types (i) C4 grassland (iv) broadleaf evergreen (vi) coniferous forest
(ii) C3 grassland (v) broadleaf cold deciduous (90}100% biomass is 7 or 8)(iii) savanna}steppe-tundra(herbaceous biomass '10%of tree biomass)
(vii) mixed forest (v and vi, with neither more than 90%of the biomass)
This re-assessment meets these three requirements.However, e!ects of land use change and "re are ignoredand Hybrid does not represent dispersal processes. Thus,the impacts reported here refer to potential vegetation, inthe absence of disturbance and assuming that all vegeta-tion types are available to grow wherever and wheneverthe climate permits.
2. Overview of the dynamic global vegetation model,hybrid v4.1
A complete description of the Hybrid model is given byFriend et al. (1997) and Friend and White (1999) whoevaluated its ability to simulate measured carbon #uxesat particular sites and the pre-industrial global distribu-tion of vegetation types, NPP and carbon. Here, weoutline the essential properties of the model.
The model operates conceptually like a forest gapmodel, in which individuals of all potential plant typesare seeded every year (i.e. there are no dispersal con-straint) into 200 m2 plots and can grow, die and regener-ate year by year, with all underlying processes calculatedon a sub-daily timestep. Vegetation types are assigneddi!erent parameter values which determine their successin competing for light, water and N in any climaticregime and hence the resulting vegetation. Thus, themodel describes the transient responses and properties ofvegetation, which can be composed of di!erent propor-tions of speci"ed plant types at any time. However, un-like most gap models, plant growth is determined entirelyby climatic variables operating through plant physiolo-gical and soil processes. The carbon, water and nutrientcycles are coupled, including all the major interactions,feedbacks and exchanges between the soil, vegetation andatmosphere. The model contains no statistical relation-ships between vegetation properties and the currentclimate except for phenology.
2.1. Plant and vegetation types
The model is parameterised for three main classes ofvegetation: herbaceous, broadleaved trees and need-
leleaved trees (Table 1), which are given di!erent valuesof up to 16 parameters (Table 2). These main classes arethen divided into eight generalised plant types, as shownin Table 1, by distinguishing C
3and C
4herbaceous
plants, evergreen and deciduous trees and cold and drydeciduous trees. C
3and C
4herbaceous plants have dif-
ferent photosynthesis submodels; cold deciduous treesshed their leaves in response to daylength and refoliate inresponse to a degree-day requirement; dry deciduoustrees shed their leaves when the soil water potential fallsbelow !1.49 MPa (106 Pa) and refoliate when it risesabove !0.5 MPa. The eight generalised plant typeswere then used to de"ne seven vegetation types, based onthe proportion of biomass present in the generalisedplant types (Table 1).
2.2. Key processes represented
The canopy is divided into 1 m layers and attenuationdown the canopy of photosynthetically active and shortwave radiation is calculated using Beer's law with de"nedextinction and re#ection coe$cients (Table 2, 1}4).Canopy photosynthesis is linearly related to the photo-synthetic rate of the uppermost leaves. The vertical pro-"le of N in the canopy is optimized to the time-meanpro"le of PAR.
C3
and C4
photosynthesis are calculated using a bio-chemical approach based on Farquhar and von Caem-merer (1982) and Collatz et al. (1991), respectively. Thethree main classes di!er in the fraction of foliage N notused in Rubisco or thylakoids (Table 2, 5). Stomatalconductance is calculated using empirical relationshipsbetween stomatal conductance and irradiance, soil waterpotential, air temperature, above-canopy water vapourpressure de"cit and above-canopy [CO
2] (Jarvis, 1976;
adapted by Stewart, 1988; see also, Friend, 1995). Themain classes di!er in the ratio between maximal stomatalconductance and Rubisco N (Table 2, 6). Foliage and "neroot maintenance respiration rates are linear functions ofN content; sapwood maintenance respiration is a linearfunction of living sapwood biomass. Herbaceous respir-ation rates are linear functions of biomass. All respirationcomponents are exponential functions of air temperature.
S22 A. White et al. / Global Environmental Change 9 (1999) S21}S30

Table 2Parameters used to de"ne the three main classes of plants in Hybrid v4.1 (Friend et al., 1997)
Parameter Herbaceous Broadleaf tree Needleleaf tree Units
1. Shortwave irradiance extinction coe$cient 0.48 0.48 0.48 dimensionless2. Shortwave irradiance re#ection coe$cient 0.20 0.20 0.11 fraction3. Photosynthetically active irradiance extinction coe$cient 0.65 0.65 0.50 dimensionless4. Photosynthetically active irradiance re#ection coe$cient 0.05 0.05 0.03 fraction5. Fraction of foliage N not used in Rubisco or thylakoids 0.67 0.67 0.83 fraction6. Ratio between max. stomatal conductance and Rubisco nitrogen 1359 1670 2220 mol(H
2O)
m~2 s~1/(kg(RubiscoN) m~2)
7. Ratio of bark thickness to D (diameter) * 0.033 0.03 m m~1
8. Tree form factor (used for calculating woody carbon mass) * 0.60 0.56 dimensionless9. Allometry coe$cient for H (height) from D (diameter) * 28.51 32.95 m~1
10. Allometry exponent for H (height) from D (diameter) * 0.467 0.588 dimensionless11. Fraction of wood plus bark below ground * 0.220 0.222 fraction12. Mean wood plus bark density * 305 205 kg C m~3
13. Maximum foliage to sapwood area ratio * 4170 3330 m2 m~2
14. Fraction of sapwood alive * 0.1700 0.0708 fraction15. Speci"c leaf area 36 36 12 m2 kg C~1
16. Turnover rate of foliage 1.13 1.00 0.33 fraction y~1
Trees are assigned initial diameters, which then deter-mine the leaf area index and biomass of tree parts accord-ing to allometric relationships (Shinozaki et al., 1964;Friend et al., 1997). Wood cross-sectional area at breastheight is calculated assuming a ratio of diameter at breastheight to bark thickness (Table 2, 7). Woody biomass isthen calculated using a form factor (Table 2, 8), cal-culated tree height (Table 2, 9 and 10), a proportion ofwoody biomass below ground (Table 2, 11) and woodspeci"c gravity (Table 2, 12). There are also de"nedvalues for ratio of foliage to sapwood area, fraction of livesapwood, speci"c leaf area and turnover rate of foliage(Table 2, 13}16).
N uptake is a function of "ne root biomass, plant C : Nratio, soil surface temperature and soil mineral N, whichincludes N biologically "xed and deposited from theatmosphere. Trees have access to all mineral N, whereasthe herbaceous layer has access to only a fraction, givenby the ratio of the soil water holding capacity of the toptwo hydrological layers over the total capacity for allthree layers.
For trees, the maximum possible foliage and "neroot C and N contents are calculated at the beginning ofthe year. During the year, litter C and N are lost fromthese components (di!erent tree species are assumed tohave the same "ne root turnover but di!erent foliageturnover rates, Table 2), and if su$cient storage isavailable they are restored to their maximum values. Ifthe lowest 1m of the crown experiences a negative Cbalance then the maximum foliage area in the next year isgiven by the amount of foliage displayed above thelowest layer and the height to the base of the crown
is increased by 1m. Also, since the foliage to sapwoodarea is "xed, when trees experience a negative Cbalance at the base of their crowns some sapwood will beconverted to heartwood. A "xed ratio between foliagemass and "ne root mass, and a "xed fraction of woodytissue below ground are also assumed (Friend et al.,1997).
For herbs and grasses, C and N litter production iscalculated as a "xed fraction of the foliage, structural and"ne root compartments. Allocation of C is parameterisedto maintain "xed ratios between these compartments. Ifthe lowest 10% of foliage has a net negative C balance onthe previous day, then the new foliage area is limited toa maximum of 90% of its previous value. Any C remain-ing after allocation is added to a storage pool. N isallocated to maintain "xed relative C : N ratios betweenthe three tissue compartments.
The daytime energy balance of the canopy is solvedto calculate the rate of transpiration and foliage tem-perature. Interception loss is calculated. The soil Cand N dynamics model is based on Century (Parton etal., 1993) as formulated by Comins and McMurtrie(1993). The soil is divided into three layers: 0}5 cm,5}20 cm and 20}100 cm depth. Herbaceous vegetationhas access to water and N in the top two layers, whereastrees can access all layers. The total soil water holdingcapacity is determined from soil carbon. A soil temper-ature pro"le is used to calculate the depth of frozen soil,with all water below this depth assumed frozen, andtherefore unavailable and forming an increased resist-ance to drainage (Wang and Polglase, 1995; White et al.,1999).
A. White et al. / Global Environmental Change 9 (1999) S21}S30 S23
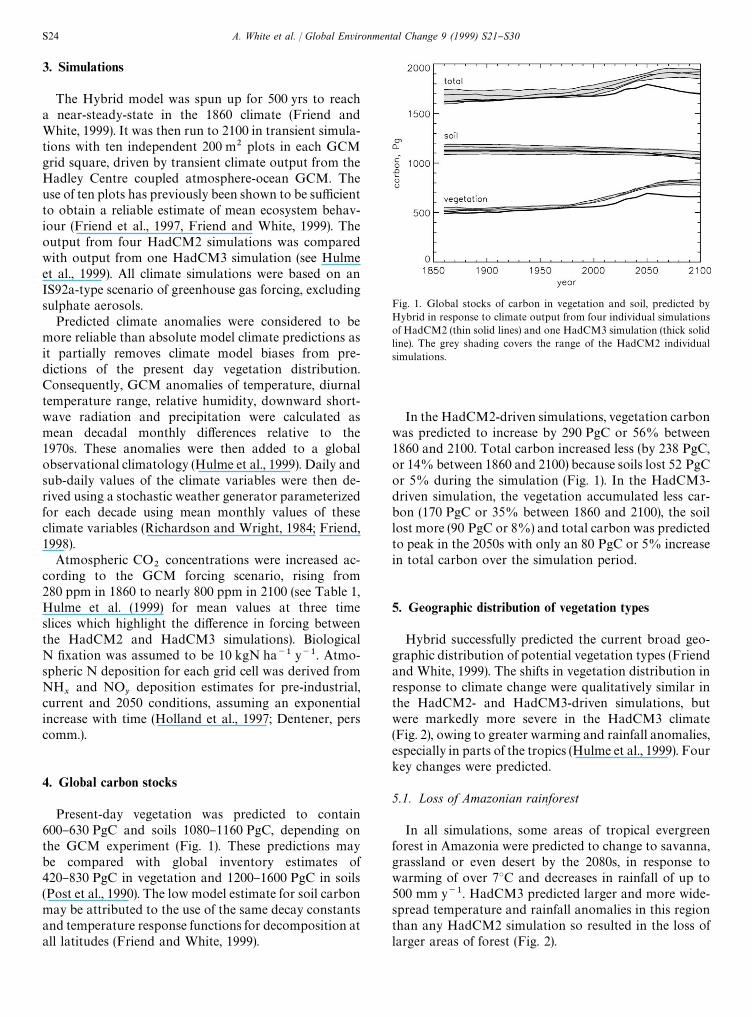
Fig. 1. Global stocks of carbon in vegetation and soil, predicted byHybrid in response to climate output from four individual simulationsof HadCM2 (thin solid lines) and one HadCM3 simulation (thick solidline). The grey shading covers the range of the HadCM2 individualsimulations.
3. Simulations
The Hybrid model was spun up for 500 yrs to reacha near-steady-state in the 1860 climate (Friend andWhite, 1999). It was then run to 2100 in transient simula-tions with ten independent 200 m2 plots in each GCMgrid square, driven by transient climate output from theHadley Centre coupled atmosphere-ocean GCM. Theuse of ten plots has previously been shown to be su$cientto obtain a reliable estimate of mean ecosystem behav-iour (Friend et al., 1997, Friend and White, 1999). Theoutput from four HadCM2 simulations was comparedwith output from one HadCM3 simulation (see Hulmeet al., 1999). All climate simulations were based on anIS92a-type scenario of greenhouse gas forcing, excludingsulphate aerosols.
Predicted climate anomalies were considered to bemore reliable than absolute model climate predictions asit partially removes climate model biases from pre-dictions of the present day vegetation distribution.Consequently, GCM anomalies of temperature, diurnaltemperature range, relative humidity, downward short-wave radiation and precipitation were calculated asmean decadal monthly di!erences relative to the1970s. These anomalies were then added to a globalobservational climatology (Hulme et al., 1999). Daily andsub-daily values of the climate variables were then de-rived using a stochastic weather generator parameterizedfor each decade using mean monthly values of theseclimate variables (Richardson and Wright, 1984; Friend,1998).
Atmospheric CO2
concentrations were increased ac-cording to the GCM forcing scenario, rising from280 ppm in 1860 to nearly 800 ppm in 2100 (see Table 1,Hulme et al. (1999) for mean values at three timeslices which highlight the di!erence in forcing betweenthe HadCM2 and HadCM3 simulations). BiologicalN "xation was assumed to be 10 kgN ha~1 y~1. Atmo-spheric N deposition for each grid cell was derived fromNH
xand NO
ydeposition estimates for pre-industrial,
current and 2050 conditions, assuming an exponentialincrease with time (Holland et al., 1997; Dentener, perscomm.).
4. Global carbon stocks
Present-day vegetation was predicted to contain600}630 PgC and soils 1080}1160 PgC, depending onthe GCM experiment (Fig. 1). These predictions maybe compared with global inventory estimates of420}830 PgC in vegetation and 1200}1600 PgC in soils(Post et al., 1990). The low model estimate for soil carbonmay be attributed to the use of the same decay constantsand temperature response functions for decomposition atall latitudes (Friend and White, 1999).
In the HadCM2-driven simulations, vegetation carbonwas predicted to increase by 290 PgC or 56% between1860 and 2100. Total carbon increased less (by 238 PgC,or 14% between 1860 and 2100) because soils lost 52 PgCor 5% during the simulation (Fig. 1). In the HadCM3-driven simulation, the vegetation accumulated less car-bon (170 PgC or 35% between 1860 and 2100), the soillost more (90 PgC or 8%) and total carbon was predictedto peak in the 2050s with only an 80 PgC or 5% increasein total carbon over the simulation period.
5. Geographic distribution of vegetation types
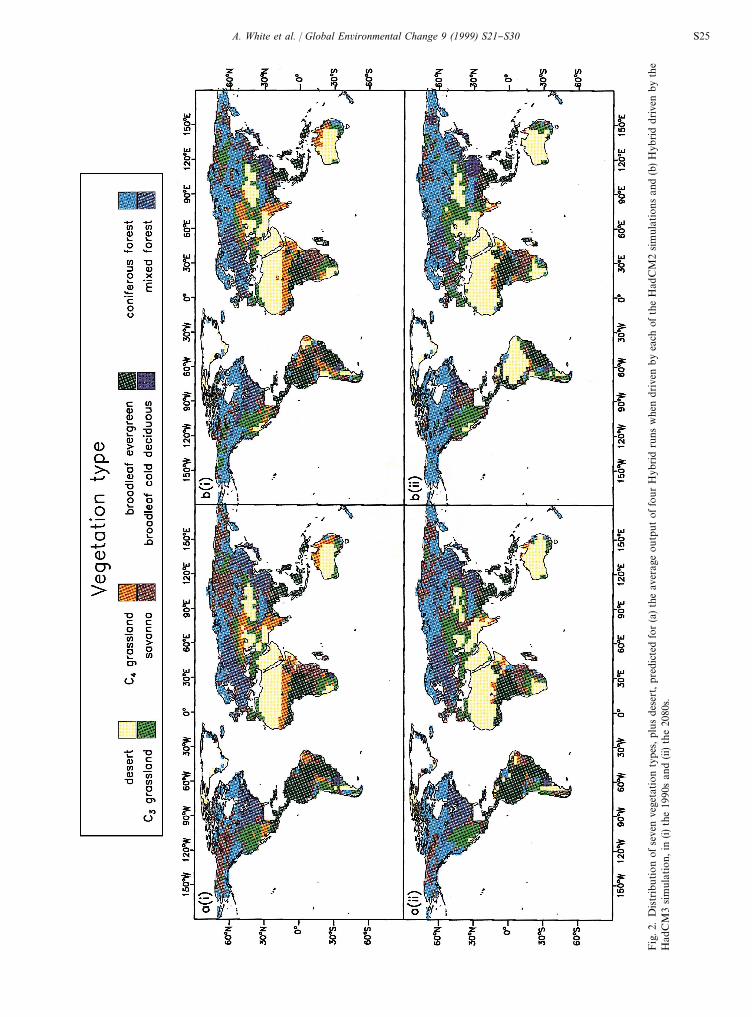
Hybrid successfully predicted the current broad geo-graphic distribution of potential vegetation types (Friendand White, 1999). The shifts in vegetation distribution inresponse to climate change were qualitatively similar inthe HadCM2- and HadCM3-driven simulations, butwere markedly more severe in the HadCM3 climate(Fig. 2), owing to greater warming and rainfall anomalies,especially in parts of the tropics (Hulme et al., 1999). Fourkey changes were predicted.
5.1. Loss of Amazonian rainforest
In all simulations, some areas of tropical evergreenforest in Amazonia were predicted to change to savanna,grassland or even desert by the 2080s, in response towarming of over 73C and decreases in rainfall of up to500 mm y~1. HadCM3 predicted larger and more wide-spread temperature and rainfall anomalies in this regionthan any HadCM2 simulation so resulted in the loss oflarger areas of forest (Fig. 2).
S24 A. White et al. / Global Environmental Change 9 (1999) S21}S30
Fig
.2.
Distr
ibution
ofse
ven
vege
tation
type
s,plu
sdes
ert,
pred
icte
dfo
r(a
)th
eav
erag
eou
tputoffo
ur
Hyb
rid
runs
whe
ndr
iven
by
each
ofth
eH
adC
M2
sim
ula
tion
san
d(b
)H
ybrid
drive
nby
the
Had
CM
3sim
ulat
ion,i
n(i)th
e19
90s
and
(ii)th
e20
80s.
A. White et al. / Global Environmental Change 9 (1999) S21}S30 S25

Fig. 3. Global annual net primary productivity (NPP), predicted byHybrid in response to climate output from four individual simulationsof HadCM2 (thin solid lines) and one HadCM3 simulation (thick solidline). The grey shading covers the range of the HadCM2 individualsimulation.
5.2. Loss of C4 tropical grasslands
In all simulations, large areas of tropical C4
grasslands(e.g. in the Sahel, India and Australia) were lost to desertby the 2080s in response to warming, increasing CO
2and
decreased rainfall, or superceded by C3
grasslands whererainfall increased (Fig. 2).
5.3. Loss of temperate forests
In the HadCM3-driven simulation, annual precipita-tion decreases of up to 200 mm y~1 resulted in the con-version of large areas of temperate forest to grassland orsavanna in southern Europe and eastern USA. Precipita-tion anomalies were not large enough in the HadCM2simulations to bring about any large loss of temperateforests (Fig. 2).
5.4. Expansion of boreal forests
In all simulations, needleleaved boreal forest extendednorthwards in response to warming, with a loss of tundra(see also White et al., 1999) and southwards in Asia inresponse to increased precipitation.
6. Global net primary productivity
Present-day global NPP was predicted to be in therange 46.6}49.5 PgC y~1 (Fig. 3) at the low end of therange estimated by others (48.3}67.6 PgC y~1; Fieldet al., 1998; 44.4}66.3 PgC y~1; Cramer et al., 1999). Lowpredicted NPP values could be attributed to somewhatlow values of short-wave radiation, which were derivedfrom cloud cover in the global observational climatology(Hulme et al., 1999). Over the period 1860}2100, globalNPP increased by 23.3 PgC y~1 or 56% in the HadCM2driven simulations and by 17.5 PgC y~1 or 43% in theHadCM3-driven simulation (Fig. 3). For the HadCM3climate, NPP did not increase consistently after the2020s. It may be noted that the shapes of the NPP curvesin Fig. 3 are similar to those for vegetation carbon inFig. 1.
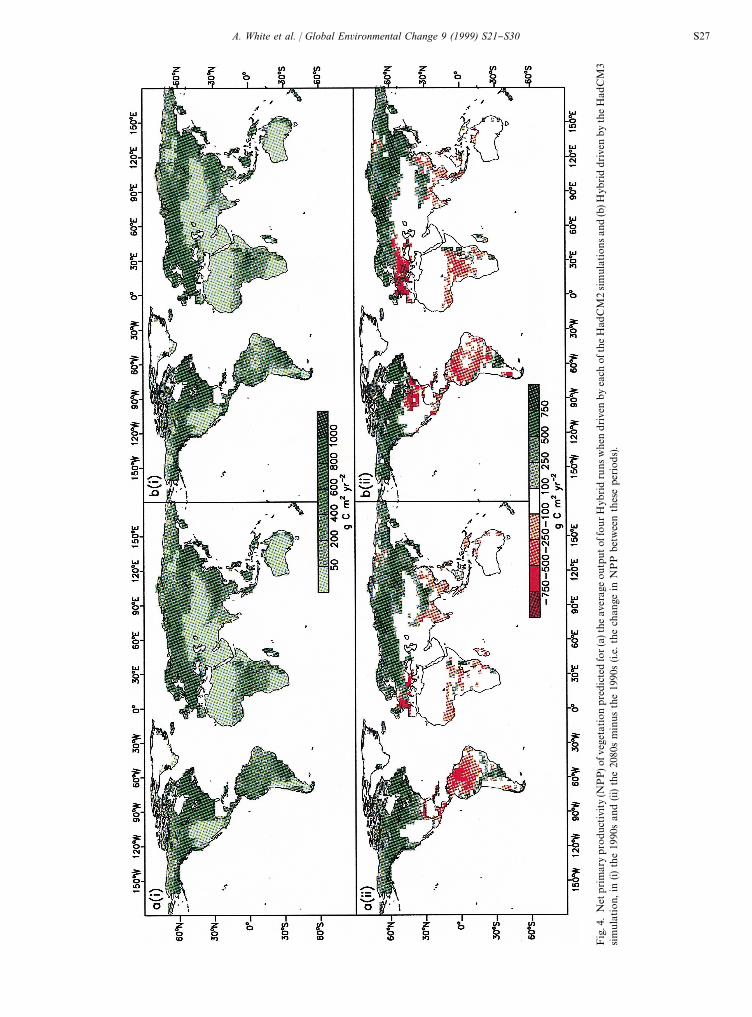
The pre-industrial geographic distribution of NPP wassimulated reasonably successfully (Fig. 4; Friend andWhite, 1999). Over the period 1990-2080, the NPP ofnorthern forests increased markedly in response towarming, increased CO
2and, in some areas, increased
precipitation. By contrast, NPP decreased in southernEurope, eastern USA and in many areas of the tropics(Fig. 4). Areas with a large drop in NPP corresponded toareas where forests declined and were transformed tosavanna, grassland or desert (Fig. 2). It should be notedthat the HadCM3 simulation predicted anomalously lowrainfall and high temperatures in Amazonia in the 1990s,giving rise to low NPPs, so that the decrease in NPP
between the 1990s the 2080s was anomalously small,although the forest was replaced by grassland or desertover this period.
7. Global net ecosystem productivity
NEP is the di!erence between NPP and heterotrophic(soil) respiration ! the rate of change of stored carbonor net #ux of carbon between the land and atmosphere.
In the HadCM2-driven simulations, NEP increasedafter about 1970 to 0.6}1.8 PgC y~1 in the 1990s, to2.5}4.5 PgC y~1 in the 2030s and then fell to below zeroby 2100 (Fig. 5). Thus, Hybrid predicted a growing terres-trial carbon sink, roughly in line with inventory anddeconvolution estimates (Houghton et al., 1998) buta collapse and reversal of this sink during the next cen-tury. The HadCM3-driven simulation predicted an an-omalous drop in NEP in the 1980}1990s, caused by lowrainfall and warming in parts of the tropics, and amuch more dramatic drop in NEP in the 2050s thanoccurred in HadCM2 driven simulations. In all cases,decreases in NEP were associated with the decline ordeath of areas of tropical and/or temperate forests, asstated above (Fig. 2).
The latitudinally resolved predictions of NEP showwhere the carbon sinks and sources were located overtime (Fig. 6). The HadCM2-driven simulations predictedthat the current sink is located at 30}603N and 0}153S,that is, in both the northern and tropical forests. Thenorthern sink strengthened throughout the simulation,whereas the tropical sink peaked in the 2030s andbecame increasingly negative after the 2050s. TheHadCM3-driven simulation predicted that the northern
S26 A. White et al. / Global Environmental Change 9 (1999) S21}S30
Fig
.4.
Net
prim
ary
pro
duc
tivi
ty(N
PP)o
fveg
etat
ion
pre
dict
edfo
r(a
)the
aver
age
outp
utof
four
Hyb
rid
runs
when
driv
enby
each
ofth
eH
adC
M2
sim
ulat
ionsan
d(b
)Hyb
rid
driv
enby
theH
adC
M3
sim
ula
tion
,in
(i)th
e19
90s
and
(ii)
the
2080
sm
inus
the
1990
s(i.e.t
hech
ange
inN
PP
betw
een
thes
epe
riod
s).
A. White et al. / Global Environmental Change 9 (1999) S21}S30 S27
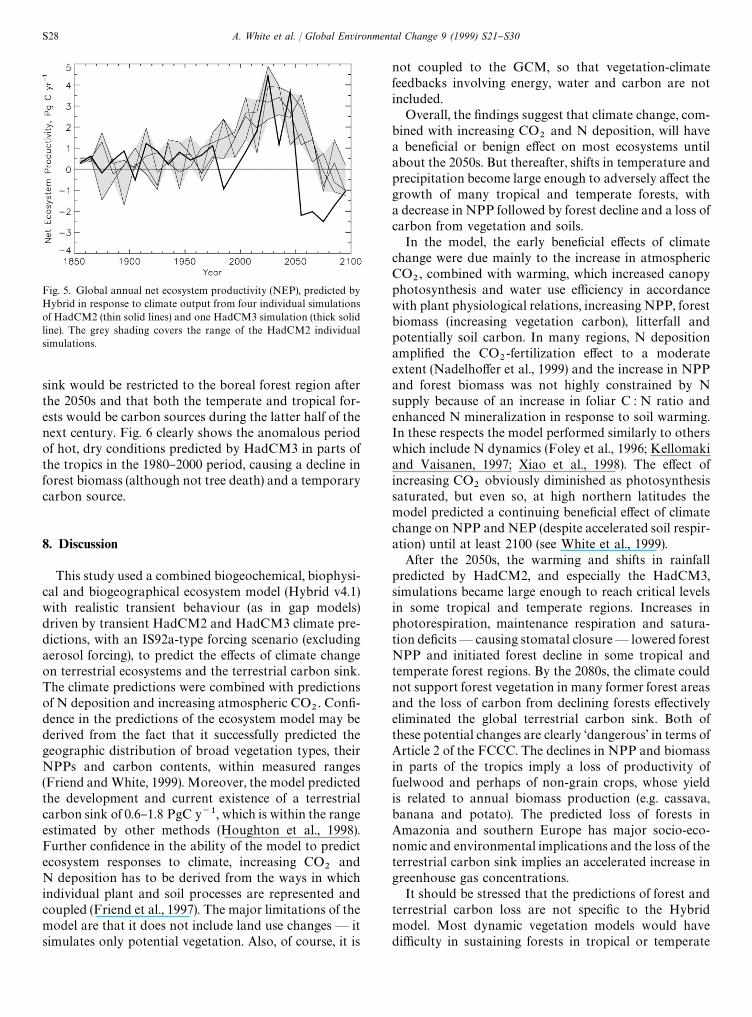
Fig. 5. Global annual net ecosystem productivity (NEP), predicted byHybrid in response to climate output from four individual simulationsof HadCM2 (thin solid lines) and one HadCM3 simulation (thick solidline). The grey shading covers the range of the HadCM2 individualsimulations.
sink would be restricted to the boreal forest region afterthe 2050s and that both the temperate and tropical for-ests would be carbon sources during the latter half of thenext century. Fig. 6 clearly shows the anomalous periodof hot, dry conditions predicted by HadCM3 in parts ofthe tropics in the 1980}2000 period, causing a decline inforest biomass (although not tree death) and a temporarycarbon source.
8. Discussion
This study used a combined biogeochemical, biophysi-cal and biogeographical ecosystem model (Hybrid v4.1)with realistic transient behaviour (as in gap models)driven by transient HadCM2 and HadCM3 climate pre-dictions, with an IS92a-type forcing scenario (excludingaerosol forcing), to predict the e!ects of climate changeon terrestrial ecosystems and the terrestrial carbon sink.The climate predictions were combined with predictionsof N deposition and increasing atmospheric CO
2. Con"-
dence in the predictions of the ecosystem model may bederived from the fact that it successfully predicted thegeographic distribution of broad vegetation types, theirNPPs and carbon contents, within measured ranges(Friend and White, 1999). Moreover, the model predictedthe development and current existence of a terrestrialcarbon sink of 0.6}1.8 PgC y~1, which is within the rangeestimated by other methods (Houghton et al., 1998).Further con"dence in the ability of the model to predictecosystem responses to climate, increasing CO
2and
N deposition has to be derived from the ways in whichindividual plant and soil processes are represented andcoupled (Friend et al., 1997). The major limitations of themodel are that it does not include land use changes* itsimulates only potential vegetation. Also, of course, it is
not coupled to the GCM, so that vegetation-climatefeedbacks involving energy, water and carbon are notincluded.
Overall, the "ndings suggest that climate change, com-bined with increasing CO
2and N deposition, will have
a bene"cial or benign e!ect on most ecosystems untilabout the 2050s. But thereafter, shifts in temperature andprecipitation become large enough to adversely a!ect thegrowth of many tropical and temperate forests, witha decrease in NPP followed by forest decline and a loss ofcarbon from vegetation and soils.
In the model, the early bene"cial e!ects of climatechange were due mainly to the increase in atmosphericCO
2, combined with warming, which increased canopy
photosynthesis and water use e$ciency in accordancewith plant physiological relations, increasing NPP, forestbiomass (increasing vegetation carbon), litterfall andpotentially soil carbon. In many regions, N depositionampli"ed the CO
2-fertilization e!ect to a moderate
extent (Nadelho!er et al., 1999) and the increase in NPPand forest biomass was not highly constrained by Nsupply because of an increase in foliar C : N ratio andenhanced N mineralization in response to soil warming.In these respects the model performed similarly to otherswhich include N dynamics (Foley et al., 1996; Kellomakiand Vaisanen, 1997; Xiao et al., 1998). The e!ect ofincreasing CO
2obviously diminished as photosynthesis
saturated, but even so, at high northern latitudes themodel predicted a continuing bene"cial e!ect of climatechange on NPP and NEP (despite accelerated soil respir-ation) until at least 2100 (see White et al., 1999).
After the 2050s, the warming and shifts in rainfallpredicted by HadCM2, and especially the HadCM3,simulations became large enough to reach critical levelsin some tropical and temperate regions. Increases inphotorespiration, maintenance respiration and satura-tion de"cits* causing stomatal closure* lowered forestNPP and initiated forest decline in some tropical andtemperate forest regions. By the 2080s, the climate couldnot support forest vegetation in many former forest areasand the loss of carbon from declining forests e!ectivelyeliminated the global terrestrial carbon sink. Both ofthese potential changes are clearly &dangerous' in terms ofArticle 2 of the FCCC. The declines in NPP and biomassin parts of the tropics imply a loss of productivity offuelwood and perhaps of non-grain crops, whose yieldis related to annual biomass production (e.g. cassava,banana and potato). The predicted loss of forests inAmazonia and southern Europe has major socio-eco-nomic and environmental implications and the loss of theterrestrial carbon sink implies an accelerated increase ingreenhouse gas concentrations.
It should be stressed that the predictions of forest andterrestrial carbon loss are not speci"c to the Hybridmodel. Most dynamic vegetation models would havedi$culty in sustaining forests in tropical or temperate
S28 A. White et al. / Global Environmental Change 9 (1999) S21}S30
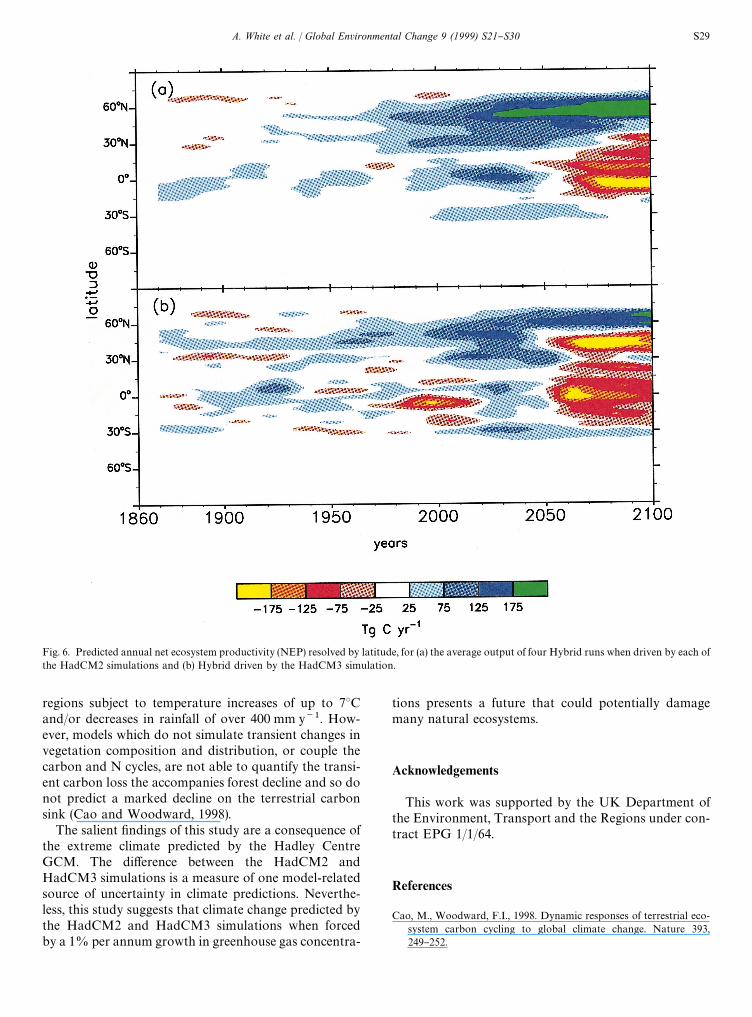
Fig. 6. Predicted annual net ecosystem productivity (NEP) resolved by latitude, for (a) the average output of four Hybrid runs when driven by each ofthe HadCM2 simulations and (b) Hybrid driven by the HadCM3 simulation.
regions subject to temperature increases of up to 73Cand/or decreases in rainfall of over 400 mm y~1. How-ever, models which do not simulate transient changes invegetation composition and distribution, or couple thecarbon and N cycles, are not able to quantify the transi-ent carbon loss the accompanies forest decline and so donot predict a marked decline on the terrestrial carbonsink (Cao and Woodward, 1998).
The salient "ndings of this study are a consequence ofthe extreme climate predicted by the Hadley CentreGCM. The di!erence between the HadCM2 andHadCM3 simulations is a measure of one model-relatedsource of uncertainty in climate predictions. Neverthe-less, this study suggests that climate change predicted bythe HadCM2 and HadCM3 simulations when forcedby a 1% per annum growth in greenhouse gas concentra-
tions presents a future that could potentially damagemany natural ecosystems.
Acknowledgements
This work was supported by the UK Department ofthe Environment, Transport and the Regions under con-tract EPG 1/1/64.
References
Cao, M., Woodward, F.I., 1998. Dynamic responses of terrestrial eco-system carbon cycling to global climate change. Nature 393,249}252.
A. White et al. / Global Environmental Change 9 (1999) S21}S30 S29
Collatz, G.J., Ball, J.T., Grivet, C., Berry, J.A., 1991. Physiological andenvironmental regulation of stomatal conductance, photosynthesisand transpiration: a model that includes a laminar boundary layer.Agricultural and Forest Meteorology 54, 107}136.
Comins, H.N., McMurtrie, R.E., 1993. Long-term response of nutrient-limited forests to CO
2enrichment. Ecological Applications 3,
666}682.Cramer, W., Kicklighter, D.W., Bondeau, A., Moore III, B., Churkina,
G., Nemry, B., Ruimy, A., Schloss, A.L., the participants in thePotsdam NPP model intercomparison, 1999. Comparing globalmodels of terrestrial net primary productivity (NPP): overview andkey results. Global Change Biology 5, 1}15.
Farquhar, G.D., von Caemmerer, S., 1982. Modelling of photosyntheticresponse to environmental conditions. In: Lange, O., Nobel, P.,Osmond, C., Zieger, H. (Eds.), Physiological Plant Ecology II:Water Relations and Carbon Assimilation. Springer, Berlin.
Field, C.B., Behrenfeld, M.J., Randerson, J.T., Falkowski, P., 1998.Primary production of the biosphere: Integrating terrestrial andoceanic components. Science 281, 237}240.
Foley, J.A., Levis, S., Prentice, I.C., Pollard, D., Thompson, S.L., 1998.Coupling dynamic models of climate and vegetation. GlobalChange Biology 4, 561}579.
Friend, A.D., 1995. PGEN: an integrated model of leaf photo-synthesis, transpiration and conductance. Ecological Modelling 77,233}255.
Friend, A.D., 1998. Parameterisation of a global daily weather gener-ator for terrestrial ecosystem modelling. Ecological Modelling 109,121}149.
Friend, A.D., Stevens, A.K., Knox, R.G., Cannell, M.G.R., 1997. A pro-cess-based terrestrial biosphere model of ecosystem dynamics (Hy-brid v3.0). Ecological Modelling 95, 249}287.
Friend, A.D., White, A., 1999. Evaluation and analysis of a dynamicterrestrial ecosystem model under pre-industrial conditions at theglobal scale. Global Biogeochemical Cycles. (in press).
Holland, E.A., Braswell, B.H., Lamarque, J.F., Townsend, A., Sulzman,J., Muller, J.F., Dentener, F., Brasseur, G., Levy, H., Penner, J.E.,Roelofs, G.J., 1997. Variations in the predicted spatial distributionof atmospheric nitrogen deposition and their impact on carbonuptake by terrestrial ecosystems. Journal of Geophysical Research102, 15 849}15866.
Houghton, R.A., Davidson, E.A., Woodwell, G.M., 1998. Missingsinks, feedbacks and understanding the role of terrestrial ecosystemsin the global carbon balance. Global Biogeochemical Cycles 12,25}34.
Hudson, R.J.M., Gherini, S.A., Goldstein, R.A., 1994. Modeling theglobal carbon cycle: nitrogen fertilization of the terrestrial biosphereand the &missing' sink. Global Biogeochemical Cycles 8, 307}333.
Hulme, M., Mitchell, J., Ingram, M., Johns, T., New, M., Viner, D.,1999. Climate change scenarios for global impacts studies. GlobalEnvironmental Change 9, S3}S19.
Hurtt, G., Moorcroft, P.R., Pacala, S.W., Levin, S.A., 1998. Terrestrialmodels and global change: challenges for the future. Global ChangeBiology 4, 581}590.
Jarvis, P.G., 1976. The interpretation of the variations in leaf waterpotential and stomatal conductance found in canopies in the "eld.Philosophical Transactions of the Royal Society of London. SeriesB 273, 593}610.
Kellomaki, S., Vaisanen, H., 1997. Modelling the dynamics of the forestecosystem for climate change studies in the boreal conditions. Eco-logical Modelling 97, 121}140.
Nadelho!er, K.J., Emmett, B.A., Gunderson, P., Janne Kjonaas, O.,Koopmans, C.J., Schleppi, P., Tietema, A., Wright, R.F., 1999.Nitrogen deposition makes a minor contribution to carbon seques-tration in temperate forests. Nature 398, 145}147.
Parton, W.J., Scurlock, J.M.O., Ojima, D.S., Gilmanov, T.G., Scholes,R.J., Schimel, D.S., Kirchner, T., Menaut, J.C., Seastedt, T., Moya,E.G., Kamnalrut, A., Kinyamrio, J.I., 1993. Observations and mod-elling of biomass and soil organic matter dynamics for the grasslandbiome worldwide. Global Biogeochemical Cycles 7, 785}809.
Post, W.M., Peng, T.H., Emmanuel, W.R., King, A.W., Dale, V.H., DeAngelis, D.L., 1990. The global carbon cycle. American Scientist 78,310}326.
Richardson, C.W., Wright, D.A. 1984. WGEN: A Model for GeneratingDaily Weather Variables, U. S. Department of Agriculture, Agricul-tural Research Service.
Shinozaki, K., Yoda, K., Hozumi, K., Kira, T., 1964. A quantitativeanalysis of plant form } the pipe model theory. I. Basic analysis.Japanese Journal of Ecology 14, 97}105.
Stewart, J.B., 1988. Modelling surface conductance of pine forest. Agri-cultural and Forest Meteorology 43, 19}35.
Townsend, A.R., Braswell, B.H., Holland, E.A., Penner, J.E., 1996.Spatial and temporal patterns in terrestrial carbon storage due todeposition of fossil fuel nitrogen. Ecological Applications 6, 806}814.
Wang, Y.P., Polglase, P.J., 1995. Carbon balance in the tundra, borealforest and humid tropical forest during climate change: scaling upfrom leaf physiology and soil carbon dynamics. Plant, Cell andEnvironment 18, 1226}1244.
White, A., Cannell, M.G.R., Friend, A.D., 1999. The high-latitudeterrestrial carbon sink: a model analysis. Global Change Biology, inpress.
Xiao, X., Melillo, J.M., Kicklighter, D.W., McGuire, A.D., Prinn, R.G.,Wang, C., Stone, P.H., Sokolov, A., 1998. Transient climate changeand net ecosystem production of the terrestrial biosphere. GlobalBiogeochemical Cycles 12, 345}360.
S30 A. White et al. / Global Environmental Change 9 (1999) S21}S30
Copyright © 2022 FDOKUMEN