Bunch Weight Determination in Relation to the Source-Sink ...
13
Citation: Rapetti, M.; Dorel, M. Bunch Weight Determination in Relation to the Source-Sink Balance in 12 Cavendish Banana Cultivars. Agronomy 2022, 12, 333. https:// doi.org/10.3390/agronomy12020333 Academic Editor: Susanna Bartolini Received: 30 December 2021 Accepted: 25 January 2022 Published: 27 January 2022 Publisher’s Note: MDPI stays neutral with regard to jurisdictional claims in published maps and institutional affil- iations. Copyright: © 2022 by the authors. Licensee MDPI, Basel, Switzerland. This article is an open access article distributed under the terms and conditions of the Creative Commons Attribution (CC BY) license (https:// creativecommons.org/licenses/by/ 4.0/). agronomy Article Bunch Weight Determination in Relation to the Source-Sink Balance in 12 Cavendish Banana Cultivars Manon Rapetti 1, * and Marc Dorel 2 1 Vitropic SA, 3 Avenue du Grand Chêne, 34270 Saint-Mathieu-de-Tréviers, France 2 UPR GECO, CIRAD (Centre de Coopération Internationale en Recherche Agronomique pour le Développement), 97130 Capesterre-Belle-Eau, France; [email protected] * Correspondence: [email protected] Abstract: This study was carried out to compare bunch weight determination in relation to the source- sink balance in a selection of 12 Cavendish banana cultivars. Fruit number and individual fruit weight are the main bunch weight components. The fruit number depended on the growth potential during floral induction, which we estimated according to the active leaf area at floral induction (ALA fi ). We studied fruit weight determination by measuring the source-sink balance during bunch growth, carbohydrate reserves and bunch-sucker biomass partitioning. Throughout the experiment, we monitored the global radiation (Rg), which exhibited seasonal variations. We noted a source variation from the first to the second cycle during bunch growth because of a decrease in the Rg and active leaf area. Our results showed significant differences between Cavendish cultivars regarding bunch weight, fruit number and susceptibility to source variations. There was an overall positive linear relation between ALA fi and fruit number, but the ALA fi /fruit number ratio varied between cultivars. We also found that the bunch weight was mainly determined by the fruit number rather than the fruit weight when the source was not limited. Finally, we assessed the cultivar susceptibility to source decreases, thereby revealing some cultivars of interest for agroecological cropping systems. Keywords: Musa; yield; deleafing; global radiation; fruiting efficiency 1. Introduction Cavendish (Musa AAA) banana cultivars were selected for their capacity to produce high fruit yields in intensive cropping systems meeting international banana market re- quirements. Among cultivars of the Cavendish group, ‘Grande Naine’ and ‘Williams’ are considered to be ‘model bananas’ [1,2] and are the main cultivars cropped for export. How- ever, banana cropping systems are currently moving towards agroecological systems based on limited chemical input use. Soil resource availability is often reduced in these systems as a result of competition with weeds or accompanying cover plants and/or the use of organic fertilizers with hard-to-predict nutrient release patterns. Moreover, as fungicide usage for black Sigatoka control has been curbed, prophylactic practices are now being implemented that involve extensive sanitary deleafing, thereby reducing the banana leaf area and photosynthetic production [3]. The Cavendish group includes various cultivars that are mainly distinguishable by their height, leaf length/width ratio and fruit number/bunch [4,5]. The agronomic perfor- mances of these cultivars have been compared in non-limiting conditions to select cultivars suitable for the banana industry and export market [1,6–10]. To this end, the cultivars have basically been compared on the basis of traits related to yield components: bunch weight, fruit number, fruit size and number of bunches/year. However, few studies have addressed the mechanisms involved in the yield build-up process of the cultivars. It is of interest to study the carbon source-sink balance so as to assess the ability of plants to withstand non-optimal cropping conditions. The term ‘source-sink balance’ is more commonly used in reference to the carbon source-sink balance. The sources are Agronomy 2022, 12, 333. https://doi.org/10.3390/agronomy12020333 https://www.mdpi.com/journal/agronomy
-
Upload
khangminh22 -
Category
Documents
-
view
0 -
download
0
Transcript of Bunch Weight Determination in Relation to the Source-Sink ...

�����������������
Citation: Rapetti, M.; Dorel, M.
Bunch Weight Determination in
Relation to the Source-Sink Balance
in 12 Cavendish Banana Cultivars.
Agronomy 2022, 12, 333. https://
doi.org/10.3390/agronomy12020333
Academic Editor: Susanna Bartolini
Received: 30 December 2021
Accepted: 25 January 2022
Published: 27 January 2022
Publisher’s Note: MDPI stays neutral
with regard to jurisdictional claims in
published maps and institutional affil-
iations.
Copyright: © 2022 by the authors.
Licensee MDPI, Basel, Switzerland.
This article is an open access article
distributed under the terms and
conditions of the Creative Commons
Attribution (CC BY) license (https://
creativecommons.org/licenses/by/
4.0/).
agronomy
Article
Bunch Weight Determination in Relation to the Source-SinkBalance in 12 Cavendish Banana CultivarsManon Rapetti 1,* and Marc Dorel 2
1 Vitropic SA, 3 Avenue du Grand Chêne, 34270 Saint-Mathieu-de-Tréviers, France2 UPR GECO, CIRAD (Centre de Coopération Internationale en Recherche Agronomique pour le
Développement), 97130 Capesterre-Belle-Eau, France; [email protected]* Correspondence: [email protected]
Abstract: This study was carried out to compare bunch weight determination in relation to the source-sink balance in a selection of 12 Cavendish banana cultivars. Fruit number and individual fruitweight are the main bunch weight components. The fruit number depended on the growth potentialduring floral induction, which we estimated according to the active leaf area at floral induction(ALAfi). We studied fruit weight determination by measuring the source-sink balance during bunchgrowth, carbohydrate reserves and bunch-sucker biomass partitioning. Throughout the experiment,we monitored the global radiation (Rg), which exhibited seasonal variations. We noted a sourcevariation from the first to the second cycle during bunch growth because of a decrease in the Rg andactive leaf area. Our results showed significant differences between Cavendish cultivars regardingbunch weight, fruit number and susceptibility to source variations. There was an overall positivelinear relation between ALAfi and fruit number, but the ALAfi/fruit number ratio varied betweencultivars. We also found that the bunch weight was mainly determined by the fruit number ratherthan the fruit weight when the source was not limited. Finally, we assessed the cultivar susceptibilityto source decreases, thereby revealing some cultivars of interest for agroecological cropping systems.
Keywords: Musa; yield; deleafing; global radiation; fruiting efficiency
1. Introduction
Cavendish (Musa AAA) banana cultivars were selected for their capacity to producehigh fruit yields in intensive cropping systems meeting international banana market re-quirements. Among cultivars of the Cavendish group, ‘Grande Naine’ and ‘Williams’ areconsidered to be ‘model bananas’ [1,2] and are the main cultivars cropped for export. How-ever, banana cropping systems are currently moving towards agroecological systems basedon limited chemical input use. Soil resource availability is often reduced in these systemsas a result of competition with weeds or accompanying cover plants and/or the use oforganic fertilizers with hard-to-predict nutrient release patterns. Moreover, as fungicideusage for black Sigatoka control has been curbed, prophylactic practices are now beingimplemented that involve extensive sanitary deleafing, thereby reducing the banana leafarea and photosynthetic production [3].
The Cavendish group includes various cultivars that are mainly distinguishable bytheir height, leaf length/width ratio and fruit number/bunch [4,5]. The agronomic perfor-mances of these cultivars have been compared in non-limiting conditions to select cultivarssuitable for the banana industry and export market [1,6–10]. To this end, the cultivars havebasically been compared on the basis of traits related to yield components: bunch weight,fruit number, fruit size and number of bunches/year. However, few studies have addressedthe mechanisms involved in the yield build-up process of the cultivars.
It is of interest to study the carbon source-sink balance so as to assess the ability ofplants to withstand non-optimal cropping conditions. The term ‘source-sink balance’ ismore commonly used in reference to the carbon source-sink balance. The sources are
Agronomy 2022, 12, 333. https://doi.org/10.3390/agronomy12020333 https://www.mdpi.com/journal/agronomy

Agronomy 2022, 12, 333 2 of 13
photoassimilate-producing leaves, while the sinks are organs requiring carbohydrates fortheir growth. In banana, the main source consists of the eight last emitted leaves, whereasthe main sinks are the bunch and sucker [11]. The source strength depends on the leaf area,the global radiation (Rg) and the radiation use efficiency. The bunch sink strength dependson the fruit number and on the number of cells contained in each fruit [12]. The source-sinkbalance is involved in bunch weight determination as the fruit number depends on theactive leaf area at floral induction [13], and the fruit growth rate and final individual fruitweight depend on the source-sink balance after bunch emergence [12]. The source strengthvaries with the environment and cropping conditions and may be reduced by a radiationdecrease, water deficit or low nitrogen availability. The source strength is also affectedby defoliation and foliar diseases such as black Sigatoka disease caused by Mycosphaerellafijiensis. However, source-sink balance variations between banana cultivars are poorlydocumented.
We hypothesized that cultivars of the Cavendish groups would differ in terms of bunchweight determination and the source-sink balance. To test this hypothesis, we measured aset of plant traits in 12 representative Cavendish banana cultivars in an experimental plotover two crop cycles.
2. Materials and Methods2.1. Experimental Design and Growing Conditions
This experiment was conducted in Capesterre-Belle-Eau (Guadeloupe, French WestIndies), at the CIRAD Neufchâteau research station (16◦04′48′′ N, 61◦36′09′′ W) fromAugust 2019 to March 2021. The climatic conditions over this period and the plant stagesfor both cycles are presented in Figure 1.
Agronomy 2022, 12, 333 2 of 13
It is of interest to study the carbon source-sink balance so as to assess the ability of plants to withstand non-optimal cropping conditions. The term ‘source-sink balance’ is more commonly used in reference to the carbon source-sink balance. The sources are pho-toassimilate-producing leaves, while the sinks are organs requiring carbohydrates for their growth. In banana, the main source consists of the eight last emitted leaves, whereas the main sinks are the bunch and sucker [11]. The source strength depends on the leaf area, the global radiation (Rg) and the radiation use efficiency. The bunch sink strength depends on the fruit number and on the number of cells contained in each fruit [12]. The source-sink balance is involved in bunch weight determination as the fruit number de-pends on the active leaf area at floral induction [13], and the fruit growth rate and final individual fruit weight depend on the source-sink balance after bunch emergence [12]. The source strength varies with the environment and cropping conditions and may be reduced by a radiation decrease, water deficit or low nitrogen availability. The source strength is also affected by defoliation and foliar diseases such as black Sigatoka disease caused by Mycosphaerella fijiensis. However, source-sink balance variations between ba-nana cultivars are poorly documented.
We hypothesized that cultivars of the Cavendish groups would differ in terms of bunch weight determination and the source-sink balance. To test this hypothesis, we measured a set of plant traits in 12 representative Cavendish banana cultivars in an ex-perimental plot over two crop cycles.
2. Materials and Methods 2.1. Experimental Design and Growing Conditions
This experiment was conducted in Capesterre-Belle-Eau (Guadeloupe, French West Indies), at the CIRAD Neufchâteau research station (16°04′48″ N, 61°36′09″ W) from Au-gust 2019 to March 2021. The climatic conditions over this period and the plant stages for both cycles are presented in Figure 1.
Figure 1. Climatic conditions and plantation stages during the experiment. (a) Banana development phases during two crop cycles; (b) monthly cumulative global radiation (Rg); (c) monthly cumula-tive rainfall and average daily temperature. BE: bunch emergence; H: harvest.
Figure 1. Climatic conditions and plantation stages during the experiment. (a) Banana developmentphases during two crop cycles; (b) monthly cumulative global radiation (Rg); (c) monthly cumulativerainfall and average daily temperature. BE: bunch emergence; H: harvest.
The soil is classified as an andosol [14]. The cultivar evaluation trial was conducted ona 0.2 ha plot in which 12 banana cultivars were planted (10 plants/cultivar). The plantswere randomly planted at a density of 930 plants/ha (3 m × 3 m spacing). We assumedthat this plant density was low enough to limit light competition in the banana population.

Agronomy 2022, 12, 333 3 of 13
The experimental field had lain fallow for 2 years and the soil was tilled before planting.The planting materials were tissue culture plants supplied by Vitropic SA.
After banana planting, fertilizers were applied twice monthly, for a total annualapplied amount of 530 kg of nitrogen, 800 kg of potassium, 110 kg of phosphorus and150 kg of magnesium.
For each crop cycle, we kept a single successive sucker and removed all others oncethey emerged aboveground. We selected a successive sucker during the first cycle 5 monthsafter plantation. For the second cycle, we selected a successive sucker 4 months after thefirst cycle harvest.
Sanitary deleafing was performed weekly, and a mixture of triazole fungicide andmineral oil, composed of 5 g of difenoconazole in 10 L of mineral oil, was sprayed monthlyto control black Sigatoka disease.
2.2. Cultivars
The Cavendish cultivars were selected in the Vitropic SA brochure with the aim ofcovering the plant size range prevailing in the Cavendish group, i.e., from the Dwarf to theRobusta type [4]. From the smallest to the tallest, the cultivars were as follows:
• Dwarf type: These are the most cultivated cultivars in the subtropics, especially in theCanary Islands. We monitored the Dwarf Cavendish ‘DC-01’ cultivar in this study.This cultivar was selected for its high fruit number and its high bunch weight insubtropical climate, where it exhibited the highest bunch weight compared to someGiant cultivars (unpublished data).
• Giant type: These are major cultivars cultivated for world export, including themainstreamed cultivars ‘Grande Naine’ and ‘Williams’. For this study, we monitorednine commercial Giant cultivars that were selected in ‘Grande Naine’ populations:‘Gua-01’ (considered as the standard ‘Grande Naine’); ‘Gua-02’; ‘Mat-01’; ‘Mat-02’;‘Mat-03’; ‘Mat-11’; ‘Mat-12’; ‘Cot-01’ and ‘Ruby’. The latter ‘Ruby’ cultivar is nematode-tolerant and has shown resistance to TR4 disease under in vitro conditions.
• Robusta type: These were once major export cultivars that replaced the Gros Michelcultivar, which is highly susceptible to Panama disease. In many exporting areas, theyhave now been replaced by Giant Cavendish types, which are shorter and producelarger bunches. We monitored two cultivars: ‘Ame-01’, an American cultivar thatused to be mostly cropped in Latin America, and ‘Poyo’ that used to be traditionallycultivated in the West Indies.
2.3. Measurements
During two banana crop cycles, a set of measurements was applied on 10 plants/cultivarto describe the plant morphology, the plant phenology and to assess the bunch characteris-tics and their determination.
2.3.1. Plant Phenology and Morphology
We noted the date of each leaf emission, of bunch emergence and of harvest. Buncheswere harvested 900 cumulative degree-days after bunch emergence, with a base tempera-ture of 14 ◦C. Since 11 leaves are emitted between floral induction and bunch emergence [15],we retroactively estimated the floral induction date by the date of emission of the twelfthleaf before bunch emergence.
The first cycle duration was measured as the interval between plantating and harvestin the first cycle, while the second cycle duration was the interval between the first andsecond cycle harvests.
For every leaf, the leaf length and width were measured to calculate the leaf areaaccording to Formula (1) [16]:
leaf area = 0.83 × leaf length × leaf width (1)
Agronomy 2022, 12, 333 4 of 13
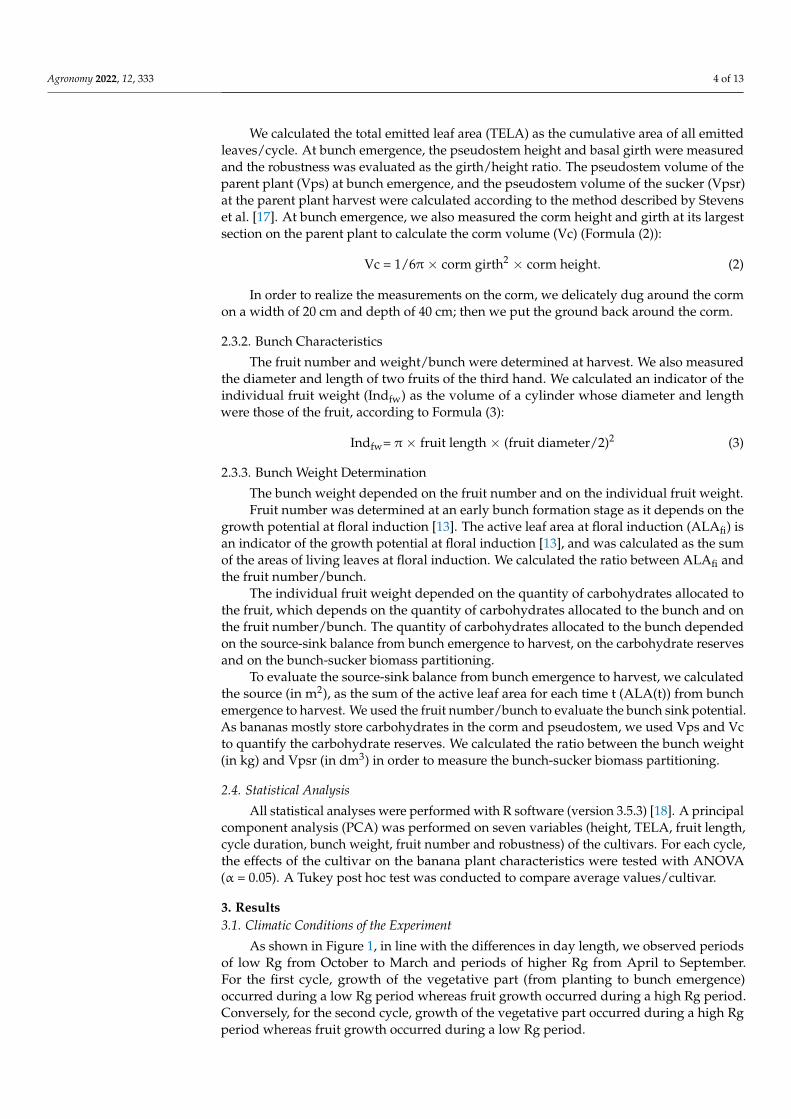
We calculated the total emitted leaf area (TELA) as the cumulative area of all emittedleaves/cycle. At bunch emergence, the pseudostem height and basal girth were measuredand the robustness was evaluated as the girth/height ratio. The pseudostem volume of theparent plant (Vps) at bunch emergence, and the pseudostem volume of the sucker (Vpsr)at the parent plant harvest were calculated according to the method described by Stevenset al. [17]. At bunch emergence, we also measured the corm height and girth at its largestsection on the parent plant to calculate the corm volume (Vc) (Formula (2)):
Vc = 1/6π × corm girth2 × corm height. (2)
In order to realize the measurements on the corm, we delicately dug around the cormon a width of 20 cm and depth of 40 cm; then we put the ground back around the corm.
2.3.2. Bunch Characteristics
The fruit number and weight/bunch were determined at harvest. We also measuredthe diameter and length of two fruits of the third hand. We calculated an indicator of theindividual fruit weight (Indfw) as the volume of a cylinder whose diameter and lengthwere those of the fruit, according to Formula (3):
Indfw= π × fruit length × (fruit diameter/2)2 (3)
2.3.3. Bunch Weight Determination
The bunch weight depended on the fruit number and on the individual fruit weight.Fruit number was determined at an early bunch formation stage as it depends on the
growth potential at floral induction [13]. The active leaf area at floral induction (ALAfi) isan indicator of the growth potential at floral induction [13], and was calculated as the sumof the areas of living leaves at floral induction. We calculated the ratio between ALAfi andthe fruit number/bunch.
The individual fruit weight depended on the quantity of carbohydrates allocated tothe fruit, which depends on the quantity of carbohydrates allocated to the bunch and onthe fruit number/bunch. The quantity of carbohydrates allocated to the bunch dependedon the source-sink balance from bunch emergence to harvest, on the carbohydrate reservesand on the bunch-sucker biomass partitioning.
To evaluate the source-sink balance from bunch emergence to harvest, we calculatedthe source (in m2), as the sum of the active leaf area for each time t (ALA(t)) from bunchemergence to harvest. We used the fruit number/bunch to evaluate the bunch sink potential.As bananas mostly store carbohydrates in the corm and pseudostem, we used Vps and Vcto quantify the carbohydrate reserves. We calculated the ratio between the bunch weight(in kg) and Vpsr (in dm3) in order to measure the bunch-sucker biomass partitioning.
2.4. Statistical Analysis
All statistical analyses were performed with R software (version 3.5.3) [18]. A principalcomponent analysis (PCA) was performed on seven variables (height, TELA, fruit length,cycle duration, bunch weight, fruit number and robustness) of the cultivars. For each cycle,the effects of the cultivar on the banana plant characteristics were tested with ANOVA(α = 0.05). A Tukey post hoc test was conducted to compare average values/cultivar.
3. Results3.1. Climatic Conditions of the Experiment
As shown in Figure 1, in line with the differences in day length, we observed periodsof low Rg from October to March and periods of higher Rg from April to September.For the first cycle, growth of the vegetative part (from planting to bunch emergence)occurred during a low Rg period whereas fruit growth occurred during a high Rg period.Conversely, for the second cycle, growth of the vegetative part occurred during a high Rgperiod whereas fruit growth occurred during a low Rg period.

Agronomy 2022, 12, 333 5 of 13
3.2. Multivariate Analysis of Descriptive Variables3.2.1. First Cycle
Dimensions 1 and 2 explained 73% of the variance of the seven descriptive variables(Figure 2a). Bunch weight and cycle duration, respectively, contributed 28% and 20% todimension 1, while pseudostem height and robustness, respectively, contributed 38% and24% to dimension 2. This figure shows three clusters of cultivars: ‘Poyo’, ‘DC-01’ and theother cultivars. These clusters differed significantly on both axes, mainly in terms of theirheight and robustness (Figure 2b,c). ‘Poyo’ was the tallest and least robust cultivar, whereas‘DC-01’ was the smallest and most robust. The other cultivars had intermediate height androbustness. Note that bunch weight was positively correlated with the cycle duration, fruitnumber and fruit length (Figure 2a).
(a)
(b) (c)
Figure 2:
Figure 2. (a) Principal component analysis (PCA) performed on seven descriptive variables forthe first cycle (95% confidence ellipse). For each cultivar, the largest symbol corresponds to thecultivar average position on both dimensions. (b) Cultivar coordinates on dimension 1. (c) Cultivarcoordinates on dimension 2. Different letters indicate significant differences according to a Tukey test(α = 0.05).
3.2.2. Second Cycle
Dimensions 1 and 2 explained 68% of the variance of the seven descriptive variables(Figure 3a). Height and robustness, respectively, contributed 25% and 18% to dimension1. Fruit number contributed 62% to dimension 2. The figure shows three clusters whichsignificantly differed on dimension 1 (Figure 3b): ‘Poyo’ and ‘Ame-01’ were the tallest andleast robust cultivars, ‘DC-01’ was the smallest and most robust, while the other cultivars

Agronomy 2022, 12, 333 6 of 13
exhibited intermediate height and robustness. Note that these clusters corresponded tothe three Cavendish types, i.e., Robusta, Giant and Dwarf Cavendish. For this cycle, thebunch weight was positively correlated with the TELA, negatively correlated with the cycleduration and was independent of the fruit number (Figure 3a).
(a)
(b) (c)
Figure 3:
Figure 3. (a) Principal component analysis (PCA) performed on seven descriptive variables forthe first cycle (95% confidence ellipse). For each cultivar, the largest symbol corresponds to thecultivar average position on both dimensions. (b) Cultivar coordinates on dimension 1. (c) Cultivarcoordinates on dimension 2. Different letters indicate significant differences according to a Tukey test(α = 0.05).
3.3. Bunch Characteristics and Cycle Duration
The bunch characteristics of the two cycles are compared in Table 1. For all cultivars,the bunch weight decreased from the first to second cycle. Note that these bunch weightvariations from the first to the second cycle were particularly marked for ‘DC-01’ (−50%),which exhibited the heaviest bunches in the first cycle and the lightest in the second cycle.In contrast, we only observed a slight decrease in bunch weight with ‘Poyo’ (−3.5%), whichproduced some of the smallest bunches in the first cycle and some of the heaviest in thesecond cycle.

Agronomy 2022, 12, 333 7 of 13
Table 1. Average yield components of the 12 cultivars: fruit number, indicator of individual fruitweight (Indfw), bunch weight and cycle duration.
Cultivars Fruit Number Indfw (cm3) Bunch Weight (kg) Cycle Duration (days)
Cycle 1 Cycle 2 Cycle 1 Cycle 2 Cycle 1 Cycle 2 Cycle 1 Cycle 2
Ame-01 162 cd 241 cd 257 127 ab 35.9 bcd 28.1 ab 311 bc 195Cot-01 168 c 260 abc 253 117 ab 36.5 bcd 27.2 ab 321 ab 198DC-01 220 a 262 abc 285 89 b 46.4 a 23.3 b 335 a 216Gua-01 166 c 270 abc 255 130 ab 36.0 bcd 30.8 a 312 abc 206Gua-02 163 c 236 cd 269 117 ab 37.1 bcd 26.1 ab 321 ab 196Mat-01 156 cd 251 abcd 273 115 ab 37.4 bcd 26.3 ab 317 abc 221Mat-02 162 cd 258 abcd 232 112 ab 31.1 d 26.7 ab 295 c 215Mat-03 163 cd 249 bcd 245 134 ab 34.9 cd 29.5 ab 306 bc 199Mat-11 175 bc 250 abcd 277 130 ab 41.0 abc 28.0 ab 313 abc 224Mat-12 177 bc 295 a 266 99 b 42.2 ab 32.5 a 320 abc 193Poyo 143 d 218 d 240 153 a 32.2 d 31.1 a 309 bc 191Ruby 190 bc 283 ab 221 105 b 37.3 bcd 27.9 ab 321 ab 198
p-value *** *** n.s. ** *** ** *** n.s
Indfw was calculated as the volume of a cylinder whose diameter and length were those of the fruit. ANOVA:n.s.: non-significant; **: p < 0.01; ***: p < 0.001. If p < 0.05, different letters indicate that the average values aresignificantly different (Tukey test, α < 0.05).
Concerning the fruit number, there were significant differences between cultivars. Inthe first cycle, ‘DC-01’ had the highest fruit number, while ‘Poyo’ had the fewest. In thesecond cycle, ‘Mat-12’ and ‘Ruby’ had the highest fruit number, and ‘Poyo’ had the fewest.For all cultivars, the fruit number increased from the first to the second cycle, with a meanincrease of 50%. ‘Mat-12’ exhibited the highest increase (+66%) and ‘DC-01’ the lowest(+19%).
However, despite the increased fruit number, the indicator of individual fruit weight(Indfw) of the 12 cultivars decreased from the first to the second cycle. The Indfw decreasewas not offset by the increased fruit number and resulted in a decreased bunch weightin the 12 cultivars. Note that in the second cycle, the cultivars with the smallest Indfw(‘Mat-12’, ‘Ruby’ and ‘DC-01’) had the highest fruit number.
The first cycle duration (interval between planting and the first cycle harvest) andsecond cycle duration (interval between the first cycle harvest and the second cycle harvest)are shown in Table 1. We only observed significant differences in the first cycle. ‘DC-01’had the longest first cycle duration (335 days) while ‘Mat-02’ had the shortest (295 days).
3.4. Fruit Number Determination According to the Fruit Number/ALAfi Ratio
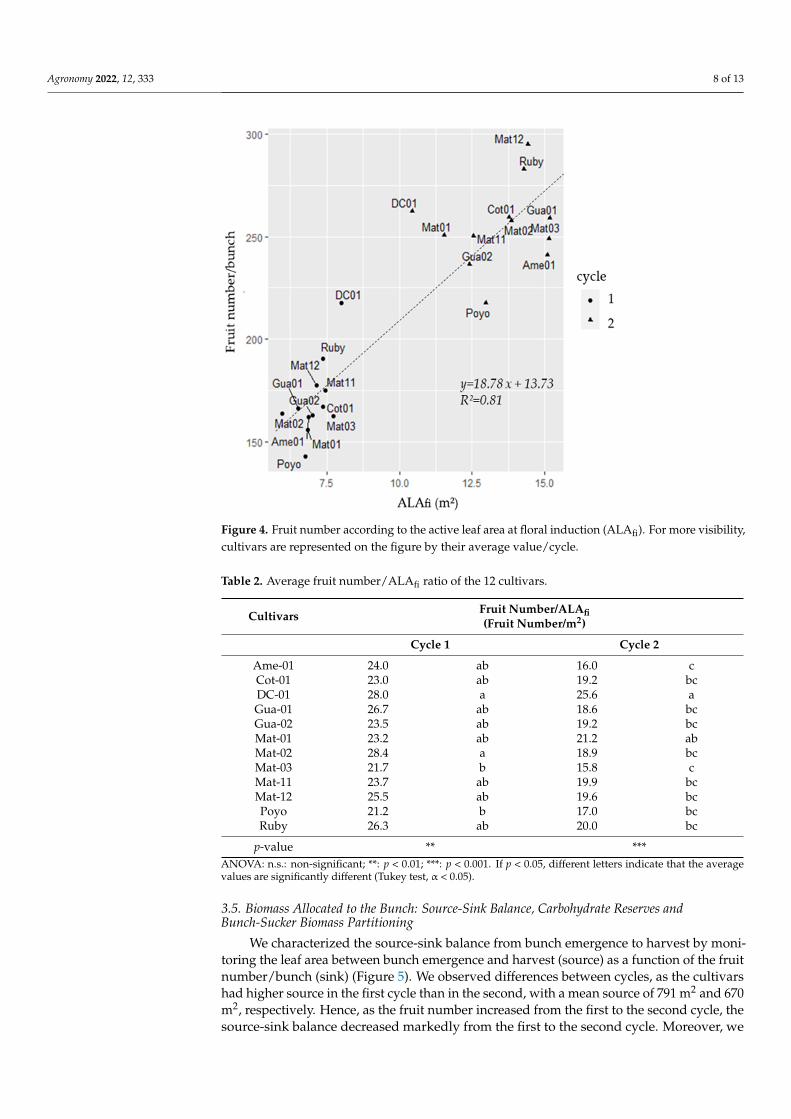
The fruit number as a function of the ALAfi for each cultivar and both cycles ispresented in Figure 4. We observed a positive linear correlation between the fruit numberand ALAfi (R2 = 0.81).
ALAfi was significantly different between cultivars for both cycles (p < 0.01). As shownin Table 2, the fruit number/ALAfi ratio also presented significant differences betweencultivars for both cycles. In the first cycle, ‘DC-01’ and ‘Mat-02’ had the highest fruitnumber/ALAfi ratio, whereas ‘Poyo’ and ‘Mat-03’ had the lowest. In the second cycle,‘DC-01’ also had the highest ratio due to its significantly lower ALAfi, whereas ‘Mat-03’and ‘Ame-01’ had the lowest ratio due to their significantly higher ALAfi.
Note that the mean increase in ALAfi from the first to the second cycle (84%) washigher than the mean increase in fruit number (50%), thereby explaining the decrease inthe fruit number/ALAfi ratio from the first to the second cycle.
Agronomy 2022, 12, 333 8 of 13Agronomy 2022, 12, 333 8 of 13
Figure 4. Fruit number according to the active leaf area at floral induction (ALAfi). For more visibil-ity, cultivars are represented on the figure by their average value/cycle.
ALAfi was significantly different between cultivars for both cycles (p < 0.01). As shown in Table 2, the fruit number/ALAfi ratio also presented significant differences be-tween cultivars for both cycles. In the first cycle, ‘DC-01′ and ‘Mat-02′ had the highest fruit number/ALAfi ratio, whereas ‘Poyo’ and ‘Mat-03′ had the lowest. In the second cycle, ‘DC-01′ also had the highest ratio due to its significantly lower ALAfi, whereas ‘Mat-03′ and ‘Ame-01′ had the lowest ratio due to their significantly higher ALAfi.
Table 2. Average fruit number/ALAfi ratio of the 12 cultivars.
Cultivars Fruit Number/ALAfi (Fruit Number/m2)
Cycle 1 Cycle 2 Ame-01 24.0 ab 16.0 c Cot-01 23.0 ab 19.2 bc DC-01 28.0 a 25.6 a Gua-01 26.7 ab 18.6 bc Gua-02 23.5 ab 19.2 bc Mat-01 23.2 ab 21.2 ab Mat-02 28.4 a 18.9 bc Mat-03 21.7 b 15.8 c Mat-11 23.7 ab 19.9 bc Mat-12 25.5 ab 19.6 bc Poyo 21.2 b 17.0 bc Ruby 26.3 ab 20.0 bc
p-value ** *** ANOVA: n.s.: non-significant; **: p < 0.01; ***: p < 0.001. If p < 0.05, different letters indicate that the average values are significantly different (Tukey test, α < 0.05).
Figure 4. Fruit number according to the active leaf area at floral induction (ALAfi). For more visibility,cultivars are represented on the figure by their average value/cycle.
Table 2. Average fruit number/ALAfi ratio of the 12 cultivars.
Cultivars Fruit Number/ALAfi(Fruit Number/m2)
Cycle 1 Cycle 2
Ame-01 24.0 ab 16.0 cCot-01 23.0 ab 19.2 bcDC-01 28.0 a 25.6 aGua-01 26.7 ab 18.6 bcGua-02 23.5 ab 19.2 bcMat-01 23.2 ab 21.2 abMat-02 28.4 a 18.9 bcMat-03 21.7 b 15.8 cMat-11 23.7 ab 19.9 bcMat-12 25.5 ab 19.6 bcPoyo 21.2 b 17.0 bcRuby 26.3 ab 20.0 bc
p-value ** ***ANOVA: n.s.: non-significant; **: p < 0.01; ***: p < 0.001. If p < 0.05, different letters indicate that the averagevalues are significantly different (Tukey test, α < 0.05).
3.5. Biomass Allocated to the Bunch: Source-Sink Balance, Carbohydrate Reserves andBunch-Sucker Biomass Partitioning
We characterized the source-sink balance from bunch emergence to harvest by moni-toring the leaf area between bunch emergence and harvest (source) as a function of the fruitnumber/bunch (sink) (Figure 5). We observed differences between cycles, as the cultivarshad higher source in the first cycle than in the second, with a mean source of 791 m2 and 670m2, respectively. Hence, as the fruit number increased from the first to the second cycle, thesource-sink balance decreased markedly from the first to the second cycle. Moreover, we

Agronomy 2022, 12, 333 9 of 13
observed differences in the source-sink balance between cultivars. Indeed, in both cycles,‘Poyo’ appeared to have a high source-sink balance, with a small fruit number, whereas‘DC-01’, ‘Ruby’ and ‘Mat-12’ had a low source-sink balance with a high fruit number.
1
Figure 5. Sum of the active leaf area from bunch emergence to harvest (source) as a function ofthe fruit number (sink). For more visibility, cultivars are represented on the figure by their averagevalue/cycle.
We monitored Vps and Vc to estimate the carbohydrate reserves. For Vc, ANOVArevealed no significant differences between cultivars (p > 0.05). Conversely, for Vps,ANOVA showed significant differences between cultivars, with ‘Mat-12’ having the highestVps in both cycles (Table 3). In the second cycle, ‘Mat-03’ and ‘Ame-01’ also had significantlyhigher Vps than the rest of the cultivars. ‘Mat-02’ had the smallest Vps in the first cycle and‘DC-01’ in the second cycle.
The mean Vps increased from the first to the second cycle, due to the tallest plantwith the highest growth being in the second cycle. Those differences of height and growthexplained the mean ALAfi increase from the first to the second cycle that we observed.However, note that the ALAfi was independent of the source during the fruit growth. Thisexplained why, despite the higher ALAfi in the second cycle, the bunch weight decreasedfrom the first to the second cycle because of the source decrease during the fruit growth.

Agronomy 2022, 12, 333 10 of 13
Table 3. Average pseudostem volume at bunch emergence (Vps), sucker pseudostem volume at theparent plant harvest (Vpsr) and bunch weight/Vpsr ratio of the 12 cultivars.
Cultivars Vps (dm3) Vpsr (dm3) Bunch Weight/Vpsr (kg/dm3)
Cycle 1 Cycle 2 Cycle 1 Cycle 2 Cycle 1 Cycle 2
Ame-01 93.9 ab 169.6 a 40.5 ab 80.1 ab 0.93 cd 0.41 abcCot-01 81.3 ab 142.5 abc 34.4 ab 53.3 bc 1.19 abcd 0.59 abDC-01 88.6 ab 109.7 c 24.6 b 44.6 c 2.04 ab 0.64 aGua-01 92.1 ab 148.6 abc 38.7 ab 83.3 ab 1.01 bcd 0.39 abcGua-02 86.1 ab 143.1 abc 35.5 ab 64.2 abc 1.16 bcd 0.45 abcMat-01 89.7 ab 131.7 bc 23.2 b 62.8 abc 2.22 a 0.44 abcMat-02 80.2 b 149.2 ab 31.3 ab 71.1 abc 1.14 bcd 0.41 abcMat-03 97.0 ab 168.8 a 47.1 a 92.2 a 0.80 d 0.37 bcMat-11 91.3 ab 131.2 bc 26.8 b 59.0 abc 1.88 ab 0.52 abcMat-12 102.7 a 171.8 a 45.3 ab 87.5 ab 1.03 bcd 0.38 abcPoyo 97.5 ab 151.9 ab 39.6 ab 91.6 a 0.99 bcd 0.36 cRuby 91.4 ab 136.8 abc 49.7 a 75.6 abc 0.86 d 0.41 abc
p-value * *** *** *** *** **
ANOVA: n.s.: non-significant; *: p ≤ 0.05; **: p < 0.01; ***: p < 0.001. If p < 0.05, different letters indicate that theaverage values are significantly different (Tukey test, α < 0.05).
4. Discussion4.1. Bunch Weight in Source- vs. Sink-Limiting Conditions
In the first cycle, the bunch weights were positively correlated with the fruit number,suggesting that in the first cycle the bunch weights were limited by the fruit number, i.e.,the bunch sink potential. In this case, cultivars such as ‘Poyo’ with a low fruit number inthe bunch had the lightest bunches. In contrast, cultivars such as ‘DC-01’ with a high fruitnumber in the bunch had the heaviest bunches.
In the second cycle, we observed that the bunch weight was positively correlatedwith the TELA. This suggests that the bunch weight was limited by the source strength ofthe leaves. Climatic conditions and foliar disease pressure differed between the first andthe second cycle. In the second cycle, the severe sanitary deleafing and the reduced Rgduring the bunch-filling period lowered the source from bunch emergence to harvest. Thisexplained the lower bunch weight that we measured in the second cycle compared to thefirst cycle. In these conditions, bunches produced by cultivars such as ‘DC-01’ with a lowsource-sink balance were highly impacted and were the lightest. On the contrary, ‘Poyo’, acultivar with a high source-sink balance and a low number of fruits, was less impacted bythe source decrease during the second cycle.
Differences in influence of the source-sink balance of the plant on its yield had previ-ously not been measured in banana cultivars, but they have been described in tomatoeswith similar results by Li et al. [19]. In this latter study, the authors showed that whensources were not limiting and when the yield was only limited by the sink strength, thebest yields (at the plant scale) were obtained with large-fruit tomato varieties (high sinkstrength). Conversely, under source-limiting conditions, the best yields at the plant scalewere obtained with a small-fruit variety (low sink strength). In source-limiting conditions,plants with low sink strength perform better than plants with high sink strength. Thesource-sink balance could be altered by fruit pruning or bloom abortion, which may reducethe final sink strength and favor fruit growth, as described in oil palm, canola, peach andsoybean [20–23]. Source-sink management is already commonly mainstreamed in bananacultural practices with the ablation of male buds [24] and the last hands of the bunch [25].
Moreover, factors other than the source-sink balance could be involved in fruit growthunder source-limiting conditions. Those factors could be related to compensatory mecha-nisms in response to source decreases [26]. Indeed, Robinson et al. [27] observed an increasein the CO2 assimilation rate in response to leaf removal in banana, in turn suggesting anincrease in the net photosynthesis rate [28]. Moreover, Daniells et al. [24] observed anincrease in the bunch-filling period when they applied severe defoliation.

Agronomy 2022, 12, 333 11 of 13
4.2. Bunch Weight and Fruit Number Determination
We found differences between cultivars in fruit number and individual fruit weightin the second crop cycle. ‘DC-01’, ‘Mat-12’ and ‘Ruby’ had a high fruit number, but thesecultivars also exhibited the smallest Indfw in the second cycle. In contrast, ‘Poyo’ had a lowfruit number but the highest Indfw in the second cycle. The negative relation between Indfwand fruit number in the second cycle, which was source-limited, may be explained by thecompetition between fruits of the same bunch for assimilates [29]. However, we found nodifferences in terms of Indfw between the cultivars in the first cycle. This indicated thatwhen the source was not limited, the cultivars had the same individual fruit weight andthat the differences in terms of bunch weight were only due to the fruit number. Thosefindings showed that the fruit number was the main factor determining the bunch weightwhen the source was not limited.
In our study, the fruit number was positively correlated with ALAfi, which confirmedthe findings of Ganry [13] showing that the growth potential at floral induction—which weassessed by ALAfi—was closely correlated with the fruit number and could be consideredas a key determinant of fruit number. Moreover, we observed significant differences in thefruit number/ALAfi ratio between the cultivars. ‘Poyo’, ‘Ame-01’ and ‘Mat-03’ had a lowratio, whereas ‘DC-01’ exhibited a high ratio.
In his experiments, Ganry [13] also observed differences between Cavendish cultivarsin terms of the fruit number to ALAfi ratio. He interpreted this as being due to a difference infloral meristem efficiency of fruit production. In cereal species, grain number determination,or so-called fruiting efficiency, involves a similar mechanism, as the grain number isdependent on the growth of vegetative parts during anthesis [30]. Studies on severalspecies also described differences in fruiting efficiency between different cultivars: breadwheat [31], durum wheat and sorghum [32].
5. Conclusions
We validated our hypothesis as the bunch weight determination differed betweencultivars due to differences in the source-sink balance. Moreover, those differences enabledus to identify cultivars of interest according to cropping systems. ‘DC-01’—a cultivarwith a high fruit number/bunch—had a high bunch weight when the source was notlimited. However, it was very sensitive to reductions in leaf photosynthetic production.This suggested that ‘DC-01’ was not adapted to agroecological cropping systems withsanitary deleafing or low nitrogen availability. In contrast, ‘Poyo’ produced small buncheswith fewer fruits, but its bunch weight remained stable despite variations in light energyacquisition thanks to its high source-sink balance. This resilient cultivar could be ofconsiderable interest for agroecological cropping systems, where the source may be reducedby the control of black Sigatoka disease with severe deleafing or by low nitrogen amountdue to organic fertilizer and/or competitive live mulch. However, its high stature makesbunch care difficult, which is why this cultivar is less attractive for export-oriented bananaproduction. ‘Ame-01’ and ‘Mat-03’ exhibited a low fruit number to ALAfi ratio, reflectinga low efficiency in fruit number development and a high pseudostem volume. Thosecultivars had a high source-sink balance, high sources and high carbohydrate reserves.They should perform well in agroecological systems. ‘Mat-12’ exhibited a high bunchweight in different light resource acquisition conditions, along with a high fruit number.With its high pseudostem volume, ‘Mat-12’ had high carbohydrate reserves, which couldoffset source decreases due to sanitary deleafing. This cultivar could also be adapted tocropping systems involving low pesticide application conditions.
Author Contributions: Conceptualization, M.R. and M.D.; data curation, M.R.; formal analysis, M.R.and M.D.; funding acquisition, M.D.; investigation, M.R.; methodology, M.R. and M.D.; supervision,M.D.; validation, M.R. and M.D.; visualization, M.R.; writing—original draft, M.R.; writing—reviewand editing, M.D. All authors have read and agreed to the published version of the manuscript.

Agronomy 2022, 12, 333 12 of 13
Funding: This work was funded by the European Regional Development Fund for the RIVAGEproject. The research work was carried out in the framework of the CIFRE scheme, which is financedby the French Ministry of Higher Education, Research and Innovation.
Institutional Review Board Statement: Not applicable.
Informed Consent Statement: Not applicable.
Data Availability Statement: The experimental data of the trial are deposited on a Dataverse: https://doi.org/10.18167/DVN1/2GVORV.
Acknowledgments: We first thank Régis Ramassamy, technician at the CIRAD research station inGuadeloupe, for helping with field measurements and for the maintenance of the experimentalfield, Cyril Truc for helping with field measurements. Then, we thank Jérôme Saint-Marc, RonySaint Hilaire and Dimitri Ramdaya, technicians at the CIRAD research station in Guadeloupe for themaintenance of the experimental field, and Mylène Ramassamy and Laura Peraire-Brudey, for theirhelp in field and laboratory measurements. We also thank Vitropic SA for providing the plantingmaterial.
Conflicts of Interest: The authors declare no conflict of interest. The funders had no role in the designof the study; in the collection, analyses, or interpretation of data; in the writing of the manuscript, orin the decision to publish the results.
References1. Robinson, J.C.; Nel, D.J.; Eckstein, K. A Field Comparison of Ten Cavendish Sub-Group Banana Cultivars and Selections (Musa
AAA) over Four Crop Cycles in the Subtropics. J. Hortic. Sci. 1993, 68, 511–521. [CrossRef]2. Stover, R.H. ’Valery’ and ’Grand Nain’: Plant and Foliage Characteristics and a Proposed Banana Ideotype. Trop. Agric. Trinidad
1982, 59, 303–306.3. Risède, J.-M.; Achard, R.; Brat, P.; Chabrier, C.; Damour, G.; Guillermet, C.; de Lapeyre, L.; Loeillet, D.; Lakhia, S.; Meynard, P.;
et al. Chapitre 6. La Transition Agro-Écologique Des Systèmes de Culture de Bananes Cavendish Aux Antilles Françaises. In LaTransition Agro-Ecologiqes des Agricultures du Sud; Agricultures et défis du monde; Éditions Quæ: Versailles, France, 2019; p. 368.
4. Simmonds, N.W. Varietal Identification in the Cavendish Group of Bananas. J. Hortic. Sci. 1956, 29, 81–86. [CrossRef]5. Stover, R.H. Variation and Cultivar Nomenclature in Musa, AAA Group, Cavendish Subgroup. Fruits 1988, 43, 353–357.6. Cabrera Cabrera, J.; Galán Saúco, V. Evaluation of the Banana Cultivars Zelig, Grande Naine and Gruesa under Different
Environmental Conditions in the Canary Islands. Fruits 2005, 60, 357–369. [CrossRef]7. Eckstein, K.; Fraser, C.; Husselmann, J.; Temple Murray, N. The Evaluation of Promising New Banana Cultivars. Acta Hortic. 1998,
490, 57–69. [CrossRef]8. Fonsah, E.G.; Adamu, C.A.; Okole, B.N.; Mullinix, B.G. Field Evaluation of Cavendish Banana Cultivars Propagated Either by
Suckers or by Tissue Culture, over Six Crop Cycles in the Tropics. Fruits 2007, 62, 205–212. [CrossRef]9. Galán Saúco, V.; Cabrera Cabrera, J.; Hernàndez, D.; Rodriguez Pastor, M.C. Evaluation of Medium-Height Cavendish Banana
Cultivars under the Subtrpical Conditions of the Canary Islands. Acta Hortic. 1998, 490, 103–116. [CrossRef]10. Nuno, L.; Ribeiro, V.P.; Alcino da Silva, J. Preliminary Studies of Cavendish Banana Cultivars under the Edafoclimatic Conditions
of Madeira Island. Acta Hortic. 1998, 490, 85–88. [CrossRef]11. Eckstein, K.; Robinson, J.C.; Davie, S.J. Physiological Responses of Banana (Musa AAA; Cavendish Sub-Group) in the Subtropics.
III. Gas Exchange, Growth Analysis and Source-Sink Interaction over a Complete Crop Cycle. J. Hortic. Sci. 1995, 70, 169–180.[CrossRef]
12. Jullien, A.; Munier-Jolain, N.G.; Malézieux, E.; Chillet, M.; Ney, B. Effect of Pulp Cell Number and Assimilate Availability on DryMatter Accumulation Rate in a Banana Fruit [Musa sp. AAA Group ‘Grande Naine’ (Cavendish Subgroup)]. Ann. Bot. 2001, 88,321–330. [CrossRef]
13. Ganry, J. Le développement du bananier en relation avec les facteurs du milieu: Action de la température et du rayonnementd’origine solaire sur la vitesse de croissance des feuilles. Etude du rythme de développement de la plante. Fruits 1980, 35,727–743.
14. FAO. World Reference Base for Soil Resources 2014: International Soil Classification System for Naming Soils and Creating Legends for SoilMaps; FAO: Rome, Italy, 2014; ISBN 978-92-5-108369-7.
15. Ganry, J. Détermination “in situ” du stade de transition entre la phase végétative et la phase florale chez le bananier, utilisantle “coefficient de vitesse de croissance des feuilles”. Essai d’interprétation de quelques processus de développement durant lapériode florale. Fruits 1977, 32, 373–386.
16. Robinson, J.C.; Nel, D.J. Comparative Morphology, Phenology and Production Potential of Banana Cultivars “Dwarf Cavendish”and Williams’ in the Eastern Transvaal Lowveld. Sci. Hortic. 1985, 25, 149–161. [CrossRef]
17. Stevens, B.; Diels, J.; Brown, A.; Bayo, S.; Ndakidemi, P.A.; Swennen, R. Banana Biomass Estimation and Yield Forecasting fromNon-Destructive Measurements for Two Contrasting Cultivars and Water Regimes. Agronomy 2020, 10, 1435. [CrossRef]

Agronomy 2022, 12, 333 13 of 13
18. R Core Team. R: A Language and Environment for Statistical Computing; R Foundation for Statistical Computing: Vienna, Austria,2018.
19. Li, T.; Heuvelink, E.; Marcelis, L.F.M. Quantifying the Source–Sink Balance and Carbohydrate Content in Three Tomato Cultivars.Front. Plant Sci. 2015, 6, 416. [CrossRef]
20. Kumar, M.; Rawat, V.; Rawat, J.M.S.; Tomar, Y.K. Effect of Pruning Intensity on Peach Yield and Fruit Quality. Sci. Hortic. 2010,125, 218–221. [CrossRef]
21. Pallas, B.; Mialet-Serra, I.; Rouan, L.; Clément-Vidal, A.; Caliman, J.-P.; Dingkuhn, M. Effect of Source/Sink Ratios on YieldComponents, Growth Dynamics and Structural Characteristics of Oil Palm (Elaeis Guineensis) Bunches. Tree Physiol. 2013, 33,409–424. [CrossRef]
22. Proulx, R.A.; Naeve, S.L. Pod Removal, Shade, and Defoliation Effects on Soybean Yield, Protein, and Oil. Agron. J. 2009, 101,971–978. [CrossRef]
23. Zhang, H.; Flottmann, S. Source-Sink Manipulations Indicate Seed Yield in Canola Is Limited by Source Availability. Eur. J. Agron.2018, 96, 70–76. [CrossRef]
24. Daniells, J.W.; Lisle, A.T.; Bryde, N.J. Effect of Bunch Trimming and Leaf Removal at Flowering on Maturity Bronzing, Yield, andOther Aspects of Fruit Quality of Bananas in North Queensland. Aust. J. Exp. Agric. 1994, 34, 259–265. [CrossRef]
25. Meyer, J.-P. Influence de l’ablation de mains sur le rendement en poids des régimes de bananes par catégories de conditionnementaux Antilles. Fruits 1975, 30, 663–668.
26. Ney, B.; Bancal, M.O.; Bancal, P.; Bingham, I.J.; Foulkes, J.; Gouache, D.; Paveley, N.; Smith, J. Crop Architecture and CropTolerance to Fungal Diseases and Insect Herbivory. Mechanisms to Limit Crop Losses. Eur. J. Plant Pathol. 2013, 135, 561–580.[CrossRef]
27. Robinson, J.C.; Anderson, T.; Eckstein, K. The Influence of Functional Leaf Removal at Flower Emergence on Components ofYield and Photosynthetic Compensation in Banana. J. Hortic. Sci. 1992, 67, 403–410. [CrossRef]
28. Turner, D.W.; Fortescue, J.A.; Thomas, D.S. Environmental Physiology of the Bananas (Musa spp.). Braz. J. Plant Physiol. 2007, 19,463–484. [CrossRef]
29. Jullien, A.; Malézieux, E.; Michaux-Ferrière, N.; Chillet, M.; Ney, B. Within-Bunch Variability in Banana Fruit Weight: Importanceof Developmental Lag Between Fruits. Ann. Bot. 2001, 87, 101–108. [CrossRef]
30. Garcia, A.L.; Savin, R.; Slafer, G.A. Fruiting Efficiency Differences between Cereal Species. Field Crops Res. 2019, 231, 68–80.[CrossRef]
31. Elía, M.; Savin, R.; Slafer, G.A. Fruiting Efficiency in Wheat: Physiological Aspects and Genetic Variation among Modern Cultivars.Field Crops Res. 2016, 191, 83–90. [CrossRef]
32. Van Oosterom, E.J.; Hammer, G.L. Determination of Grain Number in Sorghum. Field Crops Res. 2008, 108, 259–268. [CrossRef]