Sink stimulation of leaf photosynthesis by the carbon costs of ...
168
Sink stimulation of leaf photosynthesis by the carbon costs of rhizobial and arbuscular mycorrhizal fungal symbioses Glaciela Kaschuk
-
Upload
khangminh22 -
Category
Documents
-
view
3 -
download
0
Transcript of Sink stimulation of leaf photosynthesis by the carbon costs of ...
Sink stimulation of leaf photosynthesis by the carbon costs of rhizobial and arbuscular mycorrhizal fungal symbioses
Glaciela Kaschuk
Thesis committee Thesis supervisors Prof. dr. K.E. Giller Professor of Plant Production Systems Wageningen University Prof. dr. Th.W. Kuyper Personal chair at the Department of Soil Quality Wageningen University Thesis Co-supervisors Dr. ir. P.A. Leffelaar Associate Professor at the Plant Production Systems Group Wageningen University Dr. M. Hungria Senior researcher at Embrapa-Soja Londrina, Brazil Other members Prof. dr. ir. P.C. Struik, Wageningen University Prof. dr. ir. H.J. Bouwmeester, Wageningen University Dr. E.T. Kiers, Free University Amsterdam Prof. dr. P. Millard, Macaulay Institute, Aberdeen, UK
This research was conducted under the auspices of the C.T. de Wit Graduate School of Production Ecology and Resource Conservation.

Sink stimulation of leaf photosynthesis by the carbon costs of rhizobial and arbuscular mycorrhizal fungal symbioses
Glaciela Kaschuk
Thesis submitted in partial fulfilment of the requirements for the degree of doctor
at Wageningen University by the authority of the Rector Magnificus
Prof. dr. M.J. Kropff, in the presence of the
Thesis Committee appointed by the Doctorate Board to be defended in public
on Wednesday 30 September 2009 at 4 PM in the Aula.

Glaciela Kaschuk Sink stimulation of leaf photosynthesis by the carbon costs of rhizobial and arbuscular mycorrhizal fungal symbioses, 160 pages. Thesis, Wageningen University, Wageningen, NL (2009) With references, with summaries in English, Dutch and Portuguese ISBN: 978-90-8585-392-3
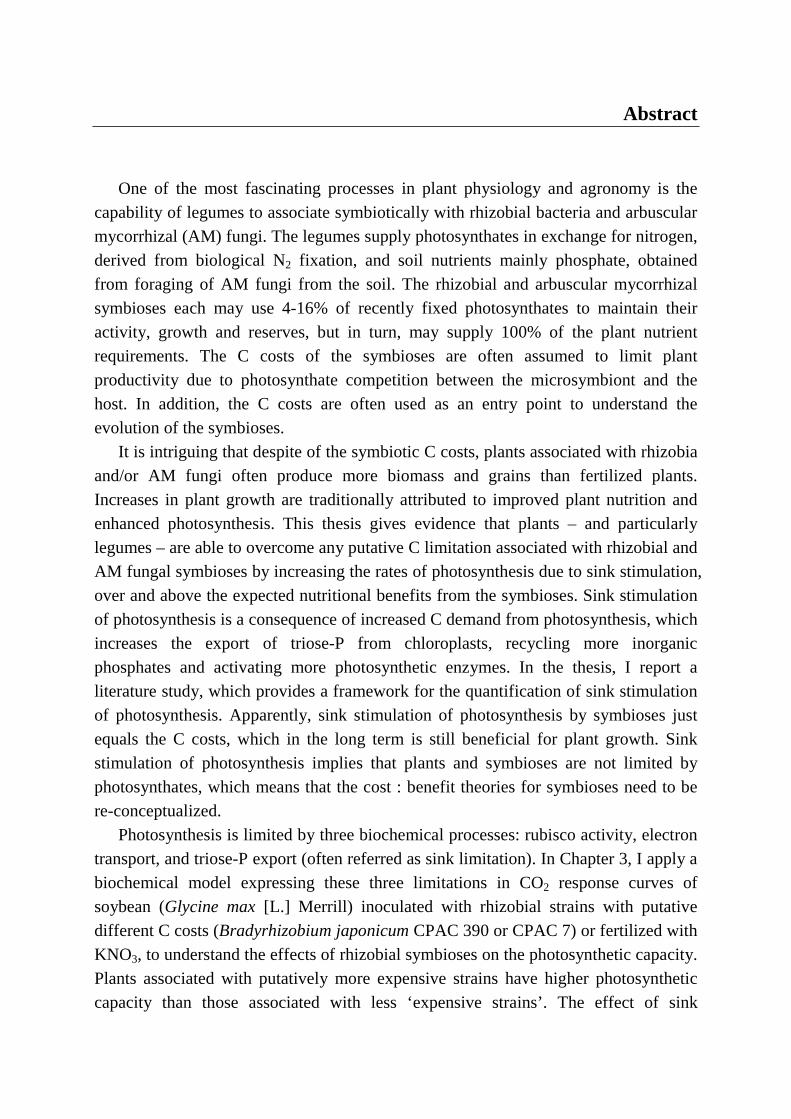
Abstract One of the most fascinating processes in plant physiology and agronomy is the
capability of legumes to associate symbiotically with rhizobial bacteria and arbuscular mycorrhizal (AM) fungi. The legumes supply photosynthates in exchange for nitrogen, derived from biological N2 fixation, and soil nutrients mainly phosphate, obtained from foraging of AM fungi from the soil. The rhizobial and arbuscular mycorrhizal symbioses each may use 4-16% of recently fixed photosynthates to maintain their activity, growth and reserves, but in turn, may supply 100% of the plant nutrient requirements. The C costs of the symbioses are often assumed to limit plant productivity due to photosynthate competition between the microsymbiont and the host. In addition, the C costs are often used as an entry point to understand the evolution of the symbioses.
It is intriguing that despite of the symbiotic C costs, plants associated with rhizobia and/or AM fungi often produce more biomass and grains than fertilized plants. Increases in plant growth are traditionally attributed to improved plant nutrition and enhanced photosynthesis. This thesis gives evidence that plants – and particularly legumes – are able to overcome any putative C limitation associated with rhizobial and AM fungal symbioses by increasing the rates of photosynthesis due to sink stimulation, over and above the expected nutritional benefits from the symbioses. Sink stimulation of photosynthesis is a consequence of increased C demand from photosynthesis, which increases the export of triose-P from chloroplasts, recycling more inorganic phosphates and activating more photosynthetic enzymes. In the thesis, I report a literature study, which provides a framework for the quantification of sink stimulation of photosynthesis. Apparently, sink stimulation of photosynthesis by symbioses just equals the C costs, which in the long term is still beneficial for plant growth. Sink stimulation of photosynthesis implies that plants and symbioses are not limited by photosynthates, which means that the cost : benefit theories for symbioses need to be re-conceptualized.
Photosynthesis is limited by three biochemical processes: rubisco activity, electron transport, and triose-P export (often referred as sink limitation). In Chapter 3, I apply a biochemical model expressing these three limitations in CO2 response curves of soybean (Glycine max [L.] Merrill) inoculated with rhizobial strains with putative different C costs (Bradyrhizobium japonicum CPAC 390 or CPAC 7) or fertilized with KNO3, to understand the effects of rhizobial symbioses on the photosynthetic capacity. Plants associated with putatively more expensive strains have higher photosynthetic capacity than those associated with less ‘expensive strains’. The effect of sink
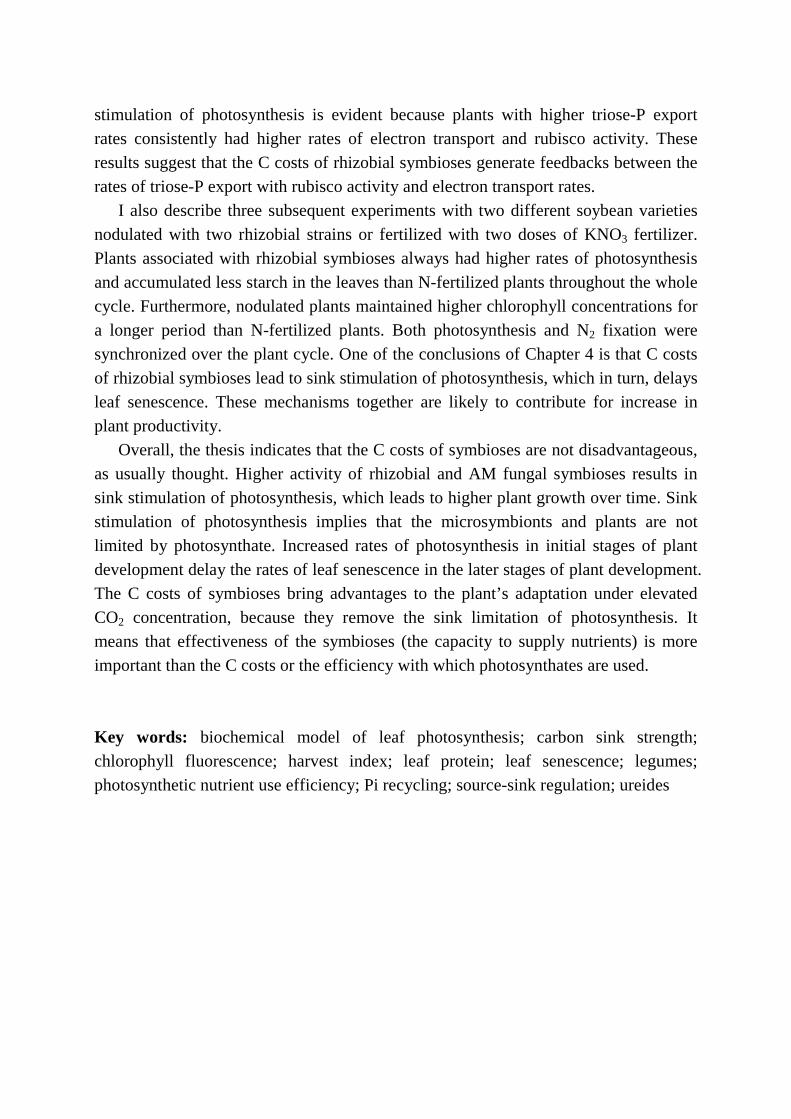
stimulation of photosynthesis is evident because plants with higher triose-P export rates consistently had higher rates of electron transport and rubisco activity. These results suggest that the C costs of rhizobial symbioses generate feedbacks between the rates of triose-P export with rubisco activity and electron transport rates.
I also describe three subsequent experiments with two different soybean varieties nodulated with two rhizobial strains or fertilized with two doses of KNO3 fertilizer. Plants associated with rhizobial symbioses always had higher rates of photosynthesis and accumulated less starch in the leaves than N-fertilized plants throughout the whole cycle. Furthermore, nodulated plants maintained higher chlorophyll concentrations for a longer period than N-fertilized plants. Both photosynthesis and N2 fixation were synchronized over the plant cycle. One of the conclusions of Chapter 4 is that C costs of rhizobial symbioses lead to sink stimulation of photosynthesis, which in turn, delays leaf senescence. These mechanisms together are likely to contribute for increase in plant productivity.
Overall, the thesis indicates that the C costs of symbioses are not disadvantageous, as usually thought. Higher activity of rhizobial and AM fungal symbioses results in sink stimulation of photosynthesis, which leads to higher plant growth over time. Sink stimulation of photosynthesis implies that the microsymbionts and plants are not limited by photosynthate. Increased rates of photosynthesis in initial stages of plant development delay the rates of leaf senescence in the later stages of plant development. The C costs of symbioses bring advantages to the plant’s adaptation under elevated CO2 concentration, because they remove the sink limitation of photosynthesis. It means that effectiveness of the symbioses (the capacity to supply nutrients) is more important than the C costs or the efficiency with which photosynthates are used.
Key words: biochemical model of leaf photosynthesis; carbon sink strength; chlorophyll fluorescence; harvest index; leaf protein; leaf senescence; legumes; photosynthetic nutrient use efficiency; Pi recycling; source-sink regulation; ureides
Contents
Chapter 1. General Introduction 1
Chapter 2. Are the rates of photosynthesis stimulated by the carbon sink strength of rhizobial and arbuscular mycorrhizal symbioses?
13
Chapter 3. Towards understanding of photosynthesis in soybean inoculated with different Bradyrhizobium japonicum strains or fertilized with nitrate
39
Chapter 4. Differences in photosynthetic behaviour and leaf senescence of soybean (Glycine max [L.] Merrill) relying on N2 fixation or nitrate supply.
55
Chapter 5. General Discussion 73
References 93
Appendices 125
Summary 137
Samenvatting 141
Resumo 145
Acknowledgements 149
Curriculum vitae 153
List of publications 155
Education certificate 157


Chapter 1
General Introduction

Chapter 1
2
General introduction
3
1.1. Carbon metabolism of mycorrhizal and rhizobial symbioses
Plants have evolved in association with symbiotic soil microorganisms – particularly, arbuscular mycorrhizal (AM) fungi and rhizobial bacteria – to overcome nutrient limitations for growth. Indeed, these symbioses have common evolutionary pathways, as they are commonly triggered by at least seven similar genes (Parniske, 2008). The AM fungi colonize the intraradical and surrounding soil spaces, absorb soil nutrients, particularly P, and transfer them to the plants in exchange for photosynthates (C). In the same way, rhizobial bacterial strains associate with plants of the family Fabaceae (Leguminosae) by inducing formation of root nodules, fix atmospheric N2 and exchange reduced N for C. Each symbiosis has a complex C metabolism and may require 4-16% of the photosynthetic production from their hosts (e.g. Pang and Paul, 1980, Finke et al., 1982, Harris et al., 1985).
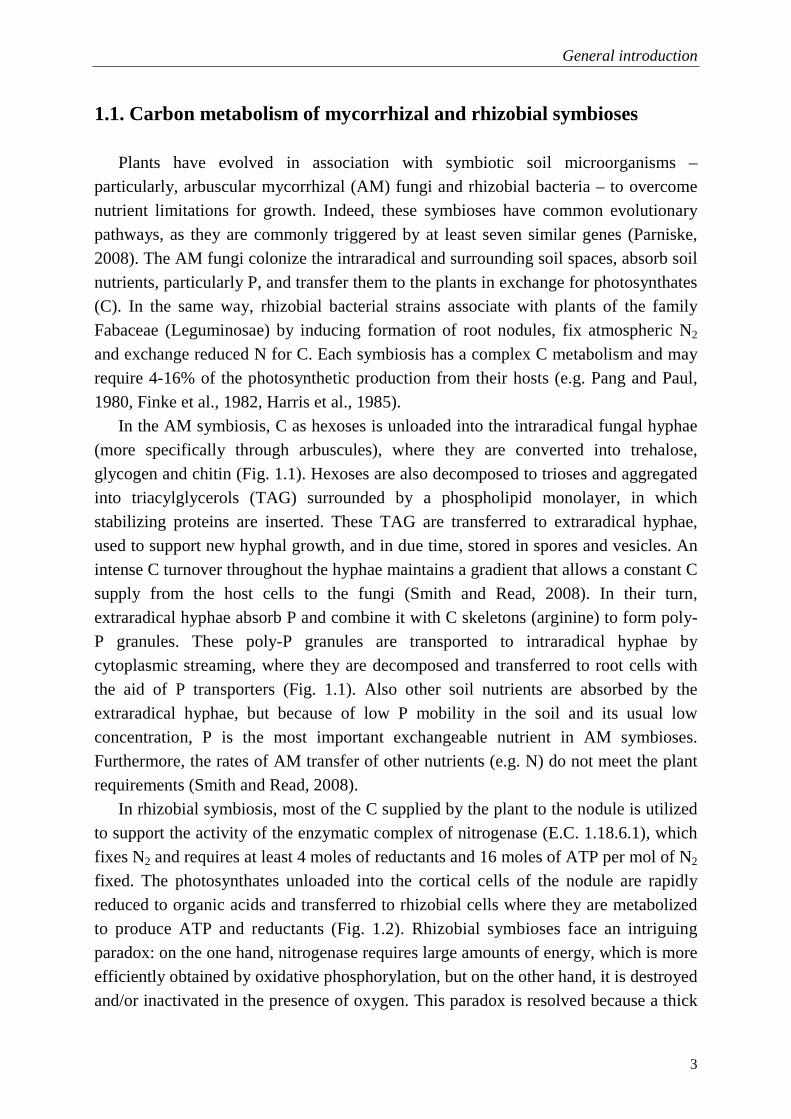
In the AM symbiosis, C as hexoses is unloaded into the intraradical fungal hyphae (more specifically through arbuscules), where they are converted into trehalose, glycogen and chitin (Fig. 1.1). Hexoses are also decomposed to trioses and aggregated into triacylglycerols (TAG) surrounded by a phospholipid monolayer, in which stabilizing proteins are inserted. These TAG are transferred to extraradical hyphae, used to support new hyphal growth, and in due time, stored in spores and vesicles. An intense C turnover throughout the hyphae maintains a gradient that allows a constant C supply from the host cells to the fungi (Smith and Read, 2008). In their turn, extraradical hyphae absorb P and combine it with C skeletons (arginine) to form poly-P granules. These poly-P granules are transported to intraradical hyphae by cytoplasmic streaming, where they are decomposed and transferred to root cells with the aid of P transporters (Fig. 1.1). Also other soil nutrients are absorbed by the extraradical hyphae, but because of low P mobility in the soil and its usual low concentration, P is the most important exchangeable nutrient in AM symbioses. Furthermore, the rates of AM transfer of other nutrients (e.g. N) do not meet the plant requirements (Smith and Read, 2008).
In rhizobial symbiosis, most of the C supplied by the plant to the nodule is utilized to support the activity of the enzymatic complex of nitrogenase (E.C. 1.18.6.1), which fixes N2 and requires at least 4 moles of reductants and 16 moles of ATP per mol of N2 fixed. The photosynthates unloaded into the cortical cells of the nodule are rapidly reduced to organic acids and transferred to rhizobial cells where they are metabolized to produce ATP and reductants (Fig. 1.2). Rhizobial symbioses face an intriguing paradox: on the one hand, nitrogenase requires large amounts of energy, which is more efficiently obtained by oxidative phosphorylation, but on the other hand, it is destroyed and/or inactivated in the presence of oxygen. This paradox is resolved because a thick
Chapter 1
4
Figure 1.1. Flows of carbon, nitrogen and phosphorus between intraradical and extraradical mycorrhizal mycelia and the root cell in an AM symbiosis. Redrawn from Bago et al. (2002).
layer of cortical cells in the outer side of the nodule regulates the diffusion of oxygen, while an enzyme called leghemoglobin reductase (EC 1.6.2.6) supplies oxygen in low concentrations but at high transport rates (Fig. 1.2).
The first product of N2 fixation is NH3, which is quickly protonated into NH4+,
bound with C skeletons and assimilated into glutamine and glutamate but finally into amino acids, amides or ureides depending on the legume species (Fig. 1.2). Legumes of the tribes Phaseoleae or Desmodieae translocate fixed N as ureides (allantoin and allantoic acid) whereas legumes of most of the other tribes (e.g. Vicieae, Trifolieae) translocate fixed N as amides (asparagine) (Giller, 2001). Ureides are more costly to be synthesized and degraded in the leaves than amides, but carry more N per unit of C (Minchin and Witty, 2005). Some rhizobial strains use C more efficiently than others, due to the presence and activity of two enzymes: phosphoenolpyruvate carboxylase (PEPC, E.C. 4.1.1.31), which can assimilate 30% of the CO2 initially released by nodule respiration (Marschner, 1995), and uptake hydrogenase (E.C. 1.12.99.6), which recycles the H2 produced by nitrogenase to increase the production of ATP and protects nitrogenase, which is intolerant of H2 (Minchin and Witty, 2005).
The activity of both AM and rhizobial symbioses is down-regulated when there is
Hexose
Chitin
Trehalose
Glycogen
Glycogen
Triose
ArgininePolyP
ArgininePolyP
TAG TAG
Chitin Trehalose
Hexose
Glyoxylatecycle
Arginine
NO3-
NH4+
NO3-
NH4+
Glutamate
P
P
OrnithineUrea
P
P
CO2
CO2
NH4+ NH4
+
Root cell
Intraradicalmycelium
Extraradicalmycelium
Hexose

General introduction
5
Figure 1.2. Relationships between nitrogenase and related reactions in bacteroids and the cytosol of the host in legume nodules. Adapted from Marschner (1995).
an abundant supply of nutrients in the soil, which suggests that plants regulate C delivered to microsymbionts when grown in fertile soil or when fertilizers are applied (Treseder and Allen, 2002; Kiers and Denison, 2008). This thesis focuses on the implications of diverted C partitioning to AM and rhizobial symbioses compared with fertilized plants. An intriguing question guiding this study is thus whether plants can overcome symbiotic C consumption by increasing the rate of photosynthesis. 1.2. Are symbioses limited by photosynthate supply?
Several studies on the C metabolism in plants associated with AM fungi and/or rhizobia have demonstrated that each of these symbioses take up 4–16% of photosynthates produced (e.g. Pang and Paul, 1980; Finke et al., 1982; Harris et al., 1985). These studies often refer to the C transfer from the plant to the microsymbiont as the C costs of the symbioses. These C costs are counterbalanced by the benefits of P in the AM symbioses, and N in the rhizobial symbioses. The cost : benefit theory suggests that (i) AM and rhizobial symbioses would only occur if plants are grown under conditions of soil nutrient limitation, and (ii) plants should sanction symbioses
O2
CO2
Electron transport
chain
Mg-ADPMg-ATP
Fe protein
Mo-Fe protein
Nitrogenase
Fe protein
Mo-Fe protein
Nitrogenase
2H+
Leghemoglobin
Ferrodoxinand flavodoxin
е–
Electrons carriers
Carbon substrate
utilization
Bacteroid
Nodule cytosol
Peribacteroid membrane
NH3
N2
H2 H2
H2
Uptake hydrogenase
(Hup+)PEP carboxylase
C4 carboxylic acids
photosynthate
Phl
oem
Xyl
em
Carbon skeletons
Amino acids; amides; ureides
NH4+
Chapter 1
6
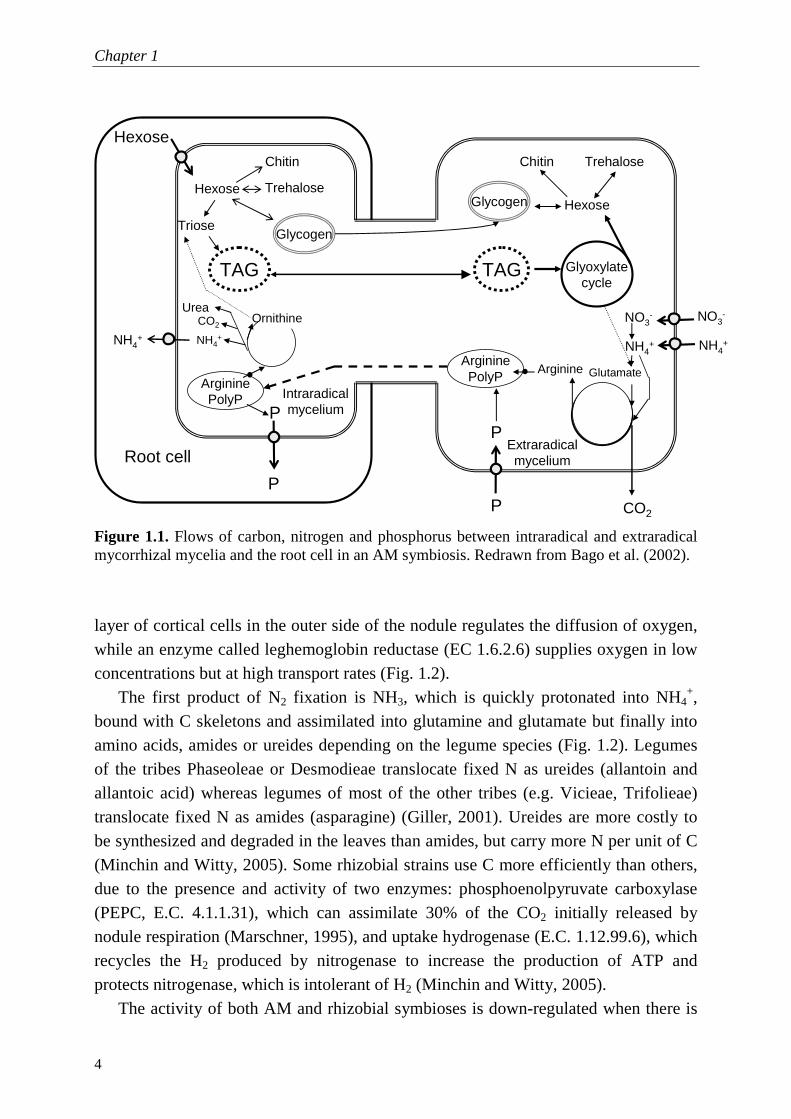
Figure 1.3. Effects of plant and microsymbiont (rhizobia or AM fungi) nutrient limitation on the microsymbiont biomass. At high soil nutrient availability, rhizobia and AM fungi will receive little C from plants and will grow less. At lower soil nutrient availability, rhizobia or AM fungi will receive more C because plants are N or P limited. At (very) low soil nutrient availability, rhizobia, AM fungi and plant should be N or P limited, and microsymbiont biomass will be low regardless of C allocation by the plants. Inspired by Treseder and Allen (2002).
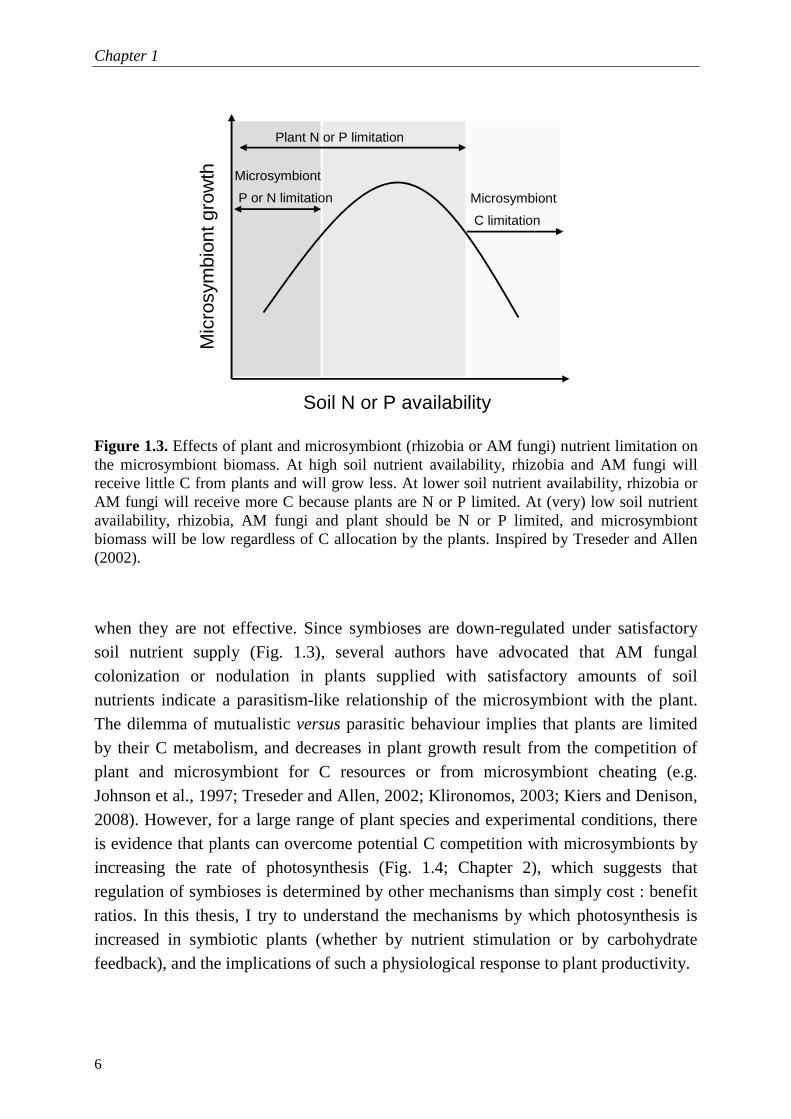
when they are not effective. Since symbioses are down-regulated under satisfactory soil nutrient supply (Fig. 1.3), several authors have advocated that AM fungal colonization or nodulation in plants supplied with satisfactory amounts of soil nutrients indicate a parasitism-like relationship of the microsymbiont with the plant. The dilemma of mutualistic versus parasitic behaviour implies that plants are limited by their C metabolism, and decreases in plant growth result from the competition of plant and microsymbiont for C resources or from microsymbiont cheating (e.g. Johnson et al., 1997; Treseder and Allen, 2002; Klironomos, 2003; Kiers and Denison, 2008). However, for a large range of plant species and experimental conditions, there is evidence that plants can overcome potential C competition with microsymbionts by increasing the rate of photosynthesis (Fig. 1.4; Chapter 2), which suggests that regulation of symbioses is determined by other mechanisms than simply cost : benefit ratios. In this thesis, I try to understand the mechanisms by which photosynthesis is increased in symbiotic plants (whether by nutrient stimulation or by carbohydrate feedback), and the implications of such a physiological response to plant productivity.
Mic
rosy
mbi
ontg
row
th
Soil N or P availability
Plant N or P limitation
Microsymbiont
P or N limitation Microsymbiont
C limitation

General introduction
7
Figure 1.4. Index of change in photosynthesis (on leaf area basis) due to AM fungi and rhizobial symbioses. 100)/()( change ofIndex ×+−= NonsymSymNonsymSym , where Sym and NonSym are the rates of photosynthesis in symbiotic and non-symbiotic plants, respectively. Indices vary from –100 to +100: negative and positive values indicate inhibition or stimulation of photosynthesis, respectively. The index of change of this figure does not correct for the effect of symbiotic nutrient acquisition, discussed in Chapter 2. Plant species: F1, Allium porrum; F2, Capsicum annum; F3, Cucumis sativus; F4, Lactuca sativa; G1, Avena nuda; G2, Cajanus cajan; G3, Glycine max; G4, Hordeum vulgare; G5, Phaseolus vulgaris; G6, Pisum sativum; G7, Vicia faba; G8, Vigna unguiculata; P1, Artemisia annua; P2, Catharanthus roseus; P3, Citrus aurantium; P4, Citrus reticulata; P5, Citrus unshiu; P6, Medicago sativa; P7, Plantago lanceolata; P8, Psidium guajava; P9, Trifolium repens; S1, Solanum tuberosum; T1, Bouteloua gracilis; T2, Panicum coloratum; T3, Zea mays. Data compiled from 51 studies, whose references are listed at the end of this thesis under the heading “Additional References on Figure 1.4.”
Index of change in photosynthesis (%)
Pla
nt s
peci
es
-20 0 20 40 60 80
P9
P9
P3
P9
P9
P1
P1
S1
S1
P8
P3
P7
P6
P1
P5
T2
P5
P1
P4
P3
P5
P7
P5
P6
P7
P5
P8
P5
P2
P5
P5
T3
T1
P3
P3
T3
T3
-20 0 20 40 60 80
G3G4G6G3G5
G4G6G3G3G5
G5G5G4G3G3
G3G7G5G7G6
G4G5G3G5G6G5
G5G6G6G1G5
G4G2G6G6G2
G6G2G7G6G7
-20 0 20 40 60 80
F4F4F4F3F3F1F2F3F3F4F2F3F1F2F2F3F3F4F1F3F2F4F3F3F4F3F3F4F4F4F4F4F4F4F4F4F4F4F4F4F4F4F4F4F4F4F4F4F4F4F4F4F2F4F4F4F4
-20 0 20 40 60 80
G3G3G6G3G3G6G3G3G3G3G6G7G3G3G3G7G6G7G7P6G6G3G3G3G7G3G6G3G3G2G3G3G3G8G8G3G3G3G7G3G7G3G3G7G7G3G3
Arbuscular Mycorrhizal Fungi Rhizobia
Key: T= Tropical C4-grasses species; P=Perennial evergreen species; G=Grain species; F=Annual foliage species; S1=Tuber crop
Chapter 1
8
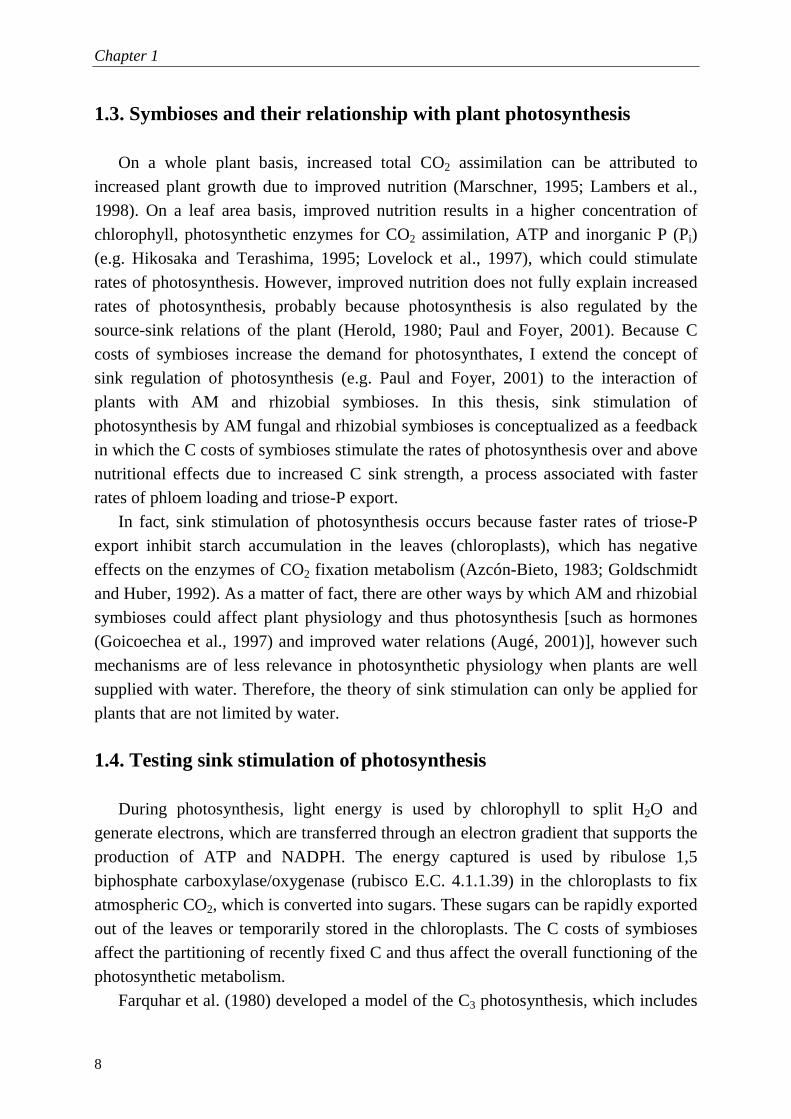
1.3. Symbioses and their relationship with plant photosynthesis
On a whole plant basis, increased total CO2 assimilation can be attributed to increased plant growth due to improved nutrition (Marschner, 1995; Lambers et al., 1998). On a leaf area basis, improved nutrition results in a higher concentration of chlorophyll, photosynthetic enzymes for CO2 assimilation, ATP and inorganic P (Pi) (e.g. Hikosaka and Terashima, 1995; Lovelock et al., 1997), which could stimulate rates of photosynthesis. However, improved nutrition does not fully explain increased rates of photosynthesis, probably because photosynthesis is also regulated by the source-sink relations of the plant (Herold, 1980; Paul and Foyer, 2001). Because C costs of symbioses increase the demand for photosynthates, I extend the concept of sink regulation of photosynthesis (e.g. Paul and Foyer, 2001) to the interaction of plants with AM and rhizobial symbioses. In this thesis, sink stimulation of photosynthesis by AM fungal and rhizobial symbioses is conceptualized as a feedback in which the C costs of symbioses stimulate the rates of photosynthesis over and above nutritional effects due to increased C sink strength, a process associated with faster rates of phloem loading and triose-P export.
In fact, sink stimulation of photosynthesis occurs because faster rates of triose-P export inhibit starch accumulation in the leaves (chloroplasts), which has negative effects on the enzymes of CO2 fixation metabolism (Azcón-Bieto, 1983; Goldschmidt and Huber, 1992). As a matter of fact, there are other ways by which AM and rhizobial symbioses could affect plant physiology and thus photosynthesis [such as hormones (Goicoechea et al., 1997) and improved water relations (Augé, 2001)], however such mechanisms are of less relevance in photosynthetic physiology when plants are well supplied with water. Therefore, the theory of sink stimulation can only be applied for plants that are not limited by water. 1.4. Testing sink stimulation of photosynthesis
During photosynthesis, light energy is used by chlorophyll to split H2O and generate electrons, which are transferred through an electron gradient that supports the production of ATP and NADPH. The energy captured is used by ribulose 1,5 biphosphate carboxylase/oxygenase (rubisco E.C. 4.1.1.39) in the chloroplasts to fix atmospheric CO2, which is converted into sugars. These sugars can be rapidly exported out of the leaves or temporarily stored in the chloroplasts. The C costs of symbioses affect the partitioning of recently fixed C and thus affect the overall functioning of the photosynthetic metabolism.
Farquhar et al. (1980) developed a model of the C3 photosynthesis, which includes
General introduction
9
Figure 1.5. Responses of CO2 assimilation (A) of leaves of N-fertilized soybeans (Glycine max) to increasing intercellular CO2 concentration. Solid lines (AC) show that CO2 assimilation is limited by VC (Rubisco activity); dashed lines (Aj) show that CO2 assimilation is limited by VJ (electron transport rates); and thick gray lines (At) shows it is limited by VT (Triose-P utilization). The rates of CO2 assimilation fitted by the model are presented as circle symbols, as the minimum estimate of three responses at a given intercellular CO2 concentration. The parameter values for the fitted model were: VCmax = 59.4 µmol CO2 m
–2 s–
1, J = 140.9 µmol e– m–2 s–1, TP = 6.3 µmol triose-P m–2 s–1. This model is applied in Chapter 3 to predict ‘sink removal’ or ‘sink stimulation’ of photosynthesis of nodulated soybean plants.
two main limiting processes of leaf CO2 assimilation: (1) kinetics of rubisco activity (AC) and (2) electron transport rates and subsequent regeneration of ribulose 1,5 phosphate (AJ). Later, this model was extended to include a third limiting process: (3) triose-P utilization or export (AT) (Sharkey, 1985; Harley et al., 1992; von Caemmerer 2000; Sharkey et al., 2007), which depends on the C sink strength of the plant. The equations of this model are fitted to response curves of photosynthesis to increasing CO2 concentrations (e.g. Fig. 1.5; von Caemmerer, 2000), often measured with the open gas exchange system Li-6400 (LI-COR Inc., Lincoln, NE, USA). Whereas AC and AJ limitations of photosynthesis are expressed at lower CO2 concentrations, the AT limitation is expressed at high CO2 concentrations, particularly when associated with high light intensities or low atmospheric O2 (Fig. 1.5), due to a feedback of weak C sink strength on the rates of photosynthesis (Sharkey, 1985). In this thesis, I test the hypothesis that the C sink strength of AM and rhizobial symbioses is large enough to remove the AT limitation of photosynthesis.
0
5
10
15
20
25
30
35
40
45
50
0 250 500 750 1000 1250 1500
AcAjAtFitted model
Intercellular CO2 (µmol mol–1)
Pho
tosy
nthe
sis
(µm
ol C
O2
m–2
s–1
)Rubiscolimitation
Electron transportlimitation
TPUlimitation
Chapter 1
10
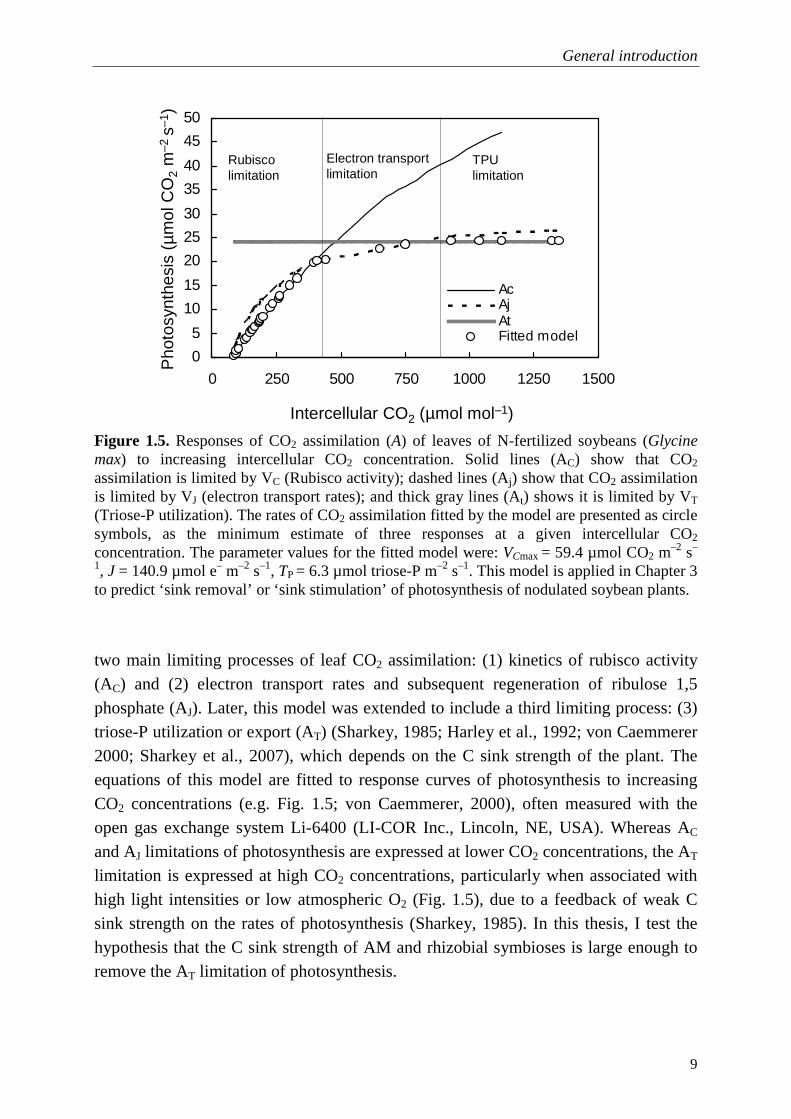
1.5. Objectives of the thesis
The objectives of the research described in this thesis were to: 1. Review the effects of AM and rhizobial symbioses on the rates of photosynthesis
and plant productivity, with emphasis on legumes; 2. Distinguish the effects of improved nutrition of AM and rhizobial symbioses from
the effects of increased C sink strength on the rates of photosynthesis; 3. Compare potential sink stimulation in AM and rhizobial symbioses; 4. Determine whether C costs of dual symbioses are additive or synergistic (i.e.
interaction between symbioses is such that the total effect is greater than the sum of the individual effects), and assess the degree of sink stimulation in single and dual symbioses;
5. Assess possible consequences of diverted C partitioning and sink stimulation of photosynthesis by AM and rhizobial symbioses on leaf senescence, plant growth and grain yield. (It has been suggested that increased photosynthesis prior to the early phase of senescence could lead to a longer photosynthetically-active life of leaves [Paul and Peliny, 2003] );
6. Implement the effect of sink stimulation of photosynthesis by AM and rhizobial symbioses in a conceptual mechanistic plant/crop growth model.
1.6. Hypotheses
I formulated five main hypotheses:
1. AM and rhizobial symbioses stimulate the rates of photosynthesis beyond a simple effect caused by the nutritional benefits.
2. Increases in the rates of photosynthesis in symbiotic plants are proportional to the C costs of the symbioses.
3. AM and rhizobial symbioses are not limited by plant C availability.
4. Plant growth is not decreased proportionally to the C costs of symbioses because the rates of photosynthesis are increased.
5. Symbiotic plants have higher rates of photosynthesis because the C costs of symbioses remove the limitation of triose-P utilization. If removal of sink limitation of photosynthesis does not explain increases in photosynthesis, then, photosynthesis is increased due to internal feedbacks between the rates of triose-P utilization, rubisco activity and electron transport rates.
General introduction
11
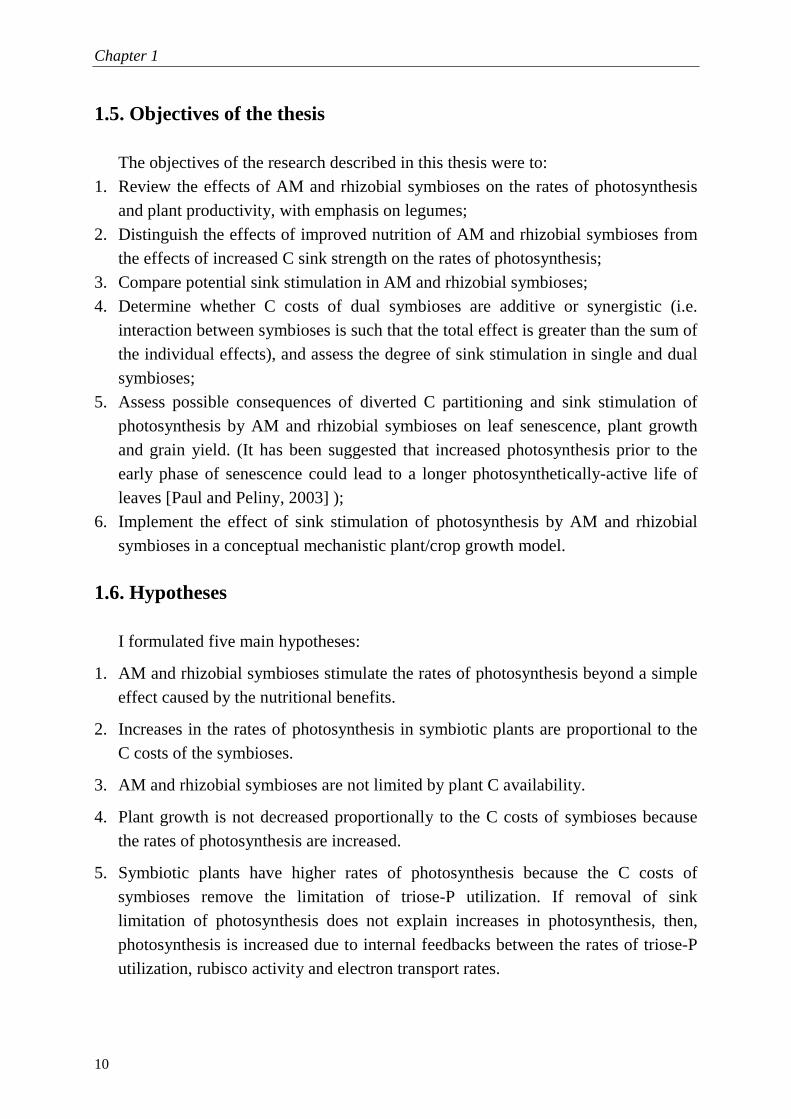
1.7. Outline of the thesis
Presumably sink stimulation of photosynthesis occurs in a wide range of plant species, with different life cycles (e.g. Fig. 1.4). However, I perform most of the analyses on legumes, because they allow for a direct comparison between AM and rhizobial symbioses. Legumes were also chosen because they play essential roles, particularly in tropical agro-ecosystems, as human food, fodder, green manure and, more recently, as a source of biofuel. In addition, physiology of one legume species, soybean (Glycine max (L.) Merrill), has been intensively studied over the last decades, and that is important for cross-checking and understanding overall physiological patterns. Furthermore, although the C costs of N2 fixation and nitrate uptake were analysed in detail during the 1970s and 1980s, it remained undecided whether the C costs of N2 fixation compromise the productivity of symbiotic legumes. If the C costs of N2 fixation are indeed compensated by sink stimulation of photosynthesis, it is interesting to know what the constraints are. This would allow us to maximize further increases of productivity of legumes solely relying on N2 fixation.
In Chapter 2, I review the effects of AM and rhizobial symbioses on leaf photosynthesis and leaf nutrition, considering a meta-analysis with data gathered from published studies as available in the SCOPUS and the Web of Science data-bases. The main key-words for this review were ‘photosynthesis’, ‘mycorrhiza’, ‘rhizobia’ and ‘legumes’. Photosynthesis can be measured at a whole plant basis and on a leaf area basis; my focus was on leaf area basis, and when available, on leaf mass basis. The response patterns obtained in this analysis were cross-checked with current understanding in photosynthesis physiology.
In Chapter 3, I describe a glasshouse experiment with soybean inoculated with rhizobia or fertilized with nitrate, in which the response curves of photosynthesis and several leaf metabolites (starch, sugars, chlorophyll, ureides, total nitrogen) were measured. Comparisons between nodulated and fertilized plants were based on plants with similar shoot weight and leaf nutrient concentrations. I apply a biochemical model of leaf photosynthesis to measured response curves of photosynthesis in order to test the hypotheses of removal of sink limitation versus sink stimulation of photosynthesis in plants reliant on N2 fixation (e.g. Fig. 1.5). I also attempted to perform similar experiments with AM fungi, but there were several methodological problems, including Mn toxicity and AM contamination in non-inoculated treatments, which I briefly comment upon in Appendix 1.
In Chapter 4, I discuss the role of sink stimulation of photosynthesis on the delay of leaf senescence based on two glasshouse experiments with soybean, in which I measured instantaneous rates of photosynthesis and leaf metabolites (starch, sugars,
Chapter 1
12
chlorophyll, soluble proteins, ureides, total nitrogen) at four stages of plant development.
In Chapter 5 (General Discussion), I use the knowledge acquired in the previous chapters to analyse possible consequences of the diverted C partitioning and sink stimulation of photosynthesis by AM and rhizobial symbioses on plant growth and grain yield of grain legumes. I also discuss the implication of sink stimulation of photosynthesis on the regulation of AM and rhizobial symbioses during plant development, and I identify gaps in our understanding in photosynthetic feedbacks, which have prevented an adequate inclusion of sink stimulation in crop models.
Chapter 2
Are the rates of photosynthesis stimulated by the carbon sink strength of rhizobial and arbuscular mycorrhizal symbioses?†
† This chapter is published as:
Kaschuk, G., Kuyper, T.W, Leffelaar, P.A., Hungria, M., Giller, K.E., 2009. Are the rates of photosynthesis
stimulated by the carbon sink strength of rhizobial and arbuscular mycorrhizal symbioses? Soil Biology &
Biochemistry 41, 1233-1244.
Chapter 2
14
Abstract
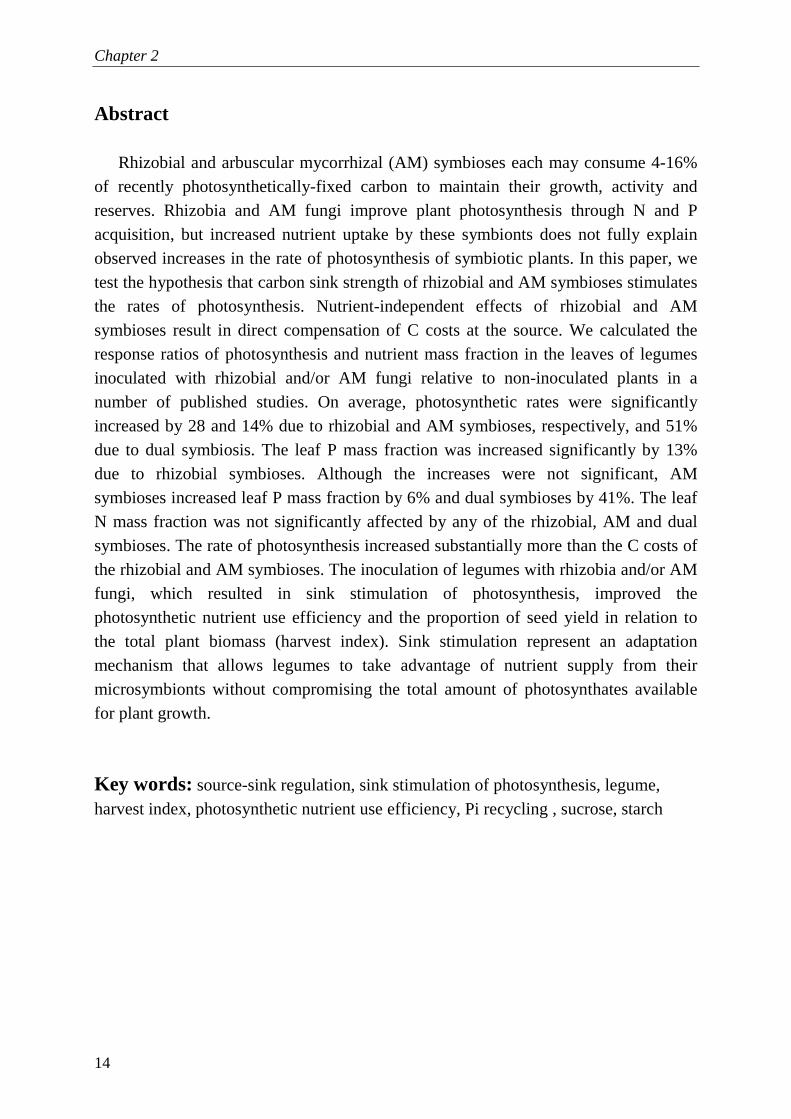
Rhizobial and arbuscular mycorrhizal (AM) symbioses each may consume 4-16% of recently photosynthetically-fixed carbon to maintain their growth, activity and reserves. Rhizobia and AM fungi improve plant photosynthesis through N and P acquisition, but increased nutrient uptake by these symbionts does not fully explain observed increases in the rate of photosynthesis of symbiotic plants. In this paper, we test the hypothesis that carbon sink strength of rhizobial and AM symbioses stimulates the rates of photosynthesis. Nutrient-independent effects of rhizobial and AM symbioses result in direct compensation of C costs at the source. We calculated the response ratios of photosynthesis and nutrient mass fraction in the leaves of legumes inoculated with rhizobial and/or AM fungi relative to non-inoculated plants in a number of published studies. On average, photosynthetic rates were significantly increased by 28 and 14% due to rhizobial and AM symbioses, respectively, and 51% due to dual symbiosis. The leaf P mass fraction was increased significantly by 13% due to rhizobial symbioses. Although the increases were not significant, AM symbioses increased leaf P mass fraction by 6% and dual symbioses by 41%. The leaf N mass fraction was not significantly affected by any of the rhizobial, AM and dual symbioses. The rate of photosynthesis increased substantially more than the C costs of the rhizobial and AM symbioses. The inoculation of legumes with rhizobia and/or AM fungi, which resulted in sink stimulation of photosynthesis, improved the photosynthetic nutrient use efficiency and the proportion of seed yield in relation to the total plant biomass (harvest index). Sink stimulation represent an adaptation mechanism that allows legumes to take advantage of nutrient supply from their microsymbionts without compromising the total amount of photosynthates available for plant growth.
Key words: source-sink regulation, sink stimulation of photosynthesis, legume, harvest index, photosynthetic nutrient use efficiency, Pi recycling , sucrose, starch

Sink stimulation of photosynthesis by symbioses?
15
2.1. Introduction Legumes associated with rhizobia and arbuscular mycorrhizal (AM) fungi show
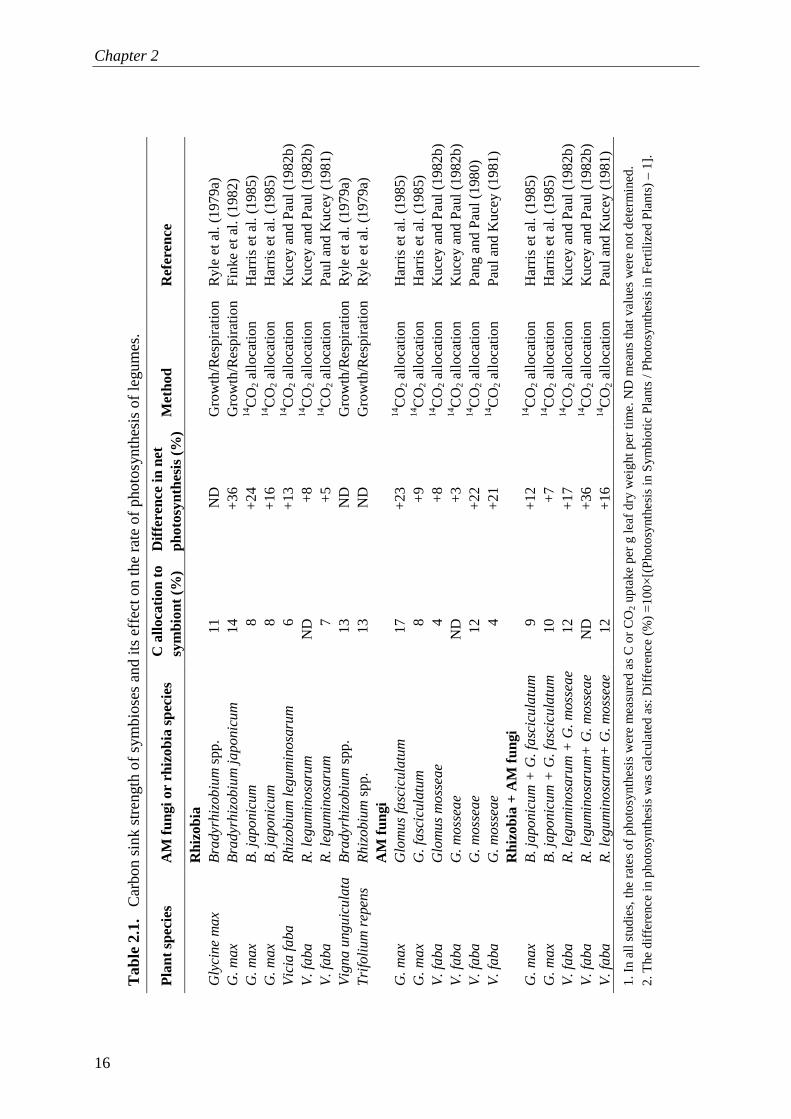
improved performance and higher yields than non-symbiotic plants. These positive effects of rhizobial and AM symbioses have been attributed to an improved nutritional state (due to N supplied by rhizobia and P by AM fungi), which in turn leads to increased photosynthetic rates and improved plant growth. Simultaneously, there is a cost to the legume of rhizobial and AM symbioses, as each may consume as much as 4-16% of recently fixed photosynthetic carbon to maintain their activity (Table 2.1). The photosynthate (C) derived from photosynthesis to maintain the performance of these symbioses is often referred to as the “cost”, and the nutrients obtained through the symbioses are often referred to as the “benefit” of the symbiont (Koide and Elliot, 1989; Fitter, 1991). The N and P acquired are the benefits from rhizobia and AM fungi, respectively, and the C costs are expressed in terms of g C g–1 N and g C g–1 P. There is evidence that AM fungi also play a role in the uptake of nitrate and ammonium (e.g. Olsson et al., 2005; Smith and Read, 2008) which are assimilated and transported within the mycelium as arginine, but compared with ectomycorrhizas, rates of N uptake by AM hyphae are too small to contribute substantially to plant N nutrition (Smith and Read, 2008).
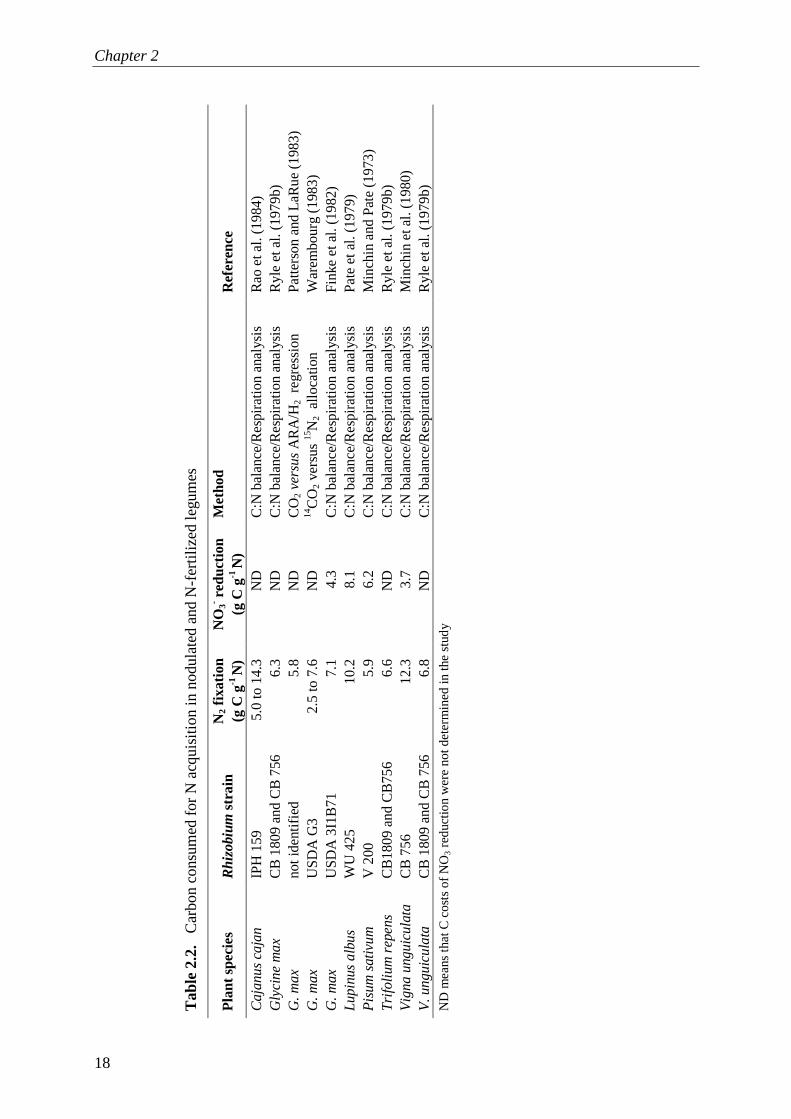
The C costs of N acquisition by N2 fixation are compared with N acquisition by NO3
– uptake, based on several methods in Table 2.2. The C costs of N2 fixation are almost exclusively incurred in the biochemical reactions of N2 fixation (Witty et al., 1983; Ryle et al., 1984; Voisin et al., 2003). On a theoretical basis, the C costs of N2 fixation should range between 3.3 and 6.6 g C g–1 N, depending on the legume-rhizobia combination, whereas NO3
– reduction should not exceed 2.5 g C g–1 N (Atkins, 1984, Minchin and Witty, 2005). Except for pea (Pisum sativum L.) (Minchin and Pate, 1973), the costs of N acquisition through rhizobia are always higher than by NO3
– uptake (Table 2.2). The differences in C costs may be small and not always statistically significant, but when integrated over the whole growth cycle the costs may be substantial.
Literature on the C costs of P uptake via AM symbioses is less abundant. By analyzing the radio-labelled 14CO2 allocation patterns, Harris et al. (1985) determined that mycorrhizal roots spent 199 g C g–1 P whereas non-mycorrhizal roots receiving N fertilizer or inoculated with rhizobia spent 129 and 127 g C g–1 P, respectively. The carbon costs of P uptake by roots only was 130 and due to mycorrhizal hyphae was twice as large (267 g C g–1 P) (Harris et al., 1985). Smith and Read (2008) argue that C costs based on length are less for mycorrhizal hyphae because they are much thinner than roots and can exploit larger soil volumes for the same amount of C. The C costs
Chapter 2
16
Tab
le 2
.1.
Car
bon
sink
str
engt
h o
f sym
bios
es a
nd
its e
ffect
on
the
rate
of
phot
osyn
thes
is o
f le
gum
es.
Pla
nt s
peci
es
AM
fung
i or
rhiz
obia
spe
cies
C
allo
catio
n to
sy
mbi
ont (
%)
Diff
eren
ce in
net
ph
otos
ynth
esis
(%
) M
etho
d R
efer
ence
R
hizo
bia
Gly
cine
max
Bra
dyr
hizo
biu
m
spp.
11
N
D
Gro
wth
/Re
spir
atio
n R
yle
et
al. (
1979
a)
G. m
ax
Bra
dyr
hizo
biu
m ja
poni
cum
14
+
36
Gro
wth
/Re
spir
atio
n F
inke
et
al. (
1982
) G
. m
ax
B. ja
poni
cum
8 +
24
14C
O2
allo
catio
n H
arr
is e
t al
. (19
85)
G. m
ax
B. ja
poni
cum
8
+16
14
CO
2 a
lloca
tion
Ha
rris
et
al. (
1985
) V
icia
faba
R
hiz
obi
um
legum
inosa
rum
6
+13
14
CO
2 a
lloca
tion
Kuc
ey
and
Pa
ul (
1982
b) V
. fa
ba
R. le
gum
inosa
rum
N
D
+8
14C
O2
allo
catio
n K
uce
y a
nd P
aul
(19
82b)
V. fa
ba
R. le
gum
inosa
rum
7
+5
14C
O2
allo
catio
n P
aul
and
Kuc
ey
(198
1)
Vig
na u
nguic
ula
ta B
radyr
hizo
biu
m sp
p.
13
ND
G
row
th/R
esp
irat
ion
Ryl
e e
t al
. (19
79a)
T
rifo
lium
re
pens
Rhiz
obi
um
sp
p.
13
ND
G
row
th/R
esp
irat
ion
Ryl
e e
t al
. (19
79a)
AM
fung
i
G
. m
ax
Glo
mus
fasc
icul
atu
m
17
+23
14
CO
2 a
lloca
tion
Ha
rris
et
al. (
1985
) G
. m
ax
G. fa
scic
ulat
um
8
+9
14C
O2
allo
catio
n H
arr
is e
t al
. (19
85)
V. fa
ba
Glo
mus
moss
eae
4
+8
14C
O2
allo
catio
n K
uce
y a
nd P
aul
(19
82b)
V. fa
ba
G. m
oss
eae
N
D
+3
14C
O2
allo
catio
n K
uce
y a
nd P
aul
(19
82b)
V. fa
ba
G. m
oss
eae
12
+
22
14C
O2
allo
catio
n P
ang
and
Pa
ul (
1980
) V
. fa
ba
G. m
oss
eae
4
+21
14
CO
2 a
lloca
tion
Pa
ul a
nd K
uce
y (1
981)
Rhi
zobi
a +
AM
fung
i
G
. m
ax
B. ja
poni
cum
+ G
. fasc
icula
tum
9 +
12
14C
O2
allo
catio
n H
arr
is e
t al
. (19
85)
G. m
ax
B. ja
poni
cum
+ G
. fasc
icula
tum
10
+
7 14
CO
2 a
lloca
tion
Ha
rris
et
al. (
1985
) V
. fa
ba
R. le
gum
inosa
rum
+ G
. m
osse
ae
12
+
17
14C
O2
allo
catio
n K
uce
y a
nd P
aul
(19
82b)
V. fa
ba
R. le
gum
inosa
rum
+ G
. m
oss
eae
N
D
+36
14
CO
2 a
lloca
tion
Kuc
ey
and
Pa
ul (
1982
b) V
. fa
ba
R. le
gum
inosa
rum
+ G
. m
oss
eae
12
+
16
14C
O2
allo
catio
n P
aul
and
Kuc
ey
(198
1)
1.
In a
ll st
udie
s, t
he r
ate
s o
f pho
tosy
nthe
sis
we
re m
ea
sure
d a
s C
or
CO
2 up
take
pe
r g
lea
f d
ry w
eig
ht p
er
time
. N
D m
ea
ns
tha
t va
lue
s w
ere
no
t d
ete
rmin
ed
.
2. T
he d
iffe
renc
e in
pho
tosy
nth
esi
s w
as
calc
ula
ted
a
s: D
iffe
renc
e (
%)
=1
00
×[(
Pho
tosy
nthe
sis
in S
ymb
iot
ic P
lant
s /
Pho
tosy
nthe
sis
in F
ert
ilize
d P
lant
s) –
1
].
Sink stimulation of photosynthesis by symbioses?
17
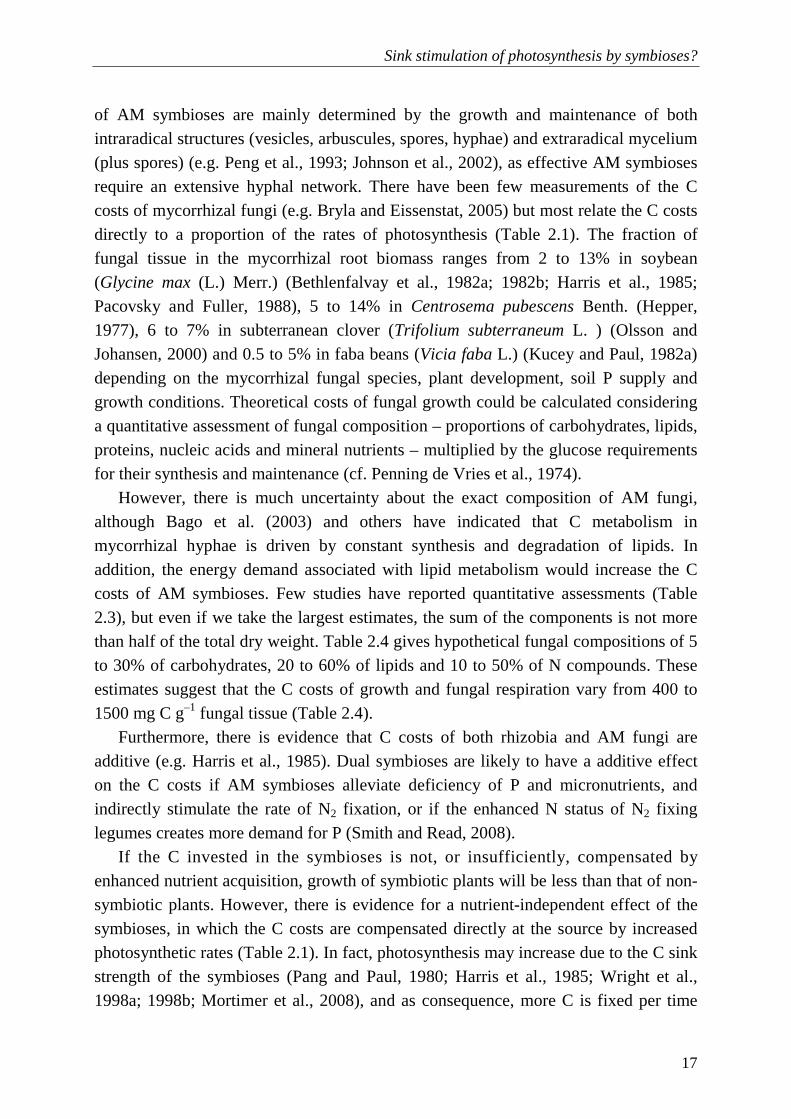
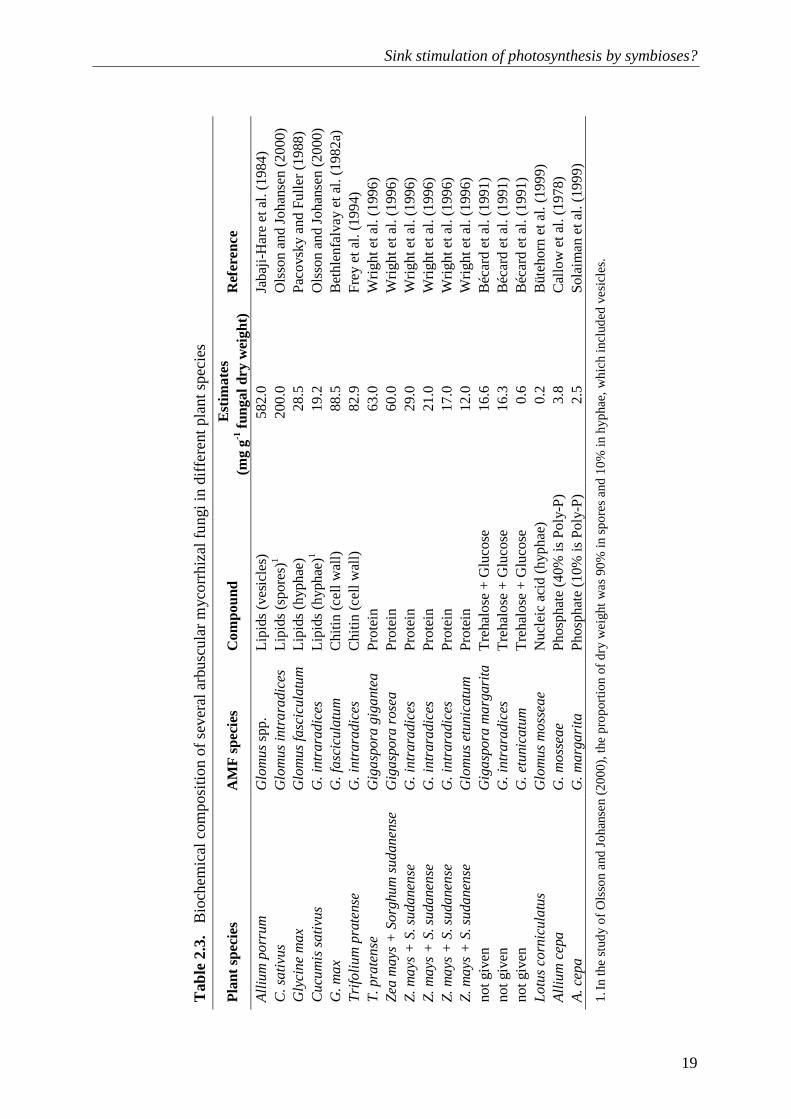
of AM symbioses are mainly determined by the growth and maintenance of both intraradical structures (vesicles, arbuscules, spores, hyphae) and extraradical mycelium (plus spores) (e.g. Peng et al., 1993; Johnson et al., 2002), as effective AM symbioses require an extensive hyphal network. There have been few measurements of the C costs of mycorrhizal fungi (e.g. Bryla and Eissenstat, 2005) but most relate the C costs directly to a proportion of the rates of photosynthesis (Table 2.1). The fraction of fungal tissue in the mycorrhizal root biomass ranges from 2 to 13% in soybean (Glycine max (L.) Merr.) (Bethlenfalvay et al., 1982a; 1982b; Harris et al., 1985; Pacovsky and Fuller, 1988), 5 to 14% in Centrosema pubescens Benth. (Hepper, 1977), 6 to 7% in subterranean clover (Trifolium subterraneum L. ) (Olsson and Johansen, 2000) and 0.5 to 5% in faba beans (Vicia faba L.) (Kucey and Paul, 1982a) depending on the mycorrhizal fungal species, plant development, soil P supply and growth conditions. Theoretical costs of fungal growth could be calculated considering a quantitative assessment of fungal composition – proportions of carbohydrates, lipids, proteins, nucleic acids and mineral nutrients – multiplied by the glucose requirements for their synthesis and maintenance (cf. Penning de Vries et al., 1974).
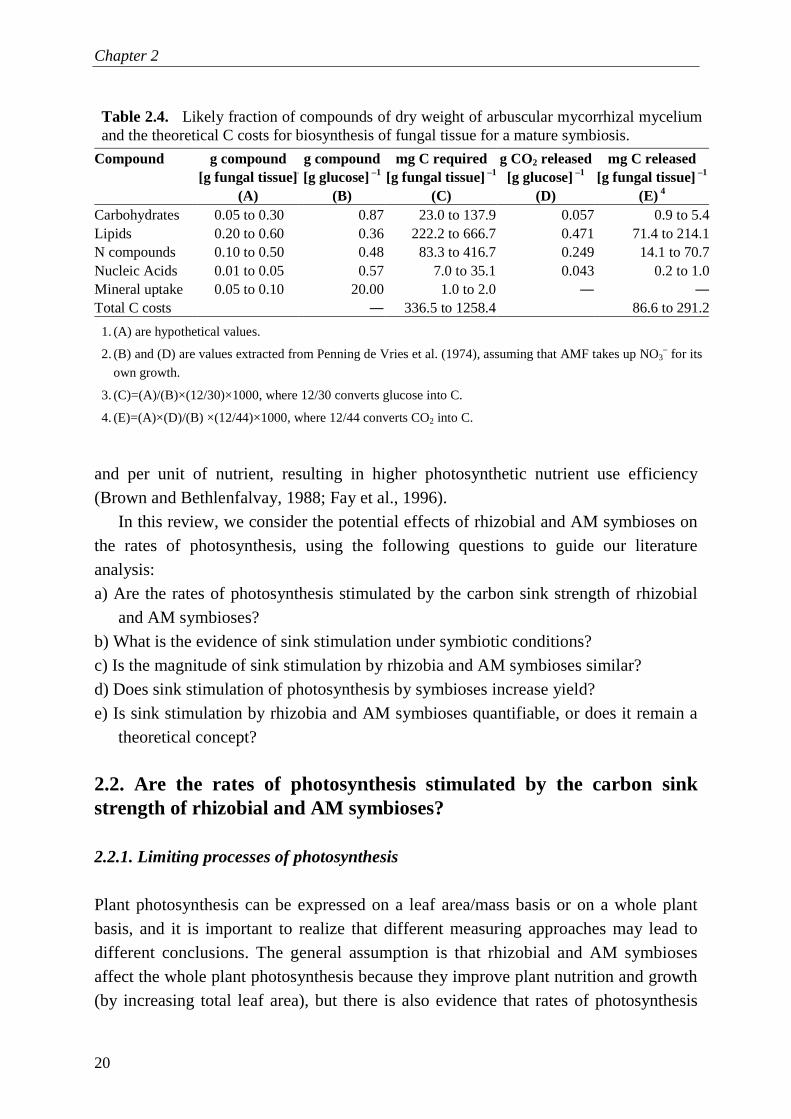
However, there is much uncertainty about the exact composition of AM fungi, although Bago et al. (2003) and others have indicated that C metabolism in mycorrhizal hyphae is driven by constant synthesis and degradation of lipids. In addition, the energy demand associated with lipid metabolism would increase the C costs of AM symbioses. Few studies have reported quantitative assessments (Table 2.3), but even if we take the largest estimates, the sum of the components is not more than half of the total dry weight. Table 2.4 gives hypothetical fungal compositions of 5 to 30% of carbohydrates, 20 to 60% of lipids and 10 to 50% of N compounds. These estimates suggest that the C costs of growth and fungal respiration vary from 400 to 1500 mg C g–1 fungal tissue (Table 2.4).
Furthermore, there is evidence that C costs of both rhizobia and AM fungi are additive (e.g. Harris et al., 1985). Dual symbioses are likely to have a additive effect on the C costs if AM symbioses alleviate deficiency of P and micronutrients, and indirectly stimulate the rate of N2 fixation, or if the enhanced N status of N2 fixing legumes creates more demand for P (Smith and Read, 2008).
If the C invested in the symbioses is not, or insufficiently, compensated by enhanced nutrient acquisition, growth of symbiotic plants will be less than that of non-symbiotic plants. However, there is evidence for a nutrient-independent effect of the symbioses, in which the C costs are compensated directly at the source by increased photosynthetic rates (Table 2.1). In fact, photosynthesis may increase due to the C sink strength of the symbioses (Pang and Paul, 1980; Harris et al., 1985; Wright et al., 1998a; 1998b; Mortimer et al., 2008), and as consequence, more C is fixed per time
Chapter 2
18
T
able
2.2
. C
arbo
n co
nsum
ed fo
r N
acq
uisi
tion
in n
odul
ated
and
N-f
ertil
ized
legu
mes
Pla
nt s
peci
es
Rhi
zobi
um s
trai
n N
2 fix
atio
n (g
C g
-1 N
) N
O3- r
educ
tion
(g C
g-1
N)
Met
hod
Ref
eren
ce
Caj
anus
ca
jan
IP
H 1
59
5.0
to 1
4.3
ND
C
:N b
alan
ce/R
espi
ratio
n an
alys
is
Rao
et a
l. (1
984)
G
lyci
ne
ma
x C
B 1
809
and
CB
756
6.
3 N
D
C:N
bal
ance
/Res
pira
tion
ana
lysi
s R
yle
et a
l. (1
979b
)
G. m
ax
not
iden
tifie
d 5.
8 N
D
CO 2
vers
us A
RA
/H2
reg
ress
ion
Pat
ters
on a
nd L
aRue
(19
83)
G. m
ax
US
DA
G3
2.5
to 7
.6
ND
14
CO
2 ve
rsus
15N
2 a
lloca
tion
War
embo
urg
(198
3)
G. m
ax
US
DA
3I1
B71
7.
1 4.
3 C
:N b
alan
ce/R
espi
ratio
n an
alys
is
Fin
ke e
t al.
(198
2)
Lupi
nus
alb
us
WU
425
10
.2
8.1
C:N
bal
ance
/Res
pira
tion
anal
ysis
P
ate
et
al. (
1979
) P
isum
sat
ivu
m
V 2
00
5.9
6.2
C:N
bal
ance
/Res
pira
tion
anal
ysis
M
inc
hin
and
Pat
e (1
973)
T
rifo
lium
rep
ens
C
B18
09 a
nd C
B75
6 6.
6 N
D
C:N
bal
ance
/Res
pira
tion
ana
lysi
s R
yle
et a
l. (1
979b
) V
igna
ung
uicu
lata
C
B 7
56
12.3
3.
7 C
:N b
alan
ce/R
espi
ratio
n an
alys
is
Mi
nchi
n et
al.
(198
0)
V. u
ngu
icul
ata
C
B 1
809
and
CB
756
6.
8 N
D
C:N
bal
ance
/Res
pira
tion
ana
lysi
s R
yle
et a
l. (1
979b
) N
D m
eans
that
C c
osts
of N
O3
red
uctio
n w
ere
not d
eter
min
ed in
the
stud
y
Sink stimulation of photosynthesis by symbioses?
19
T
able
2.3
. B
ioch
emic
al c
ompo
sitio
n of
sev
eral
arb
uscu
lar
myc
orr
hiza
l fu
ngi i
n di
ffe
rent
pla
nt s
peci
es
Pla
nt s
peci
es
AM
F s
peci
es
Com
poun
d E
stim
ates
(m
g g-1
fung
al d
ry w
eigh
t)
Ref
eren
ce
Alli
um
po
rru
m
Glo
mu
s spp
. Li
pids
(ve
sicl
es)
58
2.0
Jaba
ji-H
are
et a
l. (1
984)
C
. sa
tivu
s G
lom
us
intr
ara
dice
s Li
pids
(sp
ore
s)1 20
0.0
Ols
son
and
Joh
anse
n (2
000)
G
lyci
ne
ma
x G
lom
us
fasc
icul
atu
m Lipi
ds (
hyph
ae)
28.5
P
acov
sky
and
Ful
ler
(198
8)
Cu
cum
is s
ativ
us
G. in
trar
adi
ces
Lipi
ds (
hyph
ae)1
19.2
O
lsso
n a
nd J
ohan
sen
(200
0)
G. m
ax
G. fa
scic
ulat
um
C
hitin
(ce
ll w
all)
88
.5
Bet
hle
nfa
lva
y et
al.
(198
2a)
Trifo
lium
pra
tens
e
G. in
trar
adi
ces
Chi
tin (
cell
wal
l) 82
.9
Fre
y e
t al
. (19
94)
T. pr
ate
nse
G
iga
spor
a g
iga
nte
a P
rote
in
63.0
W
righ
t et a
l. (1
996)
Z
ea
ma
ys +
So
rghu
m s
ud
ane
nse
G
iga
spor
a r
ose
a P
rote
in
60.0
W
righ
t et a
l. (1
996)
Z
. m
ays
+ S
. su
dane
nse
G
. in
trar
adi
ces
Pro
tein
29
.0
Wri
ght e
t al.
(199
6)
Z. m
ays
+ S
. su
dane
nse
G
. in
trar
adi
ces
Pro
tein
21
.0
Wri
ght e
t al.
(199
6)
Z. m
ays
+ S
. su
dane
nse
G
. in
trar
adi
ces
Pro
tein
17
.0
Wri
ght e
t al.
(199
6)
Z. m
ays
+ S
. su
dane
nse
G
lom
us
etu
nica
tum
Pro
tein
12.0
W
righ
t et a
l. (1
996)
no
t giv
en
Gig
asp
ora
ma
rgar
ita T
reha
lose
+ G
luco
se
16.6
B
éca
rd e
t al.
(199
1)
not g
ive
n G
. in
trar
adi
ces
Tre
halo
se +
Glu
cose
16
.3
Béc
ard
et a
l. (1
991)
no
t giv
en
G. e
tuni
catu
m
Tre
halo
se +
Glu
cose
0.
6 B
éca
rd e
t al.
(199
1)
Lo
tus
corn
icul
atu
s G
lom
us
mo
sse
ae
N
ucle
ic a
cid
(hyp
hae)
0.
2 B
üte
horn
et
al. (
1999
) A
lliu
m c
epa
G
. m
oss
ea
e
Pho
spha
te (
40%
is P
oly-
P)
3.8
Cal
low
et
al. (
1978
) A
. ce
pa
G
. m
arg
arita
P
hosp
hate
(10
% is
Pol
y-P
) 2.
5 S
olai
ma
n e
t al
. (19
99)
1. I
n th
e s
tud
y o
f Ols
son
and
Jo
hans
en
(20
00
), t
he p
rop
ortio
n of
dry
we
ight
wa
s 9
0%
in s
po
res
and
10
% in
h
ypha
e,
wh
ich
incl
ude
d v
esi
cle
s.
Chapter 2
20
and per unit of nutrient, resulting in higher photosynthetic nutrient use efficiency (Brown and Bethlenfalvay, 1988; Fay et al., 1996).
In this review, we consider the potential effects of rhizobial and AM symbioses on the rates of photosynthesis, using the following questions to guide our literature analysis: a) Are the rates of photosynthesis stimulated by the carbon sink strength of rhizobial
and AM symbioses? b) What is the evidence of sink stimulation under symbiotic conditions? c) Is the magnitude of sink stimulation by rhizobia and AM symbioses similar? d) Does sink stimulation of photosynthesis by symbioses increase yield? e) Is sink stimulation by rhizobia and AM symbioses quantifiable, or does it remain a
theoretical concept?
2.2. Are the rates of photosynthesis stimulated by the carbon sink strength of rhizobial and AM symbioses?
2.2.1. Limiting processes of photosynthesis Plant photosynthesis can be expressed on a leaf area/mass basis or on a whole plant basis, and it is important to realize that different measuring approaches may lead to different conclusions. The general assumption is that rhizobial and AM symbioses affect the whole plant photosynthesis because they improve plant nutrition and growth (by increasing total leaf area), but there is also evidence that rates of photosynthesis
Table 2.4. Likely fraction of compounds of dry weight of arbuscular mycorrhizal mycelium and the theoretical C costs for biosynthesis of fungal tissue for a mature symbiosis.
Compound g compound [g fungal tissue]–
(A)
g compound [g glucose] –1
(B)
mg C required [g fungal tissue] –1
(C)
g CO2 released [g glucose] –1
(D)
mg C released [g fungal tissue] –1
(E) 4 Carbohydrates 0.05 to 0.30 0.87 23.0 to 137.9 0.057 0.9 to 5.4Lipids 0.20 to 0.60 0.36 222.2 to 666.7 0.471 71.4 to 214.1N compounds 0.10 to 0.50 0.48 83.3 to 416.7 0.249 14.1 to 70.7Nucleic Acids 0.01 to 0.05 0.57 7.0 to 35.1 0.043 0.2 to 1.0Mineral uptake 0.05 to 0.10 20.00 1.0 to 2.0 ― ―
Total C costs ― 336.5 to 1258.4 86.6 to 291.2
1. (A) are hypothetical values.
2. (B) and (D) are values extracted from Penning de Vries et al. (1974), assuming that AMF takes up NO3– for its
own growth.
3. (C)=(A)/(B)×(12/30)×1000, where 12/30 converts glucose into C.
4. (E)=(A)×(D)/(B) ×(12/44)×1000, where 12/44 converts CO2 into C.
Sink stimulation of photosynthesis by symbioses?
21
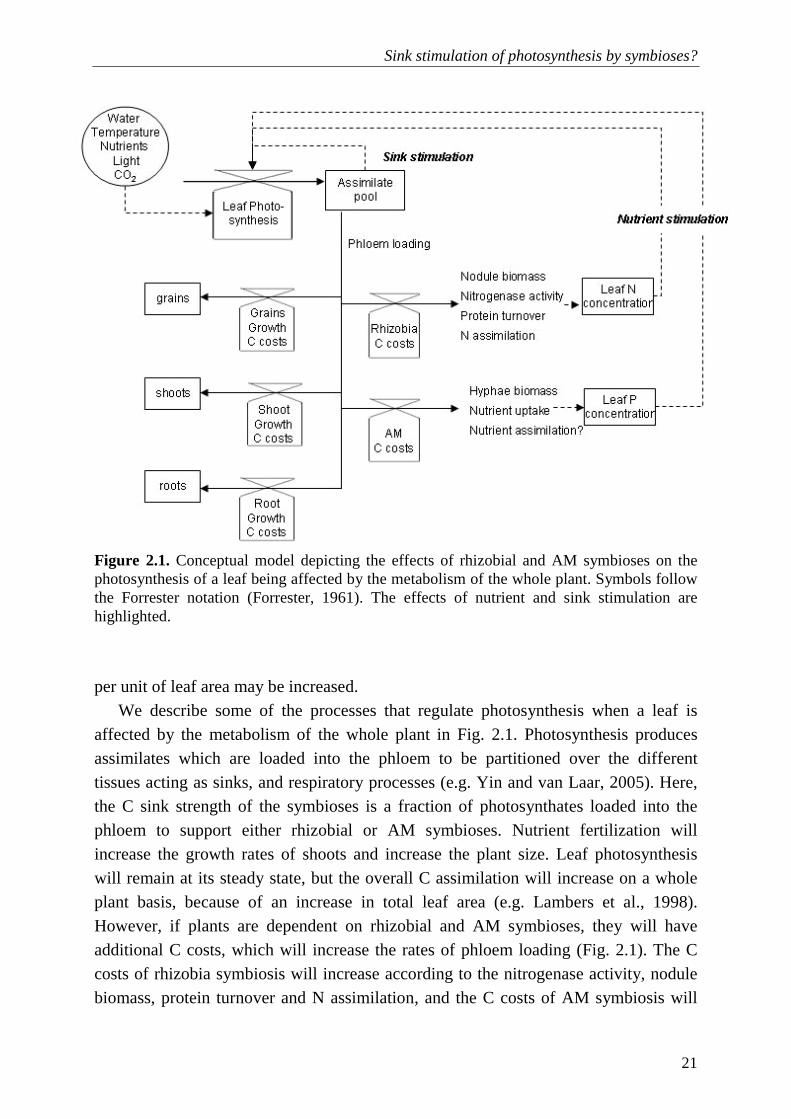
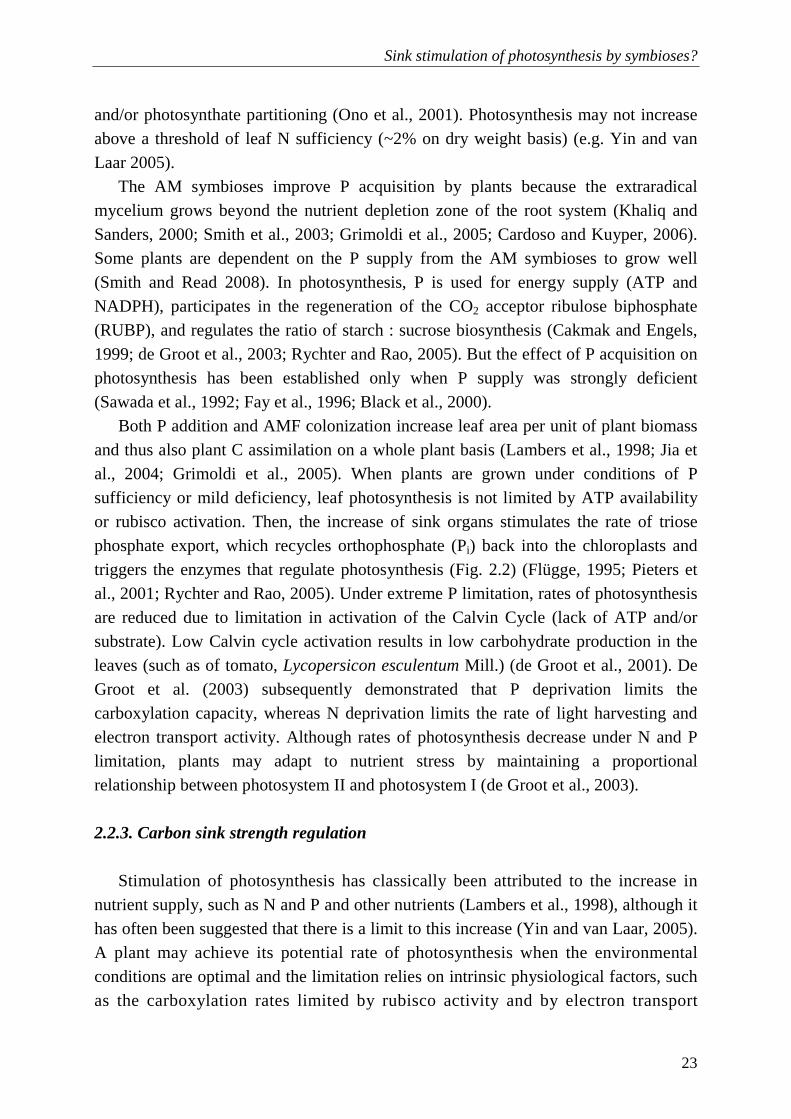
Figure 2.1. Conceptual model depicting the effects of rhizobial and AM symbioses on the photosynthesis of a leaf being affected by the metabolism of the whole plant. Symbols follow the Forrester notation (Forrester, 1961). The effects of nutrient and sink stimulation are highlighted.
per unit of leaf area may be increased.
We describe some of the processes that regulate photosynthesis when a leaf is affected by the metabolism of the whole plant in Fig. 2.1. Photosynthesis produces assimilates which are loaded into the phloem to be partitioned over the different tissues acting as sinks, and respiratory processes (e.g. Yin and van Laar, 2005). Here, the C sink strength of the symbioses is a fraction of photosynthates loaded into the phloem to support either rhizobial or AM symbioses. Nutrient fertilization will increase the growth rates of shoots and increase the plant size. Leaf photosynthesis will remain at its steady state, but the overall C assimilation will increase on a whole plant basis, because of an increase in total leaf area (e.g. Lambers et al., 1998). However, if plants are dependent on rhizobial and AM symbioses, they will have additional C costs, which will increase the rates of phloem loading (Fig. 2.1). The C costs of rhizobia symbiosis will increase according to the nitrogenase activity, nodule biomass, protein turnover and N assimilation, and the C costs of AM symbiosis will
Chapter 2
22
increase according to the formation of fungal biomass, nutrient uptake and possibly by nutrient assimilation (see also Section 2.4). On the one hand, rhizobia and AM symbioses increase the nutrient mass fraction in leaves (namely N and P) and therefore may stimulate the rate of photosynthesis – nutrient stimulation (Section 2.2). On the other hand, the C costs of rhizobial and AM symbioses increase the rate of phloem loading, and therefore, stimulate the rate of photosynthesis – sink stimulation (Section 2.3)
Our current understanding is that leaf photosynthesis is limited by three biochemical processes: rubisco (ribulose 1,5 biphosphate carboxylase/oxygenase, E.C. 4.1.1.39) activity, electron transport rates and consequent ribulose-1,5-biphosphate regeneration (Farquhar et al., 1980), and triose-P utilization (Sharkey, 1985). Water availability, temperature and nutrients, particularly N, P, and enzyme components and co-factors (i.e. Mg, Fe, Cu, Mn) are important for the proper functioning of these photosynthetic processes (Lambers et al., 1998; Cakmak and Engels, 1999). Additionally, rubisco activity is limited by atmospheric CO2 concentration, the electron transport rate is limited by light availability, and the triose-P utilization is limited by the plant C sink strength (Farquhar et al., 1980; Sharkey, 1985; von Caemmerer, 2000). Therefore, we assume that rhizobia and AM symbioses affect photosynthesis by removing the limitation of rubisco activity and electron transport rates through increases in leaf N and P mass fraction. Additionally, rhizobia and AM symbioses and its related C costs increase photosynthesis by removing the triose-P export limitation of photosynthesis.
2.2.2. Role of N and P acquisition
In rhizobial symbioses, the bacterial enzymatic complex nitrogenase (E.C.
1.18.6.1) breaks the highly-stable triple bond of N2 and reduces it to NH3. If a successful symbiosis is established, biological N2-fixation can supply the majority of the N required by legumes (Zapata et al., 1987; Hungria et al., 2005). Nitrogen is essential for the synthesis of rubisco and for the synthesis of light-harvesting chlorophyll (Evans, 1989; Hikosaka and Terashima, 1995). As N2 fixation enhances leaf N mass fraction, it should stimulate the rate of leaf photosynthesis by increasing rubisco activity and electron transport rates (e.g. Harley et al., 1992).
The relationship between N mass fraction in the leaves and the rates of photosynthesis of C3 plants is not consistently linear. In fact, the gain in photosynthesis decreases gradually with increases in rubisco content (Märchler et al. 1988; Hikosaka and Terashima, 1995; Nelson and Cox, 2004), and N partitioning in the leaves changes according to the light environment (Hikosaka and Terahima, 1995),
Sink stimulation of photosynthesis by symbioses?
23
and/or photosynthate partitioning (Ono et al., 2001). Photosynthesis may not increase above a threshold of leaf N sufficiency (~2% on dry weight basis) (e.g. Yin and van Laar 2005).
The AM symbioses improve P acquisition by plants because the extraradical mycelium grows beyond the nutrient depletion zone of the root system (Khaliq and Sanders, 2000; Smith et al., 2003; Grimoldi et al., 2005; Cardoso and Kuyper, 2006). Some plants are dependent on the P supply from the AM symbioses to grow well (Smith and Read 2008). In photosynthesis, P is used for energy supply (ATP and NADPH), participates in the regeneration of the CO2 acceptor ribulose biphosphate (RUBP), and regulates the ratio of starch : sucrose biosynthesis (Cakmak and Engels, 1999; de Groot et al., 2003; Rychter and Rao, 2005). But the effect of P acquisition on photosynthesis has been established only when P supply was strongly deficient (Sawada et al., 1992; Fay et al., 1996; Black et al., 2000).
Both P addition and AMF colonization increase leaf area per unit of plant biomass and thus also plant C assimilation on a whole plant basis (Lambers et al., 1998; Jia et al., 2004; Grimoldi et al., 2005). When plants are grown under conditions of P sufficiency or mild deficiency, leaf photosynthesis is not limited by ATP availability or rubisco activation. Then, the increase of sink organs stimulates the rate of triose phosphate export, which recycles orthophosphate (Pi) back into the chloroplasts and triggers the enzymes that regulate photosynthesis (Fig. 2.2) (Flügge, 1995; Pieters et al., 2001; Rychter and Rao, 2005). Under extreme P limitation, rates of photosynthesis are reduced due to limitation in activation of the Calvin Cycle (lack of ATP and/or substrate). Low Calvin cycle activation results in low carbohydrate production in the leaves (such as of tomato, Lycopersicon esculentum Mill.) (de Groot et al., 2001). De Groot et al. (2003) subsequently demonstrated that P deprivation limits the carboxylation capacity, whereas N deprivation limits the rate of light harvesting and electron transport activity. Although rates of photosynthesis decrease under N and P limitation, plants may adapt to nutrient stress by maintaining a proportional relationship between photosystem II and photosystem I (de Groot et al., 2003).
2.2.3. Carbon sink strength regulation
Stimulation of photosynthesis has classically been attributed to the increase in
nutrient supply, such as N and P and other nutrients (Lambers et al., 1998), although it has often been suggested that there is a limit to this increase (Yin and van Laar, 2005). A plant may achieve its potential rate of photosynthesis when the environmental conditions are optimal and the limitation relies on intrinsic physiological factors, such as the carboxylation rates limited by rubisco activity and by electron transport
Chapter 2
24
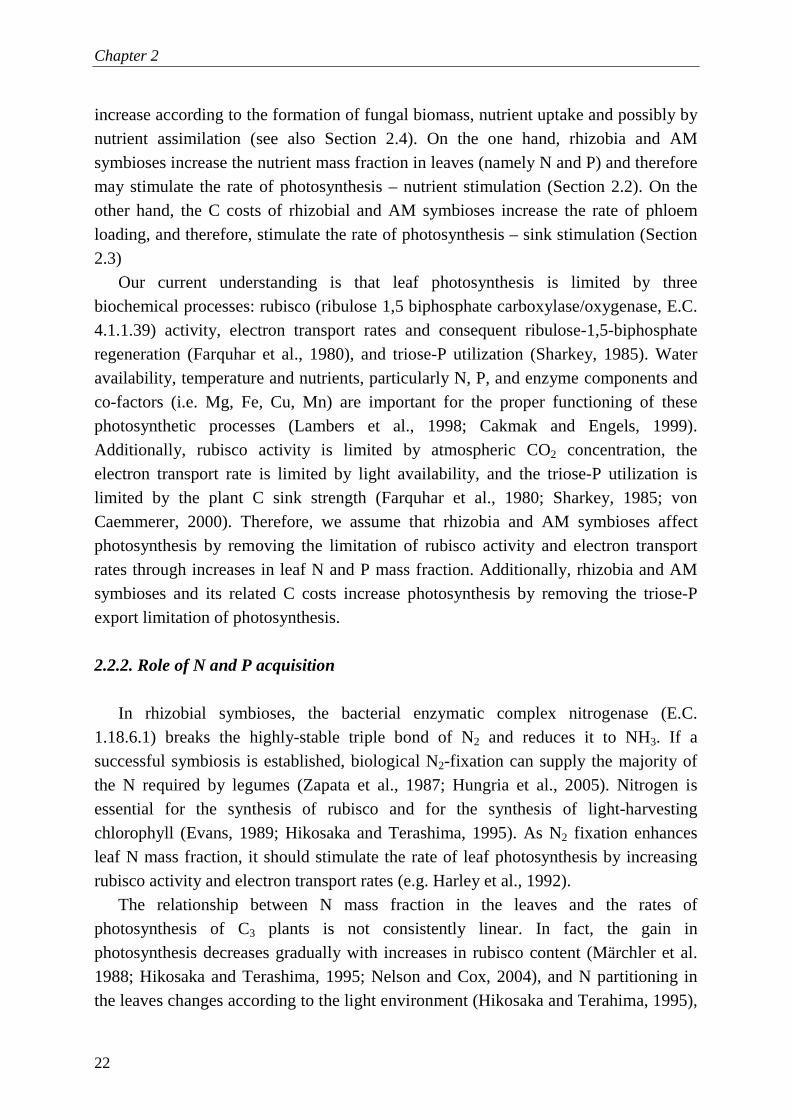
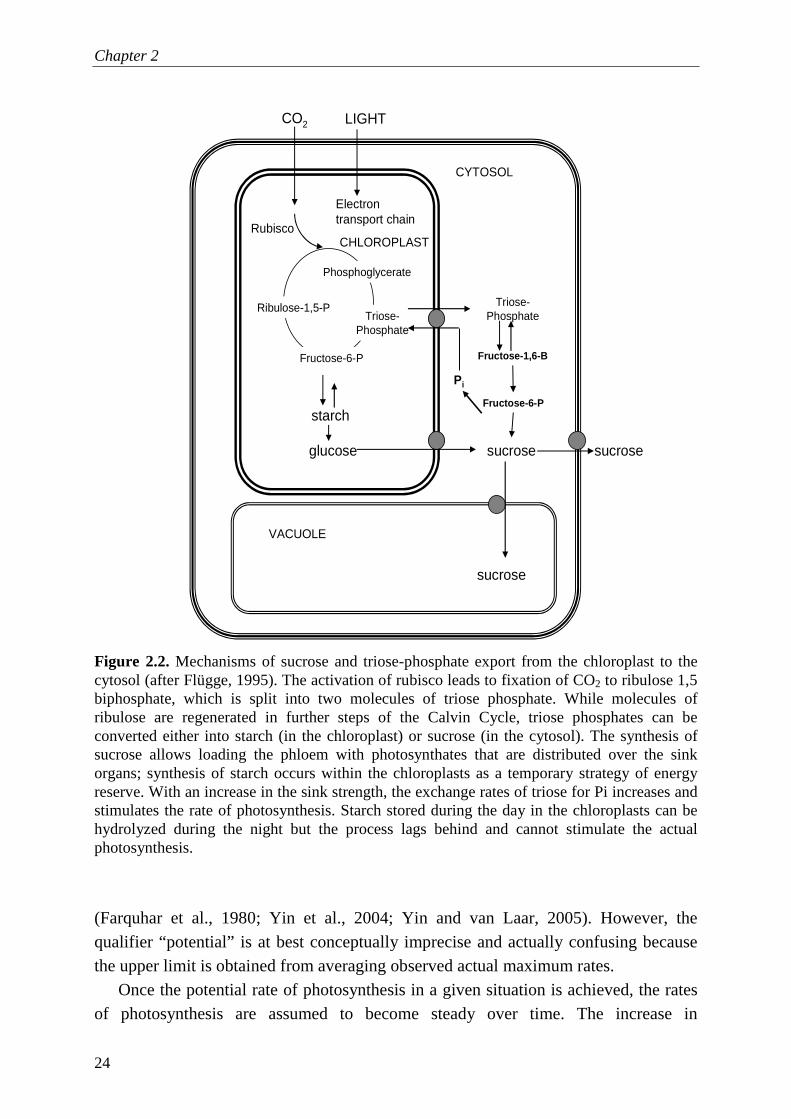
Figure 2.2. Mechanisms of sucrose and triose-phosphate export from the chloroplast to the cytosol (after Flügge, 1995). The activation of rubisco leads to fixation of CO2 to ribulose 1,5 biphosphate, which is split into two molecules of triose phosphate. While molecules of ribulose are regenerated in further steps of the Calvin Cycle, triose phosphates can be converted either into starch (in the chloroplast) or sucrose (in the cytosol). The synthesis of sucrose allows loading the phloem with photosynthates that are distributed over the sink organs; synthesis of starch occurs within the chloroplasts as a temporary strategy of energy reserve. With an increase in the sink strength, the exchange rates of triose for Pi increases and stimulates the rate of photosynthesis. Starch stored during the day in the chloroplasts can be hydrolyzed during the night but the process lags behind and cannot stimulate the actual photosynthesis.
(Farquhar et al., 1980; Yin et al., 2004; Yin and van Laar, 2005). However, the qualifier “potential” is at best conceptually imprecise and actually confusing because the upper limit is obtained from averaging observed actual maximum rates.
Once the potential rate of photosynthesis in a given situation is achieved, the rates of photosynthesis are assumed to become steady over time. The increase in
CHLOROPLAST
starch
glucose
Phosphoglycerate
Triose-Phosphate
Ribulose-1,5-P
VACUOLE
CO2 LIGHT
Pi
Triose-Phosphate
Fructose-1,6-B
Fructose-6-P
sucrose
sucrose
sucrose
Fructose-6-P
Electron transport chain
Rubisco
CYTOSOL
Sink stimulation of photosynthesis by symbioses?
25
photosynthates over the season is then attributed solely to increased leaf area (Yin and van Laar, 2005). Contrary to this steady-state assumption, it has been demonstrated that specific rates of photosynthesis are down-regulated during periods of low sink activity, for example, after girdling, defruiting and sink removal, because of both carbohydrate accumulation in the leaf and end-product inhibition feedback in the Calvin Cycle (Lawn and Brun, 1974; Mondal et al., 1978; Ascón-Bieto, 1983; Goldschmidt and Huber, 1992; Iglesias et al., 2002; Rychter and Rao, 2005; McCormick et al., 2006; Dingkuhn et al., 2007). Alternatively, an increased C demand stimulates photosynthetic activity, for example during the onset of flowering because reproductive organs are being formed (e.g. Lawn and Brun, 1974). The reason is that the strength of the new C sink speeds up the utilization of triose phosphate for sucrose synthesis and the export towards the phloem, increasing the Pi recycling rate when releasing Pi back to the chloroplast (Paul and Foyer, 2001) and activating the regeneration of RUBP in the Calvin Cycle (Fig. 2.2). Furthermore, photosynthesis is stimulated by increased triose export because the enhanced Pi availability increases the activity of the electron transport chain for the photophosphorylation of ATP and reductants, and prevents over-reduction of photosystem I (Bukhov, 2004). An increased ATP : ADP ratio enhances the activation of the rubisco provided that there is a high C demand from the sinks (Paul and Foyer, 2001).
2.2.4. What is the evidence for sink stimulation under symbiotic conditions?
One way to determine quantitatively sink stimulation of photosynthesis in plants
that have been colonized by rhizobia and AM fungi is by comparing the changes in photosynthesis and nutrient acquisition of symbiotic plants to those from non-symbiotic plants. It is possible to assess the size of such change by calculating a response ratio, an dimensionless ratio between the values of a parameter of the experimental treatment including symbiosis and the control treatment without symbiosis (Gurevitch and Hedges, 2001). Sink stimulation would be supported when the response ratio of photosynthesis is higher than the response ratio of nutrient acquisition by symbioses. To test this hypothesis, we gathered data on any study which reported both photosynthesis and leaf nutrient mass fractions as affected by rhizobial and/or AM symbioses, and calculated the response ratios (Tables 2.5, 2.6 and 2.7). When interpreting the output of this meta-analysis (Gurevitch and Hedges, 2001), one should regard the response ratio significantly positive if the lower limit of the 95% confidence intervals (CI) is larger than 1, and negative if the upper limit of the 95% CI is smaller than 1. If the lower confidence interval is lower than 1 and the upper confidence interval higher than 1, the response ratio is not significantly different from
Chapter 2
26
1. There are significant differences between the response ratios of photosynthesis and nutrient acquisition when the values of the confidence intervals of the two different response ratios do not overlap.
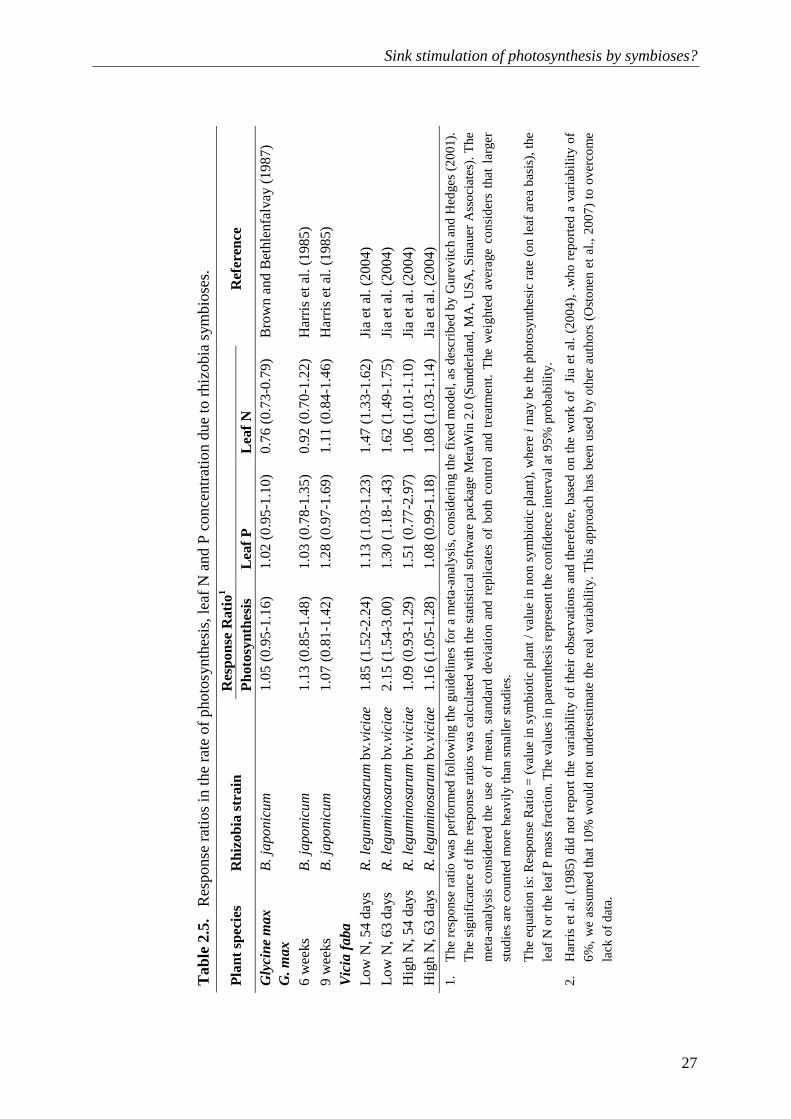
Table 2.5 and 2.6 give the response ratios of rhizobial and AM legume plants, respectively. Brown and Bethlenfalvay (1987) demonstrated that neither rhizobia nor AM fungi caused an increase in the nutrient mass fractions in the leaves of soybean, but they increased the rate of photosynthesis by 5 and 17%, respectively. The differences between the response ratios of photosynthesis and nutrient mass fractions in the leaves were significant (P<0.05; Table 5 and 6). In a comparable study, Brown and Bethlenfalvay (1988) demonstrated that the C sink strength of rhizobia and AMF led to an increased photosynthetic nutrient use efficiency. We hypothesize that the C sink strength of the symbioses led to a higher rate of triose-P export, a higher rate of Pi recycling, and, as a consequence, to a higher activation state of the Calvin cycle, which implies a higher rate of CO2 fixation in the leaves. As the entry of CO2 through stomata was larger, there was a lower nutrient requirement for the formation of photosynthetic proteins and reductants (e.g. rubisco and ATP). Therefore, increased photosynthetic nutrient use efficiency by a symbiotic legume is an expression of sink stimulation of photosynthesis.
Analysis of the data from the study by Harris et al. (1985) demonstrated (although with low statistical significance) that a soybean symbiosis with rhizobia (Table 2.5) and with a combination of rhizobia and AM fungi (Table 7) resulted in higher response ratios of photosynthesis than the response ratio of nutrient acquisition. Harris et al. (1985) pointed out that C costs of N and P acquisition were higher in soybeans associated with rhizobia than in soybeans fertilized with N, but the total biomass of symbiotic and non-symbiotic soybean was similar at the end of the study (9 weeks). Higher costs of nutrient acquisition would imply lower biomass if the rate of photosynthesis would not have been increased. Indeed, Harris et al. (1985) suggested that C sink strength of symbioses stimulated the rate of photosynthesis.
The study of Jia et al. (2004) allowed a comparison of the effects of rhizobial and AM colonization on faba beans under low and high nutrient conditions. The rate of photosynthesis increased considerably due to rhizobia or AM fungi under low nutrient conditions. Under low nutrient conditions, both rhizobia and AM fungi individually (Table 2.6) or combined (Table 2.7) resulted in higher response ratios of photosynthesis than response ratios of nutrient acquisition (significant in the case of rhizobial plants). The poor response of photosynthesis to the inoculation of rhizobia and AM fungi under high nutrient conditions can be explained by down-regulation of the symbioses (Schulze, 2004; Bittman et al., 2006).
Wright et al. (1998b) demonstrated a consistent increase in the rate of
Sink stimulation of photosynthesis by symbioses?
27
Tab
le 2
.5.
Res
pons
e ra
tios
in t
he r
ate
of p
hoto
synt
hesi
s, le
af N
and
P c
once
ntra
tion
due
to r
hizo
bia
sym
bios
es.
Res
pons
e R
atio1
Pla
nt s
peci
es
Rhi
zobi
a st
rain
P
hoto
synt
hesi
s Le
af P
Le
af N
R
efer
ence
Gly
cine
max
B
. ja
po
nicu
m 1.
05 (
0.95
-1.1
6)
1.02
(0.
95-1
.10)
0.
76 (
0.73
-0.7
9)
Bro
wn
and
Bet
hle
nfa
lva
y (1
987)
G
. max
6 w
ee
ks
B. ja
po
nicu
m 1.
13 (
0.85
-1.4
8)
1.03
(0.
78-1
.35)
0.
92 (
0.70
-1.2
2)
Ha
rris
et
al. (
1985
)
9 w
ee
ks
B. ja
po
nicu
m 1.
07 (
0.81
-1.4
2)
1.28
(0.
97-1
.69)
1.
11 (
0.84
-1.4
6)
Ha
rris
et
al. (
1985
) V
icia
fab
a
Low
N, 5
4 da
ys
R. le
gu
min
osa
rum
bv.v
icia
e 1.
85 (
1.52
-2.2
4)
1.13
(1.
03-1
.23)
1.
47 (
1.33
-1.6
2)
Jia
et
al. (
2004
)
Low
N, 6
3 da
ys
R. le
gu
min
osa
rum
bv.v
icia
e 2.
15 (
1.54
-3.0
0)
1.30
(1.
18-1
.43)
1.
62 (
1.49
-1.7
5)
Jia
et
al. (
2004
)
Hig
h N
, 54
days
R
. le
gu
min
osa
rum
bv.v
icia
e 1.
09 (
0.93
-1.2
9)
1.51
(0.
77-2
.97)
1.
06 (
1.01
-1.1
0)
Jia
et
al. (
2004
)
Hig
h N
, 63
days
R
. le
gu
min
osa
rum
bv.v
icia
e 1.
16 (
1.05
-1.2
8)
1.08
(0.
99-1
.18)
1.
08 (
1.03
-1.1
4)
Jia
et
al. (
2004
)
1.
The
re
spo
nse
ra
tio w
as
pe
rfo
rme
d f
ollo
win
g th
e g
uid
elin
es
for
a m
eta
-ana
lysi
s, c
ons
ide
ring
the
fix
ed
mo
de
l, a
s d
esc
rib
ed
by
Gur
evi
tch
and
He
dge
s (2
00
1).
The
sig
nific
anc
e o
f th
e r
esp
on
se r
atio
s w
as
calc
ula
ted
with
the
sta
tistic
al s
oft
wa
re p
ack
age
Me
taW
in 2
.0 (
Sun
de
rla
nd,
MA
, U
SA
, S
ina
uer
Ass
oci
ate
s).
The
me
ta-a
naly
sis
cons
ide
red
the
use
of
me
an,
sta
nda
rd
de
via
tion
and
re
plic
ate
s o
f b
oth
co
ntr
ol
and
tre
atm
ent
. T
he w
eig
hte
d a
vera
ge c
on
sid
ers
tha
t la
rge
r
stud
ies
are
co
unte
d m
ore
he
avi
ly t
han
sma
ller
stud
ie
s.
The
eq
uatio
n is
: R
esp
ons
e R
atio
= (
valu
e in
sym
bio
tic
pla
nt /
va
lue
in n
on
sym
bio
tic p
lant
), w
here
i m
ay
be
the
pho
tosy
nthe
sic
rate
(o
n le
af
are
a b
asi
s),
the
lea
f N o
r th
e le
af P
ma
ss f
ract
ion.
The
va
lue
s in
pa
rent
hesi
s re
pre
sent
the
co
nfid
enc
e in
terv
al a
t 9
5%
pro
ba
bili
ty.
2.
Ha
rris
et
al.
(19
85
) d
id n
ot
rep
ort
the
va
ria
bili
ty o
f th
eir
ob
serv
atio
ns
and
the
refo
re,
ba
sed
on
the
w
ork
of
Jia
et
al.
(20
04
), .
who
re
po
rte
d a
va
ria
bi
lity
of
6%
, w
e a
ssu
me
d t
hat
10
% w
oul
d n
ot
und
ere
stim
ate
the
re
al
vari
ab
ility
. T
his
ap
pro
ach
ha
s b
ee
n u
sed
by
oth
er
aut
hors
(O
sto
nen
et
al.,
20
07
) to
ove
rco
me
lack
of d
ata
.

Chapter 2
28
photosynthesis of mycorrhizal white clover (Trifolium repens L.) compared with non-mycorrhizal plants, in both nutrient-poor and nutrient-amended conditions, during at least 55 days. Two data points from Wright et al. (1998b), from a series of eight observations, allow direct comparison of the nutrient mass fraction in the leaves between the two main treatments. The response ratios of photosynthesis were significantly larger than the response ratios of nutrient mass fractions in the symbioses at the later stage of plant development (Table 2.6). The authors emphasized the effects of C sink strength by AM associations on the photosynthetic metabolism of the plants. At the 14th day of the experiment, the rates of photosynthesis were more than 3.2 times higher in the mycorrhizal plants than in the non-mycorrhizal plants (Wright et al., 1998b). Further investigation revealed that the increase in the rates of photosynthesis was correlated with an increased expression of the enzymes cell wall invertase (E.C. 3.2.1.26) and sucrose synthase (E.C. 2.4.1.13) in the roots of mycorrhizal white clover, which reflected increases in the C sink strength of the mycorrhizal symbiosis (Wright et al., 1998a).
Also Mortimer et al. (2008) demonstrated that the rate of photosynthesis of common beans (Phaseolus vulgaris L.) was increased due to increased C sink strength of the AM symbioses (higher below-ground respiration), while there was little evidence of changes in nutrient mass fraction in the leaves. Table 2.6 presents the response ratios of the rate of photosynthesis and the nutrient accumulation in the leaves of common beans from that experiment. Although the statistical significance was not strong, there was a higher increase in the rate of photosynthesis than in the leaf nutrients, especially at low P supply.
Considering all data in a meta-analysis, photosynthetic rates were significantly increased by 28 and 14% due to rhizobial and AM symbioses, respectively, and 51% due to dual symbiosis (Tables 2.5, 2.6 and 2.7). The leaf P mass fraction was increased significantly by 13% due to rhizobial symbioses. Although the increases were not significant when the confidence intervals are considered, the leaf P mass fraction increased by 6% by AM symbioses and 41% due to dual symbioses. The leaf N mass fraction increased by 13% due to rhizobial symbioses and 23% by dual symbioses.
It is important to note that the studies analysed in this paper were not originally designed to test sink stimulation, but they provided evidence that sink stimulation occurred to compensate the C costs of the extra nutrient acquired through the symbioses. In the studies listed in Tables 2.5, 2.6 and 2.7, photosynthesis rates were expressed on a leaf area basis whereas nutrients were expressed on a dry weight basis. One implication is that photosynthesis expressed on a dry weight basis would differ slightly from that expressed on a leaf area basis (e.g. Harris et al., 1985). For example, AM symbiosis increased photosynthesis by 9 and 6% on a leaf area basis (Table 2.5),
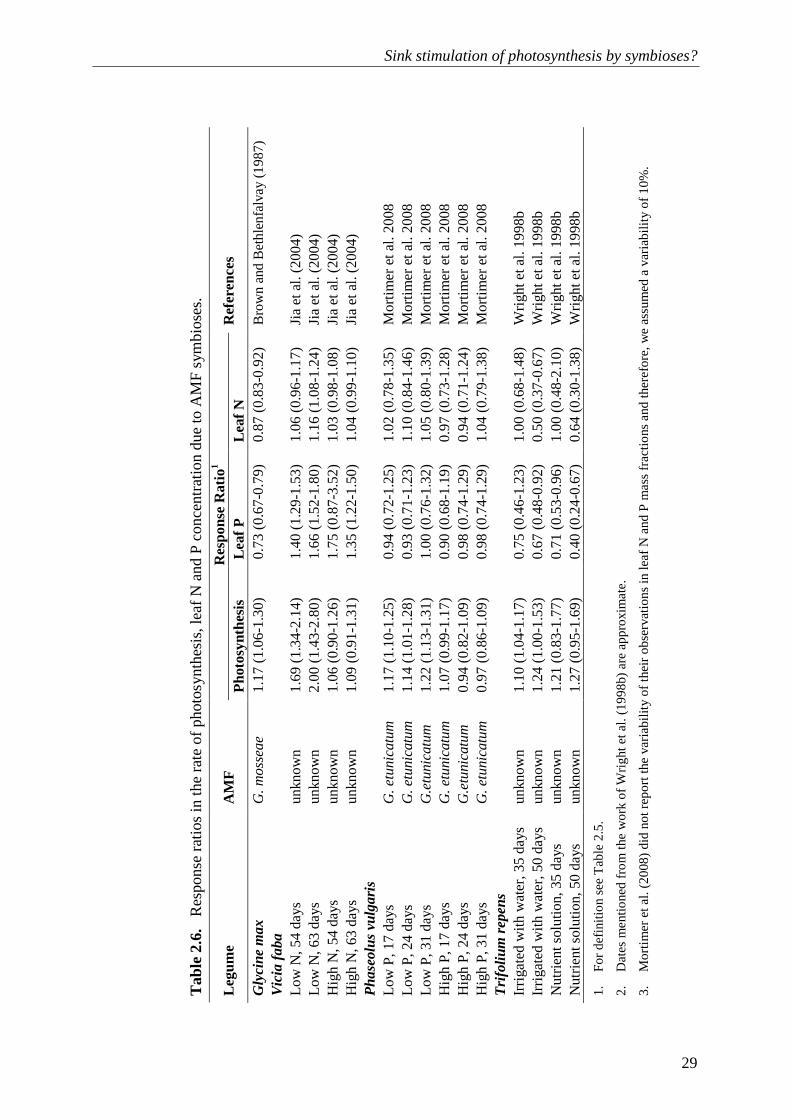
Sink stimulation of photosynthesis by symbioses?
29
Tab
le 2
.6.
Res
pons
e ra
tios
in th
e ra
te o
f pho
tosy
nthe
sis,
lea
f N a
nd P
con
cent
ratio
n du
e to
AM
F s
ymbi
oses
.
Res
pons
e R
atio1
Legu
me
AM
F
Pho
tosy
nthe
sis
Leaf
P
Leaf
N
Ref
eren
ces
Gly
cine
max
G
. m
oss
eae
1.
17 (
1.06
-1.3
0)
0.73
(0.
67-0
.79)
0.
87 (
0.83
-0.9
2) Bro
wn
and
Bet
hlen
falv
ay
(198
7)
Vic
ia f
aba
Lo
w N
, 54
days
un
know
n 1.
69 (
1.34
-2.1
4)
1.40
(1.
29-
1.53
) 1.
06 (
0.96
-1.1
7)
Jia
et
al. (
2004
) Lo
w N
, 63
days
un
know
n 2.
00 (
1.43
-2.8
0)
1.66
(1.
52-
1.80
) 1.
16 (
1.08
-1.2
4)
Jia
et
al. (
2004
) H
igh
N, 5
4 da
ys
unkn
own
1.06
(0.
90-1
.26)
1.
75 (
0.87
-3.5
2)
1.03
(0.
98-1
.08)
Ji
a e
t al
. (20
04)
Hig
h N
, 63
days
un
know
n 1.
09 (
0.91
-1.3
1)
1.35
(1.
22-1
.50)
1.
04 (
0.99
-1.1
0)
Jia
et
al. (
2004
) P
hase
olus
vul
gari
s
Low
P, 1
7 da
ys
G. e
tuni
catu
m
1.17
(1.
10-1
.25)
0.
94 (
0.72
-1.2
5)
1.02
(0.
78-1
.35)
Mor
time
r et
al.
2008
Lo
w P
, 24
days
G
. e
tuni
catu
m 1.
14 (
1.01
-1.2
8)
0.93
(0.
71-1
.23)
1.
10 (
0.84
-1.4
6)
Mor
time
r et
al.
2008
Lo
w P
, 31
days
G
.etu
nica
tum
1.22
(1.
13-1
.31)
1.
00 (
0.76
-1.3
2)
1.05
(0.
80-1
.39)
M
ortim
er
et a
l. 20
08
Hig
h P
, 17
days
G
. e
tuni
catu
m 1.
07 (
0.99
-1.1
7)
0.90
(0.
68-1
.19)
0.
97 (
0.73
-1.2
8)
Mor
time
r et
al.
2008
H
igh
P, 2
4 da
ys
G.e
tuni
catu
m 0.
94 (
0.82
-1.0
9)
0.98
(0.
74-1
.29)
0.
94 (
0.71
-1.2
4)
Mor
time
r et
al.
2008
H
igh
P, 3
1 da
ys
G. e
tuni
catu
m 0.
97 (
0.86
-1.0
9)
0.98
(0.
74-1
.29)
1.
04 (
0.79
-1.3
8)
Mor
time
r et
al.
2008
T
rifo
lium
rep
ens
Ir
riga
ted
with
wa
ter,
35
days
un
know
n 1.
10 (
1.04
-1.
17)
0.75
(0.
46-1
.23)
1.
00 (
0.68
-1.4
8)
Wri
ght e
t al.
199
8b
Irri
gate
d w
ith w
ate
r, 5
0 da
ys
unkn
own
1.24
(1.
00-1
.53
) 0.
67 (
0.48
-0.9
2)
0.50
(0.
37-0
.67)
W
righ
t et a
l. 1
998b
N
utrie
nt s
olut
ion,
35
days
un
know
n 1.
21 (
0.83
-1.7
7)
0.71
(0.
53-0
.96)
1.
00 (
0.48
-2.1
0)
Wri
ght e
t al.
1998
b N
utrie
nt s
olut
ion,
50
days
un
know
n 1.
27 (
0.95
-1.6
9)
0.40
(0.
24-0
.67)
0.
64 (
0.30
-1.3
8)
Wri
ght e
t al.
1998
b
1.
Fo
r d
efin
itio
n se
e T
ab
le 2
.5.
2.
Da
tes
me
ntio
ned
fro
m t
he w
ork
of W
rig
ht e
t a
l. (1
99
8b)
are
ap
pro
xim
ate
.
3.
Mo
rtim
er
et
al.
(20
08)
did
no
t re
po
rt t
he v
ari
ab
ility
of t
heir
ob
serv
atio
ns
in le
af N
and
P m
ass
fra
ctio
ns a
nd t
here
fore
, w
e a
ssu
me
d a
va
ria
bili
ty o
f 10
%.

Chapter 2
30
Tab
le 2
.7.
Res
pons
e ra
tios
of p
hoto
synt
hesi
s ra
tes,
leaf
N
and
P c
once
ntra
tion
due
to c
ombi
ned
rhiz
obia
and
AM
fung
i sym
bios
es.
Res
pons
e R
atio1
Legu
me
Rhi
zobi
a +
AM
F
Pho
tosy
nthe
sis
Leaf
P
Leaf
N
Ref
eren
ce
Gly
cine
max
B
. ja
poni
cum
+ G
. m
osse
ae
1.
22 (
1.12
-1.3
3)
0.68
(0.
62-0
.75)
0.
72 (
0.68
-0.7
7)
Bro
wn
and
Bet
hle
nfa
lva
y (1
987)
G. m
ax
6 w
ee
ks
B. ja
poni
cum
+ G
. fa
scic
ula
tum
1.23
(0.
93-1
.62)
1.
83 (
1.39
-2.4
1)
1.22
(0.
92-1
.61)
H
arr
is e
t al
. (19
85)
9 w
ee
ks
B. ja
poni
cum
+ G
. fa
scic
ula
tum
1.14
(0.
86-1
.50)
1.
30 (
0.99
-1.7
2)
1.23
(0.
93-1
.62)
H
arr
is e
t al
. (19
85)
Vic
ia f
aba
Low
N, 5
4 da
ys
R. le
gum
inosa
rum
bv. vi
ciae
2 2.
46 (
1.94
-3.1
2)
1.54
(1.
36-1
.75)
1.
64 (
1.50
-1.7
9)
Jia
et
al. (
2004
)
Low
N, 6
3 da
ys
R. le
gum
inosa
rum
bv. vi
ciae
2 3.
08 (
2.24
-4.2
2)
1.79
(1.
68-1
.92)
1.
77 (
1.63
-1.9
1)
Jia
et
al. (
2004
)
Hig
h N
, 54
days
R. le
gum
inosa
rum
bv. vi
ciae
2 1.
25 (
1.03
-1.5
1)
1.95
(1.
00-3
.82)
1.
14 (
1.08
-1.2
0)
Jia
et
al. (
2004
)
Hig
h N
, 63
days
R. le
gum
inosa
rum
bv. vi
ciae
2 1.
28 (
1.12
-1.4
7)
1.46
(1.
35-1
.58)
1.
19 (
1.14
-1.2
5)
Jia
et
al. (
2004
)
1.
Fo
r d
efin
itio
n se
e T
ab
le 2
.5.
2.
Jia
et
al.
(20
04)
wo
rke
d w
ith a
n u
nkn
ow
n A
M f
ung
i.
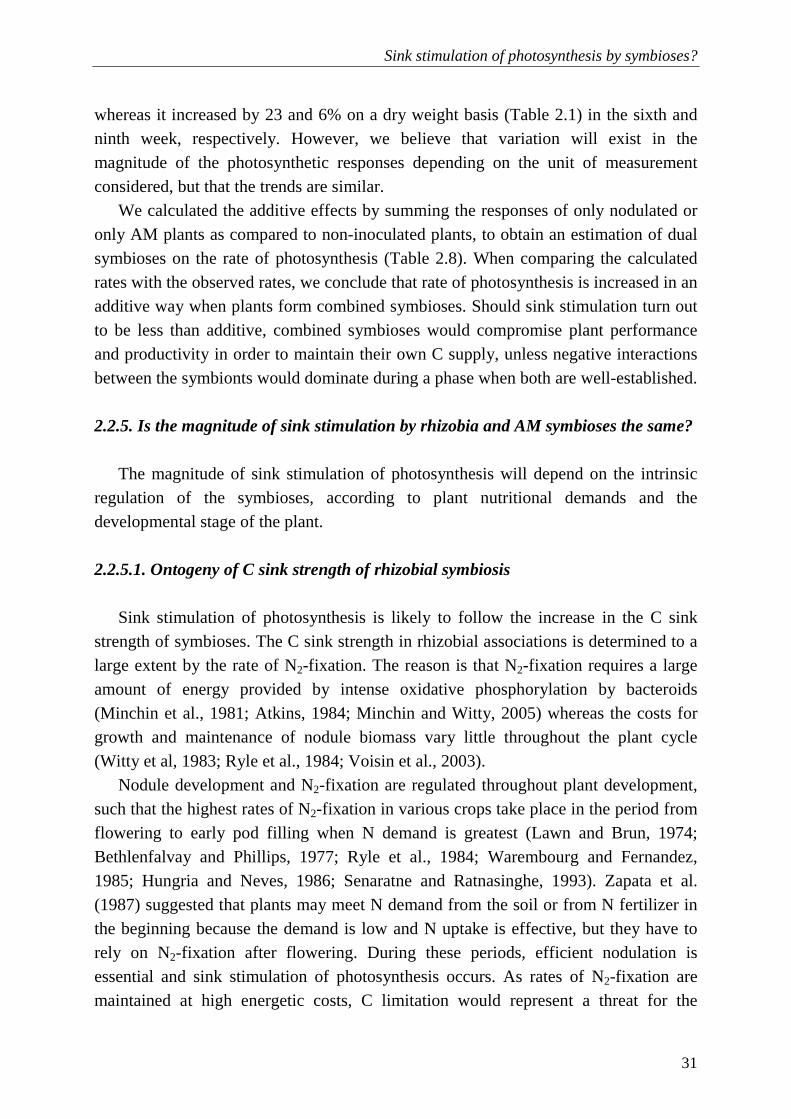
Sink stimulation of photosynthesis by symbioses?
31
whereas it increased by 23 and 6% on a dry weight basis (Table 2.1) in the sixth and ninth week, respectively. However, we believe that variation will exist in the magnitude of the photosynthetic responses depending on the unit of measurement considered, but that the trends are similar.
We calculated the additive effects by summing the responses of only nodulated or only AM plants as compared to non-inoculated plants, to obtain an estimation of dual symbioses on the rate of photosynthesis (Table 2.8). When comparing the calculated rates with the observed rates, we conclude that rate of photosynthesis is increased in an additive way when plants form combined symbioses. Should sink stimulation turn out to be less than additive, combined symbioses would compromise plant performance and productivity in order to maintain their own C supply, unless negative interactions between the symbionts would dominate during a phase when both are well-established.
2.2.5. Is the magnitude of sink stimulation by rhizobia and AM symbioses the same?
The magnitude of sink stimulation of photosynthesis will depend on the intrinsic
regulation of the symbioses, according to plant nutritional demands and the developmental stage of the plant.
2.2.5.1. Ontogeny of C sink strength of rhizobial symbiosis
Sink stimulation of photosynthesis is likely to follow the increase in the C sink
strength of symbioses. The C sink strength in rhizobial associations is determined to a large extent by the rate of N2-fixation. The reason is that N2-fixation requires a large amount of energy provided by intense oxidative phosphorylation by bacteroids (Minchin et al., 1981; Atkins, 1984; Minchin and Witty, 2005) whereas the costs for growth and maintenance of nodule biomass vary little throughout the plant cycle (Witty et al, 1983; Ryle et al., 1984; Voisin et al., 2003).
Nodule development and N2-fixation are regulated throughout plant development, such that the highest rates of N2-fixation in various crops take place in the period from flowering to early pod filling when N demand is greatest (Lawn and Brun, 1974; Bethlenfalvay and Phillips, 1977; Ryle et al., 1984; Warembourg and Fernandez, 1985; Hungria and Neves, 1986; Senaratne and Ratnasinghe, 1993). Zapata et al. (1987) suggested that plants may meet N demand from the soil or from N fertilizer in the beginning because the demand is low and N uptake is effective, but they have to rely on N2-fixation after flowering. During these periods, efficient nodulation is essential and sink stimulation of photosynthesis occurs. As rates of N2-fixation are maintained at high energetic costs, C limitation would represent a threat for the
Chapter 2
32
T
able
2.8
. T
he a
dditi
ve e
ffect
s of
rhi
zobi
a an
d A
M fu
ngi o
n p
hoto
synt
hesi
s Rhi
zobi
a+A
MF
P
lant
spe
cie
Uni
ty
Con
trol
3 A
MF
R
hizo
bia
obse
rve
d es
timat
ed1,4
Ref
eren
ce
Gly
cine
max
µ
mo
l CO 2
m–2
leaf
s–1
15.5
0 1
8.00
1
6.00
18
.50
18.5
0 B
row
n a
nd B
ethl
enf
alva
y (1
987)
Vic
ia f
aba
5 w
eek
s m
g 1
4 C g
–1 s
hoot
C h–1
7.
02 c
7
.60
b 7
.92
b 8.
23 a
8.
50
Kuc
ey a
nd P
aul (
198
2b)
6 w
eek
s m
g 1
4 C g
–1 s
hoot
C h–1
6.
79 c
6
.96
b 7
.32
b 9.
24 a
7.
49
Kuc
ey a
nd P
aul (
198
2b)
5 w
eek
s m
g 1
4 CO
2 g–1
sho
ot C
h–1
17.4
0
18.
80
18.
20
20.2
0
19.6
0 P
aul a
nd K
ucey
(19
81)
Caj
anus
caj
an
25 d
ays
14C
-act
ivity
(B
q m
g-1)2
1.40
a
1.9
5 bc
1
.55
ab
2.00
c
2.10
S
ivap
rasa
d an
d R
ai (
1985
)
35 d
ays
14C
-act
ivity
(B
q m
g–1)
2.80
a
4.6
0 c
4.0
5 b
5.40
d
5.85
S
ivap
rasa
d an
d R
ai (
1985
)
60 d
ays
14C
-act
ivity
(B
q m
g–1)
0.65
a
1.0
0 bc
0
.02
ab
1.10
c
0.37
S
ivap
rasa
d an
d R
ai (
1985
)
1.
The
eq
uatio
n fo
r ad
diti
ve e
ffect
s is
des
crib
ed a
s:
Ad
diti
ve e
ffe
ct=
M+
R–
C, w
her
e M, R
an
d C
are
the
rat
es
of
pho
tosy
nth
esis
in
myc
orr
hiza
l pla
nts,
rhi
zob
ial
pla
nts
and
co
ntro
l (w
itho
ut a
ny
sym
bio
sis)
pla
nts,
re
spec
tive
ly.
2.
The
dat
a fr
om
Siv
apra
sad
an
d R
ai (
19
85
) w
as c
onv
ert
ed w
ith t
he e
qua
tion
Bq
mg–
1 = C
PM
/ (
60
×2
0),
wh
ere
CP
M i
s th
e 14 C
co
unt
ing
of
ato
m d
eca
ys p
er
min
ute
per
sa
mp
le,
whi
ch d
ivid
ed b
y 6
0 (
seco
nds)
be
com
es Bq.
Bq
is d
ivid
ed b
y 2
0,
bec
ause
that
is th
e w
eig
ht o
f th
e s
am
ple
in m
illig
ram
s.
3.
Sta
tistic
s a
re p
rese
nted
as
in e
ach
orig
ina
l st
udy.
Diff
eren
t le
tter
s in
the
sa
me
row
are
sig
nifi
cant
ly
diff
eren
t a
t P<
0.0
5.
In t
he d
ata
fro
m P
aul
an
d K
uce
y
(19
81),
the
rat
es in
AM
F a
nd R
hiz
ob
ia+
AM
F a
re h
ighe
r at
P<
0.0
5 a
nd R
hiz
ob
ia is
hig
her
at
P<
0.1
0 in
rel
atio
n to
the
co
ntro
l.
4.
The
co
rrel
atio
n o
f ob
serv
ed a
nd e
stim
ated
rat
es w
ith
rhiz
ob
ia +
AM
F is
R2 =
0.9
95
with
P<
0.0
1 fo
r th
e tw
o ta
iled
test
.
Sink stimulation of photosynthesis by symbioses?
33
success of rhizobial symbioses. High-yielding varieties associated with highly efficient N2-fixing rhizobial strains have a relatively high activity of nodule phosphoenolpyruvate carboxylase (PEPC; E.C. 4.1.1.31) (Atkins, 1984), which might indicate a need for increasing the C uptake. While the presence of enzymes such as uptake hydrogenase (E.C. 1.12.7.2; Hungria et al., 1989) and PEPC (Atkins, 1984), which recycle energy in the nodule, overcomes some of the problems, C limitation is mainly resolved through an increased rate of photosynthesis.
High N availability in soil may lead to down-regulation of the nitrogenase activity and nodule viability (Schulze, 2004). The N-feedback mechanism presumes that N compounds in the phloem sap moving into nodules regulate the rate of N2-fixation (Parsons et al., 1993). Hartwig (1998) reasoned that symbiotic N2-fixation is regulated by the plant’s N sink demand and suggested that nitrogenase activity is modulated by sensing the plant N : C ratio, possibly through phloem translocatable compounds. A reduced catabolism in the leaves also resulted in an increased concentration of ureides and amino acids, and therefore resulted in reduced nitrogenase activity and N2-fixation (King and Purcell, 2005). A way of achieving such regulation may be related to a complex amino-acid cycling mechanism both determined by the plant and the rhizobia (Lodwig et al., 2003). Therefore, as sink stimulation is related to the process of N2-fixation, down-regulation of N2-fixation in the nodules would result in down-regulation of photosynthesis.
2.2.5.2. Ontogeny of C sink strength of AM symbiosis
The C sink strength of AM fungi is to a large extent determined by the growth and
maintenance of both the intra- and extraradical mycelium (Johnson et al., 2002), particularly because mycelia accumulate a large amount of lipids, the synthesis of which is among the most energy-demanding of organic compounds (Table 2.3). The costs of P uptake through membranes are estimated to be similar in both hyphae and root tips, even though the P uptake system of AM fungi has a higher affinity than that of plants (Smith and Read, 2008). In annual crops, such as soybean and faba bean, the biomass of AM fungi follows a logistic growth curve, which increases up to plant flowering (Bethlenfalvay et al., 1982a, 1982b; Kucey and Paul, 1982a). After flowering, the fungi stop growing and require C only for maintenance (Kucey and Paul, 1982a), although they can continue to accumulate lipids (Bago et al., 2003). However, the relative costs of AM symbiosis are larger early in plant development when AM fungal colonization is indispensable for plants because the root system is still small and hyphae are more efficient in reaching P, which is poorly-mobile in soil (Grant et al., 2005; Bittman et al., 2006).
Chapter 2
34
Root AM fungal colonization and photosynthate supply are correlated with the P concentration in the external growth medium (Peng et al., 1993, Olsson et al., 2002; Valentine and Kleinert, 2007), but there are no direct effects of the medium P concentration on the metabolism of extraradical hyphae (Olsson et al., 2002). In fact, photosynthate supply to AM mycelia is proportional to plant demand for P, with feed-backs in short-term alleviation of P stress (Valentine and Kleinert, 2007). Therefore, plants with a higher leaf P mass fraction down-regulate the carbohydrate supply to the AM mycelia (Menge et al., 1978), comparable with the effects of phloem N concentration on nodulation. Under severe P limitation in the soil, increasing P supply by fertilization may favour the AM fungal colonization until the deficiency is alleviated (Bolan et al., 1984) because severe P deficiency limits photosynthesis, but AM fungal colonization will be reduced if P supply is further increased and plant growth is no longer limited by P (Peng et al., 1993, Bittman et al., 2006).
2.2.6. Does sink stimulation of leaf photosynthesis by symbioses increase yield?
Sink stimulation of leaf photosynthesis could increase yield if increased
photosynthesis is productively used. There is evidence that both rhizobia and AM lead to changes in dry matter partitioning that affect the harvest index, the ratio seed yield : total plant dry weight. If an inoculated plant produces more seeds than the non-inoculated counterpart, and the harvest index is higher as well, it follows that less leaf area was made available to produce grains while the C costs with symbioses were compensated by the photosynthesis. It is important to note that, although large amounts of C in rhizobial symbioses are transferred to the nodule, 21 to 52% of the C first allocated to the nodules may be returned via the xylem as incorporated organic N, ureides or amides (Minchin et al., 1981). The cycling of amides and ureides to form proteins and other plant compounds in nodulated plants may save a part of the newly assimilated C, which in turn supports the formation of extra plant biomass.
Conversely, AM fungi use the C allocated to build their own biomass, and consume more C in maintenance respiration than for nutrient uptake. In that case, sink stimulation by the carbon sink strength of AM symbioses may not result in higher plant biomass, because higher photosynthesis may be accompanied by increased root symbiont respiration (Paul and Kucey, 1981; Harris et al., 1985; Johnson et al., 2002; Valentine and Kleinert, 2007; Mortimer et al., 2008). Furthermore, the P is taken up by hyphae, converted to polyphosphates, and transported in motile vacuoles until P can be transferred to the root vessels with the aid of transporter proteins (Smith and Read, 2008). That suggests that P transfer from fungal hyphae to the plant does not result in increased C availability for plant growth.
Sink stimulation of photosynthesis by symbioses?
35
There is evidence that rhizobial symbiosis increases legume grain yields by increasing the harvest index. Kantar et al. (2003) noted that the largest values of harvest index were well correlated with greater numbers of nodules and Xavier and Germida (2002; 2003) demonstrated that larger harvest indices were correlated with increased total N content in the shoot, which means that plants performed better under symbiotic conditions.
Positive effects of an AM association on yield and harvest index seem to depend on the plant-AM fungal association. In experiments with soybean (Ross, 1971; Kuo and Huang, 1982), all AM fungal species stimulated an increase in yield and harvest index, but in experiments with lentil (Lens culinaris Medikus) and pea (Xavier and Germida, 2002; 2003) positive effects of AM colonization were not always evident. In fact, certain plant-AM fungal combinations are more successful than others in promoting plant growth (Smith and Read, 2008). Although several other factors are important for plant productivity (water, nutrients, soil physical properties, etc.), changes in the harvest index suggest that sink stimulation of photosynthesis by symbioses, in addition to the effects of improved plant nutrition, could have consequences for crop yields.
Furthermore, sink stimulation of photosynthesis could possibly lead to an increased period of leaf activity or delayed senescence (Paul and Peliny, 2003), which in turn could increase the potential period for plant growth and grain filling. Paul and Peliny (2003) stated that higher photosynthesis prior to the early phase of senescence may actually lead to a longer photosynthetically-active life of leaves. Indeed, Ono et al. (2001) showed that when the demand for carbohydrates is weak, leaves accumulate sugars and start to senesce. Conversely, low leaf sugar concentration leads to an increase in photosynthesis or to delayed leaf senescence. In soybeans, the synergistic effects of prolonged N acquisition and the stimulation of photosynthesis by the rhizobial symbioses postponed the degradation of leaf protein and chlorophyll (Abu-Shakra et al., 1978), which could result in larger yields. The effects of AM symbiosis on leaf senescence await more detailed investigation.
2.2.7. Is sink stimulation by rhizobia and AM symbioses quantifiable, or does it remain a theoretical concept?
The patterns of the Tables 2.5, 2.6 and 2.7 give reasonable evidence for an strong
effect of rhizobial and mycorrhizal symbioses on the rates of photosynthesis, which goes beyond the influence of nutrient acquisition. However, given the low number of published studies, containing comparable measurements of photosynthesis and leaf nutrients, further experimental testing is clearly required. Sink stimulation has been identified as one possible explanation for the differences in responses between nutrient
Chapter 2
36
fertilized plants and symbiotic plants by many authors (e.g. Pang and Paul, 1980; Harris et al., 1985; Wright et al., 1998a; 1998b; Mortimer et al., 2008), but the order of magnitude of this phenomenon has not been measured accurately. We realize that testing sink stimulation of photosynthesis by the carbon sink strength of symbioses raises several difficulties, particularly because it is difficult to determine the linear relationships between C costs and the sink stimulation of photosynthesis. In fact, to test sink stimulation, we should ensure symbiotic and fertilized plants with similar size at same developmental stage. Additionally, we should be aware of changes in the nutrient metabolism of symbiotic and fertilized plants and the root mass and activity. In the case of mycorrhizal symbioses, under stress conditions other than nutrient limitations (i.e. drought, heavy metals, etc.), fungi may also play a protective role in plant physiology, although their relative costs : benefits are difficult to measure (Fitter, 1991).
One way to test sink stimulation of photosynthesis is by measuring response curves of photosynthesis of nutrient-fertilized and symbiotic plants and identifying accurately the physiological mechanisms (von Caemmerer, 2000) that regulate the rates of photosynthesis under symbiotic conditions. Hopefully, those measurements will strengthen our understanding of how much sink stimulation is relevant throughout the plant cycle. If the C sink strength would be quantifiable, it should be expressed in terms of photosynthesis limitation due to triose-P export from the chloroplasts (e.g. Sharkey, 1985; Harley and Sharkey, 1991; Harley et al., 1992; von Caemmerer, 2000).
2.2.8. Towards better models of photosynthesis by including sink stimulation
If the phenomenon of sink stimulation is included in simulation models of
photosynthesis, we could analyse to what extent photosynthesis can be increased to compensate for C costs of symbioses and we could assess possible changes in the harvest index of crops due to symbiotic associations. In natural ecosystems, sink stimulation of photosynthesis by rhizobial and AM symbioses is most likely to be observed in well-irradiated environments, such as savannas, grasslands or forests of pioneer plant species rather than in closed dense forests, because sink stimulation requires that photosynthesis is not primarily limited by light, water and CO2. Cropping systems, specialized systems subjected to different management which may affect the symbioses (Hungria et al., 2005; Cardoso and Kuyper, 2006), may take advantage of the sink stimulation effect because it may improve yields in an efficient way. However, estimating the magnitude of sink stimulation under field conditions will remain a hard task. It is therefore necessary to improve models to assess the
Sink stimulation of photosynthesis by symbioses?
37
possibilities of manipulating sink stimulation of photosynthesis in favour of higher yields.
2.3. Conclusions
Whereas sink stimulation of photosynthesis as a function of strong sinks in the
plants (i.e. fruits, storage organs and seeds) has been described previously (Herold, 1980; Paul and Foyer, 2001), in this paper we extended the concept to the C sink strength of root symbioses on the rates of photosynthesis. The C sink strength of rhizobial symbioses is mainly related to the respiration associated with rates of N2 fixation, whereas the C sink strength of AM symbioses is mostly associated with the growth respiration of mycelium. The C sink strength of both symbioses is regulated according to the nutritional demand of the plant. We identified three potential manifestations of sink stimulation of photosynthesis by the C sink strength of rhizobial and AM symbioses: increased photosynthetic nutrient efficiency, increased harvest index and delayed leaf senescence. Increased nutrient acquisition through rhizobial and AM symbioses does not fully explain the increase in the rates of photosynthesis of symbiotic legumes. Increased photosynthetic nutrient efficiency and harvest index seem to be equally important in the two symbioses, whereas delayed leaf senescence has not been observed in AM symbiosis.

Chapter 2
38

Chapter 3
Towards understanding of photosynthesis in soybean inoculated with different Bradyrhizobium japonicum strains or fertilized with nitrate †
† This chapter will be submitted with minor modifications as:
Kaschuk, G., Yin, X., Hungria, M., Leffelaar, P.A., Giller, K.E. Kuyper, T.W., 2009. Towards understanding of
photosynthesis in soybean inoculated with different Bradyrhizobium japonicum strains or fertilized with nitrate.

Chapter 3
40
Abstract Legumes associated with rhizobia spend large amounts of photosynthate in symbiotic N2 fixation, but still produce more biomass than their comparative N-fertilized plants. An explanation could be that legumes improve their photosynthetic capacity to compensate the carbon costs of rhizobial symbioses. We assessed photosynthesis and the chlorophyll fluorescence in soybean (Glycine max) plants inoculated with two different strains of Bradyrhizobium japonicum (CPAC 390 or CPAC 7), varying in the effectiveness to fix N2, or fertilized with NO3
–. Nodulated plants had 14-31% higher rates of photosynthesis and accumulated less starch in the leaves than N-fertilized plants. There was evidence that B. japonicum CPAC 390 had higher carbon costs of N2 fixation compared with CPAC 7, but the increases in carbon costs were accompanied by higher rates of photosynthesis. By applying a biochemical model of leaf photosynthesis, including the limitations of rubisco activity, electron transport rates and triose-P utilization, we show that soybean plants adapt their photosynthetic capacity to support the stronger carbon sink created by faster rates of N2 fixation through two likely mechanisms: removal of sink limitation and direct sink stimulation. The adaptation of the photosynthetic capacity in nodulated soybeans suggests that the photosynthate use efficiency of rhizobial symbioses (meaning lower C costs) is less important for plant growth than effectiveness for N2 fixation. Key words: biochemical model of leaf photosynthesis, carbon sink strength, chlorophyll fluorescence, legumes, rhizobia
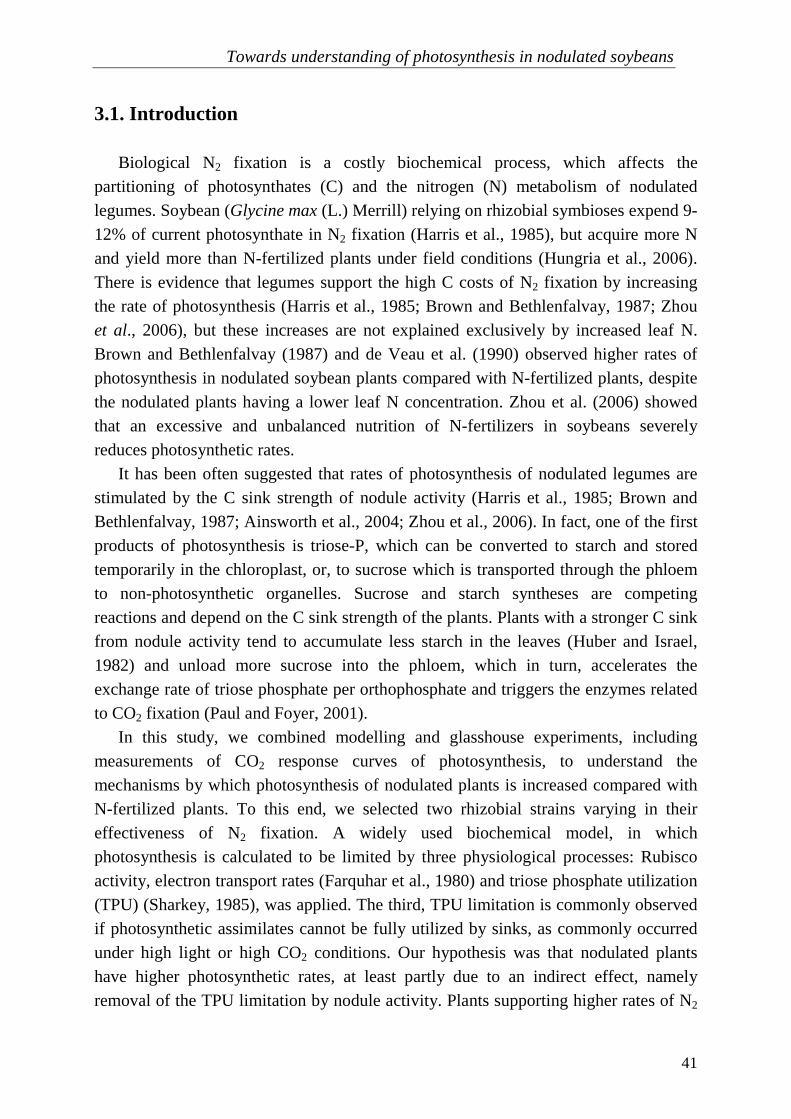
Towards understanding of photosynthesis in nodulated soybeans
41
3.1. Introduction Biological N2 fixation is a costly biochemical process, which affects the
partitioning of photosynthates (C) and the nitrogen (N) metabolism of nodulated legumes. Soybean (Glycine max (L.) Merrill) relying on rhizobial symbioses expend 9-12% of current photosynthate in N2 fixation (Harris et al., 1985), but acquire more N and yield more than N-fertilized plants under field conditions (Hungria et al., 2006). There is evidence that legumes support the high C costs of N2 fixation by increasing the rate of photosynthesis (Harris et al., 1985; Brown and Bethlenfalvay, 1987; Zhou et al., 2006), but these increases are not explained exclusively by increased leaf N. Brown and Bethlenfalvay (1987) and de Veau et al. (1990) observed higher rates of photosynthesis in nodulated soybean plants compared with N-fertilized plants, despite the nodulated plants having a lower leaf N concentration. Zhou et al. (2006) showed that an excessive and unbalanced nutrition of N-fertilizers in soybeans severely reduces photosynthetic rates.
It has been often suggested that rates of photosynthesis of nodulated legumes are stimulated by the C sink strength of nodule activity (Harris et al., 1985; Brown and Bethlenfalvay, 1987; Ainsworth et al., 2004; Zhou et al., 2006). In fact, one of the first products of photosynthesis is triose-P, which can be converted to starch and stored temporarily in the chloroplast, or, to sucrose which is transported through the phloem to non-photosynthetic organelles. Sucrose and starch syntheses are competing reactions and depend on the C sink strength of the plants. Plants with a stronger C sink from nodule activity tend to accumulate less starch in the leaves (Huber and Israel, 1982) and unload more sucrose into the phloem, which in turn, accelerates the exchange rate of triose phosphate per orthophosphate and triggers the enzymes related to CO2 fixation (Paul and Foyer, 2001).
In this study, we combined modelling and glasshouse experiments, including measurements of CO2 response curves of photosynthesis, to understand the mechanisms by which photosynthesis of nodulated plants is increased compared with N-fertilized plants. To this end, we selected two rhizobial strains varying in their effectiveness of N2 fixation. A widely used biochemical model, in which photosynthesis is calculated to be limited by three physiological processes: Rubisco activity, electron transport rates (Farquhar et al., 1980) and triose phosphate utilization (TPU) (Sharkey, 1985), was applied. The third, TPU limitation is commonly observed if photosynthetic assimilates cannot be fully utilized by sinks, as commonly occurred under high light or high CO2 conditions. Our hypothesis was that nodulated plants have higher photosynthetic rates, at least partly due to an indirect effect, namely removal of the TPU limitation by nodule activity. Plants supporting higher rates of N2
Chapter 3
42
fixation should result in higher rates of photosynthesis. Therefore, we expected that photosynthesis of nodulated plants could be predicted with a reduced model in which the TPU-limitation is removed, using parameters related to Rubisco activity and electron transport derived from fitting of CO2 response curves of photosynthesis in N-fertilized plants. However, if simulations would not show convergence between observed and predicted photosynthesis of nodulated plants, then this would support an alternative explanation that photosynthesis is increased not only by removal of TPU limitation but also due to direct C sink stimulation. 3.2. Material and Methods 3.2.1. Experiment setup
Soybean (cv. BRS 154, of determinate growth) was inoculated with two
Bradyrhizobium japonicum strains or fertilized with a nutrient solution containing KNO3. The Bradyrhizobium strains were CPAC 390 and CPAC 7 (=SEMIA 5080, both natural variants of SEMIA 586 = CB 1809). Plants were cultivated in 2.5 kg capacity plastic pots filled with a mixture of sterilized sand and vermiculite (1:1). Seeds were surface-sterilized according to Vincent (1970) before sowing. All plants received sterilized N-free solution (Broughton and Dilworth, 1971) with the pH adjusted to 6.8. Development stages were defined according to Fehr et al. (1971). The non-inoculated plants received a KNO3 20.8 mM nutrient solution three times at vegetative stage (emergence, V4, and V5, which means four and five nodes on the main stem beginning with the unifoliate node, respectively) and one time at reproductive stage (R1, one flower at any node), in total, an amount of 210 mg N per plant. Rhizobia were grown in yeast mannitol (YM) medium according to Vincent (1970) up to the density of 109 cells ml–1; and 1 ml of the suspension was added per seed of the inoculated treatments at sowing. Seven seeds were sown in each pot, and plants were thinned to one plant per pot at V1 stage (5 d). We started to measure leaf gas exchange at stage R2 (35 d, flower at node immediately below the uppermost nodes with a completely unrolled leaf) and finished measurements before the stage R4 (40 d, pod 2 cm long at one of the four uppermost nodes with a completely unrolled leaf).
The experimental station is located at Londrina-Paraná State, Brazil, where the length of visible light was 13 h 34 min on 18/02/2008 (planting) and 11 h 34 min on 02/04/2008 (harvest). Maximum photosynthetic active radiation (PAR) in the glasshouse averaged 600 µmol quanta m–2 s–1 during the growth period. Temperatures in the glasshouse during the period of the experiment averaged 33/22 °C (day/night).
Towards understanding of photosynthesis in nodulated soybeans
43
3.2.2. Gas exchange and chlorophyll fluorescence measurements The measurements of responses of photosynthesis (A) to increasing intercellular
CO2 concentrations (Ci) –A/Ci curves– and the chlorophyll fluorescence were performed simultaneously on the youngest fully expanded leaf, using the open gas exchange system Li-6400 (LI-COR Inc., Lincoln, NE, USA) with an integrated fluorescence chamber head Li-6400-40 (LI-COR Inc.). We randomly chose one leaf of each treatment per day, and, started the measurements about 11:00 h and stopped no later than 16:30 h. A full response curve took 50 min to 1 h to be completed. During the measurements, the air temperature in the glasshouse varied from 33 to 36 °C. An area of 2 cm2 of leaf was enclosed in a broadleaf chamber (6 cm2), which received a steady flow rate of 500 µmol air s–1 with different air CO2 concentrations (Ca, µmol CO2 mol–1 air) for each step. The first step consisted of 20 min of dark adaptation, and Ca of 350 µmol mol–1 to ensure a steady-state activation of Rubisco (Long and Bernacchi, 2003). The second step consisted of re-adaptation of leaf to actinic light for 0.1 min. Then, the Ca was decreased to 50 µmol mol–1, and then increased progressively to 100, 150, 200, 250, 350, 500, 650, 1000, 1500 and 2000 µmol mol–1. The parameters of chlorophyll fluorescence were measured at each CO2 concentration. The different Ca were obtained automatically with a CO2 injector System (Li-cor 6400-01), which mixed CO2-free air and high pressure pure liquefied CO2. The leaf chamber ambient air composition was adjusted to maintain steady-state of ambient O2 concentration (210 mmol mol–1), PAR of 1000 µmol quanta m–2 s–1 and leaf temperature of 32 °C. The leaf-to-air vapour pressure difference varied from 1.5 to 3.0 kPa. All of CO2 exchange data were corrected for leakage of CO2 into and out the leaf cuvette, using thermally killed leaves according to Flexas et al. (2007). The fluorescence parameters quantum efficiency of linear transport through PSII (ФPSII, mol e– mol–1 quanta) and photochemical quenching (qP, unitless) were determined with the Li-6400 by exposing the leaves to various light treatments. 3.2.3. Shoot sampling
The leaves used for photosynthesis measurements were labelled and, when all the
measurements of CO2 response curves were finished (stage R3/R4), were harvested in the afternoon (16.30 h), frozen in liquid nitrogen and stored at –80 °C for sugar and starch analyses. The remaining shoots were dried at 60 °C for 48 h and weighed. Leaves were ground for total N and ureide-N analyses. Roots and nodules were thoroughly but gently washed with tap water and dried at 60 °C for 48 h. After that, nodules were detached, counted and weighed.
Chapter 3
44
3.2.4. Leaf chemical analyses Soluble sugars and starch were extracted by ethanol (Hungria, 1994). The soluble
sugars (hexoses and their methylated derivatives) were determined based on Dubois et al. (1956). The total starch was analyzed according to the enzymatic method of McClearly et al. (1997) using a commercial assay kit (K-TSTA, Megazyme International Ireland Ltd, Bray, Republic of Ireland). Total ureide content was extracted according to Hungria (1994) and determined with the method of Vogels and van der Drift (1970). Total N was extracted from 100 mg of dry ground leaves with a sulfuric acid digestion according to the Kjeldahl method. The obtained leaf N was then converted to leaf N content (g N m–2) using specific leaf area. Chlorophyll content was determined with the chlorophyllmeter SPAD 502 (Konica Minolta Sensing, Inc., Osaka, Japan). Each replicate consisted of an average of three SPAD values, measured at different points of the leaf. The average SPAD values were converted to chlorophyll content (mg chlorophyll m–2 leaf) based on a preliminary calibration. The calibration consisted of measuring SPAD values in three spots of 30 different soybean leaves. From each spot, a leaf disc (3.67 cm2) was punched. Leaf disks were submerged in 25 ml of 80 % acetone and the flasks were covered with aluminium film and incubated in the dark at 10 °C for 72 h. Then, the absorbances of the samples were read at 645 nm and 663 nm as recommended by Linder (1974). The chlorophyll content was calculated with the equation provided by Arnon (1949), using the coefficients derived by McKinney (1941). 3.2.5. Biochemical Model of Leaf Photosynthesis
We used the model of Farquhar et al. (1980), later modified by Sharkey (1985), for C3 photosynthesis to analyze photosynthetic regulations of our experimental plants. The model assumes that A (µmol CO2 m–2 s–1) is determined by three limiting processes: carboxylation limited by Rubisco activity (AC), by electron transport (AJ), and by TPU (AP) according to the equation:
),,min( PJC AAAA =
For simplicity of our model analysis we assumed no significant mesophyll resistance, as our aim is to use a simple model as a means to understand photosynthesis differences in inoculated and N-fertilized soybean plants. With this assumption, the first two limiting processes [AC, AJ (based on the NADPH demand)] can be described as follows:
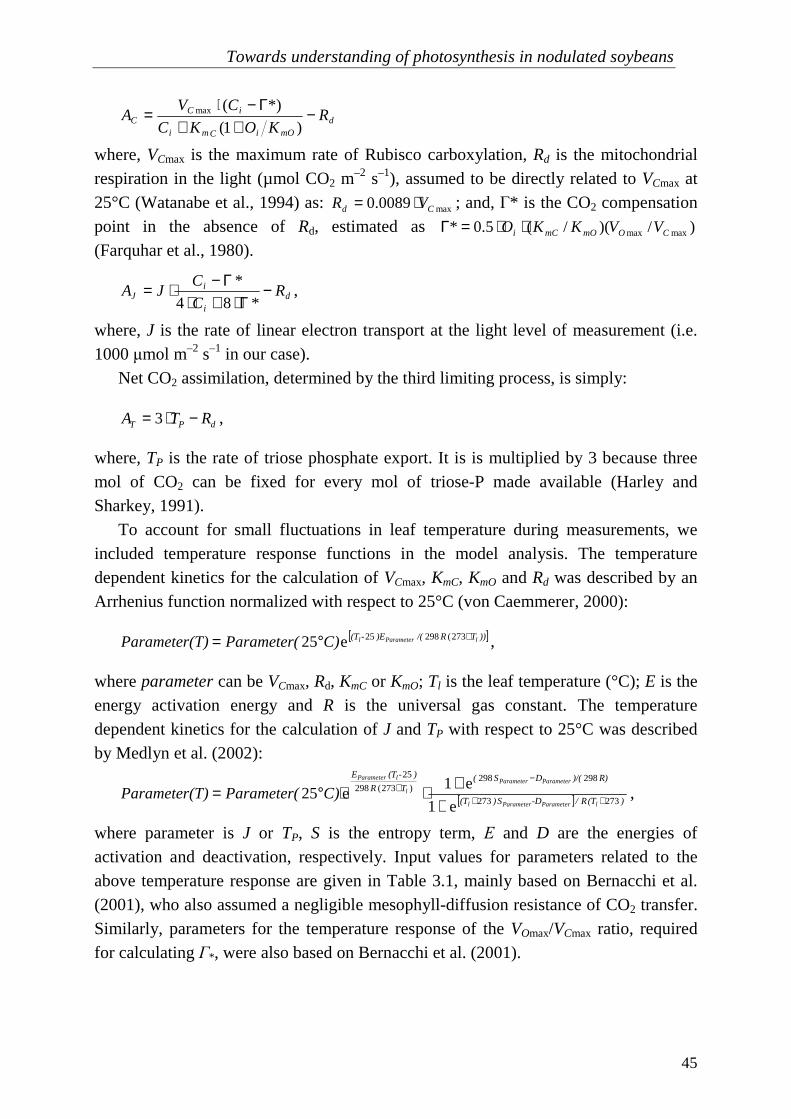
Towards understanding of photosynthesis in nodulated soybeans
45
dmOiCmi
iCC R
KOKC
CVA −
++Γ−⋅=
)1(
*)(max
where, VCmax is the maximum rate of Rubisco carboxylation, Rd is the mitochondrial respiration in the light (µmol CO2 m
–2 s–1), assumed to be directly related to VCmax at 25°C (Watanabe et al., 1994) as: max0089.0 Cd VR ⋅= ; and, Γ* is the CO2 compensation point in the absence of Rd, estimated as )/)(/(5.0* maxmax COmOmCi VVKKO ⋅⋅=Γ (Farquhar et al., 1980).
di
iJ R
C
CJA −
Γ⋅+⋅Γ−⋅=
*84
*,
where, J is the rate of linear electron transport at the light level of measurement (i.e. 1000 µmol m–2 s–1 in our case).
Net CO2 assimilation, determined by the third limiting process, is simply:
dPT RTA −⋅= 3 ,
where, TP is the rate of triose phosphate export. It is is multiplied by 3 because three mol of CO2 can be fixed for every mol of triose-P made available (Harley and Sharkey, 1991).
To account for small fluctuations in leaf temperature during measurements, we included temperature response functions in the model analysis. The temperature dependent kinetics for the calculation of VCmax, KmC, KmO and Rd was described by an Arrhenius function normalized with respect to 25°C (von Caemmerer, 2000):
[ ]))TR/()E-(T lParameterlC)Parameter(T)Parameter( +°= 273(29825e25 ,
where parameter can be VCmax, Rd, KmC or KmO; Tl is the leaf temperature (°C); E is the energy activation energy and R is the universal gas constant. The temperature dependent kinetics for the calculation of J and TP with respect to 25°C was described by Medlyn et al. (2002):
[ ] )(TR/-DS)(T
R))/(DS(TR
)-(TE
lParameterParameterl
ParameterParameter
l
lParameter
C)Parameter(T)Parameter(273273
298298)273(298
25
e1
e1e25 ++
−+
++⋅⋅°= ,
where parameter is J or TP, S is the entropy term, Ε and D are the energies of activation and deactivation, respectively. Input values for parameters related to the above temperature response are given in Table 3.1, mainly based on Bernacchi et al. (2001), who also assumed a negligible mesophyll-diffusion resistance of CO2 transfer. Similarly, parameters for the temperature response of the VOmax/VCmax ratio, required for calculating Γ*, were also based on Bernacchi et al. (2001).
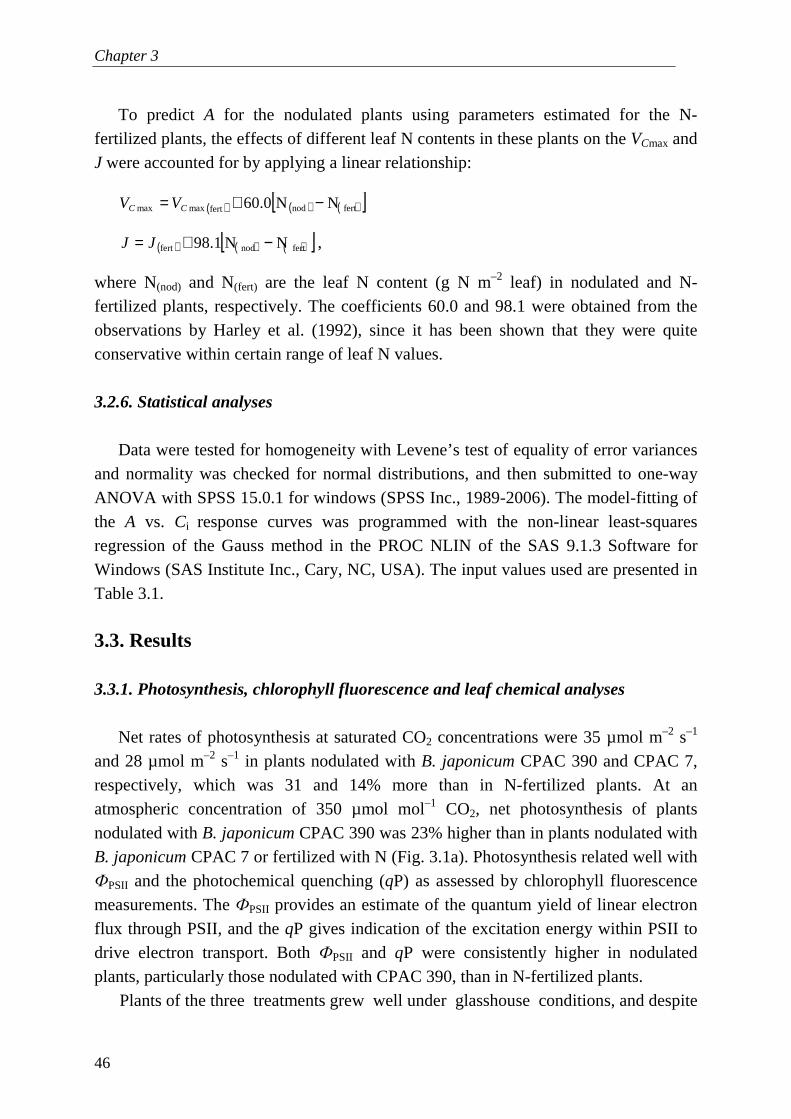
Chapter 3
46
To predict A for the nodulated plants using parameters estimated for the N-fertilized plants, the effects of different leaf N contents in these plants on the VCmax and J were accounted for by applying a linear relationship:
( ) ( ) ( )[ ]fertnodfertmaxmax NN0.60 −+= CC VV
( ) ( ) ( )[ ]fertnodfert NN98.1 −+= JJ ,
where N(nod) and N(fert) are the leaf N content (g N m–2 leaf) in nodulated and N-fertilized plants, respectively. The coefficients 60.0 and 98.1 were obtained from the observations by Harley et al. (1992), since it has been shown that they were quite conservative within certain range of leaf N values. 3.2.6. Statistical analyses
Data were tested for homogeneity with Levene’s test of equality of error variances and normality was checked for normal distributions, and then submitted to one-way ANOVA with SPSS 15.0.1 for windows (SPSS Inc., 1989-2006). The model-fitting of the A vs. Ci response curves was programmed with the non-linear least-squares regression of the Gauss method in the PROC NLIN of the SAS 9.1.3 Software for Windows (SAS Institute Inc., Cary, NC, USA). The input values used are presented in Table 3.1. 3.3. Results 3.3.1. Photosynthesis, chlorophyll fluorescence and leaf chemical analyses
Net rates of photosynthesis at saturated CO2 concentrations were 35 µmol m–2 s–1
and 28 µmol m–2 s–1 in plants nodulated with B. japonicum CPAC 390 and CPAC 7, respectively, which was 31 and 14% more than in N-fertilized plants. At an atmospheric concentration of 350 µmol mol–1 CO2, net photosynthesis of plants nodulated with B. japonicum CPAC 390 was 23% higher than in plants nodulated with B. japonicum CPAC 7 or fertilized with N (Fig. 3.1a). Photosynthesis related well with ФPSII and the photochemical quenching (qP) as assessed by chlorophyll fluorescence measurements. The ФPSII provides an estimate of the quantum yield of linear electron flux through PSII, and the qP gives indication of the excitation energy within PSII to drive electron transport. Both ФPSII and qP were consistently higher in nodulated plants, particularly those nodulated with CPAC 390, than in N-fertilized plants.
Plants of the three treatments grew well under glasshouse conditions, and despite
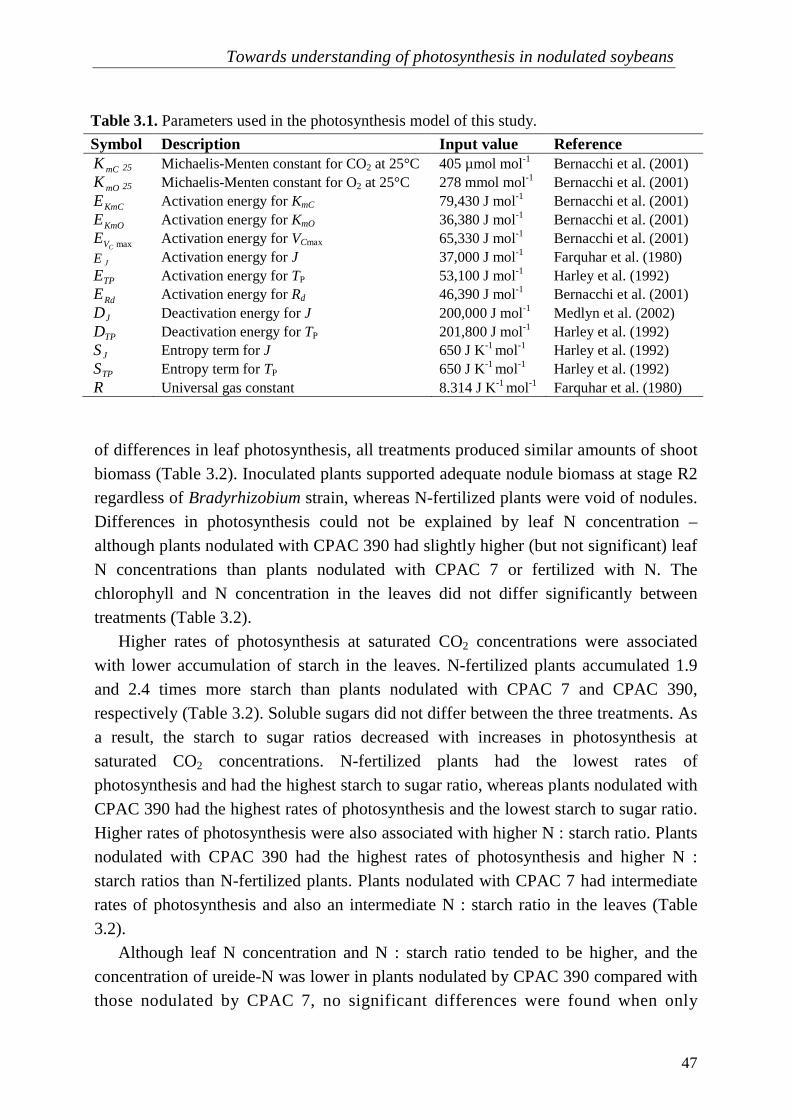
Towards understanding of photosynthesis in nodulated soybeans
47
of differences in leaf photosynthesis, all treatments produced similar amounts of shoot biomass (Table 3.2). Inoculated plants supported adequate nodule biomass at stage R2 regardless of Bradyrhizobium strain, whereas N-fertilized plants were void of nodules. Differences in photosynthesis could not be explained by leaf N concentration – although plants nodulated with CPAC 390 had slightly higher (but not significant) leaf N concentrations than plants nodulated with CPAC 7 or fertilized with N. The chlorophyll and N concentration in the leaves did not differ significantly between treatments (Table 3.2).
Higher rates of photosynthesis at saturated CO2 concentrations were associated with lower accumulation of starch in the leaves. N-fertilized plants accumulated 1.9 and 2.4 times more starch than plants nodulated with CPAC 7 and CPAC 390, respectively (Table 3.2). Soluble sugars did not differ between the three treatments. As a result, the starch to sugar ratios decreased with increases in photosynthesis at saturated CO2 concentrations. N-fertilized plants had the lowest rates of photosynthesis and had the highest starch to sugar ratio, whereas plants nodulated with CPAC 390 had the highest rates of photosynthesis and the lowest starch to sugar ratio. Higher rates of photosynthesis were also associated with higher N : starch ratio. Plants nodulated with CPAC 390 had the highest rates of photosynthesis and higher N : starch ratios than N-fertilized plants. Plants nodulated with CPAC 7 had intermediate rates of photosynthesis and also an intermediate N : starch ratio in the leaves (Table 3.2).
Although leaf N concentration and N : starch ratio tended to be higher, and the concentration of ureide-N was lower in plants nodulated by CPAC 390 compared with those nodulated by CPAC 7, no significant differences were found when only
Table 3.1. Parameters used in the photosynthesis model of this study.
Symbol Description Input value Reference
mCK 25 Michaelis-Menten constant for CO2 at 25°C 405 µmol mol-1 Bernacchi et al. (2001)
mOK 25 Michaelis-Menten constant for O2 at 25°C 278 mmol mol-1 Bernacchi et al. (2001)
KmCE Activation energy for KmC 79,430 J mol-1 Bernacchi et al. (2001)
KmOE Activation energy for KmO 36,380 J mol-1 Bernacchi et al. (2001)
maxCVE Activation energy for VCmax 65,330 J mol-1 Bernacchi et al. (2001)
JE Activation energy for J 37,000 J mol-1 Farquhar et al. (1980)
TPE Activation energy for TP 53,100 J mol-1 Harley et al. (1992)
RdE Activation energy for Rd 46,390 J mol-1 Bernacchi et al. (2001)
JD Deactivation energy for J 200,000 J mol-1 Medlyn et al. (2002)
TPD Deactivation energy for TP 201,800 J mol-1 Harley et al. (1992)
JS Entropy term for J 650 J K-1 mol-1 Harley et al. (1992)
TPS Entropy term for TP 650 J K-1 mol-1 Harley et al. (1992) R Universal gas constant 8.314 J K-1 mol-1 Farquhar et al. (1980)
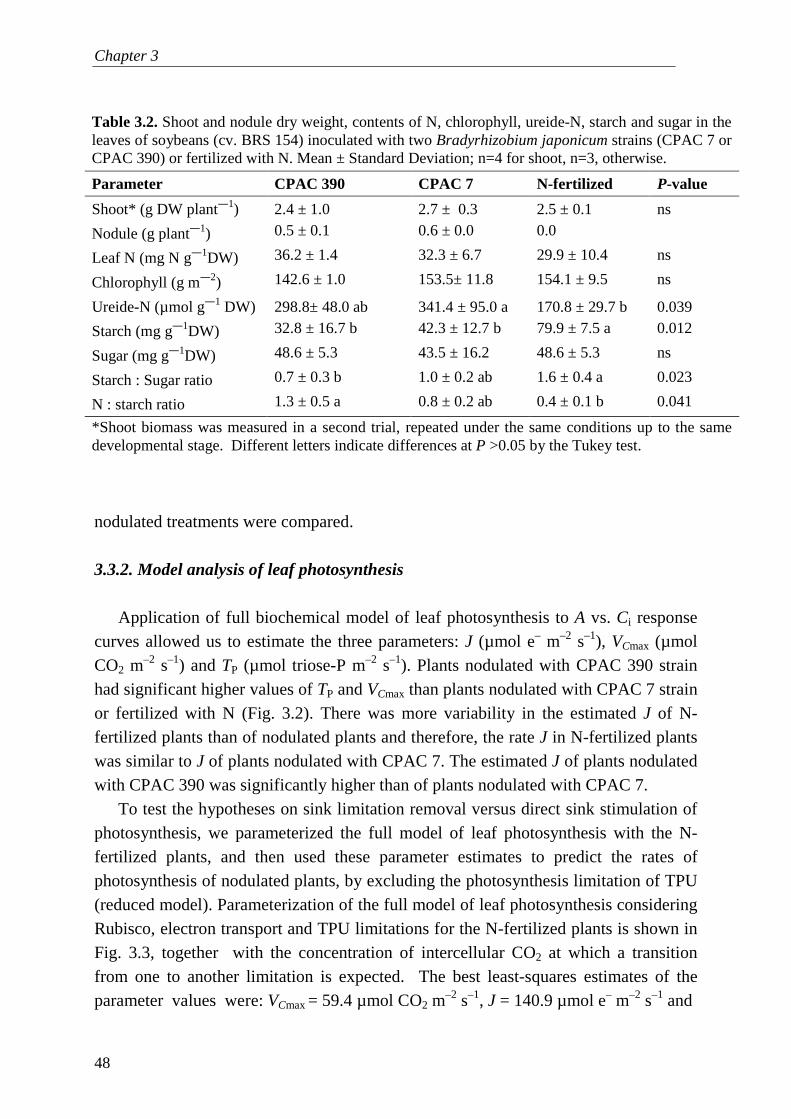
Chapter 3
48
nodulated treatments were compared. 3.3.2. Model analysis of leaf photosynthesis
Application of full biochemical model of leaf photosynthesis to A vs. Ci response
curves allowed us to estimate the three parameters: J (µmol e– m–2 s–1), VCmax (µmol CO2 m
–2 s–1) and TP (µmol triose-P m–2 s–1). Plants nodulated with CPAC 390 strain had significant higher values of TP and VCmax than plants nodulated with CPAC 7 strain or fertilized with N (Fig. 3.2). There was more variability in the estimated J of N-fertilized plants than of nodulated plants and therefore, the rate J in N-fertilized plants was similar to J of plants nodulated with CPAC 7. The estimated J of plants nodulated with CPAC 390 was significantly higher than of plants nodulated with CPAC 7.
To test the hypotheses on sink limitation removal versus direct sink stimulation of photosynthesis, we parameterized the full model of leaf photosynthesis with the N-fertilized plants, and then used these parameter estimates to predict the rates of photosynthesis of nodulated plants, by excluding the photosynthesis limitation of TPU (reduced model). Parameterization of the full model of leaf photosynthesis considering Rubisco, electron transport and TPU limitations for the N-fertilized plants is shown in Fig. 3.3, together with the concentration of intercellular CO2 at which a transition from one to another limitation is expected. The best least-squares estimates of the parameter values were: VCmax = 59.4 µmol CO2 m
–2 s–1, J = 140.9 µmol e– m–2 s–1 and
Table 3.2. Shoot and nodule dry weight, contents of N, chlorophyll, ureide-N, starch and sugar in the leaves of soybeans (cv. BRS 154) inoculated with two Bradyrhizobium japonicum strains (CPAC 7 or CPAC 390) or fertilized with N. Mean ± Standard Deviation; n=4 for shoot, n=3, otherwise.
Parameter CPAC 390 CPAC 7 N-fertilized P-value
Shoot* (g DW plant―1) 2.4 ± 1.0 2.7 ± 0.3 2.5 ± 0.1 ns
Nodule (g plant―1) 0.5 ± 0.1 0.6 ± 0.0 0.0
Leaf N (mg N g―1DW) 36.2 ± 1.4 32.3 ± 6.7 29.9 ± 10.4 ns
Chlorophyll (g m―2) 142.6 ± 1.0 153.5± 11.8 154.1 ± 9.5 ns
Ureide-N (µmol g―1 DW) 298.8± 48.0 ab 341.4 ± 95.0 a 170.8 ± 29.7 b 0.039
Starch (mg g―1DW) 32.8 ± 16.7 b 42.3 ± 12.7 b 79.9 ± 7.5 a 0.012
Sugar (mg g―1DW) 48.6 ± 5.3 43.5 ± 16.2 48.6 ± 5.3 ns
Starch : Sugar ratio 0.7 ± 0.3 b 1.0 ± 0.2 ab 1.6 ± 0.4 a 0.023
N : starch ratio 1.3 ± 0.5 a 0.8 ± 0.2 ab 0.4 ± 0.1 b 0.041
*Shoot biomass was measured in a second trial, repeated under the same conditions up to the same developmental stage. Different letters indicate differences at P >0.05 by the Tukey test.
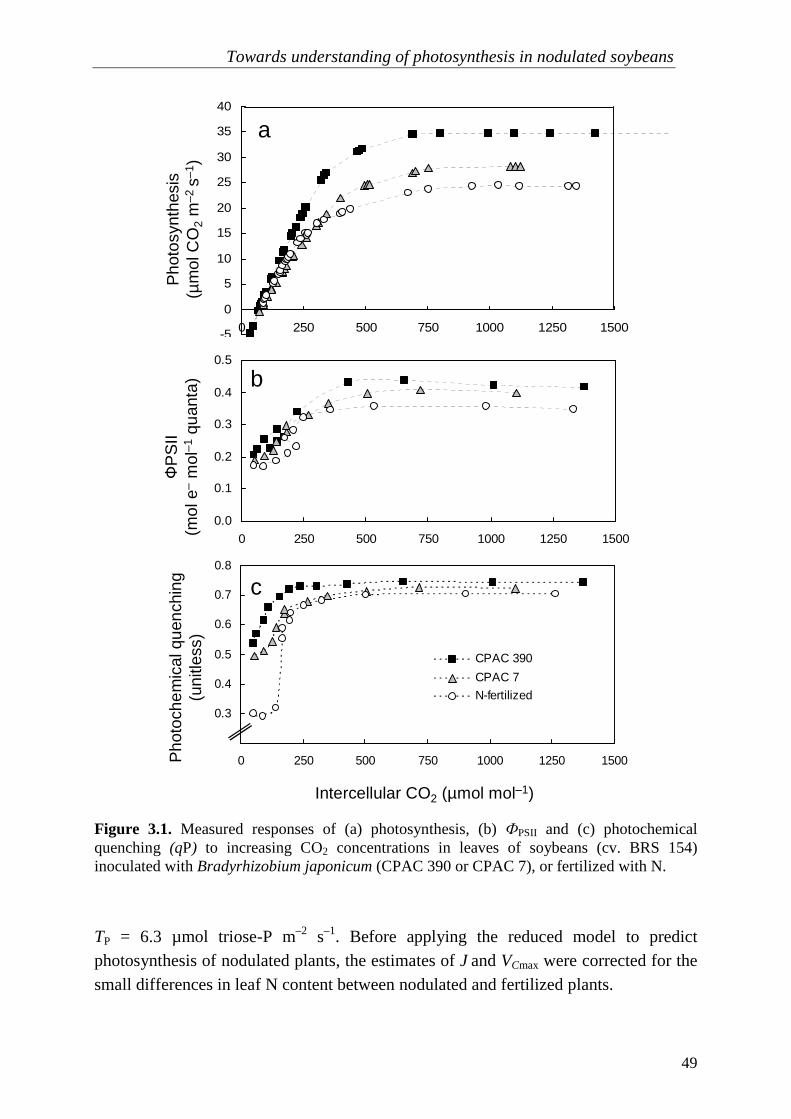
Towards understanding of photosynthesis in nodulated soybeans
49
Figure 3.1. Measured responses of (a) photosynthesis, (b) ФPSII and (c) photochemical quenching (qP) to increasing CO2 concentrations in leaves of soybeans (cv. BRS 154) inoculated with Bradyrhizobium japonicum (CPAC 390 or CPAC 7), or fertilized with N.
TP = 6.3 µmol triose-P m–2 s–1. Before applying the reduced model to predict photosynthesis of nodulated plants, the estimates of J and VCmax were corrected for the small differences in leaf N content between nodulated and fertilized plants.
-5
0
5
10
15
20
25
30
35
40
0 250 500 750 1000 1250 1500
0.2
0.3
0.4
0.5
0.6
0.7
0.8
0 250 500 750 1000 1250 1500
CPAC 390
CPAC 7
N-fertilized
0.0
0.1
0.2
0.3
0.4
0.5
0 250 500 750 1000 1250 1500
Pho
tosy
nthe
sis
(µm
ol C
O2
m–2
s–1
)Ф
PS
II(m
ol e
–m
ol–1
quan
ta)
Intercellular CO2 (µmol mol–1)
Pho
toch
emic
al q
uenc
hing
(uni
tless
)
a
c
b

Chapter 3
50
Figure 3.2. Parameters TP, VCmax and J, obtained by curve-fitting of A/Ci response curves of photosynthesis in leaves of soybeans inoculated with Bradyrhizobium japonicum strains (CPAC 7 or CPAC 390) or fertilized with N. Bars indicate 95% confidence intervals.
The reduced model predicted the rates of photosynthesis in plants nodulated with
CPAC 7 well, but strongly underestimated the rates of photosynthesis in plants nodulated with CPAC 390 (Fig. 3.4). The higher measured rates of photosynthesis of plants nodulated with CPAC 390 than predicted by removal of sink (TPU) limitation suggests that photosynthesis was directly sink-stimulated. The linear regression between predicted and measured rates of photosynthesis for plants nodulated with CPAC 390 had larger intercept and slope values than those estimated for plants nodulated with CPAC 7 (Fig. 3.5). Since the intercept of the regression gives an indication of agreement between measured and predicted A at the low Ci range, the large intercept value for the CPAC 390 treatment suggests that photosynthesis was already stimulated in plants nodulated with CPAC 390 well before the TPU limitation, which is expected to occur at saturated intercellular CO2 concentrations. 3.4. Discussion
The photosynthetic C costs of N2 fixation through rhizobial symbioses are highly
variable among different legumes, strains and their respective combinations, and may utilize between 50 to 80% more photosynthates than the uptake and reduction of NO3 (Minchin et al., 1981; Minchin and Witty, 2005). In this study, soybean plants were inoculated with two isoline Bradyrhizobium strains with apparent different C costs of N2 fixation. Although there were no significant differences in shoot weight, leaf N concentration and nodule mass, plants nodulated with CPAC 390 strain had higher N : starch and lower ureide-N concentration in the leaves than plants nodulated with CPAC 7 (Table 3.2), indicating that more starch was withdrawn for each N fixed.
0
50
100
150
200
250
0
20
40
60
80
100
120
0123456789
10
µm
ol tr
iose
-P m
–2 s–
1
µm
ol C
O2
m–2
s–
1
µm
ol e
–m
–2s–
1
TP VC max J
CPAC 390 CPAC 7 N-fertilized

Towards understanding of photosynthesis in nodulated soybeans
51
Figure 3.3. Model fit to A/Ci response curves measured on leaves of N-fertilized soybean plants. Best least-squares estimates of the parameter values were: VCmax = 59.4 µmol CO2 m
–2 s–1, J = 140.9 µmol e– m–2 s–1, TP = 6.3 µmol triose-P m–2 s–1.
Furthermore, the application of the full model of leaf photosynthesis predicted that plants nodulated with CPAC 390 had higher rates of TP ―meaning higher photosynthate export from chloroplast― than those plants inoculated with CPAC 7 or fertilized with N (Fig. 3.2). We surmise that differences in TP between plants nodulated with the two strains were due to different C costs of N2 fixation (Minchin et
al., 1981; Minchin and Witty, 2005). Nodule biomass did not differ in plants nodulated by the two strains (Table 3.2). All these results suggest that energy efficiency, in terms of gram C required per gram N fixed, differed between nodule strains. Since the C costs of N2 fixation are largely determined by nodule respiration (Witty et al., 1983; Ryle et al., 1984; Voisin et al., 2003), the larger amounts of C per N fixed required by CPAC 390 compared with CPAC 7 must have been due to higher rates of respiration in nodules formed by CPAC 390.
Phillips (1980) suggested legume growth could be improved by increasing the energy efficiency of N2 fixation, in other words by reducing the relative costs in terms of g C g N–1. Thus a rhizobial strain with less C costs of N2 fixation would be preferred for use in inoculants. However, since plants nodulated with CPAC 390 had much higher rates of photosynthesis than those nodulated with CPAC 7, our results suggest that soybean plants can compensate for the increased C costs for N2 fixation by increasing photosynthesis. We provide evidence to support earlier suggestions
0
5
10
15
20
25
30
35
40
45
50
0 250 500 750 1000 1250 1500
AcAjAtFitted model
Intercellular CO2 (µmol mol–1)
Pho
tosy
nthe
sis
(µm
ol C
O2
m–2
s–1
)Rubiscolimitation
Electron transportlimitation
TPUlimitation
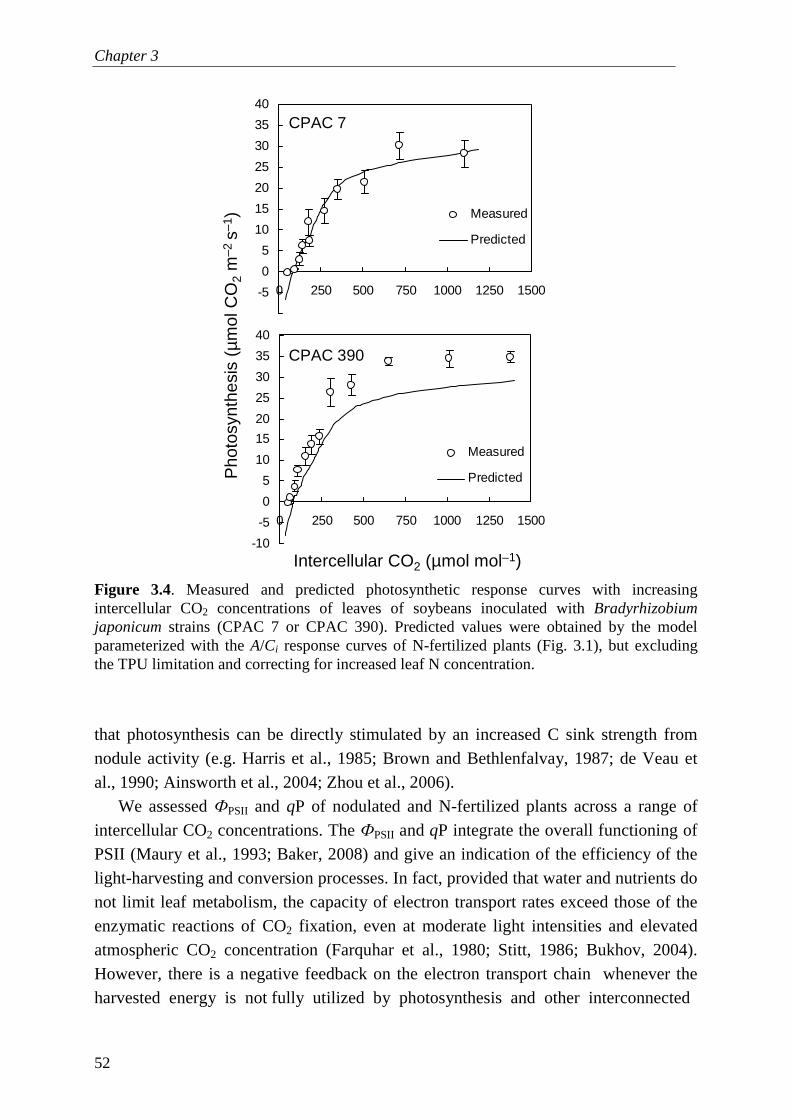
Chapter 3
52
Figure 3.4. Measured and predicted photosynthetic response curves with increasing intercellular CO2 concentrations of leaves of soybeans inoculated with Bradyrhizobium japonicum strains (CPAC 7 or CPAC 390). Predicted values were obtained by the model parameterized with the A/Ci response curves of N-fertilized plants (Fig. 3.1), but excluding the TPU limitation and correcting for increased leaf N concentration.
that photosynthesis can be directly stimulated by an increased C sink strength from nodule activity (e.g. Harris et al., 1985; Brown and Bethlenfalvay, 1987; de Veau et al., 1990; Ainsworth et al., 2004; Zhou et al., 2006).
We assessed ФPSII and qP of nodulated and N-fertilized plants across a range of intercellular CO2 concentrations. The ФPSII and qP integrate the overall functioning of PSII (Maury et al., 1993; Baker, 2008) and give an indication of the efficiency of the light-harvesting and conversion processes. In fact, provided that water and nutrients do not limit leaf metabolism, the capacity of electron transport rates exceed those of the enzymatic reactions of CO2 fixation, even at moderate light intensities and elevated atmospheric CO2 concentration (Farquhar et al., 1980; Stitt, 1986; Bukhov, 2004). However, there is a negative feedback on the electron transport chain whenever the harvested energy is not fully utilized by photosynthesis and other interconnected
-10
-5
0
5
10
15
20
25
30
35
40
0 250 500 750 1000 1250 1500
Measured
Predicted
-10
-5
0
5
10
15
20
25
30
35
40
0 250 500 750 1000 1250 1500
Measured
Predicted
Intercellular CO2 (µmol mol–1)
Pho
tosy
nthe
sis
(µm
ol C
O2
m–2
s–1
)
CPAC 390
CPAC 7

Towards understanding of photosynthesis in nodulated soybeans
53
Figure 3.5. Linear regression between measured and predicted rates of photosynthesis in leaves of soybeans inoculated with Bradyrhizobium japonicum strains (CPAC 7 or CPAC 390).
processes such as N reduction; the excess energy must be released as heat to prevent the formation of reactive O2 species (Pammenter et al., 1993; de Groot et al., 2003; Bukhov, 2004). This feedback results in reduced ФPSII and qP of chlorophyll fluorescence (Baker, 2008). Contrary to Maury et al. (1993), who observed differences between N-fertilized and nodulated plants, but did not observed differences between plants nodulated with two different B. japonicum strains, we observed that plants nodulated with CPAC 390 had higher ФPSII and qP than plants nodulated with CPAC 7. This was confirmed by the linear electron transport rate (J) estimated from gas exchange data using the model (Fig. 3.2). The model predicted that there was a difference in J between plants nodulated with CPAC 390 and plants nodulated with CPAC 7, but the estimated J in the N-fertilized plants did not differ significantly from the other treatments. Plants depending on NO3
― reduction may sustain high rates of electron transport because, apart from the demand for reductants to support CO2 fixation, N-fertilized plants utilize reductants to reduce NO3
– (e.g. Pate, 1980; Cen and Layzell, 2003; Yin et al., 2006). With regard to the nodulated plants, J of those nodulated with CPAC 7 were possibly down-regulated by lower TPU rates in comparison with those plants nodulated with CPAC 390, since electron transport is highly regulated by (e.g. Sharkey et al., 1988), and tightly coupled to (Yin et al., 2009) the TPU limitation.
We set out to test the hypothesis that nodulated plants have higher rates of photosynthesis to compensate for increased C costs from N2 fixation. There are two
y = 1.12 x + 4.16R 2 = 0.96
y = 0.95x + 1.19R 2 = 0.86
-10
-5
0
5
10
15
20
25
30
35
40
-10 -5 0 5 10 15 20 25 30 35 40
CPAC 390
CPAC 7
Mea
sure
d P
hoto
synt
hesi
s(µ
mol
CO
2m
–2 s
–1)
Predicted Photosynthesis(µmol CO2 m–2 s–1)
Chapter 3
54
plausible explanations for increased rates of photosynthesis: removal of sink limitation or direct sink stimulation of photosynthesis. Removal of sink (TPU) limitation of photosynthesis explained the increases in the plants nodulated with CPAC 7 (Fig. 3.4); so the difference in A shown in Fig. 3.1 between plants nodulated with CPAC 7 and N-fertilised plants can be explained by the observed small difference in leaf N between the two treatments (Table 3.2). By contrast, the increase in photosynthesis in the plants nodulated with CPAC 390 was explained more by direct sink stimulation of photosynthesis. Furthermore, there were differences between the intercepts of the linear regressions of predicted and measured rates of photosynthesis on plants nodulated with CPAC 390 and CPAC 7 (Fig. 3.5). This suggests that direct sink stimulation of photosynthesis in the plants nodulated with CPAC 390 occurred at levels of Ci well lower than the saturated CO2 concentration at which the TPU limitation is expected. The biochemical model of photosynthesis we used does not consider feedbacks between the three limiting processes of photosynthesis. However, there is evidence that photosynthetic electron transport is inhibited when synthesis of starch and sucrose limits the rate of CO2 fixation (Sharkey et al., 1988; Pammenter et al., 1993). We suggest that a model has to consider these feedback effects if it is used to fully predict the effects of direct sink stimulation by C costs of N2 fixation on the photosynthesis.
In conclusion, soybean plants adapt their photosynthetic capacity to support different C sink strengths of N2 fixation, possibly through two mechanisms: removal of sink limitation or by direct sink stimulation. Our analysis suggests that which mechanism plays a major role may depend on the potential effectiveness of N2 fixation of each Bradyrhizobium strain.

Chapter 4
Differences in photosynthetic behaviour and leaf senescence of soybean (Glycine max [L.] Merrill) relying on N 2 fixation or nitrate supply.†
† This chapter is published as:
Kaschuk, G., Hungria, M., Leffelaar, P.A., Giller, K.E., Kuyper, T.W., 2009. Differences in photosynthetic
behaviour and leaf senescence of soybean (Glycine max [L.] Merrill) relying on N2 fixation or nitrate supply.
Plant Biology. DOI: 10.1111/j.1438-8677.2009.00211.x
Chapter 4
56
Abstract
Biological N2 fixation can fulfil the N demand of legumes but may cost as much as 14% of the current photosynthesis. This photosynthate (C) sink strength would result in loss of productivity if the rates of photosynthesis were not increased to compensate the costs. We measured the rates of leaf photosynthesis, concentrations of N, ureides and protein in leaves of two soybean cultivars (Glycine max [L.] Merrill) differing in potential shoot biomass production, either associated with Bradyrhizobium japonicum strains, or amended with NO3
― fertilizer. Our results show that the C costs of biological N2-fixation can be compensated by increased photosynthesis. Nodulated plants shifted the N metabolism towards ureide accumulation after the reproductive stage started, by which time leaf N concentration of nodulated plants was greater than in N-fertilized plants. The carbon sink strength of N2-fixation increased photosynthetic N use efficiency in the beginning of plant development. At later stages, although average protein concentrations were similar between the groups of plants, the maximum leaf protein of nodulated plants occurred a few days later than those of N-fertilized plants. The chlorophyll concentration of nodulated plants remained high until the pod-filling stage whereas the chlorophyll concentration of N-fertilized plants started to decrease as early as the flowering stage. These results suggest that due to higher C sink strength and efficient N2 fixation, nodulated plants achieve higher rates of photosynthesis and have leaf senescence delayed. Key words: carbon sink strength, ureides, starch, leaf protein, chlorophyll
N2 fixation, photosynthesis and leaf senescence
57
4.1. Introduction
Biological N2 fixation can fulfil the N demand of legume crops such as soybean (Glycine max (L.) Merrill), resulting in a significant increase in plant total N accumulation and higher N concentration in grains (Imsande, 1988) compared with N-fertilized plants. However, in terms of N acquisition these benefits are accompanied by an increase in respiration costs by 14% or more on the current photosynthesis when compared with fertilized soybean (Finke et al., 1982; Chapter 2). Nitrate assimilation results in costs of up to 2.5 g C g–1 N assimilated, whereas N2 fixation costs as much as 5.2 to 18.8 g C g–1 N (Minchin and Witty, 2005). Therefore, N2 fixation would be limited by photosynthate availability if there was not a simultaneous increase in the rates of photosynthesis (Lawn and Brun, 1974; Abu-Shakra et al., 1978; Fujita et al., 1988a; Imsande, 1988).
As N is essential for the synthesis of rubisco – responsible for CO2 fixation – and for the synthesis of light-harvesting chlorophyll, N2 fixation could enhance leaf N concentration and therefore stimulate photosynthesis (Evans, 1989; Hikosaka and Terashima, 1995). However, leaf N concentration and photosynthesis increase linearly only until a critical N concentration in the leaves is reached (e.g. Robertson et al., 2002). Beyond that, it is likely that a further increase in leaf N concentration will result in partial deactivation of the photosynthetic machinery (Mächler et al., 1988; Hikosaka and Terashima, 1995; Cheng and Fuchigami, 2000). Furthermore, the rates of photosynthesis also respond to factors other than leaf N concentration, such as environmental conditions and the changes in the source : sink ratios of the plant (Lawn and Brun, 1974; Mondal et al., 1978; Wittenbach, 1982, 1983; Crafts-Brandner and Egli, 1987; Ainsworth et al., 2004). There are reports showing that a decrease in the sink : source ratio by removing pods at the reproductive stage, decreases the rates of photosynthesis in soybean (Wittenbach, 1982, 1983; Crafts-Brandner and Egli, 1987). In addition, probably because of changes in the sink : source ratio, the absence of nodules decreases the response of photosynthesis to elevated CO2 (Ainsworth et al., 2004). Therefore, increases in the sink : source ratio due to larger C costs of N2 fixation compared with NO3
– uptake (Minchin and Witty, 2005) are likely to increase the rates of photosynthesis of soybean in symbiosis, regardless of the N effect, due to changes in the sink : source ratio.
We performed a study to examine the effect of soybean inoculation with efficient N2-fixing rhizobia on photosynthesis ― on leaf area basis, not on a canopy basis! ― in comparison with N-fertilized plants. Our first hypothesis is that increased C sink strength from N2 fixation leads to an increase in the rates of leaf photosynthesis, regardless of the N effect. We also predict that nodulated plants with lower shoot
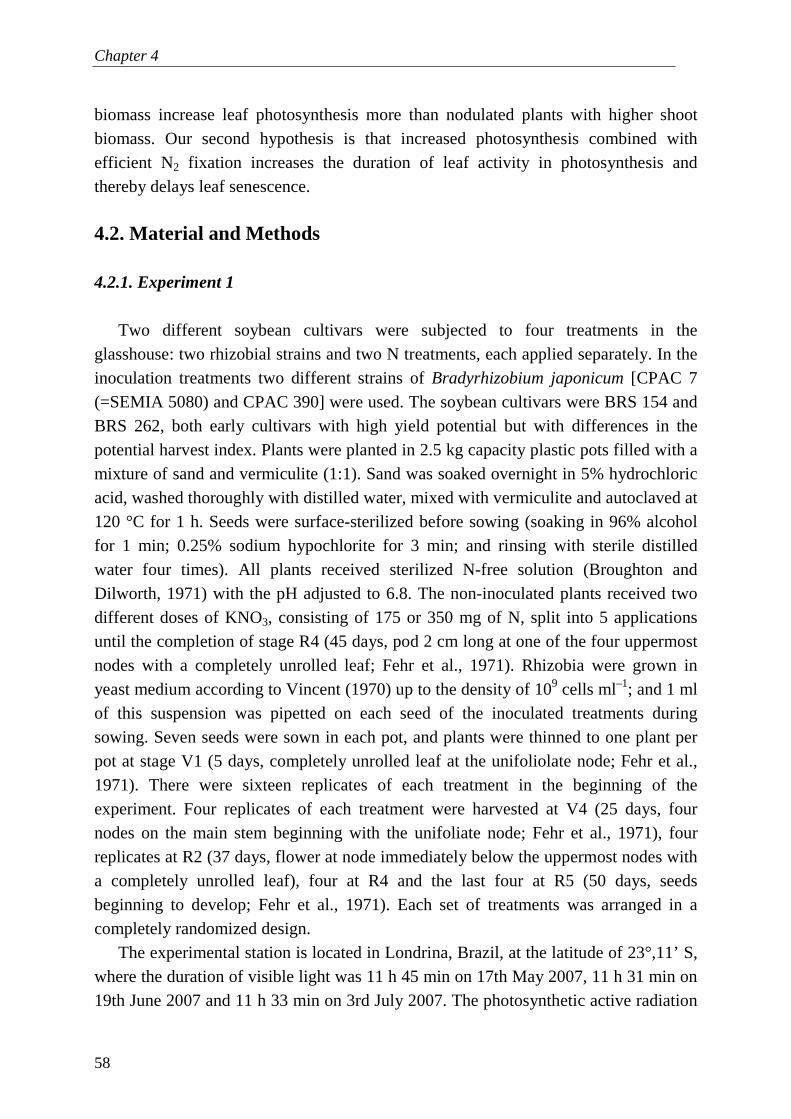
Chapter 4
58
biomass increase leaf photosynthesis more than nodulated plants with higher shoot biomass. Our second hypothesis is that increased photosynthesis combined with efficient N2 fixation increases the duration of leaf activity in photosynthesis and thereby delays leaf senescence. 4.2. Material and Methods 4.2.1. Experiment 1
Two different soybean cultivars were subjected to four treatments in the
glasshouse: two rhizobial strains and two N treatments, each applied separately. In the inoculation treatments two different strains of Bradyrhizobium japonicum [CPAC 7 (=SEMIA 5080) and CPAC 390] were used. The soybean cultivars were BRS 154 and BRS 262, both early cultivars with high yield potential but with differences in the potential harvest index. Plants were planted in 2.5 kg capacity plastic pots filled with a mixture of sand and vermiculite (1:1). Sand was soaked overnight in 5% hydrochloric acid, washed thoroughly with distilled water, mixed with vermiculite and autoclaved at 120 °C for 1 h. Seeds were surface-sterilized before sowing (soaking in 96% alcohol for 1 min; 0.25% sodium hypochlorite for 3 min; and rinsing with sterile distilled water four times). All plants received sterilized N-free solution (Broughton and Dilworth, 1971) with the pH adjusted to 6.8. The non-inoculated plants received two different doses of KNO3, consisting of 175 or 350 mg of N, split into 5 applications until the completion of stage R4 (45 days, pod 2 cm long at one of the four uppermost nodes with a completely unrolled leaf; Fehr et al., 1971). Rhizobia were grown in yeast medium according to Vincent (1970) up to the density of 109 cells ml–1; and 1 ml of this suspension was pipetted on each seed of the inoculated treatments during sowing. Seven seeds were sown in each pot, and plants were thinned to one plant per pot at stage V1 (5 days, completely unrolled leaf at the unifoliolate node; Fehr et al., 1971). There were sixteen replicates of each treatment in the beginning of the experiment. Four replicates of each treatment were harvested at V4 (25 days, four nodes on the main stem beginning with the unifoliate node; Fehr et al., 1971), four replicates at R2 (37 days, flower at node immediately below the uppermost nodes with a completely unrolled leaf), four at R4 and the last four at R5 (50 days, seeds beginning to develop; Fehr et al., 1971). Each set of treatments was arranged in a completely randomized design.
The experimental station is located in Londrina, Brazil, at the latitude of 23°,11’ S, where the duration of visible light was 11 h 45 min on 17th May 2007, 11 h 31 min on 19th June 2007 and 11 h 33 min on 3rd July 2007. The photosynthetic active radiation
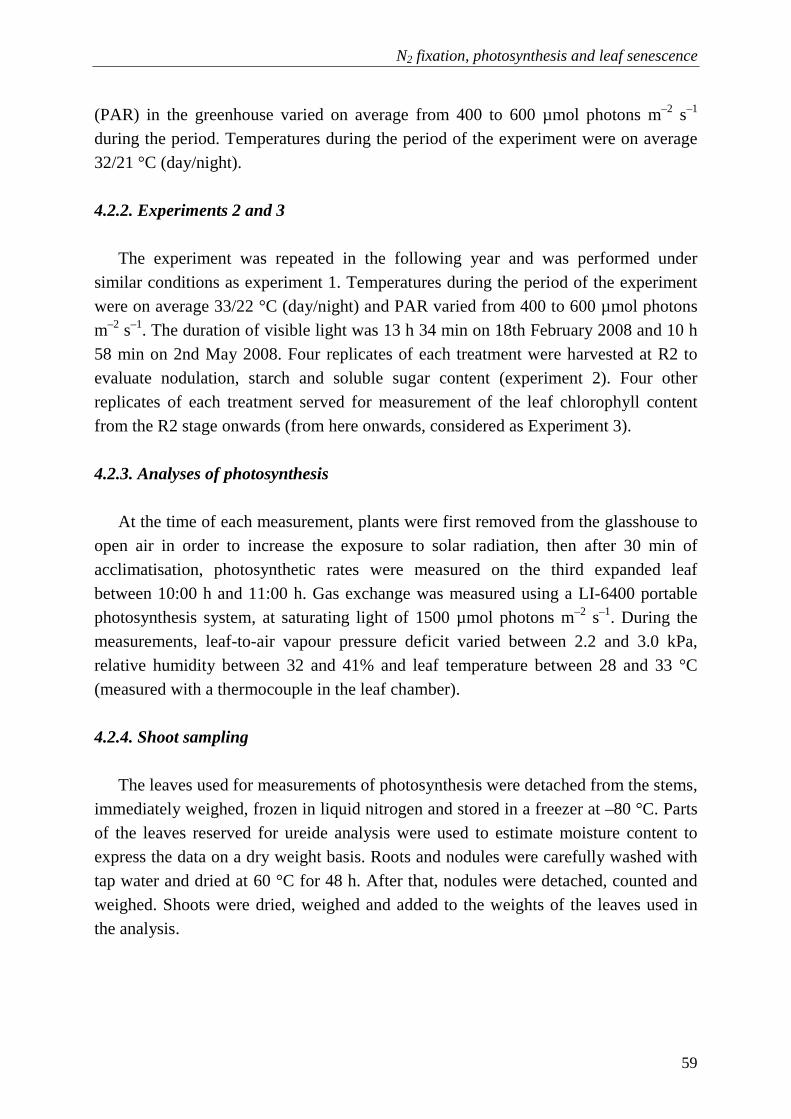
N2 fixation, photosynthesis and leaf senescence
59
(PAR) in the greenhouse varied on average from 400 to 600 µmol photons m–2 s–1 during the period. Temperatures during the period of the experiment were on average 32/21 °C (day/night). 4.2.2. Experiments 2 and 3
The experiment was repeated in the following year and was performed under similar conditions as experiment 1. Temperatures during the period of the experiment were on average 33/22 °C (day/night) and PAR varied from 400 to 600 µmol photons m–2 s–1. The duration of visible light was 13 h 34 min on 18th February 2008 and 10 h 58 min on 2nd May 2008. Four replicates of each treatment were harvested at R2 to evaluate nodulation, starch and soluble sugar content (experiment 2). Four other replicates of each treatment served for measurement of the leaf chlorophyll content from the R2 stage onwards (from here onwards, considered as Experiment 3). 4.2.3. Analyses of photosynthesis
At the time of each measurement, plants were first removed from the glasshouse to open air in order to increase the exposure to solar radiation, then after 30 min of acclimatisation, photosynthetic rates were measured on the third expanded leaf between 10:00 h and 11:00 h. Gas exchange was measured using a LI-6400 portable photosynthesis system, at saturating light of 1500 µmol photons m–2 s–1. During the measurements, leaf-to-air vapour pressure deficit varied between 2.2 and 3.0 kPa, relative humidity between 32 and 41% and leaf temperature between 28 and 33 °C (measured with a thermocouple in the leaf chamber). 4.2.4. Shoot sampling
The leaves used for measurements of photosynthesis were detached from the stems,
immediately weighed, frozen in liquid nitrogen and stored in a freezer at –80 °C. Parts of the leaves reserved for ureide analysis were used to estimate moisture content to express the data on a dry weight basis. Roots and nodules were carefully washed with tap water and dried at 60 °C for 48 h. After that, nodules were detached, counted and weighed. Shoots were dried, weighed and added to the weights of the leaves used in the analysis.

Chapter 4
60
4.2.5. Leaf N content and photosynthetic N use efficiency Total N was extracted from 100 mg of dry ground leaves with the Kjeldahl method
as described by Alves et al. (1994). Photosynthetic N use efficiency (PNUE) was calculated as the ratio of the rates of photosynthesis [actual rates (µmol CO2 m
–2 s–1) multiplied by 0.044 to obtain mg CO2 m
–2 s–1] and the N content in the leaves [N (mg g-1) times 54.125 g m–2 leaf]. The constant 54.125 g m–2 was obtained by averaging the specific leaf weight of 24 genotypes by Hesketh et al. (1981). 4.2.6. Leaf ureides-N
After weighing, frozen leaves were dried at 60 °C to constant mass, and ground. One hundred mg were used to extract ureides according to Hungria (1994). Ureides were determined according to the method of Vogels and van der Drift (1970). 4.2.7. Leaf protein content
About 1.3 g of frozen fresh leaves was ground using a mortar and pestle in liquid nitrogen followed by extraction using 15 ml of buffer as described by Catt and Millard (1988). The homogenate was incubated in ice with rotation in a laminar flow hood for 2 h. The homogenate was centrifuged at 12,000 rpm for 20 min and the supernatant was filtered in 45 µm pore membranes. The soluble protein content was determined using a colorimetric assay (Bradford, 1976). 4.2.8. Leaf soluble sugars and starch
Leaves were harvested in the afternoon (16:30 h), immediately frozen in liquid N, and stored at –80 °C until required. Then, they were ground under liquid N and a sample of 150-200 mg of ground material was transferred to 2 ml tubes. The samples were washed with 100% acetone, stirred and centrifuged at 6,000 rpm for 5 min several times until the supernatant was yellow-beige transparent. The tubes were opened and the samples dried in a laminar flow chamber. The pellets were suspended in 1.5 ml 80% ethanol, stirred a few seconds, incubated in boiling water for 20 min, and centrifuged three times each at 10,000 rpm for 10 min. The supernatants of each sample were assembled and stored in the refrigerator. The supernatant contained the soluble sugars and the pellet contained the starch. The soluble sugars were determined based on the method described by Dubois et al. (1956). The total starch was analyzed
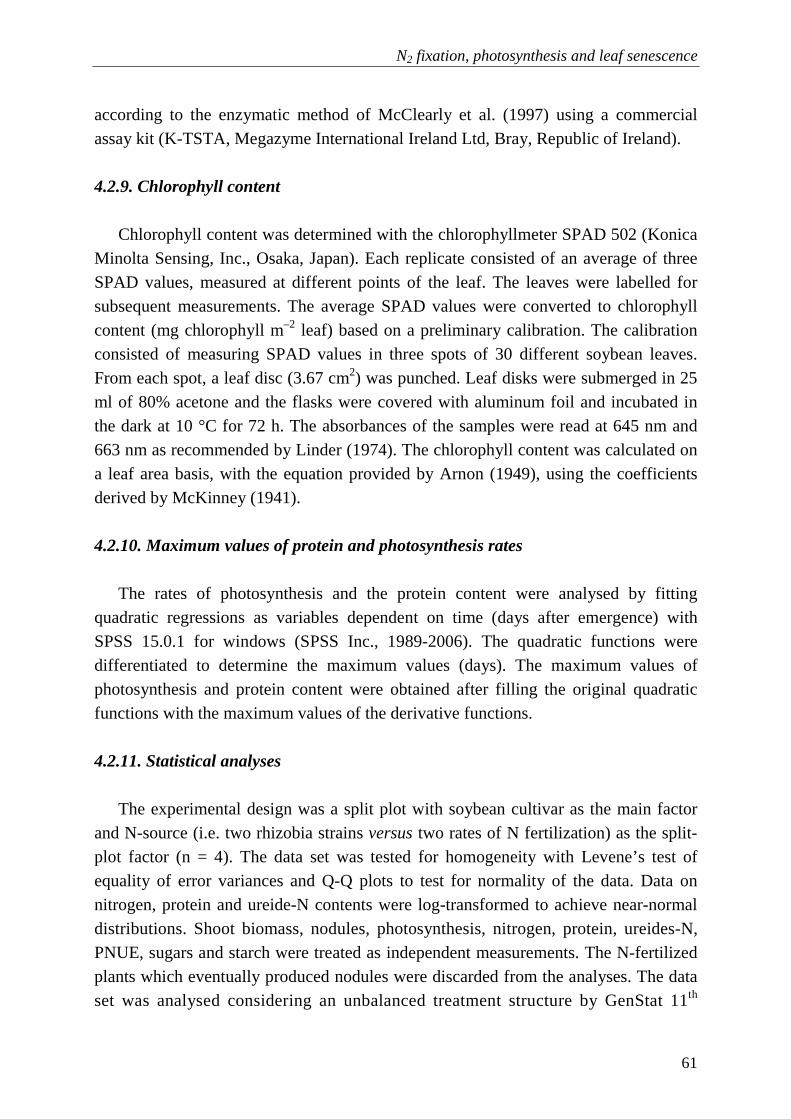
N2 fixation, photosynthesis and leaf senescence
61
according to the enzymatic method of McClearly et al. (1997) using a commercial assay kit (K-TSTA, Megazyme International Ireland Ltd, Bray, Republic of Ireland). 4.2.9. Chlorophyll content
Chlorophyll content was determined with the chlorophyllmeter SPAD 502 (Konica Minolta Sensing, Inc., Osaka, Japan). Each replicate consisted of an average of three SPAD values, measured at different points of the leaf. The leaves were labelled for subsequent measurements. The average SPAD values were converted to chlorophyll content (mg chlorophyll m–2 leaf) based on a preliminary calibration. The calibration consisted of measuring SPAD values in three spots of 30 different soybean leaves. From each spot, a leaf disc (3.67 cm2) was punched. Leaf disks were submerged in 25 ml of 80% acetone and the flasks were covered with aluminum foil and incubated in the dark at 10 °C for 72 h. The absorbances of the samples were read at 645 nm and 663 nm as recommended by Linder (1974). The chlorophyll content was calculated on a leaf area basis, with the equation provided by Arnon (1949), using the coefficients derived by McKinney (1941). 4.2.10. Maximum values of protein and photosynthesis rates
The rates of photosynthesis and the protein content were analysed by fitting quadratic regressions as variables dependent on time (days after emergence) with SPSS 15.0.1 for windows (SPSS Inc., 1989-2006). The quadratic functions were differentiated to determine the maximum values (days). The maximum values of photosynthesis and protein content were obtained after filling the original quadratic functions with the maximum values of the derivative functions. 4.2.11. Statistical analyses
The experimental design was a split plot with soybean cultivar as the main factor and N-source (i.e. two rhizobia strains versus two rates of N fertilization) as the split-plot factor (n = 4). The data set was tested for homogeneity with Levene’s test of equality of error variances and Q-Q plots to test for normality of the data. Data on nitrogen, protein and ureide-N contents were log-transformed to achieve near-normal distributions. Shoot biomass, nodules, photosynthesis, nitrogen, protein, ureides-N, PNUE, sugars and starch were treated as independent measurements. The N-fertilized plants which eventually produced nodules were discarded from the analyses. The data set was analysed considering an unbalanced treatment structure by GenStat 11th

Chapter 4
62
Tab
le 4
.1. N
odul
e an
d sh
oot
biom
ass
, N
-ur
eide
and
pro
tein
in le
ave
s o
f tw
o s
oyb
ean
cul
tiva
rs in
ocu
late
d w
ith t
wo
rhiz
obia
str
ains
or
rece
ivin
g tw
o ra
tes
of N
-fe
rtili
zer
(Exp
erim
ent
1).
N
odul
e (g
DW
pla
nt–1
)
Sho
ot
(g D
W p
lant
–1)
Le
af N
-ure
ide
(µm
ol N
-ure
ide
g–1 D
W)
Le
af p
rote
in†
(mg
g–1 D
W)
Cul
tivar
and
N s
ourc
e V
4 R
2 R
4 R
5
V4
R2
R4
V4
R2
R4
R5
V4
R2
R4
R5
BR
S 1
54
B. ja
poni
cum
CP
AC
7
0.5
0.6
0.8
0.9
1.
4 2.
5 6.
269
.4
85.8
181.
7 11
8.8
47.5
50.8
56.8
3
7.1
B. ja
poni
cum
CP
AC
39
0 0.6
0.7
0.7
0.8
1.
3 2.
3 6.
467
.9
145
.313
5.9
160.
7 59
.165
.553
.4
35.
2K
NO
3 (
350
mg
N)
00
0 0
1.7
2.6
10.9
114.
3 73
.425
.0
14.5
65
.061
.140
.2
38.
7K
NO
3 (1
75 m
g N
) 0
0 0
0
1.3
2.9
8.2
150.
5 53
.422
.2
11.5
76
.783
.650
.1
49.
1B
RS
262
B. ja
poni
cum
CP
AC
7
0.8
0.8
0.8
0.8
1.
5 3.
1 7.
595
.6
72.2
106.
9 11
.8
47.0
60.8
63.2
2
3.1
B. ja
poni
cum
CP
AC
39
0 0.
70.
7 1.
2 1.
2
1.5
2.9
8.8
77.7
1
43.9
171.
9 19
.2
46.1
60.0
72.0
1
6.9
KN
O3 (3
50 m
g N
) 0
0 0
0
1.9
4.3
14.0
150.
5 52
.522
.8
3.3
32.3
60.6
27.8
2
2.4
KN
O3 (1
75 m
g N
) 0
0 0
0
1.8
5.4
9.8
54.9
29
.123
.7
5.9
42.6
33.8
34.8
3
3.3
N s
ourc
e
B. ja
poni
cum
0.
70.
7 0.
9 0.
9
*1.4
*2
.7
*7.2
*77.
6 *1
11.8
*149
.1
*15
2.2
50.0
59.3
*61.
4 2
8.1
KN
O3
00
0 0
1.
7 3.
8 10
.111
7.6
52.1
23.4
24
.0
54.1
59.8
39.7
3
6.2
Cul
tivar
BR
S 1
54
0.5
0.6
0.8
0.9
*1
.4
*2.6
7.
710
0.5
89.
4 95
.6 12
9.7
*62.
165
.350
.8
*40.
0B
RS
262
0.
80.
7 1.
0 1.
0
1.7
3.9
9.4
94.7
74
.489
.7
49.8
42
.053
.852
.6
26.
6R
hizo
bial
str
ain
C
PA
C 7
0.
70.
7 0.
8 0.
8
1.5
2.8
6.9
82.5
*7
9.0
144.
4 14
6.6
47.2
55.8
60.0
3
0.1
CP
AC
390
0.
60.
7 1.
0 1.
0
1.4
2.6
7.6
72.8
1
44.6
153.
9 15
7.9
52.6
62.8
62.7
2
6.1
KN
O3
35
0 m
g N
0
0 0
0
1.8
3.4
12.4
132.
4 *6
3.0
24.1
24
.0
48.6
60.9
60.0
3
0.6
175
mg
N
00
0 0
1.
6 4.
2 9.
010
4.3
41.2
22.9
24
.1
59.7
58.7
62.7
4
3.9
P-v
alue
N s
our
ce
0.
006
<0.
001
<0.
001
ns
<0
.001
<0.
001
<0
.001
ns
ns0
.010
ns
Cul
tiva
r
0.00
2 <
0.00
1 0.
005
ns
nsns
0.
008
0.01
6ns
ns
0.00
3N
so
urce
× C
ultiv
ar
ns
ns
n
s0.
016
nsns
0.
008
ns0
.053
ns
ns*
ind
icat
es
tha
t diff
ere
nce
s b
etw
een
the
two
gro
ups
with
N s
our
ce,
culti
var,
rhi
zob
ial s
trai
n a
nd r
ate
s o
f KN
O3
are
sig
nifi
cant
at P
<0
.05
by
the
F-t
est
. † L
eaf p
rote
in c
on
cent
ratio
n in
this
stu
dy
is lo
wer
th
an
tha
t re
po
rted
in o
the
r st
udie
s (e
.g.
Ca
mp
be
ll e
t al.,
19
88
; d
e V
eau
et a
l., 1
99
2).
Our
und
ere
stim
ated
va
lue
s are
attr
ibut
ed
to a
pa
rtia
l bin
din
g o
f so
diu
m d
od
ecy
l sul
pha
te t
o
rub
isco
(C
att a
nd M
illar
d,
19
88
), h
ow
ever
, th
ey
do
no
t alte
r o
ur c
onc
lusi
ons
.
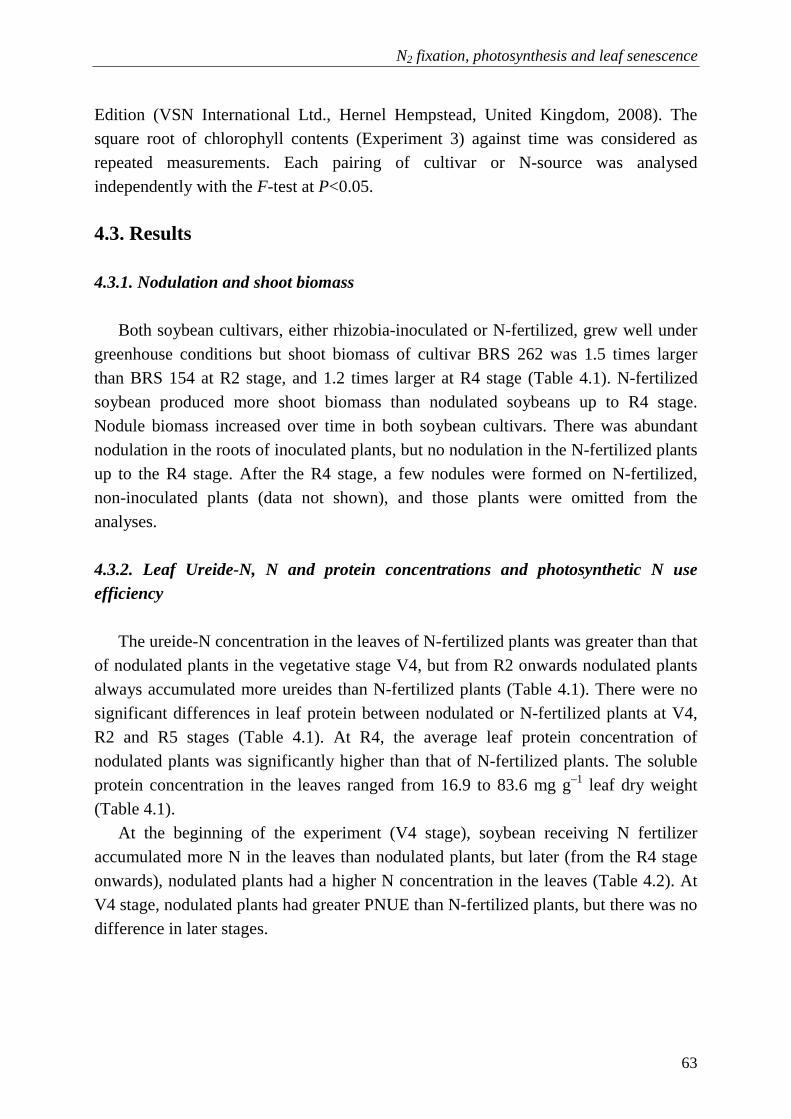
N2 fixation, photosynthesis and leaf senescence
63
Edition (VSN International Ltd., Hernel Hempstead, United Kingdom, 2008). The square root of chlorophyll contents (Experiment 3) against time was considered as repeated measurements. Each pairing of cultivar or N-source was analysed independently with the F-test at P<0.05. 4.3. Results 4.3.1. Nodulation and shoot biomass
Both soybean cultivars, either rhizobia-inoculated or N-fertilized, grew well under greenhouse conditions but shoot biomass of cultivar BRS 262 was 1.5 times larger than BRS 154 at R2 stage, and 1.2 times larger at R4 stage (Table 4.1). N-fertilized soybean produced more shoot biomass than nodulated soybeans up to R4 stage. Nodule biomass increased over time in both soybean cultivars. There was abundant nodulation in the roots of inoculated plants, but no nodulation in the N-fertilized plants up to the R4 stage. After the R4 stage, a few nodules were formed on N-fertilized, non-inoculated plants (data not shown), and those plants were omitted from the analyses. 4.3.2. Leaf Ureide-N, N and protein concentrations and photosynthetic N use efficiency
The ureide-N concentration in the leaves of N-fertilized plants was greater than that of nodulated plants in the vegetative stage V4, but from R2 onwards nodulated plants always accumulated more ureides than N-fertilized plants (Table 4.1). There were no significant differences in leaf protein between nodulated or N-fertilized plants at V4, R2 and R5 stages (Table 4.1). At R4, the average leaf protein concentration of nodulated plants was significantly higher than that of N-fertilized plants. The soluble protein concentration in the leaves ranged from 16.9 to 83.6 mg g–1 leaf dry weight (Table 4.1).
At the beginning of the experiment (V4 stage), soybean receiving N fertilizer accumulated more N in the leaves than nodulated plants, but later (from the R4 stage onwards), nodulated plants had a higher N concentration in the leaves (Table 4.2). At V4 stage, nodulated plants had greater PNUE than N-fertilized plants, but there was no difference in later stages.
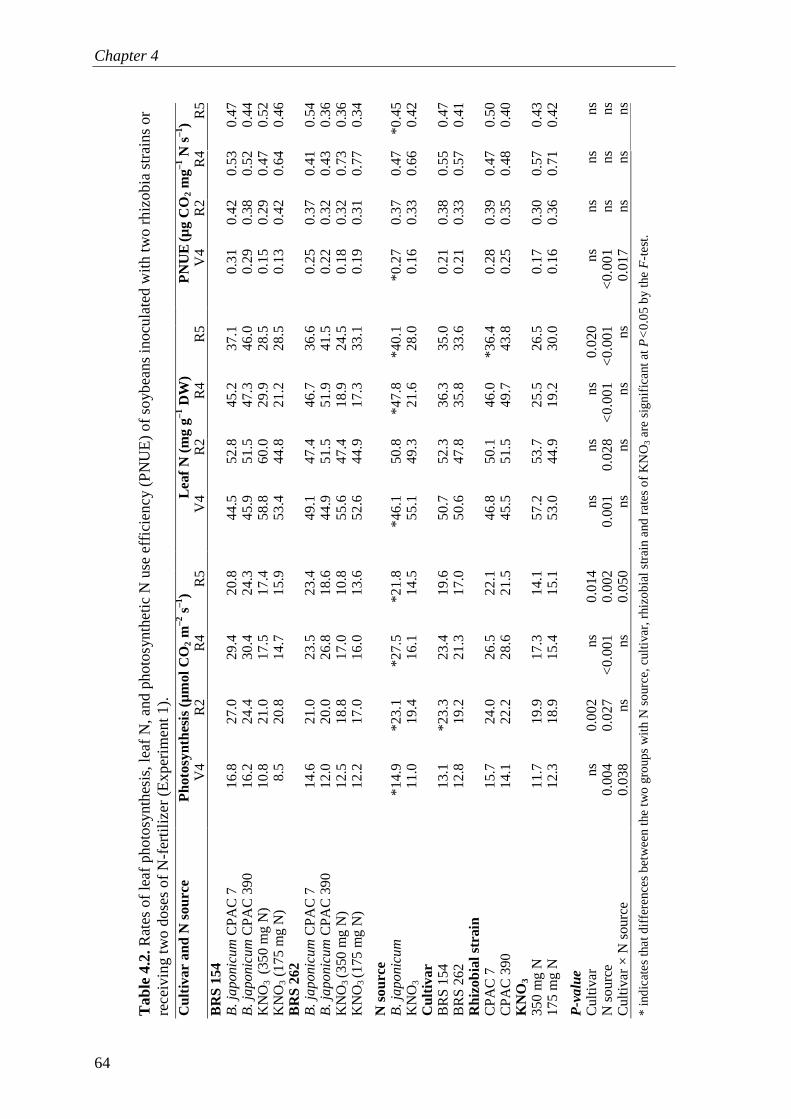
Chapter 4
64
Tab
le 4
.2. R
ates
of l
eaf
phot
osyn
thes
is, l
eaf
N, a
nd p
hoto
syn
the
tic N
use
effi
cie
ncy
(P
NU
E)
of s
oyb
ea
ns in
ocul
ate
d w
ith t
wo
rh
izob
ia s
trai
ns o
r re
ceiv
ing
two
dos
es
of N
-fer
tiliz
er
(Exp
erim
ent
1).
C
ultiv
ar a
nd N
sou
rce
Pho
tosy
nthe
sis
(µm
ol C
O 2 m
–2 s
–1)
Le
af N
(m
g g–1
DW
)
PN
UE (µ
g C
O2
mg–1
N s
–1)
V
4R
2R
4 R
5
V4
R2
R4
R5
V4
R2
R4
R5
BR
S 1
54
B. ja
poni
cum
CP
AC
7
16.8
27.0
29.4
2
0.8
4
4.5
52.8
45.2
37.1
0.
31
0.42
0.
53
0.4
7B
. ja
poni
cum
CP
AC
39
0 16
.224
.430
.4
24.
3
45.
951
.547
.346
.0
0.29
0.
38
0.52
0
.44
KN
O3 (
350
mg
N)
10.8
21.0
17.5
1
7.4
5
8.8
60.0
29.9
28.5
0.
15
0.29
0.
47
0.5
2K
NO
3 (1
75 m
g N
) 8.
520
.814
.7
15.
9
53.
444
.821
.228
.5
0.13
0.
42
0.64
0
.46
BR
S 2
62
B
. ja
poni
cum
CP
AC
7
14.6
21.0
23.5
2
3.4
4
9.1
47.4
46.7
36.6
0.
25
0.37
0.
41
0.5
4B
. ja
poni
cum
CP
AC
39
0 12
.020
.026
.8
18.
6
44.
951
.551
.941
.5
0.22
0.
32
0.43
0
.36
KN
O3 (3
50 m
g N
) 12
.518
.817
.0
10.
8
55.
647
.418
.924
.5
0.18
0.
32
0.73
0
.36
KN
O3 (1
75 m
g N
) 12
.217
.016
.0
13.
6
52.
644
.917
.333
.1
0.19
0.
31
0.77
0
.34
N s
ourc
e
B. ja
poni
cum
*1
4.9
*23.
1*2
7.5
*21.
8
*46.
150
.8*4
7.8
*40.
1 *0
.27
0.37
0.
47
*0.4
5K
NO
3 11
.019
.416
.1
14.
5
55.
149
.321
.628
.0
0.16
0.
33
0.66
0
.42
Cul
tivar
BR
S 1
54
13.1
*23.
323
.4
19.
6
50.
752
.336
.335
.0
0.21
0.
38
0.55
0
.47
BR
S 2
62
12.8
19.2
21.3
1
7.0
5
0.6
47.8
35.8
33.6
0.
21
0.33
0.
57
0.4
1R
hizo
bial
str
ain
C
PA
C 7
15
.724
.026
.5
22.
1
46.
850
.146
.0*3
6.4
0.28
0.
39
0.47
0
.50
CP
AC
390
14
.122
.228
.6
21.
5
45.
551
.549
.743
.8
0.25
0.
35
0.48
0
.40
KN
O3
35
0 m
g N
11
.719
.917
.3
14.
1
57.
253
.725
.526
.5
0.17
0.
30
0.57
0
.43
175
mg
N
12.3
18.9
15.4
1
5.1
5
3.0
44.9
19.2
30.0
0.
16
0.36
0.
71
0.4
2
P
-val
ue
C
ultiv
ar
ns0.
002
ns
0.01
4
nsns
ns
0.02
0 n
s ns
ns
ns
N s
our
ce
0.0
040.
027
<0.
001
0.00
2
0.00
10.
028
<0.
001
<0.
001
<0.
001
ns
ns
nsC
ultiv
ar
× N
sou
rce
0.0
38ns
ns
0.05
0
nsns
ns
ns
0.01
7 ns
ns
ns
* in
dic
ate
s th
at d
iffer
enc
es
bet
wee
n th
e tw
o g
roup
s w
ith N
so
urce
, cu
ltiva
r, r
hizo
bia
l str
ain
and
ra
tes
of K
NO
3 a
re s
ign
ifica
nt a
t P<
0.0
5 b
y th
e F-t
est
.

N2 fixation, photosynthesis and leaf senescence
65
4.3.3. Rates of photosynthesis
Nodulated plants had higher rates of photosynthesis than N-fertilized plants (Table 4.2). At the V4 stage, rates of photosynthesis were in the range of 12.0 to 16.8 µmol CO2 m
–2 s–1 in nodulated and 8.5 to 12.5 µmol CO2 m–2 s–1 in N-fertilized plants. At
reproductive stages, the rates of photosynthesis in both nodulated and N-fertilized plants increased. The highest rates of photosynthesis in N-fertilized plants were observed at stage R2 (17 to 21 µmol CO2 m–2 s–1), whereas the largest rates of photosynthesis in the nodulated plants were observed at stage R4 (23.5 to 30.4 µmol CO2 m
–2 s–1) (Table 4.2). Although the difference was only significant at R2 stage, on average plants of lower shoots (BRS 154) had higher rates of leaf photosynthesis (not canopy!) than those of higher shoots (BRS 262). Rates of photosynthesis were not correlated with leaf N concentration (data not shown). 4.3.4. Maximum values of leaf protein and rates of photosynthesis
We analysed the relationship between leaf protein and rates of photosynthesis using quadratic functions over the duration of our experiment. The adjusted R2 was consistently higher in nodulated than in N-fertilized plants (Table 4.3). The estimated maximum rates of photosynthesis were larger in nodulated plants than in N-fertilized plants, and these maximum rates occurred two days later. The estimated maximum protein concentration were also greater in nodulated plants (65.9 mg g–1 DW) compared with N-fertilized plants (49.2 mg g–1 DW). The regressions predicted that the maximum protein contents in the nodulated plants would be achieved six days later than in the N-fertilized plants, but R2 of N-fertilized plants was too low. A more realistic comparison considering nodulated plants at the one hand and fertilized plants with 350 mg of N on the other hand, gives a delay of just three days. 4.3.5. Starch and soluble sugars in the leaves
In Experiment 2, starch concentration in the leaves at R2 stage ranged from 6.0 to 9.9 mg g–1 fresh weight in nodulated plants and from 10.7 to 15.9 in N-fertilized plants (Table 4.4). There were no differences between the soybean cultivars but there was a large difference between nodulated and N-fertilized soybeans (Table 4.4). The average soluble sugars content in the leaves was 8.8 mg g–1 fresh weight in both nodulated and N-fertilized plants, but the ratio starch : soluble sugars was significantly higher in N-fertilized than in nodulated plants.
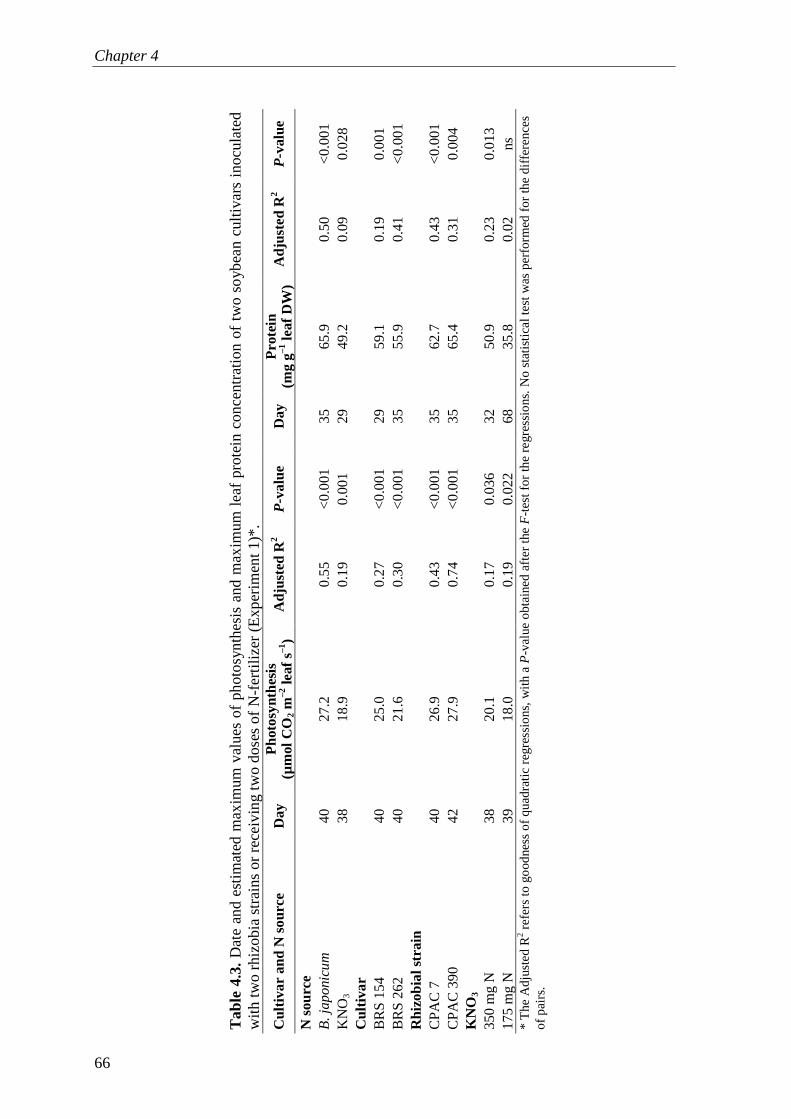
Chapter 4
66
Tab
le 4
.3. D
ate
and
est
imat
ed m
axim
um v
alue
s of
ph
oto
syn
the
sis
and
max
imum
leaf
pro
tein con
cent
ratio
n o
f tw
o so
ybea
n cu
ltiva
rs in
ocul
ate
d w
ith tw
o r
hizo
bia
stra
ins
or r
ece
ivin
g tw
o do
ses
of N
-fe
rtili
zer
(Exp
erim
ent 1
)*.
Cul
tivar
and
N s
ourc
e D
ay
Pho
tosy
nthe
sis
(µm
ol C
O2
m–2
leaf
s–1)
Adj
uste
d R
2 P
-val
ue
D
ay
Pro
tein
(m
g g–1
leaf
DW
) A
djus
ted
R2
P-v
alue
N s
ourc
e
B. ja
poni
cum
4
0 27
.2
0.5
5 <
0.0
01
35
65
.9
0.50
<
0.00
1 K
NO
3 3
8 18
.9
0.1
9 0.
001
29
49.2
0.
09
0.0
28
Cul
tivar
BR
S 1
54
40
25.0
0
.27
<0
.001
29
59
.1
0.19
0
.001
B
RS
26
2 4
0 21
.6
0.3
0 <
0.0
01
35
55.9
0.
41
<0.
001
Rhi
zobi
al s
trai
n
CP
AC
7
40
26.9
0
.43
<0
.001
35
62
.7
0.43
<
0.00
1 C
PA
C 3
90
42
27.9
0
.74
<0
.001
35
65
.4
0.31
0
.004
K
NO
3
350
mg
N
38
20.1
0
.17
0.03
6
32
50
.9
0.23
0
.013
17
5 m
g N
3
9 18
.0
0.1
9 0.
022
68
35.8
0.
02
ns
* T
he
Ad
just
ed
R2 re
fers
to g
oo
dne
ss o
f qu
adra
tic r
egre
ssio
ns,
with
a
P-v
alue
ob
tain
ed
aft
er
the
F
-tes
t fo
r th
e re
gres
sio
ns.
No
sta
tistic
al t
est
was
p
erf
orm
ed fo
r th
e d
iffer
en
ces
of p
airs
.

N2 fixation, photosynthesis and leaf senescence
67
Figure 4.1. Chlorophyll degradation in leaves of rhizobia-inoculated and N-fertilized soybeans (experiment 3). The measurements started on 26th March 2008 (Day 1) at stage R2. On day 32, all plants were at R5 stage, but the leaves of two plants of the cultivar BRS 154 fertilized with 350 mg of N had senesced already. On day 39, all plants were at stage R6/R7, except for those of BRS 154 + 350 mg of N and two plants of BRS 262 fertilized with 175 mg of N, which had lost some leaves already.
4.3.6. Chlorophyll content
The statistical analysis based on repeated measurements revealed that there was no
effect of cultivar on chlorophyll concentration, but there was a strong effect of the N source. The effects of cultivar were significant at P=0.055, the effects of the N source were significant at P<0.001, and the interaction of cultivar × N source was significant at P=0.017. At R2 stage (day 1), average chlorophyll concentration was 140 mg m–2 in the nodulated plants, and 155 mg m–2 in the N-fertilized plants (Experiment 3; Fig. 4.1). At the 16th day (R4/R5 stage), chlorophyll concentration averaged 226 mg m–2 in nodulated, and 172 mg m–2 in N-fertilized soybean. From stage R4/R5 onwards, soybean started to degrade chlorophyll and showed symptoms of leaf senescence
0
50
100
150
200
250
300
0 5 10 15 20 25 30 35 40
Days after R2 stage
Ch
loro
ph
yll c
on
cen
tratio
n (m
g m
–2 )
BRS 154 + CPAC 7 BRS 154 + CPAC 390 BRS 154 + 350 mg N BRS 154 + 175 mg N
BRS 262 + CPAC 7 BRS 262 + CPAC 390 BRS 262 + 350 mg N BRS 262 + 175 mg N
N-fertilizedy=195.39 – 3.02x
Rhizobia-nodulatedy=184.64 – 0.42x
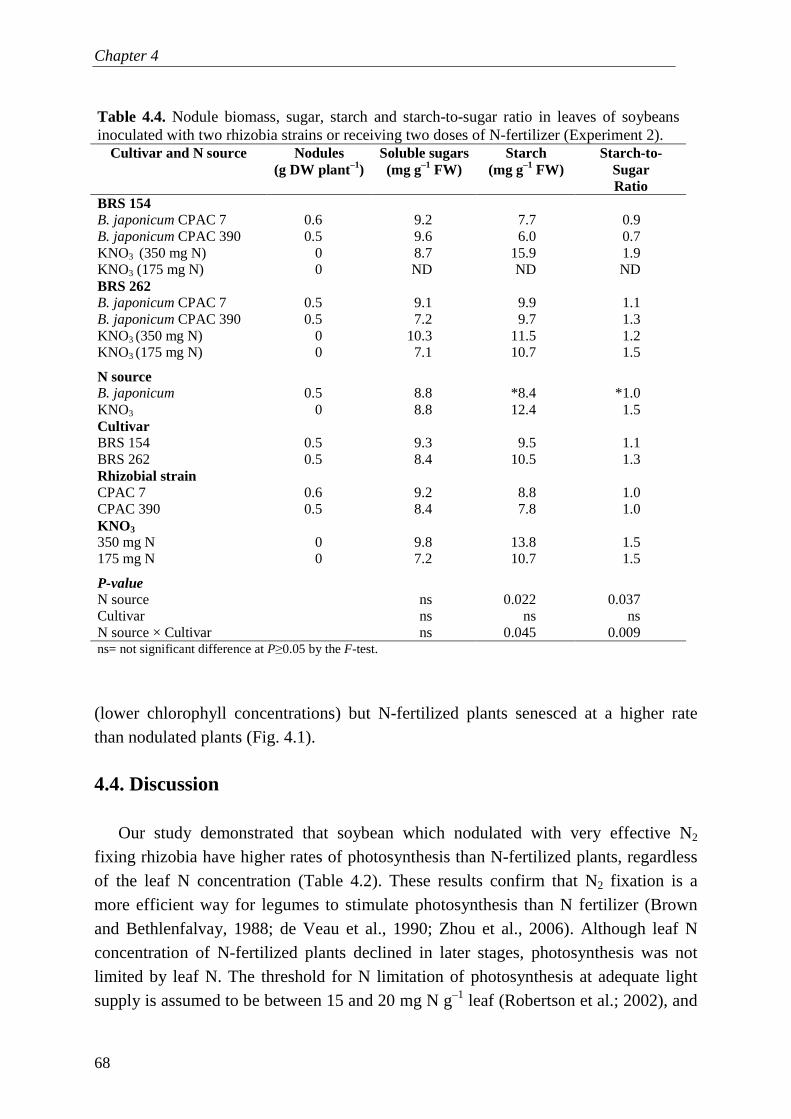
Chapter 4
68
(lower chlorophyll concentrations) but N-fertilized plants senesced at a higher rate than nodulated plants (Fig. 4.1). 4.4. Discussion
Our study demonstrated that soybean which nodulated with very effective N2
fixing rhizobia have higher rates of photosynthesis than N-fertilized plants, regardless of the leaf N concentration (Table 4.2). These results confirm that N2 fixation is a more efficient way for legumes to stimulate photosynthesis than N fertilizer (Brown and Bethlenfalvay, 1988; de Veau et al., 1990; Zhou et al., 2006). Although leaf N concentration of N-fertilized plants declined in later stages, photosynthesis was not limited by leaf N. The threshold for N limitation of photosynthesis at adequate light supply is assumed to be between 15 and 20 mg N g–1 leaf (Robertson et al.; 2002), and
Table 4.4. Nodule biomass, sugar, starch and starch-to-sugar ratio in leaves of soybeans inoculated with two rhizobia strains or receiving two doses of N-fertilizer (Experiment 2).
Cultivar and N source Nodules (g DW plant–1)
Soluble sugars (mg g–1 FW)
Starch (mg g–1 FW)
Starch-to-Sugar Ratio
BRS 154 B. japonicum CPAC 7 0.6 9.2 7.7 0.9 B. japonicum CPAC 390 0.5 9.6 6.0 0.7 KNO3 (350 mg N) 0 8.7 15.9 1.9 KNO3 (175 mg N) 0 ND ND ND BRS 262 B. japonicum CPAC 7 0.5 9.1 9.9 1.1 B. japonicum CPAC 390 0.5 7.2 9.7 1.3 KNO3 (350 mg N) 0 10.3 11.5 1.2 KNO3 (175 mg N) 0 7.1 10.7 1.5
N source B. japonicum 0.5 8.8 *8.4 *1.0 KNO3 0 8.8 12.4 1.5 Cultivar BRS 154 0.5 9.3 9.5 1.1 BRS 262 0.5 8.4 10.5 1.3 Rhizobial strain CPAC 7 0.6 9.2 8.8 1.0 CPAC 390 0.5 8.4 7.8 1.0 KNO 3 350 mg N 0 9.8 13.8 1.5 175 mg N 0 7.2 10.7 1.5
P-value N source ns 0.022 0.037 Cultivar ns ns ns N source × Cultivar ns 0.045 0.009 ns= not significant difference at P≥0.05 by the F-test.
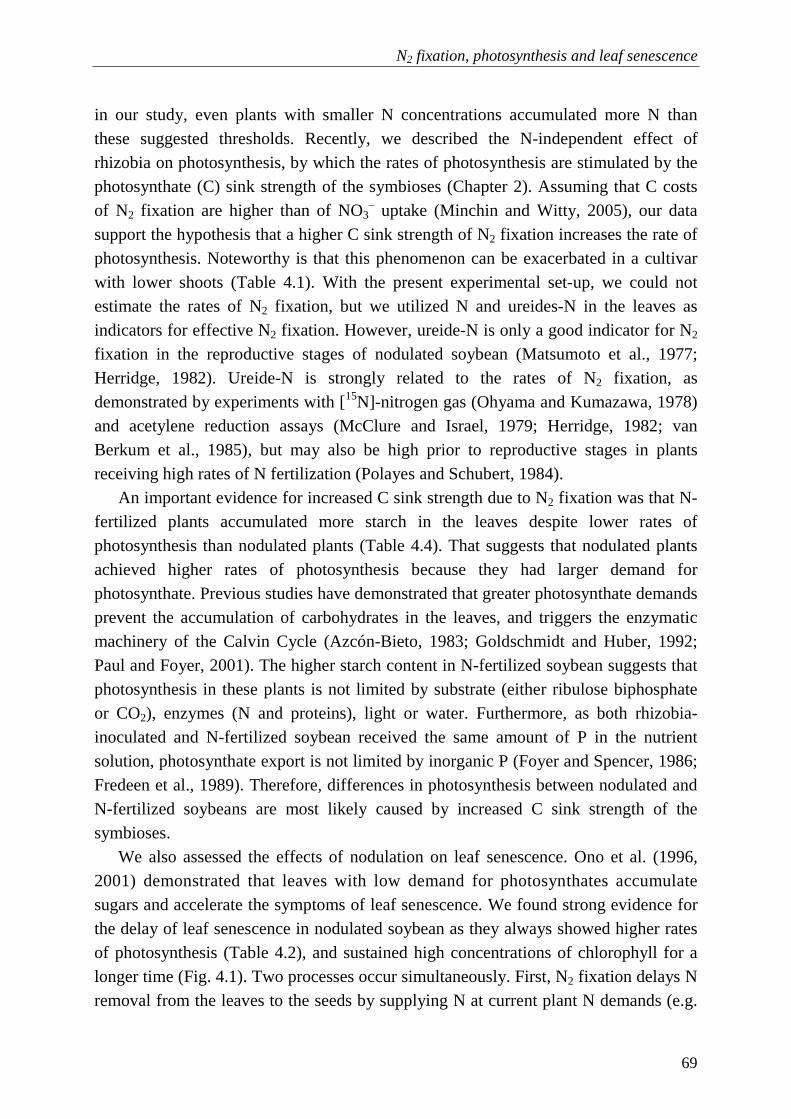
N2 fixation, photosynthesis and leaf senescence
69
in our study, even plants with smaller N concentrations accumulated more N than these suggested thresholds. Recently, we described the N-independent effect of rhizobia on photosynthesis, by which the rates of photosynthesis are stimulated by the photosynthate (C) sink strength of the symbioses (Chapter 2). Assuming that C costs of N2 fixation are higher than of NO3
– uptake (Minchin and Witty, 2005), our data support the hypothesis that a higher C sink strength of N2 fixation increases the rate of photosynthesis. Noteworthy is that this phenomenon can be exacerbated in a cultivar with lower shoots (Table 4.1). With the present experimental set-up, we could not estimate the rates of N2 fixation, but we utilized N and ureides-N in the leaves as indicators for effective N2 fixation. However, ureide-N is only a good indicator for N2 fixation in the reproductive stages of nodulated soybean (Matsumoto et al., 1977; Herridge, 1982). Ureide-N is strongly related to the rates of N2 fixation, as demonstrated by experiments with [15N]-nitrogen gas (Ohyama and Kumazawa, 1978) and acetylene reduction assays (McClure and Israel, 1979; Herridge, 1982; van Berkum et al., 1985), but may also be high prior to reproductive stages in plants receiving high rates of N fertilization (Polayes and Schubert, 1984).
An important evidence for increased C sink strength due to N2 fixation was that N-fertilized plants accumulated more starch in the leaves despite lower rates of photosynthesis than nodulated plants (Table 4.4). That suggests that nodulated plants achieved higher rates of photosynthesis because they had larger demand for photosynthate. Previous studies have demonstrated that greater photosynthate demands prevent the accumulation of carbohydrates in the leaves, and triggers the enzymatic machinery of the Calvin Cycle (Azcón-Bieto, 1983; Goldschmidt and Huber, 1992; Paul and Foyer, 2001). The higher starch content in N-fertilized soybean suggests that photosynthesis in these plants is not limited by substrate (either ribulose biphosphate or CO2), enzymes (N and proteins), light or water. Furthermore, as both rhizobia-inoculated and N-fertilized soybean received the same amount of P in the nutrient solution, photosynthate export is not limited by inorganic P (Foyer and Spencer, 1986; Fredeen et al., 1989). Therefore, differences in photosynthesis between nodulated and N-fertilized soybeans are most likely caused by increased C sink strength of the symbioses.
We also assessed the effects of nodulation on leaf senescence. Ono et al. (1996, 2001) demonstrated that leaves with low demand for photosynthates accumulate sugars and accelerate the symptoms of leaf senescence. We found strong evidence for the delay of leaf senescence in nodulated soybean as they always showed higher rates of photosynthesis (Table 4.2), and sustained high concentrations of chlorophyll for a longer time (Fig. 4.1). Two processes occur simultaneously. First, N2 fixation delays N removal from the leaves to the seeds by supplying N at current plant N demands (e.g.

Chapter 4
70
Figure 4.2. Conceptual diagram of delayed leaf senescence in soybeans with efficient nodulation. The C sink strength of N2 fixation changes the sink : source ratio of soybeans, and lowers the accumulation of carbohydrates in the leaves. High accumulation of carbohydrates lowers the rates of photosynthesis and triggers the process of leaf senescence. Low accumulation of carbohydrates stimulates the rates of photosynthesis, which in turn allows maintaining high rates of N2 fixation. Arrows indicate the feedbacks between processes.
Minchin et al., 1980); and second, C sink strength stimulates leaf activity and increased photosynthesis (Table 4.3). The two processes together are consistent with the hypothesis of Paul and Peliny (2003), who suggested that higher rates of photosynthesis prior to the early phase of senescence lead to a longer photosynthetically-active life.
We confirmed our second hypothesis by showing a 2-to-3-days-delay in the peak of photosynthesis and leaf protein in nodulated plants in comparison to N-fertilized plants receiving 350 mg of N (Table 4.3). Also Abu-Shakra et al. (1978) observed that nodulated soybeans with higher nitrogenase activity had prolonged periods of photosynthetic activity. They suggested that a longer photosynthetic activity is related to a higher N availability in the leaves as a consequence of high N2 fixation. In fact, the view that N alone regulates leaf senescence is too simplistic. Wittenbach (1982, 1983) and Crafts-Brandner and Egli (1987) removed the pods of poorly nodulated soybeans receiving high amounts of N-fertilizer, which delayed the N reallocation, but did not prevent the decrease in the rates of photosynthesis. That means that under such
Carbohydrates Leaf senescence
C : N ratio
Photosynthesis
N2 fixation
C sink strength
+-
+
-
+
Photosynthesis
+
N2 fixation, photosynthesis and leaf senescence
71
conditions, leaf photosynthesis was not limited by N, rather it was limited by C sink strength of the pods (Wittenbach 1982, 1983; Crafts-Brandner and Egli, 1987).
In Fig. 4.2, we summarize the feedbacks from N2 fixation to photosynthesis and leaf senescence, based on our results and previous studies. It indicates that the C sink strength of N2 fixation prevents accumulation of sugars in the leaves, and, probably by triggering the Calvin Cycle, stimulates the rates of photosynthesis. Increased rates of photosynthesis and higher N demand during the reproductive stage stimulates the rates of N2 fixation. In turn, N2 fixation compensates for the degradation of proteins and chlorophyll while lowering the carbohydrate concentration in the leaves, which finally, delays leaf senescence.
In conclusion, we demonstrate that C costs of N2 fixation are compensated by increased leaf photosynthesis. We also show that allowing soybeans to fully rely on N2 fixation does not compromise yield. Furthermore, due to higher leaf activity and continued N supply, N2 fixation potentially delays leaf senescence, which increases the period of pod filling.

Chapter 4
72

Chapter 5
General Discussion†
† Part of this Chapter is under review as: Kaschuk, G., Leffelaar, P.A., Giller, K.E., Alberton, O., Hungria, M., Kuyper, T.W., 2009. Responses of grain legumes to rhizobia and arbuscular mycorrhizal fungi: a meta-analysis of potential photosynthate limitation of symbioses.

Chapter 5
74
General Discussion
75
Sink stimulation of leaf photosynthesis by the C costs of rhizobial and arbuscular mycorrhizal fungal symbioses 5.1. Introduction
Both rhizobial and arbuscular mycorrhizal (AM) symbioses change the partitioning of plant photosynthate (C) due to their intense metabolism to support nutrient acquisition for the plants, and maintenance of their own growth and reserves (Minchin and Witty, 2005; Smith and Read, 2008). In this thesis I demonstrate that changes in partitioning are accompanied by increases in the rates of photosynthesis in many plant species independent of nutrient effects (Chapter 2). ‘Sink stimulation of photosynthesis by the C costs of symbioses’ had been mentioned many times, without being properly defined, as a likely explanation for the photosynthetic differences between symbiotic and fertilized plants (e.g. Pang and Paul, 1980; Harris et al., 1985; Wright et al., 1998a, 1998b; Mortimer et al., 2008). This thesis is apparently the first attempt to define this phenomenon properly.
Chapter 2 demonstrates that, while rhizobial and AM symbioses generally improve the leaf N and P mass fractions, increases of photosynthesis occur over and above this nutrient effect due to C sink stimulation. My thesis shows that the rhizobial symbiosis changes the C partitioning of soybean [Glycine max (L.) Merrill] resulting in higher triose-P export and less accumulation of starch in the leaves (Huber and Israel, 1982; Chapter 3). As a consequence of increased C sink strength by rhizobial and AM symbioses, the rates of photosynthesis of symbiotic plants are increased. Sink stimulation of photosynthesis occurs because higher rates of triose-P export and recycling of inorganic P into the chloroplasts activates the enzymes of CO2 assimilation (Paul and Foyer, 2001; Chapter 2). If the C sink strength is low, triose-P is not rapidly exported, but converted into starch and stored temporarily in the chloroplasts. Increased starch accumulation in the chloroplasts has a negative effect on the activation of photosynthetic enzymes and hampers CO2 assimilation (Azcón-Bieto, 1983; Goldschmidt and Huber, 1992).
Some authors have been sceptical about sink stimulation of photosynthesis by AM symbioses (e.g. Black et al., 2000; Grimoldi et al., 2005) because they argue that sink stimulation usually is observed in legumes associated with effective nodulation [e.g. soybean, Harris et al., 1985; clover (Trifolium repens L.), Wright et al., 1998a, 1998b] and stimulation of photosynthesis could have been an artefact of improved shoot N nutrition. However, I disagree with that view, first, because the effects of improved N nutrition were not apparent in those studies involving legumes as both mycorrhizal and non-mycorrhizal plants were nodulated (Chapter 2), and, second, because sink
Chapter 5
76
stimulation occurs over and above a nutrient effect, through a rapid sugar export from the chloroplast and orthophosphate recycling (Chapter 3).
In this thesis I also show that starch accumulation in the leaves leads to an acceleration of leaf senescence (Ono et al., 2001; Chapter 4). In soybean, rhizobial symbiosis simultaneously changes the C partitioning and prolongs the period of N accumulation in the shoots, which delays degradation of photosynthetic enzymes and postpones leaf senescence (Abu-Shakra et al., 1978; Chapter 4). Also in cowpea [Vigna unguiculata (L.) Walp.], N2 fixation reduces the proportion of senesced leaves in the end of the growing period (Minchin et al., 1980). Although effects of AM symbiosis on leaf senescence await confirmation, I think that both rhizobial and AM symbioses should favour a longer period of leaf activity since both affect photosynthetic rates through C feedbacks.
In this chapter, I contextualize the findings of my thesis within our current understanding of the physiological regulation of rhizobial and AM symbioses. I also consider the effects of sink stimulation of photosynthesis and symbioses on plants under elevated atmospheric CO2 and under field conditions.
5.2. Regulation of rhizobial symbioses
Relevant literature ascribes the regulation of N2 fixation in legumes to three main
mechanisms: C limitation, oxygen limitation, and nitrogen-feedback regulation (e.g. Mahon, 1983; Vance and Heichel, 1991; Schulze, 2004). The regulation by C limitation is based on studies which showed that nitrogenase activity is instantaneously suppressed when shoots are darkened or excised (Lawn and Brun, 1974; Bethlenfalvay and Phillips, 1978), or photosynthesis is inhibited by bentazon spray (Bethlenfalvay et al., 1979), whereas it is rapidly increased when shoots are exposed to elevated light intensities (Lawn and Brun, 1974; Bethlenfalvay and Phillips, 1978) and CO2 concentrations (Hardy and Havelka, 1975). The regulation by oxygen limitation is based on the fact that nitrogenase activity is highly dependent on the oxidative phosphorylation of photosynthates to produce ATP, and nodules have a layer of cortical cells, which decreases O2 diffusion following a physiological stress (Layzell and Hunt, 1990; King and Layzell, 1991). The nitrogen-feedback regulation assumes that N2 fixation is stimulated proportionally to plant N demand, and it is reduced when surplus organic N flows through the phloem sap into the nodule (Parsons et al., 1993; Neo and Layzell, 1997; Lodwig et al., 2003; King and Purcell, 2005). None of these arguments alone offers a complete explanation for the regulation of N2 fixation in root nodules, but all three could occur in a chain in the same symbiosis.
General Discussion
77
Vance and Heichel (1991) and Schulze (2004) argued that C limitation is not a crucial regulatory mechanism under non-stressful conditions for photosynthesis (i.e. sufficient light, CO2 and water) because photosynthetic capacity of legumes can cover the C costs of N2 fixation. Indeed, experiments reported in Chapters 3 and 4 of this thesis demonstrated that photosynthesis is increased proportionally to compensate the C costs of rhizobial symbioses. Actually, after reading the paper by Bethlenfalvay and Phillips (1978), I concluded that their results also fit within the hypothesis of sink stimulation of photosynthesis, since N2-fixing pea plants consistently sustained higher rates of photosynthesis than N-fertilized plants at all light intensities, despite lower N mass fraction in the shoots. Nevertheless, Vance and Heichel (1991) and Schulze (2004) emphasized that the argument of C limitation of N2 fixation was based on experiments performed during the reproductive stage, exactly when N2 fixation could be affected by the plant source-sink relations due to C competition between seeds and nodules. Vance and Heichel (1991) proposed that C is unloaded into the nodules according to their C sink strength. They defined C sink strength as the product of sink size times specific sink activity. Given that the construction costs of nodule biomass are small and the nodule activity costs, mainly N2 fixation, are much higher (Witty et al., 1983; Ryle et al., 1984; Voisin et al., 2003), the higher the rates the N2 fixation the higher the C sink strength.
Considering that N2 fixation increases gradually, peaks at early pod filling, and then falls abruptly (e.g. Lawn and Brun, 1974; Bethlenfalvay and Phillips, 1977; Senaratne and Ratnasinghe, 1993), one could argue that N2 fixation is indeed limited by C availability at specific stages of plant development (e.g. Vance and Heichel, 1991; Schulze, 2004). However, I challenge this argument because in Chapter 4 of my thesis, I show that photosynthesis is synchronized with N2 fixation over time (Bethlenfalvay and Phillips, 1977; Abu-Shakra et al., 1978) and in Chapter 3, the increases in photosynthesis are proportional to expected increases in C costs of N2 fixation.
Furthermore, the argument of C limitation through source-sink relations has not been confirmed by removing pods and defoliation in determinate and indeterminate soybean varieties (Fujita et al., 1988a; 1988b) because N2 fixation seems to be regulated by the N demand in the plant. In the experiments of Fujita et al. (1988a, 1988b), pod removal and defoliation did not change the proportion of C partitioned to nodules, probably because pod removal also decreased the plant N demand. After pod removal, there was a remarkable decrease in N2 fixation in a determinate soybean variety, whereas it was not significantly affected in an indeterminate variety. If N2 fixation were limited by C availability, then pod removal would overcome that limitation. Given that pod removal only had a positive effect on the rates of N2 fixation of indeterminate varieties, Fujita et al. (1988a, 1988b) concluded that N2 fixation is
Chapter 5
78
regulated by the plant N demand, and so, indeterminate varieties continue supporting N2 fixation because they demanded more N for an uninterrupted shoot growth. More recent studies confirm that the triggering agent for down-regulation of N2 fixation is indeed the return of nitrogenous compounds, particularly amino acids, flowing through the phloem into the nodules (Parsons et al., 1993; Neo and Layzell, 1997; Lodwig et al., 2003; King and Purcell, 2005).
Therefore, I suggest to combine the three arguments of regulation of N2 fixation: when the plant perceives that N2 fixation is not required any more, because nitrogenous compounds are returned via phloem to the nodule, the nodule oxygen barrier is adjusted to reduce nodule activity. Lower nodule activity decreases the C sink strength, which in turn, reduces the amount of C unloaded into the nodule. As already pointed out in Chapter 2, short-term stimulation of N2 fixation after stimulation of photosynthesis by increased CO2 concentration (e.g. Hardy and Havelka, 1975) and light (Bethlenfalvay and Phillips, 1977) can be an artefact of the dilution of nitrogenous compounds in relation to C accumulated in the plant sap (Parsons et al., 1993). However, in the long term, both photosynthesis and N2 fixation are likely to be limited by the ability of the plant to consume and/or store C and nitrogenous compounds.
The fact that both photosynthesis (Chapters 2, 3 and 4) and N2 fixation (this Chapter) can be stimulated according to plant C and N demand gives inspiration for two hypotheses. First, legumes can allow ‘cheating’ (contrary to Kiers and Denison, 2008) by ineffective rhizobial strains, as cheating would only be a constraint for the partnership if C availability was a limiting factor (Millard et al., 2007). Second, high-yielding legume varieties (e.g. soybean) can achieve their genetic potential productivity by relying solely on biological N2 fixation (e.g. Hungria et al., 2005; Salvagiotti et al., 2008).
The performance of a rhizobial symbiosis is measured by two attributes: infectiveness (capacity of nodulating in the presence of other strains) and effectiveness (capacity to fix N2). These two attributes are supposed to be traded-off according to compatibility between host and rhizobial strain and environmental conditions. A promiscuous legume species (e.g. common bean) may establish partnerships with several different rhizobial strains, and some may be not sufficiently effective (Michiels et al., 1998; Alberton et al., 2006, Kaschuk et al., 2006). A less promiscuous legume (e.g. Brazilian soybean varieties) establishes partnerships with fewer strains, which eventually are more effective (Alberton et al., 2006). Abundant nodulation and effective N2 fixation in common bean and soybean, respectively, indicate that legumes are capable of consistently supporting any rhizobial partnership, regardless of its effectiveness. In fact, since nodule biomass represents a very small proportion of the C
General Discussion
79
costs of rhizobial symbioses (e.g. Witty et al., 1983; Ryle et al., 1984, Voisin et al., 2003), fully ineffective nodules would not compromise plant growth provided that N is available in the soil or supplied as fertilizer.
Although legumes have lower photosynthetic nutrient efficiencies than cereal species such as wheat and maize due to differences in shoot N mass fractions (≥3% versus ≤2%, for legumes and grasses, respectively) (Vance and Heichel, 1991), their photosynthetic rates respond consistently more to improved availability of light and/or CO2 (e.g. Pammenter et al., 1993; Chapter 3). In terms of plant growth, it is unlikely that nodulation or N2 fixation is limited by photosynthetic capacity. In agronomic terms, legume yields will not be limited by the C costs (e.g. Skøt et al., 1986; Minchin and Witty, 2005) but it will be limited by lack of inoculation with highly effective N2 fixing strains. In Chapter 3, I showed that inoculation of rhizobial strains differing in effectiveness led to different responses of plant photosynthesis, and modelling of photosynthetic limitations confirmed that increased photosynthetic rates were proportional to increases in the C sink strength of each symbiosis.
There is no direct relationship between C costs of N2 fixation and plant growth. As a matter of fact, there have been some reports showing that increased C costs of N2 fixation resulted in greater plant dry weight (Skøt et al., 1986; Twary and Heichel, 1991; Vance and Heichel, 1991). Therefore, a lower C use efficiency of a rhizobial symbiosis, meaning less C used per N fixed (Phillips, 1980) is not relevant for plant growth when the effectiveness (more N fixed per time/or nodule biomass) of the same symbiosis is high (e.g. Skøt et al., 1986; Twary and Heichel, 1991; Vance and Heichel, 1991). However, I understand that this high effectiveness should be synchronized with plant N demand throughout plant development, particularly in the initial and final stages of development. Thus, regardless of the C costs, to maximize plant growth it is important that N2 fixation starts as early as possible during plant development, as occurred in the experiment of Skøt et al. (1986) with the more ‘expensive’ rhizobial associations, and lasts for a longer period as well (Abu-Shakra et al., 1978; Herridge and Rose, 2000; Chapter 4). I think that, due to sink stimulation of photosynthesis, early N2 fixation could improve photosynthetic N use efficiency (Brown and Bethelenfalvay, 1988) by activating a higher proportion of rubisco (E.C. 4.1.1.39) (Abu-Shakra et al., 1978; Bethlenfalvay and Phillips, 1978) and improving the photochemical efficiency (Maury et al., 1993; Chapter 3). If the plant management (e.g. by inoculation with effective strains, good plant establishment, proper soil environmental conditions, etc.) favours early nodulation and N2 fixation, both N2 fixation and photosynthesis should be proportionally up-regulated, resulting in stronger benefits to plant growth.
Chapter 5
80
5.3. Regulation of AM symbioses Biochemical signalling (i.e. production of plant strigolactones) triggers the initial
steps of the establishment of AM symbiosis (e.g. Bouwmeester et al., 2007). The AM symbiosis is only effective after the fungi have sufficiently grown and colonized the roots and then, the surrounding soil (Sanders et al., 1977; Smith and Read, 2008). There is a positive correlation between plant/root growth and fungal biomass (Bethlenfalvay et al., 1982a, 1982b; Buwalda et al., 1982; Fredeen and Terry, 1988), and, it is important that plants receive a ‘starter’ amount of nutrients (including P) to optimally benefit from AM symbioses (Bolan et al., 1984; Treseder and Allen, 2002). In addition, there is evidence that fertilization with N, associated with a high light intensity, can indirectly stimulate the AM colonization and fungal biomass due to increased plant P demand and growth (e.g. Hepper, 1983).
Even though there are diverse potential advantages from AM symbiosis for plant growth (e.g. improved water relations, reduced disease expression and hormone stimulation), the most important benefit is an improved P nutrition (occasionally Zn and Cu) of mycorrhizal plants (Smith and Read, 2008). In fact, several studies have shown that AM symbioses are regulated by both soil P availability and P internal mass fractions. The percentage of AM colonization, sporulation and number of entry points are negatively related to the soil P supply (Fredeen and Terry, 1988; Amijee et al., 1989; Fay et al., 1996; Nielsen et al., 1998). The negative effects of increased soil P supply on AM colonization and on C transfer to the AM hyphae could be attributed to a lower dependency of the plant on the soil nutrient uptake by the extraradical hyphae (e.g. Menge et al., 1978; Peng et al., 1993, Olsson et al., 2002; Valentine and Kleinert, 2007). Indeed, this is consistent with recent findings that revealed that P starvation induces the production of strigolactones, which in turn, promote mycorrhizal colonization of host plants (Bouwmeester et al., 2007). In fact, it is expected that plants will invest more in AM symbiosis if they do not meet their P demands (Valentine and Kleinert, 2007; Landis and Fraser, 2008).
Until recently, P uptake through the AM pathway was assumed to be an additive process to the root pathway. However, evidence is increasing that P uptake by the AM pathway is the prevailing process, even if there is no improvement in plant nutrient concentrations and/or growth responses of mycorrhizal plants (Smith et al., 2003, 2004, 2009; Grimoldi et al., 2005). Smith et al. (2003, 2004) highlighted that previous studies often connected the regulation of AM symbiosis with root colonization, which proved to be a misleading approach. However, plants can take great advantage from an extensive extradical hyphal network extending beyond the root nutrient depletion zone, even if the initial P availabilities are high (Smith and Read, 2008). Smith et al. (2009)
General Discussion
81
hypothesized that depression in plant growth of mycorrhizal plants under high P fertility (e.g. Peng et al., 1993; Eissenstat et al., 1993) is not an issue of C limitation, as it is usually believed. According to Smith et al. (2009), depression in growth of mycorrhizal plants under high P fertility could be explained by the fact that mycorrhizal plants switch off their own root P transporters and end up relying on an ineffective AM fungus.
Mycorrhizal plants grow bigger and accumulate more P on a mass fraction basis, which is peculiar, because plant growth usually is accompanied by fairly constant nutrient mass fractions (Marschner, 1995; Smith and Read, 2008). If P is accumulating, then P uptake is not limiting plant growth, and many authors have suggested that growth of mycorrhizal plants is limited by C availability (Eissenstat et al., 1993; Smith and Read, 2008). Other studies have suggested that plant growth of mycorrhizal plants is limited by nutrients (e.g. N, K or other) other than P (e.g. Cardoso et al., 2004).
The C limitation of AM symbioses was presumed because under high P availability, some mycorrhizal plant species have smaller dry weights than non-mycorrhizal plants (e.g. Eissenstat et al., 1993; Peng et al., 1993). Indeed, several studies have shown that both plant and fungal biomass are larger when photosynthesis is increased by elevated light intensity and CO2 concentration (e.g. Haynan, 1974; Daft and El-Giahmi, 1978; Buwalda and Goh, 1982; Bethlenfalvay and Pacovsky, 1983; Alberton et al., 2005). However, the studies that advocated C limitation of the AM symbiosis (e.g Peng et al., 1993; Eissenstat et al., 1993) have so far overlooked the fact that mycorrhizal plants (as well as nodulated plants) are capable of increasing their rates of CO2 assimilation to compensate for the symbiotic C costs (e.g. Harris et al., 1985; Brown and Bethlenfalvay, 1987; Fay et al., 1996; Wright et al., 1998a, 1998b). In Chapter 2, I describe the role of increased C sink strength of rhizobial and AM symbioses in stimulating photosynthesis over and above the nutritional effects of the symbioses. Furthermore, one strong line of evidence that plants are not limited by C availability is a natural feedback in the rates of photosynthesis, when plants with a weak C sink strength are grown under elevated CO2 (Moore et al., 1999; Ainsworth et al., 2004; Millard et al., 2007).
Plants cannot anticipate the fungal partners for their best interest. There have been several studies (e.g. Carling and Brown, 1980; Klironomos, 2003) showing that plants associate with a large range of AM fungi species differing in symbiotic effectiveness – the relative benefit (i.e. plant growth) of mycorrhizal plants in relation to non-mycorrizal plants. This promiscuity suggests that plants are not capable to sanction ineffective AM fungi species (contrary to the model of Kiers and Denison, 2008). I agree with Millard et al. (2007) that for a majority of circumstances, plants are not limited by photosynthetic capacity but rather by soil nutrient availability, and therefore,
Chapter 5
82
plants should invest C in AM symbioses until their nutrient (P, say) requirements are satisfied, even thought such ‘investment’ does not guarantee a positive outcome in terms of a cost : benefit analysis (Landis and Fraser, 2008; Smith et al., 2009).
To me, a major limitation to utilize AM symbioses for increasing plant growth is not a C use efficiency issue, but rather that P uptake via AM pathway is limited by P availability in the soils, such that plants cultivated in highly fixing P soils, or P-depleted soils will never produce large biomass, whether mycorrhizal or not. Despite increasing the absorption of some inorganic P sources (i.e. NaOH-Pi) unavailable for roots in highly P fixing soils (Cardoso et al., 2006), the AM fungi in general exploit the same soil labile-P pool as do the plant roots (Smith and Read, 2008). That is different for rhizobial symbioses, which have an unlimited availability of 80% N2 in the atmosphere. Additionally, it is not clear whether AM hyphae intentionally grow towards the soil P pools (which would increase the efficiency in nutrient uptake by the AM pathway) or whether hyphae grow randomly in the soil (Smith and Read, 2008).
On the other hand, AM fungal species with an extensive hyphal network could increase the efficiency of mycorrhizal plants in absorbing P, either by exploiting beyond the root nutrient depletion zone (Smith and Read, 2008), or by the absorption of some additional inorganic P sources (Cardoso et al., 2006). Increased P uptake by AM fungi does not suggest that AM symbioses can replace phosphate fertilization, as rhizobial symbioses do with N. But, it indicates that due to an increased efficiency in P acquisition, less fertilizers will be needed, which is very important for future agriculture limited by finite natural reserves of phosphorus. In contrast to rhizobial symbioses, there are hardly any AM fungal inoculants available for purchase. One way to stimulate AM symbioses is reducing tillage and including mycorrhizal dependent crops in the rotation (Harinikumar and Bagyaraj, 1988; Mozafar et al., 2000, Kabir, 2005). Obviously, less use of fungicides will also be beneficial to increase the potential inocula of AM fungi in the soil. These practices will probably favour an AM hyphal network, consequent rapid colonization of the crops and select the most mutualistic AM fungi (Kabir, 2005). Such practices could also be conducive to more effective nodulation (De Varennes and Goss, 2007).
5.4. Symbioses in a changing world
The CO2 concentration in our atmosphere has increased dramatically since the
industrial revolution. It is often assumed that elevated CO2 will stimulate photosynthesis because rubisco is far from saturated in the current atmosphere CO2 concentrations (e.g. Moore et al., 1999; Millard et al., 2007). However, the photosynthetic capacity of plants grown under elevated CO2 is acclimated (meaning
General Discussion
83
down-regulated in the long term) under sink-limited conditions (e.g. Goldschmidt and Huber, 1992; Xu et al., 1994; Moore et al., 1999), probably by a mechanism mediated by enzymatic carbohydrate signalling [e.g. acid invertase (E.C. 3.2.1.26) and hexokinase (E.C. 2.7.1.1)], which can result in decreased rubisco activity (Xu et al., 1994; Stitt and Krapp, 1999) and decreased expression of photosynthetic genes (Moore et al., 1999). Interestingly, plants grown under elevated CO2 concentrations can benefit from rhizobial and AM symbioses because the symbiotic C costs can remove the photosynthetic limitation of triose-P utilization (Chapter 3; Ainsworth et al., 2002, 2004). For example, Ainsworth et al. (2004) measured the responses of photosynthesis of nodulating and non-nodulating field-growing soybeans in free air CO2 concentration enrichment (550 µmol mol–1) and concluded that the C costs of nodules can remove the sink limitation of photosynthesis, preventing acclimation of photosynthesis under elevated CO2. As a result, both plants and microsymbionts can grow faster (e.g. AM symbiosis: Alberton et al., 2005; rhizobial symbiosis: Hardy and Havelka, 1975; Ainsworth et al., 2002, 2004).
However, acclimation of photosynthesis in plants grown under elevated CO2 is often constrained by limited N availability at ecosystem level (Luo et al., 2004; Alberton and Kuyper, 2009), but also at plant physiological level (Rachmilevitch et al. 2004). Luo et al. (2004) proposed ‘progressive N limitation’, a condition under which plant responses to elevated CO2 are limited by N availability in the soil, due to immobilization of N in long-lived plant parts or in soil microbial biomass. Alberton et al. (2007) observed reduced plant growth responses and progressive N limitation in Pinus silvestris (L.) seedlings grown under elevated CO2, and they attributed the depression in plant growth to a competition for N between seedlings and ectomycorrhizal hyphae. Furthermore, N limitation results from a plant physiological limitation to reduce NO3
– in the shoots, as it appears that NO3 reduction is highly dependent on shoot photorespiration (Rachmilevitch et al. 2004) or on competition for electrons between CO2 assimilation and NO3 reduction (Pate, 1980; Cen and Layzell, 2003; Yin et al., 2006). This implies that crop yield increases under elevated CO2 are likely to be restricted if management is strictly based on N fertilization.
Although plants grown under elevated CO2 in general have a smaller leaf N mass fraction than plants grown under ambient CO2, and photosynthesis is performed with a higher N use efficiency, it is often reported that N use efficiency cannot be increased endlessly, and a minimum leaf N mass fraction is required (Sttit and Krapp, 1999). Given the possibility of up regulation of rhizobial N2 fixation (see above), in addition to the effects of sink stimulation of photosynthesis (Chapters 2, 3 and 4), effective rhizobial symbioses could support legumes to overcome the constraints of N limitation
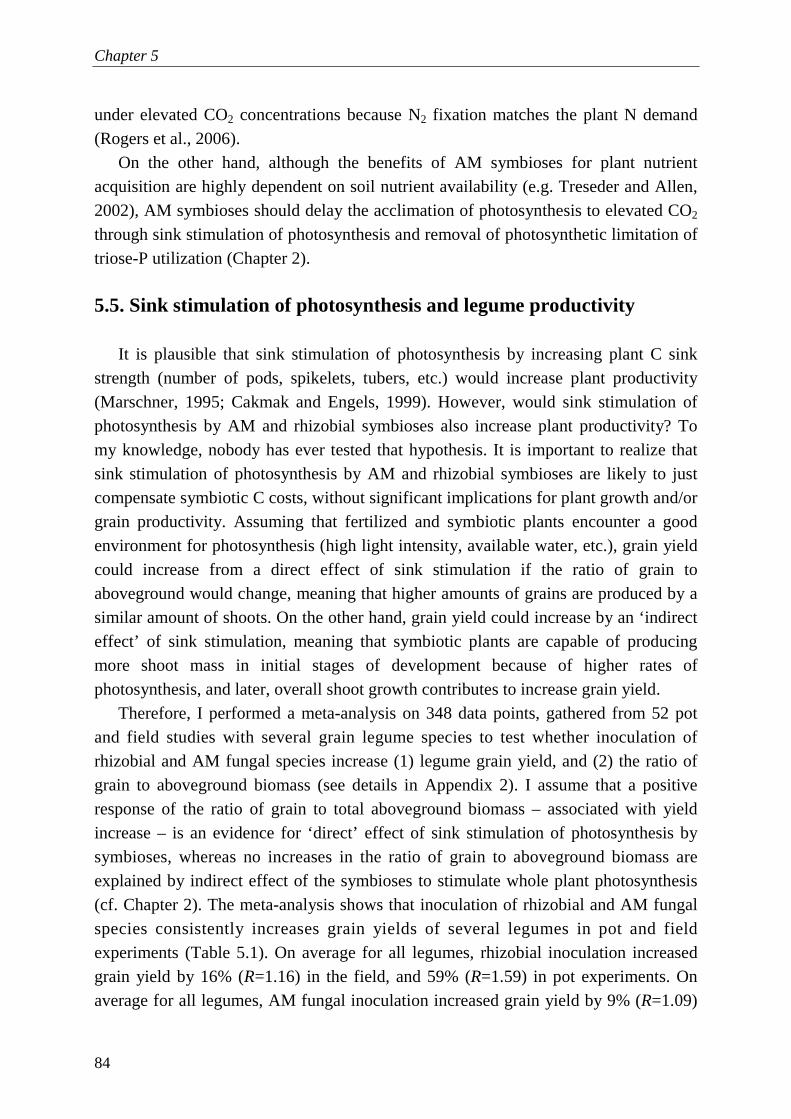
Chapter 5
84
under elevated CO2 concentrations because N2 fixation matches the plant N demand (Rogers et al., 2006).
On the other hand, although the benefits of AM symbioses for plant nutrient acquisition are highly dependent on soil nutrient availability (e.g. Treseder and Allen, 2002), AM symbioses should delay the acclimation of photosynthesis to elevated CO2 through sink stimulation of photosynthesis and removal of photosynthetic limitation of triose-P utilization (Chapter 2). 5.5. Sink stimulation of photosynthesis and legume productivity
It is plausible that sink stimulation of photosynthesis by increasing plant C sink
strength (number of pods, spikelets, tubers, etc.) would increase plant productivity (Marschner, 1995; Cakmak and Engels, 1999). However, would sink stimulation of photosynthesis by AM and rhizobial symbioses also increase plant productivity? To my knowledge, nobody has ever tested that hypothesis. It is important to realize that sink stimulation of photosynthesis by AM and rhizobial symbioses are likely to just compensate symbiotic C costs, without significant implications for plant growth and/or grain productivity. Assuming that fertilized and symbiotic plants encounter a good environment for photosynthesis (high light intensity, available water, etc.), grain yield could increase from a direct effect of sink stimulation if the ratio of grain to aboveground would change, meaning that higher amounts of grains are produced by a similar amount of shoots. On the other hand, grain yield could increase by an ‘indirect effect’ of sink stimulation, meaning that symbiotic plants are capable of producing more shoot mass in initial stages of development because of higher rates of photosynthesis, and later, overall shoot growth contributes to increase grain yield.
Therefore, I performed a meta-analysis on 348 data points, gathered from 52 pot and field studies with several grain legume species to test whether inoculation of rhizobial and AM fungal species increase (1) legume grain yield, and (2) the ratio of grain to aboveground biomass (see details in Appendix 2). I assume that a positive response of the ratio of grain to total aboveground biomass – associated with yield increase – is an evidence for ‘direct’ effect of sink stimulation of photosynthesis by symbioses, whereas no increases in the ratio of grain to aboveground biomass are explained by indirect effect of the symbioses to stimulate whole plant photosynthesis (cf. Chapter 2). The meta-analysis shows that inoculation of rhizobial and AM fungal species consistently increases grain yields of several legumes in pot and field experiments (Table 5.1). On average for all legumes, rhizobial inoculation increased grain yield by 16% (R=1.16) in the field, and 59% (R=1.59) in pot experiments. On average for all legumes, AM fungal inoculation increased grain yield by 9% (R=1.09)
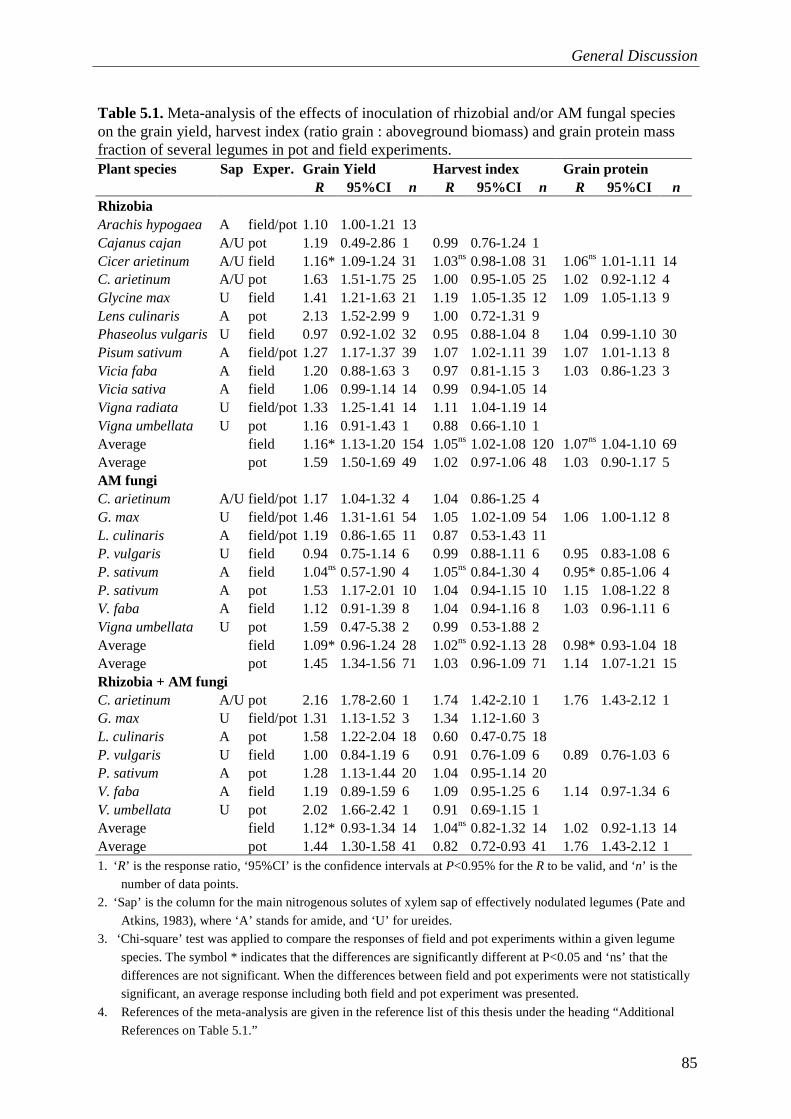
General Discussion
85
Table 5.1. Meta-analysis of the effects of inoculation of rhizobial and/or AM fungal species on the grain yield, harvest index (ratio grain : aboveground biomass) and grain protein mass fraction of several legumes in pot and field experiments. Plant species Sap Exper. Grain Yield Harvest index Grain protein R 95%CI n R 95%CI n R 95%CI n Rhizobia Arachis hypogaea A field/pot 1.10 1.00-1.21 13 Cajanus cajan A/U pot 1.19 0.49-2.86 1 0.99 0.76-1.24 1 Cicer arietinum A/U field 1.16* 1.09-1.24 31 1.03ns 0.98-1.08 31 1.06ns 1.01-1.11 14 C. arietinum A/U pot 1.63 1.51-1.75 25 1.00 0.95-1.05 25 1.02 0.92-1.12 4 Glycine max U field 1.41 1.21-1.63 21 1.19 1.05-1.35 12 1.09 1.05-1.13 9 Lens culinaris A pot 2.13 1.52-2.99 9 1.00 0.72-1.31 9 Phaseolus vulgaris U field 0.97 0.92-1.02 32 0.95 0.88-1.04 8 1.04 0.99-1.10 30 Pisum sativum A field/pot 1.27 1.17-1.37 39 1.07 1.02-1.11 39 1.07 1.01-1.13 8 Vicia faba A field 1.20 0.88-1.63 3 0.97 0.81-1.15 3 1.03 0.86-1.23 3 Vicia sativa A field 1.06 0.99-1.14 14 0.99 0.94-1.05 14 Vigna radiata U field/pot 1.33 1.25-1.41 14 1.11 1.04-1.19 14 Vigna umbellata U pot 1.16 0.91-1.43 1 0.88 0.66-1.10 1 Average field 1.16* 1.13-1.20 154 1.05ns 1.02-1.08 120 1.07ns 1.04-1.10 69 Average pot 1.59 1.50-1.69 49 1.02 0.97-1.06 48 1.03 0.90-1.17 5 AM fungi C. arietinum A/U field/pot 1.17 1.04-1.32 4 1.04 0.86-1.25 4 G. max U field/pot 1.46 1.31-1.61 54 1.05 1.02-1.09 54 1.06 1.00-1.12 8 L. culinaris A field/pot 1.19 0.86-1.65 11 0.87 0.53-1.43 11 P. vulgaris U field 0.94 0.75-1.14 6 0.99 0.88-1.11 6 0.95 0.83-1.08 6 P. sativum A field 1.04ns 0.57-1.90 4 1.05ns 0.84-1.30 4 0.95* 0.85-1.06 4 P. sativum A pot 1.53 1.17-2.01 10 1.04 0.94-1.15 10 1.15 1.08-1.22 8 V. faba A field 1.12 0.91-1.39 8 1.04 0.94-1.16 8 1.03 0.96-1.11 6 Vigna umbellata U pot 1.59 0.47-5.38 2 0.99 0.53-1.88 2 Average field 1.09* 0.96-1.24 28 1.02ns 0.92-1.13 28 0.98* 0.93-1.04 18 Average pot 1.45 1.34-1.56 71 1.03 0.96-1.09 71 1.14 1.07-1.21 15 Rhizobia + AM fungi C. arietinum A/U pot 2.16 1.78-2.60 1 1.74 1.42-2.10 1 1.76 1.43-2.12 1 G. max U field/pot 1.31 1.13-1.52 3 1.34 1.12-1.60 3 L. culinaris A pot 1.58 1.22-2.04 18 0.60 0.47-0.75 18 P. vulgaris U field 1.00 0.84-1.19 6 0.91 0.76-1.09 6 0.89 0.76-1.03 6 P. sativum A pot 1.28 1.13-1.44 20 1.04 0.95-1.14 20 V. faba A field 1.19 0.89-1.59 6 1.09 0.95-1.25 6 1.14 0.97-1.34 6 V. umbellata U pot 2.02 1.66-2.42 1 0.91 0.69-1.15 1 Average field 1.12* 0.93-1.34 14 1.04ns 0.82-1.32 14 1.02 0.92-1.13 14 Average pot 1.44 1.30-1.58 41 0.82 0.72-0.93 41 1.76 1.43-2.12 1 1. ‘R’ is the response ratio, ‘95%CI’ is the confidence intervals at P<0.95% for the R to be valid, and ‘n’ is the
number of data points.
2. ‘Sap’ is the column for the main nitrogenous solutes of xylem sap of effectively nodulated legumes (Pate and
Atkins, 1983), where ‘A’ stands for amide, and ‘U’ for ureides.
3. ‘Chi-square’ test was applied to compare the responses of field and pot experiments within a given legume
species. The symbol * indicates that the differences are significantly different at P<0.05 and ‘ns’ that the
differences are not significant. When the differences between field and pot experiments were not statistically
significant, an average response including both field and pot experiment was presented.
4. References of the meta-analysis are given in the reference list of this thesis under the heading “Additional
References on Table 5.1.”
Chapter 5
86
in field and by 45% (R=1.45) in pot experiments. Table 1 shows that legume responses to rhizobial and AM fungal inoculation are
stronger in pot than in field experiments. Small responses to inoculation in the field are probably attributed to the fact that field soils have a dense population of indigenous strains which are more infective than the strains inoculated, but less effective. Often, strains that proved to be very infective and effective in pot experiments, are not highly infective in the field, because of a lower competitive ability with indigenous strains for root colonization (rhizobia: Herridge and Rose, 2000; AM fungi: Smith and Read, 2008). On the other hand, if the substrate in the pots is sterilized, competition among strains is absent or reduced, and an effective symbiosis is established already in the initial stages of development. Differences in responses between field and pot experiments could also be related to the available soil volume (e.g. less phosphate available) per plant. However, some authors advocate that pots in general offer much more soil volume than fields because they support lower plant densities (Koide, 1991).
Considering harvest index (the ratio of grain to aboveground biomass) as indicator, a ‘direct’ effect of sink stimulation of the photosynthesis by symbioses is observed in a few legume crops [i.e. soybean; pea (Pisum sativum L.); and mungbean (Vigna radiata (L.) R. Wilczek)] under field conditions. I think that the harvest index did not increase in the other crops because these plants grew a larger shoot biomass as well. Although the meta-analysis would be stronger if there were a larger number of data points for some legumes [e.g. pigeon pea (Cajanus cajan (L.) Millsp.), rice bean (Vigna
umbellata (Thunb.) Ohwi & H. Ohashi); chickpea (Cicer arientinum L.), and faba bean (Vicia faba L.)], it indicates that plants associated with rhizobial and AM fungal microsymbionts grow better and produce more grain, which means that plants are not limited by C. If microsymbionts are capable of supplying nutrients, then plants would spend any C required to support such symbioses by auto-regulating photosynthetic capacity (e.g. rhizobia: Chapter 3; AM symbioses: Landis and Fraser, 2008). These results add to the argument that plants (particularly symbiotic plants) are almost never limited by C supply, but rather by soil nutrients (Millard et al., 2007).
Some legumes are highly valued for their oil content, but few studies have considered the effect of rhizobial and/or AM fungal inoculation on the grain oil mass fraction [e.g. rhizobia/peanut (Arachis hypogaea L.): Anandham et al., 2007; rhizobia/soybean: Ratner et al., 1979; Malik et al., 2006; AM fungi/soybean: Ross and Harper, 1971; Roos, 1971]. If symbiotic plants divert their C to support symbioses (Minchin and Witty, 2005; Smith and Read, 2008; Chapter 2), they cannot afford to accumulate oil in grains due to the high C requirements (cf. Penning de Vries et al., 1974), unless the stimulation of photosynthesis exceeds the C demands from the microsymbionts. Therefore, I measured the response ratios of grain oil mass fraction
General Discussion
87
due to inoculation of rhizobial or AM fungal species. Interestingly, there is no effect of inoculation in any of the grain legumes analysed, i.e. faba bean, peanut and soybean. Grain oil mass fraction in both peanut and soybean is just increased by 1% due to rhizobial inoculation (not shown in the table; peanut: R=1.01; 95%CI=0.99–1.04; n=7; soybean: R=1.01; 95%CI=0.78–1.26; n=1), whereas it is just decreased by 3% due to AM fungal inoculation (R=0.97; 95% CI=0.89–1.06; n=5), none of which are significant. To me, the absence of responses of grain oil mass fraction to microsymbiont inoculation is again evidence that plants overcome the competition for C by increasing their photosynthetic metabolism.
Although there are attributes other than photosynthesis that affect productivity under field conditions (e.g. incidence of soil-borne diseases, herbivores, soil physical properties, crop management, climatic conditions, etc), photosynthesis is one of the remaining agronomic traits which has not been improved in the past 50 years (Sharma-Natu and Ghildiyal, 2005; Long et al., 2006). Long et al. (2006) discussed several theoretical pathways of breeding to increase theoretical potential of photosynthesis in crops and concluded that it will take some decades before we can reap the benefits of genetic manipulation of photosynthetic capacity. In this thesis I show that leaf photosynthesis can be sink-stimulated by AM and rhizobial symbioses. In early growth, it is likely that increases of photosynthesis by symbioses will only compensate the C costs of symbioses (as a removal of sink limitation of photosynthesis), but in later stages, symbioses will allow for building up strong sinks (grain).
Next to grain yield increases (16%), the meta-analysis shows that rhizobial inoculation improves grain protein mass fraction by 7% (R=1.07) under field conditions (Table 1). The legume crops that most accumulated protein in the grains due to rhizobial inoculation were: pigeonpea (amide/ureide-transporter), soybean (ureide-transporter) and pea (amide-transporter) (Table 5.1). Thus, although Pate and Atkins (1983) predicted the costs of asparagine (amide) synthesis to be 15.5 ATP/NH3 and the costs of allantoin/allantoic acid (ureides) to be 8.5 ATP/NH3, legumes that transport either amides or ureides can benefit from effective rhizobial symbioses. As discussed in Chapter 4, N2 fixation offers an advantage as compared to the application of N fertilizers in the field because legumes (e.g. soybean) reduce the capability to absorb NO3
– after the flowering stage, in spite of continued N availability in the soil (Streeter, 1972; Sinclair and de Wit, 1975; Egli et al., 1978; Imsande and Edwards, 1988) due to a reduced activity of nitrate reductase (E.C. 1.6.6.1; Minchin et al., 1980). Indeed, there is evidence that soybean hardly responds to N fertilization after pod filling starts (Egli et al., 1978; Hungria et al., 2006; Salvaviotti et al., 2008). However, legumes associated with effective rhizobial strains support N2 fixation for longer periods during the pod filling stage (Warembourg and Fernandez, 1985; Neves et al.,

Chapter 5
88
1985), which delays leaf senescence and increases the period of grain filling (Chapter 4).
5.6. Modelling sink stimulation at crop level
As far as I can tell, sink stimulation of photosynthesis by symbioses has yet to be
implemented in crop models. However, the meta-analysis above evidenced that, at least for a few crops, sink stimulation plays a role in increasing grain yield. It would be very interesting to know whether we can predict sink stimulation of photosynthesis under field conditions through crop model simulations.
I selected the GECROS (Genotype-by-Environment interaction on CRop growth Simulator) model (Yin and van Laar, 2005) to discuss the role of sink stimulation of photosynthesis by symbioses in crop models. The GECROS model is appropriate in this case because it describes the CO2 assimilation with the equations of Farquhar et al. (1980) and some modifications by Yin et al. (2004), similar to what I describe in Chapter 3. Few crop models which have described the process of biological N2 fixation, have done so by describing empirical relationships between observed N2 fixation rates and plant development (cf. Cannavo et al., 2008). The GECROS model simulates N acquisition dynamically, and assumes that N2 fixation can fulfil legume N requirements if N uptake is insufficient, provided that there is sufficient C to cover the costs of N2 fixation (cf. Yin and van Laar, 2005). I parameterized GECROS with independent data for two soybean varieties, which are planted in Southern Brazil, based on data reported by Oya et al. (2004), Sinclair et al. (2005) and Franchini et al. (2007) (see Appendix 3), and compared with actual data, as observed by Hungria et al. (2006).
Following the GECROS simulations, increasing C costs of N2 fixation result in significantly decreasing soybean grain yields, particularly from 4 g C g–1 N onwards, regardless of the year of simulation (Fig. 5.1). Except for the year 2002/2003, simulated grain yields of N-fertilized plants (marked with dashed circles) are always greater than simulated grain yields of rhizobia-inoculated plants (all the other data points). It has been presumed that C costs of N2 fixation range from 5 to 12 g C g–1 (Cannell and Thornley, 2000; Witty and Minchin, 2005; Chapter 2), but implementing those values in GECROS model results in variation of around 1000 kg ha–1 in the simulated grain yields. On the other hand, observed grain yields of N-fertilized and rhizobia- inoculated did not differ in pair-wise comparisons (e.g. CT, year 2000/2001, etc.), but there were differences over the years and eventually because of soil tillage management (Fig. 5.1; Hungria et al., 2006). I do not believe that the C costs of N2 fixation are significantly changed over the years, or due to different soil tillage
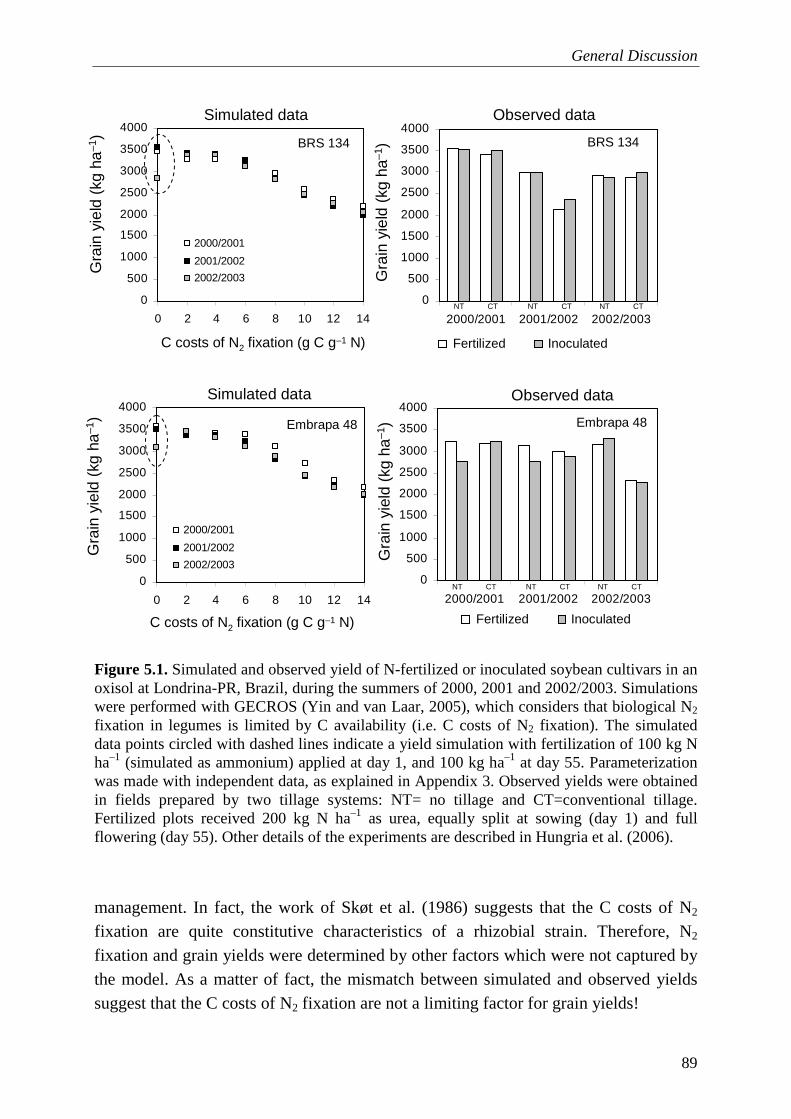
General Discussion
89
Figure 5.1. Simulated and observed yield of N-fertilized or inoculated soybean cultivars in an oxisol at Londrina-PR, Brazil, during the summers of 2000, 2001 and 2002/2003. Simulations were performed with GECROS (Yin and van Laar, 2005), which considers that biological N2 fixation in legumes is limited by C availability (i.e. C costs of N2 fixation). The simulated data points circled with dashed lines indicate a yield simulation with fertilization of 100 kg N ha–1 (simulated as ammonium) applied at day 1, and 100 kg ha–1 at day 55. Parameterization was made with independent data, as explained in Appendix 3. Observed yields were obtained in fields prepared by two tillage systems: NT= no tillage and CT=conventional tillage. Fertilized plots received 200 kg N ha–1 as urea, equally split at sowing (day 1) and full flowering (day 55). Other details of the experiments are described in Hungria et al. (2006).
management. In fact, the work of Skøt et al. (1986) suggests that the C costs of N2 fixation are quite constitutive characteristics of a rhizobial strain. Therefore, N2 fixation and grain yields were determined by other factors which were not captured by the model. As a matter of fact, the mismatch between simulated and observed yields suggest that the C costs of N2 fixation are not a limiting factor for grain yields!
0
500
1000
1500
2000
2500
3000
3500
4000
2000/2001 2001/2002 2002/2003
0
500
1000
1500
2000
2500
3000
3500
4000
2000/2001 2001/2002 2002/2003
C costs of N2 fixation (g C g–1 N)
Gra
in y
ield
(kg
ha–1
)G
rain
yie
ld (
kg h
a–1)
C costs of N2 fixation (g C g–1 N)
0
500
1000
1500
2000
2500
3000
3500
4000
0 2 4 6 8 10 12 14
2000/2001
2001/2002
2002/2003
0
500
1000
1500
2000
2500
3000
3500
4000
0 2 4 6 8 10 12 14
2000/2001
2001/2002
2002/2003
BRS 134
Embrapa 48
Gra
in y
ield
(kg
ha–1
)G
rain
yie
ld (
kg h
a–1)
Fertilized Inoculated
Fertilized Inoculated
BRS 134
Embrapa 48
Observed data
Observed data
Simulated data
Simulated data
NT CT NT CT NT CT
NT CT NT CT NT CT
Chapter 5
90
As previously reviewed by others (Graham and Vance, 2000; Hungria and Vargas, 2000; van Kessel and Hartley, 2000), the grain yields of legumes are determined by several factors other than C costs of N2 fixation, particularly soil and crop management, which indirectly affects potential N2 fixation. By including C costs to N2 fixation, crop models are likely to produce ‘right’ results by inputting a ‘wrong’ process. At best approach, models should include C costs of N2 fixation with the same values as the N acquisition though nitrate uptake (e.g. ≈ 2 g C g–1 N; GECROS model), or then, include the sink stimulation of photosynthesis by the C costs of symbioses.
In Chapter 3, I measured the response curves of photosynthesis to increasing CO2 concentrations of glasshouse-growing soybean plants, which were inoculated with Bradyrhizobium japonicum strains or fertilized with nitrate. The results of that experiment show that there is an adaptation of photosynthetic capacity (rubisco activity and electron transport rates) to different rates of triose-P utilization (Chapter 3). Therefore, I think that inclusion of sink stimulation of photosynthesis by rhizobial and AM symbioses on crop models based on photosynthetic biochemistry requires knowledge on the slope of the relationship of triose-P utilization due to increased C sink strenght with the electron transport rates and rubisco activity. In the specific case of C costs of rhizobial and AM symbioses, I would grow plants with different rhizobial and AM fungal strains, differing in C requirements, and then, measure the response curves of photosynthesis to fit the model of photosynthesis limitations, similarly to that which I describe in Chapter 3. However, as discussed in Chapter 2, the most difficult step is to determine the C costs of AM symbioses in relation to the symbiotic benefits, particularly AM symbioses bring many benefits, other than exclusive P nutrition (Smith and Read, 2008).
A major contribution of my thesis is the understanding that both rhizobial and AM fungi symbioses are beneficial to plants, regardless of the C costs, and beyond the nutritional effects of N and P acquisition. N2 fixation by rhizobial symbiosis and increasing uptake of phosphates in the soil by AM fungi symbiosis may increase crop productivity more than highly fertilized fields, while reducing monetary costs. Recent reviews (Graham and Vance, 2000; Hungria and Vargas, 2000; van Kessel and Hartley, 2000) emphasize the role of appropriate soil and crop managements for achieving effective N2 fixation and good grain yields. Potential rates of N2 fixation are not achieved in developed countries because of an inappropriate strategy of plant breeding under high rates of N fertilizers (Graham and Vance, 2000; Hungria and Vargas, 2000). Kiers et al. (2007) demonstrated that soybean breeding in the United States of America has led to modern soybean varieties with poorer ability to associate with effective rhizobial strains. On the other hand, in developing countries (e.g. Brazil), plant breeders have selected soybean varieties while omitting N fertilizers and inoculating
General Discussion
91
with effective rhizobial strains (Hungria et al., 2005, 2006). The success of N2 fixation is such in Brazil, that farmers are capable to harvest 2,000 to 3,250 kg soybean grains ha–1 (depending on regional climatic conditions) on an area of 21.4 Million ha (CONAB, 2009), without applying a grain of N fertilizer specifically for that crop, even not starter N. I would recommend that any development in crop breeding or management should consider the application of inoculants, or at least soil management which favours the establishment of rhizobial and AM fungal symbioses.

Chapter 5
92
References
93
References
Abu-Shakra, S.S., Phillips, D.A., Huffaker, R.C., 1978. Nitrogen fixation and delayed leaf senescence in soybeans. Science 199, 973-975.
Ainsworth, E.A., Davey, P.A., Bernacchi, C.J., Dermody, O.C., Heaton, E.A., Moore, D.J., Morgan, P.B., Naidu, S.L., Yoora, H.-S., Zhu, X.-G., Curtis, P.S., Long, S.P., 2002. A meta-analysis of elevated [CO2] effects on soybean (Glycine max) physiology, growth and yield. Global Change Biology 8, 695-709.
Ainsworth, E.A., Rogers, A., Nelson, R., Long, S.P., 2004. Testing the “source-sink” hypothesis of down-regulation of photosynthesis in elevated [CO2] in the field with single gene substitutions in Glycine max. Agricultural and Forest Meteorology 122, 85-94.
Alberton, O., Kaschuk, G., Hungria, M., 2006. Sampling effects on the assessment of genetic diversity of rhizobia associated with soybean and common bean. Soil Biology & Biochemistry 38, 1298-1307.
Alberton, O., Kuyper, T.W., 2009. Ectomycorrhizal fungi associated with Pinus
sylvestris seedlings respond differently to increased carbon and nitrogen availability: implications for ecosystem responses to global change. Global Change Biology 15, 166-175.
Alberton, O., Kuyper, T.W., Gorissen, A., 2005. Taking mycocentrism seriously: mycorrhizal fungal and plant responses to elevated CO2. New Phytologist 167, 859-868.
Alberton, O., Kuyper, T.W., Gorissen, A., 2007. Competition for nitrogen between Pinus sylvestris and ectomycorrhizal fungi generates potential for negative feedback under elevated CO2. Plant and Soil 296, 159-172.
Alves, B.J.R., Santos, J.C.F., Urquiaga, S., Boddey, R.M., 1994. Método de determinação do nitrogênio em solo e planta. In: Hungria, H., Araújo, R.S. (Eds). Manual de Métodos Empregados em Estudos de Microbiologia Agrícola. Embrapa-SPI, Brasília: 449-469.
Amijee, F., Tinker, P.B., Stribley, D.P., 1989. The development of endomycorrhizal root systems. VII. A detailed study of effects of soil phosphorus on colonization. New Phytologist 111, 435-446.
Anandham, R., Sridar, R., Nalayini, P., Poonguzhali, S., Madhaiyan, M., Sa, T., 2007.
References
94
Potential for plant growth promotion in groundnut (Arachis hypogaea L.) cv. ALR-2 by co-inoculation of sulfur-oxidizing bacteria and Rhizobium. Microbiological Research 162, 139-153.
Arnon, DI., 1949. Copper enzymes in isolated chloroplasts. Polyphenoloxidase in Beta
vulgaris. Plant Physiology 24, 1-15.
Atkins, C.A., 1984. Efficiencies and inefficiencies in the legume/ Rhizobium symbiosis – a review. Plant and Soil 82, 273-284.
Augé, R., 2001. Water relations, drought and vesicular-arbuscular mycorrhizal symbiosis. Mycorrhiza 11, 3-42.
Azcón-Bieto, J., 1983. Inhibition of photosynthesis by carbohydrates in wheat leaves. Plant Physiology 73, 681-986.
Bago, B., Pfeffer, P.E., Abubaker, J., Jun, J., Allen, J.W., Brouillette, J., Douds, D.D., Lammers, P.J., Shachar-Hill, Y., 2003. Carbon export from arbuscular mycorrhizal roots involves the translocation of carbohydrate as well as lipid. Plant Physiology 131, 1496-1507.
Bago, B., Pfeffer, P.E., Zipfel, W., Lammers, P., Shachar-Hill, Y., 2002. Tracking metabolism and imaging transport in arbuscular mycorrhizal fungi. Plant and Soil 244, 189-197.
Baker, N.R., 2008. Chlorophyll fluorescence: a probe of photosynthesis in vivo. Annual Review of Plant Physiology 59, 89-113.
Bécard, G., Doner, L.W., Rolin, D.B., Douds, D.D., Pfeffer, P.E., 1991. Identification and quantification of trehalose in vesicular-arbuscular mycorrhizal fungi by in vivo 13C NMR and HPLC analyses. New Phytologist 118, 547-552.
Bernacchi, C.J., Singsaas, E.L., Pimentel, C., Portis Jr., A.R., Long, S.P., 2001. Improved temperature response functions for models of Rubisco-limited photosynthesis. Plant Cell & Environment 24: 253-259.
Bethlenfalvay G.J., Phillips, D.A., 1978. Interactions between Symbiotic Nitrogen Fixation, Combined-N Application, and Photosynthesis in Pisum sativum. Physiologia Plantarum. 42, 119-123.
Bethlenfalvay, G.J., Brown, M.S., Pacovsky, R.S., 1982a. Relationships between host and endophyte development in mycorrhizal soybeans. New Phytologist 90, 537-543.
Bethlenfalvay, G.J., Norris, R.F., Phillips, D.A., 1979. Effect of bentazon, a Hill
References
95
reaction inhibitor, on symbiotic nitrogen-fixing capacity and apparent photosynthesis. Plant Physiology 63, 213-215.
Bethlenfalvay, G.J., Pacovsky, R.S., Brown, M.S., Fuller, G., 1982b. Mycotrophic growth and mutualistic development of host plant and fungal endophyte in an endomycorrhizal symbiosis. Plant and Soil 68, 43-54.
Bethlenfalvay, G.J., Pacovsky, R.S.,1983. Light effects in mycorrhizal soybeans. Plant Physiology 73, 969-972.
Bethlenfalvay, G.J., Phillips, D.A., 1977. Ontogenetic interactions between photosynthesis and symbiotic nitrogen fixation in legumes. Plant Physiology 60, 419-421.
Bittman, S., Kowalenko, C.G., Hunt, D.E., Forge, T.A., Wu, X., 2006. Starter phosphorus and broadcast nutrients on corn with contrasting colonization by mycorrhizae. Agronomy Journal 98, 394-401.
Black, K.G., Mitchell, D.T., Osborne, B.A., 2000. Effect of mycorrhizal-enhanced leaf phosphate status on carbon partitioning, translocation and photosynthesis in cucumber. Plant Cell & Environment 23, 797-809.
Bolan, N.S., Robson, A.D., Barrow, N.J., 1984. Increasing phosphorus supply can increase the infection of plant roots by vesicular-arbuscular mycorrhizal fungi. Soil Biology & Biochemistry 16, 419-420.
Bouwmeester, H.J., Roux, C., Lopez-Raez, J.A., Bécard, G., 2007. Rhizosphere communication of plants, parasitic plants and AM fungi. Trends in Plant Science 12, 224-230.
Boyd, H.W., 1971. Manganese toxicity to peanut in autoclaved soil. Plant and Soil 34, 133-144.
Bradford, M.M., 1976. A dye binding assay for protein. Analytical Biochemistry 72, 248–254.
Broughton, W.J., Dilworth, M.J., 1971. Control of leghaemoglobin synthesis in snake beans. Biochemical Journal 125:1075-1080
Brown, M.S., Bethlenfalvay, G.J., 1987. The Glycine-Glomus-Rhizobium symbiosis. IV. Photosynthesis in nodulated, mycorrhizal, or N- and P-fertilized soybean plants. Plant Physiology 85, 120-123.
Brown, M.S., Bethlenfalvay, G.J., 1988. The Glycine-Glomus-Rhizobium symbiosis. 7. Photosynthetic nutrient-use efficiency in nodulated, mycorrhizal soybeans. Plant
References
96
Physiology 86, 1292-1297.
Bryla, D.R., Eissenstat, D.M., 2005. Respiratory costs of mycorrhizal associations. In: Lambers, H., Ribas-Carbo, M., (Eds.) Plant Respiration, Springer, Dordrecht, pp 207-224.
Bukhov, N.G., 2004. Dynamic light regulation of photosynthesis. Russian Journal of Plant Physiology 51, 742-753.
Bütehorn, B., Gianinazzi-Pearson, V., Franken, P., 1999. Quantification of β-tubulin RNA expression during asymbiotic and symbiotic development of the arbuscular mycorrhizal fungus Glomus mosseae. Mycological Research 3, 360-364.
Buwalda, J.G., Goh, K.M., 1982. Host-fungus competition for carbon as a cause of growth depressions in vesicular-arbuscular mycorrhizal ryegrass. Soil Biology & Biochemistry 14, 103-106.
Buwalda, J.G., Ross, G.J.S., Stribley, D.P., Tinker, P.B., 1982. The development of endomycorrhizal root systems. III. The mathematical representation of the spread of vesicular-arbuscular mycorrhizal infection in root systems. New Phytologist 91, 669-682.
Cakmak, I., Engels, C., 1999. Role of mineral nutrients in photosynthesis and yield formation. In: Rengel, Z. (Ed.) Mineral Nutrition of Crops. Fundamental Mechanisms and Implications. The Haworth Press, Inc., New York, pp.141-168.
Callow, J.A., Capaccio, L.C.M., Parish, G., Tinker, P.B., 1978. Detection and estimation of polyphosphate in vesicular-arbuscular mycorrhizas. New Phytologist 80, 125-134.
Campbell, W.J., Allen Jr., L.H., Bowes, G., 1988. Effects of CO2 concentration on rubisco activity, amount and photosynthesis in soybeans leaves. Plant Physiology 88, 1310-1316.
Cannavo, P., Recous, S., Parnaudeau, V., Reau, R., 2008. Modeling N dynamics to assess environmental impacts of cropped soils. Advances in Agronomy 97, 131-174.
Cannell, M.G.R., Thornley, J.H.M., 2000. Modelling the components of plant respiration: some guiding principles. Annals of Botany 85, 45-54.
Cardoso, I.M., Boddington, C.L., Janssen, B.H., Oenema, O., Kuyper, T.W., 2004. Double pot and double compartment: integrating two approaches to study nutrient uptake by arbuscular mycorrhizal fungi. Plant and Soil, 260, 301-310.

References
97
Cardoso, I.M., Boddington, C.L., Janssen, B.H., Oenema, O., Kuyper, T.W., 2006. Differential access to phosphorus pools of an Oxisol by mycorrhizal and nonmycorrhizal maize. Communications in Soil Science and Plant Analysis. 37, 1537-1551.
Cardoso, I.M., Kuyper, T.W., 2006. Mycorrhizas and tropical soil fertility. Agriculture, Ecosystems and Environment 116, 72-84.
Carling, D.E., Brown, M.G., 1980. Relative effect of vesicular-arbuscular mycorrhizal fungi on the growth and yield of soybeans. Soil Science Society American Journal 44, 528-532.
Catt, J.W., Millard, P., 1988. The measurement of ribulose 1,5-biphosphate carboxylase/oxygenase concentration in the leaves of potato plants by enzyme linked immunosorbtion assays. Journal of Experimental Botany 39, 157-164.
Cen, Y.P., Layzell, D.B., 2003. In vivo gas exchange measurement of the site and dynamics of nitrate reduction in soybean. Plant Physiology 131, 1147-1156.
Cheng, L., Fuchigami, L.H., 2000. Rubisco activation state decreases with increasing nitrogen content in apple leaves. Journal of Experimental Botany 51, 1687-1694.
CONAB (Companhia Nacional de Abastecimento), 2009. Indicadores da Agropecuária Fevereiro 2009. Available at: http://www.conab.gov.br/conabweb/IA-fev09.pdf. Retrieved on: 17 March 2009.
Crafts-Brandner, S.J., Egli, D.B., 1987. Sink removal and leaf senescence in soybean. Plant Physiology 85, 662-666.
Daft, M.J., El-Giahmi, A.A., 1978. Effect of arbuscular mycorrhiza on plant growth. VIII. Effects of defoliation and light on selected hosts. New Phytologist 80, 365-372.
de Groot, C.C., Marcelis, L.F.M., van der Boogaard, R., Lambers, H., 2001. Growth and dry-mass partitioning in tomato as affected by phosphorus nutrition and light. Plant Cell & Environment 24, 1309-1317.
de Groot, C.C., van den Boogaard, R., Marcelis, L.F.M., Harbinson, J., Lambers, H., 2003. Contrasting effects of N and P deprivation on the regulation of photosynthesis in tomato plants in relation to feedback limitation. Journal of Experimental Botany 54, 1957-1967.
de Varennes, A., Goss, M.J., 2007. The tripartite symbiosis between legumes, rhizobia and indigenous mycorrhizal fungi is more efficient in undisturbed soil. Soil Biology & Biochemistry 39, 2603-2607.
References
98
de Veau, E.J., Robinson, J.M., Warmbrodt, R.D., van Berkum, P., 1990. Photosynthesis and photosynthate partitioning in N2 fixing soybeans. Plant Physiology 94, 259-267.
Dingkuhn, M., Luquet, D., Clément-Vidal, A., Tambour, L., Kim, H.K., Song, Y.H., 2007. Is plant growth driven by sink regulation? In: Spiertz, J.H.J., Struik, P.C. van Laar, H.H., (Eds) Scale and Complexity in Plant Systems Research- Gene-Plant-Crop Relations, Springer, Dordrecht, pp 157-170.
Dubois, M., Gilles K.A., Hamilton, J.K., Rebers, P.A., Smith, F., 1956. Colorimetric method for determination of sugars and related substances. Analytical Chemistry 28, 350-356.
Egli, D.B., Leggett, J.E., Duncan, W.G., 1978. Influence of N stress on leaf senescence and N redistribution in soybean. Agronomy Journal 70, 43-47.
Eissenstat, D.M., Graham, J.H., Syvertsen, J.P., Drouillard, D.L., 1993. Carbon economy of sour orange in relation to mycorrhizal colonization and phosphorus status. Annals of Botany 71, 1-10.
Evans, J.R., 1989. Photosynthesis and nitrogen relationships in leaves of C3 plants. Oecologia 78, 9-19.
Farquhar, G.D., von Caemmerer, S., Berry, J.A., 1980. A biochemical-model of photosynthetic CO2 assimilation in leaves of C3 species. Planta 149, 78-90.
Fay, P., Mitchell, D.T., Osborne, B.A., 1996. Photosynthesis and nutrient-use efficiency of barley in response to low arbuscular mycorrhizal colonization and addition of phosphorus New Phytologist 132, 425-433.
Fehr, W.R.C., Caviness, C.E., Burmood, D.T., Pennington, J.S., 1971. Stage of development descriptions for soybean, Glycine max (L.) Merrill. Crop Science 11, 929-931.
Finke, R.L., Harper, J.E., Hageman, R.H., 1982. Efficiency of nitrogen assimilation by N2-fixing and Nitrate-grown soybean plants (Glycine max [L.] Merr.). Plant Physiology 70, 1178-1184.
Fitter, A.H., 1991. Costs and benefits of mycorrhizas: implications for functioning under natural conditions. Experientia 47, 350-355.
Flexas, J., Díaz-Espejo, A., Berry, J.A., Cifre, J., Galmés, J., Kaldenhof, R., Medrano, H., Ribas-Carbó, M., 2007. Analysis of leakage in IRGA’s leaf chambers of open gas exchange systems: quantification and its effects in photosynthesis parameterization. Journal of Experimental Botany 58, 1533-1543.
References
99
Flügge, U.I., 1995. Phosphate translocation in the regulation of photosynthesis. Journal of Experimental Botany 46, 1317-1323.
Forrester, J.W., 1961. Industrial dynamics. John Wiley & Sons Inc., New York, 464.
Foyer, C., Spencer, C., 1986. The relationship between phosphate status and photosynthesis in the leaves. Planta 167, 369-375.
Franchini, J.C., Crispino, C.C., Souza, R.A., Torres, E., Hungria, M., 2007 Microbiological parameters as indicators of soil quality under various soil management and crop rotation systems in Southern Brazil. Soil & Tillage Research 92, 18-29.
Fredeen, A.L., Rao, I.M. and Terry, N., 1989. Influence of phosphorus nutritions on growth and carbon partitioning in Glycine max. Plant Physiology 89, 225-230.
Fredeen, A.L., Terry, N., 1988. Influence of vesicular-arbuscular mycorrhizal infection and soil phosphorus level on growth and carbon metabolism of soybean. Canadian Journal of Botany 66, 2311-2316.
Frey, B., Vilariño, A., Schüepp, H., Arines, J., 1994. Chitin and ergosterol content of extraradical and intraradical mycelium of the vesicular-arbuscular mycorrhizal fungus Glomus intraradices. Soil Biology & Biochemistry 26, 711-717.
Fujita, K., Masuda, T., Ogata, S., 1988a. Dinitrogen fixation, ureide concentration in xylem exudate and translocation of photosynthates in soybean as influenced by pod removal and defoliation. Soil Science & Plant Nutrition. 34, 265-275.
Fujita, K., Masuda, T., Ogata, S., 1988b. Dry matter production and dinitrogen fixation of wild and cultivated soybean varieties as affected by pod removal. Soil Science & Plant Nutrition. 34, 255-264.
Giller, K.E., 2001. Nitrogen Fixation in Tropical Cropping Systems, 2nd edn. CAB International, Wallingford.
Goicoechea, N., Antolín, M.C., Sánchez-Díaz, M., 1997. Gas exchange is related to the hormone balance in mycorrhizal or nitrogen-fixing alfafa subjected to drought. Physiologia plantarum 100, 989-997.
Goldschmidt, E.E., Huber, S.C., 1992. Regulation of photosynthesis by end-product accumulation in leaves of plants storing starch, sucrose and hexose sugars. Plant Physiology 99, 1443-1448.
Graham, P.H., Vance, C.P., 2000. Nitrogen fixation in perspective: an overview of research and extension needs. Field Crops Research 65, 93-106.

References
100
Grant, C., Bittman, S., Montreal, M., Plenchette, C., Morel, C., 2005. Soil and fertilizer phosphorus: effects on plant P supply and mycorrhizal development. Canadian Journal of Plant Sciences 85, 3-14.
Grimoldi, A.A., Kavanova, M., Lattanzi, F.A., Schnyder, H., 2005. Phosphorus nutrition-mediated effects of arbuscular mycorrhiza on leaf morphology and carbon allocation in perennial ryegrass. New Phytologist 168, 435-444.
Gurevitch, J. Hedges L.V., 2001. Meta-analysis: combining the results of independent experiments. In: Scheiner, S.M., Gurevitch, J., (Eds). Designs and Analysis of Ecological Experiments, 2nd edn., Oxford University Press, Oxford, pp 347-369.
Hardy, R.W.F., Havelka, U.D., 1975. Nitrogen fixation research: a key to world food ? Science, 188, 633-643.
Harinikumar, K.M., Bagyaraj, D.J., 1988. Effect of crop rotation on native vesicular arbuscular mycorrhizal propagules in soil. Plant and Soil 110, 77-80.
Harley, P.C., Sharkey, T.D., 1991. An improved model of C3 photosynthesis at high CO2: reversed O2 sensitivity explained by lack of glycerate re-entry into the chloroplast. Photosynthesis Research 27, 169-178.
Harley, P.C., Thomas, R.B., Reynolds, J.F., Strain, B.R., 1992. Modelling photosynthesis of cotton grown in elevated CO2. Plant, Cell & Environment 15, 271-282.
Harris, D., Pacovsky, R.S., Paul, E.A., 1985. Carbon economy of soybean-Rhizobium-
Glomus associations. New Phytologist 101, 427-440.
Hartwig, U.A., 1998. The regulation of symbiotic N2 fixation: a conceptual model of N feedback from the ecosystem to the gene expression level. Perspectives in Plant Ecology, Evolution and Systematics 1, 92-120.
Haynan, D.S., 1974. Plant growth responses to vesicular arbuscular mycorrhizal. VI. Effect of light and temperature. New Phytologist. 73, 71-80.
Hedges, L.V., Gurevitch, J., Curtis, P.S., 1999. The meta-analysis of response ratios in experimental ecology, Ecology 80, 1150-1156.
Hepper, C.M., 1977. A colorimetric method for estimating vesicular-arbuscular mycorrhizal infection in roots. Soil Biology & Biochemistry 9, 15-18.
Hepper, C.M., 1983. The effect of nitrate and phosphate on the vesicular-arbuscular mycorrhizal infection of lettuce. New Phytologist 92, 389-399.
Herold, A., 1980. Regulation of photosynthesis by sink activity – the missing link.
References
101
New Phytologist 86, 131-144.
Herridge, D., Rose, I., 2000. Breeding for enhanced nitrogen fixation in crop legumes. Field Crops Research. 65, 229-248.
Herridge, D.F., 1982. Relative abundance of ureides and nitrate in plant tissues of soybean as a quantitative assay of nitrogen fixation. Plant Physiology 70, 1-6.
Hesketh, J.D., Ogren, W.L., Peters, D.B., 1981. Correlations among leaf CO2-exchange rates, areas and enzyme activities among soybean cultivars. Photosynthesis Research 2, 21-30.
Hikosaka, K. and Terashima, I., 1995. A model of the acclimation of photosynthesis in the leaves of C3 plants to sun and shad with respect to nitrogen use. Plant, Cell & Environment 18, 605-618.
Huber, S.C., Israel, D.W., 1982. Biochemical basis for partitioning of photosynthetically fixed carbon between starch and sucrose in soybean (Glycine
max Merr.) leaves. Plant Physiology 69, 691-696.
Hungria, M., 1994. Metabolismo do carbono e do nitrogênio nos nódulos. In: Hungria, M., Araújo, R.S., (Eds.) Manual de Métodos Empregados em Estudos de Microbiologia Agrícola. Brasília, Embrapa-SPI, 247–283.
Hungria, M., Franchin, J.C., Campo, R.J., Crispino, C.C., Moraes, J.Z., Sibaldelli, R.N.R., Mendes, I.C., Arihara, J., 2006. Nitrogen nutrition of soybean in Brazil: Contributions of biological N2 fixation and N fertilizer to grain yield. Canadian Journal of Plant Science 86, 927-939.
Hungria, M., Franchini, J.C., Campo, R.J., Graham, P.H., 2005. The importance of nitrogen fixation to soybean cropping in South America. In: Werner, D., Newton, W.E., (Eds) Nitrogen Fixation in Agriculture, Forestry, Ecology, and the Environment. Springer, Dordrecht, pp.25-42.
Hungria, M., Neves, M.C.P., 1986. Ontogenia da fixação biológica do nitrogênio em Phaseolus vulgaris. Pesquisa Agropecuária Brasileira 21, 715-730.
Hungria, M., Neves, M.C.P., Doberëiner, J., 1989. Relative efficiency, ureide transport and harvest index in soybean inoculated with isogenic Hup mutants of Bradyrhizobium japonicum. Biology and Fertility of Soils 7, 325-329.
Hungria, M., Vargas, M.A.T., 2000. Environmental factors affecting N2 fixation in grain legumes in the tropics, with an emphasis on Brazil. Field Crops Research 65, 151-164.
References
102
Iglesias, D.J., Lliso, I., Tadeo, F.R., Talon, M., 2002. Regulation of photosynthesis through source: sink imbalance in citrus is mediated by carbohydrate content in leaves. Physiologia Plantarum 116, 563-572.
Imsande, J., 1988. Enhanced nitrogen fixation increases net photosynthetic output and seed yield of hydroponically grown soybean. Journal of Experimental Botany 39, 1313-1321.
Imsande, J., Edwards, D.G., 1988. Decreased rates in nitrate uptake during pod fill by cowpea, green gram and soybean. Agronomy Journal 80, 789-793.
Jabaji-Hare, S., Deschene, A., Kendrick, B., 1984. Lipid content and composition of vesicles of a vesicular-arbuscular mycorrhizal fungus. Mycologia 76, 1024-1030.
Jia, Y., Gray, V.M., 2004. Influence of phosphorus and nitrogen on photosynthetic parameters and growth in Vicia faba L. Photosynthetica 42, 535-542.
Jia, Y., Gray, V.M., Straker, C.J., 2004. The influence of Rhizobium and arbuscular mycorrhizal fungi on nitrogen and phosphorus accumulation by Vicia faba. Annals of Botany 94, 251-258.
Johnson, D., Leake, J.R., Ostle, N., Ineson, P., Read, D.J., 2002. In situ 13CO2 pulse-labelling of upland grassland demonstrates a rapid pathway of carbon flux from arbuscular mycorrhizal mycelia to the soil. New Phytologist 153, 327-334.
Johnson, N.C., Graham, J.H., Smith, F.A., 1997. Functioning of mycorrhizal associations along the mutualism-parasitism continuum. New Phytologist 135, 575-585.
Kabir, Z., 2005. Tillage or no-tillage: impact on mycorrhizae. Canadian Journal of Plant Science, 85, 23-29.
Kantar, F., Elkoca, E., Öğütcü, H., Algur, Ö.F., 2003. Chickpea yields in relation to Rhizobium inoculation from wild chickpea at high altitudes. Journal of Agronomy and Crop Science 189, 291-297.
Kaschuk, G., Hungria, M., Andrade, D.S., Campo, R.J., 2006. Genetic diversity of rhizobia associated with common bean grown under the no-tillage and conventional systems in Southern Brazil. Applied Soil Ecology, 32, p. 210-220.
Khaliq, A., Sanders, F.E., 2000. Effects of vesicular-arbuscular mycorrhizal inoculation on the yield and phosphorus uptake of field-grown barley. Soil Biology & Biochemistry 32, 1691-1696.
Kiers, E.T., Denison, R.F., 2008. Sanctions, cooperation, and the stability of plant-
References
103
rhizosphere mutualisms. Annual Review of Ecology, Evolution, and Systematics 39, 215-36.
Kiers, E.T., Hutton, M.G., Denison, R.F., 2007. Human selection and the relaxation of legume defences against ineffective rhizobia. Proceedings of the Royal Society 274, 3119-3126.
King, B.J., Layzell, D.B., 1991. Effect of increases in oxygen concentration during the Argon-induced decline in nitrogenase activity in root nodules of soybean. Plant Physiology 96, 376-381.
King, C.A., Purcell, L.C., 2005. Inhibition of N2 fixation in soybean is associated with elevated ureides and amino acids. Plant Physiology 137, 1389-1396.
Klironomos, J.N., 2003. Variation in plant response to native and exotic arbuscular mycorrhizal fungi. Ecology, 84, 2292-2301.
Koide, R., Elliot, G., 1989. Cost, benefit and efficiency of the vesicular-arbuscular mycorrhizal symbiosis. Functional Ecology 3, 252-255.
Koide, R.T., 1991. Density-dependent response to mycorrhizal infection in Abutilon
theophrasti Medic. Oecologia 85, 389-395.
Kucey, R.M.N., Paul, E.A., 1982a. Biomass of mycorrhizal fungi associated with bean roots. Soil Biology & Biochemistry 14, 413-414.
Kucey, R.M.N., Paul, E.A., 1982b. Carbon flow, photosynthesis, and N2 fixation in mycorrhizal and nodulated faba beans (Vicia faba L.). Soil Biology & Biochemistry 14, 407-412.
Kuo, C.G., Huang, R.S., 1982. Effect of vesicular-arbuscular mycorrhizae on the growth and yield of rice-stuble cultured soybeans. Plant and Soil 64, 325-330.
Lambers, H., Chapin, F.S. III, Pons, T.L., 1998. Plant Physiological Ecology. Spring-Verlag, New York.
Landis, F.C., Fraser, L.H., 2008. A new model of carbon and phosphorus transfers in arbuscular mycorrhizas. New Phytologist 177, 466-479.
Lawn, R.J., Brun, W.A., 1974. Symbiotic nitrogen-fixation in soybeans. 1. Effect of photosynthetic source-sink manipulations. Crop Science 14, 11-16.
Layzell, D.B., Hunt, S., 1990. Oxygen and the Regulation of Nitrogen-Fixation in Legume Nodules. Physiologia Plantarum 80: 322-327.
Linder, S., 1974. A proposal for the use of standardized methods for chlorophyll

References
104
determinations in ecological and eco-physiological investigations. Physiologia Plantarum 32, 154-156.
Lodwig, E.M., Hosie, A.H.F., Bourdès, A., Findlay, K., Allaway, D., Karunakaran, R., Downie, J.A., Poole, P.S., 2003. Amino-acid cycling drives nitrogen fixation in the legume-Rhizobium symbiosis. Nature 422, 722-726.
Long, S.P., Bernacchi, C.J., 2003. Gas exchange measurements, what can they tell us about the underlying limitations to photosynthesis? Procedures and sources of error. Journal of Experimental Botany 54, 2393-2401.
Long, S.P., Zhu, X.-G., Naidu, S.L., Ort, D.R. 2006. Can improvement in photosynthesis increase crop yields? Plant, Cell & Environment 29, 315-330.
Lovelock, C.E., Kyllo, D., Popp, M., Isopp, H., Virgo, A., Winter, K., 1997. Symbiotic vesicular-arbuscular mycorrhizae influence maximum rates of photosynthesis in tropical trees seedlings grown under elevated CO2. Australian Journal of Plant Physiology 24, 185-194.
Luo, Y., Su, B., Currie, W.S., Dukes, J. S., Finzi, A., Hartwig, U., Hungate, B., McMurtrie, R.E., Oren, R., Parton, W.J., Pataki, D.E., Shaw, R., Zak, D.R., Rield, C.B. 2004 Progressive nitrogen limitation of ecosystem responses to rising atmospheric carbon dioxide. Bioscence 54, 731-740.
Mächler, F., Oberson, A., Grub, A., Nösberger, J., 1988. Regulation of photosynthesis in nitrogen deficient wheat seedlings. Plant Physiology 87, 46-49.
Mahon, J.D. 1983. Energy Relationships. In: Broughton, W.J. (Ed.) Nitrogen Fixation Volume 3: Legumes. New York: Oxford University Press, pp. 299-325.
Malik, M.A., Cheema, M.A., Khan, H.Z., Wahid, M.A., 2006. Growth and yield response of soybean (Glycine max L.) to seed inoculation and varying phosphorus levels. Journal of Agricultural Research 44, 47-53.
Marschner, H., 1995. Mineral Nutrition of Higher Plants. 2 edn. Academic Press Ltd., London.
Matsumoto, T., Yatazawa, M., Yamamoto, Y., 1977. Distribution and change in the contents of allantoin and allantoic acid in developing nodulating and non-nodulating soybean plants. Plant and Cell Physiology 18, 353-359.
Maury, P., Suc, S., Berger, M., Planchon, C., 1993. Response of photochemical processes of photosynthesis to dinitrogen fixation in soybean. Plant Physiology 101, 493-497.
References
105
McClearly, B.V., Gibson, T.S., Mugford, D.C., 1997. Measurement of total starch in cereal products by amolyglucosidase –α – amylase method: collaborative study. Journal of AOAC (Association of Official Analytical Chemists) International 80, 571-579.
McClure, P.R., Israel, D.W., 1979. Transport of nitrogen in the xylem of soybean plants. Plant Physiology 64, 411-416.
McCormick, A.J., Cramer, M.D., Watt, D.A., 2006. Sink strength regulates photosynthesis in sugarcane. New Phytologist 171, 759-770.
McKinney, G., 1941. Absorption of light by chlorophyll solutions. Journal of Biological Chemistry 140, 315-322.
Medlyn, B.E., Dreyer, E., Ellsworth, D., Forstreuter, M., Harley, P.C., Kirschbaum, M.U.F., Le Roux, X., Montpied, P., Strassemeyer, J., Walcroft, A., Wang, K., Loustau, D., 2002. Temperature response of parameters of a biochemically based model of photosynthesis. II. A review of experimental data. Plant Cell & Environment 25, 1167-1179.
Menge, J.A., Steirle, D., Bagyaraj, D.J., Johnson, L.V., Leonard, R.T., 1978. Phosphorus concentrations in plants responsible for inhibition of mycorrhizal infection. New Phytologist 80, 575-578.
Michiels, J., Dombrecht, B., Vermeiren, N., Xi, C., Luyten, E., Vanderleyden, J., 1998. Phaseolus vulgaris is a non-selective host for nodulation, FEMS Microbiollogy Ecology. 26, 193–205.
Millard, P., Sommerkorn, M., Grelet, G.-A., 2007. Environmental change and carbon limitation in trees: a biochemical, ecophysiological and ecosystem appraisal. New Phytologist 175, 11-28.
Minchin, F.R., Pate, J.S., 1973. The carbon balance of a legume and the functional economy of its root nodules. Journal of Experimental Botany 24, 259-271.
Minchin, F.R., Summerfield, R.J., Hadley, P., Roberts, E.H., Rawsthorne, S., 1981. Carbon and nitrogen nutrition of nodulated roots of grain legumes. Plant Cell & Environment 4, 5-26.
Minchin, F.R., Summerfield, R.J., Neves, M.C.P., 1980. Carbon metabolism, nitrogen assimilation, and seed yield of cowpea (Vigna unquiculata L. Walp) grown in an adverse temperature regime. Journal of Experimental Botany 31, 1327-1345.
Minchin, F.R., Witty, J.F., 2005. Respiratory/carbon costs of symbiotic nitrogen fixation in legumes. In: Lambers, H., Ribas-Carbo, M., (Eds.) Plant Respiration.

References
106
Springer, Dordrecht pp. 195-205.
Mondal, M.H., Brun, W.A. and Brenner, M.L. (1978) Effects of sink removal on photosynthesis and senescence in leaves of soybean (Glycine max L.) plants. Plant
Physiology 61, 394-397.
Moore, B.D., Cheng, S.-H., Sims, D., Seemann, J.R., 1999. The biochemical and molecular basis for photosynthetic acclimation to elevated CO2. Plant, Cell & Environment 22, 567-582.
Mortimer, P.E., Pérez-Fernández, M.A., Valentine, A.J., 2008. The role of arbuscular mycorrhizal colonization in the carbon and nutrient economy of the tripartite symbiosis with nodulated Phaseolus vulgaris. Soil Biology & Biochemistry 40, 1019-1027.
Mozafar, A., Anken, T., Ruh, R., Frossard, E. 2000. Tillage intensity, mycorrhizal and nonmycorrhizal fungi, and nutrient concentrations in maize, wheat, and canola. Agronomy Journal. 92, 1117-1124.
Nelson, D.L., Cox, M.M., 2004. Lehninger: Principles of Biochemistry Ed. 4 Freeman, New York.
Neo, H.H., Layzell, D.B., 1997. Phloem glutamine and the regulation of O2 diffusion in legume nodules. Plant Physiology 113, 259-267.
Neves, M.C.P., Didonet, A.D., Duque, F.F., Döbereiner, J., 1985. Rhizobium strain effects on nitrogen transport and distribution in soybeans. Journal of Experimental Botany 36, 1179-1192.
Nielsen, K., Bouma, T.J., Lynch, J.P., Eissenstat, D.M., 1998. Effects of phosphorus availability and vesicular-arbuscular mycorrhizas on the carbon budget of common bean (Phaseolus vulgaris). New Phytologist 139, 647-656.
Ohyama, T., Kumazawa, K., 1978. Incorporation of 15N into various nitrogenous compounds in intact soybean nodules after exposure to 15N2 gas. Soil Science & Plant Nutrition 24, 525-533.
Olsson, P.A., Burleigh, S.H., van Aarle, I,M., 2005. The influence of external nitrogen on carbon allocation to Glomus intraradices in monoxenic arbuscular mycorrhiza. New Phytologist 168, 677-686.
Olsson, P.A., Johansen, A., 2000. Lipid and fatty acid composition of hyphae and spores of arbuscular mycorrhizal fungi at different growth stages. Mycological Research 104, 429-434.
References
107
Olsson, P.A., van Aarle, I.M., Allaway, W.G., Ashford, A.E., Rouhier, H., 2002. Phosphorus effects on metabolic processes in monoxenic arbuscular mycorrhiza cultures. Plant Physiology 130, 1162-1171.
Ono, K., Nishi, Y., Watanabe, A., Terashima, I., 2001. Possible mechanisms of adaptative leaf senescence. Plant Biology 3, 234-243.
Ono, K., Terashima, I., Watanabe, A., 1996. Interaction between nitrogen deficit of a plant and nitrogen content in the old leaves. Plant and Cell Physiology 37, 1083-1089.
Ostonen, I., Püttsepp, Ü., Biel, C., Alberton, O., Bakker, M.R., Lõhmus, K., Majdi, H., Metcalfe, D., Olsthoorn, A.F.M., Pronk, A., Vanguelova, E., Weih, M., Brunner, I., 2007. Specific root length as an indicator of environmental change. Plant Biosystems 141, 426-442.
Oya, T., Nepumoceno, A.L., Neumaier, N., Farias, J.R.B., Tobita, S., Ito, O., 2004. Drought tolerance characteristics of Brazilian soybean cultivars – evaluation and characterization of drought tolerance of various Brazilian soybean cultivars in the field. Plant Production Science 7, 129-137.
Pacovsky, R.S., Fuller, G., 1988. Mineral and lipid composition of Glycine-Glomus-
Bradyrhizobium symbioses. Physiologia Plantarum 72, 733-746.
Pammenter, N.W., Loreto, F., Sharkey, T.D., 1993. End product feedback effects on photosynthetic electron transport. Photosynthesis Research 35, 5-14.
Pang, P.C., Paul, E.A., 1980. Effects of vesicular-arbuscular mycorrhiza on 14C and 15N distribution in nodulated fababeans. Canadian Journal of Soil Science 60, 241-250.
Parniske, M., 2008. Arbuscular mycorrhiza: the mother of plant root endosymbioses. Nature Reviews 6, 763-775.
Parsons, R., Stanforth, A., Raven, J.A., Sprent, J.I., 1993. Nodule growth and activity may be regulated by a feedback mechanism involving phloem nitrogen. Plant Cell & Environment 16, 125-136.
Pate, J.S., 1980. Transport and partitioning of nitrogenous solutes. Annual Review of Plant Physiology 31, 313-340.
Pate, J.S., Atkins, C.A., 1983. Nitrogen uptake, transport, and utilization. In: Broughton, W.J. (Ed.) Nitrogen Fixation Volume 3: Legumes. New York: Oxford University Press, pp. 245-298.
References
108
Pate, J.S., Layzell, D.B., Atkins, C.A., 1979. Economy of carbon and nitrogen in a nodulated and nonnodulated (NO3-grown) legume. Plant Physiology 64, 1083-1088.
Patterson, T.G., LaRue, T.A., 1983. Root respiration associated with nitrogenase activity (C2H2) of soybean, and a comparison of estimates. Plant Physiology 72, 701-705.
Paul, E.A., Kucey, R.M.N., 1981. Carbon flow in plant microbial associations. Science 213, 473-474.
Paul, M.J., Foyer, C.H., 2001. Sink regulation of photosynthesis. Journal of Experimental Botany 52, 1383-1400.
Paul, M.J., Peliny, T.K., 2003. Carbon metabolite feedback regulation of leaf photosynthesis and development. Journal of Experimental Botany 54, 539-547.
Peng, S., Eissenstat, D.M., Graham, J.H., Williams, K., Hodge, N.C., 1993. Growth depression in mycorrhizal citrus at high-phosphorus supply. Plant Physiology 101, 1063-1071.
Penning de Vries, F.W.T., Brunsting, A.H.M., van Laar, H.H., 1974. Products, requirements and efficiency of biosynthesis: a quantitative approach. Journal of Theoretical Biology 45, 339-377.
Phillips, D.A., 1980. Efficiency of symbiotic nitrogen fixation in legumes. Annual Review of Plant Physiology 31, 29-49.
Pieters, A.J., Paul, M.J., Lawlor, D.W., 2001. Low sink demand limits photosynthesis under Pi deficiency. Journal of Experimental Botany 52, 1083-1091.
Polayes, D.A., Schubert, K.R., 1984. Purine synthesis and catabolism in soybean seedlings. The biogenesis of ureides. Plant Physiology 75, 1104-1110.
Rachmilevitch, S., Cousins, A.B., Bloom, A.J., 2004. Nitrate assimilation in plant shoots depends on photorespiration. The Proceedings of the National Academy of Sciences of the United States of America 101, 11506-11510.
Rao, A.S., Luthra, Y.P., Sheoran, I.S., Singh, R., 1984. Partioning of carbon and nitrogen during growth and development of pigeonpea (Cajanus cajan L.). Journal of Experimental Botany 35, 774-784.
Ratner, E.I., Lobel, R., Feldhay, H., Hartzook, A., 1979. Some characteristics of symbiotic nitrogen fixation, yield, protein and oil accumulation in irrigated peanuts (Arachis hypogaea L.). Plant and Soil 51, 373-386.

References
109
Robertson, M.J.; Carberry, P.S.; Huth, N.I.; Turpin, J.E.; Probert, M.E., Poulton P.L., 2002. Simulation of growth and development of diverse legume species in APSIM. Australian Journal of Agricultural Research 53, 429-446.
Rogers, A., Gibon, Y., Stitt, M., Morgan, P.B., Bernacchi, C.J., Ort, D.R., 2006. Long, S.P.2006. Increased C availability at elevated carbon dioxide concentration improves N assimilation in a legume. Plant, Cell & Environment 29, 1651-1658
Rosenberg, M.S., Adams, D.C., Gurevitch, J., 2000. MetaWin: Statistical Software for Meta-Analysis. Version 2. Sunderland, MA, USA: Sinauer Associates.
Ross, J.P. 1971. Effect of phosphate fertilization on yield of mycorrhizal and nomycorrhizal soybeans. Phytopathology 61, 1400-1403.
Ross, J.P., Harper, J.A., 1970. Effect of endogone mycorrhiza on soybean yields. Phytopathology 60, 1552-1556.
Rychter, A.M., Rao, I.M., 2005. Role of phosphorus in photosynthetic carbon metabolism. In: Pessarakli, M., (Ed) Handbook of photosynthesis Taylor & Francis Group, LLC, Tucson, pp. 123-148.
Ryle, G.J.A., Arnott, R.A., Powell, C.E., Gordon, A.J., 1984. N2 fixation and the respiratory costs of nodules, nitrogenase activity, and nodule growth and maintenance in Fiskeby soyabean. Journal of Experimental Botany 35, 1156-1165.
Ryle, G.J.A., Powell, C.E., Gordon, A.J., 1979a. The respiratory costs of nitrogen fixation in soyabean, cowpea, and white clover. II. Comparisons of the cost of nitrogen fixation and the utilization of combined nitrogen. Journal of Experimental Botany 30, 145-153.
Ryle, G.J.A., Powell, C.E., Gordon, A.J., 1979b. The respiratory costs of nitrogen fixation in soyabean, cowpea, and white clover. I. Nitrogen fixation and the respiration of the nodulated root. Journal of Experimental Botany 30, 135-144.
Salvagiotti, F., Cassman, K.G., Specht, J.E., Walters, D.T., Weiss, A., Dobermann, A., 2008. Nitrogen uptake, fixation and response to fertilizer N in soybeans: a review. Field Crops Research, 108, 1-13.
Sanders, F.E., Tinker, P.B., Black, R.L.B., Palmerley, S.M., 1977. The development of endomycorrhizal root systems. I. Spread of infection and growth-promoting effects with four species of vesicular-arbuscular endophyte. New Phytologist 78, 257-268.
Sawada, S., Usuda, H., Tsukui, T., 1992. Participation of inorganic orthophosphate in regulation of ribulose-1,5-biphosphate carboxylase activity in response to changes in the photosynthetic source-sink balance. Plant and Cell Physiology 33, 943-949.
References
110
Schulze, J., 2004. How are nitrogen fixation rates regulated in legumes? Journal of Plant Nutrition and Soil Science 167, 125-137.
Senaratne, R., Ratnasinghe, D.S., 1993. Ontogenic variation in nitrogen-fixation and accumulation of nitrogen in mungbean, blackgram, cowpea, and groundnut. Biology and Fertitily of Soils 16, 125-130.
Sharkey, T.D., 1985. Photosynthesis in intact leaves of C3 plants: physics, physiology and rate limitations. Botanical Review 51: 53-105.
Sharkey, T.D., Bernarcchi, C. J., Farquhar, G.D., Singsaas, E.I., 2007. Fitting photosynthetic carbon dioxide response curves for C3 leaves. Plant, Cell and Environment 30, 1035-1040.
Sharkey, T.D., Berry, J.A. and Sage, R.F., 1988. Regulation of photosynthetic electron-transport in Phaseolus vulgaris L., as determined by room-temperature chlorophyll a fluorescence. Planta 176: 415-424.
Sharma-Natu, P., Ghildiyal, M.C., 2005. Potential targets for improving photosynthesis and crop yield. Current Science 88, 1918-1928.
Sinclair, T.R., de Wit, C.T., 1975. Photosynthate and nitrogen requirements for seed production by various crops. Science 189, 565-567.
Sinclair, T.R., Neumaier, N., Farias, J.R.B., Nepomuceno, A.L., 2005. Comparison of vegetative development in soybean cultivars for low-latitude environments. Field Crops Research 92, 53-59.
Sivaprasad, P., Rai, P.V., 1985. Photosynthesis and competition for photosynthate in VA mycorrhiza, Rhizobium and Cajanus cajan symbiosis. Current Science 54, 468-469.
Skøt L., Hirsch, P.R., Witty, J.F., 1986. Genetic factors in Rhizobium affecting the symbiotic carbon costs of N2 fixation and host plant biomass production. Journal of Applied Bacteriology. 61, 239-246.
Smith F.A., Grace, E.J., Smith, S.E., 2009. More than a carbon economy: nutrient trade and ecological sustainability in facultative arbuscular mycorrhizal symbioses. New Phytologist 182, 347-358.
Smith, S.E., Read, D.J., 2008. Mycorrhizal Symbiosis. 3 edn. Elsevier Ltd., London.
Smith, S.E., Smith, F. A., Jakobsen, I., 2004. Functional diversity in arbuscular mycorrhizal (AM) symbioses: the contribution of the mycorrhizal P uptake pathway is not correlated with mycorrhizal responses in growth or total P uptake.
References
111
New Phytologist. 162, 511-524.
Smith, S.E., Smith, F.A., Jakobsen, I., 2003. Mycorrhizal fungi can dominate phosphate supply to plants irrespective of growth responses. Plant Physiology 133, 16-20.
Solaiman, M.Z., Ezawa, T., Kojima, T., Saito, M., 1999. Polyphosphates in intraradical and extraradical hyphae of an arbuscular mycorrhizal fungus, Gigaspora margarita. Applied and Environmental Microbiology 65, 5604-5606.
Stitt, M., 1986. Limitation of photosynthesis by carbon metabolism. I. Evidence for excess electron transport capacity in leaves carrying out photosynthesis in saturating light and CO2. Plant Physiology 81, 1115-1122.
Stitt, M., Krapp, A., 1999. The interaction between elevated carbon dioxide and nitrogen nutrition: the physiological and molecular background. Plant, Cell and Environment 22, 583-621.
Streeter, J.G., 1972. Nitrogen nutrition of field-grown soybean plants. I. Seasonal variation in soil nitrogen and nitrogen composition of stem exudate. Agronomy Journal 64, 311-314.
Treseder K.K., Allen, M.F., 2002 Direct nitrogen and phosphorus limitation of arbuscular mycorrhizal fungi: a model and field test. New Phytologist 155, 507-515.
Twary S.N., Heichel, G.H. 1991. Carbon costs of dinitrogen fixation associated with dry matter accumulation in alfafa. Crop Science 31, 985-992.
Valentine, A.J., Kleinert, A., 2007. Respiratory responses of arbuscular mycorrhizal roots to short-term alleviation of P deficiency. Mycorrhiza 17, 137-143.
van Berkum, P., Sloger, C., Weber, D.F., Cregan, P.B., Keyser, H.H., 1985. Relationship between ureide N and N2 fixation, aboveground N accumulation, acetylene reduction, and nodule mass in greenhouse and field studies with Glycine
max L (Merr.). Plant Physiology 77, 53-58.
van Kessel, C., Hartley, C., 2000. Agricultural management of grain legumes: has it led to an increase in nitrogen fixation? Field Crops Research 65, 165-181.
Vance, C.P., Heichel, G.H., 1991 Carbon in N2 fixation: limitation or exquisite adaptation. Annual Review of Plant Physiology and Plant Molecular Biology 42, 373-392.
Vincent, J.M., 1970. A Manual for the Practical Study of Root-Nodule Bacteria,
References
112
Blackwell Scientific, Oxford (IBP Handbook, 15).
Vogels, G.D., van der Drift, C., 1970. Differential analysis of glycolate derivatives. Analytical Biochemistry 33, 143-157.
Voisin, A.S., Salon, C., Jeudy, C., Warembourg, F.R., 2003. Symbiotic N2 fixation activity in relation to C economy of Pisum sativum L. as a function of plant phenology. Journal of Experimental Botany 54, 2733-2744.
von Caemmerer, S., 2000. Biochemical Models of Leaf Photosynthesis. Collingwood, CSIRO Publishing.
Warembourg, F.R., 1983. Estimating the true cost of dinitrogen fixation by nodulated plants in undisturbed conditions. Canadian Journal of Microbiology 29, 930-937.
Warembourg, F.R., Fernandez, M.P., 1985. Distribution and remobilization of symbiotically fixed nitrogen in soybean (Glycine max). Physiologia Plantarum 65, 281-286.
Watanabe, F.D., Evans, J.R., Chow, W.S., 1994. Changes in the photosynthetic properties of Australian wheat cultivars over the last century. Australian Journal of Plant Physiology 21, 169-183.
Wild, A., 1988. Russel’s Soil Conditions & Plant Growth. 11 edn. Wiley, New York
Wittenbach, V.A., 1982. Effect of pod removal on leaf senescence in soybeans. Plant Physiology 70, 1544-1548.
Wittenbach, V.A., 1983. Effect of pod removal on leaf photosynthesis and soluble protein composition of field-grown soybeans. Plant Physiology 73, 121-124.
Witty, J.F., Minchin, F.R., Sheehy, J.E., 1983. Carbon costs of nitrogenase activity in legume root nodules determined using acetylene and oxygen. Journal of Experimental Botany 34, 951-963.
Wright, D.P., Read, D.J., Scholes, J.D., 1998a. Mycorrhizal sink strength influences whole plant carbon balance of Trifolium repens L. Plant Cell & Environment 21, 881-891.
Wright, D.P., Scholes, J.D., Read, D.J., 1998b. Effects of VA mycorrhizal colonization on photosynthesis and biomass production of Trifolium repens L. Plant Cell & Environment 21, 209-216.
Wright, S.F., Franke-Snyder, M., Morton, J.B., Upadhyaya, A., 1996. Time-course study and partial characterization of a protein on hyphae of arbuscular mycorrhizal fungi during active colonization of roots. Plant and Soil 181, 193-203.
References
113
Xavier, L.J.C., Germida, J.J., 2002. Response of lentil under controlled conditions to co-inoculation with arbuscular mycorrhizal fungi and rhizobia varying in efficacy. Soil Biology & Biochemistry 34, 181-188.
Xavier, L.J.C., Germida, J.J., 2003. Selective interactions between arbuscular mycorrhizal fungi and Rhizobium leguminosarum bv. viceae enhance pea yield and nutrition. Biology and Fertility of Soils 37, 161-167.
Xu, D.-Q., Gifford, R.M., Chow, W.S., 1994. Photosynthetic acclimation in pea and soybean to high atmospheric CO2 partial pressure. Plant Physiology 106, 661-671.
Yin, X. van Oijen, M., Schapendonk, A.H.C.M., 2004. Extension of a biochemical model for the generalized stoichiometry of electron transport limited C3 photosynthesis. Plant, Cell & Environment 27, 1211-1222.
Yin, X., Harbinson, J. and Struik, P.C., 2006. Mathematical review of literature to assess alternative electron transports and interphotosystem excitation partitioning of steady-state C3 photosynthesis under limiting light. Plant, Cell & Environment 29, 1771-1782 (with corrigendum in Plant, Cell & Environment 29, 2252).
Yin, X., Struik, P.C., Romero, P., Harbinson, J. Evers, J.B., van der Putten, P.E.L. and Vos, J., 2009. Using combined measurements of gas exchange and chlorophyll fluorescence to estimate parameters of a biochemical C3 photosynthesis model: A critical appraisal and an integrated approach applied to leaves in a wheat (Triticum
aestivum) canopy. Plant, Cell & Environment 32, 448-464.
Yin, X., van Laar, H.H., 2005. Crop Systems Dynamics – An Ecophysiological Simulation Model for Genotype-by-environment Interaction. Wageningen Academic Publishers, Wageningen.
Zapata, F., Danso, S.K.A., Hardarson, G., Fried, M., 1987. Time course of nitrogen fixation in field-grown soybean using nitrogen-15 methodology. Agronomy Journal 79, 172-176.
Zhou, X.J., Liang, Y., Chen, H., Shen, S.H., Jing Y.X., 2006. Effects of rhizobia inoculation and nitrogen fertilization on photosynthetic physiology of soybean. Photosynthetica 44, 530-535.
References
114
Additional References on Figure 1.4.
Aguilera-Gomez, L., Davies Jr, F.T., Olalde-Portugal, V., Duray, S.A., Phavaphutanon, L., 1999. Influence of phosphorus and endomycorrhiza (Glomus
intraradices) on gas exchange and plant growth of chile ancho pepper (Capsicum
annuum L. cv. San Luis). Photosynthetica 36, 441-449.
Allen, M.F., Smith, W.K., Moore Jr., T.S., Christensen, M., 1981. Comparative water relations and photosynthesis of mycorrhizal and non-mycorrhizal Bouteloua
gracilis H.B.K. lag ex Steud. New Phytologist 88, 683-693.
Amerian, M.R., Stewart, W.S., Griffiths, H., 2001. Effect of two species of arbuscular mycorrhizal fungi on growth, assimilation and leaf water relations in maize (Zea
mays ). Aspects of Applied Biology 63, 1-6.
Azcón, R., Gomez, M., Tobar, R., 1992. Effects of nitrogen source on growth, nutrition, photosynthetic rate and nitrogen metabolism of mycorrhizal and phosphorus-fertilized plants of Lactuca sativa L. New Phytologist 121, 227-234.
Bandara, D.C., Nobuyasu, H., Ofosu-Budu, K.G., Ando, T., Fujita, K., 1998. Effect of CO2 enrichment on biomass production, photosynthesis, and sink acitivity in soybean cv. Bragg and its supernodulating mutant nts 1007. Soil Science and Plant Nutrition 44, 179-186.
Black, K.G., Mitchell, D.T., Osborne, B.A., 2000. Effect of mycorrhizal-enhanced leaf phosphate status on carbon partitioning, translocation and photosynthesis in cucumber. Plant Cell & Environment 23, 797-809.
Brown, M.S., Bethlenfalvay, G.J., 1987. The Glycine-Glomus-Rhizobium symbiosis. IV. Photosynthesis in nodulated, mycorrhizal, or N- and P-fertilized soybean plants. Plant Physiology 85, 120-123.
Cartmill, A.D., Valdez-Aguilar, L.A., Bryan, D.L., Alarcón, A., 2008. Arbuscular mycorrhizal fungi enhance tolerance of vinca to high alkalinity in irrigation water. Scientia Horticulturae 115, 275-284.
de Veau, E.J., Robinson, J.M., Warmbrodt, R.D., van Berkum, P., 1990. Photosynthesis and photosynthate partitioning in N2-fixing soybeans. Plant Physiology 94, 259-267.
Eissenstat, D.M., Graham, J.H., Syvertsen, J.P., Drouillard, D.L., 1993. Carbon economy of sour orange in relation to mycorrhizal colonization and phosphorus status. Annals of Botany 71, 1-10.
References
115
Estrada-Luna, A.A., Davies Jr, F.T., Egilla, J.N., 2000. Mycorrhizal fungi enhancement of growth and gas exchange of micropropagated guava plantlets (Psidium guajava L.) during ex vitro acclimatization and plant establishment. Mycorrhiza 10, 1-8.
Fay, P., Mitchell, D.T., Osborne, B.A., 1996. Photosynthesis and nutrient-use efficiency of barley in response to low arbuscular mycorrhizal colonization and addition of phosphorus. New Phytologist 132, 425-433.
Fredeen, A.L., Terry, N., 1988. Influence of vesicular – arbuscular mycorrhizal infection and soil phosphorus level on growth and metabolism of soybean. Canadian Journal of Botany 66, 2311-2316.
Gavito, M.E., Bruhn, D., Jakobsen, I., 2002. Phosphorus uptake by arbuscular mycorrhizal hyphae does not increase when the host plant grows under atmospheric CO2 enrichment. New Phytologist 154, 751-760.
Geneva, M., Zehirov, G., Djonova, E., Kaloyanova, N., Georgiev, G., Stancheva, I., 2006. The effect of inoculation of pea plants with mycorrhizal fungi and Rhizobium on nitrogen and phosphorus assimilation. Plant Soil and Environment 52, 435-440.
Goicocchea, N., Antolín, M.C., Sánchez-Díaz, M., 1997. Gas exchange is related to the hormone balance in mycorrhizal or nitrogen-fixing alfalfa subjected to drought. Physiologia Plantarum 100, 989-997.
Harris, D., Pacovsky, R.S., Paul, E.A., 1985. Carbon economy of soybean-Rhizobium-
Glomus associations. New Phytologist 101, 427-440.
Huang, L.L., Yang, C., Zhao, Y., Xu, X., Xu, Q., Li, G.Z., Cao, J., Herbert, S.J., Hao, L., 2008. Antioxidant defenses of mycorrhizal fungus infection against SO2-induced oxidative stress in Avena nuda seedlings. Bulletin of Environmental Contamination and Toxicology 81, 440-444.
Jia, Y., Gray, V.M., 2008. Growth yield of Vicia faba L in response to microbial symbiotic associations. South African Journal of Botany 74, 25-32.
Jia, Y., Gray, V.M., Straker, C.J., 2004. The influence of Rhizobium and arbuscular mycorrhizal fungi on nitrogen and phosphorus accumulation by Vicia faba. Annals of Botany 94, 251-258.
Jifon, J.L., Graham, J.H., Drouillard, D.L., Syvertsen, J.P., 2002. Growth depression of mycorrhizal Citrus seedlings grown at high phosphorus supply is mitigated by elevated CO2. New Phytologist 153, 133-142.
Johnson, C.R., 1984. Phosphorus nutrition on mycorrhizal colonization,
References
116
photosynthesis, growth and nutrient composition of Citrus aurantium. Plant and Soil 80, 35-42.
Kaschuk, G., Hungria, M., Leffelaar, P.A., Giller, K.E., Kuyper, T.W., 2009. Differences in photosynthetic behaviour and leaf senescence of soybean (Glycine
max L. Merrill) relying on N2 fixation or supplied with nitrate. Plant Biology DOI: 10.1111/j.1438-8677.2009.00211.x
Kucey, R.M.N., Paul, E.A., 1982b. Carbon flow, photosynthesis, and N2 fixation in mycorrhizal and nodulated faba beans (Vicia faba L.). Soil Biology & Biochemistry 14, 407-412.
Lippi, D., de Paolis, M.R., Osmi, M., Pietrini, F., Pietrosanti, T., Villani, M.C., Massacci, A., 1999. Effect of Rhizobium sp. inoculation on N2-fixing and photosynthetic activities of two cowpea [Vigna unguiculata (L.) Walp.] genotypes. Photosynthetica 37, 413-422.
Louche-Tessandier, D., Samson, G., Hernández-Sebastià, C., Chagvardieff, P., Desjardins, Y., 1999. Importance of light and CO2 on the effects of endomycorrhizal colonization on growth and photosynthesis of potato plantlets (Solanum tuberosum) in an in vitro tripartite system. New Phytologist 142, 539-550.
Maekawa, T., Kokubun, M., 2005. Correlation of leaf nitrogen, chlorophyll and rubisco contents with photosynthesis in a supernodulating soybean genotype Sakukei 4. Plant Production Science 8, 419-426.
Maekawa, T., Takahashi, M., Kokubun, M., 2003. Responses of a supernodulating soybean genotype, Sakukei 4 to nitrogen fertilizer. Plant Production Science 6, 206-212.
Mortimer, P.E., Pérez-Fernández, M.A., Valentine, A.J., 2008. The role of arbuscular mycorrhizal colonization in the carbon and nutrient economy of the tripartite symbiosis with nodulated Phaseolus vulgaris. Soil Biology & Biochemistry 40, 1019-1027.
Nemec, S., Vu, J.C.V., 1990. Effects of soil phosphorus and Glomus intraradices on growth nonstructural carbohydrates, and photosynthetic activity of Citrus
aurantium. Plant and Soil 128, 257-263.
Nielsen, K., Bouma, T.J., Lynch, J.P., Eissenstat, D.M., 1998. Effects of phosphorus availability and vesicular-arbuscular mycorrhizas on the carbon budget of common bean (Phaseolus vulgaris). New Phytologist 139, 647-656.
References
117
Parádi, I., Bratek, Z., Láng, F., 2003. Influence of arbuscular mycorrhiza and phosphorus supply on polyamine content, growth and photosynthesis of Plantago
lanceolata. Biologia Plantarum 46, 563-569.
Paul, E.A., Kucey, R.M.N., 1981. Carbon flow in plant microbial associations. Science 213, 473-474.
Pearson, J.N., Jakobsen, I., 1993. Symbiotic exchange of carbon and phosphorus between cucumber and three arbuscular mycorrhizal fungi. New Phytologist 124, 481-488.
Peng, S., Eissenstat, D.M., Graham, J.H., Williams, K., Hodge, N.C., 1993. Growth depression in mycorrhizal citrus at high-phosphorus supply. Plant Physiology 101, 1063-1071.
Rapparini, F., Lusià, J., Peñuelas, J., 2008. Effect of arbuscular mycorrhizal (AM) colonization on terpene emission and content of Artemisia annua L. Plant Biology 10, 108-122.
Ruiz-Lozano, J.M., Azcón, R., 1995. Hyphal contribution to water uptake in mycorrhizal plants as affected by the fungal species and water status. Physiologia plantarum 95, 472-478.
Ruiz-Lozano, J.M., Azcon, R., Gomez, M., 1995. Effects of arbuscular-mycorrhizal Glomus species on drought tolerance: physiological and nutritional plant responses. Applied and Environmental Microbiology 61, 456-460.
Sánchez-Díaz, M., Pardo, M.A., Peña, J., Aguirreolea, J., 1990. Effect of water stress on photosynthetic activity in the Medicago-Rhizobium-Glomus symbiosis Plant Science 71, 215-221.
Sheng, M., Tang, M., Chen, H., Yang, B., Zhang, F., Huang, Y., 2008. Influence of arbuscular mycorrhizae on photosynthesis and water status of maize plants under salt stress. Mycorrhiza 18, 287-296.
Shrestha, Y.H., Ishii, T., Kadoya, K., 1995. Effect of vesicular-arbuscular mycorrhizal fungi on the growth, photosynthesis, transpiration and the distribution of photosynthates of bearing Satsuma mandarin trees. Journal of the Japanese Society for Horticultural Science 64, 517-525.
Sivaprasad, P., Rai, P.V., 1985. Photosynthesis and competition for photosynthate in VA mycorrhiza, Rhizobium and Cajanus cajan symbiosis. Current Science 54, 468-469.
Snellgrove, R.C., Splittstoesser, W.E., Stribley, D.P., Tinker, P.B., 1982. The
References
118
distribution of carbon and the demand of the fungal symbiont in leek plants with vesicular-arbuscular mycorrhizas. New Phytologist 92, 75-87.
Syvertsen, J.P., Graham, J.H., 1990. Influence of vesicular arbuscular mycorrhizae and leaf age on net gas exchange of Citrus leaves. Plant Physiology 94, 1424-1428.
Valentine, A.J., Osborne, B.A., Mitchell, D.T., 2001. Interactions between phosphorus supply and total nutrient availability on mycorrhizal colonization, growth and photosynthesis of cucumber. Scientia Horticulturae 88, 177-189.
Valentine, A.J., Osborne, B.A., Mitchell, D.T., 2002. Form of inorganic nitrogen influences mycorrhizal colonization and photosynthesis of cucumber. Scientia Horticulturae 92, 229-239.
Wallace, L.L., 1981. Growth, morphology and gas exchange of mycorrhizal and nonmycorrhizal Panicum coloratum L., a C4 grass species, under different clipping and fertilization regimes. Oecologia, 49, 272-278.
Wang, G. M., Coleman, D.C., Freckman, D.W., Dyer, M.I., McNaughton, S.J., Acra, M.A., Goeschl, J.D., 1989. Carbon partitioning patterns of mycorrhizal versus non-mycorrhizal plants: real-time dynamic measurements using 11CO2. New Phytologist 112, 489-493.
Wright, D.P., Read, D.J., Scholes, J.D., 1998. Mycorrhizal sink strength influences whole plant carbon balance of Trifolium repens L. Plant Cell and Environment 21, 881-891.
Wu, Q.-S., Xia, R.-X., 2006. Arbuscular mycorrhizal fungi influence growth, osmotic adjustment and photosynthesis of citrus under well-watered and water stress conditions, Journal of Plant Physiology 163, 417-425.
Zhou, X.-J., Liang, Y., Chen, H., Shen, S.-H., Jing, Y.-X., 2006. Effects of rhizobia inoculation and nitrogen fertilization on photosynthetic physiology of soybean. Photosynthetica 44, 530-535.
References
119
Additional References on Table 5.1.
Alagawadi, A.R., Gaur, A.C., 1988. Associative effect of Rhizobium and phosphate-solubilizing bacteria on the yield and nutrient uptake of chickpea. Plant and Soil 105, 241-246.
Albayrak, S., Sevimay, C.S., Çöçü, S., 2006. Effect of Rhizobium inoculation on forage and seed yield and yield components of common vetch (Vicia sativa L.) under rainfed conditions. Acta Agriculturae Scandinavica Section B-Soil and Plant Science 56, 235-240.
Ali, H., Khan, M.A., Randhawa, S.A., 2004. Interactive effect of seed inoculation and phosphorus application on growth and yield of chickpea (Cicer arietinum L.). International Journal of Agriculture and Biology 6, 110-112.
Ali, M.E., Khanam, D., Bhuiyan, M.A.H, Khatun, M.R., Talukder, M.R., 2008. Effect of Rhizobium inoculation to different varieties of gardenpea (Pisum sativum L.). Journal of Soil and Nature 2, 30-33.
Anandham, R., Sridar, R., Nalayini, P., Poonguzhali, S., Madhaiyan, M., Sa, T., 2007. Potential for plant growth promotion in groundnut (Arachis hypogaea L.) cv. ALR-2 by co-inoculation of sulfur-oxidizing bacteria and Rhizobium. Microbiological Research 162, 139-153.
Ashraf, M., Ahmad, M., Bakush, H.M., 2006. Efficacy of Rhizobium strains for groundnut inoculation under rain fed conditions. Pakistan Journal of Agricultural Sciences 43, 122-125.
Ashraf, M., Mueen-Ud-Din, M., Warraich, N.H., 2003. Production efficiency of mungbean (Vigna radiata L.) as affected by seed inoculation and NPK application. International Journal of Agriculture and Biology 5, 179-180.
Aslam, M., Mahmood, I.A., Sultan, T., Ahmad, S., Zahid, M.A., 2000. Growth and yield response of chickpea (Cicer arientinum) to various Rhizobium strains fertilized with different phosphorus levels. International Journal of Agriculture and Biology 2, 89-91.
Bard El-Din, S.M.S., Moawad, H., 1988. Enhancement of nitrogen fixation in lentil, faba bean, and soybean by dual inoculation with Rhizobia and mycorrhizae. Plant and Soil 108, 117-124.
Bhuiyan, M.A.H., Mian, M.H., Islam, M.S., 2008. Studies on the effects of Bradyrhizobium inoculation on yield and yield attributes of mungbean. Bangladesh

References
120
Journal of Agricultural Research 33, 449-457.
Carling, D.E., Brown, M.F., 1980. Relative effect of vesicular-arbuscular mycorrhizal fungi on the growth and yield of soybeans. Soil Science Society of America Journal 44, 528-532.
Clayton, G.W., Rice, W.A., Lupwayi, N.Z., Johnston, A.M., Lafond, G.P., Grant, C.A., Walley, F., 2004. Inoculant formulation and fertilizer nitrogen effects on field pea: Crop yield and seed quality. Canadian Journal of Plant Science 84, 89-96.
Elkoca, E., Kantar, F., Sahin, F., 2008. Influence of nitrogen fixing and phosphorus solubilizing bacteria on the nodulation, plant growth, and yield of chickpea. Journal of Plant Nutrition 31, 157-171.
Erman, M., Yildirim, B., Togay, N., Cig, F., 2009. Effect of phosphorus application and Rhizobium inoculation on the yield, nodulation and nutrient uptake in field pea (Pisum sativum sp. arvense L.). Journal of Animal and Veterinary Advances 8, 301-304.
Ganry, F., Diem, H.G., Dommergues, Y.R., 1982. Effect of inoculation with Glomus
mosseae on nitrogen fixation by field grown soybeans. Plant and Soil 68, 321-329.
Ganry, F., Diem, H.G., Wey, J., Dommergues, Y.R., 1985. Inoculation with Glomus
mosseae improves N2 fixation by field-grown soybeans. Biology and Fertility of Soils 1, 15-23.
Green, S.K., Deng, T.C., 1985. Effect of the endomycorrhizal fungus Glomus mosseae on soybean mosaic virus in soybean. Plant Protection Bulletin 27, 353-358.
Hashem, F.M., Angle, J.S., 1990. Rhizobiophage effects on nodulation, nitrogen fixation, and yield of field-grown soybeans (Glycine max L. Merr.). Biology and Fertility of Soils 9, 330-334.
Hunt, P.G., Wollum, A.G., Matheny, T.A., 1981. Effects of soil water on Rhizobium
japonicum infection, nitrogen accumulation, and yield in bragg soybeans. Agronomy Journal 73, 501-505.
Ilbas, A.I., Sahin, S., 2005. Glomus fasciculatum inoculation improves soybean production. Acta Agriculturae Scandinavica Section B-Soil and Plant Science 55, 287-292.
Jakobsen, I., 1987. Effects of VA mycorrhiza on yield and harvest index of field-grown pea. Plant and Soil 98, 407-415.
References
121
Jalaluddin, M., 2005. Effect of inoculation with VAM-fungi and Bradyrhizobium on growth and yield of soybean in Sindh. Pakistan Journal of Botany 37, 169-173.
Kantar, F., Elkoca, E., Öğütcü, H., Algur, Ö.F., 2003. Chickpea yields in relation to Rhizobium inoculation from wild chickpea at high altitudes. Journal of Agronomy and Crop Science 189, 291-297.
Karasu, A., Öz, M., Doğan, R., 2009. The effect of bacterial inoculation and different nitrogen doses on yield and yield components of some chickpea genotypes (Cicer
arietinum L.). African Journal of Biotechnology 9, 59-64.
Kaur, S., Singh, O.S., 1988. Response of ricebean to single and combined inoculation with Rhizobium and Glomus in a P-deficient sterilized soil. Plant and Soil 112, 293-298.
Kristek, S., Kristek, A., Pavlovic, H., 2005. The influence of mycorrhizal fungi (Glomus sp.) on field pea plant survival and growth in drought caused stress conditions. Plant, Soil and Environment 51, 385-389.
Kubota, A., Hoshiba, K., Bordon, J., 2008. Effect of fertilizer-N application and seed coating with rhizobial inoculants on soybean yield in eastern Paraguay. Revista Brasileira de Ciência do Solo 32, 1627-1633.
Malik, M.A., Cheema, M.A., Khan, H.Z., Wahid, M.A., 2006. Growth and yield response of soybean (Glycine max L.) to seed inoculation and varying phosphorus levels. Journal of Agricultural Research 44, 47-53.
Mehana, T.A., Wahid, O.A.A., 2002. Associative effect of phosphate dissolving fungi, Rhizobium and phosphate fertilizer on some soil properties, yield components and phosphorus and nitrogen concentration and uptake by Vicia faba L. under field conditions. Pakistan Journal of Biological Sciences 5, 1226-1231.
Nasim, G., Bajwa, R., Hakeem, A., 2007. Response of arbuscular mycorrhizal fungi and Bradyrhizobium japonicum to air pollution stress in soybean. Journal of Agricultural and Biological Science 2, 23-46.
Ndakidemi, P.A., Dakora, F.D., Nkonya, E.M., Ringo, D., Mansoor, H., 2006. Yield and economic benefits of common bean (Phaseolus vulgaris) and soybean (Glycine
max) inoculation in northern Tanzania. Australian Journal of Experimental Agriculture 46, 571-577.
Ortas, I., 2008. The effect of mycorrhizal inoculation on forage and non-forage plant growth and nutrient uptake under field conditions. Options Méditerranéennes 79, 463-469.
References
122
Parveen, R., Sadiq, M., Saleen, M., 1999. Role of Rhizobium inoculation in chickpea (Cicer arietinum L.) under water stress conditions. Pakistan Journal of Biological Sciences 2, 452-454.
Rahman, M.A., Islam, N., Islam, A., Hassan, M.K., Talukder, M.M.R., 2002. Yield performance of mungbean (Vigna radiata L. Wilczek) cv. Barimung-4 as influenced by Rhizobium inoculation and NPK fertilizer. Pakistan Journal of Biological Sciences 5, 146-148.
Rahman, M.M., Bhuiyan, M.M.H., Sutradhar, G.N.C., Rahman, M.M., Paul, A.K., 2008. Effect of phosphorus, molybdenum and Rhizobium inoculation on yield and yield attributes of mungbean. International Journal of Sustainable Crop Production 3, 26-33.
Ratner, E.I., Lobel, R., Feldhay, H., Hartzook, A., 1979. Some characteristics of symbiotic nitrogen fixation, yield, protein and oil accumulation in irrigated peanuts (Arachis hypogaea L.). Plant and Soil 51, 373-386.
Raza, W., Akhtar, M.J., Arshad, M., Yousaf, S., 2004. Growth, nodulation and yield of mungbean (Vigna radiata L.) as influenced by coinoculation with Rhizobium and plant growth promoting rhizobacteria. Pakistan Journal of Agricultural Sciences 41, 125-130.
Ross, J.P., 1971. Effect of phosphate fertilization on yield of mycorrhizal and nonmycorrhizal soybeans. Phytopathology 61, 1400-1403.
Ross, J.P., Harper, J.A., 1970. Effect of endogone mycorrhiza on soybean yields. Phytopathology 60, 1552-1556.
Rudresh, D.L., Shivaprakash, M.K., Prasad, R.D., 2005. Effect of combined application of Rhizobium, phosphate solubilizing bacterium and Trichoderma spp. on growth, nutrient uptake and yield of chickpea (Cicer aritenium L.). Applied Soil Ecology 28, 139-146.
Sattar, M.A., Quader, M.A., Danso, K.A., 1995. Nodulation, N2 fixation and yield of chickpea as influenced by host cultivar and Bradyrhizobium strain differences. Soil Biology & Biochemistry 27, 725-727.
Seneviratne, G., van Holm, L.H.J., Ekanayake, E.M.H.G.S., 2000. Agronomic benefits of rhizobial inoculant use over nitrogen fertilizer application in tropical soybean. Field Crops Research 68, 199-203.
Singh, O.S., Singh, R.S., 1986. Effects of phosphorus and Glomus fasciculatus inoculation on nitrogen fixation, P uptake and yield of lentil (Lens culinaris Medic)
References
123
grown on an unsterilized sandy soil. Environmental and Experimental Botany 25, 185-190.
Solaiman, A.R.M., Hossain, D., 2006. Effectiveness of Bradyrhizobium japonicum strains on soybean at field condition. Bulletin of the Institute of Tropical Agriculture 29, 11-20.
Talaat, N.B., Abdallah, A.M., 2008. Response of faba bean (Vicia faba L.) to dual inoculation with rhizobium and VA mycorrhiza under different levels of N and P fertilization. Journal of Applied Sciences Research 4, 1092-1102.
Talukdar, N.C., Germida, J.J., 1994. Growth and yield of lentil and wheat inoculated with three Glomus isolates from Saskatchewan soils. Mycorrhiza 5, 145-152.
Tilak, K.V.B.R., Ranganayaki, N., Manoharachari, C., 2006. Synergistic effects of plant-growth promoting rhizobacteria and Rhizobium on nodulation and nitrogen fixation by pigeonpea (Cajanus cajan). European Journal of Soil Science 57, 67-71.
Uyanöz, R., 2007. The effects of different bio-organic, chemical and their combination on, yield, macro and micro nutrition content of dry bean (Phaseolus vulgaris L.). International Journal of Agricultural Research 2, 115-125.
Wani, P.A., Khan, M.S., Zaidi, A., 2008. Effect of metal-tolerant plant growth-promoting rhizobium on the performance of pea grown in metal-amended soil. Archives of Environmental Contamination and Toxicology 55, 33-42.
Xavier, L.J.C., Germida, J.J., 2002. Response of lentil under controlled conditions to co-inoculation with arbuscular mycorrhizal fungi and rhizobia varying in efficacy. Soil Biology & Biochemistry 34, 181-188.
Xavier, L.J.C., Germida, J.J., 2003. Selective interactions between arbuscular mycorrhizal fungi and Rhizobium leguminosarum bv. viceae enhance pea yield and nutrition. Biology and Fertility of Soils 37, 261-267.
Yadegari, M., Rahmani, H.A., Noormohammadi, G., Ayneband, A., 2008. Evaluation of bean (Phaseolus vulgaris) seeds inoculation with Rhizobium phaseoli and plant growth promoting rhizobacteria on yield and yield components. Pakistan Journal of Biological Sciences 11, 1935-1939.
Zaidi, A., Khan, M.S., Amil, M., 2003. Interactive effect of rhizotrophic microorganisms on yield and nutrient uptake of chickpea (Cicer arietinum L.). European Journal of Agronomy 19, 15-21.
Zambolim, L., Schenck, N.C., 1983. Reduction of the effects of pathogenic, root-

References
124
infecting fungi on soybean by the mycorrhizal fungus, Glomus mosseae. Phytopathology 73, 1402-1405.
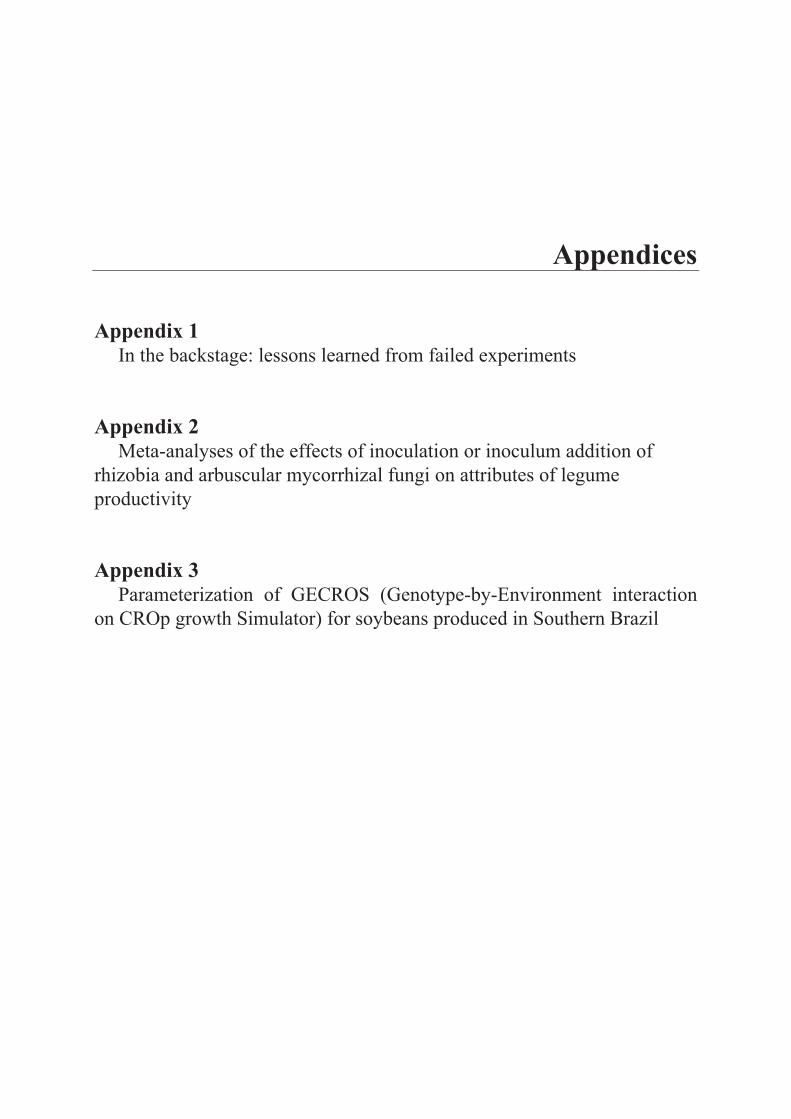
Appendices
Appendix 1
In the backstage: lessons learned from failed experiments
Appendix 2
Meta-analyses of the effects of inoculation or inoculum addition of
rhizobia and arbuscular mycorrhizal fungi on attributes of legume
productivity
Appendix 3
Parameterization of GECROS (Genotype-by-Environment interaction
on CROp growth Simulator) for soybeans produced in Southern Brazil

Appendices
126

Appendices
127
Appendix 1.
In the backstage: lessons learned from failed experiments
A scientific paper should present original data based on a clear theory and well
planned experiments. However, when working with biological systems, experiments
may not work at first attempt, and one sometimes has to try out approaches many
times before they are successful. In this appendix, I describe briefly some experiments,
which are not presented in the chapters, but which contributed to my understanding of
physiological interactions of plants associated with rhizobia and arbuscular
mycorrhizal fungi.
1. Fertilization rates and performance of symbioses
A key point to obtain a sensible comparison between symbiotic and non-symbiotic
plants is to guarantee that plants reliant on symbioses are not severely limited by
nutrients, but still need the symbioses. In other words, symbiotic and non-symbiotic
plants should have similar nutrient mass fractions combined with approximately
similar biomass in order to be comparable (e.g. Smith and Read, 2008). Therefore, I
performed preliminary experiments with soybean cultivated on an autoclaved sandy
soil. There were 21 treatments consisting of the combinations of five different rates of
N and P fertilization and/or inoculation with rhizobia and/or AMF. The fertilization
rates were given as percentage of the dose of fertilizer recommended for that soil and
that crop. Unfortunately, this experiment had to be repeated twice. At first attempt, the
seeds did not germinate evenly and the remaining seedlings presented symptoms of
nutritional toxicity at an early stage of development (probably manganese – Mn, is
directly released from organic matter complexes at high temperatures during
autoclaving, and hardly any manganese oxidation takes place because all bacteria were
killed; Boyd, 1971). Based on shoot nutrient analyses, I also realized that K and P
fertilizer rates were unbalanced. It is likely that overall nutritional unbalance of
macronutrients further enhanced micronutrient toxicity. In a second attempt, I used !-
radiation to sterilize the soil, and took care that the P and K fertilizer rates matched.
Plants germinated evenly and grew well until the harvest at V5-V6 stage (five to six
nodes on the main stem beginning with the unifoliolate node). Based on the results of
the second attempt, I chose the treatments that matched both plant biomass and shoot
N and P mass fractions, which were for that soil and that crop: application of 75% of
the recommended dose of P when rhizobia were inoculated, 50% of the recommended
Appendices
128
dose of N when AMF were inoculated, and 75% of the dose recommended for P and
50% of the dose recommended for N when no microsymbionts were inoculated.
2. Sink stimulation of photosynthesis by rhizobial and AM symbioses I
Following up on the preliminary experiment, I planted soybean seeds in !-
irradiated sandy soil, which received nutrient solutions containing 75% of the dose
recommended for P and 50% of the dose recommended for N, and/or inoculated with
rhizobia (Bradyrhizobium japonicum CPAC 7) and/or AMF (Glomus clarum).
Seedlings germinated and grew well until the reproductive stage, but after that, plants
again showed symptoms of Mn toxicity and started to die. Laboratory analyses
demonstrated that leaves were accumulating up to 2.0 mg Mn g–1
dry weight.
Photosynthesis rates were as low as 3.0 µmol CO2 m–2
s–1
as compared to normal
values of 15-30 µmol CO2 m–2
s–1
. It is important to realize that much of the Mn in the
soil is normally oxidized in the soil by Mn-oxidizing microorganisms (Wild, 1988).
When the soil is sterilized or air-dried, the solubility of Mn increases because the Mn-
oxidizing microorganisms are killed, and the Mn immobilized in their biomass starts to
be released to the soil for plant uptake (Wild, 1988). Brazilian soybean varieties
normally tolerate high soil Mn concentrations under field conditions, but this tolerance
is probably related to the fact that Mn is found in an oxidized form or bound to organic
matter and thus not available for uptake.
3. Sink stimulation of photosynthesis by rhizobial and AM symbioses II
Since native soils used in the previous experiments released too much Mn after
sterilization, I tried a new factorial experiment in sterilized sand + vermiculite.
Soybean seedlings were fertilized with N (KNO3, 16.7 mM) and P (KH2PO4, 0.2/0.5 or
1.0 mM), and/or inoculated with rhizobia and/or AM fungi. A disadvantage of
artificial substrates in relation to natural substrates (i.e. soil) is that the rates of P
fertilizer required on the non-mycorrhizal treatment are more difficult to estimate: too
much P results in down-regulation of the AM symbioses, too little P results in little
plant growth. Even poor soils have some phosphate that could support plant growth.
To ensure AM colonization, I supplied a 0.2 mM P-solution to the plants until V5
stage, and, later, a 0.5 mM P-solution to overcome P deficiency when plants grew
faster. Non-AM plants always received a 1 mM P-solution. Plants did not show
toxicity symptoms, although AM plants were not exceptionally large. Rates of
photosynthesis, plant biomass, nutrients, sugars, starch and ureides-N concentration
were measured at V4 and R2 stages. However, when I started to analyze the data,
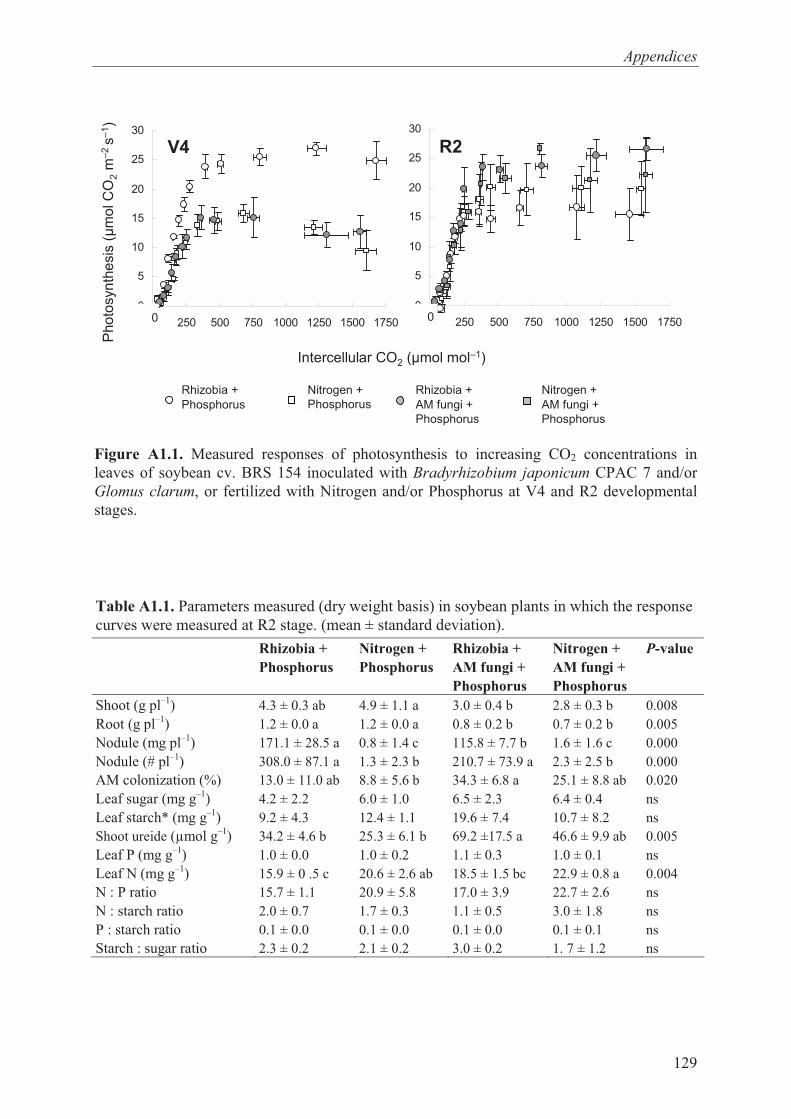
Appendices
129
Figure A1.1. Measured responses of photosynthesis to increasing CO2 concentrations in
leaves of soybean cv. BRS 154 inoculated with Bradyrhizobium japonicum CPAC 7 and/or
Glomus clarum, or fertilized with Nitrogen and/or Phosphorus at V4 and R2 developmental
stages.
-5
0
5
10
15
20
25
30
0 250 500 750 1000 1250 1500 1750-5
0
5
10
15
20
25
30
0 250 500 750 1000 1250 1500 1750
R2
Pho
tosyn
the
sis
(µ
mo
l C
O2
m–2 s
–1)
Intercellular CO2 (µmol mol–1)
V4
0 0
Nitrogen +
AM fungi +
Phosphorus
Rhizobia +
AM fungi +
Phosphorus
Nitrogen +
Phosphorus
Rhizobia +
Phosphorus
Nitrogen +
AM fungi +
Phosphorus
Rhizobia +
AM fungi +
Phosphorus
Nitrogen +
Phosphorus
Rhizobia +
Phosphorus
Table A1.1. Parameters measured (dry weight basis) in soybean plants in which the response
curves were measured at R2 stage. (mean ± standard deviation).
Rhizobia +
Phosphorus
Nitrogen +
Phosphorus
Rhizobia +
AM fungi +
Phosphorus
Nitrogen +
AM fungi +
Phosphorus
P-value
Shoot (g pl–1
) 4.3 ± 0.3 ab 4.9 ± 1.1 a 3.0 ± 0.4 b 2.8 ± 0.3 b 0.008
Root (g pl–1
) 1.2 ± 0.0 a 1.2 ± 0.0 a 0.8 ± 0.2 b 0.7 ± 0.2 b 0.005
Nodule (mg pl–1
) 171.1 ± 28.5 a 0.8 ± 1.4 c 115.8 ± 7.7 b 1.6 ± 1.6 c 0.000
Nodule (# pl–1
) 308.0 ± 87.1 a 1.3 ± 2.3 b 210.7 ± 73.9 a 2.3 ± 2.5 b 0.000
AM colonization (%) 13.0 ± 11.0 ab 8.8 ± 5.6 b 34.3 ± 6.8 a 25.1 ± 8.8 ab 0.020
Leaf sugar (mg g–1) 4.2 ± 2.2 6.0 ± 1.0 6.5 ± 2.3 6.4 ± 0.4 ns
Leaf starch* (mg g–1) 9.2 ± 4.3 12.4 ± 1.1 19.6 ± 7.4 10.7 ± 8.2 ns
Shoot ureide (µmol g–1) 34.2 ± 4.6 b 25.3 ± 6.1 b 69.2 ±17.5 a 46.6 ± 9.9 ab 0.005
Leaf P (mg g–1) 1.0 ± 0.0 1.0 ± 0.2 1.1 ± 0.3 1.0 ± 0.1 ns
Leaf N (mg g–1) 15.9 ± 0 .5 c 20.6 ± 2.6 ab 18.5 ± 1.5 bc 22.9 ± 0.8 a 0.004
N : P ratio 15.7 ± 1.1 20.9 ± 5.8 17.0 ± 3.9 22.7 ± 2.6 ns
N : starch ratio 2.0 ± 0.7 1.7 ± 0.3 1.1 ± 0.5 3.0 ± 1.8 ns
P : starch ratio 0.1 ± 0.0 0.1 ± 0.0 0.1 ± 0.0 0.1 ± 0.1 ns
Starch : sugar ratio 2.3 ± 0.2 2.1 ± 0.2 3.0 ± 0.2 1. 7 ± 1.2 ns
Appendices
130
I encountered some flaws, which compromised the quality of any conclusions. In fact,
the response curves of photosynthesis of the four treatments did not seem to have any
major apparent problem (Fig. A1.1), and one could naively attribute an effect of sink
stimulation of rhizobia at V4 stage or of AMF at R2 stage on the photosynthesis.
However, several other indicators (e.g. shoot and root dry weight, leaf starch)
suggest that growth of AM plants was severely restricted by limited P supply, although
the leaf P concentration was not affected (Table A1.1). Another complication was that
all the plants were mycorrhizal to some extent, and no claim could be made on the
effects of AM symbiosis. Although plants to which inoculum of G. clarum was added
had higher rates of photosynthesis (Fig. A1.1), there was no effect on anything else,
except on plant biomass. Therefore, since I made a shift in the P nutrient solution from
0.2 to 0.5 mM at the reproductive stage, increased rates of photosynthesis of AM
plants could have been an artifact of increased concentration in the P nutrient solution,
which increased growth rates and the C sink strength of photosynthesis. In conclusion,
if I am able to repeat this experiment in future, I will need to produce response curves
of P fertilization similar to those described in the first section of this appendix.
Appendices
131
Appendix 2
Meta-analyses of the effects of inoculation or inoculum addition of
rhizobia and arbuscular mycorrhizal fungi on attributes of legume
productivity
Objective
The objective of the meta-analyses was to evaluate the effects of rhizobial and
arbuscular mycorrizal fungal inoculation on grain yield, harvest index (the ratio of
grain yield to aboveground biomass), grain protein and lipid mass fractions in legumes.
Data gathering
The dataset was formed after searching for studies listed in Scopus, Web of
Science and Google Scholar with different combinations of the following key words:
‘rhizobium’, ‘mycorrhiza’, ‘legume’, ‘grain yield’, ‘legume’, ‘seed quality’.
Information required for the meta-analyses included: mean ! "X , standard deviation of
the mean )(X
SD and number of replicates )(n of the variables mentioned in the
objective. To overcome lack of data on standard deviation, we considered the
coefficient of variation %)(CV or standard error )(X
SE and calculated X
SD with the
following equations: XCVSDX
#$ )100/%( or nSESDXX#$ . In the cases that
neither SD, SE or CV% were reported, we calculated the variability %)(CV of all
means, and used that variability multiplied by 1.5 to overcome problems of
underestimation. Previous studies have also used this approach (e.g. Ostonen et al.,
2007; Chapter 2).
I decided beforehand that plants inoculated with rhizobia and/or arbuscular
mycorrhizal fungi would be ‘experimental’, and the non-inoculated plants would be
the ‘control’ treatment. I excluded data points, which considered variables other than
inoculation as treatments (e.g. water stress, co-inoculation with other microorganisms,
application of hormones, etc.). I considered as controls both fertilized (with N, P
and/or K) and non-fertilized plants. I included experiments with sterile soils (with
inoculation) and non-sterile soils (with inoculum addition), but I only selected controls
and treatments that were exposed to similar experimental conditions. In case the same
data set was published more than once in difference sources, I selected the earliest
paper.
The parameters recorded were: grain yield and harvest index, grain protein and
lipid mass fractions. For this analysis, I considered ‘harvest index’ as the ratio of grain
Appendices
132
yield to the aboveground biomass, which has been named as: shoot dry weight, straw,
haulm and aboveground biomass by different authors. It was not possible to assure that
all the measurements have been made at dry weight basis. However, that limitation
does not affect the overall conclusions of my analysis because the meta-analysis uses
dimensionless ratios. If seed protein was not given, I calculated seed protein by
multiplying the seed N mass fraction by 6.25.
Plant, rhizobia and AM fungi species
By selecting studies with the criteria described above, I was able to analyse thirteen
different legume species. The most commonly investigated legume species were
common bean (Phaseolus vulgaris L.), chickpea (Cicer arietinum L.), mungbean
(Vigna radiata [L.] R. Wilczek), pea (Pisum sativum L.) and soybean (Glycine max [L.]
Merrill), but also other legumes were found: fababean (Vicia faba L.), lentil (Lens
culinaris Medikus), peanut (Arachis hypogaea L.), pigeonpea (Cajanus cajan [L.]
Millsp.), rice bean (Vigna umbellata [Thunb.] Ohwi & H. Ohashi) and vetch (Vicia
sativa L.).
According to literature cited, the rhizobial inoculants in the studies were
characterized by a diverse number of rhizobial strains. The most common rhizobial
species was Rhizobium leguminosarum, which was used as inoculant with common
bean, chickpea, fababean, lentil, pea, peanut, rice bean and vetch. The species
Bradyrhizobium japonicum was always used as inoculant with soybean, whereas
Bradyrhizobium sp. was usually inoculated with mungbean. Additionally other
rhizobial species were reported: Rhizobium ciceri (nowadays, Mesorhizobium ciceri)
inoculated with chickpea, R. phaseoli with mungbean and R. tropici with common
bean.
The analyses of the effects of AM symbioses considered nineteen AM fungal
species (data not shown); one study reported an unknown Glomus spp., and three
studies reported unknown AM fungal species. The most common AM fungal species
reported in the studies was Glomus mosseae, which was utilized in 12 studies and
inoculated with six different legume species: common bean, cowpea, fababean, lentil,
pea and soybean. The second most popular AM fungi species was Glomus
fasciculatum, utilized in seven studies and inoculated with chickpea, mungbean, rice
bean and soybean. Soybean was tested individually with 14 different AM fungal
species, including one study alone that tested nine different AM fungal species.
Appendices
133
Data Analyses
The analyses were performed as described by Gurevitch and Hedges (2001). First
the means of control and experimental groups (plants inoculated with rhizobia or AM
fungi) and their respective standard deviations were arranged in columns of Microsoft
Excel® worksheets. The natural log [ln] of the response ratio R is named lr and the
variance of the response ratios (vij) (Hedges et al., 1999; Rosenberg et al., 2000;
Gurevitch and Hedges, 2001) were calculated. The values of lr and vij were imported
to the statistical software package MetaWin 2.0 (Rosenberg et al., 2000). MetaWin
was used to perform further variance analyses considering the mixed-model for n
(number of data points) larger than 1, and fixed-model for n=1. The reciprocal of the
variance of each lr was used as the weight to estimate the 95% confidence intervals
(95% CI). The values of lr were reverted to their exponent ( lreR $ ). When reading the
output of the meta-analysis, one should regard the response ratio ‘R’, significantly
positive if the lower limit of the 95% CI was larger than 1, and significantly negative if
the upper limit of the 95% CI was smaller than 1. If the lower 95% CI was lower than
1 and the upper confidence interval higher than 1, R was not significantly different
than 1.

Appendices
134
Appendix 3
Parameterization of GECROS (Genotype-by-Environment
interaction on CROp growth Simulator) for soybeans produced in
Southern Brazil
I simulated the soybean yields shown in Fig. 1 of the General Discussion with the
GECROS (Genotype-by-Environment interaction on CROp growth Simulator) model,
developed in Wageningen University by Yin and van Laar (2005). GECROS is
programmed in FST (FORTRAN Simulation Translator), and it can be downloaded
free of charge at: <http://www.cwe.wur.nl/UK/Downloads/Gecros/>.
GECROS simulates the rates of photosynthesis as limited by rubisco activity or
electron transport rates. The equations of rubisco-limited photosynthesis are given by
Farquhar et al. (1980), and the equations of electron transport-limited photosynthesis
by Yin et al. (2004), considering the stochiometry for the NADPH : ATP ratio as
required for the C3 metabolism. GECROS assumes that N2 fixation by legumes will
occur whenever the N uptake from the soil does not meet the crop N demands, but it
will be limited by photosynthate availability. The crop N demand is set equal to the
deficit in soil nitrogen supply of the preceding day, reflecting the possibility that it
may take some time for plants to respond to the signal of fixing required N. The value
of a potential N2 fixation limited by photosynthate supply (NfixE) is calculated as:
NfixE = max [0, (12/44)(PC – Rngx)/Cfix],
where, PC is the canopy gross photosynthesis (µmol CO2 m–2
s–1
), Rngx is the sum of
the respiration of all non-growth components excluding the costs for N2 fixation (µmol
CO2 m–2
s–1
), and Cfix is the C costs for fixing N2, which, in reality, range from 5 to12
g C g–1
N fixed (Cannell and Thornley, 2000).
The simulations were performed with the fitted values of maximum rates of
rubisco activity (VCmax25) and electron transport (Jmax25) of N-fertilized soybean plants,
as given in Chapter 3. The inputs for parameterization of GECROS are: weather data;
crop, genotype-specific and soil parameters; and management options (irrigation
and/or ammonium and/or nitrate fertilization). I obtained weather data from the
Laboratory of Ecophysiology at Embrapa-soybean, in Londrina, PR, Brazil. I
maintained most of the default values of the model (cf. Yin and van Laar, 2005) and
specific crop and soil parameters were obtained from three independent studies at the
same location (i.e. Oya et al., 2004; Sinclair et al., 2005; Franchini et al., 2007) of the
study that I wanted to compare (i.e. Hungria et al., 2006). Values are presented in
Table A3.1.
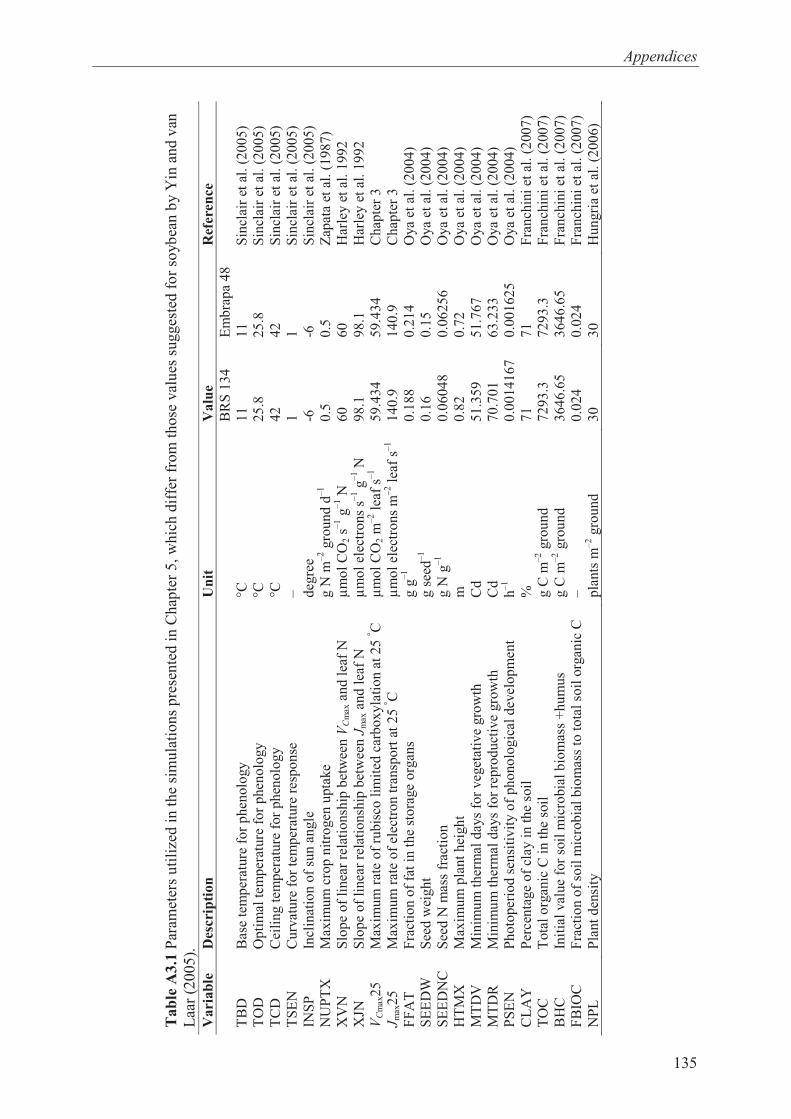
Appendices
135
Tab
le A
3.1
Par
amet
ers
uti
lize
d i
n t
he
sim
ula
tio
ns
pre
sen
ted
in
Ch
apte
r 5,
wh
ich
dif
fer
from
th
ose
val
ues
sug
ges
ted
fo
r so
yb
ean b
y Y
in a
nd v
an
Laa
r (2
005
).
Varia
ble
D
escri
pti
on
U
nit
V
alu
e
Ref
ere
nce
B
RS
134
E
mb
rap
a 4
8
TB
D
Bas
e te
mp
erat
ure
fo
r p
hen
olo
gy
°C
11
1
1
Sin
clai
r et
al.
(20
05
)
TO
D
Opti
mal
tem
per
ature
fo
r p
hen
olo
gy
°C
25
.8
25.8
S
incl
air
et a
l. (
20
05
)
TC
D
Cei
ling t
emp
erat
ure
for
ph
eno
logy
°C
42
4
2
Sin
clai
r et
al.
(20
05
)
TS
EN
C
urv
atu
re f
or
tem
per
ature
res
po
nse
–
1
1
Sin
clai
r et
al.
(20
05
)
INS
P
Incl
inat
ion
of
sun
an
gle
d
egre
e -6
-6
S
incl
air
et a
l. (
20
05
)
NU
PT
X
Max
imum
cro
p n
itro
gen
upta
ke
g N
m–
2 g
rou
nd d
–1
0.5
0
.5
Zap
ata
et a
l. (
198
7)
XV
N
Slo
pe
of
linea
r re
lati
onsh
ip b
etw
een
VC
max a
nd
lea
f N
µ
mo
l C
O2 s
–1 g
–1 N
60
6
0
Har
ley e
t al
. 1
99
2
XJN
S
lop
e of
linea
r re
lati
onsh
ip b
etw
een
Jm
ax a
nd
lea
f N
µ
mo
l el
ectr
ons
s–1 g
–1 N
9
8.1
9
8.1
H
arle
y e
t al
. 1
99
2
VC
max25
M
axim
um
rat
e o
f ru
bis
co l
imit
ed c
arb
oxyla
tio
n a
t 25 ° C
µ
mo
l C
O2 m
–2 l
eaf
s–1
59
.43
4
59.4
34
C
hap
ter
3
Jm
ax2
5
Max
imum
rat
e o
f el
ectr
on
tra
nsp
ort
at
25 ° C
µ
mo
l el
ectr
ons
m–2 l
eaf
s–1
14
0.9
1
40
.9
Chap
ter
3
FF
AT
F
ract
ion o
f fa
t in
th
e st
ora
ge
org
ans
g g
–1
0.1
88
0
.21
4
Oya
et a
l. (
20
04)
SE
ED
W
See
d w
eight
g s
eed
–1
0.1
6
0.1
5
Oya
et a
l. (
20
04)
SE
ED
NC
S
eed
N m
ass
frac
tio
n
g N
g–
1
0.0
60
48
0
.06
25
6
Oya
et a
l. (
20
04)
HT
MX
M
axim
um
pla
nt
hei
gh
t m
0.8
2
0.7
2
Oya
et a
l. (
20
04)
MT
DV
M
inim
um
ther
mal
day
s fo
r veg
etat
ive
gro
wth
C
d
51
.35
9
51.7
67
O
ya
et a
l. (
20
04)
MT
DR
M
inim
um
ther
mal
day
s fo
r re
pro
du
ctiv
e gro
wth
C
d
70
.70
1
63.2
33
O
ya
et a
l. (
20
04)
PS
EN
P
ho
toper
iod s
ensi
tivit
y o
f ph
ono
logic
al d
evel
op
men
t h
–1
0.0
01
41
67
0.0
016
25
Oya
et a
l. (
20
04)
CL
AY
P
erce
nta
ge
of
clay
in t
he
soil
%
71
7
1
Fra
nch
ini
et a
l. (
200
7)
TO
C
Tota
l o
rgan
ic C
in t
he
soil
g C
m–
2 g
rou
nd
72
93
.3
729
3.3
F
ran
chin
i et
al.
(2
00
7)
BH
C
Init
ial
val
ue
for
soil
mic
robia
l b
iom
ass
+h
um
us
g C
m–
2 g
rou
nd
36
46
.65
3
64
6.6
5
Fra
nch
ini
et a
l. (
200
7)
FB
IOC
F
ract
ion o
f so
il m
icro
bia
l bio
mas
s to
to
tal
soil
org
anic
C
–
0.0
24
0
.02
4
Fra
nch
ini
et a
l. (
200
7)
NP
L
Pla
nt
den
sity
p
lants
m–
2 g
roun
d
30
3
0
Hun
gri
a et
al.
(2
006
)

Appendices
136
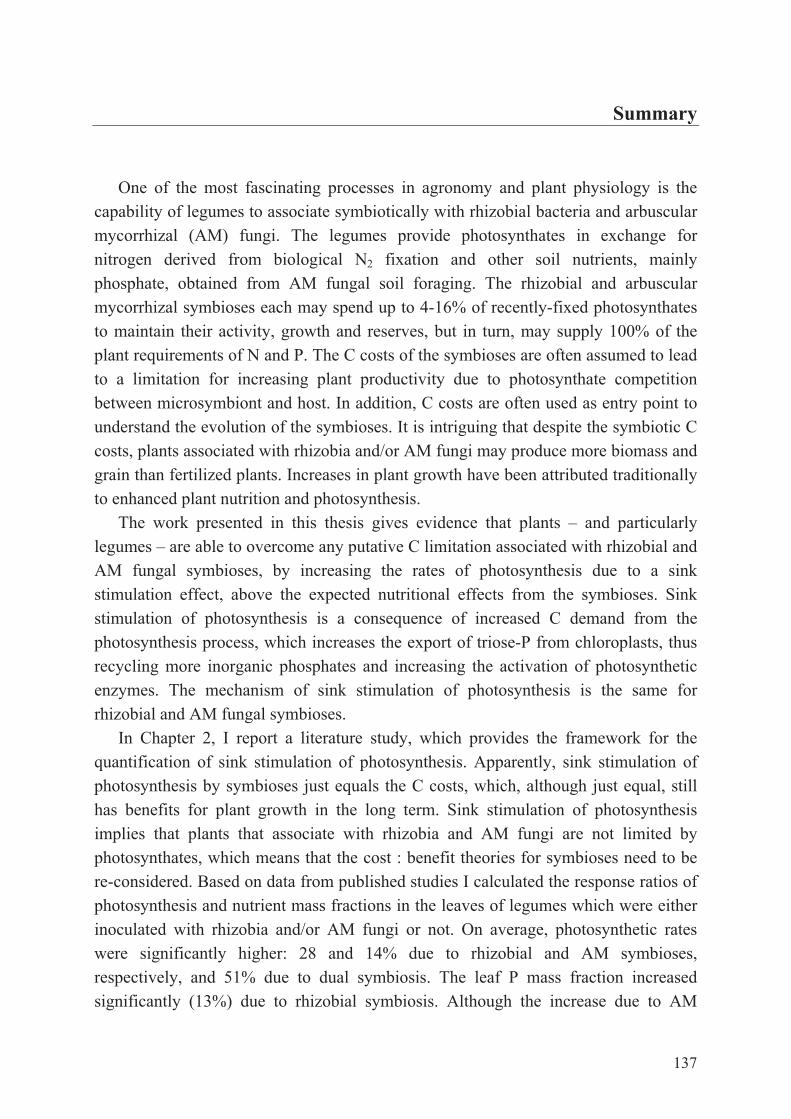
137
Summary
One of the most fascinating processes in agronomy and plant physiology is the capability of legumes to associate symbiotically with rhizobial bacteria and arbuscularmycorrhizal (AM) fungi. The legumes provide photosynthates in exchange for nitrogen derived from biological N2 fixation and other soil nutrients, mainly phosphate, obtained from AM fungal soil foraging. The rhizobial and arbuscular mycorrhizal symbioses each may spend up to 4-16% of recently-fixed photosynthates to maintain their activity, growth and reserves, but in turn, may supply 100% of the plant requirements of N and P. The C costs of the symbioses are often assumed to lead to a limitation for increasing plant productivity due to photosynthate competition between microsymbiont and host. In addition, C costs are often used as entry point to understand the evolution of the symbioses. It is intriguing that despite the symbiotic C costs, plants associated with rhizobia and/or AM fungi may produce more biomass and grain than fertilized plants. Increases in plant growth have been attributed traditionally to enhanced plant nutrition and photosynthesis.
The work presented in this thesis gives evidence that plants – and particularly legumes – are able to overcome any putative C limitation associated with rhizobial and AM fungal symbioses, by increasing the rates of photosynthesis due to a sink stimulation effect, above the expected nutritional effects from the symbioses. Sink stimulation of photosynthesis is a consequence of increased C demand from the photosynthesis process, which increases the export of triose-P from chloroplasts, thus recycling more inorganic phosphates and increasing the activation of photosynthetic enzymes. The mechanism of sink stimulation of photosynthesis is the same for rhizobial and AM fungal symbioses.
In Chapter 2, I report a literature study, which provides the framework for the quantification of sink stimulation of photosynthesis. Apparently, sink stimulation of photosynthesis by symbioses just equals the C costs, which, although just equal, still has benefits for plant growth in the long term. Sink stimulation of photosynthesis implies that plants that associate with rhizobia and AM fungi are not limited by photosynthates, which means that the cost : benefit theories for symbioses need to be re-considered. Based on data from published studies I calculated the response ratios of photosynthesis and nutrient mass fractions in the leaves of legumes which were either inoculated with rhizobia and/or AM fungi or not. On average, photosynthetic rates were significantly higher: 28 and 14% due to rhizobial and AM symbioses, respectively, and 51% due to dual symbiosis. The leaf P mass fraction increased significantly (13%) due to rhizobial symbiosis. Although the increase due to AM
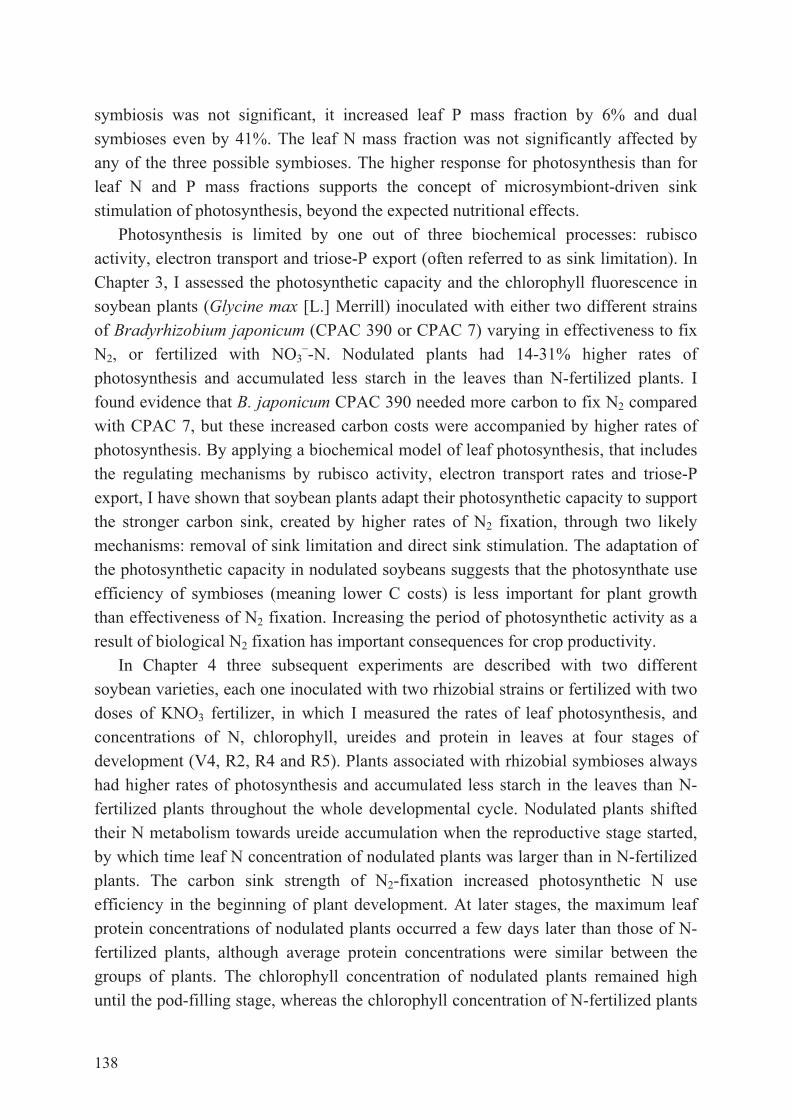
138
symbiosis was not significant, it increased leaf P mass fraction by 6% and dual symbioses even by 41%. The leaf N mass fraction was not significantly affected by any of the three possible symbioses. The higher response for photosynthesis than for leaf N and P mass fractions supports the concept of microsymbiont-driven sink stimulation of photosynthesis, beyond the expected nutritional effects.
Photosynthesis is limited by one out of three biochemical processes: rubisco activity, electron transport and triose-P export (often referred to as sink limitation). In Chapter 3, I assessed the photosynthetic capacity and the chlorophyll fluorescence in soybean plants (Glycine max [L.] Merrill) inoculated with either two different strains of Bradyrhizobium japonicum (CPAC 390 or CPAC 7) varying in effectiveness to fix N2, or fertilized with NO3
–-N. Nodulated plants had 14-31% higher rates of photosynthesis and accumulated less starch in the leaves than N-fertilized plants. I found evidence that B. japonicum CPAC 390 needed more carbon to fix N2 compared with CPAC 7, but these increased carbon costs were accompanied by higher rates of photosynthesis. By applying a biochemical model of leaf photosynthesis, that includes the regulating mechanisms by rubisco activity, electron transport rates and triose-P export, I have shown that soybean plants adapt their photosynthetic capacity to support the stronger carbon sink, created by higher rates of N2 fixation, through two likely mechanisms: removal of sink limitation and direct sink stimulation. The adaptation of the photosynthetic capacity in nodulated soybeans suggests that the photosynthate use efficiency of symbioses (meaning lower C costs) is less important for plant growth than effectiveness of N2 fixation. Increasing the period of photosynthetic activity as a result of biological N2 fixation has important consequences for crop productivity.
In Chapter 4 three subsequent experiments are described with two different soybean varieties, each one inoculated with two rhizobial strains or fertilized with two doses of KNO3 fertilizer, in which I measured the rates of leaf photosynthesis, and concentrations of N, chlorophyll, ureides and protein in leaves at four stages of development (V4, R2, R4 and R5). Plants associated with rhizobial symbioses always had higher rates of photosynthesis and accumulated less starch in the leaves than N-fertilized plants throughout the whole developmental cycle. Nodulated plants shifted their N metabolism towards ureide accumulation when the reproductive stage started, by which time leaf N concentration of nodulated plants was larger than in N-fertilized plants. The carbon sink strength of N2-fixation increased photosynthetic N use efficiency in the beginning of plant development. At later stages, the maximum leaf protein concentrations of nodulated plants occurred a few days later than those of N-fertilized plants, although average protein concentrations were similar between the groups of plants. The chlorophyll concentration of nodulated plants remained high until the pod-filling stage, whereas the chlorophyll concentration of N-fertilized plants

139
started to decrease as early as the flowering stage. In fact, plants with a low C sink strength accumulated starch in the leaves. Starch accumulation reduced photosynthesis by hampering the gene expression of enzymes of CO2 assimilation. Lower leaf photosynthetic activity led to degradation of enzymes related to CO2 assimilation, which resulted in early leaf senescence. One of the conclusions of Chapter 4 is that C costs of rhizobial symbioses increase the C sink strength of the plant, which in turn stimulates photosynthesis and consequently delays leaf senescence.
Overall, the work presented indicates that a higher activity of rhizobial and AM fungal symbioses results in sink stimulation of photosynthesis, which leads to a higher plant growth. There is evidence that plants inoculated with efficient rhizobial and AM fungal species increase the ratio of grain to aboveground biomass (harvest index), which indicates that the effects of sink stimulation are significant over the plant cycle. Sink stimulation of photosynthesis implies that symbioses and plants are not limited by photosynthates. Despite the C costs, grain yield is increased due to rhizobial and AM fungi inoculation, both in pots and field experiments. Increased rates of photosynthesis in initial stages of plant development delay the rates of leaf senescence in the later stages of plant development. The C costs of symbioses are advantageous to plants’ ability to adapt under elevated CO2 concentration, because they remove the sink limitation of photosynthesis. For both rhizobial and AM fungal symbioses, sink stimulation of photosynthesis implies that symbiotic plants are not limited by photosynthates, but rather by soil nutrients such as N and P, which has consequences for the cost : benefit theory. In fact, plants are able to invest in symbioses as much as needed to satisfy their demand for N and P. The limitations of both rhizobial and AM fungi are not related to photosynthate availability, but rather to effectiveness of each individual symbiosis. In the case of AM fungal symbiosis, their effectiveness in P uptake is, however, also limited by the availability of P in the soils.

140
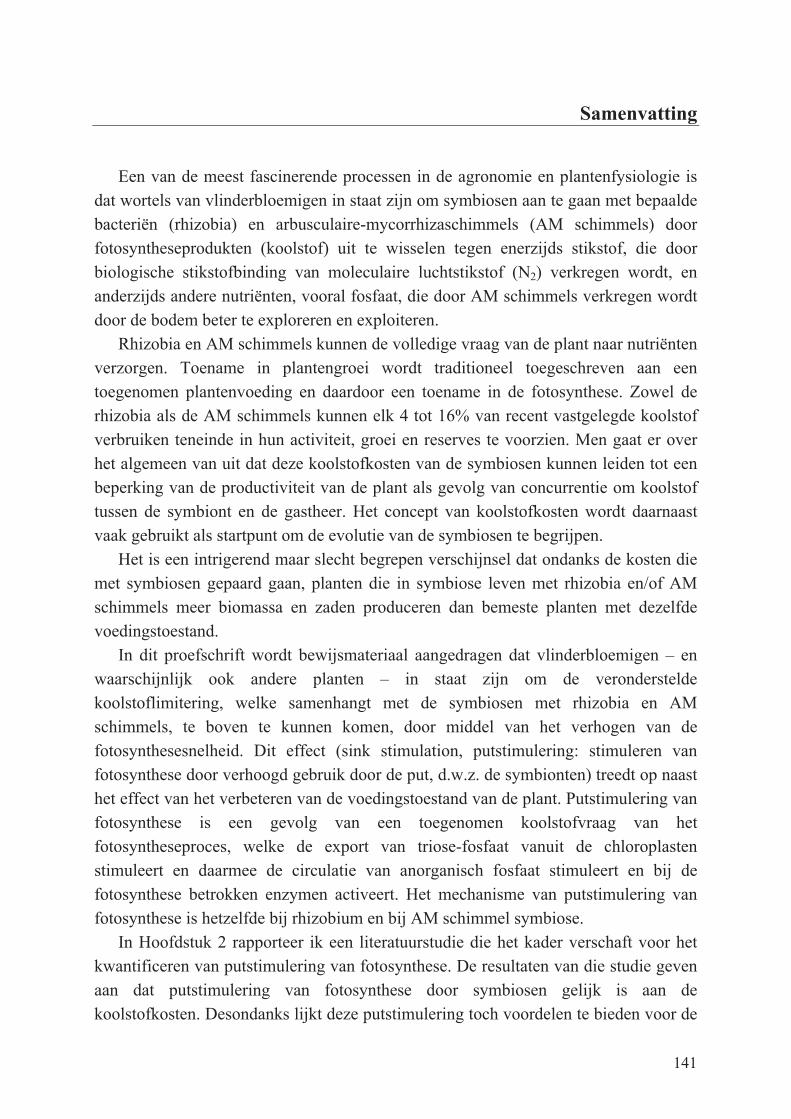
141
Samenvatting
Een van de meest fascinerende processen in de agronomie en plantenfysiologie is dat wortels van vlinderbloemigen in staat zijn om symbiosen aan te gaan met bepaalde bacteriën (rhizobia) en arbusculaire-mycorrhizaschimmels (AM schimmels) door fotosyntheseprodukten (koolstof) uit te wisselen tegen enerzijds stikstof, die door biologische stikstofbinding van moleculaire luchtstikstof (N2) verkregen wordt, en anderzijds andere nutriënten, vooral fosfaat, die door AM schimmels verkregen wordt door de bodem beter te exploreren en exploiteren.
Rhizobia en AM schimmels kunnen de volledige vraag van de plant naar nutriënten verzorgen. Toename in plantengroei wordt traditioneel toegeschreven aan een toegenomen plantenvoeding en daardoor een toename in de fotosynthese. Zowel de rhizobia als de AM schimmels kunnen elk 4 tot 16% van recent vastgelegde koolstof verbruiken teneinde in hun activiteit, groei en reserves te voorzien. Men gaat er over het algemeen van uit dat deze koolstofkosten van de symbiosen kunnen leiden tot een beperking van de productiviteit van de plant als gevolg van concurrentie om koolstof tussen de symbiont en de gastheer. Het concept van koolstofkosten wordt daarnaast vaak gebruikt als startpunt om de evolutie van de symbiosen te begrijpen.
Het is een intrigerend maar slecht begrepen verschijnsel dat ondanks de kosten die met symbiosen gepaard gaan, planten die in symbiose leven met rhizobia en/of AM schimmels meer biomassa en zaden produceren dan bemeste planten met dezelfde voedingstoestand.
In dit proefschrift wordt bewijsmateriaal aangedragen dat vlinderbloemigen – en waarschijnlijk ook andere planten – in staat zijn om de veronderstelde koolstoflimitering, welke samenhangt met de symbiosen met rhizobia en AM schimmels, te boven te kunnen komen, door middel van het verhogen van de fotosynthesesnelheid. Dit effect (sink stimulation, putstimulering: stimuleren van fotosynthese door verhoogd gebruik door de put, d.w.z. de symbionten) treedt op naast het effect van het verbeteren van de voedingstoestand van de plant. Putstimulering van fotosynthese is een gevolg van een toegenomen koolstofvraag van het fotosyntheseproces, welke de export van triose-fosfaat vanuit de chloroplasten stimuleert en daarmee de circulatie van anorganisch fosfaat stimuleert en bij de fotosynthese betrokken enzymen activeert. Het mechanisme van putstimulering van fotosynthese is hetzelfde bij rhizobium en bij AM schimmel symbiose.
In Hoofdstuk 2 rapporteer ik een literatuurstudie die het kader verschaft voor het kwantificeren van putstimulering van fotosynthese. De resultaten van die studie geven aan dat putstimulering van fotosynthese door symbiosen gelijk is aan de koolstofkosten. Desondanks lijkt deze putstimulering toch voordelen te bieden voor de
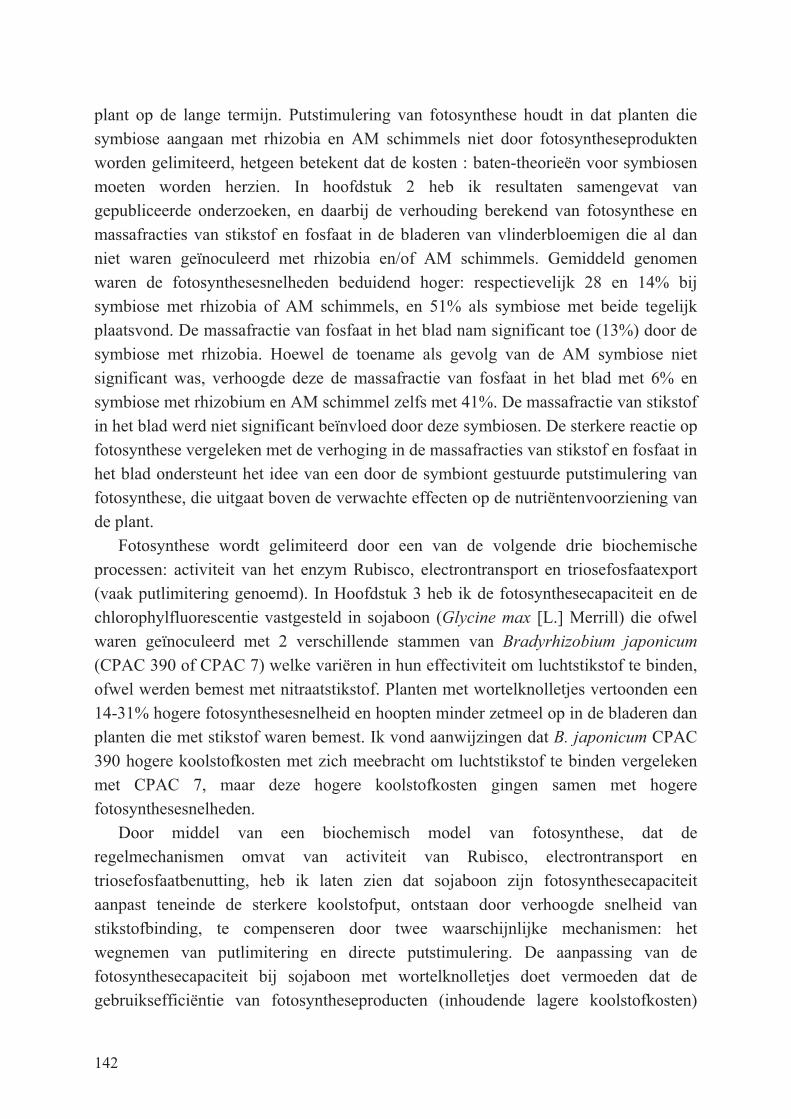
142
plant op de lange termijn. Putstimulering van fotosynthese houdt in dat planten die symbiose aangaan met rhizobia en AM schimmels niet door fotosyntheseprodukten worden gelimiteerd, hetgeen betekent dat de kosten : baten-theorieën voor symbiosen moeten worden herzien. In hoofdstuk 2 heb ik resultaten samengevat van gepubliceerde onderzoeken, en daarbij de verhouding berekend van fotosynthese en massafracties van stikstof en fosfaat in de bladeren van vlinderbloemigen die al dan niet waren geïnoculeerd met rhizobia en/of AM schimmels. Gemiddeld genomen waren de fotosynthesesnelheden beduidend hoger: respectievelijk 28 en 14% bij symbiose met rhizobia of AM schimmels, en 51% als symbiose met beide tegelijk plaatsvond. De massafractie van fosfaat in het blad nam significant toe (13%) door de symbiose met rhizobia. Hoewel de toename als gevolg van de AM symbiose niet significant was, verhoogde deze de massafractie van fosfaat in het blad met 6% en symbiose met rhizobium en AM schimmel zelfs met 41%. De massafractie van stikstof in het blad werd niet significant beïnvloed door deze symbiosen. De sterkere reactie op fotosynthese vergeleken met de verhoging in de massafracties van stikstof en fosfaat in het blad ondersteunt het idee van een door de symbiont gestuurde putstimulering van fotosynthese, die uitgaat boven de verwachte effecten op de nutriëntenvoorziening van de plant.
Fotosynthese wordt gelimiteerd door een van de volgende drie biochemische processen: activiteit van het enzym Rubisco, electrontransport en triosefosfaatexport (vaak putlimitering genoemd). In Hoofdstuk 3 heb ik de fotosynthesecapaciteit en de chlorophylfluorescentie vastgesteld in sojaboon (Glycine max [L.] Merrill) die ofwel waren geïnoculeerd met 2 verschillende stammen van Bradyrhizobium japonicum
(CPAC 390 of CPAC 7) welke variëren in hun effectiviteit om luchtstikstof te binden, ofwel werden bemest met nitraatstikstof. Planten met wortelknolletjes vertoonden een 14-31% hogere fotosynthesesnelheid en hoopten minder zetmeel op in de bladeren dan planten die met stikstof waren bemest. Ik vond aanwijzingen dat B. japonicum CPAC 390 hogere koolstofkosten met zich meebracht om luchtstikstof te binden vergeleken met CPAC 7, maar deze hogere koolstofkosten gingen samen met hogere fotosynthesesnelheden.
Door middel van een biochemisch model van fotosynthese, dat de regelmechanismen omvat van activiteit van Rubisco, electrontransport en triosefosfaatbenutting, heb ik laten zien dat sojaboon zijn fotosynthesecapaciteit aanpast teneinde de sterkere koolstofput, ontstaan door verhoogde snelheid van stikstofbinding, te compenseren door twee waarschijnlijke mechanismen: het wegnemen van putlimitering en directe putstimulering. De aanpassing van de fotosynthesecapaciteit bij sojaboon met wortelknolletjes doet vermoeden dat de gebruiksefficiëntie van fotosyntheseproducten (inhoudende lagere koolstofkosten)

143
minder van belang is voor plantengroei dan de effectiviteit van stikstofbinding. Daarnaast bleek de levensduur van bladeren van planten met rhizobia hoger te zijn dan die van planten die met nitraat waren bemest. Deze toename van de periode van fotosyntheseactiviteit als gevolg van biologische stikstofbinding heeft belangrijke consequenties voor gewasproductiviteit.
In Hoofdstuk 4 worden drie experimenten beschreven met twee verschillende rassen van sojaboon welke ofwel in symbiose leefden met twee verschillende stammen van rhizobia ofwel werden bemest met twee niveaus van nitraat. In deze experimenten heb ik de snelheden van bladfotosynthese, en de concentraties van stikstof, chlorophyl, ureide en eiwit in de bladeren gemeten bij vier ontwikkelingsstadia (V4, R2, R4 and R5). Planten met rhizobia hadden altijd hogere fotosynthesesnelheden en hoopten minder zetmeel op in de bladeren dan de met stikstof bemeste planten gedurende de hele ontwikkelingscyclus. Planten van wortelknolletjes met rhizobia verschoven hun stikstofmetabolisme naar ophoping van ureide wanneer het reproductieve stadium begon, op welk tijdstip de stikstofconcentratie in de bladeren van symbiotische planten groter was dan bij met stikstof bemeste planten. De sterkte van de koolstofput door stikstofbinding door rhizobia verhoogde de stikstofgebruiksefficiëntie van de fotosynthese in het begin van de plantontwikkeling. In latere stadia traden de maximale eiwitconcentraties in de bladeren van symbiotische planten een paar dagen later op dan bij stikstofbemeste planten, hoewel de gemiddelde eiwitconcentraties gelijk waren in beide typen behandelde planten. De chlorophylconcentratie van planten met rhizobia bleef hoog tot het stadium van peulvulling, terwijl die van met stikstof bemeste planten al bij bloei begon af te nemen. Planten met een lage koolstofputsterkte hoopten zetmeel op in de bladeren. Deze zetmeelophoping reduceerde de fotosynthese door de genexpressie van de enzymen van CO2-assimilatie te hinderen. Een lagere fotosyntheseactiviteit leidde tot afbraak van enzymen die met de CO2-assimilatie gerelateerd zijn, hetgeen resulteerde in bladsterfte op een eerder tijdstip dan planten met een hogere sterkte van de koolstofput. Een van de conclusies van Hoofdstuk 4 is dat de koolstofkosten van symbiose met rhizobia de koolstofputsterkte van de plant bevordert, hetgeen op zijn beurt de fotosynthese stimuleert en de bladsterfte vertraagt.
Over het geheel genomen laat het in dit proefschrift beschreven onderzoek zien dat een hogere symbioseactiviteit met rhizobia en/of AM schimmels putstimulering van fotosynthese tot gevolg heeft, hetgeen leidt tot een hogere plantengroei. Er zijn voorts sterke aanwijzingen dat planten die zijn geïnoculeerd met efficiënte soorten rhizobia en AM schimmels de verhouding tussen zaden en bovengrondse biomassa (de oogstindex) verhogen, hetgeen erop wijst dat de effecten van putstimulering significant zijn gedurende de groeicyclus van de plant. Putstimulering van
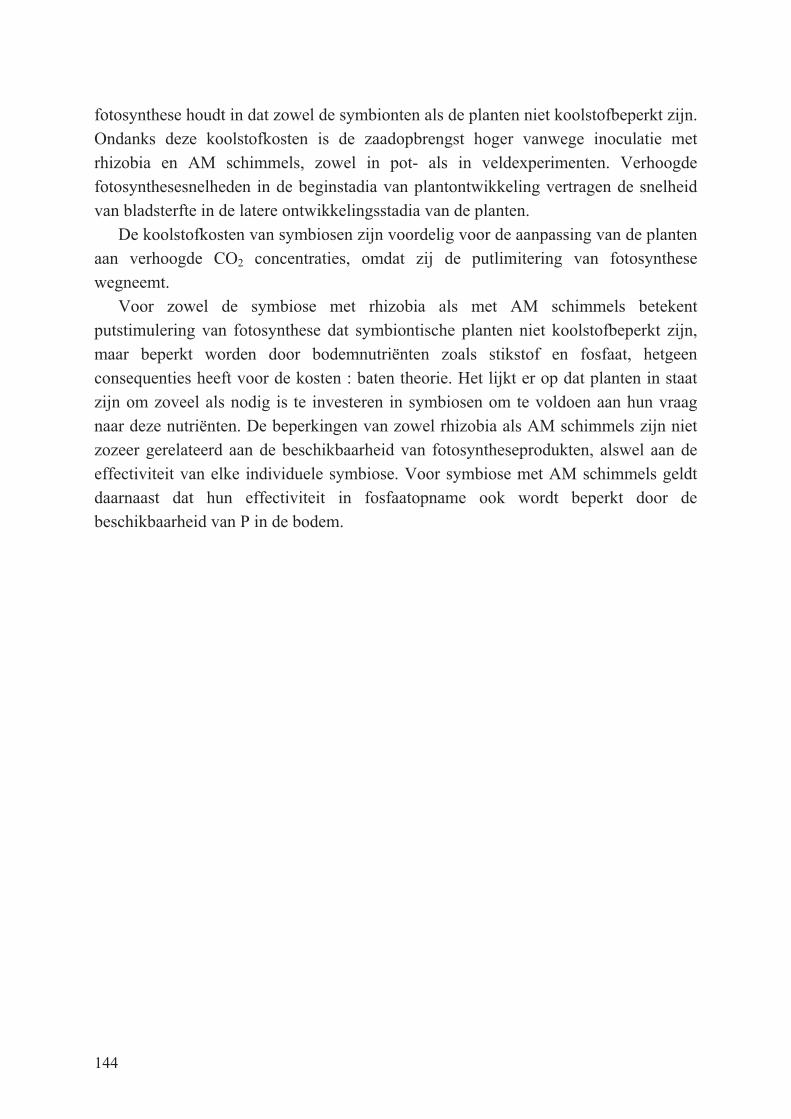
144
fotosynthese houdt in dat zowel de symbionten als de planten niet koolstofbeperkt zijn. Ondanks deze koolstofkosten is de zaadopbrengst hoger vanwege inoculatie met rhizobia en AM schimmels, zowel in pot- als in veldexperimenten. Verhoogde fotosynthesesnelheden in de beginstadia van plantontwikkeling vertragen de snelheid van bladsterfte in de latere ontwikkelingsstadia van de planten.
De koolstofkosten van symbiosen zijn voordelig voor de aanpassing van de planten aan verhoogde CO2 concentraties, omdat zij de putlimitering van fotosynthese wegneemt.
Voor zowel de symbiose met rhizobia als met AM schimmels betekent putstimulering van fotosynthese dat symbiontische planten niet koolstofbeperkt zijn, maar beperkt worden door bodemnutriënten zoals stikstof en fosfaat, hetgeen consequenties heeft voor de kosten : baten theorie. Het lijkt er op dat planten in staat zijn om zoveel als nodig is te investeren in symbiosen om te voldoen aan hun vraag naar deze nutriënten. De beperkingen van zowel rhizobia als AM schimmels zijn niet zozeer gerelateerd aan de beschikbaarheid van fotosyntheseprodukten, alswel aan de effectiviteit van elke individuele symbiose. Voor symbiose met AM schimmels geldt daarnaast dat hun effectiviteit in fosfaatopname ook wordt beperkt door de beschikbaarheid van P in de bodem.
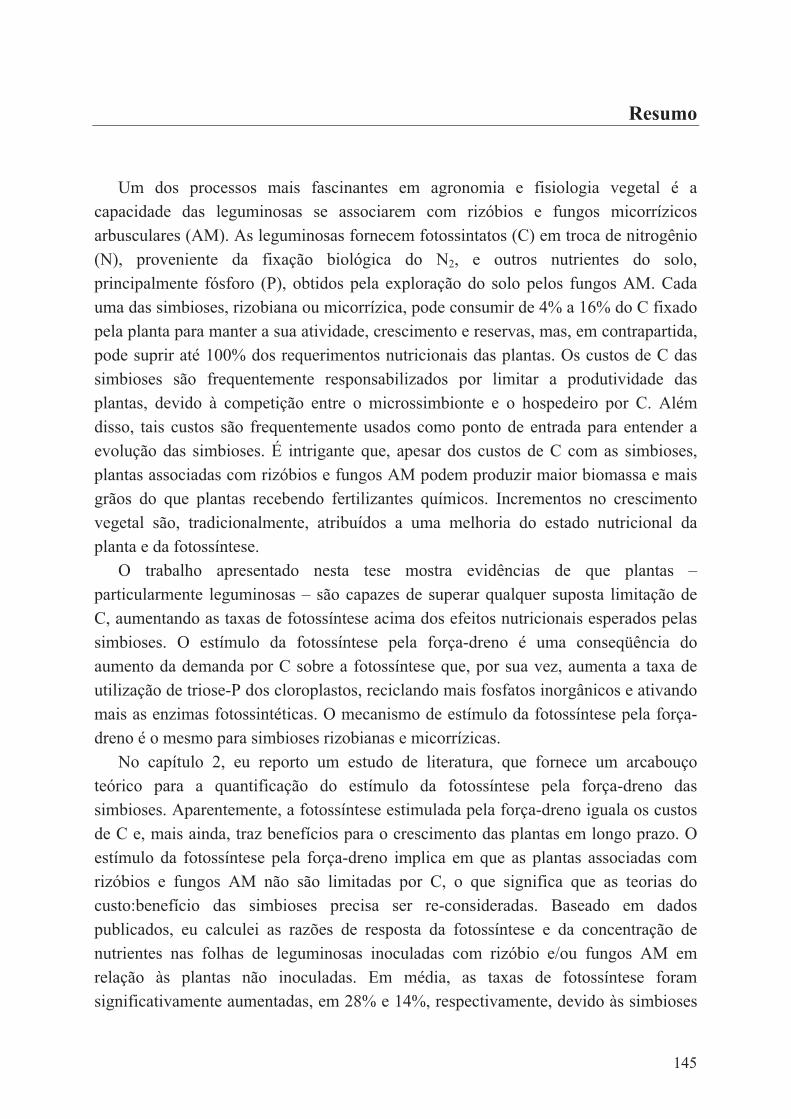
145
Resumo
Um dos processos mais fascinantes em agronomia e fisiologia vegetal é a capacidade das leguminosas se associarem com rizóbios e fungos micorrízicos arbusculares (AM). As leguminosas fornecem fotossintatos (C) em troca de nitrogênio (N), proveniente da fixação biológica do N2, e outros nutrientes do solo, principalmente fósforo (P), obtidos pela exploração do solo pelos fungos AM. Cada uma das simbioses, rizobiana ou micorrízica, pode consumir de 4% a 16% do C fixado pela planta para manter a sua atividade, crescimento e reservas, mas, em contrapartida, pode suprir até 100% dos requerimentos nutricionais das plantas. Os custos de C das simbioses são frequentemente responsabilizados por limitar a produtividade das plantas, devido à competição entre o microssimbionte e o hospedeiro por C. Além disso, tais custos são frequentemente usados como ponto de entrada para entender a evolução das simbioses. É intrigante que, apesar dos custos de C com as simbioses, plantas associadas com rizóbios e fungos AM podem produzir maior biomassa e mais grãos do que plantas recebendo fertilizantes químicos. Incrementos no crescimento vegetal são, tradicionalmente, atribuídos a uma melhoria do estado nutricional da planta e da fotossíntese.
O trabalho apresentado nesta tese mostra evidências de que plantas –particularmente leguminosas – são capazes de superar qualquer suposta limitação de C, aumentando as taxas de fotossíntese acima dos efeitos nutricionais esperados pelas simbioses. O estímulo da fotossíntese pela força-dreno é uma conseqüência do aumento da demanda por C sobre a fotossíntese que, por sua vez, aumenta a taxa de utilização de triose-P dos cloroplastos, reciclando mais fosfatos inorgânicos e ativando mais as enzimas fotossintéticas. O mecanismo de estímulo da fotossíntese pela força-dreno é o mesmo para simbioses rizobianas e micorrízicas.
No capítulo 2, eu reporto um estudo de literatura, que fornece um arcabouço teórico para a quantificação do estímulo da fotossíntese pela força-dreno das simbioses. Aparentemente, a fotossíntese estimulada pela força-dreno iguala os custos de C e, mais ainda, traz benefícios para o crescimento das plantas em longo prazo. O estímulo da fotossíntese pela força-dreno implica em que as plantas associadas com rizóbios e fungos AM não são limitadas por C, o que significa que as teorias do custo:benefício das simbioses precisa ser re-consideradas. Baseado em dados publicados, eu calculei as razões de resposta da fotossíntese e da concentração de nutrientes nas folhas de leguminosas inoculadas com rizóbio e/ou fungos AM em relação às plantas não inoculadas. Em média, as taxas de fotossíntese foram significativamente aumentadas, em 28% e 14%, respectivamente, devido às simbioses

146
rizobianas e micorrízicas. A concentração de P nas folhas foi aumentada em 13% devido às simbioses rizobianas. Embora os aumentos não fossem significativos, simbioses micorrízicas aumentaram a concentração de P nas folhas em 6%, e as simbioses duplas (rizóbios + AM) em 41%. A concentração de N nas folhas não foi significativamente afetada por nenhuma das simbioses. Uma maior resposta da fotossíntese em relação à resposta na concentração de N e P nas folhas sustenta o conceito de estímulo da fotossíntese induzida pela simbiose, superior à esperada pelos efeitos nutricionais.
A fotossíntese é limitada por um dos três processos bioquímicos: atividade da enzima rubisco, transporte de elétrons, e utilização da triose-P (frequentemente referida como limitação de dreno). No Capítulo 3, eu avaliei a capacidade fotossintética e a fluorescência da clorofila em plantas de soja [Glycine max L. (Merrill)] recebendo N mineral (como NO3
–), ou inoculadas com duas estirpes diferentes de Bradyrhizobium japonicum, CPAC 7 ou CPAC 390, caracterizadas por diferenças na eficiência de fixação de N2. Plantas noduladas tiveram taxas de fotossíntese 13% a 41% (para CPAC 7 e CPAC 390, respectivamente) maiores e acumularam menos amido nas folhas do que plantas fertilizadas. Eu encontrei evidências de que a estripe CPAC 390 apresentou custos mais elevados de C na fixação de N2, quando comparada com a CPAC 7; contudo, o maior custo foi acompanhado por taxas mais elevadas de fotossíntese. Aplicando um modelo bioquímico de fotossíntese, que inclui as limitações de atividade da rubisco, do transporte de elétrons e das taxas de utilização de triose-P, eu mostrei que plantas de soja adaptam sua capacidade fotossintética para sustentar um dreno maior causado pela fixação de N2, através de dois possíveis mecanismos: remoção da limitação de dreno e estímulo direto pelo dreno. A adaptação da capacidade fotossintética em soja nodulada sugere que a eficiência pela qual o C é utilizado pela simbiose rizobiana é menos importante para o crescimento da planta do que a capacidade efetiva de fixação de N2.
No capítulo 4, são descritos três experimentos subseqüentes conduzidos com duas variedades de soja noduladas com duas estirpes de rizóbio, ou recebendo duas doses de N-mineral (como KNO3). Nesses experimentos, eu medi as taxas de fotossíntese, as concentrações de N total, N-ureídos e proteínas nas folhas em quatro estágios de desenvolvimento (V4, R2, R4 e R5). Plantas associadas com simbioses rizobianas sempre apresentaram taxas mais elevadas de fotossíntese e acumularam menos amido do que as plantas que receberam N-mineral durante todo o ciclo. Plantas noduladas acumularam mais ureídos ao partir do início do período reprodutivo. Ao mesmo tempo, a concentração de N nas folhas das plantas noduladas aumentou em relação ao das plantas fertilizadas. A concentração de clorofila de plantas noduladas se manteve
147
elevada até o período de enchimento de grãos, enquanto que a concentração de clorofila das plantas fertilizadas começou a diminuir já no florescimento. Na verdade, plantas com baixa força-dreno acumularam mais amido nas folhas. O acúmulo de amido diminuiu a fotossíntese por bloquear a expressão gênica de enzimas de assimilação de CO2. A baixa atividade fotossintética levou à degradação de enzimas relacionadas à fixação de CO2. Uma das conclusões do Capítulo 4 é que os custos de C das simbioses rizobianas aumentam a força-dreno da planta e, como conseqüência, ocorre um incremento na fotossíntese e um atraso na senescência foliar.
O trabalho apresentado nesta tese indica, sobretudo, que uma maior atividade das simbioses rizobianas e micorrízicas resulta em estímulo da fotossíntese por força-dreno, a qual leva ao maior crescimento da planta ao longo do tempo. Existem evidências de que plantas inoculadas com rizóbios e fungos AM eficientes aumentam a razão de grãos produzidos pela biomassa da parte aérea (índice de colheita), o que indica que os efeitos do estímulo pela força-dreno são significativos ao longo do ciclo da planta. O estímulo da fotossíntese pela força-dreno implica em que as plantas simbióticas não são limitadas por C. Apesar dos custos de C, a produtividade de grãos é aumentada em função da inoculação com rizóbios e fungos AM, tanto em ensaios de casa de vegetação, como a campo. Incrementos nas taxas de fotossíntese nos estágios iniciais do desenvolvimento da planta retardam as taxas de senescência foliar nos estágios mais avançados de desenvolvimento da planta. Os custos de C das simbioses trazem vantagens para a adaptação das plantas a concentrações elevadas de CO2,porque eles removem a limitação de dreno da fotossíntese. Em ambas as simbioses rizobiana e micorrízica, o estímulo da fotossíntese pela força-dreno implica em que as plantas simbióticas não são limitadas por C, mas sim pelos nutrientes do solo, como o N e o P, que trazem consequências na teoria do custo:beneficio. Na verdade, as plantas são capazes de investir em simbioses tanto quanto necessário para satisfazer a sua demanda por N e P. A limitação de ambas as simbioses não é uma questão de disponibilidade de C, mas sim da efetividade de cada simbiose. No caso da simbiose micorrízica, a sua eficiência na captura de P também é limitada pela disponibilidade de P no solo.

148
149
Acknowledgements
"One swallow does not make a summer" (Aristotle's Nicomachean Ethics).
I consider myself a very fortunate 'swallow' because many other 'swallows' have flown with me until this work could be delivered. I wish here to thank those who help me to realize a dream.
Thanks to Prof Dr. Thom Kuyper, Dr. Peter Leffelaar and Prof. Dr. Ken Giller for inviting me to pursue this PhD project, for investing their time and energy, and for supporting me on my decisions throughout this time. I always felt anxious and happy after every meeting we had to discuss the controversial ideas about sink stimulation of photosynthesis, and I feel that we have synergistically progressed. I profoundly acknowledge Thom and Peter for coaching me to learn in detail every process I studied, for checking up flaws and weakness in the work, and for encouraging me to speak up about my own hypotheses. I thank Thom for literally flying to Brazil when I was performing glasshouse and laboratory work, and discuss improvements in the experimental designs. I specially thank Ken for cheering me up personally or by e-mail whenever an experiment failed, for proposing alternatives, and for signing all the letters and evaluations I needed due to bureaucracy matters.
Dr. Mariangela Hungria has inspired and supported me to engage in science since my undergraduate studies. During my PhD, she guided me on the legume and rhizobia physiology, gave me freedom to try out my own hypotheses, and provided infra-structure to make the experiments feasible. I thank Mariangela for ‘flying’ so close to me all this time, giving me many opportunities to grow as scientist, and for giving her affection whenever I needed.
I recognize that this thesis would have lower standard, if I had not consulted Dr. Xinyou Yin’s opinion on the initial draft about simulating sink stimulation of photosynthesis. I am very grateful to Xinyou for his advises during the planning of experiment and data analysis of Chapter 3.
This thesis was benefited from the contribution of Dr. Odair Alberton on the meta-analysis aspects in Chapters 2 and 5. Michiel de Vries helped me to resolve the issue of unbalanced treatments in Chapter 4. I want to express my gratitude to those with which I discussed methods and experimental procedures: Dr. Fabio A. Oliveira, Dr. Marco A. Nogueira, Ligia M.O. Chueire, and Dr. Diva S. Andrade. I also thank Marco for teaching me to identify mycorrhizae on the microscopy and for providing mycorrhizal inocula. I thank Dr. Alexandre L. Nepumoceno for allowing me to use the
150
photosynthesis systems LICOR-6400 and let the staff under his supervision to work on my experiments.
Furthermore, I would not have performed the experiments, if I had not had the help of Rinaldo B. Conceição, who prepared the substrates, planted and wetted the plants for all the experiments, Nelson Delatre and Claudinei F. Toledo, who measured the response curves of photosynthesis. I am also grateful to many students and technicians of EMBRAPA-soja, who helped me in several steps of the work: Adalgisa Torres, Adriana P. Silva, Adriano M. Custódio, Alan Pereira, José Z. Moraes, Juscelio D. Cardoso, Letícia C. Babujia, Lindberg Nascimento Jr., Luciana Ruano, Maria A. Santos, Nágila M. Bortolato, Pâmela Menna, Renan A. Ribeiro, Rosinei A. Souza, Rubson N.R. Sibaldelli and Simone Bortolan; and also from the laboratory of microbiology at State University of Londrina: Márcio F. Cruz and Marina Miyauchi. Few analyses were only possible because Brazilian friends in Wageningen, Rafael Vivian, Mario D. Canever, Ana C. R. Lima and Carol Soares delivered laboratory material in Londrina for my experiments. I also acknowledge the ‘Companhia Brasileira de Esterelização’ for providing sterilization of soil samples.
My life was somewhat easier in The Netherlands thanks to the professionalism and dedication of the WUR staff members, Ria van Dijk and Charlotte Schilt, on the administration matters, Gijsbertje Berkhout, on the finances management, and Petra Krop, on the visa application and immigration procedures. I also thank Vanda Lucena and Sueli Silva from CAPES/Brazil for checking up documents and reports sent for yearly renovation of the scholarship.
There were always people creating opportunities to make life more pleasant at work. I had a great fun chatting at coffee-break, or participating with the PPS group in the sportive WE-DAY. I would like to thank all the colleagues of the Plant Production System and Crop and Weed Ecology groups for the good chats we had during lunch, coffee breaks and parties. I always liked when Dr. Nico de Ridder invited the foreign PPS-PhD students to cook at his house, and together with Dr. Bert Rijk organized a trip to the polder in Flevoland. I also had a nice time sharing office with Abegaz Assefa, Amos Mwijage, Ebrahim Shibu, Kenneth Nyombi, Ousmane Sanago, Pablo Tittonell and Samuel Guto at 'Attic', and, then, with Jessica Milgroom, Mariana Rufino, Marjolein Kruidhof, Murilo R. Arruda, Pytrik Reidsma and Santiago López-Ridaura at 'Peace Palace'. I thank Mariana for hints about motherhood management during PhD, her everlasting honesty, and especially for the beautiful cover of this book. Thanks to Lenny van Bussel and Myriam Adam for informally discussing aspects of modelling photosynthesis.
There were also friends outside PPS who made life enjoyable in Wageningen and I would like to thank for their social and emotional support: Celso von Randow and his
151
wife Rita, Patrícia Nobman, Luciana Soler, Maria Betânia G. Souza, Márcia Barcellos, Isabella A. Nougalli-Tonaco, Stefano Ciannamea, Denise Novo, Vania Souza and her husband Manoel. Special thanks to Anabele Moura, Wiebe Aans, Vanja Viana and Cinara Santos for opening their homes to the Brazilian community make barbecues. I would like to thank Mario Canever, Ana Cláudia R. Lima, Eduardo Mariano and Isabela Mariano for helping my husband and me to catch up with the new life abroad.
I would like to thank Prof. Dr. Lijbert Brussaard for giving the opportunity to my husband and me to come to The Netherlands, and also for supporting me on the application of PhD proposals.
I thank my husband for always supporting my professional ambitions, for giving me emotional comfort and throughout the last few years, for dedicating his time to take care of our son Valentin while I was still doing my PhD. Eu também agradeço meus pais José e Luci Kaschuk por sempre me apoiarem naquilo que eu julgava ser o melhor para mim, mesmo que isso significasse abdicar do próprio desejo de ter toda a família reunida e próxima do portão de casa. Finally (but never least), I thank Valentin, my son, for giving me his best smile every time I come home after a hard day of work. Valentin’s smile was the best reward I could have had during the whole ‘flight’!

152
153
Curriculum vitae
Glaciela Kaschuk was born in State of Santa Catarina, southern Brazil, on 24 August 1978. From 1997 to 2001, she studied Agronomy at the State University of Santa Catarina (Lages, Brazil), and within this time, she had a fellowship of scientific initiation to characterize the genetic diversity of about 120 local varieties of common bean (Phaseolus
vulgaris L.). Field experiments taught her that common bean is a crop that poorly benefits from biological nitrogen fixation because this legume associates with too many
inefficient rhizobial strains. Her interest for symbiotic N2 fixation made her to follow a master program in Microbiology at State University of Londrina (Londrina, Brazil) from 2002 to 2003. Her master thesis showed that intensive soil tillage decreases genetic diversity of rhizobial strains of common bean, which could affect potential benefits from N2 fixation. She joined Wageningen University (The Netherlands) in December 2004 to perform a PhD research in collaboration with the research group at Embrapa-soja (Londrina, Brazil). This book reports the PhD findings. Back in Brazil, Glaciela is working on the relationships of the soil microbial biomass, soil quality and plant productivity in agroecosystems. Glaciela will continue studying physiological interactions of the symbiotic N2 fixation and the arbuscular mycorrhizal fungal symbioses, as well as other beneficial soil microorganisms that improve plant productivity and sustainability of the production.
e-mail: [email protected]

154
155
List of publications
Kaschuk, G., Kuyper, T.W., Leffelaar, P.A., Hungria, M., Giller, K.E., 2009. Are the rates of photosynthesis stimulated by the carbon sink strength of rhizobial and arbuscular mycorrhizal symbioses? Soil Biology & Biochemistry 41, 1233-1244.
Kaschuk, G. ; Hungria, M. ; Leffelaar, P. A. ; Giller, K. E. ; Kuyper, T. W., 2009. Differences in photosynthetic behaviour and leaf senescence of soybean (Glycine
max [L.] Merrill) dependent on N2 fixation or nitrate supply. Plant Biology. DOI: 10.1111/j.1438-8677.2009.00211.x
Hungria, M. ; Franchini, J. C. ; Brandão-Junior, O.; Kaschuk, G. Souza, R.A., 2009. Soil microbial activity and crop sustainability in a long-term experiment with different soil tillage and crop rotation systems. Applied Soil Ecology 42, 288-296.
Loureiro, M.F., Kaschuk, G., Alberton, O., Hungria, M., 2007. Soybean [Glycine max
(L.) Merrill] rhizobial diversity in Brazilian oxisols under various soil, cropping and inoculation managements. Biology and Fertility of Soils, Berlin 43, 665-674.
Pereira, A.A., Hungria, M., Franchini, J.C., Kaschuk, G., Chueire, L.M.O., Campo, R.J., Torres, E. 2007. Variações qualitativas e quantitativas na microbiota do solo e na fixação biológica do nitrogênio sob diferentes manejos com soja. Revista Brasileira de Ciência do Solo 31, 1397-1412.
Alberton, O., Kaschuk, G., Hungria, M., 2006. Sampling effects on the assessment of genetic diversity of rhizobia associated with soybean and common bean. Soil Biology & Biochemistry 38, 1298-1307.
Kaschuk, G., Hungria, M., Santos, J.C.P., Berton-Junior, J.F., 2006. Differences in common bean rhizobial populations associated with soil tillage management in southern Brazil. Soil & Tillage Research 87, 205-217.
Kaschuk, G., Hungria, M., Souza, D.A., Campo, R.J., 2006. Genetic diversity of rhizobia associated with common bean grown under the no-tillage and conventional systems in Southern Brazil. Applied Soil Ecology 32, 210-220.
Kaschuk, G., Santos, J.C.P., Almeida, J.A., Sinhorati, D.C., Berton-Junior, J.F., 2006. Termite activity and its effects on soil attributes under natural grasslands. Scientia Agricola 63, 583-588.
156
Kaschuk, G. Alberton, O., Hungria, M., 2009. Three decades of soil microbial biomass studies in Brazilian ecosystems: lessons learned about soil quality and indications for improving sustainability. Soil Biology & Biochemistry. Accepted under minor revision.
Kaschuk, G., Leffelaar, P.A., Giller, K.E., Alberton, O., Hungria, M., Kuyper, T.W., 2009. Responses of grain legumes to rhizobial and arbuscular mycorrhizal fungi: a meta-analysis of potential photosynthate limitation of symbioses. Submitted.
Kaschuk, G. Alberton, O., Hungria, M., 2009. Soil microbial biomass resistance and resilience to soil disturbance in Brazilian biomes inferences to improve sustainability of tropical agriculture. Submitted.
Kaschuk, G., Yin, X., Hungria, M., Leffelaar, P.A., Giller, K.E., Kuyper, T.W., 2009. Photosynthetic adaptation of soybean due to inoculation of rhizobial strains varying in effectiveness of N2 fixation. To be submitted after revision.
157
PE&RC PhD Education Certificate
With the educational activities listed below the PhD candidate has complied with the educational requirements set by the C.T. de Wit Graduate School for Production Ecology and Resource Conservation (PE&RC) which comprises of a minimum total of 32 ECTS (= 22 weeks of activities)
Review of Literature (5.6 ECTS)
- Are the rates of photosynthesis stimulated by the carbon sink strength of rhizobial and arbuscular mycorrhizal symbioses? (2005-2009)
Laboratory Training and Working Visits (1.4 ECTS)
- Response curves of photosynthesis LICOR 6400; EMBRAPA-Soja (2008)
Post-Graduate Courses (6 ECTS)
- Ethical dilemmas for life scientists; WGS (2005) - Ecophysiology of plants; Functional Ecology (2007) - Advanced statistics; PE&RC (2008)
Deficiency, Refresh, Brush-up Courses (7.5 ECTS)
- Models for forest and nature conservation; Group Information Technology and PPS (2005)
- Basic statistics; PE&RC (2008)
Competence Strengthening / Skills Courses (2.6 ECTS)
- Information literacy; WGS (2005) - PhD Competence assessment; PE&RC (2005) - The art of writing; CENTA (2007)
158
Discussion Groups / Local Seminars and Other Scientific Meetings (4.9 ECTS)
- 10th Belgium-Netherlands mycorrhizal meeting (2004) - North-South centre platform meeting (2004) - 11th Belgium-Netherlands mycorrhizal meeting (2005) - PhD Workshop on scientific publishing (2005) - Jornada Acadêmica da Embrapa-soja; oral presentation (2005) - Literature in plant physiology discussion group (2005-2006) - Sustainable agriculture in Brazil, responsible soy for food, feed and fuel (2007) - Plant-insect microbes symposium (2008)
PE&RC Annual Meetings, Seminars and the PE&RC Weekend (1.5 ECTS)
- PE&RC Weekend (2004) - PE&RC Day: biological disaster (2005) - PE&RC Day: scaling from molecules to ecosystems (2008)
International Symposia, Workshops and Conferences (4.2 ECTS)
- ICOM 5 International conference on mycorrhiza; poster presentation; Granada (2006)
- Frontis-workshop gene-plant-crop relations; poster presentation; Wageningen (2006)
- ICOM6 International conference on mycorrhiza; poster presentation; Belo Horizonte (2009)

159

160
The research described in this thesis was financially supported by:WOTRO (Netherlands Organisation for Scientific Research, Science for Global
Development, The Netherlands), and CAPES (Coordenação de Aperfeiçoamento de Pessoal de Nível Superior, Brazil).