PREDICATION OF LIFE TIME SPAN OF HIGH ASWAN DAM RESERVOIR USING CCHE2D SIMULATION MODEL
16
Fourteenth International Water Technology Conference, IWTC 14 2010, Cairo, Egypt PREDICATION OF LIFE TIME SPAN OF HIGH ASWAN DAM RESERVOIR USING CCHE2D SIMULATION MODEL Abdelazim M. Negm 1 , Tarek Abdulaziz 2 , Mohamed Nassar 3 , and Ismail Fathy 4 1 Vice Dean and Professor of Hydraulics, Faculty of Engineering, Zagazig University, Zagazig 44519, Egypt, E-mail: [email protected] 2 Professor, Nile Research Institute, National Water Research Center, MWRI, Egypt 3 Assistant Professor, Water and Water Structures Engineering Dept., Faculty of Engineering, Zagazig University, Zagazig 44519, Egypt 4 Demonstrator, Water and Water Structures Eng. Dept., Faculty of Engineering, Zagazig University, Zagazig 44519, Egypt ABSTRACT This paper used a two-dimensional numerical model (CCHE-2D) to study the scouring and silting processes in Aswan High Dam Reservoir (AHDR). The paper focused on a reach of Sudanese part of the reservoir from km 500 to km 350 U.S. Aswan High Dam. The main purpose of the model was to simulate the sediment transport in terms of the depth-averaged sediment concentration and calculated the life time span of AHDR. Field data were collected by Nile research institute (NRI), National Water Research Center (NWRC) and Ministry of Irrigation and Water Resources (MIWR). Field data were used in the calibration stage of the model. Statistical measures indicated that the model results are accurate enough for the practical purpose and hence the model could be used to predict the morphological changes of the AHDR and hence the life time span of the AHDR could be estimated. The model has been applied to predict the different cross sections along Sudanese part of the reservoir, at years 2010, 2020, 2030 and 2040. The results showed that, the steady value of Life Time Span of Dead Zone, LTSDZ is 254 years, while the steady value of Life Time Span of Life Zone, LTSLZ is 985 years. Keywords: AHDR, Numerical Models, Sediment Transport, Life Time Span 1. INTRODUCTION Many studies were done to simulate the scouring and silting processes in Aswan High Dam Reservoir (AHDR). These studies can be divided into two stages: the first stages started before the construction of the dam until 1985 and the second stage from 1985 until present. Investigators focused during the first stage, on collecting and analyzing the field data studying the reservoir characteristics. In addition, they estimated relationships between the flow and the sediment load, (Makary 1982). In the second stage, they started to develop mathematical models simulating both flow and sediment, (Abdel-Aziz 1997).
Transcript of PREDICATION OF LIFE TIME SPAN OF HIGH ASWAN DAM RESERVOIR USING CCHE2D SIMULATION MODEL
Fourteenth International Water Technology Conference, IWTC 14 2010, Cairo, Egypt
���
PREDICATION OF LIFE TIME SPAN OF HIGH ASWAN DAM RESERVOIR USING CCHE2D SIMULATION MODEL
Abdelazim M. Negm 1, Tarek Abdulaziz 2, Mohamed Nassar 3, and Ismail Fathy 4
1 Vice Dean and Professor of Hydraulics, Faculty of Engineering, Zagazig
University, Zagazig 44519, Egypt, E-mail: [email protected] 2 Professor, Nile Research Institute, National Water Research Center, MWRI, Egypt
3 Assistant Professor, Water and Water Structures Engineering Dept., Faculty of Engineering, Zagazig University, Zagazig 44519, Egypt
4 Demonstrator, Water and Water Structures Eng. Dept., Faculty of Engineering, Zagazig University, Zagazig 44519, Egypt
ABSTRACT This paper used a two-dimensional numerical model (CCHE-2D) to study the scouring and silting processes in Aswan High Dam Reservoir (AHDR). The paper focused on a reach of Sudanese part of the reservoir from km 500 to km 350 U.S. Aswan High Dam. The main purpose of the model was to simulate the sediment transport in terms of the depth-averaged sediment concentration and calculated the life time span of AHDR. Field data were collected by Nile research institute (NRI), National Water Research Center (NWRC) and Ministry of Irrigation and Water Resources (MIWR). Field data were used in the calibration stage of the model. Statistical measures indicated that the model results are accurate enough for the practical purpose and hence the model could be used to predict the morphological changes of the AHDR and hence the life time span of the AHDR could be estimated. The model has been applied to predict the different cross sections along Sudanese part of the reservoir, at years 2010, 2020, 2030 and 2040. The results showed that, the steady value of Life Time Span of Dead Zone, LTSDZ is 254 years, while the steady value of Life Time Span of Life Zone, LTSLZ is 985 years. Keywords: AHDR, Numerical Models, Sediment Transport, Life Time Span 1. INTRODUCTION Many studies were done to simulate the scouring and silting processes in Aswan High Dam Reservoir (AHDR). These studies can be divided into two stages: the first stages started before the construction of the dam until 1985 and the second stage from 1985 until present. Investigators focused during the first stage, on collecting and analyzing the field data studying the reservoir characteristics. In addition, they estimated relationships between the flow and the sediment load, (Makary 1982). In the second stage, they started to develop mathematical models simulating both flow and sediment, (Abdel-Aziz 1997).
Fourteenth International Water Technology Conference, IWTC 14 2010, Cairo, Egypt
���
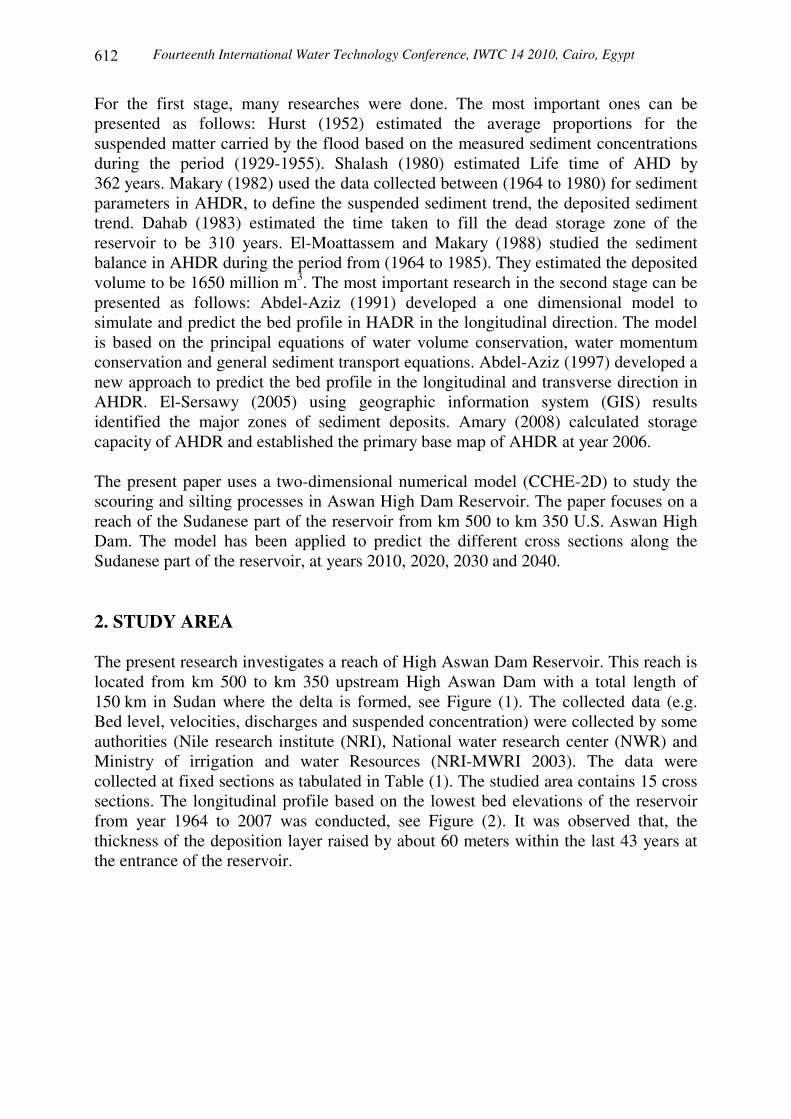
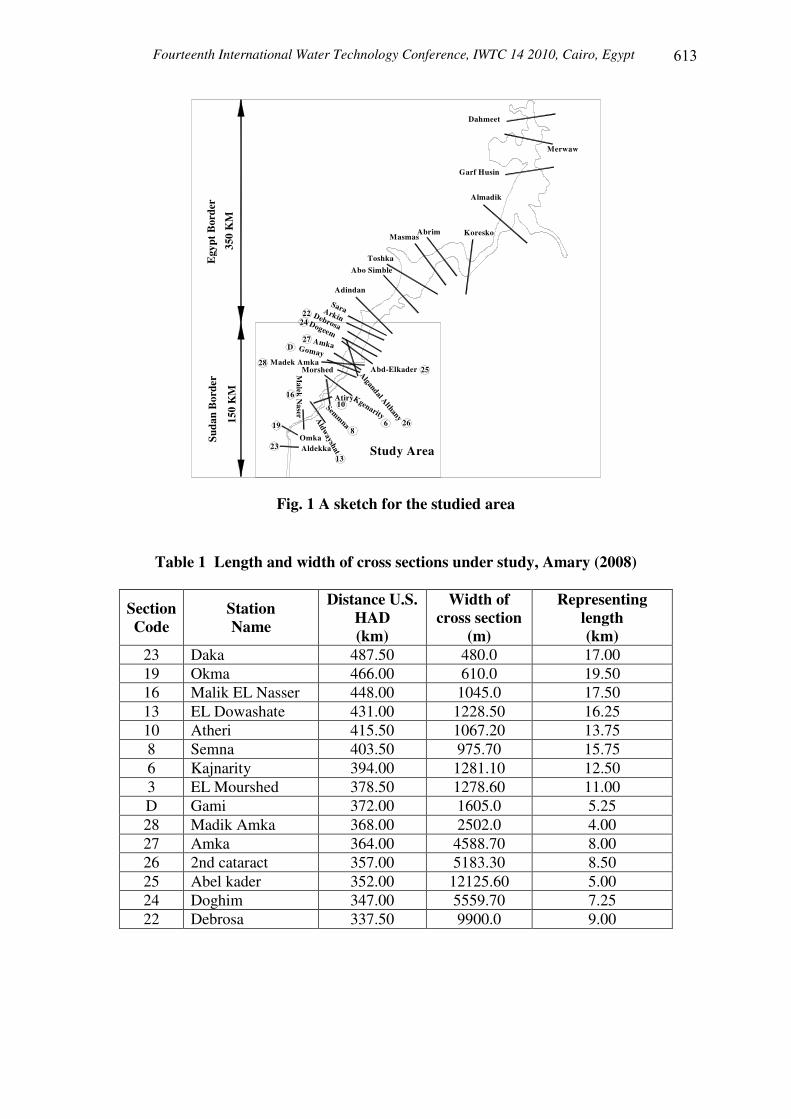
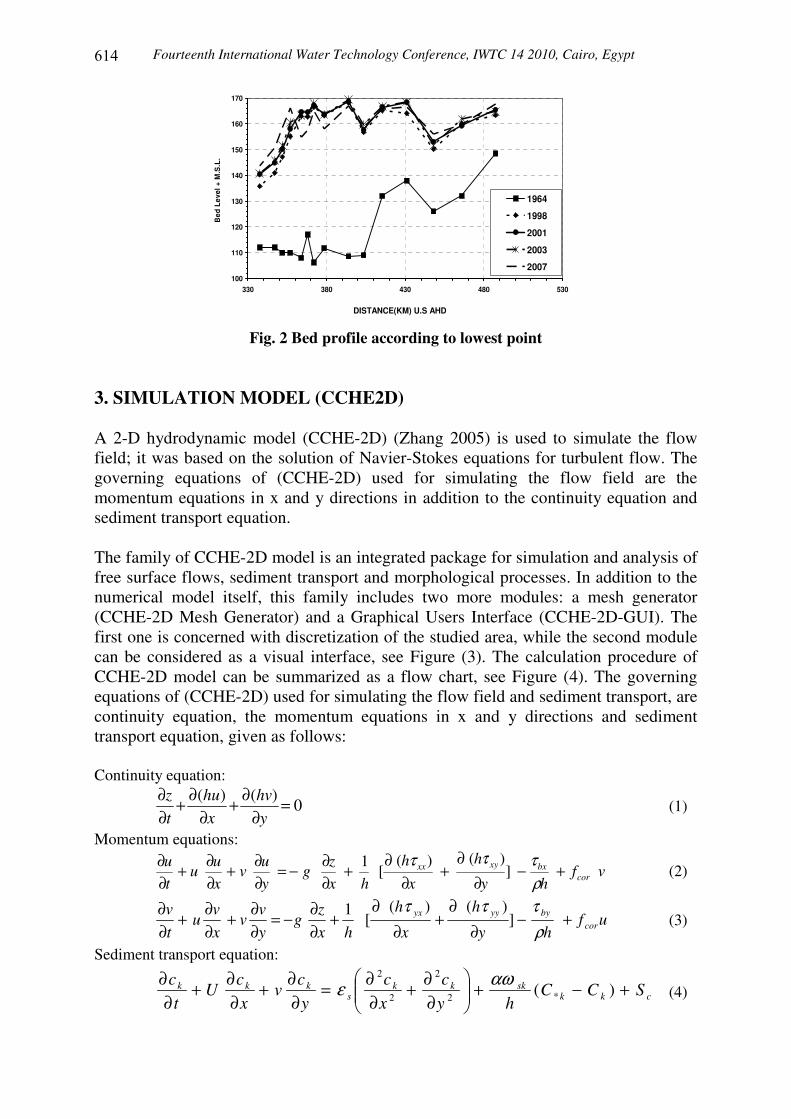
For the first stage, many researches were done. The most important ones can be presented as follows: Hurst (1952) estimated the average proportions for the suspended matter carried by the flood based on the measured sediment concentrations during the period (1929-1955). Shalash (1980) estimated Life time of AHD by 362 years. Makary (1982) used the data collected between (1964 to 1980) for sediment parameters in AHDR, to define the suspended sediment trend, the deposited sediment trend. Dahab (1983) estimated the time taken to fill the dead storage zone of the reservoir to be 310 years. El-Moattassem and Makary (1988) studied the sediment balance in AHDR during the period from (1964 to 1985). They estimated the deposited volume to be 1650 million m3. The most important research in the second stage can be presented as follows: Abdel-Aziz (1991) developed a one dimensional model to simulate and predict the bed profile in HADR in the longitudinal direction. The model is based on the principal equations of water volume conservation, water momentum conservation and general sediment transport equations. Abdel-Aziz (1997) developed a new approach to predict the bed profile in the longitudinal and transverse direction in AHDR. El-Sersawy (2005) using geographic information system (GIS) results identified the major zones of sediment deposits. Amary (2008) calculated storage capacity of AHDR and established the primary base map of AHDR at year 2006. The present paper uses a two-dimensional numerical model (CCHE-2D) to study the scouring and silting processes in Aswan High Dam Reservoir. The paper focuses on a reach of the Sudanese part of the reservoir from km 500 to km 350 U.S. Aswan High Dam. The model has been applied to predict the different cross sections along the Sudanese part of the reservoir, at years 2010, 2020, 2030 and 2040. 2. STUDY AREA The present research investigates a reach of High Aswan Dam Reservoir. This reach is located from km 500 to km 350 upstream High Aswan Dam with a total length of 150 km in Sudan where the delta is formed, see Figure (1). The collected data (e.g. Bed level, velocities, discharges and suspended concentration) were collected by some authorities (Nile research institute (NRI), National water research center (NWR) and Ministry of irrigation and water Resources (NRI-MWRI 2003). The data were collected at fixed sections as tabulated in Table (1). The studied area contains 15 cross sections. The longitudinal profile based on the lowest bed elevations of the reservoir from year 1964 to 2007 was conducted, see Figure (2). It was observed that, the thickness of the deposition layer raised by about 60 meters within the last 43 years at the entrance of the reservoir.
Fourteenth International Water Technology Conference, IWTC 14 2010, Cairo, Egypt
���
AldekkaOmka
Dahmeet
Malek N
aser
Aldwayshat
Semmna
AtiryKgenarity
Algandal Althany
Madek AmkaMorshed
Amka
Abd-Elkader
Gomay
SaraArkinDebrosaDogeem
ToshkaAbo Simble
Adindan
Masmas
Garf Husin
Almadik
KoreskoAbrim
Merwaw
Study Area
Egy
pt B
orde
rSu
dan
Bor
der
350
KM
150
KM
23
19
16
13
10
86
D
28
27
26
25
2422
Fig. 1 A sketch for the studied area
Table 1 Length and width of cross sections under study, Amary (2008)
Section Code
Station Name
Distance U.S. HAD (km)
Width of cross section
(m)
Representing length (km)
23 Daka 487.50 480.0 17.00 19 Okma 466.00 610.0 19.50 16 Malik EL Nasser 448.00 1045.0 17.50 13 EL Dowashate 431.00 1228.50 16.25 10 Atheri 415.50 1067.20 13.75 8 Semna 403.50 975.70 15.75 6 Kajnarity 394.00 1281.10 12.50 3 EL Mourshed 378.50 1278.60 11.00 D Gami 372.00 1605.0 5.25 28 Madik Amka 368.00 2502.0 4.00 27 Amka 364.00 4588.70 8.00 26 2nd cataract 357.00 5183.30 8.50 25 Abel kader 352.00 12125.60 5.00 24 Doghim 347.00 5559.70 7.25 22 Debrosa 337.50 9900.0 9.00
Fourteenth International Water Technology Conference, IWTC 14 2010, Cairo, Egypt
���
100
110
120
130
140
150
160
170
330 380 430 480 530
DISTANCE(KM) U.S AHD
Bed
Lev
el +
M.S
.L.
1964
1998
2001
2003
2007
Fig. 2 Bed profile according to lowest point
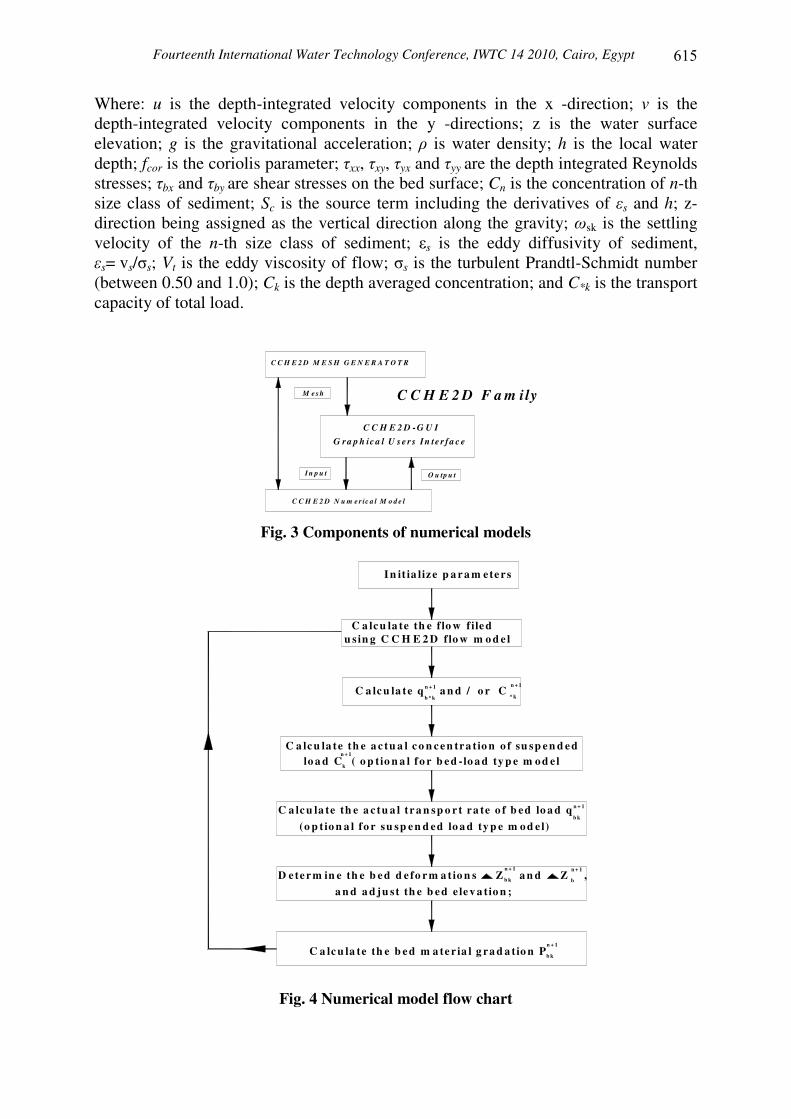
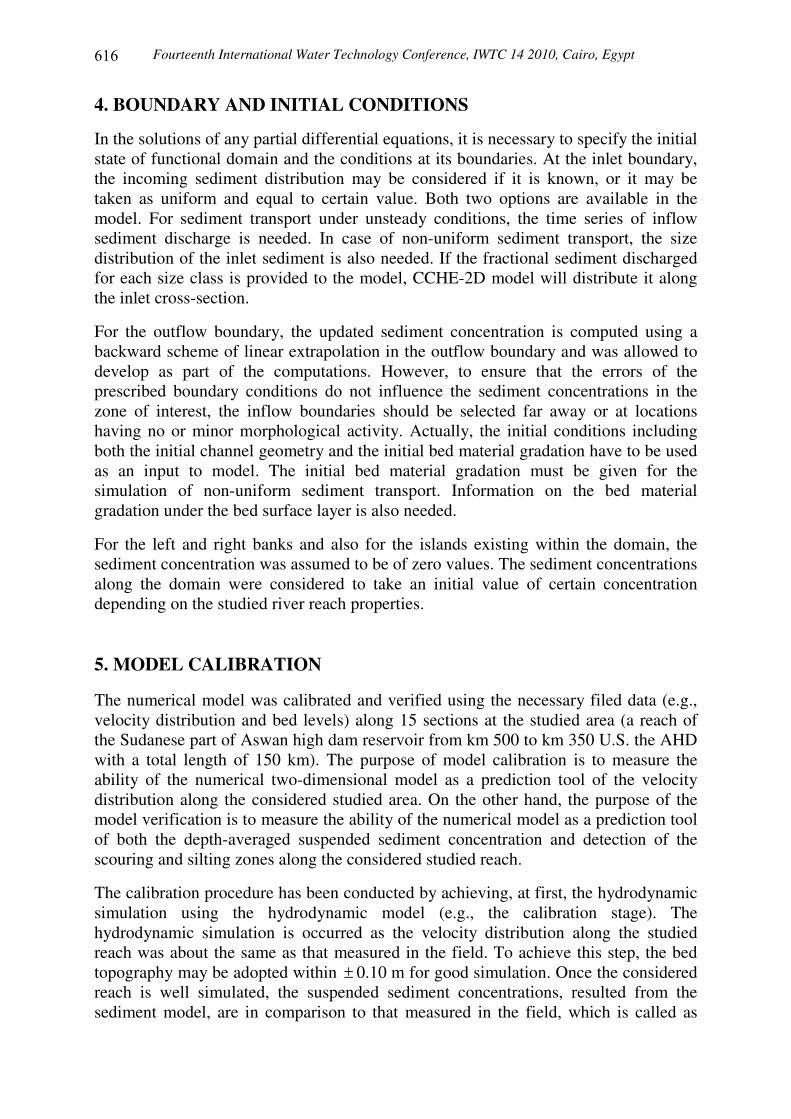
3. SIMULATION MODEL (CCHE2D) A 2-D hydrodynamic model (CCHE-2D) (Zhang 2005) is used to simulate the flow field; it was based on the solution of Navier-Stokes equations for turbulent flow. The governing equations of (CCHE-2D) used for simulating the flow field are the momentum equations in x and y directions in addition to the continuity equation and sediment transport equation. The family of CCHE-2D model is an integrated package for simulation and analysis of free surface flows, sediment transport and morphological processes. In addition to the numerical model itself, this family includes two more modules: a mesh generator (CCHE-2D Mesh Generator) and a Graphical Users Interface (CCHE-2D-GUI). The first one is concerned with discretization of the studied area, while the second module can be considered as a visual interface, see Figure (3). The calculation procedure of CCHE-2D model can be summarized as a flow chart, see Figure (4). The governing equations of (CCHE-2D) used for simulating the flow field and sediment transport, are continuity equation, the momentum equations in x and y directions and sediment transport equation, given as follows: Continuity equation:
0)()( =
∂∂+
∂∂+
∂∂
yhv
xhu
tz
(1)
Momentum equations:
vfhy
h
xh
hxz
gyu
vxu
utu
corbxxyxx +−
∂∂
+∂
∂+
∂∂−=
∂∂+
∂∂+
∂∂
ρτττ
])()(
[1
(2)
ufhy
h
x
h
hxz
gyv
vxv
utv
corbyyyyx +−
∂∂
+∂
∂+
∂∂−=
∂∂+
∂∂+
∂∂
ρτττ
])()(
[1
(3)
Sediment transport equation:
ckkskkk
skkk SCC
hyc
xc
yc
vxc
Ut
c +−+���
����
�
∂∂+
∂∂=
∂∂+
∂∂+
∂∂
)( *2
2
2
2 αωε (4)
Fourteenth International Water Technology Conference, IWTC 14 2010, Cairo, Egypt
���
Where: u is the depth-integrated velocity components in the x -direction; v is the depth-integrated velocity components in the y -directions; z is the water surface elevation; g is the gravitational acceleration; � is water density; h is the local water depth; fcor is the coriolis parameter; �xx, �xy, �yx and �yy are the depth integrated Reynolds stresses; �bx and �by are shear stresses on the bed surface; Cn is the concentration of n-th size class of sediment; Sc is the source term including the derivatives of �s and h; z-direction being assigned as the vertical direction along the gravity; �sk is the settling velocity of the n-th size class of sediment; �s is the eddy diffusivity of sediment, �s= vs/�s; Vt is the eddy viscosity of flow; �s is the turbulent Prandtl-Schmidt number (between 0.50 and 1.0); Ck is the depth averaged concentration; and C*k is the transport capacity of total load.
G r a p h ic a l U s e r s In te r fa c e
C C H E 2 D M E S H G E N E R A T O T R
M e s h
O u tp u tI n p u t
C C H E 2 D N u m e r ic a l M o d e l
C C H E 2 D F a m ily
C C H E 2 D -G U I
Fig. 3 Components of numerical models
C a lc u la te th e a c tu a l c o n c e n tra tio n o f su sp e n d e dlo a d C ( o p tio n a l fo r b e d -lo a d ty p e m o d el
n + 1
k
C a lc u la te th e a c tu a l tr a n sp o r t ra te o f b ed lo a d q (o p t io n a l fo r su sp e n d ed lo a d ty p e m o d el)
n + 1
b k
D e te r m in e th e b e d d e fo r m a t io n s Z a n d Z , a n d a d ju st th e b e d e le v a tio n ;
n + 1
b k
n + 1
b
C a lc u la te th e b e d m a te r ia l g ra d a tio n Pn + 1
b k
I n it ia liz e p a r a m ete rs
u s in g C C H E 2 D flo w m o d e l
C a lc u la te q a n d / o r Cn + 1
b * k * k
n + 1
C a lc u la te th e f lo w f ile d
Fig. 4 Numerical model flow chart
Fourteenth International Water Technology Conference, IWTC 14 2010, Cairo, Egypt
���
4. BOUNDARY AND INITIAL CONDITIONS
In the solutions of any partial differential equations, it is necessary to specify the initial state of functional domain and the conditions at its boundaries. At the inlet boundary, the incoming sediment distribution may be considered if it is known, or it may be taken as uniform and equal to certain value. Both two options are available in the model. For sediment transport under unsteady conditions, the time series of inflow sediment discharge is needed. In case of non-uniform sediment transport, the size distribution of the inlet sediment is also needed. If the fractional sediment discharged for each size class is provided to the model, CCHE-2D model will distribute it along the inlet cross-section.
For the outflow boundary, the updated sediment concentration is computed using a backward scheme of linear extrapolation in the outflow boundary and was allowed to develop as part of the computations. However, to ensure that the errors of the prescribed boundary conditions do not influence the sediment concentrations in the zone of interest, the inflow boundaries should be selected far away or at locations having no or minor morphological activity. Actually, the initial conditions including both the initial channel geometry and the initial bed material gradation have to be used as an input to model. The initial bed material gradation must be given for the simulation of non-uniform sediment transport. Information on the bed material gradation under the bed surface layer is also needed.
For the left and right banks and also for the islands existing within the domain, the sediment concentration was assumed to be of zero values. The sediment concentrations along the domain were considered to take an initial value of certain concentration depending on the studied river reach properties. 5. MODEL CALIBRATION The numerical model was calibrated and verified using the necessary filed data (e.g., velocity distribution and bed levels) along 15 sections at the studied area (a reach of the Sudanese part of Aswan high dam reservoir from km 500 to km 350 U.S. the AHD with a total length of 150 km). The purpose of model calibration is to measure the ability of the numerical two-dimensional model as a prediction tool of the velocity distribution along the considered studied area. On the other hand, the purpose of the model verification is to measure the ability of the numerical model as a prediction tool of both the depth-averaged suspended sediment concentration and detection of the scouring and silting zones along the considered studied reach.
The calibration procedure has been conducted by achieving, at first, the hydrodynamic simulation using the hydrodynamic model (e.g., the calibration stage). The hydrodynamic simulation is occurred as the velocity distribution along the studied reach was about the same as that measured in the field. To achieve this step, the bed topography may be adopted within ± 0.10 m for good simulation. Once the considered reach is well simulated, the suspended sediment concentrations, resulted from the sediment model, are in comparison to that measured in the field, which is called as
Fourteenth International Water Technology Conference, IWTC 14 2010, Cairo, Egypt
��
verification stage. Moreover, the scour and silting zones may be detected and defined along the studied reach.
The studied area has been schematized using a rectangular uniform mesh in the longitudinal direction with grid size (∆x = 250 m to 150 m), while in the lateral direction, the grid size was (∆y = 120 to 50 m). It is very important to satisfy the hydrodynamic model calibration before using its velocity computations for prediction of sediment concentration.
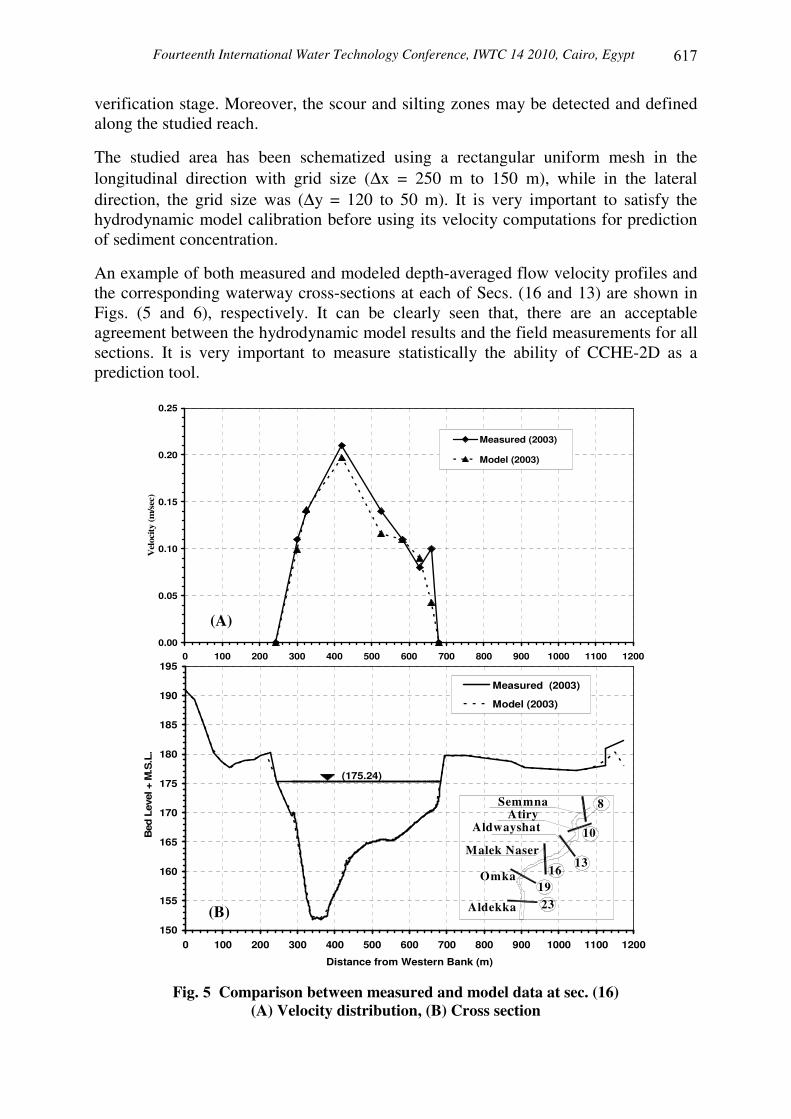
An example of both measured and modeled depth-averaged flow velocity profiles and the corresponding waterway cross-sections at each of Secs. (16 and 13) are shown in Figs. (5 and 6), respectively. It can be clearly seen that, there are an acceptable agreement between the hydrodynamic model results and the field measurements for all sections. It is very important to measure statistically the ability of CCHE-2D as a prediction tool.
Fig. � Comparison between measured and model data at sec. (16) (A) Velocity distribution, (B) Cross section
0.00
0.05
0.10
0.15
0.20
0.25
0 100 200 300 400 500 600 700 800 900 1000 1100 1200Distance from Western Bank (m)
Vel
ocity
(m/s
ec)
Measured (2003)
Model (2003)
150
155
160
165
170
175
180
185
190
195
0 100 200 300 400 500 600 700 800 900 1000 1100 1200
Distance from Western Bank (m)
Bed
Lev
el +
M.S
.L.
Measured (2003)
Model (2003)
(175.24)
Omka
Malek Naser
Aldwayshat
SemmnaAtiry
2319
16 13
10
8
Aldekka(B)
(A)
Fourteenth International Water Technology Conference, IWTC 14 2010, Cairo, Egypt
��
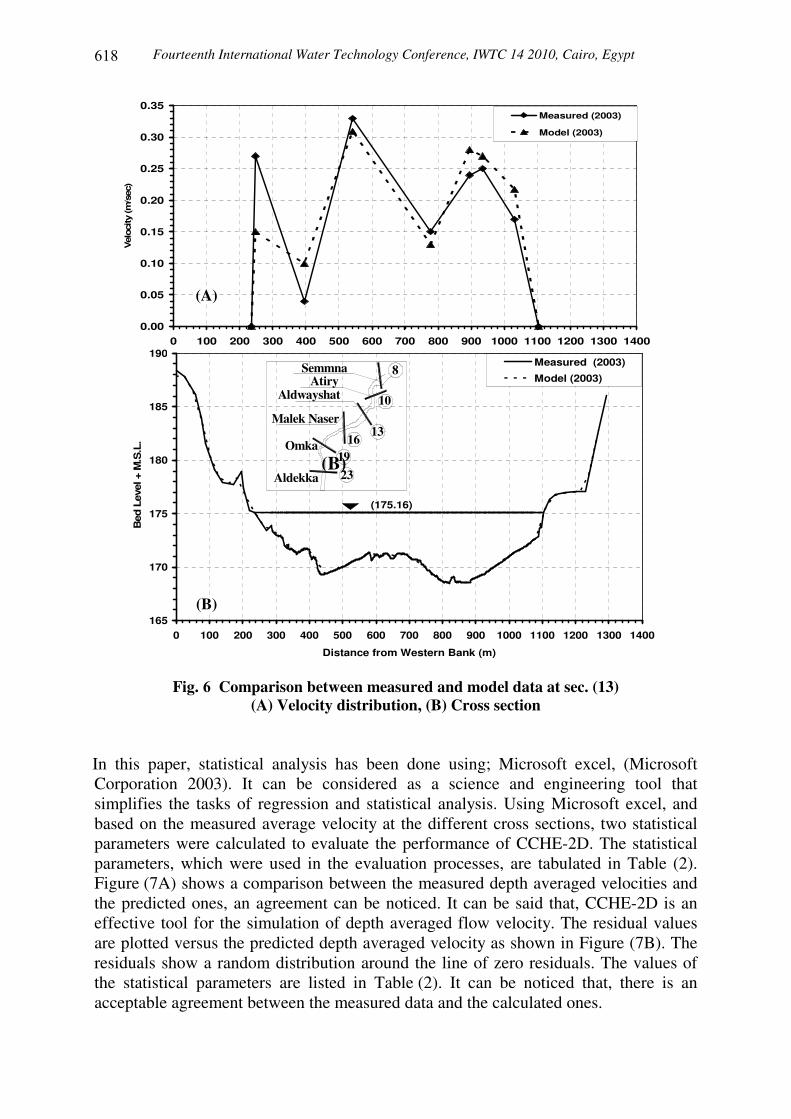
Fig. � Comparison between measured and model data at sec. (13) (A) Velocity distribution, (B) Cross section
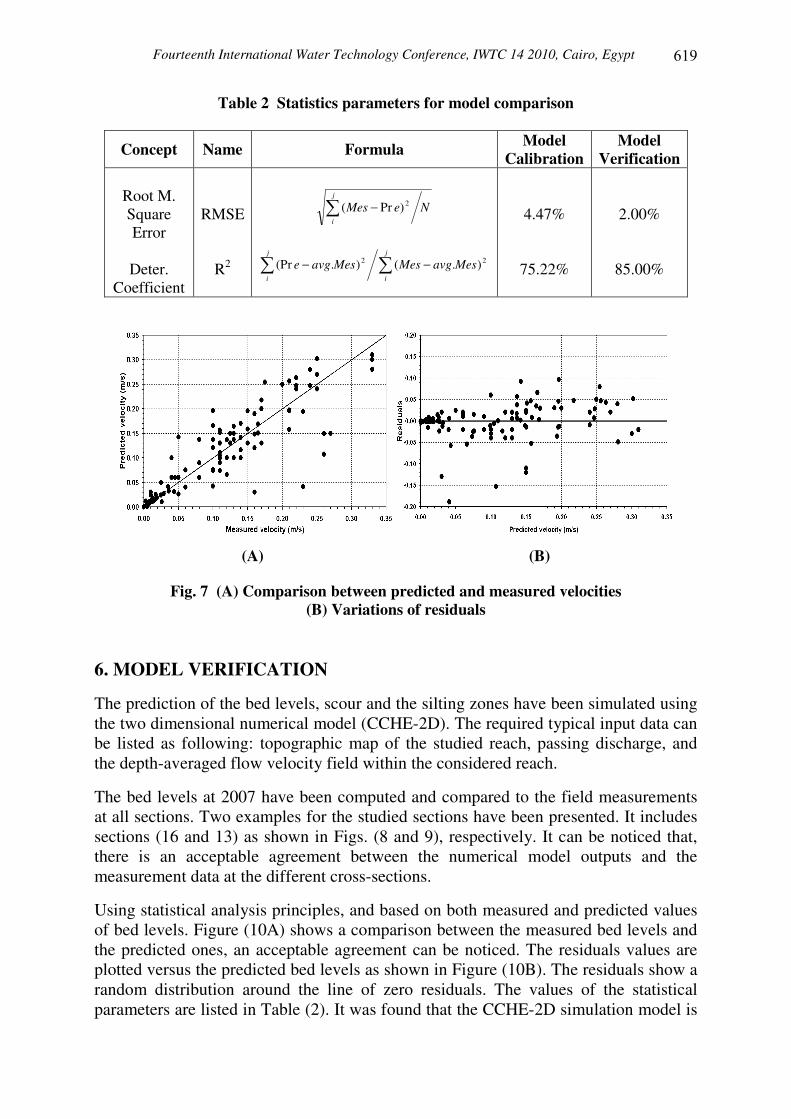
In this paper, statistical analysis has been done using; Microsoft excel, (Microsoft Corporation 2003). It can be considered as a science and engineering tool that simplifies the tasks of regression and statistical analysis. Using Microsoft excel, and based on the measured average velocity at the different cross sections, two statistical parameters were calculated to evaluate the performance of CCHE-2D. The statistical parameters, which were used in the evaluation processes, are tabulated in Table (2). Figure (7A) shows a comparison between the measured depth averaged velocities and the predicted ones, an agreement can be noticed. It can be said that, CCHE-2D is an effective tool for the simulation of depth averaged flow velocity. The residual values are plotted versus the predicted depth averaged velocity as shown in Figure (7B). The residuals show a random distribution around the line of zero residuals. The values of the statistical parameters are listed in Table (2). It can be noticed that, there is an acceptable agreement between the measured data and the calculated ones.
0.00
0.05
0.10
0.15
0.20
0.25
0.30
0.35
0 100 200 300 400 500 600 700 800 900 1000 1100 1200 1300 1400
Distance from Western Bank (m)
Vel
ocity
(m/s
ec)
Measured (2003)
Model (2003)
165
170
175
180
185
190
0 100 200 300 400 500 600 700 800 900 1000 1100 1200 1300 1400
Distance from Western Bank (m)
Bed
Lev
el +
M.S
.L.
Measured (2003)
Model (2003)
(175.16)
(A)
(B)
Omka
Malek Naser
Aldwayshat
SemmnaAtiry
2319
16 13
10
8
Aldekka(B)
Fourteenth International Water Technology Conference, IWTC 14 2010, Cairo, Egypt
���
Table 2 Statistics parameters for model comparison
Concept Name Formula Model Calibration
Model Verification
Root M. Square Error
Deter.
Coefficient
RMSE
R2
NeMesj
i� − 2)Pr(
�� −−j
i
j
i
MesavgMesMesavge 22 ).().(Pr
4.47%
75.22%
2.00%
85.00%
(A) (B) ��
Fig. 7 (A) Comparison between predicted and measured velocities (B) Variations of residuals
6. MODEL VERIFICATION
The prediction of the bed levels, scour and the silting zones have been simulated using the two dimensional numerical model (CCHE-2D). The required typical input data can be listed as following: topographic map of the studied reach, passing discharge, and the depth-averaged flow velocity field within the considered reach.
The bed levels at 2007 have been computed and compared to the field measurements at all sections. Two examples for the studied sections have been presented. It includes sections (16 and 13) as shown in Figs. (8 and 9), respectively. It can be noticed that, there is an acceptable agreement between the numerical model outputs and the measurement data at the different cross-sections.
Using statistical analysis principles, and based on both measured and predicted values of bed levels. Figure (10A) shows a comparison between the measured bed levels and the predicted ones, an acceptable agreement can be noticed. The residuals values are plotted versus the predicted bed levels as shown in Figure (10B). The residuals show a random distribution around the line of zero residuals. The values of the statistical parameters are listed in Table (2). It was found that the CCHE-2D simulation model is
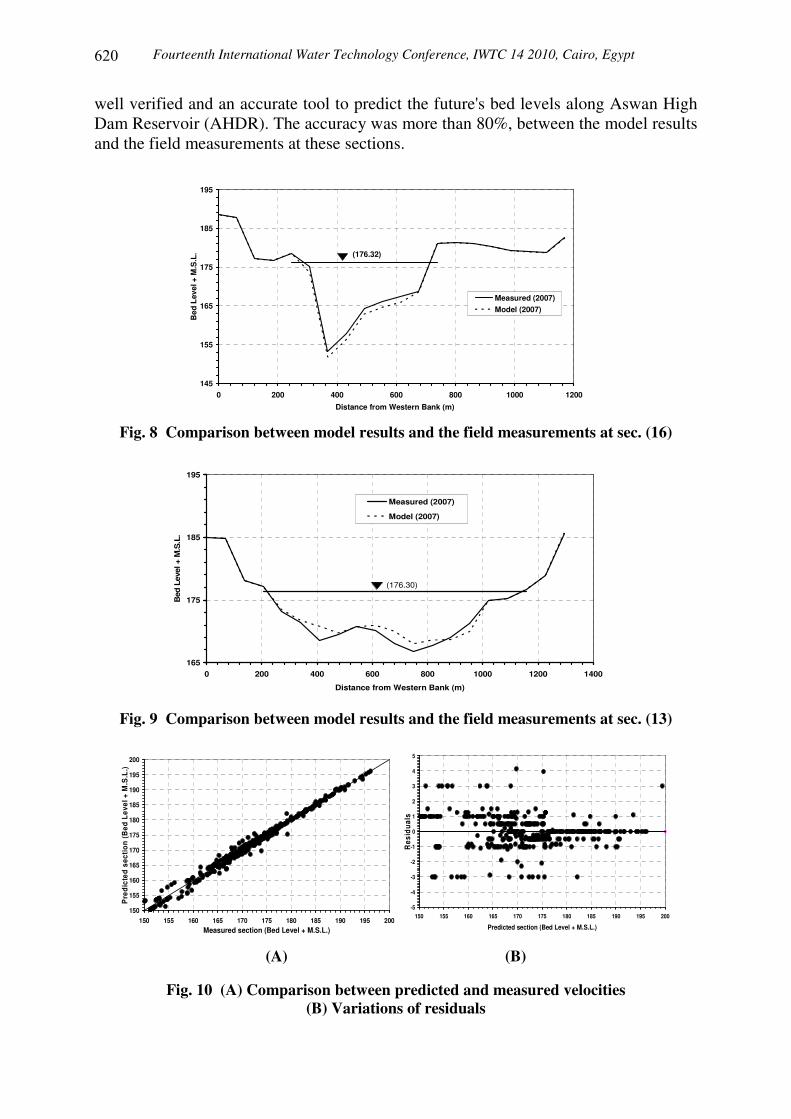
Fourteenth International Water Technology Conference, IWTC 14 2010, Cairo, Egypt
��
well verified and an accurate tool to predict the future's bed levels along Aswan High Dam Reservoir (AHDR). The accuracy was more than 80%, between the model results and the field measurements at these sections.
145
155
165
175
185
195
0 200 400 600 800 1000 1200
Distance from Western Bank (m)
Bed
Lev
el +
M.S
.L.
Measured (2007)Model (2007)
(176.32)
Fig. 8 Comparison between model results and the field measurements at sec. (16)
165
175
185
195
0 200 400 600 800 1000 1200 1400
Distance from Western Bank (m)
Bed
Lev
el +
M.S
.L.
Measured (2007)
Model (2007)
(176.30)
Fig. 9 Comparison between model results and the field measurements at sec. (13)
150
155
160
165
170
175
180
185
190
195
200
150 155 160 165 170 175 180 185 190 195 200Measured section (Bed Level + M.S.L.)
Pre
dict
ed s
ectio
n (B
ed L
evel
+ M
.S.L
.)
-5
-4
-3
-2
-1
0
1
2
3
4
5
150 155 160 165 170 175 180 185 190 195 200
Predicted section (Bed Level + M.S.L.)
Res
idua
ls
(A) (B)
Fig. 10 (A) Comparison between predicted and measured velocities
(B) Variations of residuals
Fourteenth International Water Technology Conference, IWTC 14 2010, Cairo, Egypt
���
7. PREDICATION OF LIFE TIME SPAN OF HADR The calibrated and verified two-dimensional sediment transport model (CCHE-2D) has been applied to solve the natural sediment problems at the entrance of Aswan High Dam Reservoir (e.g., the entrance section of the reservoir (Sudanese part)). The main purpose of this application is to determine the life time span of the dead zone and life zone of the AHDR. In addition, the traditional method, (e.g., Cross-section method) is used to determine the life time span of the reservoir. Finally, both methods are compared. 7.1 Traditional Method Traditional method, (i.e., cross-section method) is used to calculate the life time span of AHDR in a wide range before year 1985 as reported by Abdel-Aziz (1991). The procedure of the traditional method to calculate the life time span of the reservoir can be summarized as follows:
- Calculating the cross section area of all sections for years 1964 and 2007, - Calculating deposited volume for all sections, see Table (3), - Calculating accumulated deposited volume in the reservoir, and - Calculating of the average life time span of the dead zone by (dividing the
Designed Dead Storage Volume of the reservoir (DDSV = 31.6 billions m3) on the accumulated volume.
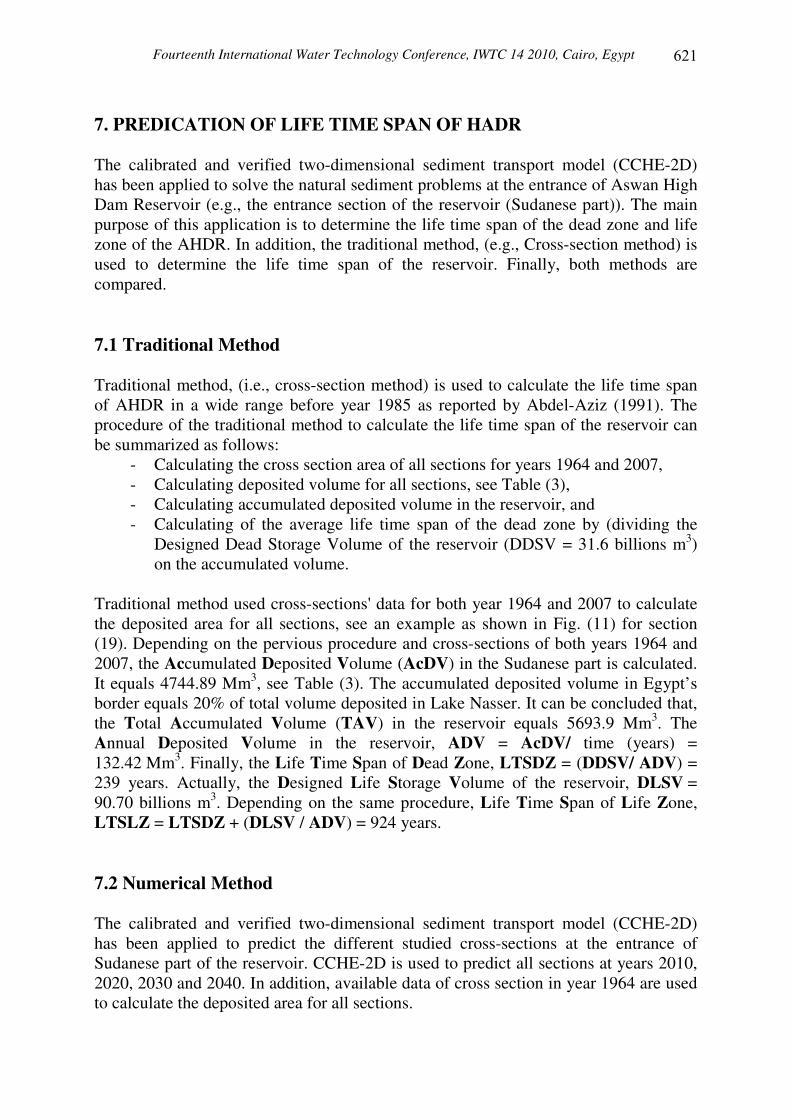
Traditional method used cross-sections' data for both year 1964 and 2007 to calculate the deposited area for all sections, see an example as shown in Fig. (11) for section (19). Depending on the pervious procedure and cross-sections of both years 1964 and 2007, the Accumulated Deposited Volume (AcDV) in the Sudanese part is calculated. It equals 4744.89 Mm3, see Table (3). The accumulated deposited volume in Egypt’s border equals 20% of total volume deposited in Lake Nasser. It can be concluded that, the Total Accumulated Volume (TAV) in the reservoir equals 5693.9 Mm3. The Annual Deposited Volume in the reservoir, ADV = AcDV/ time (years) = 132.42 Mm3. Finally, the Life Time Span of Dead Zone, LTSDZ = (DDSV/ ADV) = 239 years. Actually, the Designed Life Storage Volume of the reservoir, DLSV = 90.70 billions m3. Depending on the same procedure, Life Time Span of Life Zone, LTSLZ = LTSDZ + (DLSV / ADV) = 924 years. 7.2 Numerical Method The calibrated and verified two-dimensional sediment transport model (CCHE-2D) has been applied to predict the different studied cross-sections at the entrance of Sudanese part of the reservoir. CCHE-2D is used to predict all sections at years 2010, 2020, 2030 and 2040. In addition, available data of cross section in year 1964 are used to calculate the deposited area for all sections.
Fourteenth International Water Technology Conference, IWTC 14 2010, Cairo, Egypt
���
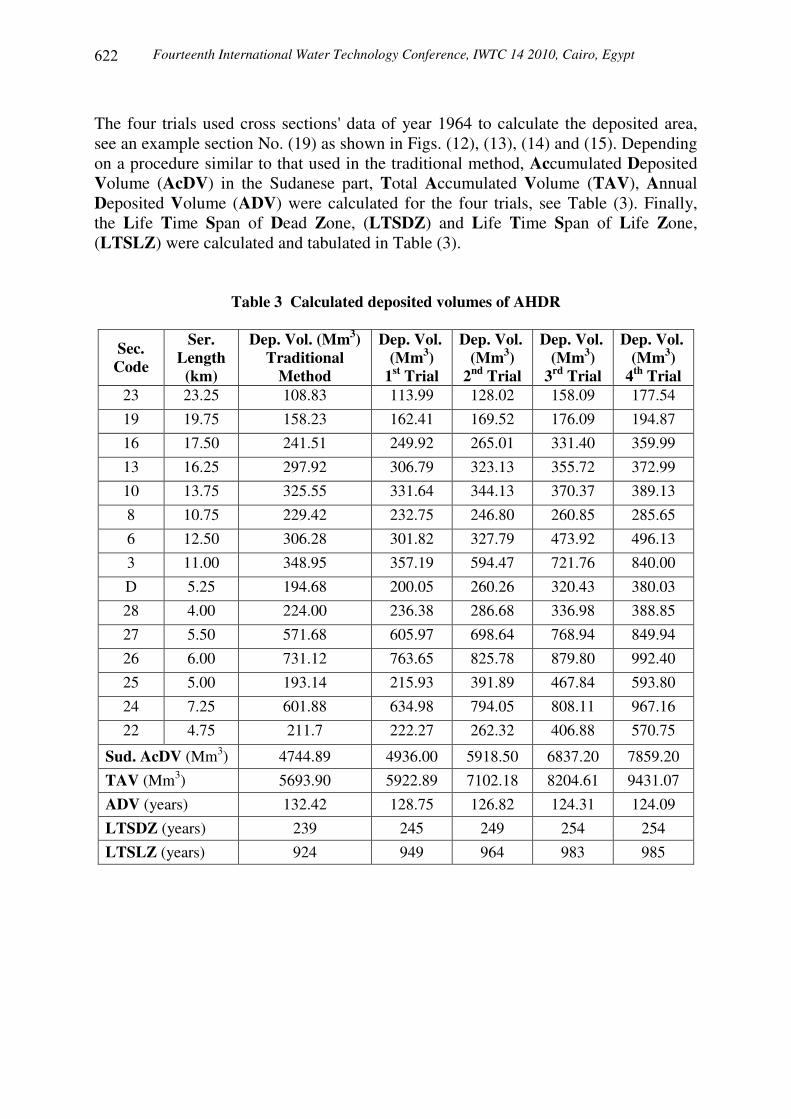
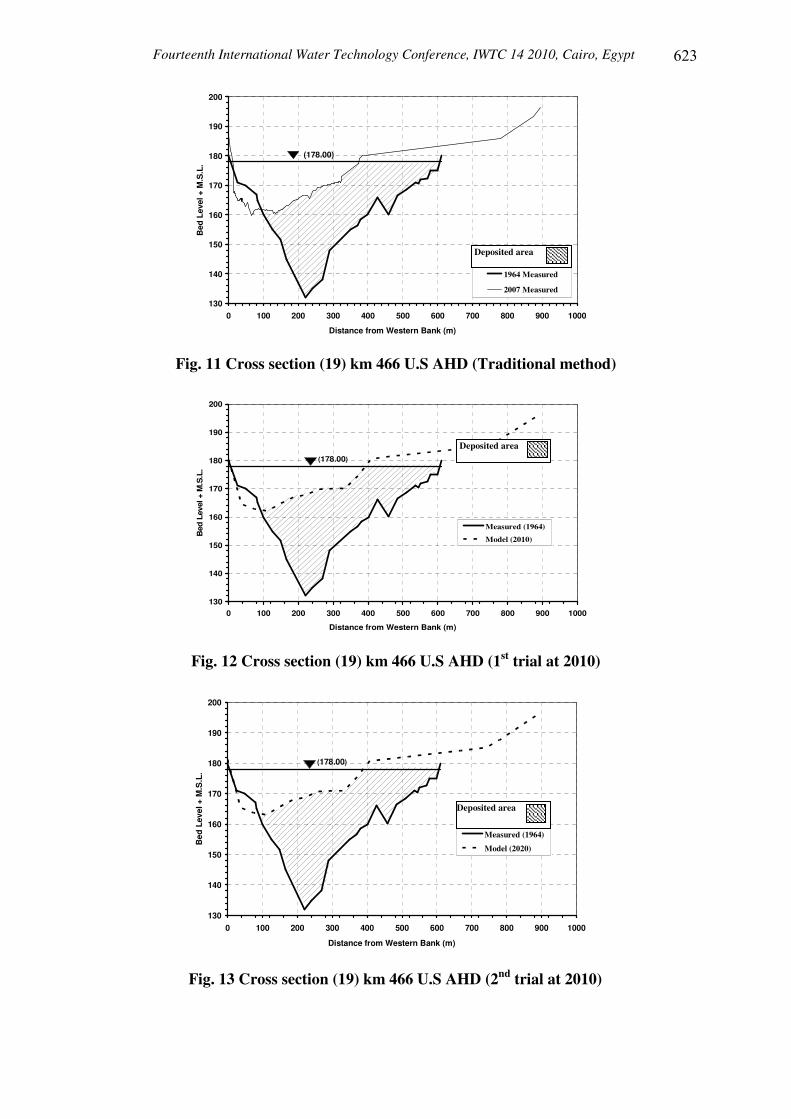
The four trials used cross sections' data of year 1964 to calculate the deposited area, see an example section No. (19) as shown in Figs. (12), (13), (14) and (15). Depending on a procedure similar to that used in the traditional method, Accumulated Deposited Volume (AcDV) in the Sudanese part, Total Accumulated Volume (TAV), Annual Deposited Volume (ADV) were calculated for the four trials, see Table (3). Finally, the Life Time Span of Dead Zone, (LTSDZ) and Life Time Span of Life Zone, (LTSLZ) were calculated and tabulated in Table (3).
Table 3 Calculated deposited volumes of AHDR
Sec. Code
Ser. Length
(km)
Dep. Vol. (Mm3) Traditional
Method
Dep. Vol. (Mm3)
1st Trial
Dep. Vol. (Mm3)
2nd Trial
Dep. Vol. (Mm3)
3rd Trial
Dep. Vol. (Mm3)
4th Trial 23 23.25 108.83 113.99 128.02 158.09 177.54 19 19.75 158.23 162.41 169.52 176.09 194.87 16 17.50 241.51 249.92 265.01 331.40 359.99 13 16.25 297.92 306.79 323.13 355.72 372.99 10 13.75 325.55 331.64 344.13 370.37 389.13 8 10.75 229.42 232.75 246.80 260.85 285.65 6 12.50 306.28 301.82 327.79 473.92 496.13 3 11.00 348.95 357.19 594.47 721.76 840.00 D 5.25 194.68 200.05 260.26 320.43 380.03 28 4.00 224.00 236.38 286.68 336.98 388.85 27 5.50 571.68 605.97 698.64 768.94 849.94 26 6.00 731.12 763.65 825.78 879.80 992.40 25 5.00 193.14 215.93 391.89 467.84 593.80 24 7.25 601.88 634.98 794.05 808.11 967.16 22 4.75 211.7 222.27 262.32 406.88 570.75
Sud. AcDV (Mm3) 4744.89 4936.00 5918.50 6837.20 7859.20 TAV (Mm3) 5693.90 5922.89 7102.18 8204.61 9431.07 ADV (years) 132.42 128.75 126.82 124.31 124.09 LTSDZ (years) 239 245 249 254 254 LTSLZ (years) 924 949 964 983 985
Fourteenth International Water Technology Conference, IWTC 14 2010, Cairo, Egypt
���
Fig. 11 Cross section (19) km 466 U.S AHD (Traditional method)
Fig. 12 Cross section (19) km 466 U.S AHD (1st trial at 2010)
Fig. 13 Cross section (19) km 466 U.S AHD (2nd trial at 2010)
130
140
150
160
170
180
190
200
0 100 200 300 400 500 600 700 800 900 1000
Distance from Western Bank (m)
Bed
Lev
el +
M.S
.L.
Measured (1964)
Model (2010)
(178.00)
Deposited area
130
140
150
160
170
180
190
200
0 100 200 300 400 500 600 700 800 900 1000
Distance from Western Bank (m)
Bed
Lev
el +
M.S
.L.
Measured (1964)
Model (2020)
(178.00)
Deposited area
130
140
150
160
170
180
190
200
0 100 200 300 400 500 600 700 800 900 1000
Distance from Western Bank (m)
Bed
Lev
el +
M.S
.L.
1964 Measured
2007 Measured
(178.00)
Deposited area
Fourteenth International Water Technology Conference, IWTC 14 2010, Cairo, Egypt
���
Fig. 14 Cross section (19) km 466 U.S AHD (3rd trial at 2010)
Fig. 15 Cross section (19) km 466 U.S AHD (4th trial at 2010) 9. CONCLUSIONS A two-dimensional numerical model (CCHE-2D) has been used to study the sedimentation processes in Aswan High Dam Reservoir for a reach in the Sudanese part from km 500 to km 350 U.S. with a total length of 150 km. It can be concluded the following: 1- The two-dimensional numerical model (CCHE-2D) has been calibrated and verified
using field data for 15- cross sections. The results showed that, there is an acceptable agreement between the model results and the field measurements for all sections.
2- Using Microsoft excel, and based on the measured data at the different cross sections, two statistical parameters were calculated to evaluate the performance of CCHE-2D. Based on the values of the statistical parameters, it can be concluded
130
140
150
160
170
180
190
200
0 100 200 300 400 500 600 700 800 900 1000
Distance from Western Bank (m)
Bed
Lev
el +
M.S
.L.
Measured (1964)
Model (2030)
(178.00)
Deposited area
130
140
150
160
170
180
190
200
0 100 200 300 400 500 600 700 800 900 1000
Distance from Western Bank (m)
Bed
Lev
el +
M.S
.L.
Measured (1964)
Model (2040)
(178.00)
Deposited area
Fourteenth International Water Technology Conference, IWTC 14 2010, Cairo, Egypt
���
that, CCHE-2D is an effective tool for the simulation of both flow field and sediment concentrations.
3- The calibrated and the verified two-dimensional sediment transport model (CCHE-2D) has been applied to calculate the life time span of AHDR. It has been applied to predict the different cross sections at the entrance of Sudanese part of the reservoir, at years 2010, 2020, 2030 and 2040. The estimation procedure to calculate the life time span of the reservoir has been applied for the pervious stages.
4- The results showed that, the steady value of Life Time Span of Dead Zone, LTSDZ is 254 years. In addition, the steady value of Life Time Span of Life Zone, LTSLZ is 985 years.
NOMENCLATURE The following symbols were used in this study:
Cn concentration of n-th size class of sediment; [ML-3], Ck depth averaged concentration; [ML-3], C*k transport capacity of total load; [ML-3], g acceleration due to gravity; [LT-2], h local water depth; [L], u depth-integrated velocity in the x -direction; [LT-1], v depth-integrated velocity in the y -direction; [LT-1], x, y coordinate system; [-], z water surface elevation; [L], ρ mass density of water [ML-3], �bx and �by shear stresses on the bed surface; [ML-1T-2], and �sk settling velocity of the n-th size class of sediment; [LT-1].
REFERENCES [1] Abdel-Aziz, T.M. (1991), Numerical modeling of sediment transport and
consolidation in the Aswan high Dam Reservoir, M.Sc. thesis, Laboratory of hydrology, Free University of Brussels, VUB, Belgium.
[2] Abdel-Aziz, T.M. (1997), Prediction of bed profile in the longitudinal and transverse direction in Aswan high dam reservoir, Ph.D. Thesis, Cairo University, Giza, Egypt.
[3] Amary, W. (2008), Study the sedimentation inside High Aswan Dam Reservoir, M.Sc. Thesis, Faculty of Engineering, Cairo University, Egypt.
[4] Dahab, A.H. (1983), Lake Nasser area between Abu-Simble and Dall cataract, Ph.D. Thesis, Univ. of Ain Shams, Egypt.
[5] El-Moattassem, M., and Makary, A.Z. (1988), Sedimentation balance in the Aswan High Dam reservoir, Report 110 NRI, Cairo, Egypt.
[6] EL-Sersawy, H. (2005), Development of decision support system (D.S.S) for Aswan High Dam Reservoir sedimentation, National Water Research Center (N.W.R.C.), Cairo, Egypt.
Fourteenth International Water Technology Conference, IWTC 14 2010, Cairo, Egypt
���
[7] NRI- MWRI (2003), Final repot of Nile Research Institute, El-Qanater, Egypt. [8] Hurst, H.E. (1952), the Nile, a General Account of the River and the utilization
of its Waters, pp 237-279, Publisher Constable and Company LTD, London, UK.
[9] Makary, A.Z. (1982), Sedimentation in the high Aswan Dam reservoir, Ph.D. thesis, Faculty of Engineering, Ain Shams University, Egypt.
[10] Microsoft corporation, Microsoft office excel 2003, product ID 73931-640-0000106-57348, U.S.A.
[11] Shalash, S. (1980), Effect of sedimentation on storage capacity of high Aswan Dam Lake, Paper No. 56, El-Qanater, Egypt.
[12] Zhang, Y. (2005), CCHE2D-GUI – Graphical User Interface for the CCHE2D Model, User’s Manual – Version 2.2, Technical Report No. NCCHE-TR-2005-03, The University of Mississippi.