High Strength Long Span Structures - Publications Office of ...
135
High Strength Long Span Structures (HILONG) EUR 28450 EN ISSN 1831-9424 (PDF) ISSN 1018-5593 (Printed)
-
Upload
khangminh22 -
Category
Documents
-
view
2 -
download
0
Transcript of High Strength Long Span Structures - Publications Office of ...

High Strength Long Span Structures
(HILONG)
Research and Innovation EUR 28450 EN
ISSN 1831-9424 (PDF)ISSN 1018-5593 (Printed)
EUR 28450
High Strength Long Span Structures (HILON
G)EU

EUROPEAN COMMISSION Directorate-General for Research and Innovation Directorate D — Industrial Technologies Unit D.4 — Coal and Steel
E-mail: [email protected] [email protected]
Contact: RFCS Publications
European Commission B-1049 Brussels
European Commission
Research Fund for Coal and SteelHigh Strength Long Span Structures
(HILONG)
N. Baddoo, E. Aggelopoulos and A. ChenThe Steel Construction Institute (SCI)
Silwood Park, Ascot, Berks, SL5 7QN, UNITED KINGDOM
F. McCormickBuro Happold (Subcontracted to SCI)
Camden Mill, 230 Lower Bristol Road, Bath, BA2 3DQ, UNITED KINGDOM
L. S. da Silva and J. P. MartinsUniversity of Coimbra (UC)
R. Luis Reis Santos, 3030-788 Coimbra, PORTUGAL
P. Manoleas, E. Koltsakis, M. Veljkovic and A. TranLuleå University of Technology (LTU)
SE-97187 Luleå, SWEDEN
C. Baniotopoulos, M. Theofanous and M. GkantouUniversity of Birmingham (UofB)
Edgbaston, Birmingham, B15 2TT, UNITED KINGDOM
L. Gardner and S. AfshanImperial College of Science, Technology & Medicine (Imperial)
Imperial College London, London, SW7 2AZ, UNITED KINGDOM
L. CederfeldtSweco Structures AB (Sweco)
Sweco AB, Box 34044, S-100 26 Stockholm, SWEDEN
M. EllenS-Squared Corporation Pty Ltd (S-Squared)
Suite 2.9, 56 Delhi Rd, North Ryde NSW 2113, AUSTRALIA
C. RemdeVallourec Deutschland GmbH
Werk Düsseldorf-Rath, Rather Kreuzweg 106, 40472 Düsseldorf-Rath, GERMANY
S. Herion and O. FleischerKoRoH GmbH (Subcontracted to Vallourec)
Schönfeldstr. 8, 76131 Karlsruhe, GERMANY
Grant Agreement RFSR-CT-2012-00028 1 July 2012 to 30 June 2015
Final report
Directorate-General for Research and Innovation
2017 EUR 28450 EN

LEGAL NOTICE
Neither the European Commission nor any person acting on behalf of the Commission is responsible for the use which might be made of the following information.
The views expressed in this publication are the sole responsibility of the authors and do not necessarily reflect the views of the European Commission.
More information on the European Union is available on the Internet (http://europa.eu). Cataloguing data can be found at the end of this publication. Luxembourg: Publications Office of the European Union, 2017
Print ISBN 978-92-79-65602-6 ISSN 1018-5593 doi:10.2777/924786 KI-NA-28-450-EN-C PDF ISBN 978-92-79-65601-9 ISSN 1831-9424 doi:10.2777/904237 KI-NA-28-450-EN-N
© European Union, 2017 Reproduction is authorised provided the source is acknowledged.
Europe Direct is a service to help you find answers to your questions about the European Union
Freephone number (*):00 800 6 7 8 9 10 11
(*) Certain mobile telephone operators do not allow access to 00 800 numbers or these calls may be billed.

3
Contents
Page No
1 FINAL SUMMARY 5
2 INTRODUCTION 13
2.1 The production of high strength structural steels 13
2.2 HSS in long span applications 13
2.3 Prestressing technologies in long span applications 14
3 WP1 CASE STUDIES 15
3.1 Objectives of WP1 15
3.2 Task 1.1 Workshop 15
3.3 Tasks 1.2 and 1.3 Case studies 17
3.4 Task 1.4 Environmental impact and whole life cost comparison 26
3.5 A survey of fabricators’ experiences using HSS 32
4 WP2 MATERIALS AND SECTION DESIGN 35
4.1 Objectives of WP2 35
4.2 Task 2.1 Laboratory testing 35
4.3 Task 2.2 Numerical modelling 37
4.4 Task 2.3 Development of design rules 44
5 WP3 JOINTS 55
5.1 Objectives of WP3 55
5.2 Investigation of crocodile nose (CN) connection 55
5.3 Investigation of HSS trusses (innovative and tubular) 69
6 WP4 PRESTRESSED HSS STRUCTURES 77
6.1 Objectives of WP4 77
6.2 Task 4.1 Prestressed stayed columns 77
6.3 Task 4.2 Prestressed trusses 96
7 WP5 EXPLOITATION OF RESEARCH RESULTS 113
7.1 Objectives of WP5 113
7.2 Task 5.1 Design examples 113
7.3 Task 5.2 Contributions to European Standardisation 113
7.4 Task 5.3 Public Seminar 114
7.5 Publications arising from work carried out in HILONG 116
8 EXPLOITATION AND IMPACT OF RESEARCH 119
9 LIST OF FIGURES 121
10 LIST OF TABLES 125
11 LIST OF ACRONYMS AND ABBREVIATIONS 127
12 REFERENCES 129

4

5
1 FINAL SUMMARY
Objectives
The use of high strength steel (HSS) can lead to a significant reduction in the weight of a steel structure. A lighter structure requires smaller foundations, shorter transportation and construction
times, and leads to lower CO2 emissions and energy use (both directly in less materials used and also indirectly due to lower transportation costs). Although HSS have found application in machinery and automotives, they are not widely used in construction because the benefit of reduced weight struggles to outweigh the disadvantages of higher price/tonne, reduced availability and different weld procedures.
HILONG investigated innovative structural arrangements, design methods and cross-sections which
enabled the benefit of high strength to be maximised by suppressing buckling and reducing
deflection. The study focussed on long span applications such as stadia, auditoria, exhibition halls
etc. The strengths of HSS studied were S460 and S690.
The technical objectives of the work were:
To develop more cost-effective design methods which suit the specific material characteristics
of HSS,
To develop design methods for HSS prestressed cable-stayed columns and trusses which enable
a greater proportion of the higher strength to be utilised by suppressing buckling and limiting
deflection,
To investigate the structural performance of innovative U-shaped and semi-closed polygonal
cross-sections which enable joints to be fabricated more easily,
To develop comparative designs for two types of functionally equivalent long span structures
which demonstrate the savings possible using HSS in terms of weight, cost and environmental
indicators,
To prepare a series of design examples for members and joints which demonstrate the design
methods developed,
To hold a seminar to disseminate the results of the project to designers and other interested
parties.
The idea for the HILONG project came from Sweco, the designer of the new Friends Arena stadium
in Stockholm, which uses four grades of HSS: S460, S550, S690 and S900 in various structural forms
for the main roof truss. The use of HSS led to a reduction in the weight of steel and environmental
impact of between 13-17%. Sweco expressed an interest in studying how further cost savings could
be made if HSS was used more extensively and more efficiently in the design of the stadium roof,
and this motivation led to the definition of the HILONG research objectives.
WP1 Case studies
The objective of WP1 was to take two different structural configurations, a long span roof truss and
a prestressed cable stayed column, and prepare two functionally equivalent designs in conventional
strength steel and HSS to compare the savings in weight, cost and environmental indicators.
The first case study was a roof truss based on the design of the Friends Arena main truss. A number
of design configurations were considered which included studying the benefit of prestressing the
bottom chord, different cross-sections for the top and bottom chords (tubes, U-shaped profiles,
polygonal sections) and the impact of using higher strength steels. The environmental impact of
using HSS in all aforementioned scenarios was also assessed through a Life Cycle Environmental
Analysis in terms of global warming potential, acidification potential, eutrophication potential and
primary energy demand.
The second case study was based on the masts supporting the roof at Manchester City’s Stadium
and a range of different configurations were studied which involved varying the cross-section of the
column and using higher strength steels. The advantages of adding a prestressed cable stayed
system to the column with varying levels of prestress were also quantified.
Within the scope of these studies, the potential advantages of using higher strength steels in terms
of cost and environmental impact were clearly demonstrated. The size of the savings depended on a
wide number of parameters including the governing load case, the cross-sectional and global
slenderness of the sections, the structural configuration, level of prestress, the assumed cost
premium for HSS material and weld consumables, the assumed cost premium for fabricating HSS
etc. Other factors may also influence the results of a cost analysis, for example fire protection costs
may be higher because HSS structural members will be lighter.
6
A public seminar was held in Sweden at the start of the project with practitioners and researchers to
discuss the opportunities and challenges to the use of HSS in structures. HSS producers presented
information on their production processes and structural section ranges, illustrated with examples of
previous structural applications. A survey of three large UK fabricators was also undertaken to
understand their experiences of fabricating HSS structures in recent projects.
WP2 Materials and section design
The main objective of this Work Package was to perform full-scale tests on HSS structural material
and cross-sections in order to address the current lack of experimental data which is restrictive for
the development of design guidance. A programme of tests was carried out on hot finished square
and rectangular hollow sections in S460 and S690. The sections were subject to bending moments,
and axial compression, both concentric and eccentric. Tensile and compressive coupon tests were
also carried out to determine the basic stress-strain response of the material.
The tests were numerically modelled. Close agreement was achieved between the measured and
predicted response. The sensitivity of the models to geometric imperfections was also assessed and
a geometric imperfection of t/50 was found to best replicate the cross-section response. A parametric
study extended the scope of the test programme to study a wider range of cross-sectional
slenderness, aspect ratio and loading scenarios. In these models, the material properties were based
on the averaged flat coupon stress-strain curves.
The experimental and numerical results enabled an assessment of current design guidance for HSS
structures, codified in EN 1993-1-1[1] and EN 1993-1-12[2] to be carried out. It was shown that S460
to S690 satisfy both the more relaxed requirements for material ductility given in EN 1993-1-12 as
well as the stricter limits of EN 1993-1-1 related to the ultimate to yield strength ratio fu/fy, the strain
at fracture εf and the ultimate to yield strain ratio εu/εy. Moreover, it was found that the EN 1993-1-12
relaxed fu/fy limits and εf limits are also generally satisfied by the higher strength materials with yield
strengths above 700 MPa; this was however not the case for the ultimate to yield strain ratios εu/εy.
Regarding section classification, the stricter limits for internal compression elements which will be
introduced into the next revision of EN 1993-1-1 (c/tε = 28 for Class 1; c/tε = 34 for Class 2 and
c/tε = 38 for Class 3) better reflected the behaviour of HSS internal compression elements than the
existing limits (c/tε = 33 for Class 1; c/tε = 38 for Class 2 and c/tε = 42 for Class 3).
The effective width equation for Class 4 cross-sections and the interaction curves for cross-sections
under combined axial load and bending gave conservative predictions for HSS cross-sections.
An alternative design method for stocky HSS was developed called the Continuous Strength Method
(CSM) which takes advantage of the beneficial effects of strain hardening. The method has previously
been successfully applied to stainless steel cross-sections. The CSM offers enhanced capacities for
stocky HSS cross-sections of up to about 10% compared to the Eurocode 3 predictions.
A reliability analysis was carried out to assess the reliability of the slenderness limits and the effective
width equation for HSS. As part of this analysis, material strength data were collected from producers
in order to determine the mean and standard deviation values for the yield and tensile strengths. A
partial safety factor greater than unity was determined for the effective width formula for Class 4
HSS internal elements. However, a similar observation has also been made for conventional strength
steel, so this is clearly not an issue just relating to the higher strength.
WP3 Joints
This Work Package studied the performance of different types of truss joints between tubular,
U-shaped and polygonal cross-sections through tests and numerical analysis. Polygonal cross-
sections give freedom to optimise the cross-section (external dimension, thickness) and ability to
fabricate the cross-section wherever a press-braking facility is available, with plates delivered in sizes
required for optimal fabrication.
Crocodile nose connections (CN)
A CN connection is a new type of tube to gusset plate connection, suitable for the diagonal members
in a truss, which avoids the classical abrupt and unattractive right-angle termination of a CHS. In a
CN connection, semi-elliptical nose plates welded to the tube provide a smoother transition with
many structural advantages by continuing beyond the termination and then being bolted to the
gusset plate. A programme of strength and long-term tests were carried out to investigate the
structural behaviour of this type of connection. For the test specimens, the tubes were S690 159 x

7
8.8 mm seamless CHS. The inflected plates were 4 mm thick S650 steel. There were six pretensioned
10.9 M26 x 70 bolts in each connection.
Four strength tests studied the effect of the angle of inflection of the nose plates and the presence
(or absence) of the connection piece on the strength of the connection. Both specimens with a
connecting piece failed suddenly in a brittle way, one by facture of the full width of the inclined plate
and the other in the weld. The specimens with the shallower angle of inflection failed at a 15% higher
load than the specimen with the steeper angle. In comparison, both specimens without connecting
pieces failed at significantly lower loads, experiencing progressive fracture of the weld, demonstrating
a hardening post-failure behaviour. As the crack propagated along the weld length, the inflected
plates started to straighten, at the same time bending below the lower bolt row and separating from
the gusset plate.
Four long-term tests studied the loss of pretension in the bolts to the gusset plate over a four month
period. A logarithmic curve of the form � preten s = � ln(� ) + � was fitted to model the asymptotic loss of
pretension due to relaxation induced by creep.
FE models of the CN connection consisting of the inflected plate, CHS member and weldment were developed and validated against the strength test data; the models predicted the tensile resistance of the four test connections reasonably well. A parametric study was carried out to determine the effect of varying the steel strength, plate thickness and inflected angle. The parametric study confirmed that:
A more ductile failure of the weld material will occur when the connecting plate is not used.
Inclusion of the connecting plate results in a more brittle failure of the weld material (though at a significantly higher load). Indicatively, the connecting plate reduced the failure displacement by approximately half.
Higher strength steel S690 and S460 provide 62% and 13.4% greater load resistance with 13.3% and 7.6% smaller failure displacement, respectively, compared to S355.
In general, a smaller angle of inflection results in higher resistance due to the larger interface between the inflected plate and the CHS member and therefore the greater length of weld. With
the connecting plate, the ultimate strength of the connection increases by 38% and 60% when the angle of inflection is reduced from 35 to 25 and from 35 to 21 respectively. Without the
connecting plate, the strength is increased by 45% when the angle is reduced from 35 to 25.
Increasing the inflected plate thickness and the thickness of the CHS member will significantly increase the strength of the connection. This is primarily due to the size of the weld material which is physically limited by the thickness of the inflected plate and the CHS member. Also, components of greater size/area can accommodate more weld material and therefore result in a higher load resistance.
A design equation was subsequently developed to calculate the resistance of the weld in the CN
connection. The equation can be used to determine a transition angle at which failure shifts from the
weld to the inflected plate. This minimum angle can be used in design to ensure that the weld in the
connection will not be the weakest part under tension.
Other truss connections
Tests were carried out on two 14 m long trusses to study the response of different types of joints
between the chord and bracing diagonals. One of the trusses comprised innovative cross-sections:
polygonal sections for the top chords and a U-shaped profile for the bottom chord. The other truss
was made from tubular members. Polygonal and U-shaped cross-sections facilitate easier
connections with minimal welding. The polygonal cross-section is also less susceptible to local
buckling than a conventional tubular cross-section.
Innovative truss
The polygonal compression chord was made from 4 mm S650 plate formed from 3 sections of folded
plate into an octahedral cross-section. The U-shaped tension chord was made from 8 mm thick S650
plate. Four different configurations for the joint between the U-shaped profile and tubular diagonal
were tested which enabled the effect of increasing the local chord thicknesses from 8 mm to 12 mm
and inserting an axial stiffener under the gusset plates to be studied.
The tests demonstrated that varying the tensile chord thickness did not significantly affect the
ultimate load and the axial stiffener provided substantial additional resistance. It was not possible to
determine the exact increase in the joint resistance due to the presence of the axial stiffener because
when the stiffener was present, the failure mechanism changed from failure in the gusset plate to
8
U-shaped profile weld to failure in the diagonal. The basic requirement for the design of the axial
stiffener is that the fillet welds connecting it to the tensile chord should be able to undertake the
axial load variation of the chord due to the vector sum of the diagonal forces.
Tubular truss
The tubular truss comprised two top chords and two bottom chords, all made from S690 seamless
CHS. The joints were identical throughout the truss. Two joints were tested and they both failed at
a similar load and displacement. In the first test, failure was in the weld between the tension diagonal
and the tension chord. In the second test, failure was in the weld between the tension diagonal and
the compression chord.
The performance of the HSS tubular truss was analysed using ABAQUS to assess the accuracy of the
hand calculation design methods in Eurocode 3 and CIDECT guides for HSS joints.
WP4 Prestressed HSS structures
This WP studied the performance of two different prestressed structural systems and demonstrated
how prestressing enables a greater proportion of the higher strength to be exploited.
Prestressed cable stayed columns (PSSCs)
The resistance of slender columns is limited by global instability, but through the addition of
cross-arms and external prestressed cables, buckling displacements can be inhibited and the
resistance of the column increased. WP4.1 investigated the application of this technology in
conjunction with HSS columns.
121 full-scale tests were carried out on PSSCs, varying the length (12 m and 18 m), cross-section
and steel strength (S355 and S690) of the column. The number of cross-arms (0, 1, 2) and the
diameter and level of prestress in the stays (cables) was also varied. The benefit of including a stay
system with cross-arms for long columns was clearly demonstrated; the benefit increased as the
slenderness increased. In stockier columns, however, the benefit of including a stay system and
cross-arms is less clear. Columns with two cross-arm systems showed greater resistance than
columns with a single cross-arm system because the angle between the cables and the core column
was greater, increasing the perpendicular component of the tension in the stays at bracing points
which stabilises the column better. For the same reason, shorter columns benefit more from a stay
system than longer columns. The test programme also demonstrated that PSSCs are highly sensitive
to geometric imperfections. Although limitations in the capacity of laboratory equipment meant that
the columns tested were highly slender, and hence the benefit of using HSS was not apparent, the
programme was useful for characterising the general behaviour of these systems and for identifying
imperfection profiles. Higher strength will become beneficial in these systems as the cross-section of
the column increases.
Each of the tests was modelled (a total of 132 linear buckling analyses and 396 geometrically and
material nonlinear analyses with imperfections included). Different assumptions regarding the
geometric imperfections were tested out. In the majority of cases, the numerical model predicted
the experimental behaviour reasonably well. In some cases the numerical model predicted higher
ultimate loads, which may be because unpredicted deviations and lack of verticality of the load
application system led to a premature loss of stiffness in the tests.
A new design method for PSSCs based on the Ayrton-Perry formulation was developed. The results
were calibrated against the experimental and numerical results, as well as previously published
simplified design methods. Worked examples for two cable stayed columns with different geometrical
and material properties were prepared to illustrate the design procedure.
The natural frequencies and respective vibration modes of the PSSCs were obtained for different
levels of pretension in the cables. Experimental modal analysis was applied using output-only
measurement techniques based on ambient vibration of the structure. FE models were developed
and calibrated with experimental results. The same operational modal analysis techniques were used
to evaluate the level of pretension in the cables. A simple methodology was proposed to control the
cable pretension during construction.
Prestressed trusses
For conventional structural steels, the need to maintain deflections under service loads within
acceptable limits for ever-increasing spans has led to the emergence of prestressed steel tubular
trusses for long-span structures, in which prestressed cables inside the bottom chord are utilised. In

9
WP4.2, the feasibility of prestressing as a means of increasing the stiffness of HSS trusses was
investigated, on the basis of 22 individual truss member tests and 6 tests on long trusses. The
individual truss member tests included tests in tension and compression. The key variables were the
steel strength, initial prestress level and the presence or absence of grout. The level of initial
prestress studied were Pnom, 0.5 Popt and Popt, where Popt is the optimum prestress force that causes
the cable and the tube to yield simultaneously. The addition of a prestressing cable increased the
tensile capacity of the system by about 30%. Increasing the prestress in the cable delays yielding of
the tube and brings it closer to the yield point of the cable. This increase in the elastic response
range reduces the axial deflection required to attain the ultimate load. The presence of the grout had
minimal effect. The S460 specimens gained more benefit from prestressing than the S690 specimens.
Four arched steel trusses of 11 m length, made up from S460 steel SHS, were tested under vertical
loading. Each truss was identical apart from the level of prestressing applied to the cable located in
the bottom chord (none, Pnom, 0.5 Popt and Popt). Prestressing delayed yielding of the bottom chord
and led to an increase in the failure load of the truss from around 35 kN (no prestressing) to 54 kN
(cable prestressed to Popt). To investigate the effects of the addition of prestressing cables and
increasing prestress levels on the vibration behaviour on the trusses, measurements of their dynamic
properties were carried out using a modified impact hammer modal testing method. The recorded
acceleration versus time responses were used to extract the natural frequencies of each of the trusses
by means of the Fast Fourier Transform (FFT), which translated the measured acceleration from the
time domain into the frequency domain. The results showed that the addition of the cable and
increasing prestress levels had an insignificant effect on the modal properties of prestressed HSS
arched trusses.
In parallel with the experimental programme, numerical models were generated and validated
against the experimental results. Ten different combinations of out-of-plane and in-plane initial
geometric imperfections were investigated. The ultimate load and the initial stiffness were very well
replicated in most of the cases, whilst, as anticipated, the displacement at the maximum load
appeared to be more sensitive to the initial geometric imperfections. It was concluded that the model
with out-of-plane imperfection L/750 and in-plane imperfection L/1500 gave best agreement with
the test results. These imperfection amplitudes were therefore introduced as initial geometric
imperfections in the subsequent parametric studies which studied the applied prestress level, the
span-to-depth ratio, the steel strength of the truss members, the truss shape and the section sizes
for the top and bottom chord. The increase in resistance and the reduction of the midpoint
displacement at failure load that arise from prestressing were also studied for a wide range of
structural configurations likely to occur in practice.
A design process for trusses with and without prestress was developed and three worked examples
illustrated its application for trusses of various spans. The results of the worked examples were
verified against predictions using ABAQUS. It was observed that the insertion of a nominally
prestressed cable in the bottom chord of a truss substantially increased its ultimate load resistance.
The ultimate resistance is however attained at very large displacements. By applying the optimal
prestress force Popt, the midspan deflection at failure reduces to about 50% of the respective value
when only a nominal prestress force Pnom is applied. In addition to this benefit, the introduction of an
optimally prestressed cable leads to approximately 10-15% material savings, compared to a
conventionally designed truss without any cable in the bottom chord.
In order to benefit from prestressing, premature buckling of the top chord should be prevented as it
can significantly reduce the ultimate load of the truss. Attention should also be paid to the material
response of the cable, whose effective stiffness reduces for increasing span and stress levels. In
order to mitigate prestress losses due to relaxation, the initial prestress of the cable should not be
higher than 70% of the yield strength of the cable.
WP5 Exploitation of results
The purpose of this WP was to present the results of the research in an appropriate way for the
intended audiences.
Design examples
A series of eight design examples was developed showing the step-by-step design procedure for HSS members and joints. The examples comprise:
Example 1: Square hollow tension member (SHS) in S460 welded to a connection plate.
Example 2: As Example 1, except the tension member is S690 steel.

10
Example 3: Internal I shape column in multi-storey building in S460 steel.
Example 4: Top chord member in tubular truss, subject to a high compression force and external loads.
Example 5: Rectangular hollow section (S460) in compression demonstrating the Continuous Strength Method (CSM).
Example 6: Rectangular hollow section (S460) in bending demonstrating the CSM.
Example 7: SHS (S460) under combined loading demonstrating the CSM.
Example 8: Crocodile Nose connection.
Whilst the first four examples do not involve the technologies specifically studied in HILONG, they
nevertheless demonstrate the weight saving of using HSS. It should be noted that the limited range
of sections available in HSS compared to conventional strength steels can limit the weight savings
achievable. Also, for tension members, the design of the connection will often be governing,
especially as fabricators tend to use S355 steel for connection details, which can again limit the
achievable weight savings by using a higher strength member.
As mentioned previously, design examples were also prepared to demonstrate the new design
methods developed for HSS PSSCs and prestressed arches; these are presented in WP4.
Contribution to European standardisation
The HILONG research has made a useful contribution to the understanding of HSS members,
connections and structural systems. In order to carry out Eurocode reliability analyses, material
strength data were collected from steel producers in Europe. Strength data were also extracted from
numerous mill certificates and research papers. This enabled a mean ratio of measured to minimum
specified strength, accompanied by standard deviations, to be derived. Under WP2, EN 1993-1-1 and
EN 1993-1-12 design rules were confirmed. Concerns were raised over the level of reliability of the
effective width formulation for Class 4 cross-sections. These results were presented to the Working
Group (WG) for EN 1993-1-12 and the relevant deliverables will be forwarded to the WG once the
final report is approved. Under WP3, the application of the design rules for tubular joints made from
HSS was confirmed. This is significant because data on the performance of HSS tubular joints are
very sparse. WP4 studied structural systems and developed design methods for PSSCs and
prestressed trusses, aligned where appropriate to the provisions in Eurocode 3.
Public seminar
A public seminar was held in July 2015 to which more than 100 designers, steelwork manufacturers,
contractors, etc. attended. The contents of the seminar was designed so that the information
presented was varied, giving a ‘complete’ picture of the use of HSS in structures, and not just the
topics studied in HILONG. Presentations included guidance on specification, design and fabrication
as well as a comprehensive presentation of the results of the research carried out in HILONG. Case
study information about HSS structures was also included. Tata Steel, Vallourec and ArcelorMittal
presented details of their HSS product range. Some very encouraging feedback was given by
delegates. The presentations given can each be downloaded from the SCI News site
http://news-sci.com/high-strength-steels-in-long-span-structures-30th-june-2015/, which extends
the impact and reach of the seminar to a much larger audience.
Conclusions
The HILONG project has sought to overcome some of the obstacles relating to design limitations due
to buckling and deflections by studying innovative structural arrangements and cross-sections which
suppress buckling and reduce deflection. The project has shown that the use of HSS presents many
opportunities for lighter structures which comply with serviceability requirements. The data
generated in the project will supplement the body of data on HSS cross-sections and contribute to
the next revision of Eurocode 3. The database of material strength properties collected for the
reliability analysis will also be useful in the future for reliability assessments for HSS design rules,
and has already been shared with HILONG’s sister RFCS project RUOSTE.
The work completed in WP3 sets the foundation for promoting the use of innovative cross-sections
in HSS rather than just continuing to use the standard rectangular and circular hollow and I-sections
designers are familiar with. The tests on the HSS trusses are valuable since there are very few data
on the performance of any types of HSS joints. The work on the CN connection will be very useful
for trusses made from conventional as well as high strength steel members.

11
The outcomes of the research into prestressing in WP4 are applicable to any strength steel and will
help to promote the use of prestressing in general. Prestressing can significantly increase the
load-carrying resistance of a truss or column without increasing its structural weight. The
combination of HSS as a structural material and prestressing technology can potentially lead to
material savings and lighter and more elegant structures.
The results of the HILONG project have shown there is much potential for designing more efficient
higher strength steel structures and the potential scope of application of the results of this project is
extensive. Further dissemination activities are required to enable designers to make use of the
recommendations and techniques arising from the HILONG research.

12
13
2 INTRODUCTION
2.1 The production of high strength structural steels
Steel properties like strength and toughness depend both on the chemical composition and
processing procedures; steel producers use a wide range of different concepts to achieve the required
balance of properties. Although the easiest way to improve the strength of steel is to increase its
carbon content, this reduces other important properties like weldability, toughness and formability.
Microalloying with elements like niobium, vanadium, molybdenum or titanium in amounts below
0.1 wt % (1000 grams/tonne) is a cost-effective method of achieving a balanced combination of
properties and is widely adopted by steel producers around the world.
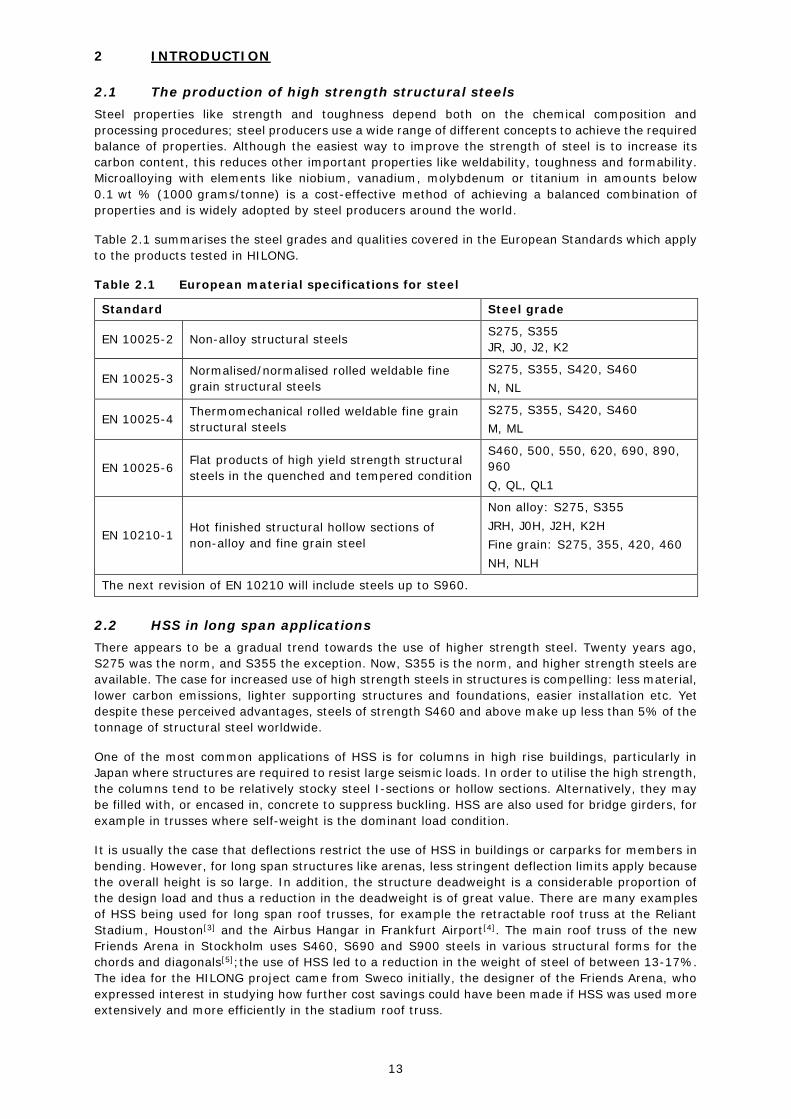
Table 2.1 summarises the steel grades and qualities covered in the European Standards which apply
to the products tested in HILONG.
Table 2.1 European material specifications for steel
Standard Steel grade
EN 10025-2 Non-alloy structural steels S275, S355
JR, J0, J2, K2
EN 10025-3 Normalised/normalised rolled weldable fine
grain structural steels
S275, S355, S420, S460
N, NL
EN 10025-4 Thermomechanical rolled weldable fine grain
structural steels
S275, S355, S420, S460
M, ML
EN 10025-6 Flat products of high yield strength structural
steels in the quenched and tempered condition
S460, 500, 550, 620, 690, 890,
960
Q, QL, QL1
EN 10210-1 Hot finished structural hollow sections of
non-alloy and fine grain steel
Non alloy: S275, S355
JRH, J0H, J2H, K2H
Fine grain: S275, 355, 420, 460
NH, NLH
The next revision of EN 10210 will include steels up to S960.
2.2 HSS in long span applications
There appears to be a gradual trend towards the use of higher strength steel. Twenty years ago,
S275 was the norm, and S355 the exception. Now, S355 is the norm, and higher strength steels are
available. The case for increased use of high strength steels in structures is compelling: less material,
lower carbon emissions, lighter supporting structures and foundations, easier installation etc. Yet
despite these perceived advantages, steels of strength S460 and above make up less than 5% of the
tonnage of structural steel worldwide.
One of the most common applications of HSS is for columns in high rise buildings, particularly in
Japan where structures are required to resist large seismic loads. In order to utilise the high strength,
the columns tend to be relatively stocky steel I-sections or hollow sections. Alternatively, they may
be filled with, or encased in, concrete to suppress buckling. HSS are also used for bridge girders, for
example in trusses where self-weight is the dominant load condition.
It is usually the case that deflections restrict the use of HSS in buildings or carparks for members in
bending. However, for long span structures like arenas, less stringent deflection limits apply because
the overall height is so large. In addition, the structure deadweight is a considerable proportion of
the design load and thus a reduction in the deadweight is of great value. There are many examples
of HSS being used for long span roof trusses, for example the retractable roof truss at the Reliant
Stadium, Houston[3] and the Airbus Hangar in Frankfurt Airport[4]. The main roof truss of the new
Friends Arena in Stockholm uses S460, S690 and S900 steels in various structural forms for the
chords and diagonals[5];the use of HSS led to a reduction in the weight of steel of between 13-17%.
The idea for the HILONG project came from Sweco initially, the designer of the Friends Arena, who
expressed interest in studying how further cost savings could have been made if HSS was used more
extensively and more efficiently in the stadium roof truss.

14
The European design code containing general rules for steel structures is Eurocode 3: Part 1.1[1];
this provides structural design guidance for material strengths up to 460 MPa. Eurocode 3:
Part 1.12[2] provides additional rules for extension of Eurocode 3 to S700 material, but with a number
of restrictions. These special rules, together with the limitation on strength to S700 material, are
partly related to insufficient test data on HSS structural elements. Although the most common
obstacles to the more widespread use of HSS relate to those phenomena that are controlled by
stiffness rather than strength, specifically instability and serviceability, reduced material ductility also
creates some limitations. Additionally, connecting high resistance members with relatively small
cross-sections is more difficult as the forces being transferred are far greater than when joining
conventional strength steel members.
2.3 Prestressing technologies in long span applications
The term prestressing is used to describe the process of introducing internal forces (or stress) into a
structural element during the construction process in order to counteract the external loads that will
be applied on the structure during its life[6]. Prestressing enhances the efficiency of structures by
increasing their load-bearing capacity or stiffness, or both, without using more material. In the case
of steel structures, the technology has not been widely used as the costs involved have been
considered too high compared with the benefits, coupled with stability problems from compressing
slender elements.
The use of prestress can effectively reduce the weight and cost of steel structures in long spans.
Previous applications of prestress revealed reductions in steel quantities of between 10-30 % (single
span beams and trusses) and reductions in cost up to between 8-20 %[6,7]. More recent prestressed
steel structures for long span roofs provided up to 50% savings in steel consumption[8,9]. Application
of prestress within trusses is typically performed by the pretensioning of tendons anchored to
elements of the truss. It is important to point out that the effectiveness of prestress may be lost
under loads that are not acting downwards. Under lateral loading, a situation which is not common
for latticed roof girders, frames have inversion of bending moments. This is an undesirable situation
when dealing with some types of prestressing techniques.
An alternative system using prestressing is the addition of cross-arms and external prestressed
cables to slender structural elements in order to inhibit buckling displacements and thus enhance
load-carrying capacity. Cable stayed columns may be executed in several different configurations by
varying the number of cross-arms per bracing point, the number of bracing points, and by using
different stay arrangements.
The application of prestressed technologies in conjunction with HSS is studied in WP4 of HILONG.

15
3 WP1 CASE STUDIES
3.1 Objectives of WP1
The objective of WP1 was to take two different structural configurations, a long span roof truss and
a prestressed cable stayed column, and prepare two functionally equivalent designs in conventional
strength steel and HSS to compare the savings in weight, cost and environmental indicators arising
from the technologies studied in HILONG.
3.2 Task 1.1 Workshop
A workshop entitled “The use of high strength steels in long span structures – a structural and
sustainability perspective” took place at the offices of Sweco Structures AB, on September 4th 2012.
Practitioners were invited and the benefits of using HSS were discussed. Table 3.1 gives the
programme. The Workshop concluded with a guided tour of the construction site of the Friends Arena.
Minutes were taken on the topics discussed by the delegates at the Workshop. A copy of these
Minutes, along with a summary of the presentations given at the Workshop is available as deliverable
D1.1 [10].
Issues discussed at the Workshop included why HSS is more expensive than conventional strength
steel. Although adding alloying elements to steel has a modest impact on cost, the primary impact
on cost is the process by which the steel is produced. HSS require more working during production
and additional forms of heat treatment. The scales of production also have an effect on cost because
HSS are not produced in the same quantities as conventional strengths of steel.
For some projects, short lead times are critically important and lead to designers being forced into
choosing conventional steel strengths where supply is guaranteed within a known timeframe.
Photographs from the site visit to the Friends Arena, illustrating the structural arrangement of the
roof structure, are given in Figure 3.1.

16
Table 3.1 HILONG Workshop Agenda (4 September 2012, Stockholm)
WORKSHOP AGENDA ITEM PRESENTED BY
Welcome and Opening of the workshop Sweco Managing Director
Contributions from HILONG partners:
Brief introduction to the HILONG (High Strength Long Span
Structures) project: objectives, scope of work, partners
Nancy Baddoo
SCI
Design of long span structures (recent trends, key
influences affecting design and construction for long span
structures and future drivers)
Fergus McCormick
Buro Happold
Prestressed long span steel structures Murray Ellen
S-squared
Introduction to HSS in construction.
The Continuous Strength Method (CSM)
Leroy Gardner
Imperial College London
Contributions from invited guests:
Thirty years’ experience of working with Advanced High
Strength Steel for light weight design. Product
development, structural design, fabrication and application
examples.
Jan-Olof Sperle
Former senior researcher at
SSAB
Production of HSS-structures for the Friends Arena at
Ruukki Construction
Alanko Timo
Director (Building Projects /
Ruukki Construction Oy)
Steel Construction – Ruukki’s focus on HSS Petri Ongelin
Senior R&D Engineer
Ruukki Construction Oy
RFCS Project Rules on High Strength Steel (RUOSTE), a
project to improve rules for HSS
Prof. Markus Feldman,
Nicole Schillo
RWTH Aachen University
ECCS databases and tools for LCA Prof. Luis Simoes da Silva
University of Coimbra
Discussion:
Opportunities for HSS in long span structures
Challenges to maximising the benefits of HSS in long span
case studies
What types of structure are more likely to benefit from
HSS?
Are HSS a more sustainable option?
Milan Veljkovic
Luleå University of Technology

17
Figure 3.1 Photos of the Friends Arena and visualisation of end connection
3.3 Tasks 1.2 and 1.3 Case studies
Two case studies were selected to study the impact of using HSS and the technologies studied in
HILONG on the weight of the structure. Full details of this study are given in D1.2.1[11] and D1.2.2[12].
3.3.1 Case Study 1: Friends Arena
Introduction
Case Study 1 is based on the Friends Arena, a multipurpose stadium built in Solna, Sweden, which
has a movable steel roof structure supported on four 3D trusses, spanning 162 m. Due to the size
and complexity of the Friends Arena roof, it was decided to focus just on the main trusses, as they
are the most important structural element of the roof and a significant portion of the framework total
weight (about 35%) (Figure 3.2).
HSS was used in the Friends Arena main roof trusses for the top and bottom chords and the outer
diagonal member closest to the support points. The top chords consisted of steel tubes with a
diameter of just over a metre, using S460M steel. Higher strengths were used in the bottom chords
and the outer diagonals (S690QL and S900 respectively) as these were subject to predominantly
tensile loading. The bottom chord was a U profile to simplify welding. The outer diagonal members
were flat plates.

18
Figure 3.2 Main truss (with rails and walkways)
Figure 3.3 Main truss components: end diagonals (left) and bottom chord (right)
The use of HSS in the as-built roof truss led to savings in the roof weight compared to a roof made
from conventional S355 structural steel[13]. When it came to cost, although HSS are slightly more
expensive than conventional structural steels, the cost of fabrication was lower, mainly due to the
reduced welding required. It was estimated that a 14.5% saving in the cost of the roof was achieved
through the use of HSS[13].
Effect of prestressing the bottom chord on truss weight
Although the HILONG case study mainly investigated the effect of using HSS more extensively in the
roof truss, the addition of prestress into the bottom chord was also studied to mitigate unwanted
effects from the loss of stiffness due to the reduction of members’ cross-section sizes. The prestress
was introduced by inserting a cable in the lower chord (Figure 3.4) which led to compression in the
lower chord of the same value as the tension in the cable (in the absence of transverse loading).The
total load that the chord is able to carry is the amplitude between the initial compression value and
its tensile resistance.
Figure 3.4 Cable positioning along the bottom chord of Friends Arena main truss
19
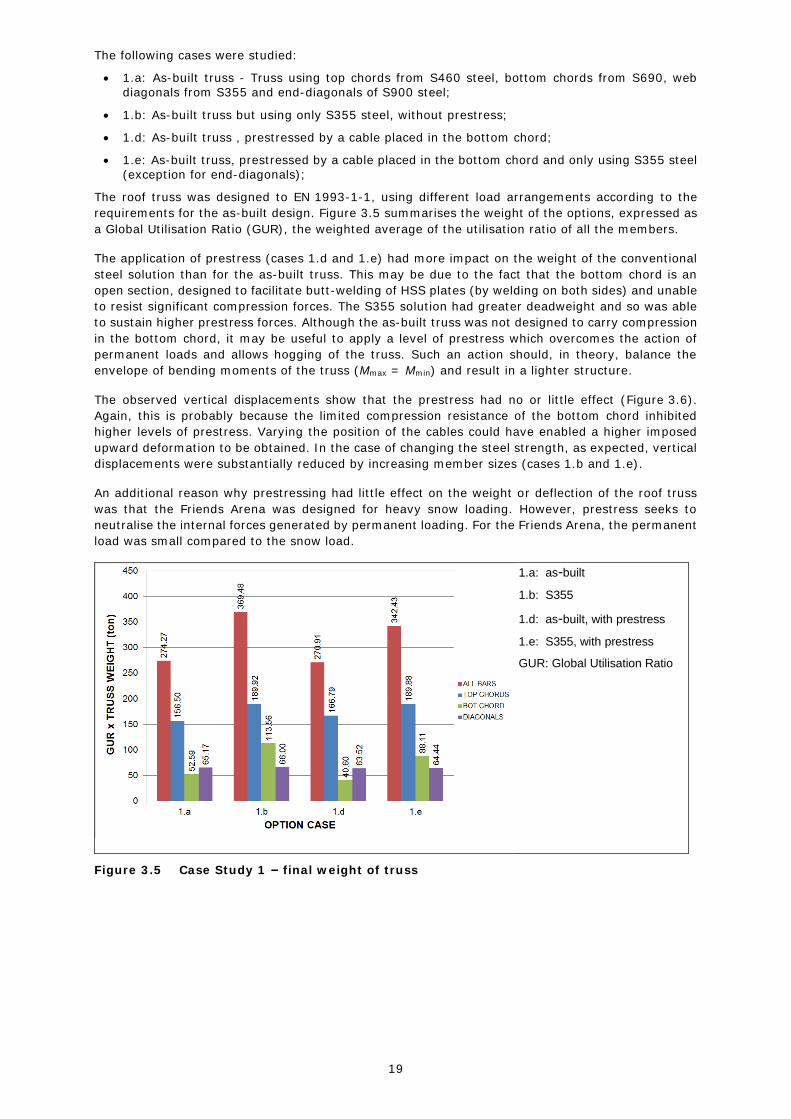
The following cases were studied:
1.a: As-built truss - Truss using top chords from S460 steel, bottom chords from S690, web diagonals from S355 and end-diagonals of S900 steel;
1.b: As-built truss but using only S355 steel, without prestress;
1.d: As-built truss , prestressed by a cable placed in the bottom chord;
1.e: As-built truss, prestressed by a cable placed in the bottom chord and only using S355 steel (exception for end-diagonals);
The roof truss was designed to EN 1993-1-1, using different load arrangements according to the
requirements for the as-built design. Figure 3.5 summarises the weight of the options, expressed as
a Global Utilisation Ratio (GUR), the weighted average of the utilisation ratio of all the members.
The application of prestress (cases 1.d and 1.e) had more impact on the weight of the conventional
steel solution than for the as-built truss. This may be due to the fact that the bottom chord is an
open section, designed to facilitate butt-welding of HSS plates (by welding on both sides) and unable
to resist significant compression forces. The S355 solution had greater deadweight and so was able
to sustain higher prestress forces. Although the as-built truss was not designed to carry compression
in the bottom chord, it may be useful to apply a level of prestress which overcomes the action of
permanent loads and allows hogging of the truss. Such an action should, in theory, balance the
envelope of bending moments of the truss (Mmax = Mmin) and result in a lighter structure.
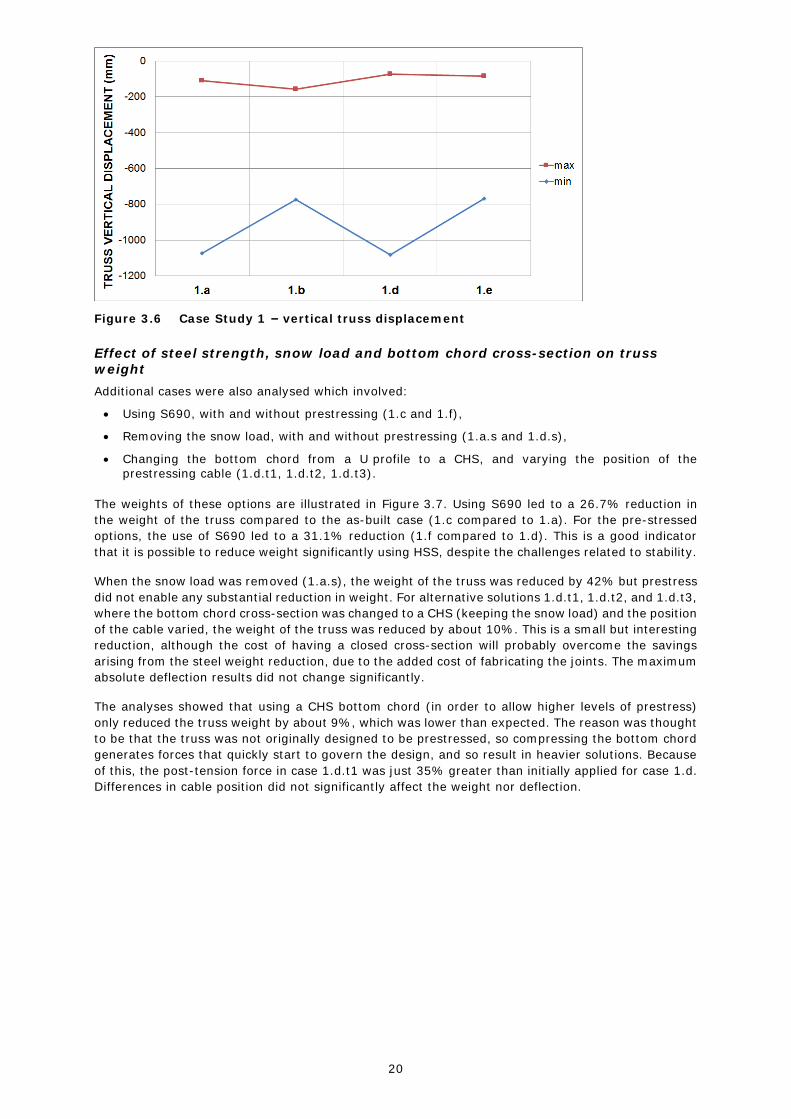
The observed vertical displacements show that the prestress had no or little effect (Figure 3.6).
Again, this is probably because the limited compression resistance of the bottom chord inhibited
higher levels of prestress. Varying the position of the cables could have enabled a higher imposed
upward deformation to be obtained. In the case of changing the steel strength, as expected, vertical
displacements were substantially reduced by increasing member sizes (cases 1.b and 1.e).
An additional reason why prestressing had little effect on the weight or deflection of the roof truss
was that the Friends Arena was designed for heavy snow loading. However, prestress seeks to
neutralise the internal forces generated by permanent loading. For the Friends Arena, the permanent
load was small compared to the snow load.
1.a: as-built
1.b: S355
1.d: as-built, with prestress
1.e: S355, with prestress
GUR: Global Utilisation Ratio
Figure 3.5 Case Study 1 – final weight of truss
20
Figure 3.6 Case Study 1 – vertical truss displacement
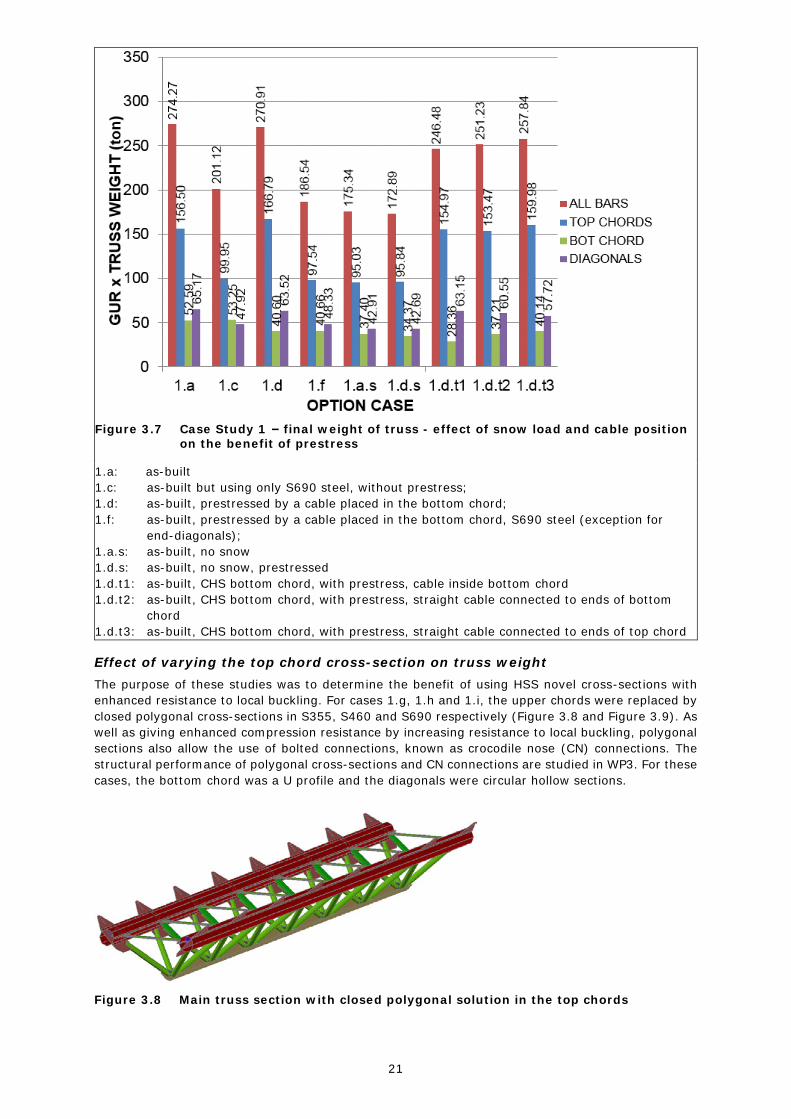
Effect of steel strength, snow load and bottom chord cross-section on truss weight
Additional cases were also analysed which involved:
Using S690, with and without prestressing (1.c and 1.f),
Removing the snow load, with and without prestressing (1.a.s and 1.d.s),
Changing the bottom chord from a U profile to a CHS, and varying the position of the prestressing cable (1.d.t1, 1.d.t2, 1.d.t3).
The weights of these options are illustrated in Figure 3.7. Using S690 led to a 26.7% reduction in
the weight of the truss compared to the as-built case (1.c compared to 1.a). For the pre-stressed
options, the use of S690 led to a 31.1% reduction (1.f compared to 1.d). This is a good indicator
that it is possible to reduce weight significantly using HSS, despite the challenges related to stability.
When the snow load was removed (1.a.s), the weight of the truss was reduced by 42% but prestress
did not enable any substantial reduction in weight. For alternative solutions 1.d.t1, 1.d.t2, and 1.d.t3,
where the bottom chord cross-section was changed to a CHS (keeping the snow load) and the position
of the cable varied, the weight of the truss was reduced by about 10%. This is a small but interesting
reduction, although the cost of having a closed cross-section will probably overcome the savings
arising from the steel weight reduction, due to the added cost of fabricating the joints. The maximum
absolute deflection results did not change significantly.
The analyses showed that using a CHS bottom chord (in order to allow higher levels of prestress)
only reduced the truss weight by about 9%, which was lower than expected. The reason was thought
to be that the truss was not originally designed to be prestressed, so compressing the bottom chord
generates forces that quickly start to govern the design, and so result in heavier solutions. Because
of this, the post-tension force in case 1.d.t1 was just 35% greater than initially applied for case 1.d.
Differences in cable position did not significantly affect the weight nor deflection.
21
Figure 3.7 Case Study 1 – final weight of truss - effect of snow load and cable position on the benefit of prestress
1.a: as-built
1.c: as-built but using only S690 steel, without prestress;
1.d: as-built, prestressed by a cable placed in the bottom chord;
1.f: as-built, prestressed by a cable placed in the bottom chord, S690 steel (exception for
end-diagonals);
1.a.s: as-built, no snow
1.d.s: as-built, no snow, prestressed
1.d.t1: as-built, CHS bottom chord, with prestress, cable inside bottom chord
1.d.t2: as-built, CHS bottom chord, with prestress, straight cable connected to ends of bottom
chord
1.d.t3: as-built, CHS bottom chord, with prestress, straight cable connected to ends of top chord
Effect of varying the top chord cross-section on truss weight
The purpose of these studies was to determine the benefit of using HSS novel cross-sections with
enhanced resistance to local buckling. For cases 1.g, 1.h and 1.i, the upper chords were replaced by
closed polygonal cross-sections in S355, S460 and S690 respectively (Figure 3.8 and Figure 3.9). As
well as giving enhanced compression resistance by increasing resistance to local buckling, polygonal
sections also allow the use of bolted connections, known as crocodile nose (CN) connections. The
structural performance of polygonal cross-sections and CN connections are studied in WP3. For these
cases, the bottom chord was a U profile and the diagonals were circular hollow sections.
Figure 3.8 Main truss section with closed polygonal solution in the top chords

22
(a) (b)
Figure 3.9 (a) Closed polygonal cross-section and (b) Crocodile nose connection
The weights and maximum deflections of these options are given in Figure 3.10 and Figure 3.11. The
modification of the top chords to a novel polygonal closed cross-section had an insignificant effect
on truss weight and displacement. The weight difference between case 1.b and case 1.g, where the
only difference is the cross-section shape of the top chords, is not significant (5.38%), and the same
occurs for case 1.c and case 1.i where the difference is 6.62%. However, the use of these
cross-sections will lead to cost savings because connections are easier.
1.a: as-built
1.b: as-built but using only S355 steel, without prestress
1.c: as-built but using only S690 steel, without prestress
1.g: All sections in S355: closed polygonal cross-section for top chords with CN connections
1.h: sections in S460: closed polygonal cross-section for top chords with CN connections
1.i: All sections in S690: closed polygonal cross-section for top chords with CN connections
1.k: All sections in S355 with two bottoms chords (CHS)
1.l: All sections in S460 with two bottoms chords (CHS)
1.m: All sections in S690 with two bottoms chords (CHS)
Figure 3.10 Case Study 1 – final weight of truss using tubular and polygonal chords
Figure 3.11 Case Study 1 – maximum displacements of truss using tubular and polygonal chords

23
Effect of using two CHS for the bottom chord
For cases 1.k, 1.l and 1.m, the U profile for the bottom chord was replaced by two CHS (Figure 3.12)
and the diagonals and top chords were also CHS. The height of the truss was 12 m, as compared to
the height of the previous cases studied (16 m). This new configuration was also tested with three
different steel strengths. The weights and maximum deflections of these options are also given in
Figure 3.10 and Figure 3.11.
Figure 3.12 Triangular main truss configuration (left: case a and g to i) and new truss configuration with two bottom chords (right: cases k to m)
The new configuration using two bottom chords did not demonstrate any benefit when compared to
the as-built truss configuration. In fact, the weight of the truss and its displacements were higher for
the new configuration. Comparing cases using the same steel strength, the truss configuration with
two bottom chords was heavier than the original configuration by 28.4%, 22.2% and 23.5%,
respectively for cases 1.g and 1.k, cases 1.h and 1.l, cases 1.i and 1.m. The same is true for
maximum displacements which were respectively, 34.4%, 36.4% and 38.2% higher. This can be
explained by: i) the decreased structural height (from 16 m to 12 m) and ii) the fact that bottom
chords were in tension, not being susceptible to any buckling phenomenon. Adding a new bottom
chord could have some influence if the suction effect caused by wind action was more significant and
the bottom chords were in compression, and susceptible to the buckling.
Effect of using HSS on truss weight
All the truss configurations using S690 revealed a significant reduction in the final weight. The weight
decrease was around 15% when comparing the truss configuration using S690 (case 1.i) with the
original configuration (case 1.a). The difference was higher if the comparison was performed for the
truss configuration using S690 (case 1.i) and the truss using only S355 (case 1.g) (33.3%). For the
configuration with two bottom chords the weight difference between the S690 truss (case 1.m) and
S355 truss (case 1.k) was even more significant (37.44%).
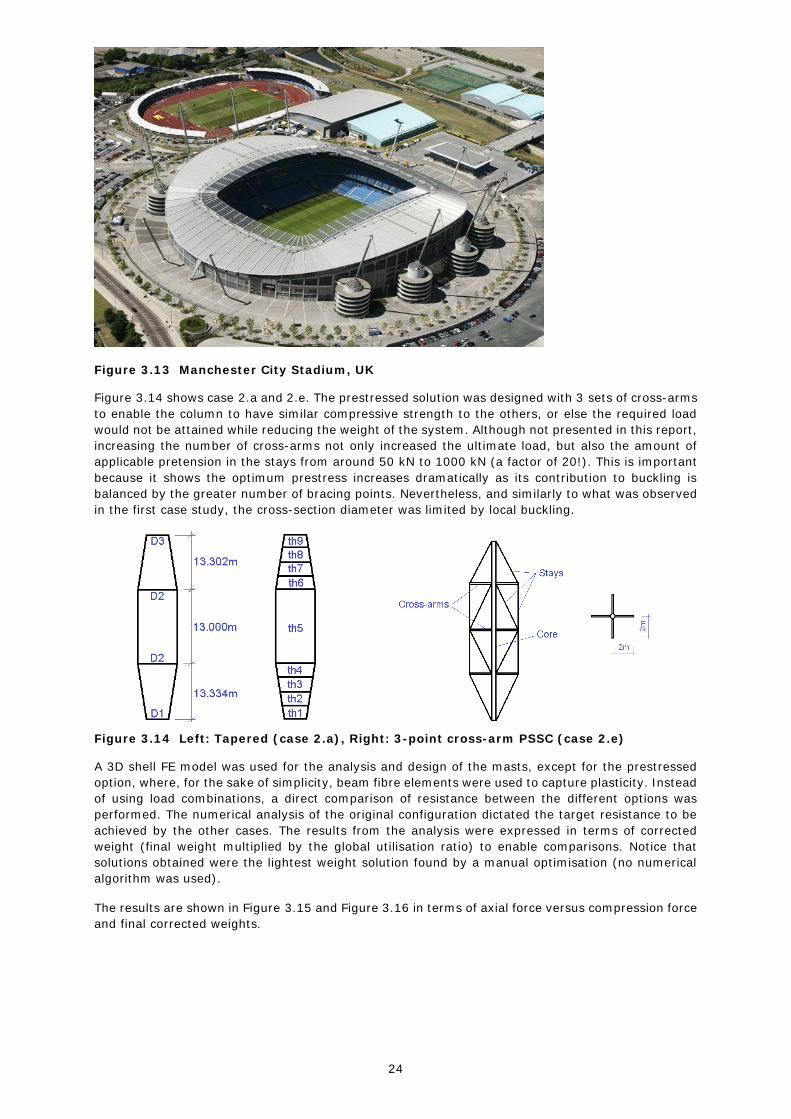
3.3.2 Case Study 2: City of Manchester Stadium
Case Study 2 is based on the 12 masts supporting the roof of the City of Manchester Stadium, home to the English team Manchester City (Figure 3.13). Full details of this study are given in D1.2.1 [11] and D1.2.2 [12]. The base case for this study is a tapered mast, with a diameter ranging from 0.70 m
to 1.58 m. Alternative designs were initially studied:
2.a: Tapered with varying thickness, S355 steel;
2.c: Constant diameter column, S355 steel;
2.e: Prestressed stayed column (PSSC), constant diameter, S355 steel.
For case 2.a, the diameter varied from 0.70 m to 1.5 m, with the thickness varying from 25 mm to
30 mm. For case 2.c, the diameter was 1.5 m and the wall thickness 24 mm. For case 2.e, the core
wall diameter was 1.3 m with wall thickness of 25 mm.
24
Figure 3.13 Manchester City Stadium, UK
Figure 3.14 shows case 2.a and 2.e. The prestressed solution was designed with 3 sets of cross-arms
to enable the column to have similar compressive strength to the others, or else the required load
would not be attained while reducing the weight of the system. Although not presented in this report,
increasing the number of cross-arms not only increased the ultimate load, but also the amount of
applicable pretension in the stays from around 50 kN to 1000 kN (a factor of 20!). This is important
because it shows the optimum prestress increases dramatically as its contribution to buckling is
balanced by the greater number of bracing points. Nevertheless, and similarly to what was observed
in the first case study, the cross-section diameter was limited by local buckling.
Figure 3.14 Left: Tapered (case 2.a), Right: 3-point cross-arm PSSC (case 2.e)
A 3D shell FE model was used for the analysis and design of the masts, except for the prestressed
option, where, for the sake of simplicity, beam fibre elements were used to capture plasticity. Instead
of using load combinations, a direct comparison of resistance between the different options was
performed. The numerical analysis of the original configuration dictated the target resistance to be
achieved by the other cases. The results from the analysis were expressed in terms of corrected
weight (final weight multiplied by the global utilisation ratio) to enable comparisons. Notice that
solutions obtained were the lightest weight solution found by a manual optimisation (no numerical
algorithm was used).
The results are shown in Figure 3.15 and Figure 3.16 in terms of axial force versus compression force
and final corrected weights.

25
2.a: original, tapered, S355
2.c: constant diameter, S355
2.e: PSSC, constant
diameter, S355
Figure 3.15 Case Study 2 – load vs. axial displacement
Figure 3.16 Case Study 2 – final corrected weights
The corrected weights show that the constant section mast (2.c) is the heaviest, consuming 1.5%
more material than 2.a. The advantages of using a tapered mast with so little reduction of steel
consumption is probably the simplification of end connections and, mostly, for improved appearance.
The lightest solution was the PSSC weighing 2.1 tonnes less than case 2.a (- 6.2%), even accounting
for additional cross-arms and stays.
Effect of HSS on mast weight
The effect of HSS on the weight of the mast was determined by re-designing the three mast options in S690 steel:
2.b: Tapered with varying thickness, S690 steel;
2.d: Constant diameter column, S690 steel;
2.e: PSSC, constant diameter, S690 steel
For case 2.b, the diameter varied from 0.70 m to 1.2 m, with the thickness varying from 25 mm to
38 mm. For case 2.d, the diameter was 1.1 m and the wall thickness 35 mm. For case 2.f, the core
wall diameter was 0.96 m with wall thickness of 32 mm.
The final corrected weights are illustrated in Figure 3.17. The results show that using HSS only led
to a reduction in weight for the PSSC. As for case study 1, the wall slenderness governs the design
for large diameter sections which meant that less economical compact sections had to be used,
instead. In the case of the constant section mast, the weight increased by 12.3% for the S690
solution.

26
2.a: Tapered with varying thickness, S355 steel
2.c: Constant diameter column, S355 steel
2.e: PSSC, constant diameter, S355 steel
2.b: Tapered with varying thickness, S690 steel
2.d: Constant diameter column, S690 steel
2.f: PSSC, constant diameter, S690
Figure 3.17 Case Study 2 – Weight of the mast and weight reductions compared to base
case 2.a
3.4 Task 1.4 Environmental impact and whole life cost comparison
3.4.1 Case Study 1: Friends Arena Truss
Cost and Life Cycle Environmental Assessments (LCEA) were compared for a range of truss designs.
Cost Analysis
A cost estimate for the production of the members in the truss was prepared based on a bill of
quantities submitted prepared by Ruukki (Annex A, D1.4 [14]). Table 3.2 gives the assumed material
costs. Costs for the end and secondary connections, as well as the cost of transport and erection on
site, were excluded.
Table 3.2 Cost estimate for each type of material
Material €/kg
S355 0.76
S460 0.90
S690 1.20
Crocodile nose connections were designed using one fork end and two free plates at the other end
in order to simplify the erection process. More details on their geometry and fabrication steps can be
found in Annex B of D1.4[14]. The cost per connection was estimated based on information provided
by Sweco to be €6,469.
The cost of the as-built truss solution (case 1.a) was compared against six cases based on the above
stated reference cost values. Figure 3.18 summarises the estimated cost for each truss member for
all seven configurations.
27
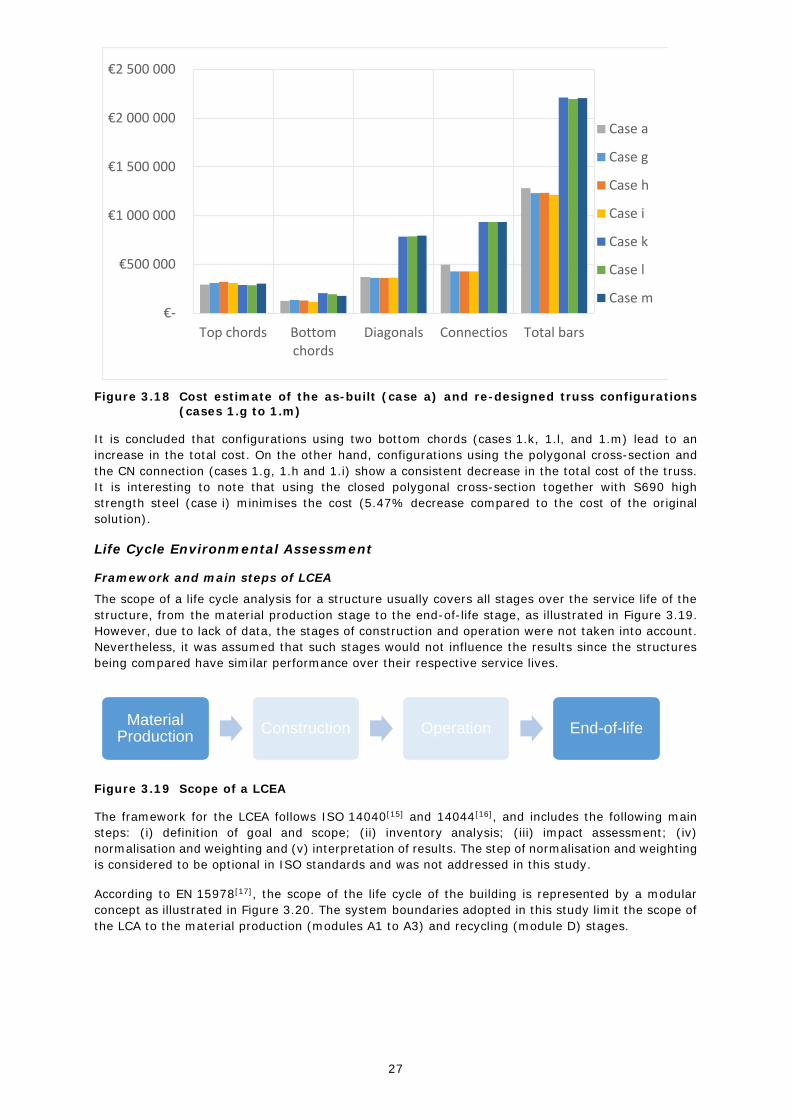
Figure 3.18 Cost estimate of the as-built (case a) and re-designed truss configurations
(cases 1.g to 1.m)
It is concluded that configurations using two bottom chords (cases 1.k, 1.l, and 1.m) lead to an
increase in the total cost. On the other hand, configurations using the polygonal cross-section and
the CN connection (cases 1.g, 1.h and 1.i) show a consistent decrease in the total cost of the truss.
It is interesting to note that using the closed polygonal cross-section together with S690 high
strength steel (case i) minimises the cost (5.47% decrease compared to the cost of the original
solution).
Life Cycle Environmental Assessment
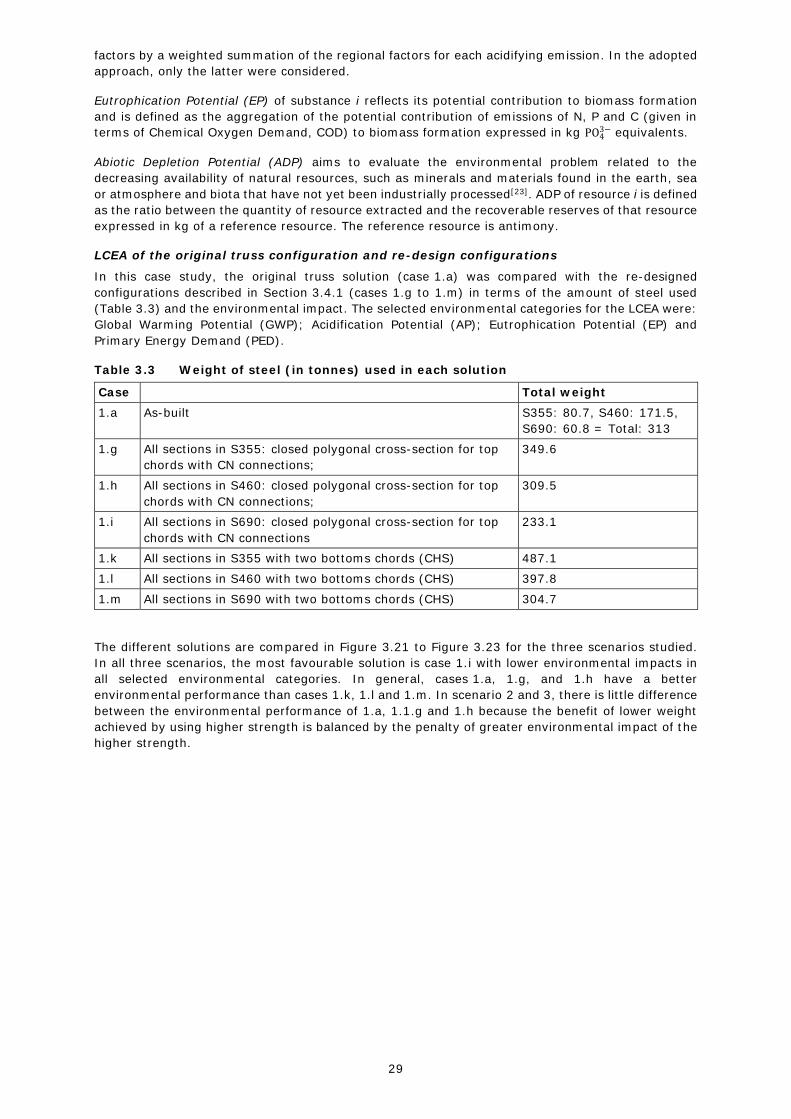
Framework and main steps of LCEA
The scope of a life cycle analysis for a structure usually covers all stages over the service life of the
structure, from the material production stage to the end-of-life stage, as illustrated in Figure 3.19.
However, due to lack of data, the stages of construction and operation were not taken into account.
Nevertheless, it was assumed that such stages would not influence the results since the structures
being compared have similar performance over their respective service lives.
Figure 3.19 Scope of a LCEA
The framework for the LCEA follows ISO 14040[15] and 14044[16], and includes the following main
steps: (i) definition of goal and scope; (ii) inventory analysis; (iii) impact assessment; (iv)
normalisation and weighting and (v) interpretation of results. The step of normalisation and weighting
is considered to be optional in ISO standards and was not addressed in this study.
According to EN 15978[17], the scope of the life cycle of the building is represented by a modular
concept as illustrated in Figure 3.20. The system boundaries adopted in this study limit the scope of
the LCA to the material production (modules A1 to A3) and recycling (module D) stages.
€-
€500 000
€1 000 000
€1 500 000
€2 000 000
€2 500 000
Top chords Bottomchords
Diagonals Connectios Total bars
Case a
Case g
Case h
Case i
Case k
Case l
Case m
Material Production
Construction Operation End-of-life

28
Figure 3.20 Modules of the life cycle of a building[17]
The environmental data needed to perform the impact assessment were provided by the WorldSteel
Association[18]. However, these datasets do not differentiate between steel strengths, although the
latter vary in their alloying constituents and heat treatment processes[19]. For this reason, three
different scenarios were considered in this study. In scenario 1, no difference was assumed between
the environmental data of steel strengths S355, S460 and S690. In scenarios 2 and 3, the
environmental impact of higher strength steels was increased by 10% and 20% for S460 and 20%
and 40% for S690 respectively.
The impact assessment stage of an LCEA aims to associate inventory data with specific environmental
impact categories and is made of two parts: (i) mandatory elements, such as selection of
environmental indicators and classification and (ii) optional elements, such as normalisation, ranking,
grouping and weighting. The classification implies a previous selection of appropriate impact
categories, according to the goal of the study and the assignment of inventory results in the chosen
impact categories. Characterisation factors (indicators) are then used to represent the relative
contribution of an inventory result (mi) to the impact category indicator result, as expressed by
Equation (5-1). Brief definitions of the most common indicators are presented in the following
paragraphs, while more details can be found in D1.4 [14].
icat
i
icat factorcharactmimpact ,_
(5-1)
Indicators of environmental performance
Global Warming Potential (GWP) measures the impact of human emissions on the radiative forcing
of the atmosphere. GWP of substance i is defined as the ratio between the increased infrared
absorption due to the instantaneous emission of 1 kg of the substance and that due to an equal
emission of carbon dioxide (CO2), both integrated over time[20]. In the adopted approach, GWPs were
calculated for a 100 year time horizon.
Ozone Depletion Potential (ODP) represents the total quantity of ozone depleting gases, such as
bromine and chlorine, released into the stratosphere and is expressed in kg of CFC-11 equivalents [21]. ODPs are divided into steady-state, in which the time span is eternity, and time-dependent. In
the adopted approach, only indicators corresponding to the steady state were considered.
Photochemical Ozone Creation Potential (POCP) assesses various emission scenarios for Volatile
Organic Compounds (VOCs). VOCs together with carbon monoxide (CO) in the presence of nitrogen
oxides (NOx) oxidise under the influence of ultraviolet light to form photo-oxidants in the troposphere [21]. POCP is given by the ratio between the change in ozone concentration due to a change in the
emission of that VOC and the change in the ozone concentration due to a change in the emission of
ethylene (C2H4)[21]. The determination of POCPs depends on the level of background NOx
concentration. In the adopted approach, only indicators corresponding to high concentration levels
were considered.
Acidification Potential (AP), expressed in kg SO2, is based on the RAINS-LCA model[22]. Based on this
model, Huijbregts developed characterisation factors for 44 regions in Europe and average European
PRODUCT stageCONSTRUCTION
PROCESS
stage
USE stage
Benefits and
loads beyond the
system boundary
END-OF-LIFE stage
Raw
mate
rial
supply
A1
Transport
A2
Manufa
ctu
ring
A3
Transport
A4
Constructio
n –
insta
llatio
n pro
cess
A5
Repla
cem
ent
B4
Deconstructio
n
dem
olit
ion
C1
Transport
C2
Waste
pro
cessin
g
C3
Dis
posal
C4
Reuse-Recove
ry-
Recyclin
g-
pote
ntia
l
DB1
Use
B2
Main
tenance
B3
Repair
B5
Refu
rbis
hm
ent
B6 Operational energy use
B7 Operational water use
29
factors by a weighted summation of the regional factors for each acidifying emission. In the adopted
approach, only the latter were considered.
Eutrophication Potential (EP) of substance i reflects its potential contribution to biomass formation
and is defined as the aggregation of the potential contribution of emissions of N, P and C (given in
terms of Chemical Oxygen Demand, COD) to biomass formation expressed in kg PO43− equivalents.
Abiotic Depletion Potential (ADP) aims to evaluate the environmental problem related to the
decreasing availability of natural resources, such as minerals and materials found in the earth, sea
or atmosphere and biota that have not yet been industrially processed[23]. ADP of resource i is defined
as the ratio between the quantity of resource extracted and the recoverable reserves of that resource
expressed in kg of a reference resource. The reference resource is antimony.
LCEA of the original truss configuration and re-design configurations
In this case study, the original truss solution (case 1.a) was compared with the re-designed
configurations described in Section 3.4.1 (cases 1.g to 1.m) in terms of the amount of steel used
(Table 3.3) and the environmental impact. The selected environmental categories for the LCEA were:
Global Warming Potential (GWP); Acidification Potential (AP); Eutrophication Potential (EP) and
Primary Energy Demand (PED).
Table 3.3 Weight of steel (in tonnes) used in each solution
Case Total weight
1.a As-built S355: 80.7, S460: 171.5,
S690: 60.8 = Total: 313
1.g All sections in S355: closed polygonal cross-section for top
chords with CN connections;
349.6
1.h All sections in S460: closed polygonal cross-section for top
chords with CN connections;
309.5
1.i All sections in S690: closed polygonal cross-section for top
chords with CN connections
233.1
1.k All sections in S355 with two bottoms chords (CHS) 487.1
1.l All sections in S460 with two bottoms chords (CHS) 397.8
1.m All sections in S690 with two bottoms chords (CHS) 304.7
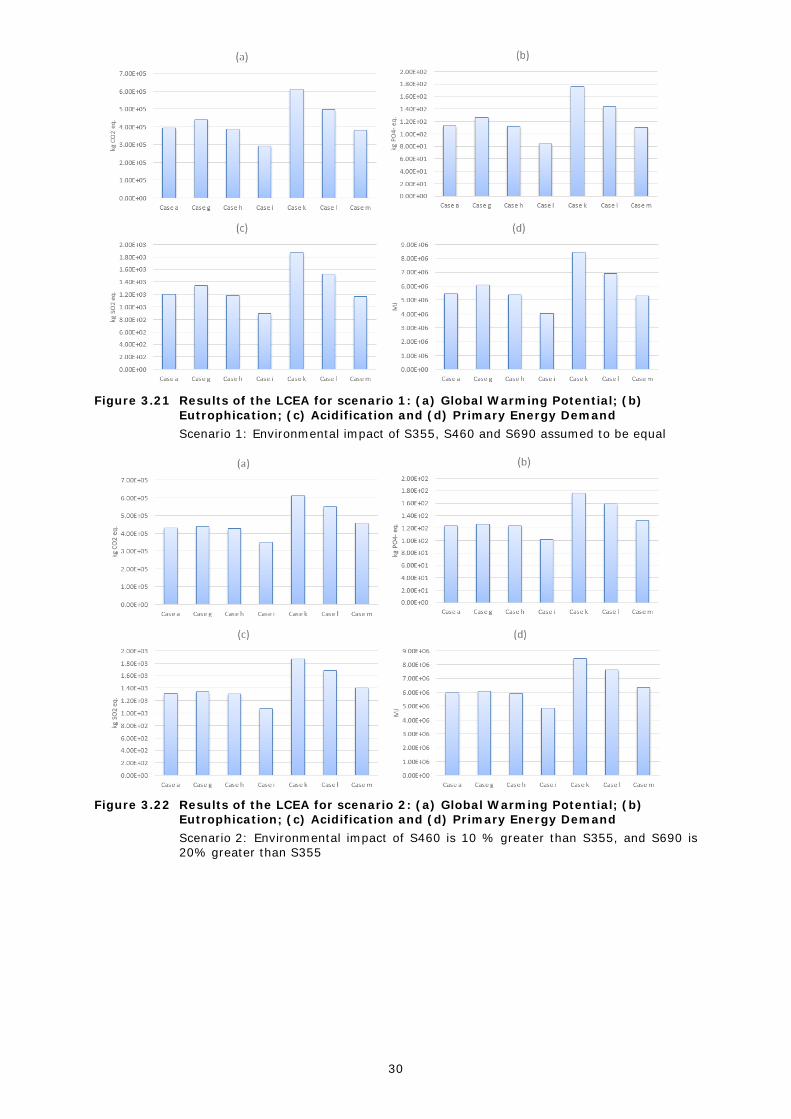
The different solutions are compared in Figure 3.21 to Figure 3.23 for the three scenarios studied.
In all three scenarios, the most favourable solution is case 1.i with lower environmental impacts in
all selected environmental categories. In general, cases 1.a, 1.g, and 1.h have a better
environmental performance than cases 1.k, 1.l and 1.m. In scenario 2 and 3, there is little difference
between the environmental performance of 1.a, 1.1.g and 1.h because the benefit of lower weight
achieved by using higher strength is balanced by the penalty of greater environmental impact of the
higher strength.
30
Figure 3.21 Results of the LCEA for scenario 1: (a) Global Warming Potential; (b)
Eutrophication; (c) Acidification and (d) Primary Energy Demand
Scenario 1: Environmental impact of S355, S460 and S690 assumed to be equal
Figure 3.22 Results of the LCEA for scenario 2: (a) Global Warming Potential; (b) Eutrophication; (c) Acidification and (d) Primary Energy Demand
Scenario 2: Environmental impact of S460 is 10 % greater than S355, and S690 is 20% greater than S355

31
Figure 3.23 Results of the LCEA for scenario 3: (a) Global Warming Potential; (b) Eutrophication; (c) Acidification and (d) Primary Energy Demand
Scenario 3: Environmental impact of S460 is 20% greater than S355, and S690 is 40% greater than S355
3.4.2 Case Study 2: Prestressed stayed column
The tests in WP4 showed that the use of PSSC can lead to weight savings compared to unstayed
columns and these savings are enhanced by using high strength steels. In order to quantify these
savings, data from the tests presented in D4.1.1[45] were used to perform a cost comparison.
PSSCs of S355 and S690 were tested in WP4. As the slenderness of the tested columns was very
high, the benefit of using HSS was small and the failure of the columns was mainly driven by stiffness.
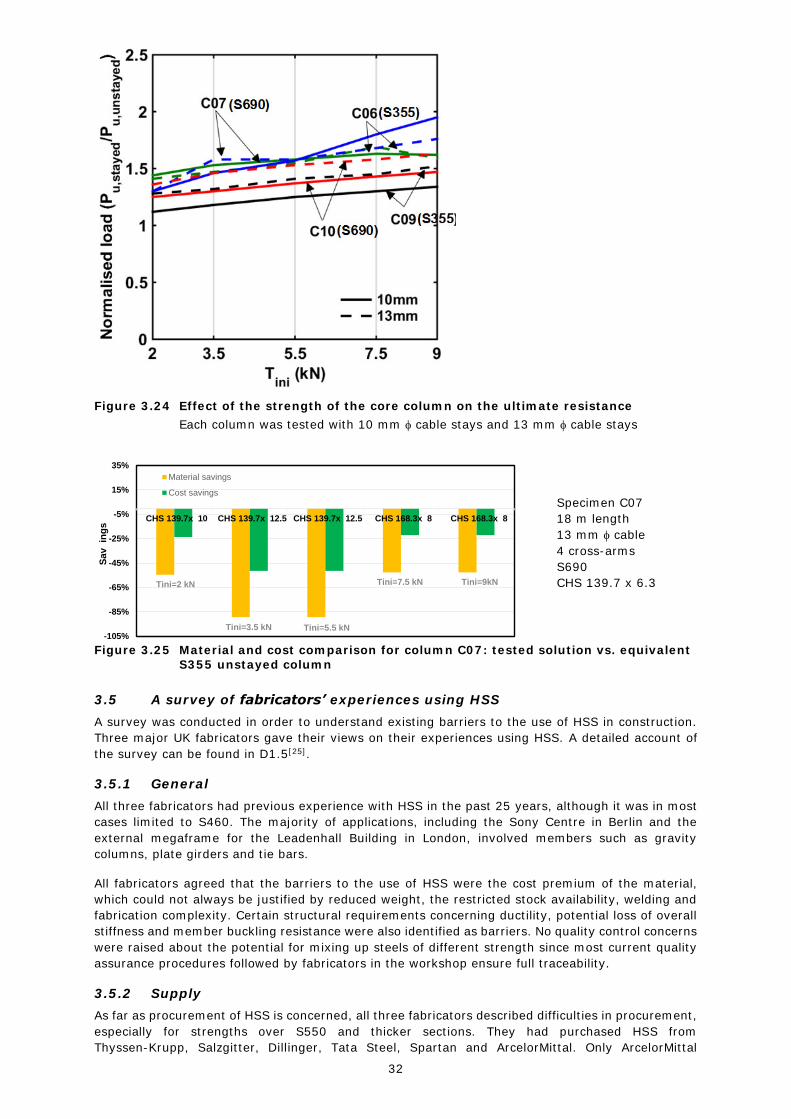
Nevertheless, some improvement was observed. Figure 3.24 compares specimens with the same
cross-section and length but with different steel strength (i.e. C06 with C07 and C09 with C10).
Columns C06 (S355) and C07 (S690) have a small profile and very high slenderness; the effect of
using HSS is negligible. However, for columns C09 (S355) and C10 (S690), the beneficial effect of is
more significant. For the comparison between C10 and C09, for the 10 mm diameter stays and an
initial tension of 2 kN, using S690 increased the ultimate resistance of the column by a factor of 1.2.
When the initial tension was 9 kN, using S690 increased the ultimate resistance of the column by a
factor of 1.19. By increasing the initial tension in the stayed systems, the slenderness of the column
decreases and the influence of the strength becomes more significant. Hence, focusing only on the
direct costs of the material of the core columns (i.e. not taking into account the cost of acquiring and
assembling the stay system) and assuming that for hot rolled circular hollow sections S690 is on
average 30% more expensive than S355[24], the benefits of HSS can be quantified. Figure 3.25 shows
the material and cost savings which can be achieved by using the S690 PSSC C07 compared to a
functionally equivalent S355 unstayed column. Note that for the cost estimate in Case Study 1, the
cost differential between S690 and S355 plate was assumed to be closer to 60% (Table 3.2). As both
estimates were based on data from steel producers, it is assumed that the difference is mainly due
to the different product forms, size of components and the size of the order.
This study has only focused on the direct material cost, excluding the cost of transportation, labour
and erection of the stay system. In order to have a more realistic cost comparison, a more detailed
analysis should be performed.
32
Figure 3.24 Effect of the strength of the core column on the ultimate resistance
Each column was tested with 10 mm cable stays and 13 mm cable stays
Specimen C07
18 m length
13 mm cable
4 cross-arms
S690
CHS 139.7 x 6.3
Figure 3.25 Material and cost comparison for column C07: tested solution vs. equivalent S355 unstayed column
3.5 A survey of fabricators’ experiences using HSS
A survey was conducted in order to understand existing barriers to the use of HSS in construction.
Three major UK fabricators gave their views on their experiences using HSS. A detailed account of
the survey can be found in D1.5[25].
3.5.1 General
All three fabricators had previous experience with HSS in the past 25 years, although it was in most
cases limited to S460. The majority of applications, including the Sony Centre in Berlin and the
external megaframe for the Leadenhall Building in London, involved members such as gravity
columns, plate girders and tie bars.
All fabricators agreed that the barriers to the use of HSS were the cost premium of the material,
which could not always be justified by reduced weight, the restricted stock availability, welding and
fabrication complexity. Certain structural requirements concerning ductility, potential loss of overall
stiffness and member buckling resistance were also identified as barriers. No quality control concerns
were raised about the potential for mixing up steels of different strength since most current quality
assurance procedures followed by fabricators in the workshop ensure full traceability.
3.5.2 Supply
As far as procurement of HSS is concerned, all three fabricators described difficulties in procurement,
especially for strengths over S550 and thicker sections. They had purchased HSS from
Thyssen-Krupp, Salzgitter, Dillinger, Tata Steel, Spartan and ArcelorMittal. Only ArcelorMittal
Tini= 2 k N
Tini= 3 . 5 k N Tini= 5 . 5 k N
Tini= 7 . 5 k N Tini= 9 k N
- 1 0 5 %
- 8 5 %
- 6 5 %
- 4 5 %
- 2 5 %
- 5 %
1 5 %
3 5 %
CHS 1 3 9 . 7 x 1 0 CHS 1 3 9 . 7 x 1 2 . 5 CHS 1 3 9 . 7 x 1 2 . 5 CHS 1 6 8 . 3 x 8 CHS 1 6 8 . 3 x 8
Sa
vin
gs
Material savings
Cost savings

33
supplied open hot rolled sections in S460. S460N/NL and ML plate products were available from
several certified EU mills, with each mill having their own length, width, thickness and weight
restraints.
Rough cost comparisons between S355 and S460 cited by the fabricators showed that the price of
HSS varied inconsistently with changes in the market and the source company. However, some
characteristic values suggest an increase of 20% for thickness t < 60 mm, 40% for 60 mm < t < 80
mm and up to 100% for t > 80 mm, while another fabricator rounded the price rise up to 30%
between S355JR and S460.
Minimum order requirements were also mentioned by the fabricators. Although some rolling mills
were able to work to a minimum order of 10 t-20 t for plate, some of them impose a minimum order
of up to 100 t. ArcelorMittal offered a range of rolled sections with a minimum order size as low as
5 t, other producers quoted higher minimum orders, e.g. 32 t.
3.5.3 Fabrication and weldability
No special weldability issues with S420 and S460 were reported by any of the fabricators. However,
the number of companies possessing a welding certificate for S460 and particularly for S690,
complying with EN ISO 3834[26], was relatively small. Normally, the fabricators reported that welding
required no special treatment for the lower HSSs.
The fabricators said that the main difference in welding HSSs in comparison with conventional steels
lay in the selected consumables, which depend on the strength, toughness and grain structure
achieved during the original manufacturing process.
Preheating was carried out in line with EN 1011[27] and became a necessity as the carbon equivalent
value increased: for Cev < 0.4, preheating can be minimised. The necessity for pre-heating also
depended on product thickness and steel strength.

34

35
4 WP2 MATERIALS AND SECTION DESIGN
4.1 Objectives of WP2
The main objective of this Work Package was to perform full-scale tests on HSS structural material
and cross-sections to address the current lack of experimental data which is restrictive for the
development of design guidance. To this end, a series of experimental tests on material,
cross-sectional response, complemented by numerical modelling was completed, which enabled the
assessment of current design guidance for HSS structures, codified in EN 1993-1-1[1] and
EN 1993-1-12[2] to be carried out. Complementary to the assessment of current design guidance, a
deformation-based design method was developed for HSS cross-sections to enable the full benefits
of the material to be exploited for stocky cross-sections, thus encouraging more widespread usage
of HSS in construction.
4.2 Task 2.1 Laboratory testing
4.2.1 Overview
In this deliverable, an experimental study on HSS hollow sections comprising tensile and compressive
coupon tests, stub column tests, full cross-section tensile tests, cross-section combined axial load
and bending tests and beam tests was carried out. The tested structural hollow sections were S460
(NH) and S690 (QH). Table 4.1 reports the type and number of tests performed. A detailed account
of the test programme is given in D2.1[28].
Table 4.1 Testing programme for D2.1
Strength Cross-section Material
tests
Stub
column
tests
Beam
test
Combined
loading
test
Full section
tensile test
S460
(NH)
SHS 50×50×5 4(T)+1(C) 1 2 4 1
SHS 50×50×4 5(T)+1(C) 1 2 0 1
SHS 100×100×5 3(T)+1(C) 1 2 0 1
SHS 90×90×3.6 3(T)+1(C) 1 2 0 1
RHS 100×50×6.3 5(T)+1(C) 1 2 0 1
RHS 100×50×4.5 3(T)+1(C) 1 2 0 1
S690
(QH)
SHS 50×50×5 5(T)+1(C) 1 2 4 1
SHS 100×100×5.6 3(T)+1(C) 1 2 0 1
SHS 90×90×5.6 3(T)+1(C) 1 2 4 1
RHS 100×50×6.3 5(T)+1(C) 1 2 0 1
RHS 100×50×5.6 3(T)+1(C) 1 2 0 1
T = tension, C = compression
4.2.2 Material tests
Material tensile and compressive coupon tests were performed to determine the basic engineering
stress-strain response of the flat and corner material for each of the tested sections. For S460 SHS
50×50×5, 50×50×4 and RHS 100×50×6.3 and S690 SHS 50×50×5 and RHS 100×50×6.3
specimens, four tensile flat coupons were extracted from each of the four faces of the section, while
for the remaining sections, two parallel flat coupons were machined, to confirm the uniformity of
properties around the sections.
All tensile flat and corner coupons were cut out in the longitudinal (rolling) direction, and dimensioned in accordance with EN ISO 6892-1[29]. One compressive flat coupon was also tested for each of the section sizes to assess the difference in the stress-strain behaviour of HSS in tension and compression. The following material parameters were extracted from each of the recorded tensile stress-strain responses:
Young’s Modulus E,
Upper yield strength fy,
Ultimate tensile strength fu,
Plastic strain at fracture εf (based on an original gauge length of L0 = √5.65 Ac , where Ac is the
cross-section area of the coupon),
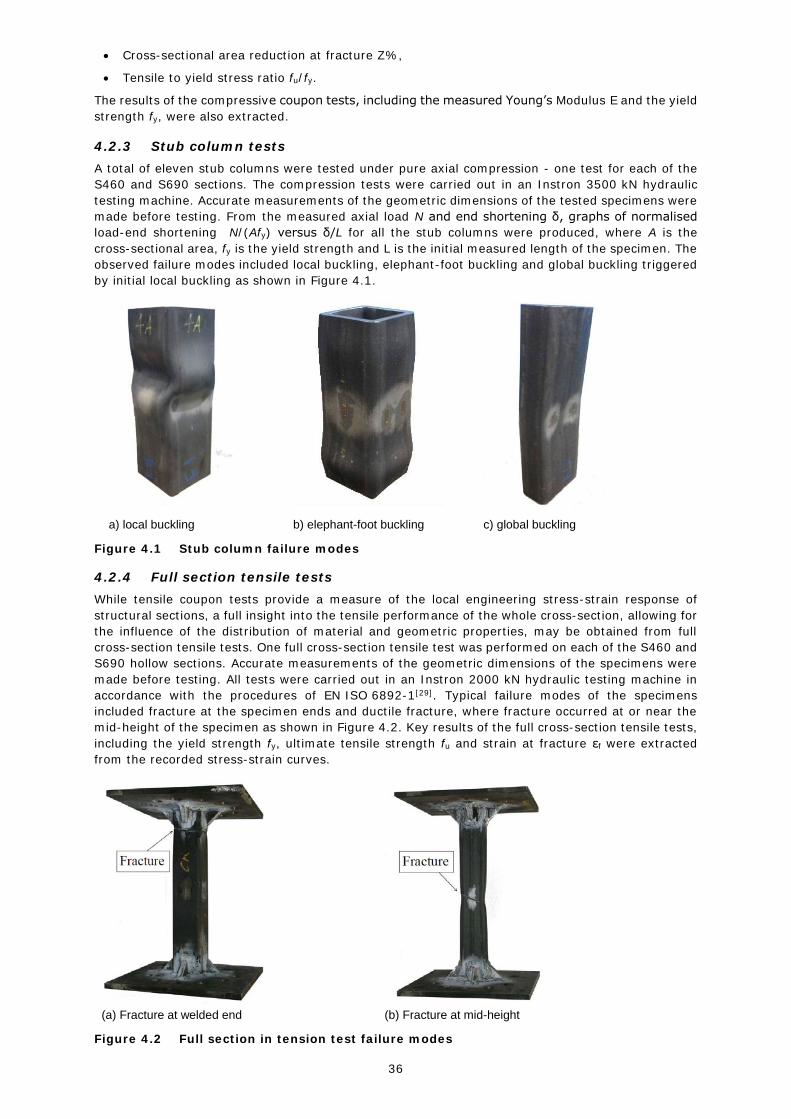
36
Cross-sectional area reduction at fracture Z%,
Tensile to yield stress ratio fu/fy.
The results of the compressive coupon tests, including the measured Young’s Modulus E and the yield
strength fy, were also extracted.
4.2.3 Stub column tests
A total of eleven stub columns were tested under pure axial compression - one test for each of the
S460 and S690 sections. The compression tests were carried out in an Instron 3500 kN hydraulic
testing machine. Accurate measurements of the geometric dimensions of the tested specimens were
made before testing. From the measured axial load N and end shortening δ, graphs of normalised
load-end shortening N/(Afy) versus δ/L for all the stub columns were produced, where A is the
cross-sectional area, fy is the yield strength and L is the initial measured length of the specimen. The
observed failure modes included local buckling, elephant-foot buckling and global buckling triggered
by initial local buckling as shown in Figure 4.1.
a) local buckling b) elephant-foot buckling c) global buckling
Figure 4.1 Stub column failure modes
4.2.4 Full section tensile tests
While tensile coupon tests provide a measure of the local engineering stress-strain response of
structural sections, a full insight into the tensile performance of the whole cross-section, allowing for
the influence of the distribution of material and geometric properties, may be obtained from full
cross-section tensile tests. One full cross-section tensile test was performed on each of the S460 and
S690 hollow sections. Accurate measurements of the geometric dimensions of the specimens were
made before testing. All tests were carried out in an Instron 2000 kN hydraulic testing machine in
accordance with the procedures of EN ISO 6892-1[29]. Typical failure modes of the specimens
included fracture at the specimen ends and ductile fracture, where fracture occurred at or near the
mid-height of the specimen as shown in Figure 4.2. Key results of the full cross-section tensile tests,
including the yield strength fy, ultimate tensile strength fu and strain at fracture εf were extracted
from the recorded stress-strain curves.
(a) Fracture at welded end (b) Fracture at mid-height
Figure 4.2 Full section in tension test failure modes

37
4.2.5 Combined axial load and bending tests
A total of 12 eccentric stub column tests was carried out to investigate the cross-section response of HSS cross-sections under combined axial load and bending. The stub column specimens were
compressed eccentrically, with different amounts of eccentricity e0 to generate different ratios of axial load to bending moment. The combined loading tests were conducted in a 2000 kN Instron
hydraulic testing machine. The load and end-rotation relationships of the tested specimens were plotted, from which the following key results of the tests were obtained:
Failure load Nu.
Applied eccentricity, referred to as the first order eccentricity e0 based on strain gauge readings.
Generated lateral deflection at failure load, referred to as the second order eccentricity e’.
Failure moment Mu = Nu (e0 + e’), with the corresponding failure end rotation u
End-shortening δu
All the SHS 50×50×5 specimens failed by material yielding, while the SHS 90×90×5.6 displayed a
local buckling failure mode, as illustrated in Figure 4.3.
a) SHS 50×50×5, eccentricity of 5 mm b) SHS 90×90×5.6, eccentricity of 5 mm
Figure 4.3 Eccentric stub column buckling modes
4.2.6 Beam tests
Three-point bending tests and four-point bending tests were conducted to establish a relationship
between cross-section slenderness and the moment resistance and rotation capacity of HSS hollow
sections. One three-point bending test and one four-point bending test were performed on each of
the S460 and S690 cross-section sizes considered. The tested beams were loaded symmetrically, in
an Instron 2000 kN hydraulic testing machine, at mid-span and at third-points for the three-point
bending and four-point bending arrangements, respectively. Non-dimensional moment-rotation and
moment-curvature responses from the three-point and four-point bending test, respectively, were
therefore plotted. Key results from the tests, including the ultimate test bending moment Mmax and
the cross-section rotation capacity R were extracted. All test specimens, apart from those which did
not reach their ultimate moment resistance, failed by yielding and local buckling of the compression
flange and the compressive part of the web. Typical failure modes of the three-point and four-point
beam tests are shown in Figure 4.4 and Figure 4.5 respectively.
Figure 4.4 Typical three-point bending failure mode (S460 SHS 100x50x4.5)
Figure 4.5 Typical four-point bending failure mode (S690 SHS 90×90×5.6)
4.3 Task 2.2 Numerical modelling
A numerical study on the structural response of HSS (S460 and S690) hot-rolled square and
rectangular hollow sections subject to pure compression, bending and combined loading was carried

38
out and a detailed account of the numerical modelling is given in D2.2[30]. Nonlinear numerical models
using the general-purpose FE software ABAQUS[31] were developed and their accuracy validated
against the laboratory tests.
4.3.1 Development of the FE models
For the development of the FE models, the 4-noded general-purpose element S4R with reduced
integration and finite membrane strains was used. For modelling convenience, only the specimen
was modelled and the effect of the supports and the loading jack were introduced through appropriate
boundary conditions and constraints. The symmetry of the test configuration in geometry and
boundary conditions was also exploited, thus greatly reducing the size of the model. An initial
convergence study was performed in order to choose an appropriate mesh size that would provide
accurate results while keeping computational time to a minimum.
The material properties that were incorporated in the FE models were derived from the material
tests. Tensile and compression coupon tests showed that both HSS (S460 & S690) exhibit a similar
behaviour to conventional strength carbon steels. A linear stress-strain response up to the yielding
point was observed, followed by a well-defined plateau and a strain hardening part after it, which
was more prominent in the case of S460. Even though this type of material behaviour can be
represented by an idealised elastic, perfect-plastic model, the necessity of accurate replication of
test results dictated the use of a multi-linear approximation of the actual stress-strain curve to better
capture the strain hardening response. ABAQUS requires the material properties input to be in the
form of points on a true stress-logarithmic plastic strain ( � � � 𝑢𝑒 - � 𝑙𝑛𝑝𝑙
) curve. The multi-linear
approximated stress-strain curve was therefore transformed to true stress and logarithmic plastic
strain by the following equations:
� � � 𝑢𝑒 = � � 𝑛𝑔(1 + � � 𝑛𝑔) (6-1)
� 𝑙𝑛𝑝𝑙 = ln (1 + � � 𝑛𝑔) −
� � � 𝑢𝑒
� (6-2)
Real structural members can never be perfectly straight and this deviation from the ideal geometry
needs to be accounted for, as it can greatly affect their structural behaviour. For modelling
convenience, geometric imperfections were incorporated in the models in the form of an appropriate
buckling mode shape. An initial linear buckling analysis using the subspace iteration method was
performed to extract the buckling modes and the shape of the lowest local buckling mode was
subsequently used to introduce imperfections into the nonlinear models. For the magnitude of the
introduced imperfections, various values were examined: 1%, 2% and 10% of the section wall
thickness, the maximum measured imperfections and the following value calculated from the
predictive model of Dawson and Walker[32]:
� 0 = � ∙ (� �� 𝑐𝑟
)0.5∙ � (6-3)
The coefficient β of the predictive model should ideally be determined through a regression analysis
performed on imperfection measurement data. However, due to the limited amount of measured
imperfection data for HSS (in part owing to the high roughness observed on the surface of the S690
specimens that prevented accurate imperfection measurements), it was decided to adopt the
respective value for conventional carbon steel hot-rolled sections, β=0.028[33].
Nonlinear static analysis was performed using the modified RIKS procedure (a variation of the classic
arc length method), which is suitable for capturing the post buckling response.
4.3.2 Validation of the FE models
The verification of the FE models was based on the experimental results of 22 bending tests, 11
concentric and 15 eccentric stub column tests. Six values for the imperfection magnitude were
assumed for each test, thus allowing the assessment of the sensitivity of the models to geometric
imperfections.
The validation of the beam models was based on the numerical to experimental ratio of the ultimate
moment Mu and its corresponding rotation θu at the plastic hinge for the 3-point bending tests (or its
corresponding curvature ku for the 4-point bending tests). The concentric stub column models were
validated by comparing the experimental and numerical values of the ultimate load Fu and its
corresponding end shortening δu, whereas for the eccentric stub columns, the experimental to
numerical ratios of the ultimate load Nu and moment resistance Mu were reported. In most of the

39
cases, the aforementioned ratios achieved a mean value close to unity with a small coefficient of
variation (COV). It was observed that the ultimate load (for concentric and eccentric stub columns)
and moment resistance (for eccentric stub columns and beams) are not significantly affected by the
imperfection magnitude, whereas the corresponding values of rotation (for 3-point bending tests),
curvature (for 4-point bending tests) and end shortening (for concentric stub columns) present a
greater sensitivity to geometric imperfections. Failure modes and full load-response curves were also
examined to further verify the accuracy of the models.
Typical graphs of the validated beam, concentric stub and eccentric stub column models are shown
in Figure 4.6, Figure 4.7 and Figure 4.8 respectively. As can be observed, the numerical curves
closely matched the experimental ones in most cases. It was concluded that very good agreement
between the experimental and numerical results was achieved overall. The sensitivity of the models
to geometric imperfections was also assessed. An imperfection of t/50, with the average comparison
ratios of Table 4.2, was found capable of replicating successfully the cross-sectional response.
Figure 4.6 Experimental versus numerical behaviour for S460 beam (SHS 50x50x4)
Figure 4.7 Experimental versus numerical behaviour for S690 concentric stub column
(SHS 90x90x5.6)
0.00
0.20
0.40
0.60
0.80
1.00
1.20
0.00 1.00 2.00 3.00 4.00 5.00 6.00 7.00 8.00
M /
Mp
l
θ / θpl
experimental
no imperfections
measured imperfections
t/100
t/50
t/10
Dawson & Walker
0.0
200.0
400.0
600.0
800.0
1000.0
1200.0
1400.0
1600.0
1800.0
0.00 2.00 4.00 6.00 8.00 10.00 12.00 14.00
Lo
ad
(k
N)
End shortening (mm)

40
Figure 4.8 Experimental versus numerical behaviour for S690 eccentric stub column (SHS 50x50x5)
Table 4.2 Comparison of FE against test results for imperfection magnitude t/50
3pt bending Mu,FE/ Mu,Exp θu,FE/ θu,Exp
MEAN 1.01 1.16
COV 0.03 0.16
4pt bending Mu,FE/ Mu,Exp ku,FE/ ku,Exp
MEAN 0.99 1.07
COV 0.04 0.19
Concentric stub Fu,FE/Fu,Exp δu,FE/δu,Exp
MEAN 0.96 1.37
COV 0.04 0.35
Eccentric stub Nu,FE/ Nu,Exp Mu,FE/ Mu,Exp
MEAN 0.92 0.98
COV 0.03 0.10
4.3.3 Parametric studies
Following the successful validation of the FE beam and stub column models, a series of parametric
studies was performed to obtain results over a wider range of cross-sectional slenderness and loading
scenarios.
The validated beam model was investigated for three sections with aspect ratios of 1.0, 2.0 and 2.44,
varying thickness to provide cross-sectional slenderness c/tε = 10 to 90 and three testing
configurations to examine the influence of the moment gradient on the deformation capacity of the
beams for both steel strengths.
Based on the expression for the non-dimensional plate slenderness � � = ( � �� 𝑐𝑟)0.5
and on the different
stress distributions within the flange and the web through the Eurocode values for the buckling
coefficient kσ (kσ = 4 for flanges of SHS in compression, kσ = 23.9 for webs under bending), 2.44 is
the limit in aspect ratio value that considers equal slenderness for the compression flange and the
web of a hollow section. Hence 2.44 is the most unfavourable aspect ratio value.
0.00
2.00
4.00
6.00
8.00
10.00
12.00
0.00 2.00 4.00 6.00 8.00 10.00 12.00
Mo
me
nt
(kN
m)
Rotation (deg)
experimental
no imp
measured
t/100
t/50
t/10
predictive
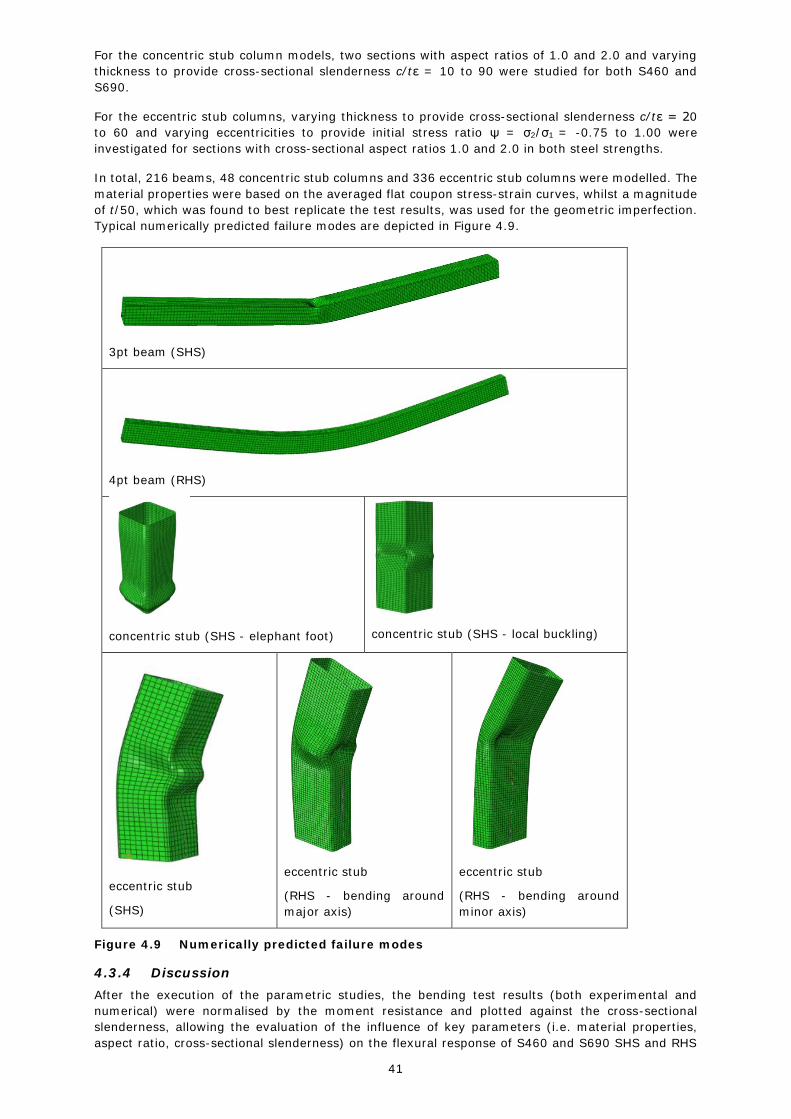
41
For the concentric stub column models, two sections with aspect ratios of 1.0 and 2.0 and varying
thickness to provide cross-sectional slenderness c/tε = 10 to 90 were studied for both S460 and
S690.
For the eccentric stub columns, varying thickness to provide cross-sectional slenderness c/tε = 20
to 60 and varying eccentricities to provide initial stress ratio ψ = σ2/σ1 = -0.75 to 1.00 were
investigated for sections with cross-sectional aspect ratios 1.0 and 2.0 in both steel strengths.
In total, 216 beams, 48 concentric stub columns and 336 eccentric stub columns were modelled. The
material properties were based on the averaged flat coupon stress-strain curves, whilst a magnitude
of t/50, which was found to best replicate the test results, was used for the geometric imperfection.
Typical numerically predicted failure modes are depicted in Figure 4.9.
3pt beam (SHS)
4pt beam (RHS)
concentric stub (SHS - elephant foot)
concentric stub (SHS - local buckling)
eccentric stub
(SHS)
eccentric stub
(RHS - bending around
major axis)
eccentric stub
(RHS - bending around
minor axis)
Figure 4.9 Numerically predicted failure modes
4.3.4 Discussion
After the execution of the parametric studies, the bending test results (both experimental and
numerical) were normalised by the moment resistance and plotted against the cross-sectional
slenderness, allowing the evaluation of the influence of key parameters (i.e. material properties,
aspect ratio, cross-sectional slenderness) on the flexural response of S460 and S690 SHS and RHS

42
beams. Figure 4.10 presents the results of S460 beams, whilst similar graphs were developed for
S690 beams. The ultimate compression loads as obtained by experimental and numerical concentric
stub column tests were normalised by the compression resistance and plotted against the cross
sectional slenderness, as depicted in Figure 4.11. Finally, the eccentric stub column results were
plotted in N-M interaction curves, separately for Class 1 and 2, Class 3 and Class 4 cross sections.
The results of SHS eccentric stub column tests are shown in Figure 4.12, Figure 4.13 and Figure
4.14. Similar graphs were created for RHS sections in bending around the major and around the
minor axis.
Figure 4.10 Beam results (normalised ultimate moment – slenderness, S460)
Figure 4.11 Concentric stub column results (normalised ultimate load – slenderness)
0.0
0.2
0.4
0.6
0.8
1.0
1.2
1.4
1.6
1.8
0 20 40 60 80 100
Mu
/ M
pl
c / tε
S460
S460 SHS 3pt test dataS460 SHS 4pt test dataS460 - SHS - 3pt (L/H=10)S460 - SHS - 3pt (L/H=20)S460 - SHS - 4pt (L/H=20)S460 RHS_2 3pt test dataS460 RHS_2 4pt test dataS460 - RHS_2 - 3pt (L/H=10)S460 - RHS_2 - 3pt (L/H=20)S460 - RHS_2 - 4pt (L/H=20)S460 - RHS_2.44 - 3pt (L/H=10)S460 - RHS_2.44 - 3pt (L/H=20)S460 - RHS_2.44 - 4pt (L/H=20)
0.0
0.2
0.4
0.6
0.8
1.0
1.2
1.4
1.6
1.8
0 20 40 60 80 100
Nu
/ A
f y
c / tε
S460 stub columns test data
S690 stub columns test data
S460 - SHS stub columns
S690 - SHS stub columns
S460 - RHS stub columns
S690 - RHS stub columns
global buckling failure
elephant footfailure
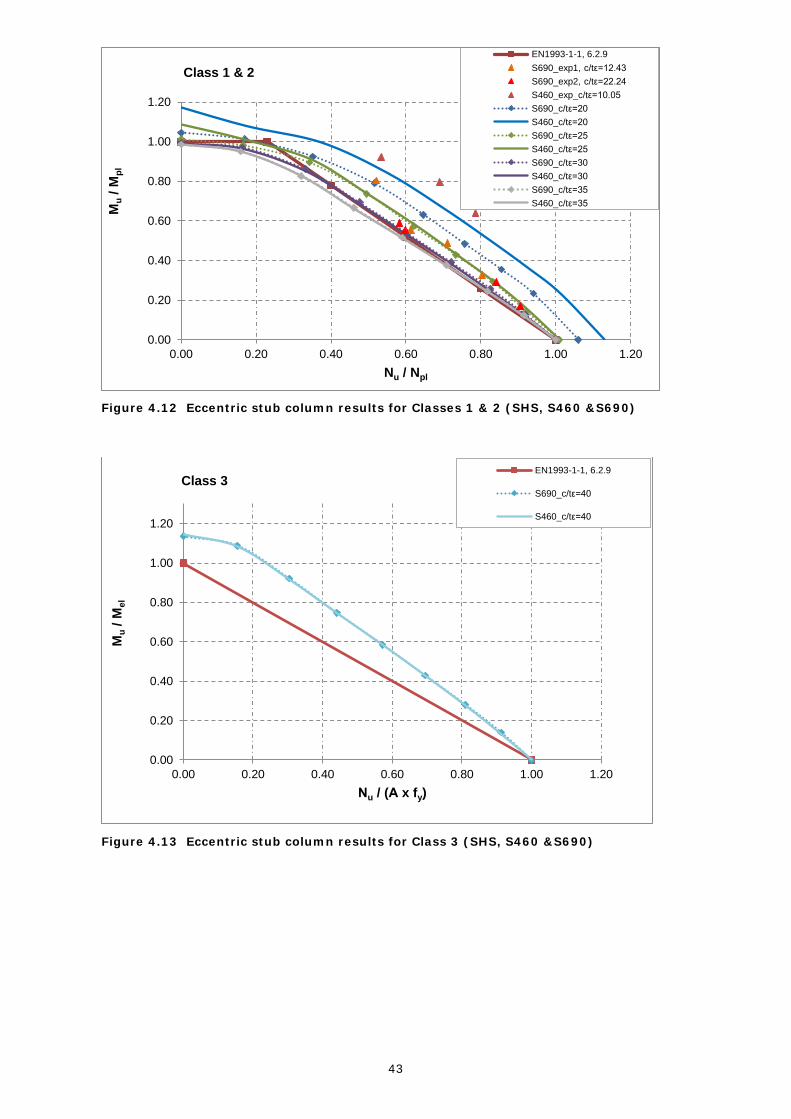
43
Figure 4.12 Eccentric stub column results for Classes 1 & 2 (SHS, S460 &S690)
Figure 4.13 Eccentric stub column results for Class 3 (SHS, S460 &S690)
0.00
0.20
0.40
0.60
0.80
1.00
1.20
0.00 0.20 0.40 0.60 0.80 1.00 1.20
Mu
/ M
pl
Nu / Npl
Class 1 & 2
EN1993-1-1, 6.2.9
S690_exp1, c/tε=12.43
S690_exp2, c/tε=22.24
S460_exp_c/tε=10.05
S690_c/tε=20
S460_c/tε=20
S690_c/tε=25
S460_c/tε=25
S690_c/tε=30
S460_c/tε=30
S690_c/tε=35
S460_c/tε=35
0.00
0.20
0.40
0.60
0.80
1.00
1.20
0.00 0.20 0.40 0.60 0.80 1.00 1.20
Mu
/ M
el
Νu / (Α x fy)
Class 3EN1993-1-1, 6.2.9
S690_c/tε=40
S460_c/tε=40
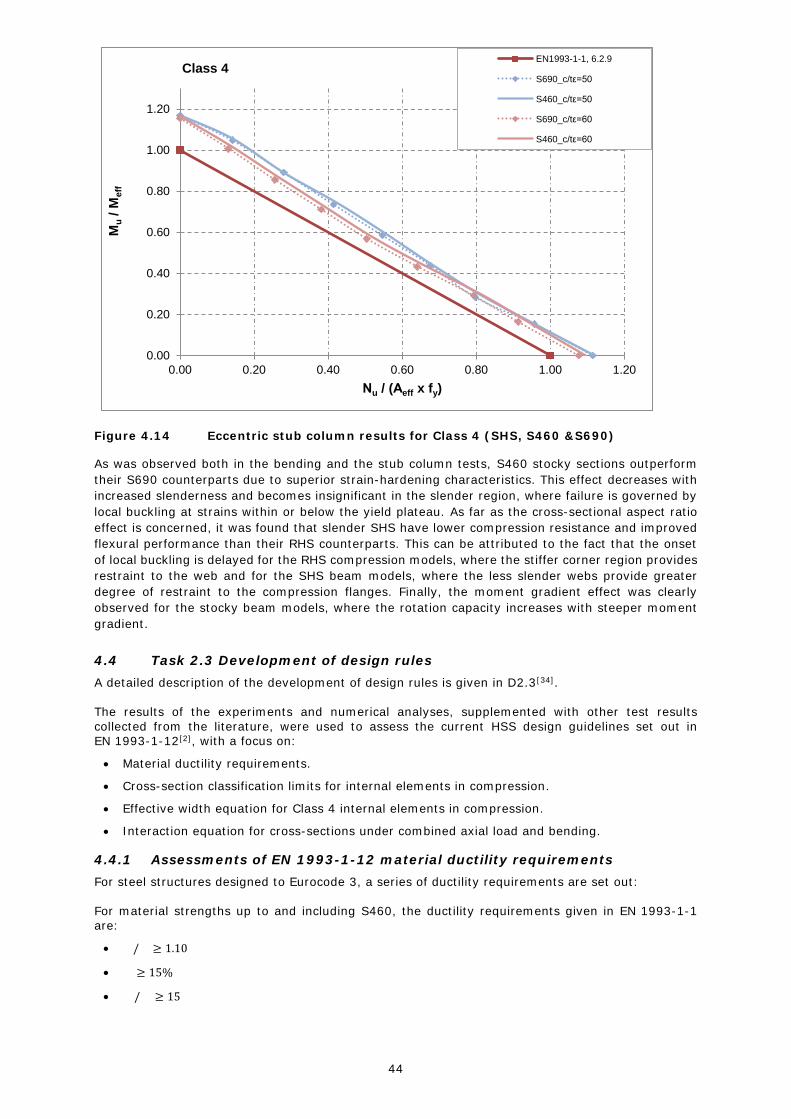
44
Figure 4.14 Eccentric stub column results for Class 4 (SHS, S460 &S690)
As was observed both in the bending and the stub column tests, S460 stocky sections outperform
their S690 counterparts due to superior strain-hardening characteristics. This effect decreases with
increased slenderness and becomes insignificant in the slender region, where failure is governed by
local buckling at strains within or below the yield plateau. As far as the cross-sectional aspect ratio
effect is concerned, it was found that slender SHS have lower compression resistance and improved
flexural performance than their RHS counterparts. This can be attributed to the fact that the onset
of local buckling is delayed for the RHS compression models, where the stiffer corner region provides
restraint to the web and for the SHS beam models, where the less slender webs provide greater
degree of restraint to the compression flanges. Finally, the moment gradient effect was clearly
observed for the stocky beam models, where the rotation capacity increases with steeper moment
gradient.
4.4 Task 2.3 Development of design rules
A detailed description of the development of design rules is given in D2.3[34].
The results of the experiments and numerical analyses, supplemented with other test results
collected from the literature, were used to assess the current HSS design guidelines set out in EN 1993-1-12[2], with a focus on:
Material ductility requirements.
Cross-section classification limits for internal elements in compression.
Effective width equation for Class 4 internal elements in compression.
Interaction equation for cross-sections under combined axial load and bending.
4.4.1 Assessments of EN 1993-1-12 material ductility requirements
For steel structures designed to Eurocode 3, a series of ductility requirements are set out:
For material strengths up to and including S460, the ductility requirements given in EN 1993-1-1 are:
� � /� � ≥ 1.10
� � ≥ 15%
� � /� � ≥ 15
0.00
0.20
0.40
0.60
0.80
1.00
1.20
0.00 0.20 0.40 0.60 0.80 1.00 1.20
Mu
/ M
eff
Νu / (Αeff x fy)
Class 4EN1993-1-1, 6.2.9
S690_c/tε=50
S460_c/tε=50
S690_c/tε=60
S460_c/tε=60

45
For higher strength steels, up to S700, the following, more relaxed ductility requirements, are set out in EN 1993-1-12:
� � /� � ≥ 1.05
� � ≥ 10%
� � /� � ≥ 15
In Figure 4.15 to Figure 4.17, the results from the tensile coupon tests on both the flat (F) and corner
(C) material, have been combined with those collated from the literature, and used to assess the
variation of the fu/fy ratio, εf and ultimate-to-yield strain εu/εy with yield stress fy. In summary, it was
shown that HSS with yield strengths in the range of 460-700 MPa, satisfy both the existing more
relaxed limits of EN 1993-1-12 as well as the stricter limits of EN 1993-1-1 related to the ultimate
to yield strength ratio fu/fy, the strain at fracture εf and the ultimate to yield strain ratio εu/εy.
Moreover, it was found that the EN 1993-1-12 relaxed limits for the ultimate to yield strength ratio
fu/fy and the strain at fracture εf are also generally satisfied by the higher strength materials with
yield strengths above 700 MPa; this was however not the case for the ultimate to yield strain ratios
εu/εy.
Figure 4.15 Assessment of the fu/fy ductility limits in Eurocode 3
Figure 4.16 Assessment of the εf ductility limits in Eurocode 3

46
Figure 4.17 Assessment of the εu/εy ductility limits in Eurocode 3
4.4.2 Assessment of EN 1993-1-12 cross-section classification limits and effective width equation
Eurocode 3 adopts the concept of cross-section classification for the treatment of local buckling. EN 1993-1-12 adopts the same classification limits for HSS as are set out for conventional strength steel in EN 1993-1-1, but with the restriction that plastic design is not permitted for HSS structures.
The current slenderness limits for internal elements in compression were assessed against the assembled experimental and numerical data for HSS structural hollow sections. Stricter slenderness limits that have been provisionally accepted for inclusion in the next revision of EN 1993-1-1 for
conventional strength steel were also considered.
In Figure 4.18, the rotation capacity R from the beam tests and the FE models is plotted against the local slenderness c/tε of the flange, allowing an assessment of the Class 1 limit for internal
elements in compression.
In Figure 4.19, the ultimate moment resistance Mmax from the beam tests and the FE models has been normalised by the plastic moment resistance Mpl and plotted against the c/tε ratio of the flange, allowing an assessment of the Class 2 limit for internal elements in compression.
In Figure 4.20, the ultimate moment resistance Mmax obtained from the test and FE models is normalised by the elastic moment resistance Mel and plotted against the c/tε ratio of the compression flange, allowing the assessment of the Class 3 limits based on the beam test
results.
In Figure 4.21, the ultimate load Nu reached in the stub column tests has been normalised by the cross-section yield load and plotted against the local slenderness parameter c/tε of the
compression flange, allowing the assessment of the Class 3 limits based on the stub column test results.
Based on the same collection of test data presented in Figure 4.21, the effective width equation for slender Class 4 internal elements in compression is examined in Figure 4.22.
In all cases, the stricter limits (c/tε = 28 for Class 1; c/tε = 34 for Class 2 and c/tε = 38 for Class 3)
better reflected the behaviour of HSS internal compression elements than the existing limits (c/tε =
33 for Class 1; c/tε = 38 for Class 2 and c/tε = 42 for Class 3) and were proposed to be adopted for
HSS.
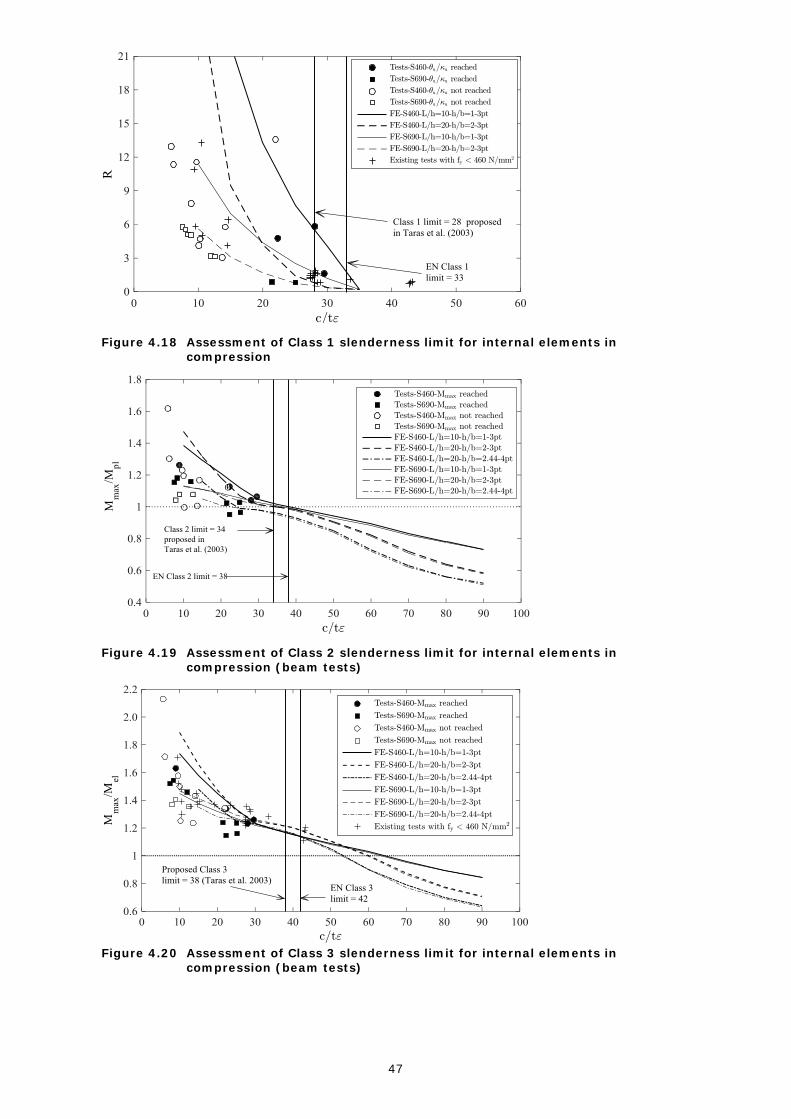
47
Figure 4.18 Assessment of Class 1 slenderness limit for internal elements in compression
Figure 4.19 Assessment of Class 2 slenderness limit for internal elements in compression (beam tests)
Figure 4.20 Assessment of Class 3 slenderness limit for internal elements in
compression (beam tests)
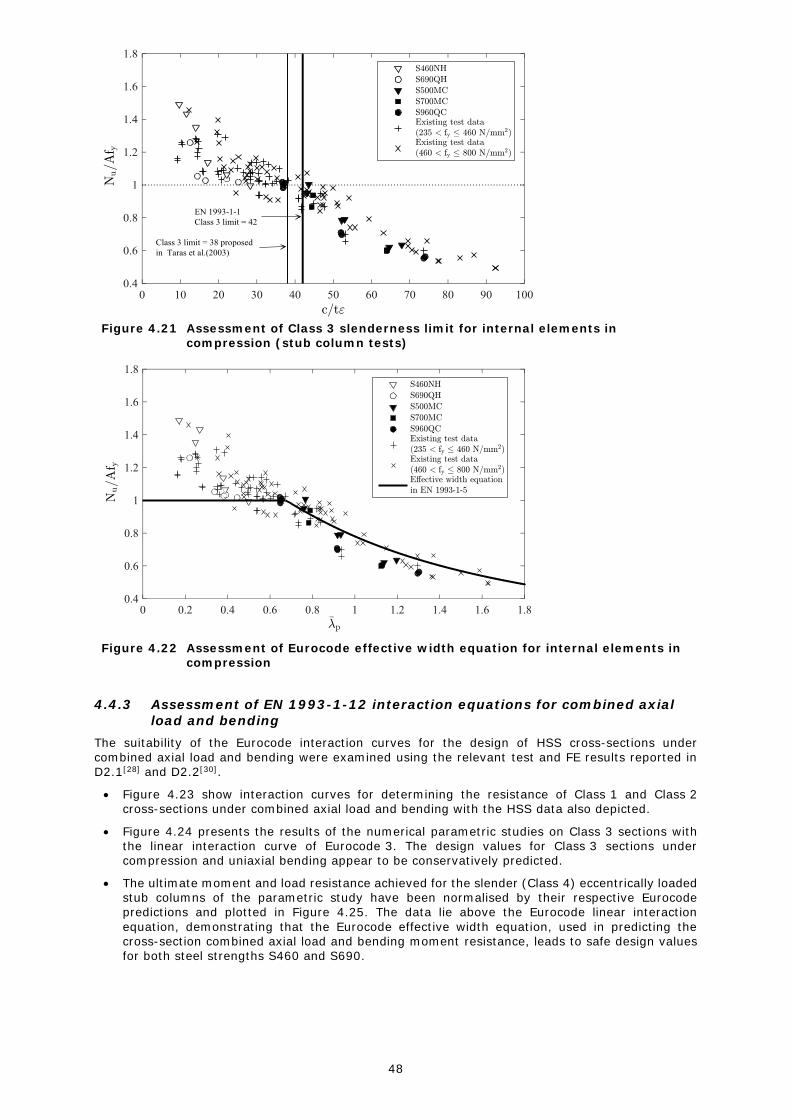
48
Figure 4.21 Assessment of Class 3 slenderness limit for internal elements in
compression (stub column tests)
Figure 4.22 Assessment of Eurocode effective width equation for internal elements in compression
4.4.3 Assessment of EN 1993-1-12 interaction equations for combined axial
load and bending
The suitability of the Eurocode interaction curves for the design of HSS cross-sections under
combined axial load and bending were examined using the relevant test and FE results reported in D2.1[28] and D2.2[30].
Figure 4.23 show interaction curves for determining the resistance of Class 1 and Class 2 cross-sections under combined axial load and bending with the HSS data also depicted.
Figure 4.24 presents the results of the numerical parametric studies on Class 3 sections with the linear interaction curve of Eurocode 3. The design values for Class 3 sections under compression and uniaxial bending appear to be conservatively predicted.
The ultimate moment and load resistance achieved for the slender (Class 4) eccentrically loaded stub columns of the parametric study have been normalised by their respective Eurocode predictions and plotted in Figure 4.25. The data lie above the Eurocode linear interaction
equation, demonstrating that the Eurocode effective width equation, used in predicting the cross-section combined axial load and bending moment resistance, leads to safe design values for both steel strengths S460 and S690.
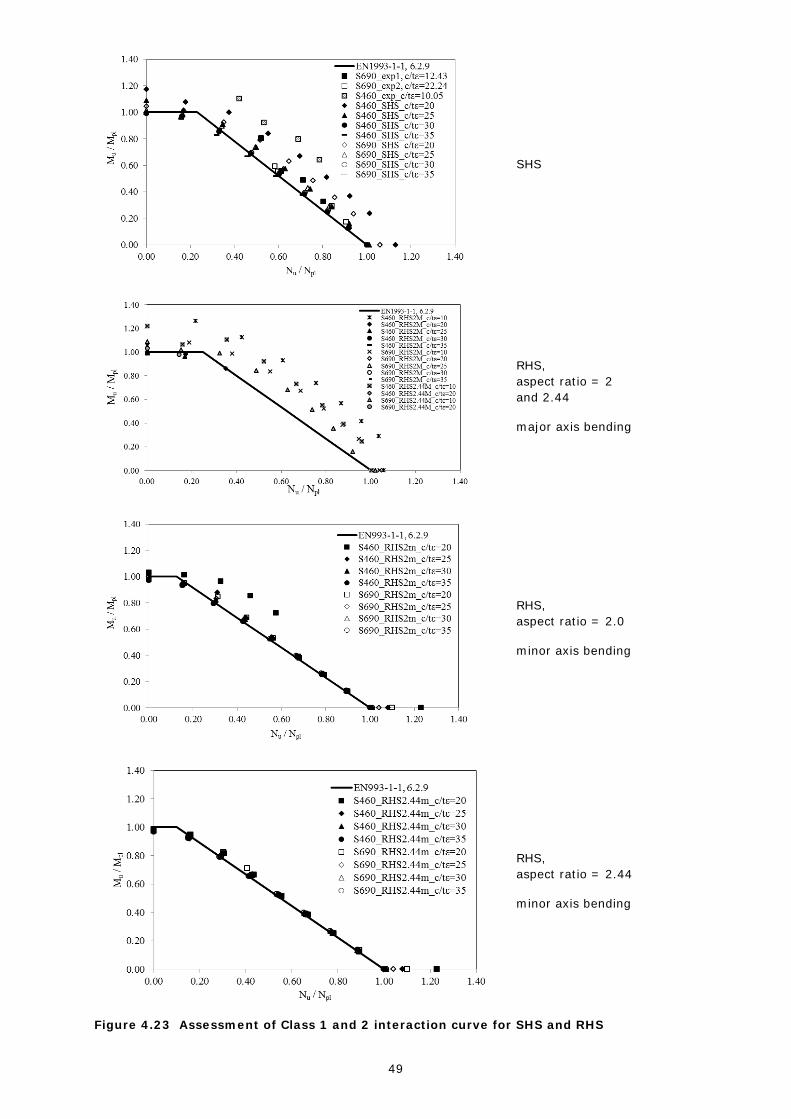
49
SHS
RHS,
aspect ratio = 2
and 2.44
major axis bending
RHS,
aspect ratio = 2.0
minor axis bending
RHS,
aspect ratio = 2.44
minor axis bending
Figure 4.23 Assessment of Class 1 and 2 interaction curve for SHS and RHS
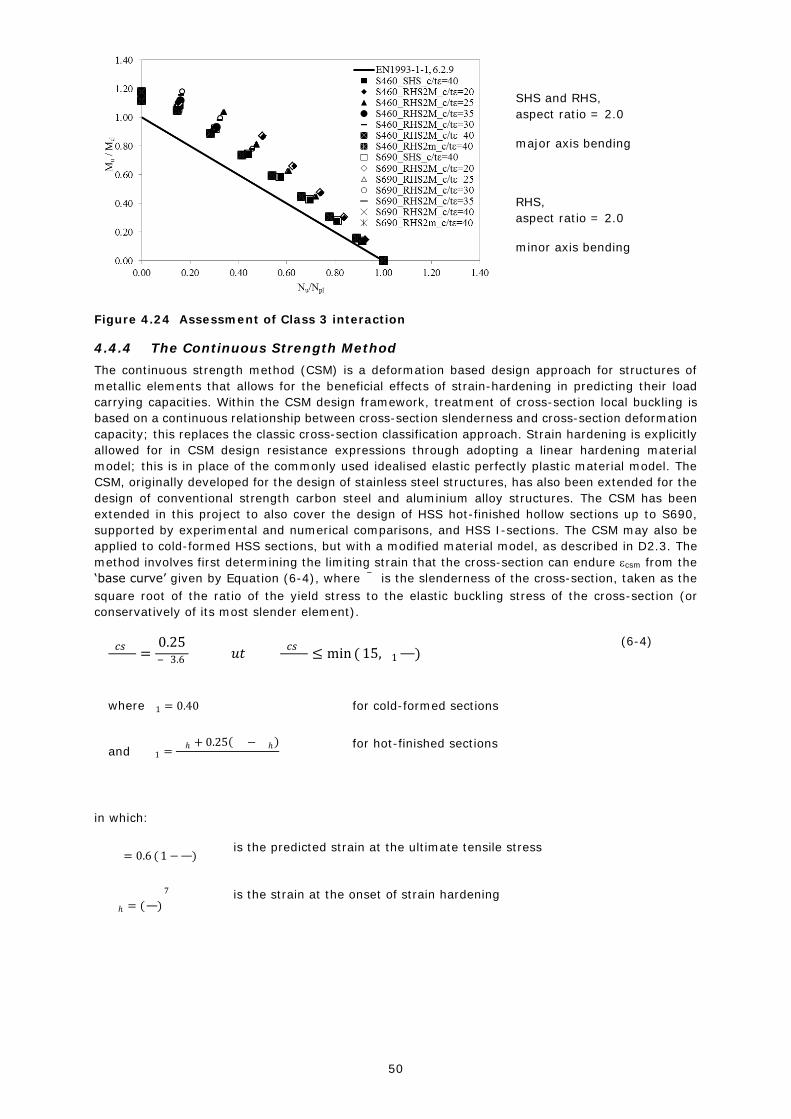
50
SHS and RHS,
aspect ratio = 2.0
major axis bending
RHS,
aspect ratio = 2.0
minor axis bending
Figure 4.24 Assessment of Class 3 interaction
4.4.4 The Continuous Strength Method
The continuous strength method (CSM) is a deformation based design approach for structures of
metallic elements that allows for the beneficial effects of strain-hardening in predicting their load
carrying capacities. Within the CSM design framework, treatment of cross-section local buckling is
based on a continuous relationship between cross-section slenderness and cross-section deformation
capacity; this replaces the classic cross-section classification approach. Strain hardening is explicitly
allowed for in CSM design resistance expressions through adopting a linear hardening material
model; this is in place of the commonly used idealised elastic perfectly plastic material model. The
CSM, originally developed for the design of stainless steel structures, has also been extended for the
design of conventional strength carbon steel and aluminium alloy structures. The CSM has been
extended in this project to also cover the design of HSS hot-finished hollow sections up to S690,
supported by experimental and numerical comparisons, and HSS I-sections. The CSM may also be
applied to cold-formed HSS sections, but with a modified material model, as described in D2.3. The
method involves first determining the limiting strain that the cross-section can endure csm from the
‘base curve’ given by Equation (6-4), where � ̅ � is the slenderness of the cross-section, taken as the
square root of the ratio of the yield stress to the elastic buckling stress of the cross-section (or
conservatively of its most slender element).
� 𝑐𝑠�
� �=0.25
� ̅ �3.6
� 𝑢𝑡
� 𝑐𝑠�
� �≤ min ( 15, � 1
� �� �)
(6-4)
where � 1 = 0.40 for cold-formed sections
and � 1 =� � ℎ + 0.25(� � − � � ℎ)
� �
for hot-finished sections
in which:
� � = 0.6 ( 1 −� �� �)
is the predicted strain at the ultimate tensile stress
� � ℎ = (� �� �)7
� � is the strain at the onset of strain hardening
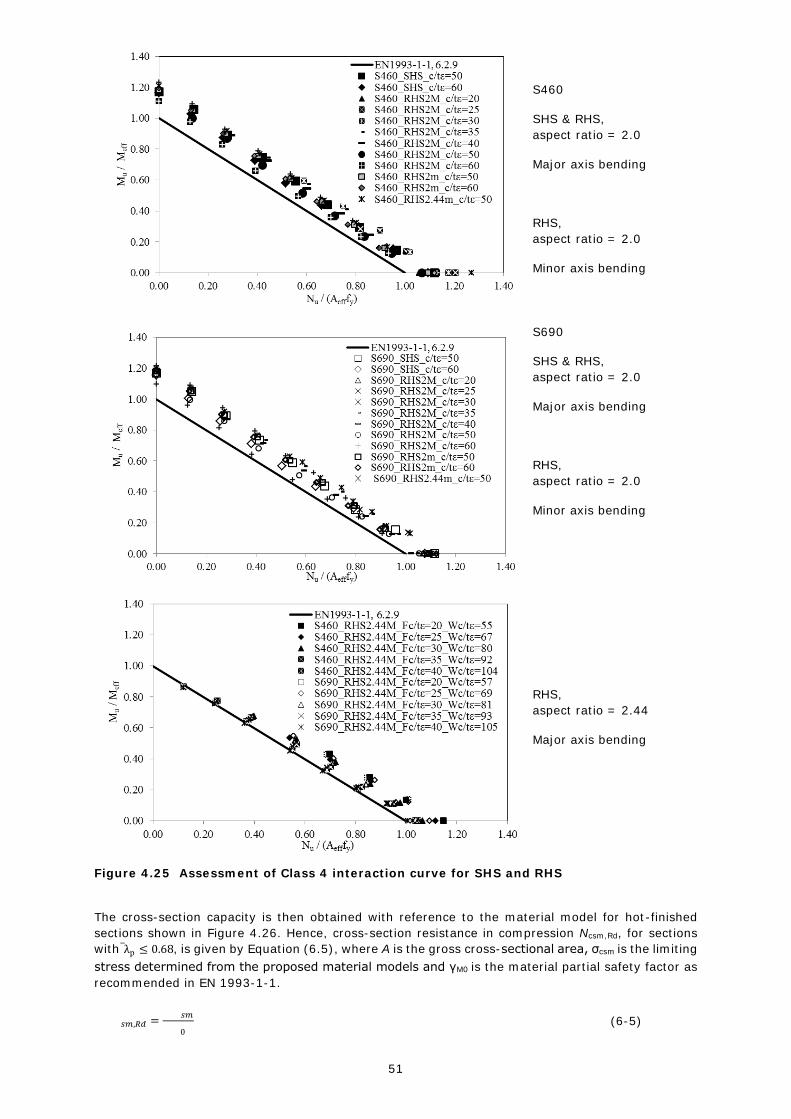
51
S460
SHS & RHS,
aspect ratio = 2.0
Major axis bending
RHS,
aspect ratio = 2.0
Minor axis bending
S690
SHS & RHS,
aspect ratio = 2.0
Major axis bending
RHS,
aspect ratio = 2.0
Minor axis bending
RHS,
aspect ratio = 2.44
Major axis bending
Figure 4.25 Assessment of Class 4 interaction curve for SHS and RHS
The cross-section capacity is then obtained with reference to the material model for hot-finished
sections shown in Figure 4.26. Hence, cross-section resistance in compression Ncsm,Rd, for sections
with λ̅p ≤ 0.68, is given by Equation (6.5), where A is the gross cross-sectional area, σcsm is the limiting
stress determined from the proposed material models and γM0 is the material partial safety factor as
recommended in EN 1993-1-1.
� � 𝑠𝑚,𝑅𝑑 =� � � 𝑠𝑚
� � 0 (6-5)
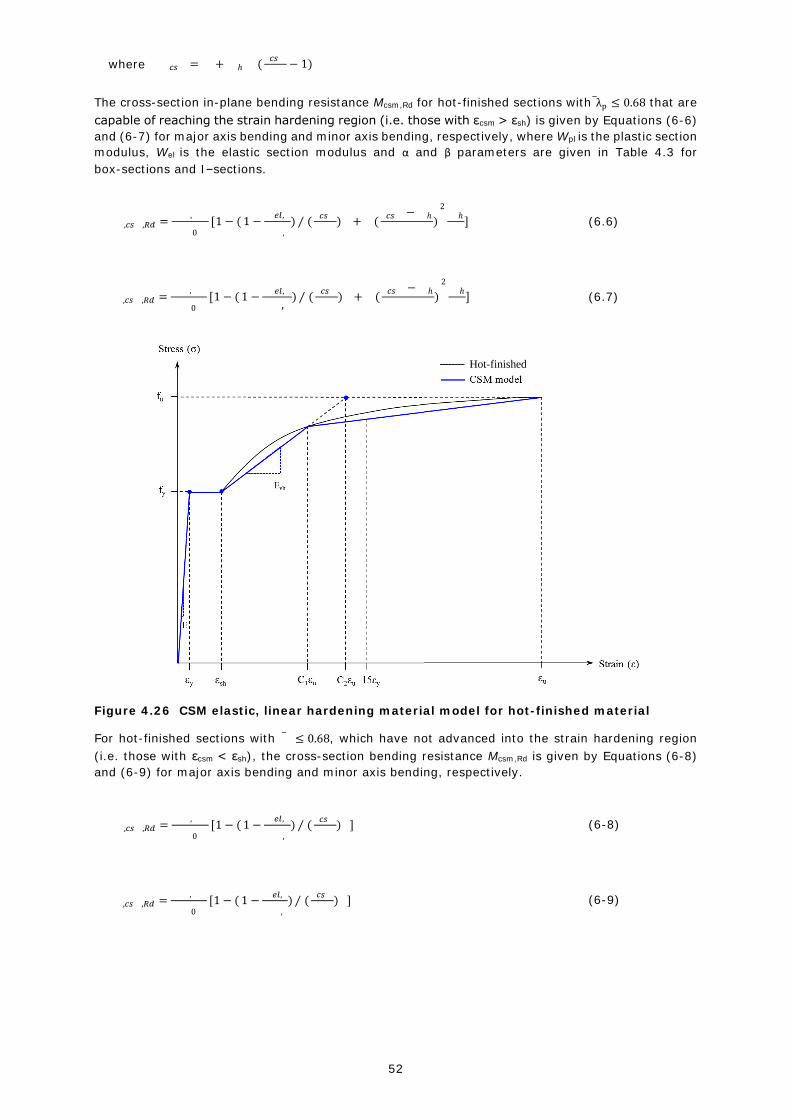
52
where � 𝑐𝑠� = � � + � � ℎ � � (� 𝑐𝑠�
� �− 1)
The cross-section in-plane bending resistance Mcsm,Rd for hot-finished sections with λ̅p ≤ 0.68 that are
capable of reaching the strain hardening region (i.e. those with εcsm > εsh) is given by Equations (6-6)
and (6-7) for major axis bending and minor axis bending, respectively, where Wpl is the plastic section
modulus, Wel is the elastic section modulus and α and β parameters are given in Table 4.3 for
box-sections and I–sections.
� � ,𝑐𝑠� ,𝑅𝑑 =� � � ,� � �� � 0
[1 − (1 −� 𝑒𝑙,�
� � � ,�) (
� 𝑐𝑠�
� �)�
⁄ + � (� 𝑐𝑠� − � � ℎ
� �)2 � � ℎ� ] (6.6)
� � ,𝑐𝑠� ,𝑅𝑑 =� � � ,� � �� � 0
[1 − (1 −� 𝑒𝑙,�
� � � , �) (
� 𝑐𝑠�
� �)�
⁄ + � (� 𝑐𝑠� − � � ℎ
� �)2 � � ℎ� ] (6.7)
Figure 4.26 CSM elastic, linear hardening material model for hot-finished material
For hot-finished sections with � ̅ � ≤ 0.68, which have not advanced into the strain hardening region
(i.e. those with εcsm < εsh), the cross-section bending resistance Mcsm,Rd is given by Equations (6-8)
and (6-9) for major axis bending and minor axis bending, respectively.
� � ,𝑐𝑠� ,𝑅𝑑 =� � � ,� � �� � 0
[1 − (1 −� 𝑒𝑙,�
� � � ,�) (
� 𝑐𝑠�
� �)�
⁄ ] (6-8)
� � ,𝑐𝑠� ,𝑅𝑑 =� � � ,� � �� � 0
[1 − (1 −� 𝑒𝑙,�
� � � ,�) (
� 𝑐𝑠�
� �)�
⁄ ] (6-9)
Hot-finished
steel
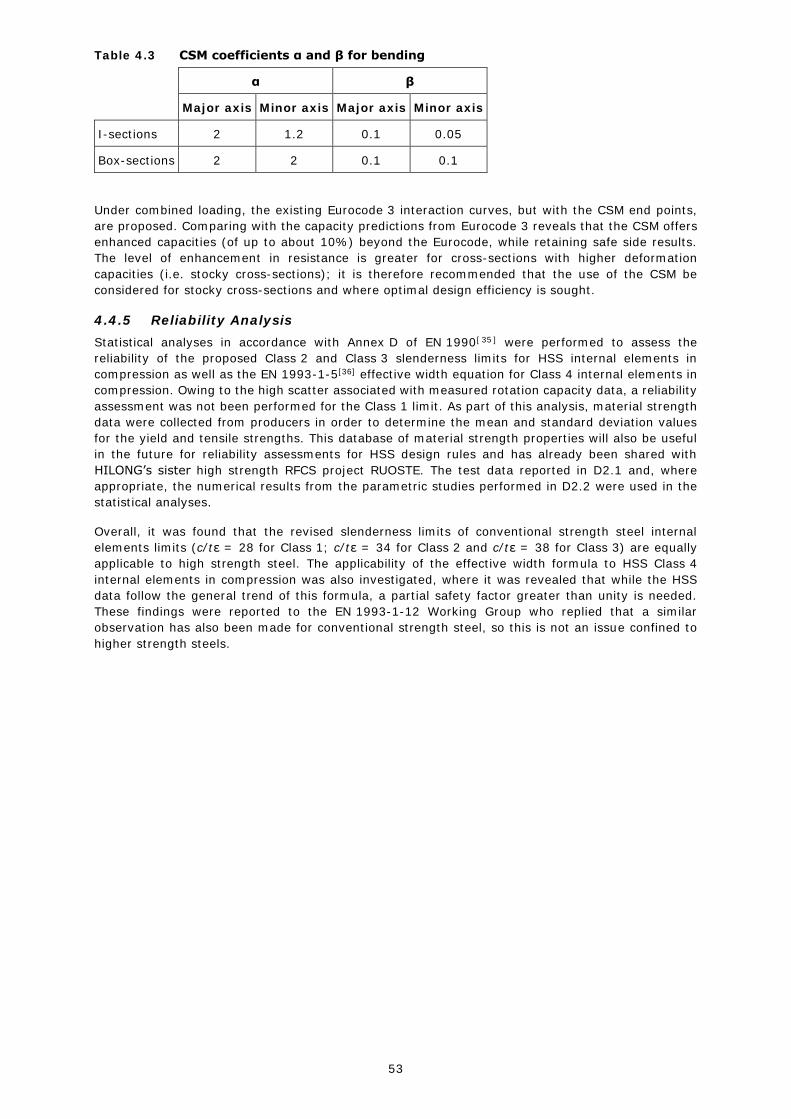
53
Table 4.3 CSM coefficients α and β for bending
α β
Major axis Minor axis Major axis Minor axis
I-sections 2 1.2 0.1 0.05
Box-sections 2 2 0.1 0.1
Under combined loading, the existing Eurocode 3 interaction curves, but with the CSM end points,
are proposed. Comparing with the capacity predictions from Eurocode 3 reveals that the CSM offers
enhanced capacities (of up to about 10%) beyond the Eurocode, while retaining safe side results.
The level of enhancement in resistance is greater for cross-sections with higher deformation
capacities (i.e. stocky cross-sections); it is therefore recommended that the use of the CSM be
considered for stocky cross-sections and where optimal design efficiency is sought.
4.4.5 Reliability Analysis
Statistical analyses in accordance with Annex D of EN 1990[ 35 ] were performed to assess the
reliability of the proposed Class 2 and Class 3 slenderness limits for HSS internal elements in
compression as well as the EN 1993-1-5[36] effective width equation for Class 4 internal elements in
compression. Owing to the high scatter associated with measured rotation capacity data, a reliability
assessment was not been performed for the Class 1 limit. As part of this analysis, material strength
data were collected from producers in order to determine the mean and standard deviation values
for the yield and tensile strengths. This database of material strength properties will also be useful
in the future for reliability assessments for HSS design rules and has already been shared with
HILONG’s sister high strength RFCS project RUOSTE. The test data reported in D2.1 and, where
appropriate, the numerical results from the parametric studies performed in D2.2 were used in the
statistical analyses.
Overall, it was found that the revised slenderness limits of conventional strength steel internal
elements limits (c/tε = 28 for Class 1; c/tε = 34 for Class 2 and c/tε = 38 for Class 3) are equally
applicable to high strength steel. The applicability of the effective width formula to HSS Class 4
internal elements in compression was also investigated, where it was revealed that while the HSS
data follow the general trend of this formula, a partial safety factor greater than unity is needed.
These findings were reported to the EN 1993-1-12 Working Group who replied that a similar
observation has also been made for conventional strength steel, so this is not an issue confined to
higher strength steels.

54
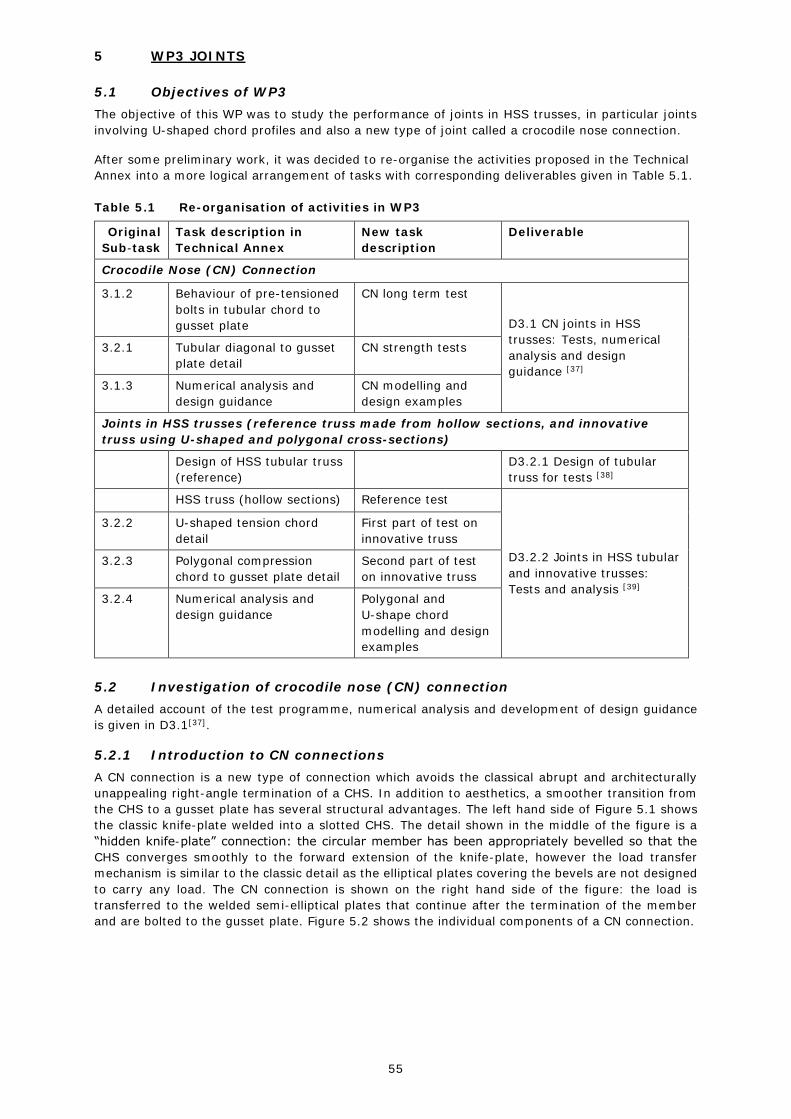
55
5 WP3 JOINTS
5.1 Objectives of WP3
The objective of this WP was to study the performance of joints in HSS trusses, in particular joints
involving U-shaped chord profiles and also a new type of joint called a crocodile nose connection.
After some preliminary work, it was decided to re-organise the activities proposed in the Technical
Annex into a more logical arrangement of tasks with corresponding deliverables given in Table 5.1.
Table 5.1 Re-organisation of activities in WP3
Original
Sub-task
Task description in
Technical Annex
New task
description
Deliverable
Crocodile Nose (CN) Connection
3.1.2 Behaviour of pre-tensioned
bolts in tubular chord to
gusset plate
CN long term test
D3.1 CN joints in HSS
trusses: Tests, numerical
analysis and design
guidance [37]
3.2.1 Tubular diagonal to gusset
plate detail
CN strength tests
3.1.3 Numerical analysis and
design guidance
CN modelling and
design examples
Joints in HSS trusses (reference truss made from hollow sections, and innovative
truss using U-shaped and polygonal cross-sections)
Design of HSS tubular truss
(reference)
D3.2.1 Design of tubular
truss for tests [38]
HSS truss (hollow sections) Reference test
D3.2.2 Joints in HSS tubular
and innovative trusses:
Tests and analysis [39]
3.2.2 U-shaped tension chord
detail
First part of test on
innovative truss
3.2.3 Polygonal compression
chord to gusset plate detail
Second part of test
on innovative truss
3.2.4 Numerical analysis and
design guidance
Polygonal and
U-shape chord
modelling and design
examples
5.2 Investigation of crocodile nose (CN) connection
A detailed account of the test programme, numerical analysis and development of design guidance
is given in D3.1[37].
5.2.1 Introduction to CN connections
A CN connection is a new type of connection which avoids the classical abrupt and architecturally
unappealing right-angle termination of a CHS. In addition to aesthetics, a smoother transition from
the CHS to a gusset plate has several structural advantages. The left hand side of Figure 5.1 shows
the classic knife-plate welded into a slotted CHS. The detail shown in the middle of the figure is a
“hidden knife-plate” connection: the circular member has been appropriately bevelled so that the
CHS converges smoothly to the forward extension of the knife-plate, however the load transfer
mechanism is similar to the classic detail as the elliptical plates covering the bevels are not designed
to carry any load. The CN connection is shown on the right hand side of the figure: the load is
transferred to the welded semi-elliptical plates that continue after the termination of the member
and are bolted to the gusset plate. Figure 5.2 shows the individual components of a CN connection.

56
Figure 5.1 The evolution of the crocodile nose connection
From left to right, typical knife-plate connection, bevelled connection, crocodile nose connection.
Figure 5.2 Parts of the crocodile nose connection
There are numerous parameters defining the behaviour of a CN connection, including:
Angle of inflection of the semi-elliptical plates.
Gap form: either parallel or wedge-shape gap.
Gap size.
Presence (or absence) of the connecting plate.
The geometrical characteristics of the tube, the design load, the steel strength and the bolt
characteristics are also important parameters.
5.2.2 Tests on CN connections
A programme of tests on CN connections was carried out to investigate two issues: strength tests
studied failure of the inflected plate and long-term tests measured the loss of pretension force of the
bolts over time.
The initial test matrix consisted of 8 strength test and 8 long term specimens. Due to unexpectedly
high fabrication costs, the number of the specimens was reduced to a total of 8. This was achieved
by removing the gap parameter from the test matrix, which was considered of minor influence to the
behaviour of the joint. Instead of testing 2 gap sizes, all specimens had the same gap, thus reducing
the number of specimens required to half: 4 strength test specimens (Figure 5.3) and 4 long-term
tests (Figure 5.4). Figure 5.5 shows a photograph of the strength tests specimens.

57
The tubes were S690 159 x 8.8 mm seamless CHS. The inflected plates were 4 mm thick S650 steel.
There were six pretensioned 10.9 M26 x 70 bolts in each connection.
Figure 5.3 Assembled CN strength test specimen with attachment parts
Figure 5.4 Assembled CN long-term specimen
Figure 5.5 Strength test specimens
To perform the two series of tests, a number of ancillary parts were designed and fabricated,
including the gusset plates (S650 8 mm thick for the strength test, S355 16 mm thick for the
long-term test), attachment grapples with holes to facilitate a pin connection, pins and securing
plates for the pins, etc.
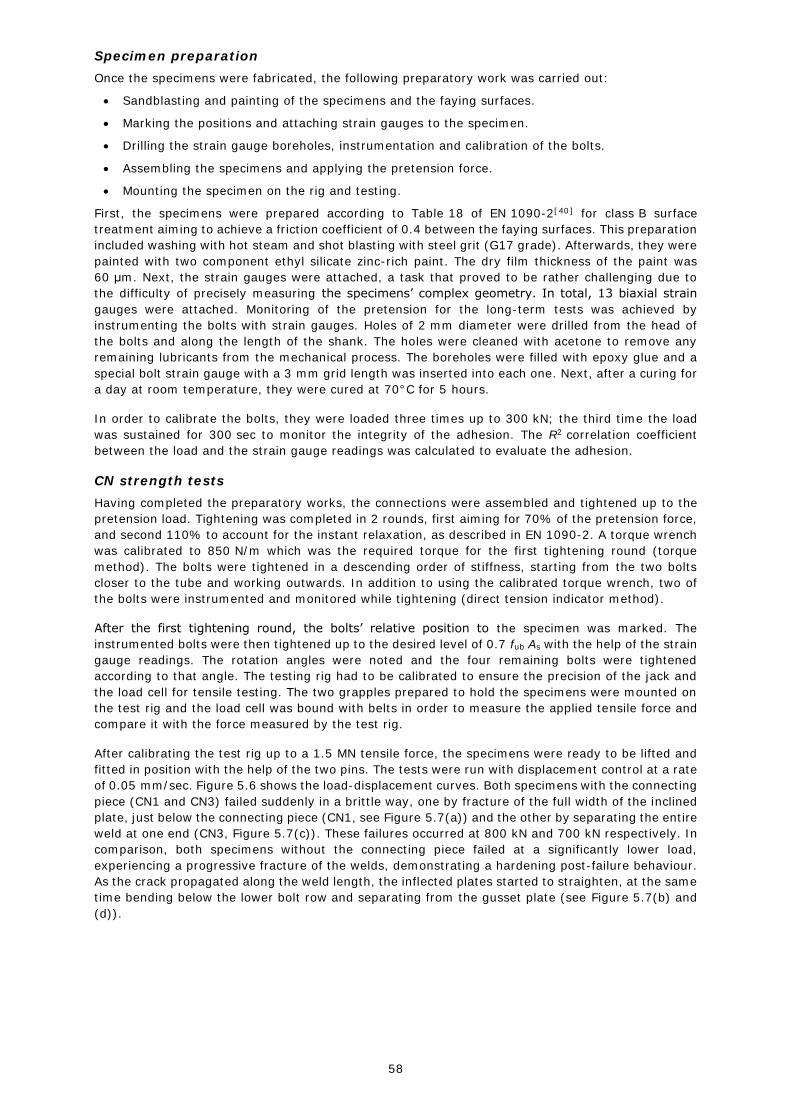
58
Specimen preparation
Once the specimens were fabricated, the following preparatory work was carried out:
Sandblasting and painting of the specimens and the faying surfaces.
Marking the positions and attaching strain gauges to the specimen.
Drilling the strain gauge boreholes, instrumentation and calibration of the bolts.
Assembling the specimens and applying the pretension force.
Mounting the specimen on the rig and testing.
First, the specimens were prepared according to Table 18 of EN 1090-2[40] for class B surface
treatment aiming to achieve a friction coefficient of 0.4 between the faying surfaces. This preparation
included washing with hot steam and shot blasting with steel grit (G17 grade). Afterwards, they were
painted with two component ethyl silicate zinc-rich paint. The dry film thickness of the paint was
60 μm. Next, the strain gauges were attached, a task that proved to be rather challenging due to
the difficulty of precisely measuring the specimens’ complex geometry. In total, 13 biaxial strain
gauges were attached. Monitoring of the pretension for the long-term tests was achieved by
instrumenting the bolts with strain gauges. Holes of 2 mm diameter were drilled from the head of
the bolts and along the length of the shank. The holes were cleaned with acetone to remove any
remaining lubricants from the mechanical process. The boreholes were filled with epoxy glue and a
special bolt strain gauge with a 3 mm grid length was inserted into each one. Next, after a curing for
a day at room temperature, they were cured at 70°C for 5 hours.
In order to calibrate the bolts, they were loaded three times up to 300 kN; the third time the load
was sustained for 300 sec to monitor the integrity of the adhesion. The R2 correlation coefficient
between the load and the strain gauge readings was calculated to evaluate the adhesion.
CN strength tests
Having completed the preparatory works, the connections were assembled and tightened up to the
pretension load. Tightening was completed in 2 rounds, first aiming for 70% of the pretension force,
and second 110% to account for the instant relaxation, as described in EN 1090-2. A torque wrench
was calibrated to 850 N/m which was the required torque for the first tightening round (torque
method). The bolts were tightened in a descending order of stiffness, starting from the two bolts
closer to the tube and working outwards. In addition to using the calibrated torque wrench, two of
the bolts were instrumented and monitored while tightening (direct tension indicator method).
After the first tightening round, the bolts’ relative position to the specimen was marked. The
instrumented bolts were then tightened up to the desired level of 0.7 fub As with the help of the strain
gauge readings. The rotation angles were noted and the four remaining bolts were tightened
according to that angle. The testing rig had to be calibrated to ensure the precision of the jack and
the load cell for tensile testing. The two grapples prepared to hold the specimens were mounted on
the test rig and the load cell was bound with belts in order to measure the applied tensile force and
compare it with the force measured by the test rig.
After calibrating the test rig up to a 1.5 MN tensile force, the specimens were ready to be lifted and
fitted in position with the help of the two pins. The tests were run with displacement control at a rate
of 0.05 mm/sec. Figure 5.6 shows the load-displacement curves. Both specimens with the connecting
piece (CN1 and CN3) failed suddenly in a brittle way, one by fracture of the full width of the inclined
plate, just below the connecting piece (CN1, see Figure 5.7(a)) and the other by separating the entire
weld at one end (CN3, Figure 5.7(c)). These failures occurred at 800 kN and 700 kN respectively. In
comparison, both specimens without the connecting piece failed at a significantly lower load,
experiencing a progressive fracture of the welds, demonstrating a hardening post-failure behaviour.
As the crack propagated along the weld length, the inflected plates started to straighten, at the same
time bending below the lower bolt row and separating from the gusset plate (see Figure 5.7(b) and
(d)).
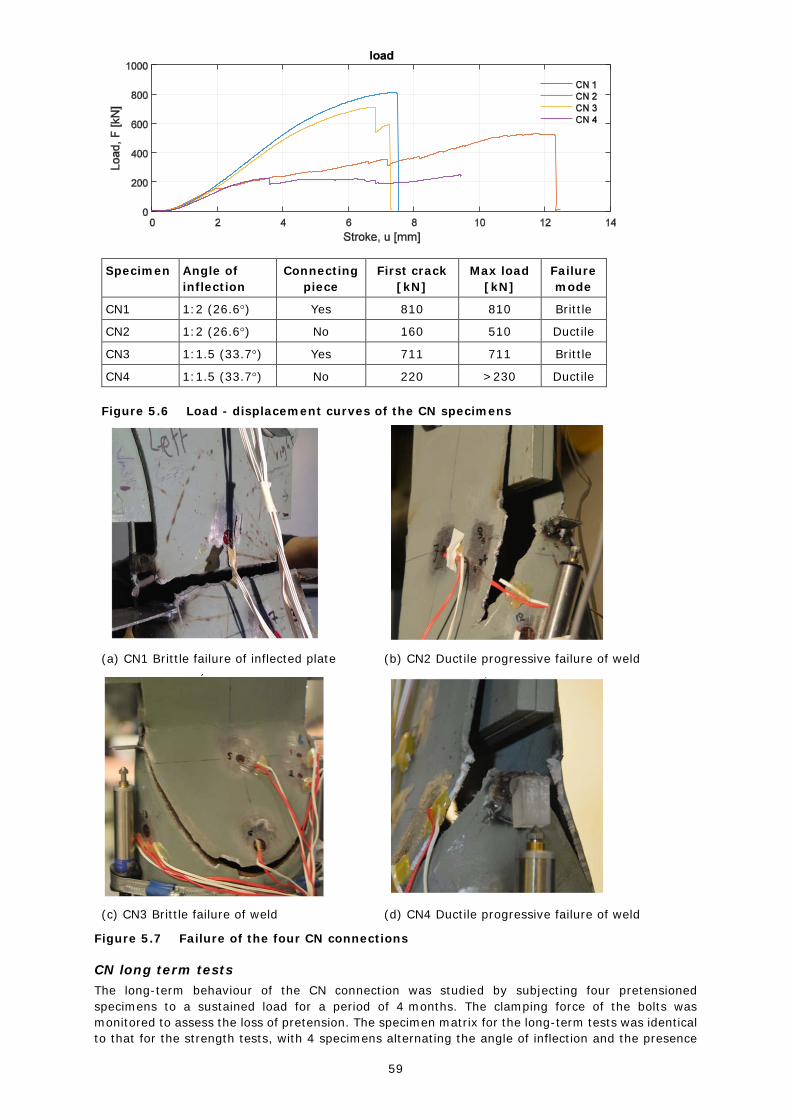
59
Specimen Angle of
inflection
Connecting
piece
First crack
[kN]
Max load
[kN]
Failure
mode
CN1 1:2 (26.6) Yes 810 810 Brittle
CN2 1:2 (26.6) No 160 510 Ductile
CN3 1:1.5 (33.7) Yes 711 711 Brittle
CN4 1:1.5 (33.7) No 220 >230 Ductile
Figure 5.6 Load - displacement curves of the CN specimens
(a) CN1 Brittle failure of inflected plate (b) CN2 Ductile progressive failure of weld
(c) CN3 Brittle failure of weld (d) CN4 Ductile progressive failure of weld
Figure 5.7 Failure of the four CN connections
CN long term tests
The long-term behaviour of the CN connection was studied by subjecting four pretensioned
specimens to a sustained load for a period of 4 months. The clamping force of the bolts was
monitored to assess the loss of pretension. The specimen matrix for the long-term tests was identical
to that for the strength tests, with 4 specimens alternating the angle of inflection and the presence
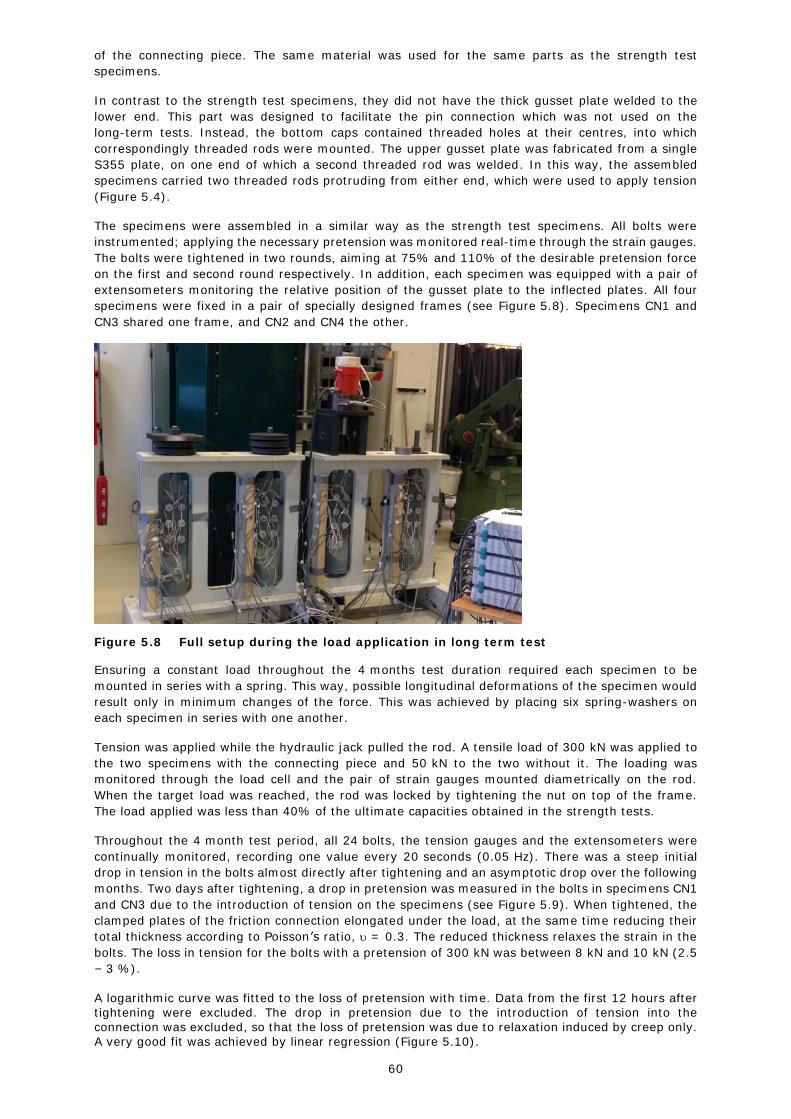
60
of the connecting piece. The same material was used for the same parts as the strength test
specimens.
In contrast to the strength test specimens, they did not have the thick gusset plate welded to the
lower end. This part was designed to facilitate the pin connection which was not used on the
long-term tests. Instead, the bottom caps contained threaded holes at their centres, into which
correspondingly threaded rods were mounted. The upper gusset plate was fabricated from a single
S355 plate, on one end of which a second threaded rod was welded. In this way, the assembled
specimens carried two threaded rods protruding from either end, which were used to apply tension
(Figure 5.4).
The specimens were assembled in a similar way as the strength test specimens. All bolts were
instrumented; applying the necessary pretension was monitored real-time through the strain gauges.
The bolts were tightened in two rounds, aiming at 75% and 110% of the desirable pretension force
on the first and second round respectively. In addition, each specimen was equipped with a pair of
extensometers monitoring the relative position of the gusset plate to the inflected plates. All four
specimens were fixed in a pair of specially designed frames (see Figure 5.8). Specimens CN1 and
CN3 shared one frame, and CN2 and CN4 the other.
Figure 5.8 Full setup during the load application in long term test
Ensuring a constant load throughout the 4 months test duration required each specimen to be
mounted in series with a spring. This way, possible longitudinal deformations of the specimen would
result only in minimum changes of the force. This was achieved by placing six spring-washers on
each specimen in series with one another.
Tension was applied while the hydraulic jack pulled the rod. A tensile load of 300 kN was applied to
the two specimens with the connecting piece and 50 kN to the two without it. The loading was
monitored through the load cell and the pair of strain gauges mounted diametrically on the rod.
When the target load was reached, the rod was locked by tightening the nut on top of the frame.
The load applied was less than 40% of the ultimate capacities obtained in the strength tests.
Throughout the 4 month test period, all 24 bolts, the tension gauges and the extensometers were
continually monitored, recording one value every 20 seconds (0.05 Hz). There was a steep initial
drop in tension in the bolts almost directly after tightening and an asymptotic drop over the following
months. Two days after tightening, a drop in pretension was measured in the bolts in specimens CN1
and CN3 due to the introduction of tension on the specimens (see Figure 5.9). When tightened, the
clamped plates of the friction connection elongated under the load, at the same time reducing their
total thickness according to Poisson’s ratio, = 0.3. The reduced thickness relaxes the strain in the
bolts. The loss in tension for the bolts with a pretension of 300 kN was between 8 kN and 10 kN (2.5
– 3 %).
A logarithmic curve was fitted to the loss of pretension with time. Data from the first 12 hours after tightening were excluded. The drop in pretension due to the introduction of tension into the connection was excluded, so that the loss of pretension was due to relaxation induced by creep only. A very good fit was achieved by linear regression (Figure 5.10).
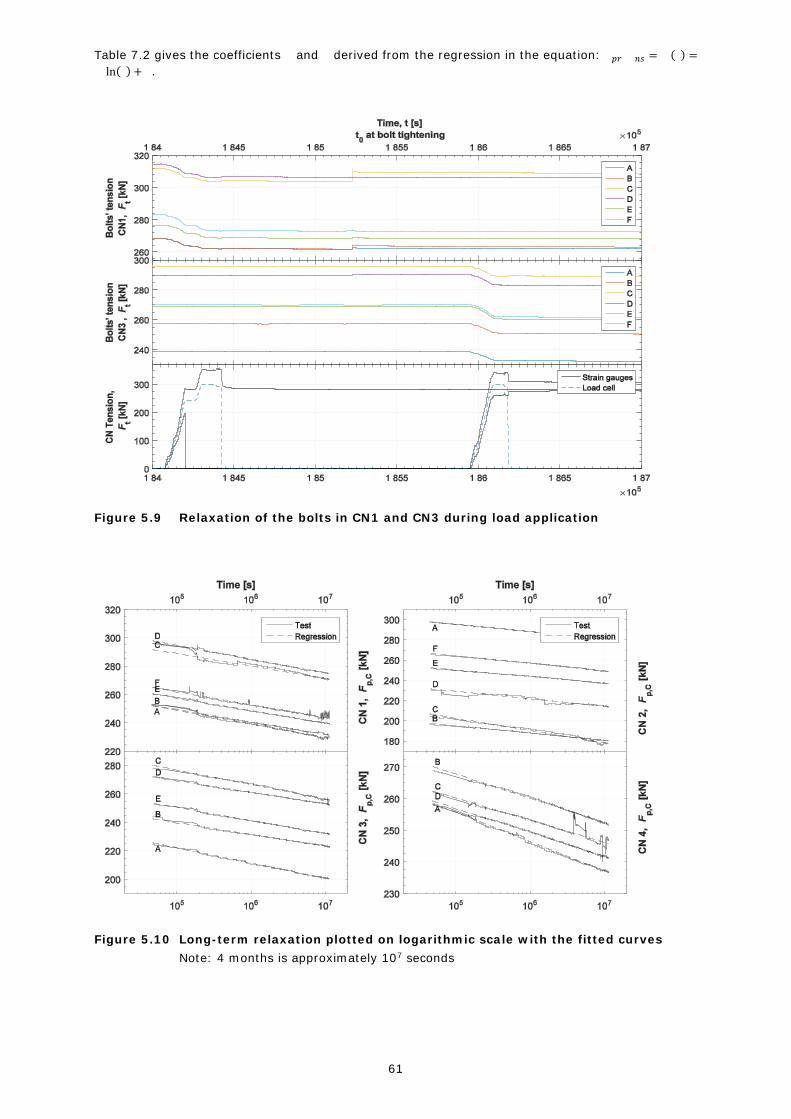
61
Table 7.2 gives the coefficients � and � derived from the regression in the equation: � 𝑝𝑟 � � � 𝑛𝑠 = � (� ) = � ln(� ) + � .
Figure 5.9 Relaxation of the bolts in CN1 and CN3 during load application
Figure 5.10 Long-term relaxation plotted on logarithmic scale with the fitted curves
Note: 4 months is approximately 107 seconds
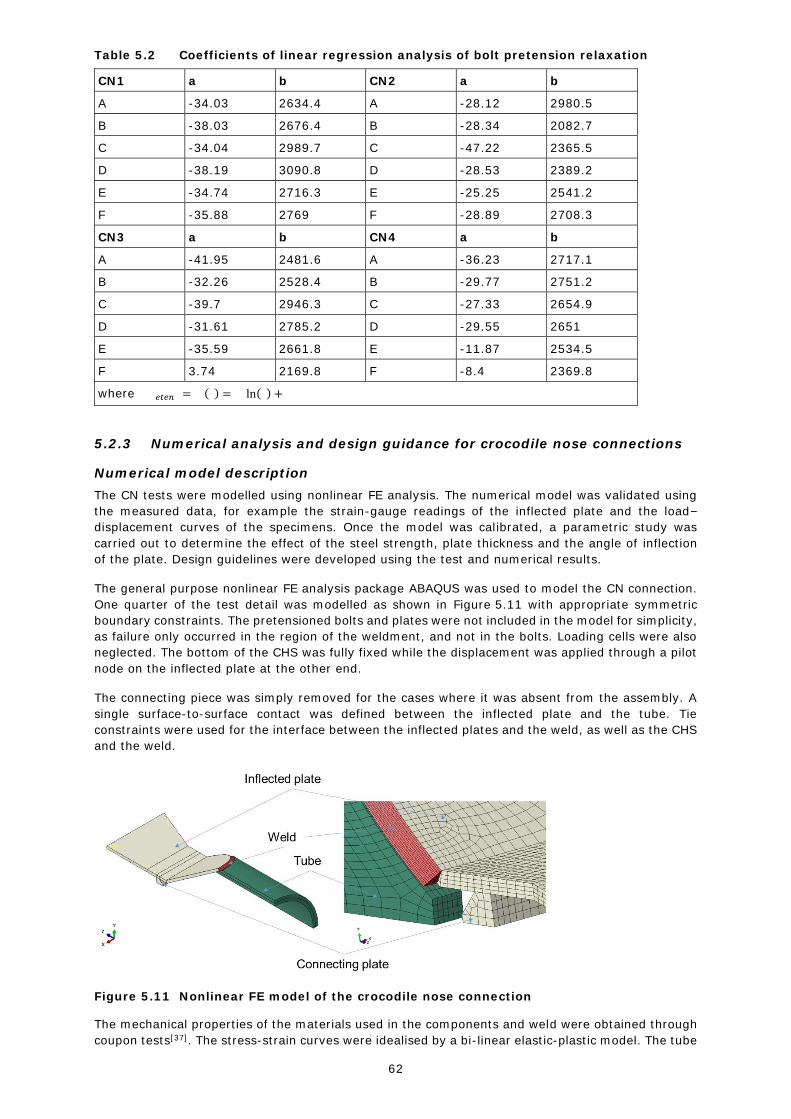
62
Table 5.2 Coefficients of linear regression analysis of bolt pretension relaxation
CN1 a b CN2 a b
A -34.03 2634.4 A -28.12 2980.5
B -38.03 2676.4 B -28.34 2082.7
C -34.04 2989.7 C -47.22 2365.5
D -38.19 3090.8 D -28.53 2389.2
E -34.74 2716.3 E -25.25 2541.2
F -35.88 2769 F -28.89 2708.3
CN3 a b CN4 a b
A -41.95 2481.6 A -36.23 2717.1
B -32.26 2528.4 B -29.77 2751.2
C -39.7 2946.3 C -27.33 2654.9
D -31.61 2785.2 D -29.55 2651
E -35.59 2661.8 E -11.87 2534.5
F 3.74 2169.8 F -8.4 2369.8
where � � � 𝑒𝑡𝑒𝑛� = � (� ) = � ln(� ) + �
5.2.3 Numerical analysis and design guidance for crocodile nose connections
Numerical model description
The CN tests were modelled using nonlinear FE analysis. The numerical model was validated using
the measured data, for example the strain-gauge readings of the inflected plate and the load–
displacement curves of the specimens. Once the model was calibrated, a parametric study was
carried out to determine the effect of the steel strength, plate thickness and the angle of inflection
of the plate. Design guidelines were developed using the test and numerical results.
The general purpose nonlinear FE analysis package ABAQUS was used to model the CN connection.
One quarter of the test detail was modelled as shown in Figure 5.11 with appropriate symmetric
boundary constraints. The pretensioned bolts and plates were not included in the model for simplicity,
as failure only occurred in the region of the weldment, and not in the bolts. Loading cells were also
neglected. The bottom of the CHS was fully fixed while the displacement was applied through a pilot
node on the inflected plate at the other end.
The connecting piece was simply removed for the cases where it was absent from the assembly. A
single surface-to-surface contact was defined between the inflected plate and the tube. Tie
constraints were used for the interface between the inflected plates and the weld, as well as the CHS
and the weld.
Figure 5.11 Nonlinear FE model of the crocodile nose connection
The mechanical properties of the materials used in the components and weld were obtained through
coupon tests[37]. The stress-strain curves were idealised by a bi-linear elastic-plastic model. The tube

63
and the connecting plate were assumed to have the same material properties as the inflected plate.
A rupture strain of 0.15 was assumed for the weld material in order to model the damage of the
weldment observed in the test.
FE model validation
The numerical model was first validated by comparing the strain gauge readings at various locations
on the inflected plate and tube for CN3, as shown in Figure 5.12. Only elastic deformations were
considered.
Figure 5.12 Strain gauge positions on test specimen of CN connection
Figure 5.13 shows that the numerical elastic strains from the FE model compare reasonably well with
their experimental counterparts. The difference in experimental strain measurements between
mirrored locations should be noted. These discrepancies, when still in the elastic range, might be
due to eccentricities in the application of loading either by slight misalignment of the specimen in the
frame or fabrication tolerances, as well as inaccuracies/errors from the measuring devices. However,
overall, there is good agreement and the elastic strains are reasonably close with the exception of
location 6(8) where the numerical results are significantly greater than the test. This may be
attributed to the complex stress/strain field around the crown of the ellipse.
The FE model was firstly solved using a general static method, but minor convergence issues were
experienced due to material failure and large deformation of elements in the weldment. In order to
avoid numerical instability and have a robust model for the parametric study, an explicit dynamic
method was then used instead. Details of the measures taken and procedures followed to ensure the
validity of the dynamic solver are explained in D3.1[37].
Figure 5.14 presents an overall comparison between the FE model and the four strength tests. The
difference in the predicted initial stiffness for all four cases to that measured in the tests is thought
to be mainly attributed to the elastic deformation of the loading cell and possible gap/slip between
components. The general characteristics of the structural behaviour of the connection were
reproduced by the numerical models reasonably well. For specimen CN1 and CN3, the predicted
ultimate capacities were similar to the test measurements. The progressive damage of the weld was
also reproduced by the FE model for specimen CN2 and CN4.
Table 5.3 presents a comparison of the measured and numerically predicted load at different damage
stages. The corresponding failure modes are shown in Figure 5.15. For cases CN1 and CN3 with the
connecting plate, the dominant failure mode is brittle and it can therefore be assumed that load at
first crack is the same as the ultimate load. FE results compare well with the experiments for both
cases with and without the connecting plate. The load predicted by the numerical model at first crack
for CN2 (151 kN) is close to the test measurements (160 kN). However, for test specimen CN4 the
numerical load level at first crack is 155.5 kN which is lower than the test value of 230 kN. This could
be attributed to uncertainty in the test specimen and also the definition of first crack in the numerical
model (i.e. when the first element of the weldment reaches a strain of 0.15, it is deleted).
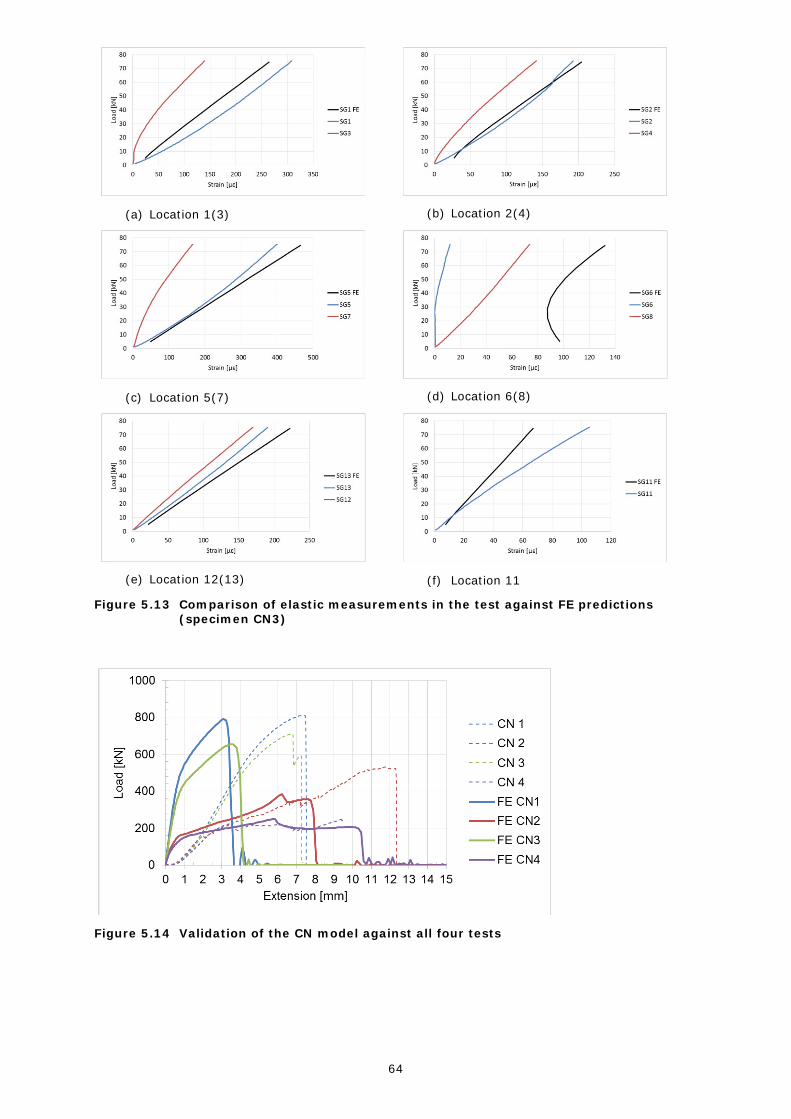
64
(a) Location 1(3)
(b) Location 2(4)
(c) Location 5(7)
(d) Location 6(8)
(e) Location 12(13)
(f) Location 11
Figure 5.13 Comparison of elastic measurements in the test against FE predictions (specimen CN3)
Figure 5.14 Validation of the CN model against all four tests

65
Table 5.3 Comparison of ultimate load capacities (experimental vs numerical)
Inclination/connecting piece First crack [kN] Max load [kN] Failure mode
Test FE Test FE Test FE
CN1 1:2 / yes 810 790 810 790 Brittle Brittle*
CN2 1:2 / no 160 151 510 384 Ductile Ductile
CN3 1:1.5 / yes 711 653 711 653 Brittle Brittle
CN4 1:1.5 / no 220 155.5 >230 248 Ductile Ductile
* Brittle failure in weld NOT the inflected plate as occurred in the test
CN1 CN2
CN3 CN4
Figure 5.15 Comparison of failure modes obtained from FE and those observed in tests
The brittle failure occurred in the weld material for CN1 rather than in the inflected plate as observed
in the test. As previously mentioned, no damage model was used for the material of the inflected
plate. However, the strain level in the inflected plate was checked in the analysis results. It was
found that the inflected plate strain was smaller than the strain in the weld (as predicted), which led
to failure occurring in the weld material first.
It was discovered later that the maximum plastic strain in the inflected plate was not sensitive to the
angle of inflection. Varying the angle of inflection in the FE model did not change the plastic strain in
the plate significantly throughout the loading process. It was not possible to shift the failure from
weld material to inflected plate without adding a damage model for the inflected plate and setting an
unrealistically small rupture strain. This observation indicated that the asymptotic nature of the stress
near areas of high stress concentration and particularly discontinuities would always lead to a high
level of strain in the weld material. As a result, failure always tends to start in the weld material.
Nonetheless, generally failure modes are well predicted by the numerical models and the maximum
failure load of the weldment can be reasonably accurately estimated by FE analysis.
Parametric study
Having validated the FE model for the CN connection, a parametric study was carried out using the
calibrated model to examine the effect of certain design parameters. Nine cases were defined
(Table 5.4) in order to examine the effect of steel strengths, the presence of the connecting plate
and the angle of inflection of the plates. It can be seen that the plate thickness and size of the CHS
are greater than those tested.
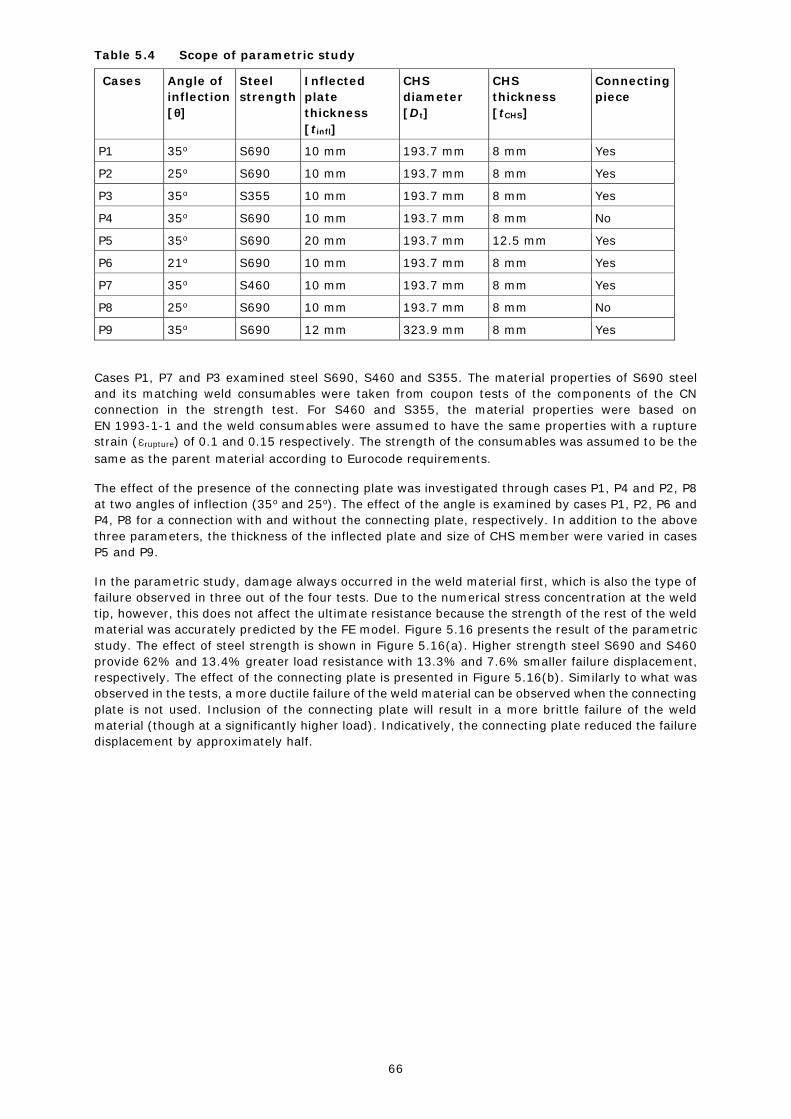
66
Table 5.4 Scope of parametric study
Cases Angle of
inflection
[θ]
Steel
strength
Inflected
plate
thickness
[tinfl]
CHS
diameter
[Dt]
CHS
thickness
[tCHS]
Connecting
piece
P1 35o S690 10 mm 193.7 mm 8 mm Yes
P2 25o S690 10 mm 193.7 mm 8 mm Yes
P3 35o S355 10 mm 193.7 mm 8 mm Yes
P4 35o S690 10 mm 193.7 mm 8 mm No
P5 35o S690 20 mm 193.7 mm 12.5 mm Yes
P6 21o S690 10 mm 193.7 mm 8 mm Yes
P7 35o S460 10 mm 193.7 mm 8 mm Yes
P8 25o S690 10 mm 193.7 mm 8 mm No
P9 35o S690 12 mm 323.9 mm 8 mm Yes
Cases P1, P7 and P3 examined steel S690, S460 and S355. The material properties of S690 steel
and its matching weld consumables were taken from coupon tests of the components of the CN
connection in the strength test. For S460 and S355, the material properties were based on
EN 1993-1-1 and the weld consumables were assumed to have the same properties with a rupture
strain (εrupture) of 0.1 and 0.15 respectively. The strength of the consumables was assumed to be the
same as the parent material according to Eurocode requirements.
The effect of the presence of the connecting plate was investigated through cases P1, P4 and P2, P8
at two angles of inflection (35o and 25o). The effect of the angle is examined by cases P1, P2, P6 and
P4, P8 for a connection with and without the connecting plate, respectively. In addition to the above
three parameters, the thickness of the inflected plate and size of CHS member were varied in cases
P5 and P9.
In the parametric study, damage always occurred in the weld material first, which is also the type of
failure observed in three out of the four tests. Due to the numerical stress concentration at the weld
tip, however, this does not affect the ultimate resistance because the strength of the rest of the weld
material was accurately predicted by the FE model. Figure 5.16 presents the result of the parametric
study. The effect of steel strength is shown in Figure 5.16(a). Higher strength steel S690 and S460
provide 62% and 13.4% greater load resistance with 13.3% and 7.6% smaller failure displacement,
respectively. The effect of the connecting plate is presented in Figure 5.16(b). Similarly to what was
observed in the tests, a more ductile failure of the weld material can be observed when the connecting
plate is not used. Inclusion of the connecting plate will result in a more brittle failure of the weld
material (though at a significantly higher load). Indicatively, the connecting plate reduced the failure
displacement by approximately half.
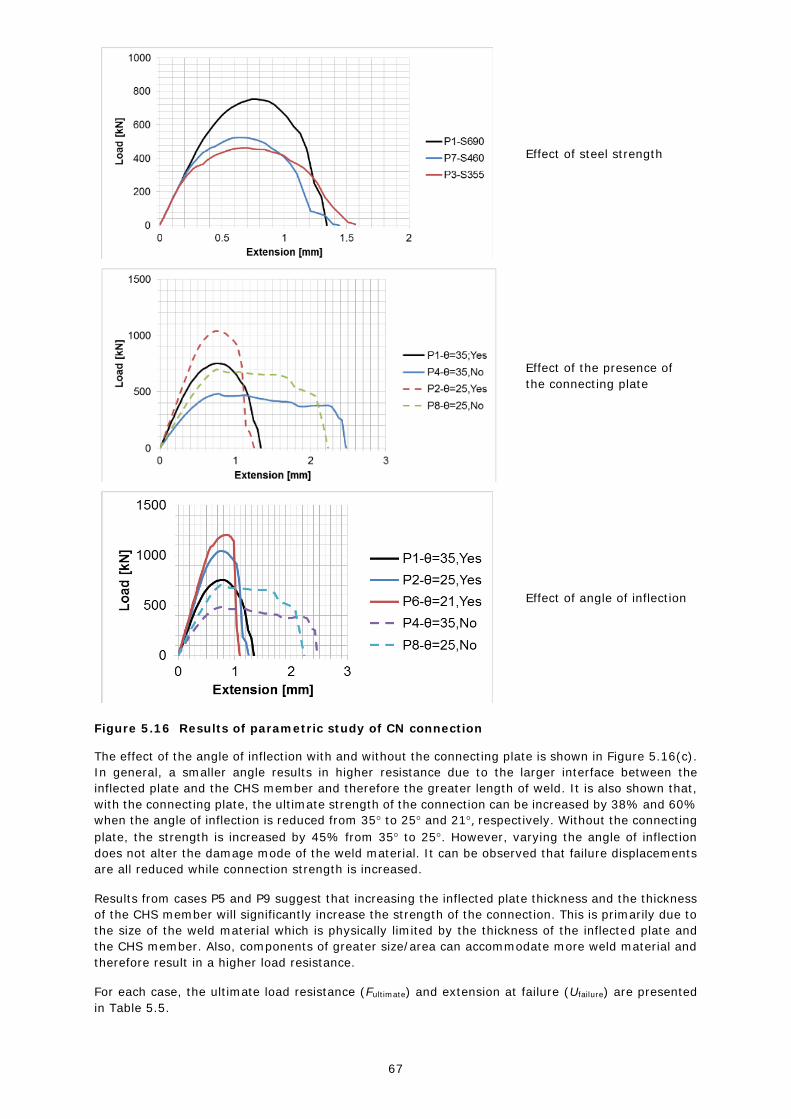
67
Effect of steel strength
Effect of the presence of
the connecting plate
Effect of angle of inflection
Figure 5.16 Results of parametric study of CN connection
The effect of the angle of inflection with and without the connecting plate is shown in Figure 5.16(c).
In general, a smaller angle results in higher resistance due to the larger interface between the
inflected plate and the CHS member and therefore the greater length of weld. It is also shown that,
with the connecting plate, the ultimate strength of the connection can be increased by 38% and 60%
when the angle of inflection is reduced from 35 to 25 and 21, respectively. Without the connecting
plate, the strength is increased by 45% from 35 to 25. However, varying the angle of inflection
does not alter the damage mode of the weld material. It can be observed that failure displacements
are all reduced while connection strength is increased.
Results from cases P5 and P9 suggest that increasing the inflected plate thickness and the thickness
of the CHS member will significantly increase the strength of the connection. This is primarily due to
the size of the weld material which is physically limited by the thickness of the inflected plate and
the CHS member. Also, components of greater size/area can accommodate more weld material and
therefore result in a higher load resistance.
For each case, the ultimate load resistance (Fultimate) and extension at failure (Ufailure) are presented
in Table 5.5.
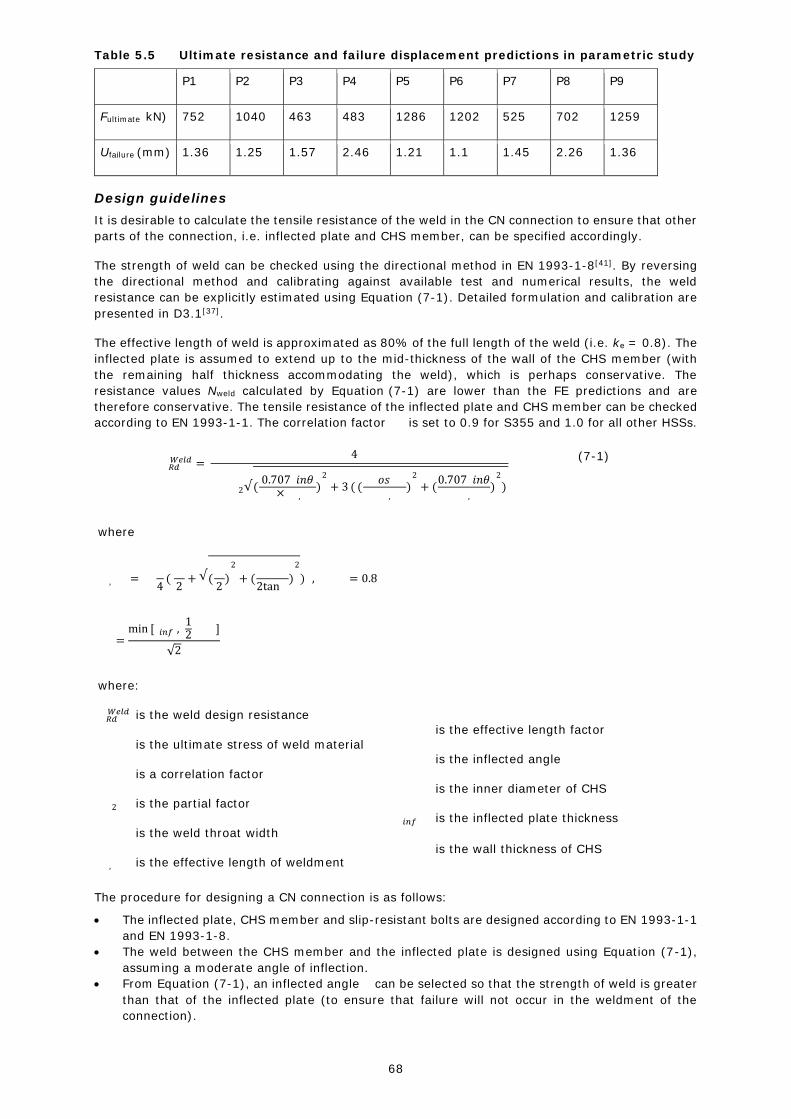
68
Table 5.5 Ultimate resistance and failure displacement predictions in parametric study
P1 P2 P3 P4 P5 P6 P7 P8 P9
Fultimate kN) 752 1040 463 483 1286 1202 525 702 1259
Ufailure (mm) 1.36 1.25 1.57 2.46 1.21 1.1 1.45 2.26 1.36
Design guidelines
It is desirable to calculate the tensile resistance of the weld in the CN connection to ensure that other
parts of the connection, i.e. inflected plate and CHS member, can be specified accordingly.
The strength of weld can be checked using the directional method in EN 1993-1-8[41]. By reversing
the directional method and calibrating against available test and numerical results, the weld
resistance can be explicitly estimated using Equation (7-1). Detailed formulation and calibration are
presented in D3.1[37].
The effective length of weld is approximated as 80% of the full length of the weld (i.e. ke = 0.8). The
inflected plate is assumed to extend up to the mid-thickness of the wall of the CHS member (with
the remaining half thickness accommodating the weld), which is perhaps conservative. The
resistance values Nweld calculated by Equation (7-1) are lower than the FE predictions and are
therefore conservative. The tensile resistance of the inflected plate and CHS member can be checked
according to EN 1993-1-1. The correlation factor � � is set to 0.9 for S355 and 1.0 for all other HSSs.
� 𝑅𝑑𝑊𝑒𝑙𝑑 =
4� �
� � � � 2√(0.707� 𝑖𝑛𝜃� � × � � ,� � �
)2+ 3 ( ( � 𝑜𝑠 �
� � � � ,� � �)2+ (0.707� 𝑖𝑛𝜃
� � � � ,� � �)2)
where
� � , � � � = � ��4 (
� �2 + √(
� �2 )
2
+ (� �
2tan � )2
) , � � = 0.8
� � =min [� 𝑖𝑛𝑓� ,
12 � � � � ]
√2
(7-1)
where:
� 𝑅𝑑𝑊𝑒𝑙𝑑 is the weld design resistance
� � is the ultimate stress of weld material
� � is a correlation factor
� � 2 is the partial factor
� � is the weld throat width
� � , � � � is the effective length of weldment
� � is the effective length factor
� is the inflected angle
� � is the inner diameter of CHS
� 𝑖𝑛𝑓� is the inflected plate thickness
� � � � is the wall thickness of CHS
The procedure for designing a CN connection is as follows:
The inflected plate, CHS member and slip-resistant bolts are designed according to EN 1993-1-1
and EN 1993-1-8.
The weld between the CHS member and the inflected plate is designed using Equation (7-1),
assuming a moderate angle of inflection.
From Equation (7-1), an inflected angle � can be selected so that the strength of weld is greater
than that of the inflected plate (to ensure that failure will not occur in the weldment of the
connection).
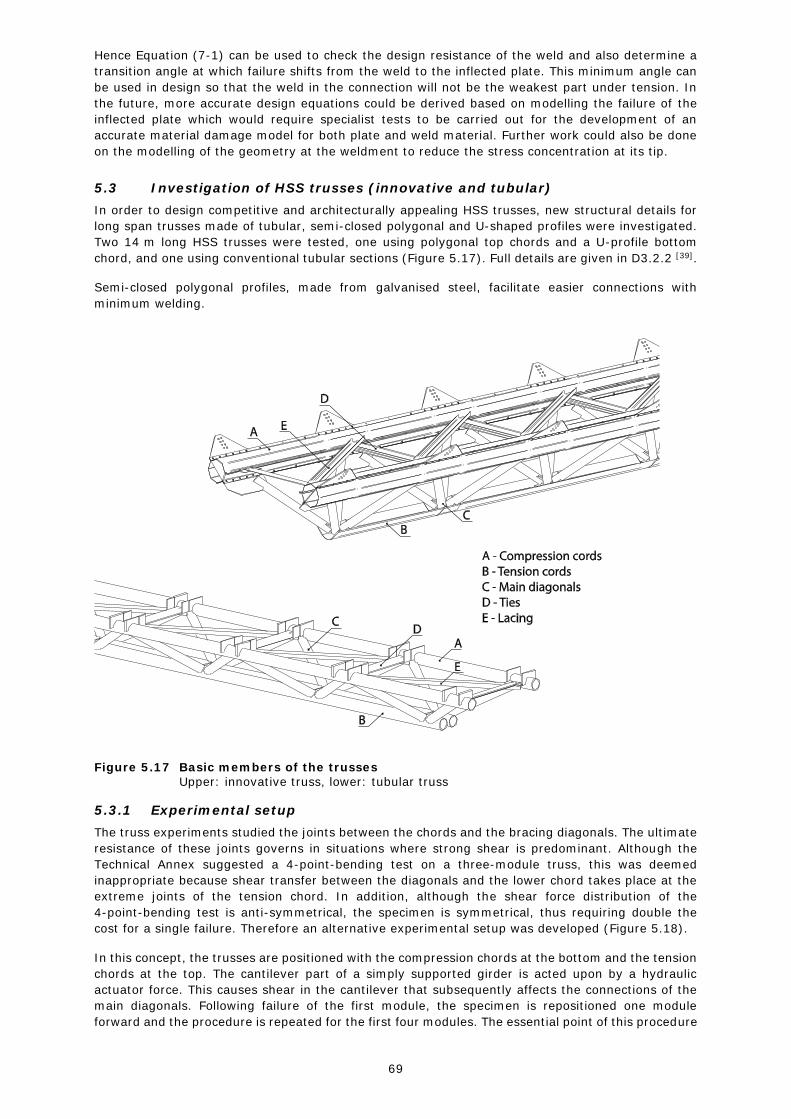
69
Hence Equation (7-1) can be used to check the design resistance of the weld and also determine a
transition angle at which failure shifts from the weld to the inflected plate. This minimum angle can
be used in design so that the weld in the connection will not be the weakest part under tension. In
the future, more accurate design equations could be derived based on modelling the failure of the
inflected plate which would require specialist tests to be carried out for the development of an
accurate material damage model for both plate and weld material. Further work could also be done
on the modelling of the geometry at the weldment to reduce the stress concentration at its tip.
5.3 Investigation of HSS trusses (innovative and tubular)
In order to design competitive and architecturally appealing HSS trusses, new structural details for
long span trusses made of tubular, semi-closed polygonal and U-shaped profiles were investigated.
Two 14 m long HSS trusses were tested, one using polygonal top chords and a U-profile bottom
chord, and one using conventional tubular sections (Figure 5.17). Full details are given in D3.2.2 [39].
Semi-closed polygonal profiles, made from galvanised steel, facilitate easier connections with
minimum welding.
Figure 5.17 Basic members of the trusses Upper: innovative truss, lower: tubular truss
5.3.1 Experimental setup
The truss experiments studied the joints between the chords and the bracing diagonals. The ultimate
resistance of these joints governs in situations where strong shear is predominant. Although the
Technical Annex suggested a 4-point-bending test on a three-module truss, this was deemed
inappropriate because shear transfer between the diagonals and the lower chord takes place at the
extreme joints of the tension chord. In addition, although the shear force distribution of the
4-point-bending test is anti-symmetrical, the specimen is symmetrical, thus requiring double the
cost for a single failure. Therefore an alternative experimental setup was developed (Figure 5.18).
In this concept, the trusses are positioned with the compression chords at the bottom and the tension
chords at the top. The cantilever part of a simply supported girder is acted upon by a hydraulic
actuator force. This causes shear in the cantilever that subsequently affects the connections of the
main diagonals. Following failure of the first module, the specimen is repositioned one module
forward and the procedure is repeated for the first four modules. The essential point of this procedure
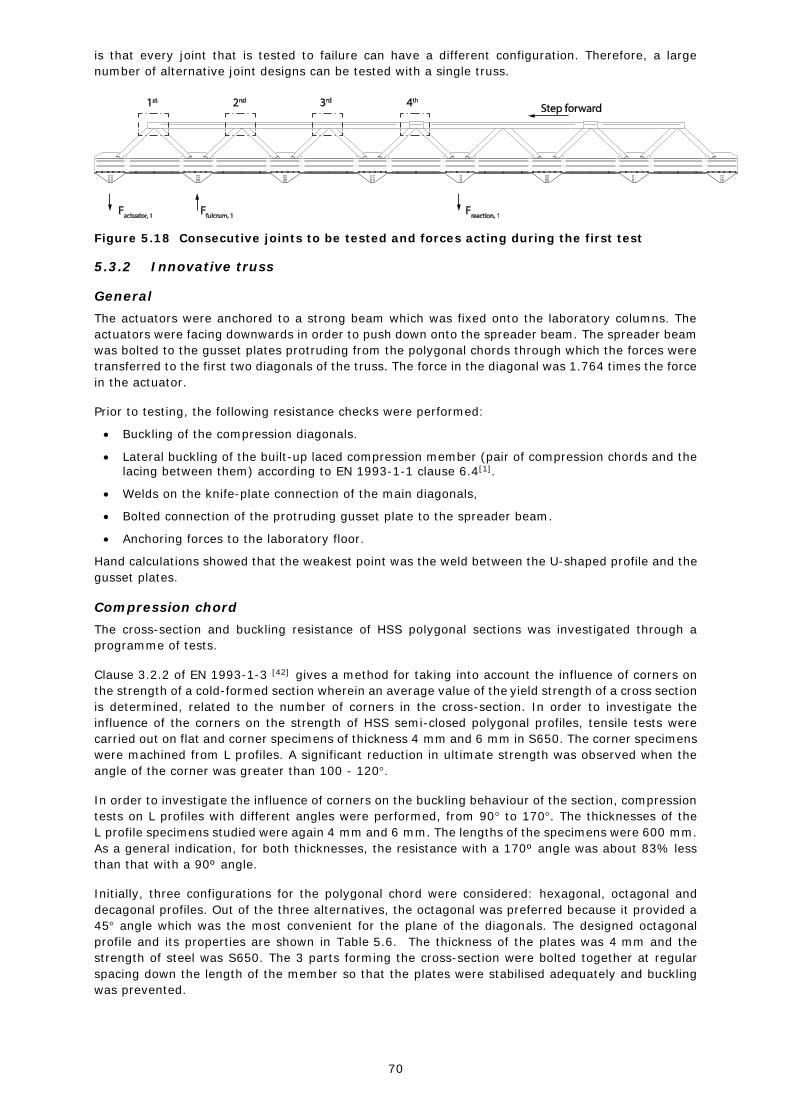
70
is that every joint that is tested to failure can have a different configuration. Therefore, a large
number of alternative joint designs can be tested with a single truss.
Figure 5.18 Consecutive joints to be tested and forces acting during the first test
5.3.2 Innovative truss
General
The actuators were anchored to a strong beam which was fixed onto the laboratory columns. The
actuators were facing downwards in order to push down onto the spreader beam. The spreader beam
was bolted to the gusset plates protruding from the polygonal chords through which the forces were
transferred to the first two diagonals of the truss. The force in the diagonal was 1.764 times the force
in the actuator.
Prior to testing, the following resistance checks were performed:
Buckling of the compression diagonals.
Lateral buckling of the built-up laced compression member (pair of compression chords and the lacing between them) according to EN 1993-1-1 clause 6.4[1].
Welds on the knife-plate connection of the main diagonals,
Bolted connection of the protruding gusset plate to the spreader beam.
Anchoring forces to the laboratory floor.
Hand calculations showed that the weakest point was the weld between the U-shaped profile and the
gusset plates.
Compression chord
The cross-section and buckling resistance of HSS polygonal sections was investigated through a
programme of tests.
Clause 3.2.2 of EN 1993-1-3 [42] gives a method for taking into account the influence of corners on
the strength of a cold-formed section wherein an average value of the yield strength of a cross section
is determined, related to the number of corners in the cross-section. In order to investigate the
influence of the corners on the strength of HSS semi-closed polygonal profiles, tensile tests were
carried out on flat and corner specimens of thickness 4 mm and 6 mm in S650. The corner specimens
were machined from L profiles. A significant reduction in ultimate strength was observed when the
angle of the corner was greater than 100 - 120.
In order to investigate the influence of corners on the buckling behaviour of the section, compression
tests on L profiles with different angles were performed, from 90 to 170. The thicknesses of the
L profile specimens studied were again 4 mm and 6 mm. The lengths of the specimens were 600 mm.
As a general indication, for both thicknesses, the resistance with a 170º angle was about 83% less
than that with a 90º angle.
Initially, three configurations for the polygonal chord were considered: hexagonal, octagonal and
decagonal profiles. Out of the three alternatives, the octagonal was preferred because it provided a
45 angle which was the most convenient for the plane of the diagonals. The designed octagonal
profile and its properties are shown in Table 5.6. The thickness of the plates was 4 mm and the
strength of steel was S650. The 3 parts forming the cross-section were bolted together at regular
spacing down the length of the member so that the plates were stabilised adequately and buckling
was prevented.

71
Table 5.6 Octagonal cross-section geometry and properties
Part 1 Part 2 Part 3 Profile
A [mm2] 2281 1761 775
A/Atotal [%] 47 37 16
Moment of
inertia about
principal
axes [mm4]
6.80 x 10⁶
33.9 x 10⁶
1.67 x 10⁶
20.4 x 10⁶
0.18 x 10⁶
1.83 x 10⁶
The reaction at the fulcrum introduced in-plane compression into the gusset plate and would have
led to serious plate buckling problems in the particular experimental set-up adopted (Figure 5.18).
It was therefore decided that the vertical fulcrum reaction should be introduced to the joint through
the rib reinforcements shown in Figure 5.19.
Figure 5.19 Compression chord joint detail; (a) rib plates; (b) tie gusset; (c) main gusset
Tension chord and joint
A U-shaped profile was designed for the tension chord, as was used in the roof trusses on the Friends
Arena, Stockholm. The profile was fabricated from an 8 mm thick S650 plate by press-braking
consecutive obtuse longitudinal folds. Four different joint configurations were tested in order to
evaluate the effect of stiffening the joint, either by locally increasing the thickness of the U-shaped
profile or by inserting a horizontal stiffener under the gusset plates, or both:
Joint 1: 8 mm profile thickness, no stiffener
Joint 2: 12 mm profile thickness, no stiffener
Joint 3: 8 mm profile thickness, with 8 mm axial stiffener
Joint 4: 12 mm profile thickness, with 8 mm axial stiffener
The joints were positioned in the truss in increasing order of strength with the least resistant joint
tested first. This reduced the chance of introducing plastic strains into the remaining joints. The main
diagonals were directly welded onto the gusset plate by means of a typical knife plate connection.
The form of the solution that was chosen and test matrix can be seen in Figure 5.20.
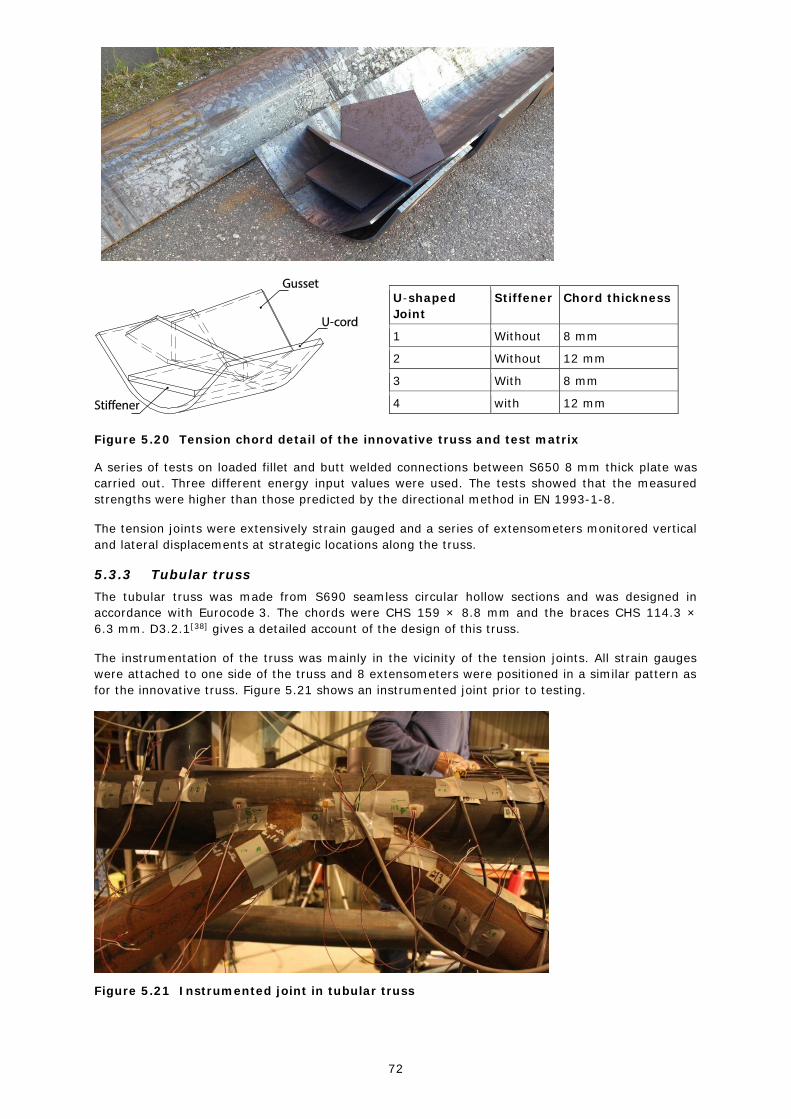
72
U-shaped
Joint
Stiffener Chord thickness
1 Without 8 mm
2 Without 12 mm
3 With 8 mm
4 with 12 mm
Figure 5.20 Tension chord detail of the innovative truss and test matrix
A series of tests on loaded fillet and butt welded connections between S650 8 mm thick plate was
carried out. Three different energy input values were used. The tests showed that the measured
strengths were higher than those predicted by the directional method in EN 1993-1-8.
The tension joints were extensively strain gauged and a series of extensometers monitored vertical
and lateral displacements at strategic locations along the truss.
5.3.3 Tubular truss
The tubular truss was made from S690 seamless circular hollow sections and was designed in
accordance with Eurocode 3. The chords were CHS 159 × 8.8 mm and the braces CHS 114.3 ×
6.3 mm. D3.2.1[38] gives a detailed account of the design of this truss.
The instrumentation of the truss was mainly in the vicinity of the tension joints. All strain gauges
were attached to one side of the truss and 8 extensometers were positioned in a similar pattern as
for the innovative truss. Figure 5.21 shows an instrumented joint prior to testing.
Figure 5.21 Instrumented joint in tubular truss
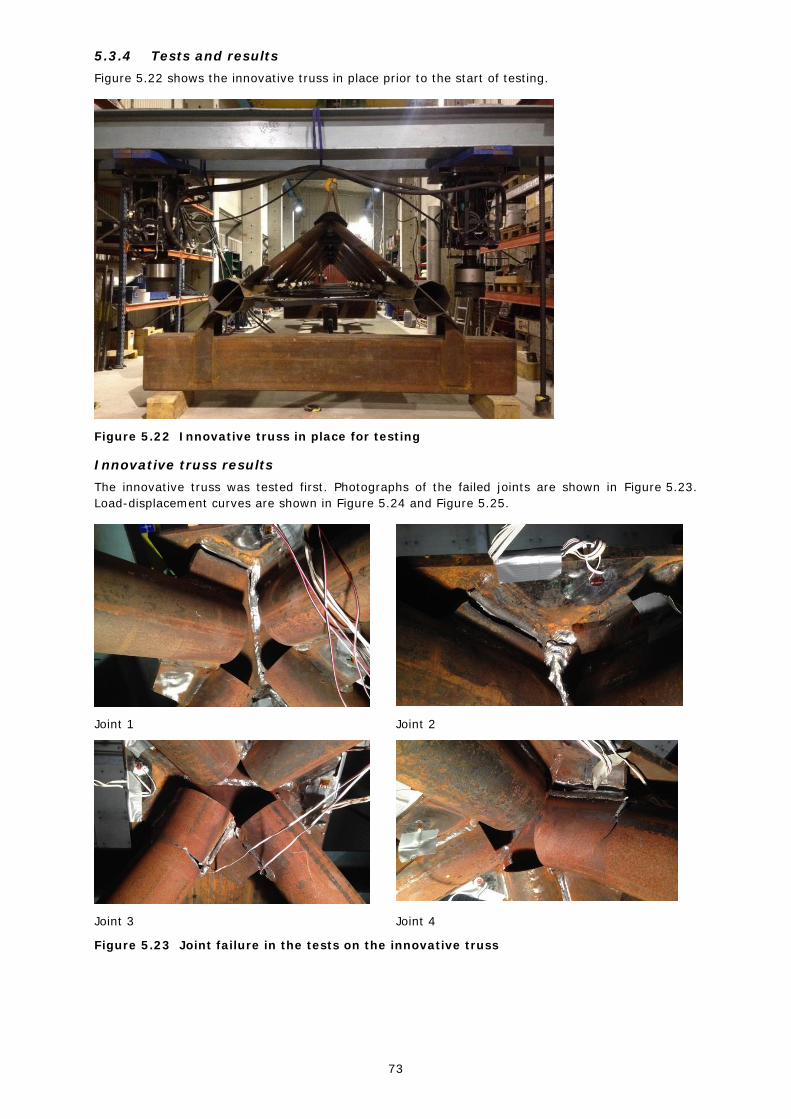
73
5.3.4 Tests and results
Figure 5.22 shows the innovative truss in place prior to the start of testing.
Figure 5.22 Innovative truss in place for testing
Innovative truss results
The innovative truss was tested first. Photographs of the failed joints are shown in Figure 5.23.
Load-displacement curves are shown in Figure 5.24 and Figure 5.25.
Joint 1 Joint 2
Joint 3 Joint 4
Figure 5.23 Joint failure in the tests on the innovative truss

74
Figure 5.24 Load-displacement curves for joints 1 (left) and 2 (right) (no stiffener)
Joint 1: 8 mm chord thickness, Joint 2: 12 mm chord thickness
Figure 5.25 Load-displacement curves of joints 3 (left) and 4 (right) (with stiffener)
Joint 3: 8 mm chord thickness, Joint 4: 12 mm chord thickness
Joint 1 – U-shaped profile 8 mm, no stiffener
The first joint failed in the weld connecting the gusset plate to the inner face of the U-shaped profile.
The crack occurred at a total load of 900 kN. At that load, the front tip of the truss where the load
was applied had a total displacement of 57 mm. A significant wave-like deformation occurred on the
triangular part of the U-shaped profile between the two pairs of diagonals. This triangular piece was
under pure shear stress. This could be either a first order or second order phenomenon, an issue
that would not alter the weld resistance which proved critical.
Joint 2 – U-shaped profile 12 mm, no stiffener
The behaviour of the second joint was very similar to the first one. Failure occurred in the weld
between the gusset plate and the U-shaped profile. The weld failed at a total load of 1 MN, at which
the displacement was 58 mm. The buckling effect of the sides of the U-shaped profile was
significantly less than that for Joint 1. Nevertheless, little difference was observed in the stiffness
and the resistance of the joint.
Joint 3 – U-shaped profile 8 mm, with stiffener
The third joint that was tested had a horizontal stiffener under the gusset plates. Failure occurred in
the welds of the tension diagonals to the gusset plates. The diagonals were completely detached
from the gusset plates. At the same time the diagonals cracked around their perimeter, with initiation
at the tip of the gusset plate. Failure occurred at a total load of 1.43 MN when the displacement at
the load application point reached 100 mm. The increase in resistance compared to the unstiffened
joints was 43%. In addition to the failure of the tension joint, significant buckling was observed in
the polygonal chords in front of the fulcrum. Moreover, the concrete stands that were fixed to support
the polygonal chords started cracking under the high pressure.
Joint 4 – U-shaped profile 12 mm, with stiffener
This joint behaved in a very similar way to Joint 3. The welds connecting the diagonals to the gusset
plates failed, accompanied by the propagation of a crack around the perimeter of the diagonal,
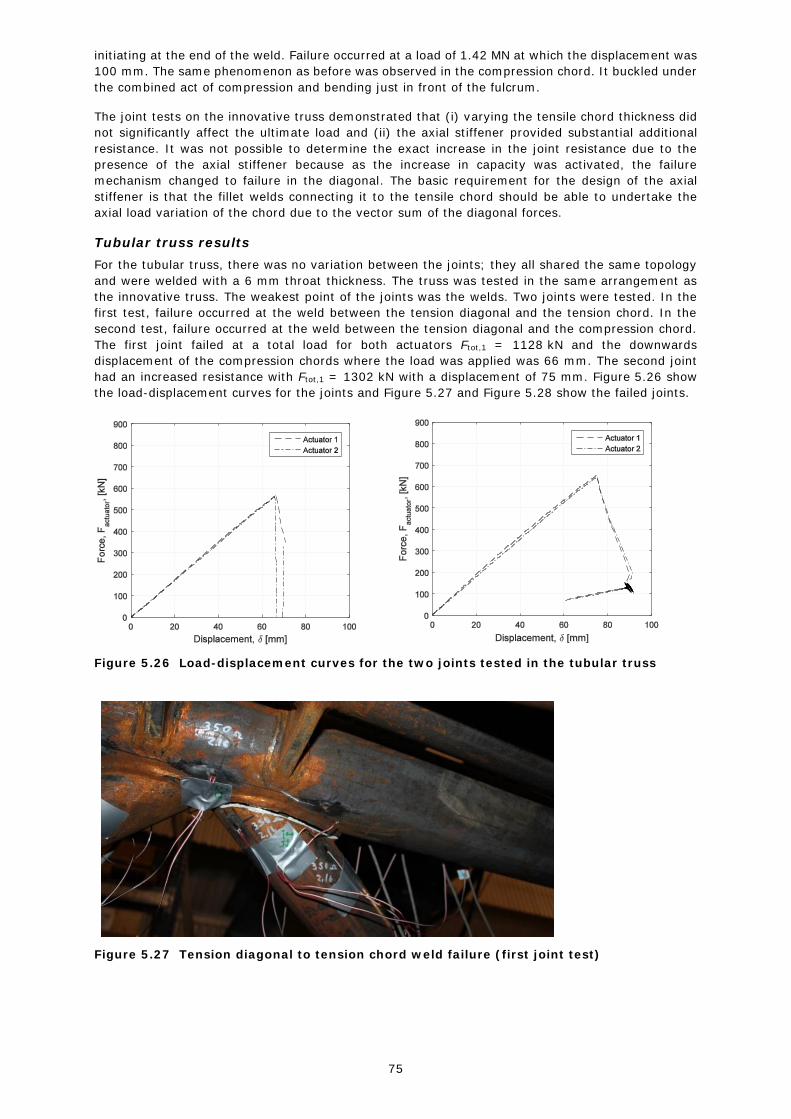
75
initiating at the end of the weld. Failure occurred at a load of 1.42 MN at which the displacement was
100 mm. The same phenomenon as before was observed in the compression chord. It buckled under
the combined act of compression and bending just in front of the fulcrum.
The joint tests on the innovative truss demonstrated that (i) varying the tensile chord thickness did
not significantly affect the ultimate load and (ii) the axial stiffener provided substantial additional
resistance. It was not possible to determine the exact increase in the joint resistance due to the
presence of the axial stiffener because as the increase in capacity was activated, the failure
mechanism changed to failure in the diagonal. The basic requirement for the design of the axial
stiffener is that the fillet welds connecting it to the tensile chord should be able to undertake the
axial load variation of the chord due to the vector sum of the diagonal forces.
Tubular truss results
For the tubular truss, there was no variation between the joints; they all shared the same topology
and were welded with a 6 mm throat thickness. The truss was tested in the same arrangement as
the innovative truss. The weakest point of the joints was the welds. Two joints were tested. In the
first test, failure occurred at the weld between the tension diagonal and the tension chord. In the
second test, failure occurred at the weld between the tension diagonal and the compression chord.
The first joint failed at a total load for both actuators Ftot,1 = 1128 kN and the downwards
displacement of the compression chords where the load was applied was 66 mm. The second joint
had an increased resistance with Ftot,1 = 1302 kN with a displacement of 75 mm. Figure 5.26 show
the load-displacement curves for the joints and Figure 5.27 and Figure 5.28 show the failed joints.
Figure 5.26 Load-displacement curves for the two joints tested in the tubular truss
Figure 5.27 Tension diagonal to tension chord weld failure (first joint test)

76
Figure 5.28 Tension diagonal to compression chord weld failure (second joint test)
5.3.5 Numerical modelling of tubular truss
The performance of the HSS tubular truss was analysed using ABAQUS to assess the accuracy of the
hand calculation design methods in Eurocode 3 and the CIDECT guides[43], [44] for HSS. Full details
are given in D3.2.2[39]. Good correlation was achieved between the numerical predictions and the
hand calculations.
The measured bending stiffness of the trusses was compared with stiffnesses calculated by methods
found in literature for planar trusses based on a beam equivalent with stiffness reduced by 1/3;
reasonably close agreement was found. The polygonal truss was stiffer than the tubular truss because
of the different joints configurations.
For the tubular truss, the characteristics of the measured stress distribution around the perimeter of
the tension diagonals close to the weld were compared to predictions using FE methods. The same
pattern of uneven strain distribution was observed in the tests, but this was not predicted in the
numerical model. It is speculated that this non-uniformity was caused by defects in the welding
process.

77
6 WP4 PRESTRESSED HSS STRUCTURES
6.1 Objectives of WP4
Using high strength steel in slender columns has little or no effect on the load carrying capacity, so
typically the cross-section dimensions are increased. Whenever elastic buckling in compression is
the critical failure mode, adding stays and cross-arms (planar or spatial) to slender columns can
improve both the elastic buckling load and the load carrying capacity as they provide translational
and rotational restraint along the length. WP4.1 investigates the application of this technology in
conjunction with HSS columns.
For conventional structural steels, the need to maintain deflections under service loads within
acceptable limits for ever-increasing spans has led to the emergence of prestressed steel tubular
trusses for long-span structures, in which prestressed cables inside the bottom chord are utilised. In
WP4.2, the feasibility of prestressing as a means of increasing the stiffness of HSS trusses is
investigated.
6.2 Task 4.1 Prestressed stayed columns
6.2.1 Task 4.1.1 Tests on prestressed stayed columns
Overview of tests
A typical PSSC comprises a slender column (also known as core or main column), cross-arm members
and pretensioned stays (i.e. cables or bars). Stayed columns usually have up to three cross-arms
along their length. Cross-arms have two (plane or planar) or four (spatial or 3D) arms depending on
the application. PSSCs have a wide range of applications: these structural typologies have been
investigated experimentally, numerically and analytically by researchers since the 1960s. However,
there is still no practical method available for design to be adopted by codes of practice and designers.
The experimental programme on PSSCs comprised 121 full-scale tests. The programme studied
different column lengths, column strengths, cross-sections, number of cross-arms and level of
prestress. A detailed account of the test programme is given in D4.1.1[45]. Two different steel
strengths were considered: S355 and S690. Cables of two different diameters were tested, where
one was approximately twice the area of the other (Figure 6.1).
Designation (according to
supplier)
Nominal diameter [mm]
Cross Section Area [mm2]
6x19S+CWR 10 47
6x19S+CWR 13 89
Figure 6.1 Cable cross section
The PSSCs with a single bracing point were composed of a core column with 4 cross-arms intersecting
at the midpoint and with an 8 cable system, each connecting a tip of the column to the tip of a
cross-arm (Figure 6.2). The PSSCs with double bracing point were composed of a core column with
4 cross-arms intersecting at the two points dividing the column into three equal parts and with a
12 cable system (see Figure 6.3). At the bracing points, the cross-arms were welded to the core
column (Figure 6.4). For transport reasons, the 18 m columns were divided into two segments, one
segment of approximately 12 m and the remaining segment of 6 m. The segments were fixed
together with a bolted connection (the effect of the splice was negligible to the column behaviour in
compression).

78
Figure 6.2 Longitudinal view of a test specimen with a single bracing point
Figure 6.3 Longitudinal view of a test specimen with a double bracing point
Figure 6.4 Cross section at the centre of the column
Table 6.1 summarises the test programme. Note that the values of slenderness for the unstayed
column are based on the nominal geometric properties. For the numerical modelling and development
of design guidance, slenderness values were based on the actual measured properties and hence
varied slightly from those tabulated.
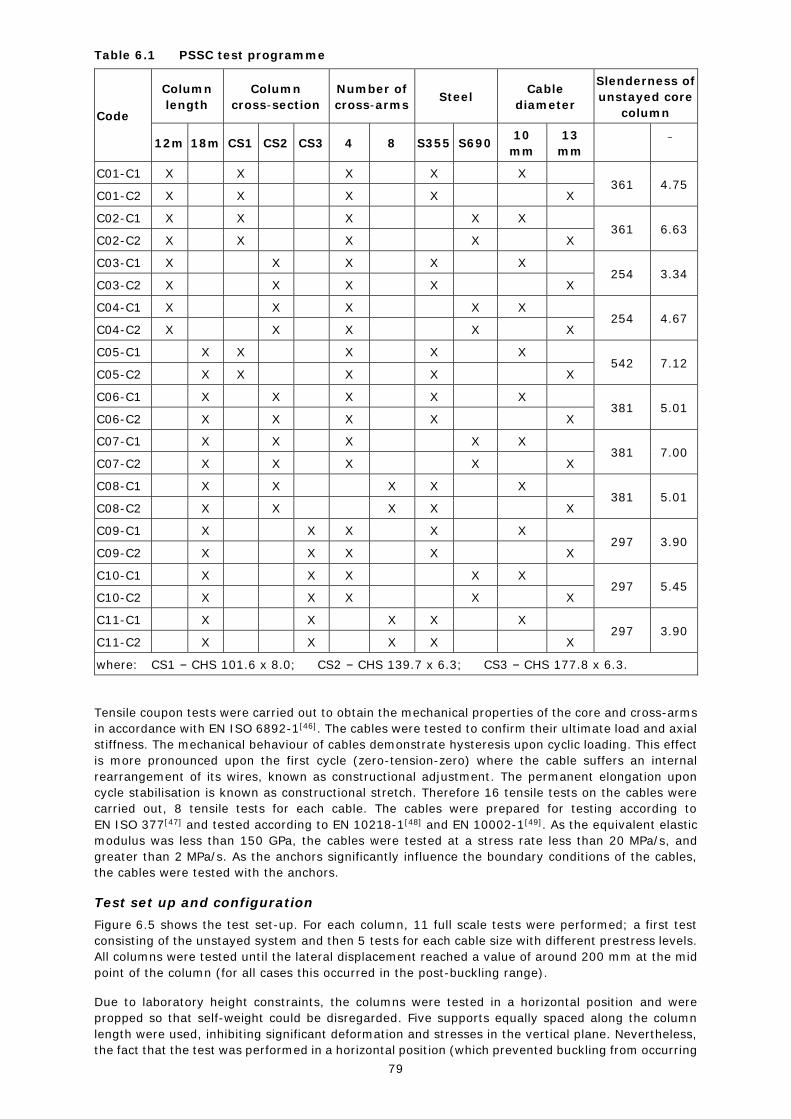
79
Table 6.1 PSSC test programme
Code
Column
length
Column
cross-section
Number of
cross-arms Steel
Cable
diameter
Slenderness of
unstayed core
column
12m 18m CS1 CS2 CS3 4 8 S355 S690 10
mm
13
mm � � ̅
C01-C1 X X X X X
361 4.75 C01-C2 X X X X X
C02-C1 X X X X X
361 6.63 C02-C2 X X X X X
C03-C1 X X X X X
254 3.34 C03-C2 X X X X X
C04-C1 X X X X X
254 4.67 C04-C2 X X X X X
C05-C1 X X X X X
542 7.12 C05-C2 X X X X X
C06-C1 X X X X X
381 5.01 C06-C2 X X X X X
C07-C1 X X X X X
381 7.00 C07-C2 X X X X X
C08-C1 X X X X X
381 5.01 C08-C2 X X X X X
C09-C1 X X X X X
297 3.90 C09-C2 X X X X X
C10-C1 X X X X X 297 5.45
C10-C2 X X X X X
C11-C1 X X X X X 297 3.90
C11-C2 X X X X X
where: CS1 – CHS 101.6 x 8.0; CS2 – CHS 139.7 x 6.3; CS3 – CHS 177.8 x 6.3.
Tensile coupon tests were carried out to obtain the mechanical properties of the core and cross-arms
in accordance with EN ISO 6892-1[46]. The cables were tested to confirm their ultimate load and axial
stiffness. The mechanical behaviour of cables demonstrate hysteresis upon cyclic loading. This effect
is more pronounced upon the first cycle (zero-tension-zero) where the cable suffers an internal
rearrangement of its wires, known as constructional adjustment. The permanent elongation upon
cycle stabilisation is known as constructional stretch. Therefore 16 tensile tests on the cables were
carried out, 8 tensile tests for each cable. The cables were prepared for testing according to
EN ISO 377[47] and tested according to EN 10218-1[48] and EN 10002-1[49]. As the equivalent elastic
modulus was less than 150 GPa, the cables were tested at a stress rate less than 20 MPa/s, and
greater than 2 MPa/s. As the anchors significantly influence the boundary conditions of the cables,
the cables were tested with the anchors.
Test set up and configuration
Figure 6.5 shows the test set-up. For each column, 11 full scale tests were performed; a first test
consisting of the unstayed system and then 5 tests for each cable size with different prestress levels.
All columns were tested until the lateral displacement reached a value of around 200 mm at the mid
point of the column (for all cases this occurred in the post-buckling range).
Due to laboratory height constraints, the columns were tested in a horizontal position and were
propped so that self-weight could be disregarded. Five supports equally spaced along the column
length were used, inhibiting significant deformation and stresses in the vertical plane. Nevertheless,
the fact that the test was performed in a horizontal position (which prevented buckling from occurring
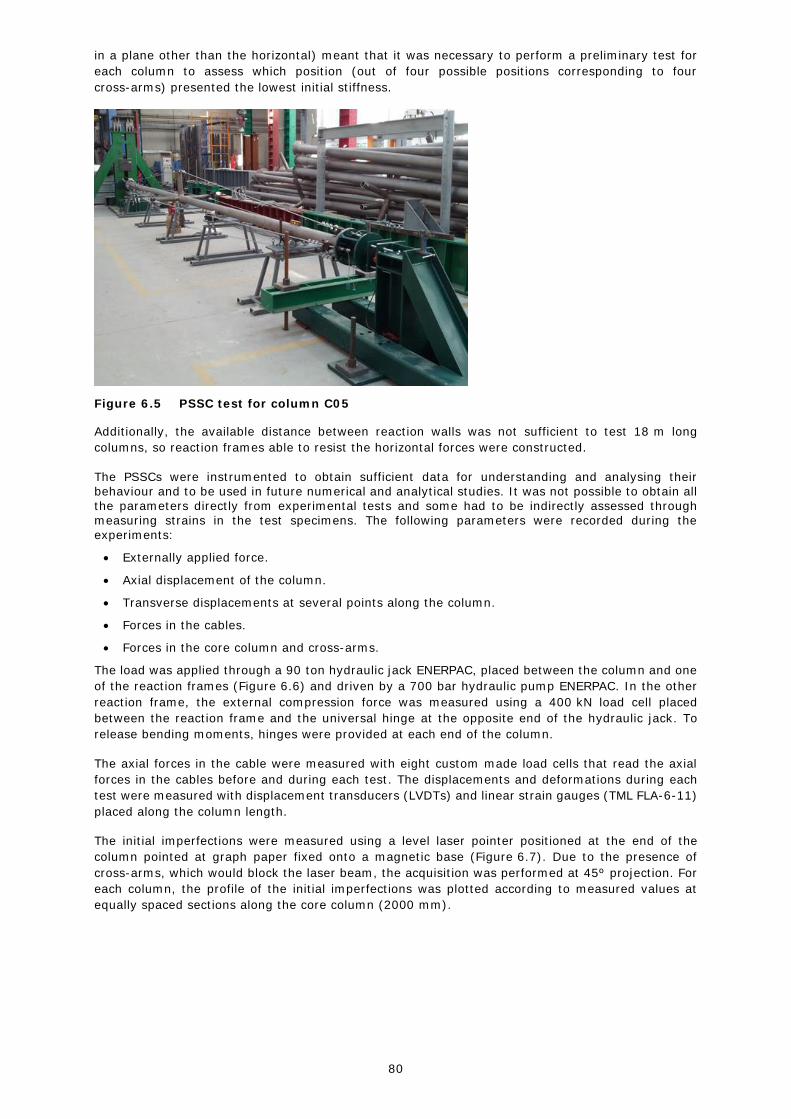
80
in a plane other than the horizontal) meant that it was necessary to perform a preliminary test for
each column to assess which position (out of four possible positions corresponding to four
cross-arms) presented the lowest initial stiffness.
Figure 6.5 PSSC test for column C05
Additionally, the available distance between reaction walls was not sufficient to test 18 m long
columns, so reaction frames able to resist the horizontal forces were constructed.
The PSSCs were instrumented to obtain sufficient data for understanding and analysing their behaviour and to be used in future numerical and analytical studies. It was not possible to obtain all the parameters directly from experimental tests and some had to be indirectly assessed through measuring strains in the test specimens. The following parameters were recorded during the experiments:
Externally applied force.
Axial displacement of the column.
Transverse displacements at several points along the column.
Forces in the cables.
Forces in the core column and cross-arms.
The load was applied through a 90 ton hydraulic jack ENERPAC, placed between the column and one
of the reaction frames (Figure 6.6) and driven by a 700 bar hydraulic pump ENERPAC. In the other
reaction frame, the external compression force was measured using a 400 kN load cell placed
between the reaction frame and the universal hinge at the opposite end of the hydraulic jack. To
release bending moments, hinges were provided at each end of the column.
The axial forces in the cable were measured with eight custom made load cells that read the axial
forces in the cables before and during each test. The displacements and deformations during each
test were measured with displacement transducers (LVDTs) and linear strain gauges (TML FLA-6-11)
placed along the column length.
The initial imperfections were measured using a level laser pointer positioned at the end of the
column pointed at graph paper fixed onto a magnetic base (Figure 6.7). Due to the presence of
cross-arms, which would block the laser beam, the acquisition was performed at 45º projection. For
each column, the profile of the initial imperfections was plotted according to measured values at
equally spaced sections along the core column (2000 mm).
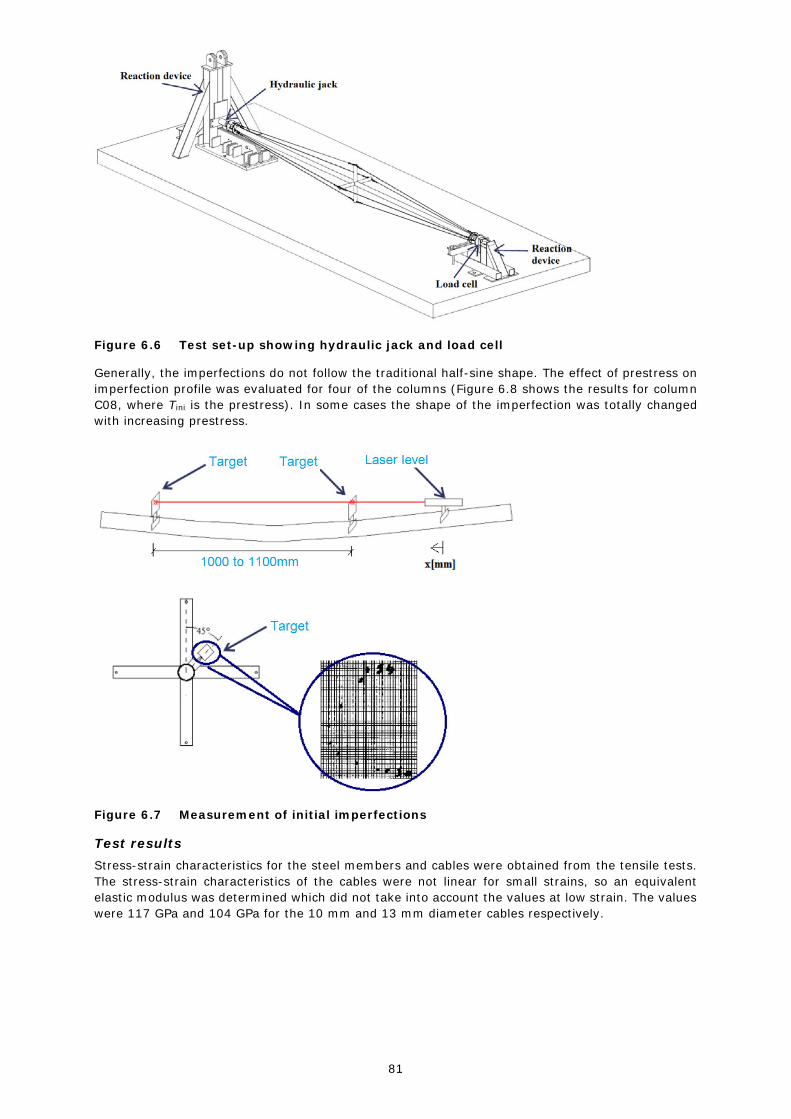
81
Figure 6.6 Test set-up showing hydraulic jack and load cell
Generally, the imperfections do not follow the traditional half-sine shape. The effect of prestress on
imperfection profile was evaluated for four of the columns (Figure 6.8 shows the results for column
C08, where Tini is the prestress). In some cases the shape of the imperfection was totally changed
with increasing prestress.
Figure 6.7 Measurement of initial imperfections
Test results
Stress-strain characteristics for the steel members and cables were obtained from the tensile tests.
The stress-strain characteristics of the cables were not linear for small strains, so an equivalent
elastic modulus was determined which did not take into account the values at low strain. The values
were 117 GPa and 104 GPa for the 10 mm and 13 mm diameter cables respectively.

82
Figure 6.8 Measured geometric imperfections for all tests for column C08
Each test series was initiated with an unstayed column test followed by the remaining tests on the
stayed columns with different prestress levels. Figure 6.9 shows the lateral displacement at mid span
against the applied load for all unstayed columns. As previously stated, all columns were tested until
the lateral displacement at mid span reached values of around 200 mm. For those columns with
higher values of slenderness, the load protocol appeared to be inappropriate as it caused vibrations
during load application. As shown in Figure 6.9, these vibrations occurred for columns C01 and C02:
after the application of the maximum load, the columns oscillated and then stabilised at the
experimental load value (near to the elastic critical buckling load value).
Figure 6.9 Force versus lateral displacement at mid span for unstayed columns
The PSSCs were tested in the elastic range. For this reason, failure was associated with geometric
nonlinearities rather than material yield strength. In general, the results show that strains increase
with the increase in prestress level, while the cable diameter seems to have a negligible influence on
the strain. The structural response of the columns with the stay system and the cross-arms was
measured by the axial load versus end-shortening and lateral displacement curves recorded at mid
span, for example Figure 6.10 shows the behaviour for column C10.
The test results clearly showed the benefit of including a stay system with the exception of columns
with higher values of slenderness (columns C01, C02 and C05), where vibrations occurred during
the test affecting the post-buckling response.

83
Lateral displacement
End shortening
Figure 6.10 Force versus lateral displacement and end shortening for C10 stayed column (18 m length, S690)
Figure 6.11 and Figure 6.12 present the measured ultimate load versus initial pretension load for the
12 m and 18 m stayed columns respectively. The normalised values of experimental ultimate loads
versus initial pretension load are also presented. Table 6.2 compares the ultimate loads for the
stayed and unstayed columns. The benefits of including a stay system with cross-arms for long
columns are clearly demonstrated. The benefit increases as the slenderness increases. In stockier
columns, the benefits of including a stay system and cross-arms is not distinct. Additionally, the
benefits of including a stay system with cross-arms in long columns are also more noticeable for
columns with a stay system with a double bracing point. This is because the angle between the cables
and the core column is higher for double braced columns, increasing the perpendicular component
of the tension in the stays at bracing points which, ultimately, results in a beneficial effect by
stabilising the column. Comparing column C11 (stay system and cross-arms with double bracing
point) and C09 and C10 (stay system and single cross-arms), although they all have the same
slenderness, the benefits are more evident in column C11. The same is true when comparing another
set of three columns that have the same slenderness: the increase in the ultimate load for column
C08 (double bracing point) is more evident than in columns C06 and C07 (single bracing point). For
the same reason, shorter columns present more benefits from the stay system and cross-arms than
longer columns. Comparing the results of column C01 and C02 with results from the most slender
column (C05), it is possible to conclude that shorter columns present more significant benefits.
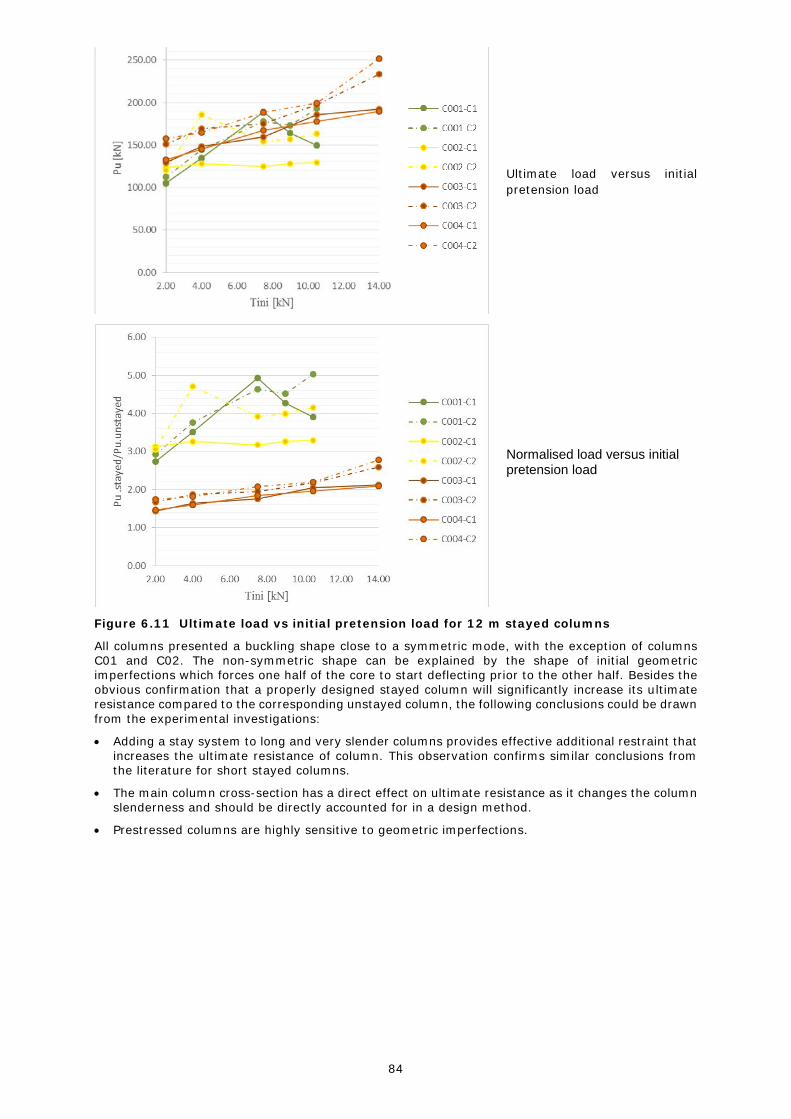
84
Ultimate load versus initial
pretension load
Normalised load versus initial pretension load
Figure 6.11 Ultimate load vs initial pretension load for 12 m stayed columns
All columns presented a buckling shape close to a symmetric mode, with the exception of columns C01 and C02. The non-symmetric shape can be explained by the shape of initial geometric imperfections which forces one half of the core to start deflecting prior to the other half. Besides the obvious confirmation that a properly designed stayed column will significantly increase its ultimate resistance compared to the corresponding unstayed column, the following conclusions could be drawn
from the experimental investigations:
Adding a stay system to long and very slender columns provides effective additional restraint that
increases the ultimate resistance of column. This observation confirms similar conclusions from the literature for short stayed columns.
The main column cross-section has a direct effect on ultimate resistance as it changes the column slenderness and should be directly accounted for in a design method.
Prestressed columns are highly sensitive to geometric imperfections.

85
Ultimate load versus initial
pretension load
Normalised load versus initial
pretension load
Figure 6.12 Ultimate load vs initial pretension load for 18 m stayed columns
The use of HSS showed no benefit for the tested PSSC. This was to be expected as the unstayed core
columns exhibited very high slenderness (Table 6.1). Because of laboratory limitations, it was not
possible to test larger cross-sections with the same 12 m and 18 m length, hence the choice of
specimens C01 to C11. However, testing HSS stayed columns was very useful to identify imperfection
profiles and to be able to characterise the behaviour of realistic columns for practical application
going through a normal fabrication process. It is expected that the steel strength will become relevant
as the cross-section increases, should these PSSC be used, for example, for applied compressive
forces in the range of 500 kN.

86
Table 6.2 Comparison of the tests results for the stayed and unstayed columns
Columns �
unstay � ̅ unstay
Tini Pu.unstay Pu.stay C1 Pu.stay C2 � u.stay C1
� u.unstay
� u.stay C2
� � .� � � � � �
� u.stay C2 − � u.stay C2
� u.stay C1 [N] [kN] [kN] [kN]
C01 12 m S355
4 X-arms CS1
361 4.75
0 38.34 - - - - -
2000 - 104.66 112.17 2.73 2.93 7.18%
4000 - 134.36 144.14 3.50 3.76 7.28%
7500 - 188.87 178.04 4.93 4.64 -5.73%
9000 - 163.71 173.14 4.27 4.52 5.76%
10500 - 149.73 192.89 3.91 5.03 28.83%
C02 12m S690
4 X-arms CS1
361 6.63
0 39.31 - - - - -
2000 123.35 120.2 3.14 3.06 -2.55%
4000 128.24 185.37 3.26 4.72 44.55%
7500 124.75 154.27 3.17 3.92 23.66%
9000 128.07 156.9 3.26 3.99 22.51%
10500 129.29 163.36 3.29 4.16 26.35%
C03 12 m S355 4 X-arms
CS2
255 3.34
0 90.37 - - - - -
2000 - 129.47 150.61 1.43 1.67 16.33%
4000 - 148.51 169.13 1.64 1.87 13.88%
7500 - 159.17 175.42 1.76 1.94 10.21%
10500 - 185.55 197.25 2.05 2.18 6.31%
14000 - 192.36 233.42 2.13 2.58 21.35%
C04 12 m S690 4 X-arms
CS2
255 4.67
0 90.58 - - - - -
2000 - 132.26 157.59 1.46 1.74 19.15%
4000 - 144.67 164.58 1.60 1.82 13.76%
7500 - 167.38 188.17 1.85 2.08 12.42%
10500 - 177.51 199.35 1.96 2.20 12.30%
14000 - 189.74 252.12 2.09 2.78 32.88%
C05 S355 18 m
4 X-arms CS1
553 7.12
0 17.3 - - - - -
2000 - 34.51 38.44 1.99 2.22 11.39%
3500 - 33.72 41.58 1.95 2.40 23.31%
5500 - 38.09 47 2.20 2.72 23.39%
7500 - 43.85 51.54 2.53 2.98 17.54%
9000 - 45.25 53.64 2.62 3.10 18.54%
C06 S355 18 m
4 X-arms CS2
385 5.01
0 38.26 - - - - -
2000 - 55.04 53.81 1.44 1.41 -2.23%
3500 - 58.53 56.43 1.53 1.47 -3.59%
5500 - 60.28 59.4 1.58 1.55 -1.46%
7500 - 62.55 64.65 1.63 1.69 3.36%
9000 - 62.08 60.98 1.62 1.59 -1.77%
C07 S690 18 m
4 X-arms CS2
384 7.00
0 39.1 - - - - -
2000 - 51.01 50.88 1.30 1.30 -0.25%
3500 - 57.13 61.68 1.46 1.58 7.96%
5500 - 61.5 61.85 1.57 1.58 0.57%
7500 - 70.59 65.87 1.81 1.68 -6.69%
9000 - 76.35 69.01 1.95 1.76 -9.61%
C08 S355 18 m
8 X-arms CS2
384 5.01
0 39.66 - - - - -
2000 - 59.75 71.28 1.51 1.80 19.30%
3500 - 66.74 76 1.68 1.92 13.87%
5500 - 72.51 81.42 1.83 2.05 12.29%
7500 - 77.75 88.93 1.96 2.24 14.38%
9000 - 79.32 96.44 2.00 2.43 21.58%
C09 S355 18 m
4 X-arms CS3
299 3.90
0 76.7 - - - - -
2000 - 85.96 98.37 1.12 1.28 14.44%
3500 - 90.33 101.16 1.18 1.32 11.99%
5500 - 95.92 108.15 1.25 1.41 12.75%
7500 - 99.76 111.47 1.30 1.45 11.74%
9000 - 102.73 116.54 1.34 1.52 13.44%
C10 S690 18 m
4 X-arms CS3
299 5.45
0 82.99 - - - - -
2000 - 103.96 112.69 1.25 1.36 8.40%
3500 - 107.98 121.25 1.30 1.46 12.29%
5500 - 113.39 126.84 1.37 1.53 11.86%
7500 - 118.63 131.04 1.43 1.58 10.46%
9000 - 122.3 135.58 1.47 1.63 10.86%
C11 S355 18 m
8 X-arms CS3
299 3.90
0 85.79 - - - - -
2000 - 117.06 134.71 1.36 1.57 15.08%
3500 - 122.65 139.95 1.43 1.63 14.11%
5500 - 130.69 147.64 1.52 1.72 12.97%
7500 - 137.15 152.53 1.60 1.78 11.21%
9000 - 141.87 155.85 1.65 1.82 9.85%
C1: 10 mm diameter cable, C2: 13 mm diameter cable
CS1: CHS 101.6 x 8.0; CS2: CHS 139.7 x 6.3; CS3: CHS 177.8 x 6.3
87
6.2.2 Task 4.1.2 Numerical analysis of prestressed columns
A detailed account of the investigation is given in D4.1.2[50].
Finite element model
The measured values of the material and geometrical properties of the columns, cables and
cross-arms were used in the numerical model. The model assumed bow imperfections with values of
L/1000 and L/750. Besides deviations from the axis of the column, these imperfections also cover
deviations and lack of orthogonality of the load application system as well as residual imperfections.
Four-node shell finite elements (S4R) were used to model the core columns and cross-arms. The
cables were modelled using truss finite elements where an initial pre-defined field (prestress) was
applied. A brief mesh discretisation study was performed and it was concluded that 25 elements were
enough to achieve numerical convergence. The prestressed application was defined using the
“predefined field” option in ABAQUS. This option enables a predefined field for a given parameter to
be defined, in this case, a predefined field of initial stresses. These stresses are directly computed
from the force applied to the cables divided by their nominal cross-sectional area.
The columns were simply supported at both ends. Rigid body constraints (tie - nodes) were applied
between the central nodes and the sections at the end of the column and tie constraints were applied
between the column and the cross arms. Between the column and cables and between cross-arms
and cables coupling constraints were applied. An axial compression load was applied at the axially
free end in the central reference point.
Linear buckling analysis (LBA) and geometrically and materially nonlinear analysis with imperfections
included (GMNIA) were performed using the FE software ABAQUS (arc length method). First, an LBA
(with cables, but without any applied prestress) was carried out to obtain the eigenmodes of the
column. Secondly, using the *IMPERFECTION option, the shape and amplitude of the eigenmode was
inserted into the model as an imperfection. Then, a first GMINA was performed (*STATIC, GENERAL)
in which the prestress was applied. The column undergoes small axial displacements and, as a
consequence, the cables lose a small amount of the applied prestress. After this analysis, another
nonlinear GMNIA was performed (*STATIC, RIKS) where the compression load was applied.
Comparison between numerical and experimental results
Each of the tests was modelled (a total of 132 linear buckling analyses and 396 GMNIA). In the
majority of cases, the numerical model predicted the experimental behaviour reasonably well. In
some cases the numerical model predicted higher ultimate loads, which may have been caused by
unpredicted deviations and lack of verticality of the load application system, leading to a premature
loss of stiffness in the tests. The assumption of a bow shaped imperfection may also lead to
differences in the numerical prediction compared to the measured behaviour. In order to assess the
influence of the shape of geometric imperfections, a comparison using two imperfection shapes (bow
imperfection and measured imperfection) was performed. In some cases using the measured
imperfection led to closer agreement with the test results. However, in other cases, it made little
difference. For the majority of results, using L/1000 and L/750 gave good agreement with
experimental results, although not always on the safe side.
Load-displacement curves (experimental vs. numerical) for the S690 column C04 are shown in
Figure 6.13 and Figure 6.14 for a prestress of 2 kN and 14 kN respectively.
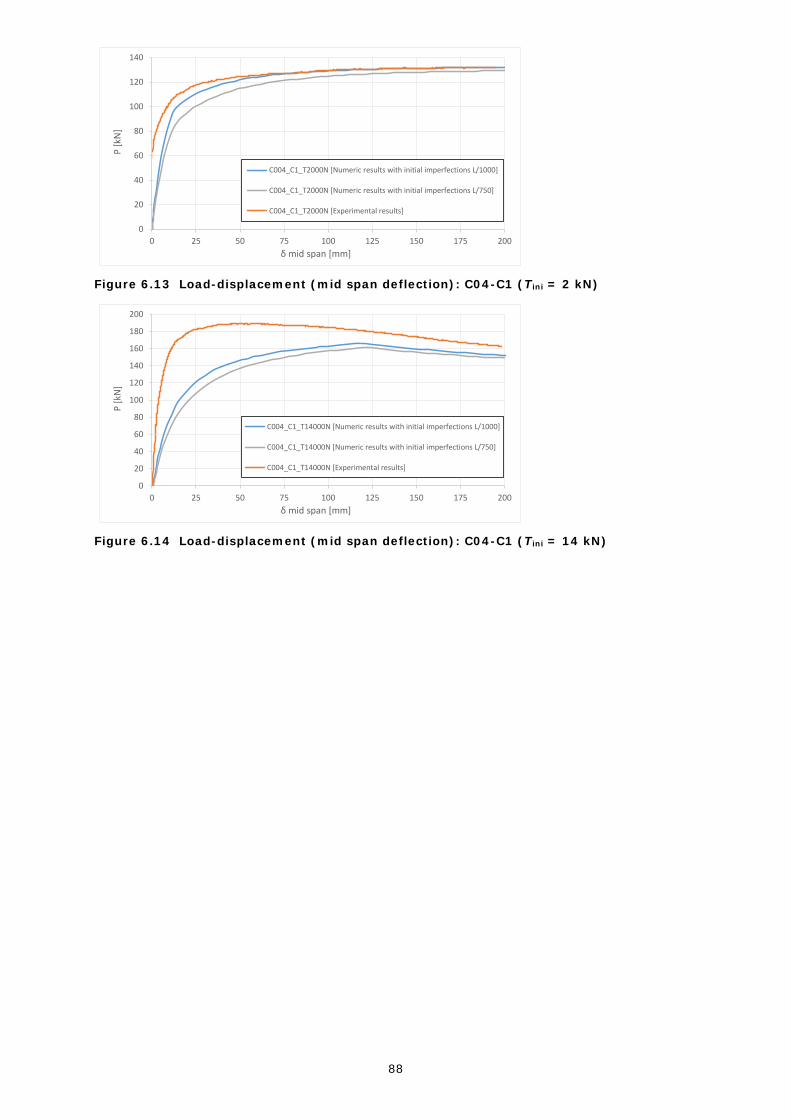
88
Figure 6.13 Load-displacement (mid span deflection): C04-C1 (Tini = 2 kN)
Figure 6.14 Load-displacement (mid span deflection): C04-C1 (Tini = 14 kN)
0
20
40
60
80
100
120
140
0 25 50 75 100 125 150 175 200
P [k
N]
δ mid span [mm]
C004_C1_T2000N [Numeric results with initial imperfections L/1000]
C004_C1_T2000N [Numeric results with initial imperfections L/750]
C004_C1_T2000N [Experimental results]
0
20
40
60
80
100
120
140
160
180
200
0 25 50 75 100 125 150 175 200
P [k
N]
δ mid span [mm]
C004_C1_T14000N [Numeric results with initial imperfections L/1000]
C004_C1_T14000N [Numeric results with initial imperfections L/750]
C004_C1_T14000N [Experimental results]

89
Table 6.3 Selected results of numerical modelling of PSSC tests
Prestress
Ultimate load
Diff. 1 Diff. 2 Exp.
Amp.
1
Amp.
2
Ti
[kN]
σi
[MPa]
Pu,exp
[kN]
Pu,num,1
[kN]
Pu,num,2
[kN]
ΔPu,1
[%]
ΔPu,2
[%]
C01 C1 2000 42.55 104.66 73.51 71.26 -29.7 -31.9
C01 C1 10500 223.40 149.73 99.08 95.90 -33.8 -35.9
C01 C2 2000 22.47 112.17 99.48 96.65 -11.3 -13.8
C01 C2 10500 117.98 192.89 145.51 136.66 -24.5 -29.1
C02 C1 2000 42.55 123.35 72.12 69.87 -41.5 -43.3
C02 C1 10500 223.40 129.29 97.53 94.31 -24.5 -27.0
C02 C2 2000 22.47 120.20 98.95 96.32 -17.6 -19.8
C02 C2 10500 117.98 163.36 143.69 133.99 -12.0 -17.9
C03 C1 2000 42.55 129.47 126.08 123.77 -2.6 -4.4
C03 C1 14000 297.87 192.36 160.40 155.69 -16.6 -19.0
C03 C2 2000 22.47 150.61 150.06 147.25 -0.3 -2.2
C03 C2 14000 157.30 233.42 203.69 192.80 -12.7 -17.4
C04 C1 2000 42.553 132.26 131.78 129.43 -0.3 -2.1
C04 C1 14000 297.872 189.74 166.28 161.03 -12.3 -15.1
C04 C2 2000 22.472 157.59 155.94 153.07 -1.0 -2.8
C04 C2 14000 157.303 252.12 209.29 198.71 -16.9 -21.1
C05 C1 2000 42.55 34.51 37.67 34.39 9.1 -0.3
C05 C1 9000 191.49 45.25 44.82 43.36 -0.9 -4.1
C05 C2 2000 22.47 38.44 45.13 43.29 17.4 12.6
C05 C2 9000 101.12 53.64 63.12 59.82 17.6 11.5
C06 C1 2000 42.55 55.04 57.15 55.57 3.8 0.9
C06 C1 9000 191.49 62.08 69.58 67.62 12.0 8.9
C06 C2 2000 22.47 53.81 68.00 66.10 26.3 22.8
C06 C2 9000 101.12 60.98 89.83 85.28 47.3 39.8
C07 C1 2000 42.55 51.01 57.06 55.47 11.8 8.7
C07 C1 9000 191.49 76.35 69.66 67.01 -8.7 -12.2
C07 C2 2000 22.47 50.88 67.90 65.84 33.4 29.4
C07 C2 9000 101.12 69.01 88.86 84.91 28.7 23.0
C08 C1 2000 42.55 59.75 73.93 72.53 23.7 21.3
C08 C1 9000 191.49 79.32 96.81 92.31 22.0 16.3
C08 C2 2000 22.47 71.28 93.17 91.27 30.7 28.0
C08 C2 9000 101.12 96.44 124.00 116.06 28.5 20.3
C09 C1 2000 42.55 85.96 98.60 96.54 14.7 12.3
C09 C1 9000 191.49 102.73 111.68 107.86 8.7 5.0
C09 C2 2000 22.47 98.37 108.49 106.06 10.2 7.8
C09 C2 9000 101.12 116.54 128.91 122.31 10.6 4.9
C010 C1 2000 42.55 103.96 103.14 101.05 -0.7 -2.8
C010 C1 9000 191.49 122.30 115.55 112.12 -5.5 -8.3
C010 C2 2000 22.47 112.69 113.08 110.60 0.3 -1.8
C010 C2 9000 101.12 135.58 133.81 127.06 -1.3 -6.2
C011 C1 2000 42.55 117.06 118.24 116.67 1.0 -0.3
C011 C1 9000 191.49 141.87 137.48 131.12 -3.0 -7.5
C011 C2 2000 22.47 134.71 138.40 136.39 2.7 1.2
C011 C2 9000 101.12 155.85 162.03 154.22 3.9 -1.0
Ampl 1: geometric imperfection: L/1000
Ampl 2: geometric imperfection: L/750
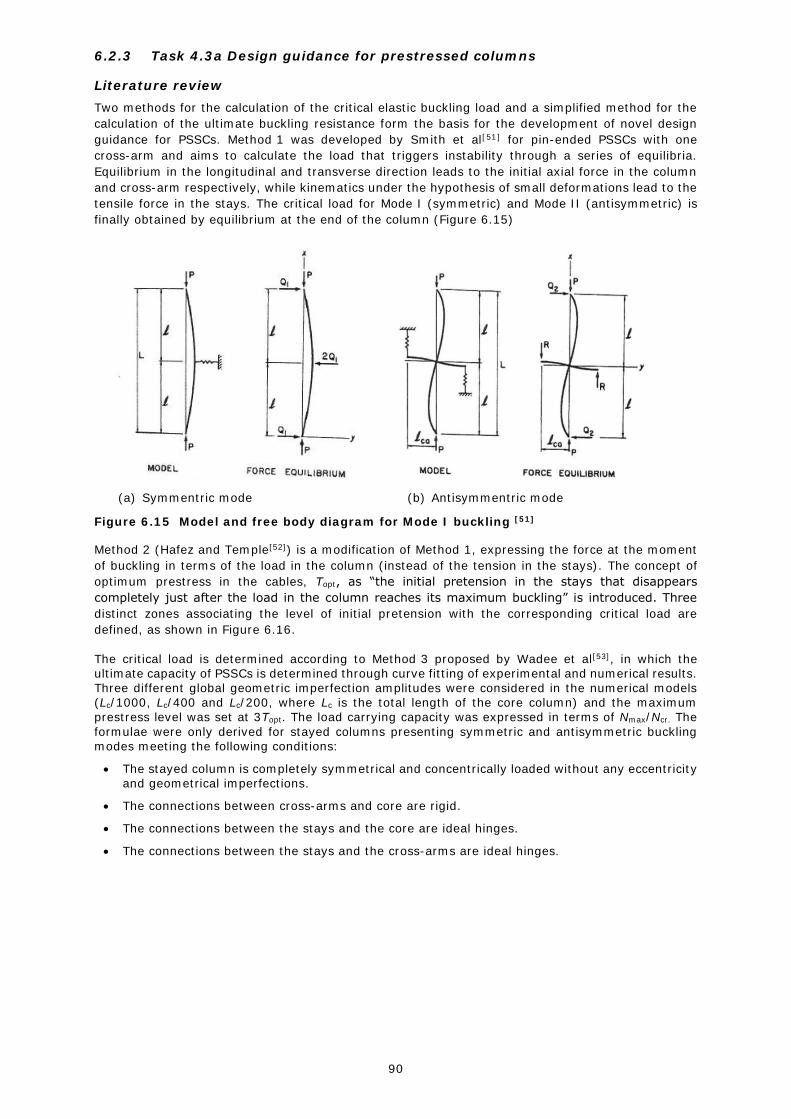
90
6.2.3 Task 4.3a Design guidance for prestressed columns
Literature review
Two methods for the calculation of the critical elastic buckling load and a simplified method for the
calculation of the ultimate buckling resistance form the basis for the development of novel design
guidance for PSSCs. Method 1 was developed by Smith et al[51] for pin-ended PSSCs with one
cross-arm and aims to calculate the load that triggers instability through a series of equilibria.
Equilibrium in the longitudinal and transverse direction leads to the initial axial force in the column
and cross-arm respectively, while kinematics under the hypothesis of small deformations lead to the
tensile force in the stays. The critical load for Mode I (symmetric) and Mode II (antisymmetric) is
finally obtained by equilibrium at the end of the column (Figure 6.15)
(a) Symmentric mode (b) Antisymmentric mode
Figure 6.15 Model and free body diagram for Mode I buckling [51]
Method 2 (Hafez and Temple[52]) is a modification of Method 1, expressing the force at the moment
of buckling in terms of the load in the column (instead of the tension in the stays). The concept of
optimum prestress in the cables, Topt, as “the initial pretension in the stays that disappears
completely just after the load in the column reaches its maximum buckling” is introduced. Three
distinct zones associating the level of initial pretension with the corresponding critical load are
defined, as shown in Figure 6.16.
The critical load is determined according to Method 3 proposed by Wadee et al[53], in which the ultimate capacity of PSSCs is determined through curve fitting of experimental and numerical results. Three different global geometric imperfection amplitudes were considered in the numerical models (Lc/1000, Lc/400 and Lc/200, where Lc is the total length of the core column) and the maximum prestress level was set at 3Topt. The load carrying capacity was expressed in terms of Nmax/Ncr. The
formulae were only derived for stayed columns presenting symmetric and antisymmetric buckling modes meeting the following conditions:
The stayed column is completely symmetrical and concentrically loaded without any eccentricity and geometrical imperfections.
The connections between cross-arms and core are rigid.
The connections between the stays and the core are ideal hinges.
The connections between the stays and the cross-arms are ideal hinges.
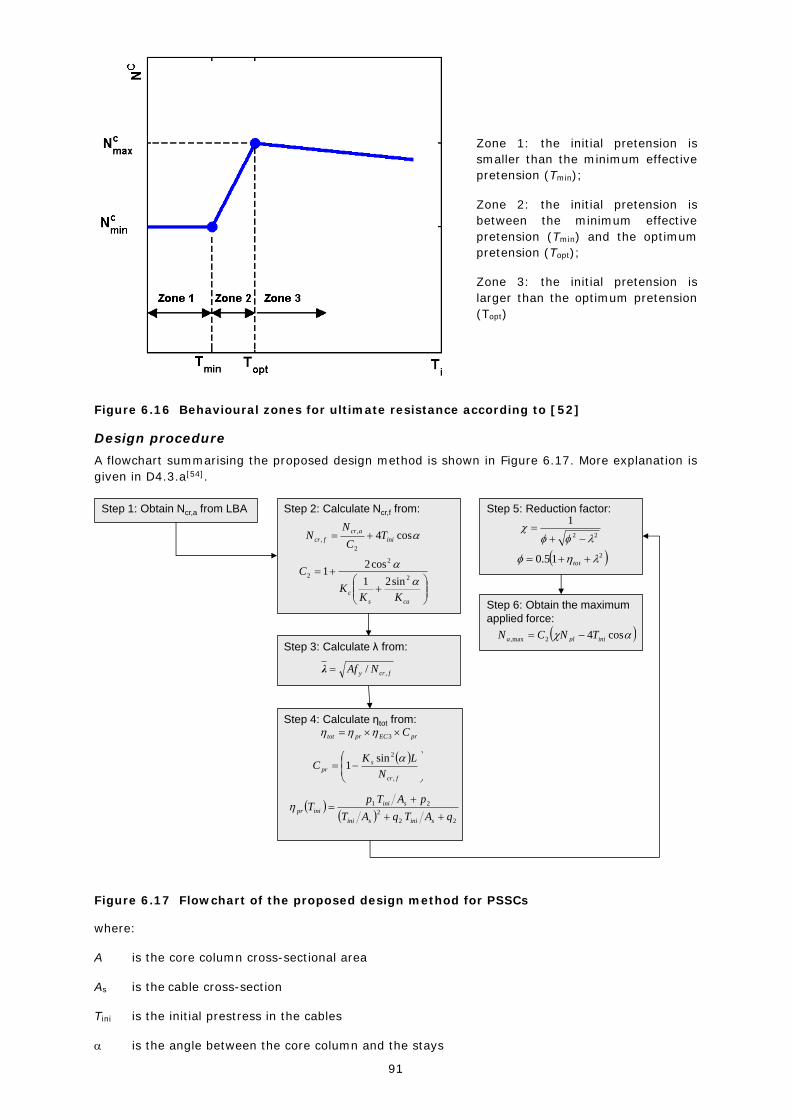
91
Zone 1: the initial pretension is
smaller than the minimum effective
pretension (Tmin);
Zone 2: the initial pretension is
between the minimum effective
pretension (Tmin) and the optimum
pretension (Topt);
Zone 3: the initial pretension is
larger than the optimum pretension
(Topt)
Figure 6.16 Behavioural zones for ultimate resistance according to [52]
Design procedure
A flowchart summarising the proposed design method is shown in Figure 6.17. More explanation is
given in D4.3.a[54].
Figure 6.17 Flowchart of the proposed design method for PSSCs
where:
A is the core column cross-sectional area
As is the cable cross-section
Tini is the initial prestress in the cables
is the angle between the core column and the stays
Step 1: Obtain Ncr,a from LBA Step 2: Calculate Ncr,f from:
cos42
,
, ini
acr
fcr TC
NN
Step 3: Calculate λ from:
fcry NAf ,/λ
cas
cKK
K
C
2
2
2sin21
cos21
Step 4: Calculate ηtot from:
prECprtot C 3
fcr
spr
N
LKC
,
2sin1
22
2
21
qATqAT
pATpT
sinisini
siniinipr
Step 5: Reduction factor:
22
1
215.0 tot
Step 6: Obtain the maximum
applied force:
cos42max, inipla TNCN
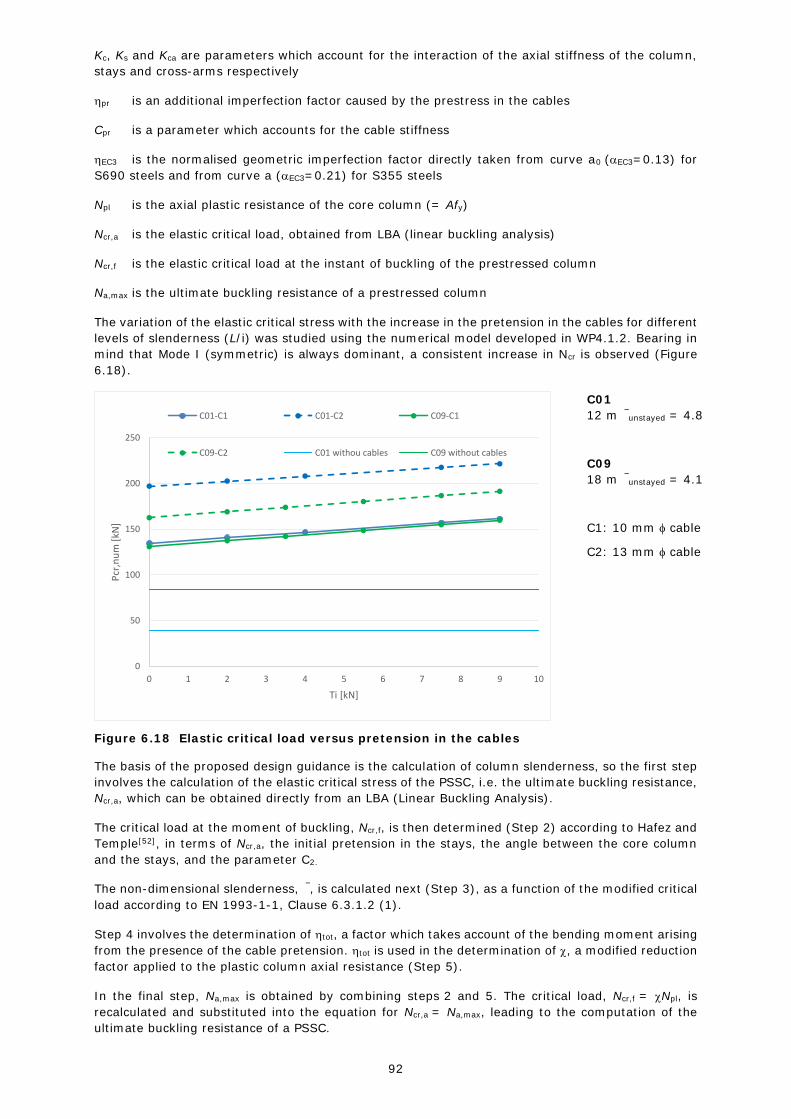
92
Kc, Ks and Kca are parameters which account for the interaction of the axial stiffness of the column,
stays and cross-arms respectively
pr is an additional imperfection factor caused by the prestress in the cables
Cpr is a parameter which accounts for the cable stiffness
EC3 is the normalised geometric imperfection factor directly taken from curve a0 (EC3=0.13) for
S690 steels and from curve a (EC3=0.21) for S355 steels
Npl is the axial plastic resistance of the core column (= Afy)
Ncr,a is the elastic critical load, obtained from LBA (linear buckling analysis)
Ncr,f is the elastic critical load at the instant of buckling of the prestressed column
Na,max is the ultimate buckling resistance of a prestressed column
The variation of the elastic critical stress with the increase in the pretension in the cables for different
levels of slenderness (L/i) was studied using the numerical model developed in WP4.1.2. Bearing in
mind that Mode I (symmetric) is always dominant, a consistent increase in Ncr is observed (Figure
6.18).
C01
12 m � ̅unstayed = 4.8
C09
18 m � ̅unstayed = 4.1
C1: 10 mm cable
C2: 13 mm cable
Figure 6.18 Elastic critical load versus pretension in the cables
The basis of the proposed design guidance is the calculation of column slenderness, so the first step
involves the calculation of the elastic critical stress of the PSSC, i.e. the ultimate buckling resistance,
Ncr,a, which can be obtained directly from an LBA (Linear Buckling Analysis).
The critical load at the moment of buckling, Ncr,f, is then determined (Step 2) according to Hafez and
Temple[52], in terms of Ncr,a, the initial pretension in the stays, the angle between the core column
and the stays, and the parameter C2.
The non-dimensional slenderness, � ̅, is calculated next (Step 3), as a function of the modified critical
load according to EN 1993-1-1, Clause 6.3.1.2 (1).
Step 4 involves the determination of tot, a factor which takes account of the bending moment arising
from the presence of the cable pretension. tot is used in the determination of , a modified reduction
factor applied to the plastic column axial resistance (Step 5).
In the final step, Na,max is obtained by combining steps 2 and 5. The critical load, Ncr,f = Npl, is
recalculated and substituted into the equation for Ncr,a = Na,max, leading to the computation of the
ultimate buckling resistance of a PSSC.
0
50
100
150
200
250
0 1 2 3 4 5 6 7 8 9 10
Pcr,n
um [k
N]
Ti [kN]
C01-C1 C01-C2 C09-C1
C09-C2 C01 withou cables C09 without cables
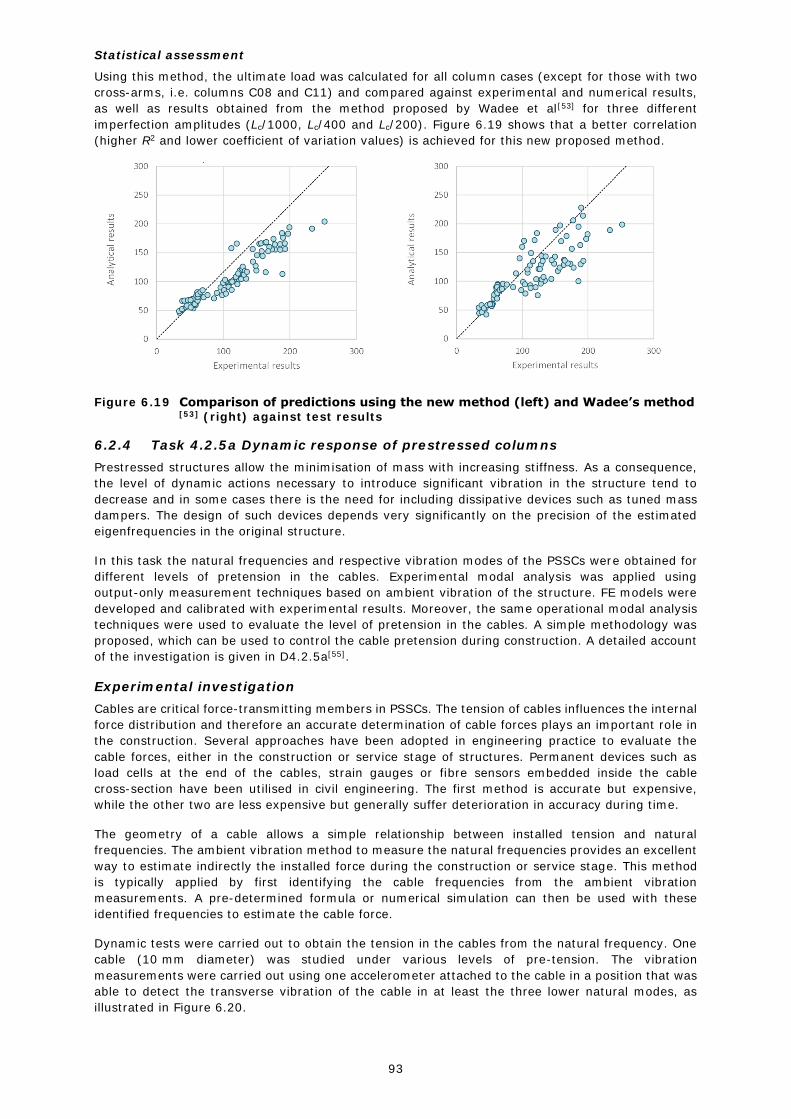
93
Statistical assessment
Using this method, the ultimate load was calculated for all column cases (except for those with two
cross-arms, i.e. columns C08 and C11) and compared against experimental and numerical results,
as well as results obtained from the method proposed by Wadee et al[53] for three different
imperfection amplitudes (Lc/1000, Lc/400 and Lc/200). Figure 6.19 shows that a better correlation
(higher R2 and lower coefficient of variation values) is achieved for this new proposed method.
Figure 6.19 Comparison of predictions using the new method (left) and Wadee’s method [53] (right) against test results
6.2.4 Task 4.2.5a Dynamic response of prestressed columns
Prestressed structures allow the minimisation of mass with increasing stiffness. As a consequence,
the level of dynamic actions necessary to introduce significant vibration in the structure tend to
decrease and in some cases there is the need for including dissipative devices such as tuned mass
dampers. The design of such devices depends very significantly on the precision of the estimated
eigenfrequencies in the original structure.
In this task the natural frequencies and respective vibration modes of the PSSCs were obtained for
different levels of pretension in the cables. Experimental modal analysis was applied using
output-only measurement techniques based on ambient vibration of the structure. FE models were
developed and calibrated with experimental results. Moreover, the same operational modal analysis
techniques were used to evaluate the level of pretension in the cables. A simple methodology was
proposed, which can be used to control the cable pretension during construction. A detailed account
of the investigation is given in D4.2.5a[55].
Experimental investigation
Cables are critical force-transmitting members in PSSCs. The tension of cables influences the internal
force distribution and therefore an accurate determination of cable forces plays an important role in
the construction. Several approaches have been adopted in engineering practice to evaluate the
cable forces, either in the construction or service stage of structures. Permanent devices such as
load cells at the end of the cables, strain gauges or fibre sensors embedded inside the cable
cross-section have been utilised in civil engineering. The first method is accurate but expensive,
while the other two are less expensive but generally suffer deterioration in accuracy during time.
The geometry of a cable allows a simple relationship between installed tension and natural
frequencies. The ambient vibration method to measure the natural frequencies provides an excellent
way to estimate indirectly the installed force during the construction or service stage. This method
is typically applied by first identifying the cable frequencies from the ambient vibration
measurements. A pre-determined formula or numerical simulation can then be used with these
identified frequencies to estimate the cable force.
Dynamic tests were carried out to obtain the tension in the cables from the natural frequency. One
cable (10 mm diameter) was studied under various levels of pre-tension. The vibration
measurements were carried out using one accelerometer attached to the cable in a position that was
able to detect the transverse vibration of the cable in at least the three lower natural modes, as
illustrated in Figure 6.20.

94
Figure 6.20 Natural vibration modes of stay cable and position of accelerometer
The natural frequencies obtained from measurements were compared to those predicted by the
following equation:
� = 4� � 2 (� �� )
2
(8-1)
where:
fn is the frequency of the nth mode of vibration
n is the mode of vibration in consideration
T is the tension in the stay
m is the mass of the stay by unit length
L is the length of the stay between supports
From Table 6.4 it can be concluded that the use of natural frequencies to control the tension in the
cables is in general possible with a good level of accuracy.
Table 6.4 Stay tension obtained from measured natural frequencies
Vibration mode
1 2 3 4 5 6 7
Sta
y T
ensio
n o
bta
ined in L
oad C
ells
4100 N
Measured
Frequency [Hz] 6.34 12.8 18.9 25.2 32.1 38.6 45.0
Cable tension T
[N] 4220 4290 4180 4150 4320 4350 4330
T Error [%] 2.9% 4.7% 1.8% 1.3% 5.5% 6.1% 5.7%
7700 N
Measured
Frequency [Hz] 8.48 16.6 24.8 33.9 42.99 --- ---
Cable tension T
[N] 7550 7220 7190 7520 7740 --- ---
T Error [%] -2.0% -6.2% -6.6% -2.4% 0.49% --- ---
15800 N
Measured
Frequency [Hz] 12.20 24.1 35.5 48.5 --- --- ---
Cable tension T
[N] 15600 15200 14700 15400 --- --- ---
T Error [%] -0.65% -3.3% -6.9% -2.0% --- --- ---
23500 N
Measured
Frequency [Hz] 14.6 28.9 42.3 --- --- --- ---
Cable tension T
[N] 22500 21900 20900 --- --- --- ---
T Error [%] -4.4% -6.7% -11% --- --- --- ---
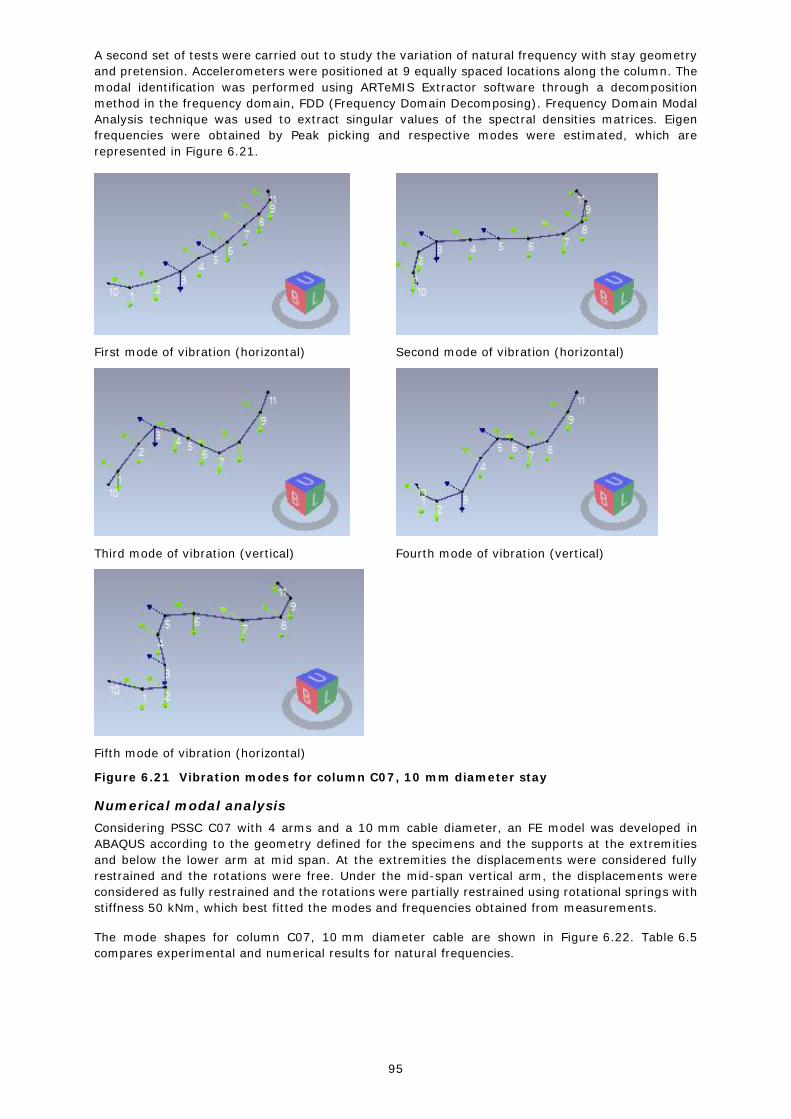
95
A second set of tests were carried out to study the variation of natural frequency with stay geometry
and pretension. Accelerometers were positioned at 9 equally spaced locations along the column. The
modal identification was performed using ARTeMIS Extractor software through a decomposition
method in the frequency domain, FDD (Frequency Domain Decomposing). Frequency Domain Modal
Analysis technique was used to extract singular values of the spectral densities matrices. Eigen
frequencies were obtained by Peak picking and respective modes were estimated, which are
represented in Figure 6.21.
First mode of vibration (horizontal) Second mode of vibration (horizontal)
Third mode of vibration (vertical) Fourth mode of vibration (vertical)
Fifth mode of vibration (horizontal)
Figure 6.21 Vibration modes for column C07, 10 mm diameter stay
Numerical modal analysis
Considering PSSC C07 with 4 arms and a 10 mm cable diameter, an FE model was developed in
ABAQUS according to the geometry defined for the specimens and the supports at the extremities
and below the lower arm at mid span. At the extremities the displacements were considered fully
restrained and the rotations were free. Under the mid-span vertical arm, the displacements were
considered as fully restrained and the rotations were partially restrained using rotational springs with
stiffness 50 kNm, which best fitted the modes and frequencies obtained from measurements.
The mode shapes for column C07, 10 mm diameter cable are shown in Figure 6.22. Table 6.5
compares experimental and numerical results for natural frequencies.
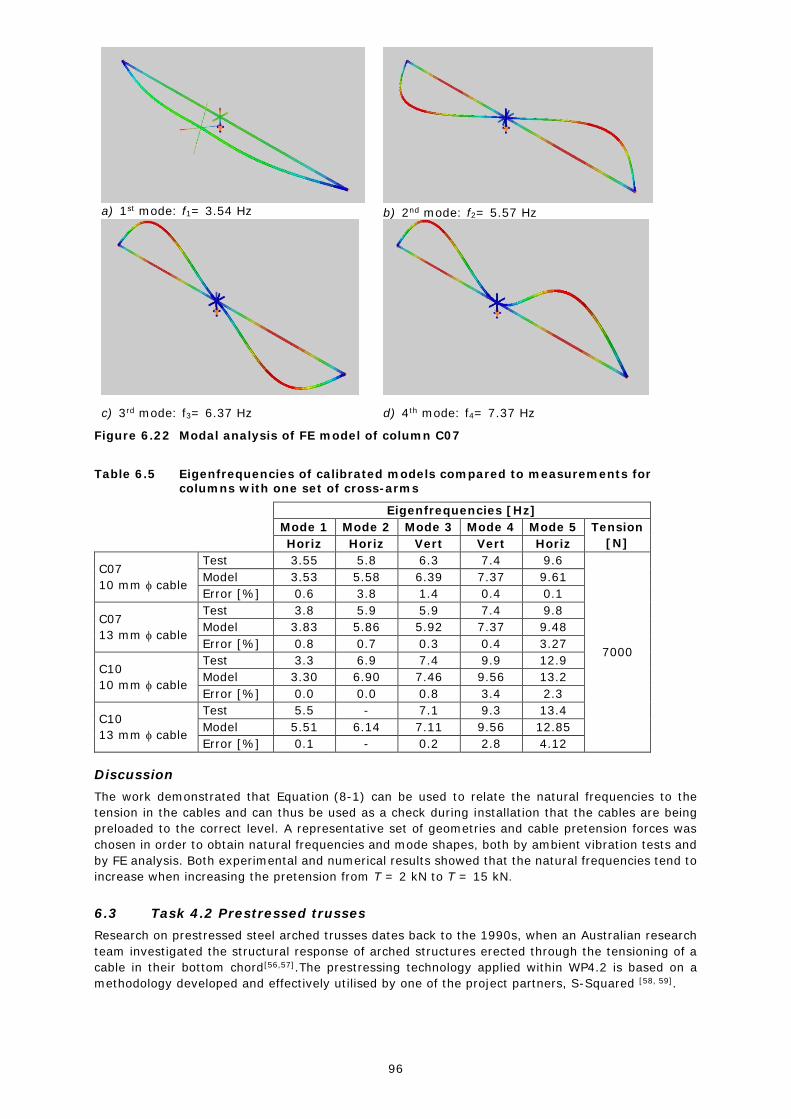
96
a) 1st mode: f1= 3.54 Hz
b) 2nd mode: f2= 5.57 Hz
c) 3rd mode: f3= 6.37 Hz
d) 4th mode: f4= 7.37 Hz
Figure 6.22 Modal analysis of FE model of column C07
Table 6.5 Eigenfrequencies of calibrated models compared to measurements for columns with one set of cross-arms
Eigenfrequencies [Hz]
Mode 1 Mode 2 Mode 3 Mode 4 Mode 5 Tension
[N] Horiz Horiz Vert Vert Horiz
C07
10 mm cable
Test 3.55 5.8 6.3 7.4 9.6
7000
Model 3.53 5.58 6.39 7.37 9.61
Error [%] 0.6 3.8 1.4 0.4 0.1
C07
13 mm cable
Test 3.8 5.9 5.9 7.4 9.8
Model 3.83 5.86 5.92 7.37 9.48
Error [%] 0.8 0.7 0.3 0.4 3.27
C10
10 mm cable
Test 3.3 6.9 7.4 9.9 12.9
Model 3.30 6.90 7.46 9.56 13.2
Error [%] 0.0 0.0 0.8 3.4 2.3
C10
13 mm cable
Test 5.5 - 7.1 9.3 13.4
Model 5.51 6.14 7.11 9.56 12.85
Error [%] 0.1 - 0.2 2.8 4.12
Discussion
The work demonstrated that Equation (8-1) can be used to relate the natural frequencies to the
tension in the cables and can thus be used as a check during installation that the cables are being
preloaded to the correct level. A representative set of geometries and cable pretension forces was
chosen in order to obtain natural frequencies and mode shapes, both by ambient vibration tests and
by FE analysis. Both experimental and numerical results showed that the natural frequencies tend to
increase when increasing the pretension from T = 2 kN to T = 15 kN.
6.3 Task 4.2 Prestressed trusses
Research on prestressed steel arched trusses dates back to the 1990s, when an Australian research
team investigated the structural response of arched structures erected through the tensioning of a
cable in their bottom chord[56,57].The prestressing technology applied within WP4.2 is based on a
methodology developed and effectively utilised by one of the project partners, S-Squared [58, 59].
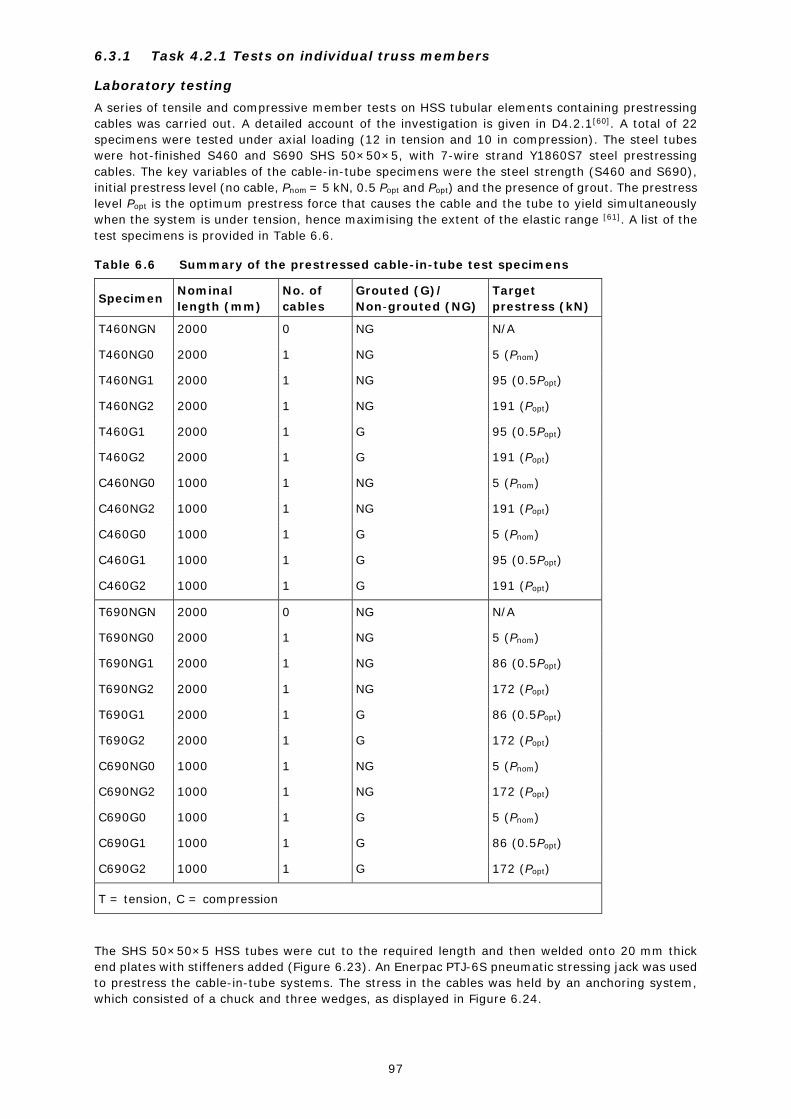
97
6.3.1 Task 4.2.1 Tests on individual truss members
Laboratory testing
A series of tensile and compressive member tests on HSS tubular elements containing prestressing
cables was carried out. A detailed account of the investigation is given in D4.2.1[60]. A total of 22
specimens were tested under axial loading (12 in tension and 10 in compression). The steel tubes
were hot-finished S460 and S690 SHS 50×50×5, with 7-wire strand Y1860S7 steel prestressing
cables. The key variables of the cable-in-tube specimens were the steel strength (S460 and S690),
initial prestress level (no cable, Pnom = 5 kN, 0.5 Popt and Popt) and the presence of grout. The prestress
level Popt is the optimum prestress force that causes the cable and the tube to yield simultaneously
when the system is under tension, hence maximising the extent of the elastic range [61]. A list of the
test specimens is provided in Table 6.6.
Table 6.6 Summary of the prestressed cable-in-tube test specimens
Specimen Nominal
length (mm)
No. of
cables
Grouted (G)/
Non-grouted (NG)
Target
prestress (kN)
T460NGN 2000 0 NG N/A
T460NG0 2000 1 NG 5 (Pnom)
T460NG1 2000 1 NG 95 (0.5Popt)
T460NG2 2000 1 NG 191 (Popt)
T460G1 2000 1 G 95 (0.5Popt)
T460G2 2000 1 G 191 (Popt)
C460NG0 1000 1 NG 5 (Pnom)
C460NG2 1000 1 NG 191 (Popt)
C460G0 1000 1 G 5 (Pnom)
C460G1 1000 1 G 95 (0.5Popt)
C460G2 1000 1 G 191 (Popt)
T690NGN 2000 0 NG N/A
T690NG0 2000 1 NG 5 (Pnom)
T690NG1 2000 1 NG 86 (0.5Popt)
T690NG2 2000 1 NG 172 (Popt)
T690G1 2000 1 G 86 (0.5Popt)
T690G2 2000 1 G 172 (Popt)
C690NG0 1000 1 NG 5 (Pnom)
C690NG2 1000 1 NG 172 (Popt)
C690G0 1000 1 G 5 (Pnom)
C690G1 1000 1 G 86 (0.5Popt)
C690G2 1000 1 G 172 (Popt)
T = tension, C = compression
The SHS 50×50×5 HSS tubes were cut to the required length and then welded onto 20 mm thick
end plates with stiffeners added (Figure 6.23). An Enerpac PTJ-6S pneumatic stressing jack was used
to prestress the cable-in-tube systems. The stress in the cables was held by an anchoring system,
which consisted of a chuck and three wedges, as displayed in Figure 6.24.
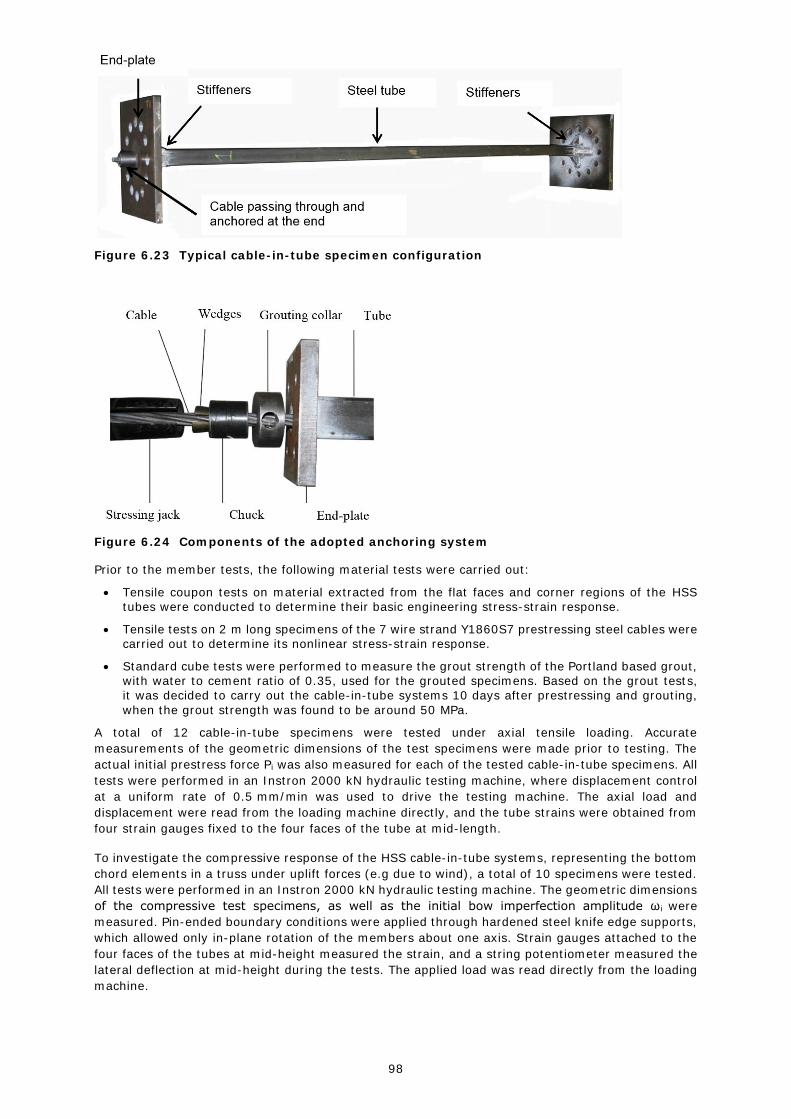
98
Figure 6.23 Typical cable-in-tube specimen configuration
Figure 6.24 Components of the adopted anchoring system
Prior to the member tests, the following material tests were carried out:
Tensile coupon tests on material extracted from the flat faces and corner regions of the HSS tubes were conducted to determine their basic engineering stress-strain response.
Tensile tests on 2 m long specimens of the 7 wire strand Y1860S7 prestressing steel cables were carried out to determine its nonlinear stress-strain response.
Standard cube tests were performed to measure the grout strength of the Portland based grout, with water to cement ratio of 0.35, used for the grouted specimens. Based on the grout tests, it was decided to carry out the cable-in-tube systems 10 days after prestressing and grouting,
when the grout strength was found to be around 50 MPa.
A total of 12 cable-in-tube specimens were tested under axial tensile loading. Accurate
measurements of the geometric dimensions of the test specimens were made prior to testing. The
actual initial prestress force Pi was also measured for each of the tested cable-in-tube specimens. All
tests were performed in an Instron 2000 kN hydraulic testing machine, where displacement control
at a uniform rate of 0.5 mm/min was used to drive the testing machine. The axial load and
displacement were read from the loading machine directly, and the tube strains were obtained from
four strain gauges fixed to the four faces of the tube at mid-length.
To investigate the compressive response of the HSS cable-in-tube systems, representing the bottom
chord elements in a truss under uplift forces (e.g due to wind), a total of 10 specimens were tested.
All tests were performed in an Instron 2000 kN hydraulic testing machine. The geometric dimensions
of the compressive test specimens, as well as the initial bow imperfection amplitude ω i were
measured. Pin-ended boundary conditions were applied through hardened steel knife edge supports,
which allowed only in-plane rotation of the members about one axis. Strain gauges attached to the
four faces of the tubes at mid-height measured the strain, and a string potentiometer measured the
lateral deflection at mid-height during the tests. The applied load was read directly from the loading
machine.
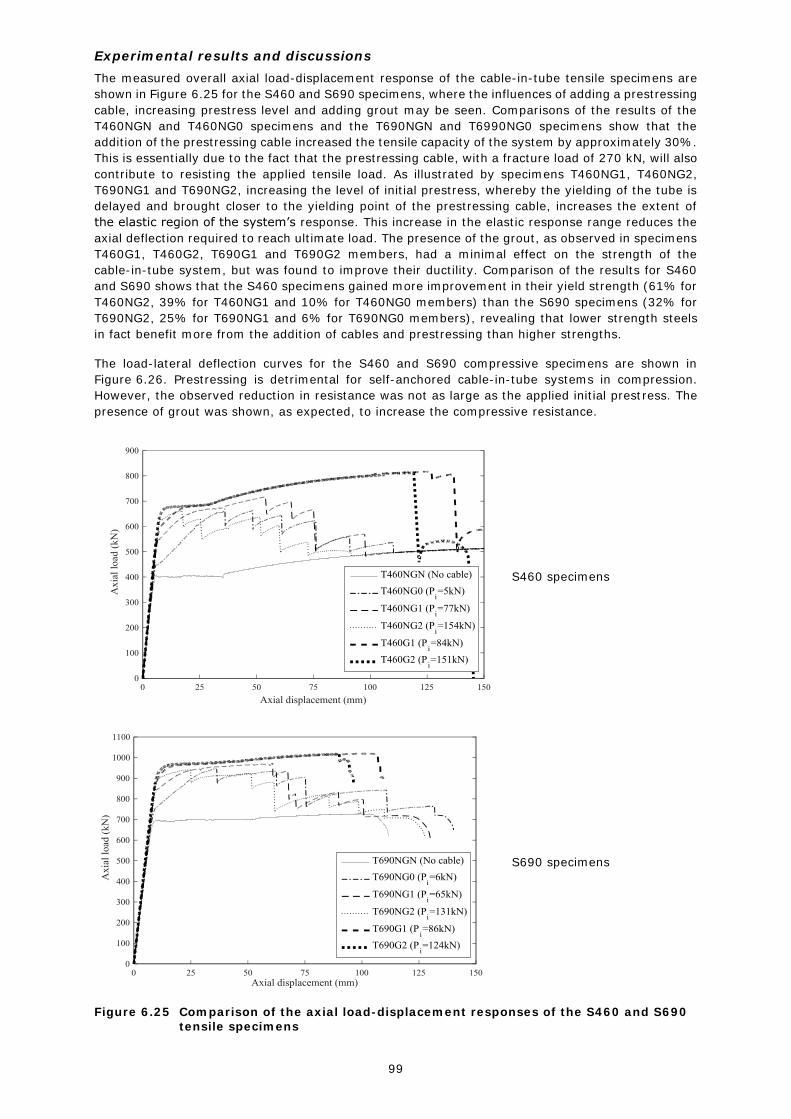
99
Experimental results and discussions
The measured overall axial load-displacement response of the cable-in-tube tensile specimens are
shown in Figure 6.25 for the S460 and S690 specimens, where the influences of adding a prestressing
cable, increasing prestress level and adding grout may be seen. Comparisons of the results of the
T460NGN and T460NG0 specimens and the T690NGN and T6990NG0 specimens show that the
addition of the prestressing cable increased the tensile capacity of the system by approximately 30%.
This is essentially due to the fact that the prestressing cable, with a fracture load of 270 kN, will also
contribute to resisting the applied tensile load. As illustrated by specimens T460NG1, T460NG2,
T690NG1 and T690NG2, increasing the level of initial prestress, whereby the yielding of the tube is
delayed and brought closer to the yielding point of the prestressing cable, increases the extent of
the elastic region of the system’s response. This increase in the elastic response range reduces the
axial deflection required to reach ultimate load. The presence of the grout, as observed in specimens
T460G1, T460G2, T690G1 and T690G2 members, had a minimal effect on the strength of the
cable-in-tube system, but was found to improve their ductility. Comparison of the results for S460
and S690 shows that the S460 specimens gained more improvement in their yield strength (61% for
T460NG2, 39% for T460NG1 and 10% for T460NG0 members) than the S690 specimens (32% for
T690NG2, 25% for T690NG1 and 6% for T690NG0 members), revealing that lower strength steels
in fact benefit more from the addition of cables and prestressing than higher strengths.
The load-lateral deflection curves for the S460 and S690 compressive specimens are shown in
Figure 6.26. Prestressing is detrimental for self-anchored cable-in-tube systems in compression.
However, the observed reduction in resistance was not as large as the applied initial prestress. The
presence of grout was shown, as expected, to increase the compressive resistance.
S460 specimens
S690 specimens
Figure 6.25 Comparison of the axial load-displacement responses of the S460 and S690 tensile specimens
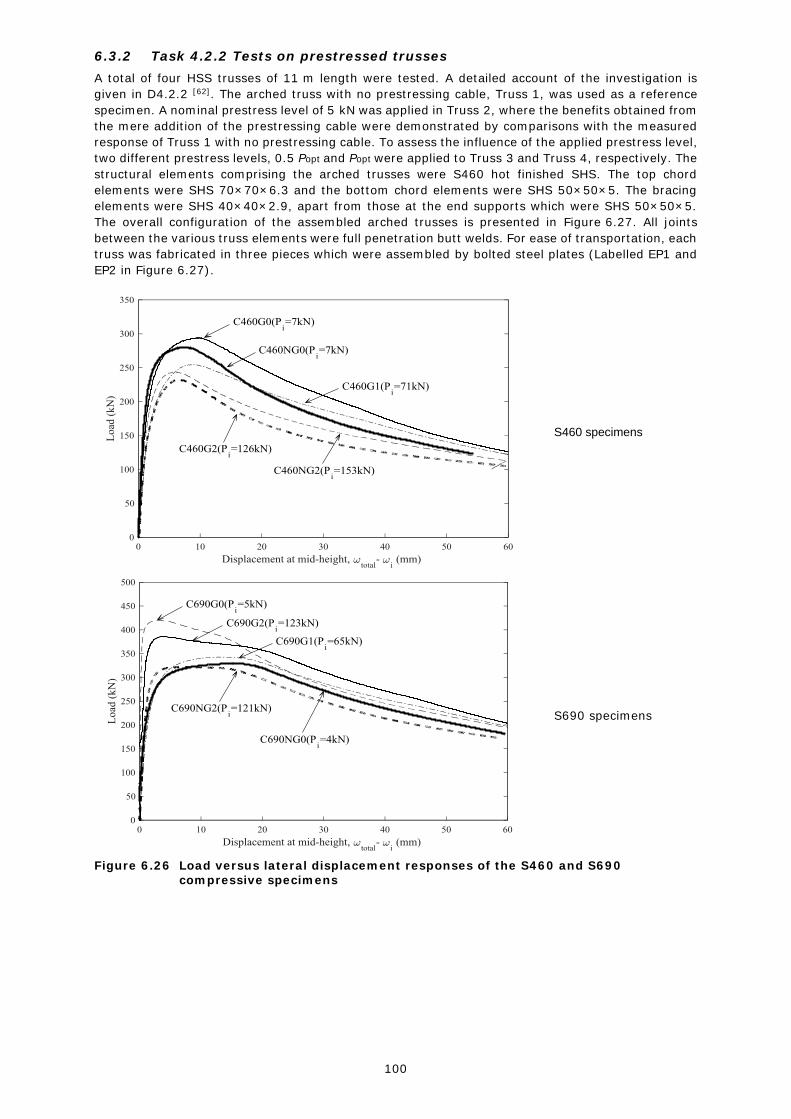
100
6.3.2 Task 4.2.2 Tests on prestressed trusses
A total of four HSS trusses of 11 m length were tested. A detailed account of the investigation is
given in D4.2.2 [62]. The arched truss with no prestressing cable, Truss 1, was used as a reference
specimen. A nominal prestress level of 5 kN was applied in Truss 2, where the benefits obtained from
the mere addition of the prestressing cable were demonstrated by comparisons with the measured
response of Truss 1 with no prestressing cable. To assess the influence of the applied prestress level,
two different prestress levels, 0.5 Popt and Popt were applied to Truss 3 and Truss 4, respectively. The
structural elements comprising the arched trusses were S460 hot finished SHS. The top chord
elements were SHS 70×70×6.3 and the bottom chord elements were SHS 50×50×5. The bracing
elements were SHS 40×40×2.9, apart from those at the end supports which were SHS 50×50×5.
The overall configuration of the assembled arched trusses is presented in Figure 6.27. All joints
between the various truss elements were full penetration butt welds. For ease of transportation, each
truss was fabricated in three pieces which were assembled by bolted steel plates (Labelled EP1 and
EP2 in Figure 6.27).
S460 specimens
S690 specimens
Figure 6.26 Load versus lateral displacement responses of the S460 and S690 compressive specimens

101
Figure 6.27 Schematic drawing of the arched truss specimens
The tests were carried out in a purpose-built rig that was designed to examine the behaviour of the
HSS prestressed arched trusses subjected to vertical downward loading. Figure 6.28 shows the
general test set-up configuration. Vertical downward loading was applied to each truss through five
point loads on the bottom chord at the locations of the hydraulic jacks as shown in Figure 6.28. A
lateral support system was developed to maintain the overall lateral stability of the tested trusses
during loading and to ensure in-plane behaviour. A series of lateral restraint cables were used,
connected to the truss top chord at one end and supported by the test rig at the other end. A total
of eighteen lateral restraint cables, nine on each side of the top chord, placed at discrete locations
as shown in Figure 6.28, were deemed necessary. All truss specimens were extensively instrumented
which allowed a full representation of the response of the HSS prestressed arched trusses to be
obtained. The prestressing cables located within the bottom chord of the fully assembled trusses
were first anchored in place at both ends, and then prestressed.
Experimental results and discussions
The load versus vertical displacement curves of all the truss specimens at each of the loading
positions (loading points 1-3) are shown in Figure 6.29, where the influences of the addition of the
prestress cable and the varying applied prestress loads on the measured response are illustrated.
In-plane failure modes were observed for Truss 1, Truss 2 and Truss 4, as shown in Figure 6.30.
Truss 3 showed evidence of out-of-plane deformations, as shown in Figure 6.31, and was therefore
unable to reach the system’s ultimate load. The influence of prestress, which is to delay the yielding
of the bottom chord and hence extend the elastic range of the system response, may be seen in
Figure 6.29.

102
Figure 6.28 Truss test rig set-up
Loading point 1 Loading point 2
Loading point 3
Figure 6.29 Load versus vertical displacement curves of the four tested trusses
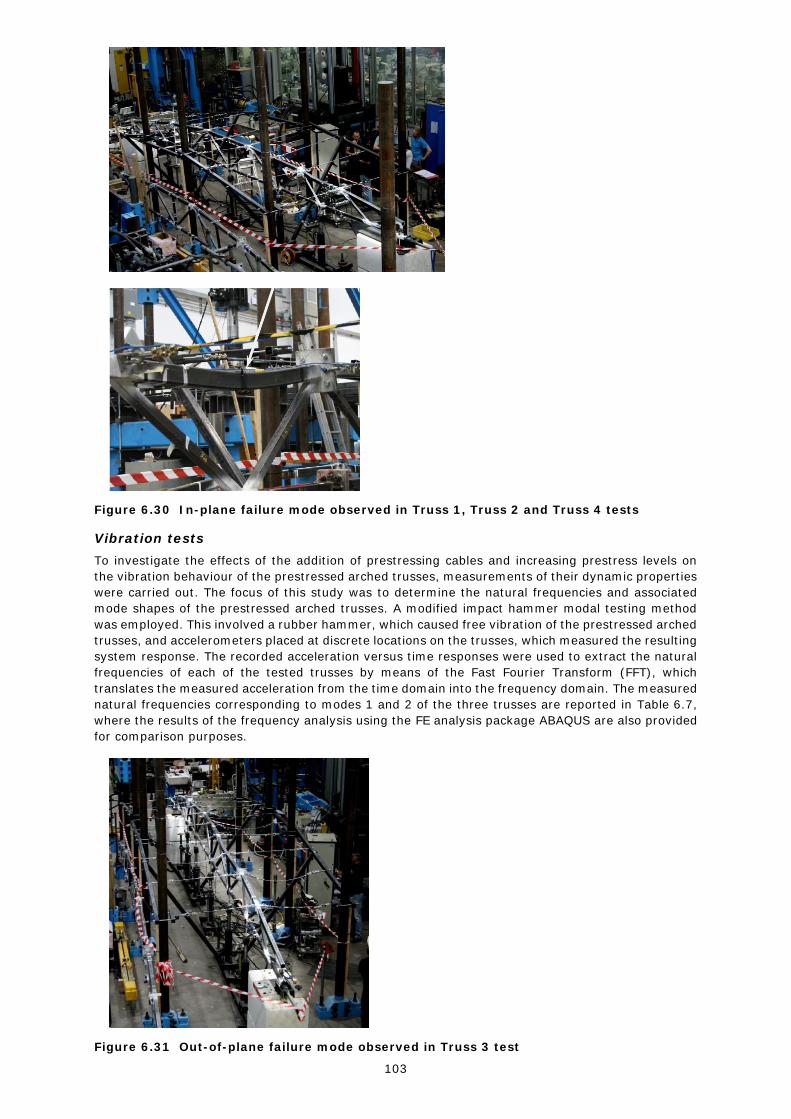
103
Figure 6.30 In-plane failure mode observed in Truss 1, Truss 2 and Truss 4 tests
Vibration tests
To investigate the effects of the addition of prestressing cables and increasing prestress levels on
the vibration behaviour of the prestressed arched trusses, measurements of their dynamic properties
were carried out. The focus of this study was to determine the natural frequencies and associated
mode shapes of the prestressed arched trusses. A modified impact hammer modal testing method
was employed. This involved a rubber hammer, which caused free vibration of the prestressed arched
trusses, and accelerometers placed at discrete locations on the trusses, which measured the resulting
system response. The recorded acceleration versus time responses were used to extract the natural
frequencies of each of the tested trusses by means of the Fast Fourier Transform (FFT), which
translates the measured acceleration from the time domain into the frequency domain. The measured
natural frequencies corresponding to modes 1 and 2 of the three trusses are reported in Table 6.7,
where the results of the frequency analysis using the FE analysis package ABAQUS are also provided
for comparison purposes.
Figure 6.31 Out-of-plane failure mode observed in Truss 3 test
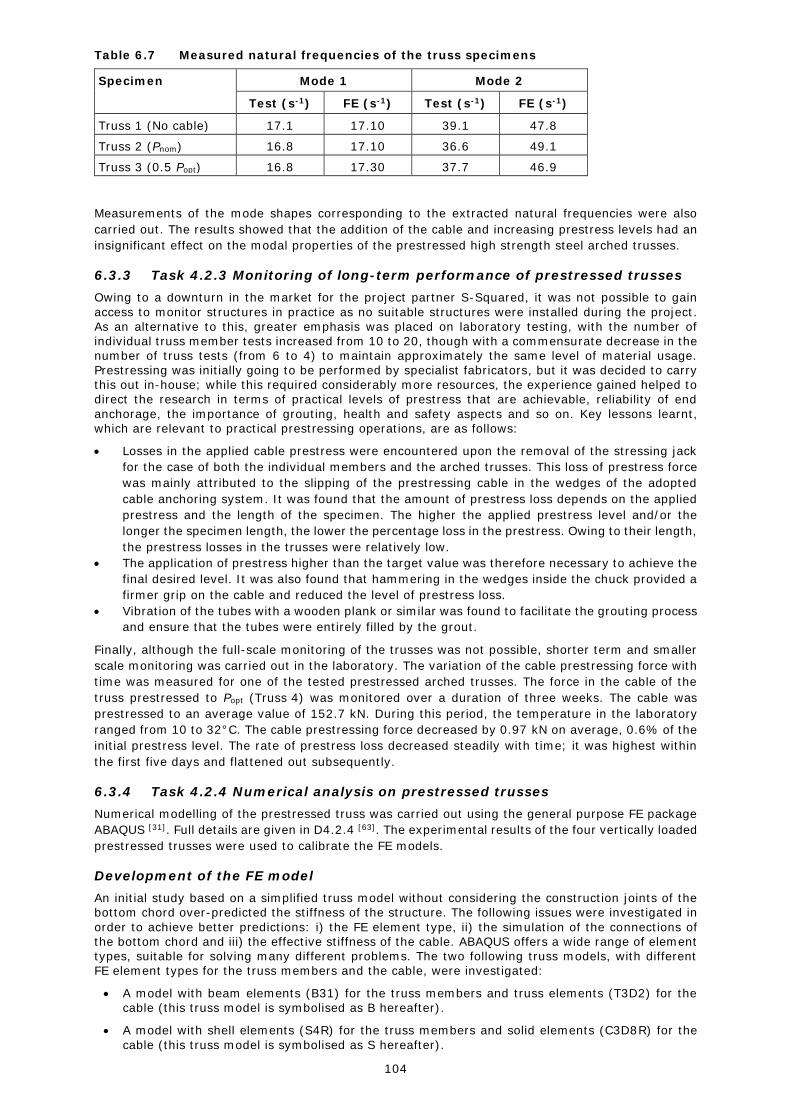
104
Table 6.7 Measured natural frequencies of the truss specimens
Specimen Mode 1 Mode 2
Test (s-1) FE (s-1) Test (s-1) FE (s-1)
Truss 1 (No cable) 17.1 17.10 39.1 47.8
Truss 2 (Pnom) 16.8 17.10 36.6 49.1
Truss 3 (0.5 Popt) 16.8 17.30 37.7 46.9
Measurements of the mode shapes corresponding to the extracted natural frequencies were also
carried out. The results showed that the addition of the cable and increasing prestress levels had an
insignificant effect on the modal properties of the prestressed high strength steel arched trusses.
6.3.3 Task 4.2.3 Monitoring of long-term performance of prestressed trusses
Owing to a downturn in the market for the project partner S-Squared, it was not possible to gain
access to monitor structures in practice as no suitable structures were installed during the project.
As an alternative to this, greater emphasis was placed on laboratory testing, with the number of individual truss member tests increased from 10 to 20, though with a commensurate decrease in the number of truss tests (from 6 to 4) to maintain approximately the same level of material usage. Prestressing was initially going to be performed by specialist fabricators, but it was decided to carry this out in-house; while this required considerably more resources, the experience gained helped to direct the research in terms of practical levels of prestress that are achievable, reliability of end
anchorage, the importance of grouting, health and safety aspects and so on. Key lessons learnt, which are relevant to practical prestressing operations, are as follows:
Losses in the applied cable prestress were encountered upon the removal of the stressing jack
for the case of both the individual members and the arched trusses. This loss of prestress force
was mainly attributed to the slipping of the prestressing cable in the wedges of the adopted
cable anchoring system. It was found that the amount of prestress loss depends on the applied
prestress and the length of the specimen. The higher the applied prestress level and/or the
longer the specimen length, the lower the percentage loss in the prestress. Owing to their length,
the prestress losses in the trusses were relatively low.
The application of prestress higher than the target value was therefore necessary to achieve the
final desired level. It was also found that hammering in the wedges inside the chuck provided a
firmer grip on the cable and reduced the level of prestress loss.
Vibration of the tubes with a wooden plank or similar was found to facilitate the grouting process
and ensure that the tubes were entirely filled by the grout.
Finally, although the full-scale monitoring of the trusses was not possible, shorter term and smaller
scale monitoring was carried out in the laboratory. The variation of the cable prestressing force with
time was measured for one of the tested prestressed arched trusses. The force in the cable of the
truss prestressed to Popt (Truss 4) was monitored over a duration of three weeks. The cable was
prestressed to an average value of 152.7 kN. During this period, the temperature in the laboratory
ranged from 10 to 32°C. The cable prestressing force decreased by 0.97 kN on average, 0.6% of the
initial prestress level. The rate of prestress loss decreased steadily with time; it was highest within
the first five days and flattened out subsequently.
6.3.4 Task 4.2.4 Numerical analysis on prestressed trusses
Numerical modelling of the prestressed truss was carried out using the general purpose FE package
ABAQUS [31]. Full details are given in D4.2.4 [63]. The experimental results of the four vertically loaded
prestressed trusses were used to calibrate the FE models.
Development of the FE model
An initial study based on a simplified truss model without considering the construction joints of the bottom chord over-predicted the stiffness of the structure. The following issues were investigated in
order to achieve better predictions: i) the FE element type, ii) the simulation of the connections of the bottom chord and iii) the effective stiffness of the cable. ABAQUS offers a wide range of element types, suitable for solving many different problems. The two following truss models, with different FE element types for the truss members and the cable, were investigated:
A model with beam elements (B31) for the truss members and truss elements (T3D2) for the cable (this truss model is symbolised as B hereafter).
A model with shell elements (S4R) for the truss members and solid elements (C3D8R) for the
cable (this truss model is symbolised as S hereafter).
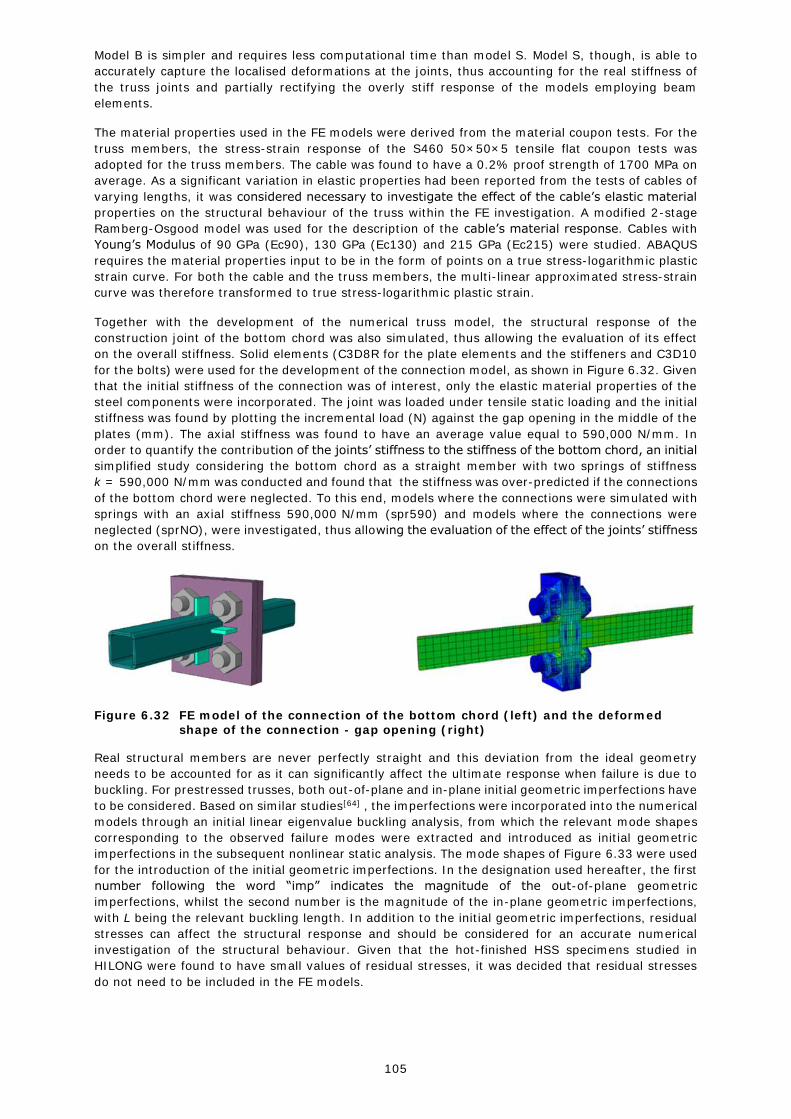
105
Model B is simpler and requires less computational time than model S. Model S, though, is able to
accurately capture the localised deformations at the joints, thus accounting for the real stiffness of
the truss joints and partially rectifying the overly stiff response of the models employing beam
elements.
The material properties used in the FE models were derived from the material coupon tests. For the
truss members, the stress-strain response of the S460 50×50×5 tensile flat coupon tests was
adopted for the truss members. The cable was found to have a 0.2% proof strength of 1700 MPa on
average. As a significant variation in elastic properties had been reported from the tests of cables of
varying lengths, it was considered necessary to investigate the effect of the cable’s elastic material
properties on the structural behaviour of the truss within the FE investigation. A modified 2-stage
Ramberg-Osgood model was used for the description of the cable’s material response. Cables with
Young’s Modulus of 90 GPa (Ec90), 130 GPa (Ec130) and 215 GPa (Ec215) were studied. ABAQUS
requires the material properties input to be in the form of points on a true stress-logarithmic plastic
strain curve. For both the cable and the truss members, the multi-linear approximated stress-strain
curve was therefore transformed to true stress-logarithmic plastic strain.
Together with the development of the numerical truss model, the structural response of the
construction joint of the bottom chord was also simulated, thus allowing the evaluation of its effect
on the overall stiffness. Solid elements (C3D8R for the plate elements and the stiffeners and C3D10
for the bolts) were used for the development of the connection model, as shown in Figure 6.32. Given
that the initial stiffness of the connection was of interest, only the elastic material properties of the
steel components were incorporated. The joint was loaded under tensile static loading and the initial
stiffness was found by plotting the incremental load (N) against the gap opening in the middle of the
plates (mm). The axial stiffness was found to have an average value equal to 590,000 N/mm. In
order to quantify the contribution of the joints’ stiffness to the stiffness of the bottom chord, an initial
simplified study considering the bottom chord as a straight member with two springs of stiffness
k = 590,000 N/mm was conducted and found that the stiffness was over-predicted if the connections
of the bottom chord were neglected. To this end, models where the connections were simulated with
springs with an axial stiffness 590,000 N/mm (spr590) and models where the connections were
neglected (sprNO), were investigated, thus allowing the evaluation of the effect of the joints’ stiffness
on the overall stiffness.
Figure 6.32 FE model of the connection of the bottom chord (left) and the deformed shape of the connection - gap opening (right)
Real structural members are never perfectly straight and this deviation from the ideal geometry
needs to be accounted for as it can significantly affect the ultimate response when failure is due to
buckling. For prestressed trusses, both out-of-plane and in-plane initial geometric imperfections have
to be considered. Based on similar studies[64] , the imperfections were incorporated into the numerical
models through an initial linear eigenvalue buckling analysis, from which the relevant mode shapes
corresponding to the observed failure modes were extracted and introduced as initial geometric
imperfections in the subsequent nonlinear static analysis. The mode shapes of Figure 6.33 were used
for the introduction of the initial geometric imperfections. In the designation used hereafter, the first
number following the word “imp” indicates the magnitude of the out-of-plane geometric
imperfections, whilst the second number is the magnitude of the in-plane geometric imperfections,
with L being the relevant buckling length. In addition to the initial geometric imperfections, residual
stresses can affect the structural response and should be considered for an accurate numerical
investigation of the structural behaviour. Given that the hot-finished HSS specimens studied in
HILONG were found to have small values of residual stresses, it was decided that residual stresses
do not need to be included in the FE models.

106
Figure 6.33 Elastic buckling modes: out-of-plane buckling (left) & in-plane buckling
(right); model S
For the evaluation of the structural response of HSS prestressed trusses, a nonlinear static analysis,
was performed using the modified RIKS procedure (a variation of the classic arc length method) [65].
Validation of the FE model
Each of the four numerical truss models (T1 (no cable), T2 (truss with a cable at Pnom prestress level),
T3 (truss with a cable at 0.50 Popt prestress level) and T4 (truss with cable at Popt prestress level))
were validated against the respective experimental results. The results were plotted in
load-displacement curves, thus allowing the direct comparison between experimental and numerical
data. The effects of the FE element type and the flexibility of the bottom chord’s connections on the
overall performance were evaluated for all trusses. For T2, T3 and T4, the effect of cables with
different Young’s Modulus on the overall structural response was also investigated. The
load-displacement curves at the midpoint (L3) of all trusses are depicted in Figure 6.34.
As can be observed for Truss 1, the numerical model with beam elements for truss members
(model B) over-predicts the stiffness of the system, whereas the numerical model with shell elements
(model S) leads to a more flexible response, closer to the experimental observations. With the
incorporation of the bottom chord joints as springs of axial stiffness 590,000 N/mm in model S, the
initial stiffness of the system is reduced further, matching precisely the experimental curve. The
same conclusion with regard to the over-prediction of the overall stiffness of the structure by model B
can be drawn also for Truss 2. Moreover, for Truss 2, the FE results achieve better agreement with
the experimental ones - both in terms of ultimate load and displacement at failure load - for the
cable with the lowest Young’s Modulus. The applied prestress in Truss 3 and Truss 4, leads to a stiffer
overall response of the structure compared to the response of Truss 2, whereas the effect of the
cable’s Young’s Modulus on the overall structural behaviour is more significant in Truss 2 than in
Truss 3 and 4. It has therefore been concluded that a model with shell elements for the truss
members, with an axial spring in place of the connections of the bottom chord and a cable with
Young’s Modulus of 90 GPa leads to very good overall agreement with the test results. This model
was therefore used to investigate the appropriate amplitudes of the initial out-of-plane and in-plane
geometric imperfections that give the closest agreement with the experimental results.
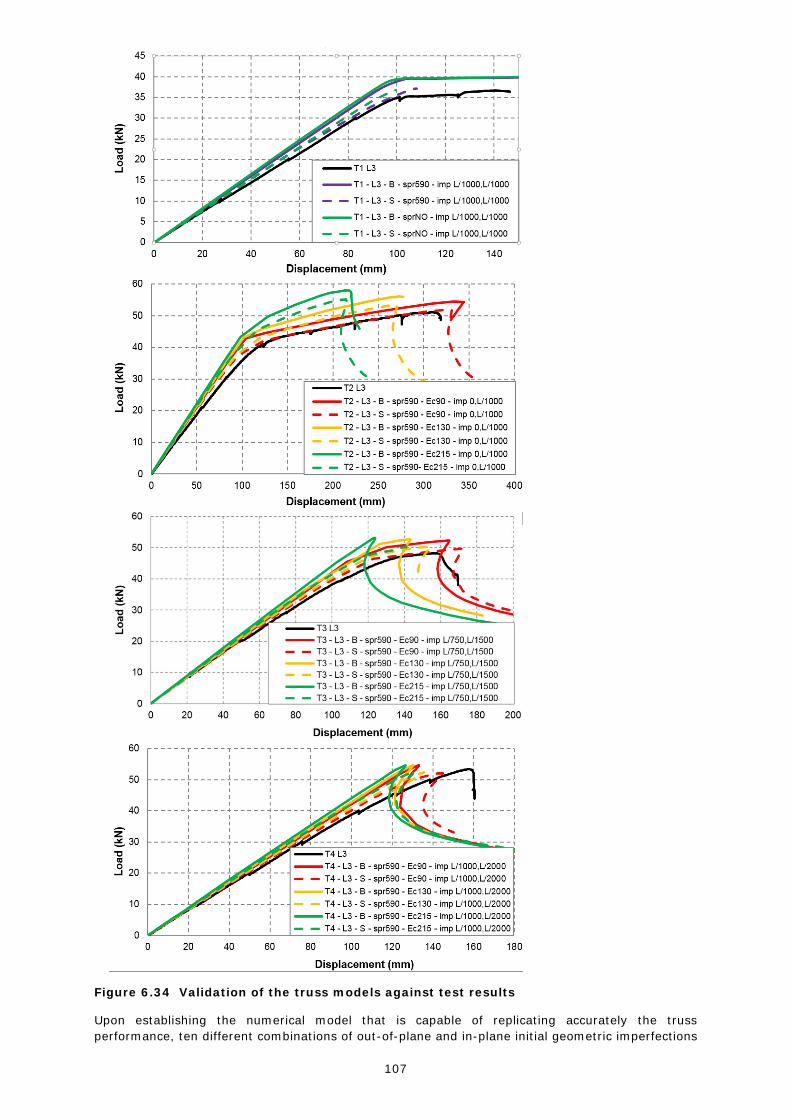
107
Figure 6.34 Validation of the truss models against test results
Upon establishing the numerical model that is capable of replicating accurately the truss
performance, ten different combinations of out-of-plane and in-plane initial geometric imperfections
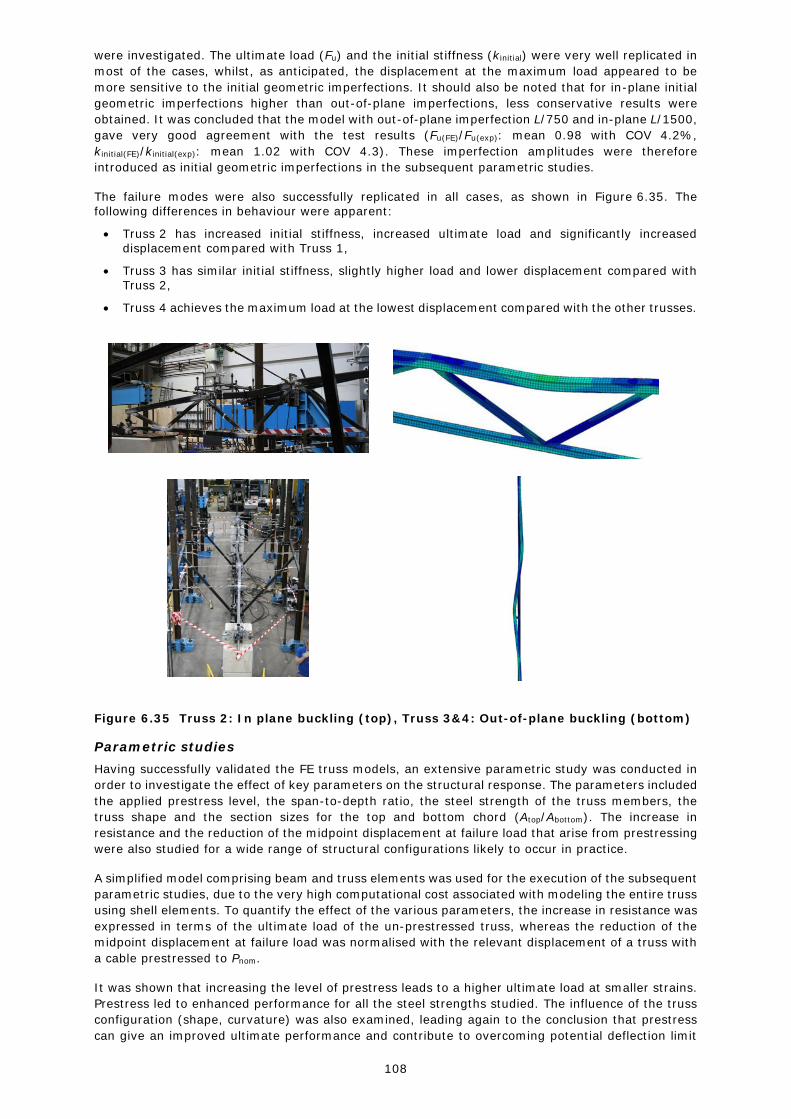
108
were investigated. The ultimate load (Fu) and the initial stiffness (kinitial) were very well replicated in
most of the cases, whilst, as anticipated, the displacement at the maximum load appeared to be
more sensitive to the initial geometric imperfections. It should also be noted that for in-plane initial
geometric imperfections higher than out-of-plane imperfections, less conservative results were
obtained. It was concluded that the model with out-of-plane imperfection L/750 and in-plane L/1500,
gave very good agreement with the test results (Fu(FE)/Fu(exp): mean 0.98 with COV 4.2%,
kinitial(FE)/kinitial(exp): mean 1.02 with COV 4.3). These imperfection amplitudes were therefore
introduced as initial geometric imperfections in the subsequent parametric studies.
The failure modes were also successfully replicated in all cases, as shown in Figure 6.35. The following differences in behaviour were apparent:
Truss 2 has increased initial stiffness, increased ultimate load and significantly increased displacement compared with Truss 1,
Truss 3 has similar initial stiffness, slightly higher load and lower displacement compared with Truss 2,
Truss 4 achieves the maximum load at the lowest displacement compared with the other trusses.
Figure 6.35 Truss 2: In plane buckling (top), Truss 3&4: Out-of-plane buckling (bottom)
Parametric studies
Having successfully validated the FE truss models, an extensive parametric study was conducted in
order to investigate the effect of key parameters on the structural response. The parameters included
the applied prestress level, the span-to-depth ratio, the steel strength of the truss members, the
truss shape and the section sizes for the top and bottom chord (Atop/Abottom). The increase in
resistance and the reduction of the midpoint displacement at failure load that arise from prestressing
were also studied for a wide range of structural configurations likely to occur in practice.
A simplified model comprising beam and truss elements was used for the execution of the subsequent
parametric studies, due to the very high computational cost associated with modeling the entire truss
using shell elements. To quantify the effect of the various parameters, the increase in resistance was
expressed in terms of the ultimate load of the un-prestressed truss, whereas the reduction of the
midpoint displacement at failure load was normalised with the relevant displacement of a truss with
a cable prestressed to Pnom.
It was shown that increasing the level of prestress leads to a higher ultimate load at smaller strains.
Prestress led to enhanced performance for all the steel strengths studied. The influence of the truss
configuration (shape, curvature) was also examined, leading again to the conclusion that prestress
can give an improved ultimate performance and contribute to overcoming potential deflection limit

109
problems. The effect of the Atop/Abottom ratio was investigated, which showed that care is needed in
the design: if the top chord fails by premature buckling, the benefits of prestress cannot be realised
as the truss fails at small strains. When the anticipated failure mode is yielding of the tensile bottom
chord, the truss exhibits a more ductile structural response with increased resistance for increasing
levels of prestress.
Hence, it can be concluded that the application of prestress can increase the elastic load-carrying
resistance of a structure, without substantially increasing its structural weight. It can therefore be
utilised to overcome potential deflection limit issues in HSS structures, in which it is likely that SLS
implications are more pronounced than in conventional strength steel structures. This means that
the design criteria can be met using smaller span-to-depth ratios, hence reducing the length and
cross-section dimensions of the truss diagonals and resulting in lighter and more elegant structures,
thus pushing further the limits of modern structural design practice.
Vibration considerations
The dynamic response of prestressed trusses was numerically investigated using the FE software
ABAQUS. Based on both the experimental and the numerical studies, it was concluded that the
introduction of cables in the bottom chord of the trusses does not cause any significant change in
the dynamic response (natural frequencies and mode shapes) of the trusses regardless of the applied
prestress level. Hence the dynamic response of the prestressed arched trusses does not differ from
the response of conventional steel trusses and therefore, no further research on vibration control
needs to be carried out. Nevertheless, if deemed necessary, various technologies to mitigate
vibration in steel structures are currently available[66,67] and could be adopted.
6.3.5 Design guidance for prestressed trusses
Design procedure
Based on the tests and numerical modelling described in the preceding sections, a design process
for long span trusses of tubular members was developed. Full details are given in D4.3b [68]. The
design process applies to trusses in one of the three following cases: i) without any cable inserted in
the bottom chord, ii) with a cable in the bottom chord at nominal prestress level Pnom and iii) with a
cable in the bottom chord at optimum prestress level Popt.
As a first step, the designer selects the geometry (i.e. span, depth, configuration of diagonals,
number of girders and curvature of the bottom and top chord) of the truss. Like in conventional truss
design, the final choice is a compromise between aesthetics, economy, weight, fabrication cost and
so on, and is usually the result of a number of iterations.
The second step involves the determination of the relevant actions for both the Ultimate Limit State
(ULS) and Serviceability Limit State (SLS). Various loading combinations should be established and
compared, from which the most critical loading cases, in both the gravity and uplift directions, are
able to be identified. It should be noted that for some cases, where all the load combinations result
in net downward forces, the uplift ULS and SLS can be ignored and only the gravity ULS and SLS
need to be considered in the truss design. For conceptual design, it may be assumed that only point
loads at the joints of the top chord act on the structure. If a concentrated load acts transversely on
a top chord member, that member needs to be designed as a beam column rather than a truss
member in pure compression. Herein, it will be assumed that loads are acting only at joint locations
and hence only truss action will be considered.
The next step is to determine the cross-section sizes of the truss members according to the identified
ULS. The procedure starts with the design of the bottom chord, which depends on whether a cable
is to be inserted in the bottom chord. With the assumption that the truss behaves macroscopically
like a simply supported beam, subjected to uniform gravity or uplift loading qEd, the design bending
moment at midspan at ULS can be found by the formula qEdL2/8, where L is the span of the truss.
Hence, the design tensile (or compressive) load in the bottom chord, NEd,bottom,t (or NEd,bottom,c), equals
the maximum gravity (or uplift) bending moment, MEd,gravity (or MEd,uplift), divided by the lever arm
(i.e the depth of the truss at mid-span).
When there is no cable inserted in the bottom chord, the cross-section of the bottom chord (At,bottom)
in the considered steel strength (fyt) can be evaluated from Equations (8-2) and (8-3), being checked
against the tensile and compressive design loads, respectively.
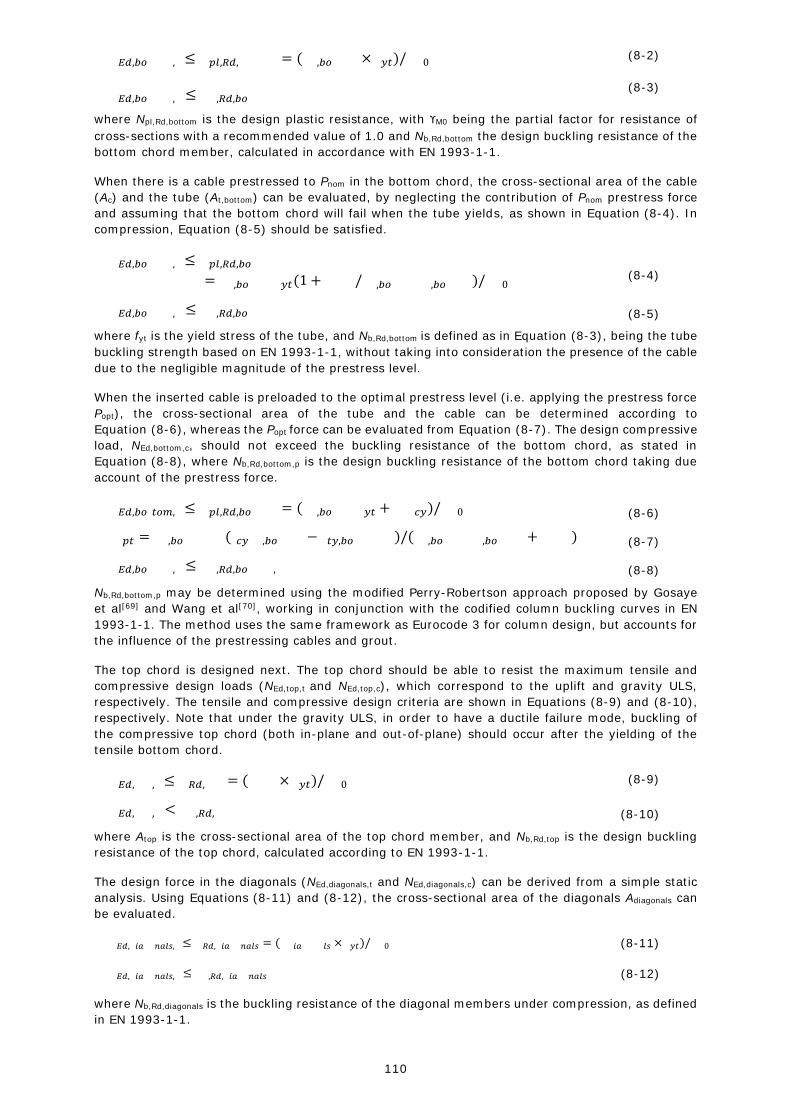
110
� 𝐸𝑑,𝑏𝑜� � � � ,� ≤ � 𝑝𝑙,𝑅𝑑,� � � � � � = (� � ,𝑏𝑜� � � � × � 𝑦𝑡)/� � 0 (8-2)
� 𝐸𝑑,𝑏𝑜� � � � ,� ≤ � � ,𝑅𝑑,𝑏𝑜� � � � (8-3)
where Npl,Rd,bottom is the design plastic resistance, with ϒM0 being the partial factor for resistance of
cross-sections with a recommended value of 1.0 and Nb,Rd,bottom the design buckling resistance of the
bottom chord member, calculated in accordance with EN 1993-1-1.
When there is a cable prestressed to Pnom in the bottom chord, the cross-sectional area of the cable
(Ac) and the tube (At,bottom) can be evaluated, by neglecting the contribution of Pnom prestress force
and assuming that the bottom chord will fail when the tube yields, as shown in Equation (8-4). In
compression, Equation (8-5) should be satisfied.
� 𝐸𝑑,𝑏𝑜� � � � ,� ≤ � 𝑝𝑙,𝑅𝑑,𝑏𝑜� � � �= � � ,𝑏𝑜� � � � � 𝑦𝑡(1 + � � � � /� � ,𝑏𝑜� � � � � � ,𝑏𝑜� � � � )/� � 0 (8-4)
� 𝐸𝑑,𝑏𝑜� � � � ,� ≤ � � ,𝑅𝑑,𝑏𝑜� � � � (8-5)
where fyt is the yield stress of the tube, and Nb,Rd,bottom is defined as in Equation (8-3), being the tube
buckling strength based on EN 1993-1-1, without taking into consideration the presence of the cable
due to the negligible magnitude of the prestress level.
When the inserted cable is preloaded to the optimal prestress level (i.e. applying the prestress force
Popt), the cross-sectional area of the tube and the cable can be determined according to
Equation (8-6), whereas the Popt force can be evaluated from Equation (8-7). The design compressive
load, NEd,bottom,c, should not exceed the buckling resistance of the bottom chord, as stated in
Equation (8-8), where Nb,Rd,bottom,p is the design buckling resistance of the bottom chord taking due
account of the prestress force.
� 𝐸𝑑,𝑏𝑜� 𝑡𝑜𝑚,� ≤ � 𝑝𝑙,𝑅𝑑,𝑏𝑜� � � � = (� � ,𝑏𝑜� � � � � 𝑦𝑡 + � � � 𝑐𝑦)/� � 0 (8-6)
� � 𝑝𝑡 = � � ,𝑏𝑜� � � � � � (� 𝑐𝑦 � � ,𝑏𝑜� � � � − � 𝑡𝑦,𝑏𝑜� � � � � � )/(� � ,𝑏𝑜� � � � � � ,𝑏𝑜� � � � + � � � � ) (8-7)
� 𝐸𝑑,𝑏𝑜� � � � ,� ≤ � � ,𝑅𝑑,𝑏𝑜� � � � ,� (8-8)
Nb,Rd,bottom,p may be determined using the modified Perry-Robertson approach proposed by Gosaye
et al[69] and Wang et al[70], working in conjunction with the codified column buckling curves in EN
1993-1-1. The method uses the same framework as Eurocode 3 for column design, but accounts for
the influence of the prestressing cables and grout.
The top chord is designed next. The top chord should be able to resist the maximum tensile and
compressive design loads (NEd,top,t and NEd,top,c), which correspond to the uplift and gravity ULS,
respectively. The tensile and compressive design criteria are shown in Equations (8-9) and (8-10),
respectively. Note that under the gravity ULS, in order to have a ductile failure mode, buckling of
the compressive top chord (both in-plane and out-of-plane) should occur after the yielding of the
tensile bottom chord.
� 𝐸𝑑,� � � ,� ≤ � 𝑅𝑑,� � � = (� � � � × � 𝑦𝑡)/� � 0 (8-9)
� 𝐸𝑑,� � � ,� < � � ,𝑅𝑑,� � � (8-10)
where Atop is the cross-sectional area of the top chord member, and Nb,Rd,top is the design buckling
resistance of the top chord, calculated according to EN 1993-1-1.
The design force in the diagonals (NEd,diagonals,t and NEd,diagonals,c) can be derived from a simple static
analysis. Using Equations (8-11) and (8-12), the cross-sectional area of the diagonals Adiagonals can
be evaluated.
� 𝐸𝑑,� 𝑖𝑎 � � 𝑛𝑎𝑙𝑠,� ≤ � 𝑅𝑑,� 𝑖𝑎 � � 𝑛𝑎𝑙𝑠 = (� � 𝑖𝑎 � � � � 𝑙𝑠 × � 𝑦𝑡)/� � 0 (8-11)
� 𝐸𝑑,� 𝑖𝑎 � � 𝑛𝑎𝑙𝑠,� ≤ � � ,𝑅𝑑,� 𝑖𝑎 � � 𝑛𝑎𝑙𝑠 (8-12)
where Nb,Rd,diagonals is the buckling resistance of the diagonal members under compression, as defined
in EN 1993-1-1.
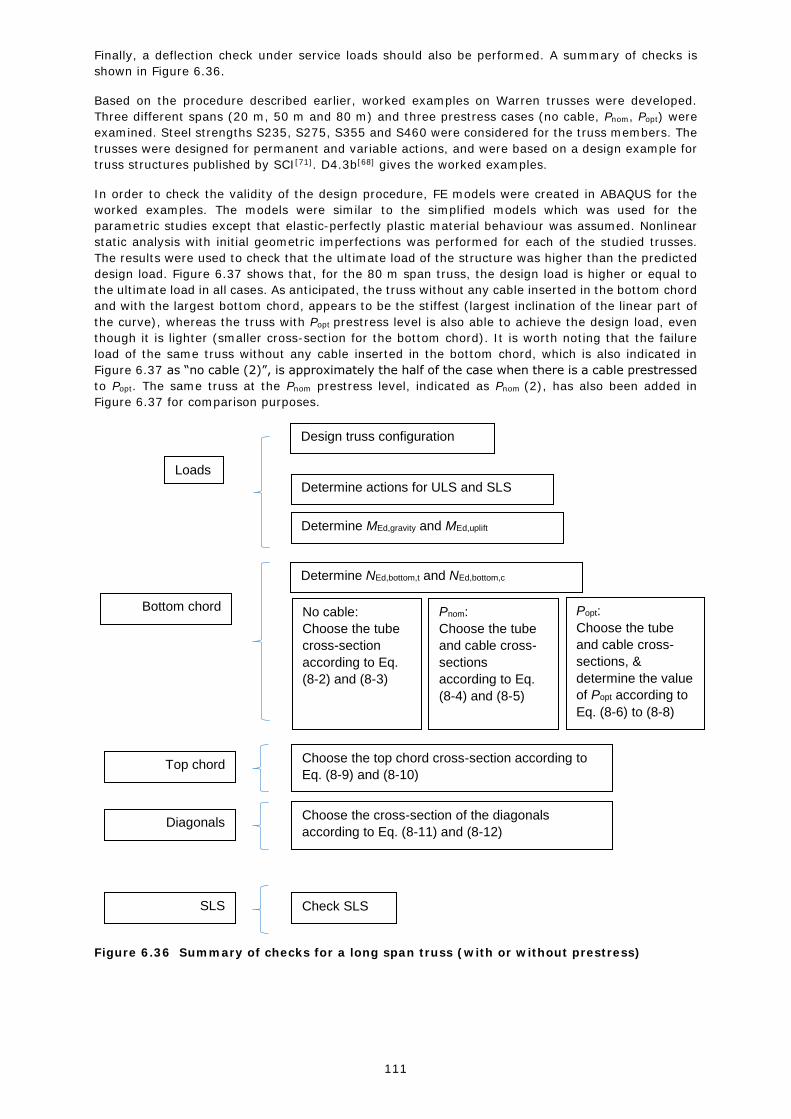
111
Finally, a deflection check under service loads should also be performed. A summary of checks is
shown in Figure 6.36.
Based on the procedure described earlier, worked examples on Warren trusses were developed.
Three different spans (20 m, 50 m and 80 m) and three prestress cases (no cable, Pnom, Popt) were
examined. Steel strengths S235, S275, S355 and S460 were considered for the truss members. The
trusses were designed for permanent and variable actions, and were based on a design example for
truss structures published by SCI[71]. D4.3b[68] gives the worked examples.
In order to check the validity of the design procedure, FE models were created in ABAQUS for the
worked examples. The models were similar to the simplified models which was used for the
parametric studies except that elastic-perfectly plastic material behaviour was assumed. Nonlinear
static analysis with initial geometric imperfections was performed for each of the studied trusses.
The results were used to check that the ultimate load of the structure was higher than the predicted
design load. Figure 6.37 shows that, for the 80 m span truss, the design load is higher or equal to
the ultimate load in all cases. As anticipated, the truss without any cable inserted in the bottom chord
and with the largest bottom chord, appears to be the stiffest (largest inclination of the linear part of
the curve), whereas the truss with Popt prestress level is also able to achieve the design load, even
though it is lighter (smaller cross-section for the bottom chord). It is worth noting that the failure
load of the same truss without any cable inserted in the bottom chord, which is also indicated in
Figure 6.37 as “no cable (2)”, is approximately the half of the case when there is a cable prestressed
to Popt. The same truss at the Pnom prestress level, indicated as Pnom (2), has also been added in
Figure 6.37 for comparison purposes.
Figure 6.36 Summary of checks for a long span truss (with or without prestress)
Design truss configuration
Determine actions for ULS and SLS
Determine MEd,gravity and MEd,uplift
Determine NEd,bottom,t and NEd,bottom,c
No cable:
Choose the tube
cross-section
according to Eq.
(8-2) and (8-3)
Pnom:
Choose the tube
and cable cross-
sections
according to Eq.
(8-4) and (8-5)
Popt:
Choose the tube
and cable cross-
sections, &
determine the value
of Popt according to
Eq. (8-6) to (8-8)
Choose the top chord cross-section according to
Eq. (8-9) and (8-10)
Choose the cross-section of the diagonals
according to Eq. (8-11) and (8-12)
Check SLS
Loads
Bottom chord
Top chord
Diagonals
SLS

112
Figure 6.37 Load - displacement curves of 80 m span truss
Figure 6.37 shows the benefits of the use of prestress. By comparing the load displacement response
of the no cable (2) truss with that of the Pnom (2) truss, it is clear that the insertion of a nominally
prestressed cable in the bottom chord of a truss increases significantly its ultimate resistance, albeit
attained at very large displacements. By introducing Popt prestress to the cable, the benefit in the
reduction of the displacements at failure load can be seen by comparing the Pnom (2) with the Popt
truss. It is worth noting that for the trusses studied, the introduction of Popt prestress reduces the
midspan deflection at ultimate load by about 50% on average, compared with when the cable is only
nominally prestressed. In addition, 10-15% material savings arise from the introduction of an
optimally prestressed cable compared to a conventionally designed truss without any cable in the
bottom chord.
As anticipated, the selection of truss members in higher strength steel leads to a reduced total truss
weight, as indicated for the 80 m span truss in Figure 6.38. When the strength changes from S235
to S460 there is a significant reduction in weight of about 35%. This means that important material
savings can be made from the use of HSS. However, the reduction in cross-section size means that
stiffness related issues such as excessive deflections are more pronounced and hence the benefits of
the increased material strength may not be fully exploited if SLS rather than ULS govern the design.
This issue can be addressed using the prestressing technology. In particular, the combination of HSS
with the prestressing system, which leads to significantly reduced displacements, may lead to a
smart, efficient and economic structural system.
Figure 6.38 Predicted truss weight for steel strengths S235 to S460
0.00
100.00
200.00
300.00
400.00
500.00
600.00
0.00 500.00 1000.00 1500.00 2000.00 2500.00 3000.00
Lo
ad
(kN
)
Displacement (mm)
span 80m, no cable
span 80m, design load
span 80m, Popt
span 80m, no cable (2)
span 80m, Pnom (2)
SLS limit (L/250)
0.00 5000.00 10000.00 15000.00 20000.00
S235
S275
S355
S460
Truss weight (kg)
span 80m_Popt
span 80m_no cable

113
7 WP5 EXPLOITATION OF RESEARCH RESULTS
7.1 Objectives of WP5
The objectives of this WP were to present the results of the project in a form that can be used by a wider audience. The key activities were:
Preparation of design examples which illustrated the benefits of using HSS in certain applications.
Contributions to future revisions to Eurocode 3.
A seminar, with presentations by researchers and practitioners.
Preparation of journal papers.
7.2 Task 5.1 Design examples
A collection of eight design examples was prepared for D5.1[72]. It is expected that they will be valuable educational tools showing the step-by-step design procedure for HSS members (beams and
columns) and joints. The examples comprise:
Example 1: Square hollow tension member (S460) welded to a connection plate (S355).
Example 2: As Example 1, except the tension member is S690 steel.
Example 3: Internal I shape column in a multi-storey building from S460 where the beam spans and loading about each axis are identical; there are no out-of-balance loads and so the column is subject to axial load only
Example 4: Top chord member in tubular truss, subject to a high compression force and external
loads
Example 5: Rectangular hollow section (S460) in compression demonstrating the Continuous Strength Method (CSM)
Example 6: Rectangular hollow section (S460) in bending demonstrating the CSM
Example 7: Square hollow section (S460) under combined loading demonstrating the CSM
Example 8: Crocodile Nose connection
Whilst the first four examples do not involve the technologies specifically studied in HILONG, they
nevertheless demonstrate the weight saving of using HSS. It should be noted that the limited range
of sections available in HSS compared to conventional strength steels can limit the weight savings
achievable. Also, for tension members, the design of the connection will often be governing, which
can again limit the achievable weight savings by using a higher strength member.
Design examples were also developed to demonstrate the new design methods developed for HSS
prestressed cable stayed columns and prestressed arches; these are presented in D4.3a[54] and
D.4.3b[68] respectively.
7.3 Task 5.2 Contributions to European Standardisation
The work completed in HILONG has been discussed at meetings of the Working Group (WG) for
EN 1993-1-12 over the last two years. The main contributions are summarised in D5.2[73].
The HILONG research has made a useful contribution to the understanding of HSS members,
connections and structural systems. In order to carry out Eurocode reliability analyses, material
strength data were collected from steel producers in Europe. Strength data were also extracted from
numerous mill certificates and research papers. This enabled a mean ratio of measured to minimum
specified strength, accompanied by standard deviations, to be derived for each strength grade of
steel.
Under WP2, EN 1993-1-1 and EN 1993-1-12 design rules were confirmed. Concerns were raised over
the level of reliability of the effective width formulation for Class 4 cross-sections. These results were
presented to the WG for EN 1993-1-12 and the relevant deliverables will be forwarded to the WG
once the final report is approved.
The design rules for tubular joints in EN 1993-1-8 are based on experimental and numerical
investigations using steel S235 and S355. The work carried out in WP3 has made a significant
contribution to the gap in knowledge of the behaviour of tubular joints in higher strength members.
Under WP3, the application of these design rules for tubular joints made from HSS was confirmed.

114
WP4 studied structural systems and developed design methods for PSSCs and prestressed trusses,
aligned where appropriate to the provisions in Eurocode 3.
7.4 Task 5.3 Public Seminar
7.4.1 Preparation for the seminar
A seminar was held on 30 June 2015 to disseminate the findings of the HILONG Project. A full account of the event is given in D5.3[74]. The venue was Imperial College London. This was an ideal location because it is located in central London with good public transport links. Also, holding the seminar at
Imperial College meant that a number of post-graduate students from Imperial College attended, in addition to construction practitioners. The workshop was publicised extensively by:
Emailing contacts on SCI’s and other HILONG partners’ contact databases.
Personal invitations.
Advertisements in The Structural Engineer and New Steel Construction journals (see Figure 7.1).
LinkedIn.
In order to attract delegates, Continuing Professional Development Certificates were available for
those requiring proof of attendance.
In total, 124 people registered, of which 20 were speakers or project partners. The delegates came
from a wide range of organisations:
Designers (this was the majority of delegates, e.g. Arup, WSP, Aecom, Flint & Neill, Waterman).
Steelwork manufacturers (e.g. Westok, Doshi).
Steel producers (Tata Steel, ArcelorMittal).
Contractors (e.g. Laing O’Rourke).
Local authorities (e.g. Southend-on-Sea).
Steelwork fabricators/contractors (e.g. Severfield, Billington Structures).
Universities (Derby, Brunel, RWTH in addition to the partner universities).
Ministry of Defence.
Norwegian Steel Association.
British Constructional Steelwork Association.
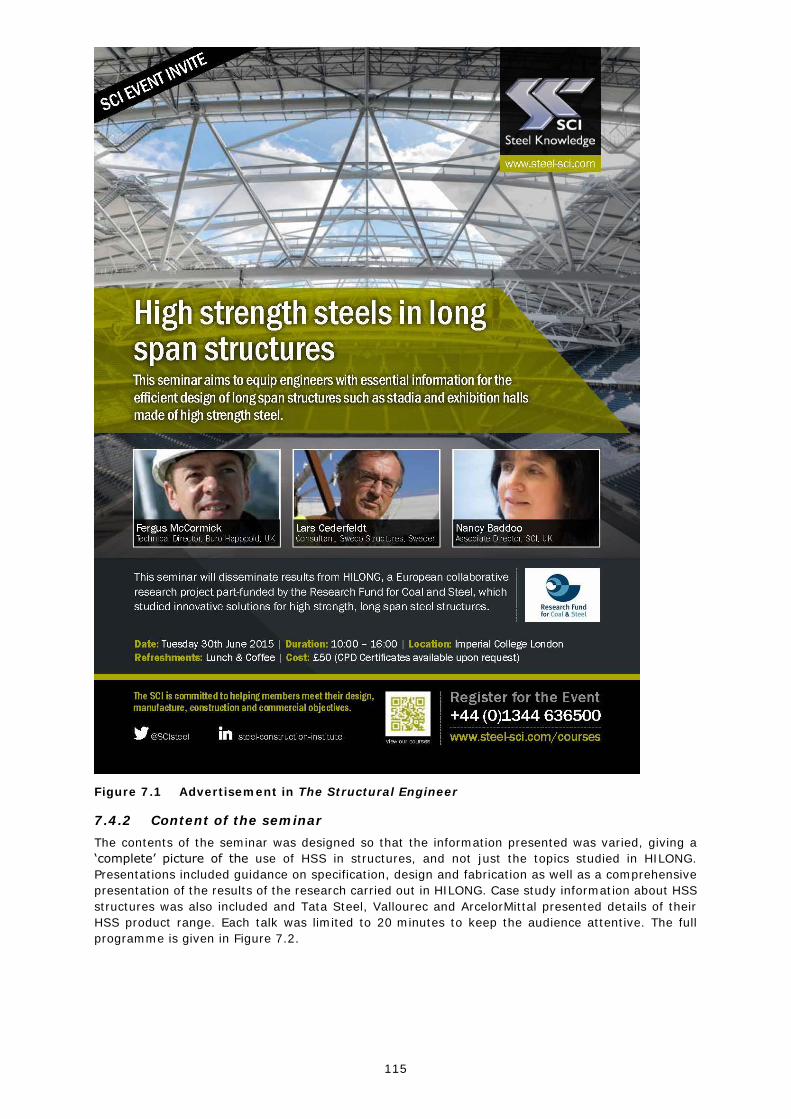
115
Figure 7.1 Advertisement in The Structural Engineer
7.4.2 Content of the seminar
The contents of the seminar was designed so that the information presented was varied, giving a
‘complete’ picture of the use of HSS in structures, and not just the topics studied in HILONG.
Presentations included guidance on specification, design and fabrication as well as a comprehensive
presentation of the results of the research carried out in HILONG. Case study information about HSS
structures was also included and Tata Steel, Vallourec and ArcelorMittal presented details of their
HSS product range. Each talk was limited to 20 minutes to keep the audience attentive. The full
programme is given in Figure 7.2.

116
Tuesday 30 June 2015
Room 201, Skempton Building,
Imperial College London
Registration from 09.30
10.00 Welcome Nancy Baddoo (SCI)
10.10 Recent experiences with long span
structures
Fergus McCormick
(Buro Happold)
10.30 Friends Arena and other recent projects
using HSSs (HSS)
Lars Cederfeldt (Sweco Structures AB,
Sweden)
10.50 Properties and specification of HSS Nancy Baddoo (SCI)
11.10 Vallourec hot formed hollow sections in
HSS
Christian Remde
(Vallourec, Germany)
11.20 Coffee Break
11.45 Designing HSS structures: Eurocode
rules and practical guidance
Prof. Leroy Gardner
(Imperial College London)
12.05 Fabrication of HSS Dan Hudson
(Severfield UK Ltd)
12.25 Design methods for HSS cross-sections Dr. Sheida Afshan
(Imperial College London)
12.40 ArcelorMittal HSS open sections –
product range and recent projects
Marc May (ArcelorMittal Europe,
Luxembourg)
12.55 Experiences of HSS structures in
Scandinavia
Prof. Milan Veljkovic (Luleå Univ. of
Technology, Sweden)
13.10 Lunch
14.10 Utilisation of HSS in tubular trusses Dr. Kristo Mela (Tampere Univ. of
Technology)
14.25 Innovative structural systems for HSS:
Prestressed stayed columns
Prof. Luís Simões da Silva (Univ. of
Coimbra, Portugal) 14.45 Innovative structural systems for HSS:
Prestressed trusses
Dr. Marios Theofanous (University of
Birmingham)
15.05 Tata Steel HSS tubes Dave Chapman
(Tata Steel Tubes)
15.15 Innovative cross-sections and
connections in HSS
Prof. Milan Veljkovic (Luleå Univ. of
Technology, Sweden)
15.35 Discussion, access to further resources
and closing remarks
Nancy Baddoo (SCI)
Figure 7.2 Workshop programme
7.4.3 Feedback from delegates and follow-up activities
The seminar was well received by students and practitioners alike. There was a lively question time
after many of the presentations. Examples of the feedback received by email were:
‘I attended the HILONG seminar at Imperial College last week (which I thought was excellent).’
‘Yesterday myself and two others from Reids attended the SCI high strength steels in long span
structures talk. The talk was excellent with a lot of very interesting speakers. So thanks to yourself
and everyone else involved in organising it!’
The presentations given can each be downloaded from the SCI News site http://news-sci.com/high-
strength-steels-in-long-span-structures-30th-june-2015/, which extends the impact and reach of the
seminar to a much larger audience.
7.5 Publications arising from work carried out in HILONG
The following papers have been prepared in relation to HILONG:
117
Journal Papers
Serra, M., Shahbazian A., Silva L. S., Marques L., Rebelo C., Vellasco P. C. G. S. (2015), A full scale
experimental study of prestressed stayed columns. Engineering Structures 100, pp 490-510.
Martins, J.P., Shahbazian, A., Simões da Silva, L., Rebelo, C., Simões, R., Structural behaviour of
prestressed stayed columns with single and double cross-arms using normal and high strength steel,
Archives of Civil and Mechanical Engineering, (submitted).
Wang, J., Afshan, S., Gkantou, M., Theofanous, M., Baniotopoulos, C. and Gardner, L., (2016)
Flexural behaviour of hot-finished high strength steel square and rectangular hollow sections. Journal
of Constructional Steel Research, 121, pp.97-109.
Gkantou, M., Wang, J., Theofanous, M., Gardner, L. and Baniotopoulos, C. Structural behaviour of
high strength steel hollow sections under compression and uniaxial bending. Proceedings of the
Institution of Civil Engineers (abstract accepted)
Gkantou, M., Theofanous, M. Antoniou, A. and Baniotopoulos, C. Numerical investigation of High
Strength Steel (HSS) square and rectangular hollow section stub columns. Proceedings of the
Institution of Civil Engineers (abstract accepted)
Conference Papers
Manoleas, P., Koltsakis, E., Veljkovic, M., Cederfeldt, L., The crocodile nose connection: An
Aesthetically Appealing Joint for CHS, in Landolfo, R. and Mazzolani, F. (eds.), Eurosteel 2014 – 7th
European Conference on Steel and Composite Structures, Naples, Italy, 8-10 September 2014,
(2014)
Serra, M., Silva, L., Marques, L., Alves, L., Prestressed Stayed Columns: Compressive Strength and
Behaviour, in Landolfo, R. and Mazzolani, F. (eds.), Eurosteel 2014 – 7th European Conference on
Steel and Composite Structures, Naples, Italy, 8-10 September 2014, (2014)
Schillo, N., Theofanous, M., Gardner, L., Feldmann, M., Material properties and local buckling
behaviour of high strength steel hollow sections, in Landolfo, R. and Mazzolani, F. (eds.), Eurosteel
2014 – 7th European Conference on Steel and Composite Structures, Naples, Italy, 8-10 September
2014, (2014)
Serra, M., Simões da Silva L., Marques, L. and Alves, L., “Prestressed stayed columns - Compressive
strength and behaviour of”, in Landolfo, R. and Mazzolani, F. (eds.), Eurosteel 2014 – 7th European
Conference on Steel and Composite Structures, Naples, Italy, 8-10 September 2014, (2014)
Gkantou, M., Theofanous, M. and Baniotopoulos, C., 2015. Optimisation of High Strength Steel
Trusses. Proceedings of the 8th GRACM International Congress on Computational Mechanics, Volos,
Greece.
Gkantou, M., Theofanous, M. and Baniotopoulos, C., 2016. On the structural response of High
Strength Steel prestressed trusses. A numerical approach. Proceedings of the 11st HSTAM
International Congress on Mechanics, Athens, Greece. (Abstract submitted)
Antoniou, N., Theofanous, M., Baniotopoulos, C., Gardner, L., Numerical investigation of high
strength steel tubular members, CESARE’14 International Conference Civil Engineering for
Sustainability and Resilience, 2014
Breda, R., Martins, J.P., Shahbazian, A., Simões da Silva, L., (2015), Estudo experimental do
comportamento de colunas pré-esforçadas de elevada esbelteza. Atas do X Congresso de Construção
Metálica e Mista, pp. 565 574 (II), Coimbra.
MSc Dissertations
Silva, Paulo (2015), “Controlo da Pré Tensão em cabos usando análise modal”, Tese de Mestrado em
Engenharia Civil, Especialidade de Mecânica Estrutural, Universidade de Coimbra
MEng research project 2013/14, Elias Baramilis, Numerical modelling of high strength steel stub
columns
MSc Civil Engineering 2013/14, Nicola Wall, Design of a High Strength Steel (HSS) Industrial Building
MSc Civil Engineering and Management 2013/14, Sasidharan Manu Plavinkoottathil, Structural
Design of an Arena by using High Strength Steel

118
119
8 EXPLOITATION AND IMPACT OF RESEARCH
Despite steels of higher strength than S355 being available for many years, the market share is still
surprisingly low in the main construction segments. One of the main obstacles to the use of HSS is
that many structural elements are governed by stiffness considerations rather than strength, hence
buckling or deflection criteria prevent the benefits of using HSS from being fully exploited.
Additionally, the design rules for HSS are unnecessarily conservative and based on few test data,
thus preventing efficient design in many circumstances. Further obstacles to the wider use of HSS
include the higher price/tonne, inexperience in fabrication, limited sources of supply, fewer section
sizes available, and a general reluctance to change within the notoriously conservative construction
industry.
Most designers know little about higher strength steels: there is a widespread lack of knowledge
about the properties of modern higher strength steels and about recent projects in which they have
been used. Replicating a design in S355 steel will not always lead to an optimum design in S460,
and rarely in higher strength steels. For the higher strength steels, the use of ‘traditional’ structural
sections like hollow rectangular and square sections, and open I sections will not allow the higher
strength to be exploited since local buckling will govern design. It is not always easy or obvious how
to design structures using higher strength steels in such a way as to achieve maximum cost savings.
It not only involves designing to optimise the amount of strength which can be exploited, but also
requires minimising fabrication costs, ensuring stability during erection, and being aware of
differences in sections/plates availability, (slightly) different welding procedures, etc.
The HILONG project has sought to overcome some of the obstacles relating to design limitations due
to buckling and deflections by studying innovative structural arrangements and cross-sections which
suppress buckling and reduce deflection. Once construction practitioners are able to design more
efficient HSS structures, demand will grow and the procurement obstacles are likely to reduce in
response.
The work completed in WP2 adds to the body of data on HSS cross-sections and will contribute to
the next revision of Eurocode 3 with respect to the rules on ductility requirements, section
classification, effective width formulae and axial load and bending moment interaction. The database
of material strength properties collected for the reliability analysis will also be useful in the future for
reliability assessments for HSS design rules, and has already been shared with HILONG’s sister RFCS
project RUOSTE.
The work completed in WP3 sets the foundation for promoting the use of innovative cross-sections
in HSS rather than just continuing to use the standard rectangular and circular hollow and I-sections
designers are familiar with. This is significant because polygonal cross-sections are not only less
susceptible to local buckling but also enable joints to be made more easily. They also give freedom
to optimise the cross-section (external dimension, thickness) and ability to fabricate the cross-section
wherever a press-braking facility is available, with plates delivered in sizes required for optimal
fabrication. The tests on the HSS trusses are valuable since there are very few data on the
performance of any types of HSS joints. The work on the CN connection will be very useful for trusses
made from conventional as well as high strength steel members.
WP4 studied the application of prestressing technologies to HSS columns and trusses, although the
outcomes of the work are also valuable to any strength steel and will help to promote the use of
prestressing in general. Prestressing can significantly increase the load-carrying resistance of a truss
or column without increasing its structural weight. Prestressing a truss can help to overcome potential
deflection limit issues which enables design criteria to be met using smaller span-to-depth ratios,
hence reducing the length and cross-section dimensions of the truss diagonals and resulting in lighter
and more elegant structures, thus pushing further the limits of modern structural design practice.
The results of the HILONG project have shown there is much potential for designing more efficient
higher strength steel structures and the potential scope of application of the results of this project
are far reaching. Further dissemination activities are required to enable designers to make use of the
recommendations and techniques arising from the HILONG research.

120
121
9 LIST OF FIGURES
Figure 3.1 Photos of the Friends Arena and visualisation of end connection 17
Figure 3.2 Main truss (with rails and walkways) 18
Figure 3.3 Main truss components: end diagonals (left) and bottom chord (right) 18
Figure 3.4 Cable positioning along the bottom chord of Friends Arena main truss 18
Figure 3.5 Case Study 1 – final weight of truss 19
Figure 3.6 Case Study 1 – vertical truss displacement 20
Figure 3.7 Case Study 1 – final weight of truss - effect of snow load and cable position on the benefit of prestress 21
Figure 3.8 Main truss section with closed polygonal solution in the top chords 21
Figure 3.9 (a) Closed polygonal cross-section and (b) Crocodile nose connection 22
Figure 3.10 Case Study 1 – final weight of truss using tubular and polygonal chords 22
Figure 3.11 Case Study 1 – maximum displacements of truss using tubular and polygonal chords 22
Figure 3.12 Triangular main truss configuration (left: case a and g to i) and new truss configuration with two bottom chords (right: cases k to m) 23
Figure 3.13 Manchester City Stadium, UK 24
Figure 3.14 Left: Tapered (case 2.a), Right: 3-point cross-arm PSSC (case 2.e) 24
Figure 3.15 Case Study 2 – load vs. axial displacement 25
Figure 3.16 Case Study 2 – final corrected weights 25
Figure 3.17 Case Study 2 – Weight of the mast and weight reductions compared to base case 2.a 26
Figure 3.18 Cost estimate of the as-built (case a) and re-designed truss configurations (cases 1.g to 1.m) 27
Figure 3.19 Scope of a LCEA 27
Figure 3.20 Modules of the life cycle of a building[17] 28
Figure 3.21 Results of the LCEA for scenario 1: (a) Global Warming Potential; (b) Eutrophication; (c) Acidification and (d) Primary Energy Demand 30
Figure 3.22 Results of the LCEA for scenario 2: (a) Global Warming Potential; (b) Eutrophication;
(c) Acidification and (d) Primary Energy Demand 30
Figure 3.23 Results of the LCEA for scenario 3: (a) Global Warming Potential; (b) Eutrophication; (c) Acidification and (d) Primary Energy Demand 31
Figure 3.24 Effect of the strength of the core column on the ultimate resistance 32
Figure 3.25 Material and cost comparison for column C07: tested solution vs. equivalent S355 unstayed column 32
Figure 4.1 Stub column failure modes 36
Figure 4.2 Full section in tension test failure modes 36
Figure 4.3 Eccentric stub column buckling modes 37
Figure 4.4 Typical three-point bending failure mode (S460 SHS 100x50x4.5) 37
Figure 4.5 Typical four-point bending failure mode (S690 SHS 90×90×5.6) 37
Figure 4.6 Experimental versus numerical behaviour for S460 beam (SHS 50x50x4) 39
Figure 4.7 Experimental versus numerical behaviour for S690 concentric stub column (SHS
90x90x5.6) 39
Figure 4.8 Experimental versus numerical behaviour for S690 eccentric stub column (SHS 50x50x5) 40
Figure 4.9 Numerically predicted failure modes 41
Figure 4.10 Beam results (normalised ultimate moment – slenderness, S460) 42
Figure 4.11 Concentric stub column results (normalised ultimate load – slenderness) 42
Figure 4.12 Eccentric stub column results for Classes 1 & 2 (SHS, S460 &S690) 43
Figure 4.13 Eccentric stub column results for Class 3 (SHS, S460 &S690) 43
Figure 4.14 Eccentric stub column results for Class 4 (SHS, S460 &S690) 44
Figure 4.15 Assessment of the fu/fy ductility limits in Eurocode 3 45
Figure 4.16 Assessment of the εf ductility limits in Eurocode 3 45
Figure 4.17 Assessment of the εu/εy ductility limits in Eurocode 3 46
Figure 4.18 Assessment of Class 1 slenderness limit for internal elements in compression 47
Figure 4.19 Assessment of Class 2 slenderness limit for internal elements in compression (beam
tests) 47
Figure 4.20 Assessment of Class 3 slenderness limit for internal elements in compression (beam tests) 47
Figure 4.21 Assessment of Class 3 slenderness limit for internal elements in compression (stub column tests) 48
Figure 4.22 Assessment of Eurocode effective width equation for internal elements in
compression 48
Figure 4.23 Assessment of Class 1 and 2 interaction curve for SHS and RHS 49
Figure 4.24 Assessment of Class 3 interaction 50
Figure 4.25 Assessment of Class 4 interaction curve for SHS and RHS 51
Figure 4.26 CSM elastic, linear hardening material model for hot-finished material 52
Figure 5.1 The evolution of the crocodile nose connection 56
122
Figure 5.2 Parts of the crocodile nose connection 56
Figure 5.3 Assembled CN strength test specimen with attachment parts 57
Figure 5.4 Assembled CN long-term specimen 57
Figure 5.5 Strength test specimens 57
Figure 5.6 Load - displacement curves of the CN specimens 59
Figure 5.7 Failure of the four CN connections 59
Figure 5.8 Full setup during the load application in long term test 60
Figure 5.9 Relaxation of the bolts in CN1 and CN3 during load application 61
Figure 5.10 Long-term relaxation plotted on logarithmic scale with the fitted curves 61
Figure 5.11 Nonlinear FE model of the crocodile nose connection 62
Figure 5.12 Strain gauge positions on test specimen of CN connection 63
Figure 5.13 Comparison of elastic measurements in the test against FE predictions (specimen CN3) 64
Figure 5.14 Validation of the CN model against all four tests 64
Figure 5.15 Comparison of failure modes obtained from FE and those observed in tests 65
Figure 5.16 Results of parametric study of CN connection 67
Figure 5.17 Basic members of the trusses 69
Figure 5.18 Consecutive joints to be tested and forces acting during the first test 70
Figure 5.19 Compression chord joint detail; (a) rib plates; (b) tie gusset; (c) main gusset 71
Figure 5.20 Tension chord detail of the innovative truss and test matrix 72
Figure 5.21 Instrumented joint in tubular truss 72
Figure 5.22 Innovative truss in place for testing 73
Figure 5.23 Joint failure in the tests on the innovative truss 73
Figure 5.24 Load-displacement curves for joints 1 (left) and 2 (right) (no stiffener) 74
Figure 5.25 Load-displacement curves of joints 3 (left) and 4 (right) (with stiffener) 74
Figure 5.26 Load-displacement curves for the two joints tested in the tubular truss 75
Figure 5.27 Tension diagonal to tension chord weld failure (first joint test) 75
Figure 5.28 Tension diagonal to compression chord weld failure (second joint test) 76
Figure 6.1 Cable cross section 77
Figure 6.2 Longitudinal view of a test specimen with a single bracing point 78
Figure 6.3 Longitudinal view of a test specimen with a double bracing point 78
Figure 6.4 Cross section at the centre of the column 78
Figure 6.5 PSSC test for column C05 80
Figure 6.6 Test set-up showing hydraulic jack and load cell 81
Figure 6.7 Measurement of initial imperfections 81
Figure 6.8 Measured geometric imperfections for all tests for column C08 82
Figure 6.9 Force versus lateral displacement at mid span for unstayed columns 82
Figure 6.10 Force versus lateral displacement and end shortening for C10 stayed column (18 m length, S690) 83
Figure 6.11 Ultimate load vs initial pretension load for 12 m stayed columns 84
Figure 6.12 Ultimate load vs initial pretension load for 18 m stayed columns 85
Figure 6.13 Load-displacement (mid span deflection): C04-C1 (Tini = 2 kN) 88
Figure 6.14 Load-displacement (mid span deflection): C04-C1 (Tini = 14 kN) 88
Figure 6.15 Model and free body diagram for Mode I buckling [51] 90
Figure 6.16 Behavioural zones for ultimate resistance according to [52] 91
Figure 6.17 Flowchart of the proposed design method for PSSCs 91
Figure 6.18 Elastic critical load versus pretension in the cables 92
Figure 6.19 Comparison of predictions using the new method (left) and Wadee’s method [53] (right) against test results 93
Figure 6.20 Natural vibration modes of stay cable and position of accelerometer 94
Figure 6.21 Vibration modes for column C07, 10 mm diameter stay 95
Figure 6.22 Modal analysis of FE model of column C07 96
Figure 6.23 Typical cable-in-tube specimen configuration 98
Figure 6.24 Components of the adopted anchoring system 98
Figure 6.25 Comparison of the axial load-displacement responses of the S460 and S690 tensile specimens 99
Figure 6.26 Load versus lateral displacement responses of the S460 and S690 compressive
specimens 100
Figure 6.27 Schematic drawing of the arched truss specimens 101
Figure 6.28 Truss test rig set-up 102
Figure 6.29 Load versus vertical displacement curves of the four tested trusses 102
Figure 6.30 In-plane failure mode observed in Truss 1, Truss 2 and Truss 4 tests 103
Figure 6.31 Out-of-plane failure mode observed in Truss 3 test 103
Figure 6.32 FE model of the connection of the bottom chord (left) and the deformed shape of the
connection - gap opening (right) 105
Figure 6.33 Elastic buckling modes: out-of-plane buckling (left) & in-plane buckling (right); model S 106
Figure 6.34 Validation of the truss models against test results 107
Figure 6.35 Truss 2: In plane buckling (top), Truss 3&4: Out-of-plane buckling (bottom) 108

123
Figure 6.36 Summary of checks for a long span truss (with or without prestress) 111
Figure 6.37 Load - displacement curves of 80 m span truss 112
Figure 6.38 Predicted truss weight for steel strengths S235 to S460 112
Figure 7.1 Advertisement in The Structural Engineer 115
Figure 7.2 Workshop programme 116

124

125
10 LIST OF TABLES
Table 2.1 European material specifications for steel 13
Table 3.1 HILONG Workshop Agenda (4 September 2012, Stockholm) 16
Table 3.2 Cost estimate for each type of material 26
Table 3.3 Weight of steel (in tonnes) used in each solution 29
Table 4.1 Testing programme for D2.1 35
Table 4.2 Comparison of FE against test results for imperfection magnitude t/50 40
Table 4.3 CSM coefficients α and β for bending 53
Table 5.1 Re-organisation of activities in WP3 55
Table 5.2 Coefficients of linear regression analysis of bolt pretension relaxation 62
Table 5.3 Comparison of ultimate load capacities (experimental vs numerical) 65
Table 5.4 Scope of parametric study 66
Table 5.5 Ultimate resistance and failure displacement predictions in parametric study 68
Table 5.6 Octagonal cross-section geometry and properties 71
Table 6.1 PSSC test programme 79
Table 6.2 Comparison of the tests results for the stayed and unstayed columns 86
Table 6.3 Selected results of numerical modelling of PSSC tests 89
Table 6.4 Stay tension obtained from measured natural frequencies 94
Table 6.5 Eigenfrequencies of calibrated models compared to measurements for columns with one set of cross-arms 96
Table 6.6 Summary of the prestressed cable-in-tube test specimens 97
Table 6.7 Measured natural frequencies of the truss specimens 104

126

127
11 LIST OF ACRONYMS AND ABBREVIATIONS
Acronym Abbreviation
CHS Circular hollow section
CN Crocodile Nose
FE Finite element
GUR Global Utilisation Ratio
HSS High strength steel
LCEA Life Cycle Environmental Analysis
PSSC Prestressed stayed column
RHS Rectangular hollow section
RUOSTE Rules for High Strength Steels (‘Sister’ RFCS research project to HILONG)
SHS Square hollow section

128
129
12 REFERENCES
1 EN 1993-1-1, Eurocode 3: Design of Steel Structures - Part 1-1: General rules and rules for
buildings. CEN, 2005
2 EN 1993-1-12, Eurocode 3: Design of Steel Structures- Part 1-12: Additional rules for the extension of EN 1993 up to steel grades S 700. CEN, 2007.
3 Griffis, L., et al. 2003. Comprehensive Design and A913 Grade 65 Steel Shapes: The High-
strength Steel in the Long-Span Retractable Roof of Reliant Stadium. In: North American
Steel Construction Conference (NASCC), Baltimore, Maryland, U.S.A 2-5 AISC, 2003.
4 Willms, R.. High strength steel for steel constructions. Proceedings of the Nordic Steel Construction Conference, 2009
5 Cederfeldt, J. and Sperle, J.-O., High strength steel in the roof of Swedbank Arena: Savings in weight, cost and environmental impact, Nordic Steel Construction Conference, Oslo,
Norway, September 2012
6 Belenya, E. Prestressed Load-Bearing Metal Structures, Moscow: MIR Publishers, 1977
7 Troitsy, M.S., Prestressed Steel Bridges, New York: van Nostrand Reinhold, 1990.
8 The BRITE project, Post-Tensioned Steel Trusses for Long Span Roofs, Innovation Case Study No. 9, CRC Construction Innovation, Australia, 2006 (http://eprints.qut.edu.au/27130/1/27130.pdf)
9 Ellen, M., The design, behaviour and construction of long span post-tensioned steel
structures. Proceedings of the 9th Pacific Structural Steel Conference, Beijing, China, 2010
10 HILONG D1.1: Veljkovic, M. & Cederfeldt, L., WP1: Report of HILONG Workshop, 2012
11 HILONG D1.2.1: Serra, M, WP1: Design of two case studies in conventional steel, 2013
12 HILONG D1.2.2: Breda, R., Martins, J.P. & da Silva, L.S., WP1: Re-design of case studies in HSS, 2015
13 Mäkelä, J., Environmental and cost implications of using high strength steel in the roof of the National Arena. KTH School of Architecture, Sweden, 2012
14 HILONG D1.4: Breda, R., Martins, J.P., Gervasio, H. & da Silva, L.S., WP1: Environmental and financial impact evaluation of case studies, 2015
15 ISO 14040: Environmental management – life cycle assessment – Principles and framework, ISO 2006
16 ISO 14044: Environmental management – life cycle assessment – Requirements and guidelines, ISO, 2006
17 EN 15978: Sustainability of Construction Works — Assessment of environmental performance of buildings — Calculation method. CEN, 2011
18 Worldsteel organisation. http://www.worldsteel.org/index.php
19 Stroetmann, R., HSS for improvement of sustainability. Eurosteel 2011.
20 IPCC, Fourth Assessment Report – Climate Change 2007. IPCC. Geneva, Switzerland, 2007
21 CML Handbook on life cycle assessment; Operational Guide to the ISO standards. Jeroen B. Guinée (Ed.) Kluwer Academic Publishers, 2002
22 Huijbregts. M., Uncertainty and variability in environmental life-cycle assessment. PhD. Thesis. University of Amsterdam. The Netherlands, 2001
23 Guinée, J. and Heijungs, R., A proposal for the definition of resource equivalency factors for use in product life-cycle assessment. Environmental toxicology and chemistry 14 (5). pp. 917-925, 1995
24 Mela K., Heinisuo M., Weight and cost optimisation of welded high strength steel beams, Engineering Structures 79 (2014) 354-64
25 HILONG D1.5: McCormick, F., WP1: Survey of fabricators’ experiences using HSS, 2015
26 EN ISO 3834: Quality requirements for fusion welding of metallic materials, CEN
27 EN 1011: Welding. Recommendations for welding of metallic materials, CEN, 2009
28 HILONG D2.1: Afshan, S., Gardner, L., Wang, J. and Wadee, A.. WP2: Report on laboratory tests on HSS members, 2014
130
29 EN ISO 6892-1: Metallic materials - Tensile testing - Part 1: Method of test at room temperature, CEN, 2009
30 HILONG D2.2: Gkantou, M., Antoniou, N. and Baniotopoulos, C., WP2: Report on numerical modelling of HSS members (material, stub columns and beams), 2014
31 Hibbitt, Karlsson, Sorensen Inc. ABAQUS. ABAQUS/Standard user's manual volumes I–III and ABAQUS CAE manual. Version 6.10. USA: Pawtucket; 2010
32 Dawson R.G., Walker A.C., Post-buckling of geometrically imperfect plates. Journal of the Structural Division, ASCE 98(ST1):75-94, 1972
33 Gardner L., Saari N., Wang F. Comparative experimental study of hot-rolled and cold-formed
rectangular hollow sections. Thin-Walled Structures; 48:495-507, 2010
34 HILONG D2.3: Afshan, S., Gardner, L., Wang, J. and Wadee, A. WP2: Design guidance and reliability of HSS members, 2016
35 EN 1990 Eurocode: Basis of Structural design. CEN, 2002
36 EN 1993-1-5, Eurocode 3: Design of Steel Structures – Part 1-5: Plated structural elements.
CEN, 2006
37 HILONG D3.1.1 and 3.1.2: Manoleas, P., Aggelopoulos, E., Chen, A. WP3: Crocodile nose
joints in HSS trusses: Tests, numerical analysis and design guidance, 2016
38 HILONG D3.2.1: Herion, S & Fleischer, O, WP3: Design of a 3D girder made of CHS for experimental investigations, 2015
39 HILONG D3.2.2 and D3.2.3: WP3: Manoleas, P. and Koltsakis, E., WP3: Joints in HSS tubular and innovative trusses: Tests and analysis, 2016
40 EN 1090-2. Execution of steel structures and aluminium structures - Part 2: Technical
requirements for steel structures. CEN, 2008
41 EN-1993-1-8. Design of steel structures, Part 1-8: Design of joints, CEN, 2006
42 EN-1993-1-3. Design of steel structures, Part 1-3: General rules. Supplementary rules for cold-formed members and sheeting, CEN, 2006
43 Wardenier J., Kurobane Y., J.A. Packer, G.J. van der Vegte, and X. -L. Zhao, Design guide for circular hollow section (CHS) joint under predominantly static loading, 2nd ed., vol. 1. CIDECT, 2008.
44 J. Wardenier, JA Packer, XL Zhao, and GJ Van der Vegte, Hollow sections in structuralapplications. CIDECT Zoetermeer, Netherlands, 2000.
45 HILONG D4.1.1: Breda, R., Martins, J.P. & da Silva, L.S., WP4: Tests on HSS prestressed stayed columns, 2016
46 EN ISO 6892-1: Metallic materials. Tensile testing. Method of test at ambient temperature, CEN, 2009
47 EN ISO 377: Steel and steel products. Location and preparation of samples and test pieces
for mechanical testing, CEN, 2013
48 EN 10218-1: Steel wire and wire products. General. Test methods, CEN, 2012
49 EN 10002-1: Tensile testing of metallic materials. Method of test at ambient temperature, CEN, 2001
50 HILONG D4.1.2: Martins, J.P., Breda, R. & da Silva, L.S. WP4: Numerical analysis of HSS prestressed stayed columns, 2016
51 Smith, R.J., Ellis, J.S., McCaffrey, G.T., Buckling of a single-crossarm stayed column, Journal of the Structural Division, 101, 249-268, 1975
52 Hafez, H.H., Ellis, J.S., Temple, M.C., Pretensioning of single-cross arm stayed columns journal of the structural division, 105, 359-375, 1979
53 Wadee, M.A., Gardner, L., Osofero, A.I., Design of prestressed stayed columns, Journal of Constructional Steel Research, 80, 287-298, 2013
54 HILONG D4.3a: Tankova, T., Martins, J.P., da Silva, L.S., WP4: Report on Design Guidance of
Pre-stressed Stayed Columns, 2016
55 HILONG D4.2.5a: Silva, P., Serra, C.M., Martins, J.P. & Rebelo, C., WP4: Vibrations considerations and modal identification of pre-stressed cable stayed columns, 2016
56 Clarke, M.J. and Hancock, G.J., Finite-element nonlinear analysis of stressed-arch frames, Journal of structural engineering, Vol. 117 (4), pp. 2819–2837, 1991
131
57 Clarke, M.J. and Hancock, G.J., Tests and nonlinear analyses of small-scale stressed-arch
frames, Journal of structural engineering, Vol. 121, pp. 187-200, 1995
58 Creators of super powerful structures. Available from www.s-squared.com.au [2 February 2016]
59 Ellen M., Gosaye, J., Gardner, L., Wadee, A., Design and construction of long span post-tensioned tubular steel structures. Proceedings of the 14th international symposium and IIW international conference on tubular structures (ISTS 14), London, UK, 2012
60 HILONG D4.2.1: Gardner, L., Afshan, S., Wang, J. & Wadee, A., WP4: Report on tests on individual truss members in prestressed trusses, 2016
61 Gosaye J., Gardner L., Wadee M. A., and Ellen M. E., Tensile performance of prestressed steel elements. Engineering Structures, 79:234–243, 2014
62 HILONG D4.2.2: Gardner, L., Afshan, S., Wang, J. & Wadee, A., WP4: Report on tests on pre-stressed trusses, 2016
63 HILONG D4.2.4: Gkantou, M., Theofanous, M. & Baniotopoulos, C., WP4: Report on
numerical analysis of post-tensioned trusses and vibration considerations, 2016
64 Wang, J., Afshan S., Gkantou, M., Theofanous, M., Baniotopoulos, C., and Gardner L.,
Flexural behaviour of hot-finished high strength steel square and rectangular hollow section, Journal of Constructional Steel Research, Vol 121, pp. 97-109, 2016
65 Riks, E., An incremental approach to the solution of snapping and buckling problems, International Journal of Solids and Structures, Vol. 15 (7), pp. 529-55, 1978
66 Spencer Jr, B. F. & Nagarajaiah, S., State of the art of structural control. Journal of structural engineering, 129(7), 845-856, 2003
67 Saaed, T. E., Nikolakopoulos, G., Jonasson, J. E., & Hedlund, H., A state-of-the-art review of structural control systems. Journal of Vibration and Control, 21(5), 919-937, 2015.
68 HILONG D4.3b: WP4: Gkantou, M., Theofanous, M., Baniotopoulos, L., Gardner, L., Afshan, S., Wang, J., Wadee, A., Design guidance for prestressed trusses, 2016
69 Gosaye, J., Gardner, L., Wadee, A. and Ellen, M., Compressive behaviour and design of pre-stressed steel elements, Structures, Vol. 5, pp. 76-87, 2016
70 Wang, J., Afshan, S. and Gardner, L., Axial behaviour of prestressed high strength steel
tubular members, Proceedings of the international colloquium on stability and ductility of steel structures – SDSS 2016.
71 Brettle, M.E. and Brown, D.G. Steel Building Design: Worked examples for students, In accordance with Eurocodes and the UK National Annexes, Steel Construction Institute, UK, 2009
72 HILONG D5.1: Baddoo, N., WP5: HSS worked examples, March 2016
73 HILONG D5.2: Baddoo, N., WP5: Contributions to European standardisation, July 2015
74 HILONG D5.3: Baddoo, N., WP5: Report of final HILONG seminar, July 2015

HOW TO OBTAIN EU PUBLICATIONS
Free publications:
• one copy: via EU Bookshop (http://bookshop.europa.eu);
• more than one copy or posters/maps: from the European Union’s representations (http://ec.europa.eu/represent_en.htm); from the delegations in non-EU countries (http://eeas.europa.eu/delegations/index_en.htm); by contacting the Europe Direct service (http://europa.eu/europedirect/index_en.htm) or calling 00 800 6 7 8 9 10 11 (freephone number from anywhere in the EU) (*). (*) The information given is free, as are most calls (though some operators, phone boxes or hotels may charge you).
Priced publications:
• via EU Bookshop (http://bookshop.europa.eu).

HILONG investigated innovative cross-sections and structural arrangements which enable the benefit of high strength to be maximised by suppressing buckling and reducing deflection. The study focussed on long span applications, such as trusses for stadia, exhibition halls etc. The strengths studied were between S460 and S690.
Tests and numerical studies on stub columns, beams and beam-columns confirmed current guidelines in Eurocode 3 and also led to the development of a less conservative deformation-based design method.
The performance of different types of joints in two HSS trusses was investigated. One truss comprised conventional tubular sections and the other a U-shaped bottom chord and semi-closed polygonal top chords; these innovative cross-sections facilitate easier fabrication of the joints compared to conventional tubular joints. Tests were also carried out on a crocodile nose connection, which is a novel type of connection suitable for joining tubular diagonal members to a gusset plate.
The performance of prestressed stayed columns and prestressed trusses was studied experimentally and numerically to assess the extent to which they enable a greater proportion of the higher strength to be utilised by suppressing buckling and limiting deflection. Vibration tests explored the dynamic response of these prestressed systems.
Two case studies (a long span roof truss and a prestressed cable stayed column) demonstrated the potential for savings in weight, cost and environmental impacts through the use of HSS and the technologies studied in HILONG. The studies clearly demonstrated the potential advantages of HSS structural systems, but careful design is required to maximise these advantages.
EUR 28450
High Strength Long Span Structures (HILON
G)EU
ISBN 978-92-79-65601-9
doi:10.2777/904237
KI-NA-28-450-EN
-N