Grade Span Configuration and Academic Performance for ...
14
School Leadership Review School Leadership Review Volume 12 Issue 2 Article 8 2017 Grade Span Configuration and Academic Performance for Grade Span Configuration and Academic Performance for Students in Poverty: A Texas Multiyear Analysis Students in Poverty: A Texas Multiyear Analysis M. Chad Jones Iola Independent School District John R. Slate Sam Houston State University George W. Moore Sam Houston State University Cynthia Martinez-Garcia Sam Houston State University Follow this and additional works at: https://scholarworks.sfasu.edu/slr Part of the Educational Leadership Commons, and the Elementary and Middle and Secondary Education Administration Commons Tell us how this article helped you. Recommended Citation Recommended Citation Jones, M. Chad; Slate, John R.; Moore, George W.; and Martinez-Garcia, Cynthia (2017) "Grade Span Configuration and Academic Performance for Students in Poverty: A Texas Multiyear Analysis," School Leadership Review: Vol. 12 : Iss. 2 , Article 8. Available at: https://scholarworks.sfasu.edu/slr/vol12/iss2/8 This Article is brought to you for free and open access by the Journals at SFA ScholarWorks. It has been accepted for inclusion in School Leadership Review by an authorized editor of SFA ScholarWorks. For more information, please contact [email protected].
-
Upload
khangminh22 -
Category
Documents
-
view
1 -
download
0
Transcript of Grade Span Configuration and Academic Performance for ...
School Leadership Review School Leadership Review
Volume 12 Issue 2 Article 8
2017
Grade Span Configuration and Academic Performance for Grade Span Configuration and Academic Performance for
Students in Poverty: A Texas Multiyear Analysis Students in Poverty: A Texas Multiyear Analysis
M. Chad Jones Iola Independent School District
John R. Slate Sam Houston State University
George W. Moore Sam Houston State University
Cynthia Martinez-Garcia Sam Houston State University
Follow this and additional works at: https://scholarworks.sfasu.edu/slr
Part of the Educational Leadership Commons, and the Elementary and Middle and Secondary
Education Administration Commons
Tell us how this article helped you.
Recommended Citation Recommended Citation Jones, M. Chad; Slate, John R.; Moore, George W.; and Martinez-Garcia, Cynthia (2017) "Grade Span Configuration and Academic Performance for Students in Poverty: A Texas Multiyear Analysis," School Leadership Review: Vol. 12 : Iss. 2 , Article 8. Available at: https://scholarworks.sfasu.edu/slr/vol12/iss2/8
This Article is brought to you for free and open access by the Journals at SFA ScholarWorks. It has been accepted for inclusion in School Leadership Review by an authorized editor of SFA ScholarWorks. For more information, please contact [email protected].

Grade Span Configuration and Acade,nic Performance for Students in Poverty: A Texas Multiyear Analysis
M Chad Jones Iola Independent School District
John R. Slate; Sam Houston State University
George W. Moore Sam Houston State University
Cynthia Martinez-Garcia Sam Houston State University
Grade-span configuration refers to the range of grades within a school (Coladarci & Hancock, 2002). The debate over the benefits of one grade span configuration over the other has ensued for decades (Howley, 2002). Specific questions in this debate are (a) Which grade span configuration is most cost effective?; (b) Which grade span configuration yields the best academic achievement?; and (c) Which grade span configuration best meets the social and emotional needs of middle level children? (Howley, 2002).
In regard to the cost effectiveness of grade-span configurations, Bickel, Howley, Glascock, and Williams (2000) concluded that expenditure per pupil increased proportionally with school size. In addition, they stated that as school size increases, costs associated with having students in poverty in schools increased per pupil expenditures. The Bickel et al. (2000) article is particularly relevant to this article because data on students in poverty were analyzed herein.
Over the past two decades, an increase has occurred in the number of schools containing a Grade K-8 configuration rather than the Grade 6-8 traditional middle school (Blair, 2008). The reason behind this trend may reflect educator awareness that achievement loss takes place during each transition (Alspaugh, 1999; Cullen & Robles-Pina, 2012; Clark et al. 2013a). As educational leaders make decisions about how to configure the schools within their district, one major factor they must take into account is the effect that school transitions will have on students and the timing of such transitions. Adolescents experiencing cognitive, physiological, social and emotional developmental changes associated with puberty also have to contend with another important developmental process, the transition from elementary to secondary school (Aikins, Bierman, & Parker, 2005).
i John R. Slate can be reached at profs/[email protected]
68
1
Jones et al.: Grade Span Configuration and Academic Performance for Students in
Published by SFA ScholarWorks, 2017
Statement of the Problem
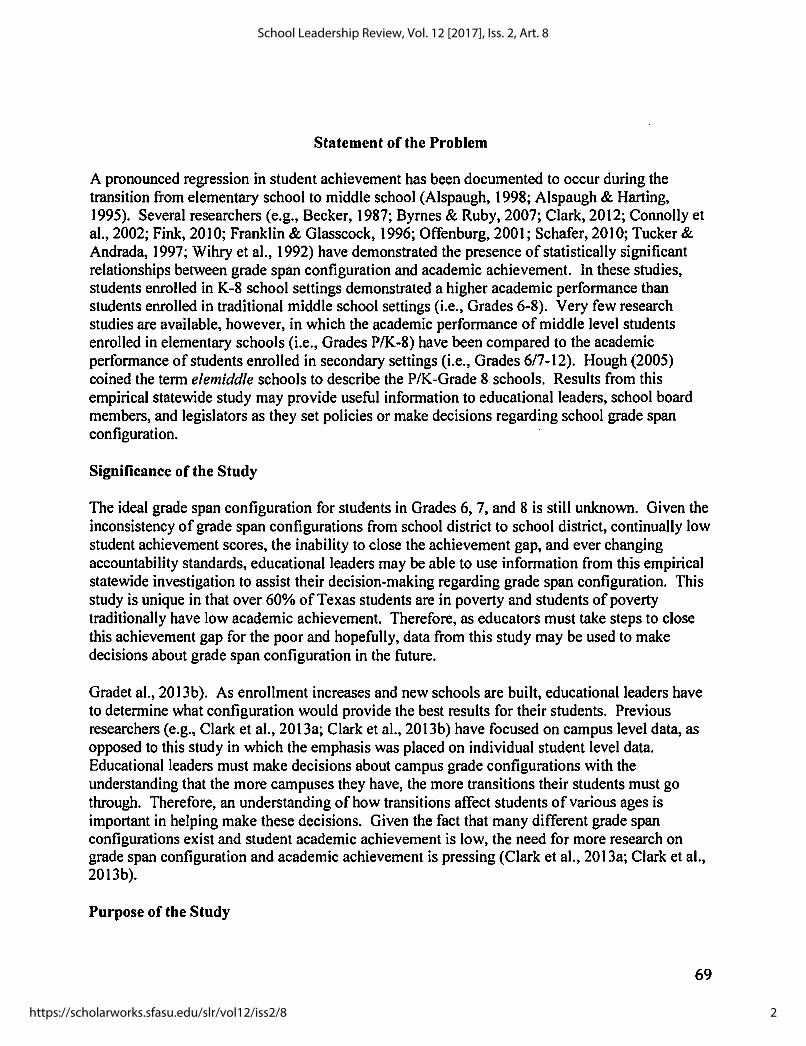
A pronounced regression in student achievement has been documented to occur during the transition from elementary school to middle school (Alspaugh, 1998; Alspaugh & Harting, 1995). Several researchers (e.g., Becker, 1987; Byrnes & Ruby, 2007; Clark, 2012; Connolly et al., 2002; Fink, 201 O; Franklin & Glasscock, 1996; Offen burg, 200 I; Schafer, 201 O; Tucker & Andrada, 1997; Wihry et al., 1992) have demonstrated the presence of statistically significant relationships between grade span configuration and academic achievement. In these studies, students enrolled in K-8 school settings demonstrated a higher academic performance than students enrolled in traditional middle school settings (i.e., Grades 6-8). Very few research studies are available, however, in which the academic performance of middle level students enrolled in elementary schools (i.e., Grades P/K-8) have been compared to the academic performance of students enrolled in secondary settings (i.e., Grades 6/7-12). Hough (2005) coined the term elemidd/e schools to describe the PIK-Grade 8 schools. Results from this empirical statewide study may provide useful information to educational leaders, school board members, and legislators as they set policies or make decisions regarding school grade span configuration.
Significance of the Study
The ideal grade span configuration for students in Grades 6, 7, and 8 is still unknown. Given the inconsistency of grade span configurations from school district to school district, continually low student achievement scores, the inability to close the achievement gap, and ever changing accountability standards, educational leaders may be able to use information from this empirical statewide investigation to assist their decision-making regarding grade span configuration. This study is unique in that over 60% of Texas students are in poverty and students of poverty traditionally have low academic achievement. Therefore, as educators must take steps to close this achievement gap for the poor and hopefully, data from this study may be used to make decisions about grade span configuration in the future.
Gradet al., 2013b). As enrollment increases and new schools are built, educational leaders have to determine what configuration would provide the best results for their students. Previous researchers (e.g., Clark et al., 2013a; Clark et al., 2013b) have focused on campus level data, as opposed to this study in which the emphasis was placed on individual student level data. Educational leaders must make decisions about campus grade configurations with the understanding that the more campuses they have, the more transitions their students must go through. Therefore, an understanding of how transitions affect students of various ages is important in helping make these decisions. Given the fact that many different grade span configurations exist and student academic achievement is low, the need for more research on grade span configuration and academic achievement is pressing (Clark et al., 2013a; Clark et al., 2013b).
Purpose of the Study
69
2
School Leadership Review, Vol. 12 [2017], Iss. 2, Art. 8
https://scholarworks.sfasu.edu/slr/vol12/iss2/8

The purpose of this article was to examine the extent to which the academic achievement of Grade 6, 7, and 8 students in poverty differed as a function of grade span configuration. The specific grade span configurations of interest in this investigation were elementary settings (i.e., Pre-K/K-Grade 6/7/8) and secondary settings (i.e., Grades 6/7-Grade 12). For purposes of this investigation, the grade span configuration for elementary settings was referred to as elemiddle settings (Hough, 2005) and the grade span configuration for secondary settings was regarded as secondary settings. Academic achievement herein were aggregated campus level Texas Assessment of Knowledge and Skills (T AKS) data obtained from the Texas Education Agency Academic Excellence Indicator System.
Research Question
In this investigation, the following research question was addressed: (a) What is the effect of grade span configuration (i.e., elemiddle and secondary settings) on the academic achievement of Grade 6, 7, or 8 students who were economically disadvantaged? This research question was repeated for the last two school years in which the TAKS Reading and Mathematics tests were administered.
Method Research Design
A causal-comparative research design was used in this investigation (Creswell, 2009). Specifically analyzed were archival data as a function of the grade span configuration of the schools in which they were enrolled on Texas Grade 6, 7, and 8 students by their economic status. The independent variable of grade span configuration and the dependent variables of reading and mathematics achievement had already occurred for students whose data were analyzed herein. As such, the research design most appropriate for this investigation was a causal-comparative one (Silva, 2010).
Readers should note that in the causal-comparative research design that was used, as is typical for archival data, only the presence or absence of statistically significant differences between the two grade span configurations can be documented. Readers should not infer nor do we imply that grade span configuration is the cause of any differences that may be present for students in their academic achievement. Cause-and-effect relationship can only be made from experimental research designs with sufficient controls. Those controls are absent when archival data are analyzed as was this case in this investigation.
Participants and Instrumentation
Archival data were obtained from the Texas Education Agency Academic Excellence Indicator System database for the last two years of T AKS data: the 2009-2010 school year and 2010-2011 school years. Examined in this study were T AKS Reading and Mathematics test scores of students in Grades 6, 7, and 8 by their economic status. Specifically compared were reading and mathematics test scores of students who had been enrolled in elemiddle schools to the reading and mathematics test scores of students who had been enrolled in secondary schools. For purposes of this investigation, the definition of economically disadvantaged was the one used in the Texas Education Agency Texas Academic Performance Report Glossary (2015). As such,
70
3
Jones et al.: Grade Span Configuration and Academic Performance for Students in
Published by SFA ScholarWorks, 2017

economic disadvantage was defined as being "eligible for free or reduced-price lunch or eligible for other public assistance" (p. 10). Although the State of Texas changed its mandatory statewide examination to the State of Texas Assessment of Academic Readiness, numerous problems were present in its implementation. As such, only data from the predecessor to the current state-mandated assessment, the T AKS, were analyzed in this investigation. The T AKS Reading examinations were given to measure student knowledge of the Texas Reading Essential Knowledge and Skills. Assessments in Grades 6, 7, and 8 contained 42, 48, and 48 multiple choice items, respectively. In addition, each exam assessed four reading objectives: (a) the understanding of culturally varied written texts, (b) the application of knowledge of literary elements, ( c) the use of reading strategies to analyze texts, and (d) the application of critical thinking skills to analyze texts.
The TAKS Mathematics examinations were given to measure student knowledge of the Texas Mathematics Essential Knowledge and Skills. Assessments in the sixth, seventh, and eighth grades contained 46, 48, and 50 multiple choice items each, respectively. In addition, each of the three tests assessed six strands of mathematical concepts: (a) numbers, operations, and quantitative reasoning; (b) pattern relationships and algebraic reasoning; (c) geometry and spatial reasoning; (d) measurement; (e) probability; and statistics, and (f) mathematical processes-and tools. Readers are directed to the Texas Education Agency website for information regarding the score reliability and score validity of the TAKS assessments.
Results
To answer the previously delineated research questions, independent samples /-tests were calculated and checks were made for normality. Independent samples /-tests were the appropriate statistical technique to use because the independent variable of grade span configuration consisted of two groups (i.e., elemiddle and secondary settings) and the dependent variables were test scores. The results of these analyses will now be presented, with reading analyses presented first, followed by the mathematics analyses.
TAKS Reading Results for Students in Poverty
For the 2009-2010 school year for Grade 6 students in poverty, a statistically significant difference was not yielded, /(30.82) = 1.16, p = .26, in passing rates on the TAKS Reading test as a function of grade span configuration. Grade 6 students in poverty had similar passing rates on the T AKS Reading test regardless of the grade span configuration in which they were enrolled. Delineated in Table 1 are the descriptive statistics for this school year.
Concerning the 2010-2011 school year for Grade 6 students in poverty, a statistically significant difference was revealed, /(33.44) = 2.43,p = .02, in the TAKS Reading passing rates as a function of grade span configuration. This difference represented a small effect size (Cohen's d) of 0.46 (Cohen, 1988). Grade 6 students in poverty who were enrolled in elemiddle schools had an average passing rate on the T AKS Mathematics test that was 4.34% higher than the average passing rate of Grade 6 students in poverty who were enrolled in secondary schools. Revealed in Table 2 are the descriptive statistics for this analysis.
71
4
School Leadership Review, Vol. 12 [2017], Iss. 2, Art. 8
https://scholarworks.sfasu.edu/slr/vol12/iss2/8
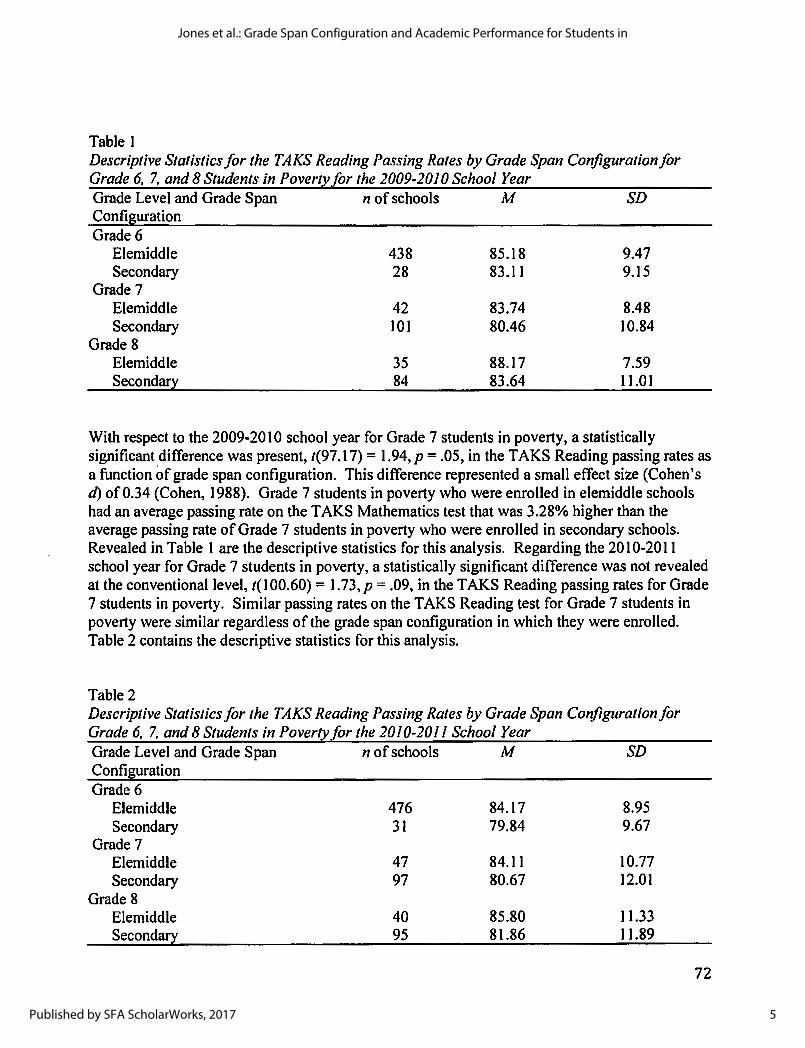
Table 1 Descriptive Statistics/or the TAKS Reading Passing Rates by Grade Span Configuration/or Grade 6, 7, and 8 Students in Poverty/or the 2009-2010 School Year Grade Level and Grade Span n of schools M SD Configuration Grade 6
Elemiddle 438 85.18 9.47 Secondary 28 83.11 9.15
Grade 7 Elemiddle 42 83.74 8.48 Secondary 101 80.46 10.84
Grade 8 Elemiddle 35 88.17 7.59 Secondary 84 83.64 11.01
With respect to the 2009-2010 school year for Grade 7 students in poverty, a statistically significant difference was present, t(97.l 7) = 1.94, p = .05, in the TAKS Reading passing rates as a function of grade span configuration. This difference represented a small effect size (Cohen's d) of0.34 (Cohen, 1988). Grade 7 students in poverty who were enrolled in elemiddle schools had an average passing rate on the T AKS Mathematics test that was 3 .28% higher than the average passing rate of Grade 7 students in poverty who were enrolled in secondary schools. Revealed in Table 1 are the descriptive statistics for this analysis. Regarding the 2010-2011 school year for Grade 7 students in poverty, a statistically significant difference was not revealed at the conventional level, t( 100.60) = 1. 73, p = .09, in the T AKS Reading passing rates for Grade 7 students in poverty. Similar passing rates on the TAKS Reading test for Grade 7 students in poverty were similar regardless of the grade span configuration in which they were enrolled. Table 2 contains the descriptive statistics for this analysis.
Table 2 Descriptive Statistics/or the TAKS Reading Passing Rates by Grade Span Configuration/or Grade 6, 7, and 8 Students in Poverty/or the 2010-2011 School Year Grade Level and Grade Span n of schools M Configuration Grade 6
Elemiddle Secondary
Grade 7 Elemiddle Secondary
Grade 8 Elemiddle Secondary
476 31
47 97
40 95
84.17 79.84
84.11 80.67
85.80 81.86
SD
8.95 9.67
10.77 12.01
11.33 11.89
72
5
Jones et al.: Grade Span Configuration and Academic Performance for Students in
Published by SFA ScholarWorks, 2017

With respect to the 2009-2010 school year for Grade 8 students in poverty, a statistically significant difference was yielded, 1(91.09) = 2.58, p = .01, in the TAKS Reading passing rates as a function of grade span configuration. This difference represented a small effect size (Cohen's d) of 0.48 (Cohen, 1988). Grade 8 students in poverty who were enrolled in elemiddle schools had an average passing rate on the T AKS Mathematics test that was 4.53% higher than the average passing rate of Grade 8 students in poverty who were enrolled in secondary schools. Descriptive statistics for this analysis are presented in Table 1. With respect to the 2010-2011 school year for Grade 8 students in poverty, a statistically significant difference was not revealed at the conventional level, 1(76.74) = 1.82,p = .07, in the TAKS Reading passing rates as a function of grade span configuration. Although not statistically significant at the conventional level, Grade 8 students in poverty had higher average passing rates on the T AKS Reading test in elemiddle schools than in secondary settings. Table 2 contains the descriptive statistics for this school year.
T AKS Mathematics Results for Students in Poverty
For the 2009-2010 school year for Grade 6 students in poverty, a statistically significant difference was revealed, 1(32. 77) = 3 .31, p = .002, in the T AKS Mathematics passing rates as a function of grade span configuration. This difference represented a moderate effect size (Cohen's d) of0.67 (Cohen, 1988). Grade 6 students in poverty who were enrolled in elemiddle schools had an average passing rate on the T AKS Mathematics test that was 9.23% higher than the average passing rate of Grade 6 students in poverty who were enrolled in secondary schools. Delineated in Table 3 are the descriptive statistics for this analysis.
Table 3 Descriptive Statistics for the TAKS Mathematics Passing Rates by Grade Span Conjiguralionfor Grade 6, 7, and 8 Students in Povertyfor the 2009-2010 School Year Grade Level and Grade Span n of schools M Configuration Grade 6
Elemiddle Secondary
Grade 7 Elemiddle Secondary
Grade 8 Elemiddle Secondary
454 31
48 110
42 110
82.09 72.81
78.52 71.60
78.64 69.91
SD
12.42 15.73
15.05 15.82
15.24 18.77
Concerning the 2010-2011 school year for Grade 6 students in poverty, a statistically significant difference was revealed, 1(33.51) = 2.48,p = .018, in the TAKS Mathematics passing rates as a function of grade span configuration. This difference represented a moderate effect size (Cohen's d) of 0.50 (Cohen, 1988). Grade 6 students in poverty who were enrolled in elemiddle schools had an average passing rate on the T AKS Mathematics test that was 6.84% higher than
73
6
School Leadership Review, Vol. 12 [2017], Iss. 2, Art. 8
https://scholarworks.sfasu.edu/slr/vol12/iss2/8
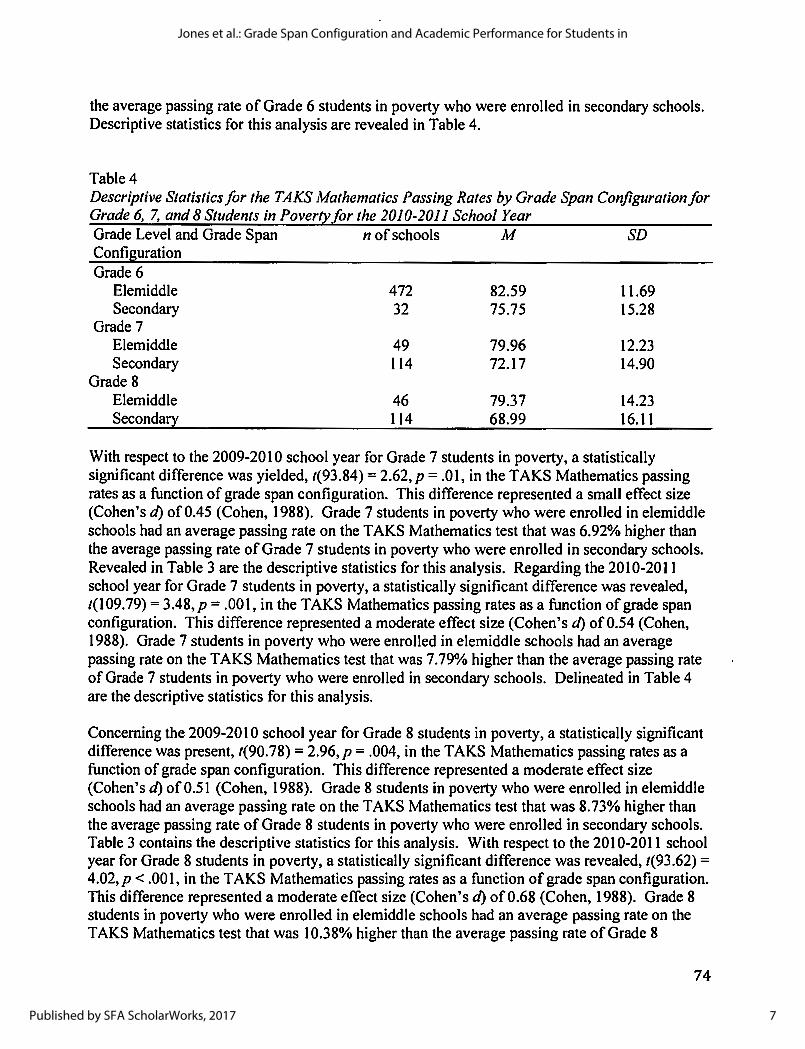
the average passing rate of Grade 6 students in poverty who were enrolled in secondary schools. Descriptive statistics for this analysis are revealed in Table 4.
Table 4 Descriptive Statistics/or the TAKS Mathematics Passing Rates by Grade Span Configuration/or Grade 6, 7, and 8 Students in Poverty/or the 2010-2011 School Year Grade Level and Grade Span n of schools M Configuration Grade 6
Elemiddle Secondary
Grade 7 Elemiddle Secondary
Grade 8 Elemiddle Secondary
472 32
49 114
46 114
82.59 75.75
79.96 72.17
79.37 68.99
SD
11.69 15.28
12.23 14.90
14.23 16.11
With respect to the 2009-2010 school year for Grade 7 students in poverty, a statistically significant difference was yielded, t(93 .84) = 2.62, p = .01, in the T AKS Mathematics passing rates as a function of grade span configuration. This difference represented a small effect size (Cohen's d) of0.45 (Cohen, 1988). Grade 7 students in poverty who were enrolled in elemiddle schools had an average passing rate on the TAKS Mathematics test that was 6.92% higher than the average passing rate of Grade 7 students in poverty who were enrolled in secondary schools. Revealed in Table 3 are the descriptive statistics for this analysis. Regarding the 2010-2011 school year for Grade 7 students in poverty, a statistically significant difference was revealed, 1(109.79) = 3.48,p = .001, in the TAKS Mathematics passing rates as a function of grade span configuration. This difference represented a moderate effect size (Cohen's d) of 0.54 (Cohen, 1988). Grade 7 students in poverty who were enrolled in elemiddle schools had an average passing rate on the T AKS Mathematics test that was 7. 79% higher than the average passing rate of Grade 7 students in poverty who were enrolled in secondary schools. Delineated in Table 4 are the descriptive statistics for this analysis.
Concerning the 2009-20 l O school year for Grade 8 students in poverty, a statistically significant difference was present, 1(90.78) = 2.96,p = .004, in the TAKS Mathematics passing rates as a function of grade span configuration. This difference represented a moderate effect size (Cohen's d) of 0.51 (Cohen, 1988). Grade 8 students in poverty who were enrolled in elemiddle schools had an average passing rate on the T AKS Mathematics test that was 8. 73% higher than the average passing rate of Grade 8 students in poverty who were enrolled in secondary schools. Table 3 contains the descriptive statistics for this analysis. With respect to the 2010-2011 school year for Grade 8 students in poverty, a statistically significant difference was revealed, 1(93.62) = 4.02, p < .00 l, in the T AKS Mathematics passing rates as a function of grade span configuration. This difference represented a moderate effect size (Cohen's d) of0.68 (Cohen, 1988). Grade 8 students in poverty who were enrolled in elemiddle schools had an average passing rate on the TAKS Mathematics test that was 10.38% higher than the average passing rate of Grade 8
74
7
Jones et al.: Grade Span Configuration and Academic Performance for Students in
Published by SFA ScholarWorks, 2017
students in poverty who were enrolled in secondary schools. Delineated in Table 4 are the descriptive statistics for this analysis.
Discussion
In this multiyear statewide analysis, the degree to which grade span configuration was related to the reading and mathematics achievement of Grade 6, 7, and 8 students in poverty in Texas public schools was addressed. With respect to the TAKS Reading passing rates, three of the six analyses revealed statistically significant differences, with small to moderate effect sizes. Although the other three T AKS Reading analyses were not statistically significant, average passing rates on the T AKS Reading tests for students in poverty were higher at the elemiddle schools than in secondary schools in all six analyses.
Concerning the T AKS Mathematics passing rate analyses, statistically significant differences were revealed in all six analyses. In all of the analyses, passing rates on the T AKS Mathematics test for students in poverty were higher in the elemiddle grade span configurations than in the secondary grade span configurations. Small to moderate effect sizes were present.
Connection with Existing Literature
Student achievement has been documented to decrease during the transition from elementary school to middle school (Alspaugh, 1998; Alspaugh & Harting, 1995). Many researchers ( e.g., Becker, 1987; Byrnes & Ruby, 2007; Clark, 2012; Clark et al., 2013a; Collins, 2006; Connolly et al., 2002; Fink, 2010; Franklin & Glasscock, 1996; Offenburg, 2001; Schafer, 2010; Tucker & Andrada, 1997; Wihry et al., 1992) have demonstrated the presence of statistically significant relationships between grade span configuration and academic achievement. In previous studies, students enrolled in K-8 school settings had better academic performance than their peers enrolled in traditional middle school settings (i.e., Grades 6-8). Few research studies are available, however, in which the passing rates of students enrolled in elemiddle schools (i.e., Grades Pre-KJK.-Grade 6, 7 ,8) have been compared to the passing rates of students enrolled in secondary settings (i.e., Grades 6/7-12), particularly when the focus was placed on students in poverty. Results from this study are commensurate to these previous studies because in both, students enrolled in the configuration with the least number of transitions (i.e., elemiddle) outperformed their counterparts enrolled in the grade span configuration with more transitions (i.e., middle school or secondary school).
Implications for Policy and Practice
The ideal grade span configuration for students in Grades 6, 7, and 8 is still not known. Considering the poor academic achievement of students of poverty in Texas, the inconsistencies of grade span configurations from school district to school district, ever changing accountability standards, and the inability to close the achievement gap, school administrators and educational leaders may be able to use data from this study to help them make decisions about grade span configuration. Results delineated in this investigation may also aid legislators and policymakers in their decisions regarding educational facilities.
75
8
School Leadership Review, Vol. 12 [2017], Iss. 2, Art. 8
https://scholarworks.sfasu.edu/slr/vol12/iss2/8

Grade span configuration has been documented to impact student achievement (Clark et al., 2013a; Clark et al., 2013 b ). One issue of concern is that school administrators must make decisions about campus grade configurations with the understanding that the more campuses they have, the more transitions their students must experience. Therefore, an understanding of how transitions affect students of various ages is crucial in helping make these decisions. Given the fact that many different grade span configurations exist and student academic achievement is low, the need for more research on grade span configuration and academic achievement is pressing (Clark et al., 2013a; Clark et al., 2013b).
As we noted earlier in this article, increases in the number of schools containing a Grade K-8 configuration rather than the Grade 6-8 traditional middle school (Blair, 2008) have taken place in the last two decades. The reason behind this trend may reflect awareness that student achievement suffers during each transition (Alspaugh, 1999; Cullen & Robles-Pina, 2012; Clark et al. 2013a). As educational leaders make decisions about how to configure the schools within their district, one major factor they must take into account is the effect that school transitions will have on students and the timing of such transitions. Adolescents experiencing cognitive, physiological, social and emotional developmental changes associated with puberty also have to contend with another important developmental process, the transition from elementary to secondary school (Aikins, Bierman, & Parker, 2005).
Suggestions for Future Research
Examined in this study was the degree to which differences were present in the T AKS Reading and Mathematics passing rates as a function of grade span configuration for Grade 6, 7, and 8 students of poverty in Texas. Specifically analyzed were passing rates for Grade 6, 7, and 8 students of poverty who were either enrolled in elemiddle settings (i.e., Pre-K/K-Grade 6/7/8) or in secondary settings (i.e., Grades 6/7-Grade 12). In this investigation, data were analyzed at the aggregated campus level. In the future, researchers are encouraged to analyze individual student data rather than campus level passing rate data. Such investigations would allow for a more detailed analysis of the relationship of grade span configuration to student performance. Other suggestions for future research would be to examine the relationship of grade span configuration to other academic areas than just reading and mathematics such as science, social studies, and writing; examine grade span configuration and other student demographic characteristics such as at-risk or English Language Learners or students in special education. Future researchers might also analyze grade span configuration and student discipline data.
Data from this investigation were solely composed of the T AKS Reading and Mathematics passing rates for the 2009-2010 and 2010-2011 school years. Due to issues in the implementation of the replacement for the TAKS, the State of Texas Assessment of Academic Readiness, a decision was made to not use data from the newly mandated state assessment. Although data from the State of Texas Assessment of Academic Readiness were not considered valid for this study, in the future researchers are encouraged to analyze data from its administration.
76
9
Jones et al.: Grade Span Configuration and Academic Performance for Students in
Published by SFA ScholarWorks, 2017
Conclusion
The purpose of this research study was to determine the extent to which differences were present in the T AKS Reading and Mathematics passing rates as a function of grade span configuration for Grade 6, 7, and 8 students of poverty. In reading, two out of the six analyses revealed statistically significant differences. In all instances, however, reading performance was higher in the elemiddle settings than in secondary settings. Statistically significant differences were revealed in all six of the analyses of student mathematics passing rates. In all six analyses, mathematics performance was better in the elemiddle settings than in secondary settings. Consistent with previous research (Clark et al., 2013a; Clark et al., 2013b) students in elemiddle settings performed better than students in secondary settings.
Lest readers overgeneralize from the results of this investigation, several caveats are in order. First, only archival data were analyzed. As such, no cause-and-effect relationships can be made. We established in this study that statistically significant reading and mathematics achievement was present between the two grade span configurations. The reasons for such differences were not determined in this study. Second, we analyzed data for two student groups. The complexities of student demographic characteristics, their academic performance, and the manner in which they respond to transitions were not addressed in this investigation. As a result, readers are urged to be cautious in the extent to which they generalize from the results of this study.
References
Aikins, J. W., Bierman, K. L., & Parker, J. G. (2005). Navigating the transition to junior high school: The influence of pre-transition friendship and self-system characteristics. Social Development, 14, 42-60.
Alspaugh, J. W. (1998). Achievement loss associated with the transition to middle school and high school. Journal of Educational Research. 92(1), 20-25.
Alspaugh, J. W., & Harting, R. D. (1995). Transition effects of school grade-level organization on student achievement. Journal of Research and Development in Education, 28, 145-149.
Becker, H.J. (1987). Addressing the needs of different groups of early adolescents: Effects of varying school and classroom organizational practices on students from different social backgrounds and abilities (Report No. 16). Baltimore, MD: The Johns Hopkins University Center for Research on Elementary and Middle Schools.
Berliner, D. C. (2009). Poverty and potential: Out-of-school factors and school success. Boulder and Tempe: Education and the Public Interest Center & Education Policy Research Unit. Retrieved from http://epicpolicy.org/publication/poverty-and-potential
Bickel, R., Howley, C., Williams, T., & Glasscock, C. (2000). High school size, achievement equity, and cost: Robust interaction effects and tentative results. Washington, DC: Rural School and Community Trust.
Byrnes, V., & Ruby, A. (2007). Comparing achievement between K-8 and middle schools: A large-scale empirical study. American Journal of Education, 114, 101-135. doi: I 0.1086/520693
77
10
School Leadership Review, Vol. 12 [2017], Iss. 2, Art. 8
https://scholarworks.sfasu.edu/slr/vol12/iss2/8
Clark, D. M. (2012). A comparative analysis of grade span configurations and academic achievement among 6-8 and K-8 public schools in Texas. (Doctoral Dissertation). Retrieved from Proquest Dissertations and Theses. (UMI No. 3531779)
Clark, D. M., Slate, J. R., Combs, J.P., & Moore, G. W. (2013a). 6-8 and K-8 Texas public schools: Differences in writing, science, and social studies. Frontiers in Education, 1(1), 1-5.
Clark, D. M., Slate, J. R., Combs, J.P., & Moore, G. W. (2013b). Math and reading differences between 6-8 and K-8 grade span configurations: A multiyear, statewide analysis. Current Issues in Education, 16(2), 1-15. Retrieved from http://cie.asu.edu/oj s/index. php/cieatasu/article/view/ 1144
Cohen, J. (1988). Statistical power analysis/or the behavioral sciences (2nd ed.). Hillsdale, NJ: Lawrence Erl baum.
Coladarci, T., & Hancock, J. (2002). The (limited) evidence regarding effects of grade-span configurations on academic achievement: What rural educators should know. Journal of Research in Rural Education, 17(3), 189-192.
Connolly, F., Yakimowski-Srebnick, M. E., & Russo, C. V. (2002). An examination ofK-5, 6-8 versus K-8 grade configurations. ERS Spectrum, 20(2), 28-37.
Fink, L. L. (2010). A comparison of grade configuration on urban sixth to eighth grade student outcomes in regular and special education. Doctoral dissertation, University of Maryland, College Park, MD. Retrieved from http://drum.lib.umd.edu/handle/l 903/l 0836
Franklin, B. J., & Glascock, C.H. (1996, October). The relationship between grade configuration and student performance in rural schools. Paper presented at the Annual Conference of the National Rural Education Association, San Antonio, TX (ERIC Document Reproduction Service No. ED403083). Retrieved from http://www.eric.ed.gov/PDFS/ED403083.pdf
Ho, R. (2006). Handbook of univariate and multivariate data analysis and interpretation with SPSS. London, England: Chapman and Hall. doi: 10.1201/9781420011111
Hough, D. L. (2005). The rise of the 'elemiddle' school. School Administrator, 62(3), 10-14. Howley, C. B. (2002). Grade-span configurations. School Administrator, 59(3), 24-29. Offenberg, R. M. (2001). The efficacy of Philadelphia's K-to-8 schools compared to middle
grades schools. Middle School Journal, 32(4), 23-29. Schafer, K. L. (2010). The impact of grade configuration on sixth grade academic achievement
in Florida Public schools. Doctoral dissertation (UMI No. 3415047), University of Central Florida, FL.
Silva, C. N. (2010). Ex post facto study. Encyclopedia of research design. doi: 10.4135/978141296 l 288
Texas Education Agency. (2015). Glossary for the Texas Academic Performance Report: 2014-2015 report. Retrieved from http://ritter.tea.state.tx.us/perfreport/tapr/2015/glossary.html
The Annie E. Casey Foundation. (2012). Double jeopardy: How third grade reading skills and poverty influence high school graduation. Retrieved from http://www.aecf.org/resources/double-jeopardy/
Tucker, C. G., & Andrada, G. N. (1997, March). Accountability works: Analysis of performance by grade span of school. Paper presented at the annual meeting of the American Educational Research Association, Chicago, IL.
78
11
Jones et al.: Grade Span Configuration and Academic Performance for Students in
Published by SFA ScholarWorks, 2017
Vogt, W. P. (2005). Dictionary of statistics and methodology: A nontechnical guide/or the social sciences (3rd ed.). Thousand Oaks, CA: Sage.
Wihry, D. F., Coladarci, T., & Meadow, C. (1992). Grade span and eighth-grade academic achievement: Evidence from a predominantly rural state. Journal of Research in Rural Education, 8(2), 58-70.
79
12
School Leadership Review, Vol. 12 [2017], Iss. 2, Art. 8
https://scholarworks.sfasu.edu/slr/vol12/iss2/8
Texas Council of Professors of Educational Administration ./06 East 11th Stml Amlin, 'IX 78701-2617
School Leadership Review
The i11ternatio11a~ peer-reviewed journal of the Texas Co1111cil of Professors ofEd11calio11al Admi11istratio11
ISSN: 1559-4998 http://www.tcpea.org/slr.html
80
13
Jones et al.: Grade Span Configuration and Academic Performance for Students in
Published by SFA ScholarWorks, 2017