Experimental study on innovative connections for large span ...
77
Experimental study on innovative connections for large span structural timber trusses Petter Werner Åström Master Thesis Stockholm, August 2019 Supervisor: Roberto Crocetti Examiner: Magnus Wålinder
-
Upload
khangminh22 -
Category
Documents
-
view
0 -
download
0
Transcript of Experimental study on innovative connections for large span ...

Experimental study on innovative connections
for large span structural timber trusses
Petter Werner Åström
Master Thesis
Stockholm, August 2019
Supervisor: Roberto Crocetti
Examiner: Magnus Wålinder

KTH Royal Institute of Technology School of Architecture and the Built Environment Department of Civil and Architectural Engineering Division of Building Materials SE-100 44 Stockholm, Sweden
TRITA-ABE-MBT-19627
© 2019 Petter Werner Åström. All rights reserved. No part of this thesis may be reproduced without permission from the author.

i
ABSTRACT Large span timber trusses are usually built with glulam. One problem with large span glulam
trusses is that the connections needed to transfer the load between truss members are
often complex and expensive. Another issue is transportation. Building large span trusses
out of structural timber instead, could be a way of simplifying the connections and at the
same time increase the degree of on-site construction and thereby solving the
transportation problem.
In this study, a total of 18 laboratory tests were performed with the purpose of
investigating the tensile strength and the load slip behavior of different connection designs
for large span structural timber trusses. Six different test groups corresponding to six
different connection designs were tested. The materials used include members made of
C24 timber and gusset plates made of birch plywood, aluminum, and steel. Screws were
used as fasteners for five test groups and adhesive was used for one group. The influence
of different reinforcement techniques including reinforcement screws and added
aluminum sheets was studied.
The results showed a ductile failure behavior for all test groups except for the group where
adhesive was used. However, a decrease of ductility was observed for groups were
aluminum sheets were used on the outsides of the mid placed plywood gusset plate. A 12-
17 % increase in capacity was observed due to the presence of aluminum sheets. The
reinforcement screws had no significant effect on the capacity. However, the presence of
reinforcement screws did lead to a reduction in scatter both regarding capacity and
stiffness.
Keywords: Timber structure, timber joint, large span trusses, experimental study,
structural timber, birch plywood, reinforcement screws

ii
SAMMANFATTNING Träfackverk med stora spännvidder tillverkas vanligen av limträ. Stora spännvidder medför
stora krafter som via förbanden måste överföras mellan fackverkets olika stänger. Detta
gör att förbanden ofta blir komplexa och dyra. Att välja konstruktionsträ istället för limträ
skulle kunna förenkla förbanden och också utöka graden till i vilken mån monteringen av
fackverket kan utföras på byggarbetsplatsen. Detta skulle kunna lösa en del av de
transportproblem som ofta uppstår då stora byggelement som tillexempel takstolar ska
fraktas.
I denna experimentella studie utfördes totalt 18 tester uppdelat i 6 test grupper. Varje
testgrupp avsåg en typ av förband. Materialen som används i studien inkluderar reglar av
konstruktionsvirke och laskar av björkplywood, aluminiumplåt och stål. I fem av de testade
förbanden användes skruv som fästdon, för ett förband användes lim. Studien avser bland
annat att undersöka björkplywoods funktion som lask samt inverkan olika
förstärkningsmetoder så som armeringskruv och aluminiumlåtar i kombination med
plywood som lask.
Resultatet visade på ett duktilt brottbeteende för alla förband utom det limmade. Dock
observerades en minskning av duktiliteten för de förband där aluminiumplåt användes i
kombination med björkplywood. Kapaciteten för de förband där aluminium användes
ökade med 12-17 %. Användningen av armeringsskruv visade ej på någon signifikant ökning
av kapaciteten, dock minskade spridningen både vad gäller kapacitet och styvhet när
armeringsskruv användes.
Nyckelord: Träkonstruktion, träförband, fackverk, experimentell studie,
konstruktionsvirke, björkplywood

iii
PREFACE This master thesis was carried out at KTH Department of Civil and Architectural
Engineering, Division of Building Materials, in Stockholm, Sweden. The construction of the
test specimens took place at KTH while the testing was performed at The Swedish Cement
and Concrete Research Institute (CBI). The study was carried out between January and June
2019.
I would like to start by thanking my supervisor Roberto Crocetti for his help and support
with great knowledge within the subject. I would also like to express my gratitude to all the
companies that helped with providing material for this project. Derome - for providing the
structural timber and kindly welcoming me to visit their factory in Varberg, Sweden,
Koskisen - for providing the plywood, RothoBlaas - for providing the screws. Gratitude is
also given to Maj and Hilding Brosenius research foundation for financial support. I would
also like to thank Joakim Norén from RISE (Research Institute of Sweden), for his
involvement and input to the project. I would specially like to thank Stefan Trillkott at KTH
- who helped with many important technical and practical details for the experiment,
Patrick Rogers from CBI – for patiently teaching me how the testing equipment at CBI
works, Kaj Lappalainen and Mattias Backman – for helping me with a lot of heavy lifting
and nice company during the construction and experimental part of this project.
Stockholm, June 2019, Petter Werner Åström

iv
CONTENTS
ABSTRACT ........................................................................................................................... i
SAMMANFATTNING .......................................................................................................... ii
PREFACE ........................................................................................................................... iii
CONTENTS ........................................................................................................................ iv
CHAPTER 1 Introduction........................................................................................................ 1
1.1 Context ........................................................................................................................ 1
1.2 Background ................................................................................................................. 1
1.3 State of the art ............................................................................................................ 2
1.4 Aim .............................................................................................................................. 3
1.5 Limitations ................................................................................................................... 3
CHAPTER 2 - Relevant theory ................................................................................................ 4
2.1 Trusses in general ........................................................................................................ 4
2.1.1 Structural aspects ................................................................................................. 4
2.1.2 Transportation...................................................................................................... 5
2.1.3 Economy ............................................................................................................... 5
2.2 Material Properties ..................................................................................................... 5
2.2.1 Mechanical properties ......................................................................................... 5
2.2.2 Deterioration ........................................................................................................ 7
2.3 Timber joint design ..................................................................................................... 7
2.3.1 Embedding strength ............................................................................................. 7
2.3.2 Yield moment ....................................................................................................... 8
2.3.3 Withdrawal capacity ............................................................................................ 8
2.4 Failure modes .............................................................................................................. 9
2.4.1 Johansen´s yield theory ........................................................................................ 9
2.4.2 Brittle failure ...................................................................................................... 10
2.5 Multiple shear planes ................................................................................................ 10
2.6 Glued timber connections ......................................................................................... 12
2.7 Example of truss design ............................................................................................ 13
CHAPTER 3 - Materials ........................................................................................................ 15

v
3.1 Timber ....................................................................................................................... 15
3.2 Steel ........................................................................................................................... 15
3.3 Aluminum .................................................................................................................. 15
3.4 Screws ....................................................................................................................... 15
3.5 Adhesives .................................................................................................................. 16
CHAPTER 4 - Methods ......................................................................................................... 16
4.1 Test groups ................................................................................................................ 16
4.2 Measurements .......................................................................................................... 19
4.2.1 Moisture content ............................................................................................... 19
4.2.2 Density................................................................................................................ 20
4.3 Calculations ............................................................................................................... 20
4.4 Tensile test ................................................................................................................ 21
4.4.1 Displacement measurements ............................................................................ 21
4.4.2 Application of load ............................................................................................. 23
4.4.3 Maximum load ................................................................................................... 24
4.4.4 Stiffness .............................................................................................................. 24
4.4.5 Efficiency ............................................................................................................ 24
4.5 Construction of test specimens ................................................................................. 25
CHAPTER 5 - Results and discussion .................................................................................... 29
5.1 Pre-testing of dowelled rig connection ..................................................................... 29
5.2 Capacity and failure behavior ................................................................................... 30
5.3 Stiffness ..................................................................................................................... 36
Conclusions and further research ....................................................................................... 38
Bibliography ........................................................................................................................ 39
APPENDIX A – Test results ................................................................................................... 40
APPENDIX B – Measurements of density and moisture content ........................................ 47
APPENDIX C – Calculations .................................................................................................. 52

1
CHAPTER 1 Introduction
1.1 Context
The always present interest of building economically justifiable structures and an increased
interest in environmentally friendly structures are two strong motives for investigating the
possibility of using structural timber as truss member material for large span trusses.
Constructing trusses out of material that is accessible and non-specially designed could be
a way of reducing costs. Using simple timber joints instead of complex heavy steel joints
would provide on-site construction to a higher degree, which could solve some problems
regarding transportation of large span elements.
1.2 Background
The tradition of using timber as a building material goes far back. In the early days of
housing construction, whole logs of timber were stacked upon each other connected by
recess joints to form walls and ridges made from logs were used to support planks that
formed roofs. When we later began building cities one problem arose, fire. City fires were
a big issue in the old cities and had a big impact on how we built our cities. The
consequences of building cities of timber led to other building materials being used instead,
such as brick tiles and later concrete. Timber was forgotten, at least as a building material
for larger structures such as dwelling buildings, bridges, and facility buildings. Today,
however, timber has once again caught our attention. Modern technology in combination
with a deeper knowledge has led to previous problems no longer standing in the way of
using timber as a building material for larger structures.
To create these large timber structures, timber elements must be connected to each other
with joints. These joints have a strong influence on the structural behavior. Well-designed
joints should have the ability to transfer loads between the elements. Most large span
timber structures built today, are made of glulam. The ability to form beams and truss
members almost without dimensional restrictions is of great advantage. However, for
these glulam structures, the connections are often complex and expensive. Making these
structures out of structural timber could be a way to simplify the connections while at the
same time saving money.
In Sweden, steel nail plates are often used as gusset plates in roof trusses. These nail plates
are preferably pressed in place in a factory to ensure a good fit. By using plywood as gussets
instead, the assembly could be made on the construction site to a higher degree and
thereby solving some issues regarding transportation of large elements. Another benefit is
that plywood gussets are cheaper than steel gussets. The idea behind using birch plywood
as gusset plates are that its relatively high density leads to a higher embedding strength

2
compared to for example spruce or pine plywood. However, birch has poor resistance to
rot and is therefore only suitable for weather protected structures.
Another important matter in today’s building industry is environmental impact. High
energy consuming production of building materials, long transportations and heavy
machines used during construction are a few sources of pollution. Timber is made from
wood, which is a natural resource and requires no high energy fossil fuels to be produced,
just the natural process of photosynthesis. This means that instead of polluting the
atmosphere, wood is freeing the atmosphere from carbon dioxide, storing it in the material
as carbon. Wood is also a renewable resource if the forestry is managed in a sustainable
way. Timber is therefore often referred to as the building material of the future.
1.3 State of the art
Using plywood as gusset plates for timber trusses is not a new idea.
In 1968, Thomas Lee Wilkinson compared the longtime performance of different
connection systems for trusses including one were Douglas-fir plywood where used as
gusset plates. The study included several different connection systems including nailed
gusset plates of plywood, different types of glue-nailed plywood gussets and different
types of steel plates used as gussets. The conclusion was that the longtime deflection was
related to the stiffness of the joint. (Wilkinson, 1968).
In 1981, Turnbull et al, introduced multi-laminated nailed joints to the Canada Plan Service.
A joint of two lumber studs connected to each other with three gussets – two Douglas-fir
plywood boards and one steel gusset in the middle. The plywood was made from Douglas-
fir and had a thickness of 12.5 𝑚𝑚, the lumber studs were made from spruce with a
thickness of 38 𝑚𝑚, the mid placed steel gusset had a thickness of 0.95 𝑚𝑚. Spiral nails
with a diameter of 4 𝑚𝑚 were used as fasteners. Experimental testing resulted in a failure
load of 4.6 𝑘𝑁/𝑛𝑎𝑖𝑙 (Turnbull, et al., 1981). This type of construction was introduced to the
Canadian Plan Service, as a recommended construction for heavy duty farm buildings.
A modern application of a joint similar to the Canada Plan Service joint, but designed for
larger spans is the Ariane system, developed by Jean-Luc Sandoz. The Ariane truss system
consists of structural timber studs connected to each other by LVL or birch plywood gusset
plates. This truss system has the capability of reaching spans up to 60 meters.
Several studies on reinforcing screws have shown that it could be a way of both increasing
the load-bearing capacity and provide a ductile failure behavior.
Blass and Schädle showed that the ductility of dowelled joints could be significantly
increased by using self-tapping screws. By placing self-tapping screws in front of the
dowels, perpendicular to the grain direction, brittle splitting failure could be avoided
resulting in a higher ductility. The ductility defined as the ratio between ultimate and yield

3
displacement was increased from 1,6 to 5,3 while the load-bearing capacity was increased
with 17%. (Blass & Schädle, 2011).
Another study conducted at SP, showed that self-tapping screws used as reinforcement for
single large diameter dowels, could be an effective way of increasing strength, ductility and
stiffness of the connection. Tests showed that when using self-tapping reinforcement
screws on connectors placed closed to the end grain, both stiffness and strength was
considerably increased. The distance to end grain wood can therefore be reduced without
negatively affecting the strength and stiffness. The testing also indicated a significant
increase in ductility when reinforcement screws were present (Crocetti, et al., 2010).
Since Eurocode does not provide a method for calculating the resistance when
reinforcement screws are used, Bejtka and Blass developed an extension to Johansen´s
yield theory. The calculation method developed indicates an increase of load-carrying
capacity up to 80% for connections with a ductile failure behavior and up to 120% increase
for connections with brittle failure behavior. These values were both verified by tests
(Bejtka & Blass, 2005).
1.4 Aim
This experimental study aims to investigate different connection design solutions for large
span timber trusses made from structural timber. The focus will be on birch plywood
connections, how different strengthening techniques and how material combinations
impact the load-bearing capacity and failure behavior. The goal is to provide a better
understanding of how structural timber could be used as truss member material.
1.5 Limitations
This study will not investigate how the capacity and failure behavior of the connection is
affected due to different grain directions on the plywood used as gusset plates. Instead,
focus will be on methods for improving the performance of the connections. The testing in
this experimental study only consists of axial testing of the joints. No full-scale, bending or
long-term tests were performed.

4
CHAPTER 2 - Relevant theory
2.1 Trusses in general
2.1.1 Structural aspects A truss consists of geometrically stable triangles, joined together to form a load-bearing
structure. Compared to a beam, trusses have a much higher material utilization due to most
of the material being placed in the upper and lower part of the cross section, which is called
top chord and bottom chord respectively. The elements between the top and bottom chord
are usually referred to as web members. Typically, the top chord will be in compression
and the bottom chord in tension. The truss web is carrying the shear forces either by
diagonal or diagonal and vertical members. If these diagonal or diagonal and vertical
members act in tension or compression depends on the design of the truss. In Figure 2-1,
the most common design types for parallel chord trusses are presented. For these types of
trusses, the loads in the web members are usually large, resulting in some difficulties
designing joints that are strong enough.
Figure 2-1 – Different types of parallel chord trusses. a) Howe, diagonals in compression. b) Pratt, diagonals in tension. c) Warren, diagonals in both compression and tension.
Since this thesis will focus on connections for roof trusses, pitched trusses will be of bigger
interest than parallel chord trusses. This is because the shape of a pitched truss is a better
representation of the moment distribution for a distributed load which leads to part of the
load being transferred directly through the top chord, resulting in the webs having to
transfer relatively small loads compared to the parallel chord trusses. The ideal shape
would be an exact representation of the moment distribution, a so-called bowstring truss.
When constructed in glulam, these structures can easily reach spans of 60 – 70 meters. In
Figure 2-2, different roof truss types are presented.
Figure 2-2 – Different type of roof trusses. d) Trapezoidal (Howe type). e) triangular with horizontal bottom chord. f) bowstring shaped with horizontal bottom chord.
For large span timber truss structures, glulam is the most commonly used material.
Structural timber is often used for smaller spans like roof trusses for small houses.
However, there are examples of large span structures where structural timber is used
5
instead of glulam. In Sweden, a company called Derome has built trusses with spans up to
28 meters using structural timber. These trusses were built using the same techniques as
for small roof trusses i.e. structural timber members joined together using nail plates.
A truss system capable of reaching spans up to 60 meters was developed by Professor Jean-
Luc Sandoz. This system is called “Ariane” and uses several layers of structural timber studs
connected to each other using plywood or LVL panels and screws.
2.1.2 Transportation Transportation is an important aspect when it comes to large span trusses. Depending on
the element dimensions, different methods of transfer and different rules apply, which is
why this is important to consider at an early stage in the project. The most common way
of transfer is by truck. In Sweden, the maximum total vehicle length is 24 meters, but with
a general permission from the transport administration, this could be increased to 30
meters, the same permission is needed for cargos with widths between 2,6-3,1 meters. If
the cargo is wider than this, a separate permission is required for every occasion. The
height limit for transport by roads is 4,5 meters, which for trusses is important to consider.
For a typical triangular roof truss ( Figure 2-2, e) ), the height to length ratio is about 1/6.
This means that for a 30-meter span, the height is about 5 meters, which is more than what
is possible to transport by truck. This could be solved either by dividing the truss into
multiple members or by changing the design to for example a Howe type truss (Figure 2-2,
d)), which has a lower height to length ratio. If the truss must be divided into multiple truss
members, it must be possible to construct the joints on the construction site. This could be
one strong reason for using structural timber as truss member material. Joining truss
members with gusset plates of for example birch plywood could be done directly on the
building site instead of in a factory and thereby obliterating the problem of transporting
large trusses.
2.1.3 Economy Large span timber roof trusses are generally economically justifiable for spans over 25 – 30
meters. They are usually made from glulam with steel connections transferring loads from
member to member. However, for large glulam cross-sections, the connections become
complex and expensive. Using structural timber in combination with other easily accessible
materials could be a way to avoid expensive specially designed components.
2.2 Material Properties
2.2.1 Mechanical properties When studying material deformations, we are not satisfied by just knowing the total
deformation, we also want to know in what way it was deformed, did it go fast or slow, did
the deformation start right away or did it happen all at once when the load became
sufficiently large and so on. How a material behaves when exposed to loading depends on

6
different material properties, the for this study most important properties are described
below.
Elasticity/stiffness
Elasticity and stiffness are important material properties. The elasticity is the materials
ability to store deformation as potential energy, that is the ability to restore its original
proportions when unloaded. The classical mechanical definition of elasticity is the
relationship between stress and deformation which is the elastic modulus 𝐸. The elastic
modulus is defined as in equation 2.1.
𝐸 =𝜎
휀 2.1
Where 𝜎 is the stress and 휀 the strain.
The stiffness is the materials ability to withstand deformation when a force is applied and
is defined as in equation 2.2.
Where 𝐹 is the applied force and 𝛿 is the displacement.
For timber connections where screws are used, the stiffness in the serviceability state 𝐾𝑠𝑒𝑟
can be estimated according to equation 2.3. The value is expressed in 𝑁/𝑚𝑚 per shear
plane and fastener.
𝐾𝑠𝑒𝑟 = 𝜌𝑚1.5𝑑/23 2.3
Where 𝜌𝑚 is the mean density and 𝑑 is the screw diameter. When different timber
materials are used a combined mean density must be calculated according to equation 2.4.
𝜌𝑚 = √𝜌𝑚.1𝜌𝑚.2 2.4
Where 𝜌𝑚.1 and 𝜌𝑚.2 are the different materials mean density. For connections between
steel and timber, 𝜌𝑚 is to be based on the timber material and then multiplied by 2.
The stiffness for the ultimate limit state can then be calculated according to equation 2.5.
𝐾𝑢 =2
3𝐾𝑠𝑒𝑟
2.5
Yield and ultimate tensile strength
𝑘 =𝐹
𝛿
2.2

7
The yield strength of a material is at what stress level it starts to deform plastically instead
of elastically. The ultimate tensile strength of a material is the maximum stress the material
can withstand before going to failure.
Ductility
Ductility is a property that describes the behavior of a material or structure when exposed
to stress. Higher ductility means that the material or structure can withstand a larger plastic
deformation before failing. For structures, a slow failure hence high ductility is preferable.
To find the plastic deformation using a tensile test, the specimen is unloaded at the
ultimate stress point causing the elastic deformation to revert, leaving only the plastic
deformation. The plastic deformation is one way to represent the ductility. However, in
this thesis, the ductility will be defined as the ratio between the displacement at rapture
𝑉𝑢 and the yield displacement 𝑉𝑦, see equation 2.6.
2.2.2 Deterioration There are several different deterioration mechanisms for building materials. Biological,
irradiation, chemical and electro-chemical is the most common. When it comes to timber
the main issues are often biological and strongly related to moisture and temperature.
Biodeterioration (biological deterioration) is a natural process and part of nature’s carbon
cycle. This is a necessary process for all life on earth. However, it may cause problems for
a structure where timber is used as a building material. Deterioration could lead to a
decrease in load-bearing capacity, change in failure behavior and generation of toxic gases
that could harm people residing in the building. The sensitivity to deterioration varies with
different species of wood. Birch is extra sensitive to deterioration which explains why it is
not often used in weather exposed construction.
2.3 Timber joint design
Three main parameters influence the load-bearing capacity and failure behavior of joints.
These are embedding strength, yield moment for the fastener and withdrawal strength.
Note that the equations presented in the following chapter differ from the equations
provided by Eurocode 5 in the sense that mean values are used instead of characteristic
values. This is since characteristic values correspond to the 0,05 percentile, while the mean
values correspond to the 0,50 percentile. Therefore, using mean- rather than characteristic
values yields a more correct estimation of the capacity even if it is not recommended for
designing purposes.
2.3.1 Embedding strength A fastener that is loaded in angle to the grain direction will produce pressure against the
wood that is surrounding it. For the simple case with only one timber member, the fastener
𝐷 =𝑉𝑢𝑉𝑦
2.6

8
can be seen as a simply supported beam on elastic soil. The pressure that is caused by the
loaded fastener on to the surrounding timber is called embedding pressure. How much
embedding pressure the surrounded timber can withstand is called the embedding
strength. Important parameters that affect the embedding strength are the density of the
timber, the diameter of the fastener, the angle between load and grain direction, the
timber moisture content, the friction and whether the hole for the fastener is pre-drilled
or not.
Eurocode part 5 provides empirical equations for the determination of embedding strength
(EN1995-1-1, 2004). For example, the embedding strength for wood with screw diameter
up to 30 millimeters is calculated according to equation 2.7. For plywood, equation 2.8 is
used instead.
Where the diameter 𝑑 is expressed in 𝑚𝑚 and the mean density 𝜌𝑚𝑒𝑎𝑛 in 𝑘𝑔/𝑚3.
2.3.2 Yield moment When a fastener reaches its yield moment a plastic hinge is formed. For screws, the yield
moment can be determined with equation 2.9, where 𝑓𝑢 is the ultimate steel strength in
𝑁/𝑚𝑚2 and 𝑑 the screw diameter in millimeters.
𝑀𝑦,𝑅 = 0,3𝑓𝑢𝑑2,6 2.9
2.3.3 Withdrawal capacity The withdrawal strength for screws can reach high values and is partially dependent on the
dimensions and threading of the screw and the density of the timber. The withdrawal
strength perpendicular to the grain direction in [𝑁/𝑚𝑚2], can be determined according
to equation 2.10, given that the diameter of the threaded part of the screw is between 6
and 12 millimeters and the ratio between the diameter of the threaded and non-threaded
part is between 0,6 and 0,75.
𝑓𝑎𝑥 = 0,52𝑑−0,5𝑙𝑒𝑓
−0,1𝜌𝑚𝑒𝑎𝑛0,8 2.10
where 𝑙𝑒𝑓 is the length of the threaded part of the screw embedded in wood, 𝑑 the
diameter and 𝜌𝑚𝑒𝑎𝑛 the mean density of the timber.
To then calculate the withdrawal strength in [𝑁], of a connection with screws, equation
2.11 is used.
𝑓ℎ,0,𝑡𝑖𝑚𝑏𝑒𝑟 = 0,082(1 − 0,01𝑑)𝜌𝑚𝑒𝑎𝑛
2.7
𝑓ℎ,0,𝑝𝑙𝑦𝑤𝑜𝑜𝑑 = 0,11(1 − 0,01𝑑)𝜌𝑚𝑒𝑎𝑛 2.8

9
𝐹𝑎𝑥.𝑅 =𝑛𝑒𝑓𝑓𝑎𝑥,𝑘 𝑑 𝑙𝑒𝑓 𝑘𝑑
1,2 cos2 𝛼 + sin2 𝛼
2.11
𝑘𝑑 = 𝑚𝑖𝑛 {𝑑
81
2.12
Where 𝑛𝑒𝑓 is the effective number of screws, 𝑑 the diameter of the threaded part, 𝑙𝑒𝑓 the
length of the threaded part embedded in timber and 𝛼 the angle between the screw and
the grain direction. The value 𝑘𝑑 is to be calculated according to equation 2.12.
To calculate effective number of screws, equation 2.13 is used.
𝑛𝑒𝑓 = 𝑚𝑖𝑛 {
𝑛
𝑛0.9√𝑎113𝑑
4
2.13
Where 𝑎1 is the screw distance in the fiber direction and 𝑑 the screw diameter. This method
was used only for connections where reinforcement screws were not used.
2.4 Failure modes
2.4.1 Johansen´s yield theory In 1949, the first method of calculating
the resistance for a dowelled joint was
put forward by Johansen (Johansen,
1949). According to Johansen´s theory, a
single shear dowelled joint can fail in
three different ways, see Figure 2-3.
When designing a joint, all possible
failure modes must be considered and
the one resulting in the lowest
resistance chosen. However, this
method of calculating the joint
resistance is only valid when perfect elasticity of both the timber and the fastener is
assumed. Therefore, when failure occurs before the embedment strength is reached for
example by splitting of the timber, other methods must be applied. To deal with this,
Eurocode uses different requirements that must be fulfilled in order to use different
equations. One example is requirements on distances between fasteners and end
distances. When the distance between fasteners is not enough, an effective number of
fasteners 𝑛𝑒𝑓 is used instead of the actual number of fasteners.
Figure 2-3 – Possible failure modes for a single shear connection

10
2.4.2 Brittle failure Contrary to the assumption made in Johansen´s theory, timber joint failure is not always
characterized by a ductile embedding failure. Premature splitting failure might occur
before the embedding strength is reached. Timber member thickness, the spacing between
dowels, end edge distances and the angle between load and grain are parameters that
affect the tendency of splitting failure. Increasing the spacing between the fasteners will
decrease the probability for splitting failure, however, this makes the connection larger
which is not desirable. Another way to make the connection stronger to splitting failure is
by reinforcement, by for example wood-based panels glued on to both sides of the shear
plane or self-tapping screws arranged in front of and perpendicular to the connection
fastener. For this experimental study, the latter will be used, this will be explained further
in the next section.
2.5 Multiple shear planes
Eurocode provides equations for calculating the resistance of joints in double shear
according to Johansen´s yield theory. For timber to timber connections in double shear,
four different failure cases presented in Figure 2-4 should be taken into consideration.
When having more than two shear planes Eurocode recommends that every shear plane
of the joint should be viewed as a part of a joint in double shear. This gives rise to many
different failure modes. However, not all combinations of failure modes are possible. In
Figure 2-5 an illustration of possible failure modes for a timber to timber joint with four
shear planes according to the book “Timber Engineering” is presented (Blass & Sandhaas,
2017). The shaded parts indicate cavities in the timber caused by embedment failure.
Figure 2-5 – Possible failure modes for a timber to timber joint with four shear planes (Blass & Sandhaas, 2017)
Figure 2-4 – Possible failure cases for a timber to timber joint according to Johansen´s yield theory
11
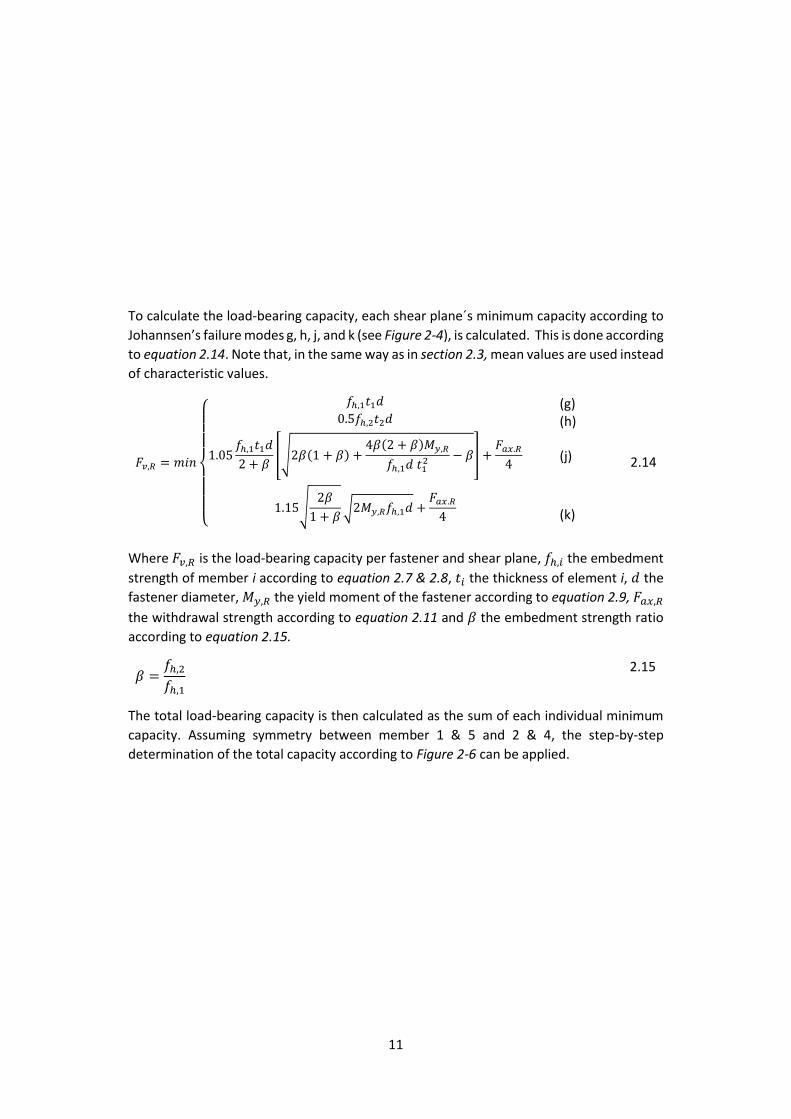
To calculate the load-bearing capacity, each shear plane´s minimum capacity according to
Johannsen’s failure modes g, h, j, and k (see Figure 2-4), is calculated. This is done according
to equation 2.14. Note that, in the same way as in section 2.3, mean values are used instead
of characteristic values.
𝐹𝑣,𝑅 = 𝑚𝑖𝑛
{
𝑓ℎ,1𝑡1𝑑
0.5𝑓ℎ,2𝑡2𝑑
1.05𝑓ℎ,1𝑡1𝑑
2 + 𝛽[√2𝛽(1 + 𝛽) +
4𝛽(2 + 𝛽)𝑀𝑦,𝑅
𝑓ℎ,1𝑑 𝑡12 − 𝛽] +
𝐹𝑎𝑥.𝑅4
1.15√2𝛽
1 + 𝛽√2𝑀𝑦,𝑅𝑓ℎ,1𝑑 +
𝐹𝑎𝑥.𝑅4
(g)
2.14
(h)
(j)
(k)
Where 𝐹𝑣,𝑅 is the load-bearing capacity per fastener and shear plane, 𝑓ℎ,𝑖 the embedment
strength of member i according to equation 2.7 & 2.8, 𝑡𝑖 the thickness of element i, 𝑑 the
fastener diameter, 𝑀𝑦,𝑅 the yield moment of the fastener according to equation 2.9, 𝐹𝑎𝑥,𝑅
the withdrawal strength according to equation 2.11 and 𝛽 the embedment strength ratio
according to equation 2.15.
𝛽 =𝑓ℎ,2𝑓ℎ,1
2.15
The total load-bearing capacity is then calculated as the sum of each individual minimum
capacity. Assuming symmetry between member 1 & 5 and 2 & 4, the step-by-step
determination of the total capacity according to Figure 2-6 can be applied.

12
Figure 2-6 – Step-by-step determination of load bearing capacity for a timber to timber connection with four shear planes (Blass & Sandhaas, 2017)
2.6 Glued timber connections
In timber construction, adhesives are frequently used for finger-jointing and production of
glulam. But when it comes to for example truss joints, adhesives may not be the best choice
due to two reasons. One being the lack of precise design rules, and the other being that
the gluing must be executed in a factory (Xu & Tan, 2015).
Using only adhesives when designing joints can be problematic. In 1964, Volkersen
presented a report showing that the shear stress for a glued connection was not uniformed
(Volkersen, 1964). In Figure 2-7, the shear stress distribution for a glued connection
according to Volkersens theory is presented. The illustration shows that large shear
stresses occur at the edges of the overlapping.
13
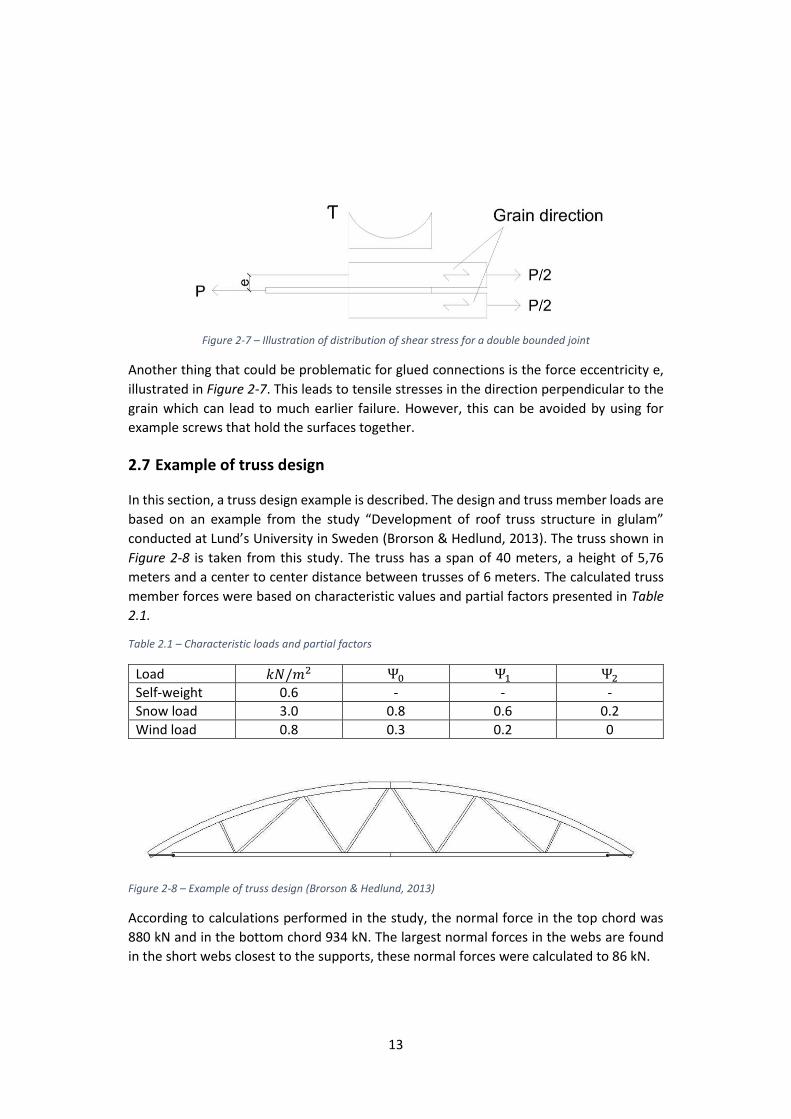
Figure 2-7 – Illustration of distribution of shear stress for a double bounded joint
Another thing that could be problematic for glued connections is the force eccentricity e,
illustrated in Figure 2-7. This leads to tensile stresses in the direction perpendicular to the
grain which can lead to much earlier failure. However, this can be avoided by using for
example screws that hold the surfaces together.
2.7 Example of truss design
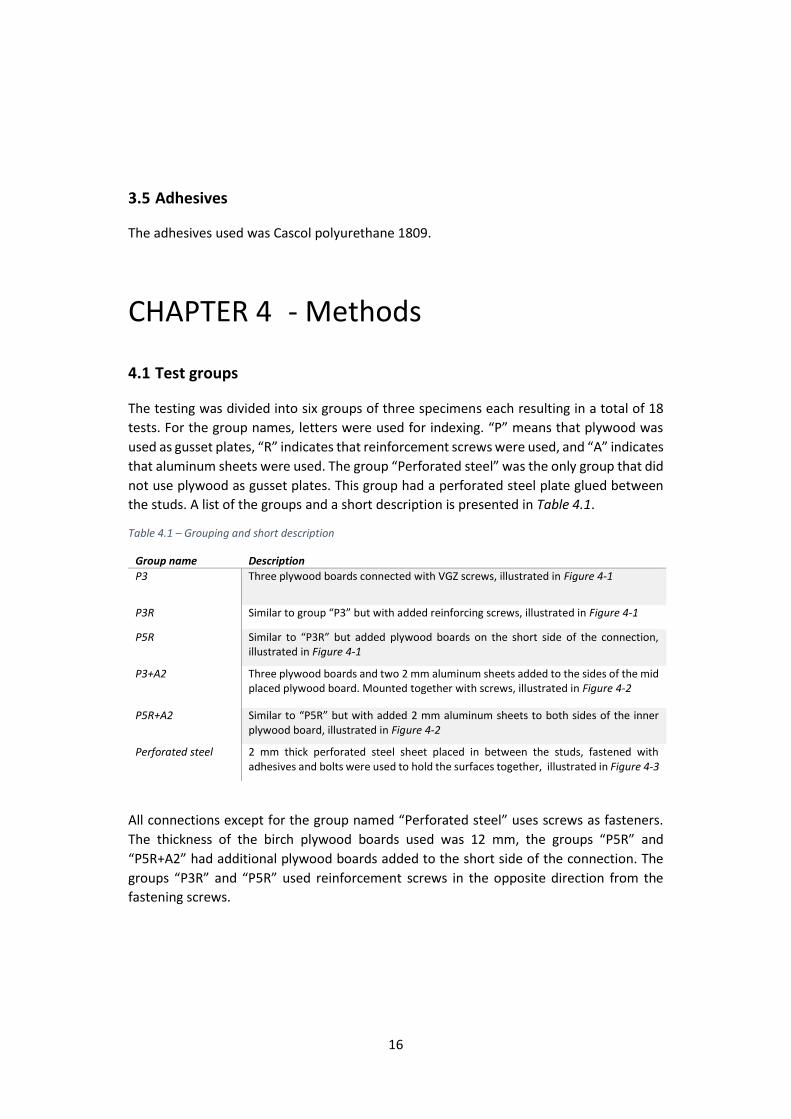
In this section, a truss design example is described. The design and truss member loads are
based on an example from the study “Development of roof truss structure in glulam”
conducted at Lund’s University in Sweden (Brorson & Hedlund, 2013). The truss shown in
Figure 2-8 is taken from this study. The truss has a span of 40 meters, a height of 5,76
meters and a center to center distance between trusses of 6 meters. The calculated truss
member forces were based on characteristic values and partial factors presented in Table
2.1.
Table 2.1 – Characteristic loads and partial factors
Load 𝑘𝑁/𝑚2 Ψ0 Ψ1 Ψ2
Self-weight 0.6 - - -
Snow load 3.0 0.8 0.6 0.2
Wind load 0.8 0.3 0.2 0
Figure 2-8 – Example of truss design (Brorson & Hedlund, 2013)
According to calculations performed in the study, the normal force in the top chord was
880 kN and in the bottom chord 934 kN. The largest normal forces in the webs are found
in the short webs closest to the supports, these normal forces were calculated to 86 kN.

14
This example is only to give the reader an idea of the approximate forces that arise when
constructing large span trusses. The circumstances would change if this truss was designed
in structural timber instead of glulam. For example, the top chord would be divided in to
six straight parts instead of two curved parts. An example of how a joint where plywood
gusset plates are used is presented in Figure 2-9.
Figure 2-9 – Example of plywood gusset plate joint
The capacity and stiffness of the joint can be adjusted by changing the number of screws
and shear planes.
15
CHAPTER 3 - Materials
All values presented in this chapter are according to either the material provider or Swedish
standards. For measured density and moisture content see section 4.2.
3.1 Timber
The studs used for all tests were structural timber of quality C24, with a characteristic
tensile parallel to grain strength of 𝑓𝑡,0,𝑘 = 14 𝑀𝑃𝑎. The C24 timber was provided by the
company Derome. When the C24 timber arrived at KTH, the moisture content was quite
high (see section 4.2.1). A second measurement of the moisture content was performed
after the tests had been executed. This time the moisture content was markedly lower. The
relatively fast drying of the C24 that took place between the measurements led to cracking
of some specimens. Specimens where large cracks were observed were replaced. Studs
with smaller cracks on only one side were still used but assembled so that the side with
small cracks were faced towards the rig connection in order to not impact the performance
of the connection.
The plywood used was made from birch with a mean density of 𝜌𝑚 = 680 𝑘𝑔/𝑚3 and had
a thickness of 12 𝑚𝑚. The plywood was provided by the company Koskisen.
3.2 Steel
The perforated steel plate used for the test group “Perforated steel” was in steel quality
S250GD, with a minimum yield capacity of 𝑓𝑦 = 250 𝑀𝑃𝑎 and a minimum tensile capacity
of 𝑓𝑡 = 330 𝑀𝑃𝑎. The perforated steel plate had a thickness of 2 mm and the hole
diameter was 5 mm. The perforated steel plate was provided by Rothoblaas.
3.3 Aluminum
The aluminum sheets used, contain 99.5 % aluminum and had a thickness of 2 mm. The
sheets were delivered in the dimensions 500 x 1000 mm and were then cut into 215 x 470
mm pieces.
3.4 Screws
The screws used for both fastening of the gusset plates and reinforcement were VGZ screws
from the manufacturer Rothoblaas. The VGZ screw is fully threaded and is made from
carbon with a characteristic yield capacity of 𝑓𝑦,𝑘 = 1000 𝑀𝑃𝑎. It has a yield moment of
𝑀𝑦.𝑅𝑘 = 14174 𝑁𝑚𝑚 and the rope effect is 𝐹𝑎𝑥.𝑅𝑘 = 11.7 𝑀𝑃𝑎. All screws used had a
nominal diameter of 7 𝑚𝑚 and a shank diameter of 5 𝑚𝑚.
16
3.5 Adhesives
The adhesives used was Cascol polyurethane 1809.
CHAPTER 4 - Methods
4.1 Test groups
The testing was divided into six groups of three specimens each resulting in a total of 18
tests. For the group names, letters were used for indexing. “P” means that plywood was
used as gusset plates, “R” indicates that reinforcement screws were used, and “A” indicates
that aluminum sheets were used. The group “Perforated steel” was the only group that did
not use plywood as gusset plates. This group had a perforated steel plate glued between
the studs. A list of the groups and a short description is presented in Table 4.1.
Table 4.1 – Grouping and short description
Group name Description
P3 Three plywood boards connected with VGZ screws, illustrated in Figure 4-1
P3R Similar to group “P3” but with added reinforcing screws, illustrated in Figure 4-1
P5R Similar to “P3R” but added plywood boards on the short side of the connection, illustrated in Figure 4-1
P3+A2 Three plywood boards and two 2 mm aluminum sheets added to the sides of the mid placed plywood board. Mounted together with screws, illustrated in Figure 4-2
P5R+A2 Similar to “P5R” but with added 2 mm aluminum sheets to both sides of the inner plywood board, illustrated in Figure 4-2
Perforated steel 2 mm thick perforated steel sheet placed in between the studs, fastened with adhesives and bolts were used to hold the surfaces together, illustrated in Figure 4-3
All connections except for the group named “Perforated steel” uses screws as fasteners.
The thickness of the birch plywood boards used was 12 mm, the groups “P5R” and
“P5R+A2” had additional plywood boards added to the short side of the connection. The
groups “P3R” and “P5R” used reinforcement screws in the opposite direction from the
fastening screws.

17
Figure 4-1 – Illustration of group ”P3”, ”P3R” and ”P5R”
The groups “P3+A2” and “P5R+A2” had thin aluminum plates placed on each side of the
mid placed plywood. These aluminum plates had a thickness of 2 mm.
Figure 4-2 – Illustration of group ”P3+A2” and “P5R+A2”
The group named “Perforated steel” had a 2 mm thick perforated steel plate glued in
between the studs and fastened with bolts. The holes in the nail plate provide mechanical
bounding for the glue.
18
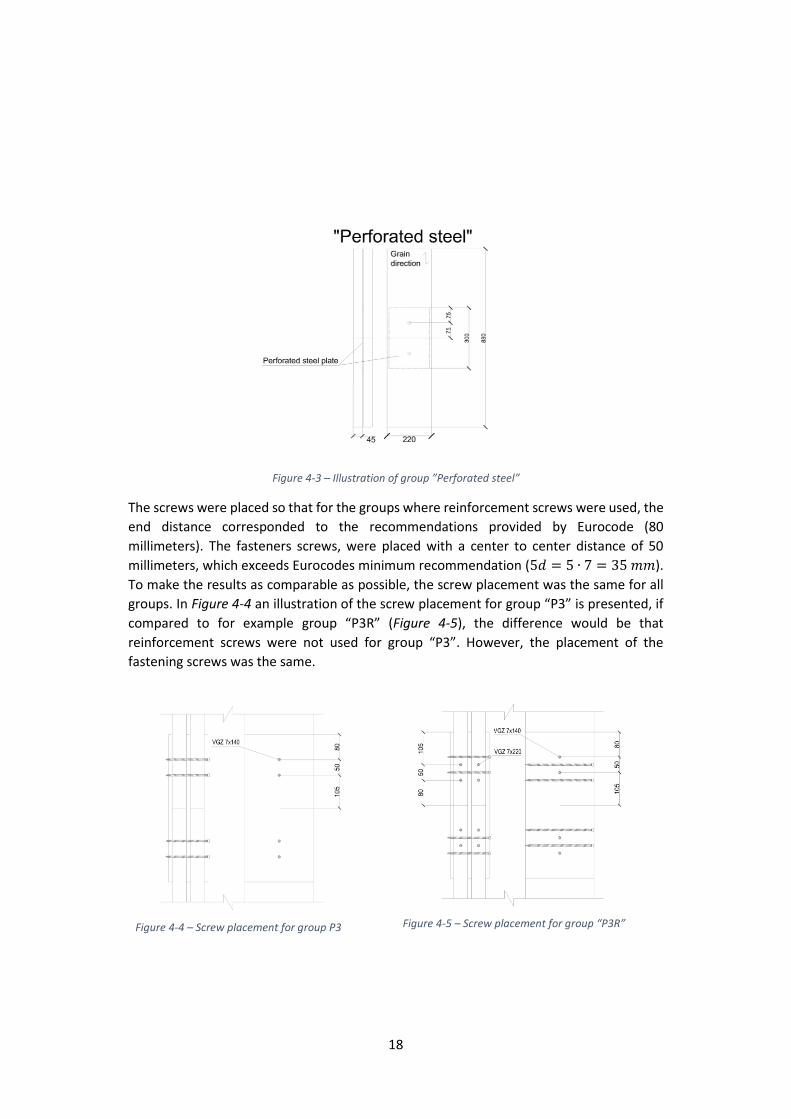
Figure 4-3 – Illustration of group ”Perforated steel”
The screws were placed so that for the groups where reinforcement screws were used, the
end distance corresponded to the recommendations provided by Eurocode (80
millimeters). The fasteners screws, were placed with a center to center distance of 50
millimeters, which exceeds Eurocodes minimum recommendation (5𝑑 = 5 ∙ 7 = 35 𝑚𝑚).
To make the results as comparable as possible, the screw placement was the same for all
groups. In Figure 4-4 an illustration of the screw placement for group “P3” is presented, if
compared to for example group “P3R” (Figure 4-5), the difference would be that
reinforcement screws were not used for group “P3”. However, the placement of the
fastening screws was the same.
Figure 4-4 – Screw placement for group P3
Figure 4-5 – Screw placement for group “P3R”
19
4.2 Measurements
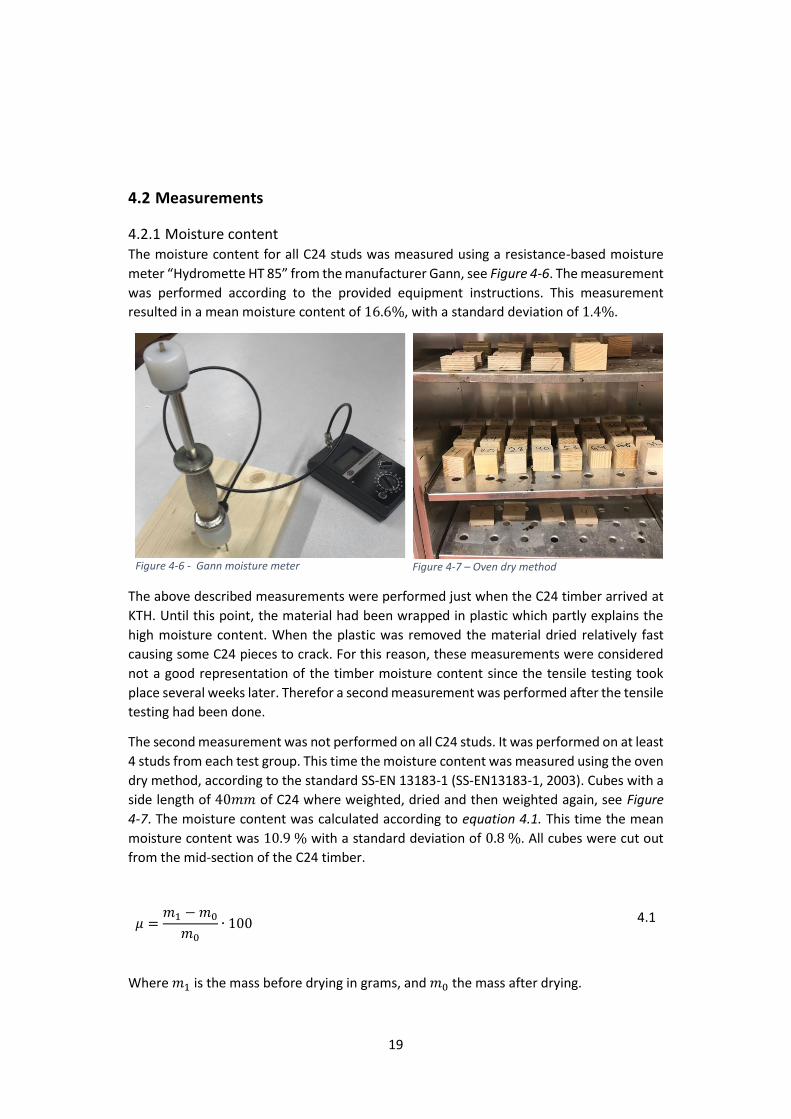
4.2.1 Moisture content The moisture content for all C24 studs was measured using a resistance-based moisture
meter “Hydromette HT 85” from the manufacturer Gann, see Figure 4-6. The measurement
was performed according to the provided equipment instructions. This measurement
resulted in a mean moisture content of 16.6%, with a standard deviation of 1.4%.
Figure 4-6 - Gann moisture meter
Figure 4-7 – Oven dry method
The above described measurements were performed just when the C24 timber arrived at
KTH. Until this point, the material had been wrapped in plastic which partly explains the
high moisture content. When the plastic was removed the material dried relatively fast
causing some C24 pieces to crack. For this reason, these measurements were considered
not a good representation of the timber moisture content since the tensile testing took
place several weeks later. Therefor a second measurement was performed after the tensile
testing had been done.
The second measurement was not performed on all C24 studs. It was performed on at least
4 studs from each test group. This time the moisture content was measured using the oven
dry method, according to the standard SS-EN 13183-1 (SS-EN13183-1, 2003). Cubes with a
side length of 40𝑚𝑚 of C24 where weighted, dried and then weighted again, see Figure
4-7. The moisture content was calculated according to equation 4.1. This time the mean
moisture content was 10.9 % with a standard deviation of 0.8 %. All cubes were cut out
from the mid-section of the C24 timber.
𝜇 =𝑚1 −𝑚0
𝑚0∙ 100 4.1
Where 𝑚1 is the mass before drying in grams, and 𝑚0 the mass after drying.

20
All results from both the first and second measurement is presented in APPENDIX B.
4.2.2 Density The density was calculated using measurements and weight. For the C24, 60 pieces were
measured and weighted. This resulted in a mean density 443.3 𝑘𝑔/𝑚3, with a standard
deviation of 41.2 𝑘𝑔/𝑚3 . The density of the plywood where calculated by cutting out
50𝑥50 𝑚𝑚 pieces and weigh them. The plywood used were delivered in two sheets, and
these measurements were done two times on each sheet. This resulted in a mean density
680𝑘𝑔/𝑚3 with a standard deviation of 6.2 𝑘𝑔/𝑚3.
A second measurement of the density was performed by measuring dimension and weight
of the cubes that where cut for the second moisture content measurement. These
measurements resulted in a C24 mean density of 465 𝑘𝑔/𝑚3 with a standard deviation of
64.3 𝑘𝑔/𝑚3. However, these measurements of density were uncertain due to uneven cut
pieces. For this reason, the values from the first density measurement were used for
calculation of the estimated capacity and stiffness.
4.3 Calculations
Both estimated stiffness and capacity were calculated in accordance with Euro Code 5
(EN1995-1-1, 2004). The mean value from the second density measurement described in
4.2.2 was used. For the screw parameters, characteristic values for the yield moment 𝑀𝑦.𝑅
and rope effect 𝑓𝑎𝑥.𝑅 were taken from the Technical Data Sheet provided by Rothoblaas.
These values were then increased with 10 % to compensate for being characteristic values
and not mean values.
For all test groups except the group “Perforated steel”, an estimated capacity was
calculated. For groups where reinforcement screws were used, no consideration to
effective number of screws due to screw placement was taken. For groups where
aluminum plates were used, failure mode “k” according to Johansen´s theory, was assumed
in the mid placed shear planes.
The estimated capacity per screw was calculated by dividing the total capacity with the
number of fastener screws. The reinforcement screws used in group “P3R” were not
regarded as fastener screws.
An estimated stiffness was also calculated in accordance with Euro Code. For connections
where aluminum sheets were used, the same method of multiplying the mean density 𝜌𝑚
by 2, as described in section 2.2.1 was applied. This method is usually used for timber to
steel connections, but since Euro Code does not provide any stiffness calculation model for
timber to aluminum connections it was used in this case.
The performed calculations are presented in APPENDIX C – Calculations.

21
4.4 Tensile test
The machine used for the tensile testing was an MTS 500 and is shown in Figure 4-8. The
tests were performed at The Swedish Cement and Concrete Research Institute (CBI).
Figure 4-8 – MTS 500
Each specimen was installed in the machine in the same way. A large diameter dowel and
steel plates were used to connect each specimen to the machine. To ensure a good fit, the
steel plates were mounted to each other with bolts. The dowels used was made of steel
quality S355. The dowel used for the timber to steel connection had a diameter of 40
millimeters and the dowel used for the rig connection had a diameter of 12 millimeters. In
order to avoid premature splitting failure of the timber members, self-tapping screws were
used to reinforce the timber. For testing groups with an estimated maximum load 𝐹𝑒𝑠𝑡
larger than 30 kN, baubuche boards with a thickness of 21 millimeters were glued on the
outside of the timber members to increase the embedding strength and thereby increase
the overall capacity of the rig connection. The capacity of the joint was estimated using the
equations presented in the chapter “relevant theory” and can be read in APPENDIX C –
Calculations. The doweled joint was designed in such a way that the estimated capacity
was at least twice as big compared to the estimated joint capacity. An illustration of the
not glue reinforced test setup is presented in Figure 4-9.
4.4.1 Displacement measurements When testing the connections, it was important to measure the relative slip of the
connection in order to calculate stiffness and ductility. This was done with external devices
for displacement measurements, also called LVDT’s (linear variable displacement
Figure 4-9 – Test setup
22
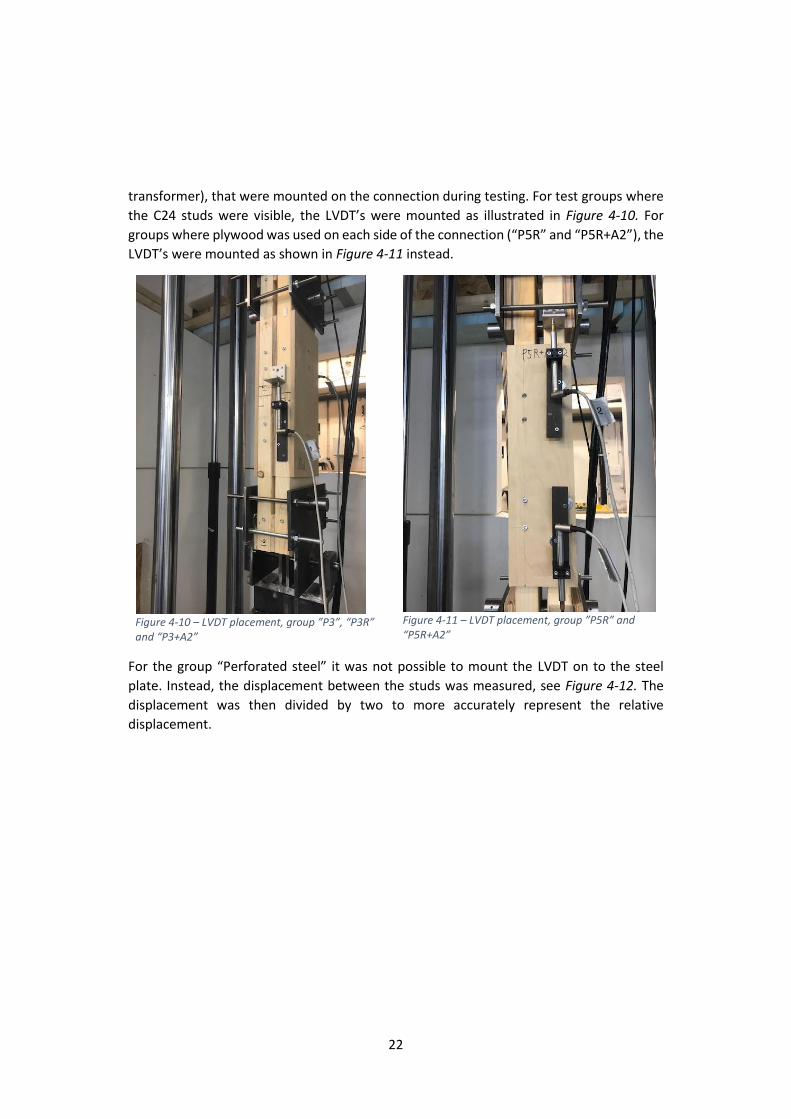
transformer), that were mounted on the connection during testing. For test groups where
the C24 studs were visible, the LVDT’s were mounted as illustrated in Figure 4-10. For
groups where plywood was used on each side of the connection (“P5R” and “P5R+A2”), the
LVDT’s were mounted as shown in Figure 4-11 instead.
Figure 4-10 – LVDT placement, group ”P3”, “P3R” and “P3+A2”
Figure 4-11 – LVDT placement, group ”P5R” and “P5R+A2”
For the group “Perforated steel” it was not possible to mount the LVDT on to the steel
plate. Instead, the displacement between the studs was measured, see Figure 4-12. The
displacement was then divided by two to more accurately represent the relative
displacement.

23
Figure 4-12 – Placement of LVDT, group ”Perforated steel”
4.4.2 Application of load The load was applied in several steps. First, each specimen was loaded up to approximate
40 % of the estimated capacity 𝐹𝑒𝑠𝑡 and maintained for 30 seconds. The load was force-
controlled with the speed 0.2 𝑘𝑁/𝑠. After this step, each specimen was unloaded to 2 𝑘𝑁
at the load rate 2 𝑘𝑁/𝑠. Thereafter, each specimen was loaded until failure or until a
relative displacement of 10 mm was reached. The load rate when loaded to failure was
displacement controlled with the rate 0.05 𝑚𝑚/𝑠. The loading procedure is illustrated in
Figure 4-13.
Figure 4-13 – Loading procedure

24
4.4.3 Maximum load Most tested groups showed a very ductile failure behavior which in many cases led to no
physical failure occurring. For this reason, the maximum load 𝐹𝑚𝑎𝑥 was defined as either
the load corresponding to physical failure or the load corresponding to a relative
displacement of 10 𝑚𝑚, whichever occurred first. A typical load slip curve can be seen in
Figure 4-14.
Figure 4-14 – Typical load slip curve
4.4.4 Stiffness For all groups except “Perforated steel”, the stiffness 𝑘 was calculated as the slope of a line
drawn between the points corresponding to 10 and 40% of the estimated capacity 𝐹𝑒𝑠𝑡 on
the load slip curve, see Equation 4.2. The stiffness 𝑘 represents the slope of the curve after
the preloading cycle corresponding to the points 21 and 24 in Figure 4-13. For the group
“Perforated steel” the stiffness was instead calculated as the slope between 10 and 80% of
the capacity based on the test results due to unevenness in the 10 to 40% load slip zone.
𝑘 =0.4𝐹𝑒𝑠𝑡 − 0.1𝐹𝑒𝑠𝑡
𝛿0.4 − 𝛿0.1
4.2
4.4.5 Efficiency For each group, an efficiency 𝑃, expressed in 𝑀𝑃𝑎 per fastener and shear plane was
calculated based on the test results. The efficiency was calculated by dividing the measured
capacity with the area based on screw placement, the number of shear planes and the
number of fasteners, see Equation 4.3.
𝑃 =𝐹𝑚𝑎𝑥
𝐴 ∙ 𝑛𝑠 ∙ 𝑛𝑠𝑝
4.3

25
Where 𝑛𝑠 is the number of screws, 𝑛𝑠𝑝 the number of shear planes and 𝐴 the area
corresponding to the screw placement for the tests (28𝑥50 𝑚𝑚). 28 mm is based on Euro
codes recommendation for minimum distance between screws in the transverse to load
direction.
For the test group “Perforated steel”, the efficiency was calculated by dividing the
measured capacity with the number of shear planes and the area of the glued connection
(200𝑥150 𝑚𝑚).
4.5 Construction of test specimens
All specimens were constructed at KTH, Stockholm, Sweden. The machinery and tools used
were all provided by KTH. A table saw was used for cutting of the board material, a steel
sheet cutter was used for cutting of the aluminum sheets and a pillar drill was used for all
drilling. In addition to these machines, necessary hand tools such as screwdrivers, clamps
and a folding rule etc. was used during the construction.
Figure 4-15 – Steel sheet cutter
Figure 4-16 – Table saw
Cutting of aluminum sheets was done using a steel sheet cutter as seen in Figure 4-15. The
sheets were delivered in the dimension 500 𝑥 1000 𝑚𝑚 and then cut into 215 𝑥 470 𝑚𝑚
pieces.
A table saw was used to cut the plywood board into 220 𝑥 470 𝑚𝑚 pieces. The table saw
can be seen in Figure 4-16.
The table saw was also used for cutting of Baubuche used for reinforcement of the C24
timber. The baubuche boards were also predrilled with a 3 mm drill in each corner to avoid
splitting when later screwed on to the C24 timber.

26
The C24 studs were delivered in the correct dimensions. The first step was to measure
density and moisture content. The C24 studs were then labeled from number 1 to 72. When
this was done, the baubuche board was glued on using screws and clamps. This was only
done for groups with an estimated capacity 𝐹𝑒𝑠𝑡 larger than 30 𝑘𝑁. After this step, a
42 𝑚𝑚 hole for the 40 𝑚𝑚 dowel used for the attachment to the machine was drilled. To
ensure a consistent placement of the hole, a template was used to mark the positioning.
Before the 42 𝑚𝑚 hole where drilled, a 4 𝑚𝑚 guide hole was drilled to further ensure the
positioning. All C24 studs was reinforced with a 220 𝑚𝑚 long self-drilling VGZ screw,
placed 85 𝑚𝑚 from the edge. This was to prevent premature failure due to splitting of the
C24 timber when the 40 𝑚𝑚 dowel was loaded. In Figure 4-17 and Figure 4-18, the
different reinforcement methods are shown.

27
Figure 4-17 – Screw reinforced C24 stud
Figure 4-18 – Glued on baubuche, 42 mm hole and installed reinforcement screw
Figure 4-19 – Mounting of connection

28
During the assembly of the connections, the dowels were used to get every part in line as
shown in Figure 4-19. When everything was lined up, clamps were used to hold everything
in position while pre-drilling holes for the screws. To ensure holes to be drilled vertically,
all holes were drilled through a square wooden cube with a pre-drilled vertical hole in it.
To make sure a consistent placement of the screws and reinforcing screws, a template was
used when pre-drilling.
For the “Perforated steel” group, each specimen was glued together using the same glue
used for the glue-reinforcing of the doweled connection. Before gluing, each perforated
steel plate was washed with 98% alcohol and then sanded with 240 grit sandpaper. When
the glue had hardened, a 14 mm hole for the 12 mm bolt was drilled on each side of the
connection. The bolt was then installed and tensioned in order to keep the connection
together. The reason for the hole being larger than the bolt was that the bolt was not
supposed to contribute to an increased load bearing capacity. Ready for testing specimens
from test groups “Perforated steel”, “P5R” and “P3” is presented in
Figure 4-20, Figure 4-21 and Figure 4-22 respectively.
Figure 4-20 – A ready for testing ”Perforated steel” specimen
Figure 4-21 - A ready for testing ”P5R” specimen
Figure 4-22 - A ready for testing ”P3” specimen

29
CHAPTER 5 - Results and discussion
5.1 Pre-testing of dowelled rig connection
In order to test the capacity of the dowel connection to the rig, three test specimens were
designed without connections, one using only screw reinforcement, one using glue
reinforcement and one a combination of both. In Figure 5-2, the test setup for testing the
glue-reinforced rig connection is shown. The results presented in Figure 5-1, were smaller
than estimated which led to some necessary changes of the test design.
Figure 5-1 – Test result from different methods of reinforcement
The reasons for the surprisingly low results were most likely due to the already existing
cracks in the C24 timber. All three specimens failed by plug shear. In Figure 5-3 the failed
screw reinforced connection is shown.
Since the estimated capacity for the screw reinforced connection was 74 kN, but the
maximum load when tested only 35, the rig connection for groups “P3R” and “P3+A2” had
to be reinforced. This was done by gluing plywood boards between and on the outside of
the C24 timber. The plywood was glued above the dowel hole in order to reinforce the C24
timber to avoid premature failure. For the group “P3R” three 12 mm birch plywood was
glued on the outside and in between the C24 studs. For the group “P3+A2” two 12 mm
birch plywood was glued on the outsides while a 12 mm and a 6 mm birch plywood board
was glued between the studs, see Figure 5-4.
0
10
20
30
40
50
60
70
80
90
100
110
120
0 2 4 6 8 10 12 14
kN
mm
Glue
Glue + Screw
Screw

30
Figure 5-2 – Test setup for glue-reinforced rig connection
Figure 5-3 – Plug shear failure, screw reinforced connection
Figure 5-4 – Glue reinforced specimen, group “P3+A2”
5.2 Capacity and failure behavior
Three specimens of each test group were tested resulting in a total of 18 tests. Most test
specimens had two LVDT’s installed. For these specimens, two load slip relationships were
obtained per test specimen. The results from specimens where no LVDT was installed could
not be used to determine the stiffness since no relative displacement was measured during
these tests. The results from these tests could, however, be used to determine the capacity,
but only if a physical failure occurred. Results from each individual test specimen as well as
the load slip relation for each test group is presented in
31
APPENDIX A.
Test groups “P3R” and “P3R+A2” had dual LVDT’s installed on all three test specimens.
“P5R+A2” had dual LVDT’s installed on two and a single on the third specimen. Test groups
“P3” and “P5R” had LVDT’s installed on two specimens each. However, one specimen of
group “P3” failed in the connection to the machine. The results from “P3” is therefore
based on only one test. The test group “perforated steel” had one LVDT installed on all
three specimens.
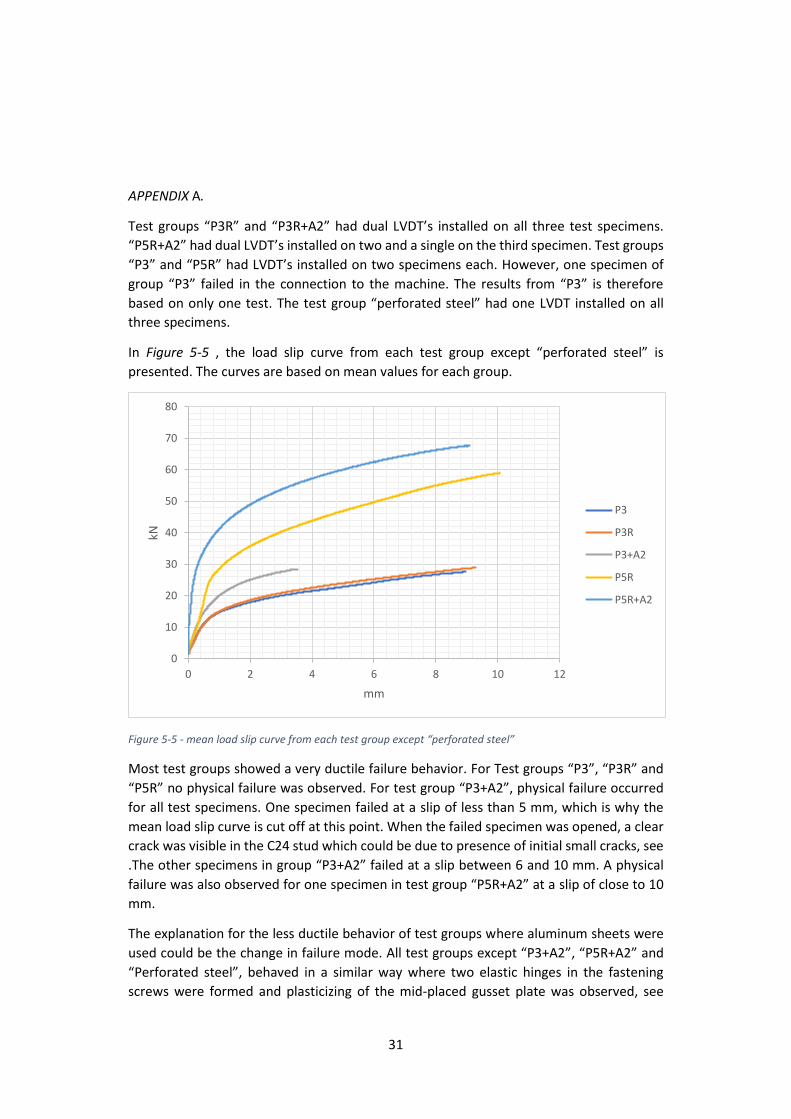
In Figure 5-5 , the load slip curve from each test group except “perforated steel” is
presented. The curves are based on mean values for each group.
Figure 5-5 - mean load slip curve from each test group except “perforated steel”
Most test groups showed a very ductile failure behavior. For Test groups “P3”, “P3R” and
“P5R” no physical failure was observed. For test group “P3+A2”, physical failure occurred
for all test specimens. One specimen failed at a slip of less than 5 mm, which is why the
mean load slip curve is cut off at this point. When the failed specimen was opened, a clear
crack was visible in the C24 stud which could be due to presence of initial small cracks, see
.The other specimens in group “P3+A2” failed at a slip between 6 and 10 mm. A physical
failure was also observed for one specimen in test group “P5R+A2” at a slip of close to 10
mm.
The explanation for the less ductile behavior of test groups where aluminum sheets were
used could be the change in failure mode. All test groups except “P3+A2”, “P5R+A2” and
“Perforated steel”, behaved in a similar way where two elastic hinges in the fastening
screws were formed and plasticizing of the mid-placed gusset plate was observed, see
0
10
20
30
40
50
60
70
80
0 2 4 6 8 10 12
kN
mm
P3
P3R
P3+A2
P5R
P5R+A2

32
Figure 5-6 and Figure 5-7. For test groups where aluminum was used, the failure mode
changed. For these groups plastic hinges were also formed in the mid-placed gusset plate
due to the added aluminum sheets, see Figure 5-8 and Figure 5-9. This led to less
plasticizing of the mid-placed plywood gusset plate and more plasticizing of the C24 timber,
which led to failure by cracking in the C24 timber, see Figure 5-10 and Figure 5-11. Since
some C24 studs had initial cracks due to the fast-drying process described in section 3.1, it
can’t be ruled out that small initial cracks or weakening’s were present, even if none were
observed.

33
Figure 5-6 – Typical failure mode for test groups were aluminum was not used. In this case test group “P5R”.
Figure 5-7 – Plasticizing of mid-placed gusset plate for test group “P5R”
Figure 5-8 – Failure mode for group P3+A2“
Figure 5-9 – Screw deformation at mid-placed gusset plate for test group “P3+A2”

34
Figure 5-10 – Cross sectional cut illustrating failure by cracking of C24 stud, specimen P3+A2.1
Figure 5-11 – Specimen P3+A2.1 when cracked piece of C24 stud removed
In order to be scalable, the capacity and stiffness are ideally represented per fastener and
shear plane. However, this leads to some problems with the test groups “P5R” and
“P5R+A2” since all shear planes for these groups weren’t in the same direction. This means
that if a shear plane were added, it would not impact all fastener screws. In the same way,
if a screw were added, it would not impact all shear planes. For this reason, two values
were calculated, one where consideration to the reinforcement screws and the shear
planes they act on was taken, and one calculated in the same way as the other groups.
Neither of which giving a fair representation since the capacity and stiffness per screw
varies between the different types of screws. With that said, these values can only be used
for scaling if the ratio between screws and shear planes in both planes is the same as during
testing. The estimated capacity as well as the results from testing are presented in Table
5.1.
Table 5.1 – Calculated capacity and results from testing. Standard deviation is shown within parenthesis. * - no consideration taken to screws and shear planes in transverse direction (see explanation above).
Calculated capacity Test results
Number of fasteners
Total capacity
per fastener and shear plane
Total capacity
Capacity per fastener and shear plane
Efficiency per fastener and shear plane
CoV
Group
kN kN kN kN Mpa %
P3 2 20.3 2.54 28.5 (2.3) 3.56 (0.29) 2.54 (0.21) 8.1
P3R 2 27.1 3.39 29.4 (1.6) 3.68 (0.20) 2.63 (0.14) 5.4
P3+A2 2 25.3 3.16 32.0 (2.2) 4.00 (0.27) 2.85 (0.19) 6.9

35
P5R 6 56.3 7.04* 58.6 (1.4) 7.32 (0.31)* 1.63 (0.07) 5.23 (0.22)*
1.16 (0.05) 2.4
P5R+A2 6 62.9 7.86* 68.8 (3.1) 8.60 (0.38)* 1.91 (0.09) 6.14 (0.27)*
1.36 (0.06) 4.5
Perforated steel - - -
65.6 (6.7) 32.8 (3.3) 1.09 (0.11) 10.2
No estimated value for the group “Perforated steel” was calculated because there were
too many uncertainties and a lack of calculation models.
The first thing to notice from these results is that the calculation model for estimating the
capacity seems to be quite accurate. The test results from the groups “P3” and “P3+A2”
deviated more from the estimated value than the other groups. The test result for group
“P3” was 40 % higher than the estimated value. However, the results from this group were
only based on two measurements and should therefore not be taken too seriously. The test
result for group “P3+A2” was 26 % larger than the estimation and based on three tests. In
Figure 5-12, the estimated capacity and test results from each test group are presented.
The second thing to notice is that results from testing tend to be slightly higher than the
estimated values. Since this is the case for all test groups, one might suspect a systematic
error in either the calculation model or the test method. An example of such type of error
could be an underestimation of the screw capacity in the calculation model, which in this
case isn’t that unlikely since values for the screw yield moment 𝑀𝑦.𝑅, were obtained by
adding 10% to the characteristic values provided by the manufacturer. Maybe a slightly
higher increase would result in an even more precise calculation model.
The presence of reinforcement screws indicated no significant effect on the capacity.
However, the scatter was significantly reduced.
Figure 5-12 – Estimated capacity and mean capacity from test results
0
10
20
30
40
50
60
70
P3 P3R P3+A2 P5R P5R+A2 Perforated steel
Total capacity [kN]
Estimated Test result
36
The test group “Perforated steel” had a mean total capacity of 65,5 kN, which corresponds
to an efficiency of 1,09 MPa per shear plane. For glued surfaces, a shear capacity of around
4 MPa should be expected. This low result is most likely due to the construction being
poorly performed and points on how important it is that gluing is performed in a controlled
environment.
With the test results as a basis, the number of fasteners and shear planes in order to
achieve a high enough capacity regarding the truss design example in section 2.7 can be
calculated. For example, 30 fasteners and eight shear planes of the connection “P3+A2”
would result in a theoretical capacity of 960 kN, which can be compared to the estimated
tension force of 932 kN in the bottom chord.
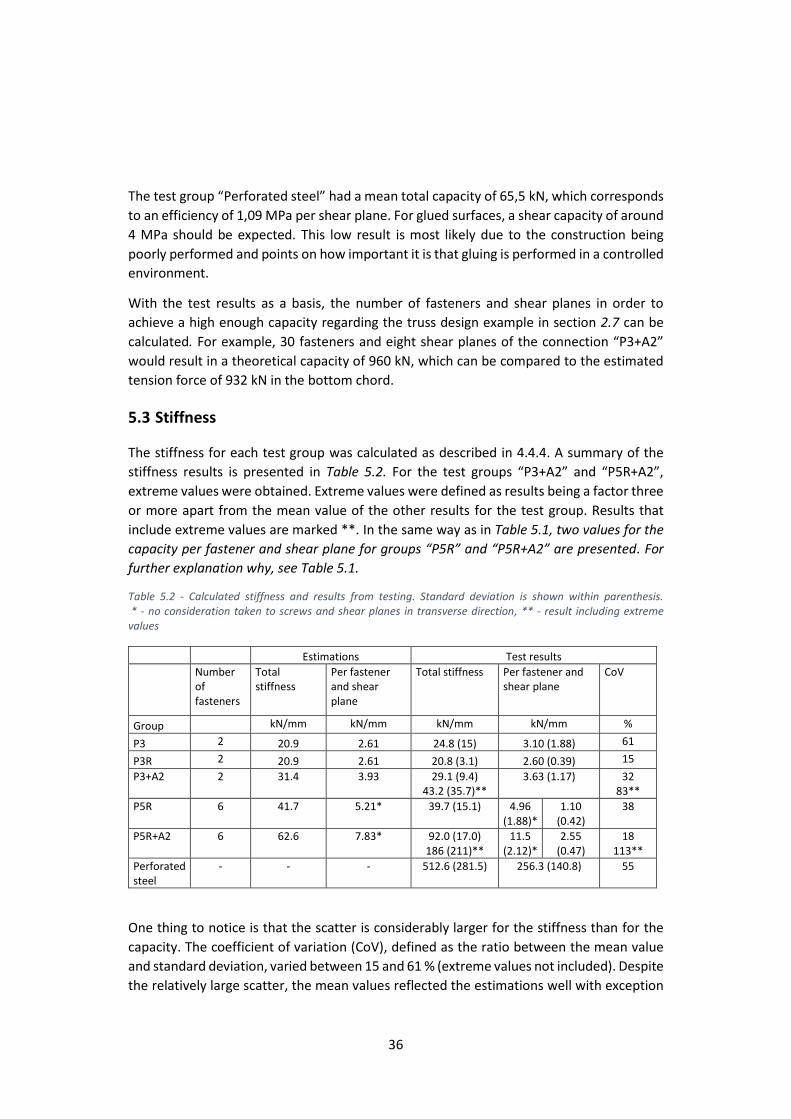
5.3 Stiffness
The stiffness for each test group was calculated as described in 4.4.4. A summary of the
stiffness results is presented in Table 5.2. For the test groups “P3+A2” and “P5R+A2”,
extreme values were obtained. Extreme values were defined as results being a factor three
or more apart from the mean value of the other results for the test group. Results that
include extreme values are marked **. In the same way as in Table 5.1, two values for the
capacity per fastener and shear plane for groups “P5R” and “P5R+A2” are presented. For
further explanation why, see Table 5.1.
Table 5.2 - Calculated stiffness and results from testing. Standard deviation is shown within parenthesis. * - no consideration taken to screws and shear planes in transverse direction, ** - result including extreme values
Estimations Test results
Number of fasteners
Total stiffness
Per fastener and shear plane
Total stiffness Per fastener and shear plane
CoV
Group kN/mm kN/mm kN/mm kN/mm %
P3 2 20.9 2.61 24.8 (15) 3.10 (1.88) 61
P3R 2 20.9 2.61 20.8 (3.1) 2.60 (0.39) 15
P3+A2 2 31.4 3.93 29.1 (9.4) 43.2 (35.7)**
3.63 (1.17) 32 83**
P5R 6 41.7 5.21* 39.7 (15.1) 4.96 (1.88)*
1.10 (0.42)
38
P5R+A2 6 62.6 7.83* 92.0 (17.0) 186 (211)**
11.5 (2.12)*
2.55 (0.47)
18 113**
Perforated steel
- - - 512.6 (281.5) 256.3 (140.8) 55
One thing to notice is that the scatter is considerably larger for the stiffness than for the
capacity. The coefficient of variation (CoV), defined as the ratio between the mean value
and standard deviation, varied between 15 and 61 % (extreme values not included). Despite
the relatively large scatter, the mean values reflected the estimations well with exception

37
from test group “P5R+A2”. The test result was for this group 47 % higher than the estimated
value. The test group that deviated second most was “P3”, with nearly 19 %. Estimated
stiffness and test results are presented in Figure 5-13.
Figure 5-13 – Estimated stiffness and mean stiffness from test results
A comparison of test groups “P3” and “P3R” shows a stiffness reduction of 16 % when
reinforcement screws were used. A scatter reduction was also observed for test group
“P3R”. A comparison between the same test groups indicates a CoV reduction from 61 to
15 %. However, since the results for test group “P3” only are based on two measurements,
conclusions should be drawn with caution.
The highest stiffness was obtained for test group “P5R+A2”, with a test result being 47 %
higher than the estimated stiffness and 132 % higher compared to “P5R”. This indicates
that a combination of aluminum sheets and reinforcement screws is an effective way of
increasing the stiffness.
0
10
20
30
40
50
60
70
80
90
100
P3 P3R P3+A2 P5R P5R+A2
Total stiffness [kN/mm]
Estimated Test result
38
Conclusions and further research
Based on the above presented results from this experimental study, the following main
conclusions are drawn:
- Euro code’s calculation model works satisfactorily for these types of joints, both
regarding capacity and stiffness.
- The failure behavior for all connections where screws were used as fasteners were
of a ductile character. However, a decrease in ductility was observed for test
groups where aluminum sheets were used.
- The presence of aluminum sheets leads to an increased capacity of 12-17 %.
- The stiffness was also increased due to the presence of aluminum sheets. A
comparison between test groups “P3” and “P3+A2” indicates a 17 % increase and
a comparison between “P5R” and “P5R+A2” a 132 % increase.
- A comparison between test groups “P3” and “P3R” indicates a significant reduction
of scatter due to the presence of reinforcement screws, both regarding capacity
and stiffness. No significant increase in capacity due to the presence of
reinforcement screws was observed, while a 16 % decrease in stiffness was
observed.
- Test results indicate that a combination of reinforcement screws and aluminum
sheets has a large positive effect on stiffness.
- Results from the test group where glue was used indicated a low efficiency of 1,09
MPa with a relatively large scatter, most likely due to poor construction. A more
precise method for gluing is therefore recommended.
Based on test results and conclusions, further studies are of interest:
- In order to maximize the joint efficiency, different thicknesses of the plywood
boards should be studied.
- Studying the impact of using different type of fasteners are also recommended. For
example, nails, which also could be a way of reducing costs.
- A numerical model would be a more economical way of investigation. However,
these are complex when dealing with screws. Therefore, a numerical model where
nails are used as fasteners is recommended.
- A cost comparison between trusses made of structural timber and trusses made of
glulam.

39
Bibliography
Bejtka, I. & Blass, H. J., 2005. Self-tapping screws as reinforcement in connections with
dowel-type fasteners, Karlsruhe: Universität Karlsruhe.
Blass, H. J. & Sandhaas, C., 2017. Timber Engineering - Principles for Design. Karlsruhe: KIT
Scientific Publishing.
Blass, H. J. & Schädle, P., 2011. Ductility aspects on reinforced and non-reinforced timber
joints, Karlsruhe: Karlsruhe Institute of Technology.
Brorson, A. & Hedlund, R., 2013. Development of a roof truss structure in glulam, Lund:
Lunds Tekniska Högskola.
Crocetti, R., Axelson, M. & Sartori, T., 2010. Strengthening of large diameter single dowel
joints, Borås: SP Technical Research Institute of Sweden.
EN1995-1-1, 2004. Eurocode 5: Design of timber structures - Part 1-1: General - Commone
rules and rules for buildings. SS-EN 1995-1-1:2004 red. Bryssel: European Committee for
Standardization.
Johansen, K. W., 1949. Theory of Timber Connections, Zürich: IABSE publications.
SS-EN13183-1, 2003. Moisture content of a piece of sawn timber. EN 13183-1:2002 red.
Bryssel: European Committee For Standardization.
Turnbull, J. E., Lefkovitch, L. P. & Lowe, D., 1981. Multi-laminated nailed truss connections,
Ottawa: Engineering and Statistical Research Institute.
Wilkinson, T. L., 1968. Longtime Performance of Trussed Rafters with Different Connection
Systems, Madison, Wisconsin: United States Department of Agriculture.
Volkersen, O., 1964. Recent research on the theory of bonded joints, Washington: NASA -
National Aeronautics and Space Administration.
Xu, S. & Tan, P., 2015. Glued timber connections - Experimental and numerical study of
tension behaviour under various influencing parameters, Växjö: Linnaeus University.

40
APPENDIX A – Test results
In this appendix, results and load slip curves for each test specimen and test group are
presented. Yellow regions refer to estimated values and green regions to test results.
Table A 1 – Estimated capacity and stiffness for test group “P3”
Fest [kN] 20,3
Fest [kN/screw & sp] 2,54
Kest [kN/mm] 20,9
Kest [kN/mm,screw,sp] 2,61
Table A 2 – Test results from each test specimen for test group “P3”. Note that specimen 1 failed in the connection to the rig which is why no results were obtained. For test specimen 3, no LVDT’s were installed and no physical failure occurred, therefore capacity was obtained.
Specimen 1.1 1.2 2.1 2.2 3.1 3.2 mean value Stdev
Fmax [kN] - - 26,9 30,1 - - 28,5 2,3
Fmax [kN/screw] - - 13,4 15,1 - - 14,2 1,2
Fmax [kN/screw&sp] - - 3,4 3,8 - - 3,56 0,29
Efficiency [Mpa] - - 2,4 2,7 - - 2,54 0,21
K [kN/mm] - - 35,4 14,2 - - 24,8 15,0
K [kN/mm,screw,sp] - - 4,4 1,8 - - 3,10 1,88

41
Figure A 1 – Load slip relation for test group “P3”
Table A 3 – Estimated capacity and stiffness for test group “P3R”
Fest [kN] 27,1
Fest [kN/screw&sp] 3,39
Kest [kN/mm] 20,9
Kest [kN/mm,screw,sp] 2,61
Table A 4 - Test results from each test specimen for test group “P3R”.
specimen 1.1 1.2 2.1 2.2 3.1 3.2 mean value STDEV
Fmax [kN] 28,7 27,2 28,6 29,9 30,3 31,8 29,4 1,6
Fmax [kN/screw & sp] 3,6 3,4 3,6 3,7 3,8 4,0 3,68 0,20
Efficiency [Mpa] 2,56 2,43 2,55 2,67 2,71 2,83 2,63 0,14
K [kN/mm] 20,5 17,8 18,5 25,2 18,4 24,1 20,8 3,1
K [kN/mm,screw,sp 2,6 2,2 2,3 3,1 2,3 3,0 2,60 0,39
0
5
10
15
20
25
30
35
0,000 2,000 4,000 6,000 8,000 10,000 12,000
kN
mm
P3
2,1
2,2
1,1
1,2

42
Figure A 2 - Load slip relation for test group “P3R”
Table A 5 – Estimated capacity and stiffness for test group “P3+A2”
Fest [kN] 25,3
Fest [kN/screw & sp] 3,16
Kest [kN/mm] 31,4
Kest [kN/mm & screw & sp] 3,93
Table A 6 - Test results from each test specimen for test group “P3+A2”. * - Extreme values not included in the mean result
Specimen 1.1 1.2 2.1 2.2 3.1 3.2 mean value STDEV
Fmax [kN] 33,6 33,6 29,2 29,2 33,2 33,2 32,0 2,2
Fmax [kN/screw & sp] 4,2 4,2 3,6 3,6 4,1 4,1 4,00 0,27
Efficiency [Mpa] 3,00 3,00 2,61 2,61 2,96 2,96 2,85 0,19
K [kN/mm] 45,2 25,9 23,1 28,5 114,2* 22,5 29,1 9,4
K [kN/mm,screw,sp] 5,7 3,2 2,9 3,6 14,3* 2,8 3,63 1,17
0
5
10
15
20
25
30
35
0 2 4 6 8 10 12 14
kN
mm
P3R
1,1
1,2
2,1
2,2
3,1
3,2
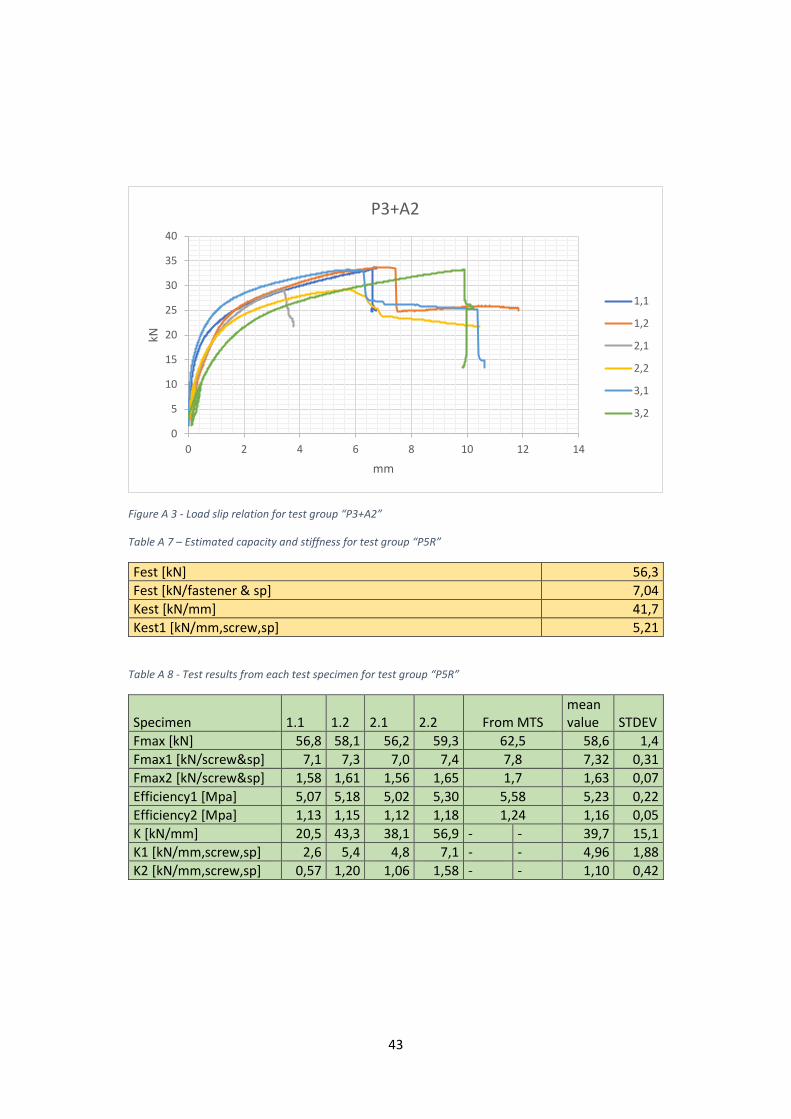
43
Figure A 3 - Load slip relation for test group “P3+A2”
Table A 7 – Estimated capacity and stiffness for test group “P5R”
Fest [kN] 56,3
Fest [kN/fastener & sp] 7,04
Kest [kN/mm] 41,7
Kest1 [kN/mm,screw,sp] 5,21
Table A 8 - Test results from each test specimen for test group “P5R”
Specimen 1.1 1.2 2.1 2.2 From MTS mean value STDEV
Fmax [kN] 56,8 58,1 56,2 59,3 62,5 58,6 1,4
Fmax1 [kN/screw&sp] 7,1 7,3 7,0 7,4 7,8 7,32 0,31
Fmax2 [kN/screw&sp] 1,58 1,61 1,56 1,65 1,7 1,63 0,07
Efficiency1 [Mpa] 5,07 5,18 5,02 5,30 5,58 5,23 0,22
Efficiency2 [Mpa] 1,13 1,15 1,12 1,18 1,24 1,16 0,05
K [kN/mm] 20,5 43,3 38,1 56,9 - - 39,7 15,1
K1 [kN/mm,screw,sp] 2,6 5,4 4,8 7,1 - - 4,96 1,88
K2 [kN/mm,screw,sp] 0,57 1,20 1,06 1,58 - - 1,10 0,42
0
5
10
15
20
25
30
35
40
0 2 4 6 8 10 12 14
kN
mm
P3+A2
1,1
1,2
2,1
2,2
3,1
3,2

44
Figure A 4 - Load slip relation for test group “P5R”
Table A 9 – Estimated capacity and stiffness for test group “P5R+A2”
Fest [kN] 62,9
Fest [kN/fastener & sp] 7,86
Kest [kN/mm] 62,6
Kest [kN/mm,screw,sp] 7,83
Table A 10 - Test results from each test specimen for test group “P5R+A2”. Note that only one LVDT was installed on specimen 3. * - Extreme values not included in the mean result
Specimen 1.1 1.2 2.1 2.2 3.1 3.2 mean value STDEV
Fmax [kN] 71,2 69,6 70,3 69,4 63,4 - 68,8 3,1
Fmax1 [kN/screw&sp] 8,9 8,7 8,8 8,7 7,9 - 8,60 0,38
Fmax2 [kN/screw&sp] 1,98 1,93 1,95 1,93 1,76 - 1,91 0,09
Efficiency1 [Mpa] 6,36 6,21 6,28 6,19 5,66 - 6,14 0,27
Efficiency2 [Mpa] 1,41 1,38 1,40 1,38 1,26 - 1,36 0,06
K [kN/mm] 72,4 98,4 563,5* 85,3 111,8 - 92,0 17,0
K1 [kN/mm,screw,sp] 9,0 12,3 70,4* 10,7 14,0 - 11,50 2,12
K2 [kN/mm,screw,sp] 2,0 2,7 15,7* 2,4 3,1 - 2,55 0,47
0
10
20
30
40
50
60
70
0,00 2,00 4,00 6,00 8,00 10,00 12,00 14,00
kN
mm
P5R
1,1
1,2
2,1
2,2

45
Figure A 5 - Load slip relation for test group “P5R+A2”
Table A 11 - Test results from each test specimen for test group “Perforated steel”
1 2 3 mean value STDEV
Fmax [kN] 58,1 67,9 70,8 65,6 6,7
Fmax [kN / sp] 29,0 34,0 35,4 32,8 3,3
K [kN/mm] 402,4 302,8 832,5 512,6 281,5
K [kN/mm and sp] 201,2 151,4 416,3 256,3 140,8
Efficiency per sp [Mpa] 0,97 1,13 1,18 1,09 0,11
0
10
20
30
40
50
60
70
80
0 2 4 6 8 10 12 14
kN
mm
P5R+A2
1,1
1,2
2,1
2,2
3,1
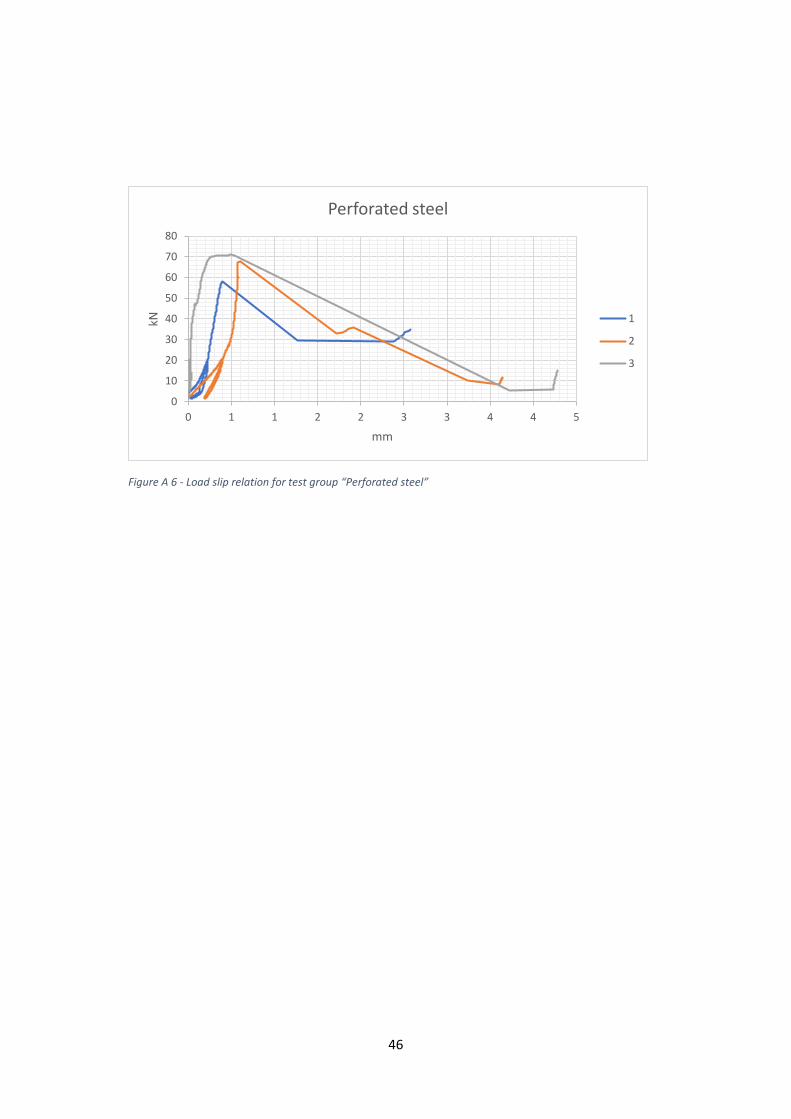
46
Figure A 6 - Load slip relation for test group “Perforated steel”
0
10
20
30
40
50
60
70
80
0 1 1 2 2 3 3 4 4 5
kN
mm
Perforated steel
1
2
3

47
APPENDIX B – Measurements of density and moisture content
In this appendix, results from moisture content and density are presented.
Table B 1 – Results from the first measurement
Measurement 1
Specimen C24
number Width [mm]
Thickness [mm]
length [mm] V [m3] mass [g]
Density [kg/m3]
Moisture content
P3.1
1 219 45 439 0,0043 1928 446 15,7
2 217 43 439 0,0041 1880 459 16,4
3 219 45 440 0,0043 2047 472 16,2
4 216 44 440 0,0042 1914 458 14,9
P3.2
5 220 45 439 0,0043 1883 433 16,2
6 220 44 439 0,0042 1816 427 13,4
7 219 44 440 0,0042 1890 446 16,2
8 220 45 438 0,0043 1860 429 16,2
P3.3
9 217 44 439 0,0042 1718 410 13,6
10 218 44 438 0,0042 2008 478 15,8
11 220 45 439 0,0043 1907 439 17,1
12 220 45 440 0,0044 2293 526 16,8
P3R.1
13 219 44 440 0,0042 1787 421 15,4
14 218 44 439 0,0042 1931 459 16,7
15 221 44 440 0,0043 1780 416 15,3
16 220 45 439 0,0043 1915 441 16,8
P3R.2
17 220 45 439 0,0043 1933 445 17,9
18 219 45 439 0,0043 1867 432 16,3
19 219 43 438 0,0041 1728 419 15,1
20 218 45 439 0,0043 1881 437 15,4
P3R.3
21 219 44 440 0,0042 1781 420 14,7
22 220 44 440 0,0043 1913 449 14,2
23 220 44 439 0,0042 1719 405 16,3
24 218 44 440 0,0042 1865 442 17,1
P5R.1
25 220 44 439 0,0042 1929 454 16
26 218 44 438 0,0042 1822 434 15,7
27 220 45 440 0,0044 1907 438 16,6
28 220 44 440 0,0043 1939 455 16,3
P5R.2 29 220 44 440 0,0043 1767 415 14,8
30 220 45 440 0,0044 2071 475 17,4

48
31 219 44 440 0,0042 1771 418 13,8
32 220 44 439 0,0042 1769 416 15,7
P5R.3
33 217 45 438 0,0043 2025 473 17,2
34 218 45 439 0,0043 1992 463 16,4
35 218 44 439 0,0042 2290 544 17,2
36 219 45 440 0,0043 1824 421 15,6
P3+A2.1
37 218 45 440 0,0043 2093 485 17,8
38 216 45 439 0,0043 1842 432 17,2
39 218 44 440 0,0042 1965 466 16,4
40 220 45 439 0,0043 1830 421 16,3
P3+A2.2
41 220 45 440 0,0044 1788 410 15,8
42 216 45 440 0,0043 1983 464 16,3
43 219 45 439 0,0043 1800 416 16,5
44 217 45 440 0,0043 1922 447 17,9
P3.A2.3
45 216 45 440 0,0043 1916 448 13,3
46 220 45 439 0,0043 1868 430 17,2
47 220 45 440 0,0044 2079 477 17,1
48 217 45 438 0,0043 1878 439 17,6
P5R+A2.1
49 219 45 440 0,0043 2025 467 18,1
50 217 44 439 0,0042 1763 421 15,5
51 217 45 439 0,0043 2540 593 18,4
52 220 45 440 0,0044 2060 473 19,7
P5R+A2.2
53 220 45 440 0,0044 2561 588 18,3
54 220 45 439 0,0043 2322 534 18,9
55 219 45 439 0,0043 1775 410 16,6
56 217 45 440 0,0043 1789 416 15,1
P5R+A2.3
57 219 45 440 0,0043 1693 390 15,2
58 219 45 440 0,0043 2272 524 17,8
59 219 45 439 0,0043 1884 435 17,2
60 220 44 440 0,0043 1900 446
Perforated steel.1
61 17,8
62 17,5
63 18,9
64 17,2
Perforated steel.2
65 16,3
66 18,3
67 18,1
68 20,1
Perforated steel.3
69 17,7
70 18,1
71 18,2
72 17
Mean 218,8 44,6 439,4 0,0 1931,6 443,3 16,6
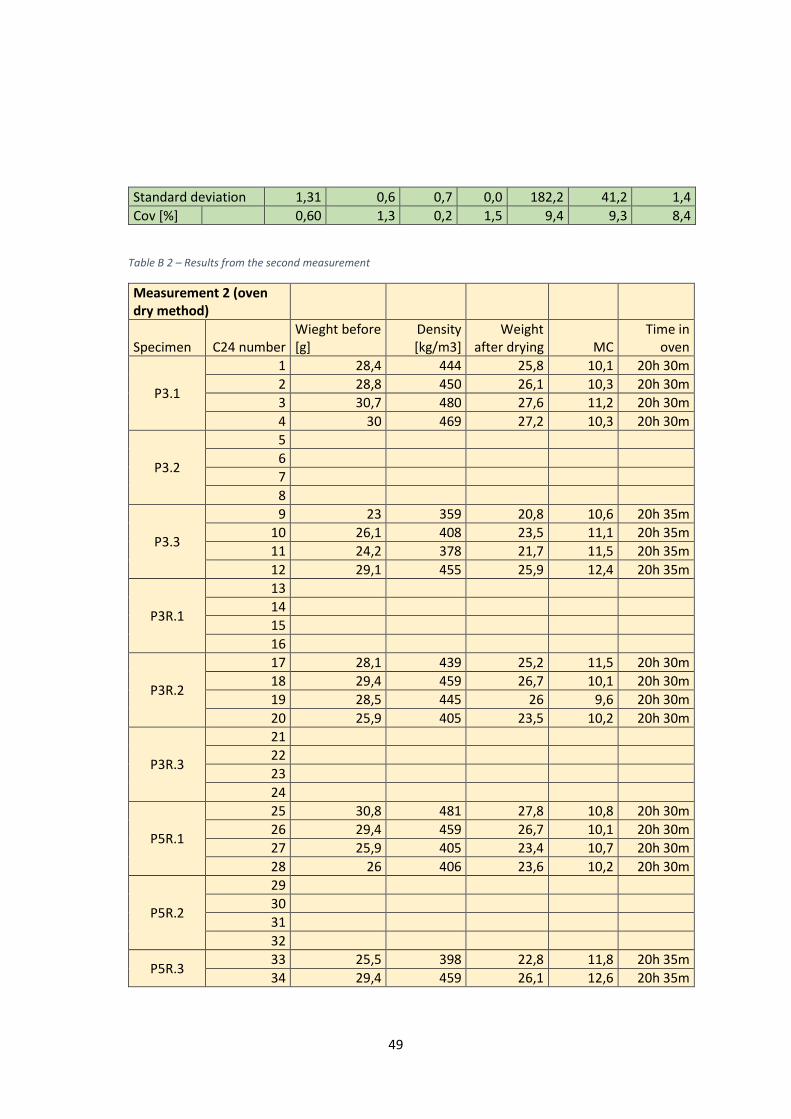
49
Standard deviation 1,31 0,6 0,7 0,0 182,2 41,2 1,4
Cov [%] 0,60 1,3 0,2 1,5 9,4 9,3 8,4
Table B 2 – Results from the second measurement
Measurement 2 (oven dry method)
Specimen C24 number Wieght before [g]
Density [kg/m3]
Weight after drying MC
Time in oven
P3.1
1 28,4 444 25,8 10,1 20h 30m
2 28,8 450 26,1 10,3 20h 30m
3 30,7 480 27,6 11,2 20h 30m
4 30 469 27,2 10,3 20h 30m
P3.2
5
6
7
8
P3.3
9 23 359 20,8 10,6 20h 35m
10 26,1 408 23,5 11,1 20h 35m
11 24,2 378 21,7 11,5 20h 35m
12 29,1 455 25,9 12,4 20h 35m
P3R.1
13
14
15
16
P3R.2
17 28,1 439 25,2 11,5 20h 30m
18 29,4 459 26,7 10,1 20h 30m
19 28,5 445 26 9,6 20h 30m
20 25,9 405 23,5 10,2 20h 30m
P3R.3
21
22
23
24
P5R.1
25 30,8 481 27,8 10,8 20h 30m
26 29,4 459 26,7 10,1 20h 30m
27 25,9 405 23,4 10,7 20h 30m
28 26 406 23,6 10,2 20h 30m
P5R.2
29
30
31
32
P5R.3 33 25,5 398 22,8 11,8 20h 35m
34 29,4 459 26,1 12,6 20h 35m

50
35 32,7 511 29,1 12,4 20h 35m
36 27,8 434 25,2 10,3 20h 35m
P3+A2.1
37 33,2 519 29,7 11,8 20h 30m
38 27,1 423 24,5 10,6 20h 30m
39 31,7 495 28,8 10,1 20h 30m
40 27,2 425 24,7 10,1 20h 30m
P3+A2.2
41
42
43
44
P3.A2.3
45
46
47
48
P5R+A2.1
49 28,8 450 26 10,8 20h 30m
50 26,8 419 24,2 10,7 20h 30m
51 37,6 588 33,5 12,2 20h 30m
52
P5R+A2.2
53 39,1 611 35,1 11,4 20h 30m
54
55
56
P5R+A2.3
57
58
59
60
Perforated steel.1
61 31,2 537,9 28,1 11,0 20h 30m
62 27,2 469,0 24,4 11,5 20h 30m
63 24,6 424,1 22,1 11,3 20h 30m
64 31,4 541,4 28,1 11,7 20h 30m
Perforated steel.2
65 40,6 634,4 36,9 10,0 20h 30m
66 30,6 478,1 27,8 10,1 20h 30m
67 38,6 603,1 35 10,3 20h 30m
68 32 500,0 28,7 11,5 20h 30m
Perforated steel.3
69 22 379,3 20 10,0 20h 30m
70 26,7 460,3 24,1 10,8 20h 30m
71 23,9 412,1 21,5 11,2 20h 30m
72 28,3 487,9 25,7 10,1 20h 30m
mean 29 465,1 26,34 10,9
stdev 4,22 20,9 3,79 0,8
CoV [%] 14,5 4,5 14,4 7,2

51
Table B 3 – Results from measurement of plywood
Plywood weight before density Weight after MC
1 20,4 680,0 18,9 7,9
2 20,5 683,3 19 7,9
3 20,1 670,0 18,6 8,1
4 20,6 686,7 19,1 7,9
mean value 680,0 7,9
STD 6,2 0,079

52
APPENDIX C – Calculations
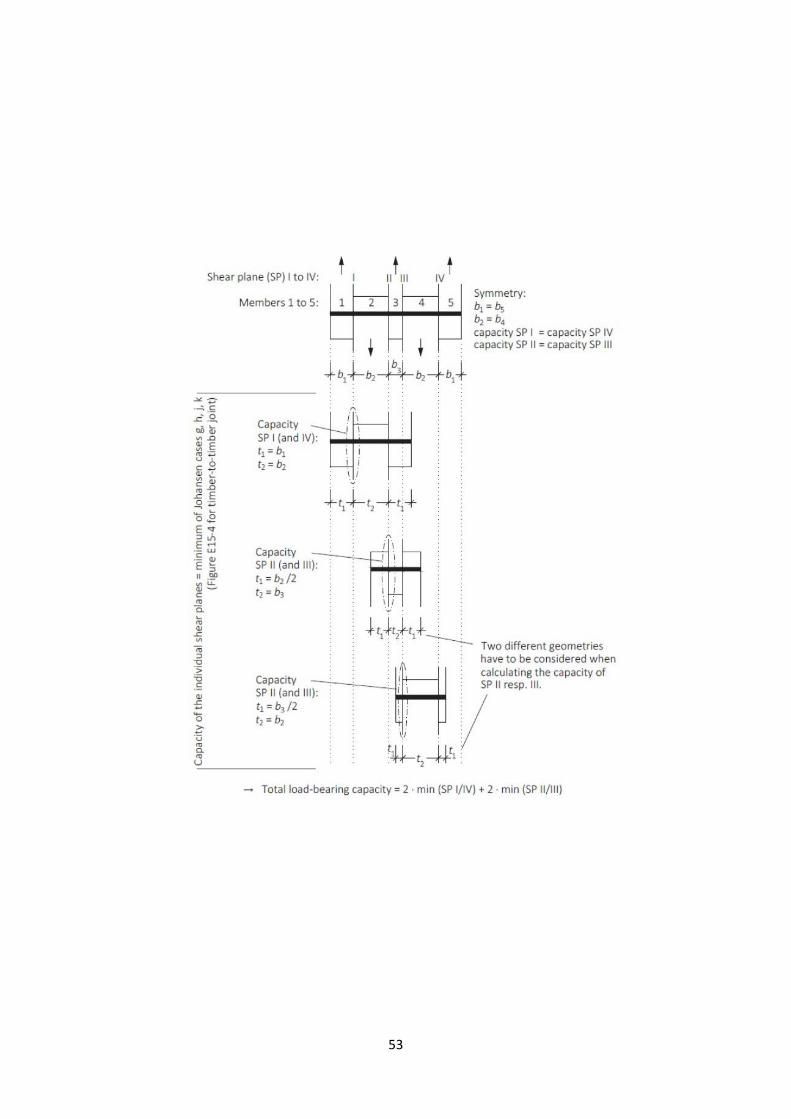
53

54

55

56

57

58

59

60

61

62

63

64

65

66

67
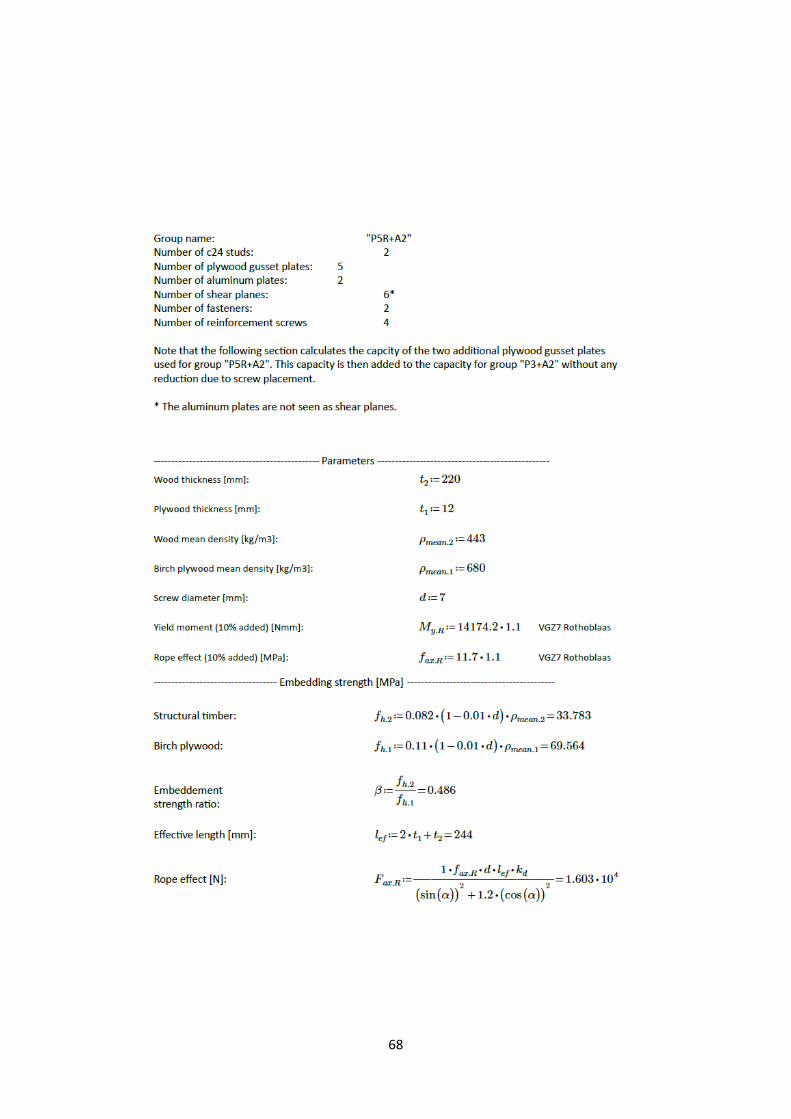
68

69

70