Examining the Relationship between Grade Configuration and ...
338
Examining the Relationship between Grade Configuration and Teachers’ Perceptions of Working Conditions in Public K-8 Schools and Middle Schools in North Carolina Jason Brent Cooper A dissertation submitted to the faculty of the University of North Carolina at Chapel Hill in partial fulfillment of the requirements for the degree of Doctor of Education in the Department of Educational Leadership in the School of Education Chapel Hill 2008 Approved by Advisor: Professor Fenwick English Reader: Professor Rita O’Sullivan Reader: Professor Stanley Schainker Reader: Professor Jim Veitch
-
Upload
khangminh22 -
Category
Documents
-
view
1 -
download
0
Transcript of Examining the Relationship between Grade Configuration and ...

Examining the Relationship between Grade Configuration and Teachers’ Perceptions of Working Conditions in Public K-8 Schools and Middle Schools in North Carolina
Jason Brent Cooper
A dissertation submitted to the faculty of the University of North Carolina at Chapel Hill in partial fulfillment of the requirements for the degree of Doctor of Education in the
Department of Educational Leadership in the School of Education
Chapel Hill
2008
Approved by Advisor: Professor Fenwick English Reader: Professor Rita O’Sullivan
Reader: Professor Stanley Schainker Reader: Professor Jim Veitch

ii
© 2008 Jason Brent Cooper
ALL RIGHTS RESERVED

iii
ABSTRACT
Brent Cooper: Examining the Relationship between Grade Configuration and Teachers’ Perceptions of Working Conditions in Public K-8 Schools and Middle Schools in North
Carolina (Under the direction of Dr. Fenwick English)
The purpose of this quantitative study was to determine if there were statistically
significant differences in teachers’ perceptions of working conditions between public K-8
and middle school teachers in North Carolina. Teacher working conditions subscale scores
were calculated for the five teacher working conditions domains (time; facilities and
resources; leadership; teacher empowerment; and professional development) within the 2006
North Carolina Teacher Working Conditions Survey (NCTWCS) secondary data set for
questions that teachers were provided with the same Likert scale responses. The researcher
hypothesized that public K-8 school teachers would report greater satisfaction with working
conditions in K-8 schools than public middle school teachers in middle schools in the state of
North Carolina as measured by the 2006 NCTWCS.
The sample included 13,433 public K-8 and middle school teachers who were
selected from the 2006 NCTWCS data set. This study’s sample included 10,520 6-8 middle
school teachers, 1,813 K-8 teachers, and 1,100 other middle school configuration teachers.
T-tests for independent samples were calculated to test for significant differences in teachers’
perceptions of working conditions domain means by school type (also referred to as grade
configuration in this study) for (a) Group 1, 6-8 middle school teachers and K-8 teachers, and
(b) Group 2, all middle school configuration (AMS) teachers (6-8, 3-8, 4-8, and
iv
5-8) and K-8 teachers. Correlations were also calculated to test for significant relationships
among teacher working conditions domains and between teacher working conditions
domains and school type. Further analysis was conducted which controlled for relevant
teacher demographic and student/school characteristics variables.
The results indicated significant differences in teachers’ perceptions of working
conditions by school type for all teacher working conditions domains except professional
development. K-8 teachers reported more positive perceptions of all working conditions
domains except time when compared to 6-8 middle school teachers. K-8 teachers reported
more positive perceptions of all working conditions domains except time and professional
development when compared to AMS teachers. Further discussion of this study’s findings
and potential rival hypotheses are discussed in Chapter Four. Implications and
recommendations for future research are presented and discussed in Chapter Five.
v
ACKNOWLEDGEMENTS
I would like to begin by expressing my appreciation to the distinguished scholars
within the Educational Leadership Doctoral Program at the University of North Carolina at
Chapel Hill that provided valuable expertise, guidance, and words of encouragement over the
last six years as I completed the requirements for my Master’s of School Administration
(M.S.A.) and Doctorate of Educational Leadership. When I first began the M.S.A. Program
in the fall 2002, I had no idea that this journey would end with a completed dissertation and
earned doctorate as well. First of all, I would like to acknowledge the expertise and guidance
provided by Dr. Fenwick English, my dissertation chair and advisor throughout my doctoral
journey. Without his valuable advice, the completion of this dissertation would never have
been possible. Secondly, I am grateful to the mentoring, statistical expertise, and words of
encouragement Dr. Rita O’Sullivan provided me over the course of the last year. Dr.
O’Sullivan’s willingness to take me under her wing throughout the summer 2007 through the
spring 2008 motivated me to keep progressing with this endeavor full speed ahead until its
final approval and completion were achieved in March 2008. I look forward to continuing to
learn and grow professionally in the realm of higher education in the coming months and
years from Dr. English and Dr. O’Sullivan.
I am also grateful to my other committee members, Dr. Stanley Schainker and Dr.
Jim Veitch, for their willingness to serve on my dissertation committee and the advice each
provided in the completion of this study. The words of encouragement they expressed to me
during the completion of the Master’s of School Administration Program led me to request
vi
their services on my dissertation committee. I would also like to express gratitude to Dr.
Linda Tillman, as several dissertation proposal documents she provided her students in her
dissertation proposal class were referenced frequently during the completion of this study.
Finally, within the Educational Leadership Program, I would like to thank Ms. Jane Gorey
for her assistance in helping me communicate with my committee members and reminding
me of all deadlines along this journey.
Outside of the Educational Leadership Program, much is owed to many individuals
that provided assistance and words of encouragement along the road to the completion of this
study. Additional statistical expertise was provided by Ms. Cathy Zimmer who assisted with
the merging of multiple data files that paved the way for this dissertation to be completed.
Technological expertise was provided by Mrs. Bhuvana Ramachandran, Mrs. Marie
Scarlette, and Mr. Jeremy Hartmann, colleagues with whom I work at Bonlee School in
Chatham County, North Carolina. I also would like to express my gratitude to my editor,
Mrs. Stephanie Parsons, Reference Librarian at High Point University, for her willingness to
provide editing services for such a lengthy dissertation at the last moment. The professional
advice and words of encouragement provided by two colleagues, Mrs. Nita Bowman and Ms.
Marilyn Dean, were invaluable during the year this study was completed. This study also
would not have been feasible without the flexibility graciously extended to me at Bonlee
School by my supervisors, Mr. Ronnie Joyce and Ms. Tracy Fowler. I would also like to
thank the office professionals at Bonlee School, Mrs. Karen Wilkins and Mrs. Angie Hege,
for bearing with me during the year this study was completed as my mind was often in two
worlds during each and every day from August 2007 through March 2008.

vii
This work would also not have been possible and maybe never even pursued without
the positive support from several close friends over the past several years. Reverting back to
the beginning of this journey, it was the motivational words of Mr. and Mrs. Kevin Chapman
that got this journey started in May 2002. Mr. Ricky Fuquay, a colleague and friend at
Bonlee School, provided words of encouragement when they were needed the most on the
days when it seemed this journey would never reach its destination. Finally, the friendship,
professional and scholarly advice, and words of encouragement provided by Dr. Dustin N.
Johnson fueled the fire within me to complete this study since the onset of our friendship in
Dr. Frank Brown’s Organizational Theory doctoral class on late nights in the fall 2004.
Without Dr. Johnson’s motivational speeches throughout the summer and fall 2007, and
winter 2008, this study would never have been completed. There are others I am grateful to
for their support throughout the completion of this study. Hopefully, I will be able to extend
my gratitude to them when opportunity allows in the future.
Lastly, I must thank my mother, Beverly S. Cooper, for serving as my sounding board
for frustration and my wall of emotional support as this journey carried on. Positive words
were extended always when needed most throughout this past summer, fall, and winter. She
never complained that my mind was elsewhere and that I was always on the go since I
pressed play on this study in the spring 2007. I also am greatly appreciative my father, Jacky
L. Cooper, is first, alive to see the completion of this study, and two, was supportive in his
own unique way as best as he could be since his diagnosis with prostate cancer in May 2007.
I was not there for my father like I could and should have been in July, August, and
September 2007 following my father’s surgery for prostate cancer and lengthy, difficult
recovery. I owe much gratitude to my aunts, Mrs. Patsy Beard and Mrs. Mary Lois Clark, for

viii
being there for each of us as I began this journey and as he recovered from complications
from surgery.
In conclusion, I thank Jesus Christ my Lord and Savior for being with me at all times
throughout the completion of this study. I was not always as faithful as I should have been,
and as I hope to be from this point forward in my life, wherever the educational
accomplishments from the completion of this study take me educationally and professionally
hereafter.

ix
TABLE OF CONTENTS
LIST OF FIGURES.......................................................................................................... xvi LIST OF TABLES........................................................................................................... xvii Chapter
I. INTRODUCTION......................................................................................... 1
The Importance of the Middle Grades for Young Adolescents........... 1
Questioning the Middle School Model: Does It Meet the Academic and Socio-Emotional Needs of Young Adolescents........................... 5
The Influence of Politics and Policy: Why Some Lower-Wealth, Rural Districts Never Left the K-8 Model.......................................... 6
Welcome Back K-8 Schools.............................................................. 7
Statement of the Problem.............................................................................. 7
Summary.................................................................................................... 13
Purpose of the Study................................................................................... 14
Major Hypothesis ....................................................................................... 15
Sub-hypotheses ............................................................................... 15
Overview of Methods ................................................................................. 16
Limitations ................................................................................................. 19
Definition of Terms .................................................................................... 22
II. LITERATURE REVIEW............................................................................ 30
Introduction................................................................................................ 30
x
Welcome Back K-8 Schools ....................................................................... 34
Research on the Debate of the K-8 Versus Middle School Grade Configuration ....................................................................... 35
Meeting the Needs of Young Adolescents: K-8 Schools Versus Middle Schools ................................................................... 37
History of Grade Configuration in American Schools: The Decline in the Junior High Grade Configuration....................... 39
Factors to Consider in the Debate on the Best Grade Configuration for Middle Grades Students.................................................. 41
Questioning the Middle School Model from the Perspective of Location................................................................... 41
The Influence of Local and State Politics on Grade Configuration.................................................................................. 43
Academic Achievement of Middle Grades Students in
K-8 Schools Versus Middle Schools ............................................... 47
Elimination of the Elementary to Middle School Transition ............ 60
Discipline........................................................................................ 65
Increased Parent/Community Involvement ...................................... 67
Small Learning Environments ......................................................... 69
Is it the Grade Configuration that Allows a School to Best Meet the Needs of Its Students and Staff? ........................................... 72
Other Factors that Influence a School’s Success in Meeting the Needs of Middle Grades Students and Teachers ...................... 73
Smaller Schools and Fewer Students per Grade............................... 73
Poor Implementation of the Middle School Concept ....................... 75
The Missing Link: Teachers’ Perceptions of Working Conditions and Related Topics..................................................... 76 Herzberg’s Motivational-Hygiene Theory of Worker Satisfaction and Dissatisfaction...................................................... 77
xi
Teacher Satisfaction ................................................................................... 79
Physical Working Conditions ..................................................................... 85
Organizational Health, School Climate and Organizational Factors: Research that Moves Closer to the Current Accepted Definition of Teacher
Working Conditions ................................................................................... 88
Teacher Working Conditions Initiative and the North Carolina Teacher Working Conditions Survey .................................. 98
2002 North Carolina Teacher Working Conditions Survey.............. 99 2004 North Carolina Teacher Working Conditions Survey............ 103
2004 South Carolina Teacher Working Conditions Survey............ 108
2006 North Carolina Teacher Working Conditions Survey............ 112
The Future of the NCTWCS and Working Conditions Surveys ..... 119
III. RESEARCH DESIGN.............................................................................. 121
Introduction.............................................................................................. 121
Purpose of the Study ..................................................................... 121
Conceptual Framework ................................................................. 121
Major Hypothesis ..................................................................................... 125
Sub-hypotheses ............................................................................. 125
Rationale for Use of Quasi-Experimental, Non-Equivalent Control Group Design and Quantitative Approach ........................ 126
Site Selection & Participants..................................................................... 128
Steps to Access the 2006 North Carolina Teacher Working Conditions Survey Secondary Data Set........................... 128
Population..................................................................................... 129
Sample Size and Rationale for Choice of Sample .......................... 130
Rationale for Choice of Sample Size ............................................. 132
xii
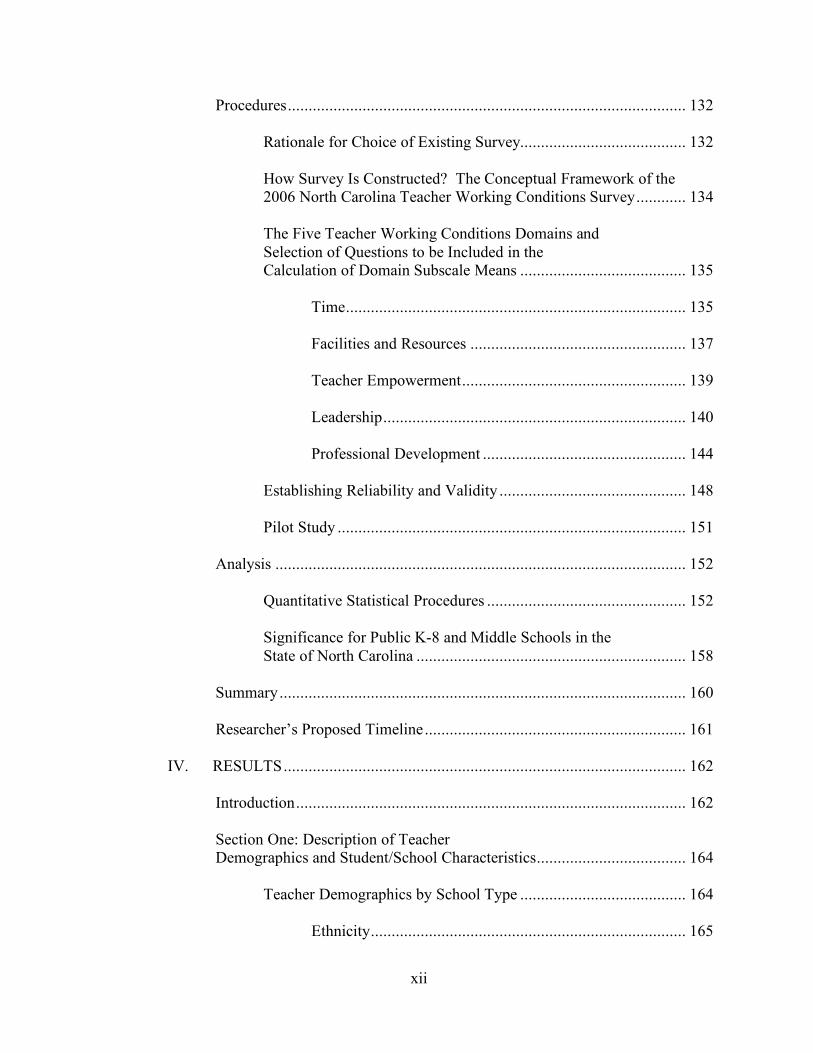
Procedures................................................................................................ 132
Rationale for Choice of Existing Survey........................................ 132
How Survey Is Constructed? The Conceptual Framework of the 2006 North Carolina Teacher Working Conditions Survey............ 134
The Five Teacher Working Conditions Domains and Selection of Questions to be Included in the Calculation of Domain Subscale Means ........................................ 135
Time.................................................................................. 135
Facilities and Resources .................................................... 137
Teacher Empowerment...................................................... 139
Leadership......................................................................... 140
Professional Development ................................................. 144
Establishing Reliability and Validity ............................................. 148
Pilot Study .................................................................................... 151
Analysis ................................................................................................... 152
Quantitative Statistical Procedures ................................................ 152
Significance for Public K-8 and Middle Schools in the State of North Carolina ................................................................. 158
Summary.................................................................................................. 160
Researcher’s Proposed Timeline............................................................... 161
IV. RESULTS................................................................................................. 162
Introduction.............................................................................................. 162
Section One: Description of Teacher Demographics and Student/School Characteristics.................................... 164
Teacher Demographics by School Type ........................................ 164
Ethnicity............................................................................ 165

xiii
Gender............................................................................... 167
Educational Training Prior to Beginning Teaching ............ 167
Highest Degree Earned...................................................... 168
National Board Certification Status ................................... 168
Years as an Educator ......................................................... 169
Years at School ................................................................. 170
Student/School Characteristics by School Type......................... 178
Free and Reduced Lunch ................................................... 178
2005-06 ABC School Recognition..................................... 179
Proficiency on 2005-06 Reading End-of-Grade Test (Percent Level III or Higher) ............................................. 182
Section Two: Testing the Major Research Hypothesis and Sub-hypotheses......................................................................................... 187
Hypothesis 1 ................................................................................. 188
Hypothesis 2 ................................................................................. 188
Hypothesis 3 ................................................................................. 189
Hypothesis 4 ................................................................................. 190
Hypothesis 5 ................................................................................. 191
Summary of Hypotheses 1-5 ......................................................... 192
Hypothesis 6 ................................................................................. 200
Hypothesis 7 ................................................................................. 207
Effect Size: Contrasting the Differences in Means for Teachers’ Perceptions of Teacher Working Conditions Domains by School Type (K-8 vs. All Middle Schools) .................................................................... 215
Summary of Results.................................................................................. 216
xiv
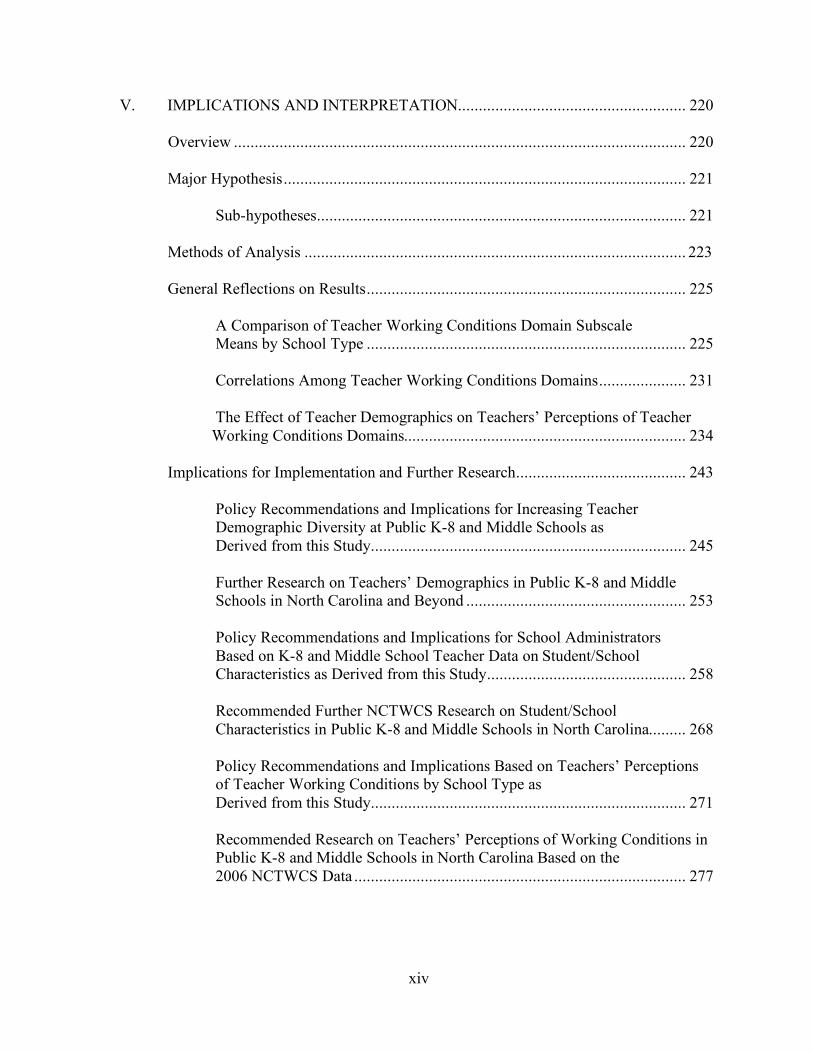
V. IMPLICATIONS AND INTERPRETATION....................................................... 220
Overview ............................................................................................................. 220
Major Hypothesis................................................................................................. 221
Sub-hypotheses......................................................................................... 221
Methods of Analysis ............................................................................................ 223
General Reflections on Results............................................................................. 225
A Comparison of Teacher Working Conditions Domain Subscale Means by School Type ............................................................................. 225
Correlations Among Teacher Working Conditions Domains..................... 231
The Effect of Teacher Demographics on Teachers’ Perceptions of Teacher Working Conditions Domains.................................................................... 234
Implications for Implementation and Further Research......................................... 243
Policy Recommendations and Implications for Increasing Teacher Demographic Diversity at Public K-8 and Middle Schools as Derived from this Study............................................................................ 245
Further Research on Teachers’ Demographics in Public K-8 and Middle Schools in North Carolina and Beyond ..................................................... 253
Policy Recommendations and Implications for School Administrators Based on K-8 and Middle School Teacher Data on Student/School Characteristics as Derived from this Study................................................ 258
Recommended Further NCTWCS Research on Student/School Characteristics in Public K-8 and Middle Schools in North Carolina......... 268 Policy Recommendations and Implications Based on Teachers’ Perceptions
of Teacher Working Conditions by School Type as Derived from this Study............................................................................ 271
Recommended Research on Teachers’ Perceptions of Working Conditions in
Public K-8 and Middle Schools in North Carolina Based on the 2006 NCTWCS Data ................................................................................ 277
xv
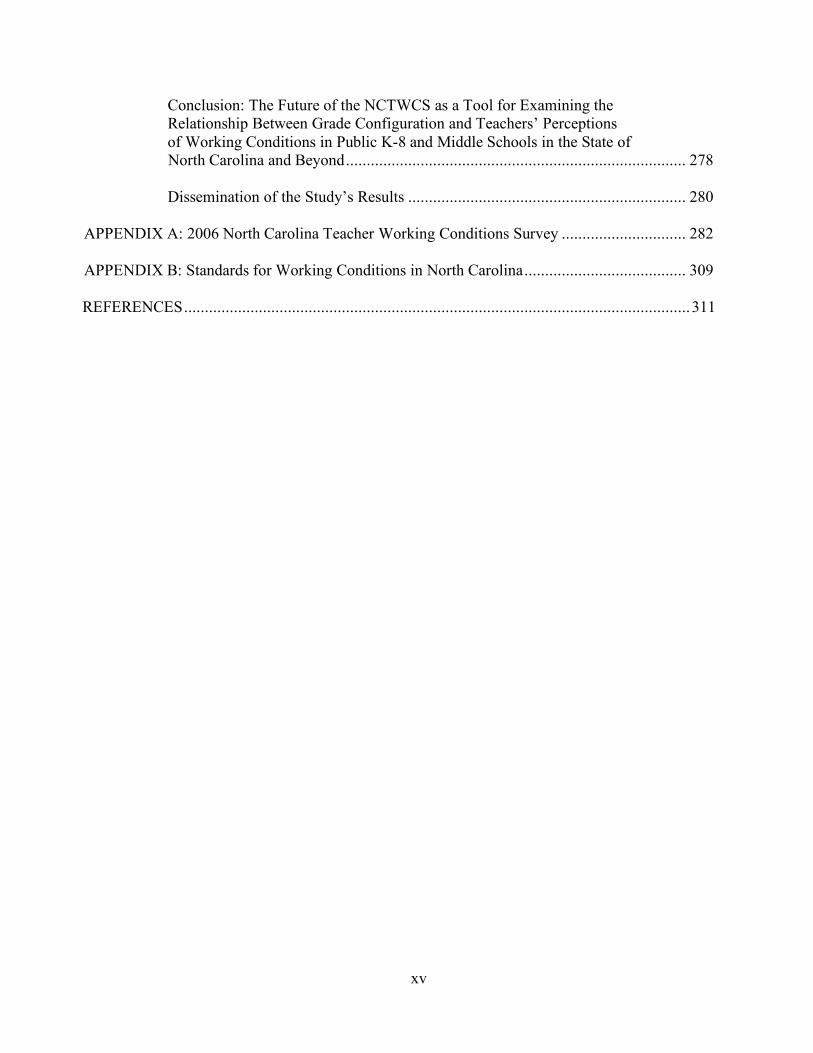
Conclusion: The Future of the NCTWCS as a Tool for Examining the Relationship Between Grade Configuration and Teachers’ Perceptions of Working Conditions in Public K-8 and Middle Schools in the State of North Carolina and Beyond.................................................................................. 278
Dissemination of the Study’s Results ................................................................... 280
APPENDIX A: 2006 North Carolina Teacher Working Conditions Survey .............................. 282
APPENDIX B: Standards for Working Conditions in North Carolina....................................... 309
REFERENCES..........................................................................................................................311

xvi
LIST OF FIGURES
Figure
1. Herzberg’s Motivational-Hygiene Theory.............................................................................124
xvii
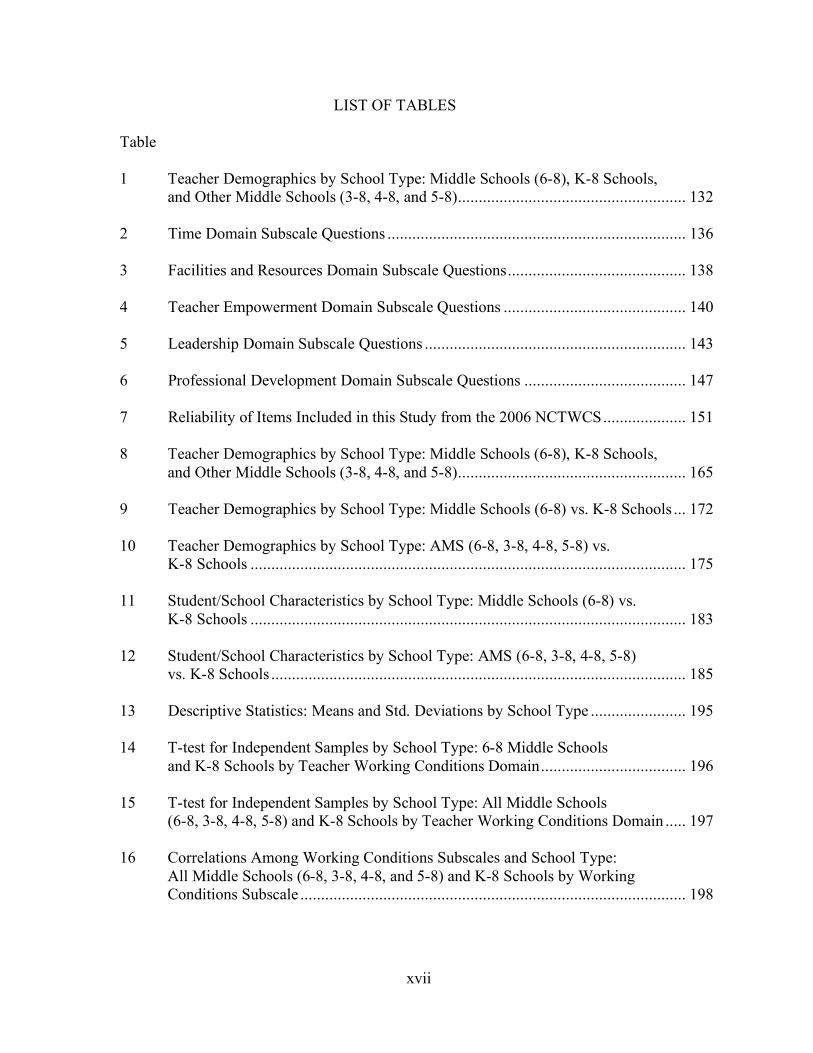
LIST OF TABLES
Table 1 Teacher Demographics by School Type: Middle Schools (6-8), K-8 Schools,
and Other Middle Schools (3-8, 4-8, and 5-8)....................................................... 132
2 Time Domain Subscale Questions ........................................................................ 136
3 Facilities and Resources Domain Subscale Questions........................................... 138
4 Teacher Empowerment Domain Subscale Questions ............................................ 140
5 Leadership Domain Subscale Questions ............................................................... 143
6 Professional Development Domain Subscale Questions ....................................... 147
7 Reliability of Items Included in this Study from the 2006 NCTWCS.................... 151
8 Teacher Demographics by School Type: Middle Schools (6-8), K-8 Schools, and Other Middle Schools (3-8, 4-8, and 5-8)....................................................... 165
9 Teacher Demographics by School Type: Middle Schools (6-8) vs. K-8 Schools ... 172
10 Teacher Demographics by School Type: AMS (6-8, 3-8, 4-8, 5-8) vs. K-8 Schools ......................................................................................................... 175
11 Student/School Characteristics by School Type: Middle Schools (6-8) vs. K-8 Schools ......................................................................................................... 183
12 Student/School Characteristics by School Type: AMS (6-8, 3-8, 4-8, 5-8) vs. K-8 Schools .................................................................................................... 185
13 Descriptive Statistics: Means and Std. Deviations by School Type ....................... 195
14 T-test for Independent Samples by School Type: 6-8 Middle Schools and K-8 Schools by Teacher Working Conditions Domain................................... 196
15 T-test for Independent Samples by School Type: All Middle Schools (6-8, 3-8, 4-8, 5-8) and K-8 Schools by Teacher Working Conditions Domain ..... 197
16 Correlations Among Working Conditions Subscales and School Type: All Middle Schools (6-8, 3-8, 4-8, and 5-8) and K-8 Schools by Working Conditions Subscale ............................................................................................. 198
xviii
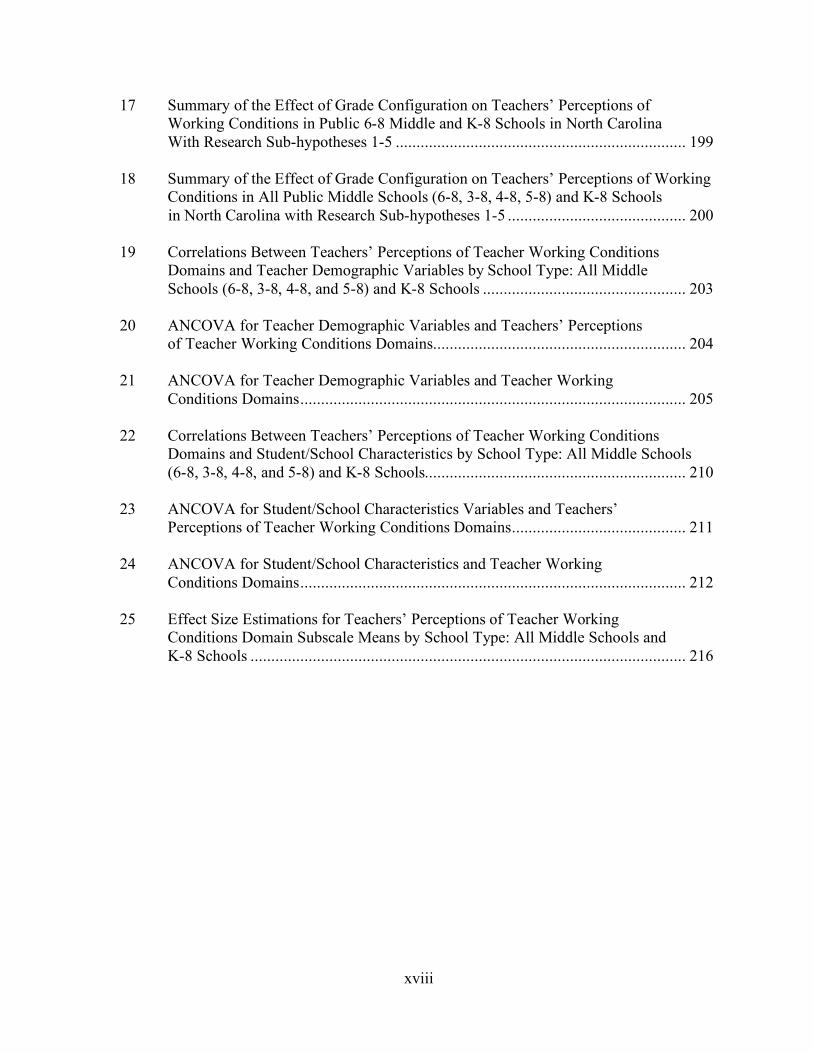
17 Summary of the Effect of Grade Configuration on Teachers’ Perceptions of Working Conditions in Public 6-8 Middle and K-8 Schools in North Carolina With Research Sub-hypotheses 1-5 ...................................................................... 199
18 Summary of the Effect of Grade Configuration on Teachers’ Perceptions of Working
Conditions in All Public Middle Schools (6-8, 3-8, 4-8, 5-8) and K-8 Schools in North Carolina with Research Sub-hypotheses 1-5 ........................................... 200 19 Correlations Between Teachers’ Perceptions of Teacher Working Conditions
Domains and Teacher Demographic Variables by School Type: All Middle Schools (6-8, 3-8, 4-8, and 5-8) and K-8 Schools ................................................. 203
20 ANCOVA for Teacher Demographic Variables and Teachers’ Perceptions of Teacher Working Conditions Domains............................................................. 204
21 ANCOVA for Teacher Demographic Variables and Teacher Working Conditions Domains............................................................................................. 205
22 Correlations Between Teachers’ Perceptions of Teacher Working Conditions Domains and Student/School Characteristics by School Type: All Middle Schools (6-8, 3-8, 4-8, and 5-8) and K-8 Schools............................................................... 210
23 ANCOVA for Student/School Characteristics Variables and Teachers’ Perceptions of Teacher Working Conditions Domains.......................................... 211
24 ANCOVA for Student/School Characteristics and Teacher Working Conditions Domains............................................................................................. 212
25 Effect Size Estimations for Teachers’ Perceptions of Teacher Working Conditions Domain Subscale Means by School Type: All Middle Schools and K-8 Schools ......................................................................................................... 216
CHAPTER I
INTRODUCTION
The Importance of the Middle Grades for Young Adolescents
The middle grades for young adolescents are a crucial time period if young they are
to be successful academically and professionally in the future. One of the reasons for the
movement to organize adolescent students in schools with a separate grade configuration for
middle grades students grades four through eight was to meet the needs of young adolescents
in a setting entirely devoted to adolescent education (Herman, 2004; Mizell, 2005). Schools
serving young adolescents of the middle grades are structured in various arrangements, such
as fourth to eighth, fifth to eighth, and sixth to eighth. The majority of middle schools are
organized in a sixth to eighth grade format. The reason for the predominance of the sixth to
eighth grade format is because adolescents face numerous emotional and academic
challenges in their developmental years. For young adolescents to reach their academic
potential during a time of great physical and psychological transformation, schools must be
structured so that appropriate services are available to meet their needs.
A second reason middle grades years are so important is that the middle grades years
are a time for beginning vocational and career exploration (Juvonen, Le, Kagonoff,
Augustine, & Constant, 2004; Mizell, 2005). Middle grades students are provided with a
wide variety of elective course offerings. Elective courses such as foreign languages,
computer skills,

2
dramatic arts, and vocational careers are incorporated within the context of an exploratory,
middle grades curriculum. This allows students to explore topics they might wish to pursue
in greater detail in high school as middle grades students. Hence, middle grades students
have the opportunity to broaden their academic horizons prior to entering high school.
Young adolescents are also better prepared to make academic choices that could open doors
to post-secondary educational opportunities before they enter high school.
The ability to personally shape one’s career opportunities is another reason the middle
grades years are so important for young adolescents. As society continues to press its youth
to grow up faster and assume more and more responsibility, the increased pressure placed on
children to perform on accountability tests will provide middle grades students with
opportunities to shape their academic tracks prior to entering high school. By the time
students reach high school, it may be too late, academically, for struggling students.
Furthermore, placing students in academic tracks during their middle grades years, especially
in math, might limit their academic choices once they reach high school.
Successful academic performance in the middle grades is important, because
students’ learning in reading, writing, and math should prepare students to succeed on the
college entrance exams they will take throughout their high school years. For example,
students are often given the opportunity to take the Pre-Scholastic Aptitude Test (PSAT),
once they are enrolled in a certain mathematics course in high school. Students who pursue
higher mathematics courses in middle grades are extended this opportunity at an earlier stage
in their schooling. In fact, students labeled Academically and Intellectually Gifted (AIG) in
some school districts take the PSAT for the first time in middle school. With better academic
planning and more efficient organization during the middle grades years, more students
3
might qualify to take the PSAT at a younger age. Furthermore, middle school students’ math
credits influence how soon students encounter collegiate accountability tests such as the
PSAT. These pre-collegiate accountability tests often open doors to post-secondary
institutions and present opportunities to qualify for post-secondary scholarships.
In addition to the PSAT, students begin to progressively build up knowledge for
college entrance exams such as the Scholastic Aptitude Test (SAT) and the American
College Testing Program (ACT) within their middle grades’ curricula. It is important to
prepare students to perform well on these college entrance exams in the middle grades
because college admission, as well as scholarships and financial aid, is often tied to student
performance on college entrance exams; hence, post-secondary academic opportunities might
be increased for high school students if students are better prepared in the middle grades for
these high-stakes tests.
The middle grades are also a vital period in young adolescents’ lives because it is
during this time that students are often first exposed to drugs, alcohol, and the opportunity to
engage in sexual activities (Hough, 1995; George, 2005). A good middle grades program
will integrate counseling and instruction during these years to encourage students to abstain
from the use of drugs, alcohol, and sexual activities. Separate middle schools were
introduced in part to counteract adolescents’ early encounters with these social problems
(Hough, 1995; Herman, 2004). Educators hoped separate middle schools would shield
younger children in the primary grades from these negative aspects of adolescence.
A final reason a proper setting for the middle grades is so important is that it is during
this time period that there is often a significant rise in student discipline problems. Increased
incidents of fighting, skipping school, drug and alcohol use, harassment, and profanity often
4
increase at schools during the middle grades years (Franklin & Glascock, 1998).
Establishing the best grade configuration for middle grades students might curtail discipline
problems, which, in turn, could have a positive effect on middle grades students’ academic
performance (Patton, 2005). Fewer discipline problems involving middle grades students
also might decrease teacher turnover through increased teacher retention.
Patton (2005) reported that in Philadelphia, a city in which school district
administrators recently began converting middle schools to K-8 schools in an attempt to
better meet the needs of its students and teachers, teacher retention rates are higher at K-8s
than middle schools. Researchers often link student discipline problems at all levels of
schooling to teacher dissatisfaction, which often leads to teacher turnover (also referred to as
teacher attrition) (Georgia Professional Standards Commission, 2001; Ingersoll, 2001;
Patton, 2005). In fact, the Georgia Professional Standards Commission found, in its
quantitative study looking at the factors that affect teacher retention, that 59% of teachers
who responded to their survey viewed student discipline as “unsatisfactory” or “very
unsatisfactory” at the time of the survey. The Georgia Teacher Retention Study also revealed
69% of teachers indicated student discipline problems were “likely or very likely reasons for
leaving the teaching profession” in their current status at the public school in which they
currently were employed (p. 27). When discussing the effects of teacher turnover, Ingersoll
explained that “teacher turnover is a significant phenomenon and a dominant factor behind
the demand for new teachers and the difficulties schools encounter inadequately staffing
classrooms with qualified teachers” (p. 5).

5
Questioning the Middle School Model: Does It Meet the Academic and Socio-Emotional
Needs of Young Adolescents
In recent years, educators have begun to question what the most appropriate grade
configuration is for schools to best meet the academic and socio-emotional needs of young
adolescents. This debate is concentrated on the analysis of the two most popular grade
configurations for schools serving young adolescents ranging in age from 10 to 14: middle
schools and K-8 schools. Researchers such as Anfara and Buehler (2005) suggested there is
“evidence that academic achievement, social development, and dropout rates are all
influenced by grade span configuration.” (p. 56)
David L. Hough (1995) was one of the first educators to write extensively on the
potential move away from the middle school grade configuration. Hough questioned the
acceptance of the middle school model as the only option for organizing young adolescents
within a school (p. 8). Hough elaborated on his indecisiveness in support of a specific
middle school grade configuration when he suggested, “there is no national consensus on
appropriate spans for the middle grades” (p. 8). Hough recognized the importance grade
configuration could have on the quality of young adolescents’ education and called for a shift
to what he referred to as the “elemiddle school,” which he defined as:
One that attends to the needs of young adolescents, aged 10 to 14, in any combination of grades 5 through 8, but is also part of an organizational structure that includes lower grades. (p. 7)
Hough’s “elemiddle school” of the mid 1990s preceded by nearly a decade the revival of the
K-8 grade configuration now seen in many urban areas throughout the nation.
Seller (2004, August) also explored the topic of grade configuration. However,
Seller’s research examined the best grade configurations for students in all grades
6
kindergarten through twelfth. Seller noted that there are two competing factors which school
district administrators must consider when choosing grade configurations for the schools in
their districts. Seller explained “even though what is best for the student is central to the
decision, administrative issues related to finances, transportation, space usage, and others can
affect the final decision” (p. 2). Seller identified “many purposes” that should be considered
when determining the best grade configuration for middle grades students (p. 5). As noted
previously, student and administrative factors should be considered by school administrators
when selecting the best grade configurations for middle grades students. Student factors to
be considered by administrators, according to Seller, when selecting the best grade
configuration for middle grades students included “academic achievement, social adjustment,
high school preparation, increased parental involvement, and beneficial effect on the
community” (p. 6). Administrative factors which influence administrators’ selection of grade
configuration for middle grades students included “cost effectiveness, transportation
efficiency, building usage, and personnel deployment” (p. 6). Following his research on the
topic of grade configuration Seller concluded that “there is not a single grade span
configuration that will serve all purposes” (p. 2).
The Influence of Politics and Policy: Why Some Lower-Wealth, Rural Districts Never Left the
K-8 Model
Many rural school districts across the nation have never swayed in their support and
use of the K-8 grade configuration (DeYoung, Howley, and Theobald, 1994; Franklin &
Glascock, 1998; Seller, 2004, August). Hough (1995) realized that districts that considered
implementation of separate middle schools would have to be convinced of the value of grade
configuration models for young adolescents designed along the lines of his “elemiddle
7
school” model (p. 9). Even though Hough expressed his opposition to separate middle
school grade configurations, he acknowledged that ultimately, the grade configuration
implemented within a particular school district “will probably remain a function of decision
makers’ personal preferences, community needs, and economic necessity (p. 9).
As the resurgence of K-8 schools has begun to gather steam in comparison to middle
schools, DeYoung, Howley, and Theobald (1994) spoke passionately to rural America to
hang tight to their K-8 school communities and oppose any school movement which might
wish to replace K-8 schools with middle school grade configurations. Failing to do so “may
improve their own school right out of existence” (p. 24)
Welcome Back K-8 Schools
Barry E. Herman (2004) recently concluded that “there is much interest around the
country in the revival of K-8 schools” (p. 8). His observation of the rising popularity of the
K-8 model, especially in large, urban areas, has also been noted by other scholars of middle
grades education (Abella, 2005; George, 2005; Herman, 2004; Mizell, 2005; Seller, 2004,
August). Many large cities across the country, such as Baltimore, Cincinnati, Cleveland,
Denver, Miami, Milwaukee, Newark, New Orleans, Philadelphia, Phoenix, and New York
City are either transforming their districts entirely to K-8 schools or are beginning a gradual
changeover to schools with the K-8 grade configuration (Abella, 2005; Anfara & Buehler,
2005; George, 2005; Look, 2001; Mizell, 2005).
Statement of the Problem
An often overlooked area in the grade configuration debate on the success of K-8
schools versus middle schools in educating middle grades students is teachers’ perceptions of
K-8 schools and middle schools. Could anyone have greater expertise, and a more up-close

8
perspective on the advantages and disadvantages of K-8 and middle school grade
configurations than those who work daily within these school structures? There are two
reasons that additional research looking at teachers’ perceptions of K-8 schools and middle
schools needs to be conducted. The first reason is the absence of comprehensive literature on
teachers’ perceptions of K-8 schools and middle schools. A second reason for expanding
research on teachers’ perceptions of K-8 schools and middle schools is the vital information
teachers within these grade configurations might provide if only approached; hence, more
research should be completed that concentrates on the inclusion of teachers and their
perceptions of the advantages and disadvantages of K-8 schools versus middle schools.
In recent years, several states, including Arizona, Georgia, Kansas, Ohio, North
Carolina, and South Carolina have followed the lead of Governor Mike Easley and the state
of North Carolina by conducting extensive research on teachers’ perceptions of the working
conditions within the schools in which they work (Hirsch, 2005a; 2005b; Hirsch & Emerick
with Church & Fuller, 2006a; 2006b; 2006c; 2007a). Charlotte Advocates for Education
(CAE) (2004), a non-profit educational group, commended Governor Easley’s support for
education and North Carolina teachers through his 2002 Teacher Working Conditions
Initiative. Their report explained that the purpose of the Teacher Working Conditions
Initiative was to increase teacher retention and improve the educational experience for all
students in North Carolina public schools by analyzing data gathered from North Carolina
public school teachers, administrators, and other licensed-educators on their perceptions of
teacher working conditions in North Carolina public schools. CAE explained that the
Teacher Working Conditions Initiative was made possible by Governor Easley’s “partnership
with the North Carolina Professional Teaching Standards Commission, with assistance from

9
the NC Association of Educators, and with funding from Bell-South-NC” (p. 25). Once
political and financial support was established for the Teacher Working Conditions Initiative,
the 2002 North Carolina Teacher Working Conditions Survey (NCTWCS) was created in
collaboration with teacher representatives from the North Carolina Professional Teaching
Standards Commission (NCPTSC). The 2002 NCTWCS was then mailed to every teacher,
principal, and licensed educator in all North Carolina public schools for the first ever
assessment of teacher working conditions in North Carolina public schools and in any public
school system in the nation.
In 2004 and 2006 the NCTWCS was re-administered to teachers, administrators, and
other licensed professionals in North Carolina public schools after modifications were made
to the NCTWCS after each administration. Data were disaggregated after each
administration by the Southeast Center for Teaching Quality (now known as the Center for
Teaching Quality) in Chapel Hill, North Carolina. Working conditions survey data were
measured using grade configuration of teachers and schools as the units of analysis. The
NCTWCS was structured to gather measurable data on teacher working conditions along five
domains of working conditions as defined by the North Carolina Professional Teaching
Standards Commission. These domains included (a) time; (b) facilities and resources; (c)
leadership; (d) teacher empowerment; and (e) professional development. Valuable data on
teacher working conditions have been gathered in North Carolina from the three previous
administrations of the NCTWCS. However, this research has failed to focus on potential
differences that might be present in the working conditions teachers may face in public K-8
and middle schools that serve young adolescents within the middle grades in North Carolina.
In fact, the “working conditions” surveys have failed to even delineate responses according
10
to the K-8 versus middle school categories. Instead, the states that have conducted working
conditions surveys amongst their teachers have simply lumped survey responses
categorically into three main levels: elementary, middle, and secondary school teacher
responses. Categorizing teacher surveys in this manner has failed to separate K-8 teacher
responses from elementary (K-5) responses so that a potential comparison of K-8 to separate
middle school survey responses could be conducted. No attempt was made to draw
conclusions as to what potential differences in working conditions may be for teachers in K-8
schools versus middle schools.
The reason it is important that research looking at teachers’ perceptions of working
conditions in K-8 schools versus middle schools be conducted is that conclusions could
potentially be drawn from teachers’ perceptions of working conditions in their schools and
the overall success of particular grade configurations at educating students within these
schools. Emerick and Hirsch (2004) recognized the interconnectedness of teachers’ working
conditions and student achievement stating that the data from previous administrations of the
NCTWCS indicates “powerful empirical links between teachers’ working conditions and
student achievement in elementary, middle, and particularly high schools.” The research on
teachers’ working conditions, however, needs to be expanded a step further to examine the
potential effects of various grade configurations on teachers’ perceptions of working
conditions. This study took secondary survey data gathered from the administration of 2006
NCTWCS, and examined the effect of grade configuration at the K-8 and middle school level
on teachers’ perceptions of working conditions.
11
The Southeast Center for Teaching Quality (SECTQ) (2004) also recognized the
relationship between teacher working conditions and student achievement. SECTQ declared
that:
Teachers’ responses on the working conditions survey were significant and powerful predictors of whether or not schools made Adequately Yearly Progress (AYP) and performed well on the state’s ABCs both in terms of growth and school designation. (p. 2)
According to North Carolina Report Cards, Adequately Yearly Progress (AYP) is a yearly
measure of academic progress in reading and mathematics established by the No Child Left
Behind federal legislation on education. AYP is met at schools when at least 95 percent of
students in each student group are tested and meet the targeted proficiency goal in reading
and mathematics. Student subgroups for which AYP is calculated include the School as a
whole, White, Black, Hispanic, Native American, Asian, Multiracial, Economically
Disadvantaged Students, Limited English Proficient Students, and Students with Disabilities.
A school fails to meet its yearly AYP if one student subgroup does not meet its targeted
proficiency goal in either reading or math.
Another reason for the importance of this study is the fact that often a direct
correlation is made between teacher satisfaction/teachers’ perceptions of their working
conditions and the ability of teachers to successfully meet the academic and emotional needs
of their students (Hirsch, 2005a; 2005b; Hirsch & Emerick with Church & Fuller, 2006a;
2006b; 2006c; 2007a; 2007b; Southeast Center for Teaching Quality, 2004). The Southeast
Center for Teaching Quality (SECTQ) (2004), in its Interim Report on Governor Mike
Easley’s Teacher Working Conditions Initiative, suggested that public educators often

12
overlook the importance of the relationship between teacher satisfaction and working
conditions. SECTQ explained:
Yet, while business often focuses on employee satisfaction, many schools often struggle to address critical working conditions. Such conditions are closely related to teacher turnover and difficulties in recruiting and retaining teachers. Rarely has the academic and policy community taken teacher working conditions seriously, although research evidence has proven the link between the conditions under which teachers work and their effectiveness. (p. 2)
A final reason for the importance of this study is the growing concern in states and
school districts across the nation with teacher retention. Policymakers in some urban and
rural areas even refer to the current status of the teacher workforce as a time of teacher
shortage, and not just a problem of teacher retention (Baltimore City Public School System
Division of Research, Evaluation, Assessment, and Accountability, 2002; Charlotte
Advocates for Education, 2004; Colgan, 2004; Futernick, 2007; Georgia Professional
Standards Commission, 2001; Ingersoll, 2001; Center for Teaching Quality).
CAE (2004) recently commented at length on the current “teacher shortage” in North
Carolina (p. 26). CAE explained that schools of education are not graduating enough
students to fill teaching vacancies in North Carolina public schools each year. CAE
discovered that over 10,000 teachers are hired for public school teaching vacancies in North
Carolina each year. Due to the “teacher shortage” in North Carolina, CAE suggested that
schools are turning to “lateral entry candidates, teachers from other states, and teachers
returning to the profession after time away” to fill teaching vacancies (p. 26).
Consequently, looking at teachers’ perceptions of working conditions in the state of
North Carolina might help policymakers better address the problems of teacher retention and
teacher shortage in North Carolina. Also, educational policymakers should examine the

13
effects of teacher demographic variables such as (a) ethnicity; (b) gender; (c) educational
training prior to beginning teaching; (d) highest degree earned; (e) if a teacher is National
Board Certified; (f) years as an educator; and (g) years at a school on teachers’ perceptions of
working conditions. Data on these teacher demographic variables was collected from survey
respondents in the administration of the 2006 NCTWCS. Educational policymakers should
also examine the effects of student/school characteristics on teachers’ perceptions of working
conditions. The effects of student/school characteristics variables on teachers’ perceptions of
working conditions that could be examined include (a) socio-economic status of students and
(b) student/school academic achievement. Socio-economic status of students can be
measured by the percentage of students eligible for free and reduced lunch at a school.
Student/school academic achievement can be measured by ABC School Recognitions and the
percentage of students’ proficient on end-of-grade tests. An examination of the effects of
teacher demographic and student/school characteristics variables on teachers’ perceptions of
working conditions should result in a more accurate analysis of the effects of grade
configuration on teachers’ perceptions of working conditions at K-8 and middle school
configurations in North Carolina public schools.
Summary
The reasons are numerous for examining the best grade configuration for middle
grades students. Research indicates the reasons for the current debate over the best grade
configuration for middle grades students include (a) which grade configuration best meets the
academic needs of middle grades students; (b) which grade configuration best prepares
middle grades students for their future academic and professional careers in high school,
college, and beyond; (c) which grade configuration best meets the socio-emotional needs of
14
young adolescents during a time of great change physically, emotionally, and socially in their
lives; (d) which grade configuration best addresses potential disciplinary problems that
middle grades students might face during their middle grades tenure; and (e) the rise in
popularity of the K-8 grade configuration in many urban areas in recent years.
Likewise, the reasons are numerous for the importance of examining teachers’
perceptions of working conditions at this time, especially for middle grades teachers, whose
grade configuration is already being debated in the public sphere. Examining middle grades
teachers’ perceptions of working conditions will provide the teachers’ expert opinions on the
debate between the K-8 and middle school grade configuration. Reasons provided within the
research on teacher working conditions for continuing and expanding research on teacher
working conditions include (a) teachers’ perceptions of working conditions are often
overlooked in educational research, especially in a discussion of the best grade configuration
for middle grades students; (b) recent correlations have been made between student
achievement and teacher working conditions; (c) teacher satisfaction is often linked to
teachers’ positive perceptions of their working conditions; and, (d) recent correlations have
been made between positive teachers’ perceptions of working conditions and teacher
retention.
Purpose of the Study
The purpose of this study was to examine the relationship between grade
configuration and teachers’ perceptions of the working conditions in public K-8 and middle
schools in North Carolina.

15
Major Hypothesis
HR = Public, K-8 school teachers will report greater satisfaction with working conditions in
K-8 schools than public middle school teachers in middle schools in the state of North
Carolina as measured by the 2006 North Carolina Teacher Working Conditions Survey.
Sub-hypotheses
1. K-8 teachers will report less satisfaction with the use of time at their schools than
AMS teachers according to the 2006 NCTWCS.
2. K-8 teachers will report greater satisfaction with access to facilities and resources
than AMS teachers according to the 2006 NCTWCS.
3. K-8 teachers will report greater satisfaction with leadership at their schools than AMS
teachers according to the 2006 NCTWCS.
4. K-8 teachers will report greater satisfaction with opportunities for teacher
empowerment at their schools than AMS teachers according to the 2006 NCTWCS.
5. K-8 teachers will report greater satisfaction with the professional development
offered at their schools than AMS teachers according to the 2006 NCTWCS.
6. Teacher demographics (ethnicity, gender, educational training prior to beginning
teaching, highest degree earned, if a teacher is National Board Certified, years as an
educator, and years at a school) will not significantly affect teachers’ perceptions of
working conditions.
7. Student/school characteristics including socio-economic status of students (as
determined by the percentage of students eligible for free and reduced lunch) and
student/school academic achievement (as measured by 2005-06 ABC School
Recognitions and percentage of students’ proficient on the 2005-06 Reading End-of-

16
Grade test) will significantly affect teachers’ perceptions of all teacher working
conditions domains except time.
Overview of Methods
This study examined the differences between school grade configurations for early
adolescents and teachers’ perceptions of working conditions in public K-8 schools and
middle schools in the state of North Carolina. The completion of the quantitative analysis of
the 2006 NCTWCS data set was used to test the hypothesis that public K-8 school teachers
will report greater satisfaction with working conditions in K-8 schools than public middle
school teachers in middle schools in the state of North Carolina as measured by the 2006
NCTWCS. Conclusions and recommendations were made based on the findings from this
study which examined teachers’ perceptions of working conditions at public K-8 and middle
schools in North Carolina and whether these differences hold when controlling for teacher
demographic and student/school characteristic variables.
A “Non-Equivalent Control Group Design” was established, as described by
Campbell and Stanley (1963). A quasi-experimental, nonequivalent control group design
was used for this study for the purposes of examining the effects of grade configuration on
teachers’ perceptions of working conditions in public K-8 and middle schools in North
Carolina. Campbell and Stanley explained that quasi-experimental designs are used in
social settings in which the research person can introduce something like experimental design into his scheduling of data collection procedures even though he lacks the full control over the scheduling of experimental stimuli which makes a true experiment possible. (p. 204)
The nonequivalent control group design was chosen by this researcher since the control
group (middle schools) and the treatment group (K-8 schools) did not have what Campbell
and Stanley referred to as “pre-experimental sampling equivalence” (p. 217). Instead of
17
“pre-experimental sampling equivalence,” Campbell and Stanley explained that the groups
within a nonequivalent control group design represent “naturally assembled collectives such
as classrooms” (p. 217). The “naturally assembled collectives” that made up this study’s
control and treatment groups are public K-8 and middle schools in North Carolina. Campbell
and Stanley explained that within a nonequivalent control group design, “the assignment of X
to one group or the other is assumed to be random and under the experimenter’s control” (p.
217).
The independent variable for this research design was grade configuration. Two
types of grade configurations were tested in this study. The K-8 grade configuration served
as the treatment group. The middle school grade configuration served as the comparison
group. The dependent variable for this research study was working conditions. The five
teacher working conditions domains served as co-dependent variables throughout this study.
Data analysis began by sorting the 2006 NCTWCS data set into a file that contained
only survey data for the K-8 and middle school teachers that completed the 2006 NCTWCS.
Only K-8 and middle school teachers in schools that met the 40% response rate guideline for
the 2006 NCTWCS were included in this study’s sample. The unit of analysis for this study
was individual schools. Descriptive statistics were calculated for all public K-8 and middle
school teachers to determine the exact size of the sample for this study. Three distinct groups
of teachers were included in the sample for this study: (1) 6-8 middle school teachers; (2) K-
8 school teachers; and (3) AMS (6-8, 3-8, 4-8, 5-8) teachers. Teacher working conditions
subscale means were calculated for each of the five teacher working conditions domains.
Domain subscale means were calculated for all NCTWCS questions which had the same
Likert-scale responses for each teacher working conditions domain. Means and standard
18
deviations for the domain subscale means were calculated and compared by school type for
Group 1, 6-8 middle school and K-8 teachers, and Group 2, AMS and K-8 school teachers.
Next, teacher working conditions domain subscale means by school type for Group 1 and
Group 2 were compared within groups to determine if there were significant differences in
teacher working conditions domain subscale means within groups by school type.
Next, t-tests for independent samples were conducted to test the major research
hypothesis that
HR = Public, K-8 school teachers will report greater satisfaction with working conditions in
K-8 schools than public middle school teachers in middle schools in the state of North
Carolina as measured by the 2006 North Carolina Teacher Working Conditions Survey.
T-tests for independent samples were calculated for Group 1, K-8 and 6-8 middle school
teachers, and Group 2, K-8 and AMS teachers. T-tests for independent samples were
calculated for each teacher working conditions domain to compare teachers’ perceptions of
teacher working conditions domains by school type for (a) time; (b) facilities and resources;
(c) teacher empowerment; (d) leadership; and (e) professional development. Significance of
� was set at .000 using a two-tailed test.
Further analysis was conducted which controlled for relevant teacher demographic
and student/school characteristics variables. Five separate one-way ANCOVAs were
calculated for the five co-dependent working conditions domain variables: (a) time; (b)
facilities and resources; (c) empowerment; (d) leadership; and (e) professional development.
Grade configuration (school type) served as the independent variable or fixed factor for each
ANCOVA. Teacher demographic and student/school characteristics variables were imported
as co-variates for each ANCOVA. ANCOVAs control for the effects of co-variates and

19
estimate the variance that should be attributed to co-variates and not to the independent
variable in a research study. Significance of � was set at .000 using a two-tailed test.
In this study, ANCOVAS estimated the variance in teachers’ perceptions of teacher
working conditions domains that should be attributed to teacher demographic and
student/school characteristics variables and not grade configuration. The analysis of the
effects of co-variates on teachers’ perceptions of teacher working conditions domains could
have revealed rival alternative hypotheses if it had been discovered that teacher demographic
and student/school characteristics variables were attributing to large variance in teachers’
perceptions of teacher working conditions domains.
Limitations
One potential limitation of this study was the limited generalizability that might result
from the fact that the secondary data set analyzed in this study was completely based on data
from North Carolina public schools. It might be difficult to generalize findings from this
study to other states, or even large, urban school districts (the most recent locations where the
NCTWCS is being modified and administered) if school and student characteristics in
schools and school systems in other states do not mirror the school and student characteristics
of the schools and school systems included within this study’s sample of public K-8 and
middle schools obtained from the 2006 NCTWCS. Hence, teacher demographics in other
states’ schools and school districts will have to be closely scrutinized to determine the
potential generalizabilty of the research findings in this study to schools and school districts’
outside the state of North Carolina.
Another limitation of this study was the inability of this researcher to identify
teachers by the grade level at which they taught in the 2005-06 school year to more
20
comprehensively analyze teachers’ perceptions of teacher working conditions by grade level.
The 2006 NCTWCS did not include a teacher demographic question which asked teachers
the grade level they taught during the 2005-06 school year as a safeguard to teacher
respondent confidentiality. Hence, this researcher had to settle for comparing teachers’
perceptions of teacher working conditions by school type for K-8, 6-8 middle, and all middle
school configurations (6-8, 3-8, 4-8, 5-8; AMS).
An additional limitation that this researcher recognized in the completion of the
literature review for this study was the differences in the location of K-8 schools in North
Carolina as compared to other states across the nation. Many K-8 schools in other states
were found in large, urban areas. This was in striking contrast to the location of many K-8
schools in the rural areas of North Carolina. The differences in location of K-8 schools in
rural North Carolina compared to large, urban areas outside the state of North Carolina
should be examined as a potential rival alternative hypothesis for this study’s findings to be
considered generalizable to K-8 schools in other parts of the country.
Another limitation of this study was the discovery that reliability and validity have
not been established for the 2006 NCTWCS, the survey instrument that was used to gather
the secondary data analyzed in this study. However, this researcher established reliability for
the 2006 NCTWCS data in this study through SPSS 15.0 statistical procedures at the
beginning of the data analysis phase. Despite the fact that official validity had not been
established for the 2006 NCTWCS data, it is important to note that the NCPTSC, comprised
of experienced teachers from North Carolina public schools, created the NCTWCS at the
recommendation of North Carolina Governor Mike Easley in 2002. The NCPTSC was
chosen to create the NCTWCS due to its members’ expert knowledge in the realms of public
21
education and the respect garnered by these experienced teachers within the public schools in
which they worked. The NCTWCS has also been modified and re-administered to all
licensed, public school educators on two separate occasions (2004 and 2006) since the initial
administration of the 2002 NCTWCS. In fact, as this researcher proceeded with this study, a
fourth modified version of the NCTWCS was created for administration in March 2008
within North Carolina public schools. Finally, the fact that other states and large urban
school districts across the nation have administered modified versions of the NCTWCS in
public school districts in their states and large urban school districts across the county
indicates educational policymakers within these states and large urban school districts
consider the NCTWCS as a valid instrument for measuring teachers’ perceptions of teacher
working conditions.
A final limitation of this study was the types of schools and corresponding teachers
from these schools that were omitted from this study’s sample. Like the 2006 NCTWCS,
this study only looked at public K-8 and middle school teachers’ perceptions of teacher
working conditions. Hence, generalizability should not be extended to private K-8 and
middle schools and teachers from these schools when examining the effect of grade
configuration on teachers’ perceptions of working conditions at private K-8 and middle
schools. Finally, this study did not include public charter schools and charter school teachers
within the sample for this study due to the limited response rate of public charter school
teachers to the 2006 NCTWCS.
22
Definition of Terms
ABCs of Public Education: The ABCs of Education is North Carolina’s
comprehensive plan to improve public schools that is based on three goals: strong
accountability, an emphasis on student mastery of basic skills, and as much local
control as possible. The ABCs has been in operation in all schools since 1997-98.
The model focuses on schools meeting growth expectations for student achievement
as well as on overall percentage of students who scored at or above grade level. The
model uses end-of-grade tests in grades 3-8 in reading and mathematics to measure
growth at the elementary and middle school levels (North Carolina Report Cards).
Achievement Level: Standards by which student achievement on end-of-grade and
end-of-course tests is measured and reported (North Carolina Report Cards).
Achievement Level III: Students scoring at this level on end-of-grade and end-of-
course tests are considered proficient in mastery of grade level subject matter and are well
prepared for the next grade level (North Carolina Report Cards).
Adequate Yearly Progress: Adequately Yearly Progress is a yearly measure of
academic progress established by the No Child Left Behind federal legislation on education.
AYP is met at schools “achieving grade level performance for each student group in reading
and mathematics. Schools must test at least 95 percent of students in each group and each
group must meet the targeted proficiency goal in reading and mathematics in order to meet
AYP” (North Carolina Report Cards). Student groups for which AYP is calculated include
the School as a whole, White, Black, Hispanic, Native American, Asian, Multiracial,
Economically Disadvantaged Students, Limited English Proficient Students, and Students
with Disabilities. AYP is not met for a school “if just one student group in one subject at a
23
school does not meet the targeted proficiency goal with a confidence interval applied to
account for sampling error” (North Carolina Report Cards).
Alternative route: Teachers that enter the teaching profession after working in another
career.
Empowerment: The North Carolina Teachers Working Conditions Survey defines
empowerment as “teachers’ perceptions regarding their autonomy and leadership at the
classroom- and school-levels” (Teachers Working Conditions Survey).
Expected growth: Expected growth is defined by the ABC’s of Education in North
Carolina as “the amount of academic growth that would reasonably be expected by a school
over a year’s worth of time” (North Carolina Report Cards). Student growth is measured by
comparing students’ end-of grade test scores in reading and mathematics for two consecutive
years. Factors to be considered when establishing the expected growth for a school from
year to year include: the school’s academic performance the previous school year; statewide
average growth; and a statistical adjustment to allow for the comparison of students’ test
scores from year to year.
Facilities & Resources: The North Carolina Teacher Working Conditions Survey
defines facilities and resources as “teachers’ access to and adequacy, quality, and safety of
school- and classroom-level facilities and resources” (Teachers Working Conditions Survey).
Five domains of the North Carolina Teacher Working Conditions Survey: The five
teacher working conditions measured by the North Carolina Teacher Working Conditions
Survey. The five teacher working conditions domains are: (a) Empowerment; (b) Facilities
and Resources; (c) Leadership; (d) Professional Development; and (e) Time. (Teachers
Working Conditions Survey)

24
Free & Reduced Lunch: The measurement used to indicate students’ socio-economic
status (SES) or poverty status within a school (North Carolina Report Cards). In their
research, Johnson & Stevens (2006) control for students’ SES through free and reduced lunch
statistics within a sample of elementary schools.
Grade level, achievement level III, and proficiency level: Grade level, achievement
level III, and proficiency level are academic standards according to the ABC’s of Education
in North Carolina that constitute “student work that meets the achievement standard set by
North Carolina.” Students performing at grade level as indicated by scores of Achievement
Level III or Achievement Level IV on end-of-grade tests are considered to be performing at
grade level and at the proficiency level deemed necessary “to be well prepared to meet the
demands of the next grade level” (North Carolina Report Cards).
High growth: High growth, according to the ABCs of Education in North Carolina
“refers to a growth rate that is approximately 10 percent above the expected growth goal set
for each school” (North Carolina Report Cards).
Highly Qualified teacher: “A Highly Qualified teacher is defined as one who has
obtained full state teacher certification or has passed the state teacher licensing examination
and holds a license to teach in the state” (North Carolina Report Cards).
Honor Schools of Excellence: According to the ABCs of Public Education, a school
is designated as a Honor School of Excellence if 90-100 percent of students score at or above
Achievement Level III on end-of-grade tests, the school makes expected or high growth, and
the school makes AYP (North Carolina Report Cards).
Hygiene factors: Herzberg (1966) defined hygiene factors or “dissatisfiers,” as
factors which “served only to bring about job dissatisfaction and were rarely involved in
25
events that led to positive job attitudes” (p. 92-93). Hygiene factors “essentially describe the
environment and serve primarily to prevent job dissatisfaction, while having little effect on
positive job attitudes” (p. 94). Hygiene factors acknowledged by Herzberg throughout the
course of The Motivation to Work study which often led to worker dissatisfaction included
“company policy and administration, supervision, salary, interpersonal relations, and
working conditions” (p. 94).
K-8 schools: Schools serving students in grades kindergarten through eighth grade.
Leadership: The North Carolina Teacher Working Conditions Survey defines
leadership as “teachers’ perceptions of the effectiveness, supportiveness, and professionalism
of their school leaders” (Teachers Working Conditions Survey).
Leavers: Teachers who intend to leave the teaching profession for other career
opportunities.
Low Performing Schools: According to the ABCs of Public Education, a school is
designated as a Low Performing School if less than 50 percent of students score at or above
Achievement Level III on end-of-grade tests. Low Performing Schools also fail to make
expected or high growth (North Carolina Report Cards).
Middle schools: Middle schools are schools serving young adolescents in the most
common middle school grade configuration including grades six through eight. However, a
small number of public middle schools in North Carolina in primarily rural areas in the
eastern and western portions of the state are made up of grade configurations which may
include grades three, four and five as well as the more common middle school grades of six
through eight. For purposes of summarizing the data from the 2006 NCTWCS, Hirsch &

26
Emerick with Church & Fuller (2006a) included the grade configurations of: 3-8, 4-8, 5-8,
and 6-8 into the data analysis of middle schools.
Movers: Berry & Fuller with Williams & Lobacz (2007, Fall) defined movers as
“teachers who intend to continue teaching but who plan to move to another school within
their district or to another school district altogether” (p. 4).
Motivation factors: Herzberg defined motivational factors or “satisfiers” as the
“strong determiners of job satisfaction,” which “are effective in motivating the individual to
superior performance and effort” (p.92 & 94). Motivational factors acknowledged by
Herzberg over the course of The Motivation to Work study which should lead to worker
satisfaction are “achievement, recognition, work itself, responsibility, and advancement” (p.
92).
Motivation-hygiene theory of worker satisfaction: The Motivational-hygiene theory
of worker satisfaction, according to Herzberg (1966) explains “the concept that man has two
sets of needs: his need as an animal to avoid pain and his need as a human to grow
psychologically” (p. 91). In Herzberg’s 1959 Motivation to Work study two distinct types of
factors affecting worker satisfaction and dissatisfaction emerged. Herzberg categorized these
factors as “motivational” often referred to as “satisfiers,” and “hygiene,” often referred to as
“dissatisfiers” (p. 92-95). Herzberg defined motivational factors or “satisfiers” as the “strong
determiners of job satisfaction,” which “are effective in motivating the individual to superior
performance and effort” (p. 92 & 94). Herzberg defined hygiene factors or “dissatisfiers,” as
factors which “served only to bring about job dissatisfaction and were rarely involved in
events that led to positive job attitudes” (p. 92-93). Hygiene factors “essentially describe
27
the environment and serve primarily to prevent job dissatisfaction, while having little effect
on positive job attitudes” (p. 94).
No Child Left Behind (NCLB): No Child Left Behind (NCLB) is the name given to
federal legislation defining the federal government’s role in public education. According to
ncreportcards.org, the primary goals of NCLB are for all schools to reach 100 percent
proficiency in student achievement on end-of-grade state tests and for every student to be
taught by a Highly Qualified teacher by 2013-14.
2006 North Carolina Teacher Working Conditions Survey (2006 NCTWCS): An
online, quantitative, survey instrument used to assess the perceptions of working conditions
held by all licensed educators in North Carolina public schools at the beginning of the 2005-
06 school year.
No Recognition Schools: According to the ABCs of Public Education, a school is
designated as a No Recognition School if 60 to 100 percent of students score at or above
Achievement Level III on end-of-grade tests, but, the school does not make expected or high
growth (North Carolina Report Cards).
Priority Schools: According to the ABCs of Public Education, a school is designated
as a Priority School if 50 to 60 percent or less than 50 percent of students score at or above
Achievement Level III on end-of-grade tests. Priority Schools also fail to make expected or
high growth (North Carolina Report Cards).
Professional Development: The North Carolina Teacher Working Conditions Survey
defines professional development as “teachers’ opportunities to design and engage in
professional development and school leadership activities” (Teachers Working Conditions
Survey).

28
Schools of Distinction: According to the ABCs of Public Education, a school is
designated as a School of Distinction if 80-89 percent of students score at or above
Achievement Level III on end-of-grade tests and the school makes expected or high growth
(North Carolina Report Cards).
Schools of Excellence: According to the ABCs of Public Education, a school is
designated as a School of Excellence if 90-100 percent of students score at or above
Achievement Level III on end-of-grade tests and the school makes expected or high growth
(North Carolina Report Cards).
Schools of Progress: According to the ABCs of Public Education, a school is
designated as a School of Progress if 60-79 percent of students score at or above
Achievement Level III on end-of-grade tests and the school makes expected or high growth
(North Carolina Report Cards).
Teacher attrition: According to the Georgia Professional Standards Commission
(2001), teacher attrition is the number of teachers leaving their current schools either to take
jobs at other schools or to exit the teaching profession. Teacher attrition is also referred to as
teacher turnover.
Teacher retention: The Georgia Professional Standards Commission (2001) refers to
teacher retention as the ability to keep teachers within their current schools and within the
teaching profession from year to year.
Teacher shortage: The Georgia Professional Standards Commission (2001) explains
that teacher shortages occur when there are more vacant teaching positions than can be filled
by the current supply of available, licensed teacher candidates.
Teacher turnover: See definition of teacher attrition.
29
Teacher working conditions: The accepted definition of teacher working
conditions for current research in the state of North Carolina and other states across
the nation where the Teacher Working Conditions Survey has been administered has
been established by the Center for Teaching Quality. CTQ explains:
The current concept of working conditions for states has moved beyond typical labor issues of occupational health and safety concerns to consider a more comprehensive environment for teaching and learning. Recent teaching working conditions research also includes measures to determine the effect of time allocation, empowerment, professional development, and leadership, complex issues now proven to be closely related to the capacity of professionals to improve student learning. (Center for Teaching Quality)
Teacher Working Conditions Initiative: The Teacher Working Conditions Initiative
was enacted in 2002 by North Carolina’s Governor Mike Easley. The purpose of the Teacher
Working Conditions Initiative was for North Carolina “to implement a statewide study of
teacher working conditions by surveying teachers and administrators across the state”
(Center for Teaching Quality).
Time: The North Carolina Teacher Working Conditions Survey defines the time
domain as “the time available to teachers to adequately engage in such activities as planning,
teaching, and professional development critical to successfully reaching all students”
(Teacher Working Condition Survey).
CHAPTER II
LITERATURE REVIEW
Introduction
Recent years have seen the emergence of a debate on what the most appropriate grade
configuration is for schools to best meet the academic and socio-emotional needs of young
adolescents. This debate centers on the analysis of the two most popular grade
configurations for schools serving young adolescents ranging in age from 10 to 14: K-8
schools and middle schools. K-8 schools are schools that serve student populations in grades
kindergarten through eighth grade. In fact, many K-8 schools now include a pre-
kindergarten (pre-K) program for four year-olds as well. Middle schools are separate schools
designed to meet the academic and emotional needs of middle grades students in isolation
from younger students; however, it is important to note that middle school grade
configurations are often structured differently according to the educational philosophies and
financial capabilities of each individual school district. Hence, separate middle school grade
configurations may include grades 3-8, 4-8, 5-8, or 6-8. However, the most popular middle
school grade configuration includes grades 6-8.
Looking back at statistics from past years on the number of public schools configured
in either a K-8 or middle school configuration is an important starting point in an analysis of
public K-8 schools and middle schools. A search of prominent national websites on

31
education such as The U.S. Department of Education and the National Center for Education
Statistics (NCES) found that public school grade configurations are simply classified into the
categories of elementary and secondary. Under this type of classification, all public K-8
schools and middle schools are placed within the classification of elementary schools;
however, upon further review, a table formulated by the National Center for Education
Statistics delineated public schools beyond the simple classification of elementary and
secondary schools. Public schools within this National Center for Education Statistics table
included totals for the following categories public elementary schools, regular elementary
schools, pre-K, kindergarten (K), or first grade through grades three or four, pre-K, K, or first
grade through fifth grade, pre-K, K, or first grade through sixth grade, pre-K, K, or first grade
through eighth grade, grades four, five, or six through six, seven, or eight, and other grade
spans. Within the Digest of Education Statistics Tables and Figures section of the NCES
website, it was found that, in 2005, 17,843 schools existed that served adolescents up to the
8th grade. Of these schools, 5,502, or 31%, were configured as K-8 schools. The remaining
12,341 schools, 69% of the schools serving adolescents up to the 8th grade, were configured
as middle schools in the form of 4-8, 5-8, or 6-8 grade configurations (NCES, 2007). A
closer look at similar statistics gathered for the 2003 and 2004 school years revealed that the
percentage of K-8 schools to middle schools had remained consistent over this three year
time period. Even though the total number of K-8 schools and middle schools had increased
slightly for each grade configuration over this three year period, 31% of schools serving
adolescents up to 8th grade were K-8 schools and 69% of public schools were one of the three
most common variations of middle schools (4-8, 5-8, or 6-8) (NCES, 2007). These statistics
support conclusions drawn by such educational researchers as Paglin & Fager (1997), who
32
state that “today, the middle school is the dominant form of middle grades education in terms
of numbers of students enrolled” (p. 2).
The state of North Carolina also categorizes school statistics along the lines of grade
configurations within the elementary realm so a search can be conducted to determine the
number of K-8 schools and middle schools serving middle grades students. According to
North Carolina Report Cards, North Carolina’s public school system contained 128 K-8
schools. A further breakdown of the public K-8 schools in North Carolina for the 2005-06
school year found there were 80 regular, non-charter, K-8 schools and 31 regular, charter K-8
schools that followed a traditional ten-month, school calendar, at the beginning of the 2005-
06 school year. K-8 schools classified as a regular school meant they were not designed
specifically to meet the needs of special populations, such as special education students;
students who had been removed from the regular school setting due to excessive discipline
problems; or terminally ill students who were unable to be enrolled in a regular school
setting. There were an additional 17 schools, eight non-charter (seven K-12 and one K-11)
and nine charter (six K-12 and three K-9, K-10, or K-11), that were structured in a grade
configuration extending beyond grade eight due to their extreme rural location or due to their
charter school nature (North Carolina Report Cards, 2007).
A search of North Carolina Report Cards for existing public middle schools either in
a 3-8, 4-8, 5-8 or 6-8 grade configuration for the 2005-06 school year found that there was a
total of 387 public middle schools in North Carolina. Seven of the 387 public middle schools
were classified as a charter school (one 4-8, two 5-8, and four 6-8) operating as a regular
school on a traditional calendar. There were 380 non-charter public middle schools. The

33
public, non-charter middle schools included one 3-8, five 4-8, 25 5-8, and 349 6-8, non-
charter public middle schools (North Carolina Report Cards, 2007).
The literature review will begin the synthesis of literature by looking at where public
K-8 schools remain a popular grade configuration for middle grades students. The discussion
will then turn to locations where public K-8 schools have emerged in greater numbers in
recent years. Before moving into the heart of the literature review and a debate on the
effectiveness of public K-8 schools versus public middle schools in meeting the academic
and emotional needs of middle grades students, the review will discuss characteristics of
previous research that has debated the best grade configuration for middle grades students.
Next, the literature review will shift to a discussion on why the debate on grade
configurations, K-8 versus separate middle schools, is important by focusing on the needs of
young adolescents. This researcher will then discuss literature that provides a brief history of
grade configurations serving middle grades students and the movement in the mid-1990s
which began to question the separate middle school model for middle grades students.
The next segment of this literature review will focus on the reasons for the increased
popularity in the debate between public K-8 schools and public middle schools at best
meeting the needs of middle grades students. Categories that will be discussed within this
segment of the literature review in public K-8 schools, as opposed to middle schools, include
academic achievement, the elimination of the elementary to middle school transition with the
adoption of the K-8 grade configuration, a comparison of discipline within public K-8
schools and public middle schools, parental and community involvement, and the desire to
establish small learning environments. Following the discussion of the literature which
outlines the reasons for the current debate on the best grade configuration for meeting the
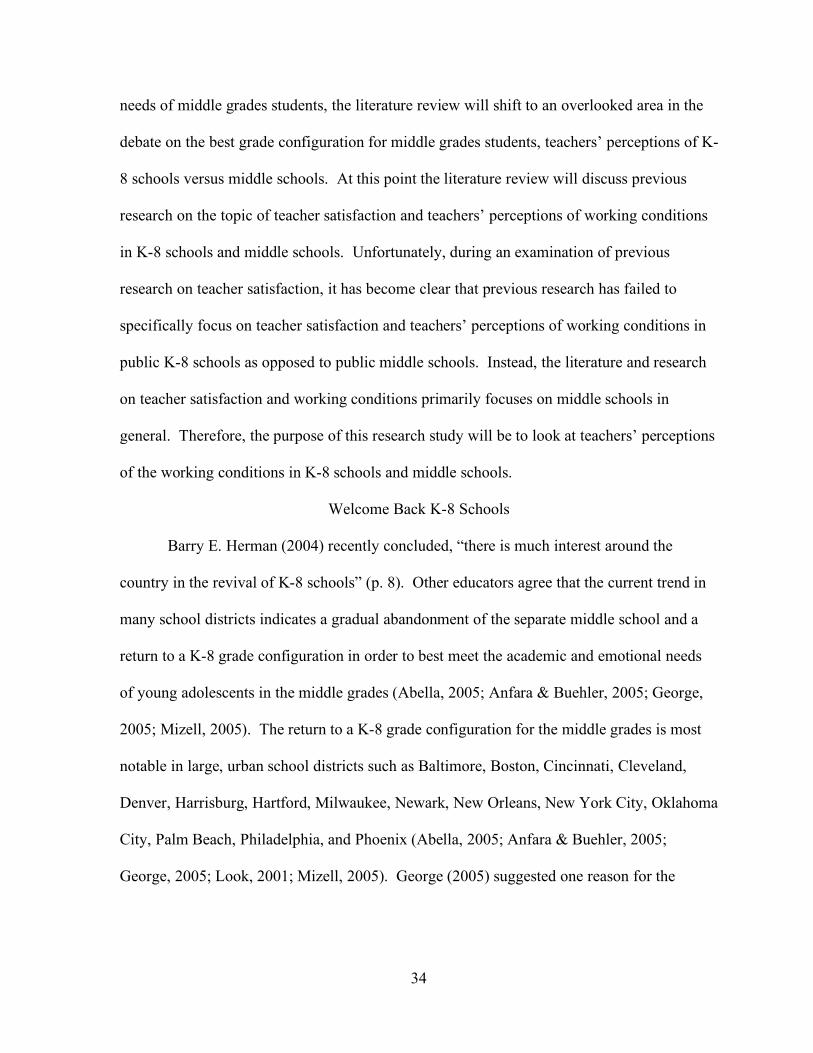
34
needs of middle grades students, the literature review will shift to an overlooked area in the
debate on the best grade configuration for middle grades students, teachers’ perceptions of K-
8 schools versus middle schools. At this point the literature review will discuss previous
research on the topic of teacher satisfaction and teachers’ perceptions of working conditions
in K-8 schools and middle schools. Unfortunately, during an examination of previous
research on teacher satisfaction, it has become clear that previous research has failed to
specifically focus on teacher satisfaction and teachers’ perceptions of working conditions in
public K-8 schools as opposed to public middle schools. Instead, the literature and research
on teacher satisfaction and working conditions primarily focuses on middle schools in
general. Therefore, the purpose of this research study will be to look at teachers’ perceptions
of the working conditions in K-8 schools and middle schools.
Welcome Back K-8 Schools
Barry E. Herman (2004) recently concluded, “there is much interest around the
country in the revival of K-8 schools” (p. 8). Other educators agree that the current trend in
many school districts indicates a gradual abandonment of the separate middle school and a
return to a K-8 grade configuration in order to best meet the academic and emotional needs
of young adolescents in the middle grades (Abella, 2005; Anfara & Buehler, 2005; George,
2005; Mizell, 2005). The return to a K-8 grade configuration for the middle grades is most
notable in large, urban school districts such as Baltimore, Boston, Cincinnati, Cleveland,
Denver, Harrisburg, Hartford, Milwaukee, Newark, New Orleans, New York City, Oklahoma
City, Palm Beach, Philadelphia, and Phoenix (Abella, 2005; Anfara & Buehler, 2005;
George, 2005; Look, 2001; Mizell, 2005). George (2005) suggested one reason for the

35
increase in popularity of the K-8 grade configuration in these urban areas was to close
“‘troubled’ 6-8 middle schools” (p. 6).
With so many large cities across the country either transforming their districts entirely
to K-8 schools, or beginning a gradual changeover to schools with the K-8 grade
configuration, there have to be justifiable reasons for doing so. How else would such large
school districts be able to ensure continued political support from stakeholders within their
school communities?
Herman (2004) ties the K-8 model all the way back to “the one-room schoolhouse,
the nation’s first model for middle level education” (p. 9). He goes on to point out, “students
received a considerable amount of individual attention in the one-room schools that were
common in rural America in the 19th and early 20th centuries” (p. 9). Herman points to
several specific characteristics of the one-room schoolhouse that are often found in K-8
schools today which include the integration of patriotic, legal, religious, and moral values
within the school curriculum. Herman also hails the one-room schoolhouse for providing
opportunities for “cooperative learning and older students helping younger students” (p. 9).
The characteristics of one-room schoolhouses Herman describes are many of the same
characteristics that proponents of K-8 schools in urban and rural school districts across the
United States are rallying behind in support of a move back to K-8 schools from the once
overwhelmingly popular middle school model.
Research on the Debate of the K-8 Versus Middle School Grade Configuration
It is important to note the limited amount of research that has been completed
analyzing the success of K-8 schools and middle schools and their ability to provide
successful learning environments for young adolescent children. Look (2001) describes the
36
breadth of research comparing K-8 schools to middle schools as “a shallow body of
literature” (p. 2). Furthermore, the literature and data that does exist is still considered by
educators such as Hough (1995) as “inconclusive” (p. 9).
The two forms of literature most common that present a comparison of the K-8 and
middle school grade configuration are anecdotal, descriptive articles and statistical analyses.
Connolly, Yakimowski-Srebnick, and Russo (2002) explain:
Anecdotal literature focuses on the advantages and disadvantages of K-8 schools according to the perceptions of parents, teachers, and administrators. These stakeholders defend their preference with an intuitive understanding of the choices. (p. 28)
Hence, anecdotal literature has addressed the K-8 versus middle school debate from a
qualitative approach.
Other researchers (Anfara & Buehler; Connolloy, et al., 2002; Hough, 1995; Paglin &
Fager, 1997) have referenced quantitative studies that have compared K-8 schools to middle
schools from a limited perspective. Statistical analyses, or research studies, depend on the
quantitative data to support one’s argument. For example, Hough acknowledges the presence
of statistical research comparing K-8 schools to middle schools. However, Hough states
quantitative research up to this point “cannot be statistically related to school organization”
in areas such as “student learning, attitudes, behavior, adjustment, truancy, and teacher
performance” (p. 9). Also, Connolloy, et al. emphasize that statistical research is “gravely
limited” (p. 28). The research studies that do exist, in the words of Connolloy et al.
“compare the programs and curricula offered at different middle schools. Few compare K-5,
6-8, with K-8 configured schools” (p. 28). Connolloy et al. conclude by stating that, “no
definitive study has offered a clear direction for schools” that house young adolescents (p.
28).
37
Hough (1995) notes that, when middle schools were rising in popularity, prior to the
renewed popularity of K-8 schools, it was suggested that “an ideal grade span has not been
empirically identified” (p. 7). Paglin and Fager (1997) also decline to entirely support either
K-8 schools or middle schools as being the best grade configuration for middle grades
students as they explain, “Research has not provided definitive answers to the myriad
possible questions about grade span” (p. 1). Paglin and Fager suggest that “even the studies
that do attempt to isolate the effect of grade span by controlling for other variables are
suggestive rather than definitive” (p. 6). Nevertheless, researchers such as Anfara and
Buehler (2005) state there is “evidence that academic achievement, social development, and
dropout rates are all influenced by grade span configuration” (p. 56).
Meeting the Needs of Young Adolescents: K-8 Schools Versus Middle Schools
Even during the height of the middle school movement in the early 1990s, researchers
recognized the unique academic and emotional needs of young adolescents during the middle
grades (Cromwell, 1999; Hough, 1995; McEwin & Alexander, 1990). Hough attributes the
importance of the middle grades for young adolescents to several aspects of adolescents’
lives during the middle grades. Hough recognizes that adolescence is a time of rapid
physical growth, a time for the development of morals and values, and often is when young
adolescents first encounter choices associated with sex, drugs, and violence. Cromwell
suggests that “kids aged 12 and 13 have their own needs—including discipline problems and
special electives” (p. 3).
Look (2001) presents several questions that middle grades educators should address
as school districts decide whether or not to implement K-8 schools or middle schools within
their districts. Questions that Look identifies include:
38
• How can schools increase academic rigor in the middle grades?
• What school conditions are necessary to support adolescent identity
development?
• What interventions aid students’ transitions between grades and
between schools?
• What role do race, class, and gender play in answering these
questions? (p. 1)
George (2005) also discusses the importance of the middle grades for young
adolescents through his comparison of certain aspects of K-8 schools and separate
middle schools. At first, George supports K-8 schools instead of separate middle
schools for young adolescents in the middle grades because of what he views as an
increased potential for middle school students to encounter the evils of adolescence
when they are collectively placed in mass numbers. George explains:
For three additional years, instead of leaving younger children behind and moving to a place with age mates, some of whom might smoke, use drugs, engage in sexual activity, even drive cars, young adolescents could stay younger longer… (p. 8)
However, later in the same article, George flips his argument, stating that keeping young
adolescents in the same building with K-5 students for their middle school years could
potentially result in the “corruption of younger children” as younger children come into
contact with the before-mentioned evils first encountered during adolescence (p. 10).
Connolly, et al. (2002) attributed the rise of middle schools as educators’ “attempt to
address the social and emotional needs” of young adolescents “by offering a more
appropriate educational environment for students” (p. 28). In fact, Connolly et al. propose an
argument held by middle school supporters who believe the best place to educate young
39
adolescents is middle schools, rather than K-8 schools. Connolly et al. offer “that the K-8
grade configuration does not allow for programs to address the particular developmental
needs of any specific age group” (p. 29).
History of Grade Configuration in American Schools: The Decline in the Junior High Grade
Configuration
Barry E. Herman (2004) confides in The Revival of K-8 Schools, that “the middle
school still predominates in public schools in our nation” (p. 7). According to the National
Center for Education Statistics, there were still 12,341 public middle schools in the United
States in 2005, as opposed to 5,502 K-8 schools (NCES, 2007). According to several
educators (Anfara & Buehler, 2005; Cromwell, 1999; Herman, 2004) the rise in popularity of
the middle school grade configuration began in the 1960s. Middle schools arose during this
time period because the junior high grade configuration, primarily consisting of students in
grades 7 through 9, was under question for its ability to meet the academic and socio-
emotional needs of young adolescents (Anfara & Buehler, 2005; Cromwell, 1999; Herman,
2004). Herman describes the junior high school that was most prominent during the 1950s
and 1960s as a “mini-high school” (p. 11). This “mini-high school” type setting in the junior
high school was not meeting the academic needs of young adolescents like it once did during
the onset in its popularity at the turn of the 20th century.
Another reason for the sudden displeasure with the junior high model was the fact
that adolescents’ socio-emotional needs had increased over the first half of the 20th century
due to what Herman (2004) primarily labels as “increased rates of physical and social
maturation” (p. 11). These needs had not existed for junior high schools to address in the
past. Many educators and parents alike felt there was a need to separate ninth graders from
40
other young adolescents in the 7-9 junior high setting because, “ninth-graders are more like
high school students than they were when the original junior high school was conceived” (p.
11). Herman categorizes educators’ continuously changing support in favor of various grade
configurations serving middle grades students from the initial appearance of a middle school
movement, to the more recent “revival of K-8 schools” as “a pendulum swinging back and
forth” (p. 1). Herman suggests the current “revival of K-8 schools” could lead to “phasing
out the junior high (or middle school) concept in some places” (p. 1).
Mizell (2005) reinforced his dissatisfaction with the junior high model in its ability to
meet the needs of young adolescents in the middle grades by a reference to the findings of
Juvonen, Le, Kagonoff, Augustine, & Constant (2004). Juvonen et al. suggest that the junior
high model fails to meet young adolescents’ needs because it focuses on “content rather than
exploration” and “departmentalization rather than integration” amongst other reasons (p. 14).
Junior high schools were viewed as too much like high schools and were not providing the
educational benefits and opportunities that young adolescents needed at this stage in their
lives. However, Mizell highlights other reasons for the sudden popularity of the middle
school model as opposed to the junior high model as the 20th century progressed. Mizell’s
reasons for the conversion to and increase in middle schools include “a rise in secondary
school enrollments, the desire to push sixth grade out of elementary schools, and the need to
address school desegregation” (p. 15).
Anfara and Buehler (2005) attributed the conversion of junior high schools to middle
schools during the 1960s in part to the need for a grade configuration better suited for various
instructional strategies and programs aimed at middle grades students such as “team
teaching, integrated curricula, advisory programs, and flexible scheduling” (p. 53).
41
Factors to Consider in the Debate on the Best Grade Configuration for Middle Grades Students
Questioning the Middle School Model from the Perspective of Location
DeYoung, Howley, and Theobald (1994) present a challenge to the middle school
grade configuration during a time it remained highly popular in the early 1990s from the
perspective of location. They challenged the feasibility of the middle school grade
configuration for rural areas throughout the United States. DeYoung et al. speak
passionately for rural America to protect their K-8 school communities. DeYoung et al.
argue:
But more is at stake in rural America than an intellectual argument over the aims of middle schooling. Rather, on two accounts, the emergence of middle schools under the cloak of psychological progress can be destructive to both the declining sense of community in America, and to the actual persistence of many rural communities still organized around K-8 or K-6 public schools. (p. 14)
DeYoung et al. conclude by declaring,
to the extent which Americans in rural locales continue to value a sense of place and a sense of the particular communities in such places, they need to resist the philosophy of ‘the middle school concept’ when professional educators begin to talk about ‘school improvement.’ Otherwise, they may improve their own school right out of existence. (p. 24)
The work of DeYoung et al. is extremely important in the comparison of the effectiveness of
K-8 schools and middle schools in meeting the needs of young adolescents and their
teachers.
The context of a given area is a key factor that should be considered in the
establishment of either a K-8 school or a middle school in a given locale. Paglin and Fager
(1997) suggest, “each community considers different factors when making grade span
decisions and that no one grade configuration is right for all” (p. 1). Look (2001) also

42
emphasizes the importance that location may play in a district’s decision to either choose K-8
schools or middle schools for educating middle grades students. Look suggested that “Some
residential communities turned towards K-8 schools as a means to create true neighborhood
schools” (p. 2). Look explains that “the local K-8 school allowed families to avoid sending
children across informal boundaries to the middle school, which serves a broader
geographical area” (p. 2).
David L. Hough (1995) writes extensively on the potential move away from the
middle school grade configuration. Hough questions those who support the middle school
model as the only option for organizing young adolescents within a school. Hough defends
his unwillingness to support one particular existing grade configuration (middle school or K-
8) for middle grades students over another, explaining,
While it is important to note that grade spans are less indicative of a school’s educational philosophy than its programs, policies, and practices, there is no national consensus on appropriate spans for the middle grades. (p. 8)
Instead, Hough proposes his “elemiddle school,” as the best grade configuration for middle
grades students. Hough explains the “elemiddle school” is
One that attends to the needs of young adolescents, aged 10 to 14, in any combination of grades 5 through 8, but is also part of an organizational structure that includes lower grades. (p. 7)
Hough’s “elemiddle school” actually precedes by nearly a decade the sudden rise in
popularity of the K-8 grade configuration that is now seen in many urban areas throughout
the nation. For the first time Hough, however, delineates the concept of grade configuration
as one of the most important factors to be considered when establishing the best school for
young adolescents and their teachers.
43
Hough (1995) goes on to explain the strengths he observes in the “elemiddle model,”
in comparison to middle and junior high schools. Hough contends that a move to an
“elemiddle school” grade configuration would “more easily facilitate the child-centered
programs conducive to young adolescent learning (p. 8). Hough realizes that for there to be
an acceptance of his “elemiddle school,” or a return to prior school grade configurations that
were more prevalent before the rise in popularity of the middle school model, many
educators would still have to be convinced of the value of such grade configuration models
for young adolescents. Hough concludes his argument on the “elemiddle school” by
suggesting,
But while it appears that elemiddle schools hold great promise as facilitators of reform efforts, the organizations of middle grades schools will probably remain a function of decision makers’ personal preferences, community needs, and economic necessity. (p. 9)
The Influence of Local and State Politics on Grade Configuration
Brown (1998) offers pertinent information from the North Carolina court case,
Leandro v. North Carolina that could continue to affect rural districts and their
decision whether or not to organize middle grades students into K-8 schools or
middle schools. Available funding might influence rural districts throughout the state
of North Carolina for years to come if funding provided to local education agencies
(LEA; or school districts) is not made more equitable for all LEAs throughout the
state. Brown writes:
The state of North Carolina provides the resources necessary to supply the state’s standard course of study to students in all school districts based upon the average daily membership (ADM). Furthermore, North Carolina’s local school districts do not have taxing authority. School districts must get the approval of their county commissioners to tax residents for support beyond that received from the state. (p. 45)
44
Hence, the amount of money allotted each year to LEAs by the state of North Carolina makes
up a significant portion of the budgets LEAs have to support their school systems on a yearly
basis. Odden and Picus (2000) estimate “65.1% of educational revenue for the state of North
Carolina in the 1994-95 school year came from state funds” (p. 7). On the other hand,
“24.6% of educational revenue for the state of North Carolina in the 1994-95 school year
came from local funds” (p. 7). Brown (1998) explains that disparities often appear between
districts that are totally dependent on state allocations each year and those districts that
supplement their state allotment for education with tax dollars. Brown explains,
In the low-wealth counties, most of the operating budgets come from state funds. There are few or no local supplements to increase teacher salaries, add new positions or purchase additional supplies. In medium-wealth districts, school boards may convince county commissioners to levy a local property tax to increase teachers’ salaries above the state salary schedule for teachers and administrators. However, in the high-wealth districts, county commissioners are more likely to approve a tax levy to support local supplements to raise teachers’ salaries above the state salary schedule. (p. 45)
Brown (1998) correlates the state court case, Leandro v. State of North Carolina, to
rural education, school finance, and educational equity in North Carolina public schools.
Brown emphasizes in his article that the key legal principle in the Leandro case is the
responsibility of the state to “provide every child with a ‘sound basic education’” (p. 45).
Brown goes on to explain that rural LEAs, often the low-wealth districts in the state, were
greatly affected by the High Court’s decision in the Leandro case; however, Brown points
out,
The Court agreed that each child in the state should be afforded a “sound basic education” but did not agree that the state constitution required the state to provide each district equal funding on a per-pupil basis. (p. 45)

45
Several arguments provided by the plaintiffs in the Leandro case highlight ways state
funding of public education can place rural school districts at a disadvantage when it comes
to providing equitable and high-quality educations for its students when compared to high-
wealth districts. Brown (1998) highlights two specific arguments that rural district plaintiffs
provided to the High Court of North Carolina which place rural school districts at a financial
disadvantage. First, Brown shares the fact that
Children in their districts are denied an equal education because there is greater disparity between the educational opportunities available to children in their districts and those offered in more wealthy districts of the state. (p. 46)
The second plaintiff argument that Brown (1998) highlights is “the state leaves the
funding of capital expenses as well as 25 percent of current school expenses to local
governments” (p. 46). Hence, disparities have developed between school districts throughout
the state of North Carolina because of the increased responsibility of local governments to
supplement minimal state funding for education. The financial inequity that exists in the
comparison of educational programs between low-wealth and high-wealth school districts
has often resulted in academic disparities between the students attending low-wealth and
high-wealth districts; likewise, the financial responsibility of LEAs within the state of North
Carolina to build their schools leaves the discretion with each individual school district to
determine what type of grade configuration best fits the needs of its students, and can be best
financially supported by its available capital improvements budget. The context of each
district, whether it be rural or urban, the socio-economic make-up of its student population,
and the diverse educational needs of its student body should be examined by each school
district in determining whether K-8 schools or middle schools are best suited for the school
district.
46
Local politics is another contextual factor that often influences a school district’s
choice of grade configuration for its middle grades students. The responsibility often falls to
local school districts to raise money to supplement state allocated funds for education in
many states. Stakeholders within the local political arena want the power to influence how
funds raised by local and state governments are allocated to be spent within their school
district. Gerstl-Pepin and Marshall (2005) explain local government’s delegated power to
make decisions such as the grade configuration of its schools when she writes, “state
legislatures generally retain authority but defer to localities to generate local funds and to
work out details of implementing policies and delivering services” (p. 125). Gerstl-Pepin
and Marshall continue their explanation of local government’s strong influence on local
school districts when they explain, “town and city councils and county commissions affect
school policies most when they determine tax rates, school sites, district boundaries, and
other similar issues” (p. 133). These decisions in turn can and often do influence a district’s
choice of grade configuration. In essence, a school district’s decision to choose one
particular grade configuration over another for middle grades students may be influenced as
much by the financial capabilities and politics of the county or community as it is by what is
best for the middle grades students themselves.
Look (2001) also discusses how a school district’s financial capabilities may
influence a school district’s decision to implement K-8 schools or middle schools for middle
grades students. Look explains “some districts find K-8 schools to be less expensive to
operate than simultaneously running elementary and middle schools” (p. 2). Look highlights
the influence of financial capability upon the decision-making processes within a school
district by sharing some specifics of the financial policies faced by the Philadelphia School

47
System when it chooses to implement K-8 schools or middle schools. Look notes that K-8
schools are classified as elementary schools, and thus “are funded at a lower level than the
middle grades of a middle school” (p. 4). As a result, K-8 schools in Philadelphia may not be
allocated positions such as assistant principals and resource officers that a middle school
would automatically receive. Hence, a school’s grade configuration in some school districts
may affect the financial capacity of a school. Likewise, a school district might choose one
grade configuration over another, in Philadelphia’s case, K-8 over middle schools, in part due
to the rationale of cheaper operating costs for K-8 schools as compared to middle schools at
the academic expense of what is truly best for its students.
Academic Achievement of Middle Grades Students in K-8 Schools Versus Middle Schools
A popular reason proponents of K-8 schools provide in support of young adolescent
placement in K-8 schools is the belief that K-8 schools provide learning environments that
allow for greater academic achievement. Many educators (Abella, 2005; Anfara & Buehler,
2005; Balfanz, Spiridakis, & Nield, 2002; Connolly et al., 2002; Erb, 2005; George, 2005;
Herman, 2004; Hough, 1995; Look, 2001; Mizell, 2005; McEwin & Alexander, 1990;
McEwin, Dickinson, & Jacobson, 2005) have conducted extensive research projects to
determine if there is validity to the statement that young adolescents, primarily between the
ages of 10 and 14, perform better academically within a K-8 learning environment than a
middle school environment. Educational researchers have measured the academic
achievement of students attending K-8 versus middle schools by comparing such indicators
as test scores, GPAs, promotion rates, and dropout rates. However, Paglin and Fager (1997)
point out, through a reference to Wihry, Coladarci, and Meadow (1992) that comprehensive
research is lacking that
48
…attempts the more difficult task of determining if a cause-and-effect relationship exists between grade configuration and academic achievement, while controlling for other factors such as school size, student socioeconomic status, and teacher experience. (p. 6)
Other researchers have analyzed middle grades students’ academic achievement
through longitudinal studies by looking at students’ academic performance at K-8 schools
and middle schools until the completion of their 9th grade year in high school (Offenberg,
2001; Simmons & Blyth, 1987). Simmons and Blyth (1987) conducted a longitudinal study
from 1974-1979 that included a “stratified random sample” of schools from Milwaukee’s K-
8, K-6, and 7-9 (junior high) schools (p. 25). Even though this study did not include schools
that are defined by today’s standards as middle schools, this study did focus upon grade
configuration’s impact on young adolescent and middle grades students’ academic
achievement. Simmons and Blyth stratified the sample into three groups of schools based on
the percentage of minority students in the school. These groups were defined as having 0-
20%, 21-42%, or 43-100% minority representation. As a result of stratification, the sample
included 18 total schools: six K-8 schools, eight comparable K-6 schools, and four
predominantly black K-6 schools, out of 120 elementary schools and 22 junior high schools
in Milwaukee Public Schools. A synopsis of the goals of this study by Simmons and Blyth
(1987) follows:
It begins with a focus on the problematic transitional year at entry to adolescence. It first follows children from Grade 6 (the “last year of childhood”) into Grade 7 (early adolescence), and then extensively remeasures them in Grade 9 and 10 (middle adolescence), thus covering a 5-year period. The short- as well as the long-term consequences of the transition into early adolescence, therefore, can be studied, including the transition into senior high school. (p. 8)
From a population of every sixth grade student in the district, an 85% response rate
with parental consent was obtained from K-8 and K-6 students. A closer look at the sample

49
demographics revealed that “There were 924 students in the total sample in Grade 6, 703 of
whom were from K-8 and comparable K-6 schools. Of these, 621 (88%) were white” (p. 26).
Students agreed to be interviewed once in the fall or spring of sixth and seventh grade so that
the short-term effects of grade configuration could be measured. Along with data obtained
from student interviews, student academic achievement was measured with data obtained
from students’ records at their schools. The types of accessible, achievement data used for
analysis included student GPA and scores on end-of-the year achievement tests in reading
and math. Simmons and Blyth (1987) conducted Multivariate Analyses of Variance
(MANOVAs) and One-way ANOVAs, “with gender as the independent variable” (p. 54).
Simmons and Blyth rationalize their choice of the MANOVA statistical method because it
“is a suitable analysis to summarize the existence of effects across sets of dependent
variables in any one year” (p. 54). Simmons and Blyth also conducted a Repeated Measures
Design because it “can summarize the effects for one variable across years” (p. 54).
Short-term and long-term consequences affecting student academic achievement as a
result of attendance at K-8 schools versus K-6 schools and then 7-9 schools (junior high
school) were measured in this study. Short-term consequences were considered by Simmons
and Blyth (1987) to have occurred in Phase I of this study, during students’ sixth and seventh
grade years. Simmons and Blyth recorded that “in seventh grade, the junior high students,
both boys and girls, earn less high GPAs,” after there were “no significant differences in
GPAs the year before,” when these students first entered the study in sixth grade (p. 246).
Simmons and Blyth (1987) also found long-term consequences that affected student
achievement as a result of students attending a K-8 school, rather than a K-6 school followed
by a 7-9 school in their study. Long-term consequences which measured student academic
50
achievement in ninth and tenth grades, following attendance at a K-8 school, or a K-6 and
then a 7-9 school, revealed a “general decrease in GPA as one goes up in grade level” (p.
248). Furthermore, “each school transition appears to be associated with a steeper decline”
(p. 248). Simmons and Blyth point out “that for boys the two cohorts are earning about the
same GPA in Grade 9; whereas for Grade 9 girls, the K-8 cohort is doing considerably
worse” (p. 248). Simmons and Blyth conclude their discussion of longitudinal academic
achievement by explaining “In Grade 10, it is the K-6/JH/SH cohort, who have just entered
senior high school, who are showing a steeper decline in GPA” (p. 248). Therefore,
“findings are mixed” on academic achievement data according to Simmons and Blyth in their
study comparing student academic achievement in K-8 schools as compared to students
attending K-6 schools before a transition to 7-9 junior high schools (p. 252).
The longitudinal nature of this study by Simmons and Blyth (1987) is one strength in
this study. This factor allowed for student academic data to be compared during two
different stages at two separate times during the study’s five year span. An additional
strength of this study was the ability of Simmons and Blyth to create a stratified random
sample of schools and students within these schools to be included in the final sample for the
study. This sample allowed for the generalizability of findings from this study to the entire
Milwaukee Public School System. Another strength of this study was that Simmons and
Blyth analyzed achievement data along gender lines.
Even though the work of Simmons and Blyth (1987) was a step in the right direction
for research analyzing the effects of grade configuration for young adolescents and middle
grades students, the generalizability of the study remains significantly limited today, since
most junior high schools have since been replaced by various middle school grade
51
configurations. The grade levels within junior high schools are most likely not comparable
to the grade levels found within today’s middle school grade configurations. Furthermore,
this study took place nearly 30 years ago; hence, its research findings could be deemed
outdated by many educational researchers.
There has been at least one additional longitudinal study conducted along the same
premises of Simmons and Blyth (1987) that has received notoriety for its comprehensiveness
and its findings when analyzing academic achievement of middle grades students in different
grade configurations. Offenberg (2001) examined the success of young adolescents who
attended public K-8 schools as opposed to public middle schools in Philadelphia. The
objective of Offenberg’s study was to determine the effects of young adolescents’ attendance
in public K-8 schools as opposed to middle schools on eighth and ninth grade academic
achievement. From 1996 until 1999, Offenberg collected student achievement data from “37
to 42 middle schools and 40 to 43 K-8 schools” (p. 25). Prior to the beginning of this
research study and its corresponding data collection, Offenberg made the assumption that
It was apparent that children in the eighth grade of K-to-8 schools in Philadelphia, on average, had better academic achievement than eighth grade children in middle grades schools. For example, students in K-to-8 schools appeared to perform better than students in middle grades schools on standardized measures such as the Stanford Achievement Test (SAT-9). (p. 25)
Offenberg (2001) used regression models throughout his study “that control for the
differences in the socioeconomic status of schools in Philadelphia and then to find
statistically reliable variations, if any, in the performance of K-to-8 schools and middle
grades schools” (p. 25). In this study “the socioeconomic variable that was controlled for
was the Title 1 Eligibility Poverty Index, which is based on the percentage of students who
receive public assistance and are eligible for reduced price lunch” (p. 25). Ethnic
52
background was also controlled for in this study at some schools; however, “the addition of
the ethnic background variable never changed the significance or magnitude of the effect of
the type of school to a meaningful degree” (p. 25). In the end, Offenberg concluded that “all
the analyses lead to the conclusion that the better SAT-9 scores of K-to-8 schools were not
merely artifacts of the social class of the student bodies they served” (p. 25).
Offenberg (2001) converted this study of young adolescent academic achievement in
Philadelphia’s K-8 and middle schools into a longitudinal study as well by following K-8 and
middle school alumni into their prospective high schools. Once these students entered high
school, he collected data that would reflect their academic achievement at the conclusion of
their ninth grade, or freshman years, to determine if there might have been a significant effect
on the ninth grade academic achievement in relation to whether they attended a K-8 or
middle school the previous three years. From Offenberg’s longitudinal study he found:
With the unique character of the high schools and the poverty levels of middle grade schools controlled, the analyses showed that the K-to-8 alumni’s GPA was about one tenth of a letter grade higher than the middle grades school alumni’s GPA, a statistically significant difference (p<.02). (p. 27)
Hence, Offenberg concluded, “ninth grade GPAs, credits earned, and standardized reading,
math, and science scores all tended in the direction favoring K-to-8 alumni” (p. 26).
Connolly, et al. (2002) completed a study within Baltimore City Public Schools from
2000-02 that compared the success of K-8 schools to K-5 elementary schools feeding into 6-
8 middle schools. One of the research questions guiding this study by Connolly et al.
focused on student academic achievement that “allowed for post hoc comparisons of students
in two types of grade-configured schools” (p. 30). The research question that focused on
student academic achievement in BCPSS K-8 schools as compared to K-5 and 6-8 schools
53
would analyze “student achievement as measured by the TerraNova (i.e., composite scores)
and the Maryland Functional Testing Program” (p. 30). Connolly et al. explained how these
two components of student achievement would be compared, stating,
Using guidelines established by CTB/McGraw Hill (1997), an average score was calculated. On the Maryland Functional Testing Program, pass rates were calculated on the mathematics, writing, and reading tests. (p. 30)
Connolly, et al. (2002) used a mixed-methods design throughout this study. The
source of data for the component of this study that focused on student academic achievement
came from BCPSS’ current student information system. Connolly et al. explain that:
A longitudinal cohort design was used to follow a single group of students through BCPSS’ schools. The cohort was designed to include students who should have entered ninth grade during 2001-02. In addition, students who were enrolled in BCPSS in the first grade during 1993-94 were included… (p. 30)
According to Connolly et al., the cohort was divided into two subgroups for comparison. One
group contained students who attended a K-5 elementary and then a middle school. The
second group contained students who attended one K-8 school. In addition, “the cohort was
composed of only those students who remained consistently in the designated grade-
configured school” (p. 30). Connolly et al. identified control variables so groups could be
compared since students were not equal when first enrolled in their respective grade
configurations. Gender, race/ethnicity, and free/reduced lunch were identified as the control
variables for this study. Data was sorted using “descriptive and multivariate statistical
procedures, including analysis of covariance (MANCOVA), ordinary least squares and logit
models” to analyze student achievement data “using the Statistical Package for the Social
Sciences (SPSS) (1999) (p. 30). Connolly et al. applied a “conservative sampling approach
54
(i.e. examining data on students enrolled in BCPSS for nine years meeting specified criteria)”
(p. 30).
The findings by Connolly, et al. (2002) from this study lean in favor of higher student
achievement from attendance at K-8 schools as opposed to separate K-5 (elementary) schools
followed by 6-8 middle schools in BCPSS. Connolly et al. summarize their findings
explaining that
Results from MANCOVA and Ordinary Least Squares analyses indicate that students in K-8 schools had significantly higher TerraNova reading, language arts, and mathematics scores than students from K-5, 6-8 schools, after controlling for identified variables such as baseline student achievement. (p. 33-34)
It was also concluded from the data “that K-8 students were more likely to pass the Maryland
Functional Testing Program” (p. 34). In fact, Connolly et al. noted that “the difference in
mathematics was statistically significant” (p. 34).
Connolly, et al. (2002) also administered a survey to principals and teachers within
the study they conducted in the BCPSS in the spring and summer of 2001 to gather data on
“parental and principal perceptions” of K-8 schools as opposed to K-5 and 6-8 schools (p.
30). A sample of 168 principals yielded a 93.9 percent response rate whereas a sample of
775 parents yielded a 27.3 percent response rate. Connolly et al. analyzed the results “by
grade configuration to allow comparisons of perceptual data on schooling experiences” (p.
30).
Herman (2004) also provides evidence that supports the ability of K-8 schools to
increase the academic achievement of young adolescents in comparison to separate middle
schools for young adolescents. Significant results were found in Cleveland where sixth
graders in K-8 schools exhibited better attendance patterns and scored higher on standardized
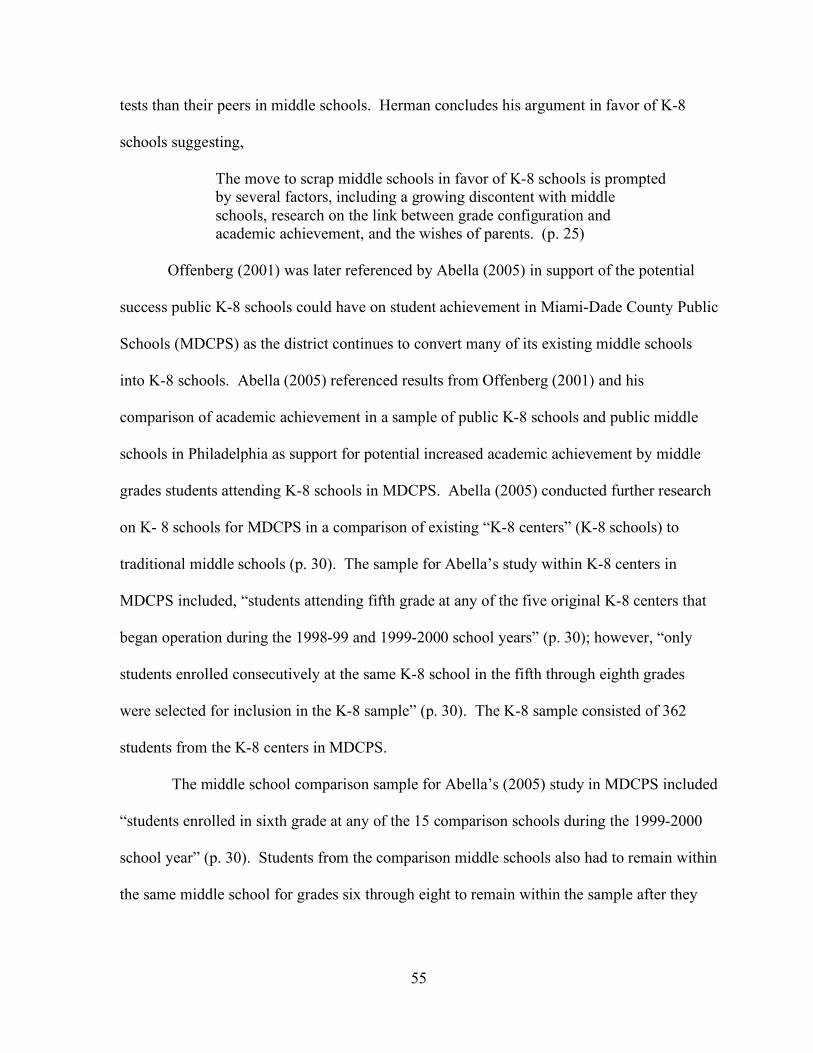
55
tests than their peers in middle schools. Herman concludes his argument in favor of K-8
schools suggesting,
The move to scrap middle schools in favor of K-8 schools is prompted by several factors, including a growing discontent with middle schools, research on the link between grade configuration and academic achievement, and the wishes of parents. (p. 25)
Offenberg (2001) was later referenced by Abella (2005) in support of the potential
success public K-8 schools could have on student achievement in Miami-Dade County Public
Schools (MDCPS) as the district continues to convert many of its existing middle schools
into K-8 schools. Abella (2005) referenced results from Offenberg (2001) and his
comparison of academic achievement in a sample of public K-8 schools and public middle
schools in Philadelphia as support for potential increased academic achievement by middle
grades students attending K-8 schools in MDCPS. Abella (2005) conducted further research
on K- 8 schools for MDCPS in a comparison of existing “K-8 centers” (K-8 schools) to
traditional middle schools (p. 30). The sample for Abella’s study within K-8 centers in
MDCPS included, “students attending fifth grade at any of the five original K-8 centers that
began operation during the 1998-99 and 1999-2000 school years” (p. 30); however, “only
students enrolled consecutively at the same K-8 school in the fifth through eighth grades
were selected for inclusion in the K-8 sample” (p. 30). The K-8 sample consisted of 362
students from the K-8 centers in MDCPS.
The middle school comparison sample for Abella’s (2005) study in MDCPS included
“students enrolled in sixth grade at any of the 15 comparison schools during the 1999-2000
school year” (p. 30). Students from the comparison middle schools also had to remain within
the same middle school for grades six through eight to remain within the sample after they
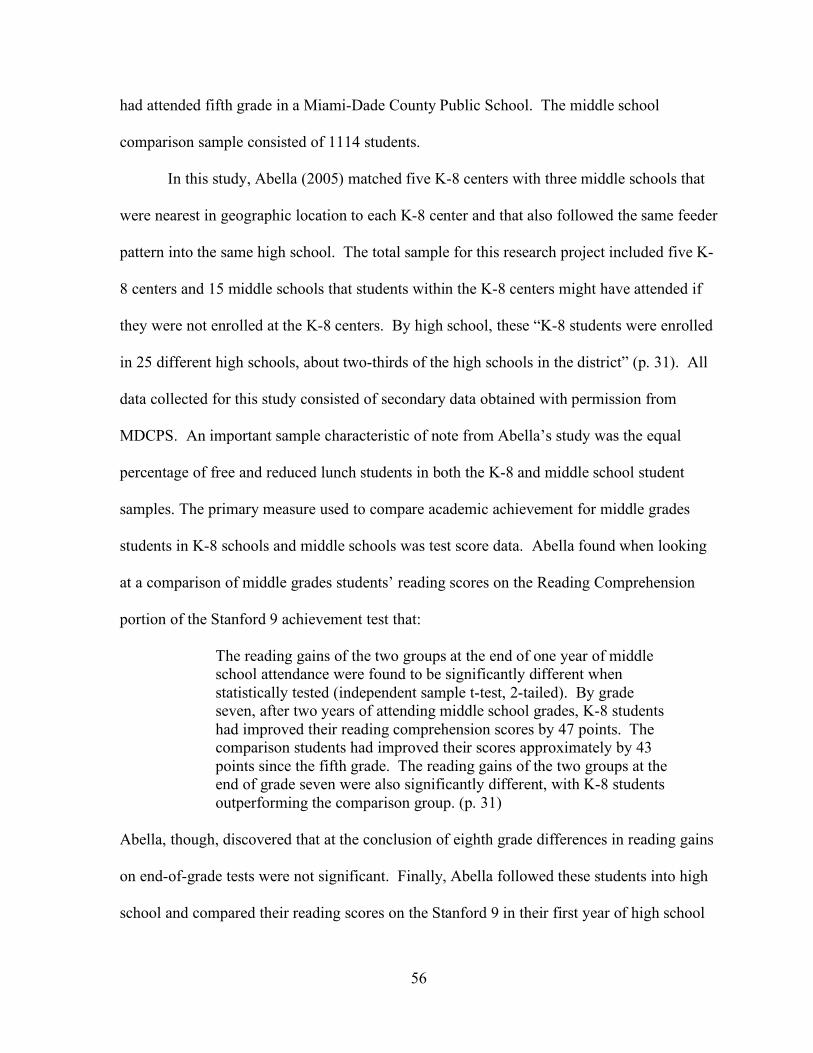
56
had attended fifth grade in a Miami-Dade County Public School. The middle school
comparison sample consisted of 1114 students.
In this study, Abella (2005) matched five K-8 centers with three middle schools that
were nearest in geographic location to each K-8 center and that also followed the same feeder
pattern into the same high school. The total sample for this research project included five K-
8 centers and 15 middle schools that students within the K-8 centers might have attended if
they were not enrolled at the K-8 centers. By high school, these “K-8 students were enrolled
in 25 different high schools, about two-thirds of the high schools in the district” (p. 31). All
data collected for this study consisted of secondary data obtained with permission from
MDCPS. An important sample characteristic of note from Abella’s study was the equal
percentage of free and reduced lunch students in both the K-8 and middle school student
samples. The primary measure used to compare academic achievement for middle grades
students in K-8 schools and middle schools was test score data. Abella found when looking
at a comparison of middle grades students’ reading scores on the Reading Comprehension
portion of the Stanford 9 achievement test that:
The reading gains of the two groups at the end of one year of middle school attendance were found to be significantly different when statistically tested (independent sample t-test, 2-tailed). By grade seven, after two years of attending middle school grades, K-8 students had improved their reading comprehension scores by 47 points. The comparison students had improved their scores approximately by 43 points since the fifth grade. The reading gains of the two groups at the end of grade seven were also significantly different, with K-8 students outperforming the comparison group. (p. 31)
Abella, though, discovered that at the conclusion of eighth grade differences in reading gains
on end-of-grade tests were not significant. Finally, Abella followed these students into high
school and compared their reading scores on the Stanford 9 in their first year of high school

57
in the ninth grade. At the end of ninth grade, Abella found no difference in reading scores, as
had been the case with students at the beginning of sixth grade. These findings bring into
question whether or not the K-8 school model actually leads to greater academic success in
reading as opposed to middle school attendance when following middle grades students
longitudinally into high school.
Abella (2005) also looked at middle grades students’ scores on the math portion of
the Stanford 9 achievement test in his comparison of academic achievement for students
attending K-8 schools as opposed to middle schools in MDCPS. When looking at the math
scores, Abella found:
K-8 and comparison students began in the sixth grade with identical mean scale scores in the Stanford 9 mathematics component of the test. By the time they reached ninth grade, K-8 students and comparison students produced similar mean scale scores. However, it was also observed that K-8 students significantly outperformed comparison students in math throughout three years of middle school. (p. 32)
Even though “the difference in math performance between the two groups was no longer
statistically significant by senior high school,” as was the case with the reading scores from
the Stanford 9 test, Abella argues his study uncovers the potential for increased academic
achievement for middle grades students by their attendance in K-8 schools as opposed to
middle schools. Abella provides support for his argument in favor of K-8 schools over
middle schools by highlighting the success of middle grade students in their first year of
attendance at five new K-8 schools in MDCPS when he shares,
After one year of exposure to the K-8 school model, results showed K-8 students academically outperforming comparable students attending traditional middle schools. (p. 30)

58
George (2005) provides additional support for middle grades student achievement in
K-8 schools as compared to middle schools. George contends that, “high poverty middle
schools are reported to be less effective, in terms of test scores, than K-8 programs in the
same district” (p. 6). George references the work of Balfanz, Spiridakis and Nield (2002), in
which they compared the academic achievement of K-8 students and middle school students
in the public schools of Philadelphia. Balfanz, et al., according to George, “concluded that
the typical high poverty K-8 school outperformed the typical high poverty middle school” (p.
6-7). George goes on to suggest that “increasing test scores seems to be the grail that
educators seek when K-8 schools are established” (p.7).
George (2005), however, later retreats from his total support of the K-8 grade
configuration for middle grades students. In the process, George brings to light other factors
that may affect the ability of K-8 schools to meet the academic needs of young adolescents.
George explains:
The influence of factors such as school size, location in urban or suburban settings, poverty levels, ethnic diversity, and teacher quality are not yet clearly understood in the K-8 setting. Desired outcomes may have little to do with reconfiguring, and much to do with the fundamental socioeconomic circumstances of the school. (p. 9)
Mizell (2005) also discusses the success of middle grades students academically
within K-8 schools as opposed to middle schools. Mizell shares:
In New Orleans, eighth graders in the school system’s five K-8 schools (none of them magnets) were twice as likely to pass the state test compared to students at the district’s failing middle schools. (p. 17)
However, Mizell also points out that K-8 schools are not an all-encompassing solution to
meeting students’ academic needs. Mizell suggests that research is still limited on “whether
K-8 students will also be the beneficiaries of an appropriate and rigorous curriculum” (p. 18).
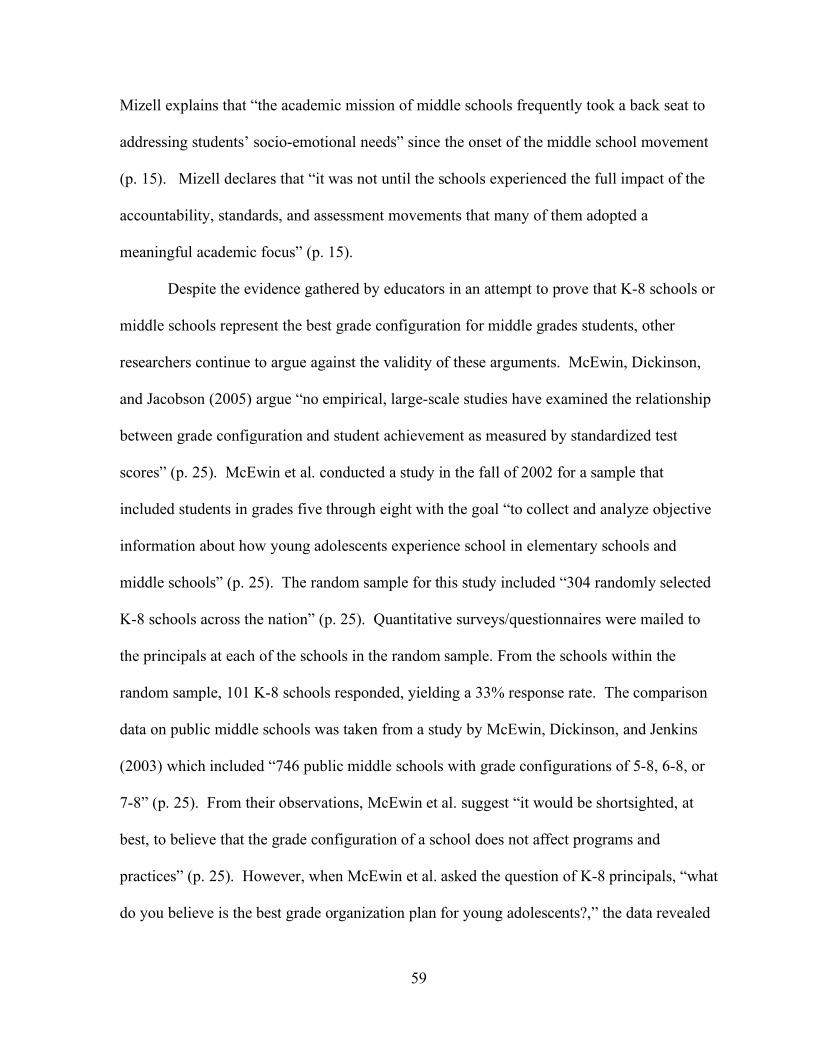
59
Mizell explains that “the academic mission of middle schools frequently took a back seat to
addressing students’ socio-emotional needs” since the onset of the middle school movement
(p. 15). Mizell declares that “it was not until the schools experienced the full impact of the
accountability, standards, and assessment movements that many of them adopted a
meaningful academic focus” (p. 15).
Despite the evidence gathered by educators in an attempt to prove that K-8 schools or
middle schools represent the best grade configuration for middle grades students, other
researchers continue to argue against the validity of these arguments. McEwin, Dickinson,
and Jacobson (2005) argue “no empirical, large-scale studies have examined the relationship
between grade configuration and student achievement as measured by standardized test
scores” (p. 25). McEwin et al. conducted a study in the fall of 2002 for a sample that
included students in grades five through eight with the goal “to collect and analyze objective
information about how young adolescents experience school in elementary schools and
middle schools” (p. 25). The random sample for this study included “304 randomly selected
K-8 schools across the nation” (p. 25). Quantitative surveys/questionnaires were mailed to
the principals at each of the schools in the random sample. From the schools within the
random sample, 101 K-8 schools responded, yielding a 33% response rate. The comparison
data on public middle schools was taken from a study by McEwin, Dickinson, and Jenkins
(2003) which included “746 public middle schools with grade configurations of 5-8, 6-8, or
7-8” (p. 25). From their observations, McEwin et al. suggest “it would be shortsighted, at
best, to believe that the grade configuration of a school does not affect programs and
practices” (p. 25). However, when McEwin et al. asked the question of K-8 principals, “what
do you believe is the best grade organization plan for young adolescents?,” the data revealed
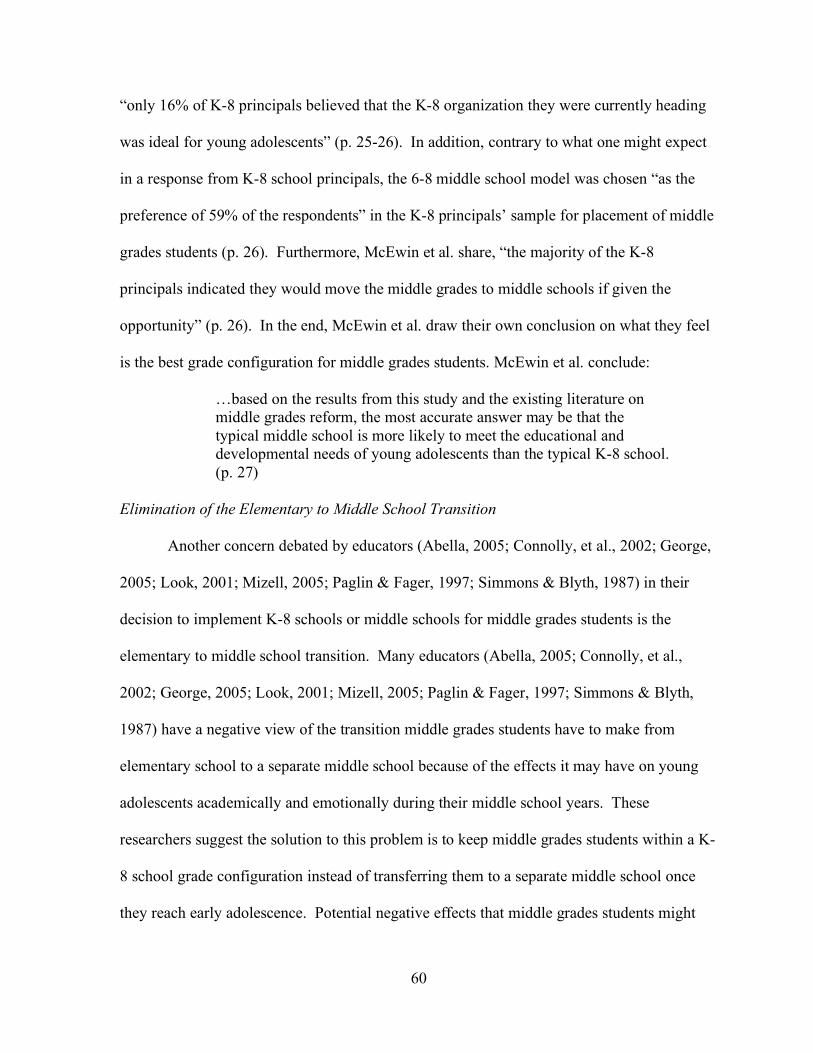
60
“only 16% of K-8 principals believed that the K-8 organization they were currently heading
was ideal for young adolescents” (p. 25-26). In addition, contrary to what one might expect
in a response from K-8 school principals, the 6-8 middle school model was chosen “as the
preference of 59% of the respondents” in the K-8 principals’ sample for placement of middle
grades students (p. 26). Furthermore, McEwin et al. share, “the majority of the K-8
principals indicated they would move the middle grades to middle schools if given the
opportunity” (p. 26). In the end, McEwin et al. draw their own conclusion on what they feel
is the best grade configuration for middle grades students. McEwin et al. conclude:
…based on the results from this study and the existing literature on middle grades reform, the most accurate answer may be that the typical middle school is more likely to meet the educational and developmental needs of young adolescents than the typical K-8 school. (p. 27)
Elimination of the Elementary to Middle School Transition
Another concern debated by educators (Abella, 2005; Connolly, et al., 2002; George,
2005; Look, 2001; Mizell, 2005; Paglin & Fager, 1997; Simmons & Blyth, 1987) in their
decision to implement K-8 schools or middle schools for middle grades students is the
elementary to middle school transition. Many educators (Abella, 2005; Connolly, et al.,
2002; George, 2005; Look, 2001; Mizell, 2005; Paglin & Fager, 1997; Simmons & Blyth,
1987) have a negative view of the transition middle grades students have to make from
elementary school to a separate middle school because of the effects it may have on young
adolescents academically and emotionally during their middle school years. These
researchers suggest the solution to this problem is to keep middle grades students within a K-
8 school grade configuration instead of transferring them to a separate middle school once
they reach early adolescence. Potential negative effects that middle grades students might
61
encounter as a result of the transition from an elementary to separate middle school setting
include: decline in academic achievement as measured by end-of-grade test scores and GPA,
decreased participation in extracurricular activities, exposure to the evils of adolescence such
as alcohol, drugs, and sexual activities at a younger age, and the increased size, diversity, and
anonymity of their schools (Abella, 2005; George, 2005; Mizell, 2005; Simmons & Blyth,
1987). Retaining middle grades students within a K-8 school might eliminate some, if not
all, of the negative factors young adolescents might encounter if they had to make the
transition and attend a separate middle school after five or six years in their elementary
school setting.
Simmons and Blyth (1987) completed a study of young adolescents within
Milwaukee Public Schools (MPS) in the 1980s in which one of the research objectives was to
compare student success in school based on the number of transitions students had to make
from one school to another during their K-12 school years. The sample for this study
included males and females in grades six through ten that were attending or had attended K-6
(elementary), 7-9 (junior high), or 10-12 (high school) in MPS. Simmons and Blyth
discovered that students who attended K-8 schools and did not have to make the transition to
junior high after their K-6 years seemed to experience greater success academically and
socially. Simmons and Blyth explained these differences in middle grades experiences by
first stating that “the very nature of the school environment and the general atmosphere of the
school was dramatically different in these junior high schools from either of the elementary
types of schools” (p. 30). Simmons and Blyth partially attributed the negative aspects faced
by students when making the transition from elementary schools to junior high schools to the
“size and diversity” found within larger, more diverse junior high schools (p. 31). Simmons
62
and Blyth explain in greater detail the contrasting experiences middle grades students
encounter as a result of a transition to junior high schools instead of remaining in K-8 schools
by stating:
This change in size and diversity had the effect of making it very difficult for a student to become acquainted with the other students even in their own grade level. This is in direct contrast to the seventh graders in the K-8 schools who could be expected to be acquainted with most, if not all, of the seventh and eighth graders in the building. (p. 31)
Simmons and Blyth (1987) also look at the relationship between “school type and
school transition upon attitudes toward school and upon self-image” (p. 226). From this
study, Simmons and Blyth concluded “that the transition from a smaller elementary school to
a larger impersonal junior high school has a negative impact on the early adolescent child”
(p. 226). Hence, school size could be considered as a potential factor contributing to student
success in various grade configurations for middle grades students. Another observation is
that “feelings of anonymity increase for a short while every time there is a switch of schools”
(p. 226-27). Likewise, when looking at the effects of this transition on middle grades
students’ extracurricular participation Simmons and Blyth discovered that “a transition into a
new school almost always results in a decreased level of participation” (p. 238). In fact,
Simmons and Blyth suggest “the early adolescent transition has persistent long-term
consequences” (p. 238). Simmons and Blyth include young adolescents’ decreased
participation in extracurricular activities as they proceed through school as one of these long-
term consequences and attribute this decrease to the transition from elementary to junior high
school instead of following the continuous K-8 path to high school.
Finally, Simmons and Blyth (1987) counterattack those that argue that a middle
school transition (in this study the junior high school transition) will make the eventual
63
transition to high school easier for those students that have experienced previous school
transitions. Simmons and Blyth note that young adolescent girls that experienced both
transitions actually “respond more, not less, negatively to the transition into senior high
school than does the cohort who has to make only one change at a more mature age” (p. 227).
This landmark study by Simmons and Blyth (1987) was one of the first studies to
comprehensively look at the varying effects of grade configurations on middle grades
students. However, one must be careful in generalizing from this study to the present day K-
8 school versus middle school argument due to the fact this study compared K-8 schools to
junior high schools, not middle schools as they are defined today. The Simmons and Blyth
study also has limitations because over twenty years have passed since this study was
conducted. However, references to this study are numerous (Connolly, et al., 2002;
Offenberg, 2001) when educators debate the best grade configurations for middle grades
students.
Paglin and Fager (1997) also consider the transition from elementary to a separate
middle school as a potential drawback of young adolescents attending separate middle
schools as opposed to K-8 schools. Paglin and Fager describe school transitions as
potentially “stressful” times (p. 8).
George (2005) also writes in support of middle grades students attending K-8 schools
instead of middle schools in order to avoid this extra transition. George writes:
A restructuring of middle level education that would close 6-8 schools and replace them with K-8 schools might produce additional benefits for young adolescents. Perhaps the most likely of these positive outcomes would be that K-8 schools would require one less school transition (eliminating the transition out of fifth into sixth grade)…Students who remained in small elementary schools from fifth to sixth grades and beyond, would not face the consequences of
64
transitions until they were older and presumably more capable of handling the more impersonal high school climate. (p. 7)
Mizell (2005) also recognizes the transition from elementary to middle school as a
factor to be considered when determining the best grade configuration for middle grades
students. Mizell explains,
Converting a school system to a K-8, 9-12 configuration also eliminates the transition from fifth to sixth grade that occurs when there are 6-8 middle schools. As every parent knows, whenever a young person transitions from one level of schooling to another, whether from fifth to sixth grade, eighth to ninth grade, or twelfth grade to post-secondary education, there is potential for difficulty. (p. 18)
Mizell’s recognition of other transition difficulties for students at other ages during their K-
12 years could have opened a window of opportunity for middle school advocates to propose
that the true problem is transitions in general, not just the elementary to middle school
transition. However, Mizell quickly closes that window when he discusses in greater detail
what he believes are the negatives in the transition from elementary to middle school:
These transitions require developing new relationships with adults and peers, negotiating unfamiliar and unwritten social norms, and responding to expectations of higher academic performance. Particularly for young adolescents, who are also experiencing a variety of developmental stresses, and perhaps academic ones as well, the transition from elementary to middle school can be problematic. (p. 18)
Abella (2005) analyzes the effects of school transitions on student success from a
different perspective. Abella debates the argument that K-8 students might in fact be
hindered by not having to experience the elementary to middle school transition when it
comes time for K-8 students to make the transition into high school. Abella elaborates on his
feelings concerning this argument by explaining:
65
One could expect traditional middle school students to make the transition from middle to senior high school with greater ease than K-8 students, which, in turn, would be reflected in their school performance. The results indicate that this may not be the case. The school performance of K-8 students does not seem to be disproportionately affected when making the transition from middle to senior high school. On the other hand, the transition from elementary to middle school does appear to have negative consequences for students attending traditional middle schools. K-8 students seem to benefit from not having to make this transition. (p. 35)
Discipline
Another characteristic of K-8 schools that its proponents emphasize is the fact that
young adolescents’ behavior appears to improve in a K-8 environment as opposed to the
middle school environment. In a study within the Baltimore Public Schools (BPS) as its
school system began the conversion to K-8 schools throughout the 1990s, Connolly, et al.
(2002) surveyed principals to gather data on student behavior in K-8 schools. Principals
informed Connolly et al. that “their students show a higher level of courtesy and respect to
their peers, teachers, and school administrators than any other school configurations” (p. 32).
Related to the findings noting higher levels of student respect in K-8 schools in the BPS
study is the appearance in recent years of a wave of character education programs which
have been implemented in our nation’s schools over the last decade as an attempt to instill
morals and values upon students in hopes of improved behavior in the long run. Many
school districts have concluded that increasing student respect for adults and peers within a
school is where discipline and behavior improvement begins.
Mizell (2005) also supports K-8 school enrollment for young adolescents over
separate middle schools in an attempt to decrease young adolescent discipline problems.
Mizell points out:
66
Some large urban school systems are turning away from 6-8 middle schools, citing pervasive problems of low academic performance and high rates of disciplinary actions. (p. 19)
Mizell also cites the work of Nussbaum (2004) and Sparks (2004) when arguing in favor of
converting middle schools to K-8 schools in an attempt to alleviate young adolescent
discipline problems. Mizell feels many school districts are choosing to revisit the K-8 grade
configuration (and in some cases convert middle schools to K-8 schools) because the current
notion is that K-8 schools better address factors such as “student control, discipline, and
safety” than middle schools (p. 17).
George (2005) emphasizes there are potential benefits for young adolescents’
behavior when attending K-8 schools instead of middle schools because of characteristics
found in many K-8 schools. George stereotypes K-8 schools as “smaller” and “less
crowded,” with “greater parental involvement” (p. 7). George also points out young
adolescents are given the opportunity to “stay younger longer” if assigned to a K-8 school for
their young adolescent years as opposed to a middle school (p. 8). George goes on to
elaborate on this point by stating,
For three additional years, instead of leaving younger children behind and moving to a place with age mates, some of whom might smoke, use drugs, engage in sexual activity, even drive cars, young adolescents could stay younger by remaining in school buildings among six- to eleven-year olds. (p. 8)
Abella (2005) looked at attendance, another factor related to student performance and
student discipline during his research on the conversion to K-8 schools in the Miami-Dade
County Public Schools (MSCPS). Abella noted, “K-8 students had better attendance and
fewer out-of-school suspensions” (p. 30). He also confirmed, “…the absentee rates across a
four-year period shows that K-8 students were less likely than comparison students to

67
increase their level of absenteeism” (p. 33). Abella’s recognition of attendance as an
important factor that might contribute to disciplinary issues is important. Oftentimes, the
students that miss the most days of school are the students that get in the most trouble. Some
students may have missed school because they were suspended in the first place. Abella did
find through his research in MDCPS that “the suspension rates of K-8 students increased at a
significantly slower rate than that of comparison students in sixth and seventh grades” (p.
34). Even with Abella’s findings on the potential relationships between absenteeism,
behavior problems, and the grade configuration of the schools young adolescents’ attended,
more research needs to be conducted to determine the extent of the correlation between
young adolescents’ absenteeism to the amount of discipline problems they are involved in at
their K-8 or middle school.
Finally, some educators believe young adolescents attending the same K-8 school as
their younger siblings, and even younger children unrelated to them, seem to be more prone
to act as role models and display model behaviors that they might not otherwise perform
within a larger, middle school setting. Within a K-8 school setting, older students are more
likely to watch their language and act as protectors of younger children. Younger children
may also look up to middle grades students as their elders when they are attending K-8
schools instead of middle schools.
Increased Parent/Community Involvement
There is growing support for young adolescents attending K-8 schools as opposed
to separate middle schools due to the potential for increased parental and community
involvement for parents of young adolescents within the K-8 school learning community
(Anfara, 2005; George, 2005; Mizell, 2005; Offenberg, 2001). Offenberg (2001) notes:

68
Middle grades parents are less likely to be on campus than are K-8 parents because middle grades schools tend to be outside their immediate neighborhoods, and because their children attend them for only a few years. (p. 29)
Anfara (2005) also recognizes the potential for higher parental involvement when
young adolescents attend K-8 schools instead of middle schools. Anfara explains:
The K-8 configuration may also lead to sustained parent involvement in their children’s schooling. We know that while many families are quite involved in their children’s elementary schools, their participation declines dramatically when their children enter middle school. (p. 55)
George (2005) sees the possibility for increased parental involvement through the use
of K-8 schools as an opportunity to establish what he denotes as “neighborhood schools” (p.
8). George suggests, “smaller, nearby neighborhood schools would likely encourage parents
to stay involved in the school lives of their children” (p. 8).
McEwin, et al. (2005) also note parental desires for “neighborhood schools” as a
reason for the sudden rise in the popularity of middle grades students attending K- 8 schools
instead of middle schools (p. 25). McEwin et al. confirm that more districts are switching
over to the K-8 model in response to parental requests to keep their children in neighborhood
schools.
Mizell (2005) recognizes multiple benefits pertaining to increased parental
involvement when placing middle grades students in a K-8 grade configuration model.
Mizell shares:
One potential effect of a K-8 grade configuration is that parents’ involvement in their children’s school during the primary years may carry over as their children progress through the upper levels of the K-8 school. Another possible benefit is that parents may feel the K-8 school provides an institutional focus they share with their children for nine years, thereby providing a framework of common interests that parents can use to sustain positive relationships with their children throughout early adolescence. (p. 19)

69
The atmosphere that results from increased parental involvement and from young
adolescents potentially remaining at the same K-8 school for nine years results in what some
refer to as a “family-like” atmosphere developing in some K-8 schools. A qualitative
interview between author Rebecca Kesner (2000) and Michelle Arbour, the 1999
Distinguished Principal of the Year for the state of Vermont, provides evidence of one K-8
school with a “family-like” atmosphere. Kesner shares Arbour’s description of her K-8
school:
I want the kids to interact with one another and to know that we’re all family, that we take care of one another. So we try to do a lot of activities together, and that creates a real family atmosphere. (p. 43)
It is this type of “family-like” atmosphere that many supporters of K-8 schools provide as
one of the influential reasons for wanting young adolescents to remain within, or become a
part of the K-8 school environment.
In the end, educators support placing middle grades students in K-8 schools as
opposed to middle schools because of the potential for K-8 schools to yield several positive
outcomes for middle grades students who attend them. The positive outcomes that may
result from middle grades students attending K-8 schools include: increased academic
achievement, elimination of the middle school transition, fewer discipline problems, and
increased parental involvement during a challenging time in young adolescents’ lives
academically and emotionally.
Small Learning Environments
Educators also recognize the importance of establishing smaller schools and smaller
learning environments within schools whenever possible (Erb, 2005; McEwin & Alexander,
1990). Erb (2005) writes that, “the notion of small learning communities (i.e.,

70
interdisciplinary teams) has been a part of the middle school concept for at least 40 years” (p.
2). Erb also writes, “the middle school concept has long called for small schools or schools
made to seem small through teaming and advisories and adult advocates” (p. 2).
McEwin and Alexander (1990) also refer to the importance of small learning
communities in the successful education of young adolescents. McEwin and Alexander
conclude:
It is the judgment of the authors that communities with relatively small student populations, assuming a consolidated middle school serving several such K-8 schools is not feasible, should work intensely to develop middle grades programs which focus on the unique characteristics and needs of young adolescents. (p. 10)
In these instances, reference is made to the small size of the learning community, and not
necessarily that K-8 schools or middle schools are the best grade configurations for educating
young adolescents.
One of the original objectives of the middle school concept was to provide students
with an exploratory curriculum at a time of physical and emotional development that might
lead them into a particular academic or career path once they reach the high school ranks.
McEwin and Alexander (1990) write:
It is very important that attention be focused on the establishment of developmentally appropriate programs for the young adolescents that attend these schools, and that concentrated efforts to improve these programs be continuous. (p.11)
McEwin and Alexander also write when addressing the importance of a rigorous and
applicable curriculum for young adolescents:
The K-8 school then, along with other grade organizations including middle grades, should focus on restructuring programs and practices that reflect rather than reject the essential components of effective middle level programs and schools. (p. 10)
71
It appears from this argument by McEwin and Alexander that grade configuration is one of
several issues that must be addressed when attempting to establish a school with the best
grade configuration for young adolescents. McEwin and Alexander note that it is just as
important to “focus on restructuring programs and practices” as it is to debate the particular
grade configuration that best meets the needs of young adolescents.
Mizell (2005) refers to the work of Clark (2004) and Cooney and Bottoms (2003)
when he discusses the need for a rigorous curriculum for young adolescents. Mizell writes:
Whether young adolescents are in 6-8 or K-8 schools, they need engaging, challenging curricula and high quality teaching rooted in knowledge of subject content. (p. 21)
George (2005) also stresses the importance of addressing the middle grades
curriculum in the establishment of a successful learning community instead of placing too
much emphasis on the grade configuration for young adolescents when he writes, with
support included from Kasak (2004) and Swaim (2004):
Many middle level educators have learned how to effectively educate all of the older children and young adolescents who attend middle schools. As Kasak (2004) and Swaim (2004) have pointed out, young adolescents need well-trained teachers, cohesive learning communities, mentoring programs, and a rich and rigorous curriculum focused on their interests and needs. (p. 12)
George (2005) feels one of the ways K-8 or middle school learning communities can increase
the rigor of the curriculum they offer to young adolescents is by hiring more middle grade or
secondary school teachers to teach young adolescents at their schools. The effects of the
integration of more secondary teachers to a school’s staff can be numerous according to
George. George explains:

72
If an elementary school receives an influx of a dozen or two middle level or secondary teachers as a result of reorganization to K-8, the school might benefit from the presence of teachers who could add a great deal more depth, rigor, and richness to the curriculum at every level in the school. (p. 8)
Is it the Grade Configuration that Allows a School to Best Meet the Needs of Its Students and
Staff?
This researcher is well aware that, throughout the beginning of this paper, “glowing”
support has been provided for the establishment of K-8 schools as opposed to separate
middle schools in order to effectively establish successful learning communities for young
adolescents, their teachers, administrators, and parents. The evidence provided supports the
rise in popularity of K-8 schools, especially in urban America, over the last several years.
On the other hand, some areas of rural America have never given up on the potential success
of K-8 schools and their ability to support successful learning communities for young
adolescents. However, there is more to the success of K-8 schools than their grade
configurations. There are exemplary middle schools that continue to support successful
learning communities for young adolescents and the teachers that work within these schools.
There must be commonalities between K-8 schools and separate middle schools that
effectively support young adolescent academic achievement and aid the establishment of
favorable working conditions for the teachers that serve these students in schools serving
middle grades students. Before research is examined that attempts to make the connection
between grade configuration and teachers’ perceptions of the desired working conditions
needed in order for schools to meet the needs of its teachers when instructing middle grades
students, there are additional school factors such as: school size, number of students per
grade, quality of leadership, poor implementation of the middle school concept in middle
schools, and other socio-economic factors of the students within a school that influence the

73
overall success of young adolescents, and thus, influence the overall success of a particular
school and its grade configuration at meeting the needs of both students and teachers.
Other Factors that Influence a School’s Success in Meeting the Needs of Middle Grades
Students and Teachers
Smaller Schools and Fewer Students per Grade
Erb (2005) supports establishment of smaller schools as a potential antidote to the
problems educators currently face when meeting the needs of young adolescents. Erb
explains, “the rhetoric of big-city middle schools often fails to note the confounding variable
of school size and its effects on the achievement of low-income students” (p. 2). Erb points
out that research supports smaller schools and their ability to successfully educate low-
income students in urban areas. In the end, Erb suggests there are four variables which
influence student behavior and academic achievement. These variables are “school size,
timing of school transitions, student SES, and how the middle grades are organized to deliver
instruction” (p. 3). Therefore, according to Erb, it is more than grade configuration that
determines the successful formation of a learning community for young adolescents in the
middle grades.
George (2005) argues that there are many factors that affect the successful formation
of learning communities for young adolescents beyond “simply changing grade levels and
school designs” (p. 9). George recognizes several potential factors that contribute to the
formation of successful learning communities such as “school size, location in urban or
suburban settings, poverty levels, ethnic diversity, and teacher quality” (p. 9). Unfortunately
for this discussion on the best grade configuration for middle grades students, George notes
that educators do not completely understand the relationship between each of these factors

74
and K-8 schools. George, however, does offer that there may not be a “best” grade
configuration for middle grades students. Instead, middle grades students’ success may have
as “much to do with the fundamental socioeconomic circumstances of the school and the
reculturing that may be required” (p. 9).
Offenberg (2001) proposed from his study comparing K-8 schools to middle schools
in Philadelphia that the number of students in each grade is an important factor to consider
when comparing K-8 schools to middle schools. Offenberg (2001) defended the attempts of
some middle schools to arrange their schools into smaller units, often similar to the size
many K-8 schools operate from. Offenberg explained:
The house organizations and small learning communities advocated by middle school specialists are, in a sense, attempts to create a group of K-to-8-like learning environments within an organization that tends to be bureaucratic because of its size and the character of the community it serves. I think a field-based study of our middle grades schools would show most having small-learning community organizational structures, but not the supportive interpersonal relationships that the middle school approach is supposed to develop. (p. 29)
Offenberg’s argument can be interpreted from two perspectives. The first perspective is that
the important factor to consider may be number of students per grade and not the grade
configuration serving middle grades students. However, the previous quote referenced from
Offenberg repeatedly recognizes educators’ desire to make schools serving middle grades
students more like K-8 schools. Other factors affecting the success of middle grades students
must be recognized and examined as alternative rival hypotheses before completely crediting
grade configuration as the most important factor affecting young adolescents success in the
middle grades.
75
Poor Implementation of the Middle School Concept
McEwin, et al. (2005) propose that poor implementation of the middle school concept
in part explains why middle schools are often viewed as less successful at meeting the needs
of middle grades students than K-8 schools. McEwin et al. argue that all middle schools
have not passionately adopted and implemented the middle school concept in their schools.
However, McEwin et al. feel middle schools, in the end, have greater potential at meeting the
needs of young adolescents than K-8 schools. McEwin et al. explain,
Middle schools more frequently have programs and practices in place that are recognized as essential in middle level schools (e.g., interdisciplinary teaming, advisory programs, a wide variety of exploratory courses, common planning time for core teachers), and educators in middle schools are more likely to understand young adolescents to better focus their efforts on serving them. (p. 27)
McEwin et al. also note that the results of a survey they administered revealed that, “only
18% of K-8 principals believed that the K-8 organization they were currently heading was
ideal for young adolescents” (p. 26).
Mizell (2005) also sees middle schools’ failure to comprehensively implement the
middle school concept as a major flaw that has contributed to recent backlash on middle
schools in general. Mizell elaborates:
School systems that embraced the 6-8 middle school configurations also put too much emphasis on changing the organization of the grades and too little emphasis on the new knowledge, skills, and behaviors teachers and principals would have to develop to make middle schools successful. (p. 16)
Mizell also discusses, with reference to the work of Fletcher (2004), how he feels school
system leaders and middle school administrators in urban areas could have done more to
guarantee the successful formation of middle school learning communities in separate middle
schools for young adolescents. Mizell elaborates:

76
School system leaders did not understand that implementing such basic middle school concepts as teaming, integrated curriculum, advisories, common planning time, flexible scheduling, exploratory courses, and honoring student voice were very difficult, requiring new knowledge, skills, and behaviors. (p. 16)
Anfara and Buehler (2005) approach the issue of grade configuration from a different
perspective. They argue there are disadvantages to the K-8 model that many proponents of
K-8 schools are willing to overlook at this time of increased popularity in K-8 schools.
Anfara and Buehler list “potential drawbacks” of K-8 schools, referenced from the research
of Look (2001), that include: less funding for K-8 schools due to their classification as
elementary schools, and the potential withholding of assistant principal, resource officer, and
counselor allocations for K-8 schools that middle schools often receive (p. 57).
The Missing Link: Teachers’ Perceptions of Working Conditions and Related Topics
An area that has not been explored comprehensively in the comparison of K-8
schools to middle schools and their ability to best meet the needs of the students and teachers
in schools serving middle grades students is teachers’ perceptions of working conditions in
public K-8 and middle schools. A more complete analysis of K-8 schools versus middle
schools and their abilities to meet the needs of students and staff could be accomplished
through an analysis and cross-comparison of teachers’ perceptions of working conditions in
K-8 and middle schools. Herzberg (1966) identified working conditions as one of several
hygiene factors which affected worker dissatisfaction in his motivational-hygiene theory of
worker satisfaction and dissatisfaction. Past research on teacher working conditions has been
mostly limited to an analysis of teachers’ perceptions of working conditions under such
premises as teacher satisfaction, organizational health, organizational climate, and the
physical working conditions of schools. In the second half of this literature review, this
77
researcher will begin with a brief discussion of Herzberg’s motivational-hygiene theory and
his recognition of working conditions as a hygiene factor which contributes to worker
dissatisfaction. Next, this researcher will provide a brief discussion of past literature on
teacher satisfaction and its application to this research project’s focus on teachers’
perceptions of working conditions in public K-8 and middle schools in North Carolina. A
discussion of research on two related topics, organizational climate and organizational health,
which have contributed to the evolution of the current accepted definition of teacher working
conditions, will follow. This literature review will conclude with a discussion of the
literature that has focused on the topic of teacher working conditions. The discussion of
research on teacher working conditions will begin with a synthesis of the literature that first
recognized the importance of teacher working conditions. To conclude this literature review,
the most recent literature as a result of Teacher Working Condition Survey (TWCS)
administrations in the state of North Carolina, other corresponding states, and large, urban
school districts will be discussed.
Herzberg’s Motivational-Hygiene Theory of Worker Satisfaction and Dissatisfaction
Working conditions were identified by Herzberg (1966) as one of several hygiene
factors affecting worker dissatisfaction in his motivational-hygiene theory of worker
satisfaction and dissatisfaction. Motivational-hygiene theory, according to Herzberg,
explained “the concept that man has two sets of needs: his need as an animal to avoid pain
and his need as a human to grow psychologically” (p. 91). Herzberg’s 1959 Motivation to
Work study included “two hundred engineers and accountants who represented a cross-
section of Pittsburgh industry” (p. 91). The purpose of the Motivation to Work study was to
gather data from workers “about events they had experienced at work which either had
78
resulted in a marked improvement in their job satisfaction or had led to a marked reduction in
job satisfaction” (p. 91).
Multiple one-on-one interview sessions with study participants revealed two distinct
types of factors that influenced worker satisfaction and dissatisfaction. Herzberg (1966)
categorized these factors as “motivational,” often referred to as “satisfiers,” and “hygiene,”
often referred to as “dissatisfiers” (p. 92-95). Herzberg defined motivational factors or
“satisfiers” as the “strong determiners of job satisfaction,” which “are effective in motivating
the individual to superior performance and effort” (p. 92 & 94). Motivational factors
acknowledged by Herzberg over the course of The Motivation to Work study which should
lead to worker satisfaction were “achievement, recognition, work itself, responsibility, and
advancement” (p. 92).
Contrastingly, Herzberg (1966) defined hygiene factors or “dissatisfiers,” as factors
that “served only to bring about job dissatisfaction and were rarely involved in events that led
to positive job attitudes” (p. 92-93). Furthermore, hygiene factors “essentially describe the
environment and serve primarily to prevent job dissatisfaction, while having little effect on
positive job attitudes” (p. 94). Hygiene factors acknowledged by Herzberg throughout the
course of The Motivation to Work study which often led to worker dissatisfaction included
“company policy and administration, supervision, salary, interpersonal relations, and
working conditions” (p. 94).
Herzberg’s identification of working conditions as one of several factors potentially
affecting worker dissatisfaction, along with the presence of the accessible, secondary data set
from the 2006 NCTWCS, led this researcher to designate the hygiene factor, working
conditions, as the dependent variable for more extensive research in this study. Whereas
79
Herzberg looked at both the motivational and hygiene factors affecting worker satisfaction
and dissatisfaction, this study focused on the hygiene factor, working conditions, for public
K-8 and middle school teachers’ responses to the 2006 NCTWCS.
Teacher Satisfaction
Teacher satisfaction, by far, has been the most popular researched topic in close
relation to a study of teachers’ perceptions of working conditions. Nias (1981) conducted
observations and interviews of 100 recent college graduates who were followed after
graduation into their first “two to nine years” of teaching in English primary schools to
gather data pertaining to the research question, “Why do teachers go on teaching?” (p. 235 &
237). Thirty men and sixty-nine women were included in the sample for this study. This
study focused on teacher satisfaction and dissatisfaction using Herzberg’s motivational-
hygiene theory of worker satisfaction as the conceptual framework for the study. Nias found
the “causes of satisfaction came mainly from the work itself (affective satisfaction; personal
competence; extension of skills) but so did many of the causes of dissatisfaction” (p. 235).
Causes of dissatisfaction for beginning primary teachers in their first couple of years
included “interpersonal relations, physical conditions, promotion prospects, ill-health, and
fatigue” (p. 235). The most notable cause of dissatisfaction mentioned from this study was
the “physical conditions” of the schools these beginning teachers were working within. Nias
explained, “job-dissatisfaction apparently derived mainly from the context in which the job
was done (i.e. policy and administration, supervision, interpersonal relations, working
conditions, salary)” (p. 236). Results from Nias’ study revealed, “a fifth of the sample found
their physical surroundings uncomfortable, unaesthetic, cramped or inconvenient” and
labeled working conditions as “unsatisfactory” (p. 243).
80
Despite the limited definition of physical and working conditions within Nias’ (1981)
study, the findings of this study are significant for future research because working
conditions is identified as a cause of dissatisfaction for beginning teachers in English primary
schools. Nias’ research on factors contributing to job dissatisfaction is quite applicable to
this research project focusing on teachers’ perceptions of working conditions as the factors
contributing to job dissatisfaction in Nias’ study are exactly what the NCTWCS is attempting
to measure. A second commonality in Nias’ study and this research project is the inclusion
of Herzberg’s Motivation-Hygiene Theory of Job Satisfaction. Finally, through close
analysis of Nias’ study one will begin to recognize the transformation of what is meant when
the term “teacher working conditions” is discussed as a source of dissatisfaction. The term
“teacher working conditions” has evolved from a concept referring solely to the “physical
conditions” teachers and students encounter within a school building to a much more
complex and overarching definition today. For example in the NCTWCS, physical
conditions are still recognized as an important aspect of teacher working conditions.
However, physical conditions are integrated within one of the five NCTWCS domains,
facilities and resources. Generalizability may be limited due to the location of the study.
Nevertheless, working conditions is identified as a potential cause of teacher dissatisfaction.
Another quantitative research study by Quaglia, Marion, and McIntire (1990) studied
the relationship of teacher satisfaction to the independent variables: teachers’ perceptions of
school organization, teacher empowerment, work conditions, and community status. One
specific objective of this research study was to investigate the relationship between teacher
satisfaction and dissatisfaction to aspects of the work environment. The sample for this study
included 477 teachers from twenty Maine communities. Each sample participant completed

81
the Community Attitude toward Education survey conducted by the Center for Research and
Evaluation within the College of Education at the University of Maine, and completed the
Teacher Opinion Inventory survey. One of the five major areas on which the survey was
designed to gather teacher opinion data was working conditions. Teachers answered
questions with answers arranged in a Likert-scale format with answer choices ranging from
“very satisfied to very dissatisfied” (p. 209). “Thirty-eight teachers identified themselves as
dissatisfied and 386 indicated that overall, they were satisfied” (p. 209).
Findings from the study by Quaglia et al. (1990) found “73% percent of the
dissatisfied teachers and 74.8% of the satisfied teachers were K-8 teachers (p. 209). The
working conditions aspect of the Teacher Opinion Inventory contained questions asking
teachers about faculty workload, instructional time, planning time, and salaries. Only the
question, “Is the number of instructional periods that you teach appropriate?,” provided a
significant difference between satisfied and dissatisfied teachers, with 89% satisfied and only
63% dissatisfied reporting that they approved of the number of instructional periods (p. 211
& 213). Overall, however, “the satisfied teachers were generally more positive about their
working conditions than were dissatisfied teachers” (p. 214).
Again, the limited scope of the working conditions aspect of this particular survey
provides limited data on teachers’ perceptions of working conditions compared to where
current research on teacher working conditions has evolved. Furthermore, only one section
of this survey consisting of six questions focused on the importance of working conditions to
teacher satisfaction. Within these six questions, four focus on the use of teacher time and fail
to explore additional areas of teacher working conditions that are researched in more recent
studies. However, the primary focus of this survey on teachers’ perceptions of the use of
82
time coincides with the 2006 NCTWCS’s incorporation of time as one of the five domains of
teacher working conditions to be researched and focused upon in its survey. The final
limitation of this study is its limited generalizability to populations outside the state of
Maine.
Shann (1998) completed a quantitative study on teacher satisfaction including 92
teachers from four urban middle schools in its sample. The purpose of this study was to gain
a better understanding of the “importance and satisfaction” teachers attributed to various
aspects of their jobs (p. 1). Shann justified the importance of this study by the acknowledged
correlation in previous research of teacher job satisfaction to teacher retention. Furthermore,
Shann acknowledged “getting and keeping good teachers is a difficult challenge for many
urban school systems” (p. 1). The relationship between teacher satisfaction and its effect on
teacher retention is pertinent to this research project because this study specifically focuses
on the middle school grade configuration when analyzing this relationship. Results of this
study found “teachers in higher achieving schools reported greater levels of satisfaction than
those in lower achieving schools” (p. 1). The indicated correlation between student academic
achievement and teacher satisfaction in this study leads this researcher to include overall
school academic achievement as a co-variate variable that needs to be controlled for when
examining teachers’ perceptions of working conditions in public K-8 and middle schools in
North Carolina.
Shann (1998) and her associates conducted a two-part assessment guided by two
specific research questions. The two questions asked of members of the representative
sample, which included 58 teachers out of the 200 teachers from these four urban schools
included,
83
(a) How congruent are teachers’ perceptions of the importance of various aspects of their jobs and their reported satisfaction with those components? and (b) Do teachers in more, as compared with less, effective schools differ in their ratings of importance and satisfaction with various aspects of their job? (p. 3)
Data gathering instruments employed over the course of this three year study included
multiple interviews and surveys. Results from the study indicate that teachers found their
relationships with parents and students as most important to teacher satisfaction. As
indicated previously, “teachers in higher achieving schools reported greater levels of
satisfaction than those in lower achieving schools” (p. 1). Another important finding was
that “dissatisfaction with participation in decision-making ranked second from the bottom
and had the least variance” (p. 6). Teacher dissatisfaction with decision-making (often
referred to as empowerment) in the sample of urban schools in Shann’s study is noteworthy
because empowerment is one of the five domains of working conditions focused upon by the
2006 NCTWCS, which is used by this researcher as the survey instrument in this research
project. Whereas a substantial amount of data gathered in Shann’s study is inapplicable to
this research project, the data which focused on teacher dissatisfaction with decision-making
authority in these urban middle schools is an applicable finding for this research study.
Limited generalizabilty exists from Shann’s study because only four urban middle schools
are included in the study’s sample.
Ma and MacMillan (1999) completed a quantitative study in New Brunswick, Canada
which examined the influences of workplace conditions on teachers’ job satisfaction using a
sample of 2,202 elementary school teachers. Their study measured teacher satisfaction
through three main variables: “teacher competence, administration control, and
organizational culture” (p. 1). Their finding that “workplace conditions positively affected

84
teacher satisfaction” is relevant to this research project. Another relevant finding from Ma
and MacMillan’s study for this research project is that “administration control was the most
important” factor affecting teacher satisfaction of the three dependent variables measured in
their study (p. 1). “Administration control” is referred to by the synonymous label,
leadership, in other studies focusing on teacher working conditions. Furthermore, leadership
is classified as one of the five domains of teacher working conditions in the 2006 NCTWCS.
A final significant finding from Ma and MacMillan’s study was the recognition of
“significant interactions between teacher background characteristics and workplace
conditions” (p. 1). The significance found between teacher background characteristics and
workplace conditions has led this researcher to control for teacher background characteristics
as co-variates by using an ANCOVA statistic when measuring the effects of grade
configuration on teachers’ perceptions of working conditions in public K-8 and middle
schools in North Carolina in this study.
There are several limitations found within Ma and MacMillan’s (1999) study of
teacher satisfaction and teachers’ perceptions of working conditions in New Brunswick.
First of all, New Brunswick is “largely a rural province” (p. 3). Hence, this factor limits
generalizability to schools in sub-urban and urban areas. Secondly, New Brunswick is a “bi-
lingual province” (p. 3). Hence, it would seem that the findings of this study might be best
applied to school districts with at least the presence of multiple languages. Finally, this study
was completed in New Brunswick, Canada, which limits the generalizability of its findings to
American public schools.

85
Physical Working Conditions
A second body of research related to teacher working conditions limited its focus to
the physical aspects of teacher working conditions. Even though several research studies
were conducted in the name of working conditions, they in actuality only looked at the
physical attributes of the school buildings and classrooms (Buckley & Schneider, 2005;
Taylor & Bogotch, 1993).
Taylor and Bogotch (1993) completed a mixed-methods study in an urban school
district in the southern United States that examined physical working conditions. Taylor and
Bogotch focused on the facilities and resources that teachers encountered in their
examination of physical working conditions. The sample for this study included 1329
teachers from 15 secondary and 68 elementary schools from a high-poverty school district
consisting of “40,000 teachers, and 80,000 students in some 120 schools” (p. 1 & 5). There
was a 50% response rate to the administration of this survey. The survey completed by
respondents examined teachers’ perceptions of working conditions in the areas of “class size
and teaching load, timeliness of receiving textbooks, sufficiency of materials, condition of
equipment, and physical conditions of the school and classroom” (p. 6). Survey results
indicated teachers’ concerns with physical working conditions such as “textbook availability
and functional equipment” (p. 1).
The second component of the Taylor and Bogotch (1993) study consisted of
interviews with teacher leaders throughout the district. One theme that emerged from these
interviews was that “teacher leaders conceive of working conditions along two dimensions,
faculty/staff relationships and physical conditions” (p. 10). Taylor and Bogotch found that
teachers considered faculty/staff relationships as a more important aspect of teacher working
86
conditions than the physical conditions of the schools in which they worked. Taylor and
Bogotch argued that faculty/staff relationships “is the aspect of working conditions not
considered in prior research” (p. 10). Taylor and Bogotch’s study of teacher working
conditions should be seen as a turning point for working conditions research. Taylor and
Bogotch contributed to the expanding realms of what is considered working conditions for
research purposes at the time of their study. Furthermore, Taylor and Bogotch speak strongly
in opposition to the lack of attention they felt is being paid to teacher working conditions at
the schools within their sample when they proclaim, “change advocates would be wise to
consider that serious and sustained attention to ameliorating the conditions under which
teachers work may be a necessary prerequisite to genuine reform” (p. 3).
Buckley and Schneider (2005) completed a quantitative study, using a K-12 survey in
Washington, D.C. that analyzed the “importance of facility quality” as an important working
condition factor influencing teacher retention (p. 1107). Findings from their study indicated
“that facility quality is an important predictor of the decision of teachers to leave their current
position, even after controlling for contributing factors” (p.1107). Factors which Buckley
and Schneider controlled for in their study included teachers’ age, gender, number of years at
their present school, and race. These teacher demographic variables are important to this
researcher’s study of teachers’ perceptions of working conditions as many of these same
teacher demographic variables were controlled for as co-variates in this research project.
Buckley and Schneider listed indoor air quality, thermal comfort, building cleanliness, and
classroom lighting as physical working condition factors that influenced teacher retention in
Washington, D.C. schools. Buckley and Schneider identified “the lack of resources” as an
additional factor affecting teacher retention in Washington, D.C. public schools (p. 1110).
87
The physical working condition categorized as “resources” by Buckley and Schneider is
incorporated within the “facilities and resources” domain in 2006 NCTWCS, the quantitative
instrument used in this study (p. 1110). Buckley and Schneider concluded that “the benefits
of facility improvement for retention can be equal to or greater than those from pay
increases” (p. 1119). Despite the fact this study took place in a large urban school district, its
findings are generalizable to many of the schools and districts from the state of North
Carolina that were included in the sample for this study via data collected from the 2006
NCTWCS. The reason for this generalizabilty is that many rural school districts in North
Carolina are considered low-wealth districts, and thus face many of the same physical
working conditions issues that the sample of schools from Washington, D.C. face because
they lack adequate funding for physical working conditions.
Research that has focused only on the physical attributes of school buildings has
limited value in a comprehensive study of teachers’ perceptions of working conditions when
compared to the research objectives of the 2006 NCTWCS. In fact, data collected from
physical working conditions studies would likely be categorized under only the Facilities and
Resources domain of the 2006 NCTWCS. Nevertheless, an analysis of the prior research that
examined the physical attributes of working conditions allows this researcher to better
understand the evolution and expansion of the current accepted definition of teacher working
conditions.
88
Organizational Health, School Climate and Organizational Factors:
Research that Moves Closer to the Current
Accepted Definition of Teacher Working Conditions
Organizational health and school climate are two additional topics somewhat
synonymous to teacher working conditions that have been increasingly researched in recent
years (Brown, Roney, & Anfara, 2003; Huang, 2001; Johnson & Stevens, 2006; Rosenholtz
& Simpson, 1990; Tsui and Cheng, 1999). However, organizational health studies have
failed to specifically focus on a discussion of teachers’ perceptions of working conditions as
their main source of data collection. Instead, organizational health studies, such as one
conducted by Brown, et al. (2003) within a sample of twelve public middle schools in
Philadelphia, focused on such topics as “academic focus, teacher affiliation, collegial
leadership, resource support, and institutional integrity” (p. 6). The twelve public middle
schools chosen as the sample for this research project were chosen as a convenience sample.
Six schools were chosen as low performing urban schools, while six schools were chosen as
high performing, suburban schools. Low performing and high performing middle schools
were compared to one another quantitatively through the analysis of descriptive statistics,
which looked at school and student characteristics. School and student characteristics
analyzed quantitatively included percentage of low income students, percentage of minority
students, and achievement test scores. Low and high performing schools were compared
qualitatively by using teacher responses gathered while conducting 24 teacher interviews
through a purposive sampling strategy at the schools within the sample.
Quantitative analysis by Brown et al. (2003) “highlight stark demographic disparities
between the two types of schools” (p. 7). Brown et al. also discovered “distinct differences”
89
between teachers’ responses in high performing suburban and low performing urban schools
(p. 14). Finally, Brown et al. found “a 400-point difference in average state scores and an
85% difference in the percentage of low-income students” between high performing
suburban and low performing urban schools as well (p. 14)
The comparison of high and low performing middle schools by Brown et al. (2003) is
applicable to this study which examined the relationship between teachers’ perceptions of
working conditions in public K-8 and middle schools in North Carolina because two
components of organizational climate analyzed within their study, collegial leadership and
resource support, are identified in the 2006 NCTWCS. Collegial leadership is synonymous
with the leadership domain of the 2006 NCTWCS. Resource support is synonymous with
the facilities and resources domain of the 2006 NCTWCS.
Another reason for the applicability of the study by Brown et al. (2003) to this study
is its focus on schools as a unit of analysis at the middle school level. A limitation in
applicability to this study, however, is that it fails to make a comparison between low
performing and high performing middle schools and low performing and high performing K-
8 schools. The fact that K-8 schools are not included in the study’s sample is perplexing
since K-8 schools have become increasingly popular in Philadelphia in recent years.
Tsui and Cheng (1999) also completed a quantitative study on organizational health
in which teachers’ perceptions of their work environment was a primary focus. The sample
for this study included 20 primary schools and 423 teachers in Hong Kong. Teachers
completed surveys which assessed the relationship of organizational health factors to teacher
commitment. Teacher surveys consisted of three separate sections that collected quantitative
data on teacher demographics, teachers’ perception of organizational health, and teacher
90
commitment. Teacher demographic data that was collected included “age, teaching
experience, sex, educational level, professional training, working position, and marital
status” (p. 256). One of the major findings from this study was “that the relationship
between perceived school organizational health and teacher commitment is contingent upon
some teacher characteristics” (p. 259). To be more specific, “correlational analysis revealed
that age, teaching experience, and service in school were highly correlated to teacher
commitment” (p. 258). Tsui and Cheng also noted that a “principal’s behavior is also an
important factor that contributes to teacher commitment” (p. 265). This is a noteworthy
finding that is applicable to this research project because leadership is identified as one of the
five domains of teacher working conditions that is measured by the 2006 NCTWCS. Tsui
and Cheng declared a weakness of prior studies looking at the relationship between
organizational health and teacher commitment has been “their ignorance of interactions
between personal characteristics and school environment in contributing to the development
of teacher commitment” (p. 250). Tsui and Cheng also discussed the close relationship
between the meanings of organizational health and organizational climate. Tsui and Cheng
explained that “the term school organizational health is a metaphor used for conceptualizing
the climate of a school” (p. 251). This is an important recognition because it allows for the
simultaneous discussion and comparison of organizational health and organizational climate
studies. Organizational climate is also a topic closely related to the concept of working
conditions that according to Tsui and Cheng has been researched at length since at least the
late 1950s (p. 251).
Another important aspect of the study by Tsui and Cheng (1999) is its applicability to
this researcher’s study of teachers’ perceptions of working conditions in public schools in

91
North Carolina. Within their study, a connection is made between organizational
health/climate studies and the need to further expand research in the realm of teacher
working conditions. Tsui and Cheng make this connection between organizational health
and teacher working conditions when they explain,
Apparently, a healthy school would be a better environment for teachers to work and cope with challenges from the internal and external environments. School organizational health might be an important and powerful conception for capturing the atmosphere of an effective school. (p. 251)
Whereas Tsui and Cheng did not explicitly use the term “teacher working conditions,” these
researchers did recognize the importance of teachers’ work environment in establishing
healthy, effective schools and for increasing teacher commitment. The importance of
teachers’ perceptions of their work environment is best explained by Tsui and Cheng when
they share,
Teachers’ perception of the school environment or organizational health is an important source of data to reflect the quality of teachers’ work life. In fact, school organizational health is the measure of teachers’ perceptions of different aspects of school environment. (p.253)
Brown (2004, October 26) emphasized the importance of establishing organizational
climates that are tolerant of change. Brown defined organizational climate as “the
perceptions that individuals have of various aspects of the environment in an organization
that reflects those norms, assumptions, and beliefs that make up the organizational culture”
(Class Notes, 2004, October 26). Brown suggested that it is easier to change the
organizational climate of an organization, such as a school, than it is to change the
organizational culture. Brown asserted that, “leaders can change the climate, but, people
love their cultures and do not want to change that” (Class Notes, 2004, October 26).
92
Appropriate organizational climates in schools establish the conditions necessary for the
academic success of all students and teachers. In concluding his discussion on organizational
climates, Brown elaborated that:
The organizational environment is key to influencing organizational behavior. School leaders have little ability to alter the inner forces of individuals. However, the environment can be changed. Creating organizational environments that support creativity, team building, and participation in problem solving fosters inner motivational forces, social- psychological environment, rather than just the physical. (Class Notes, 2004, October 26)
Another quantitative study by Huang (2000) focused on high school teachers’
perceptions of school environments and “whether gender was a differentiating factor” (p.
159). The sample for Huang’s study consisted of 275 teachers from eight public high schools
in the southern United States. There were 127 male and 148 female teachers included in the
sample. Teachers completed the Teacher’s School Environment Survey (TSES) which was
divided into seven learning environment variables: “Job Satisfaction, Collegiality, Teacher-
Student Relations, Principal Leadership, Ethnic Equity, Teacher Influence, and Student
Discipline” (p. 163). Two learning environment variables, Principal Leadership and Teacher
Influence, closely mirror two domains of the 2006 NCTWCS, leadership and empowerment.
Hence, it is applicable for this study’s purposes to look at how these learning environment
variables are defined in the TSES. The TSES asked multiple questions in each sub-category
with Likert scale responses ranging from “strongly disagrees” to “strongly agrees” (p. 163).
Several findings from Huang’s (2000) study are applicable to this research project.
First of all, “analysis of variance (ANOVA) results indicate teachers’ perceptions of the
learning environment variables differ significantly (p<0.01) in different schools” (p. 164).
Furthermore, “12% of the variance in the school environment scores can be accounted for by
the teachers’ school membership” (p. 164). A final finding potentially applicable to this
93
research project was that “the MANOVA results revealed that there was an overall
significant gender difference in teachers’ perceptions of their school environments” (p. 166).
Due to gender’s significance in Huang’s study it was be controlled for as a co-variate in this
research project.
Johnson and Stevens (2006) completed another study on school climate which looked
at the effect of community and school context on student achievement and elementary
teachers’ perceptions of school climate. Johnson and Stevens, like Huang (2000), noted that
school climate could be referred to by other terms such as “school environment” or “school-
level learning environment” (p.111). Johnson and Stevens explained that school climate “can
either be seen as a construct representing the involvement of everyone in a school or as
something that is primarily a function of the teachers or of the students. (p. 112)
The sample for Johnson and Stevens (2006) study consisted of 1115 teachers from 59
of the 78 schools in a city school district in the southwestern United States. Teachers
completed the School-Level Environment Questionnaire (SLEQ), which measured a school’s
climate in eight areas: “student support, affiliation, professional interest, staff freedom,
participatory decision making, innovation, resource adequacy, and work pressure” (p. 113).
Two of these areas, participatory decision making (empowerment), and resource adequacy
(facilities & resources), correspond closely to working conditions domains within the 2006
NCTWCS used by this researcher for this research project.
One of the more important findings from this study by Johnson and Stevens (2006)
was the presence of “a positive and statistically significant relationship between teachers’
perceptions of school climate and student achievement” (p. 118). Johnson and Stevens
94
explained the “statistically significant relationship” between teachers’ perceptions of school
climate and student achievement saying,
Schools in which teachers perceived a positive school climate, with a high degree of affiliation among teachers, an atmosphere of innovation, high involvement of teachers in the decision-making process, cooperative, friendly students, and adequate resources and facilities, had better average student achievement. (p. 118)
The significant relationship between teachers’ perceptions of school climate and student
achievement in Johnson and Stevens’ study leads this researcher to examine the relationship
between teachers’ perceptions of working conditions, student achievement, and other
independent variables such as grade configuration, the independent variable of focus in this
research project, due to the overlapping parameters in the dependent variables, school climate
and teacher working conditions, in these two studies. However, Johnson and Stevens caution
of the generalizability of their findings to other areas because the school district from which
their sample was taken consisted of a large, Hispanic population. Additionally, as with most
other studies conducted within elementary and middle schools, it is not mentioned whether or
not the elementary schools in this sample are configured as K-8 schools. This omission
limits generalizability to this research project as well.
Rosenholtz and Simpson (1990) completed a quantitative study looking at the effect
of working conditions on teacher commitment. The reason for a discussion of this study at
this point in this researcher’s literature review and not in the forthcoming discussion
specifically on working conditions literature is that the authors discuss working conditions
under the heading of organizational conditions. Therefore, the evolution of what is
researched under the auspices of the term “working conditions” is still emerging at the time
of the Rosenholtz and Simpson study. The purpose of the Rosenholtz and Simpson study

95
was to examine seven organizational conditions and their affect on teacher commitment.
These organizational conditions are labeled by Rosenholtz and Simpson as teacher
commitment, performance efficacy, psychic rewards, task autonomy and discretion, teachers’
learning opportunities, managing students’ behavior, and principal buffering. In their study,
six of the seven organizational characteristics were “found to affect the job commitment of
1,213 teachers from 78 elementary schools throughout Tennessee” (p. 241). Eight school
districts in Tennessee “whose superintendents supported the participation of all elementary
schools” were included in the study’s sample (p. 248).
Principals at participating schools were given an approximately 30-minute
questionnaire to administer to their faculties within the context of a faculty meeting. A 70
percent response rate was achieved from the administration of this questionnaire. Survey
questions were designed in a five-point Likert- scale response format with answers “ranging
either from ‘strongly disagree’ to ‘strongly agree’ or from ‘almost never’ to ‘almost always’”
(p. 248).
Rosenholtz and Simpson explained the importance of organizational conditions to
teacher commitment by stating, “the organizational factors considered here influence
commitment through affecting both the conditions of the work itself and teachers’
interpretations of the work and their relation to it” (p. 242). Teacher commitment is described
through a discussion of “disaffection” or “teachers’ lack of commitment” to their work
(p.242). Teacher disaffection, or lack of commitment, according to Rosenholtz and Simpson,
“may manifest itself most dramatically in a decision to leave the teaching profession or to
leave a particular school” (p. 242). The effect of working conditions on teacher retention in
this particular study by Rosenholtz and Simpson further convinces this researcher of the

96
importance of looking at teachers’ perceptions of working conditions in different grade
configurations for middle grades students. Rosenholtz and Simpson point out in their study
that “various qualities of the organizational context within which teachers work influence
teachers’ commitment to their profession and to the schools in which they work” (p. 241).
Rosenholtz and Simpson’s (1990) study is also applicable to this research project because
several organizational conditions measured in their study mirror working conditions domains
measured in the 2006 NCTWCS. The organizational conditions that mirror teacher working
conditions domains in the 2006 NCTWCS, with the 2006 NCTWCS domains in parentheses
are task autonomy and discretion (empowerment), teachers’ learning opportunities
(professional development), and principal buffering (leadership). In fact, Rosenholtz and
Simpson suggest that “the two most important organizational qualities located were principal
buffering, for new teachers, and task discretion and autonomy, for experienced teachers” (p.
254). The correlation between organizational conditions and teacher commitment is also
applicable to this research project. One of the main objectives of the Teacher Working
Conditions Initiative, which led to the creation of the NCTWCS, is to examine the effect of
teacher working conditions on teacher retention, a topic closely related to teacher
commitment.
Another important finding from Rosenholtz and Simpson’s (1990) study is the
potential effect of student characteristics in any quantitative research model which includes
either individual teachers or the schools in which they work as a unit of analysis. Rosenholtz
and Simpson explained,
although the socioeconomic status (SES) of the student body is not a quality of school or classroom organization, previous research has shown that it influences all the organizational qualities that affect
97
commitment and has strongly recommended its inclusion in any model that seeks to explain the commitment of teachers. (p. 246)
Rosenholtz and Simpson (1990) also analyzed within their study the effect of
organizational conditions on teacher commitment for teachers at different stages of their
teaching career. They hypothesized that “the satisfaction or disaffection of more experienced
teachers should be influenced more than that of the novices by organizational factors that are
tied more directly to their core instructional tasks” (p. 247). Rosenholtz and Simpson
hypothesized “that the commitment of novice teachers will be most influenced by
organizational support (or lack of support) for consolidating the boundaries surrounding the
teaching role (p. 246). Rosenholtz and Simpson feel teachers’ “boundary roles” pertain to
classroom management, whereas “core instructional tasks” refer to the process of delivering
classroom instruction. In their study, Rosenholtz and Simpson found
…that novice teachers’ commitment is influenced more by organizational supports for the management of boundary issues, while experienced teachers are influenced more by organizational qualities that affect the core instructional tasks. (p. 241)
Rosenholtz and Simpson found “the number of years teaching, is only weakly, albeit
significantly, correlated with commitment” (p. 250). As a result of the significant differences
between teachers’ commitment and years of experience found in this study by Rosenholtz
and Simpson, this researcher will control for certain teacher demographic variables,
including teachers’ years of experience. Other teacher demographic variables for which data
was gathered during the administration of the 2006 NCTWCS will be controlled for as co-
variates in this study as well.
Finally, the generalizability of the findings from the Rosenholtz and Simpson (1990)
study is limited for several reasons. First of all, their study’s sample did not include any
98
large, urban school districts. Secondly, for the purposes of applicability and generalizability
to this research project, the authors do not state if the elementary schools in their study’s
sample are K-8 schools. If it is determined that there were no K-8 schools in their sample,
this researcher should use caution in generalizing the findings from their study to this
research project. Finally, the findings of this research study are now over fifteen years old.
It would be best if more recent research is used to generalize findings to this research project
instead of relying solely on generalizations from the Rosenholtz and Simpson study.
Teacher Working Conditions Initiative and the North Carolina Teacher Working Conditions
Survey
Beginning in the 2001-02 school year, the term “teacher working conditions”
emerged as a topic of increased focus in educational research. In his first term, North
Carolina Governor Mike Easley quickly shifted the state of North Carolina’s educational
focus to improving its public schools through his Teacher Working Conditions Initiative
(TWCI). According to the Center for Teaching Quality (CTQ) (known as the Southeast
Center for Teaching Quality when the Teacher Working Conditions Initiative was created),
“North Carolina became the first state to implement a statewide study of teacher working
conditions by surveying teachers and administrators across the state” (Southeast Center for
Teaching Quality). The TWCI was a major breakthrough in teacher working conditions
research because the parameters of what was included in teacher working conditions research
was greatly expanded and more clearly defined by the TWCI. The CTQ explains:
For states to make meaningful improvements around teacher working conditions requires more than focusing only on resources, class sizes, and physical structures. The current concept of working conditions for states has moved beyond typical labor issues of occupational health and safety concerns to consider a more comprehensive environment for teaching and learning. Recent teaching working conditions
99
research also includes measures to determine the effect of time allocation, empowerment, professional development, and leadership, complex issues now proven to be closely related to the capacity of professionals to improve student learning. (Center for Teaching Quality)
The private, non profit group, Charlotte Advocates for Education (2004), explained the goal
of the TWCI was “to improve working conditions and increase the retention of quality
teachers for all of North Carolina’s children” (p. 26).
The reason for the increased emphasis on teacher working conditions research in
North Carolina and other states (Arizona, California, Georgia, Kansas, Ohio, South Carolina,
and Virginia) which have followed North Carolina’s lead and replicated modified versions of
the North Carolina Teacher Working Conditions Survey (NCTWCS) in their states is the
“direct effect that working conditions have on both teacher attrition (and likewise teacher
retention) and ultimately, student achievement” (Hirsch, 2005a; Hirsch, Emerick, with
Church & Fuller, 2006a; Hirsch, Emerick, with Church & Fuller, 2006b; Hirsch, Emerick,
with Church & Fuller, 2006c; Hirsch, Emerick, with Church & Fuller, 2007; Southeast
Center for Teaching Quality). This relationship, as explained by the CTQ concluded:
Data collected and analyzed by the Center for Teaching Quality (CTQ, formerly named the Southeast Center for Teaching Quality) show powerful empirical links between teachers’ working conditions and student achievement in elementary, middle, and particularly high schools. The research proves that improved working conditions are not only central to teachers’ well-being and satisfaction, but they are also important to the success of the students they serve. (Center for Teaching Quality)
2002 North Carolina Teacher Working Conditions Survey
In 2002, the first NCTWCS was created and administered to public school teachers,
administrators, and other licensed school personnel across the state of North Carolina.
Charlotte Advocates for Education (CAE) (2003) explained that the 2002 NCTWCS
100
followed up a pilot study conducted by the North Carolina Professional Teaching Standards
Commission (NCPTSC) in 2001. CAE noted from data provided by the SECTQ that 30
working conditions standards were adopted as the framework for the 2002 NCTWCS which
“were validated by focus groups and by more than 500 teachers” (p. 26).
CAE (2003) indicated that in the fall of 2001 the initial version of what was to
become the 2002 NCTWCS “was administered in a pilot study to 2,300 teachers and
administrators in 60 schools throughout the state” (p. 26). After modifications were made to
the initial pilot survey, the SECTQ (2003, July) explained that the 2002 NCTWCS was
administered to “over 40,000 teachers (representing over 50% of the state’s teachers)” (p. 1).
According to CTQ “90 percent of the state’s schools” were represented in the final analysis
of 2002 NCTWCS (Center for Teaching Quality). CAE provided exact sample statistics for
teachers, schools, and districts that completed the 2002 NCTWCS stating that “42,209
educators from 1,471 schools in 115 of 117 of the state’s 117 school districts” completed the
2002 NCTWCS (p. 27). CAE further explained that “76% of the schools had a response rate
of 50% or higher” (p. 27).
The 2002 NCTWCS was “based on thirty working conditions standards in five areas:
time, empowerment, facilities and resources, leadership, and professional development,
created by the North Carolina Professional Teaching Standards Commission” under the
direction of Ms. Carolyn McKinney, Executive Director of the North Carolina Professional
Teaching Standards Commission (Teachers Working Conditions Survey). These five areas
have since been referred to as the five domains of teacher working conditions. The 2002
NCTWCS consisted of 39 survey questions developed around the five domains of teacher
101
working conditions. The initial survey was designed in a 6-point Likert scale format with
“‘6’ representing strongly agree” to “‘1’ strongly disagree” (p.3).
There were several findings of note from the initial NCTWCS administration in 2002.
Several groups have commented on the findings from the administration of the 2002
NCTWCS. CAE (2003) explained that data from the 2002 NCTWCS was imported into two
types of reports, average reports and frequency distribution reports. Average reports provide
the mean responses for each question in the 2002 NCTWCS for each group of licensed
educators. A mean summary for each of the five domains of the 2002 NCTWCS is provided
along with the mean responses for each question in the 2002 NCTWCS. Frequency
distribution reports “provide the percentage of responses for each of the values, 1 through 6”,
for each question in the 2002 NCTWCS (p.28). Data analysis yielded several important
findings from the 2002 NCTWCS. Several findings CAE cited from the work of the SECTQ
(2003, July) included:
• Overall, teachers are not satisfied with their conditions of work and feel
least satisfied with the amount of time they have to do their jobs.
• Teachers are most satisfied with school leadership but harbor mixed
sentiments on issues of facilities, teacher empowerment, and professional
development.
• With the exception of issues related to time, elementary teachers are more
satisfied with their conditions of work than their middle and high school
peers.
• Educators in smaller schools are more satisfied than their colleagues in
mid-range and larger schools.
102
• There are striking differences in perceptions between principals and
teachers. (p. 25)
CAE explained in greater detail the SECTQ’s analysis of the 2002 NCTWCS through
recognition of general trends for individual questions and for sets of questions within
individual teacher working condition domains. The highest average domain score for the
2002 NCTWCS was leadership (CAE, 2003; SECTQ, 2003). An average score of 4.2 was
reported for questions within the leadership domain. The lowest average domain score where
teachers indicated the least satisfaction was in the teacher working conditions domain of time
(CAE, 2003; SECTQ, 2003). CAE explained that “teachers were least positive about the
time provided to them to work on curriculum, classroom management and individual
instruction, time to work with colleagues and mentors, and time for professional
development” (p. 29). A synopsis of overall observations for the 2002 NCTWCS by the
SECTQ according to CAE follows:
…only one out of five categories had an average score of more than 4 (out of 6) and no statement on the survey received a rating of higher than 4.57. Thus, while there were some positive findings, the results demonstrated a great deal of room for improvement in the working conditions for educators. (p. 28)
Principals’ and teachers’ responses to survey items often were quite different, with
principals usually rating teacher working conditions higher (CAE, 2003; SECTQ, 2003).
CAE (2003) explained “teachers are less satisfied with every aspect of the school
environment than are peers in non-teaching jobs” (p. 29). The domains with the greatest
differences between principals and teachers that CAE recognized from the SECTQ report
were time and empowerment. CAE noted that “gaps between teachers and principals are
statistically significant for every statement on the survey” (p.29).

103
A final important finding from the administration of the 2002 NCTWCS was that
elementary teachers were more satisfied with most teacher working conditions domains than
their counterparts in middle and high schools (CAE, 2003; SECTQ, 2003). SECTQ (2003)
explained that “elementary school teachers reported more satisfaction with issues of
professional development, leadership, and empowerment than did their secondary
counterparts.” Elementary teachers were the least satisfied of the three groups of teachers in
response to questions on the teacher working conditions domain of time (CAE, 2003;
SECTQ, 2003). Whereas, “middle school teachers were the most satisfied” (Southeastern
Center for Teaching Quality).
2004 North Carolina Teacher Working Conditions Survey
The state of North Carolina conducted the second administration of the NCTWCS in
April-May 2004. According to Hirsch (2005b), several modifications were made to 2004
NCTWCS based on comments pertaining to the administration of the 2002 NCTWCS to
enhance the quality of data that would be gathered. The 2004 survey expanded from 39 core
questions in the working conditions domains in the 2002 NCTWCS to 72 questions in the
2004 version. The demographics portion of the 2004 NCTWCS was also expanded to a
series of eight questions. The 2004 NCTWCS also expanded by adding questions which
asked participants to assess “actual conditions” and “teachers’ perceptions of their school”
(p.2). Hirsch explained that many of these questions were taken from questions previously
validated by the School Staffing Survey from National Center for Educational Statistics
(NCES).
The 2004 NCTWCS was also converted to an online survey in an attempt to make
completion of the 2004 NCTWCS less burdensome for the licensed educators who chose to
104
complete the 2004 NCTWCS and in an effort to improve the response rate from licensed
educators in North Carolina public schools. Survey administrators also hoped that an online
version of the 2004 NCTWCS would place less pressure on survey participants by giving
participants more time and greater privacy to complete the online survey. However, the
initial administration of the online version of the NCTWCS in 2004 resulted in a decrease in
the total number of surveys which met the response rate eligibility requirement of 40% for
their schools to be included in the final data analysis for the 2004 NCTWCS. The sample for
the 2004 NCTWCS included nearly 34,000 educators from 90 percent of North Carolina’s
public schools representing all 117 school districts in North Carolina. The sample for the
2004 NCTWCS included over 8000 less participants compared to the initial NCTWCS in
2002. The number of schools meeting the response rate guideline also decreased from over
1400 in 2002, to just 1100 in 2004. One positive observation when comparing samples from
the 2002 and 2004 NCTWCS is the fact that all public school districts in the state of North
Carolina are represented in the 2004 NCTWCS sample, whereas two districts did not meet
the response rate criteria to be included in the 2002 sample for final data analysis.
In an effort to improve reliability of data analyzed for the 2004 NCTWCS, Hirsch
(2005b) completed a factor analysis:
to ensure that the survey was well constructed” and to “create domain averages that included only questions that truly explained the working conditions area described. (p. 2)
Hirsch also administered a “stakeholder survey” which consisted of 30 teachers,
administrators, and policymakers to make sure the most important questions for gathering
teacher data were not eliminated by the factor analysis (p. 2).

105
Hirsch (2005b) summarized the major findings from the SECTQ’s data analysis of
the 2004 NCTWCS sharing that
1. Teachers’ working conditions are significant and strong predictors
of student achievement and teacher retention.
2. Leadership is critical to improving working conditions, but
principals and teachers perceive these conditions very differently.
3. Teachers are generally satisfied with their working conditions and,
since 2002, their views about them are improving across North
Carolina.
4. Teachers, regardless of their background and experience, view
working conditions similarly. (SECTQ, 2004)
Hirsch also discussed the correlations between teachers’ perceptions of working conditions
as reported in the 2004 NCTWCS and overall school academic achievement. Hirsch noted
that “time is the only working condition that is not connected to student achievement when
examining basic correlations” (p. 5).
Hirsch (2005b) found school characteristics to be “significant and powerful
predictors” of teachers’ perceptions of all working conditions domains but time (p.vii). In
fact, “high performance was actually more likely to occur in schools where teachers held
more negative perceptions about their time” (p. 8). School characteristics variables used in
this study were AYP status, ABC status, and ABC growth. The correlation between school
context (as determined by AYP status, ABC status, and ABC growth) and teachers’
perceptions of working conditions leads this researcher to classify school context variables as
co-variates in the methodology for this research project.

106
Hirsch (2005b) discussed several additional pertinent findings throughout his final
report on the 2004 NCTWCS. Hirsch noticed “more positive perceptions in higher
performing schools were found in all domains, except time” (p. 5). Hirsch explained that
differences between higher performing and lower performing schools were all significant,
with the largest differences occurring in the leadership domain. When examining the
relationship between grade configuration and the five working condition domains,
“professional development was by far the greatest predictor of ABC status at the middle
school level” (p. 7).
Hirsch (2005b) also examined the relationship between teachers’ perceptions of their
working conditions and teacher retention. Hirsch noted “there are significant connections
between four out of the five working conditions and teacher retention” (p. 9). Time was the
only teacher working condition domain where there was not a significant relationship with
teacher retention. Hirsch also pointed out that schools with a higher number of low-income
and minority students had higher attrition rates. It was also discovered that these schools had
greater percentages of teachers with less advanced educational backgrounds. Several
questions in the demographic portion of the 2004 NCTWCS gather information on teachers’
educational backgrounds. Another working condition domain, professional development,
exhibited a significant statistical relationship with teacher retention at the elementary level.
However, “only four percent of teachers identified professional development as the working
condition that would most guide their employment decision” (p. 11).
An overarching trend recognized by Hirsch (2005b) within the data gathered from the
2004 NCTWCS is that despite teachers’ demographic differences, teachers view working
conditions similarly in public schools across the state of North Carolina. Teacher
107
demographic variables such as race, gender, highest degree earned, and means of preparation
“do not appear to affect teachers’ perceptions of any working conditions domain” (p. 12-13).
Nevertheless, this researcher will control for these teacher demographic variables when
analyzing the data for the 2006 NCTWCS. Teacher demographic variables “also did not
affect overall satisfaction with their school or the aspects of working conditions they believed
to be most important in retaining teachers and improving student learning” (p. 13).
The most relevant finding from the 2004 NCTWCS for this research study, however,
may be that the school level that teachers work in does affect teachers’ perceptions of
working conditions. Hirsch (2005b) found that elementary teachers had more positive
perceptions of teacher working conditions than both middle and secondary school teachers.
Hirsch attributed the differences in teachers’ perceptions of working conditions across school
levels partially to disparities found in teachers’ responses to questions in the professional
development domain. Elementary teachers in general reported higher overall satisfaction
with professional development than did middle and secondary teachers. The applicability of
importance of school level to teachers’ perceptions of working conditions leads this
researcher to expand on the analysis of the relationship between school level and teachers’
perceptions of working conditions in this research study. Hence, this researcher compared
K-8 to middle school teachers’ perceptions of working conditions using data from the 2006
NCTWCS.
A final finding of importance from the 2004 NCTWCS is the interconnectedness of
teacher working condition domains. Hirsch (2005b) found that all working condition
domains are “positively and significantly correlated with each other” (p. 13). The two
working condition domain correlations that Hirsch recognized as the strongest were
108
leadership and professional development, and leadership and empowerment. Hirsch
emphasized the importance of looking at correlations and the interconnectedness between
variables because of the difficulties that could result when one attempts to address one
working condition domain within a school despite the significant interconnectedness of the
five working condition domains.
2004 South Carolina Teacher Working Conditions Survey
The state of South Carolina conducted the first administration of the South Carolina
Teacher Working Conditions Survey (SCTWCS) in the spring of 2004. The SCTWCS was
created along the same lines as the NCTWCS, which first began in 2002. The 2004 South
Carolina Teacher Working Conditions Initiative established teacher working conditions as an
area for increased research focus in order to examine the effect of teachers’ perceptions of
working conditions on teacher retention and ultimately student achievement. The state of
South Carolina adopted, in partnership with the state of North Carolina and the SECTQ, the
2004 NCTWCS and administered online to all licensed, public educators in South Carolina
public schools in the spring of 2004 with several modifications to best address the contextual
circumstances found in South Carolina public schools. One modification resulted in several
questions from the 2004 NCTWCS being dropped from the 2004 SCTWCS version and
replaced with more pertinent questions of greater interest to the state of South Carolina.
Administrators were given a separate survey to clarify the importance of their assessment of
teachers’ perceptions of working conditions, not their assessment of their own working
conditions. Finally, an additional teacher working condition domain, teacher induction and
mentoring, was added to the 2004 SCTWCS. In this domain, teachers in their first three
109
years were asked their perception of the mentoring they had received, while mentors were
asked questions pertaining to the quality of mentoring they had provided to new teachers.
Hirsch (2005a) shared that the sample for the 2004 SCTWCS included 15,202
teachers from 90 percent of the state’s public schools representing all public school districts.
A response rate requirement of 28% had to be met by a school’s teachers for a school’s
results to be included in the final report for the 2004 SCTWCS. Twenty-eight percent was
chosen because this number represented the state school response rate average. A total of
519 schools were included in the final sample for the 2004 SCTWCS. Hirsch noted “schools
included in the analysis serve a slightly more diverse and higher poverty group of students
than the student population in the rest of the state” (p. 3). However, Hirsch recognized that
“teacher characteristics within the schools are similar, including education, salary, and
proportion of qualified teachers” (p. 3).
One finding that Hirsch (2005a) elaborated on was the determination that “teacher
working conditions are important predictions of student performance” (p. 6). Hirsch first
analyzed this relationship from the perspective of schools that made AYP. Hirsch found that
“for all working condition domains, there was a statistically significant difference in the
school average” (p. 3). The highest difference was found in the teacher empowerment
domain, which was selected by teachers as the most important domain for improving student
learning. Hirsch also identified school characteristic variables that may be correlated to AYP
status according to the 2004 SCTWCS. Hirsch noted that “schools that made AYP had a
smaller proportion of emergency certified teachers and a smaller minority population” than
schools that did not make AYP (p. 6). The teacher working condition domain of
110
empowerment was also found to be a significant predictor of AYP status for South Carolina
schools.
The state of South Carolina also compared teachers’ perceptions of working
conditions to state accountability standards for schools set by the state of South Carolina.
These state accountability standards included below average to unsatisfactory, average, and
good to excellent. Hirsch (2005a) found large differences in the domain averages between
schools rated good to excellent as opposed to average and below average to unsatisfactory.
Findings also indicated that all working condition domain average were higher in schools
with higher accountability ratings. Differences in working condition domain averages were
not as great between schools with different accountability ratings in the domains of time and
professional development. School accountability ratings were also found to be statistically
significant. Nevertheless, these differences “do not appear to be highly correlated with
working conditions and many other characteristics” (p. 8).
The state of South Carolina assesses school improvement using students’ scores on
the Palmetto Achievement Challenge Test (PACT) to assign improvement ratings for each
individual school. Hirsch (2005a) acknowledged that “professional development was by far
the greatest predictor of improvement status at the middle school level” (p. 9). Data also
indicated that “leadership had a significant and positive impact on student performance” (p.
9). Converse to findings of the 2002 and 2004 NCTWCS and the importance of leadership to
student academic achievement, the SCTWCS found that schools where teachers perceived
leadership more negatively actually correlated in higher performance on two of the academic
accountability measures in the state of South Carolina. Nevertheless, leadership did have a
significant impact on accountability ratings for schools in South Carolina.
111
The second major finding from the 2004 SCTWCS which Hirsch (2005a) expanded
on was that teachers’ perceptions of working conditions do affect teacher retention. Hirsch
found that correlations were statistically significant between the teacher working conditions
domains of leadership, empowerment, and facilities and resources and teacher retention.
Hirsch acknowledged that “higher attrition rates are most strongly correlated with average
teacher salary and the proportion of under prepared teachers” (p. 11). Teachers’ perceptions
of leadership and time were also correlated to teacher retention. Hirsch explained that
“greater agreement (higher satisfaction levels) with the leadership questions on the survey
had a significant impact on teacher retention in South Carolina schools” (p. 12). In fact, 25%
of teachers in the sample for the 2004 SCTWCS listed leadership as the most important
working condition domain affecting their decision to remain at their current school.
According to Hirsch (2005a), a unique finding from the administration of the 2004
SCTWCS was that “limited differences” existed between teachers’ and principals’
perceptions of teacher working conditions (p. 13). This is the exact opposite of the findings
from the 2002 and 2004 administrations of the NCTWCS, where average principals’
perceptions were always higher than teachers’ perceptions of working conditions for all
domains.
Hirsch (2005a) also looked at the relationship between teacher demographics and
teachers’ perceptions of working conditions on the 2004 SCTWCS. Hirsch discovered that:
race, gender, highest degree earned, means of preparation, and National Board Certification status do not appear to affect teacher perceptions of any working condition domain at meaningful levels. (p. 14).
However, just as the findings from the 2002 and 2004 administrations of the NCTWCS
indicated, “the school level in which they teach does” (p. 14). Elementary teachers also were
112
more positive with their working conditions than middle and secondary teachers according to
the 2004 SCTWCS.
Finally, results from the 2004 SCTWCS reinforced the notion that all teacher working
condition domains are interconnected, which was previously indicated by the 2002 and 2004
NCTWCS. Hirsch (2005a) pointed out that all teacher working condition domains are
“positively and significantly correlated with one another” (p. 15). Of the teacher working
condition domains, leadership and empowerment had the strongest positive correlations.
Two additional pairs of working condition domains, professional development and
empowerment as well as professional development and leadership, are also strongly
correlated.
2006 North Carolina Teacher Working Conditions Survey
The 2006 NCTWCS was conducted in the fall of 2006 as a follow-up to the two prior
administrations of the NCTWCS in 2002 and 2004. The 2006 NCTWCS was the second
administration of the online version of the NCTWCS, which had been implemented for
administration of the 2004 NCTWCS. According to Hirsch (2007b), 66 percent of licensed
educators in North Carolina public schools completed the voluntary 2006 NCTWCS. The
number of survey responses rose to over 75,000 for the 2006 NCTWCS compared to the
previous high number of responses of nearly 42,000 for the 2002 NCTWCS, the first
NCTWCS. Hence, survey responses nearly doubled for the 2006 NCTWCS compared to the
previous high. The minimum response rate of 40% was reached by 1,985 schools which
included over 85% of the state’s public schools. The total number of schools included in the
sample for the 2006 NCTWCS declined from a previous maximum percentage of 90% in
each of the first two administrations of the NCTWCS.

113
Hirsch (2007b) confirmed that there are significant differences in working condition
average scores at all school levels in the teacher working condition domains: empowerment,
leadership, and facilities and resources. However, when looking at teachers’ perceptions of
working conditions at schools categorized by academic performance levels, there are “few
differences” in the working condition average scores for time and professional development
when looking at the highest and lowest performing schools in the state (p. 4).
Hirsch (2007b) correlated student achievement as measured by the North Carolina
performance composite (the percentage at or above Level III/proficient) with teachers’
perceptions for each of the five teacher working conditions domains. From these correlations
it was found that time was “only weakly correlated with the performance composite at the
elementary and middle schools levels,” even though teachers listed time most frequently as
the domain most critical to improving student academic achievement (p. 8). Facilities and
resources, leadership and empowerment were all significantly correlated to student
achievement across all school levels: elementary, middle, and high school.
Hirsch (2007b) also recognized the correlation of several student characteristic
variables with student achievement. The student characteristic that was most highly
correlated with student achievement was the percentage of students eligible for free and
reduced lunch. The proportion of students eligible for free and reduced lunch, along with the
proportion of English Language Learners served in a school, were also significantly and
negatively correlated to student achievement.
Several teacher demographic variables were also correlated to student achievement
according to the 2006 NCTWCS data. Significant negative correlations were found between
the percentage of Lateral Entry Licensed teachers and novice teachers and student
114
achievement. However, Hirsch (2007b) suggested that “more investigation needs to be done
on the correlations related to teacher race to better understand how other variables are
influencing this connection with student achievement” (p. 8).
Hirsch (2007b) used statistical modeling in an attempt to control for the variance as a
result of co-variate effects on student achievement. Ordinary Least Squares (OLS)
regression was chosen as the statistical method to control for variance caused by co-variates.
Numerous co-variates were selected and controlled for when running OLS regression from
the independent variables of working conditions domain questions, teacher demographics,
student variables, and school characteristics. The dependent variable for the OLS regression
models was student achievement.
When looking at the effects of teacher working condition domain questions on
student achievement, Hirsch (2007b) recognized “strong connections” and “multicolinearity”
of working condition domain variables. Hirsch stated that “the correlation between working
condition domains ranged from a low of .540 between facilities and resources to a high of
.913 between empowerment and leadership” (p. 10). The multicolinearity of working
condition domains, according to Hirsch, “makes it difficult to find significant connection as
the variables often weaken each other in the model” (p. 10). It was also noted that the order
in which variables were entered into the OLS regression equation affects the amount of
variance attributed to a particular co-variate.
Hirsch (2007b) also analyzed the effects of co-variates on academic achievement by
school level. Hirsch explained that the complexity of schools often limits the variance
attributed to a single independent variable on student achievement. This will also be the case
when this researcher looks at the variance explained by independent variables on teachers’

115
perceptions of working conditions. At the elementary school level, Hirsch found that OLS
explained 68 % of the variance in school level achievement. Working condition domains
accounted for 19 % of the variance in school level achievement. Variance attributed to
poverty as measured by students eligible for free and reduced lunch only accounted for 3% of
the total variance in student achievement at the elementary school level. Hirsch also
discovered that student characteristics are more influential to student achievement on end-of-
grade tests than working condition domains. Hirsch indicated, “student variables explained
at least one-quarter (27 percent) of the difference in achievement across the schools (and as
much as 62 percent)” (p. 11). According to Hirsch, teacher demographic variables explained
the second greatest amount of variance by contributing to 22 percent of the variance in
achievement. However, the only teacher demographic variable that was found to be
statistically significant in relation to student achievement at the school level was teacher
turnover.
When looking at academic growth at the elementary level as measured by growth
distinctions determined by the ABCs of Public Education for the state of North Carolina,
Hirsch (2007b) found that “the strongest predictor of elementary academic growth was the
proportion of Limited English Proficient (LEP) students” (p.11). The proportion of LEP
students in an elementary school was not statistically significant, however. Working
conditions variables, on the other hand, were stronger predictors than the proportion of
economically disadvantaged students, novice teachers, or teachers on lateral entry of student
academic achievement at the elementary level.
At the middle school level, 68% of the variance was explained by the OLS
statistical model. Working condition domains explained 20% of the variance on student
116
academic achievement at the middle school level. Teacher demographics explained the
greatest amount of variance on student academic achievement at the middle school level.
Thirty-two percent of the variance was attributed to working condition domains. Hirsch
(2007b) noted that “the proportion of white and female teachers was statistically significant”
(p. 12). School characteristics, however, explained very little variance in student academic
achievement at the middle school level. Hirsch pointed out larger middle schools had greater
academic achievement than smaller middle schools. Larger schools were categorized as
schools with more than 1,100 students enrolled, whereas smaller schools enrolled less than
400 students. The number of students eligible for free and reduced lunch and the number of
LEP students “were statistically and negatively connected to achievement” (p. 12).
When looking at middle school academic growth, Hirsch (2007b) shared, “working
conditions were the strongest predictors of middle schools meeting or exceeding growth
expectations” (p. 12). Hirsch found that “the percentage of high poverty students, white
teachers and school size (larger than 800) all affect the probability of meeting or exceeding
growth targets at the middle school level” (p. 12).
Hirsch (2007b) also looked at the effect of teachers’ perceptions of working
conditions on teacher retention. According to data gathered from the 2006 NCTWCS, Hirsch
stated that 78 percent of teachers, nearly 60,000 educators, felt their school was a good place
to work and learn. 2006 NCTWCS data also revealed that 87 percent of teachers want to
remain teaching in their school. Only 5 percent of teachers indicated they wanted to leave
teachers altogether, whereas 8 percent wished to look for a teaching job at another school.
Hirsch elaborated on the overall effect of teacher working conditions on teacher retention by
stating,
117
Evidence throughout the survey indicates that teachers with positive perceptions about their working conditions are much more likely to stay at their current school than educators who are more negative about their conditions of work, particularly in the areas of leadership and empowerment. (p. 14).
Teachers were asked in the 2006 NCTWCS which working conditions most influenced their
retention decisions. Leadership was the working condition domain identified most by
teachers as 38 percent chose it as the most important working condition domain affecting
their retention decisions. Professional development was identified as least important to
retention decisions as it was chosen by only five percent of teachers. Nevertheless, Hirsch
noted that “all working conditions were significantly correlated with teachers’ future
employment plans” (p.15). In elementary and middle schools, leadership and empowerment
had the strongest correlations with teachers’ retention decisions.
According to Hirsch (2007b), the 2006 NCTWCS revealed that teachers and
administrators continued to view working conditions differently as they had previously in
2002 and 2004. On all survey questions principals responded with more positive perceptions
of working conditions when compared to teachers. Differences in principals’ perceptions
were greatest in the teacher working conditions domain of time where mean domain scores
differed by over one point on a five-point Likert scale. There were also large differences
(over .9) between teachers and principals in the leadership and empowerment domains.
Teacher demographics, as in 2002 and 2004, failed to make a significant difference in
teachers’ perceptions of working conditions. Hirsch (2007b) stated that gender, education,
race, ethnicity, and route into the profession do not significantly affect teachers’ perceptions
of working conditions. Years in the school and years in the profession are two variables
where there are “slight differences” in teachers’ perceptions of working conditions (p. 24).

118
Teachers in their first three years in the teaching profession as well as teachers with greater
than 20 years of experience “are slightly more positive” abut working conditions in all five
domains.
Student demographics affected teachers’ perceptions of working conditions in some
teacher working conditions domains. However, when looking at averages for all teacher
working conditions domains for schools serving different proportions of students eligible for
free and reduced lunch, findings are inconsistent and do not allow for broad generalizations
to be made.
School level was a factor that affected teachers’ perceptions of working conditions
according to the 2006 NCTWCS. Hirsch (2007b) noted that “there are differences in the
perceptions of working conditions across different school types” (p. 24). Elementary
teachers, as was the case in 2002 and 2004, held more positive perceptions of teacher
working conditions in most domains and for a majority of survey questions. Empowerment
and leadership are two working condition domains in particular that elementary teachers
view more positively than their peers in different school levels. Time remained as the only
domain where elementary teachers collectively do not hold the highest perceptions. The
domain with the greatest difference in elementary teachers’ perceptions of working
conditions between elementary and middle school teachers was leadership. However, it
should be noted that the difference between perceptions in the leadership domain for
elementary and middle school teachers is still relatively small (only .21 on a 5-point Likert
scale).
When comparing results from the 2006 NCTWCS to results from previous
administrations of the NCTWCS, Hirsch (2007b) declared “it is clear that educators were
119
more positive about many aspects of their conditions of work than in 2004” (p. 22).
Following the administration of the 2006 NCTWCS the working conditions survey data was
compared to working conditions survey data from other states for the first time. Beginning in
2004 and continuing in 2006, several other states (South Carolina, 2004; Arizona, Ohio,
Kansas, 2006; Clark County, Nevada, 2006) administered modified versions of the
NCTWCS in their states to assess teachers’ and administrators’ perceptions of working
conditions. When comparing the 2006 NCTWCS to recent working conditions survey results
in other states, Hirsch (2007b) affirmed that “on most questions on the survey, teachers in
North Carolina noted more positive working conditions” (p. 22).
The Future of the NCTWCS and Working Condition Surveys
It appears that the NCTWCS is a permanent fixture that will be used to assess
teachers’ and administrators’ perceptions of working conditions for years to come. Hirsch
(2007b) shared that the state of North Carolina has agreed to set aside funding for
administration of the survey every two years and created the North Carolina Teacher
Working Conditions Advisory Board to oversee the modification and administration
processes. A higher level of principal leadership has also been incorporated into the
principal training and evaluation process to force principals to take serious findings from the
NCTWCS. Hirsch confirmed that “the state has rewritten principal standards to incorporate
teacher recruitment, retention, and administration” (p. 42). Finally, the state of North
Carolina has established partnerships with businesses, organizations, and universities in an
on-going effort to raise funds for continuous analysis of teacher working conditions survey
data to aid low-performing schools and districts across the state.
120
Hirsch (2007b) recognized the increased popularity of teacher working conditions
surveys in other states modeled after the NCTWCS and the NCTWCS Initiative. Ohio,
South Carolina, Clark County Schools in Las Vegas, Nevada, Kansas, and Arizona (Berry &
Fuller with Williams & Lobacz , 2007; Hirsch, 2005; Hirsch & Emerick with Church &
Fuller, 2006b; 2006c; 2007a) have administered modified versions of the NCTWCS in their
state or city public schools since 2006 and plan to continue administering teacher working
condition surveys in their public schools in the future. North Carolina emerged as the leader
in the teacher working condition survey movement in 2001-02. With expertise provided by
the CTQ in analyzing teacher working condition survey data and in modifying the NCTWCS
for future administrations, North Carolina will continue to propose the importance of
assessing teacher working conditions to other states and the need for them to adopt modified
versions of the NCTWCS to administer in their public schools.

CHAPTER III
RESEARCH DESIGN
Introduction
Purpose of the Study
The purpose of this study was to examine the relationship between grade
configuration and teachers’ perceptions of working conditions in public K-8 and middle
schools in North Carolina.
Conceptual Framework
The dependent variable, teachers’ perceptions of working conditions, was measured
through teachers’ responses to domain-specific questions for each of the five teacher working
conditions survey domains. The five teacher working conditions domains included (a) time;
(b) facilities and Resources; (c) leadership; (d) teacher empowerment; and (e) professional
development, as defined in the 2006 NCTWCS. The five teacher working conditions
domains served as co-dependent variables throughout this study.
The dependent variable, teachers’ perceptions of working conditions, was identified
by Herzberg (1966) as one of several hygiene factors affecting worker dissatisfaction in his
motivational-hygiene theory of worker satisfaction and dissatisfaction. Motivational-hygiene
theory, according to Herzberg, explained “the concept that man has two sets of needs: his
need as an animal to avoid pain and his need as a human to grow psychologically” (p. 91).
122
Herzberg’s 1959 Motivation to Work study included “two hundred engineers and accountants
who represented a cross-section of Pittsburgh industry” (p. 91). The purpose of the
Motivation to Work study was to gather data from workers “about events they had
experienced at work which either had resulted in a marked improvement in their job
satisfaction or had led to a marked reduction in job satisfaction” (p. 91).
Multiple one-on-one interview sessions with study participants revealed two distinct
types of factors that influenced worker satisfaction and dissatisfaction. Herzberg (1966)
referred to these factors as “motivational” (also referred to as “satisfiers”) and “hygiene”
(also referred to as “dissatisfiers”) factors. Herzberg explained that motivational factors or
“satisfiers,” are the “strong determiners of job satisfaction” (p. 92). Herzberg explained that
satisfiers “are effective in motivating the individual to superior performance and effort” (p.
94). Motivational factors acknowledged by Herzberg over the course of The Motivation to
Work study which should lead to worker satisfaction were “achievement, recognition, work
itself, responsibility, and advancement” (p. 92).
Contrastingly, Herzberg (1966) defined hygiene factors or “dissatisfiers,” as factors
that “served only to bring about job dissatisfaction and were rarely involved in events that led
to positive job attitudes” (p. 92-93). Furthermore, hygiene factors “essentially describe the
environment and serve primarily to prevent job dissatisfaction, while having little effect on
positive job attitudes” (p. 94). Hygiene factors acknowledged by Herzberg throughout the
course of The Motivation to Work study which often led to worker dissatisfaction included
“company policy and administration, supervision, salary, interpersonal relations, and
working conditions” (p. 94).

123
Herzberg’s identification of working conditions as one of several factors potentially
affecting worker dissatisfaction, along with the presence of the accessible, secondary data set
from the 2006 NCTWCS, led this researcher to designate the hygiene factor, working
conditions, as the dependent variable for more extensive research in this study. This
researcher analyzed the hygiene factor, working conditions, through the lens of Herzberg’s
motivational-hygiene theory of worker satisfaction, with a specific focus on the worker
dissatisfaction component, or hygiene lens. The conceptual framework for this study also
incorporated the conceptual framework of the 2006 NCTWCS, which identified and focused
on the five teacher working conditions domains, or co-dependent variables measured in the
2006 NCTWCS. Whereas Herzberg looked at both the motivational and hygiene factors
affecting worker satisfaction and dissatisfaction, this study focused on the hygiene factor,
working conditions, for public K-8 and middle school teachers’ responses to the 2006
NCTWCS. This researcher tested the major research hypothesis that public, K-8 school
teachers will report greater satisfaction with working conditions in K-8 schools than public
middle school teachers in middle schools in the state of North Carolina as measured by the
2006 NCTWCS.
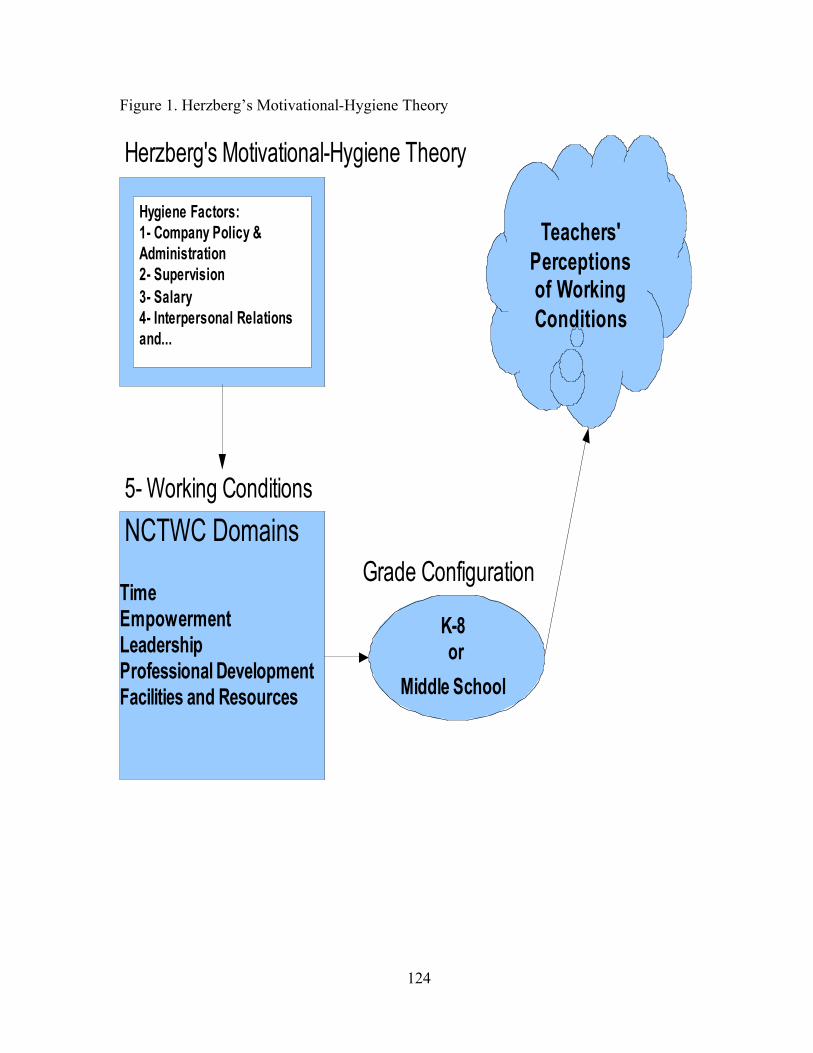
124
Figure 1. Herzberg’s Motivational-Hygiene Theory
Herzberg's Motivational-Hygiene Theory
Hygiene Factors:
1- Company Policy &
Administration
2- Supervision
3- Salary
4- Interpersonal Relations
and...
Time EmpowermentLeadershipProfessional DevelopmentFacilities and Resources
NCTWC Domains
5- Working Conditions
Grade Configuration
K-8 or
Middle School
Teachers'
Perceptions of Working
Conditions
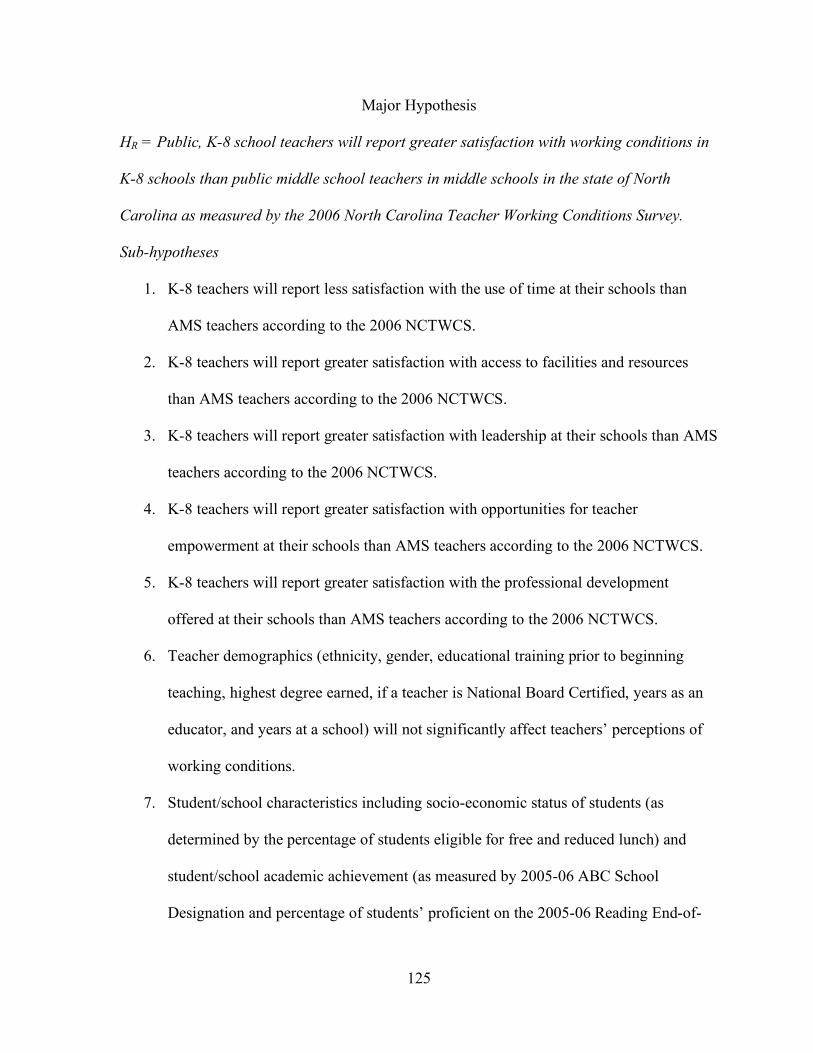
125
Major Hypothesis
HR = Public, K-8 school teachers will report greater satisfaction with working conditions in
K-8 schools than public middle school teachers in middle schools in the state of North
Carolina as measured by the 2006 North Carolina Teacher Working Conditions Survey.
Sub-hypotheses
1. K-8 teachers will report less satisfaction with the use of time at their schools than
AMS teachers according to the 2006 NCTWCS.
2. K-8 teachers will report greater satisfaction with access to facilities and resources
than AMS teachers according to the 2006 NCTWCS.
3. K-8 teachers will report greater satisfaction with leadership at their schools than AMS
teachers according to the 2006 NCTWCS.
4. K-8 teachers will report greater satisfaction with opportunities for teacher
empowerment at their schools than AMS teachers according to the 2006 NCTWCS.
5. K-8 teachers will report greater satisfaction with the professional development
offered at their schools than AMS teachers according to the 2006 NCTWCS.
6. Teacher demographics (ethnicity, gender, educational training prior to beginning
teaching, highest degree earned, if a teacher is National Board Certified, years as an
educator, and years at a school) will not significantly affect teachers’ perceptions of
working conditions.
7. Student/school characteristics including socio-economic status of students (as
determined by the percentage of students eligible for free and reduced lunch) and
student/school academic achievement (as measured by 2005-06 ABC School
Designation and percentage of students’ proficient on the 2005-06 Reading End-of-

126
Grade test) will significantly affect teachers’ perceptions of all teacher working
conditions domains except time.
Rationale for Use of Quasi-Experimental, Non-Equivalent Control Group Design and
Quantitative Approach
A quasi-experimental, non-equivalent control group design was established as
described by Campbell and Stanley (1963) for the purposes of examining the effects of grade
configuration on teachers’ perceptions of working conditions in public K-8 and middle
schools in North Carolina. According to Campbell and Stanley, quasi-experimental, non-
equivalent control group designs are used in
social settings in which the research person can introduce something like experimental design into his scheduling of data collection procedures even though he lacks the full control over the scheduling of experimental stimuli which makes a true experiment possible. (p. 204)
The nonequivalent control group design was chosen by this researcher since the control
group (middle schools) and the treatment group (K-8 schools) did not have what Campbell
and Stanley referred to as “pre-experimental sampling equivalence” (p. 217). Instead of
“pre-experimental sampling equivalence,” Campbell and Stanley explained that the groups
within a nonequivalent control group design represent “naturally assembled collectives such
as classrooms” (p. 217). The “naturally assembled collectives” that made up this study’s
control and treatment groups are public K-8 and middle schools in North Carolina.
The presence of an accessible, secondary, quantitative data set was one of the
determining factors in selecting a quantitative approach for this study. The North Carolina
Center for Teaching Quality (CTQ), created and funded by North Carolina Governor Mike
Easley, has conducted three prior NCTWCSs, which gathered quantitative data from a survey
which measured responses using a Likert scale format. Administrations of the NCTWCS

127
were conducted in: 2002, 2004, and most recently in 2006. The 2006 NCTWCS data set
were used for the purpose of analyzing teachers’ perceptions of teacher working conditions
domains in K-8 schools and middle schools for this study.
A second reason this researcher chose a quantitative approach was that using this
secondary data set removed any potential restrictions that might have been encountered from
teachers, administrators, or host school districts if primary research had been conducted with
sample participants. Furthermore, a significant amount of time and money was saved since
the pre-existing survey and its corresponding secondary data set was easily accessible and
did not have to be created, pilot tested, and administered within schools or school districts.
The final reason a quantitative approach was selected by this researcher for analyzing
the 2006 NCTWCS secondary data set by school type for K-8 and middle school teachers
was due to the increasing number of replications of the NCTWCS in other states and large
cities across the country. Since the first administration of the NCTWCS in 2002, other states
and large cities, in partnership with CTQ, have administered modified versions of the
NCTWCS in their state and city school districts. Locations where modified versions of the
NCTWCS have been administered include Arizona, Georgia, Kansas, Ohio, South Carolina
and Clark County Schools in Las Vegas, Nevada (Center for Teaching Quality).
Replications of the NCTWCS and its modified versions in other states have improved the
reliability of survey questions which make up the teacher working conditions domain
subscales. Improved reliability has resulted in potential rival hypotheses being displaced as
potential explanations for teachers’ responses to survey questions which could have affected
the calculations of teacher working conditions domain subscale means.

128
Site Selection and Participants
Steps to Access the 2006 North Carolina Teacher Working Conditions Survey Secondary
Data Set
Beginning in the winter of 2007, several steps were taken to obtain access to the pre-
existing data set from the 2006 NCTWCS. Scott Emerick, Policy and Communications
Associate at the CTQ in Chapel Hill, North Carolina was contacted via email and asked how
this researcher might obtain permission to access the 2006 NCTWCS pre-existing data set.
Mr. Emerick’s response to this email provided me with additional contact information on
how to request permission to access the 2006 NCTWCS data set. Mr. Emerick forwarded
this researcher’s email and his response at this researcher’s request to Ann McArthur,
Teacher Advisor to Governor Mike Easley, in the Office of the Governor for the State of
North Carolina, and Ms. Carolyn McKinney, Director of the North Carolina Professional
Teaching Standards Commission. Mr. Emerick stated it was within these two offices that
permission to access the 2006 NCTWCS pre-existing data set would be granted.
Shortly thereafter, Ms. Connie Barbour from the North Carolina Department of
Public Instruction emailed this researcher with additional information on the steps that would
need to be taken to request and receive permission to access the 2006 NCTWCS data set.
Barbour shared that a written request describing the intended use of this data must be
submitted to Ms. McKinney within the North Carolina Professional Teaching Standards
Commission. This researcher was informed that requests must be made at least five business
days prior to the release of the 2006 NCTWCS data set before the release of the data set
could be granted.
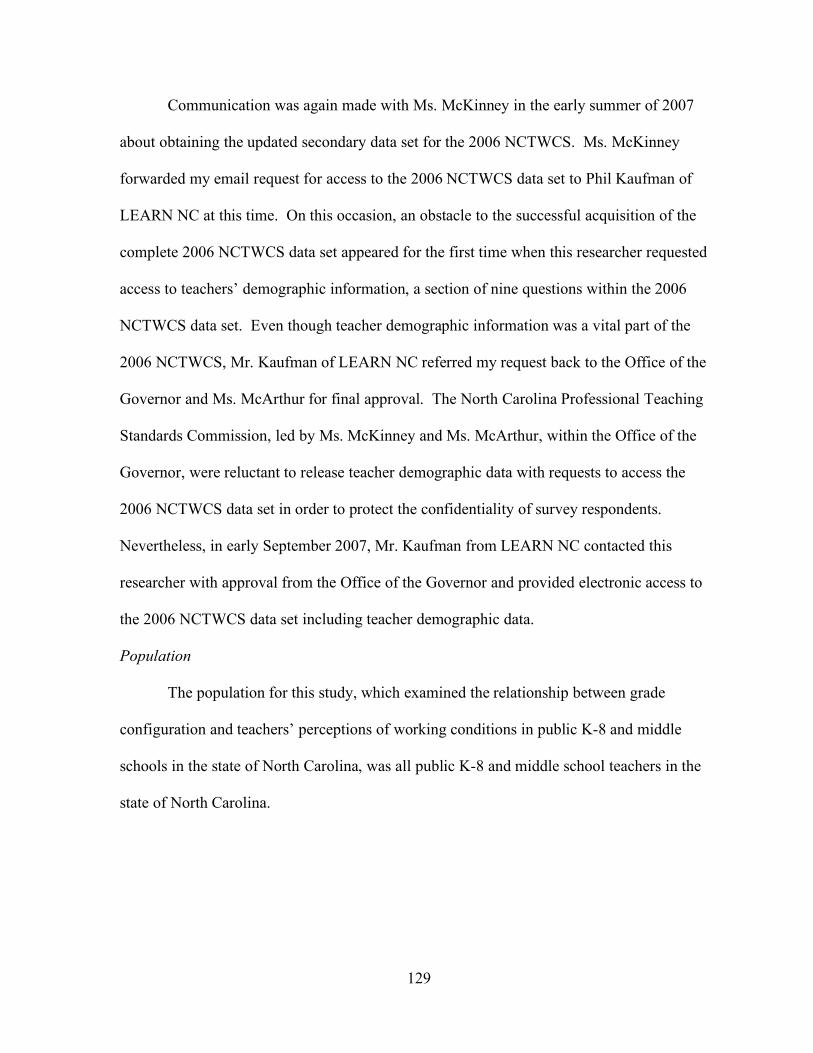
129
Communication was again made with Ms. McKinney in the early summer of 2007
about obtaining the updated secondary data set for the 2006 NCTWCS. Ms. McKinney
forwarded my email request for access to the 2006 NCTWCS data set to Phil Kaufman of
LEARN NC at this time. On this occasion, an obstacle to the successful acquisition of the
complete 2006 NCTWCS data set appeared for the first time when this researcher requested
access to teachers’ demographic information, a section of nine questions within the 2006
NCTWCS data set. Even though teacher demographic information was a vital part of the
2006 NCTWCS, Mr. Kaufman of LEARN NC referred my request back to the Office of the
Governor and Ms. McArthur for final approval. The North Carolina Professional Teaching
Standards Commission, led by Ms. McKinney and Ms. McArthur, within the Office of the
Governor, were reluctant to release teacher demographic data with requests to access the
2006 NCTWCS data set in order to protect the confidentiality of survey respondents.
Nevertheless, in early September 2007, Mr. Kaufman from LEARN NC contacted this
researcher with approval from the Office of the Governor and provided electronic access to
the 2006 NCTWCS data set including teacher demographic data.
Population
The population for this study, which examined the relationship between grade
configuration and teachers’ perceptions of working conditions in public K-8 and middle
schools in the state of North Carolina, was all public K-8 and middle school teachers in the
state of North Carolina.
130
Sample Size and Rationale for Choice of Sample
The sample for this study was selected from the 75,000 licensed, public school
educators (teachers, school administrators, and other licensed educators) in the state of North
Carolina that completed the 2006 NCTWCS. The sample for the 2006 NCTWCS included
66% of the public school teachers in the state of North Carolina. A response rate of 40% had
to be met by teachers and licensed educators at each school in order for a school’s responses
to be included in the final sample and data analysis for the 2006 NCTWCS. Only two school
districts in North Carolina failed to meet the 40% response rate required to be included in the
sample for the first data analysis of the 2006 NCTWCS. In the end, 85% of the public
schools in the state of North Carolina met the 40% response rate requirement to be included
in the final sample for the first analysis of data for the 2006 NCTWCS (Center for Teaching
Quality).
One must take into account when considering the 40% response rate requirement that
had to be met a school’s teachers and licensed educators to be included in the final sample
for data analysis for the 2006 NCTWCS that one school’s 40% minimum sample may be
totally different from another school’s 40% minimum sample. It could be that teachers who
responded to the 2006 NCTWCS at schools meeting the 40% response rate requirement were
from opposite extremes along the scale rating teachers’ perceptions of working conditions.
Teachers included within the 40% minimum response rate sample at one school might have
held extremely negative perceptions of working conditions, whereas teachers at another
school might have held extremely positive perceptions of working conditions. Indirect
administrative influence may have played a factor in which teachers within a school chose to
complete the 2006 NCTWCS as well. Despite the unethical nature that would have existed if
131
such undue administrative pressure was placed on certain groups of teachers to complete or
not complete the 2006 NCTWCS at their school, this factor must be recognized as a potential
variable that influenced which teachers were included within the 40% minimum response
rate sample at each school.
Teacher respondents from 72 of 80 public, non-charter, K-8 schools operating on a
traditional, ten-month calendar in the state of North Carolina were included in this study’s
sample. Teacher respondents from 331 of 380 public, non-charter, middle schools (6-8, 3-8,
4-8, 5-8) in the state of North Carolina were included in this study’s sample. Nineteen of the
49 middle schools that did not meet the 40% response rate criteria for these schools’ teachers
to be included in the sample for this study were located in two urban school districts. Six K-
8 schools in the eastern part of the state of North Carolina and two K-8 schools from the
western part of the state of North Carolina did not meet the 40% response rate criteria for
these schools’ teachers to be included in the sample for this study.
The final non-random convenience sample for this study only included public school
teachers from K-8 schools, 6-8 middle schools, and all other middle school configurations (3-
8, 4-8, 5-8) that met the response rate guidelines set by the CTQ during its administration of
the 2006 NCTWCS for the Office of the Governor of the State of North Carolina. Exact
descriptive statistics for the final sample for this study were computed using SPSS 15.0 for
Windows. Please see Table 1 for this study’s sample of public K-8, 6-8 middle, and AMS
teachers who completed the 2006 NCTWCS.
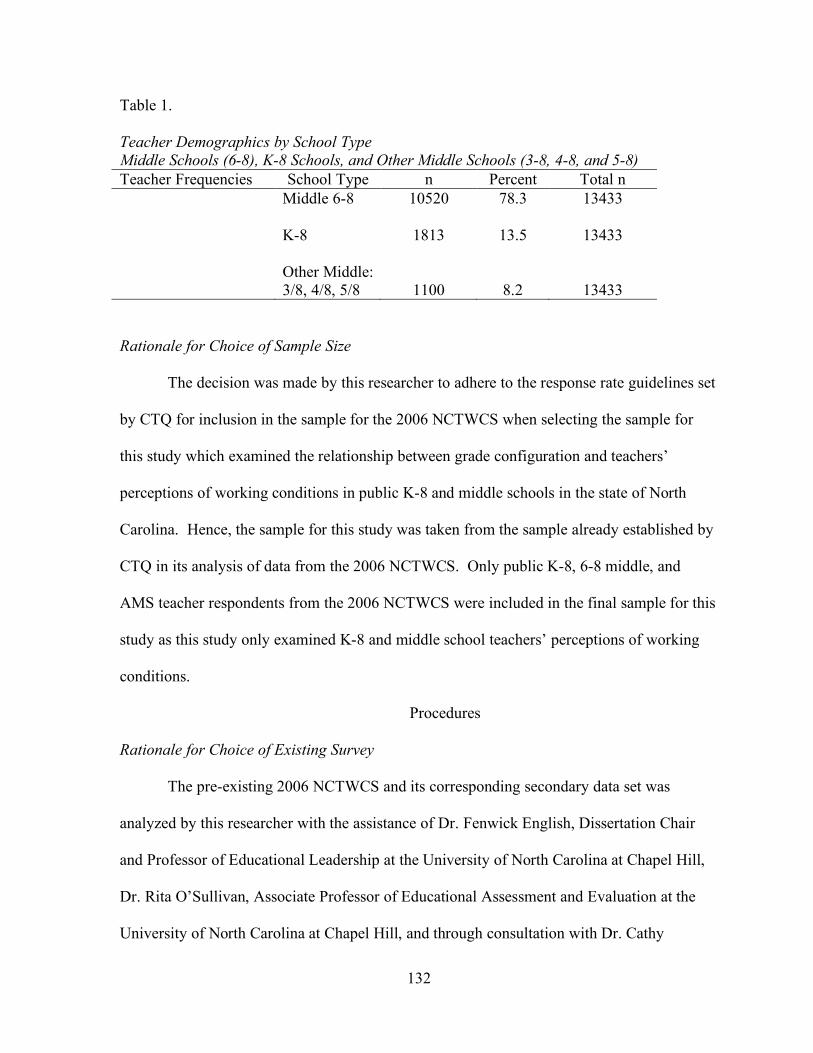
132
Table 1. Teacher Demographics by School Type Middle Schools (6-8), K-8 Schools, and Other Middle Schools (3-8, 4-8, and 5-8) Teacher Frequencies School Type n Percent Total n Middle 6-8 10520 78.3 13433
K-8
1813
13.5
13433
Other Middle: 3/8, 4/8, 5/8
1100
8.2
13433
Rationale for Choice of Sample Size
The decision was made by this researcher to adhere to the response rate guidelines set
by CTQ for inclusion in the sample for the 2006 NCTWCS when selecting the sample for
this study which examined the relationship between grade configuration and teachers’
perceptions of working conditions in public K-8 and middle schools in the state of North
Carolina. Hence, the sample for this study was taken from the sample already established by
CTQ in its analysis of data from the 2006 NCTWCS. Only public K-8, 6-8 middle, and
AMS teacher respondents from the 2006 NCTWCS were included in the final sample for this
study as this study only examined K-8 and middle school teachers’ perceptions of working
conditions.
Procedures
Rationale for Choice of Existing Survey
The pre-existing 2006 NCTWCS and its corresponding secondary data set was
analyzed by this researcher with the assistance of Dr. Fenwick English, Dissertation Chair
and Professor of Educational Leadership at the University of North Carolina at Chapel Hill,
Dr. Rita O’Sullivan, Associate Professor of Educational Assessment and Evaluation at the
University of North Carolina at Chapel Hill, and through consultation with Dr. Cathy
133
Zimmer, Statistical Analyst at The Odum Institute for Research in Social Science on the
campus of the University of North Carolina at Chapel Hill. There were several reasons this
survey and its secondary data set were chosen. The fact that this survey had been
administered and revised on three different occasions (2002, 2004, and 2006) by the CTQ for
the Office of the Governor of the State of North Carolina was a deciding factor in selecting
the 2006 NCTWCS and its secondary data set for inclusion in this study.
Another reason for the selection of the 2006 NCTWCS and its secondary data set for
this study was the population for the 2006 NCTWCS survey from its prior administrations by
the CTQ for the Office of the Governor for the State of North Carolina in part included all
public school teachers in the state of North Carolina. This survey was sent to all public
school teachers in grades kindergarten through twelfth grade at the beginning of the 2005-06
school year. Likewise, the desired sample for this study looking at teachers’ perceptions of
working conditions in public K-8 schools and middle schools in the state of North Carolina
was all public school teachers working in K-8, 6-8 middle, and AMS at the beginning of the
2005-06 school year.
Another deciding factor in the selection of the 2006 NCTWCS as the quantitative
survey instrument for this study was the conceptual framework of this particular survey.
This 2006 NCTWCS’s conceptual framework was divided into five domains in order to
specifically gather data for each of the five teacher working conditions domains: time,
facilities and resources, leadership, teacher empowerment, and professional development.
The five teacher working conditions domains and the corresponding survey questions within
each domain provided adequate data for analysis of teachers’ perceptions of working
conditions in public K-8 schools and middle schools in the state of North Carolina.

134
How Survey Is Constructed? The Conceptual Framework of the 2006 North Carolina
Teacher Working Conditions Survey
The 2006 NCTWCS was designed for completion by all public school teachers,
administrators, and licensed educators (school counselors, school psychologists, social
workers, library media specialists, etc.) who worked in public schools in the state of North
Carolina during the 2005-06 school-year. The purpose of the 2006 NCTWCS was for the
North Carolina Department of Public Instruction (the executive department most responsible
for educational policies within the North Carolina state government) to gather quantitative
data from teachers, administrators, and other licensed, school personnel on teacher working
conditions within the schools they worked via responses to the survey questions. Completion
of the 2006 NCTWCS was voluntary and confidential.
The 2006 NCTWCS included a demographics section within the survey that included
nine multiple choice questions for respondents to complete to obtain more information about
the sample for the 2006 NCTWCS. The 2006 NCTWCS was further divided into five
teacher working conditions domains for the purpose of data collection and analysis. The five
teacher working conditions domains were time, facilities and resources, leadership, teacher
empowerment, and professional development. In order to take advantage of the pre-existing
data set as a result of the previous administration of the 2006 NCTWCS, this researcher
integrated the five teacher working condition domains used in the 2006 NCTWCS into this
study’s conceptual framework since this study examined the relationship between grade
configuration and teachers’ perceptions of working conditions at public K-8 and middle
schools in the state of North Carolina. Likewise, the five teacher working condition domains
135
(time; facilities and resources; leadership; teacher empowerment; and professional
development) served as the five co-dependent variables for this study.
First, teacher working conditions domain subscale means were calculated for each
individual K-8, 6-8 middle, and AMS teacher (6-8, 3-8, 4-8, 5-8) for the five teacher working
conditions domains. Next, teacher working conditions domain subscale means were
calculated for collective groups by school type for K-8, 6-8 middle, and AMS teachers.
Questions written in a Likert scale format with the answer choices “strongly disagree,
disagree, neither agree nor disagree, agree, or strongly agree” were included in the domain
subscale mean calculations for each teacher working conditions domain (2006 NCTWCS).
The rationale for including only questions with the same Likert-scale responses was that it
would allow for the comparison of teacher working conditions domain subscale means.
The Five Teacher Working Condition Domains and Selection of Questions to be Included in
the Calculation of Domain Subscale Means
Time
The first domain of the 2006 NCTWCS contained questions designed to gather data
on teachers’ perceptions of the use of time in public schools in North Carolina. Teachers
were asked five questions about their use of time in public schools; responses were given in a
Likert scale format. Teachers were given the instructions to “Please indicate your level of
agreement with the following statements” (2006 NCTWCS). Teachers chose from the
following Likert scale responses: “strongly disagree, disagree, neither agree nor disagree,
agree, or strongly agree” for these five questions from the time domain (2006 NCTWCS).
The term “teachers” was defined throughout the 2006 NCTWCS as “a majority of teachers in
your school” (2006 NCTWCS). This researcher included each of the five questions on time

136
from this portion of the 2006 NCTWCS when computing domain subscale means which
were used to compare teachers’ perceptions of working conditions in public K-8 schools to
public middle schools in North Carolina. The Likert scale format of the responses to these
five questions on the use of time allowed for this data to be compared quantitatively. Please
see Table 2 for questions included in the calculation of time subscale means for individual
teachers and by school type.
Table 2. Time Domain Subscale Questions 2006 NCTWCS Survey Question
1
2
3
4
5
3.1a Teachers have reasonable class sizes, affording them time to meet the educational needs of all students.
Strongly Disagree
Disagree Neither Disagree Nor Agree
Agree Strongly Agree
3.1b Teachers have time available to collaborate with their colleagues.
Strongly Disagree
Disagree Neither Disagree Nor Agree
Agree Strongly Agree
3.1c Teachers are protected from duties that interfere with their essential role of educating students.
Strongly Disagree
Disagree Neither Disagree Nor Agree
Agree Strongly Agree
3.1d School leadership tries to minimize the amount of routine administrative paperwork required of teachers.
Strongly Disagree
Disagree Neither Disagree Nor Agree
Agree Strongly Agree
3.1e The non-instructional time provided for teachers in my school is sufficient.
Strongly Disagree
Disagree Neither Disagree Nor Agree
Agree Strongly Agree
NCTWCS (2006) Responses are structured in a 1 to 5 Likert scale format.

137
The next set of questions teachers were asked in the time domain in the 2006
NCTWCS consisted of responses aligned in a different Likert scale format than the first five
questions on time that were included when calculating domain subscale means for time by
school type. There were six questions in this section of the time domain for the 2006
NCTWCS. Teachers chose from the following Likert scale responses: “none, less than three
hours, more than three hours but less than or equal to five hours, more than five hours but
less than or equal to ten hours, or more than 10 hours” for these six questions from the time
domain (2006 NCTWCS). Since response choices differed for these six questions from the
first set of five questions in the time domain of the 2006 NCTWCS, this researcher decided
not to include these six questions in this study.
Facilities and Resources
The second domain of the 2006 NCTWCS focused on teachers’ perceptions of the
availability of facilities and resources for public school teachers in North Carolina. Teachers
were asked to “Please rate how strongly you agree or disagree with the following statements
about your school facilities and resources” (2006 NCTWCS). Teachers were asked eight
questions in reference to the availability of facilities and resources at their school in the
facilities and resources domain. Teachers chose from the following Likert scale responses:
“strongly disagree, disagree, neither disagree nor agree, agree, strongly agree” for these eight
questions from the facilities and resources domain (2006 NCTWCS). This researcher
included each of the eight questions on facilities and resources from this portion of the 2006
NCTWCS when calculating domain subscale means that were used to compare teachers’
perceptions of working conditions in public K-8 schools to middle schools in North Carolina.
The Likert scale format of the responses to these eight questions on facilities and resources
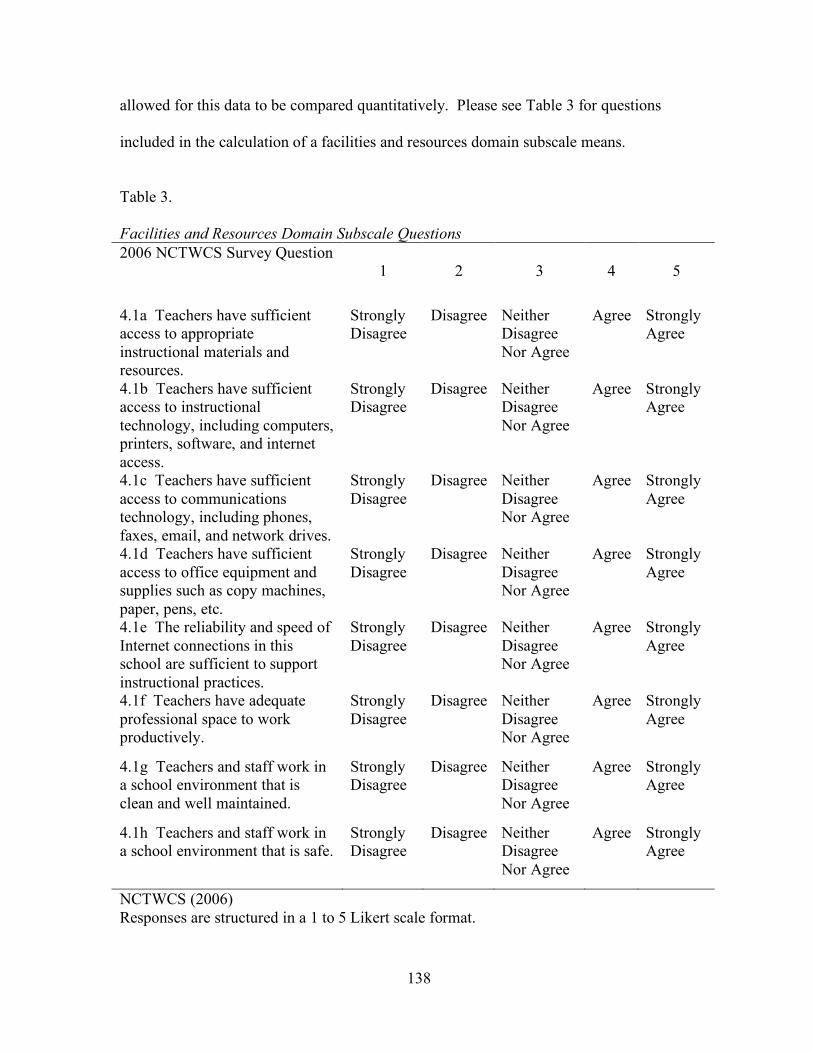
138
allowed for this data to be compared quantitatively. Please see Table 3 for questions
included in the calculation of a facilities and resources domain subscale means.
Table 3. Facilities and Resources Domain Subscale Questions 2006 NCTWCS Survey Question
1
2 3
4
5
4.1a Teachers have sufficient access to appropriate instructional materials and resources.
Strongly Disagree
Disagree Neither Disagree Nor Agree
Agree Strongly Agree
4.1b Teachers have sufficient access to instructional technology, including computers, printers, software, and internet access.
Strongly Disagree
Disagree Neither Disagree Nor Agree
Agree Strongly Agree
4.1c Teachers have sufficient access to communications technology, including phones, faxes, email, and network drives.
Strongly Disagree
Disagree Neither Disagree Nor Agree
Agree Strongly Agree
4.1d Teachers have sufficient access to office equipment and supplies such as copy machines, paper, pens, etc.
Strongly Disagree
Disagree Neither Disagree Nor Agree
Agree Strongly Agree
4.1e The reliability and speed of Internet connections in this school are sufficient to support instructional practices.
Strongly Disagree
Disagree Neither Disagree Nor Agree
Agree Strongly Agree
4.1f Teachers have adequate professional space to work productively.
Strongly Disagree
Disagree Neither Disagree Nor Agree
Agree Strongly Agree
4.1g Teachers and staff work in a school environment that is clean and well maintained.
Strongly Disagree
Disagree Neither Disagree Nor Agree
Agree Strongly Agree
4.1h Teachers and staff work in a school environment that is safe.
Strongly Disagree
Disagree Neither Disagree Nor Agree
Agree Strongly Agree
NCTWCS (2006) Responses are structured in a 1 to 5 Likert scale format.
139
Teacher Empowerment
The third domain of the 2006 NCTWCS focused on the topic of teacher
empowerment. The teacher empowerment domain was divided into two sections of
questions with Likert scale responses. In the first section of the teacher empowerment
domain, teachers were asked in the first five questions to “Please rate your level of agreement
with the following statements” (2006 NCTWCS). Teachers chose from the following Likert
scale responses: “strongly disagree, disagree, neither disagree nor agree, agree, strongly
agree” for these five questions from the teacher empowerment domain (2006 NCTWCS).
This researcher included each of the five questions on teacher empowerment from this
portion of the 2006 NCTWCS when calculating domain subscale means which were used to
compare teachers’ perceptions of working conditions in public K-8 schools to middle schools
in North Carolina. The Likert scale format of the responses to these eight questions on
facilities and resources allowed for this data to be compared quantitatively. Please see Table
4 for questions included in the calculation of a teacher empowerment domain subscale
means.
In the second section of the teacher empowerment domain, teachers were asked to
“Please indicate how large a role teachers at your school have in each of the following areas”
(2006 NCTWCS). Teachers were asked eight questions in this section of the teacher
empowerment domain which included responses designed in a Likert scale format. Teachers
chose from the following Likert scale responses: “no role at all, small role, moderate role,
large role, and the primary role” for these eight questions from the teacher empowerment
domain (2006 NCTWCS). Since response choices differed for these eight questions from the
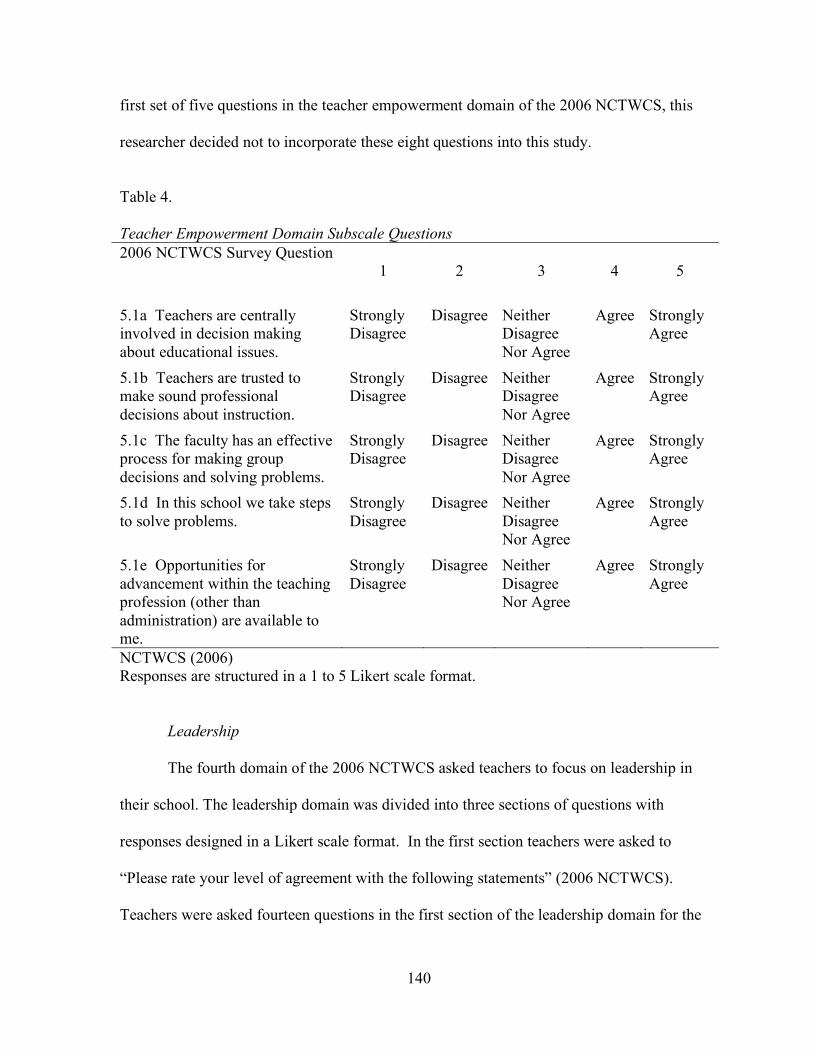
140
first set of five questions in the teacher empowerment domain of the 2006 NCTWCS, this
researcher decided not to incorporate these eight questions into this study.
Table 4. Teacher Empowerment Domain Subscale Questions 2006 NCTWCS Survey Question
1
2 3
4
5
5.1a Teachers are centrally involved in decision making about educational issues.
Strongly Disagree
Disagree Neither Disagree Nor Agree
Agree Strongly Agree
5.1b Teachers are trusted to make sound professional decisions about instruction.
Strongly Disagree
Disagree Neither Disagree Nor Agree
Agree Strongly Agree
5.1c The faculty has an effective process for making group decisions and solving problems.
Strongly Disagree
Disagree Neither Disagree Nor Agree
Agree Strongly Agree
5.1d In this school we take steps to solve problems.
Strongly Disagree
Disagree Neither Disagree Nor Agree
Agree Strongly Agree
5.1e Opportunities for advancement within the teaching profession (other than administration) are available to me.
Strongly Disagree
Disagree Neither Disagree Nor Agree
Agree Strongly Agree
NCTWCS (2006) Responses are structured in a 1 to 5 Likert scale format.
Leadership
The fourth domain of the 2006 NCTWCS asked teachers to focus on leadership in
their school. The leadership domain was divided into three sections of questions with
responses designed in a Likert scale format. In the first section teachers were asked to
“Please rate your level of agreement with the following statements” (2006 NCTWCS).
Teachers were asked fourteen questions in the first section of the leadership domain for the
141
2006 NCTWCS. Teachers chose from the following Likert scale responses: “strongly agree,
disagree, neither disagree nor agree, agree, or strongly agree” for these fourteen questions in
the first sections of the leadership domain (2006 NCTWCS). This researcher included each
of the fourteen questions on leadership from this portion of the 2006 NCTWCS when
calculating domain subscale means which were used to compare teachers’ perceptions of
working conditions in public K-8 schools to public middle schools in North Carolina. The
Likert scale format of the responses to these fourteen questions on leadership allowed for this
data to be compared quantitatively.
Teachers were provided with the same Likert scale responses for the second section
in the leadership domain which consisted of six questions. Teachers were asked to respond
to the statement “The school leadership makes a sustained effort to address teacher concerns
about facilities and resources, the use of time in my school, professional development,
empowering teachers, leadership issues, and new teacher support” (2006 NCTWCS).
Despite the fact these questions contained the same Likert scale responses as all other
questions included in the measurement of domain subscale means, this researcher decided
not to incorporate these eight questions into this study. The rationale for not including these
six questions when calculating domain subscale means was based on the recognition by
Hirsch (2007b) of the “multicolinearity” of working condition domains, which “makes it
difficult to find significant connection as the variables often weaken each other” (p. 10).
Each of the questions in this section contained references to two teacher working condition
domains, one teacher working conditions domain in the question, and one teacher working
conditions domain in the answer. Hence, due to the overlapping of questions and answers
142
into two teacher working conditions domains, the second section of six questions on
leadership was not included when calculating domain subscale means.
Finally, teachers were asked two additional questions in the final section of the
leadership domain which were not easily placed in the other two sets of questions in the
leadership domain. The first question stated “Overall, the school leadership in my school is
effective” (2006 NCTWCS). The same Likert scale response choices that were provided for
the previous two sections in the leadership domain were provided to teachers. However, this
researcher decided not to include this question in the calculation of domain subscale means
because it was presented in a different visual format to the survey respondent than all other
questions included when calculating domain subscale means. The final question asked
“Which position best describes the person who most often provides the instructional
leadership at your school?” (2006 NCTWCS). Responses to this question included
“principal or school head, assistant or vice principal, department chair or grade level chair,
school-based curriculum specialist, director of curriculum and instruction or other central
office based personnel, other teachers, none of the above” (2006 NCTWCS). Since response
choices differed for this question from the first set of fourteen questions in the leadership
domain of the 2006 NCTWCS, this researcher decided not to incorporate this question into
this study. Please see Table 5 for questions included in the calculation of the leadership
domain subscale means.

143
Table 5. Leadership Domain Subscale Questions 2006 NCTWCS Survey Question
1
2 3
4
5
6.1a There is an atmosphere of trust and mutual respect within the school.
Strongly Disagree
Disagree Neither Disagree Nor Agree
Agree Strongly Agree
6.1b The faculty are committed to helping every student learn.
Strongly Disagree
Disagree Neither Disagree Nor Agree
Agree Strongly Agree
6.1c The school leadership shields teachers from disruptions, allowing teachers to focus on educating students.
Strongly Disagree
Disagree Neither Disagree Nor Agree
Agree Strongly Agree
6.1d The school leadership consistently enforces rules for student conduct.
Strongly Disagree
Disagree Neither Disagree Nor Agree
Agree Strongly Agree
6.1e The school leadership support teachers’ efforts to maintain discipline in the classroom.
Strongly Disagree
Disagree Neither Disagree Nor Agree
Agree Strongly Agree
6.1f The school leadership support teachers’ efforts to maintain discipline in the classroom.
Strongly Disagree
Disagree Neither Disagree Nor Agree
Agree Strongly Agree
6.1g Opportunities are available for members of the community to actively contribute to this school’s success.
Strongly Disagree
Disagree Neither Disagree Nor Agree
Agree Strongly Agree
6.1h The school leadership consistently supports teachers.
Strongly Disagree
Disagree Neither Disagree Nor Agree
Agree Strongly Agree
6.1i The school improvement team provides effective leadership at this school.
Strongly Disagree
Disagree Neither Disagree Nor Agree
Agree Strongly Agree
6.1j The faculty and staff have a shared vision.
Strongly Disagree
Disagree Neither Disagree Nor Agree
Agree Strongly Agree

144
6.1k Teachers are held to high professional standards for delivering instruction.
Strongly Disagree
Disagree Neither Disagree Nor Agree
Agree Strongly Agree
6.1l Teacher performance evaluations are handled in an appropriate manner.
Strongly Disagree
Disagree Neither Disagree Nor Agree
Agree Strongly Agree
6.1m The procedures for teacher performance evaluations are consistent.
Strongly Disagree
Disagree Neither Disagree Nor Agree
Agree Strongly Agree
6.1n Teachers receive feedback that can help them improve teaching.
Strongly Disagree
Disagree Neither Disagree Nor Agree
Agree Strongly Agree
NCTWCS (2006) Responses are structured in a 1 to 5 Likert scale format.
Professional Development
The fifth domain of the 2006 NCTWCS asked teachers to rate the quality of
professional development in their school. The professional development domain was divided
into four sections of questions with various types of responses teachers chose from. In the
first section of the professional development domain, teachers were asked in the first five
questions to “Please indicate your level of agreement with the following statements” (2006
NCTWCS). Teachers were provided the following Likert scale responses: “strongly agree,
disagree, neither disagree nor agree, agree, and strongly agree” for these five questions in the
professional development domain (2006 NCTWCS). This researcher included each of the
five questions from the first set of questions in the professional development domain when
calculating domain subscale means which were used to compare teachers’ perceptions of
working conditions in public K-8 schools to public middle schools in North Carolina. The
Likert scale format of the responses to these five questions on professional development
allowed for this data to be compared quantitatively.

145
In the second set of questions for the professional development domain, teachers were
provided a different set of answer choices than those provided for the first section of
questions for the professional development domain. Teachers chose from the following
responses: “special education (students with disabilities), special education (academically
gifted students), Limited English Proficiency (LEP), closing the achievement gap, your
content area, methods of teaching, student assessment, classroom management techniques,
and reading strategies,” for the three questions in this section of the professional development
domain (2006 NCTWCS). The purpose of this section was to determine specific areas that
teachers perceived professional development opportunities needed to be offered or improved.
Since the responses for the three questions in the second section of the professional
development domain were different from the Likert scale responses for questions in section
one of the professional development domain, the second section of questions was not
included when calculating domain subscale means.
The third section in the professional development domain presented teachers with
eighteen questions on professional development with responses in a yes or no format. This
section included two sets of nine questions where the questions from each set paralleled a
question from the other set. The first set of nine questions in the third section of the
professional development domain began with the phrase “Did the professional development
you received” (2006 NCTWCS). The second set of nine questions in the third section of the
professional development domain, contrastingly, began with the phrase “Were these
strategies you learned in your professional development in” (2006 NCTWCS). Since the
responses for all questions in the third section of the professional development domain were
different from the Likert scale responses for questions in section one of the professional

146
development domain, all questions in the third section of the professional development
domain were not included when calculating domain subscale means.
The fourth and final section of questions in the professional development domain
contained a mixture of questions in random order with either response choices of “Yes/No,”
or with the Likert scale responses of “strongly agree, disagree, neither agree nor disagree,
agree, or strongly agree” (2006 NCTWCS). There are eight questions with “Yes/No”
responses, and three questions with the Likert scale responses of “strongly agree, disagree,
neither agree nor disagree, agree, or strongly agree” (2006 NCTWCS). Since the statement
that teachers responded to for the eleven questions in the fourth section of the professional
development domain was not “Please indicate your level of agreement with the following
statement,” as was the case for all other questions included in the calculation of the
professional development domain subscale mean, these eleven questions were not included
when calculating domain subscale means. Please see Table 6 for questions included in the
calculation of the professional development domain subscale means.

147
Table 6. Professional Development Domain Subscale Questions 2006 NCTWCS Survey Question
1
2
3
4
5
7.1a Sufficient funds and resources are available to allow teachers to take advantage of professional development activities.
Strongly Disagree
Disagree Neither Disagree Nor Agree
Agree Strongly Agree
7.1b Teachers are provided opportunities to learn from one another.
Strongly Disagree
Disagree Neither Disagree Nor Agree
Agree Strongly Agree
7.1c Adequate time is provided for professional development.
Strongly Disagree
Disagree Neither Disagree Nor Agree
Agree Strongly Agree
7.1d Teachers have sufficient training to fully utilize instructional technology.
Strongly Disagree
Disagree Neither Disagree Nor Agree
Agree Strongly Agree
7.1e Professional development provides teachers with the knowledge and skills most needed to teach effectively.
Strongly Disagree
Disagree Neither Disagree Nor Agree
Agree Strongly Agree
NCTWCS (2006) Responses are structured in a 1 to 5 Likert scale format.
One additional section included in the 2006 NCTWCS was a section entitled “Core
Questions” (2006 NCTWCS). This section included six questions designed with Likert scale
responses. In the first three questions, teachers were asked about aspects of the school work
environments or working conditions at the schools where teacher respondents worked (2006
NCTWCS). Teachers chose from the following Likert scale responses: “time during the
work day, school facilities and resources, school leadership, teacher empowerment, and
professional development” (2006 NCTWCS). The Likert scale responses provided to
teachers for the first three questions in this section were the five teacher working condition

148
domains. Since the first three questions in this section did not focus on a specific teacher
working condition domain, these three questions were not included when calculating domain
subscale means. The next two questions were designed in a Likert scale format. Teachers
were provided the following responses: “strongly agree, disagree, neither agree nor disagree,
agree, and strongly agree” (2006 NCTWCS). The first question in this set asked teachers to
respond to the statement “Overall, my school is a good place to teach and learn” (2006
NCTWCS). The second question asked teachers to respond to the statement “At this school
we utilize results from the TWCS as a tool for improvement” (2006 NCTWCS). These two
questions were not included when calculating domain subscale means for this study because
they did not focus on a specific teacher working condition domain. The final question in the
Core Questions section of the 2006 NCTWCS gathered information on teacher respondents’
future career aspirations. This information is not needed for analysis of teachers’ perceptions
of teacher working condition domains for this study. Thus, this question was not included in
the calculation of domain subscale means.
Establishing Reliability and Validity
At the onset of this research project neither reliability nor validity had been
established for the 2006 NCTWCS, or for prior administrations of the NCTWCS in 2002 or
2004. In a conversation with CTQ Director Mr. Barnett Berry in the fall of 2007, Dr. Rita
O’Sullivan, Associate Professor of Educational Assessment and Evaluation at UNC-Chapel
Hill, learned there is a desire on the part of CTQ to establish reliability and validity for the
NCTWCS when funding becomes available either from the State of North Carolina, or from
private donations or partnerships.
149
Content validity for the NCTWCS was completed in 2002 prior to the first statewide
administration of the survey. Charlotte Advocates for Education (CAE) (2003) explained
that the 2002 NCTWCS followed up a pilot study conducted by the North Carolina
Professional Teaching Standards Commission (NCPTSC) in 2001. CAE noted from data
provided by the SECTQ that 30 working conditions standards were adopted as the
framework for the 2002 NCTWCS which “were validated by focus groups and by more than
500 teachers” (p. 26). The 2002 NCTWCS was “based on thirty working conditions
standards in five areas: time, empowerment, facilities and resources, leadership, and
professional development, created by the North Carolina Professional Teaching Standards
Commission” under the direction of Ms. Carolyn McKinney, Executive Director of the North
Carolina Professional Teaching Standards Commission (Center for Teaching Quality). These
five areas have since been referred to as the five domains of teacher working conditions. The
2002 NCTWCS consisted of 39 survey questions developed around the five domains of
teacher working conditions.
The 2006 NCTWCS has retained the same structure as the initial 2002 NCTWCS
with questions focused on the same five teacher working conditions domains that the first
administration of the NCTWCS consisted of in 2002. The 2006 NCTWCS has expanded to
include a total of 92 questions within the five teacher working conditions domains. Six
additional questions labeled as Core questions asked comparison questions in which
respondents choose one of the five teacher working conditions domains as their answer.
There are nine additional demographics questions which gathered demographic information
on survey respondents. Finally, there was a new segment within the 2006 NCTWCS that did
not exist in the 2002 NCTWCS. This section, entitled Mentoring, contained 31 questions

150
that measured mentor and mentee perceptions of the effectiveness of mentoring provided to
beginning teachers in their first three years of teaching.
For the purpose of this study, reliability was established using SPSS 15.0 Statistical
Software for the data analyzed in this study. The task of establishing reliability for this study
was accomplished with the assistance of this researcher’s Secondary Data Analysis
instructor, Dr. Rita O’Sullivan. Reliability was completed immediately following the work
of Dr. Cathy Zimmer, Statistical Analyst in the Research Design and Data Collection
Services Department at The Odum Institute of Social Science Research on the campus of the
University of North Carolina at Chapel Hill. Dr. Zimmer merged data from several files
including the 2006 NCTWCS data file, a North Carolina school type file obtained from
LEARN NC which listed schools by grade configuration, and the 2005-06 North Carolina
Report Card Excel data file for all K-8, 6-8 middle, and AMS into one manageable data file.
With the assistance of this researcher’s Secondary Data Analysis instructor, Dr. Rita
O’Sullivan, a series of questions were chosen from each teacher working conditions domain
that were structured with the same Likert-scale responses as the questions to convert into
teacher working condition subscale means for the purposes of data analysis for this research
project. Questions selected included time, questions 3.1a-3.1e; facilities and resources,
questions 4.1a- 4.1h; teacher empowerment, questions 5.1a-5.1e; leadership, questions 6.1a-
6.1n; and 7.1a- 7.1e. Responses for each of these questions included the Likert-scale
responses: “strongly agree, disagree, neither disagree nor agree, agree, strongly agree” (2006
NCTWCS). The sample for questions included in this study included a total of 13,433 public
K-8, 6-8 middle, and AMS teachers from the state of North Carolina. See Table 7 for
reliability for the questions selected for this study from the 2006 NCTWCS.

151
Table 7. Reliability of Items Included in this Study from the 2006 NCTWCS Factor Alpha Number
of Items Time (3.1a- 3.1e)
.78 5
Facilities and Resources (4.1a- 4.1h)
.83 8
Teacher Empowerment (5.1a- 5.1e)
.86 5
Leadership (6.1a- 6.1n)
.94 14
Professional Development (7.1a- 7.1e)
.82 5
Pilot Study
No pilot study was conducted by this researcher for this study. However, CAE
(2003) indicated that in the fall of 2001 the initial version of what was to become the 2002
NCTWCS “was administered in a pilot study to 2,300 teachers and administrators in 60
schools throughout the state” (p. 26). The prior administrations of the NCTWCS in 2002,
2004, and 2006, along with the recent adoption, modification, and administrations of the
NCTWCS in several other states and one large, city-school district across the country, in
essence served the purpose of a pilot study or pilot test this researcher might have conducted
prior to secondary data analysis. Replicated administrations of the NCTWCS in other states
and the large, city-school district has allowed CTQ to continue to modify and improve the
NCTWCS for future administrations.
152
Analysis
Quantitative Statistical Procedures
SPSS 15.0 Statistical Software for Windows was used for data analysis procedures
for this study. The major research hypothesis tested in this study was:
HR = Public, K-8 school teachers will report greater satisfaction with working conditions in
K-8 schools than public middle school teachers in middle schools in the state of North
Carolina as measured by the 2006 North Carolina Teacher Working Conditions Survey.
A quasi-experimental, nonequivalent control group design was used for this study, as
defined by Campbell and Stanley (1963), for the purposes of examining the effects of grade
configuration on teachers’ perceptions of working conditions in public K-8 and middle
schools in North Carolina. Campbell and Stanley explained that quasi-experimental designs
are used in
social settings in which the research person can introduce something like experimental design into his scheduling of data collection procedures even though he lacks the full control over the scheduling of experimental stimuli which makes a true experiment possible. (p. 204)
The nonequivalent control group design was chosen by this researcher since the control
group (middle schools) and the treatment group (K-8 schools) did not have what Campbell
and Stanley referred to as “pre-experimental sampling equivalence” (p. 217). Instead of
“pre-experimental sampling equivalence,” Campbell and Stanley explained that the groups
within a nonequivalent control group design represent “naturally assembled collectives such
as classrooms” (p. 217). The “naturally assembled collectives” that made up this study’s
control and treatment groups are public K-8 and middle schools in North Carolina. Campbell
and Stanley explained that within a nonequivalent control group design, “the assignment of X
153
to one group or the other is assumed to be random and under the experimenter’s control” (p.
217).
Campbell and Stanley (1963) suggested a major disadvantage when selecting a
nonequivalent control group design is that study subjects are not randomly assigned to the
treatment and control groups from a common population as subjects are when using a pretest-
posttest control group design. Campbell and Stanley explained that the use of a
nonequivalent control group design “reduces greatly the equivocality of interpretation over
what is obtained” than when pre-experimental and true experimental designs are used (p.
217).
In this study, the independent variable that was examined through the use of a
nonequivalent control group design was grade configuration (also referred to in this study as
school type). Two types of grade configurations were examined in this study. The K-8 grade
configuration served as the treatment group. The middle school grade configuration served
as the control group. The dependent variable for this research design was working
conditions. The five working conditions domains served as co-dependent variables
throughout this study.
Data analysis began by sorting the 2006 NCTWCS data set into a file that contained
only survey data for the K-8 and middle school teachers that completed the 2006 NCTWCS.
Only K-8 and middle school teachers whose schools met the 40% response rate guideline
were included in the 2006 NCTWCS data set. Descriptive statistics, including means and
standard deviations, were calculated and analyzed for K-8 and middle school teachers.
Individual schools served as the unit of analysis.
154
With the assistance of Dr. Cathy Zimmer, Statistical Analyst in the Research Design
and Data Collection Services Department at the Odum Institute of Social Sciences Research
on the campus of the University of North Carolina at Chapel Hill, a merged, secondary data
file was created for this study. The merged, secondary data file included co-dependent,
teacher working conditions variable data and teacher demographic data from the 2006
NCTWCS, as well as co-variate data on teacher demographics and student/school
characteristics from the 2005-06 school year obtained from North Carolina Report Cards.
The secondary data in the merged data file was analyzed using quantitative statistical
procedures in this study. The major research hypothesis tested in this study was
HR = Public, K-8 school teachers will report greater satisfaction with working conditions in
K-8 schools than public middle school teachers in middle schools in the state of North
Carolina as measured by the 2006 North Carolina Teacher Working Conditions Survey.
First, t-tests for independent samples were calculated to compare means for teachers’
perceptions of teacher working conditions domains by school type for K-8 and 6-8 middle
school teachers, and K-8 teachers and all middle school (AMS) teachers. Five separate t-
tests for independent samples were calculated for the five teacher working conditions of (a)
time; (b) facilities and resources; (c) teacher empowerment; (d) leadership; and (e)
professional development. Alpha (� ) was set at .000 using a two-tailed test of significance.
Further analysis was conducted which controlled for select extraneous teacher
demographic and student/school characteristics variables. Five separate one-way ANCOVAs
were calculated using SPSS 15.0 for the five co-dependent working conditions domain
variables: (a) time; (b) facilities and resources; (c) empowerment; (d) leadership; and (e)
professional development. Grade configuration (school type) served as the independent
155
variable or fixed factor for each ANCOVA. Teacher demographic and student/school
characteristics variables were imported as co-variates for each ANCOVA. ANCOVAS
control for the effects of co-variates and estimate the variance that should be attributed to co-
variates and not to the independent variable in a research study. In this study, ANCOVAS
estimated the variance in teachers’ perceptions of teacher working conditions domains that
should be attributed to teacher demographic and student/school characteristics variables and
not grade configuration. The analysis of the effects of co-variates on teachers’ perceptions of
teacher working conditions domains could have revealed rival alternative hypotheses if it had
been discovered that teacher demographic and student/school characteristics variables were
attributing to large variance in teachers’ perceptions of teacher working conditions domains.
Rosenholtz and Simpson (1990) completed a study which looked at the differences
between teachers’ commitment and years of experience at different stages of their career.
Rosenholtz and Simpson found significant differences between novice and experienced
teachers in teacher commitment. Taking into consideration the findings from Rosenholtz and
Simpson’s study, teachers’ years of experience (the exact data often used to determine the
stage of a teacher’s career) was selected as a covariate for this study.
Another study by Huang (1998) found that gender was a significant factor which
influenced teachers’ perceptions of their school environments. Huang explained that “the
MANOVA results revealed that there was an overall significant gender difference in
teachers’ perceptions of their school environments” (p. 166). Due to gender’s significance in
Huang’s study, gender was selected as a co-variate for this study. Other teacher
demographic, extraneous variables selected as co-variates for this study since secondary data
was available for analysis from the 2006 NCTWCS included ethnicity, highest degree earned
156
prior to beginning teaching, highest degree earned, National Board Certification status, and
years at a school.
Another important recommendation from the study of working conditions effects on
teacher commitment by Rosenholtz and Simpson (1990) was these researchers’ recognition
of the importance of student characteristics for any quantitative research model which
includes either individual teachers or the schools in which they work as a unit of analysis.
Rosenholtz and Simpson explained,
although the socioeconomic status (SES) of the student body is not a quality of school or classroom organization, previous research has shown that it influences all the organizational qualities that affect commitment and has strongly recommended its inclusion in any model that seeks to explain the commitment of teachers. (p. 246)
Johnson and Stevens (2006) also controlled for student SES through free and reduced lunch
statistics at schools within a sample of elementary schools in a research study they
conducted. Johnson and Stevens justified the importance of controlling for student SES and
for additional student and school characteristics variables in this particular study stating:
Schools don’t operate in vacuums. They are reflections of and contributors to the communities in which they are based. For this reason, community and school context variables were added to this model. (p. 118)
In summary, student/school characteristics variables selected as co-variates for this
study included percentage of students eligible for free and reduced lunch (often referred to as
students’ socio-economic status), percentage of students proficient on the 2005-06 North
Carolina Reading End-of-Grade test, and ABC School Recognitions as defined by the ABCs
of Public Education developed by the Office of the Governor and the North Carolina State
Board of Education. According to North Carolina Report Cards
157
The ABCs of Education is North Carolina’s comprehensive plan to improve public schools that is based on three goals: strong accountability, an emphasis on student mastery of basic skills, and as much local control as possible. The ABCs has been in operation in all schools since 1997-98. The model focuses on schools meeting growth expectations for student achievement as well as on overall percentage of students who scored at or above grade level. The model uses end-of-grade tests in grades 3-8 in reading and mathematics to measure growth at the elementary and middle school levels (North Carolina Report Cards).
Students’ proficiency on achievement tests for individual school units is recognized
by the proficiency classifications of expected and high growth. Expected growth is defined
by the ABCs of Education
… as the amount of academic growth that would reasonably be expected by a school over a year’s worth of time. This may be different for schools and is based on the school’s previous performance; statewide average growth; and a statistical adjustment which is needed whenever you compare test scores of students from one year to the next (North Carolina Report Cards).
High growth “refers to a growth rate that is approximately 10 percent above the expected
growth goal set for each school” (North Carolina Report Cards).
ABC School Recognitions for academic achievement for public schools in the state of
North Carolina, according to the ABCs of Public Education, include in order from lowest to
highest distinction: (a) School of Progress, (b) School of Distinction, (c) School of
Excellence, and (d) Honor School of Excellence. Schools of Progress have 60 to 79% of
students’ scores at or above Achievement Level III and made expected or high growth the
previous school year. Schools of Distinction have 80 to 89% of students’ scores at or above
Achievement Level III and made expected or high growth. Schools of Excellence have 90 to
100% of students’ scores at or above Achievement Level III and made expected or high
growth. Honor Schools of Excellence have 90 to 100% of students’ scores at or above

158
Achievement Level III, made high or expected growth, and made Adequate Yearly Progress
(AYP). Achievement Level III and Achievement Level IV are measures of student academic
performance that indicate students are performing at grade level and should be well prepared
to meet the demands of the next grade level (North Carolina Report Cards). The percentage
of students proficient on the 2005-06 Reading End-of-Grade test and the 2005-06 ABC
School Recognitions for each school with teachers included in this study’s sample were
obtained from the North Carolina Department of Public Instruction (NCDPI) within the
2005-06 NC School Report Cards Excel file and used in the data analyses procedures of this
study.
Significance for Public K-8 and Middle Schools in the State of North Carolina
This research project examining the relationship between grade configuration in
public K-8 and middle schools in North Carolina and teachers’ perceptions of working
conditions was significant because no research project to date had examined specifically the
relationship between grade configuration at the K-8 level and teachers’ perceptions of
working conditions. Teachers’ perceptions of working conditions data had been gathered
and analyzed for elementary, middle, and high school grade configurations. However, no
research project had compared the relationship of teachers’ perceptions of working
conditions in K-8 schools to teachers’ perceptions of working conditions in middle schools.
This study could provide valuable data for use by the state of North Carolina, and potentially
other states across the nation that contain both K-8 schools and middle schools for young
adolescents. Furthermore, large, urban school districts which have already converted middle
schools to K-8 schools, or are considering establishing
159
K-8 schools as opposed to middle schools for young adolescents within their school district,
might find this study’s findings very beneficial as they seek to establish schools with the
most effective grade configurations for young adolescents and the teachers that work within
these schools.
Another reason for the significance of this study was it examined K-8 teachers’
perceptions of working conditions as a separate group for the first time. It was in the 2001-
02 school year that the state of North Carolina first introduced the concept of a teacher
working conditions survey in an effort to improve teacher working conditions. North
Carolina Governor Mike Easley and his closest educational advisors within the Office of the
Governor and the State Board of Education hoped that focusing on improving teacher
working conditions, through the Teacher Working Condition Initiative and its corresponding
NCTWCS, would not only improve teacher working conditions, but, simultaneously improve
teacher retention and decrease teacher turnover during a foreseeable future where teacher
shortages might dominate the educational landscape. This study expanded on the work of the
Office of the Governor for the State of North Carolina, and its partnership with the Center for
Teaching Quality (CTQ), by taking past research a step further and looking at teachers’
perceptions of working conditions from a new perspective, a perspective that examines the
relationship of grade configuration in public K-8 and middle schools in North Carolina and
teachers’ perceptions of working conditions.
In conclusion, educational researchers should continue to focus on teacher working
conditions by conducting additional research projects in the realm of teachers’ working
conditions. Continued interest in teachers’ working conditions in the state of North Carolina
and across the country should persuade the CTQ and the Office of the Governor for the State
160
of North Carolina to continue to seek funding to continue replications of the NCTWCS in
North Carolina. Likewise, administrations of the NCTWCS in additional states and large
school districts throughout the country should continue to increase, through the collaborative
efforts and partnership provided with the CTQ. In the end, repeated administrations of the
NCTWCS, even with modifications to the survey’s format to meet the educational needs of
teachers in other states, should result in an improved teacher working conditions survey,
hopefully with reliability and validity established by the CTQ when adequate time and
funding allow.
Summary
This chapter has explained the research design and methodologies applied in this
study. The expedited IRB for this study was approved by the Office of Human Research
Ethics Institutional Review Board at the University of North Carolina at Chapel Hill in early
November 2007. After the successful defense of this researcher’s dissertation proposal on
November 21, 2007, approval was granted by Dr. Fenwick English, Dissertation Chair, in
agreement with the other dissertation committee members, for this researcher to begin the
data analyses for this study. Chapter IV includes the findings for this study examining the
relationship between grade configuration and teachers’ perceptions of working conditions in
public K-8 and middle schools in North Carolina. Chapter V follows with a summary and
discussion of the findings in this study, as well as policy recommendations and implications
for future research on the topic of grade configuration and teachers’ perceptions of working
conditions.
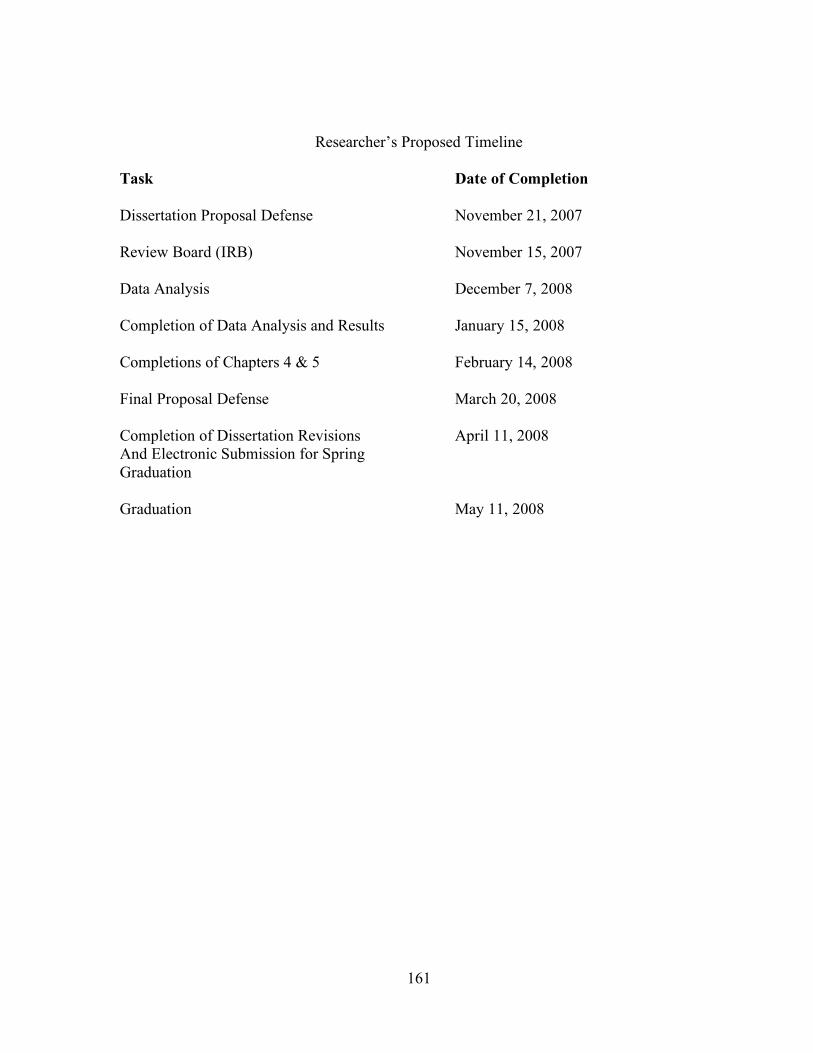
161
Researcher’s Proposed Timeline
Task Date of Completion
Dissertation Proposal Defense November 21, 2007 Review Board (IRB) November 15, 2007 Data Analysis December 7, 2008 Completion of Data Analysis and Results January 15, 2008 Completions of Chapters 4 & 5 February 14, 2008 Final Proposal Defense March 20, 2008 Completion of Dissertation Revisions April 11, 2008 And Electronic Submission for Spring Graduation Graduation May 11, 2008
CHAPTER IV
RESULTS
Introduction
This chapter is divided into two sections. The first section, Description of Teacher
Demographics and Student/School Characteristics, consists of descriptive statistics on the
teachers and schools included within the sample of this research study. There are two
subsections within the Description of Teacher Demographics and Student/School
Characteristics: (a) teacher demographics by school type (K-8, middle, and all middle
schools (AMS; 3-8, 4-8, 5-8, 6-8) and (b) a general description of schools by school type in
the areas of student and school characteristics. The Description of Teacher Demographics
and Student/School Characteristics section includes descriptive statistics such as frequencies
and cross tabulations which describe teacher demographics and provide a general description
of schools. The descriptive statistics calculated for The Description of Teacher Demographic
and Student/School Characteristics section explain whether or not there were significant
differences in teacher demographic variables and student/school characteristics variables by
school type for K-8, 6-8 middle, and AMS.
The second main section, Testing the Major Research Hypothesis and Sub-
hypotheses, is divided into subsections, one for each sub-hypotheses, and one subsection
devoted to an explanation of effect size estimates for teachers’ perceptions of teacher
working condition domains by school type for K-8 and all middle school configuration
163
teachers. Statistics calculated and discussed within the section titled, Testing the Major
Research Hypothesis and Sub-hypotheses included means, standard deviations, correlations,
independent sample t-tests, one-way ANCOVAs, and effect size estimates. Sub-hypothesis
one through five test teachers’ perceptions of each teacher working condition domain by
school type for K-8, 6-8 middle, and AMS teachers. This section begins with the calculation
of teacher working condition domain subscale means and standard deviations by school type
for K-8, 6-8 middle, and AMS teachers. Teacher working condition domain subscale means
and standard deviations are presented and discussed in subsections one through five where
test results are provided for each research sub-hypothesis. Within subsections one through
five, teachers’ perceptions of teacher working condition domain subscale means will be
compared and discussed for two groups, K-8 versus 6-8 middle school teachers, and K-8
versus AMS teachers.
Within subsections six and seven, correlations were calculated for teacher
demographic and student/school characteristic variables to examine the relationship between
these independent variables and the dependent variable, teachers’ perceptions of working
condition domains as influenced by the primary independent variable of this study, school
type. ANCOVAs were then conducted for significant relationships between teacher
demographic or student/school characteristic variables and teachers’ perceptions of teacher
working condition domains as indicated by correlation results to estimate the variance in
teachers’ perceptions of teacher working condition domains that could be attributed to each
co-variate, and not differences in school type. Subsection eight concludes with effect size
estimates which contrasted the differences in teachers’ perceptions of working condition
164
subscale means between K-8 and AMS teachers to measure the magnitude of the differences
in teacher perception means by school type.
Section One: Description of Teacher Demographics and Student/School
Characteristics
Teacher Demographics by School Type
Demographic information for the 13,433 teachers responding to the 2006 NCTWCS
who are included within this study from 6-8 middle schools, K-8 schools, and other middle
school grade configurations (3-8, 4-8, 5-8) from public schools in the state of North Carolina
was as follows. There were 10,520 6-8 middle school teachers (78.3%), 1,813 K-8 teachers
(13.5%), and 1,100 teachers (8.2%) from other middle school grade configurations included
in the sample for this study. In an attempt to highlight additional demographic differences
between teachers by school type, each demographic characteristic will be discussed
separately so that comparisons by school type can be made.
Total group item non-responses ranged from 23 to 424 for each question on teacher
demographics. There were fewer K-8 non-respondents for each question on teacher
demographics than for the 6-8 middle school and AMS groups. Non-respondents ranged
from 23 to 53 for K-8 school respondents. Non-respondents ranged from 113 to 424 for the
6-8 middle school and AMS groups. The question with the most non-respondents for the 6-8
middle school and the AMS groups pertained to teacher ethnicity. For K-8 schools, the
question with the most non-respondents pertained to gender. For all three groups the
question with the least non-respondents pertained to the prior educational training of teachers
beginning their teaching career. Please see Table 8 for the frequencies of teachers by school
type in this study.

165
Table 8. Teacher Demographics by School Type Middle Schools (6-8), K-8 Schools, and Other Middle Schools (3-8, 4-8, and 5-8)
Teacher Frequencies School Type n Percent Total n Middle 6-8
10520 78.3 13433
K-8
1813 13.5 13433
Other Middle: 3/8, 4/8, 5/8
1100 8.2 13433
Ethnicity
Teachers were asked to classify their ethnicity as American Indian or Alaska Native,
Asian or Pacific Islander, Black or African-American, Hispanic, white, mixed or multiple
ethnicity, or other. For each school type, white teachers represented the majority ethnic
group. In 6-8 middle schools, 8245 teachers (81.4%) of all teachers classified their ethnicity
as white. In comparison, there were 1,649 white teachers (93.4%) from K-8 schools included
in this study. In an attempt to look at differences that might result by the inclusion of other
middle school grade configuration teachers in the sample for this study, other middle school
configuration teachers (3-8, 4-8, 5-8) were included with 6-8 middle school teachers in a
second comparison of teacher demographics by school type known as all middle school
(AMS) teachers. When 3-8, 4-8, and 5-8 teachers were combined with 6-8 middle school
teachers and compared to K-8 teachers for ethnicity, the percentage of white teachers in the
total sample for this study decreased from 81.4% to 80.7%.
Black or African-American teachers were the second largest ethnic group of teachers
across school types. There were 1420 Black or African-American teachers (14.0%) in 6-8
middle schools. Fifty-one teachers (2.9%) classified themselves as Black or African-
American in K-8 schools. When comparing teachers in all middle school grade
166
configurations to K-8 schools, the percentage of Black or African-American teachers rose
from 14% to 14.4%.
Greater variation in teachers’ ethnicity by school type was found when looking at
ethnic groups other than African-Americans. The third largest ethnic group of teachers was
different for 6-8 middle schools and K-8 schools. Mixed/multiple ethnicity teachers made up
the third largest ethnic group of teachers (1.5%) in 6-8 middle schools. In K-8 schools,
American Indian/Alaska Native teachers were the third largest ethnic group (1.8%) in this
study’s sample. When 3-8, 4-8, and 5-8 teachers were combined with 6-8 middle school
teachers and compared as a group to K-8 teachers, mixed/multiple ethnicity remained the
third largest ethnic group and represented the same percentage of the total sample by
ethnicity for AMS teachers. Results also indicated that Hispanic teachers represented a very
small percentage of the total sample for this study for each school type. The largest group of
Hispanic teachers for any of the three school types was 1%, found in the K-8 and AMS
groups.
Cross tabulations were run to test for significant differences in teacher ethnicity by
school type in the study’s sample. Significant differences in teacher ethnicity by school type
were found between 6-8 middle school teachers and K-8 teachers, and between AMS
teachers and K-8 teachers, when significance was set for p≤.000 on a two-tailed test of
significance.
The decision by this researcher to select two-tailed over one-tailed tests of
significance was based on Howell (2002) and his rationale for selecting two-tailed over one-
tailed tests. Howell explained that two-tailed tests of significance reject an equal percentage
of extreme scores at both ends of a distribution. One-tailed tests only reject extremes at one
167
end of the distribution. However, the rejection region for a one-tailed test is twice as large
since extreme scores are only rejected at one end of the distribution. Howell gave two
reasons for the more widespread use of two-tailed tests as opposed to one-tailed tests. First
of all, Howell explained “the investigator may have no idea what the data will look like and
therefore has to be prepared for any eventuality” (p.108). Secondly, researchers choose two-
tailed over one-tailed tests if “investigators are reasonably sure that data will come out one
way but want to cover themselves in the event they are wrong” (p.108).
Gender
K-8 teachers reported a higher percentage of female teachers than either the 6-8
middle school or all middle school configuration groups. There were 1,545 female K-8
teachers (87.8) compared to 7,761 female 6-8 middle school teachers (76.4%) and 8,590
female AMS teachers (76.5%). Cross tabulations revealed significant differences between
school types and teachers by gender. Significance was set at p≤.000 on a two-tailed test of
significance.
Educational Training Prior to Beginning Teaching
Teachers were asked to designate their educational training based on their degree
earned prior to entering the teaching field. Teachers were to select among such choices as
Bachelor’s degree, Master’s degree, or alternative route. For each school type, the majority
of teachers chose Bachelor’s degree as their educational training prior to entering the
teaching profession. K-8 teachers were the school type with the highest percentage (76.9%)
of teachers who earned only their Bachelor’s degree prior to entering the teaching profession.
By comparison, 70.8% of 6-8 middle school and AMS teachers reported earning only their
Bachelor’s degree prior to entering the teaching profession. A higher percentage of K-8

168
teachers (17.6%) compared to both middle school groups of teachers (16.4%) reported
earning Master’s degrees prior to beginning teaching. However, a larger percentage of 6-8
middle school (12.8%) and teachers from AMS (12.8%) reported entering the teaching
profession via an alternative route than K-8 teachers (5.5%). Cross tabulations found
significant differences between teachers by school type and educational training prior to
entering the teaching profession for 6-8 middle school teachers and K-8 teachers and for
AMS teachers and K-8 teachers. Significance was set at p≤.000 on a two-tailed test of
significance.
Highest Degree Earned
Teachers were asked to choose the highest degree earned from the following
selections: Bachelor’s, Master’s, Doctorate, and other. Similar percentages were found for
each degree choice by each school type. The largest percentage of K-8 teachers reported
Bachelor’s degree (66.6%) as their highest degree earned compared to 66.2% of AMS
teachers and 65.9% of 6-8 middle school teachers. Nearly 32% of K-8, 6-8 middle, and
AMS teachers reported that their highest degree earned was a Master’s degree. Less than 1%
of respondents in all groups by school type reported earning doctorates. When cross
tabulations were calculated, no significant differences were found between school types and
highest degree earned by teachers. Hence, there were not significant differences in highest
degree earned between K-8 and 6-8 middle school teachers, nor K-8 and AMS teachers.
Significance was set at p≤.000 on a two-tailed test of significance.
National Board Certification Status
Teachers were asked to designate if they had earned National Board Certification at
the time they completed the 2006 NCTWCS. Over 10% of K-8, 6-8 middle, and AMS

169
teachers reported that they had earned National Board Certification prior to their completion
of the 2006 NCTWCS. Nearly 90% of K-8, 6-8 middle, and AMS teachers had not earned
National Board Certification at the time of their completion of the 2006 NCTWCS. Cross
tabulations revealed no significant differences between school types and whether or not
teachers had earned National Board Certification. Significance was set at p≤.000 on a two-
tailed test of significance.
Years as an Educator
Teachers were asked to designate the number of years they had served as an educator
prior to the 2005-06 school year. Teachers were to select among such choices as first year,
2-3 years, 4-6 years, 7-10 years, 11-20 years, and 20+ years. For each school type, the
largest percentage of teachers noted that they had completed 11-20 years as an educator prior
to the 2005-06 school year. Over 30% of K-8 teachers, and over 24% of 6-8 middle and
AMS teachers reported they had completed 11-20 years as an educator prior to the 2005-06
school year. The next largest group of teachers reported they had completed over 20 years as
an educator prior to the 2005-06 school year. Over 23% of 6-8 middle and AMS teachers,
and over 25% of K-8 teachers reported they had completed over 20 years as an educator prior
to the 2005-06 school year. Contrastingly, the smallest group of teachers according to the
teacher demographic variable, years as an educator, was teachers in their first year. Less than
seven percent of K-8, 6-8 middle, and AMS teachers were in their first year as an educator.
When the group of teachers in their first year was combined with teachers who had
completed two to three years as an educator, results indicated that over 15% of K-8 teachers
and at least 19% of 6-8 middle and AMS teachers had completed no more than three years as
educators prior to the 2005-06 school year.
170
Cross tabulations found significant differences between teachers by school type and
teachers’ years as an educator between K-8 and 6-8 middle school teachers, and between K-8
and AMS teachers. Significance was set at p≤.000 on a two-tailed test of significance.
Years at School
Teachers were asked to designate the number of years they had worked at their
current school prior to the 2005-06 school year. Teachers were to select among such choices
as first year, 2-3 years, 4-6 years, 7-10 years, 11-20 years, and 20+ years. For each school
type, the largest percentage of teachers reported that they had worked at their current school
for four to six years. Nearly 23% of K-8, and over 24% of 6-8 middle and AMS teachers
reported they had worked at their current school for four to six years. The next largest
percentage of teachers reported that they had worked at their current school for two to three
years. Twenty-one percent of K-8 teachers and at least 24% of 6-8 middle and AMS teachers
reported they had worked at their current school for two to three years. When groups of
teachers were combined that reported they had worked at their current schools for six years
or less, it was found that nearly 60% of K-8, and nearly 68% of 6-8 middle and AMS
teachers had worked at their current schools for six years or less. The smallest percentage of
teachers for each school type reported they had worked at their current school for over 20
years. Over nine percent of K-8 teachers and over four percent of 6-8 middle and AMS
teachers reported they had worked over 20 years at their current school.
Cross tabulations found significant differences between teachers by school type and
teachers’ years at their current school between K-8 and 6-8 middle school teachers, and
between K-8 and AMS teachers. Significance was set at p≤.000 on a two-tailed test of
significance.
171
Please see Table 9 for a listing of teacher demographics by number and percentage of
teacher responses by school type for teachers in K-8, 6-8 middle, and AMS. The sample for
this study included 13,433 K-8, 6-8 middle, and AMS teachers.
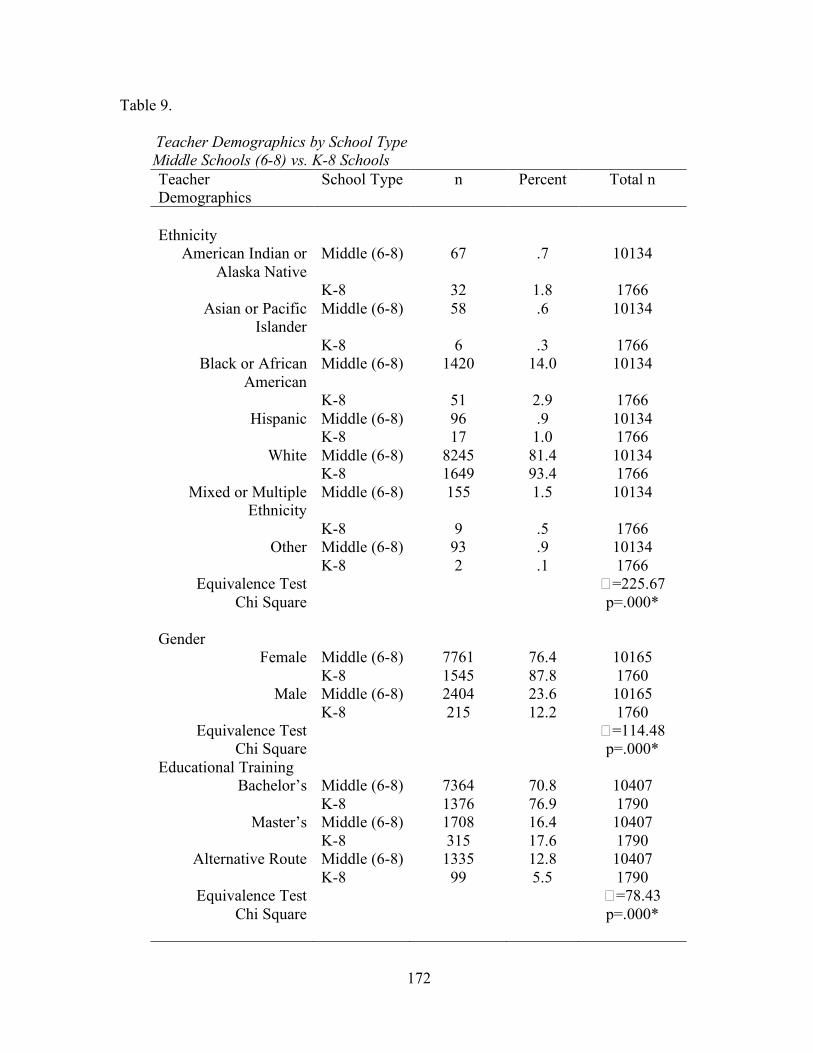
172
Table 9. Teacher Demographics by School Type Middle Schools (6-8) vs. K-8 Schools
Teacher Demographics
School Type n Percent Total n
Ethnicity
American Indian or Alaska Native
Middle (6-8) 67 .7 10134
K-8 32 1.8 1766 Asian or Pacific
Islander Middle (6-8) 58 .6 10134
K-8 6 .3 1766 Black or African
American Middle (6-8) 1420 14.0 10134
K-8 51 2.9 1766 Hispanic Middle (6-8) 96 .9 10134
K-8 17 1.0 1766 White Middle (6-8) 8245 81.4 10134
K-8 1649 93.4 1766 Mixed or Multiple
Ethnicity Middle (6-8) 155 1.5 10134
K-8 9 .5 1766 Other Middle (6-8) 93 .9 10134
K-8 2 .1 1766 Equivalence Test
Chi Square � =225.67
p=.000* Gender
Female Middle (6-8) 7761 76.4 10165 K-8 1545 87.8 1760
Male Middle (6-8) 2404 23.6 10165 K-8 215 12.2 1760
Equivalence Test Chi Square
� =114.48 p=.000*
Educational Training Bachelor’s Middle (6-8) 7364 70.8 10407
K-8 1376 76.9 1790 Master’s Middle (6-8) 1708 16.4 10407
K-8 315 17.6 1790 Alternative Route Middle (6-8) 1335 12.8 10407
K-8 99 5.5 1790 Equivalence Test
Chi Square � =78.43
p=.000*

173
Teacher Demographics
School Type n Percent Total n
Highest Degree
Bachelor’s Middle (6-8) 6847 65.9 10391 K-8 1190 66.6 1786 K-8 4 .2 1786
Other Middle (6-8) 164 1.6 10391 K-8 23 1.3 1786
Equivalence Test Chi Square
� =3.90 p=.272
National Board Certified
Yes Middle (6-8) 1088 10.5 10342 K-8 194 10.9 1785
No Middle (6-8) 9254 89.5 10342 K-8 1591 89.1 1765
Equivalence Test Chi Square
� =.20 p=.659
Years as an Educator
First Year Middle (6-8) 698 6.7 10366 K-8 107 6.0 1780
2-3 Years Middle (6-8) 1279 12.3 10366 K-8 168 9.4 1780
4-6 Years Middle (6-8) 1739 16.8 10366 K-8 246 13.8 1780
7-10 Years Middle (6-8) 1719 16.6 10366 K-8 268 15.1 1780
11-20 Years Middle (6-8) 2525 24.4 10366 K-8 538 30.2 1780
20+Years Middle (6-8) 2406 23.2 10366 K-8 453 25.4 1780
Equivalence Test Chi Square
� =46.17 p=.000*
Years at School
First Year Middle (6-8) 2011 19.5 10326 K-8 283 16.0 1774
2-3 Years Middle (6-8) 2508 24.3 10326 K-8 372 21.0 1774
4-6 Years Middle (6-8) 2515 24.4 10326 K-8 403 22.7 1774

174
Teacher Demographics
School Type n Percent Total n
7-10 Years Middle (6-8) 1559 15.1 10326 K-8 278 15.7 1774
11-20 Years Middle (6-8) 1275 12.3 10326 K-8 271 15.3 1774
20+Years Middle (6-8) 458 4.4 10326 K-8 167 9.4 1774
Equivalence Test Chi Square
� =101.73 p=.000*
*Significant at p≤.000 on a two-tailed test of significance
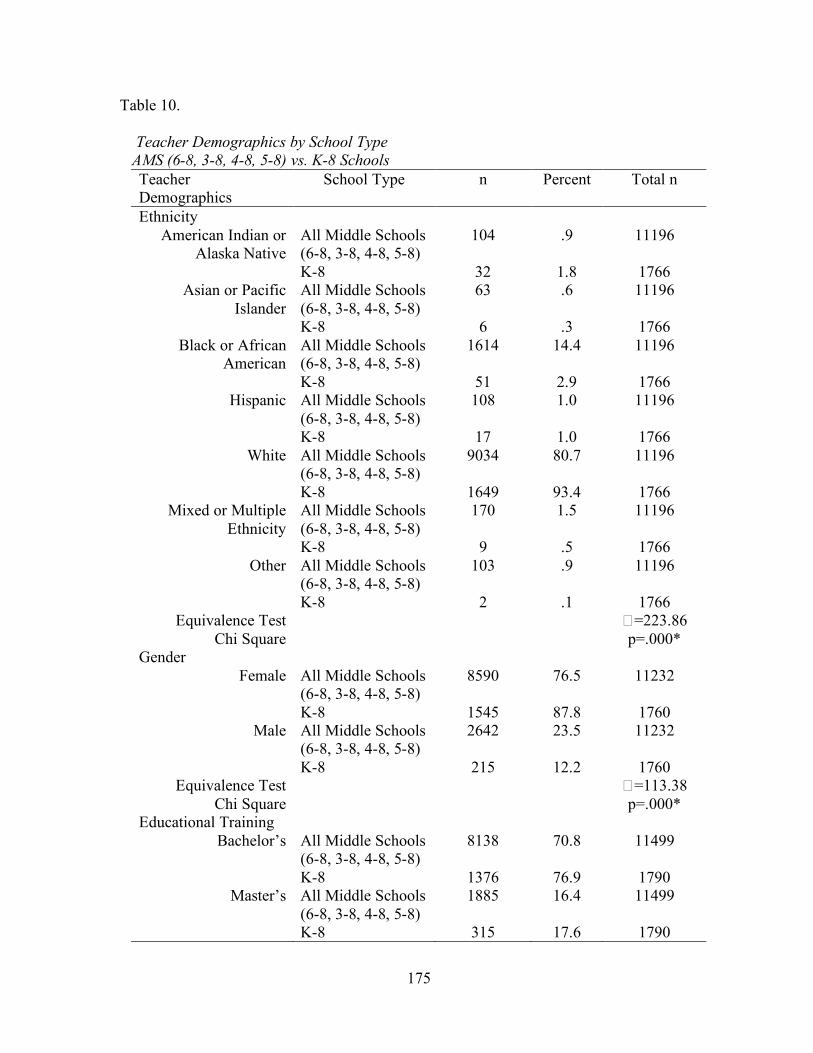
175
Table 10. Teacher Demographics by School Type AMS (6-8, 3-8, 4-8, 5-8) vs. K-8 Schools
Teacher Demographics
School Type n Percent Total n
Ethnicity American Indian or
Alaska Native All Middle Schools (6-8, 3-8, 4-8, 5-8)
104 .9 11196
K-8 32 1.8 1766 Asian or Pacific
Islander All Middle Schools (6-8, 3-8, 4-8, 5-8)
63 .6 11196
K-8 6 .3 1766 Black or African
American All Middle Schools (6-8, 3-8, 4-8, 5-8)
1614 14.4 11196
K-8 51 2.9 1766 Hispanic All Middle Schools
(6-8, 3-8, 4-8, 5-8) 108 1.0 11196
K-8 17 1.0 1766 White All Middle Schools
(6-8, 3-8, 4-8, 5-8) 9034 80.7 11196
K-8 1649 93.4 1766 Mixed or Multiple
Ethnicity All Middle Schools (6-8, 3-8, 4-8, 5-8)
170 1.5 11196
K-8 9 .5 1766 Other All Middle Schools
(6-8, 3-8, 4-8, 5-8) 103 .9 11196
K-8 2 .1 1766 Equivalence Test
Chi Square � =223.86
p=.000* Gender
Female All Middle Schools (6-8, 3-8, 4-8, 5-8)
8590 76.5 11232
K-8 1545 87.8 1760 Male All Middle Schools
(6-8, 3-8, 4-8, 5-8) 2642 23.5 11232
K-8 215 12.2 1760 Equivalence Test
Chi Square � =113.38
p=.000* Educational Training
Bachelor’s All Middle Schools (6-8, 3-8, 4-8, 5-8)
8138 70.8 11499
K-8 1376 76.9 1790 Master’s All Middle Schools
(6-8, 3-8, 4-8, 5-8) 1885 16.4 11499
K-8 315 17.6 1790

176
Teacher Demographics
School Type n Percent Total n
Alternative Route All Middle Schools (6-8, 3-8, 4-8, 5-8)
1476 12.8 11499
K-8 99 5.5 1790 Equivalence Test
Chi Square � =79.15
p=.000* Highest Degree
Bachelor’s All Middle Schools (6-8, 3-8, 4-8, 5-8)
7595 66.2 11480
K-8 1190 66.6 1786 Master’s All Middle Schools
(6-8, 3-8, 4-8, 5-8) 3643 31.7 11480
K-8 569 31.9 1786 Doctorate All Middle Schools
(6-8, 3-8, 4-8, 5-8) 65 .6 11480
K-8 4 .2 1786
Other All Middle Schools (6-8, 3-8, 4-8, 5-8)
177 1.5 11480
K-8 23 1.3 1786
Equivalence Test Chi Square
� =4.20 p=.241
National Board Certified
Yes All Middle Schools (6-8, 3-8, 4-8, 5-8)
1179 10.3 11430
K-8 194 10.9 1785 No All Middle Schools
(6-8, 3-8, 4-8, 5-8) 10251 89.7 11430
K-8 1591 89.1 1785 Equivalence Test
Chi Square � =.51
p=.476 Years as an Educator
First Year All Middle Schools (6-8, 3-8, 4-8, 5-8)
791 6.9 11452
K-8 107 6.0 1780
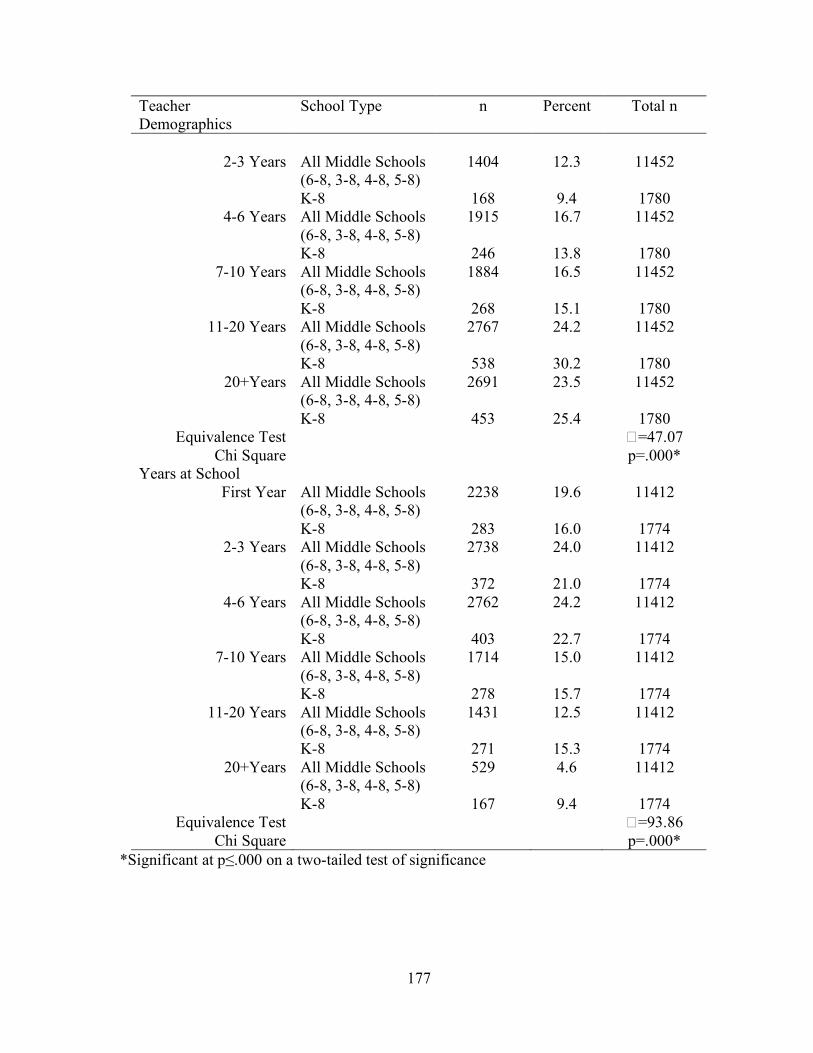
177
Teacher Demographics
School Type n Percent Total n
2-3 Years All Middle Schools
(6-8, 3-8, 4-8, 5-8) 1404 12.3 11452
K-8 168 9.4 1780 4-6 Years All Middle Schools
(6-8, 3-8, 4-8, 5-8) 1915 16.7 11452
K-8 246 13.8 1780 7-10 Years All Middle Schools
(6-8, 3-8, 4-8, 5-8) 1884 16.5 11452
K-8 268 15.1 1780 11-20 Years All Middle Schools
(6-8, 3-8, 4-8, 5-8) 2767 24.2 11452
K-8 538 30.2 1780 20+Years All Middle Schools
(6-8, 3-8, 4-8, 5-8) 2691 23.5 11452
K-8 453 25.4 1780 Equivalence Test
Chi Square � =47.07
p=.000* Years at School
First Year All Middle Schools (6-8, 3-8, 4-8, 5-8)
2238 19.6 11412
K-8 283 16.0 1774 2-3 Years All Middle Schools
(6-8, 3-8, 4-8, 5-8) 2738 24.0 11412
K-8 372 21.0 1774 4-6 Years All Middle Schools
(6-8, 3-8, 4-8, 5-8) 2762 24.2 11412
K-8 403 22.7 1774 7-10 Years All Middle Schools
(6-8, 3-8, 4-8, 5-8) 1714 15.0 11412
K-8 278 15.7 1774 11-20 Years All Middle Schools
(6-8, 3-8, 4-8, 5-8) 1431 12.5 11412
K-8 271 15.3 1774 20+Years All Middle Schools
(6-8, 3-8, 4-8, 5-8) 529 4.6 11412
K-8 167 9.4 1774 Equivalence Test
Chi Square � =93.86
p=.000* *Significant at p≤.000 on a two-tailed test of significance
178
Student/School Characteristics by School Type
Student/school characteristics were determined by merging several files from the
2005-06 NC Report Card Excel data file to teacher respondents’ data files from the 2006
NCTWCS. The NC Report Card data files from the 2005-06 school year that contained
student/school characteristics which were merged with teacher respondents’ data files from
the 2006 NCTWCS included percentage of students eligible at a school for free and reduced
lunch, 2005-06 ABC Recognition of academic status for each school, and percentage of
students’ proficient on the 2005-06 Reading End-of-Grade test.
Merging these files resulted in very few instances of missing data for each school
type. There were 22 instances (.012%) of missing data after merging 2005-06 ABC School
Recognition status to K-8 teacher responses to the 2006 NCTWCS. There were 14 instances
(.001%) of missing data after merging 2005-06 ABC School Recognition status to 6-8 middle
school responses to the 2006 NCTWCS. Finally, there were 30 instances (.002%) of missing
data after merging 2005-06 ABC School Recognition status to AMS teachers’ responses to
the 2006 NCTWCS. Since the instances of missing data and percentages of total sample data
by school type as a result of the data merging process were so small, it is unlikely the
instances of missing data significantly affected the findings of this study.
Free and Reduced Lunch
The AMS group consisted of the highest number of teacher respondents where 50%
or more of the students at their schools were eligible for free and reduced lunch. 5,825
teachers (50.1%) worked at these schools. There were 5,042 6-8 middle school teachers
(47.9%) who worked at schools where 50% or more of the students were eligible for free and
reduced lunch. K-8 school teachers had the lowest percentage (46.5%) of teacher
179
respondents that worked at schools where 50% or more of the students were eligible for free
and reduced lunch. Cross tabulations found that there were no significant differences in the
percentage of teachers who worked at schools where 50% or more of the students were
eligible for free and reduced lunch by school type when comparing K-8 to 6-8 middle school
teachers, or when comparing K-8 to AMS teachers. Hence, the percentage of teachers that
worked at schools where 50% or more of the students were eligible for free and reduced
lunch should not have resulted in differences in teachers’ perceptions of teacher working
condition domains by school type. This was the case since there were not significant
differences in the percentage of teachers by school type that worked at schools where 50% or
more of the students were eligible for free and reduced lunch.
2005-06 ABC School Recognition
The largest percentage of teacher respondents for all three school types worked in
schools designated as Schools of Progress as determined by the ABC’s of Public Education
for the State of North Carolina. Schools of Progress are the 4th highest designation schools
can receive for academic achievement under the ABC’s of Public Education. In a School of
Progress, 60-79% of students would be classified as proficient and the school would be
expected to show high growth as evidenced by student performance on end-of-grade tests
(North Carolina Report Cards). Thirty-seven percent or more of AMS and 6-8 middle school
teachers worked at Schools of Progress. By contrast, 33.2% of K-8 teacher respondents
worked at Schools of Progress.
The second largest percentage of teachers for all three school types worked at schools
receiving No Recognition. Schools that received No Recognition designations failed to
qualify for the School of Progress designation. Schools designated as No Recognition
180
schools did not make academic growth the previous year as it is defined by the ABCs of
Public Education. Making academic growth is a requirement for achieving the School of
Progress designation. Schools that received the No Recognition designation did achieve at
least 60% student proficiency on End-of-Grade tests, which is required to avoid being
designated as a Priority School. Schools are designated Priority Schools if 50 to 60%, or less
than 50% of students score at or above Achievement Level III on end-of-grade tests. Priority
Schools also fail to make expected or high growth (North Carolina Report Cards). K-8
schools had the largest percentage (29.2%) of teacher respondents working at schools
receiving the No Recognition designation. Each middle school group followed closely
behind as 27.3% of 6-8 middle school teachers and 26.6% of AMS teacher respondents
worked at schools receiving the No Recognition designation.
The third largest percentage of teachers for the 6-8 middle school and K-8 school
group worked at schools designated as Schools of Distinction. School of Distinction is the
third highest ABC Recognition a school can earn based on students’ academic achievement.
Schools of Distinction have 80-89% student proficiency and must be demonstrating expected
or high growth as a school (North Carolina Report Cards). Data indicated that 26.1% of K-8
teacher respondents worked at Schools of Distinction compared to 14.1% of 6-8 middle
school teacher respondents. In the AMS group, the third largest percentage of teacher
respondents worked at schools designated as Priority Schools. A Priority School designation
is given when a school does not meet academic growth and either 50-60% of students are
proficient, or less than 50% of students at a school meet proficiency standards (North
Carolina Report Cards). Only 7% of K-8 schools were designated as Priority Schools in
2005-06.

181
When comparing 6-8 middle school teacher respondents to K-8 teacher respondents,
the data revealed that 16.5% of 6-8 middle school teachers, compared to 10.2% of K-8
teachers, worked at Priority or Low Performing Schools, the two lowest school designations
for school academic achievement according to the ABC’s of Public Education. This
percentage increased to 19.3% for AMS teachers. When comparing 6-8 middle school
teacher respondents to K-8 teacher respondents at the two highest ABC designations, 3.3% of
6-8 middle school teachers worked at Honor Schools of Excellence or Schools of Excellence
compared to 1.2% of K-8 teachers. Honor Schools of Excellence achieved at least 90%
student proficiency, made expected or high growth, and as a school made Adequate Yearly
Progress (AYP). Schools of Excellence achieved at least 90% student proficiency and made
expected or high growth, but, did not make AYP (North Carolina Report Cards). Fewer
teachers worked at the two highest ABC designations (Honor Schools of Excellence and
Schools of Excellence) in the AMS group than the 6-8 middle school group, as this
percentage declined to 2.9% when AMS teachers were included.
Cross tabulations revealed that there were significant differences in the percentage of
teachers working at schools for each 2005-06 ABC School Recognition by school type when
comparing K-8 to 6-8 middle school teachers, and when comparing K-8 to AMS teachers.
As a result of the differences in the percentage of teachers working at schools for each 2005-
06 ABC School Recognition by school type, 2005-06 ABC School Recognition should be
examined as a potential factor that may have caused differences in teachers’ perceptions of
teacher working condition domains by school type.
182
Proficiency on 2005-06 Reading End-of-Grade Test (Percent Level III or Higher)
The largest percentage of teacher respondents for all three school types worked in
schools where 80-89% student proficiency was achieved. The 6-8 middle school group of
teacher respondents consisted of the largest percentage (55.0%) of teachers working in
schools with 80-89% student proficiency, followed closely by the AMS group at 52.1%, and
K-8 school teacher respondents at 46.8%. The second largest percentage of teachers for all
three school types worked in schools where at least 90% of students were proficient. A
larger percentage of K-8 school teacher respondents (37.4%) worked in schools with 90%
student proficiency or higher than 6-8 middle school (27.3%) and AMS teacher respondents
(27.0%). Cross tabulations revealed that there were significant differences by school type
between K-8 and 6-8 middle school teachers, and between K-8 and AMS teachers, and the
percentage of teachers working at schools at all levels of student proficiency on the 2005-06
Reading End-of-Grade test. As a result of the differences in the percentage of teachers
working at schools at all levels of student proficiency on the 2005-06 Reading End-of-Grade
test by school type, the percentage of students proficient on the 2005-06 Reading End-of-
Grade test should be examined as a potential factor that may have caused differences in
teachers’ perceptions of teacher working condition domains by school type. Please see
Table 11 for a listing of student/school characteristics by number and percentage of teacher
responses by school type for teachers in K-8, 6-8 middle, and AMS.

183
Table 11. Student/School Characteristics by School Type Middle Schools (6-8) vs. K-8 Schools
Student/School Characteristics School Type n Percent Total n
Free and Reduced Lunch (≥50 percent students eligible for)
Middle (6-8) 5042 47.9 10520
K-8 843 46.5 1813
Equivalence Test Chi Square
� =1.27 p=.260
2005-06 ABC School Recognition
Honor School of Excellence Middle (6-8) 293 2.8 10506
K-8 22 1.2 1791
School of Excellence Middle (6-8) 52 .5 10506
K-8 0 0 1791
School of Distinction Middle (6-8) 1486 14.1 10506
K-8 468 26.1 1791
School of Progress Middle (6-8) 4064 38.7 10506
K-8 595 33.2 1791
No Recognition Middle (6-8) 2872 27.3 10506
K-8 523 29.2 1791
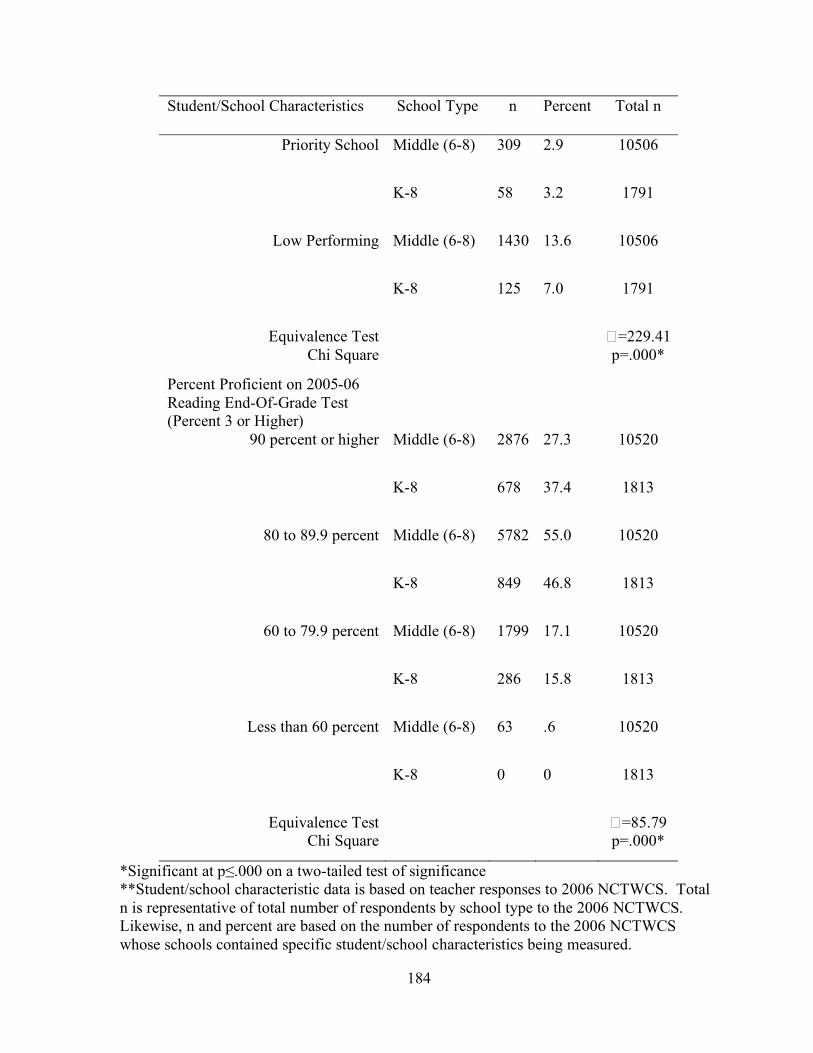
184
Student/School Characteristics School Type n Percent Total n
Priority School Middle (6-8) 309 2.9 10506
K-8 58 3.2 1791
Low Performing Middle (6-8) 1430 13.6 10506
K-8 125 7.0 1791
Equivalence Test Chi Square
� =229.41 p=.000*
Percent Proficient on 2005-06 Reading End-Of-Grade Test (Percent 3 or Higher)
90 percent or higher Middle (6-8) 2876 27.3 10520
K-8 678 37.4 1813
80 to 89.9 percent Middle (6-8) 5782 55.0 10520
K-8 849 46.8 1813
60 to 79.9 percent Middle (6-8) 1799 17.1 10520
K-8 286 15.8 1813
Less than 60 percent Middle (6-8) 63 .6 10520
K-8 0 0 1813
Equivalence Test Chi Square
� =85.79 p=.000*
*Significant at p≤.000 on a two-tailed test of significance **Student/school characteristic data is based on teacher responses to 2006 NCTWCS. Total n is representative of total number of respondents by school type to the 2006 NCTWCS. Likewise, n and percent are based on the number of respondents to the 2006 NCTWCS whose schools contained specific student/school characteristics being measured.
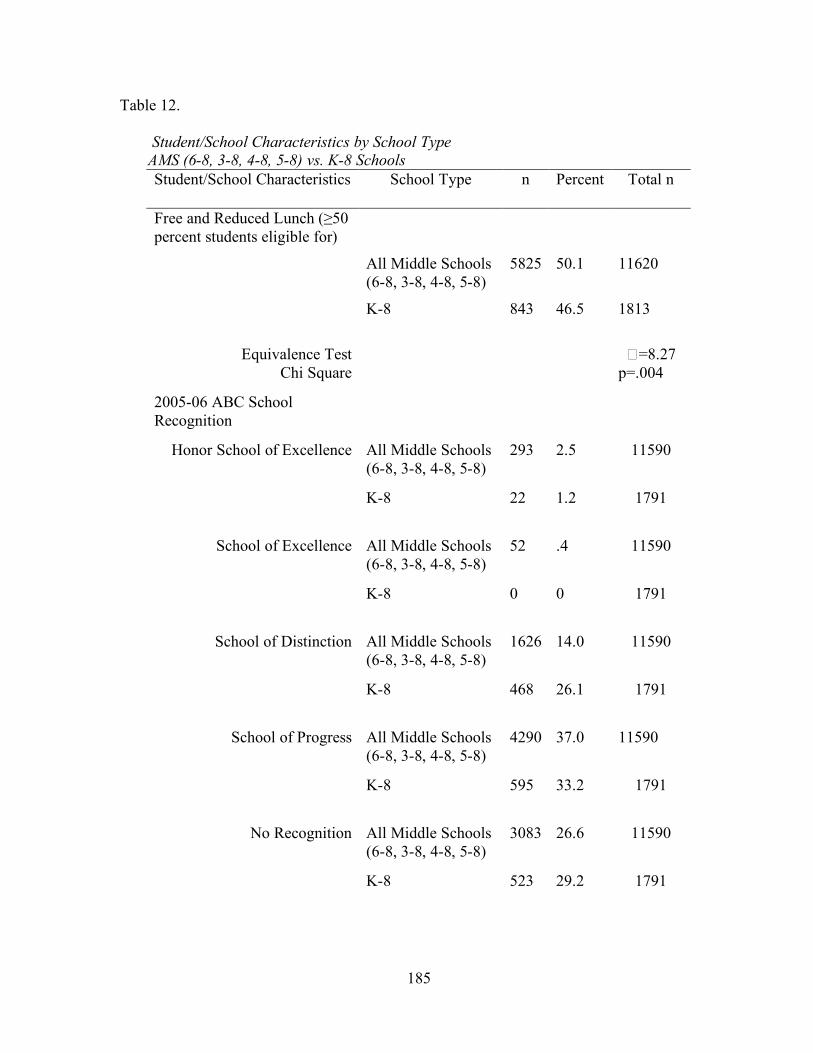
185
Table 12. Student/School Characteristics by School Type AMS (6-8, 3-8, 4-8, 5-8) vs. K-8 Schools
Student/School Characteristics School Type n Percent Total n
Free and Reduced Lunch (≥50 percent students eligible for)
All Middle Schools (6-8, 3-8, 4-8, 5-8)
5825 50.1 11620
K-8 843 46.5 1813
Equivalence Test Chi Square
� =8.27 p=.004
2005-06 ABC School Recognition
Honor School of Excellence All Middle Schools (6-8, 3-8, 4-8, 5-8)
293 2.5 11590
K-8 22 1.2 1791
School of Excellence All Middle Schools (6-8, 3-8, 4-8, 5-8)
52 .4 11590
K-8 0 0 1791
School of Distinction All Middle Schools (6-8, 3-8, 4-8, 5-8)
1626 14.0 11590
K-8 468 26.1 1791
School of Progress All Middle Schools (6-8, 3-8, 4-8, 5-8)
4290 37.0 11590
K-8 595 33.2 1791
No Recognition All Middle Schools (6-8, 3-8, 4-8, 5-8)
3083 26.6 11590
K-8 523 29.2 1791
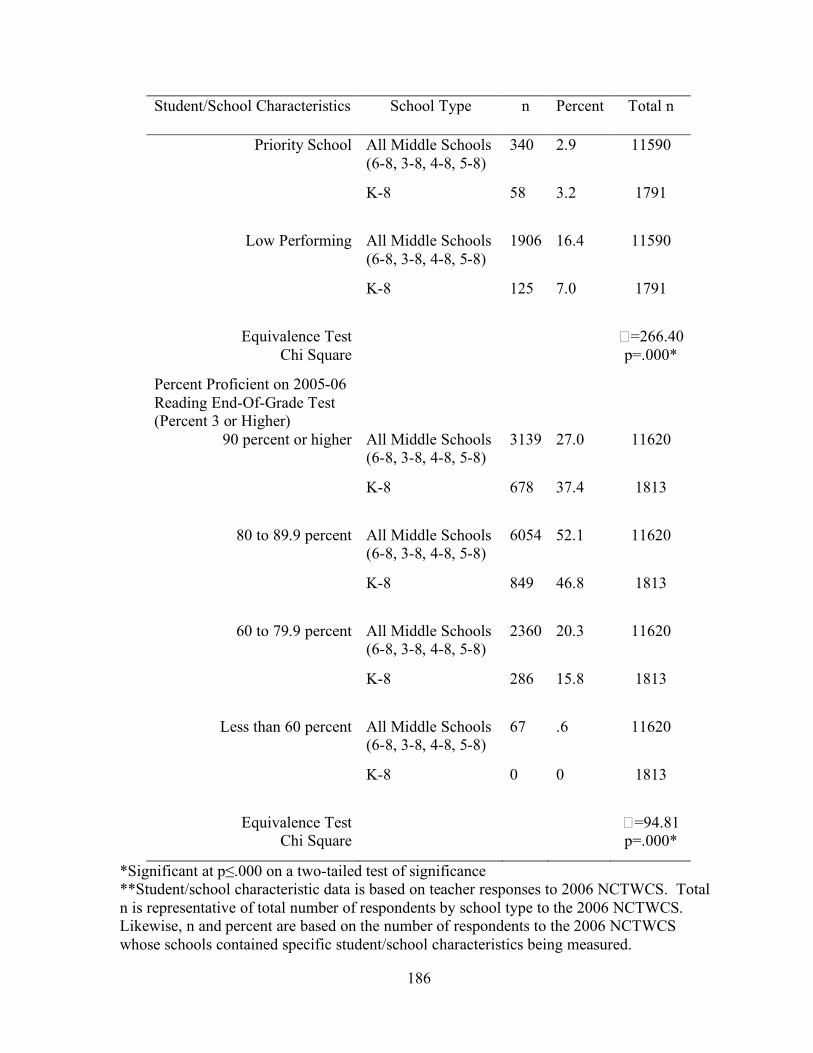
186
Student/School Characteristics School Type n Percent Total n
Priority School All Middle Schools (6-8, 3-8, 4-8, 5-8)
340 2.9 11590
K-8 58 3.2 1791
Low Performing All Middle Schools (6-8, 3-8, 4-8, 5-8)
1906 16.4 11590
K-8 125 7.0 1791
Equivalence Test Chi Square
� =266.40 p=.000*
Percent Proficient on 2005-06 Reading End-Of-Grade Test (Percent 3 or Higher)
90 percent or higher All Middle Schools (6-8, 3-8, 4-8, 5-8)
3139 27.0 11620
K-8 678 37.4 1813
80 to 89.9 percent All Middle Schools (6-8, 3-8, 4-8, 5-8)
6054 52.1 11620
K-8 849 46.8 1813
60 to 79.9 percent All Middle Schools (6-8, 3-8, 4-8, 5-8)
2360 20.3 11620
K-8 286 15.8 1813
Less than 60 percent All Middle Schools (6-8, 3-8, 4-8, 5-8)
67 .6 11620
K-8 0 0 1813
Equivalence Test Chi Square
� =94.81 p=.000*
*Significant at p≤.000 on a two-tailed test of significance **Student/school characteristic data is based on teacher responses to 2006 NCTWCS. Total n is representative of total number of respondents by school type to the 2006 NCTWCS. Likewise, n and percent are based on the number of respondents to the 2006 NCTWCS whose schools contained specific student/school characteristics being measured.
187
Section Two: Testing the Major Research Hypothesis and Sub-hypotheses
For a list of all research hypotheses, procedures, and variables used, please refer to
Chapter III. Standard deviations and means were calculated for all five teacher working
conditions domains for all three school types to measure teachers’ perceptions of teacher
working conditions means by school type. T-tests for independent samples were calculated
to compare the mean subscale scores for K-8 and 6-8 middle school teachers, as well as K-8
and AMS teachers. T-tests for independent samples also test for significant differences in
teachers’ perceptions of teacher working conditions domain means by school type.
Correlations were calculated among the teacher working conditions domain mean subscale
scores, and between teacher working conditions domain mean subscale scores and school
type, teacher demographic variables, and student/school characteristic variables using data
that included AMS and K-8 teachers. Correlations were calculated to test for significant
relationships between teachers’ perceptions of teacher working conditions domains as
measured by mean subscale scores and independent variables. Correlation results that
indicated significant relationships between teachers’ perceptions of the teacher working
conditions domains and independent variables were further tested using one-way ANCOVA
statistical procedures. Independent variables that had significant relationships with teachers’
perceptions of the teacher working conditions domains were imported as co-variates to
estimate the differences in teachers’ perceptions of teacher working conditions domains that
may have been caused by co-variates.
188
Hypothesis 1
Based on the literature review (which found that elementary teachers reported more
positive perceptions of all teacher working condition domains except time for the 2004 and
2006 administrations of the NCTWCS), it was hypothesized that K-8 teachers would report
less satisfaction with the use of time at their schools than AMS teachers. This researcher
proposed this hypothesis as prior analysis of the 2004 and 2006 NCTWCS data by Hirsch
(2005b) and Hirsch and Emerick with Church and Fuller (2006a) by school type for
elementary (K-5), middle (6-8), and high school (9-12) teachers indicated that elementary
teachers reported more positive perceptions of all teacher working conditions domains except
time. Since K-5 teachers are included within the sample for K-8 school teachers in this study
and cannot be identified by removing them from the sample due to safeguards in
confidentiality, this researcher presumed that K-8 school teachers would report less
satisfaction with the use of time at their schools than AMS teachers. The results, as indicated
in Table 13, revealed that K-8 teachers did not report greater satisfaction than 6-8 middle
school or AMS teachers with the use of time. T-tests for independent samples indicated the
differences in means for teachers’ perceptions of the use of time by school type between K-8
teachers and 6-8 middle school teachers, as well as between K-8 teachers and AMS teachers,
were significant at p≤.000, two-tailed. A correlation of -.036 was found between school type
and teachers’ perceptions with the use of time at their school. Results, as indicated in Table
16, revealed a statistically significant relationship at p≤.000, two-tailed.
Hypothesis 2
Based on the literature review (which found that elementary teachers reported more
positive perceptions of all teacher working conditions domains except time for the 2004 and
189
2006 administrations of the NCTWCS), it was hypothesized that K-8 teachers would report
greater satisfaction with access to facilities and resources than AMS teachers according to the
2006 NCTWCS. This researcher proposed this hypothesis as prior analyses of the 2004 and
2006 NCTWCS data by Hirsch (2005b) and Hirsch and Emerick with Church and Fuller
(2006a) by school type for elementary (K-5), middle (6-8), and high school (9-12) teachers
indicated that elementary teachers reported more positive perceptions of all teacher working
conditions domains except time. Since K-5 teachers were included within the sample for K-8
school teachers in this study, and could not be identified to be removed from the sample due
to safeguards in confidentiality, this researcher presumed that K-8 school teachers would
report greater satisfaction with access to facilities and resources at their schools than AMS
teachers. Results, as indicated in Table 13, revealed that K-8 teachers did report greater
satisfaction than 6-8 middle school and AMS teachers with access to facilities and resources
at their schools. T-tests for independent samples indicated the differences in means for
teachers’ perceptions of access to facilities and resources by school type between K-8
teachers and 6-8 middle school teachers, as well as between K-8 teachers and AMS teachers,
were significant at p≤.000, two-tailed. A correlation of .036 was found between school type
and teachers’ perceptions of access to facilities and resources at their school. Results, as
indicated in Table 16, revealed a statistically significant relationship at p≤.000, two-tailed.
Hypothesis 3
Based on the literature review (which found that elementary teachers reported more
positive perceptions of all teacher working conditions domains except time for the 2004 and
2006 administrations of the NCTWCS), it was hypothesized that K-8 teachers would report
greater satisfaction with leadership at their schools than AMS teachers according to the 2006
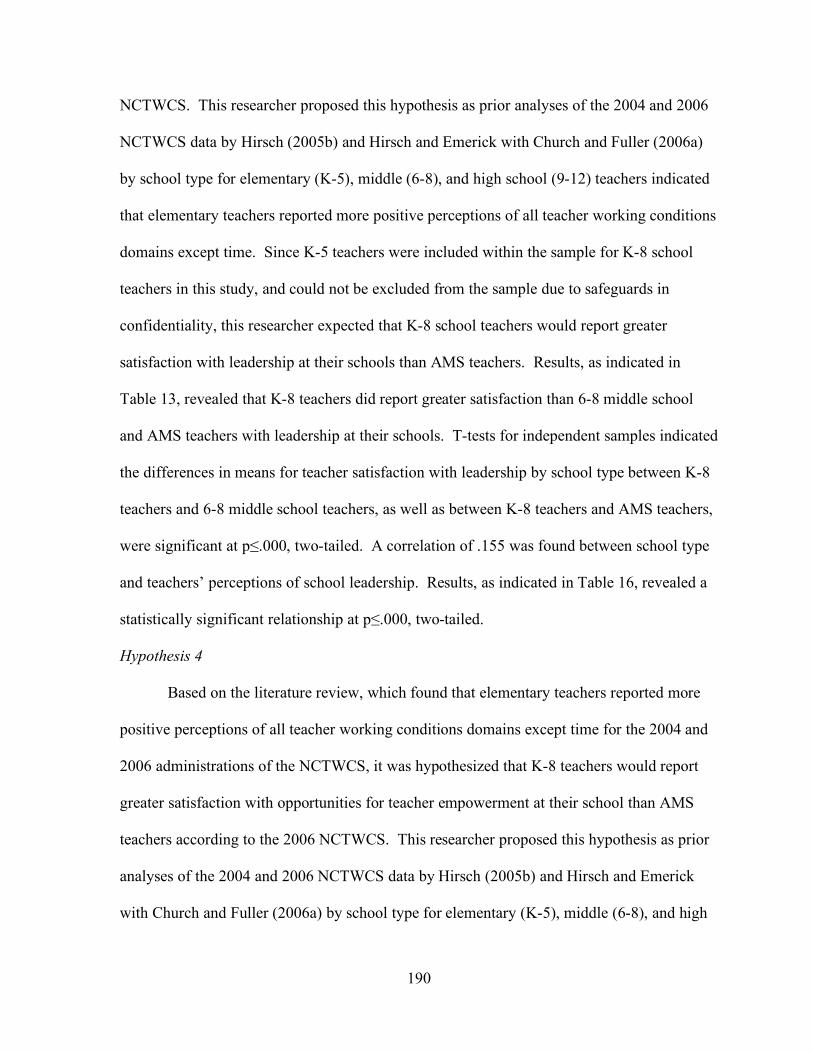
190
NCTWCS. This researcher proposed this hypothesis as prior analyses of the 2004 and 2006
NCTWCS data by Hirsch (2005b) and Hirsch and Emerick with Church and Fuller (2006a)
by school type for elementary (K-5), middle (6-8), and high school (9-12) teachers indicated
that elementary teachers reported more positive perceptions of all teacher working conditions
domains except time. Since K-5 teachers were included within the sample for K-8 school
teachers in this study, and could not be excluded from the sample due to safeguards in
confidentiality, this researcher expected that K-8 school teachers would report greater
satisfaction with leadership at their schools than AMS teachers. Results, as indicated in
Table 13, revealed that K-8 teachers did report greater satisfaction than 6-8 middle school
and AMS teachers with leadership at their schools. T-tests for independent samples indicated
the differences in means for teacher satisfaction with leadership by school type between K-8
teachers and 6-8 middle school teachers, as well as between K-8 teachers and AMS teachers,
were significant at p≤.000, two-tailed. A correlation of .155 was found between school type
and teachers’ perceptions of school leadership. Results, as indicated in Table 16, revealed a
statistically significant relationship at p≤.000, two-tailed.
Hypothesis 4
Based on the literature review, which found that elementary teachers reported more
positive perceptions of all teacher working conditions domains except time for the 2004 and
2006 administrations of the NCTWCS, it was hypothesized that K-8 teachers would report
greater satisfaction with opportunities for teacher empowerment at their school than AMS
teachers according to the 2006 NCTWCS. This researcher proposed this hypothesis as prior
analyses of the 2004 and 2006 NCTWCS data by Hirsch (2005b) and Hirsch and Emerick
with Church and Fuller (2006a) by school type for elementary (K-5), middle (6-8), and high

191
school (9-12) teachers indicated that elementary teachers reported more positive perceptions
of all teacher working conditions domains except time. Since K-5 teachers were included
within the sample for K-8 school teachers in this study, and could not be identified and
removed from the sample due to safeguards in confidentiality put in place to protect teacher
respondents’ identity, this researcher expected that K-8 school teachers would report greater
satisfaction with opportunities for teacher empowerment at their schools than AMS teachers.
Results, as indicated in Table 13, revealed that K-8 teachers did report greater satisfaction
than 6-8 middle school and AMS teachers with opportunities for teacher empowerment at
their schools. T-tests for independent samples indicated the differences in means for
teachers’ perceptions of opportunities for teacher empowerment by school type between K-8
teachers and 6-8 middle school teachers, as well as between K-8 teachers and AMS teachers,
were significant at p≤.000, two-tailed. A correlation of .112 was found between school type
and teachers’ perceptions of opportunities for teacher empowerment at their school. Results,
as indicated in Table 16, revealed a statistically significant relationship at p≤.000, two-tailed.
Hypothesis 5
Based on the literature review (which found that elementary teachers reported more
positive perceptions of all teacher working condition domains except time for the 2004 and
2006 administrations of the NCTWCS), it was hypothesized that K-8 teachers would report
greater satisfaction with the professional development offered at their schools than AMS
teachers according to the 2006 NCTWCS. This researcher proposed this hypothesis as prior
analyses of the 2004 and 2006 NCTWCS data by Hirsch (2005b) and Hirsch and Emerick
with Church and Fuller (2006a) by school type for elementary (K-5), middle (6-8), and high
school (9-12) teachers indicated that elementary teachers reported more positive perceptions

192
of all teacher working conditions domains except time. Since K-5 teachers were included
within the sample for K-8 school teachers in this study, and could not be identified for
exclusion from the sample due to safeguards in confidentiality put in place to protect teacher
respondents’ identity, this researcher expected that K-8 school teachers would report greater
satisfaction with the professional development offered at their schools than AMS teachers.
Results, as indicated in Table 13, revealed that K-8 teachers reported greater satisfaction than
6-8 middle school teachers with opportunities for professional development at their schools.
However, AMS teachers reported greater satisfaction than K-8 teachers with opportunities
for professional development at their schools. T-tests for independent samples indicated the
differences in means for teachers’ perceptions of opportunities for professional development
by school type between K-8 teachers and 6-8 middle school teachers, as well as between K-8
teachers and AMS teachers, were not significant at p≤.000, two-tailed. A correlation of .005
was found between school type and teachers’ perceptions of opportunities for professional
development at their school. Results, as indicated in Table 16, revealed there was not a
statistically significant relationship at p≤.000, two-tailed.
Summary of Hypotheses 1-5
For three of the five teacher working conditions domains (facilities and resources,
leadership, and teacher empowerment), K-8 teachers reported greater satisfaction with
working conditions in their schools than 6-8 middle school and AMS teachers. For facilities
and resources, leadership, and teacher empowerment, there were statistically significant
relationships between each teacher working conditions domain and school type. Differences
in means by school type for teachers’ perceptions of facilities and resources, leadership, and

193
teacher empowerment, as determined by t-tests for independent samples, were also
significant.
K-8 teachers reported less satisfaction with one working conditions domain, the use
of time, than 6-8 middle school and AMS teachers. There were statistically significant
relationships between the use of time and school type when comparing K-8 teachers to 6-8
middle school teachers, and when comparing K-8 teachers to AMS teachers. Differences in
means by school type for teachers’ perceptions of the use of time, as determined by t-tests for
independent samples, were also significant. K-8 teachers also reported less satisfaction with
opportunities for professional development than AMS teachers, but were more satisfied with
opportunities for professional development than 6-8 middle school teachers. There were no
statistically significant relationships between teachers’ perceptions of opportunities for
professional development and school type when comparing K-8 teachers to 6-8 middle
school teachers, or when comparing K-8 teachers to AMS teachers. Differences in means by
school type for teachers’ perceptions of opportunities for professional development, as
determined by t-tests for independent samples, were also not significant. (See Tables 17 and
18 for summary information on the relationship between teachers’ perceptions of working
conditions, i.e., teacher satisfaction with working conditions and school type).
Correlation results indicated the multicolinearity of all teacher working conditions
domain subscales. Multicolinearity means that there are multiple significant relationships
among variables. Hence, when one variable changes, other related variables change also.
Multicolinearity indicated there were multiple significant relationships among teacher
working conditions domain subscales. The strongest significant correlation (.780) among
teacher working conditions domain subscales was between leadership and teacher

194
empowerment. The weakest correlation (.497) among teacher working conditions domain
subscales was between time and professional development. All correlations among teacher
working conditions domain subscales were positive and ranged from .497 to .780. See Table
16 for complete results on correlations among teacher working conditions domain subscales.
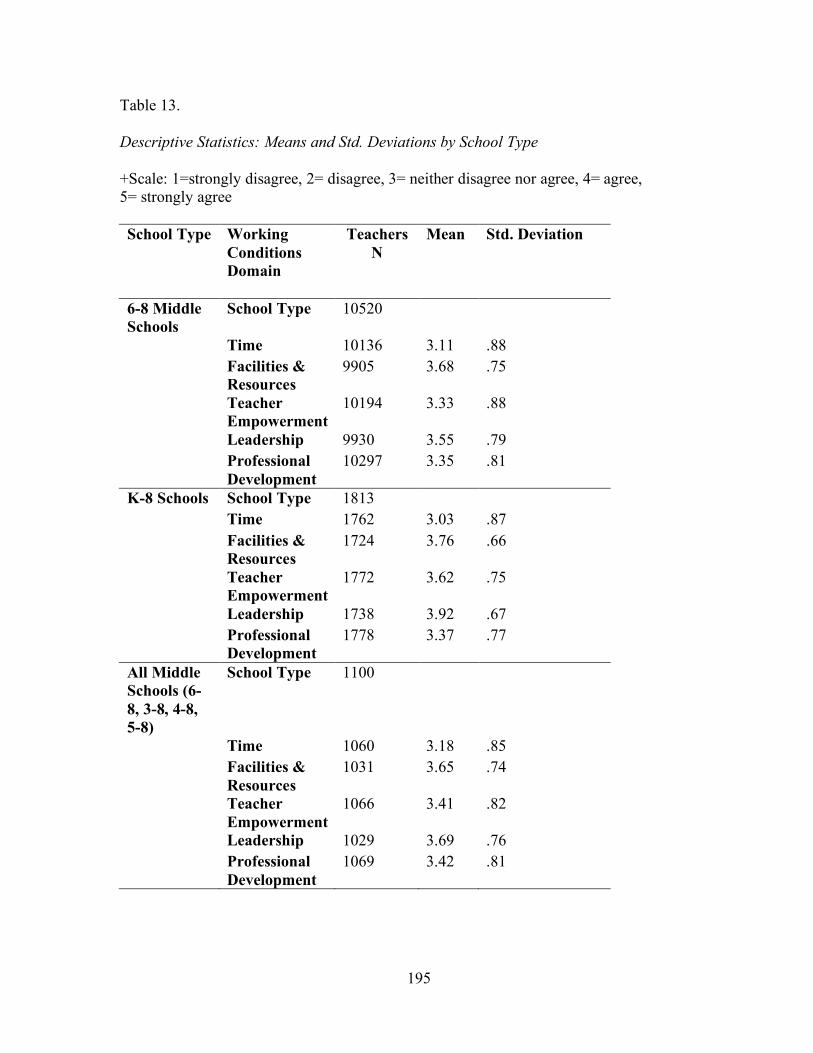
195
Table 13. Descriptive Statistics: Means and Std. Deviations by School Type +Scale: 1=strongly disagree, 2= disagree, 3= neither disagree nor agree, 4= agree, 5= strongly agree School Type Working
Conditions Domain
Teachers N
Mean Std. Deviation
6-8 Middle Schools
School Type 10520
Time 10136 3.11 .88 Facilities &
Resources 9905 3.68 .75
Teacher Empowerment
10194 3.33 .88
Leadership 9930 3.55 .79 Professional
Development 10297 3.35 .81
K-8 Schools School Type 1813 Time 1762 3.03 .87 Facilities &
Resources 1724 3.76 .66
Teacher Empowerment
1772 3.62 .75
Leadership 1738 3.92 .67 Professional
Development 1778 3.37 .77
All Middle Schools (6-8, 3-8, 4-8, 5-8)
School Type 1100
Time 1060 3.18 .85 Facilities &
Resources 1031 3.65 .74
Teacher Empowerment
1066 3.41 .82
Leadership 1029 3.69 .76 Professional
Development 1069 3.42 .81
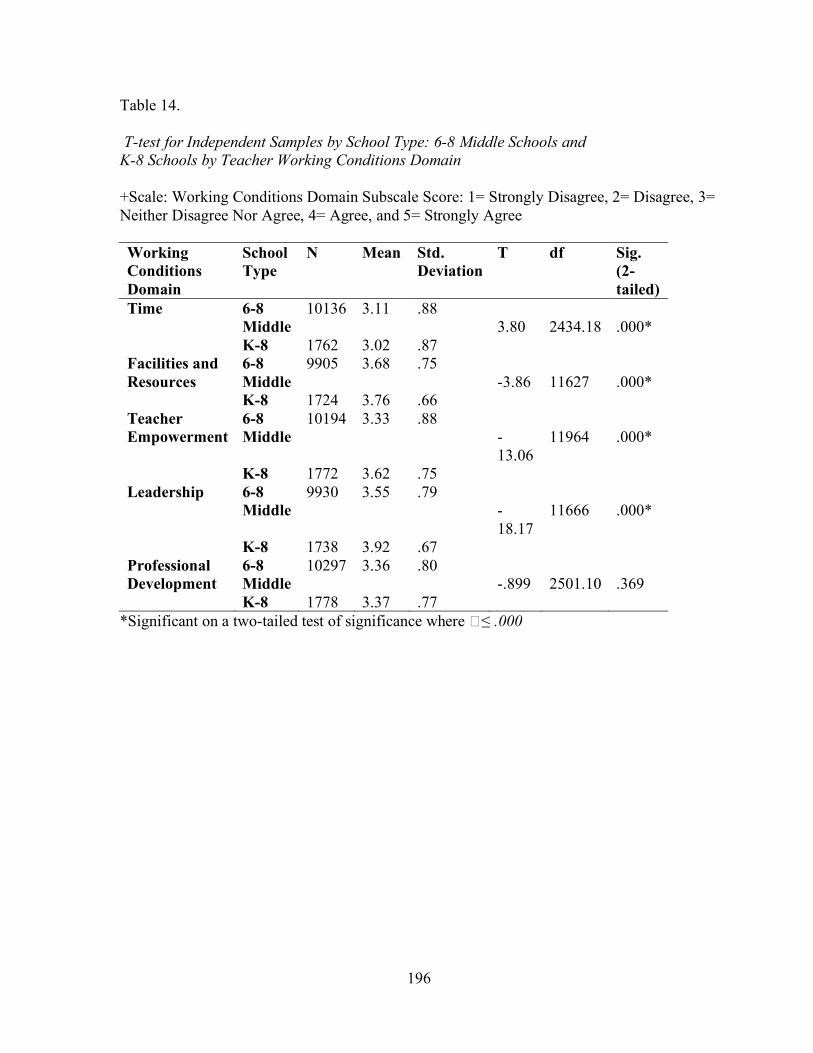
196
Table 14. T-test for Independent Samples by School Type: 6-8 Middle Schools and K-8 Schools by Teacher Working Conditions Domain +Scale: Working Conditions Domain Subscale Score: 1= Strongly Disagree, 2= Disagree, 3= Neither Disagree Nor Agree, 4= Agree, and 5= Strongly Agree Working Conditions Domain
School Type
N Mean Std. Deviation
T df Sig. (2-tailed)
Time 6-8 Middle
10136 3.11 .88 3.80
2434.18
.000*
K-8 1762 3.02 .87 Facilities and Resources
6-8 Middle
9905 3.68 .75 -3.86
11627
.000*
K-8 1724 3.76 .66 Teacher Empowerment
6-8 Middle
10194 3.33 .88 -13.06
11964
.000*
K-8 1772 3.62 .75 Leadership 6-8
Middle 9930 3.55 .79
-18.17
11666
.000*
K-8 1738 3.92 .67 Professional Development
6-8 Middle
10297 3.36 .80 -.899
2501.10
.369
K-8 1778 3.37 .77 *Significant on a two-tailed test of significance where � ≤ .000

197
Table 15. T-test for Independent Samples by School Type: All Middle Schools (6-8, 3-8, 4-8, 5-8) and K-8 Schools by Teacher Working Conditions Domain +Scale: Working Conditions Domain Subscale Score: 1= Strongly Disagree, 2= Disagree, 3= Neither Disagree Nor Agree, 4= Agree, and 5= Strongly Agree
Working Conditions Domain
School Type
N Mean Std. Deviation
T df Sig. (2-tailed)
Time All Middle Schools
11196 3.12 .88 4.10
2363.95
.000*
K-8 1762 3.02 .87 Facilities and Resources
All Middle Schools
10936 3.68 .75 -4.03
12658
.000*
K-8 1724 3.76 .66 Teacher Empowerment
All Middle Schools
11260 3.34 .87 -12.85
13030
.000*
K-8 1772 3.62 .75 Leadership All
Middle Schools
10959 3.57 .79 -17.67
12695
.000*
K-8 1738 3.92 .67 Professional Development
All Middle Schools
11366 3.36 .81 -.59
2430.86
.55
K-8 1778 3.37 .77 *Significant on a two-tailed test of significance where � ≤ .000
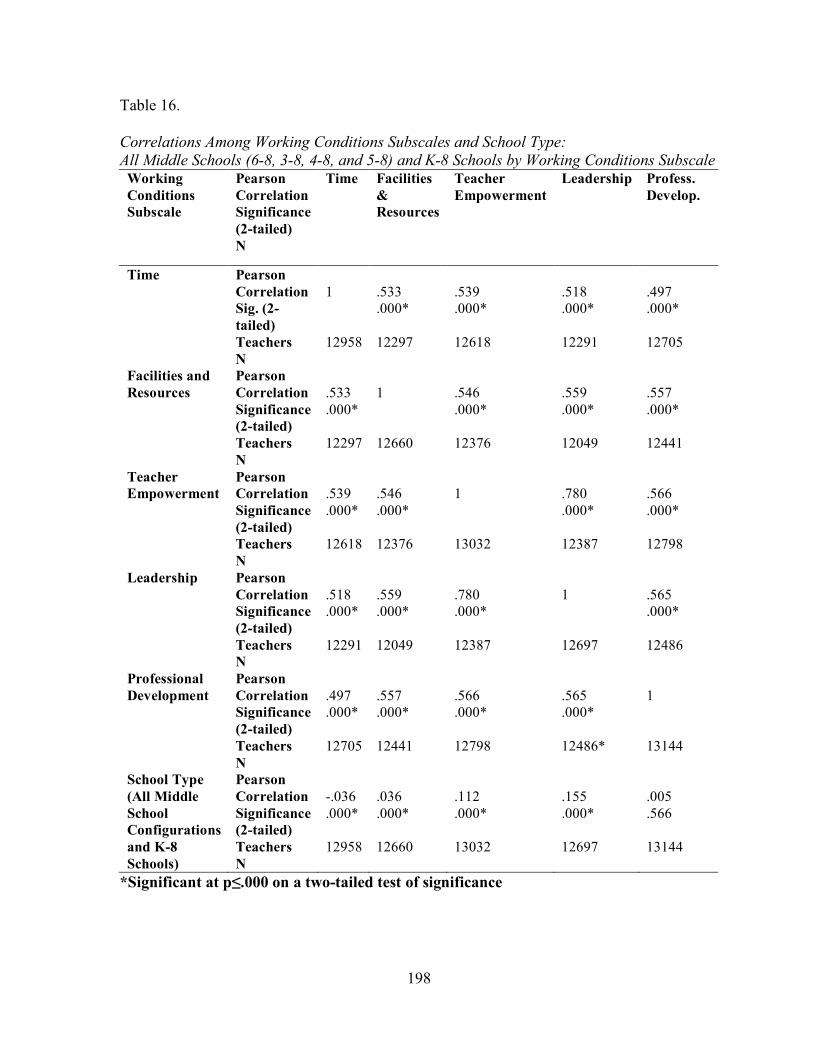
198
Table 16. Correlations Among Working Conditions Subscales and School Type: All Middle Schools (6-8, 3-8, 4-8, and 5-8) and K-8 Schools by Working Conditions Subscale
Working Conditions Subscale
Pearson Correlation Significance (2-tailed) N
Time Facilities & Resources
Teacher Empowerment
Leadership Profess. Develop.
Time Pearson Correlation Sig. (2-tailed) Teachers N
1 12958
.533 .000* 12297
.539 .000* 12618
.518 .000* 12291
.497 .000* 12705
Facilities and Resources
Pearson Correlation Significance (2-tailed) Teachers N
.533 .000* 12297
1 12660
.546 .000* 12376
.559 .000* 12049
.557 .000* 12441
Teacher Empowerment
Pearson Correlation Significance (2-tailed) Teachers N
.539 .000* 12618
.546 .000* 12376
1 13032
.780 .000* 12387
.566 .000* 12798
Leadership Pearson Correlation Significance (2-tailed) Teachers N
.518 .000* 12291
.559 .000* 12049
.780 .000* 12387
1 12697
.565 .000* 12486
Professional Development
Pearson Correlation Significance (2-tailed) Teachers N
.497 .000* 12705
.557 .000* 12441
.566 .000* 12798
.565 .000* 12486*
1 13144
School Type (All Middle School Configurations and K-8 Schools)
Pearson Correlation Significance (2-tailed) Teachers N
-.036 .000* 12958
.036 .000* 12660
.112 .000* 13032
.155 .000* 12697
.005 .566 13144
*Significant at p≤.000 on a two-tailed test of significance

199
Table 17. Summary of the Effect of Grade Configuration on Teachers’ Perceptions of Working Conditions in Public 6-8 Middle and K-8 Schools in North Carolina with Research Sub-hypotheses 1-5
Working Conditions Domain
Results of Teachers’ Perceptions of Working Conditions Domains by School Type
Time
6-8 Middle Schools>K-8
Facilities and Resources
6-8 Middle Schools<K-8
Teacher Empowerment
6-8 Middle Schools<K-8
Leadership 6-8 Middle Schools<K-8
Professional Development
6-8 Middle Schools<K-8
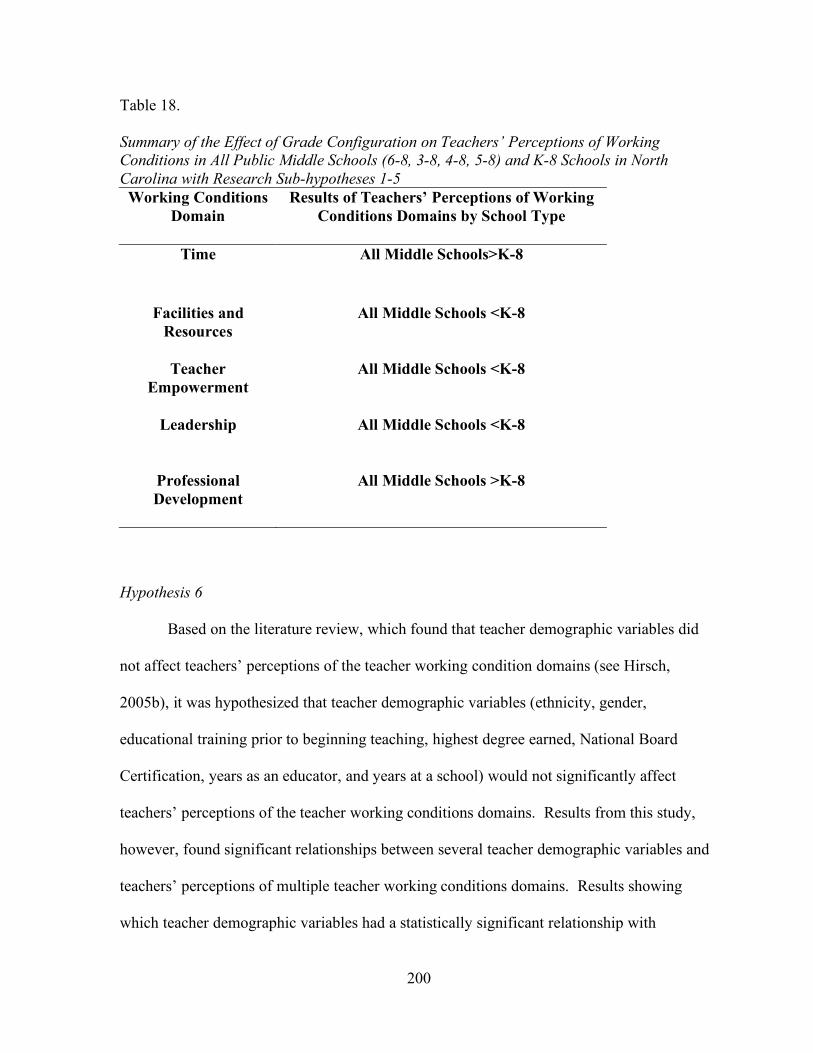
200
Table 18. Summary of the Effect of Grade Configuration on Teachers’ Perceptions of Working Conditions in All Public Middle Schools (6-8, 3-8, 4-8, 5-8) and K-8 Schools in North Carolina with Research Sub-hypotheses 1-5
Working Conditions Domain
Results of Teachers’ Perceptions of Working Conditions Domains by School Type
Time
All Middle Schools>K-8
Facilities and Resources
All Middle Schools <K-8
Teacher Empowerment
All Middle Schools <K-8
Leadership All Middle Schools <K-8
Professional Development
All Middle Schools >K-8
Hypothesis 6
Based on the literature review, which found that teacher demographic variables did
not affect teachers’ perceptions of the teacher working condition domains (see Hirsch,
2005b), it was hypothesized that teacher demographic variables (ethnicity, gender,
educational training prior to beginning teaching, highest degree earned, National Board
Certification, years as an educator, and years at a school) would not significantly affect
teachers’ perceptions of the teacher working conditions domains. Results from this study,
however, found significant relationships between several teacher demographic variables and
teachers’ perceptions of multiple teacher working conditions domains. Results showing
which teacher demographic variables had a statistically significant relationship with

201
individual teacher working conditions domains are shown in Table 19. Details showing the
significant results of the one-way ANCOVA calculations are shown in Table 21. Details for
the significant correlations between teacher demographic variables and individual teacher
working conditions domains are shown in Table 21.
Results indicated significant relationships between ethnicity and the teacher working
conditions domains at p≤.000, two-tailed. All correlations were negative, meaning that when
one variable increases, the other decreases. The strongest correlation (-.084) was between
ethnicity and professional development. The other four correlations between ethnicity and
teacher working conditions domains ranged from -.042 to -.048.
Results also indicated multiple significant relationships between gender and teacher
working conditions domains. The highest significant correlation (.064) was between gender
and the use of time. The other significant correlation (.037) was between gender and access
to facilities and resources. All correlations were positive between gender and teacher
working condition domains.
Results revealed one significant relationship for the teacher demographic variable of
educational training prior to beginning teaching. This significant correlation (-.035) was
between educational training prior to beginning teaching and the use of time. All
correlations were negative between educational training prior to beginning teaching and
teacher working conditions domains.
Results indicated two significant relationships between highest degree earned by
teachers and teacher working condition domains. Significant correlations were found
between highest degree earned and opportunities for teacher empowerment (-.032), and
between highest degree earned and opportunities for professional development (-.037). All

202
correlations were negative between highest degree earned and teacher working conditions
domains.
There were no significant relationships between National Board Certification status of
teachers and any teacher working conditions domain. Results indicated one significant
relationship between years as an educator and one teacher working conditions domain. A
significant correlation (.041) was found between years as an educator and leadership. There
was also one significant relationship between teachers’ years at a school and one teacher
working conditions domain. A significant correlation (-.053) was found between years at a
school and the use of time. Please see Table 19 for results showing which teacher
demographic variables had a statistically significant relationship with individual teacher
working conditions domains.
One-way ANCOVA tests were completed to evaluate the relationship between
teacher demographic variables and their effect on teachers’ perceptions of working
conditions for all teacher demographic variables. The results indicated a significant
relationship between teacher demographic variables and the teacher working conditions
domains. Results showing which teacher demographic variables had a statistically
significant relationship with teacher working conditions domains are shown in Table 19.
Details showing the results of ANCOVA calculations for statistically significant relationships
are shown in Table 21. More comprehensive results for ANCOVA calculations are found in
Table 21. Please note that each teacher demographic variable had a significant overall
relationship to a teacher working conditions domain. However, the strength of the
relationship as assessed by � 2 was weak as each teacher demographic variable explained less
than one percent of the variance of teachers’ perceptions of the working conditions domain.

203
Table 19. Correlations Between Teachers’ Perceptions of Teacher Working Conditions Domains and Teacher Demographic Variables by School Type: All Middle Schools (6-8, 3-8, 4-8, and 5-8) and K-8 Schools
Teacher Demographic Variable
Time Facilities & Resources
Teacher Empowerment
Leadership Profess. Develop.
Gender Pearson Correlation Significance (2-tailed) N
.064 .000* 12543
.037 .000* 12251
.010 .247 12613
.018 .051 12290
.010 .254 12722
Educational Training Prior to Beginning Teaching
Pearson Correlation Significance (2-tailed) N
-.035 .000* 12823
-.027 .003 12528
-.027 .002 12905
-.029 .001 12570
-.028 .001 13015
Highest Degree Earned
Pearson Correlation Significance (2-tailed) N
-.025 .005 12801
-.015 .097 12505
-.032 .000* 12881
-.016 .066 12550
-.037 .000* 12995
National Board Certification
Pearson Correlation Significance (2-tailed) N
-.005 .543 12751
-.016 .082 12458
.007 .448 12829
-.002 .796 12500
.027 .002 12943
Years as an Educator
Pearson Correlation Significance (2-tailed) N
-.009 .302 12768
-.005 .595 12473
.001 .880 12845
.041 .000* 12518
-.014 .102 12957
Years at a School
Pearson Correlation Significance (2-tailed) N
-.053 .000* 12727
-.007 .418 12427
-.021 .018 12800
.001 .937 12473
-.026 .003 12915
*Significant at p≤.000 on a two-tailed test of significance

204
Table 20. ANCOVA for Teacher Demographic Variables and Teachers’ Perceptions of Teacher Working Conditions Domains Relationship Between Teacher Demographic Variables and Teachers’ Perceptions of Teacher
Working Conditions Domains
Teacher working conditions domains for each independent variable where there was a significant relationship
(df between groups, df within groups)=F Teacher Working Conditions Domain
Time Facilities and Resources
Teacher Empowerment
Leadership Professional Development
Teacher Demographic Variable
Ethnicity (1,12507)= 21.96
(1,12219)= 24.33
(1,12580)= 39.76
(1,12261)= 37.08
(1,12693)= 90.91
Gender (1,12540)= 46.17
(1,12248)= 20.77
Educational Training Prior to Beginning Teaching
(1,12820)= 17.95
Highest Degree Earned
(1,12878)= 12.42
(1,12992)= 17.97
National Board Certification
Years as an Educator
(1,12515)= 14.32
Years at School
(1,12724)= 32.30
*correlation is significant at p≤.000
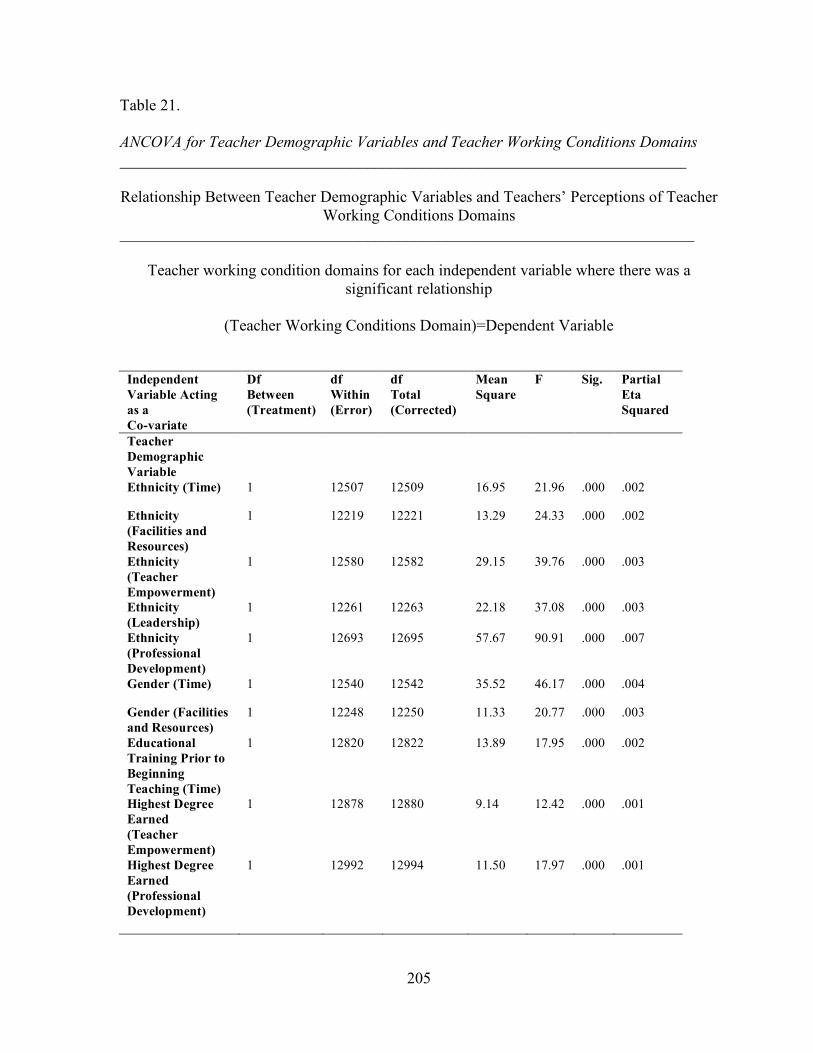
205
Table 21. ANCOVA for Teacher Demographic Variables and Teacher Working Conditions Domains _______________________________________________________________________ Relationship Between Teacher Demographic Variables and Teachers’ Perceptions of Teacher
Working Conditions Domains ________________________________________________________________________
Teacher working condition domains for each independent variable where there was a significant relationship
(Teacher Working Conditions Domain)=Dependent Variable
Independent Variable Acting as a Co-variate
Df Between (Treatment)
df Within (Error)
df Total (Corrected)
Mean Square
F Sig. Partial Eta Squared
Teacher Demographic Variable
Ethnicity (Time) 1 12507 12509 16.95 21.96 .000 .002
Ethnicity (Facilities and Resources)
1 12219 12221 13.29 24.33 .000 .002
Ethnicity (Teacher Empowerment)
1 12580 12582 29.15 39.76 .000 .003
Ethnicity (Leadership)
1 12261 12263 22.18 37.08 .000 .003
Ethnicity (Professional Development)
1 12693 12695 57.67 90.91 .000 .007
Gender (Time) 1 12540 12542 35.52 46.17 .000 .004
Gender (Facilities and Resources)
1 12248 12250 11.33 20.77 .000 .003
Educational Training Prior to Beginning Teaching (Time)
1 12820 12822 13.89 17.95 .000 .002
Highest Degree Earned (Teacher Empowerment)
1 12878 12880 9.14 12.42 .000 .001
Highest Degree Earned (Professional Development)
1 12992 12994 11.50 17.97 .000 .001
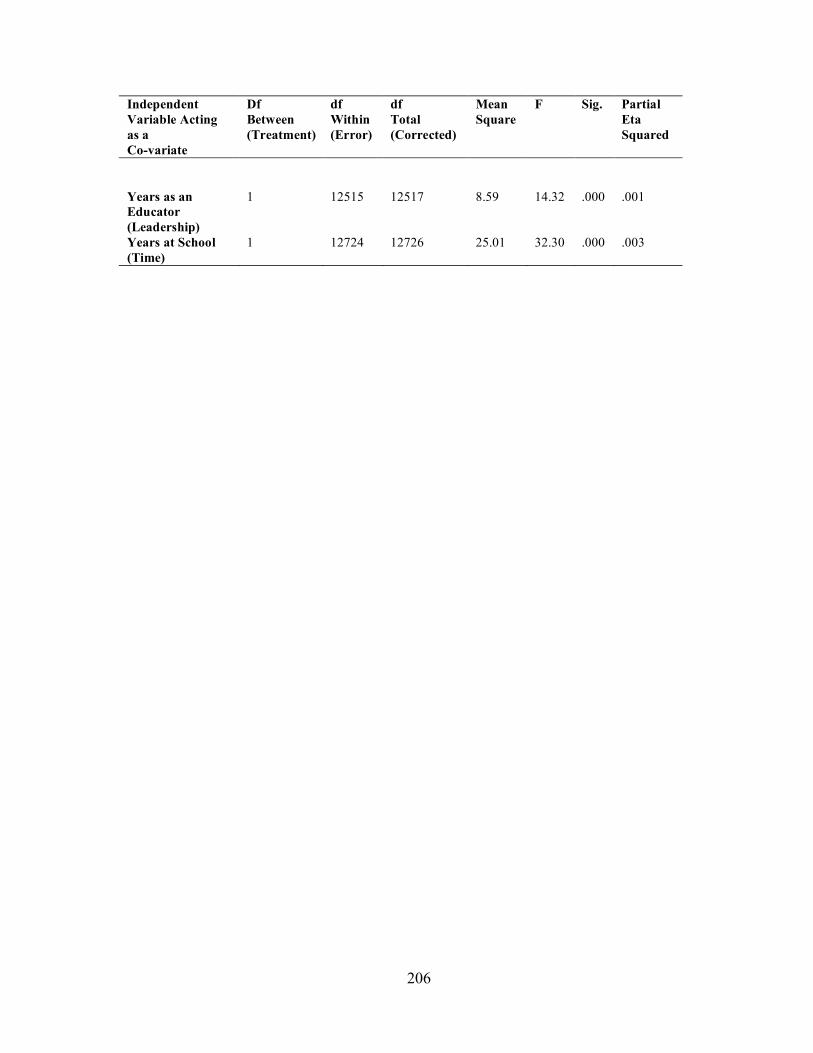
206
Independent Variable Acting as a Co-variate
Df Between (Treatment)
df Within (Error)
df Total (Corrected)
Mean Square
F Sig. Partial Eta Squared
Years as an Educator (Leadership)
1
12515
12517
8.59
14.32
.000
.001
Years at School (Time)
1 12724 12726 25.01 32.30 .000 .003

207
Hypothesis 7
Based on the literature review, which found that there was a significant relationship
based on negative correlations between the percentage of students’ eligible for free and
reduced lunch at a school and teacher retention (see Hirsch, 2005b), it was hypothesized that
socio-economic status of students would significantly affect teachers’ perceptions of all
teacher working conditions domains except time. Based on the literature review, which
found that there were significant relationships between teachers’ perceptions of the teacher
working conditions domains except time and measures of student/school academic
achievement such as ABC School Recognition, ABC growth, and AYP status according to
Hirsch (2005b), it was hypothesized that student/school characteristics measuring
student/school academic achievement (as measured by 2005-06 ABC School Recognition
and percentage of students’ proficient on the 2005-06 Reading End-of-Grade test) would
significantly affect teachers’ perceptions of the teacher working conditions domains except
time. Results showing which student/school characteristics variables have a statistically
significant relationship with individual teacher working conditions domains are shown in
Table 22. Details showing the significant results of the one-way ANCOVA calculations are
shown in Table 24. Details for the significant relationships between student/school
characteristics variables and individual teacher working conditions domains are also
illustrated in Table 23.
Results indicated significant relationships between the percentage of students eligible
for free and reduced lunch and the three teacher working conditions domains (facilities and
resources, teacher empowerment, and leadership) at p≤.000, two-tailed. All correlations
208
were positive, with the highest correlation (.126) between the percentage of students eligible
for free and reduced lunch and teachers’ access to facilities and resources.
Results indicated significant relationships between 2005-06 ABC School
Recognitions and the teacher working conditions domains. All correlations were negative
ranging from -.174 for facilities and resources to -.045 for professional development. Results
also indicated significant relationships between the percentage of students’ proficient on the
2005-06 Reading EOG test and the teacher working conditions domains. All correlations
were positive ranging from .038 for professional development to .175 for facilities and
resources.
One-way ANCOVA tests were completed to evaluate the relationship between
student/school characteristics and their effect on teachers’ perceptions of working conditions
for the student/school characteristics variables where the results indicated a significant
relationship between student/school characteristics variables and teacher working conditions
domains. Results showing which student/school characteristics variables had a statistically
significant relationship with the teacher working conditions domains are shown in Table 22.
Details showing the results of ANCOVA calculations for statistically significant relationships
are also shown in Table 23. More comprehensive results for ANCOVA calculations are
found in Table 24. Please note that each student/school characteristics variable had a
significant overall relationship to a teacher working conditions domain. However, the
strength of the relationship as assessed by � 2 was weak for most student/school
characteristics variables (� ≤.016). The two exceptions were the strength of the relationships
between 2005-06 ABC School Recognition and teachers’ access to facilities and resources,
209
and between the percentage of students’ proficient on the 2005-06 Reading EOG test and
teachers’ access to facilities and resources, as � 2 = .030.
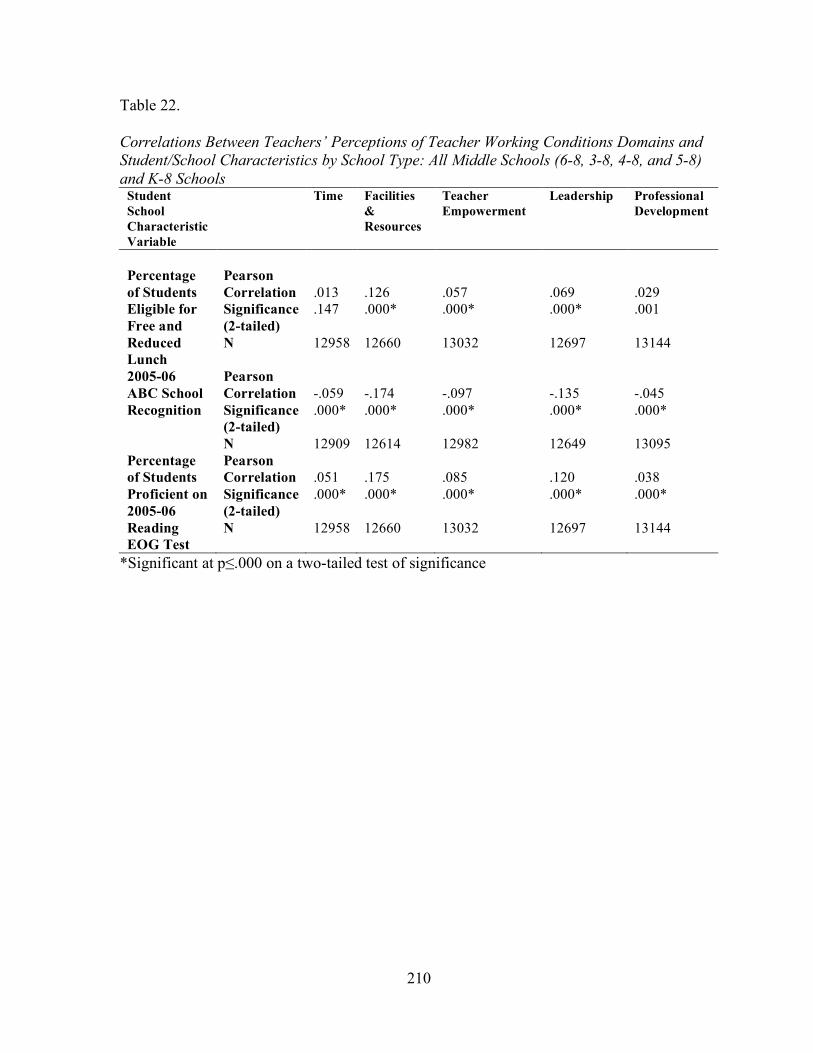
210
Table 22. Correlations Between Teachers’ Perceptions of Teacher Working Conditions Domains and Student/School Characteristics by School Type: All Middle Schools (6-8, 3-8, 4-8, and 5-8) and K-8 Schools
Student School Characteristic Variable
Time Facilities & Resources
Teacher Empowerment
Leadership Professional Development
Percentage of Students Eligible for Free and Reduced Lunch
Pearson Correlation Significance (2-tailed) N
.013 .147 12958
.126 .000* 12660
.057 .000* 13032
.069 .000* 12697
.029 .001 13144
2005-06 ABC School Recognition
Pearson Correlation Significance (2-tailed) N
-.059 .000* 12909
-.174 .000* 12614
-.097 .000* 12982
-.135 .000* 12649
-.045 .000* 13095
Percentage of Students Proficient on 2005-06 Reading EOG Test
Pearson Correlation Significance (2-tailed) N
.051 .000* 12958
.175 .000* 12660
.085 .000* 13032
.120 .000* 12697
.038 .000* 13144
*Significant at p≤.000 on a two-tailed test of significance

211
Table 23. ANCOVA for Student/School Characteristics Variables and Teachers’ Perceptions of Teacher Working Conditions Domains ________________________________________________________________________ Relationship Between Student/School Characteristics Variables and Teachers’ Perceptions of
Teacher Working Conditions Domains ________________________________________________________________________
Teacher working conditions domains for each independent variable where there was a significant relationship
(df between groups, df within groups)=F
Teacher Working Conditions Domain
Time Facilities and Resources
Teacher Empowerment
Leadership Professional Development
Student/School Characteristics Variable
Percentage of Students Eligible for Free and Reduced Lunch
(1,12657)= 202.55
(1,13029)= 38.58
(1,12694)= 56.43
2005-06 ABC School Recognition
(1,12906)= 50.12
(1,12611)= 385.36
(1,12979)= 101.80
(1,12646)= 197.33
(1,13092)= 26.27
Percentage of Students Proficient on 2005-06 Reading EOG Test
(1,12955)= 37.90
(1,12657)= 388.25
(1,13029)= 78.31
(1,12694)= 153.22
(1,13141)= 18.68
*correlation is significant at p≤.000
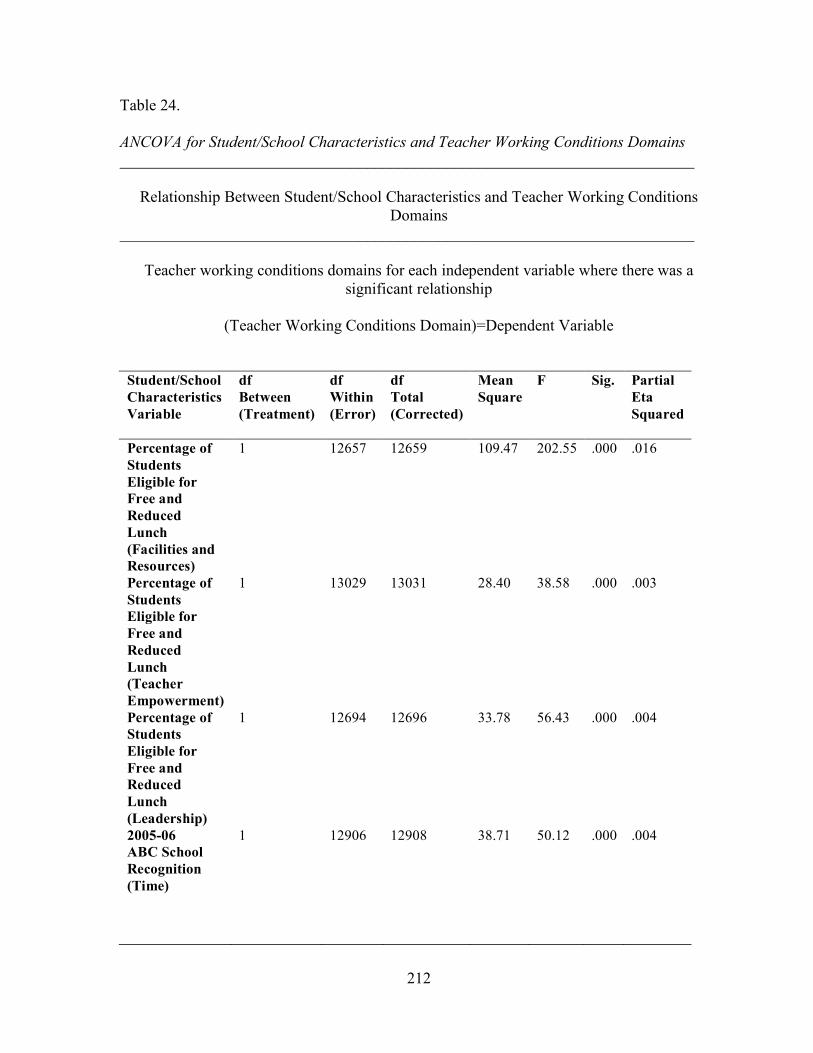
212
Table 24. ANCOVA for Student/School Characteristics and Teacher Working Conditions Domains ________________________________________________________________________
Relationship Between Student/School Characteristics and Teacher Working Conditions Domains
________________________________________________________________________
Teacher working conditions domains for each independent variable where there was a significant relationship
(Teacher Working Conditions Domain)=Dependent Variable
Student/School Characteristics Variable
df Between (Treatment)
df Within (Error)
df Total (Corrected)
Mean Square
F Sig. Partial Eta Squared
Percentage of Students Eligible for Free and Reduced Lunch (Facilities and Resources)
1 12657 12659 109.47 202.55 .000 .016
Percentage of Students Eligible for Free and Reduced Lunch (Teacher Empowerment)
1 13029 13031 28.40 38.58 .000 .003
Percentage of Students Eligible for Free and Reduced Lunch (Leadership)
1 12694 12696 33.78 56.43 .000 .004
2005-06 ABC School Recognition (Time)
1 12906 12908 38.71 50.12 .000 .004

213
Student/School Characteristics Variable
df Between (Treatment)
df Within (Error)
df Total (Corrected)
Mean Square
F Sig. Partial Eta Squared
2005-06 ABC School Recognition (Facilities and Resources)
1 12611 12613 205.49 385.36 .000 .030
2005-06 ABC School Recognition (Teacher Empowerment)
1 12979 12981 74.60 101.80 .000 .008
2005-06 ABC School Recognition (Leadership)
1 12646 12648 116.98 197.33 .000 .015
2005-06 ABC School Recognition (Professional Development)
1 13092 13094 16.80 26.27 .000 .002
Percentage of Students Proficient on 2005-06 Reading EOG Test (Time)
1 12955 12957 29.29 37.90 .000 .003
Percentage of Students Proficient on 2005-06 Reading EOG Test (Facilities and Resources)
1 12657 12659 206.85 388.25 .000 .030
Percentage of Students Proficient on 2005-06 Reading EOG Test (Teacher Empowerment)
1 13029 13031 57.48 78.31 .000 .006
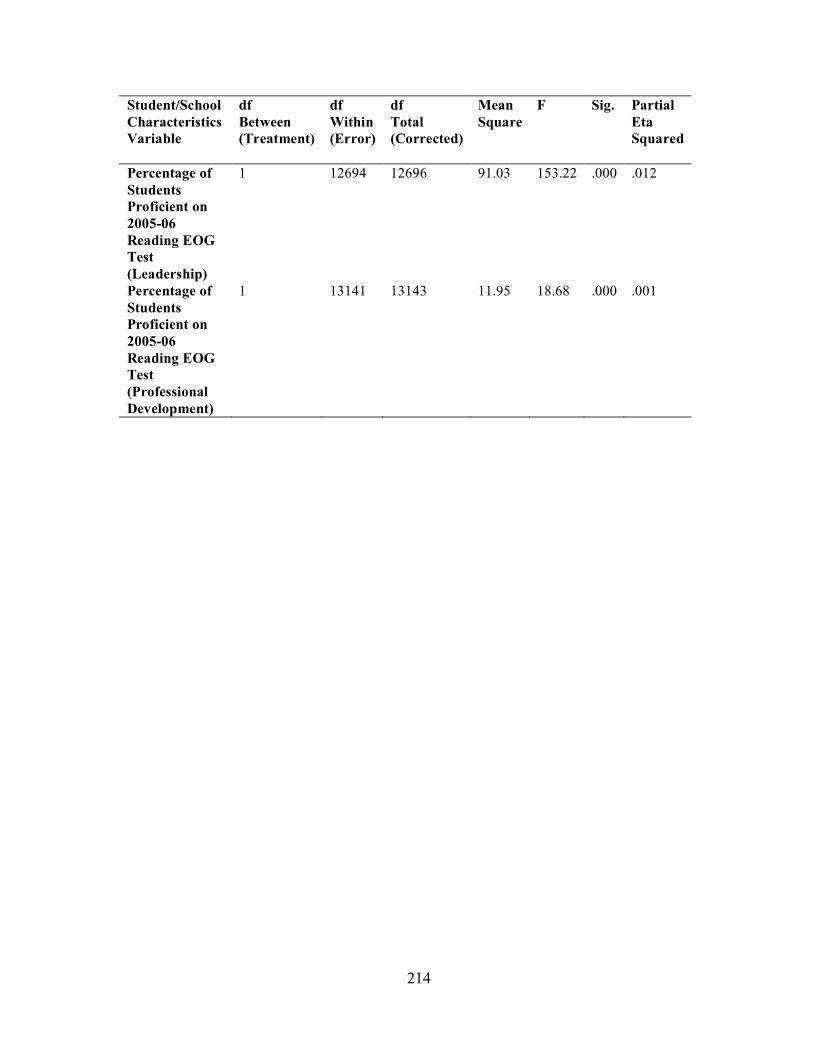
214
Student/School Characteristics Variable
df Between (Treatment)
df Within (Error)
df Total (Corrected)
Mean Square
F Sig. Partial Eta Squared
Percentage of Students Proficient on 2005-06 Reading EOG Test (Leadership)
1 12694 12696 91.03 153.22 .000 .012
Percentage of Students Proficient on 2005-06 Reading EOG Test (Professional Development)
1 13141 13143 11.95 18.68 .000 .001
215
Effect Size:
Contrasting the Differences in Means for Teachers’ Perceptions of Teacher Working
Conditions Domains by School Type (K-8 vs. All Middle Schools)
Effect sizes were calculated for the teacher working conditions domain subscale
means in order to analyze differences in means between K-8 and AMS teachers’ perceptions
of teacher working condition domains by school type. A d statistic was calculated to
represent an effect size estimate which revealed contrasts in means for K-8 and AMS
teachers’ perceptions of teacher working conditions domains. Howell (2002) explained that
d “is a measure of the degree to which � 1 and � 0 differ in terms of the standard deviation of
the parent population” (p. 227). K-8 school teachers’ perceptions of teacher working
condition domains were represented by � 1. AMS teachers’ perceptions were represented by
� 0. The total standard deviation of both K-8 and AMS teachers for each teacher working
conditions domain is represented by � . The effect size estimate equation used to calculate d
for this study was:
d = � 1 – � 0 � or
d = K-8 Teachers’ Domain Subscale Mean – AMS Domain Subscale Mean Total Combined Group Domain Standard Deviation
Cohen (1988) defined several levels of d to be used when estimating effect sizes which
included: small=.20, medium=.50, and large=.80. Effect size estimates that contrasted means
between K-8 and AMS teachers’ perceptions of teacher working conditions domains
indicated that all effect size estimates were small when classified according to Cohen’s three
levels of d. The highest effect size was for K-8 and AMS teachers’ perceptions of leadership
where d = .23. The smallest effect size was for K-8 and AMS teachers’ perceptions of

216
professional development where d= .05. Please refer to Table 25 for complete results of
effect size estimate calculations contrasting means for K-8 and AMS teachers’ perceptions of
teacher working conditions domains.
Table 25. Effect Size Estimations for Teachers’ Perceptions of Teacher Working Conditions Domain Subscale Means by School Type: All Middle Schools and K-8 Schools
+Scale: Working Conditions Domain Subscale Score: 1= Strongly Disagree, 2= Disagree, 3= Neither Disagree Nor Agree, 4= Agree, and 5= Strongly Agree
Working Conditions Domain
K-8 Mean
All Middle Schools Mean
Difference in Means
Total Standard Deviations By School Type
Effect Size Estimation
Level of Effect Size As Defined by Cohen (1988)
Time 3.03 3.18 .15 1.72 .15 Small
Facilities and Resources
3.76 3.65 .11 1.40 .11
Small
Teacher Empowerment
3.62 3.41 .21 1.57 .21 Small
Leadership 3.92 3.69 .23 1.43 .23 Small
Professional Development
3.37 3.42 .05 1.58 .05 Small
*Cohen (1988) classified effect size estimations in three levels: small = .20, medium = .50, and large = .80
Summary of Results
For three of the five teacher working conditions domains (facilities and resources,
leadership, and teacher empowerment), K-8 teachers reported greater satisfaction with
working conditions in their schools than 6-8 middle school and AMS teachers. For these
three working conditions domains there were statistically significant relationships between
each of those working condition domains and school type. Differences in means by school
217
type for these three working conditions domains, as determined by t-tests for independent
samples, were also significant.
K-8 teachers reported less satisfaction with one working condition domain, the use of
time, than 6-8 middle school and AMS teachers. There were statistically significant
relationships between the use of time and school type when comparing K-8 teachers to 6-8
middle school teachers, and when comparing K-8 teachers to AMS teachers. Differences in
means by school type for the use of time, as determined by t-tests for independent samples,
were also significant. K-8 teachers also reported less satisfaction with opportunities for
professional development than AMS teachers, but were more satisfied with opportunities for
professional development than 6-8 middle school teachers. There were no statistically
significant relationships between teacher satisfaction with opportunities for professional
development and school type when comparing K-8 teachers to 6-8 middle school teachers, or
when comparing K-8 teachers to AMS teachers. Differences in means by school type for
teacher satisfaction with opportunities for professional development, as determined by t-tests
for independent samples, were also not significant. See Tables 17 and 18 for summary
information on the relationship between teachers’ perceptions of working conditions (teacher
satisfaction with working conditions) and school type.
Each teacher demographic variable had a significant overall relationship to a teacher
working conditions domain. However, the strength of the relationship as assessed by � 2 was
weak. This weakness was due to the fact that each teacher demographic variable explained
less than one percent of the variance of teachers’ perceptions of the working conditions
domain. Results indicated significant relationships between ethnicity and the teacher
working conditions domains at p≤.000, two-tailed. Correlations between ethnicity and the
218
teacher working conditions domains were negative, meaning that when one variable
increases, the other variable decreases. Results also indicated multiple significant
relationships between gender and the use of time, and between gender and facilities and
resources. Results indicated two significant relationships between highest degree earned by
teachers and teacher working conditions domains. Significant correlations were found
between highest degree earned and opportunities for teacher empowerment, and highest
degree earned and opportunities for professional development. The only teacher
demographic variable with no significant relationships with any teacher working conditions
domain was National Board Certification status.
For student/school characteristics, results indicated significant relationships between
the percentage of students eligible for free and reduced lunch and the three teacher working
conditions domains (facilities and resources, teacher empowerment, and leadership) at
p≤.000, two-tailed. All correlations between students eligible for free and reduced lunch and
these three working conditions domains were positive. Results indicated significant
relationships between 2005-06 ABC School Recognition and the teacher working conditions
domains. All correlations were negative. Results also indicated significant relationships
between the percentage of students’ proficient on the 2005-06 Reading EOG test and the
teacher working conditions domains. All correlations were positive. Each student/school
characteristics variable had a significant overall relationship to multiple teacher working
conditions domains. However, the strength of the relationships, as assessed by � 2 was weak
for most student/school characteristics variables (� ≤.016). The two exceptions were the
strength of the relationships between 2005-06 ABC School Recognition and teachers’ access
219
to facilities and resources, and between the percentage of students’ proficient on the 2005-06
Reading EOG test and teachers’ access to facilities and resources as � 2 = .030.

CHAPTER V
IMPLICATIONS AND INTERPRETATION
Overview
This research project examined the relationship between grade configuration and
teachers’ perceptions of working conditions in public K-8 and middle schools in North
Carolina. The study also examined the potential effects of extraneous, independent variables,
teacher demographic and student/school characteristics variables, on teachers’ perceptions of
teacher working conditions domains in public K-8 schools and middle schools in North
Carolina. The decision to import teacher demographic and student/school characteristics
variables as co-variates was based on research included within this study’s literature review
completed by Hirsch (2005b). In his analysis of the 2004 NCTWCS data, Hirsch controlled
for many extraneous, independent variables, such as teacher demographic and student/school
characteristics variables, so that the variance caused by each co-variate on teachers’
perceptions of teacher working conditions domains, the dependent variable in both Hirsch’s
and this researcher’s study, could be estimated. One-way ANCOVAs were calculated to
estimate the variance in teachers’ perceptions of teacher working conditions domains caused
by teacher demographic or student/school characteristic variables. If greater variance in
teachers’ perceptions of teacher working conditions domains could be attributed to teacher
demographic and student/school characteristic variables, less variance in teachers’

221
perceptions of teacher working conditions domains would be attributed to school type, the
primary independent variable of this study.
There was one principal hypothesis tested in this study with seven sub-hypotheses.
That principal research hypothesis was
Major Hypothesis
HR = Public, K-8 school teachers will report greater satisfaction with working conditions in
K-8 schools than public middle school teachers in middle schools in the state of North
Carolina as measured by the 2006 North Carolina Teacher Working Conditions Survey.
Sub-hypotheses that were tested in this study included:
Sub-hypotheses
1. K-8 teachers will report less satisfaction with the use of time at their schools than
AMS teachers according to the 2006 NCTWCS.
2. K-8 teachers will report greater satisfaction with access to facilities and resources at
their schools than AMS teachers according to the 2006 NCTWCS.
3. K-8 teachers will report greater satisfaction with leadership at their schools than AMS
teachers according to the 2006 NCTWCS.
4. K-8 teachers will report greater satisfaction with opportunities for teacher
empowerment at their schools than AMS teachers according to the 2006 NCTWCS.
5. K-8 teachers will report greater satisfaction with the professional development
offered at their schools than AMS teachers according to the 2006 NCTWCS.
6. Teacher demographics (ethnicity, gender, educational training prior to beginning
teaching, highest degree earned, National Board Certification status, years as an

222
educator, and years at a school) will significantly effect teachers’ perceptions of
working conditions.
7. Student/school characteristics including: socio-economic status of students (as
determined by the percentage of students eligible for free and reduced lunch) and
student/school academic achievement (as measured by 2005-06 ABC School
Recognition and percentage of students’ proficient on the 2005-06 Reading End-of-
Grade test) will significantly effect teachers’ perceptions of working conditions.
Sub-hypotheses one through five were selected for this study based on the literature
review which found that elementary teachers reported more positive perceptions of all
teacher working conditions domains except time for the 2004 and 2006 administrations of the
NCTWCS according to Hirsch (2005b), and Hirsch and Emerick with Church and Fuller
(2006a) in their analysis of teachers’ perceptions of working conditions by school type for
elementary (K-5), middle (6-8), and high school (9-12) teachers. Since K-5 teachers were
included within the sample for K-8 school teachers in this study, and could not be removed
from the study’s sample due to safeguards of confidentiality put in place to protect teacher
respondents’ identity, this researcher presumed that as measured by the 2006 NCTWCS data,
K-8 school teachers would report greater satisfaction for all teacher working condition
domains except time at their schools than AMS teachers. Sub-hypotheses six was selected
for this study based on the research of Hirsch (2005b) and his subsequent 2004 NCTWCS
data analysis, which found that teacher demographic variables did not affect teachers’
perceptions of all teacher working conditions domains. Sub-hypothesis seven was also
selected for this study based on the research of Hirsch and his subsequent 2004 NCTWCS
data analysis. Hirsch found there was a significant relationship based on negative

223
correlations between the percentage of students eligible for free and reduced lunch at a
school and teacher retention. Likewise, significant relationships were found between
teachers’ perceptions of all teacher working conditions domains except time and statistics on
three-year teacher retention. Therefore, this researcher hypothesized that socio-economic
status of students would significantly affect teachers’ perceptions of all teacher working
conditions domains except time. Hirsch also found in his research and subsequent 2004
NCTWCS data analysis that there were significant relationships between teachers’
perceptions of all teacher working conditions domains except time and measures of
student/school academic achievement such as ABC School Recognition, ABC growth, and
AYP status. Hence, it was hypothesized for this study that student/school characteristics
measuring student/school academic achievement (as measured by 2005-06 ABC School
Recognition and percentage of students’ proficient on the 2005-06 Reading End-of-Grade
test) would significantly affect teachers’ perceptions of all teacher working conditions
domains except time.
Methods of Analysis
The researcher used SPSS 15.0 for Windows to calculate subscale scores for each of
the five teacher working conditions domains which represented the dependent variable for
analysis in this study. Subscale scores were calculated to combine multiple survey questions
in the same Likert-scale format for each teacher working conditions domain. Means and
standard deviations for the subscale scores were calculated, analyzed, and compared by
school type first for Group 1, which consisted of 6-8 middle and K-8 teachers, and then for
Group 2, which consisted of AMS and K-8 school teachers. Descriptive statistics from the
224
subscale scores of Group 1 and Group 2 were then compared to determine if there were
significant differences in subscale means and standard deviations between the two groups.
Next, the researcher analyzed independent sample t-tests to compare means for all
teacher working conditions domain subscale scores by school type (K-8, 6-8 middle, and
AMS). Correlations were then calculated to determine the relationships among teacher
working conditions domain subscale means, between teacher working conditions domain
subscale means and school type, between teacher working conditions domain subscale means
and teacher demographic variables, and between teacher working conditions domain subscale
means and student/school characteristics. Teacher demographic and student/school
characteristics variables that were significantly correlated to a teacher working conditions
domain subscale means were run as co-variates via one-way ANCOVA tests. Grade
configuration served as the independent variable, or fixed factor, for each ANCOVA.
Teacher demographic and student/school characteristics variables were run as co-variates for
each ANCOVA. ANCOVAs estimate the variance in teachers’ perceptions of teacher
working conditions domains caused by co-variates. Otherwise, the variance in teachers’
perceptions of teacher working conditions domains might be attributed to the primary
independent variable examined in this study, grade configuration. ANCOVA results could
yield potential rival alternative hypotheses if variance in the dependent variable, teachers’
perceptions of teacher working conditions domains, was caused by co-variates.
Data analysis for this study began by sorting the 2006 NCTWCS data set into a file
that contained only survey data for the K-8 and middle school teachers that completed the
2006 NCTWCS. Only K-8 and middle school teachers in which their schools met the 40%
response rate guideline were included in the 2006 NCTWCS data set. This study’s sample
225
consisted of 13,433 teachers, which included 10,520 6-8 middle school teachers, 1,813 K-8
teachers, and 1,100 AMS (6-8, 3-8, 4-8, 5-8) teachers.
This study marked the first time data from any administration of the NCTWCS had
been analyzed by school type comparing K-8 to 6-8 middle, and K-8 to AMS teachers’ data.
Data analyzed by school type from all prior administrations of the NCTWCS in 2002, 2004,
and 2006 compared elementary (K-5), middle (6-8), and high school (9-12) teachers’
perceptions of teacher working conditions domains. Even though the percentage of total
teachers in the sample responding from K-8 (13.5%) and middle school configurations other
than 6-8 (8.2%) was quite small when compared to the 6-8 middle school group (78.3%), it
was still important to include and analyze the valuable data from these experts on their
perceptions of teacher working conditions in their schools. Such an analysis could highlight
any emerging trends or patterns as many large, urban districts around the country have either
converted or have begun to consider the possibility of converting middle schools to K-8
schools (Abella, 2005; Anfara & Buehler, 2005; George, 2005; Look, 2001; Mizell, 2005).
General Reflections on Results
As a result of the findings from the literature review for this study, the researcher
proposed the major research hypothesis that
HR = Public, K-8 school teachers will report greater satisfaction with working conditions in
K-8 schools than public middle school teachers in middle schools in the state of North
Carolina as measured by the 2006 North Carolina Teacher Working Conditions Survey.
A Comparison of Teacher Working Conditions Domain Subscale Means by School Type
The data reported indicated that for the teacher working conditions domains of
facilities and resources, teacher empowerment, leadership, and professional development, K-

226
8 teachers’ perceptions of working conditions were more positive than 6-8 middle school
teachers’ perceptions of working conditions. Only for the time domain did 6-8 middle school
teachers report greater satisfaction with working conditions than K-8 teachers. T-tests for
independent samples indicated that the differences in means for teacher working conditions
domain subscale means were statistically significant at p≤.000, two-tailed, for all teacher
working conditions domains except professional development.
However, when teachers’ perceptions of working conditions were compared by
school type including other middle grade configuration (3-8, 4-8, and 5-8) teacher data with
the 6-8 middle school teacher data in comparison to K-8 teachers, the number of teacher
working conditions domains in which K-8 teachers’ perceptions of working conditions were
more positive decreased to three (facilities and resources, teacher empowerment, and
leadership). Once again, the only teacher working conditions domain subscale mean for
which t-tests indicated differences in means were not statistically significant was the
differences in means for the professional development domain. Therefore, K-8 teachers’
perceptions of working conditions were more positive than 6-8 middle school teachers’
perceptions for each of the teacher working conditions domains except the time domain.
Likewise, K-8 teachers’ perceptions of working conditions were more positive than AMS
teachers’ perceptions for the facilities and resources, teacher empowerment, and leadership
teacher working conditions domains. Correlation results indicated that there were significant
relationships between school type for K-8 and AMS teachers and each of the teacher working
conditions domain subscale means except professional development. Therefore, differences
in teachers’ perceptions of teacher working conditions domain subscale means were in part
due to school type for K-8 and middle school teachers.

227
Categorizing K-8 schools and AMS along several parameters of lowest to highest
performing schools as defined by the ABCs of Public Education for several measurements of
student/school academic achievement might provide further explanation or even alternative
rival hypotheses for the differences in teachers’ perceptions of teacher working conditions
domains by school type. In their analysis of the 2006 NCTWCS data, Hirsch and Emerick
with Church and Fuller (2007b) analyzed teachers’ perceptions of teacher working conditions
domains by school type, as well as by several measurements of student/school academic
achievement which included ABC academic growth, three-year overall academic
performance composite, ABC School Recognition, and percentage of students proficient on
end-of-grade tests in reading and math. For example, when comparing teachers’ perceptions
of teacher working conditions domains by school type, and also by academic growth and
overall performance composite, two measurements of student/school academic achievement,
Hirsch et al. found
…much greater variation in schools that did not meet and those that exceeded academic growth expectations in the area of time than was the case in examining the overall performance composite. (p. 8)
Hirsch et al. also noted from their analysis of the 2006 NCTWCS data that noticeable
differences were present between highest and lowest performing schools in teachers’
perceptions of the teacher working conditions domains of: facilities and resources, teacher
empowerment, and leadership for elementary and middle schools. Few differences were
found in teachers’ perceptions of teacher working conditions domains for elementary and
middle schools for the time and professional development teacher working conditions
domains.
228
In the data analysis of the 2006 Kansas TWCS, Hirsch and Emerick with Church and
Fuller (2006c) again found “consistent and significant differences” in teachers’ perceptions
of teacher working conditions domains between high and low achieving schools by school
type (p. 4). Hirsch et al. also found that all teacher working conditions domains except
professional development were significantly correlated to the percentage of students passing
the Kansas end-of-grade math assessment by school type. Findings from data analysis of
previous administrations of teacher working conditions surveys, as well as the findings from
this study, indicated that school academic achievement variables might serve as alternative
rival hypotheses to school type in causing differences in teachers’ perceptions of teacher
working conditions domains.
K-8 teachers, as indicated by teacher working conditions subscale means, reported the
greatest satisfaction with leadership (3.92) of the five teacher working conditions domains
(1=strongly disagree, 5=strongly agree). The leadership domain subscale mean was also the
highest domain subscale mean of all teacher working conditions subscale means by school
type. The K-8 leadership subscale mean for this study was higher than the elementary school
leadership subscale mean (3.68) and middle school leadership subscale mean (3.47) found by
Hirsch and Emerick with Church and Fuller (2007b) in their analysis of data from the 2006
NCTWCS by school type.
The next highest teacher working conditions domain subscale mean was also reported
by K-8 teachers for the facilities and resources domain (3.76). The facilities and resources
domain subscale mean for elementary schools was 3.71 and 3.64 for middle schools
according to the findings of Hirsch and Emerick with Church and Fuller (2007b). The highest
teacher working conditions domain subscale mean for 6-8 middle and AMS teachers was the
229
mean for facilities and resources (3.68). The facilities and resources domain subscale mean
was also the highest domain subscale mean for middle schools in the prior analysis of the
2006 NCTWCS by Hirsch et al. The difference between highest domain subscale means by
school type for this study was .24 for scores ranging from one to five on a Likert scale,
compared to a .07 difference in highest domain subscale means by school type for
elementary and middle schools as found by Hirsch et al. in their prior analysis of the 2006
NCTWCS. Even though K-8 teachers’ perceptions of working conditions were higher for all
teacher working conditions domains except for time, the differences in domain subscale
means was small. Therefore, the variation in teachers’ perceptions of working conditions
attributed to school type and whether or not teachers worked at K-8 or middle schools was
similarly small.
The teacher working conditions domain that teachers reported the least satisfaction
with for all school types was time. In fact, the time domain mean subscale score (3.03) for
K-8 teachers was the lowest teacher working conditions subscale mean for all school types.
The time domain subscale means for 6-8 middle (3.11) and AMS (3.12) were also the lowest
subscale means for each of these school types. Hirsch and Emerick with Church and Fuller
(2007b) also found that teachers’ perceptions of time were the lowest for any teacher
working conditions domain for elementary (3.09) and middle school teachers (3.19).
According to Hirsch et al., teachers’ perceptions of time were also the least positive of all
teacher working conditions domains for the 2002 and 2004 NCTWCS. One possible reason
that K-8 teachers reported less positive perceptions of the use of time in their schools, as
compared to 6-8 middle and AMS teachers, was that the most common scheduling and
instructional practice for K-5 elementary teachers, unlike 6-8 middle and AMS teachers, is
230
self-contained classrooms in which the teacher is responsible for instruction in all core
subject areas (language arts, math, science, and social studies). K-5 teachers within the K-8
configuration might be registering their frustration with the limited amount of planning time
that is typically available for instructional planning during the school day. Data collected in
the 2004 and 2006 administrations of the NCTWCS found that elementary teachers are most
concerned with time teachers have available for planning (Hirsch, 2005b; Hirsch & Emerick
(with Church & Fuller), 2007b). Hirsch and Emerick with Church and Fuller (2007b) noted
in the 2006 NCTWCS that 37.2% of elementary teachers felt the planning time they had
available on a daily basis was sufficient compared to 57.2% of middle school teachers.
Hirsch et al. continued by explaining that “elementary educators disproportionately report
receiving less than an hour per day that could be used for planning (94 percent) compared to
middle school (62 percent) (p. 33). Findings from the 2006 NCTWCS also revealed that
94% of elementary teachers, and 62% of middle school teachers, reported receiving less than
one hour per day for planning. The results from the 2004 and 2006 NCTWCSs, as well as
the secondary data analysis in this study comparing K-8 and middle school teachers’
perceptions of working conditions from the 2006 NCTWCS, could suggest the reasons for
such differences in time subscale means between K-8 and 6-8 middle school teachers, and
between K-8 and AMS teachers. However, the difference between time subscale means
remained quite small (.08 and .09) between K-8 and 6-8 middle school teachers, and between
K-8 and AMS teachers. There was only a difference of .10 for elementary and middle school
teachers in the analysis of teachers’ perceptions of the use of time by Hirsch et al. in the 2006
NCTWCS.
231
The second lowest teacher working conditions domain subscale mean by school type
for this study and the 2006 NCTWCS according to the findings of Hirsch and Emerick with
Church and Fuller (2007b) was for teachers’ perceptions of the time domain. In this study,
the time domain subscale mean for 6-8 middle school teachers was (3.11) compared to the
time domain subscale mean of (3.19) for middle school teachers from the 2006 NCTWCS.
The second lowest teacher working conditions domain subscale mean for K-8 teachers in this
study was in the professional development domain (3.37).
Correlations Among Teacher Working Conditions Domains
Correlation results indicated the multicolinearity of all teacher working conditions
domain subscale means. Multicolinearity means there were multiple significant relationships
among teacher working conditions domain subscale means. An examination of the
significant relationships among teacher working conditions domain subscale means is
important because the multicolinearity of teacher working conditions domain subscale means
could represent an alternative rival hypothesis that influenced teachers’ perceptions of
working conditions that might otherwise be attributed to school type.
Hirsch (2005a; 2005b) also discovered the multicolinearity among teachers’
perceptions of teacher working conditions domains in his analyses of the 2004 SCTWCS and
the 2004 NCTWCS. Hirsch found significant correlations among all teacher working
conditions domains at p<.01, two-tailed in his analyses of the 2004 SCTWCS and 2004
NCTWCS data for all survey respondents. Hirsch explained that the “interconnectedness”
among teacher working conditions domains could lead to a “ripple effect,” causing changes
in teachers’ perceptions of multiple teacher working conditions domains when efforts are
made to improve teachers’ perceptions of one working conditions domain (p. 14). Hence,

232
efforts by school administrators to improve teachers’ perceptions of one teacher working
conditions domain could result in more positive teachers’ perceptions of additional teacher
working conditions domains as well due to the “interconnectedness” among teacher working
conditions domains. Failure to estimate the variance caused by the “interconnectedness” of
teacher working conditions domains could result in the variance of teachers’ perceptions of
working conditions being mistakenly attributed to independent variables such as school type
in this study.
Results from this study indicated the strongest significant correlation (.780) among
teacher working conditions domain subscale means was between leadership and teacher
empowerment. Strong significant correlations between teacher working conditions domain
subscale means implies that when teachers’ perceptions of one teacher working conditions
domain change, teachers’ perceptions of the other domain with which it has a significant
relationship will likely change in the same direction. Hirsch (2005a; 2005b) also found a
strong, significant correlation between leadership and teacher empowerment in his analyses
of the 2004 NCTWCS data (.803) and 2004 SCTWCS (.788) for all survey respondents.
Hirsch offered one explanation for the strong correlation and subsequent relationship
between teachers’ perceptions of the leadership and teacher empowerment domains by
stating “teachers who felt empowered to make decisions about their classroom and school
work have positive views of their school leader” (p. 14).
In 2004, however, Hirsch found that a stronger correlation existed between the
professional development and leadership domains for the 2004 NCTWCS than the
correlation between the leadership and teacher empowerment domains. Results from the
2004 NCTWCS found a strong, significant correlation of .823 between the leadership and
233
professional development domains. Results from this study found a significant correlation of
.526 between leadership and professional development for K-8 and AMS teachers from the
2006 NCTWCS. Correlations for the leadership and professional development domains were
each significant in 2004 and 2006. However, there was a difference between the correlations
for the leadership and professional development domains, as the correlation was stronger in
2004 than in 2006. One possible explanation for the differences in the correlations between
the leadership and professional development domains in 2004 and 2006 was that results for
this study using 2006 NCTWCS data included only K-8, 6-8 middle, and AMS teachers. By
contrast, the 2004 data analysis and corresponding correlation results included all teachers,
administrators, and licensed educators included in the final data for the 2004 NCTWCS.
Hence, the differences in the correlations between the leadership and professional
development domains from 2004 to 2006 could be attributable to the differences in study
samples for which data was analyzed for the 2004 NCTWCS and this study.
The weakest correlation (.497) among teacher working conditions domain subscale
means for this study was between time and professional development. The fact that results
indicated teachers were least positive with the use of time in their schools could have led to a
stronger correlation between teachers’ perceptions of the use of time and professional
development since professional development activities often reduce available teacher
planning time. However, this was not the case according to the results from this analysis.
The weakest correlations found by Hirsch (2005a; 2005b) in his analyses of the 2004
SCTWCS and the 2004 NCTWCS were between the time and teacher empowerment
domains (.360 and .458 respectively). Hence, the weakest correlation among teacher
working conditions domains for K-8, 6-8 middle, and AMS teachers was stronger than the
234
weakest correlations for the administrations of the 2004 SCTWCS and 2004 NCTWCS.
Again, this difference could be attributed to school type since only K-8, 6-8 middle, and
AMS teachers were included in the sample for this study.
In summary, all correlations among teacher working conditions domain subscale
means were positive and ranged from .497 to .780. Strong significant correlations between
teacher working conditions domain subscale means indicated that when teachers’ perceptions
of one teacher working conditions domain changed, teachers’ perceptions for the other
domain with which it had a significant relationship likely changed in the same direction. The
closer correlation coefficients were to -1 or 1, the stronger the relationship was between
variables.
The Effect of Teacher Demographics on Teachers’ Perceptions of Teacher Working
Conditions Domains
Results indicated that teacher demographics did have an effect on teachers’
perceptions of working conditions in many cases. This is contrary to the findings of Hirsch
(2005a; 2005b) when he found that:
race, gender, highest degree earned, means of preparation (lateral entry versus traditionally preparation), and National Board Certification status do not appear to affect teachers’ perceptions of any working conditions domain. (p. 12-13)
In this study, there were multiple, statistically significant relationships between teacher
demographic variables and teachers’ perceptions of teacher working conditions domains.
Significant relationships between teachers’ perceptions of teacher working conditions
domains and teacher demographic variables likely influenced teachers’ perceptions of these
teacher working conditions domains. The direction in which teachers’ perceptions of
working conditions domains changed was determined by the negative or positive correlations

235
found when correlations were calculated. Ethnicity was the only teacher demographic
variable that results indicated statistically significant relationships with all teacher working
conditions domains at p≤.000, two-tailed. All correlations between ethnicity and teacher
working condition domains were negative, indicating that when one variable increased, the
other decreased. Thus, when the percentage of teachers from a particular ethnic group
increased or decreased, teachers’ perceptions of working conditions were likely to change in
the opposite direction of the change in the percentage of teachers from a particular ethnic
group. The strongest correlation (-.084) between all teacher demographic variables and
teacher working conditions domains was between ethnicity and professional development.
The correlation between ethnicity and professional development indicated that there was a
strong relationship between teachers’ ethnicity and teachers’ perceptions of professional
development offered at their school. The negative correlation indicated that as the
percentage of teachers from an ethnic group increased or decreased for this study’s sample,
teachers’ perceptions of professional development at their school changed in the opposite
direction.
There were seven additional significant relationships between teacher demographic
variables and teacher working conditions domains (gender and time; gender and facilities and
resources; educational training prior to beginning teaching and time; highest degree earned
and teacher empowerment; highest degree earned and professional development; years as an
educator and leadership; years at a school and time). All significant correlations between
teacher demographic variables and teacher working conditions domains ranged from -.084
(ethnicity and professional development) to .064 (gender and time). Results indicated the
variable of time had the most statistically significant relationships (four) with teacher
236
demographic variables. The leadership variable had the fewest number (one) of statistically
significant relationships with teacher demographic variables. The only teacher demographic
variable that did not have at least one statistically significant relationship with a teacher
working condition domain was National Board Certification status of teachers. Even though
North Carolina is first in the nation in the number of nationally board certified teachers with
1,442, only 13.5% of North Carolina’s public school teachers are Nationally Board Certified
(www.nbpts.org). This finding could suggest why there were no statistically significant
relationships between teachers’ perceptions of working conditions domains and National
Board Certification status. The reason may be simply that the percentage of Nationally
Board Certified teachers in this study’s sample was low.
One potential alternative rival hypothesis to this study’s finding that teacher
demographic variables often have significant relationships with teachers’ perceptions of
teacher working conditions domains may be school type. Hirsch referred to this variable as
school level (2005a; 2005b). Hirsch explained in his analyses of data from the 2004
SCTWCS and 2004 NCTWCS that “while background does not appear to influence teacher’s
perceptions of their working conditions, the school level at which they teach does” (p.14;
p.13). Hirsch found that elementary teachers reported greater satisfaction with teacher
working conditions than secondary (high school) teachers. However, no references were
made in the final reports for the 2004 SCTWCS and 2004 NCTWCS regarding significant
differences between elementary and middle school teachers’ perceptions of working
conditions domains. Hence, in this study, the variable of school type (K-8, 6-8 middle, and
AMS) may be the reason for differences in teachers’ perceptions of teacher working
conditions domains and not teacher demographic variables since previous studies revealed no
237
differences in teachers’ perceptions of teacher working conditions domains based on teacher
demographic variables.
All teacher demographic variables which showed significant relationships with
teacher working conditions domains were entered as co-variates via one-way ANCOVAs.
Significant differences were still found in teacher working conditions domain subscale means
by school type when controlling for teacher demographics as co-variates. However, the
estimated variance in teacher working conditions subscale means explained by selected
teacher demographic variables was quite small as indicated by � 2 (.001 to .007). The
conclusion that the estimated variance in teacher working conditions subscale means
explained by selected teacher demographic variables was quite small was based on the
definition of � 2 by Green and Salkind (2005). Green and Salkind define small, medium, and
large effect sizes as .01, .06, and .14 respectfully. Hence, very little variance in teachers’
perceptions of working conditions by school type can be attributed to teacher demographic
variables even though there were significant relationships between some teacher
demographic variables and teacher working conditions domain subscale means.
The results of correlations run between teacher working conditions domain subscale
means and student/school characteristic variables indicated that student/school characteristic
variables affected teachers’ perceptions of working conditions in most cases. The
relationships between student/school characteristic variables measuring socio-economic
status of students and student/school academic achievement, and teachers’ perceptions of
teacher working conditions domains were examined in this study. The socio-economic status
of students was measured by the percentage of students eligible for free and reduced lunch.
238
Student/school academic achievement was measured by 2005-06 ABC School Recognition
and percentage of students’ proficient on the 2005-06 Reading End-of-Grade test.
The results of correlations calculated between the percentage of students’ eligible for
free and reduced lunch at a school and teacher working conditions domain subscale means
indicated significant relationships between the percentage of students eligible for free and
reduced lunch and three teacher working conditions domains (facilities and resources, teacher
empowerment, and leadership) at p≤.000, two-tailed. All correlations were positive ranging
from .057 to .126. Since the correlation coefficients were so low (closer to 0 on a scale of -1
to 1) for each significant relationship between the percentage of students eligible for free and
reduced lunch and teacher working conditions domains, it is not likely large differences in
teachers’ perceptions of working conditions domains by school type were prompted by the
percentage of students eligible for free and reduced lunch.
However, when analyzing data from the 2006 Kansas Teacher Working Conditions
Survey (KTWCS) Hirsch and Emerick with Church and Fuller (2006c) found that “schools
serving a lower percentage of economically disadvantaged students consistently had more
positive working conditions, particularly in the area of teacher empowerment” (p. 21).
Hirsch et al. found a difference of .56 on a Likert scale of one to five in teachers’ perceptions
of the teacher empowerment domain between teachers working at schools with high poverty
(greater than 75% of students eligible for free and reduced lunch) and low poverty (25% or
less of students eligible for free and reduced lunch). According to results from the 2006
KTWCS, three teacher working conditions domains (teacher empowerment, facilities and
resources, and leadership) had “large gaps” in teachers’ perceptions of these teacher working
conditions domains between teachers working at high and low poverty schools.
239
The results shared by Hirsch and Emerick with Church and Fuller (2007b) from the
2006 NCTWCS did not reveal differences as large as those found in Kansas in teachers’
perceptions of working conditions between teachers working at high and low poverty
schools. The largest gap measuring teachers’ perceptions of working conditions between
teachers working at high and low poverty schools was only .13 for the teacher empowerment
domain. Similar to the findings of Hirsch et al. in their analysis of the 2006 NCTWCS, this
study found significant relationships between the percentage of students eligible for free and
reduced lunch and the facilities and resources, teacher empowerment, and leadership
domains. However, these correlations, though significant, were considered weak as the
largest correlation coefficient was only .126 between the percentage of students eligible for
free and reduced lunch at a school and the facilities and resources domain.
Results also indicated significant relationships between the student/school
characteristics variables: (a)2005-06 ABC School Recognition, and (b)percentage of students
proficient on the 2005-06 Reading End-of-Grade test, and the teacher working conditions
domain subscale means. Results indicated negative correlations for all significant
relationships between 2005-06 ABC School Recognition and teacher working conditions
domains. However, correlations were weak ranging from -.174 to -.045. Since the
correlation coefficients were so low (closer to 0 on a scale of -1 to 1) for each significant
relationship between 2005-06 ABC School Recognition and teacher working conditions
domain subscale means, it was not likely large differences in teachers’ perceptions of
working conditions domains by school type were prompted by 2005-06 ABC School
Recognition. Hirsch (2005a) reiterated the caution that should be used when attributing
changes in teachers’ perceptions of teacher working conditions domains to student/school

240
characteristics variables measuring academic achievement in his discussion of findings from
the 2004 SCTWCS. When discussing the relationship between student/school variables of
academic achievement and teachers’ perceptions of teacher working conditions domains for
the 2004 SCTWCS, Hirsch explained,
School improvement ratings, while statistically and significantly different, do not appear to be highly correlated with working conditions and many other characteristics. The mean differences between school working condition domain averages in different rating categories were very small. (p. 8)
Hence, as was indicated from the findings in this study, weak correlations could result in
very little variance in teachers’ perceptions of teacher working conditions domains as Hirsch
found in his analysis of data from the 2004 SCTWCS.
However, significant correlations between teachers’ perceptions of teacher working
conditions domains and student/school characteristic variables such as 2005-06 ABC School
Recognition should be closely examined as evidenced by the results of the 2004 NCTWCS
revealed by Hirsch (2005a). Hirsch noted,
teachers in poorer performing schools (as indicated by the three measures of achievement: AYP status, ABC status, and ABC growth) have more negative perceptions of their working conditions. More positive perceptions of working conditions in higher performing schools were found in all domains, except time. (p. 5)
Hirsch and Emerick with Church and Fuller (2007b) completed more extensive data analysis
when examining the relationship between teachers’ perceptions of teacher working
conditions domains and student achievement for the 2006 NCTWCS data. Hirsch et al.
calculated Ordinary Least Square regression models (OLS) to control for various factors “to
better determine whether there is a direct relationship between working conditions and
student achievement” (p. 10). Hirsch et al. found from their calculation of OLS regression
241
models that working conditions explained up to 19% of the variance in elementary school
student achievement. Hence, further analysis of data for this study could include running
OLS regression models to determine an estimation of variance in K-8 and AMS student
achievement caused by teachers’ perceptions of teacher working conditions domains. For the
purposes of this study, the findings by Hirsch et al. in their analysis of the 2006 NCTWCS
revealed the importance of significant relationships between teachers’ perceptions of teacher
working conditions domains and various student/school variables measuring academic
achievement.
Results indicated positive significant correlations between percentage of students’
proficient on the 2005-06 Reading End-of-Grade test and the teacher working conditions
domains. Again, correlations were weak ranging from .038 to .175. Hirsch and Emerick
with Church and Fuller (2007b) only found significant correlations between the facilities and
resources, leadership, and teacher empowerment domains and the percentage of students
proficient on all 2005-06 End-of-Grade tests (also known as the North Carolina performance
composite). Differences in research design between this study and the study completed by
Hirsch et al. in the administration of the 2006 NCTWCS may have led to different correlation
findings between teachers’ perceptions of teacher working conditions domains and the
percentage of students proficient on 2005-06 End-of-Grade tests. First of all, this study only
tested for correlations between the 2005-06 Reading End-of-Grade test and teachers’
perceptions of all teacher working conditions domains. Secondly, this study only looked at
K-8, 6-8 middle, and AMS teachers’ perceptions. Hence, different correlation results
between teachers’ perceptions of teacher working conditions domains and the percentage of
students proficient on 2005-06 End-of-Grade tests could be attributed to one or both of these

242
factors. However, since the correlation coefficients were so low between the percentage of
students proficient on the 2006 Reading End-of-Grade test and the teacher working
conditions domain subscale means, it is not likely large differences in teachers’ perceptions
of working conditions domains by school type can be attributed to the percentage of students
proficient on the 2006 Reading End-of-Grade test at a school.
All student/school characteristics variables which showed significant relationships
with teacher working conditions domains were run as co-variates via one-way ANCOVAs.
Significant differences were still found in teacher working conditions domain subscale means
by school type when controlling for student/school characteristics as co-variates. The
estimated variance in teacher working conditions domain subscale means explained by select
student/school characteristics variables (as indicated by � 2 ) ranged from (.001 to .030). The
estimated variance explained for teacher working conditions domain subscale means was
quite small except for the significant relationships between 2005-06 ABC School
Recognition and facilities and resources, and percentage of students proficient on the 2005-
06 Reading End-of-Grade test and facilities and resources, where � 2=.030. Hence, three
percent of the variance in teachers’ perceptions of the facilities and resources domain
subscale mean can be attributed to 2005-06 ABC School Recognition and the percentage of
students proficient on the 2005-06 Reading-End-of-Grade test at a school. However, for all
other significant relationships between student/school characteristic variables run as co-
variates and teacher working conditions domain subscale means, less than three percent, and
in most cases, less than one percent, of estimated variance in teachers’ perceptions of
working conditions was explained by student/school characteristics variables. Therefore,
very little variance in teachers’ perceptions of working conditions domains can be attributed
243
to student/school characteristics even when there were significant relationships according to
the results from this study. Instead, differences in teachers’ perceptions of teacher working
conditions domains could be attributed to other factors. Other factors that may have affected
teachers’ perceptions of teacher working conditions domains as suggested in past teacher
working conditions studies (Hirsch & Emerick with Church & Fuller, 2006c; Berry & Fuller
with Williams & Lobacz, 2007, Fall; Hirsch & Emerick with Church & Fuller, 2007b)
include grade level (referred to as school type in this study), school size, student ethnicity,
and type of district (urban, suburban, rural).
Implications for Implementation and Further Research
The researcher will now present the implications of the study and suggest questions
and lines of inquiry for future research. Each implication and line of inquiry suggested and
discussed in this section is preceded by a presentation of the important findings relevant to
each implication and line of inquiry.
Based on the teacher working conditions variables included within this study,
findings indicated that K-8 teachers’ perceptions of working conditions were more positive
than AMS teachers’ perceptions of working conditions. While there are many factors that
influence teachers’ perceptions of working conditions at a school, the following variables
would be worth considering as well if superintendents and site-based school administrators
are concerned about teachers’ perceptions of working conditions at their schools.
The research reported on teacher demographic variables indicated
• 13.5% of sample respondents were K-8 teachers
• Ethnic minorities comprised 6.6%, 18.6%, and 19.3% of the total sample of teachers
for K-8, 6-8 middle, and AMS respectively.
244
• At least 14% of all AMS teachers were Black or African-American compared to less
than 3% of K-8 school teachers.
• No more than 1% of K-8 and AMS teachers were Hispanic.
• Nearly 88% of K-8 teachers were female compared to 76% of AMS teachers.
• 12.2% of K-8 teachers were male compared to nearly 23.5% of 6-8 middle and AMS
teachers.
• Fewer than 20% of K-8 and AMS teachers completed their Master’s degrees prior to
beginning teaching.
• Nearly 13% of AMS teachers indicated “alternative route” as their educational
training prior to beginning teaching compared to fewer than 6% of K-8 teachers.
• Almost 32% of K-8 and middle school teachers’ highest degree earned was a
Master’s degree.
• Less than 11% of K-8 and AMS teachers earned National Board Certification.
• 15.4% of K-8 teachers possessed at least three years of teaching compared to at least
19% of AMS teachers.
• 12.3% of AMS teachers had three years of teaching experience or less compared to
9.4% of K-8 teachers.
• Nearly 44% of AMS teachers were in their first three years at their school compared
to 37% of K-8 teachers.
• Nearly a quarter of K-8 teachers have been at their school more than ten years
compared to around 17% of AMS teachers.
In summary, the results from this study indicated there were significant differences in
teacher ethnicity by school type for this study’s sample as indicated by � 2 for teacher

245
demographic variables. Results also indicated there were significant differences between
teacher demographic variables by school type for this study’s sample as indicated by � 2 for
(a) gender, (b) educational training prior to beginning teaching, (c) highest degree earned, (d)
years as an educator, and (e) years at a school. Teacher demographic variables were often
significantly correlated to teacher working conditions domain subscale means by school type.
Ethnicity was especially important as it was the only teacher demographic variable that
showed a significant relationship with all teacher working conditions domain subscale
means. Several policy suggestions based on teacher demographics by school type from the
findings of this study are shared here which are applicable to school administrators at the
school, district, state, and national level. These policy suggestions address teacher
demographic variables where there were significant differences by school type. In turn,
policies that address teacher demographic variables might in turn affect teachers’ perceptions
of working conditions domains where significant relationships exist between teacher
demographic variables and teacher working conditions domain subscale means.
Policy Recommendations and Implications for Increasing Teacher Demographic Diversity at
Public K-8 and Middle Schools as Derived from this Study
1. Recruit and hire minority teachers in both K-8 and AMS.
First, school administrators need to encourage expanded recruitment and hiring of
minority teachers at K-8 and AMS. School administrators in the state of North Carolina
should especially seek out qualified African-American and Hispanic teachers as these are the
two largest minority groups in the state of North Carolina. Recent research from teacher
working conditions studies has examined the relationship between teacher ethnicity and
teachers’ perceptions of teacher working conditions domains. In their recent analysis of a

246
modified teacher working conditions study in Ohio, Berry and Fuller with Williams and
Lobacz (2007, Fall) recognized “striking differences between African-American and white
educator perceptions of their levels of empowerment” (p. 19). Areas of the teacher
empowerment domain that African-American educators’ perceptions rated higher than white
educators’ perceptions included: the faculty has an effective process for making group
decisions, there are more non-administrative opportunities for advancement, and teachers are
involved in the school improvement planning process. Berry et al. also noted from their
Ohio teacher working conditions study that “minority teachers continue to be
underrepresented in the profession” (p. 2). In Ohio, only five percent of the total teacher
workforce was African-American.
However, research completed in recent years has recognized the potential benefits of
increasing the number of minority teachers, especially African-American teachers, in public
school across the nation. Hanushek, Kain, and Rivkin (2004) noticed in their study of
teacher mobility and retention in the state of Texas that “black teachers tend to move to
schools with higher black enrollment shares than the schools they left (p. 340). The findings
of Hanushek et al. also revealed that Black and Hispanic teachers were less likely to leave
schools with higher percentages of minority student populations than non-black and non-
Hispanic teachers. Hirsch and Emerick with Church and Fuller (2007b) explained the
relationship between teacher retention and teachers’ perceptions of teacher working
conditions domains in their analysis of the 2006 NCTWCS. Hirsch et al. noted
…evidence throughout the survey indicates that teachers with positive perceptions about their working conditions are much more likely to stay at their current school than educators who are more negative about their conditions of work. (p. 14)
247
Hence, increasing the number of minority teachers at schools serving larger populations of
minority students could increase teacher retention at these schools, which in turn, could
coincide with more positive teachers’ perceptions of teacher working conditions at the same
schools.
As the minority population continues to rise in numbers and as a total percentage of
the state and national population, it is imperative school administrators seek minority
applicants to fill instructional vacancies in schools filled with increasingly higher numbers of
minority students. The K-8 sample for this study only consisted of 6.6% ethnic minority
teachers. Furthermore, the 6-8 middle and AMS samples were made up of no more than 19%
minority teachers. The percentages of ethnic minority teachers for this study’s sample are
similar in comparison to the findings of the North Carolina Department of Public Instruction
(2007). In its North Carolina Schools Statistical Profile 2007, the North Carolina
Department of Public Instruction found that 15% of all elementary teachers were from ethnic
minorities. Thirteen percent of elementary teachers were Black. In comparison, 17% of all
public school teachers were from ethnic minorities. Fourteen percent of all public school
teachers were Black. Despite the fact that the North Carolina Department of Public
Instruction failed to distinguish public middle school and K-8 teachers in a separate category
for comparison purposes (instead teachers were classified in elementary, secondary, and
other classifications), this researcher found the statistics on elementary and all public school
teachers important for consideration purposes when making recommendations to increase the
number and percentage of ethnic minority teachers in K-8 and AMS. Success in increasing
the number and percentage of minority teachers in K-8 and AMS has the potential for
significantly affecting teachers’ perceptions of working conditions in K-8 schools and AMS.
248
Results from this study indicated that ethnicity has a significant relationship with the teacher
working conditions domain subscale means. Hence, increasing the number and percentage of
minority teachers, along with the significant relationship between teacher ethnicity and the
teacher working condition domains by school type, could have a significant effect on
teachers’ perceptions of working conditions in public K-8 and middle schools in the future.
2. Recruit and hire male teachers at K-8 schools.
Second, there was also a wide disparity along gender lines in this study’s sample.
There was a significant relationship between gender and the two teacher working conditions
domain subscale means (time and facilities and resources). The recognition of significant
relationships between teachers’ perceptions of the teacher working conditions domains of
time and facilities and resources, and the teacher demographic variable, gender, are contrary
to Hirsch’s (2005b) finding that gender did not appear to affect teachers’ perceptions of any
teacher working conditions domain in his analysis of the 2004 NCTWCS.
To address the wide disparity in the percentage of male and female teachers in North
Carolina’s public K-8 and AMS as revealed from the findings of this study, it is the
recommendation of this researcher that school administrators in K-8 and AMS recruit more
male teachers for their school to decrease the differences in teacher demographics by gender.
Increasing the number of male teachers in K-8 and AMS would provide additional male role
models for male students from the time they begin school in kindergarten through their
middle school years. Increasing the number of male teachers would also provide additional
security within K-8 and AMS during a time when there has been an increased number and
concern with acts of school violence. Increasing the number of male teachers could be
especially important for K-8 schools. The literature review for this study revealed that one of

249
the perceived weaknesses of K-8 schools in comparison to middle schools was the financial
inability or unwillingness of school district leaders to provide K-8 schools with the same
personnel that was allocated to middle schools (George, 2005). One of the positions K-8
schools often were not allocated, unlike middle schools, was school resource officers.
Increasing the number of male teachers might assist K-8 schools to some extent in
overcoming this security weakness that middle schools might not have to face.
Only 12.2% of this study’s K-8 teachers were male. Less than a quarter of this
study’s 6-8 middle and AMS teachers were male. The percentage of male teachers in this
study’s sample was similar to the findings of the North Carolina Department of Instruction
(2007) within its North Carolina Public Schools Statistical Profile 2007. The North Carolina
Department of Public Instruction reported that 10% of all elementary teachers were male.
Twenty percent of all public school teachers in North Carolina were male in 2007 according
to the North Carolina Department of Public Instruction’s report. Despite the fact that the
North Carolina Department of Public Instruction failed to distinguish public middle school
and K-8 teachers in a separate category for comparison purposes (instead teachers were
classified in elementary, secondary, and other classifications), this researcher found the
statistics on elementary and all public school teachers important for consideration purposes
when making recommendations to increase the number and percentage of male teachers in
K-8 and AMS. Increasing the number and percentage of male teachers for K-8 and AMS
could result in more positive teacher perceptions of working conditions domains in the areas
of time and facilities and resources as results from this study indicated significant
relationships already existed between gender and teachers’ perceptions of these two teacher
working conditions domains.

250
3. Encourage teachers to earn their Master’s of Arts in Teaching (M.A.T.) prior
to beginning their teaching careers.
Third, educational leaders should encourage prospective teachers to complete
requirements for their M.A.T. prior to beginning their teaching careers. Significant
relationships were found in three cases between educational training prior to beginning
teaching or highest degree earned and teacher working conditions domain subscale means
(educational training prior to beginning teaching and time; highest degree earned and teacher
empowerment; highest degree earned and professional development). Results from this
study indicated that less than 20% of K-8 and AMS teachers earned Master’s degrees prior to
beginning teaching.
Universities that offer M.A.T. degrees often structure their programs so that the last
year of prospective teachers’ degree requirements is totally devoted to the student teaching
practicum and reflection and pre-service instructional planning. Therefore, prospective
teachers that complete their M.A.T. requirements prior to beginning their teaching careers
could acquire valuable experience that could be applicable to their initial teaching positions.
Likewise, completion of M.A.T. requirements prior to beginning their teaching careers could
also affect teachers’ perceptions of teacher working conditions domains where significant
relationships were found between the teacher demographic variables of educational training
prior to beginning teaching or highest degree earned and teacher working conditions domain
subscale means (educational training prior to beginning teaching and time; highest degree
earned and teacher empowerment; highest degree earned and professional development).
Completion of M.A.T. degrees prior to beginning teaching, consequently, could
increase teacher retention for Initially-Licensed Teachers (ILTs) and lead these teachers to
251
settle into careers of teaching. North Carolina defines Initially-Licensed Teachers as teachers
in their first three years of teaching. ILTs are provided teacher mentors within their schools
their first three years of teaching and are protected from extracurricular duty assignments.
Furthermore, removing the burdens and stresses that accompany graduate studies from
teachers’ responsibilities once engrained in the teaching profession could result in more
positive teachers’ perceptions of working conditions as these factors would no longer
potentially negatively influence teachers’ perceptions of working conditions. This is
especially true for elementary teachers’ perceptions of the time domain, as repeatedly studies
(Hirsch, 2005a; 2005b; Hirsch & Emerick with Church & Fuller, 2006a; 2006c; 2007b) have
found elementary teachers are less positive in their perceptions of the time domain than
teachers at other grade levels. Instead of devoting time during and after school to graduate
course requirements, teachers could devote more time to responsibilities that lie within
teacher working conditions domains. Teachers could seek leadership and empowerment
opportunities at their schools on committees and leadership teams. Teachers could also
spend more time at work influencing their school’s decisions on facilities and resources and
in choosing professional development activities.
4. Develop district and state level programs that provide assistance to beginning and
Initially-Licensed Teachers (ILTs). These programs could increase beginning
teacher and ILT retention.
Fourth, school district leaders at the local and state level may wish to further develop
district and state level programs that provide mentoring and assistance to beginning teachers
and ILTs because, as the data suggested in this study, 12.3% of AMS teachers, and 9.4% of
all K-8 teachers are in their three years of teaching. Mentoring and assistance programs

252
could increase beginning teacher and ILT retention. The results from this study indicated
nearly 44% of AMS teachers were in their first three years at their school, compared to 37%
of all K-8 teachers. Contrastingly, a greater percentage of K-8 teachers (nearly 25%) had
been at their schools more than ten years when compared to AMS teachers (17%).
Increasing teacher retention and decreasing what Futernick (2007) referred to as “dissatisfied
leavers” might in turn contribute to more positive teacher perceptions’ of working conditions
as teachers establish themselves professionally within one school for longer periods of time
without the desire to seek teacher employment at another school or district, or leave the
teaching profession entirely. Furthermore, results indicated that there was a significant
relationship between the years teachers are at a school and the time domain subscale mean.
The importance of this finding was that the number of years teachers had been at a school
influenced teachers’ perceptions of the use of time at their school. There was also a
significant relationship between a teacher’s number of years as an educator and teachers’
perceptions of the leadership domain subscale mean. The importance of this finding was that
the number of years a teacher had been in education influenced teachers’ perceptions of the
leadership at their school. Similarly, Hirsch and Emerick with Church and Fuller (2007b)
found in their analysis of the 2006 NCTWCS for elementary, middle, and secondary school
teachers that there were “slight variations” in teachers’ perceptions of teacher working
conditions domains based on the number of years teachers had been at a school or the
number of years teachers had been teaching (p. 24). In fact, Hirsch et al. revealed that
teachers in their first three years (ILTs) and teachers eligible for retirement (over twenty
years of experience) were “slightly more positive about their conditions of work in all five
areas (p. 24).
253
A key relationship not central to this study, which has been included in previous
studies (Hirsch, 2005a; 2005b; Hirsch & Emerick with Church & Fuller, 2006a; 2006c;
2007b) was the relationship between teacher retention and teachers’ perceptions of teacher
working conditions domains. Hirsch and Emerick with Church and Fuller (2007b) explained,
…teachers with positive perceptions about their working conditions are much more likely to stay at their school than educators who are more negative about their conditions of work, particularly in the areas of leadership and empowerment. (p.14)
Hence, the establishment of effective ILT programs at district and state levels could in turn
lead to increased teacher retention at schools, and within the teaching profession, if ILT
programs focus on improving teachers’ perceptions of teacher working conditions domains at
the beginning of their teacher careers. Hirsch et al. found this to be especially true for
improving teachers’ perceptions of the leadership and teacher empowerment domains.
Further Research on Teachers’ Demographics in Public K-8 and Middle Schools in North
Carolina and Beyond
Further research regarding the relationship between teacher demographics and
teachers’ perceptions of working conditions should be conducted since there were multiple
significant relationships found between teacher demographic variables and teachers’
perceptions of working conditions domain subscale means in this study. The ever-changing
demographics of the teacher workforce due to teacher attrition caused by “movers” and
“leavers” as defined by Berry and Fuller with Williams and Lobacz (2007, October) provide
additional support for continuing research on teacher demographics and teachers’ perceptions
of teacher working conditions domains. Research analyzing the relationship between teacher
demographics and teachers’ perceptions of teacher working conditions domains should also
continue as an effort to improve beginning and ILT retention. Colgan (2004, August)
254
revealed that “one-third of the country’s new teachers leave teaching sometime during their
first three years” (p. 23). Colgan also shared that up to 46 percent of beginning teachers
leave the profession by the end of their fifth year.
The benefits of continuing research on the relationship between teacher demographics
and teachers’ perceptions of teacher working conditions domains are numerous when it
comes to teacher retention. Using teacher working conditions research to develop a better
approach to retaining teachers will allow limited financial resources available for school
funding at district and state levels to be spent on improving facilities and providing resources
at schools for students and teachers. Instead of directing financial resources on recruiting
teachers, these funds can be spent on professional development activities for teachers, which
in turn can be used to improve the instruction provided to middle grades students.
Furthermore, reducing teacher turnover should allow for a more stable, educational
environment to be formed within schools as less time and money has to be spent each year
replacing teachers that have left and orienting teachers with new instructional assignments
and beginning teachers to their schools.
More extensive research on the relationship between teacher demographics and
teachers’ perceptions of teacher working conditions domains might also examine the teacher
demographics of all North Carolina K-8 schools. The findings could potentially be compared
to urban school districts across the nation that are currently converting middle schools back
to K-8 schools in hopes of improving the middle grade experience for students and teachers.
Additionally, urban school districts that are currently debating whether or not to convert their
middle schools to K-8 schools, or K-8 to middle schools, could administer modified versions
of the 2006 NCTWCS, as Clark County Schools in Las Vegas, Nevada did in 2006 and 2007,
255
to assess teachers’ perceptions of working conditions in their urban schools. By
administering teacher working conditions survey instruments in urban districts, the
relationship between teacher demographics and teachers’ perceptions of teacher working
conditions domains could be analyzed by school type during and after the conversion
process. Teacher working conditions surveys could be one of many assessments used to
evaluate the current state and success of K-8 and middle schools in the urban school districts
considering grade configuration changes for middle grades students. Furthermore, the
significant relationships found in this study between several teacher demographic variables
and various teacher working conditions domains should enlighten urban school district
leaders of the information that could be gathered through administrations of teacher working
conditions surveys in their districts.
Additional research might also look for potential relationships between teacher
demographics by school type and middle grade student academic achievement. Conducting
such research might provide additional quantitative support for organizing middle grades
students and teachers in K-8, 6-8 middle, or other middle grade configurations in order to
best meet the needs of students and teachers.
The research on student/school characteristics variables indicated that:
• Nearly 50% of teachers worked in schools where 50% or more of students were
eligible for free and reduced lunch.
• There was a statistically significant relationship between percentage of students
eligible for free and reduced lunch and three teacher working conditions domain
subscale means (facilities and resources, teacher empowerment, and leadership).
256
• Only 3% of AMS teachers worked in schools designated in the top two levels of
academic distinction (Honor School of Excellence and School of Excellence) as
determined by the ABCs of Public Education.
• Only 1.2% of K-8 teachers worked in schools designated in the top two levels of
academic distinction (Honor School of Excellence and School of Excellence) as
defined by the ABCs of Public Education.
• Over 60% of K-8 teachers worked in schools receiving academic distinction as
defined by the ABCs of Public Education (Honor School of Excellence, School of
Excellence, School of Distinction, and School of Progress) compared to nearly 56%
of 6-8 middle and nearly 54% of AMS teachers.
• 16.4% of AMS teachers worked in schools classified as Low Performing Schools the
lowest ABC School Recognition status for school academic achievement compared to
over 13% of 6-8 middle schools teachers.
• Only 7% of K-8 teachers worked in schools classified as Low Performing Schools,
the lowest ABC School Recognition status for school academic achievement.
• Over 19% of AMS and over 16% of 6-8 middle school teachers worked in schools
classified in the lowest two ABC School Recognition categories (Priority Schools and
Low Performing Schools) measuring school academic achievement compared to 10%
of K-8 teachers.
• There was a statistically significant relationship between 2005-06 ABC School
Recognitions and the teacher working conditions domain subscale means.
257
• Over 37% of K-8 school teachers worked at schools with more than 90% of students
proficient on the 2005-06 Reading End-of-Grade test compared to 27% of 6-8 middle
and AMS teachers.
• Over 82% of K-8, 6-8 middle, and AMS teachers worked at schools where at least
80% of students were proficient on the 2005-06 Reading End-of-Grade test.
• There was a statistically significant relationship between the percentage of students
proficient on the 2005-06 Reading End-of-Grade test and the teacher working
conditions domain subscale means.
The results from this study provided extensive student/school characteristic data for
the public K-8 and middle schools where teacher respondents worked. Student/school
characteristic variables were important factors to consider when analyzing this study’s
sample by school type. Results for this study indicated nearly half of the teachers worked in
schools where 50% or more of the students were eligible for free and reduced lunch. There
were significant relationships between percentage of students eligible for free and reduced
lunch and three teacher working conditions domain subscale means (facilities and resources,
teacher empowerment, and leadership). Results also indicated that there were significant
relationships between 2005-06 ABC School Recognitions and the percentage of students
proficient on the 2006 Reading End-of-Grade test and all teachers’ perceptions of all teacher
working conditions domain subscale means. Several policy suggestions for school, local,
and state administrators to consider based on student/school characteristics for schools
worked at by teacher respondents in this study are shared here. These policy
recommendations address student/school characteristics variables that might in turn affect
teachers’ perceptions of working conditions domains. These policy recommendations are
258
based on the premise that students and schools will experience gains in yearly academic
achievement as measured by yearly ABC School Recognitions and the percentage of students
proficient on yearly end-of-grade tests. Improvements in student and school academic
achievement are based on the findings of Hirsch and Emerick with Church and Fuller
(2007b) that significant relationships exist between teachers’ perceptions of teacher working
conditions domains and school achievement at the elementary and middle school levels.
Policy Recommendations and Implications for School Administrators Based on K-8 and
Middle School Teacher Data on Student/School Characteristics as Derived from this Study
1. Provide additional resources via local, state, and federal funds to Title I schools
(schools with ≥50% of students eligible for free and reduced students).
First, Title I schools (schools with ≥50% of students eligible for free and reduced
students) should continue to receive additional resources from local, state, and federal funds
to meet the educational needs of students and instructional needs of teachers in Title I
schools. Results from this study indicated a statistically significant relationship between the
percentage of students eligible for free and reduced lunch and teachers’ perceptions of three
teacher working conditions domain subscale means (facilities and resources, teacher
empowerment, and leadership). Providing additional resources to Title I schools may lead to
more positive teachers’ perceptions of working conditions in K-8 and AMS. Positive
teachers’ perceptions of working conditions might in turn lead to improved learning
conditions and increased student achievement in Title I K-8 and middle schools. This
researcher supports the assumption by Hirsch and Emerick with Church and Fuller (2007b)
in a previous analysis of the 2006 NCTWCS that “teacher working conditions are student
learning conditions” (p. vii). Previous studies (Hirsch, 2005a; 2005b; Hirsch & Emerick with

259
Church & Fuller, 2006b; 2007b) have repeatedly found significant relationships between
positive teachers’ perceptions of teacher working conditions domains and improved student
achievement.
Hirsch (2007, February) completed an additional study on the relationship between
teachers’ perceptions of teacher working conditions domains and student achievement. The
sample for his study included many high poverty school districts that contained Title I middle
and high schools. Hirsch’s study was in response to Judge Howard Manning’s ruling against
the State of North Carolina in Leandro vs. the State of North Carolina. Judge Manning ruled
in Leandro vs. the State of North Carolina that the State of North Carolina must provide
additional resources (financial, human, professional development) to low-wealth school
districts in an effort to establish conditions might lead to improved student academic
achievement within low-wealth school districts. State educational policymakers should also
continue to explore ways in which to address the financial disparities between low-wealth
and high-wealth school districts as ruled by Judge Howard Manning in Leandro v. the State
of North Carolina. A closer analysis revealed that schools within low-wealth school districts
such as those included within Judge Manning’s ruling in Leandro v. the State of North
Carolina often contain large percentages of students eligible for free and reduced lunch.
Hence, developing programs to meet the needs of low-wealth school districts and their
schools could simultaneously provide valuable assistance and resources to schools which
have large percentages of students eligible for free and reduced lunch. Hirsch (2007,
February) explained that additional resources and assistance could be used to provide
professional development for school leaders within low-wealth school districts and Low
Performing Schools that trains these school leaders on how to best improve teacher working

260
conditions in their school. Additional financial resources could also be used to train school
leaders on ways to develop a “rigorous curriculum” at their school (p. 7).
2. At the local and state levels continue to implement professional development for
teachers and administrators that could lead to improved student academic
achievement. This could result in higher annual ABC School Recognitions for
school academic achievement.
3. At the local and state levels provide additional funding, resources, and assistance
to schools in low-wealth school districts in the state of North Carolina as ruled by
Judge Howard Manning in Leandro vs. the State of North Carolina in order for
school administrators to address teacher working conditions concerns that once
remedied might improve teachers’ perceptions of working conditions in schools in
low-wealth school districts.
4. Provide local and state assistance to Priority and Low Performing Schools.
Second, professional development should be provided that improves administrator
and teacher understanding of what is required for their schools to achieve the highest ABC
School Recognitions (Honor Schools of Excellence and Schools of Excellence) for school
academic achievement. Professional development could include end-of-grade test data
disaggregation training for administrators and teachers to determine areas within the
curriculum that teachers need to place greater emphasis on in the future according to the
previous year’s end-of-grade test results. Better understanding of test results would allow
administrators and teachers to better align instruction for the next school year to the tested
curriculum which English and Steffy (2001) refer to as deep curriculum alignment.
Administrators and teachers might use more efficiently human and material resources as they
261
clearly understand the instructional needs of students and teachers within their schools.
Effective professional development, in turn, could result in more positive teachers’
perceptions of the teacher working conditions domains, as results from this study indicated
statistically significant relationships among the teacher working conditions subscale means.
Therefore, improving teachers’ perceptions of one teacher working conditions domain could
have what Hirsch (2005b) referred to as a “ripple effect” on other teacher working conditions
domains (p. 14). Hirsch explained that “improving one area could have a ‘ripple’ effect on
others and cause teacher’s overall satisfaction with their school climate to increase and
thereby improve student learning” (p. 14). Likewise, results from this study also indicated
statistically significant relationships between 2005-06 ABC School Recognitions for school
academic achievement and the teacher working conditions subscale means. Hence,
improving K-8 and middle school ABC School Recognitions could in turn improve teachers’
perceptions of working conditions as well.
The need for professional development to improve teacher and administrator
understanding of the ABC School Recognition standards, and subsequently improve teacher
and administrator end-of-grade test disaggregation was based on the premise that results from
this study indicated that a very small percentage of K-8 and AMS teachers worked at schools
that earned the two highest ABC School Recognitions during the 2005-06 school year.
Results from this study indicated that only 1.2% of K-8 teachers and 3% of AMS teachers
worked at schools that achieved the two highest ABC School Recognitions for school
academic achievement during 2005-06. Furthermore, only 60% of K-8 teachers, 56% of 6-8
middle school teachers, and 54% of AMS teachers worked at schools that received ABC

262
School Recognitions for successful school academic achievement (Honor School of
Excellence, School of Excellence, School of Distinction, School of Progress) in 2005-06.
The results from this study also revealed that over 16% of AMS teachers and over
13% of 6-8 middle school teachers worked in schools labeled as Low Performing, the lowest
2005-06 ABC School Recognition for school academic achievement. Only 7% of K-8 school
teachers worked in Low Performing Schools. When combining the percentage of teachers
working in Low Performing Schools with the second lowest 2005-06 ABC School
Recognition (Priority Schools), the percentage of teachers working in these schools increased
to over 19% for AMS teachers and over 16% for 6-8 middle school teachers. Only 10% of
K-8 school teachers worked at schools with the two lowest 2005-06 ABC School
Recognitions.
The student/school characteristics data from this study on ABC School Designations
for academic achievement for the 2005-06 school year were important because each year
schools receive ABC Report Cards, which are released to the general public to inform
parents of the academic performance of their school the previous year. Stakeholders outside
the school (district and state administrators, parents, residents in the community served by
the school) look at information measuring school academic achievement such as ABC School
Recognitions to develop their own perceptions on the success or failure of their local school.
Hence, it is important administrators and teachers understand the ABC School Recognition
standards so successful instruction can be delivered to students so their school can earn
positive ABC School Recognitions for student/school academic performance annually.
Furthermore, achieving the highest ABC School Recognitions (Honor School of Excellence,
School of Excellence), which few K-8 and AMS teachers were able to report according to

263
this study’s findings, should bring positive publicity to a school and lead to the development
of positive perceptions about the work of administrators and teachers from those outside the
school. Foremost, improving K-8 and middle school ABC School Recognitions could in turn
improve teachers’ perceptions of working conditions at their schools due to the statistically
significant relationship revealed between 2005-06 ABC School Recognition and teachers’
perceptions of the teacher working conditions domains as indicated by results from this
study.
The results from this study also revealed statistically significant relationships between
the percentage of students proficient on the 2005-06 Reading End-of-Grade test and the
teacher working conditions domain subscale means. These results indicated that only 37% of
K-8 school teachers and 27% of 6-8 middle and AMS teachers worked at schools where over
90% of students were proficient on the 2005-06 Reading End-of-Grade test. Only 82% of K-
8 and AMS teachers worked at schools with greater than 80% student proficiency on the
2005-06 Reading End-of-Grade test. Improving teachers’ perceptions of the teacher working
conditions domains could result in increased student proficiency in K-8 and AMS on future
reading end-of-grade tests due to the statistically significant relationship between the
percentage of students’ proficient on the 2005-06 Reading End-of-Grade test and teachers’
perceptions of the teacher working conditions.
The results based on the student/school characteristics of schools where teachers
worked in this study including, 2005-06 ABC School Recognitions for school academic
achievement, and the percentage of students proficient on the 2005-06 Reading End-of-Grade
test, showed there was room for school academic improvement for both public K-8 and
middle schools in North Carolina. Hirsch (2005b) noted from the 2004 NCTWCS that

264
unique relationships existed between teachers’ perceptions of certain teacher working
conditions domains and 2005-06 ABC School Recognitions. Hirsch found that for teachers’
perceptions of the professional development working conditions domain, “for every one
point increase on the Working Conditions Survey, schools were ten times more likely to be
rated in one of the top school designation categories” (p. 7). For the facilities and resources
teacher working conditions domain, Hirsch found that “schools were three times more likely
to be in one of the top school designation categories for every one point increase on the
survey” (p. 8). Likewise, statistically significant relationships were found between 2005-06
ABC School Recognitions for school academic achievement, and percentage of students
proficient on the 2005-06 Reading End-of-Grade test, and teachers’ perceptions of the
teacher working conditions domain subscale means for public K-8 and middle school
teachers in this study. Hirsch (2005b) explained the importance of closely examining
significant relationships between ABC School Recognitions and student proficiency on end-
of-grade tests when he concluded:
Given working conditions are significant predictors of student achievement, if policymakers, educators, and communities across North Carolina expect students to achieve at high levels, then teacher working conditions should be addressed and improved. (p.8)
5. Create regional K-8/Middle School Teacher Working Conditions Committees
within the eastern, central, and western regions of the state composed of public
K-8 and middle school teachers and administrators whose purpose is to discuss
strategies for improving teacher working conditions in public K-8 and middle
schools.
Fifth, North Carolina state educational leaders should look into the possibility of
creating regional K-8/Middle School Teacher Working Conditions Committees whose
265
purpose is to discuss strategies for improving teacher working conditions in public K-8 and
middle schools. Three regional K-8/Middle School Teacher Working Conditions
Committees should be created, one each for the western, central, and eastern regions of the
state. Committees will consist of teachers and administrators from public K-8 and middle
schools from their particular regions. Committees should meet bi-annually during the school
year and meet for several days during the summer outside the regular school year to discuss
how teacher working conditions have improved in their school over the past school year. Bi-
annual meetings during the school year should last no longer than one day, with locations for
these meetings rotating to limit the pain committee members might face in traveling to the
committee meetings. During the summer sessions, K-8 and middle school teachers and
administrators can share strategies that have proven successful in improving teachers’
perceptions of working conditions in their school the previous school year.
The rationale for recommending the formation of regional K-8/Middle School
Teacher Working Conditions Committees is based in part on the recommendations of
previous studies on teacher working conditions (Hirsch, 2005a; Hirsch & Emerick with
Church and Fuller, 2006b; 2007b) which suggested that the best way to improve teacher
working conditions is for collaboration amongst teachers and administrators to take place at
the school, district, and state levels. Following a previous analysis of the 2006 NCTWCS,
Hirsch and Emerick with Church and Fuller (2007b) made several recommendations to
increase teacher and administrator collaboration on teachers’ perceptions of teacher working
conditions which are similar in comparison to this researcher’s recommendation to create
regional K-8/Middle School Teacher Working Conditions Committees. Hirsch et al.
discussed the creation of the Real DEAL (Dedicated Educators, Administrators and Learners)
266
Conference whose purpose is “to share best practices in schools with positive working
conditions and high student achievement” (p. 42). It might be possible for regional K-
8/Middle School Teacher Working Condition Committees to commence as one collective
group during professional development events such as the Real DEAL Conference since time
has already been set aside to focus on improving teacher working conditions. At regional
and collective committee meetings committee members could share teacher working
conditions strategies that have produced positive and improved teacher working conditions in
their schools and districts within their specific region of the state.
The rationale for recommending the creation of regional K-8/Middle School Teacher
Working Conditions Committees is due to the regional differences that exist within each
region’s schools across the state of North Carolina. For example, the majority of K-8 schools
are found in rural, low-wealth districts in the eastern and western regions of the state. In the
central region middle schools are the most common grade configuration for educating middle
grades students. Central region school districts are more likely to be categorized as high-
wealth districts due to their urban and sub-urban location. Urban and suburban locations are
more densely populated. Larger populations in most urban and suburban locations pay
higher property taxes in the central region of the state. This results in the increased financial
capacity of school districts in the central region. A final reason for establishing regional K-
8/Middle School Teacher Working Conditions Committees could be that regional K-
8/Middle School Teacher Working Conditions Committee meetings might require less time
and money for committee members to travel to committee meetings since they would be held
in their region of the state.
267
The results from this study support regional K-8/Middle School Teacher Working
Conditions Committees addressing differences in teachers’ perceptions of working
conditions for numerous reasons. The results also indicated significant differences in teacher
working conditions subscale means by school type for all teacher working conditions
domains except professional development. Concomitantly the results also revealed that K-8
teachers had more positive perceptions than 6-8 middle school teachers for the teacher
working conditions domains except time. K-8 teachers also had more positive perceptions of
working conditions than AMS teachers for the facilities and resources, teacher
empowerment, and leadership domains. These data could in turn be used to develop
strategies for narrowing the gap in teachers’ perceptions of working conditions between K-8,
6-8 middle, and AMS teachers. The SECTQ recognized in its previous analysis of the 2006
NCTWCS data by school type for elementary, middle, and secondary schools that school
level does appear to influence teachers’ perceptions of working conditions (SECTQ, p.4).
School type also affects teachers’ perceptions of the teacher working conditions domains
except professional development according to results from this study.
There are numerous benefits of establishing regional K-8/Middle School Teacher
Working Conditions Committees. Within regional summer retreats, regional committees
could discuss current issues within grade configurations serving middle grades students such
as: current discipline problems, issues pertaining to student achievement, and current
teachers’ perceptions of teacher working conditions in their particular region of the state.
Within the course of regional and collective, statewide committee meetings discussions could
result in the discussion of successful instructional strategies to implement in schools serving
middle grades students. Collaborative resolutions could be developed to address current

268
grade configuration issues for schools serving middle grades students within regional and
statewide committee meetings as well. The results of regional K-8/Middle School Teacher
Working Conditions Committees should in turn lead to more positive teachers’ perceptions
of working conditions as changes are made which affect the teacher working conditions
domains within K-8 and middle schools across the state of North Carolina. Hirsch and
Emerick with Church and Fuller (2007b) presented additional benefits of teacher and
administrator collaboration on the topic of improving teacher working conditions from their
previous analysis of the 2006 NCTWCS. Hirsch et al. shared “that successful undertakings
to improve these conditions could help improve student achievement and help to stem
teacher turnover” (p. 43). Regional K-8/Middle School Teacher Working Conditions
Committees would offer additional opportunities for collaborative discussions within a
regional context for K-8 and middle school teachers which might result in more positive
teachers’ perceptions of teacher working conditions.
Recommended Further NCTWCS Research on Student/School Characteristics in Public K-8
and Middle Schools in North Carolina
Several student/school characteristics variables should be examined more closely to
determine their effects on K-8 and middle school teachers’ perceptions of working conditions
in public K-8 and middle schools in North Carolina. Additional research could examine the
relationship between district/school location and teachers’ perceptions of working conditions.
A recent teacher working conditions study in Ohio completed by Berry and Fuller with
Williams and Lobacz (2007, Fall) for the first time examined the relationship between
district/school location (district type) and teachers’ perceptions of teacher working
conditions. Berry et al. characterized district types into the following categories: major
269
urban, urban, suburban, affluent suburban, and rural. Within research on school location the
financial capacities of school districts containing K-8 and middle schools could be examined
as the financial capacity of school districts is often synonymous with district location.
Whereas district/school location can not be changed, the financial capacity of a school
district can potentially be changed. Further analysis of the relationships between the school
characteristic variables, district/school location and the financial capacity of school districts,
and teachers’ perceptions of teacher working conditions could lead to a better understanding
of what it might take to improve teachers’ perceptions of working conditions in all
district/school locations, despite the financial capacity of a school district.
Another factor whose relationship with teachers’ perceptions of teacher working
conditions that could be examined in future studies of student/school characteristics and their
effects on teachers’ perceptions of working conditions in public K-8 and middle schools in
North Carolina is school size. Hirsch (2005b) analyzed the effects of school size on teachers’
perceptions of all teacher working conditions domains in his analysis of the 2004 NCTWCS
data. District/school location is often a predictor of school size for school districts across the
state of North Carolina. For example, the K-8 schools of the rural eastern and western
regions of North Carolina are often smaller schools, despite the fact they serve students in
kindergarten through eighth grade. The benefits of looking at school size might include
helping school administrators to better understand the relationship between school size and
teachers’ perceptions of teacher working conditions. Possible correlations could be drawn
between school size and student achievement, and between school size and teacher retention
as well if further research focuses on the relationship between school size and teachers’
perceptions of teacher working conditions.
270
The research on teachers’ perceptions of working conditions by school type indicated that:
• All teacher working conditions domain subscale means were significantly correlated
to all other teacher working conditions subscale means.
• Correlations among teacher working conditions subscale means were positive,
ranging from .497 (time and professional development) to .780 (leadership and
teacher empowerment).
• Professional development was the only teacher working conditions subscale mean not
significantly correlated with school type.
• The four teacher working conditions domain subscale means (time, facilities and
resources, teacher empowerment, and leadership) significantly correlated to school
type showed weak correlations ranging from -.036 (time) to .155 (leadership) in their
significant correlations to school type.
• Teacher working conditions subscale means by school type ranged from 3.03 (time
by K-8) to 3.92 (leadership by K-8). Hence, there was plenty of room for improving
teachers’ perceptions of teacher working conditions domains by school type on a
Likert scale of one to five.
• There were significant differences between teacher working conditions subscale
means by school type for four of five teacher working condition domains (time,
facilities and resources, teacher empowerment, leadership).
• Professional development was the only teacher working conditions domain that did
not have significant differences for subscale means by school type. Therefore,
whether teachers worked in public K-8 or middle schools did not result in differences
in teachers’ perceptions of professional development
271
• K-8 teachers had more positive perceptions than 6-8 middle school teachers for
teacher working conditions domains except time.
• K-8 teachers had more positive perceptions than AMS teachers for the facilities and
resources, teacher empowerment, and leadership domains.
• The largest differences in teacher working conditions subscale means was between
teachers’ perceptions of K-8 (3.92) and 6-8 middle school leadership (3.55). Hence,
K-8 teachers held more positive perceptions of school leadership than middle school
teachers. School type could be partially responsible for the differences in teachers’
perceptions of school leadership at K-8 and middle schools.
• The least variation by school in teacher working conditions subscale means was in
teachers’ perceptions of professional development (.07).
• Time had the lowest teacher working conditions subscale mean by school type.
• Leadership had the highest teacher working condition subscale mean for K-8 and
AMS teachers.
• Facilities and resources was the highest teacher working conditions subscale mean for
6-8 middle school teachers.
Policy Recommendations and Implications Based on Teachers’ Perceptions of Teacher
Working Conditions by School Type as Derived from this Study:
1. Increase teacher involvement in all aspects of the school community by
implementing aspects of professional learning communities as defined by
DuFour, DuFour, Eaker, and Many (2006).
First, school administrators should increase teacher involvement in all aspects of the
school community by implementing aspects of professional learning communities as defined
272
by DuFour, DuFour, Eaker, and Many (2006). The professional learning community concept
popularized by DuFour et al. is suggested by this researcher as a possible strategy for
improving teacher working conditions within public K-8 and middle schools in North
Carolina because many aspects of professional learning communities address teacher
working conditions domain standards referenced by Hirsch (2005b) in his analysis of the
2004 NCTWCS which define teacher working conditions domains. Please see Appendix B
for the complete North Carolina Teacher Working Conditions Standards. DuFour et al.
explained, “a professional learning community is composed of collaborative teams whose
members work interdependently to achieve common goals linked to the purpose of learning
for all” (p. 3). Aspects of professional learning communities, according to DuFour et al.
include (a) a focus on learning, (b) a collaborative culture with a focus on learning for all, (c)
collective inquiry into best practice and current reality, (d) action orientation: learning by
doing, (e) a commitment to continuous improvement, and (f) results orientation. Professional
learning communities have great potential to improve teachers’ perceptions of working
conditions due to their emphasis on teacher collaboration within all aspects of the school
community. Teachers’ focus on the learning of all students guides teacher collaboration
within the professional learning community. Teachers’ focus on all students’ learning within
professional learning communities is synonymous with the conclusion reached by Hirsch and
Emerick with Church and Fuller (2006a) in their prior analysis of the 2006 NCTWCS, when
they concluded “teacher working conditions are student learning conditions” (p. 1). Hence,
implementing aspects of professional learning communities that includes teacher
collaboration to focus on the academic improvement of all students could result in more

273
positive teachers’ perceptions of teacher working conditions according to the conclusion by
Hirsch et al. that “teacher working conditions are student learning conditions” (p. 1).
Results from this study which compared teachers’ perceptions of working conditions
in public K-8 and middle schools in North Carolina, and results from the Southeast Center
for Teaching Quality’s prior analysis of the 2006 NCTWCS data by school type for
elementary, middle, and high school teachers, found that all teacher working conditions
domains were “significantly correlated with each other” (SETQ, p. 4). SECTQ explained the
significance among all teacher working conditions by observing that it was “less likely to
have teachers feel positive or negative about a single working condition without affecting
their perception of other conditions in the school” (p. 4). Hence, implementing aspects of
professional learning communities suggested by DuFour, DuFour, Eaker, and Many (2006)
within K-8 and middle schools which emphasize teacher collaboration and
“interdependency” within all aspects of the school community could result in more positive
teachers’ perceptions of working conditions as teachers have a more direct effect on
decisions made in each of the teacher working conditions domains (p. 3). Since all teacher
working conditions domain subscale means except professional development were
significantly correlated to school type for K-8 and middle schools, implementing aspects of
professional learning communities could improve teachers’ perceptions of working
conditions in these types of schools as well.
2. Administrators should facilitate discussions of teacher working conditions survey
results in various meetings of teachers and parents from the school community.
Grade level meetings, faculty meetings, school improvement team meetings, and
Parent-Teacher-Student Association meetings provide potential opportunities for
274
discussing previous teacher working conditions survey results. These meetings
might also provide administrators valuable opportunities to gather input from
teachers, parents, and community members which could be used in plans aimed at
improving teacher working conditions at each school.
Second, administrators should facilitate discussions of teacher working conditions
survey results in various meetings of teachers and parents from the school community.
Administrators could gain potentially valuable insight on suggested changes and
improvements that could be made at their schools from teachers and active parent-volunteers
within the school community at meetings where teacher working conditions survey results
were presented and discussed. Collaborative meetings such as grade level meetings, faculty
meetings, school improvement team meetings, and parent-community forums could provide
opportune, collaborative environments for administrators, teachers, parents, and community
members to have beneficial discussions on the current state of teacher working conditions at
their schools and ways in which working conditions could potentially be improved.
Administrators could also create paper or online surveys for parents and potential school
volunteers to gain a better understanding of ways these groups may wish to serve their local
school. Meetings and parent-volunteer surveys might also encourage increased parent-
community involvement within their local school as constituents learn ways in which they
could volunteer their time and provide volunteer services to their local school.
Administrators, teachers, and parent-volunteers could use prior NCTWCS results to justify
the suggested changes or areas in their schools that need improving which might result in
positive changes in teachers’ perceptions of teacher working conditions domains. Input
275
gathered from these collaborative meetings could be integrated into future plans designed
with the goal of improving working conditions at K-8 and middle schools.
3. Analyze future NCTWCS data by the teacher demographic variable of grade
level. This would allow for a more comprehensive comparison of teacher
working conditions data and potentially allow for an estimation of explained
variance by grade level. As a result, school administrators might be able to better
understand the relationship between a teachers’ grade level and teachers’
perceptions of teacher working conditions domains.
Third, analysis of teacher respondent data for future administrations of the NCTWCS
should be taken a step further, beyond the analysis of teacher respondent data by grade
configuration for K-8 and middle school teachers, and include an examination of the
relationship between the grade taught by teachers and teachers’ perceptions of working
conditions. It could be that teachers’ perceptions of teacher working conditions domains
vary by the specific grade level taught by teachers. The results from previous teacher
working conditions studies (Hirsch, 2005a, 2005b) indicated that grade level (defined as
elementary, middle, and high school; referred to as school type in this study) has influenced
teachers’ perceptions of working conditions. However, these studies have not looked at the
potential relationships between the specific grade level taught by teachers and teachers’
perceptions of teacher working conditions.
An ANCOVA could be run to estimate the explained variance in teachers’
perceptions of all teacher working conditions domains for grade level taught by teachers.
Consequences for future studies with similar research designs to this study could be that K-5
elementary teachers’ responses could be compared to teachers’ responses from kindergarten

276
through fifth grade at K-8 schools. This analysis could partially explain why K-8 teachers’
perceptions were more positive than 6-8 middle school teachers’ perceptions for four teacher
working conditions domains, and why K-8 teachers’ perceptions were more positive than
AMS teachers for three teacher working conditions domains. The SECTQ also found in its
analysis of the 2006 NCTWCS that “elementary teachers had more positive perceptions of
working conditions than secondary teachers” (p. 4). In the three previous administrations of
the NCTWCS, teachers have not been asked a teacher demographic question for the purpose
of gathering data on the grade level taught by teachers in order to protect the confidentiality
of survey respondents. Hence, the CTQ (which conducts statistical analyses of NCTWCS
data) has yet to test for correlations between teachers’ perceptions of working conditions and
the grade level at which a teacher currently teaches as the term grade level is defined by this
researcher.
The initial benefit of analyzing teachers’ perceptions of teacher working conditions
domains by a teacher’s grade level could include that administrators have additional teacher
working conditions data to analyze in their efforts to improve teacher working conditions at
their schools. Teacher working conditions data gathered for teachers’ grade level could
allow administrators to identify more easily teacher working conditions areas that need
addressing within their school. It is understood by this researcher the need to protect
individual respondent confidentiality, because safeguards to confidentiality not only protect
survey respondents, but also likely encourage more teachers to participate in the teacher
working conditions survey. However, for administrators to be truly successful at addressing
teacher working conditions in their schools, they need to be able to identify the specific areas

277
(in this case grade levels) which need addressing to provide the best working conditions they
can for their school’s teachers.
Recommended Research on Teachers’ Perceptions of Working Conditions in Public K-8 and
Middle Schools in North Carolina Based on the 2006 NCTWCS Data
First, future research on teachers’ perceptions of working conditions in North
Carolina needs to place a greater emphasis on increasing charter school teachers’ response
rate in future administrations of the NCTWCS. According to data found at North Carolina
Report Cards (2006), there were 96 public charter schools in North Carolina at the time of
the 2006 NCTWCS administration. Teachers from all public charter schools were invited via
email to respond to the 2006 NCTWCS. Only 5.33% of all charter schools met the response
rate criteria of 40% to be included in the final report on findings from the 2006 NCTWCS.
Only 21% of all public, charter school teachers completed the 2006 NCTWCS.
Increasing public charter school participation could provide additional data for
analysis by school type for schools that include middle grades students in a K-8 or middle
school format. According to North Carolina Report Cards, there were 31 public, K-8 charter
schools in North Carolina at the time the 2006 NCTWCS was administered. No public
charter schools were aligned in any type of middle school format at the time the 2006
NCTWCS was administered. Increasing the number of public, K-8 charter schools that are
eligible to be included in the final report for future NCTWCS administrations could provide
valuable data that could be used to compare teachers’ perceptions of working conditions at
public, K-8 charter schools to public, K-8 non-charter schools.

278
Conclusion: The Future of the NCTWCS as a Tool for Examining the Relationship Between
Grade Configuration and Teachers’ Perceptions of Working Conditions in Public K-8 and
Middle Schools In the State of North Carolina and Beyond
According to the Center for Teaching Quality (2007), further research on teachers’
perceptions of working conditions continues in the state of North Carolina and across the
country as this research study concludes. In March 2008, the administration of the 2008
NCTWCS will begin in public schools for all grade configurations across the state of North
Carolina. At this point in time, this researcher has not learned from the state of North
Carolina of any plans to compare teacher respondent data by school type for K-8 and middle
schools for the 2008 NCTWCS administration. However, for the first time the 2008
NCTWCS will include a separate teacher working conditions survey designed solely for
administrators to assess administrators’ perceptions of teacher working conditions in their
schools. In previous administrations teachers and administrators completed the same version
of the NCTWCS. Hirsch and Emerick with Church and Fuller (2006a) indicated the results
from the 2006 NCTWCS revealed,
On all questions, the roughly 1,400 principals responding to the survey were significantly more likely to note that positive working conditions are in place, and that leadership was making efforts to address them. (p. 20)
Hirsch et al. explained that principals’ perceptions of teacher working conditions have been
consistently higher than teachers’ perceptions of working conditions since the first
administration of the NCTWCS in 2002. Principals’ perceptions of working conditions were
also more positive for the 2004 NCTWCS, and for administrations of modified versions of
the NCTWCS in Arizona, Clark County, Nevada, Ohio, and Kansas. As a result of this
consistent finding, North Carolina Governor Mike Easley has approved the use of a separate
279
survey with questions only for administrators during the 2008 NCTWCS administration in an
effort to gain a better understanding as to why administrators might view teacher working
conditions more positively than teachers. Examining why principals view teacher working
conditions more positively than teachers could allow school administrators at all levels to
better understand teachers’ concerns with their working conditions. Consequently, school
administrators could take the potentially valuable data they acquire in a comparison of
principal’s and teachers’ perceptions of working conditions and use these findings to support
policies and strategies for improving teacher working conditions in their schools.
The Center for Teaching Quality listed several other states across the nation including
Arizona, Kansas, Mississippi, Ohio, South Carolina, and Virginia, that continue to adopt and
administer modified versions of the NCTWCS to assess teacher working conditions in their
public schools. At this point, none of these states has examined the relationship between
teachers’ perceptions of working conditions in public K-8 and middle schools. One urban
school system, Clark County Schools in Las Vegas, Nevada, just administered its second
teacher working conditions survey in 2007. It would be beneficial for other large, urban
school districts across the country that are currently converting or debating a switch from
middle to K-8 schools to administer modified versions of the NCTWCS in K-8 and middle
schools in their districts to aid the conversion process. Such systems might also wish to
analyze secondary data from previous administrations of teacher working conditions surveys
in other states by school type to gain a better understanding of teachers’ perceptions of
working conditions in public K-8 and middle schools.
280
Dissemination of the Study’s Results
This researcher intends to share the results of this study with educators at local, state,
and potentially national levels in areas where the best grade configuration for middle grades
students is currently under debate and where analyses of teachers’ perceptions of working
conditions are currently taking place. The dissemination of results from this researcher’s
examination of the relationship between grade configuration and teachers’ perceptions of
working conditions in the state of North Carolina will begin at the North Carolina
Association of Research in Education (NCARE) spring conference in late February 2008.
This researcher has also discussed the possibility of sharing results from this study at the
local level in the school district where this researcher currently works as this school district
currently has both K-8 and middle school configurations for middle grades students. The
current superintendent of the school district where this researcher works has made the
recommendation to this researcher to share results from this study at the state level with
educational policymakers within the State Educational Planning Committee. Most
importantly, this researcher desires to share findings from this study with the Office of the
Governor of the State of North Carolina which granted this researcher permission to access
the secondary data from the 2006 NCTWCS for analysis and inclusion within this study. It is
quite possible that the Office of the Governor will encourage this researcher to share findings
from this study with The Center for Teaching Quality, the organization responsible for the
quantitative statistical analyses and publication of final reports for all previous
administrations of the NCTWCS.
In conclusion, this researcher references Hirsch and Emerick with Church and Fuller
(2006a) on the importance of continued research on teachers’ perceptions of working

281
conditions and the potential effects school type, teacher demographic variables, and
student/school characteristics might have on teachers’ perceptions of working conditions.
Hirsch et al. explained, “teacher working conditions are student learning conditions” (p. 1).
Hence, improving teacher working conditions, and teachers’ perceptions of working
conditions, should result in improved student learning conditions, which in turn, could lead to
improved academic achievement for students.

282
APPENDIX A
2006 NORTH CAROLINA TEACHER WORKING CONDITIONS SURVEY
North Carolina Teacher Working Conditions 2005-2006 Survey Draft
Thank you in advance for your time and willingness to share your views on working conditions in your school. Research has demonstrated that teacher working conditions are critical to increasing student achievement and retaining teachers. North Carolina policymakers and education stakeholders have expressed great interest in using your collective responses on this survey to help improve working conditions in schools and districts across the state.
Please know that your anonymity is guaranteed. No one in your school, the district or state will be able to view individual surveys, and reports on the results will not include data that could identify individuals. You are being asked demographic information to learn whether teachers from different backgrounds and different characteristics look at working conditions differently.
Access Code. You have been assigned an anonymous access code to ensure that we can identify the school in which you work and to ensure the survey is taken only once by each respondent. T The code can only be used to identify a school, and not an individual. The effectiveness of the survey is dependent upon your honest completion.
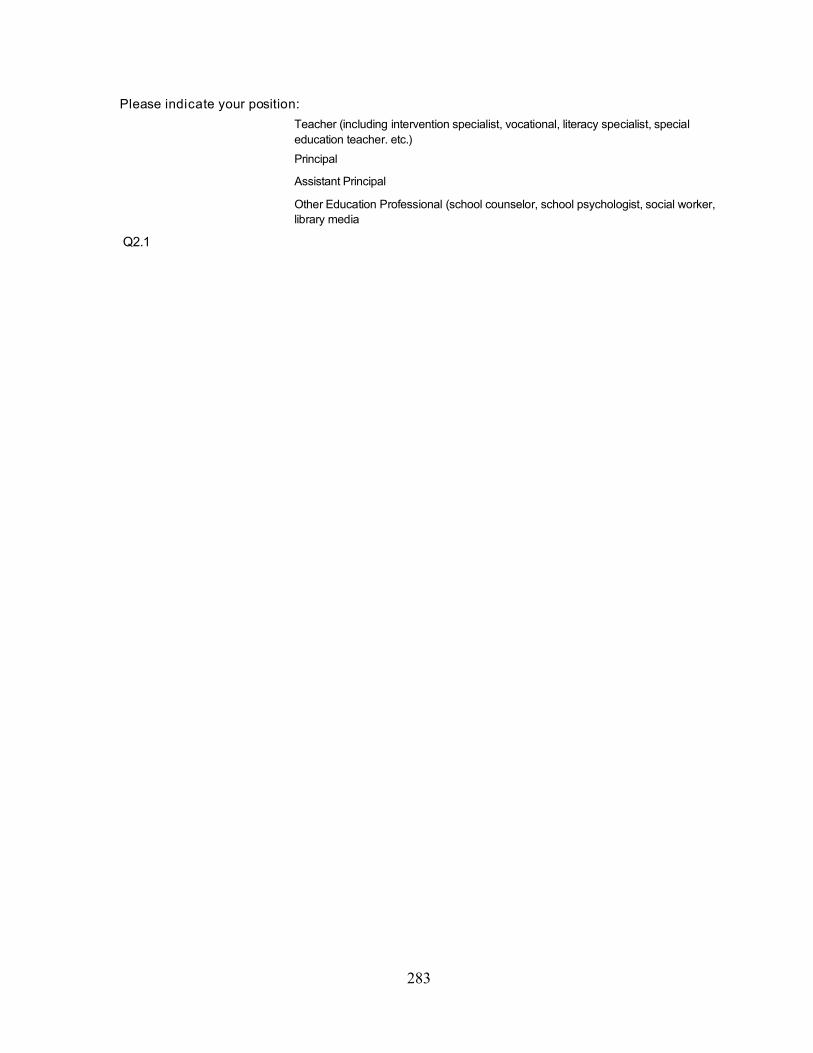
283
Please indicate your position:
Teacher (including intervention specialist, vocational, literacy specialist, special education teacher. etc.)
Principal 2
Assistant Principal 3
Other Education Professional (school counselor, school psychologist, social worker, library media
Q2.1 specialist, etc.).

284
Time Please rate how strongly you agree or disagree with the following statements about the use of time in your school.
Please indicate your level of agreement with the following statements.
Strongly Disagree
Disagree
Neither Agree nor Disagree
Agree Strongly Agree
Q3.1a
a. Teachers* have reasonable class sizes, affording them time to meet the educational needs of all students.
1 2 3 4 5
Q3.1b b. Teachers have time available to collaborate with their colleagues.
1 2 3 4 5
Q3.1c c. Teachers are protected from duties that interfere with their essential role of educating students.
1 2 3 4 5
Q3.1d d. School leadership tries to minimize the amount of routine administrative paperwork required of teachers.
1 2 3 4 5
Q3.1e e. The non-instructional time* provided for teachers in my school. is sufficient.
1 2 3 4 5
N3.3. *"Teachers" means a majority of teachers in your school.
N3.4. *"Non-instructional time” refers to any structured time during the work day to work individually or collaboratively on instructional issues.
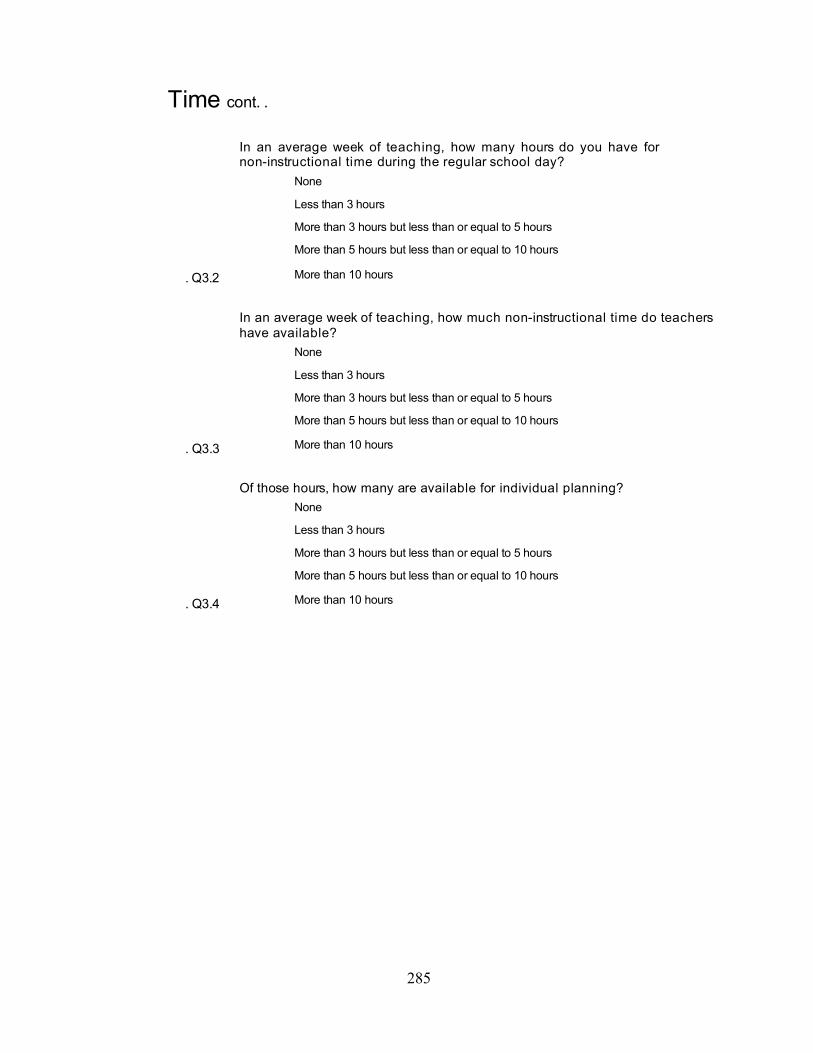
285
Time cont. . In an average week of teaching, how many hours do you have for non-instructional time during the regular school day?
None 1
Less than 3 hours 2
More than 3 hours but less than or equal to 5 hours 3
More than 5 hours but less than or equal to 10 hours 4
. Q3.2 More than 10 hours 5
In an average week of teaching, how much non-instructional time do teachers have available?
None 1
Less than 3 hours 2
More than 3 hours but less than or equal to 5 hours 3
More than 5 hours but less than or equal to 10 hours 4
. Q3.3 More than 10 hours 5
Of those hours, how many are available for individual planning?
None 1
Less than 3 hours 2
More than 3 hours but less than or equal to 5 hours 3
More than 5 hours but less than or equal to 10 hours 4
. Q3.4 More than 10 hours 5
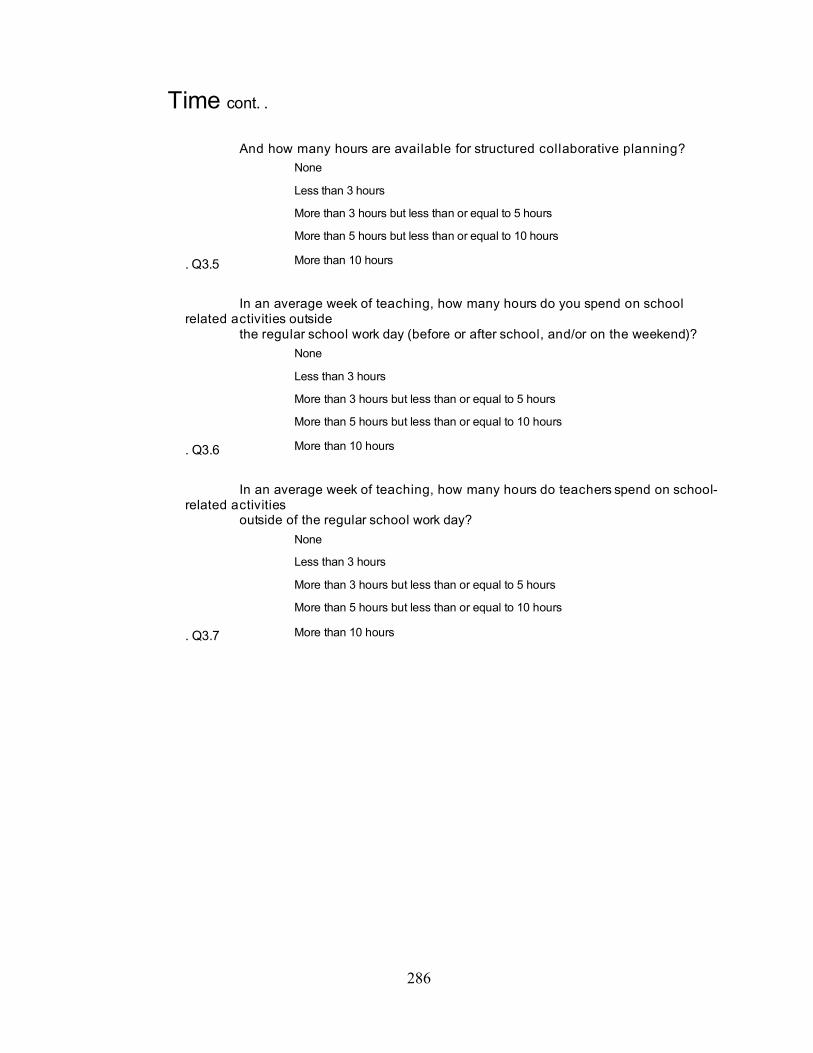
286
Time cont. .
And how many hours are available for structured collaborative planning?
None 1
Less than 3 hours 2
More than 3 hours but less than or equal to 5 hours 3
More than 5 hours but less than or equal to 10 hours 4
. Q3.5 More than 10 hours 5
In an average week of teaching, how many hours do you spend on school related activities outside
the regular school work day (before or after school, and/or on the weekend)?
None 1
Less than 3 hours 2
More than 3 hours but less than or equal to 5 hours 3
More than 5 hours but less than or equal to 10 hours 4
. Q3.6 More than 10 hours 5
In an average week of teaching, how many hours do teachers spend on school-related activities
outside of the regular school work day?
None 1
Less than 3 hours 2
More than 3 hours but less than or equal to 5 hours 3
More than 5 hours but less than or equal to 10 hours 4
. Q3.7 More than 10 hours 5

287
Facilities and Resources Please rate how strongly you agree or disagree with the following statements about your school facilities and resources.
Strongly Disagree
Disagree Neither Agree nor Disagree
Agree Strongly Agree
Q4.1a a. Teachers have sufficient access to appropriate instructional materials* and resources.
1 2 3 4 5
Q4.1b b. Teachers have sufficient access to instructional technology, including computers, printers, software, and internet access.
1 2 3 4 5
Q4.1c c. Teachers have sufficient access to communications technology, including phones, faxes, email, and network drives.
1 2 3 4 5
Q4.1d d. T Teachers have sufficient access to office equipment and supplies such as copy machines, paper, pens, etc.
1 2 3 4 5
Q4.1e e. The reliability and speed of Internet connections in this school are sufficient to support instructional practices.
1 2 3 4 5
Q4.1f f. Teachers have adequate professional space to work productively.
1 2 3 4 5
Q4.1g g. Teachers and staff work in a school environment that is clean and well maintained.
1 2 3 4 5
Q4.1h h. Teachers and staff work in a school environment that is safe.
1 2 3 4 5
N4.3 *Instructional materials include items such as textbooks, curriculum materials, content references, etc.

288
Teacher Empowerment Please rate how strongly you agree or disagree with the following statements about teacher empowerment in your school.
Please rate your level of agreement with the following statements.
Strongly Disagree
Disagree Neither Agree nor Disagree
Agree Strongly Agree
Q5.1a a. Teachers are centrally involved in decision making about educational issues.
1 2 3 4 5
Q5.1b b. Teachers are trusted to make sound professional decisions about instruction.
1 2 3 4 5
Q5.1c c.The faculty has an effective process for making group decisions and solving problems.
1 2 3 4 5
Q5.1d d. In this school we take steps to solve problems.
1 2 3 4 5
Q5.1e
e. Opportunities for advancement within the teaching profession (other than administration) are available to me.
1 2 3 4 5
Please indicate how large a role teachers at your school have in each of the following areas: No role at all Small
role Moderate role Large
role The Primary role
Q5.2a a. Selecting instructional materials and resources.
1 2 3 4 5
Q5.2b b. Devising teaching techniques. 1 2 3 4 5
Q5.2c c. Setting grading and student assessment practices.
1 2 3 4 5
Q5.2d d. Determining the content of in-service professional development programs.
1 2 3 4 5
Q5.2e e. Hiring new teachers. 1 2 3 4 5
Q5.2f f. Establishing and implementing policies about student discipline.
1 2 3 4 5
Q5.2g g. Deciding how the school budget will be spent.
1 2 3 4 5
Q5.2h h. School improvement planning. 1 2 3 4 5
Members of the school improvement team are elected.
Yes 1
No 2
. Q5.3 Don't know 3
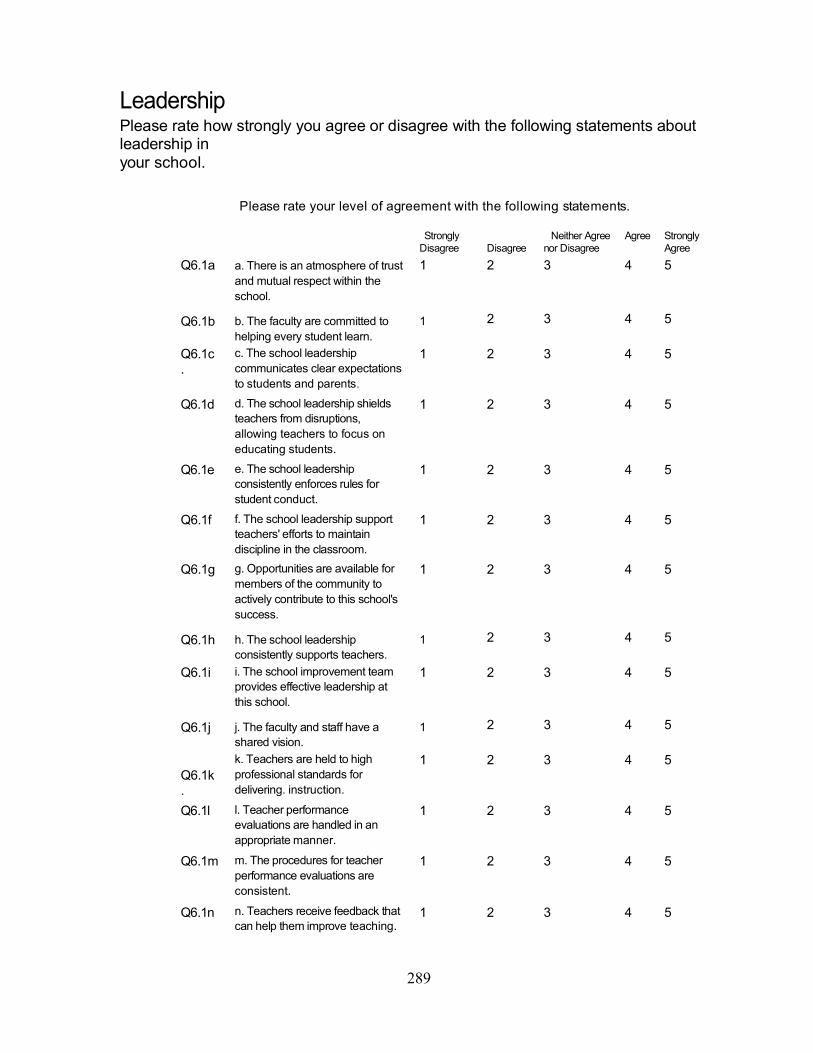
289
Leadership Please rate how strongly you agree or disagree with the following statements about leadership in your school.
Please rate your level of agreement with the following statements.
Strongly Disagree
Disagree
Neither Agree nor Disagree
Agree Strongly Agree
Q6.1a a. There is an atmosphere of trust and mutual respect within the school.
1 2 3 4 5
Q6.1b b. The faculty are committed to helping every student learn.
1 2 3 4 5
Q6.1c .
c. The school leadership communicates clear expectations to students and parents.
1 2 3 4 5
Q6.1d d. The school leadership shields teachers from disruptions, allowing teachers to focus on educating students.
1 2 3 4 5
Q6.1e e. The school leadership consistently enforces rules for student conduct.
1 2 3 4 5
Q6.1f f. The school leadership support teachers' efforts to maintain discipline in the classroom.
1 2 3 4 5
Q6.1g g. Opportunities are available for members of the community to actively contribute to this school's success.
1 2 3 4 5
Q6.1h h. The school leadership consistently supports teachers.
1 2 3 4 5
Q6.1i i. The school improvement team provides effective leadership at this school.
1 2 3 4 5
Q6.1j j. The faculty and staff have a shared vision.
1 2 3 4 5
Q6.1k .
k. Teachers are held to high professional standards for delivering. instruction.
1 2 3 4 5
Q6.1l l. Teacher performance evaluations are handled in an appropriate manner.
1 2 3 4 5
Q6.1m m. The procedures for teacher performance evaluations are consistent.
1 2 3 4 5
Q6.1n n. Teachers receive feedback that can help them improve teaching.
1 2 3 4 5
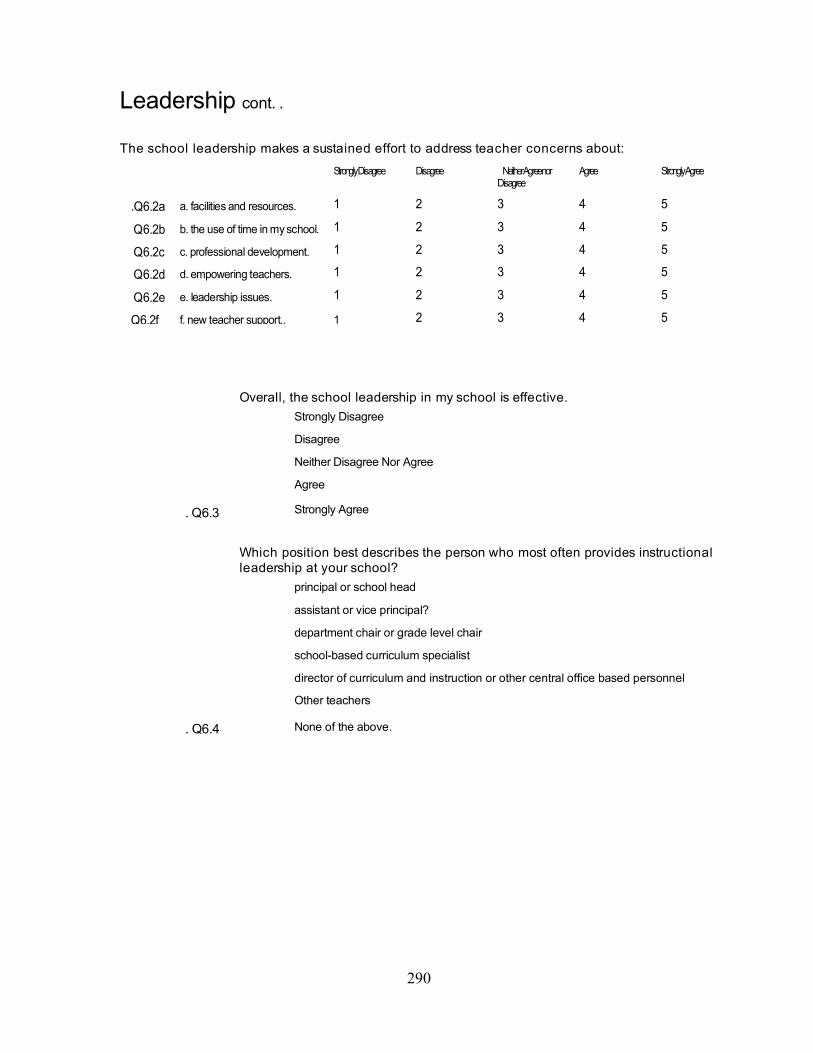
290
Leadership cont. .
The school leadership makes a sustained effort to address teacher concerns about:
Overall, the school leadership in my school is effective.
Strongly Disagree 1
Disagree 2
Neither Disagree Nor Agree 3
Agree 4
. Q6.3 Strongly Agree 5
Which position best describes the person who most often provides instructional leadership at your school?
principal or school head 1
assistant or vice principal? 2
department chair or grade level chair 3
school-based curriculum specialist 4
director of curriculum and instruction or other central office based personnel 5
Other teachers 6
. Q6.4 None of the above. 7
Strongly Disagree Disagree Neither Agree nor Disagree
Agree Strongly Agree
.Q6.2a a. facilities and resources. 1 2 3 4 5
Q6.2b b. the use of time in my school. 1 2 3 4 5
Q6.2c c. professional development. 1 2 3 4 5
Q6.2d d. empowering teachers. 1 2 3 4 5
Q6.2e e. leadership issues. 1 2 3 4 5
Q6.2f f. new teacher support.. 1 2 3 4 5
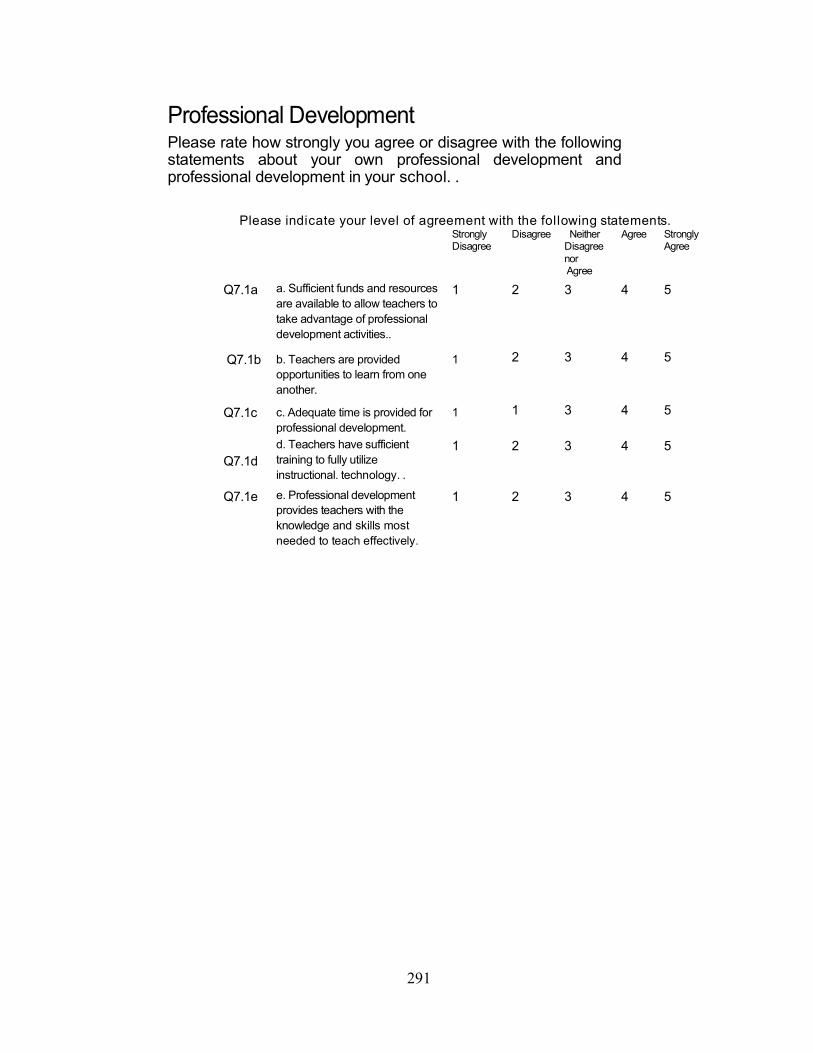
291
Professional Development Please rate how strongly you agree or disagree with the following statements about your own professional development and professional development in your school. .
Please indicate your level of agreement with the following statements. Strongly
Disagree Disagree Neither
Disagree nor Agree
Agree Strongly Agree
Q7.1a a. Sufficient funds and resources are available to allow teachers to take advantage of professional development activities..
1 2 3 4 5
Q7.1b b. Teachers are provided opportunities to learn from one another.
1 2 3 4 5
Q7.1c c. Adequate time is provided for professional development.
1 1 3 4 5
Q7.1d
d. Teachers have sufficient training to fully utilize instructional. technology. .
1 2 3 4 5
Q7.1e e. Professional development provides teachers with the knowledge and skills most needed to teach effectively.
1 2 3 4 5

292
Professional Development cont. In which of the following areas, if any, do you believe teachers need additional support to effectively teach students?
Special education (students with disabilities) 1
Special education (academically gifted students) 2
Limited English Proficiency (LEP) 3
Closing the achievement gap 4
Your content area 5
Methods of teaching 6
Student assessment 7
Classroom management techniques 8
. Q7.2 Reading strategies 9

293
Professional Development cont. .
In which of the following areas, if any, do you need additional support to effectively teach your students? Check all that apply.
Special education (students with disabilities) 1
Special education (academically gifted students) 2
Limited English Proficiency (LEP) 3
Closing the achievement gap 4
Your content area 5
Methods of teaching 6
Student assessment 7
Classroom management techniques 8
. Q7.3 Reading strategies 9
In the past 2 years, have you had 10 hours or more of professional development in any of the following areas? Check all that apply.
Special education (students with disabilities) 1
Special education (academically gifted students) 2
Limited English Proficiency (LEP) 3
Closing the achievement gap 4
Your content area 5
Methods of teaching 6
Student assessment 7
Classroom management techniques 8
. Q7.4 Reading strategies 9
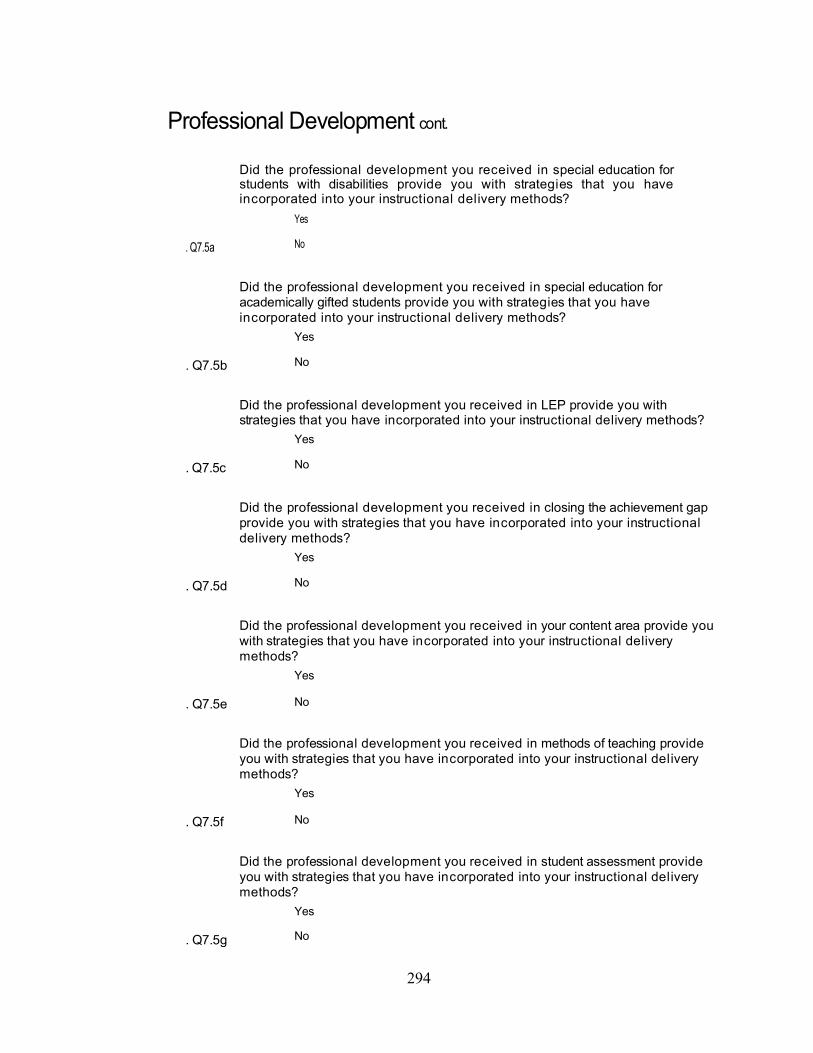
294
Professional Development cont. Did the professional development you received in special education for students with disabilities provide you with strategies that you have incorporated into your instructional delivery methods?
Yes 1
. Q7.5a No 2
Did the professional development you received in special education for academically gifted students provide you with strategies that you have incorporated into your instructional delivery methods?
Yes 1
. Q7.5b No 2
Did the professional development you received in LEP provide you with strategies that you have incorporated into your instructional delivery methods?
Yes 1
. Q7.5c No 2
Did the professional development you received in closing the achievement gap provide you with strategies that you have incorporated into your instructional delivery methods?
Yes 1
. Q7.5d No 2
Did the professional development you received in your content area provide you with strategies that you have incorporated into your instructional delivery methods?
Yes 1
. Q7.5e No 2
Did the professional development you received in methods of teaching provide you with strategies that you have incorporated into your instructional delivery methods?
Yes 1
. Q7.5f No 2
Did the professional development you received in student assessment provide you with strategies that you have incorporated into your instructional delivery methods?
Yes 1
. Q7.5g No 2
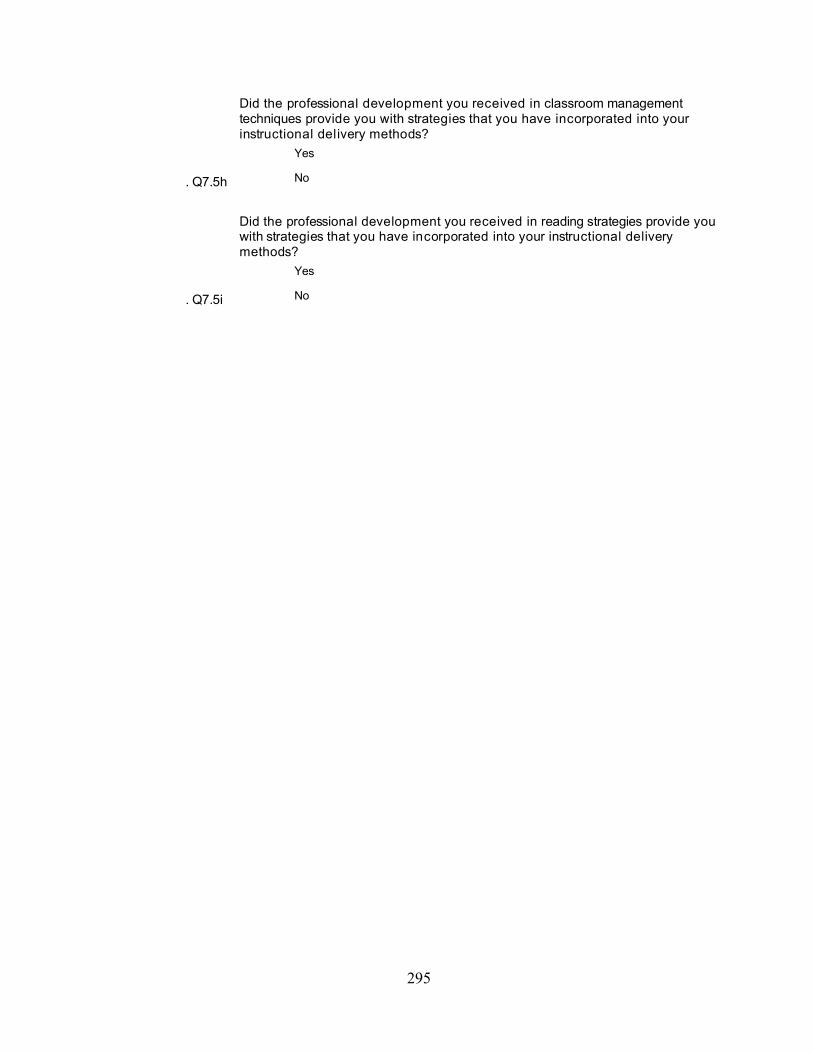
295
Did the professional development you received in classroom management techniques provide you with strategies that you have incorporated into your instructional delivery methods?
Yes 1
. Q7.5h No 2
Did the professional development you received in reading strategies provide you with strategies that you have incorporated into your instructional delivery methods?
Yes 1
. Q7.5i No 2
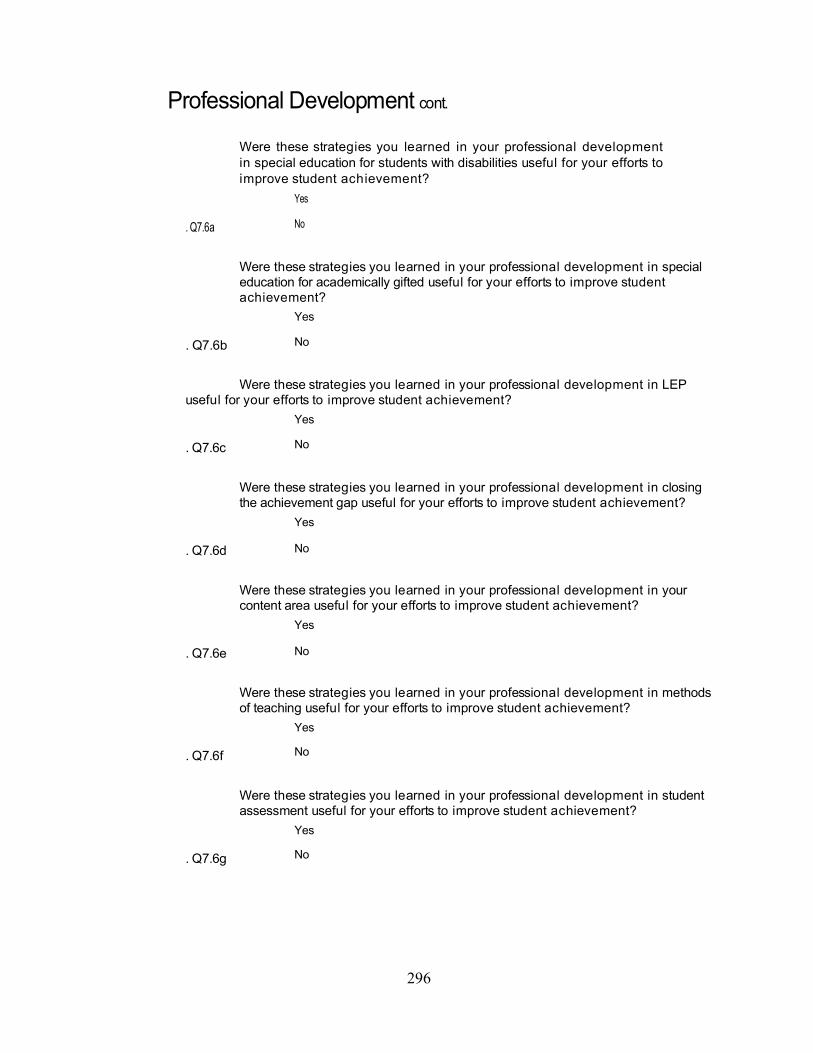
296
Professional Development cont.
Were these strategies you learned in your professional development in special education for students with disabilities useful for your efforts to improve student achievement?
Yes 1
. Q7.6a No 2
Were these strategies you learned in your professional development in special education for academically gifted useful for your efforts to improve student achievement?
Yes 1
. Q7.6b No 2
Were these strategies you learned in your professional development in LEP useful for your efforts to improve student achievement?
Yes 1
. Q7.6c No 2
Were these strategies you learned in your professional development in closing the achievement gap useful for your efforts to improve student achievement?
Yes 1
. Q7.6d No 2
Were these strategies you learned in your professional development in your content area useful for your efforts to improve student achievement?
Yes 1
. Q7.6e No 2
Were these strategies you learned in your professional development in methods of teaching useful for your efforts to improve student achievement?
Yes 1
. Q7.6f No 2
Were these strategies you learned in your professional development in student assessment useful for your efforts to improve student achievement?
Yes 1
. Q7.6g No 2
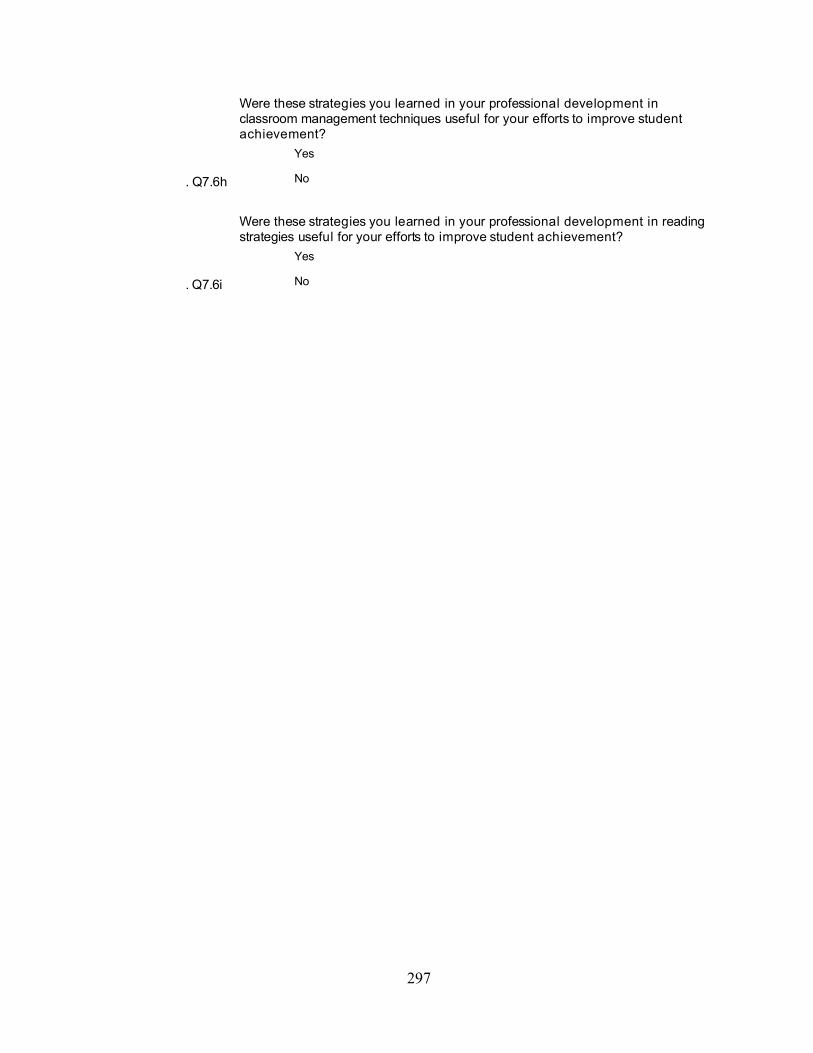
297
Were these strategies you learned in your professional development in classroom management techniques useful for your efforts to improve student achievement?
Yes 1
. Q7.6h No 2
Were these strategies you learned in your professional development in reading strategies useful for your efforts to improve student achievement?
Yes 1
. Q7.6i No 2

298
Professional Development cont. .
In the past two years, have you enrolled or participated in any of the following professional development activities?
Yes No
. Q7.7a online learning opportunities 1 2
. Q7.7b local in-service program 1 2
. Q7.7c state-sponsored in-service program 1 2
Was the Online learning opportunity required?
Yes 1
. Q7.8 No 2
The Online learning opportunities activities I participated in were effective.
Strongly Disagree 1
Disagree 2
Neither Agree Nor Disagree 3
Agree 4
. Q7.9 Strongly Agree 5
Was the local in-service program required?
Yes 1
. Q7.10 No 2
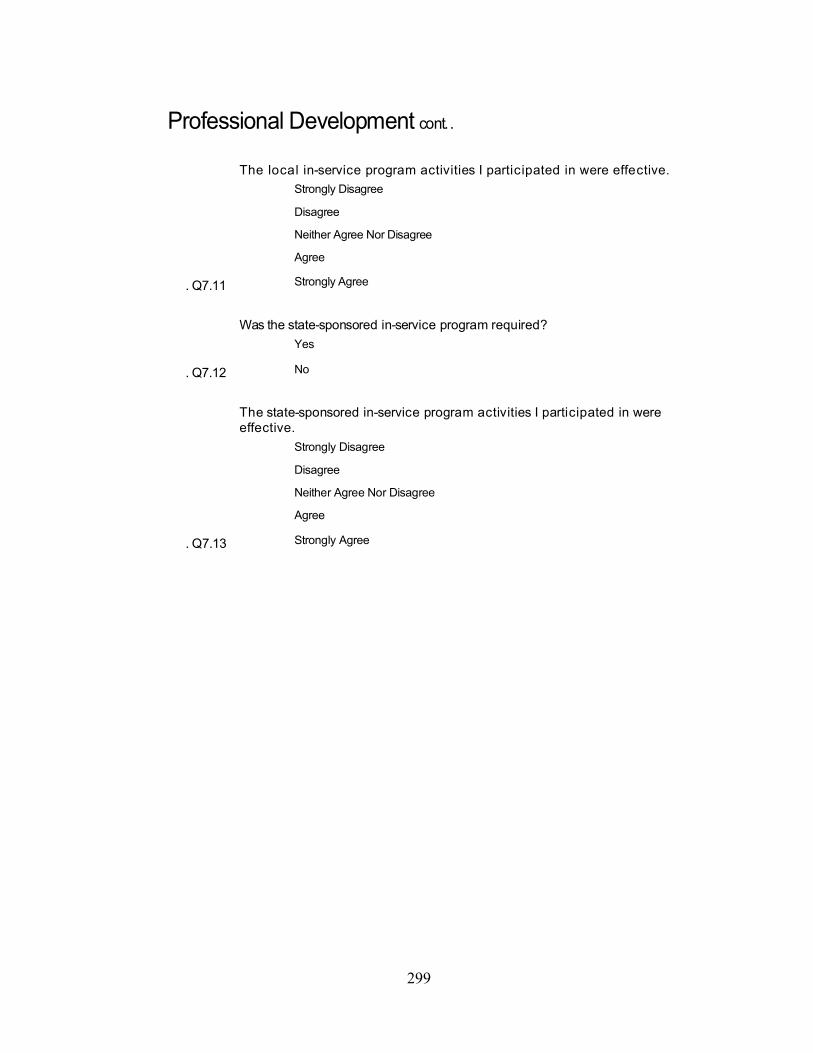
299
Professional Development cont. .
The local in-service program activities I participated in were effective.
Strongly Disagree 1
Disagree 2
Neither Agree Nor Disagree 3
Agree 4
. Q7.11 Strongly Agree 5
Was the state-sponsored in-service program required?
Yes 1
. Q7.12 No 2
The state-sponsored in-service program activities I participated in were effective.
Strongly Disagree 1
Disagree 2
Neither Agree Nor Disagree 3
Agree 4
. Q7.13 Strongly Agree 5

300
Professional Development cont.
Do you teach students who have an Individualized Education Plan or 504 Plan?
Yes 1
. Q7.14 No 2
Do you teach students who are Limited English Proficient?
Yes 1
. Q7.15 No 2

301
Core Questions Which aspect of your work environment most affects your willingness to keep teaching at your school?
Time during the work day 1
School facilities and resources 2
School leadership 3
Teacher empowerment 4
. Q8.1 Professional Development 5
Which aspect of your school's work environment most affects teachers' willingness to keep teaching at your school?
Time during the work day 1
School facilities and resources 2
School leadership 3
Teacher empowerment 4
. Q8.2 Professional Development 5
Which aspect of working conditions is most important to you in promoting student learning?
Time during the work day 1
School facilities and resources 2
School leadership 3
Teacher empowerment 4
. Q8.3 Professional Development 5
Overall, my school is a good place to teach and learn
Strongly Disagree 1
Disagree 2
Neither Agree Nor Disagree 3
Agree 4
Q8.4 . Strongly Agree 5
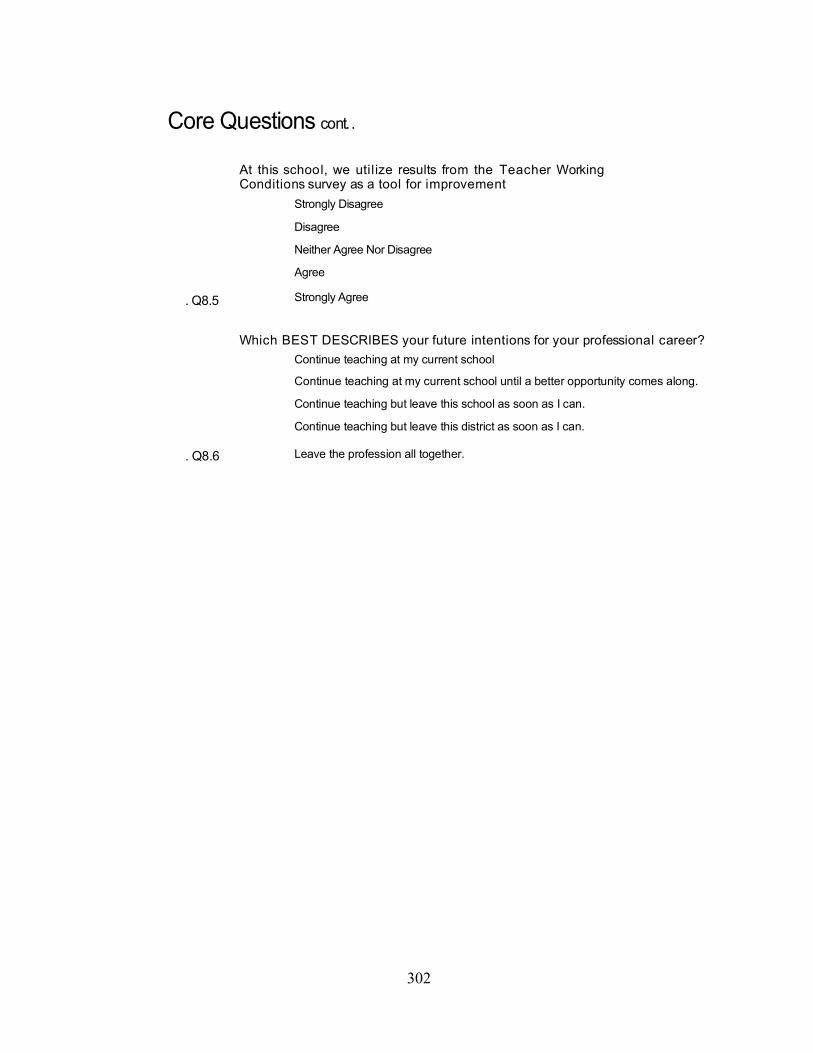
302
Core Questions cont. . At this school, we utilize results from the Teacher Working Conditions survey as a tool for improvement
Strongly Disagree 1
Disagree 2
Neither Agree Nor Disagree 3
Agree 4
. Q8.5 Strongly Agree 5
Which BEST DESCRIBES your future intentions for your professional career?
Continue teaching at my current school 1
Continue teaching at my current school until a better opportunity comes along. 2
Continue teaching but leave this school as soon as I can. 3
Continue teaching but leave this district as soon as I can. 4
. Q8.6 Leave the profession all together. 5
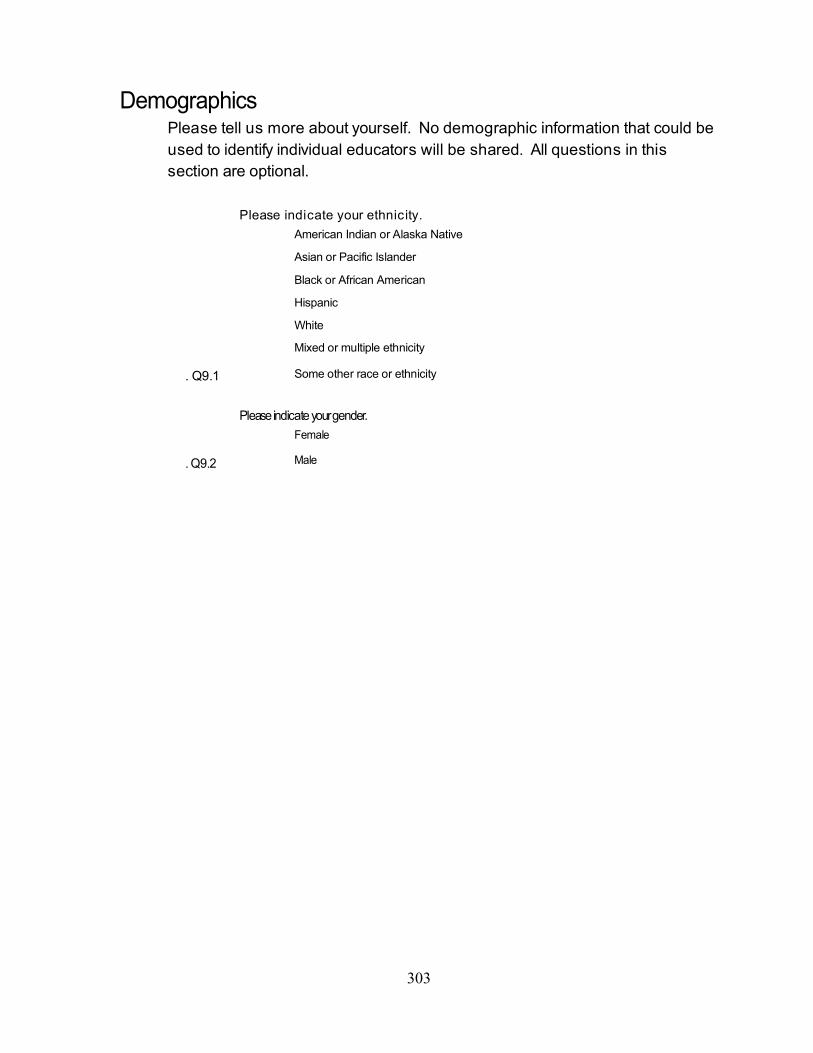
303
Demographics Please tell us more about yourself. No demographic information that could be used to identify individual educators will be shared. All questions in this section are optional.
Please indicate your ethnicity.
American Indian or Alaska Native 1
Asian or Pacific Islander 2
Black or African American 3
Hispanic 4
White 5
Mixed or multiple ethnicity 6
. Q9.1 Some other race or ethnicity 7
Please indicate your gender.
Female 1
. Q9.2 Male 2
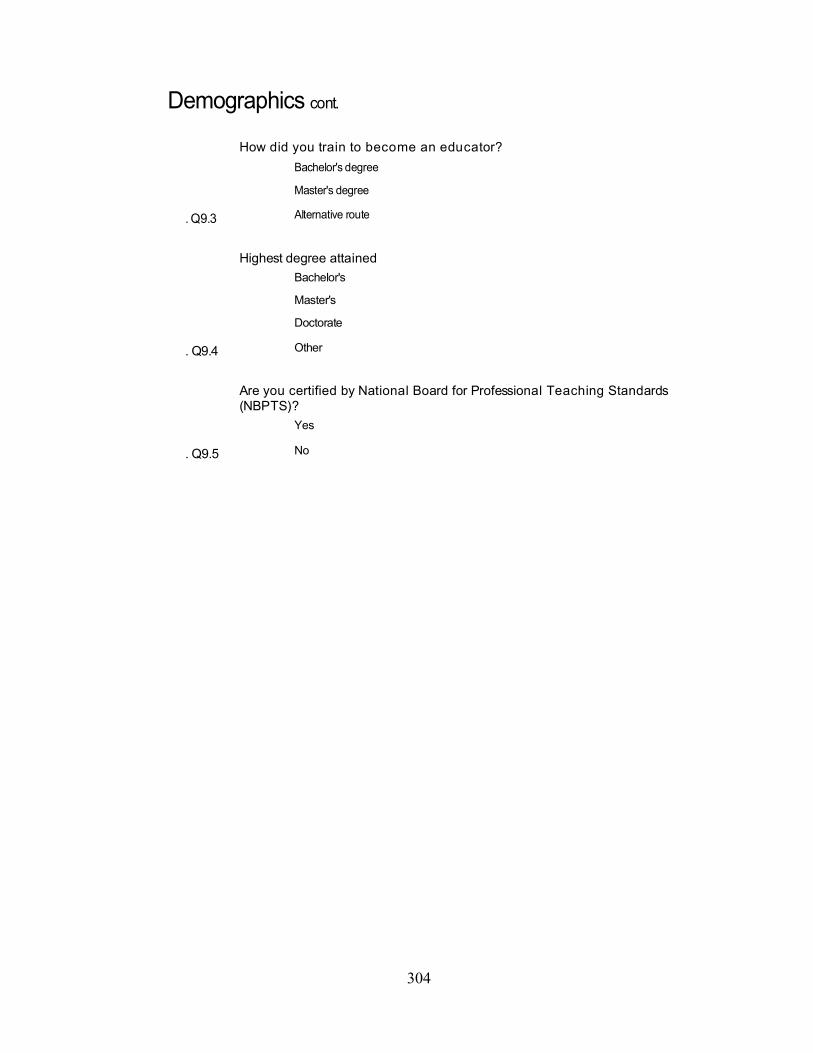
304
Demographics cont.
How did you train to become an educator?
Bachelor's degree 1
Master's degree 2
. Q9.3 Alternative route 3
Highest degree attained
Bachelor's 1
Master's 2
Doctorate 3
. Q9.4 Other 4
Are you certified by National Board for Professional Teaching Standards (NBPTS)?
Yes 1
. Q9.5 No 2

305
Demographics cont.
How many years have you been employed as an educator?
First Year 1
2 - 3 Years 2
4 - 6 Years 3
7 - 10 Years 4
11 - 20 Years 5
. Q9.6 20+ Years 6
How many years have you been employed in the school in which you are currently working?
First Year 1
2 - 3 Years 2
4 - 6 Years 3
7 - 10 Years 4
11 - 20 Years 5
. Q9.7 20+ Years 6
Have you served as a mentor in North Carolina schools in the past five years?
Yes 1
. Q9.8 No 2

306
Mentoring
Have you been formally assigned a mentor in your first AND second year teaching in North Carolina?
Yes 1
Q10.1. No 2
Answer questions for a formal mentor assigned at the school where you now work. If you had multiple years of formal mentors, answer questions for your most recent mentor experience.
My mentor was effective in providing support in the following areas Of no
help at all
Has helped a little
Has helped some
Has helped a lot
Help was critical
Q10.2a. a. Instructional strategies. 1 2 3 4 5
Q10.2b. b. Curriculum and the subject content I teach.
1 2 3 4 5
Q10.2c. c. Classroom management/discipline strategies.
1 2 3 4 5
Q10.2d. d. School and/or district policies and procedures.
1 2 3 4 5
Q10.2e. e. Completing products or documentation required of new teachers.
1 2 3 4 5
Q10.2f. f. Completing other school or district paperwork.
1 2 3 4 5
Q10.2g. g. Social support and general encouragement.
1 2 3 4 5
Q10.2h. h. Other. 1 2 3 4 5
Please indicate whether each of the following were true for you and your mentor Yes No
Q10.3a. a. My mentor and I were in the same building(or school). 1 2
Q10.3b. b. My mentor and I taught in the same content area. 1 2
Q10.3c. c. My mentor and I taught the same grade level. 1 2

307
Mentoring cont. .
On average, how often did you engage in each of the following activities with your mentor?
Q10.4a. a. Planning during the school day with my mentor. 1 2 3 4 5 6
Q10.4b. b. Being observed teaching by my mentor. 1 2 3 4 5 6
Q10.4c. c. Observing my mentor's teaching. 1 2 3 4 5 6
Q10.4d. d. Planning instruction with my mentor. 1 2 3 4 5 6
Q10.4e. e. Having discussions with my mentor about my teaching 1 2 3 4 5 6
Q10.4f. f. Meeting with my mentor outside of the school day. 1 2 3 4 5 6
How important has your mentoring experience been in your decision to continue teaching at this school?
Made no difference at all 1
Only slightly important 2
Somewhat important 3
Important 4
Q10.5. Very important 5

308
Mentoring cont.
Please indicate which best describes you and your mentee(s) None of them Some of them All of them
Q10.9a.a. My mentor and I were in the same building. 1 2 3
Q10.9b.b. My mentor and I taught in the same content area. 1 2 3
Q10.9c.c. My mentor and I taught the same grade level. 1 2 3
On average, how often did you engage in each of the following activities with your mentee(s)? . Q10.10aa. Planning during the school day with my mentee(s). 4 5 . Q10.10bb. Observing my mentee(s)' teaching 5 6 4 6
. Q10.10cc. Being observed by my mentee(s).
. Q10.10dd. Planning instruction with my mentee(s).
. Q10.10ee. Having discussions with my mentee(s) about teaching.
Please indicate which of the following kinds of support, if any, you received as a formally assigned mentor. (Check all that apply).
Release time to observe your mentee(s) 1
Release time to observe other mentors 2
Reduced teaching schedule 3
Reduced number of preparations 4
Common planning time with teachers you are mentoring 5
Specific training to serve as a mentor (e.g. seminars or classes). 6
Regular communication with principals, other administrator or department chair 7
Q10.11 Other 8
Thank you for sharing your valuable time, thoughts and perspectives on this survey. We value the work you do to provide a quality
education to the children of NC.
Survey results will be available at http://www.northcarolinatwc.org. by June 1, 2006.
1 2 3 4 5 6
1 2 3 4 5 6
1 2 3 4 5 6
1 2 3 4 5 6
1 2 3 4 5 6

309
APPENDIX B
STANDARDS FOR WORKING CONDITIONS IN NORTH CAROLINA SCHOOLS Use of time In schools that are dedicated to recruiting, nurturing and retaining teachers, the following working conditions are evident:
• There is scheduled time in the day for teachers to focus on development of successful curriculum, classroom management, strategies, and techniques to individualize instruction for student success.
• Teachers have student loads that allow them to meet the educational needs of all students. • Teachers are not assigned duties that interfere with their primary job of educating students. • Planning time is provided for all teachers K-12. • New teachers are provided effective mentors. There is time for the new teachers and the mentor to work
together during the day, both within and outside the classroom. • Standards and expectations for teachers are organized, simplified and streamlined to allow teachers to focus
on developing skills that are most important for successful instruction. • Teachers have time to collaborate with highly skilled, dedicated colleagues.
Facilities and Resources In schools where teachers are productive, creative, and satisfied, the following working conditions are in place:
• There is space for each teacher to work with students and with colleagues; there is also space for the teachers to work quietly and individually.
• Teachers have necessary office and instructional supplies and access to funds for purchasing supplies which allows them to involve students in meaningful work.
• Teachers have access to current technology that allows them to prepare students to be successful. • Teachers have assistance for the clerical aspects of their jobs. • The school environment is safe. The health of teachers, staff members and students is a top priority. The
school is a secure place for the entire learning community. • Teachers have help from educational support personnel such as tutors, family specialists, psychologists,
nurses, counselors, administrators, social workers, mental health professionals, and others. This assistance allows teachers to meet all the needs of their students.
• Schools have community and business partnerships that support the learning process. • Teacher salaries and supplements are competitive with equivalent professions.
Leadership Schools where teachers are enthusiastic and effective show evidence of the following:
• The principal is a strong and supportive leader with a clear vision of the central mission of the school. The principal utilizes the leadership potential of the teachers.
• All stakeholders (including teachers) participate in the decision-making process. • There is a high level of leadership and support from the school board, central office, and parent, as well as
from government officials, such as county commissioners, state legislator, the Superintendent of Public Instruction, the State Board of Education, and the Department of Public Instruction.
• Teachers are the recognized leaders of their classrooms and are supported in their classroom-based decisions and initiatives.
• School leaders at all levels shield educators from disruptive distractions in order to ensure that teachers can focus on what is best for their students and for learning.
Empowerment In schools where teachers are effective and where turnover is low, there is evidence of the following:
• There are many avenues available for educators to express their concerns and propose solutions.
310
• Reasoned educational risk-taking is encouraged and supported. • Teachers are recognized as educational experts and are trusted to make sound professional decisions. • Within the educational community there is an atmosphere of mutual respect, where each professional is
empowered to do his/her work.
Professional Development In schools where learning is valued, teachers are encouraged and supported in their efforts to develop their skills and knowledge:
• Sufficient resources are available to allow teachers to take advantage of important professional development opportunities.
• Professional growth of teachers is valued as the basis for improving student achievement. • A variety of types of learning opportunities are recognized as valuable, including study groups and teacher
research. • The design and choice of professional development activities are research-based. • Professional development is based on individual, school, and distinct goals.

311
REFERENCES
Abella, R. (2005). The effects of small K-8 centers compared to large 6-8 schools on student performance. Middle School Journal, 37(1), 29-35. Anfara, V.A., & Buehler, A. (2005). Grade configuration and the education of young
adolescents. Middle School Journal, 37(1), 53-57. Astuto, T., Clark, D.L., Read, A. M., McGree, K., & Fernandez, L. (1993). Challenges to
dominant assumptions controlling educational reform. Andover, MS: Regional Laboratory for the Educational Improvement of the Northeast and Islands.
Balfanz, R., Spiridakis, K., & Nield, R. (2002, November). Will converting high-poverty
schools to K-8 schools facilitate achievement gains? A research brief for the School District of Philadelphia. Philadelphia, PA: Philadelphia Education Fund.
Baltimore City Public School System: Division of Research, Evaluation, Assessment,
and Accountability. (2002). Factors impacting staff employment decisions: Survey results of current and former teachers, administrators, and additional staff. Baltimore, MD. Retrieved July 25, 2007, from http://www.bcps.k12.md.us/student_performance/pdf/ir_factors_impacting_staff_ employment.pdf.
Berry, B. & Fuller, E. (with Williams, A., & Lobacz, U.). (2007, Fall). Teaching
and learning conditions in Ohio: Implications for supply and demand. Chapel Hill, N.C.: Center for Teaching Quality. Retrieved January 10, 2008, from http://www.teachingquality.org/twc/Ohio2007final.pdf.
Boyd, V. (1992). School context: Bridge or barrier to change? Austin, TX: Southwest
Educational Development Laboratory. Bradley, A., & Kennedy-Manzo, K. (2000, October). The weak link. Education Week,
(20)5, 3-8. Retrieved April 9, 2007, from http://www.edweek.org/ew/articles/2000/10/04/05msmain.h20.html.
Brown, F. (1998). Legal perspective: Leandro v. State of No. Carolina. School
Business Affairs, 64(4), 44-48. Brown, F. (2004). Organizational Climate and Organizational Culture. Notes taken in
EDUC 237: Organizational Theory at the University of North Carolina at Chapel Hill, October 26, 2004, Chapel Hill, NC.
Brown, K. M., Roney, K., & Anfara, V. A. (2003, May). Organizational health directly
influences student performance at the middle level. Middle School Journal, 34 (5), 5-15. Buckley, J., Schneider, M, & Shang, Y. (2005, May). Fix it and they might stay: School
312
facility quality and teacher retention in Washington, D.C. Teachers College Record, 107, 1107-1123. Retrieved August 15, 2007, from http://web.ebscohost.com.libproxy.lib.unc.edu/ehost/pdf?vid=4&hid=113&sid=ba62f6c6-8006-4e30-a165-f91678b6d746%40sessionmgr107.
Bulion, L. (2005). Turning Points 2000: A blue print for middle grades education
reform. Education World. Retrieved April 9, 2007, from http://www.educationworld.com/a_admin/admin/admin208.shtml.
Campbell, D. & Stanley, J. (1963). Experimental and quasi-experimental
designs for research on teaching. In N. Gage (Ed.), Handbook of Research on Teaching (pp. 171-246). Chicago: Rand McNally and Company.
Center for Child and Family Policy at Duke University. (2003, March). Governor Mike
Easley’s teacher working conditions initiative: Preliminary report of findings from a statewide survey of educators. North Carolina: Office of the Governor at the State of North Carolina.
Center for Teaching Quality. (n.d.). Retrieved August 20, 2007, from
http://www.teachingquality.org/twc/whereweare.htm
Charlotte Advocates for Education. (2004, February). Role of principal leadership in increasing teacher retention: creating a supportive environment. Executive Summary. Retrieved September 5, 2007, from http://www.lausd.k12.ca.us/lausd/committees/hrc/100704pdf/Item%202.pdf.
Christman, J. B. (2001). Powerful ideas, modest gains: Five years of systemic reform in
Philadelphia middle schools. Philadelphia, PA: Consortium for Policy Research in Education.
Clark, A. (2004). National forum to accelerate middle grades reform. Newton, MA:
Education Development Center. Cohen, J. (1988). Statistical power analysis for the behavioral sciences. Hillsdale, NJ:
Erlbaum. Colgan, C. (2004, August). Teacher retention crisis? American School Board Journal,
191(8), 22-25. Retrieved August 15, 2007, from http://web.ebscohost.com.libproxy.lib.unc.edu/ehost/pdf?vid=2&hid=113&sid=7f a4c1c5-6045-4139-af4c-e22ea90cc121%40sessionmgr109.
Cooney, S., & Bottoms, G. (2003). A highly qualified teacher in every middle grades
classroom: What states, districts and schools can do. Atlanta, GA: Southern Regional Education Board.
Connolly, F., Yakimowski-Srebnick, M., & Russo, C.V. (2002). An examination of K-5,
313
6-8 versus K-8 grade configurations. ERS Spectrum, 20(2), 28-37. Cromwell, S. (1999). K-8 schools: An idea for the new millennium? Education World.
Retrieved April 9, 2007, from http://www.educationworld.com/a_admin/admin/admin115.shtm
DeYoung, A., Howley, C., & Theobald, P. (1994). The cultural contradictions of middle schooling for rural community survival. Washington, D.C.: U.S. Department of Education, Office of Educational Research and Improvement, 14, 24.
Diamantes, T. (2004). What principals think motivates teachers. Journal of Instructional Psychology, 31, 68-70. DuFour, R., DuFour, R., Eaker, R., & Many, T. (2006). Learning by doing: A handbook for
professional learning communities at work. Bloomington, IN: Solution Tree. Emerick, S., & Hirsch, E. (2004). Teacher working conditions: Reforming state policy to
create positive teaching and learning environments. Retrieved August 20, 2007, from http://www.teachingquality.org/publications/reports.htm
English, F. & Steffy, B. (2001). Deep curriculum alignment: Creating a level playing
field for all children on high-stakes tests of educational accountability. Lanham, MD: The Scarecrow Press, Inc.
Erb, T. (2005). K-8 settings or separate schools: Is there a best way to educate young
adolescents? Middle School Journal, 37(1), 2-3. Fletcher, A. (2004). Broadening the bounds of involvement: Transforming schools with
student voice, para. 3. Retrieved September 2, 2004, from http://www.newhorizons.org/voices/fletcher.htm
Franklin, B. J., & Glascock, C. H. (1998). The relationship between grade configuration
and student performance in rural schools. Journal of Research in Rural Education, 14, 149-153.
Futernick, K. (2007). A possible dream: Retaining all teachers so all students can learn. Sacramento: Caifornia State University. Retrieved August 20, 2007, from http://www.calstate.edu/teacherquality/documents/possible_dream_exec.pdf
Georgia Professional Standards Commission. (2001). A statewide analysis of the factors that lead to the retention of teachers in Georgia’s public schools. Retrieved July 25, 2007, from http//:www.gapsc.com/Workforce/Data/Retention_Full_2001.pdf.
George, P. S. (2005). K-8 or not: Reconfiguring the middle grades. Middle School
Journal, 37(1), 6-13. Gerstl-Pepin, C., & Marshall, C. (2005). Re-framing education politics for social
justice. Boston: Allyn and Bacon.
314
Green, S. B., & Salkind, N. J. (2005). Using SPSS for Windows and Macintosh:
Analyzing and understanding data. Upper Saddle River, N.J.: Pearson/Prentice Hall.
Hanushek, E. A., Kain, J. F., & Rivkin, S. G. (2004). Why public schools lose
teachers. Journal of Human Resources, 39, 326-354. Retrieved February 22, 2008, from http://www.jstor.org.libproxy.lib.unc.edu/view/0022166x/sp060003/06x0026z/0?frame=noframe&[email protected]/01c0a8346500501d3d89d&dpi=3&config=jstor.
Herman, B. E. (2004). The revival of K-8 schools. Phi Delta Kappa Fastbacks.
Bloomington, Ind.: Phi Delta Kappa Foundation, 519, 7-37. Herzberg, F. (1966). Work and the Nature of Man. New York, N.Y.: The World
Publishing Company. 91-111. Herzberg, F., Mausner, B., & Snyderman, B. B. (1993). The motivation to work. New
Brunswick, N.J.: Transaction Publishers. Hirsch, E. (2005a). Listening to the experts: A report on South Carolina’s 2004 teacher
working conditions initiative. Chapel Hill, N.C.: Southeast Center for Teaching Quality. Retrieved September 23, 2007, from http://www.teachingquality.org/pdfs/TWC_SCFinalReport.pdf.
Hirsch, E. (2005b). Teacher working conditions are student learning conditions: A
report of Governor Easley’s 2004 working conditions initiative. Chapel Hill, N.C.: Southeast Center for Teaching Quality. Retrieved September 23, 2007, from http://www.teachingquality.org/pdfs/TWC_FullReport.pdf.
Hirsch, E. (2007, February). Report for Superior Court Judge Howard Manning:
Teacher working conditions in lower performing North Carolina secondary schools. Report presented at the New Teacher Center at the University of California at Santa Cruz, Santa Cruz, CA. Retrieved February 7, 2008, from http://ncteachingconditions.org/research.htm.
Hirsch, E. & Emerick, S. (with Church, K., & Fuller, E.). (2006a). Interim report on the
North Carolina teacher working conditions survey. Chapel Hill, N.C.: Center for Teaching Quality. Retrieved September 23, 2007, from http://www.teachingquality.org/pdfs/twcnc2006.pdf.
Hirsch, E. & Emerick, S. (with Church, K., & Fuller, E.). (2006b). Teaching and
learning conditions are critical to the success of students and the retention of teachers: Final report on the 2006 Clark County teaching and learning conditions survey. Hillsborough, N.C.: Center for Teaching Quality. Retrieved September 23, 2007, from http://www.teachingquality.org/pdfs/twcccsd2006.pdf.
315
Hirsch, E. & Emerick, S. (with Church, K., & Fuller, E.). (2006c). Working conditions
survey report: Kansas. Chapel Hill, N.C.: Center for Teaching Quality. Retrieved September 23, 2007, from http://www.kansastwc.org/twcks2006.pdf.
Hirsch, E. & Emerick, S. (with Church, K., & Fuller, E.). (2007a). Arizona teacher working conditions: Designing schools for educator and student success. Chapel Hill, N.C.: Center for Teaching Quality. Retrieved September 23, 2007, from http://www.teachingquality.org/pdfs/twcaz2006.pdf.
Hirsch, E. & Emerick, S. (with Church, K., & Fuller, E.). (2007b). Teacher working conditions are student learning conditions: A report on the 2006 North Carolina Teacher Working Conditions Survey. Chapel Hill, N.C.: Center for Teaching Quality. Retrieved January 10, 2008, from http://www.teachingquality.org/pdfs/twcnc2006.pdf.
Hough, D. L. (1995). The elemiddle school: A model for middle grades reform.
Principal, 74(3), 6-9. Howell, D. C. (2002). Statistical methods for psychology (5th ed.). Pacific Grove, CA:
Duxbury. Huang, S. L. (2001). Teachers’ perceptions of high school environments. Learning
Environments Research, 4, 159-173. Retrieved August 12, 2007, from http://www.springerlink.com/content/g2w40t4331m014g0.
Ingersoll, R. M. (2001, January). Teacher turnover, teacher shortages, and the organization of schools. Center for the Study of Teaching and Policy, University of Washington. Retrieved September 20, 2007, from http://depts.washington.edu.libproxy.lib.unc.edu/ctpmail/PDFs/Turnover-Ing-01-2001.pdf.
Ingersoll, R. M. (2002, June). The teacher shortage: A case of wrong diagnosis and wrong prescription. NASSP Bulletin, 86(631), 16-31. Retrieved September 23, 2007, from http://vnweb.hwwilsonweb.com/hww/shared/shared_main.jhtml?_requestid=176744.
Jackson, A. W. & Davis, G. A. (2000, November 3). Turning Points 2000: Educating Adolescents in the 21st Century. St. Louis, MO: National Middle School Association. Retrieved April 9, 2007, from http://mgforum.org/Resources/RDirectory/excerptsjacksondavis.asp.
Johnson, B., & Stevens, J. J. (2006, July). Student achievement and elementary
teachers’ perceptions of school climate. Learning Environments Research, 9, 111-122. Retrieved August 22, 2007, from http://www.springerlink.com/content/uxh24431h2055101/fulltext.pdf.
316
Johnson, S. M. (2006, July). The workplace matters: Teacher quality, retention,
and effectiveness. Washington, D.C.: National Education Association. Retrieved August 25, 2007, from http://www.gse.harvard.edu.libproxy.lib.unc.edu/~ngt/workplacematters.pdf
Johnson, S. M., Birkeland, S., Kardos, S. M., Kauffman, D., Liu, E, & Peske, H.
G. (2001, July/August). Retaining the next generation of teachers: The importance of school-based support. Harvard Education Letter: Research Online. Retrieved April 9, 2007, from http://www.physics.ohio-state.edu/~jossem/REF/99.pdf.
Juvonen, J., Le, V., Kagonoff, T., Augustine, C., & Constant, L. (2004). Focus on the
wonder years: Challenges facing the American middle school. Santa Monica, CA: RAND Corporation.
Kasak, D. (2004, August 1). Custom focus vital for middle schools. Atlanta Journal
and Constitution. Retrieved December 17, 2005, from http://ajc.printthis.clickability.com/pt/cp?action=cpt&title=Custom+focus+vital+ for+middle+schools&expire=&urlID=14479996&fb=Y&url.http%3A.
Kesner, R. & Arbour, M. (2000). The K-8 school: “Like a great, big family.” Principal,
80(2), 43-44. Lambert, L., Collay, M., Dietz, M. E., Kent, K., & Richert, A.E. (1997). Who will save
our schools? Teachers as constructionist leaders. Thousand Oaks, CA: Sage Publications.
Little, J. W. (1982). Norms of collegiality and experimentation: Workplace conditions of
school success. American Educational Research Journal, 19, 325-40. Retrieved August 25, 2007, from http://www.jstor.org.libproxy.lib.unc.edu/view/00028312/ap040076/04a00010/0.
Loeb, S. & Darling-Hammond, L. (2005). How teaching conditions predict teacher
turnover in California schools. Peabody Journal of Education, 80(3), 44-70. Look, K. (2001). The great K-8 debate. Philadelphia Public School Notebook. Retrieved
April 9, 2007, from http://www.philaedfund.org/notebook/TheGreatK8Debate.htm.
Louis, K. S., & Kruse, S. D. (1995). Professionalism and community: Perspectives on
reforming urban schools. Thousand Oaks, CA: Corwin Press. Ma, X., & MacMillan, R. B. (1999, September/October). Influences of workplace
conditions on teachers’ job satisfaction. The Journal of Educational Research, 93, 39-47. Retrieved May 29, 2007 from http://find.galegroup.com.libproxy.lib.unc.edu/itx/retrieve.do?.
317
McEwin, C. K., & Alexander, W. M. (1990). What is the place of the middle grades in
the K-8 school? Middle School Journal, 22, 5-11. McEwin, C. K., Dickinson, T. S., & Jacobson, M. G. (2005). How effective are K-8
schools for young adolescents? Middle School Journal, 37(1), 24-28.
Mizell, H. (2005). Grade configurations for educating young adolescents are still crazy after all these years. Middle School Journal, 37(1), 14-21. National Center for Education Statistics. (n.d.). 2003 digest of education statistics tables
and figures. Retrieved February 20, 2007, from http://nces.ed.gov/programs/digest/d03/tables/dt_097.asp.
National Center for Education Statistics. (n.d.). 2004 digest of education statistics tables
and figures. Retrieved February 20, 2007, from http://nces.ed.gov/programs/digest/d04/tables/dt04_097.asp.
National Center for Education Statistics. (n.d.). 2005 digest of education statistics tables
and figures. Retrieved February 20, 2007, from http://nces.ed.gov/programs/digest/d05/tables/dt05_096.asp.
National Staff Development Council. (2001). National Staff Development Council’s
Standards for Staff Development Oxford, OH: National Staff Development Council. Nias, J. (1981). Teacher satisfaction and dissatisfaction: Herzberg’s ‘two-factor’
hypothesis revisited. British Journal of Sociology of Education, 2, 235-246. Retrieved August 23, 2007, from http://links.jstor.org/sici=0142-5692%281981%292%3A3%3C235%3ATSADH%27%3E2.0.CO%3B2-3.
North Carolina Department of Public Instruction. (2007). North Carolina schools
statistical profile: 2007. Retrieved Febraury 23, 2008, from http://www.dpi.state.nc.us/docs/fbs/resources/data/statisticalprofile/2007profile.pdf.
North Carolina Report Cards. (n.d.). Glossary of terms. Retrieved August 20, 2007, from http://www.ncreportcards.org/src/glossary.jsp North Carolina Report Cards. (n.d.). 2004 search for K-8 schools [Data file]. Retrieved
February 20, 2007, from http://www.ncreportcards.org/src/search.jsp?pYear=2004-2005.
North Carolina Report Cards. (n.d.). 2004 search for middle schools [Data file].
Retrieved February 20, 2007, from http://www.ncreportcards.org/src/search.jsp?pYear=2004-2005.
North Carolina Report Cards. (n.d.). 2005 search for K-8 schools [Data file]. Retrieved
318
February 20, 2007, from http://www.ncreportcards.org/src/search.jsp?pYear=2005-2006. North Carolina Report Cards. (n.d.). 2005 search for middle schools [Data file].
Retrieved February 20, 2007, from http://www.ncreportcards.org/src/search.jsp?pYear=2005-2006.
Nussbaum, D. (2004, September 12). Why middle schools are being questioned? The
New York Times, para. 3, 23 [Electronic version]. Retrieved December 17, 2005, from http://www.nytimes.com/2004/09/12/nyregion/12NJ.html
Odden, A. R., & Picus, L. O. (2000). School finance: A policy perspective. Boston,
MA: The McGraw-Hill Companies, Inc. Offenberg, R. M. (2001). The efficacy of Philadelphia’s K-to-8 schools compared to
middle grades schools. Middle School Journal, 32(4), 23-29. Paglin, C., & Fager, J. (1997). Grade configuration: Who goes where? By Request
Series. Washington, DC: Office of Educational Research (OERI) & Northwest Regional Educational Laboratory.
Pardini, P. (2002). Revival of the K-8 school. The School Administrator, 59(3), 6-12.
Patton, C. (2005, February). The K-8 bunch. District Administration, 41(2), 44; 53-55. Quaglia, R., Marion, S. F., & McIntire, W. G. (1991). The relationship of teacher
satisfaction to perceptions of school organization, teacher empowerment, work conditions, and community status. Education, 112(2), 206-16. Retrieved May 29, 2007, from http://web.ebscohost.com.libproxy.lib.unc.edu/ehost/.
Rosenholtz, S. J., & Simpson, C. (1990). Workplace conditions and the rise and fall of
teachers’ commitment. Sociology of Education, 63, 241-257. Retrieved August 3, 2007 from http://links.jstor.org/sici=0038- 0407%28199010%2963%3A4%3C241%3AWCATRA%3E2.0.CO%3B2-O.
Scheurich, J. J., & Skrla, L. (2003). Leadership for equity and excellence: Creating high-achievement classrooms, schools, and districts. Thousand Oaks, CA: Corwin Press, Inc.
Schlechty, P. (1997). Inventing better schools: An action plan for education reform.
San Francisco, CA: Jossey-Bass. Seller, W. (2004, August). Configuring schools: A review of the literature. Toronto,
Canada: Ontario Institute for Studies in Education. Retrieved July 24, 2007, from http://www.wrdsb.on.ca/Configuring_Schools_Review.pdf.
Shann, M. H. (1998). Professional commitment and satisfaction among
319
teachers in urban middle schools. The Journal of Educational Research, 92(2), 1- 12. Retrieved June 6, 2007, from http://find.galegroup.com.libproxy.lib.unc.edu/itx/retrieve.do?.
Simmons, R. G., & Blyth, D. A. (1987). Moving into adolescence: The impact of
puberty change and school context. New York: Aldine de Gruyter. Southeast Center for Teaching Quality. (2003, July). Creating working conditions so
teachers can help all students achieve. Teaching Quality in the Southeast: Best Practices & Policies, 3(2). Chapel Hill, NC. Retrieved July 27, 2007, from http://www.teachingquality.org/BestTQ/issues/v03/v03n02.pdf.
Sparks, C. (2004, September 19). Middle schools v. K-8. The Arizona Republic.
Retrieved December17, 2005, from http://www.azcentral.com/news/articles/0919edmiddle19.html.
Swaim, S. (2003, May). Musts for middle schools. The Education Digest, 68(9), 44-45.
Retrieved September, 17, 2007, from http://www.chicousd.org/dna/bidwell_jr/documents/Musts_for_Middle_School.pdf.
Swaim, S. (2004, April 21). Strength in the middle: New grade configurations won’t
improve the education of young adolescents. Education Week, 23, 32. Taylor, D. L., & Bogotch, I. E. (1993, January). Teacher working conditions and school
reform: A descriptive analysis. Austin, TX: Paper presented at the Southwest Educational Research Association. Retrieved July 17, 2007, from http://eric.ed.gov/ERICDocs/data/ericdocs2sql/content_storage_01/0000019b/80/13/c6/b8.pdf.
Teachers Working Conditions Survey. (2004). North Carolina Teacher Working
Conditions State Report by Domain Area. Retrieved October 16, 2007, from http://www.northcarolinatwc.org/NCTWC_Reports/NCRPT_State_Dom.pdf.
Tsui, K. T., & Cheng, Y. C. (1999, September). School organizational health and teacher commitment: A contingency study with multi-level analysis. Educational Research and Evaluation, 5, 249-268. Retrieved August 3, 2007, from http://dx.doi.org/10.1076/edre.5.3.249.3883.
Vail, K. (2006, May). Rebuilding New Orleans schools after Katrina. The Education Digest, 71(9), 36-39.
Wihry, D., Coladarci, T., & Meadow, C. (1992). Grade span and eight-grade
achievement: Evidence from a predominantly rural state. Journal of Research in Rural Education, 8(2), 58-70.

320