Subsoil-potassium depletion accounts for the nutrient budget ...
10
1 Vol.:(0123456789) Scientific Reports | (2021) 11:11597 | https://doi.org/10.1038/s41598-021-90297-1 www.nature.com/scientificreports Subsoil‑potassium depletion accounts for the nutrient budget in high‑potassium agricultural soils Adrian A. Correndo 1* , Gerardo Rubio 2 , Fernando O. García 3 & Ignacio A. Ciampitti 1* Continuous potassium (K) removal without replenishment is progressively mining Argentinean soils. Our goals were to evaluate the sensitivity of soil‑K to K budgets, quantify soil‑K changes over time along the soil profile, and identify soil variables that regulate soil‑K depletion. Four on‑farm trials under two crop rotations including maize, wheat and soybean were evaluated. Three treatments were compared: (1) control (no fertilizer applied); (2) application of nitrogen, phosphorus, and sulfur fertilizers ‑NPS‑; and (3) pristine condition. After nine years, crops removed from 258 to 556 kg K ha −1 . Only two sites showed a decline in the exchangeable‑K levels at 0–20 cm but unrelated to K budget. Topsoil exchangeable‑K levels under agriculture resulted 48% lower than their pristine conditions, although still above response levels. Both soil exchangeable‑K and slowly‑exchangeable K vertical distribution patterns (0–100 cm) displayed substantial depletion relative to pristine conditions, mainly concentrated at subsoil (20–100 cm), with 55–83% for exchangeable‑K, and 74–95% for slowly‑ exchangeable‑K. Higher pristine levels of exchangeable‑K and slowly‑exchangeable‑K and lower clay and silt contents resulted in higher soil‑K depletion. Soil K management guidelines should consider both topsoil and subsoil nutrient status and variables related to soil K buffer capacity. Potassium (K) is an essential macronutrient required by crops, which exhibit a broad range of K requirements (40–300 kg ha −1 year −1 ) and K removal from the harvested product 1 . Wheat (Triticum aestivum L.) and maize (Zea mays L.) crops export around 3 kg K Mg −1 , whereas soybean (Glycine max L.) exports 16 kg K Mg −12–4 . e main source of plant K is the soil, where K is distributed in four different pools: (1) soil solution K, (2) exchangeable K (NH 4 -OAc-K), (3) slowly exchangeable K (NaBPh 4 -K), and (4) K-bearing primary minerals 5–7 . e soil solution-K and NH4-OAc-K fractions are the most readily available K source to plants. us, fertilizer recommendations are mostly based on these fractions 8 . e NaBPh4-K pool includes less available K fractions albeit has received more attention for diagnosing K fertilization needs during the last decades 9–11 . Finally, the mineral-K is a recalcitrant soil K fraction, usually not considered for K diagnosing purposes. Potassium can be acquired from all soil layers explored by plant roots, depending on the crop species and on vertical distribution of plant available K 12 . Although root mass is concentrated at topsoil, maize root mass was reported as poorly correlated with root activity, which can remain high until 60 cm depth 13 . Spring cereals might take up to 80% of the K from the 0–25 cm layer 14 , while soybeans may take about to 60% of the K from the 0–30 cm layer 15 . Studies at a global scale indicate that the stratification towards the topsoil is less marked for K than for other major nutrients such as phosphorus and nitrogen 16 . us, only a portion of the soil K available for plants is captured if soil samples are collected from the topsoil (i.e. 0–20 cm depth) 17 . is underestimation is reduced in those soils with a high topsoil K stratification 14 . Stratification normally occurs when K fertilizer is applied in the topsoil 18 , as well as when roots uptake K from deeper soil layers and residues are deposited in the topsoil 16 . is process is enhanced in fertilized and high-yielding systems, involving a high deposition of plant residues such as in no-tillage systems 19 . Most agricultural soils of the Argentine Pampas are characterized by high native soil K linked to the clay mineralogy (predominantly illite) of the parental material 20 . Positive yield responses to K fertilization have been rarely observed in the region so far; thus, fertilizer K applications have been negligible during the Argentinean agricultural era, which started around 100 years ago. However, continuous K removal via harvest is gradually OPEN 1 Department of Agronomy, Kansas State University, 3031 Throckmorton Plant Sciences Center, Manhattan, KS 66506, USA. 2 Soil Fertility Laboratory, School of Agriculture and INBA CONICET-, University of Buenos Aires, Av. San Martin 4453, C1417DSE Buenos Aires, Argentina. 3 Facultad de Ciencias Agrarias, Universidad Nacional de Mar del Plata, Ruta 226 km 73.5, B7620 Balcarce, Buenos Aires, Argentina. * email: [email protected]; [email protected]
-
Upload
khangminh22 -
Category
Documents
-
view
0 -
download
0
Transcript of Subsoil-potassium depletion accounts for the nutrient budget ...
1
Vol.:(0123456789)
Scientific Reports | (2021) 11:11597 | https://doi.org/10.1038/s41598-021-90297-1
www.nature.com/scientificreports
Subsoil‑potassium depletion accounts for the nutrient budget in high‑potassium agricultural soilsAdrian A. Correndo 1*, Gerardo Rubio 2, Fernando O. García 3 & Ignacio A. Ciampitti 1*
Continuous potassium (K) removal without replenishment is progressively mining Argentinean soils. Our goals were to evaluate the sensitivity of soil‑K to K budgets, quantify soil‑K changes over time along the soil profile, and identify soil variables that regulate soil‑K depletion. Four on‑farm trials under two crop rotations including maize, wheat and soybean were evaluated. Three treatments were compared: (1) control (no fertilizer applied); (2) application of nitrogen, phosphorus, and sulfur fertilizers ‑NPS‑; and (3) pristine condition. After nine years, crops removed from 258 to 556 kg K ha−1. Only two sites showed a decline in the exchangeable‑K levels at 0–20 cm but unrelated to K budget. Topsoil exchangeable‑K levels under agriculture resulted 48% lower than their pristine conditions, although still above response levels. Both soil exchangeable‑K and slowly‑exchangeable K vertical distribution patterns (0–100 cm) displayed substantial depletion relative to pristine conditions, mainly concentrated at subsoil (20–100 cm), with 55–83% for exchangeable‑K, and 74–95% for slowly‑exchangeable‑K. Higher pristine levels of exchangeable‑K and slowly‑exchangeable‑K and lower clay and silt contents resulted in higher soil‑K depletion. Soil K management guidelines should consider both topsoil and subsoil nutrient status and variables related to soil K buffer capacity.
Potassium (K) is an essential macronutrient required by crops, which exhibit a broad range of K requirements (40–300 kg ha−1 year−1) and K removal from the harvested product1. Wheat (Triticum aestivum L.) and maize (Zea mays L.) crops export around 3 kg K Mg−1, whereas soybean (Glycine max L.) exports 16 kg K Mg−12–4. The main source of plant K is the soil, where K is distributed in four different pools: (1) soil solution K, (2) exchangeable K (NH4-OAc-K), (3) slowly exchangeable K (NaBPh4-K), and (4) K-bearing primary minerals5–7. The soil solution-K and NH4-OAc-K fractions are the most readily available K source to plants. Thus, fertilizer recommendations are mostly based on these fractions8. The NaBPh4-K pool includes less available K fractions albeit has received more attention for diagnosing K fertilization needs during the last decades9–11. Finally, the mineral-K is a recalcitrant soil K fraction, usually not considered for K diagnosing purposes.
Potassium can be acquired from all soil layers explored by plant roots, depending on the crop species and on vertical distribution of plant available K12. Although root mass is concentrated at topsoil, maize root mass was reported as poorly correlated with root activity, which can remain high until 60 cm depth13. Spring cereals might take up to 80% of the K from the 0–25 cm layer14, while soybeans may take about to 60% of the K from the 0–30 cm layer15.
Studies at a global scale indicate that the stratification towards the topsoil is less marked for K than for other major nutrients such as phosphorus and nitrogen16. Thus, only a portion of the soil K available for plants is captured if soil samples are collected from the topsoil (i.e. 0–20 cm depth)17. This underestimation is reduced in those soils with a high topsoil K stratification14. Stratification normally occurs when K fertilizer is applied in the topsoil18, as well as when roots uptake K from deeper soil layers and residues are deposited in the topsoil16. This process is enhanced in fertilized and high-yielding systems, involving a high deposition of plant residues such as in no-tillage systems19.
Most agricultural soils of the Argentine Pampas are characterized by high native soil K linked to the clay mineralogy (predominantly illite) of the parental material20. Positive yield responses to K fertilization have been rarely observed in the region so far; thus, fertilizer K applications have been negligible during the Argentinean agricultural era, which started around 100 years ago. However, continuous K removal via harvest is gradually
OPEN
1Department of Agronomy, Kansas State University, 3031 Throckmorton Plant Sciences Center, Manhattan, KS 66506, USA. 2Soil Fertility Laboratory, School of Agriculture and INBA CONICET-, University of Buenos Aires, Av. San Martin 4453, C1417DSE Buenos Aires, Argentina. 3Facultad de Ciencias Agrarias, Universidad Nacional de Mar del Plata, Ruta 226 km 73.5, B7620 Balcarce, Buenos Aires, Argentina. *email: [email protected]; [email protected]

2
Vol:.(1234567890)
Scientific Reports | (2021) 11:11597 | https://doi.org/10.1038/s41598-021-90297-1
www.nature.com/scientificreports/
depleting soil K reservoir21. Under comparable negative K budgets in Pampean soils, greater NH4-OAc reduc-tions (46% vs. 8%) at the topsoil were found in soils with high- (900 mg kg−1) relative to low-initial (600 mg kg−1) NH4-OAc-K levels22. However, most of Pampean soils are still above the NH4-OAc-K critical level (about 130–170 mg K kg−1)21.
The aim of this study was to quantify the effect of contrasting K removal on soil K fractions along the soil profile. We hypothesize that: (1) in high native K soils, the topsoil (0–20 cm) NH4-OAc test is not sensitive to identify short-medium term K depletion trends; (2) vertical distribution patterns of both NH4-OAc-K and NaBPh4-K are affected by the agricultural footprint, with a significant depletion expected to occur beyond the topsoil (0–20 cm); and (3) soil K deviates from the Pristine conditions depending on soil factors related to K buffer capacity such as soil texture and indigenous richness of soil K, with more depletion expected to occur for both K fractions with coarser textures and high pristine soil K levels.
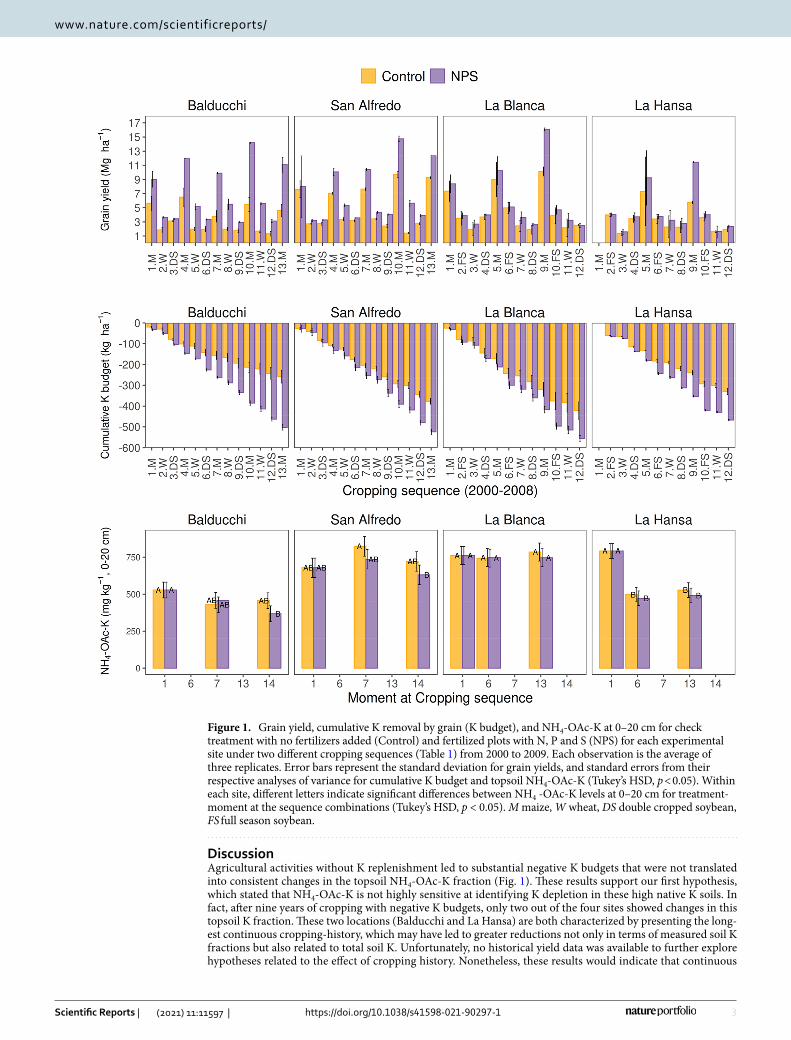
ResultsCumulative K budget. Cumulative K budget reflects continuous K removal, without K fertilization. The high-yielding system, NPS treatment (Fig. 1), significantly increased K removal, with an average annual K removal ranging from − 29 to − 62 kg K ha−1 year−1. After more than 10 harvests, the cumulative K budget for the Control varied from − 258 to − 421 kg K ha−1 and for the NPS ranged from − 467 to − 556 kg K ha−1 (Fig. 1). San Alfredo, La Blanca and La Hansa sites presented comparable K removal on Control plots (− 330 to − 421 kg K ha−1), whereas Balducchi exhibited lower K removal (− 258 kg K ha−1). Cumulative removal at the NPS resulted similar across sites (− 467 to − 556 kg K ha−1). Differences in K removal are largely explained by final yields, with lower yield for the Control in Balducchi but with similar yield for the NPS relative to the other sites (average 1.9 vs. 3.2 Mg ha−1, with larger yield gap for Control and NPS, respectively).
Topsoil NH4‑OAc‑K changes. The evolution of NH4-Oac-K in the topsoil (0–20 cm) was site-specific (Fig. 1). The sites with longest agricultural history at the beginning of the experiment (Balducchi and La Hansa), presented significant NH4-OAc-K reductions from 2000 to 2009. The opposite occurred in those sites with shorter farming history at the beginning of the experiment (< 10 year: San Alfredo and La Blanca), with no dif-ferences between initial and final NH4-OAc-K levels. Surprisingly, no differences were detected between Control and NPS in any case (Fig. 1, Table 2). Thus, the lack of change or negligible reductions in topsoil NH4-OAc-K over cropping seasons did not correspond with the increasingly negative K budgets.
Vertical distribution patterns of soil KNH4‑OAcK. The NH4-OAcK fraction was predominantly located (range 72–86%) in the subsoil (20–100 cm) with significant differences between sites and treatments (Table 2). Under the Pristine conditions, the distribution in depth showed notorious differences among the four sites (green circles; Fig. 2). The most contrasting soils were Balducchi and San Alfredo, portraying greater NH4-OAc-K towards the subsoil and topsoil, respectively. La Blanca and La Hansa sites presented a fairly similar Pristine NH4-OAc-K pattern, following a sinuous trajectory with minimum levels at 20–40 cm, and rather com-parable values at shallower and deeper layers. Interestingly, observed differences among soils were not reflected in the average NH4-OAc-K stocks (0–100 cm), that were rather equivalent (1359, 1055, 1228, and 1284 g m−2 for Balducchi, San Alfredo, La Blanca and La Hansa, respectively).
A remarkable effect of agriculture was reflected in a considerable decrease in the NH4-OAc-K levels for the Control and NPS relative to their Pristine condition (Table 2; Fig. 2) although its vertical distribution varied depending on the location (Fig. 2). At all locations, significant interactions between treatment and soil depth were documented (Supplementary material 1, Appendix A). Balducchi and La Blanca (Hapludolls), showed the higher NH4-OAc-K depletion rates (averaging 63 and 37%; respectively), which was exacerbated towards the subsoil (60–100 cm). Contrastingly, in San Alfredo and La Hansa (Argiudolls), NH4-OAc-K reductions due to agriculture were lower (average 25 and 27%, respectively) and occurred mainly towards the topsoil (Table 2). Differences in NH4-OAc-K between the Control and NPS showed a lower magnitude than relative for the differ-ence of those treatments to the Pristine due to differences in time-spans (Cropping history, Table 1).
NaBPh4‑K. Similarly to NH4-OAc-K, the slowly-exchangeable fraction (NaBPh4-K) was found predomi-nantly in the subsoil (20–100 cm) (range 78–81%), without large differences between sites or treatments (Table 2). The NaBPh4-K contents were 2.1 times in average (range 1.2×–6.2×) larger than the NH4-OAc-K. Treatment by soil depth interaction was significant (p < 0.05) at Balducchi and La Blanca, while main effects of treatment (p = 0.05) and soil depth (p < 0.05) were significant at La Hansa, and only soil depth resulted in a marginally significant effect (p = 0.11) at San Alfredo (Fig. 3) (Supplementary material 1, Appendix A). Balduc-chi showed the larger impact of agriculture on their NaBPh4-K levels (average 41% depletion as compared to the Pristine scenario), whereas the other sites varied in a rather small range (5–17%).
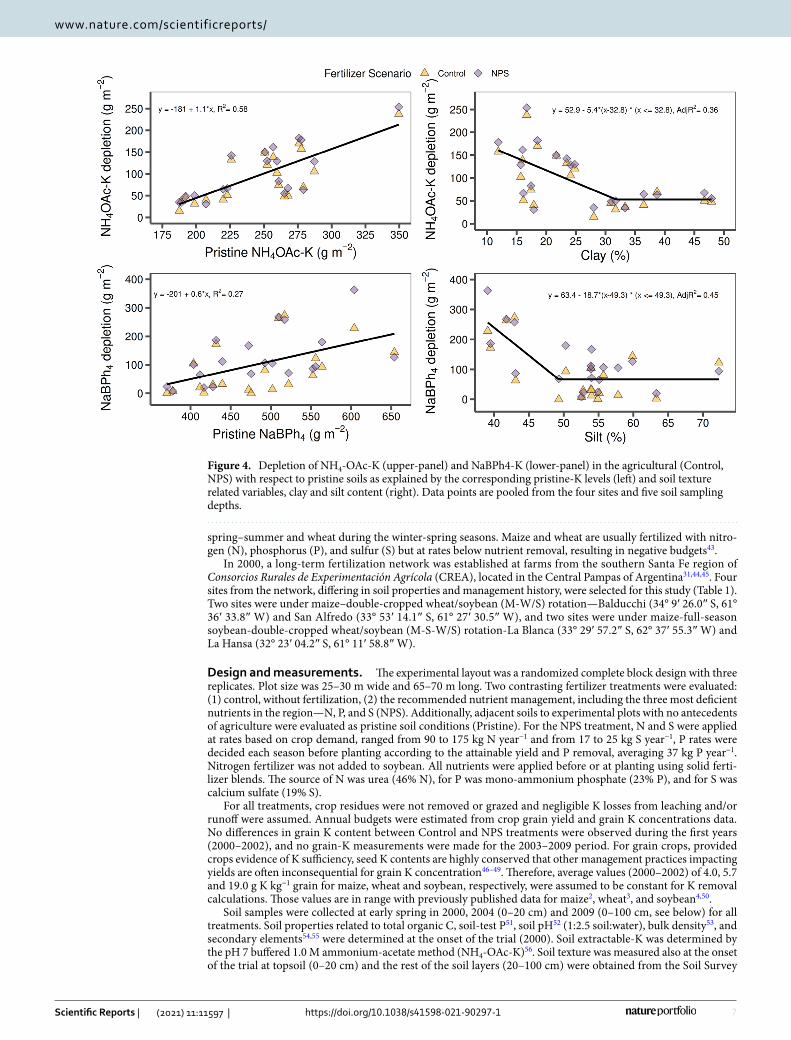
Soil K depletion drivers. The NH4-OAc-K depletion patterns followed a close association with the Pris-tine- NH4-OAc-K and clay content of each soil layer (Fig. 4). For the Pristine- NH4-OAc-K, the greater the native K values, the larger was the documented depletion K rate. On the other hand, increases in soil clay (%) levels were associated with lower depletion NH4-OAc-K rate until reaching a threshold about 33% of clay, remaining at a minimum level for NH4-OAc-K depletion with high clay content. Conversely, for NaBPh4-K depletion, the most relevant factor resulted the silt content (%), showing a depletion trend until reaching a threshold of 50% of silt, above of which the NaBPh4-K depletion becomes minimum. A relatively weak but positive association to Pristine-NaBPh4-K content was also observed, however; it resulted less relevant than for the NH4-OAc-K depletion.
3
Vol.:(0123456789)
Scientific Reports | (2021) 11:11597 | https://doi.org/10.1038/s41598-021-90297-1
www.nature.com/scientificreports/
DiscussionAgricultural activities without K replenishment led to substantial negative K budgets that were not translated into consistent changes in the topsoil NH4-OAc-K fraction (Fig. 1). These results support our first hypothesis, which stated that NH4-OAc-K is not highly sensitive at identifying K depletion in these high native K soils. In fact, after nine years of cropping with negative K budgets, only two out of the four sites showed changes in this topsoil K fraction. These two locations (Balducchi and La Hansa) are both characterized by presenting the long-est continuous cropping-history, which may have led to greater reductions not only in terms of measured soil K fractions but also related to total soil K. Unfortunately, no historical yield data was available to further explore hypotheses related to the effect of cropping history. Nonetheless, these results would indicate that continuous
Figure 1. Grain yield, cumulative K removal by grain (K budget), and NH4-OAc-K at 0–20 cm for check treatment with no fertilizers added (Control) and fertilized plots with N, P and S (NPS) for each experimental site under two different cropping sequences (Table 1) from 2000 to 2009. Each observation is the average of three replicates. Error bars represent the standard deviation for grain yields, and standard errors from their respective analyses of variance for cumulative K budget and topsoil NH4-OAc-K (Tukey’s HSD, p < 0.05). Within each site, different letters indicate significant differences between NH4 -OAc-K levels at 0–20 cm for treatment-moment at the sequence combinations (Tukey’s HSD, p < 0.05). M maize, W wheat, DS double cropped soybean, FS full season soybean.

4
Vol:.(1234567890)
Scientific Reports | (2021) 11:11597 | https://doi.org/10.1038/s41598-021-90297-1
www.nature.com/scientificreports/
K removal after nine years of farming has come from extra K-pools (e.g., non-exchangeable-K, root K uplift) rather than the NH4-OAc-K at top-soil.
In line with recent surveys performed in the Pampean Region21, our four soils remained high in K fertility along the experimental period, as reflected by topsoil NH4-OAc-K values above the critical level. Considering an average annual K removal of 62 kg K ha−1 (average yields for the studied crop rotation), a soil should lose about 15 mg kg−1 of soil K a year. If all the K budget is reflected on the NH4-OAc-K at topsoil, the critical range could be reached in between 6 (Balducchi) to 224 years (La Blanca). Nonetheless, observed variability is in line with Simonsson et al.23, who reported that, besides the K budget, the soil K depletion results from the interaction of multiple factors such as cropping history, soil texture and mineralogy and potential subsoil K supply. Addition-ally, our data reveals that the subsoil NH4OAc-K levels are decreasing but still high.
Regarding our second hypothesis, we found evidence to support that K depletion occurs mainly beyond the topsoil. Both soil exchangeable and slowly-exchangeable K vertical distribution patterns displayed large depletion relative to the Pristine scenario in the whole soil profile (0–100 cm). However, depletion of both fractions was more pronounced at subsoil (20–100 cm) (55–83% for NH4-OAc-K and 74–95% for NaBPh4-K) rather than in the usually tested 0–20 cm soil layer. It is known that plants can remobilize K from the subsoil towards shallow layers16,24,25, and this effect would be exacerbated under minimum or no-tillage management where the stover may release significant amounts of soluble K that later has low mobility into the soil matrix19,26. Thus, our results highlight the relevance of subsoil on the K supply for crops27 and thus, of building awareness about soil K profile concentrations28. For practical reasons, most of soil K recommendation systems are based on topsoil data without considering the subsoil—e.g. 0–15 cm in the US Corn Belt, where also Mollisols is the dominant soil order29. However, our results are consistent with a K recommendation system based on the combined NH4-OAc infor-mation from both the topsoil and the subsoil such as former system in Iowa29 and recommendations in India30.
Lastly, obtained results fully support our third hypothesis, since the two main factors affecting K depletion rates were the pristine K levels and the soil texture (reflected as clay and silt content). In the same long-term experiment, Sucunza et al.31 reported a similar tendency for phosphorus: the higher the pristine nutrient levels the higher the nutrient depletion rates. In terms of soil texture, its influence on NH4-OAc-K critical levels is well documented9,32,33, as well as soil K buffer capacity is affected by clay content and mineralogy34–37. Particularly in
Figure 2. Soil profiles of NH4-OAc-K (g m−2) under three different conditions: pristine soils (green circles), under grain cropping from 2000 to 2009 with no fertilizers added (Control, orange triangles), and under grain cropping from 2000 to 2009 with N, P, plus S fertilization (NPS, purple diamonds). Overlapping error bars indicate absence of significant differences between scenarios by soil depths combinations (Tukey’s HSD, p < 0.05).

5
Vol.:(0123456789)
Scientific Reports | (2021) 11:11597 | https://doi.org/10.1038/s41598-021-90297-1
www.nature.com/scientificreports/
Table 1. Soil taxonomy, cropping history, and soil properties (0–20 cm and subsoil layers) at the onset of the experimentation term (September 2000) at four sites of the CREA Southern Santa Fe Crop Nutrition Network. Two sites were under maize–wheat/double-cropped soybean (M-W/DS) cropping sequence, and two under maize–full season soybean–wheat/double-cropped soybean (M-FS-W/DS). Each determination is the average of three replicates. SOC: soil organic carbon; BD: soil bulk density.
Cropping sequence Depth (cm) pH SOC (g kg−1) Ca (mg kg−1) Mg (mg kg−1) K (mg kg−1) Clay (%) Silt (%) Sand (%)BD (g cm−3)
M-W/DS
Balducchi (Typic Hapludolls; + 60 year)
0–20 6.3 13.5 1380 252 528 16 43.1 40.9 1.3
20–40 – – – – – 23.5 39.1 37.4 1.29
40–60 – – – – – 21.7 39.5 38.8 1.3
60–80 – – – – – 18.5 41.8 39.7 1.31
80–100 – – – – – 16.7 42.9 40.4 1.31
San Alfredo (Typic Argiudolls; 8 year)
0–20 6.0 19.8 2200 252 678 24.1 63.3 12.6 1.26
20–40 – – – – – 30.9 55.1 14 1.29
40–60 – – – – – 33.3 52.6 14.2 1.3
60–80 – – – – – 31.7 52.8 15.5 1.31
80–100 – – – – – 28 54.9 17.1 1.31
M-FS-W/DS
La Blanca (Typic Hapludolls; + 6 year)
0–20 6.6 13.3 1440 240 760 17.4 55.7 26.9 1.19
20–40 – – – – – 17.9 54 28.1 1.21
40–60 – – – – – 16.1 53.9 29.9 1.23
60–80 – – – – – 15.7 53.9 30.4 1.24
80–100 – – – – – 11.9 54 34.1 1.24
La Hansa (Aquic Argiudolls; + 20 year)
0–20 5.5 12.2 1520 192 792 24.8 72.3 2.9 1.25
20–40 – – – – – 36.5 59.9 3.7 1.28
40–60 – – – – – 46.7 50.3 3 1.3
60–80 – – – – – 47.9 49.3 2.8 1.3
80–100 – – – – – 38.7 57.8 3.5 1.3
Table 2. Soil-profile K stock (g m−2, 0–100 cm depth) for NH4-OAc-K and NaBPh4-K under different agricultural conditions (Pristine, Control and NPS) and its distribution between topsoil (0–20 cm) and subsoil (20–100 cm) layers. *Within the same site, different capital letters indicate significant differences (Tukey’s HSD, p < 0.05) among scenarios for the soil profile (0–100 cm). †Within the same site, different lowercase letters indicate significant differences (Tukey’s HSD, p < 0.05) at the interaction level (agricultural condition by soil depth).
SITE CONDITION
NH4-OAc-K (g m−2) NaBPh4-K (g m−2)
Soil depth (cm)
0–100* 0–20† 20–100† 0–100* 0–20† 20–100†
Balducchi
Pristine 1359A 257bc 1102a 2615A 552d 2063a
Control 532B 119c 413b 1615B 490d 1125b
NPS 469B 95c 374b 1453B 466d 987c
San Alfredo
Pristine 1055A 287c 767a 2005A 417c 1588a
Control 821B 181d 639b 1945A 414c 1531ab
NPS 758B 159d 599b 1865A 397c 1468b
La Blanca
Pristine 1228A 261d 968a 2331A 493d 1838a
Control 803B 187d 616b 2069AB 412d 1658b
NPS 740B 178d 563c 1772B 385d 1387c
La Hansa
Pristine 1284A 252c 1032a 2751A 556c 2195a
Control 956B 132c 824b 2378AB 433c 1944ab
NPS 904B 123c 782b 2176B 462c 1714b

6
Vol:.(1234567890)
Scientific Reports | (2021) 11:11597 | https://doi.org/10.1038/s41598-021-90297-1
www.nature.com/scientificreports/
Pampean soils, with loess as the main parental material, the silt fraction also contributes to the cation exchange capacity with clay minerals rich in K such as illite38, supporting our finding of reduced NaBPh4-K depletion with increased silt content. Thus, an increased soil K buffer capacity could mask the effects of continuous K removal. In other soils, negative K budgets were reflected not only in NH4-OAc-K but also in changes in more stable and recalcitrant soil K fractions9,11,24,37,39. Finally, our results also indicate that the root K uplift process was accentu-ated at locations without fine-textured horizons (Balducchi and La Blanca). Thus, soil layers with greater clay content involve not only a high buffer capacity but may also denote a mechanical impedance to root growth40, ultimately affecting K uptake and removal41.
This research offers an indication that topsoil NH4-OAc-K interacts with subsoil K and other soil K pools as a K source for satisfying plant nutrient demand. Yet, it is worth acknowledging the need of more comprehensive studies on soil-K depletion trends in response to different crop management practices for the Pampean Mollisols.
ConclusionsThe high indigenous-K fertility of Pampean Mollisols is progressively being depleted due to the prolonged and intensive agricultural use without K replenishment, thereby rendering them to express responsiveness to K in a near future. Continuous K removal by crop harvest without K replenishment led to soil K depletion primarily concentrated in the subsoil. In such sense, the single use of topsoil NH4-OAc-K in high native K soils could result in an incomplete assessment of soil K fertility diagnosis. Instead, both topsoil and subsoil K analyses could be complemented to develop more precise guidelines on medium-to-long-term K fertilizer needs. Also, as soil K depletion increased with indigenous K level and decreased with finer soil texture, including them as key metadata will contribute for an improved development of soil K guidelines.
MethodsExperimental sites. The Pampas region is located in the East-Central region of Argentina. The climate is temperate and annual mean temperature varies from 15 to 25 °C. The rainfall pattern is humid to the East and semiarid to the West. Mollisols, Entisols, and Alfisols are the predominant soil orders in the Region42. Agri-cultural activities are mainly concentrated in the Mollisols. The main crops are maize and soybean during the
Figure 3. Soil profiles of NaBPh4-K (g m−2) under three different scenarios: pristine soils (green circles), under grain cropping from 2000 to 2009 with no fertilizers added (Control, orange triangles), and under grain cropping from 2000 to 2009 with N, P, plus S fertilization (NPS, purple diamonds). Overlapping error bars indicate absence of significant differences between scenarios by soil depths combinations (Tukey’s HSD, p < 0.05).
7
Vol.:(0123456789)
Scientific Reports | (2021) 11:11597 | https://doi.org/10.1038/s41598-021-90297-1
www.nature.com/scientificreports/
spring–summer and wheat during the winter-spring seasons. Maize and wheat are usually fertilized with nitro-gen (N), phosphorus (P), and sulfur (S) but at rates below nutrient removal, resulting in negative budgets43.
In 2000, a long-term fertilization network was established at farms from the southern Santa Fe region of Consorcios Rurales de Experimentación Agrícola (CREA), located in the Central Pampas of Argentina31,44,45. Four sites from the network, differing in soil properties and management history, were selected for this study (Table 1). Two sites were under maize–double-cropped wheat/soybean (M-W/S) rotation—Balducchi (34° 9′ 26.0″ S, 61° 36′ 33.8″ W) and San Alfredo (33° 53′ 14.1″ S, 61° 27′ 30.5″ W), and two sites were under maize-full-season soybean-double-cropped wheat/soybean (M-S-W/S) rotation-La Blanca (33° 29′ 57.2″ S, 62° 37′ 55.3″ W) and La Hansa (32° 23′ 04.2″ S, 61° 11′ 58.8″ W).
Design and measurements. The experimental layout was a randomized complete block design with three replicates. Plot size was 25–30 m wide and 65–70 m long. Two contrasting fertilizer treatments were evaluated: (1) control, without fertilization, (2) the recommended nutrient management, including the three most deficient nutrients in the region—N, P, and S (NPS). Additionally, adjacent soils to experimental plots with no antecedents of agriculture were evaluated as pristine soil conditions (Pristine). For the NPS treatment, N and S were applied at rates based on crop demand, ranged from 90 to 175 kg N year−1 and from 17 to 25 kg S year−1, P rates were decided each season before planting according to the attainable yield and P removal, averaging 37 kg P year−1. Nitrogen fertilizer was not added to soybean. All nutrients were applied before or at planting using solid ferti-lizer blends. The source of N was urea (46% N), for P was mono-ammonium phosphate (23% P), and for S was calcium sulfate (19% S).
For all treatments, crop residues were not removed or grazed and negligible K losses from leaching and/or runoff were assumed. Annual budgets were estimated from crop grain yield and grain K concentrations data. No differences in grain K content between Control and NPS treatments were observed during the first years (2000–2002), and no grain-K measurements were made for the 2003–2009 period. For grain crops, provided crops evidence of K sufficiency, seed K contents are highly conserved that other management practices impacting yields are often inconsequential for grain K concentration46–49. Therefore, average values (2000–2002) of 4.0, 5.7 and 19.0 g K kg−1 grain for maize, wheat and soybean, respectively, were assumed to be constant for K removal calculations. Those values are in range with previously published data for maize2, wheat3, and soybean4,50.
Soil samples were collected at early spring in 2000, 2004 (0–20 cm) and 2009 (0–100 cm, see below) for all treatments. Soil properties related to total organic C, soil-test P51, soil pH52 (1:2.5 soil:water), bulk density53, and secondary elements54,55 were determined at the onset of the trial (2000). Soil extractable-K was determined by the pH 7 buffered 1.0 M ammonium-acetate method (NH4-OAc-K)56. Soil texture was measured also at the onset of the trial at topsoil (0–20 cm) and the rest of the soil layers (20–100 cm) were obtained from the Soil Survey
Figure 4. Depletion of NH4-OAc-K (upper-panel) and NaBPh4-K (lower-panel) in the agricultural (Control, NPS) with respect to pristine soils as explained by the corresponding pristine-K levels (left) and soil texture related variables, clay and silt content (right). Data points are pooled from the four sites and five soil sampling depths.

8
Vol:.(1234567890)
Scientific Reports | (2021) 11:11597 | https://doi.org/10.1038/s41598-021-90297-1
www.nature.com/scientificreports/
Summary of the National Institute of Agricultural Technology (Instituto Nacional de Tecnología Agropecuaria, INTA).
In 2009, three sub-samples of soil profiles per plot were sampled and fresh mixed at five depths (0–20, 20–40, 40–60, 60–80, and 80–100 cm), dried at 40 °C until constant weight, and sieved (2 mm). Soil extractable-K was determined as NH4-OAc-K50, and by the modified sodium tetraphenyl boron method (NaBPh4-K)9. The verti-cal distribution of both NH4-OAc-K and NaBPh4-K was expressed on a volumetric basis (g m−2) as in Jobbagy and Jackson16. Bulk density, determined for Control and NPS plots at the onset of the study for each soil layer (Table 1), was used to transform from gravimetric (mg kg−1) to volumetric units (g m−2).
Statistical analysis. For testing the first hypothesis, variables of interest were the topsoil NH4OAc-K (0–20 cm) for 2000, 2004 and 2009 years and the apparent cumulative K budget (kg ha−1) of both the Con-trol and NPS treatments. For the apparent cumulative K budget, treatment with two levels (Control and NPS), and the crop number with 12 (La Blanca, La Hansa) and 13 (Balducchi and San Alfredo) levels (2000–2008) and their interactions were considered the fixed factors while the block was considered as random. For topsoil NH4OAc-K, treatment with two levels (Control and NPS), year with three levels (2000, 2004 and 2009) and their interactions were considered as fixed, while block was considered as random. In both cases, a mixed effect model with repeated measures over time was applied using the nlme package56 of the R software57. Additionally, the relationship between the NH4-OAc-K with the apparent cumulative K budgets (2000, 2004 and 2009) was tested with a simple linear regression model by pooling data from all four locations.
For the second hypothesis, NH4-OAc-K and NaBPh4-K contents (g m−2) were considered to evaluate the agricultural footprint (Pristine, Control and NPS in 2009). The analysis of variance (ANOVA) was partitioned by location. For vertical distributions of NH4-OAc-K and NaBPh4-K, we applied a mixed effect models with repeated measures over space (soil depth) using the nlme package56. Thereby, treatment, soil depth and their interactions were considered as fixed factors, while block was considered as random factor. The fulfillment of the assumptions of normality and homogeneity of variance for the K budget, NH4-OAc-K and NaBPh4-K were visually (QQ-plots and Student’s residuals vs. fitted values) and formally evaluated (Shapiro-Wilks normality test). Finally, we selected the best models based on the lowest scores for the Akaike Information Criterion (AIC). Means and significant interactions were obtained using the LSMEAN/PDIFF procedure using the emmeans package58.
For the third hypothesis, regression analyses were executed to estimate the effect of soil texture (clay, silt and sand -%-) and pristine K richness (Pristine NH4-OAc-K and NaBPh4-K) on the depletion of NH4-OAc-K and NaBPh4-K. A stepwise selection was applied using the stepAIC function from the MASS package59 to define the most relevant variables linearly associated with both depletions. Once variables were selected, partial linear and linear-plateau relationships were further tested for interpretation purposes using the stats package v3.6.257.
Received: 14 January 2021; Accepted: 10 May 2021
References 1. Mullins, G. & Burmester, C. Potassium uptake by crops during the season. In Frontiers in Plant Nutrition (eds Oosterhuis, D. &
Berkowitz, G.) 123–132 (Springer, 1999). 2. Ciampitti, I. A., Camberato, J. J., Murrell, S. T. & Vyn, T. J. Corn nutrient accumulation and partitioning in response to plant density
and nitrogen rate: I. Macronutrients. Agron. J. 105, 783–795. https:// doi. org/ 10. 2134/ agron j2012. 0467 (2013). 3. Singh, V. K. et al. Potassium fertilization in rice–wheat system across northern India: Crop performance and soil nutrients. Agron.
J. 105, 471–481. https:// doi. org/ 10. 2134/ agron j2012. 0226 (2013). 4. Villavicencio, C. X. Relationship between potassium fertilization, removal with harvest, and soil-test potassium in corn-soybean
rotations. MS Thesis. Iowa State University. http:// lib. dr. iasta te. edu/ cgi/ viewc ontent. cgi? artic le= 1150& conte xt= etd. Accessed 02 June 2020 (2011).
5. Helmke, P. A. & Sparks, D. L. Lithium, sodium, potassium, rubidium, and cesium. In Methods of Soil Analysis, Part 3, Chemical Methods and Processes, SSSA Book Series 5 (eds Sparks, D. L. et al.) 551–574 (SSSA, 1996). https:// doi. org/ 10. 2136/ sssab ookse r5.3. c19.
6. Hinsinger, P. Potassium. In Encyclopedia of Soil Science (ed. Lal, R.) 1035–1039 (Marcel Dacker Inc, 2002). 7. Sparks, D. L. Potassium dynamics in soils. In Advances in Soil Science (ed. Stewart, B. A.) 1–63 (Springer, 1987). https:// doi. org/
10. 1007/ 978-1- 4612- 4682-4_1. 8. Barbagelata, P. A. & Mallarino, A. P. Field correlation of potassium soil test methods based on dried and field-moist soil samples
for corn and soybean. Soil Sci. Soc. Am. J. 77, 318–327. https:// doi. org/ 10. 2136/ sssaj 2012. 0253 (2013). 9. Cox, A. E., Joern, B. C., Brouder, S. M. & Gao, D. Plant-available potassium assessment with a modified sodium tetraphenylboron
method. Soil Sci. Soc. Am. J. 63, 902–911 (1999). 10. Fernández, F. G., Brouder, S. M., Beyearouty, C. A., Volenec, J. J. & Hoyum, R. Assessment of plant-available potassium for no-till,
rainfed soybean. Soil Sci. Soc. Am. J. 72, 1085–1095. https:// doi. org/ 10. 2136/ sssaj 2007. 0345 (2008). 11. Moody, P. W. & Bell, M. J. Availability of soil potassium and diagnostic soil tests. Aust. J. Soil Res. 44, 265–275. https:// doi. org/ 10.
1071/ SR051 54 (2006). 12. Mallarino, A. P. & Ul-Haq, M. Topsoil and subsoil potassium as affected by long-term potassium fertilization of corn-soybean
rotations. Commun. Soil Sci. Plant Anal. 28(17–18), 1537–1547. https:// doi. org/ 10. 1080/ 00103 62970 93698 95 (1997). 13. Rosolem, C. A. & Pivetta, L. A. Mechanical and biological approaches to alleviate soil compaction in tropical soils: Assessed by root
growth and activity (Rb uptake) of soybean and maize grown in rotation with cover crops. Soil Use Manag. 33, 141–152. https:// doi. org/ 10. 1111/ sum. 12313 (2017).
14. Kuhlmann, H. Importance of the subsoil for the K nutrition of crops. Plant Soil 127, 129–136. https:// doi. org/ 10. 1007/ BF000 10845 (1990).
15. Maciel de Oliveira, S., Santos Dias, D., Froes de Borja Reis, A., Silva Cruz, S. C. & Favarin, J. L. Vertical stratification of K uptake for soybean-based crop rotation. Nutr. Cycl. Agroecosyst. 117, 185–197. https:// doi. org/ 10. 1007/ s10705- 020- 10059-9 (2020).
16. Jobbagy, E. G. & Jackson, R. B. The distribution of soil nutrient with depth: Global patterns and imprint of plants. Biogeochemistry 53, 51–77. https:// doi. org/ 10. 1023/A: 10107 60720 215 (2001).
9
Vol.:(0123456789)
Scientific Reports | (2021) 11:11597 | https://doi.org/10.1038/s41598-021-90297-1
www.nature.com/scientificreports/
17. Blake, L. et al. Potassium content in soil, uptake in plants and the potassium balance in three European long-term field experiments. Plant Soil 216, 1–14. https:// doi. org/ 10. 1023/A: 10047 30023 746 (1999).
18. Farmaha, B. S., Fernández, F. G. & Nafziger, E. D. Distribution of soybean roots, soil water, phosphorus and potassium concentra-tions with broadcast and subsurface-band fertilization. Soil Sci. Soc. Am. J. 76, 1079–1089. https:// doi. org/ 10. 2136/ sssaj 2011. 0202 (2012).
19. Mallarino, A. P. & Borges, R. Phosphorus and potassium distribution in soil following long-term deep-band fertilization in dif-ferent tillage systems. Soil Sci. Soc. Am. J. 70, 702–707. https:// doi. org/ 10. 2136/ sssaj 2005. 0129 (2006).
20. Zubillaga, M. M. & Conti, M. E. Availability of exchangeable and non-exchangeable K in Argentine soils with different mineralogy. J. Plant Nutr. Soil Sci. 159, 149–153. https:// doi. org/ 10. 1002/ jpln. 1996. 35815 90208 (1996).
21. Sainz-Rozas, H. et al. Relevamiento y determinación de propiedades químicas en suelos de aptitud agrícola de la región pampeana. In Proceedings of Symposium Fertility 2019. Fertilizar AC. pp 141–158. https:// www. ferti lizar. org. ar/ subida/ evento/ Simpo sio20 19/ ActaS impos ioFer tilid ad2019. pdf (2019).
22. Lossino, B. & Conti, M. E. Evolución espacial y temporal de potasio en 30 años de agricultura en el NE de la pampa ondulada. Inform. Agron. Cono Sur 26, 23–24 (2005).
23. Simonsson, M. et al. Potassium release and fixation as a function of fertilizer application rate and soil parent material. Geoderma 140, 188–198. https:// doi. org/ 10. 1016/j. geode rma. 2007. 04. 002 (2007).
24. Singh, M., Singh, V. P. & Reddy, D. D. Potassium balance and release kinetics under continuous rice-wheat cropping system in Vertisol. Field Crops Res. 77, 81–91. https:// doi. org/ 10. 1016/ S0378- 4290(01) 00206-4 (2002).
25. Jobbagy, E. G. & Jackson, R. B. The uplift of soil nutrients by plants: Biogeochemical consequences across scales. Ecology 85(9), 2380–2389. https:// doi. org/ 10. 1890/ 03- 0245 (2004).
26. Bordoli, J. M. & Mallarino, A. P. Deep and shallow banding phosphorus and potassium as alternatives to broadcast fertilization for no-till corn. Agron. J. 90, 27–33. https:// doi. org/ 10. 2134/ agron j1998. 00021 96200 90000 10006x (1998).
27. Rao, C. S., Rupa, R., Subba Rao, A. & Bansal, S. K. Subsoil potassium availability in twenty-two benchmark soil series of India. Commun. Soil Sci. Plant Anal. 32, 5–6, 863–876. https:// doi. org/ 10. 1081/ CSS- 10010 3913 (2001).
28. Obrycki, J. F., Kovar, J. L. & Karlen, D. L. Subsoil potassium in central Iowa soils: Status and future challenges. Age 1, 1–8. https:// doi. org/ 10. 2134/ age20 18. 07. 0018 (2018).
29. Mallarino, A. P., Sawyer, J. & Barnhart, S. A general guide for crop nutrient and limestone recommendations in Iowa. PM 1688. In: Iowa State University Extension and Outreach PM 1688. Univ Ext Iowa State University, Ames, Iowa, USA. https:// lib. dr. iasta te. edu/ exten sion_ pubs/ 82 (2013).
30. Rao, C. S. & Srinivas, K. Potassium dynamics and role of non-exchangeable potassium in crop nutrition. Indian J. Fertil. 13(4), 80–94 (2017).
31. Sucunza, F. A., Gutierrez-Boem, F. H., García, F. O., Boxler, M. & Rubio, G. Long-term phosphorus fertilization of wheat, soybean and maize on Mollisols: Soil test trends, critical levels and balances. Eur. J. Agron. 96, 87–95. https:// doi. org/ 10. 1016/j. eja. 2018. 03. 004 (2018).
32. Mallarino, A. P. Changing potassium recommendations in Iowa and the Cornbelt. In Proceedings, The Fluid Fertilizer Foundation Forum. Feb 12–14, 2006. Scottsdale, AZ. (2006).
33. Vitosh, M., Johnson, J. & Mengel, D. Tri-state fertilizer recommendations for corn, soybeans, wheat and alfalfa. Ext. Bull. E-2567. Michigan State Univ. USA. https:// api. seman ticsc holar. org/ Corpu sID: 13133 9722 (1996).
34. Rao, C. S. & Khera, M. S. Potassium replenishment capacity of illitic soils at their minimal exchangeable K in relation to clay mineralogy. Z. Pflanzenernaehr. Bodenk. 157, 467–470. https:// doi. org/ 10. 1002/ jpln. 19941 570612 (1994).
35. Barré, P., Montagnier, C., Chenu, C., Abbadie, L. & Velde, B. Clay minerals as a soil potassium reservoir: Observation and quan-tification through X-ray diffraction. Plant Soil 302, 213–220. https:// doi. org/ 10. 1007/ s11104- 007- 9471-6 (2008).
36. Raheb, A. & Heidari, A. Effects of clay mineralogy and physico-chemical properties on potassium availability under soil aquic conditions. J. Soil Sci. Plant Nutr. 12, 747–761. https:// doi. org/ 10. 4067/ S0718- 95162 01200 50000 29 (2012).
37. Wang, J. J., Harrell, D. L. & Bell, P. F. Potassium buffering characteristics of three soils low in exchangeable potassium. Soil Sci. Soc. Am. J. 68, 654–661. https:// doi. org/ 10. 2136/ sssaj 2004. 6540 (2004).
38. Peinemann, N., Amiotti, N. M., Zalba, P., Villamil, M. & B. ,. Minerales de arcilla en fracciones limo de horizontes superficiales de suelos de diferente mineralogía. Ciencia Suelo 18, 69–72 (2000).
39. Cox, A. E., Joern, B. C. & Roth, C. B. Non-exchangeable ammonium and potassium determination in soils with a modified sodium tetraphenylboron method. Soil Sci. Soc. Am. J. 60, 114–120. https:// doi. org/ 10. 2136/ sssaj 1996. 03615 99500 60000 10019x (1996).
40. Wang, F., Fraisse, C. W., Kitchen, N. R. & Sudduth, K. A. Site-specific evaluation of the CROPGRO-soybean model on Missouri claypan soils. Agric. Syst. 76, 985–1005. https:// doi. org/ 10. 1016/ S0308- 521X(02) 00029-X (2002).
41. Myers, D. B., Kitchen, N. R., Sudduth, K. A., Miles, R. J. & Sharp, R. E. Soybean root distribution related to claypan soil properties and apparent soil electrical conductivity. Crop Sci. 47, 1498–1509. https:// doi. org/ 10. 2135/ crops ci2006. 07. 0460 (2007).
42. Rubio, G., Pereyra, F. X. & Taboada, M. A. Soils of the Pampean Region. In The Soils of Argentina, World Soils Book Series (eds Rubio, G. et al.) 81–100 (Springer, 2019). https:// doi. org/ 10. 1007/ 978-3- 319- 76853- 36.
43. García, F. O., Grasso, A., Gonzalez Sanjuan, M. F., Correndo, A. & Salvagiotti, F. Connecting crop nutrient use efficiency to future soil productivity. Better Crops Plant Food 102(4), 8–10. http:// www. ipni. net/ publi cation/ bette rcrops. nsf/ issue/ BC- 2018-4 (2018).
44. Ciampitti, I. A., Picone, L., Rubio, G. & García, F. O. Pathways of phosphorous fraction dynamics in field crop rotations of the pampas of Argentina. Soil Sci. Soc. Am. J. 75, 918–926. https:// doi. org/ 10. 2136/ sssaj 2009. 0345 (2011).
45. Vega-Jara, L., Gutiérrez-Boem, F. H., García, F. O., Boxler, M. & Rubio, G. Long-term fertilization does not affect soil C:N:S or the proportion between labile/non-labile fractions in Mollisols. Soil Sci. Soc. Am. J. 84, 798–810. https:// doi. org/ 10. 1002/ saj2. 20058 (2020).
46. Brouder, S. M. & Volenec, J. J. Impact of climate change on crop nutrient and water use efficiencies. Physiol. Plant 133(4), 705–724. https:// doi. org/ 10. 1111/j. 1399- 3054. 2008. 01136.x (2008).
47. Mallarino, A. P., Oltmans, R. R., Prater, J. R., Villavicencio, C. X., & Thompson, L. B. Nutrient uptake by cornand soybean, removal, and recycling with crop residue. In Proceedings of the Integrated Crop Management Conference 19. (2011). https:// lib. dr. iasta te. edu/ icm/ 2011/ proce edings/ 19.
48. White, P. J., Bell, M. J., Djalovic, I., Hinsinger, P. & Rengel, Z. Chapter 5: Potassium use efficiency of plants. In Improving Potassium Recommendations for Agricultural Crops (eds Murrell et al.) 119–145 (Springer, 2021). https:// doi. org/ 10. 1007/ 978-3- 030- 59197-7.
49. Volenec, J. J., Brouder, S. M. & Murrell, S. Chapter 14: Broadening the objectives of future potassium recommendations. In Improv-ing Potassium Recommendations for Agricultural Crops (eds Murrell et al.) 385–415 (Springer, 2021). https:// doi. org/ 10. 1007/ 978-3- 030- 59197-7.
50. Oltmans, R. R. & Mallarino, A. P. Potassium uptake by corn and soybean, recycling to soil, and impact on soil test potassium. Soil Sci. Soc. Am. J. 79, 314–327. https:// doi. org/ 10. 2136/ sssaj 2014. 07. 0272 (2015).
51. Bray, R. H. & Kurtz, L. Determination of total, organic and available form of phosphorus in soil. Soil Sci. 59, 39–46. https:// doi. org/ 10. 1097/ 00010 694- 19450 1000- 00006 (1945).
52. Thomas, G. W. Soil pH and soil acidity. In Methods of Soil Analysis. Part 3 (ed. Sparks, D. L.) 475–490 (Soil Science Society of America, 1996). https:// doi. org/ 10. 2136/ sssab ookse r5.3. c16.
53. Grossman, R. B. & Reinsch, T. G. Bulk density and linear extensibility. In Methods of Soil Analysis, Part 4, SSSA Book Ser 5 (eds Dane, J. H. & Topp, G. C.) 201–228 (SSSA, 2002). https:// doi. org/ 10. 2136/ sssab ookse r5.4. c9.

10
Vol:.(1234567890)
Scientific Reports | (2021) 11:11597 | https://doi.org/10.1038/s41598-021-90297-1
www.nature.com/scientificreports/
54. Gupta, U. C. A simplified method for determining hot-water soluble boron in podzols soils. Soil Sci. 103, 424–428. https:// doi. org/ 10. 1097/ 00010 694- 19670 6000- 00009 (1967).
55. Warncke, D. & Brown, J. R. Potassium and other basic cations. In Recommended chemical soil test procedures for the North Central region. North Central Regional Publ 221 (rev.) (Brown, J. L. ed). Missouri Exp Stn Publ SB 1001, Univ. of Missouri, Columbia, pp 31–33. https:// p2inf ohouse. org/ ref/ 17/ 16690. pdf (1998).
56. Pinheiro, J., Bates, D., DebRoy, S. & Sarkar, D. nlme: Linear and Nonlinear Mixed Effects Models. R package version 3.1-126. http:// CRAN.R- proje ct. org/ packa ge= nlme (2019).
57. R Core Team. R: A Language and Environment for Statistical Computing. R Foundation for Statistical Computing, Vienna, Austria. http:// www.R- proje ct. org/ (2021).
58. Lenth, R. emmeans: Estimated Marginal Means, aka Least-Squares Means. https:// cran.r- proje ct. org/ web/ packa ges/ emmea ns/ index. html.
59. Venables, W. N. & Ripley, B. D. Random and mixed effects. In Modern Applied Statistics with S 271–300 (Springer, 2002).
AcknowledgementsMain funding was provided by the International Plant Nutrition Institute (IPNI) Latin America-Southern Cone. The research was also partially supported by Kansas State University, University of Buenos Aires (UBACyT) and CONICET (PIP 335) of Argentina. We express our thanks to CREA Southern Santa Fe, Nutrien, Mr. Miguel Boxler, Mr. Jorge Alonso, Mr. Eduardo Vella, Dr. Esteban Ciarlo, Dr. Marcelo Ferrando, consultants, farmers, staff and volunteers of CREA Southern Santa Fe and FAUBA for their extensive help. This manuscript is contribution No. 21-295-J from the Kansas Agricultural Experiment Station.
Author contributionsA.A.C. contributed with data-curation, conceptualization, formal analysis, visualization and wrote the original draft. G.R. contributed with data-curation, conceptualization, supervision, and revision of the manuscript. F.O.G. contributed with experimental design, conceptualization, supervision, and revision of the manuscript. I.A.C. contributed with conceptualization, supervision, and revision of the manuscript.
Competing interests The authors declare no competing interests.
Additional informationSupplementary Information The online version contains supplementary material available at https:// doi. org/ 10. 1038/ s41598- 021- 90297-1.
Correspondence and requests for materials should be addressed to A.A.C. or I.A.C.
Reprints and permissions information is available at www.nature.com/reprints.
Publisher’s note Springer Nature remains neutral with regard to jurisdictional claims in published maps and institutional affiliations.
Open Access This article is licensed under a Creative Commons Attribution 4.0 International License, which permits use, sharing, adaptation, distribution and reproduction in any medium or
format, as long as you give appropriate credit to the original author(s) and the source, provide a link to the Creative Commons licence, and indicate if changes were made. The images or other third party material in this article are included in the article’s Creative Commons licence, unless indicated otherwise in a credit line to the material. If material is not included in the article’s Creative Commons licence and your intended use is not permitted by statutory regulation or exceeds the permitted use, you will need to obtain permission directly from the copyright holder. To view a copy of this licence, visit http:// creat iveco mmons. org/ licen ses/ by/4. 0/.
© The Author(s) 2021