The effect of potassium and fiber intake on serum potassium in ...
41
The effect of potassium and fiber intake on serum potassium in children with CKD Kato Delva Student number: 01815664 Supervisors: prof. dr. Sunny Eloot, prof. dr. Ann Raes, dr. Evelien Snauwaert Mentor: Amina El Amouri A dissertation submitted to Ghent University in partial fulfilment of the requirements for the degree of Master of Medicine in Medicine Academic year: 2020 – 2021
-
Upload
khangminh22 -
Category
Documents
-
view
2 -
download
0
Transcript of The effect of potassium and fiber intake on serum potassium in ...
The effect of potassium and fiber intake
on serum potassium in children with
CKD
Kato Delva Student number: 01815664
Supervisors: prof. dr. Sunny Eloot, prof. dr. Ann Raes, dr. Evelien Snauwaert
Mentor: Amina El Amouri
A dissertation submitted to Ghent University in partial fulfilment of the requirements for the degree of
Master of Medicine in Medicine
Academic year: 2020 – 2021
Deze pagina is niet beschikbaar omdat ze persoonsgegevens bevat.Universiteitsbibliotheek Gent, 2022.
This page is not available because it contains personal information.Ghent University, Library, 2022.
Content
Abstract ....................................................................................................................................... 1
Samenvatting .............................................................................................................................. 2
Introduction ................................................................................................................................. 4
1 Renal anatomy ...................................................................................................................... 4
2 Kidney function ..................................................................................................................... 4
2.1 Glomerular filtration rate ................................................................................................. 4
2.2 Electrolyte balance ......................................................................................................... 5
3 Potassium ............................................................................................................................. 5
4 Chronic kidney disease in children ........................................................................................ 7
4.1 Epidemiology .................................................................................................................. 8
4.2 Etiology .......................................................................................................................... 8
4.3 Pathophysiology ............................................................................................................. 8
4.4 Symptoms and clinical diagnosis .................................................................................... 9
4.5 Complications ............................................................................................................... 10
4.6 Management ................................................................................................................ 14
4.7 Renal replacement therapy ........................................................................................... 14
4.8 Potassium management ............................................................................................... 15
Objective ................................................................................................................................... 20
Methods .................................................................................................................................... 21
1. Study design ................................................................................................................... 21
2. Patient inclusion and clinical assessment ....................................................................... 21
3. Dietary assessment ........................................................................................................ 21
4. Laboratory analyses ....................................................................................................... 22
5. Statistics ......................................................................................................................... 22
Results ...................................................................................................................................... 24
1. Demographics................................................................................................................. 24
2. K+ and fiber intake .......................................................................................................... 24
3. Serum K+ concentration and impact of potassium binding resins .................................... 27
4. Association of serum K+ concentration and K+ intake....................................................... 28
5. Association of serum K+ concentration and fiber intake ................................................... 29
Discussion ................................................................................................................................. 31
Conclusion ................................................................................................................................ 35
References ................................................................................................................................ 36
1
Abstract
Background: Potassium (K+) restricting diets are part of everyday clinical practice to reduce the
risk of hyperkalemia in pediatric patients with chronic kidney disease (CKD). It is based on the
assumption that dietary potassium importantly impacts serum potassium ([K+]s) in these
children. However, no evidence is provided in the pediatric population. Besides, potassium
restriction could lead to low fiber intake. Since fiber intake has various proven health benefits,
potassium restriction is increasingly questioned. Lack of research hereabout leads to
questionable and vaguely described nutrition guidelines on potassium and fiber. We aimed to
assess dietary K+ and fiber intake in a pediatric CKD cohort and define their communal
relationship. We intended to asses [K+]s and research the impact of a potassium binding resin
on this. The ultimate aim was to define relationships between dietary K+ intake as well as fiber
intake, and [K+]s.
Methods: In this two-centered, cross-sectional observational study, 52 non-dialysis pediatric
patients with CKD stage 1 to 5, were included. Dietary assessment was performed through three
day food diaries or 24 hours recall and [K+]s was analyzed by standard laboratory techniques. K+
intake, fiber intake and [K+]s were compared between CKD stages. To assess the association
between K+ and fiber intake, K+ intake was compared between three groups of patients based
on fiber intake tertiles. [K+]s was compared between patients whether or not on a potassium
binding resin (kayexalate), and matched for primary kidney disease and eGFR. To study the
influence of dietary K+ and fiber intake on [K+]s, patients are divided in high and low intake
groups. These groups are compared for each CKD stage.
Results: K+ intake is significantly lower in CKD 4-5 (50,2[41,4;59,4] mg/kg/day) than in CKD 1-2
(76,6 [61,7;114,4] mg/kg/day) (p=0,005). Also fiber intake is significantly lower in CKD 4-5 (53,0
± 34,6 % of dietary reference intake (%DRI)) than in CKD 1-2 (92,1 ± 37,3 %DRI) (p=0,005). A
significant difference in K+ intake is seen between groups of high and low fiber intake (p=0,017).
In general [K+]s is within the normal range: 4,6 ± 0,6 mmol/L. [K+]s in patients on kayexalate was
equal to or higher than [K+]s in the control patients. No significant difference of [K+]s is seen
neither between high and low K+ intake nor between high and low fiber intake, for each CKD
stage, except for CKD 3. In CKD 3 an inverse relation between K+ intake and [K+]s is found
(p=0,035).
Conclusion: This study shows that fiber intake is low in pediatric CKD patients, which is more
pronounced in advanced CKD. A moderate association between fiber and K+ intake is described,
which demonstrates that low fiber intake is partly caused by dietary K+ restriction. No consistent

2
effect of kayexalate on [K+] is found, which may be biased by the observational study design. No
association between K+ intake nor fiber intake and [K+]s is seen. Further research is necessary
to define efficacy and safety of dietary potassium restriction and potassium binding resins. More
attention towards fiber intake is needed.
Samenvatting
Achtergrond: Een kalium (K+) beperkend dieet maakt deel uit van de dagelijkse klinische
praktijk om het risico op hyperkaliëmie bij pediatrische patiënten met chronische nierziekte
(CKD) te verminderen. Het is gebaseerd op de aanname dat inname van kalium via de voeding
een belangrijke invloed heeft op de serum kalium concentratie ([K+]s) in deze pediatrische
populatie. Er is echter geen klinisch bewijs gepubliceerd hieromtrent. Bovendien kan
kaliumbeperking leiden tot een lage vezelinname. Wegens de verschillende
gezondheidsvoordelen die met vezelinname geassocieerd zijn, wordt kaliumbeperking in
toenemende mate in twijfel getrokken. Gebrek aan onderzoek op dit vlak leidt tot dubieuze, vaag
beschreven nutritionele richtlijnen omtrent kalium en vezel. Het doel van deze studie was om
zowel K+ als vezelinname in een pediatrische CKD populatie na te gaan en hun onderlinge
relatie te beschrijven. Daarnaast wilden we ook [K+]s nagaan en de impact van kaliumbinders op
[K+]s onderzoeken. Het uiteindelijke doel was om zowel de relatie tussen K+-inname en [K+]s als
die tussen vezelinname en [K+]s te beschrijven.
Methode: In dit cross-sectioneel, observationeel onderzoek, uitgevoerd in 2 centra, werden 52
pediatrische patiënten met CKD stadium 1 tot 5 die geen nierfunctievervangende therapie
volgden, geïncludeerd. Dieetevaluatie werd uitgevoerd door middel van driedaagse
voedingsdagboeken of 24-uurs dieetanamnese en [K+]s werd geanalyseerd via standaard
laboratoriumtechnieken. K+-inname, vezelinname en [K+]s werden vergeleken tussen de CKD-
stadia. Om het verband tussen K+-en vezelinname te beoordelen, werd K+-inname vergeleken
tussen drie patiëntgroepen op basis van de vezelinname tertielen. [K+]s werd vergeleken tussen
patiënten die wel of niet een kaliumbinder (kayexalaat) kregen, en deze patiënten werden
gematcht op basis van primaire nierziekte en eGFR. Om de invloed van K+- en vezelinname op
[K+]s te bestuderen, werden patiënten verdeeld in groepen met hoge en lage inname. Deze
groepen werden voor elk CKD-stadium vergeleken.
Resultaten: De K+-inname is significant lager in CKD 4-5 (50,2 [41,4;59,4] mg/kg/dag) dan in
CKD 1-2 (76,6 [61,7;114,4] mg/kg/dag) (p=0,005). Ook de vezelinname is significant lager in
3
CKD 4-5 (53,0 ± 34,6 %ADH) dan in CKD 1-2 (92,1 ± 37,3 %ADH) (p=0,005). Er is een
significant verschil in K+-inname tussen de groepen met hoge en lage vezelinname (p=0,017). In
het algemeen ligt [K+]s binnen de normaalwaarden: 4,6 ± 0,6 mmol/L. [K+]s bij patiënten met
kayexalaat inname was gelijk aan of hoger dan [K+]s bij controlepatiënten. In geen enkel CKD-
stadium was er een significant verschil te zien in [K+]s noch tussen groepen met hoge en lage
K+-inname, noch tussen groepen met hoge en lage vezelinname, behalve voor CKD 3, waar er
een omgekeerd verband tussen K+-inname en [K+]s is aangetoond (p=0,035).
Conclusie: Deze studie toont een lage vezelinname bij pediatrische patiënten met CKD, die
meer uitgesproken is in gevorderde stadia. Er is een matige associatie tussen K+-en
vezelinname. Dit toont aan dat een kaliumbeperkend dieet invloed heeft op vezelinname bij deze
patiënten. Er werd geen consistent effect van kayexalaat op [K+]s gevonden, wat een vertekend
beeld kan zijn wegens de observationele aard van de studie. Tussen K+- of vezelinname en
[K+]s werd er geen verband gezien. Verder onderzoek is nodig om de doeltreffendheid en
veiligheid van zowel kaliumbeperkend dieet als kaliumbinders te bepalen. Ook is er meer
aandacht nodig voor vezelinname bij deze patiënten.

4
Introduction
1 Renal anatomy The kidneys are paired organs that lie in the retroperitoneal cavity, on either side of the vertebral
column. A kidney consists of an outer cortex and an inner medulla enclosed by a fibrous
capsule. Each kidney contains about one million nephrons. A nephron is made up of a
glomerulus, a proximal tubule, a loop of Henle, a distal tubule and a collecting duct. The
glomeruli are located in the cortex and the tubules in the cortex and medulla (1). In the
glomerulus, ultrafiltration of blood takes place with the production of primary urine as a result.
The tubule is responsible for reabsorption, filtration and secretion of water and solutes. The
region where the distal tubule contacts its glomerulus is called the juxtaglomerular apparatus (2).
At the papilla of the renal pyramid (medulla) the collecting ducts merge into a calyx. These
calices form the renal pelvis, which is the beginning of the ureter. Urine is excreted through the
ureters, bladder and urethra (1, 2).
2 Kidney function The kidney has three major functions. The first function is the excretion of waste products of
metabolism. The second is the maintenance of a relatively constant extracellular environment.
This includes pH as well as electrolyte balance. This balance is necessary for cells to function
normally. The third function is the secretion of hormones that participate in the regulation of
hemodynamics, red cell production and mineral metabolism (3).
2.1 Glomerular filtration rate
The function of the kidney is measured by the glomerular filtration rate (GFR). This is the rate of
ultrafiltration over the glomerular capillary wall. It varies with sex, from 12 years on, and with age
(1). Typical mean GFR values in children and adolescents are presented in table 1. The driving
forces for GFR are the hydraulic and oncotic pressure gradients across the glomerular capillary
wall. GFR is regulated by different mechanisms. One of them is the autoregulation of the
glomerular capillaries. It protects the nephrons against increases of perfusion pressure. During
alterations in arterial pressure, the afferent arteriole of the glomerulus contracts to prevent an
increase in perfusion pressure. Another mechanism is tubuloglomerular feedback. It occurs at
the juxtaglomerular apparatus. When the amount of fluid and NaCl in this part of the distal tubule
increases, the glomerular filtration rate of that nephron falls. GFR is also regulated by the renin-
angiotensin system and by neurohumoral influences (2, 3).
5
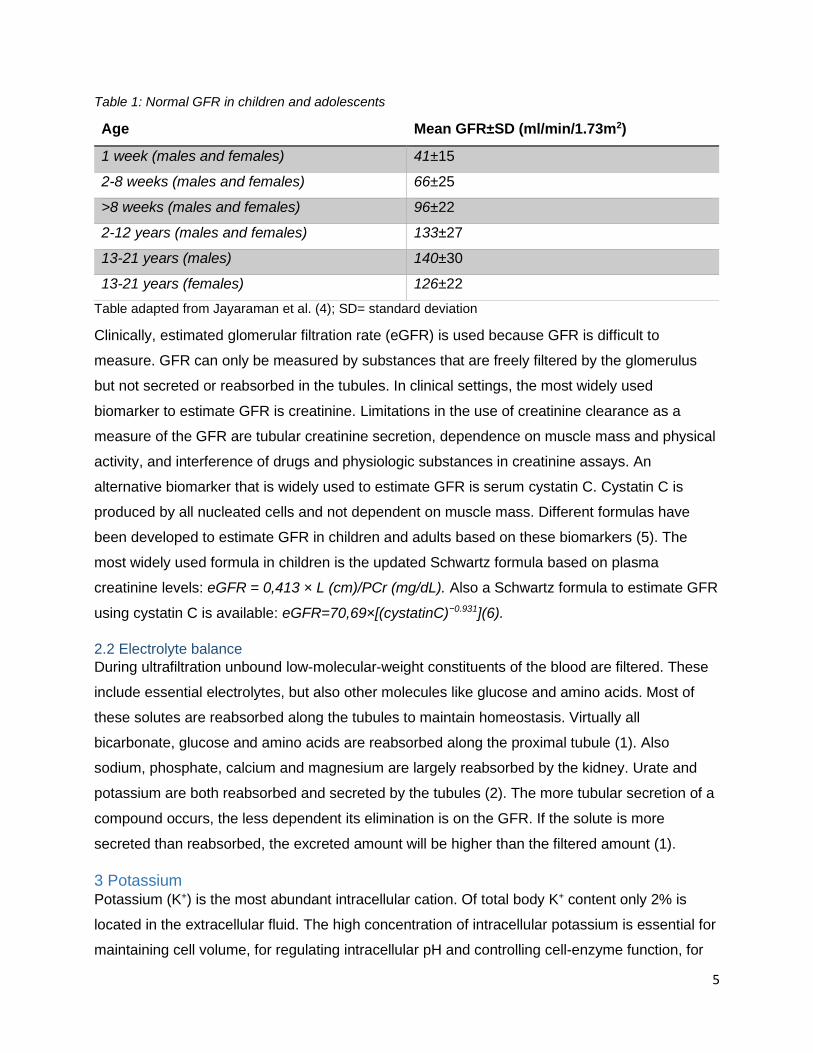
Table 1: Normal GFR in children and adolescents
Age Mean GFR±SD (ml/min/1.73m2)
1 week (males and females) 41±15
2-8 weeks (males and females) 66±25
>8 weeks (males and females) 96±22
2-12 years (males and females) 133±27
13-21 years (males) 140±30
13-21 years (females) 126±22
Table adapted from Jayaraman et al. (4); SD= standard deviation
Clinically, estimated glomerular filtration rate (eGFR) is used because GFR is difficult to
measure. GFR can only be measured by substances that are freely filtered by the glomerulus
but not secreted or reabsorbed in the tubules. In clinical settings, the most widely used
biomarker to estimate GFR is creatinine. Limitations in the use of creatinine clearance as a
measure of the GFR are tubular creatinine secretion, dependence on muscle mass and physical
activity, and interference of drugs and physiologic substances in creatinine assays. An
alternative biomarker that is widely used to estimate GFR is serum cystatin C. Cystatin C is
produced by all nucleated cells and not dependent on muscle mass. Different formulas have
been developed to estimate GFR in children and adults based on these biomarkers (5). The
most widely used formula in children is the updated Schwartz formula based on plasma
creatinine levels: eGFR = 0,413 × L (cm)/PCr (mg/dL). Also a Schwartz formula to estimate GFR
using cystatin C is available: eGFR=70,69×[(cystatinC)−0.931](6).
2.2 Electrolyte balance
During ultrafiltration unbound low-molecular-weight constituents of the blood are filtered. These
include essential electrolytes, but also other molecules like glucose and amino acids. Most of
these solutes are reabsorbed along the tubules to maintain homeostasis. Virtually all
bicarbonate, glucose and amino acids are reabsorbed along the proximal tubule (1). Also
sodium, phosphate, calcium and magnesium are largely reabsorbed by the kidney. Urate and
potassium are both reabsorbed and secreted by the tubules (2). The more tubular secretion of a
compound occurs, the less dependent its elimination is on the GFR. If the solute is more
secreted than reabsorbed, the excreted amount will be higher than the filtered amount (1).
3 Potassium Potassium (K+) is the most abundant intracellular cation. Of total body K+ content only 2% is
located in the extracellular fluid. The high concentration of intracellular potassium is essential for
maintaining cell volume, for regulating intracellular pH and controlling cell-enzyme function, for

6
DNA and protein synthesis and for cell growth. The low extracellular concentration of potassium
is necessary for maintaining the cell membrane potential (2). The resting membrane potential is
important because it is the stage from where an action potential can be provoked. This is
essential for normal neural and muscular function (3).
The normal range of serum potassium in adults is 3,5 to 5,5 mmol/L. Hyperkalemia is defined as
a serum potassium concentration above 5,5 mmol/L. On the other hand a serum potassium
below 3,5 mmol/L is called hypokalemia. A deviation from normokalemia is associated with
increased risk of major adverse cardiovascular events, hospitalization and mortality (7). Young
children and infants physiologically have higher serum potassium rates. This should be taken
into account when interpreting serum potassium in children. There are however no official limit
values described for serum potassium in children. So in clinical practice, the same reference
values are used in children as in adults (neonates excluded) (5).
The most common source of potassium load is dietary potassium. K+ is absorbed by both the
small intestine and the colon. Potassium can also originate from damaged tissue. The kidney
excretes potassium based on dietary intake. The higher dietary intake, the more K+ is secreted in
the distal tubule. In addition, increased luminal flow, aldosterone and antidiuretic hormone
promote K+ excretion by the kidney. Whereas epinephrine lowers K+ excretion (2).
Disturbances of potassium homeostasis can be of different cause. There can be a problem in
the uptake of K+ into the cell. The hormones insulin, epinephrine and aldosterone all promote
transfer of K+ into the cell. Lack of one of these hormones can thus result in hyperkalemia. Acid-
base disturbances also affect internal K+ distribution with acidosis leading to hyperkalemia.
However, the primary cause of hyperkalemia is impaired renal excretion. This can be due to
advanced renal failure or other abnormalities like hypoaldosteronism and distal renal tubular
acidosis. Furthermore, massive breakdown of cells can lead to hyperkalemia. This is the case
with intravascular hemolysis, burns, crush injuries, rhabdomyolysis, gastro-intestinal (GI)
bleeding and the use of chemotherapy with leukemia or a tumor. Risk factors of developing
hyperkalemia include CKD and renal impairment, type 2 diabetes mellitus, chronic heart failure,
hypertension and the use of medication like renin-angiotensin-aldosteron system inhibitors (ACE
inhibitors and ARB), NSAIDs and mineralocorticoid receptor antagonists. Common causes of
hypokalemia are GI disturbances such as vomiting and severe diarrhea. Also an inadequate
dietary intake can lead to hypokalemia (2, 7).
7
During hypokalemia the magnitude of the resting membrane potential increases. This reduces
the excitability of the cell leading to muscle weakness. With severe hypokalemia there can be
enhanced excitability of the cell due to increased intracellular sodium concentration.
With hyperkalemia the membrane excitability is increased. Persistent hyperkalemia however, is
associated with decreased membrane excitability due to inactivation of sodium channels (3).
Both hypokalemia and hyperkalemia cause alterations in muscle function and cardiac
arrhythmias. This is clinically important because it can lead to cardiac arrest and death. Severe
hyperkalemia can also result in death by paralysis of muscles that control ventilation (8).
4 Chronic kidney disease in children The definition of chronic kidney disease (CKD) by Kidney Disease Outcomes Quality Initiative
(KDOQI) guidelines (9) is as follows: a GFR <60ml/min/1.73m2, with or without kidney damage,
during more than three months or kidney damage, with or without decreased GFR, for more than
three months. Kidney damage is in this guideline defined as structural or functional abnormalities
of the kidney characterized by pathologic abnormalities or kidney damage markers, which
include abnormalities of blood or urine analysis or abnormal imaging. CKD is considered a
chronic deterioration of renal function that may gradually progress to end-stage kidney disease
(ESKD) (5). It is specified as a continuous process from mild-to-severe rather than a discrete
change in renal function. It is divided into five stages (table 2) based on kidney damage and
renal function. The definition of CKD as GFR below 60 ml/min/1,73m2 is not applicable for
children under the age of two because they physiologically have a low GFR, even when
corrected for body surface area (table 1)(4, 5, 10).
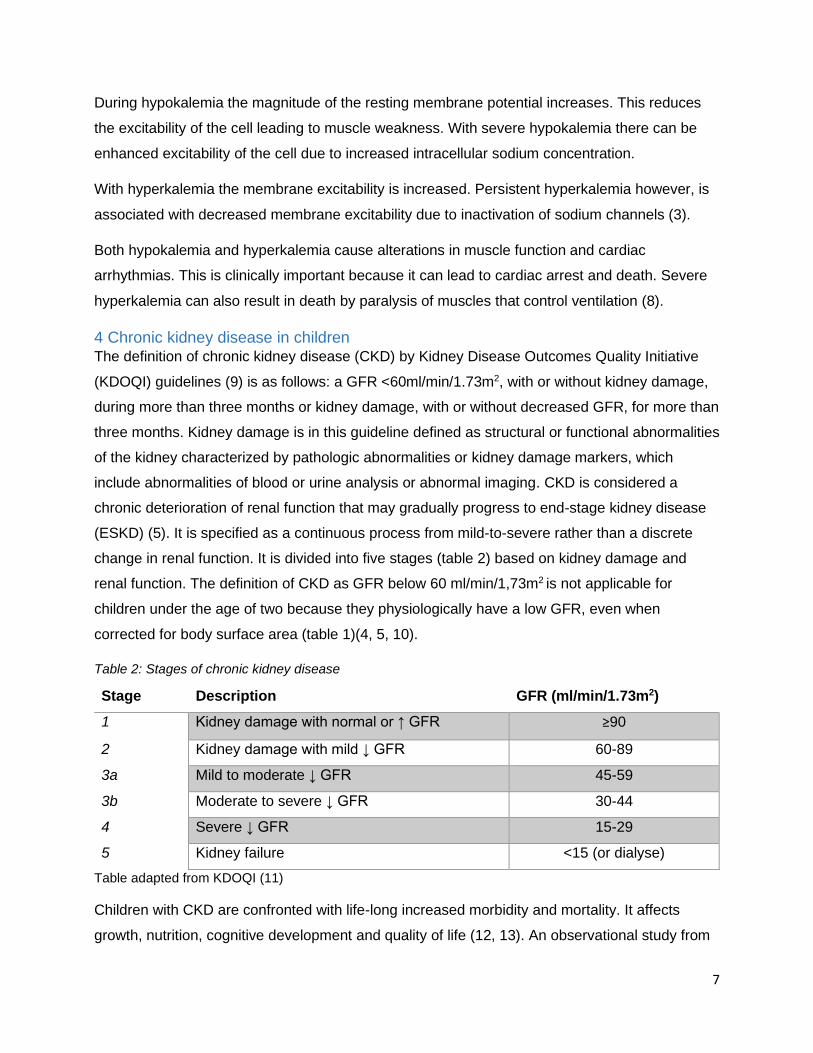
Table 2: Stages of chronic kidney disease
Stage Description GFR (ml/min/1.73m2)
1 Kidney damage with normal or ↑ GFR ≥90
2 Kidney damage with mild ↓ GFR 60-89
3a Mild to moderate ↓ GFR 45-59
3b Moderate to severe ↓ GFR 30-44
4 Severe ↓ GFR 15-29
5 Kidney failure <15 (or dialyse)
Table adapted from KDOQI (11)
Children with CKD are confronted with life-long increased morbidity and mortality. It affects
growth, nutrition, cognitive development and quality of life (12, 13). An observational study from
8
Harmer et al.(14) shows that health-related quality of life (HRQoL) is lower in children with CKD
pre-dialysis than in a healthy control population. It also shows that HRQoL is associated with
nutritional status in these children.
4.1 Epidemiology
Information on the epidemiology of pediatric CKD is limited because the early stages of CKD are
often asymptomatic and therefore under-diagnosed and under-reported. Available data is mainly
restricted to the Western world. In Europe, the incidence is about 11-12 per million of the age-
related population (pmarp) for CKD stages 3-5 and 8 pmarp for stages 4-5. In Belgium, the
incidence between 2001 and 2005 for children aged 0-19, was 11,9 pmarp for CKD stages 3-5
and the prevalence was 56 pmarp. Notable was the predominance of the male gender (15).
Mortality rate is 30 times higher in children with CKD than in healthy children. Cardiopulmonary
death was the most common cause cited in children, followed by infection. Worldwide
adolescents have a higher incidence of renal replacement therapy (RRT) compared to other age
groups. The youngest pediatric patients on dialysis have the worst survival after one, two and
three years on RRT (13).
4.2 Etiology
In adults, common causes of CKD are diabetes mellitus, hypertension and autosomal dominant
polycystic kidney disease. In contrast, the most common causes of pediatric CKD are congenital
anomalies of the kidney and urinary tract (CAKUT), hereditary nephropathies and
glomerulonephritis (13). CAKUT are more common in younger children, whereas older children
are more likely to have glomerular disease (10). Diagnoses that are most common with pediatric
ESKD include focal segmental glomerulosclerosis, renal hypoplasia or dysplasia, congenital
obstructive uropathy and systemic lupus erythematosus (5). Infants born with low weight and
small for gestational age have an increased risk of developing ESKD in adolescence. Also
children with obesity have a higher risk of early kidney dysfunction and CKD (13).
4.3 Pathophysiology
In CKD the progressive damage of the kidney may be secondary to repeated insults to the renal
parenchyma or to the adaptive hyperfiltration of the kidney (10). Initially, the kidney adapts to
damage by increasing the filtration rate in the remaining nephrons. As a result, mild CKD is often
associated with normal serum concentrations of creatinine, sodium, potassium, calcium and
phosphorus. Also total body water remains within the normal range for patients with mild to
moderate stages of CKD. This adaptive mechanism is beneficial at first, but can lead to long-
term damage of the remaining nephrons. This is manifested by progressive kidney insufficiency
often with proteinuria and accumulation of uremic toxins. This irreversible damage is responsible
9
for the development of ESKD. The prognosis depends to a large extent on the number of
functioning nephrons (4, 5).
As described above, kidney damage leads to accumulation of uremic toxins. These are
metabolic waste products, but they can also be produced by gut microbiota, particularly indoxyl
sulfate (IS) and p-Cresyl sulfate (PCS). They have an adverse effect on biological functions. The
presence of uremic toxins is called azotemia, whereas uremia refers to the clinical
manifestations of azotemia (5).
The underlying etiology has a major influence on the progression of CKD. In the first years of
life, renal dysplasia predominates in comparison to glomerular disease. Renal dysplasia has
different causes among which primary genetic disorders, posterior urethral valves which cause
lower urinary tract obstruction and teratogens (16). During fetal development severe bilateral
renal dysplasia or polycystic kidney disease can lead to oligohydramnios. This can cause
pulmonary hypoplasia because lung development requires factors present in amniotic fluid.
Survival of these children is based on their lung development. Also, the presence of
oligohydramnios is a predictor of poor renal function after birth. Glomerular diseases, on the
other hand, are more likely to present later in childhood and they have a faster progression. In
this case, impaired renal clearance occurs because the kidneys become affected by
tubulointerstitial fibrosis and nephron loss (5).
Beside the etiology, the stage of CKD at time of diagnosis and clinical factors like hypertension,
proteinuria, obesity, dyslipidemia, anemia and metabolic acidosis influence the progression of
CKD. The rate of progression is also faster among African-Americans. This is documented for
adults as well as children with CKD (10, 17).
4.4 Symptoms and clinical diagnosis
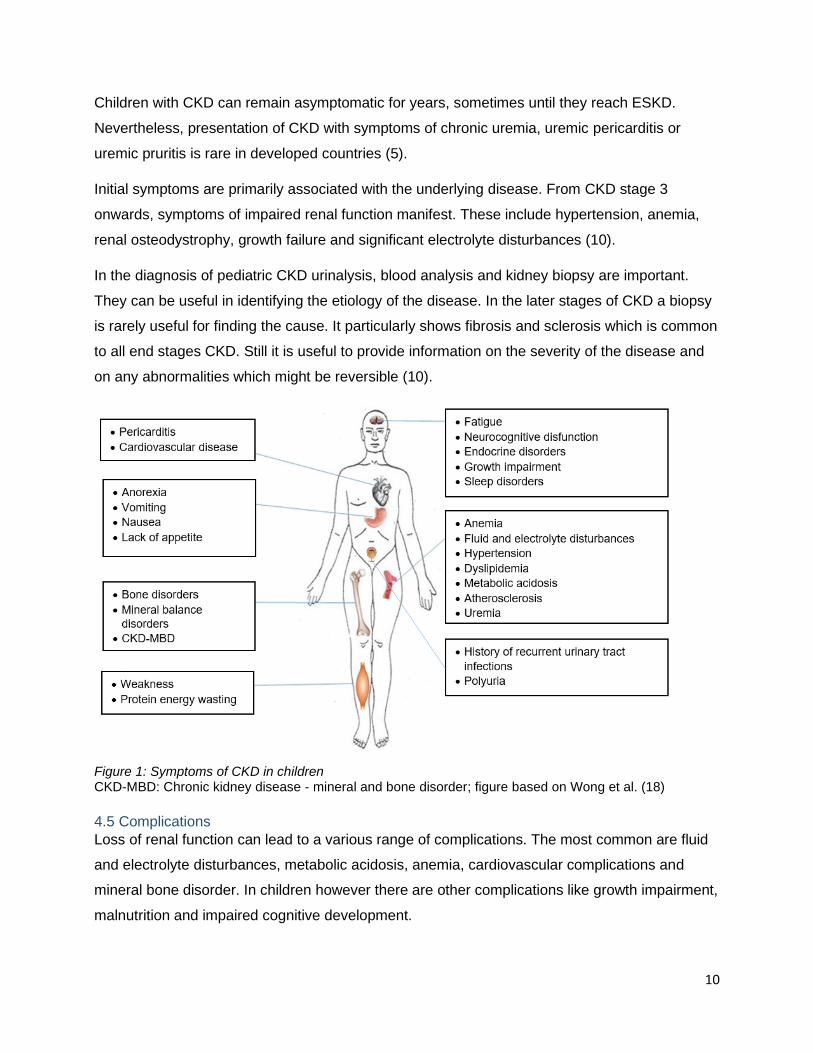
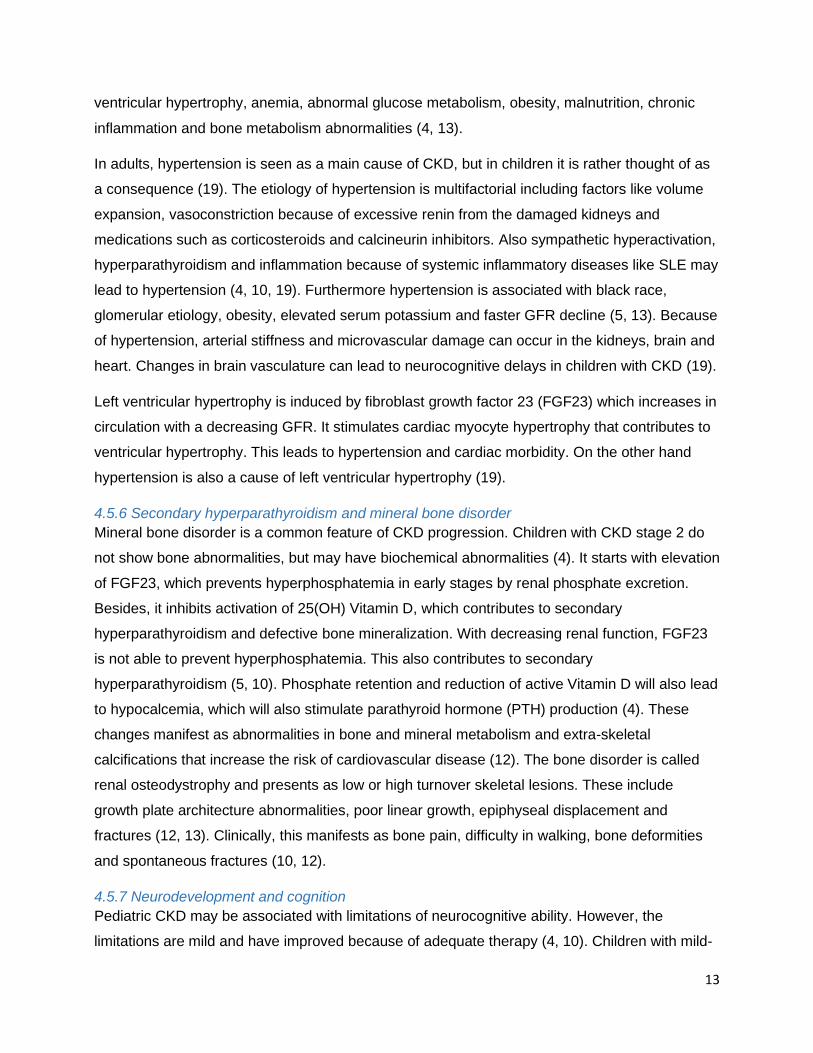
The clinical presentation of pediatric CKD can vary widely (Figure 1). In developed countries
CAKUT are mostly detected prenatally by routine ultrasound examination. In the developing
world this diagnosis may be delayed by a lack of prenatal care. If not diagnosed in early
childhood, children with CAKUT may present with recurrent urinary tract infection, failure to
thrive, growth impairment or concentrating defects including polyuria. It can also be diagnosed
by an incidental finding of elevated serum creatinine, blood urea nitrogen or abnormal imaging.
On the other hand glomerular causes of CKD present with nephritic and/or nephrotic symptoms
like proteinuria, edema and elevated blood pressure (5, 10).
10
Children with CKD can remain asymptomatic for years, sometimes until they reach ESKD.
Nevertheless, presentation of CKD with symptoms of chronic uremia, uremic pericarditis or
uremic pruritis is rare in developed countries (5).
Initial symptoms are primarily associated with the underlying disease. From CKD stage 3
onwards, symptoms of impaired renal function manifest. These include hypertension, anemia,
renal osteodystrophy, growth failure and significant electrolyte disturbances (10).
In the diagnosis of pediatric CKD urinalysis, blood analysis and kidney biopsy are important.
They can be useful in identifying the etiology of the disease. In the later stages of CKD a biopsy
is rarely useful for finding the cause. It particularly shows fibrosis and sclerosis which is common
to all end stages CKD. Still it is useful to provide information on the severity of the disease and
on any abnormalities which might be reversible (10).
Figure 1: Symptoms of CKD in children CKD-MBD: Chronic kidney disease - mineral and bone disorder; figure based on Wong et al. (18)
4.5 Complications
Loss of renal function can lead to a various range of complications. The most common are fluid
and electrolyte disturbances, metabolic acidosis, anemia, cardiovascular complications and
mineral bone disorder. In children however there are other complications like growth impairment,
malnutrition and impaired cognitive development.
11
4.5.1 Fluid and electrolyte disturbances
Fluid and electrolyte disturbances are usually present in CKD stages 4 and 5 (10). The drop in
GFR leads to water retention and impaired clearance of solutes. It is associated with volume
overload, hypernatremia, hyperkalemia and hyperphosphatemia (10, 19). Volume overload and
salt retention can be the cause of secondary hypertension (10). However, children with
obstructive uropathies and/or dysplastic kidneys and certain genetic diseases may experience
polyuria and hyponatremia due to poor urinary concentration and excessive urinary sodium loss
(4, 5). Also patients on peritoneal dialysis can experience excessive sodium loss due to
ultrafiltration. Chronic hyponatremia may contribute to growth impairment.
Hyperphosphatemia stimulates parathyroid gland function and has an effect on bone resorption
and formation (5).
The most feared electrolyte complication of CKD is hyperkalemia. Typically, renal potassium
excretion is maintained until GFR decreases to less than 10 to 15 mL/min/1.73m². When the
kidney loses its ability to clear potassium, it is important to counsel children and their family to
limit dietary potassium intake (8). However, there are a number of other factors that can
influence hyperkalemia. These include high dietary intake, hypercatabolic state with increased
tissue breakdown, metabolic acidosis, hypoaldosteronism due to ACE inhibitors or ARBs and
other medication like potassium sparing diuretics, calcineurin inhibitors, NSAIDs and in some
cases co-trimoxazole (4, 5, 10, 19). Of total potassium excretion 10% happens through the
gastro-intestinal tract (8). With advanced CKD there is an adaptive increase in colonic potassium
secretion (10). So constipation can lead to hyperkalemia in these patients (5). Unfortunately
constipation is frequent in patients with CKD due to reduction of fluid intake, dietary restrictions
and medications like phosphate binders or antibiotics (20). Also inadequate dialysis can be a
cause of hyperkalemia(8). On the other hand hypokalemia can be seen in association with
Fanconi syndrome, polyuric CKD, diuretic therapy, peritoneal dialysis and frequent hemodialysis
(4, 8).
4.5.2 Metabolic acidosis
As the GFR decreases to about 50% of normal, metabolic acidosis occurs. Normally the kidney
eliminates acid load by hydrogen excretion as titratable acids and through ammonium excretion.
When GFR falls impaired reabsorption of bicarbonate, reduced ammonia synthesis, decreased
excretion of titratable acids and decreased acidification of tubular fluid lead to metabolic acidosis
(13, 19). It results in osteopenia, growth impairment, nephrolithiasis due to hypercalciuria, higher
risk of secondary hyperparathyroidism and increased protein and muscle catabolism. It can also
12
contribute to hyperkalemia, inflammation, enhanced insulin resistance and CKD progression (5,
10, 13, 19).
4.5.3 Growth impairment and malnutrition
Growth impairment is a common complication in pediatric CKD and a major negative factor of
quality of life in these patients. It is associated with a higher hospitalization and mortality rate (5).
All phases of body growth are affected, starting with the infantile phase. It is thought that in this
phase, impairment is largely mediated by malnutrition. Prematurity-related feeding intolerance
and recurrent vomiting can be the cause. However more frequent factors of malnutrition in
children with CKD include poor appetite, altered gastrointestinal motility, malabsorption,
increased inflammatory status, metabolic acidosis and uremic abnormalities that influence
metabolism. Malnutrition may also affect neurocognitive development (4, 5). During childhood,
the most important factor is the growth hormone axis. CKD is associated with growth hormone
resistance, which leads to growth disturbances. The grow spurt is limited by a reduced height
velocity and duration and is associated with a more rapid decline in renal function (5, 10, 12, 13).
The pubertal phase is mostly affected by the gonadotropic hormones. In children with CKD the
average pubertal delay is 2.5 years. The age of onset of CKD has the biggest influence on the
severity of growth retardation with the worst outcomes in younger children (10). Next to the
phase related factors, there are others factors that contribute to growth impairment. These
include metabolic acidosis, fluid and electrolyte abnormalities, renal osteodystrophy, anemia,
infections and use of steroids (4, 5, 10, 12).
4.5.4 Anemia
Anemia is an important complication of CKD. It is linked to poor outcomes, quality of life and
neurocognitive ability in patients with CKD (5, 13). In children, it is associated with growth
impairment (5). Anemia presents with worsening levels of renal function starting from stage 3b
on, and is more likely in stage 4 and 5 (19). The cause of anemia is a decreased red blood cell
production because of an iron deficiency and because of decreased erythropoietin (EPO)
production by the kidney. EPO is a hormone essential for erythropoiesis (5, 19). Iron absorption
is suppressed by the hepatic hormone hepcidin, which is elevated in CKD. While EPO
suppresses hepcidin production, both inflammation and iron loading stimulate it (5, 13).
4.5.5 Cardiovascular disease
The long-term survival of children with CKD is far lower than that of the healthy population. The
leading cause of death in pediatric CKD is cardiovascular disease. Children with CKD have a
high prevalence of cardiovascular risk factors including dyslipidemia, hypertension, left
13
ventricular hypertrophy, anemia, abnormal glucose metabolism, obesity, malnutrition, chronic
inflammation and bone metabolism abnormalities (4, 13).
In adults, hypertension is seen as a main cause of CKD, but in children it is rather thought of as
a consequence (19). The etiology of hypertension is multifactorial including factors like volume
expansion, vasoconstriction because of excessive renin from the damaged kidneys and
medications such as corticosteroids and calcineurin inhibitors. Also sympathetic hyperactivation,
hyperparathyroidism and inflammation because of systemic inflammatory diseases like SLE may
lead to hypertension (4, 10, 19). Furthermore hypertension is associated with black race,
glomerular etiology, obesity, elevated serum potassium and faster GFR decline (5, 13). Because
of hypertension, arterial stiffness and microvascular damage can occur in the kidneys, brain and
heart. Changes in brain vasculature can lead to neurocognitive delays in children with CKD (19).
Left ventricular hypertrophy is induced by fibroblast growth factor 23 (FGF23) which increases in
circulation with a decreasing GFR. It stimulates cardiac myocyte hypertrophy that contributes to
ventricular hypertrophy. This leads to hypertension and cardiac morbidity. On the other hand
hypertension is also a cause of left ventricular hypertrophy (19).
4.5.6 Secondary hyperparathyroidism and mineral bone disorder
Mineral bone disorder is a common feature of CKD progression. Children with CKD stage 2 do
not show bone abnormalities, but may have biochemical abnormalities (4). It starts with elevation
of FGF23, which prevents hyperphosphatemia in early stages by renal phosphate excretion.
Besides, it inhibits activation of 25(OH) Vitamin D, which contributes to secondary
hyperparathyroidism and defective bone mineralization. With decreasing renal function, FGF23
is not able to prevent hyperphosphatemia. This also contributes to secondary
hyperparathyroidism (5, 10). Phosphate retention and reduction of active Vitamin D will also lead
to hypocalcemia, which will also stimulate parathyroid hormone (PTH) production (4). These
changes manifest as abnormalities in bone and mineral metabolism and extra-skeletal
calcifications that increase the risk of cardiovascular disease (12). The bone disorder is called
renal osteodystrophy and presents as low or high turnover skeletal lesions. These include
growth plate architecture abnormalities, poor linear growth, epiphyseal displacement and
fractures (12, 13). Clinically, this manifests as bone pain, difficulty in walking, bone deformities
and spontaneous fractures (10, 12).
4.5.7 Neurodevelopment and cognition
Pediatric CKD may be associated with limitations of neurocognitive ability. However, the
limitations are mild and have improved because of adequate therapy (4, 10). Children with mild-
14
to-moderate CKD fall within normative ranges for IQ, academic achievement and executive
functioning (13). On the other hand, there is a trend toward lower IQ for more severe renal
failure, while higher GFR predicts improved academic achievement (12, 13).
4.6 Management
The management of CKD consists of several steps which are needed with the progression of the
disease. The first step is identifying the underlying etiology and management of reversible
causes. This means evaluating patients for fluid depletion, nephrotoxic drug intake, infection,
inflammation and congestive heart failure. The second step is slowing the progression of renal
dysfunction. Hypertension associated with proteinuria is a risk factor of CKD progression.
Therefore strict blood pressure control is important in slowing the disease progression. This can
be realized by pharmacologic treatment with an ACE inhibitor or ARB. In addition to blood
pressure control, anti-proteinuric effects of this treatment, may promote kidney survival.
However, children with renal failure and proteinuria often do not tolerate these medications
because the reduction in blood pressure leads to a reduction in perfusion pressure of the
kidneys and thus a reduction in GFR. Therefore it is recommended to measure renal function
within a few weeks after starting the medication. In adults restriction of protein has shown to be
effective. However, this is not recommended in pediatric patients because of the danger of
malnutrition. The third step involves treatment of complications which appear in CKD stage 3. In
stage 4 the last step takes place: adequate preparation for renal replacement therapy (RRT) (4,
10).
4.7 Renal replacement therapy
When the patient reaches stage 4 of CKD, preparation for RRT should be started. The therapy
of choice in children with ESKD is preemptive transplantation (i.e. before dialysis is started). If
this is not an option, a decision is made between hemodialysis and peritoneal dialysis. This
decision is based on personal circumstances, family preference, medical and social constraints.
Later on, a transplantation can still take place (4, 10).
4.7.1 Transplant
When children reach CKD stage 5, RRT is usually initiated. Transplantation conveys a four times
higher survival rate than dialysis. Preemptive transplantation has shown better graft survival and
reduced mortality compared to transplantation following dialysis. Other advantages of
preemptive transplantation are better growth and development and avoidance of the morbidity of
dialysis (4, 13). It must be taken into account that the minimum weight for kidney transplantation
in children is around 10 kg. Children with a weight below 10 kg will be treated with dialysis until
they reach the minimum weight. Transplants can come from the cadaveric transplant waiting list
15
or from a living related donor (LRD). Parents or other close loved ones can become an LRD for
the child. This provides shorter waiting times and improved graft survival. If possible, this is the
best treatment option for pediatric CKD patients (4, 10).
4.7.2 Dialysis
Despite the benefits of preemptive transplantation, there are situations where dialysis is
necessary. The KDOQI guidelines recommend considering dialysis at an eGFR <15
ml/min/1.73m2. European guidelines recommend a threshold of 6 ml/min/1.73m2. Absolute
indicators to start dialysis include anuria, severe electrolyte disturbances like hyperkalemia,
neurologic consequences, pericarditis, bleeding diathesis, refractory nausea and hypertension.
Side effects of uremia are considered relative indicators (13).
The preferred option of dialysis for younger children is peritoneal dialysis. The advantage is that
it can be performed at home. The best option is continuous automated peritoneal dialysis during
the night, such that it does not disturb school attendance or other day activities. This kind of
therapy can put a lot of pressure on families. Together with other factors like infections, ultra-
filtration failure and technical problems, this may lead to a switch to hemodialysis (4).
Hemodialysis is performed within a pediatric nephrology center. This has a major impact on daily
activities of the child as it takes place three to four times a week for 3-4 hours. Vascular access
is traditionally through a large central venous catheter or arteriovenous fistula. Arteriovenous
fistulas provide access with less risk of infection but are technically difficult in small children due
to small vessel size. They are preferred in children weighing more than 20kg. Despite, central
venous lines are often used in practice (4).
4.8 Potassium management
Requirements for potassium in healthy children vary among age. According to WHO guidelines
(21) the recommended potassium intake of at least 90 mmol/day in adults should be adjusted
downward for children, based on the energy requirement of children relative to those of adults. In
this guideline children include all individuals between 2 and 15 years of age. European Food
Safety Authority (EFSA) (22) and the High Health Council of Belgium (HGR) (23) express
specific recommendations based on age (table 3).

16
Table 3: Recommendations of daily potassium intake in healthy children
EFSA HGR
Age Potassium (mg/day) Age Potassium (mg/day)
7 - 11 months 750 0 - 12 months 39 – 78a
1 - 3 years 800 1 - 3 years 800 - 1,000
4 - 6 years 1,100 4 - 6 years 1,100 - 1,400
7 - 10 years 1,800 7 - 10 years 1,600 - 2,000
11 - 14 years 2,700 11 - 14 years 2,000 - 3,100
15 - 17 years 3,500 15 - 18 years 2,500 - 5,000
a: per kg of body weight EFSA: European Food Safety Authority; HGR: High Health Council of Belgium; table based on EFSA (22) and HGR (23)
Recommendations for potassium intake in children with CKD are scarce and based on research
in adults. The KDOQI guidelines (8) recommend limiting potassium intake for children with CKD
stages 2 to 5 and 5D who have or are at risk of hyperkalemia. However no data are available on
the degree of potassium restriction in children with CKD and hyperkalemia. In adults with CKD,
potassium intake is limited to less than 2,000 to 3,000 mg daily, which corresponds to 30 to 40
mg/kg/day for a 70-kg standard adult. Based on this, recommendations for infants and young
children with CKD are 40 to 120 mg/kg/day.
4.8.1 Diet
Potassium intake can be lowered by restricting intake of high potassium foods. Foods containing
less than 100 mg or less than 3% daily value (DV) are considered low in potassium. These
include apples, grapes, berries, white rice, onions, eggplant, zucchini, cucumber and pineapple.
Foods containing 200 to 250 mg or greater than 6% DV are considered high in potassium.
These include bananas, oranges and orange juice, potatoes, avocados, potato chips, mangoes,
papayas, dried fruits, tomato products, pumpkin, legumes and lentils, nuts and seeds, yoghurt
and chocolate. Also potassium-containing salt substitutes must be avoided in patients at risk for
hyperkalemia (5, 8, 19, 24). Potassium is infrequently listed on food labels and cannot be tasted,
which makes it difficult for patients to restrict high potassium foods (24). Meats are often absent
from high-potassium food lists, despite containing more potassium than recommended. They
can be enhanced with potassium-based food additives, which greatly increases potassium
content. An analysis found that enhanced boneless loin strip steak contained 930mg of
potassium per 100g. This is almost three times more than a similar unenhanced product. Thus
meats often contain as much or even more potassium than many high potassium fruits and
vegetables (25).
17
Potassium content can also be lowered by different cooking techniques. Potassium-rich
vegetables can be peeled, diced and presoaked in water to lower potassium content. The water
should be discarded before preparing the vegetables. Presoaking root vegetables can lower
their potassium content by 50% to 75% (5, 8, 24). Other recommended cooking techniques are
boiling in water and blanching. Also using frozen or canned foods plus washing can lower
potassium intake. Furthermore, serving sizes should be reviewed; a high serving of low
potassium foods can also lead to high potassium intake (20, 24, 26). Dietary restriction can be
challenging in infants with CKD. This usually involves low potassium diet in mothers who are
breastfeeding their infant (19).
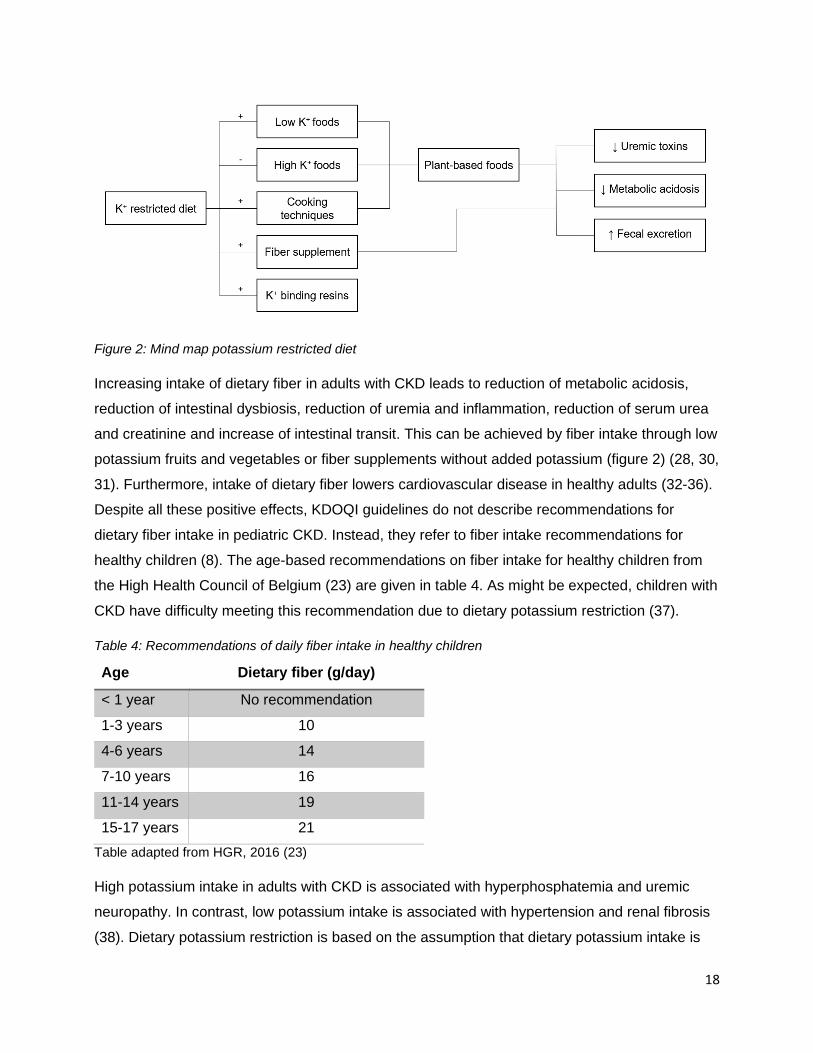
Potassium restriction thus often includes restriction of many plant-based foods and fibers (figure
2). Plant-based foods have potential health benefits which are related to their alkalinizing effects.
A study in adults has shown that the intake of plant-based foods leads to reduction of metabolic
acidosis and kidney disease progression in acidic, non-diabetic patients with CKD stage 4.
Serum potassium in this population was not increased by diets containing potassium-rich foods
despite relatively low potassium intake at baseline (27). Furthermore the bioavailability of
potassium in high-fiber foods is lower compared to other potassium foods (28). Potassium
derived from plants may promote intracellular potassium distribution by stimulating alkaline and
insulin. In addition, natural fiber intake promotes fecal excretion of potassium. These effects are
currently only described in adults (29). Contradictory, no studies have shown a difference in
serum potassium levels between patients mostly consuming plant-derived potassium sources
and patients mostly consuming omnivore-derived potassium sources (26). With decreased
intake of plants and fibers, dysbiosis of intestinal microbiota occurs. This leads to increased
production of uremic toxins as IS and PCS, which can lead to accelerated progression of kidney
disease (30). Fiber supplementation has shown to lower plasma PCS by 20% to 37% in adult
CKD patients with elevated compliance (20).
18
Figure 2: Mind map potassium restricted diet
Increasing intake of dietary fiber in adults with CKD leads to reduction of metabolic acidosis,
reduction of intestinal dysbiosis, reduction of uremia and inflammation, reduction of serum urea
and creatinine and increase of intestinal transit. This can be achieved by fiber intake through low
potassium fruits and vegetables or fiber supplements without added potassium (figure 2) (28, 30,
31). Furthermore, intake of dietary fiber lowers cardiovascular disease in healthy adults (32-36).
Despite all these positive effects, KDOQI guidelines do not describe recommendations for
dietary fiber intake in pediatric CKD. Instead, they refer to fiber intake recommendations for
healthy children (8). The age-based recommendations on fiber intake for healthy children from
the High Health Council of Belgium (23) are given in table 4. As might be expected, children with
CKD have difficulty meeting this recommendation due to dietary potassium restriction (37).
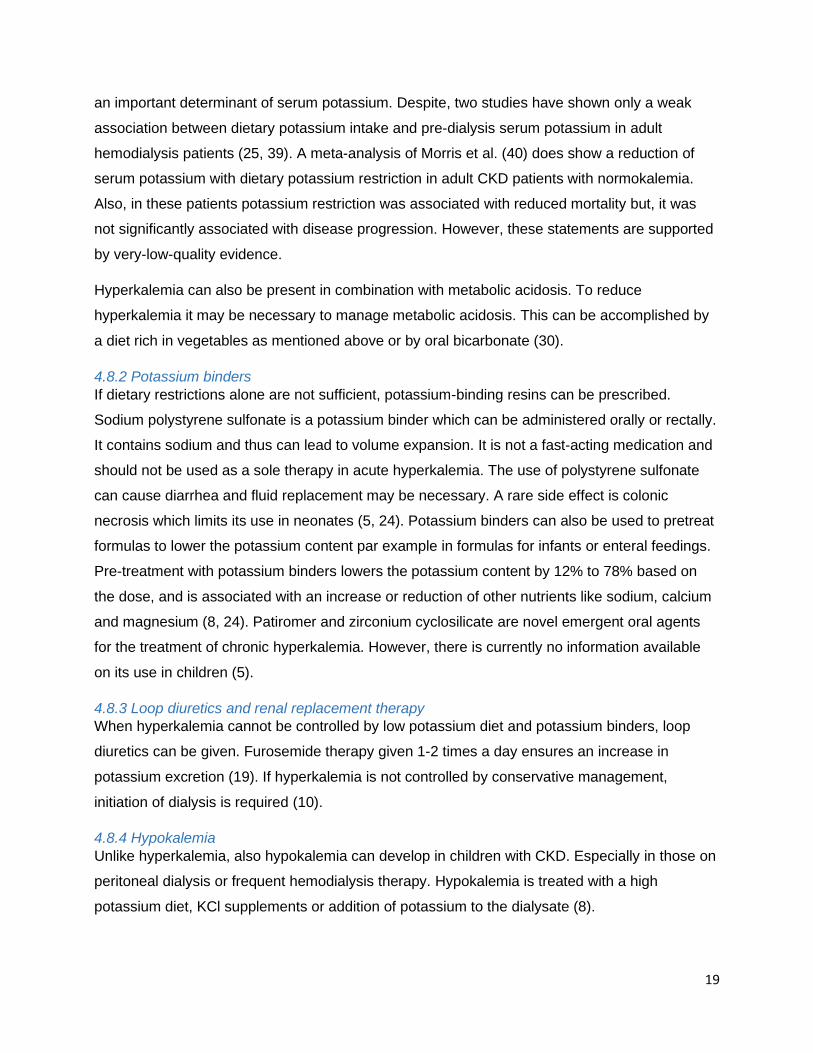
Table 4: Recommendations of daily fiber intake in healthy children
Age Dietary fiber (g/day)
< 1 year No recommendation
1-3 years 10
4-6 years 14
7-10 years 16
11-14 years 19
15-17 years 21
Table adapted from HGR, 2016 (23)
High potassium intake in adults with CKD is associated with hyperphosphatemia and uremic
neuropathy. In contrast, low potassium intake is associated with hypertension and renal fibrosis
(38). Dietary potassium restriction is based on the assumption that dietary potassium intake is
19
an important determinant of serum potassium. Despite, two studies have shown only a weak
association between dietary potassium intake and pre-dialysis serum potassium in adult
hemodialysis patients (25, 39). A meta-analysis of Morris et al. (40) does show a reduction of
serum potassium with dietary potassium restriction in adult CKD patients with normokalemia.
Also, in these patients potassium restriction was associated with reduced mortality but, it was
not significantly associated with disease progression. However, these statements are supported
by very-low-quality evidence.
Hyperkalemia can also be present in combination with metabolic acidosis. To reduce
hyperkalemia it may be necessary to manage metabolic acidosis. This can be accomplished by
a diet rich in vegetables as mentioned above or by oral bicarbonate (30).
4.8.2 Potassium binders
If dietary restrictions alone are not sufficient, potassium-binding resins can be prescribed.
Sodium polystyrene sulfonate is a potassium binder which can be administered orally or rectally.
It contains sodium and thus can lead to volume expansion. It is not a fast-acting medication and
should not be used as a sole therapy in acute hyperkalemia. The use of polystyrene sulfonate
can cause diarrhea and fluid replacement may be necessary. A rare side effect is colonic
necrosis which limits its use in neonates (5, 24). Potassium binders can also be used to pretreat
formulas to lower the potassium content par example in formulas for infants or enteral feedings.
Pre-treatment with potassium binders lowers the potassium content by 12% to 78% based on
the dose, and is associated with an increase or reduction of other nutrients like sodium, calcium
and magnesium (8, 24). Patiromer and zirconium cyclosilicate are novel emergent oral agents
for the treatment of chronic hyperkalemia. However, there is currently no information available
on its use in children (5).
4.8.3 Loop diuretics and renal replacement therapy
When hyperkalemia cannot be controlled by low potassium diet and potassium binders, loop
diuretics can be given. Furosemide therapy given 1-2 times a day ensures an increase in
potassium excretion (19). If hyperkalemia is not controlled by conservative management,
initiation of dialysis is required (10).
4.8.4 Hypokalemia
Unlike hyperkalemia, also hypokalemia can develop in children with CKD. Especially in those on
peritoneal dialysis or frequent hemodialysis therapy. Hypokalemia is treated with a high
potassium diet, KCl supplements or addition of potassium to the dialysate (8).

20
Objective
The existing KDOQI guidelines (8) regarding dietary potassium limitation in children with CKD
are vaguely described and little substantiated. This is because of unavailable data on potassium
in children with CKD, on intake as well as on serum values. Furthermore, there is little evidence
of a correlation between potassium intake and serum potassium in both adult and pediatric CKD
patients. In adult hemodialysis patients two studies (25, 39) described only a weak association
between dietary potassium intake and pre-dialysis serum potassium. A recent meta-analysis did
show associations between potassium restriction and reduction of serum potassium as well as a
reduction of mortality in adult CKD patients, but this study is based on very-low-quality evidence
(40). Nevertheless, many clinicians nowadays still assume that dietary potassium restriction
beneficially influences serum potassium in adult as well as pediatric CKD patients. To our
knowledge, no studies have examined this in children. But care should be taken when potassium
restrictions are prescribed, since they may lead to lower fiber intake. As described in the
introduction, fiber intake has a lot of positive effects in adult CKD patients like reduction of
uremia, inflammation and intestinal dysbiosis. On top of that, it also improves cardiovascular
disease in healthy adults (32-36). So the question arises whether dietary potassium restriction is
really beneficial in children with CKD.
Besides, many patients are bothered by dietary restrictions as well as pharmacologic treatment
(41-43). This may contribute to reduced quality of live (QoL) in children with CKD (44-46). So the
question is asked whether dietary restrictions and potassium binding resins are effective and
necessary.
The objective of this study is to describe serum potassium concentrations, and potassium and
fiber intake in children with different stages of CKD through cross-sectional analysis. Potassium
intake will be compared to the norms of the KDOQI guidelines (8), fiber intake to the
recommendation of the High Health Council of Belgium (23) and serum potassium concentration
to the conventional reference values. The association between dietary potassium intake and
dietary fiber intake will be examined and the impact of potassium binding resins on serum
potassium concentrations will be assessed. Furthermore, associations will be evaluated between
dietary potassium intake as well as dietary fiber intake and serum potassium concentrations.
21
Methods
1. Study design This study is a two-center cross-sectional analysis of serum potassium concentrations,
potassium and fiber intake in 52 children with CKD. Information was assembled from the
departments of pediatric nephrology of the Ghent University Hospital (UZ Gent) and the
University Hospital of Antwerp (UZA). Data was collected between September 2015 and January
2017.
2. Patient inclusion and clinical assessment
In this prospective, observational study, children with CKD stages 1 to 5, who were not on renal
replacement therapy, were included. Children who consulted the outpatient clinic or who were
hospitalized in the pediatric nephrology departments of both centers and who met the inclusion
criteria, were asked to participate in this study. Inclusion criteria for this study involved: dated
and signed informed consent, age ≤18 years, and diagnosed with CKD stage 1-5 according to
KDOQI guidelines (9) (table 2). Informed consent was signed by the parents and if the child was
12 years or older, it was signed by the child as well. Patients on dialysis were excluded as well
as children with unstable disease states like active inflammatory diseases or malignancies.
During the consultation, information on demographics such as age and sex, was obtained. Also
information on etiology of primary kidney disease, history of kidney transplant and diet (see
below), was collected. Information on treatment with medication was obtained from the patient’s
history. Length and weight of the patients was measured and blood samples were taken. Length,
weight and body mass index (BMI) were standardized for age by a standard deviation score
(SDS).
3. Dietary assessment
Dietary potassium and fiber intake were estimated through diet investigations in two different
manners. The first manner was a three day food diary. The patients and/or parents were asked
to fill in a printed diary with different food categories. The diary had to contain everything the
patient ate and drank during the three days preceding the outpatient clinic visit. Quantities were
expressed in tablespoons, glasses, grams, slices, pieces… The second manner was a 24 hours
recall. Ambulatory, the patient and/or parents were asked by a skilled dietician in a structured
way, what the child had eaten and drunk the 24h before consultation. Quantities were estimated
by the portion size book (Valetudo Consulting, third edition, March 2014) such that the patients
could indicate the quantities of their portions by pointing out the corresponding photo.

22
The written quantities were calculated to grams with help of the instruction manual ‘Weights and
measures’ of the High Health Council of Belgium (47). If the product was not described in this
manual, measures were used of the software package for dieticians, Evry-Diëtist 6.7.7.0 (Evry
BV, Alphen aan den Rijn, The Netherlands). If Evry did not contain this information, it was
searched for on the internet.
Dietary potassium and fiber were calculated through Evry by entering all foods and quantities.
For the three day food diaries a mean value for 24 hours was obtained. A coding method was
used for the input of this information. For every food a matching code in Evry was noted. This
made it possible to insert the information quickly. The products that were not available in Evry,
were searched for in the brand name database ‘Internubel’ (Nubel vzw) or in the Dutch nutrient
database (Nevo, 4th edition). If not available there, it was searched for on sites of stores and
nutritional brands themselves. The product was then newly entered in Evry and included in the
coding method. When no amount was mentioned during the diet investigation, a list was used,
which expresses an average weight for each food in the coding method.
Because of the convention from the KDOQI guidelines (8), daily potassium intake was divided by
weight to get a more standardized measure for K+ intake in mg/kg/day. Fiber was corrected for
body surface area (BSA), calculated by the Haycock formula
(=0,024265*(length0,3964)*(weight0,5378)m2) (48). If a patient was on laxatives, this was taken into
account and fiber content was added to the daily fiber intake of the patient. Further, fiber was
also standardized by the percentage dietary reference intake (%DRI) for fiber. This measure
expresses total dietary fiber intake of a patient as a percentage of the age-dependent DRI for
fiber, according to the Belgian nutrition recommendation (table 4) (23).
4. Laboratory analyses Blood samples were centrifuged (2095g, 10min, 4°C) and preserved at a temperature of -80°C
until analysis of the sample. For the small water soluble molecules (creatinine), the protein
albumin and electrolytes (Na+, K+), concentration was analyzed by the laboratories of clinical
biology of UZ Gent and UZA, through standard laboratory techniques.
The updated Schwartz formula (see above) was used to calculate eGFR. For definition of the
CKD stages reference is made to table 2.
5. Statistics Statistical analysis are performed using SPSS version 26. Study population as well as potassium
intake, fiber intake and serum potassium per stage of CKD are described through a cross-
sectional analysis. Normality is checked for by the Shapiro-Wilk test. If data are normally
23
distributed, it is presented as mean ± standard deviation (SD). If data are skewed, it is
expressed as median [25th;75th percentile]. For categorical data, frequencies and percentages
are given.
Height SDS, weight SDS and BMI SDS are compared between the CKD stages by a one-way
ANOVA test. For age and eGFR, a Kruskal-Wallis test is used. Further, fiber intake and serum
K+ concentrations ([K+]s) are compared between the CKD stages by a one-way ANOVA test with
post hoc Tukey comparison. To compare K+ intake between CKD stages, a Kruskal-Wallis test
with post hoc Dunn’s analysis and Bonferroni correction is used.
To study the association between fiber and K+ intake, %DRI fiber is divided into three groups
based on tertiles. These three groups are compared by the Kruskal-Wallis test with Dunn’s post
hoc comparison and Bonferroni correction.
To research the effect of potassium binding resins on [K+]s, a comparison is made between
patients who are on kayexalate and patients who are not. They are matched based on primary
kidney disease and eGFR. Between these matched pairs, K+ intake and [K+]s are compared.
For the association of K+ intake and [K+]s, the cohort is divided in two groups based on the
median K+ intake. Each group is further divided into three, based on CKD stage. An independent
T-test is used to compare [K+]s between high and low K+ intake, for each stage of CKD. To
compare [K+]s between the CKD stages, for either high or low K+ intake, an ANOVA test with
post hoc Tukey analysis is performed. If the assumption of homogeneity of variances is not met,
a Welch test with post hoc Games-Howell comparison is performed instead.
The same method is used to research the association between [K+]s and fiber intake. Except for
CKD stage 1-2, a Mann-Whitney U test is used instead of an independent T-test due to skewed
data.
Statistical significance is set at a 2-tailed probability level of <0,05.
24
Results
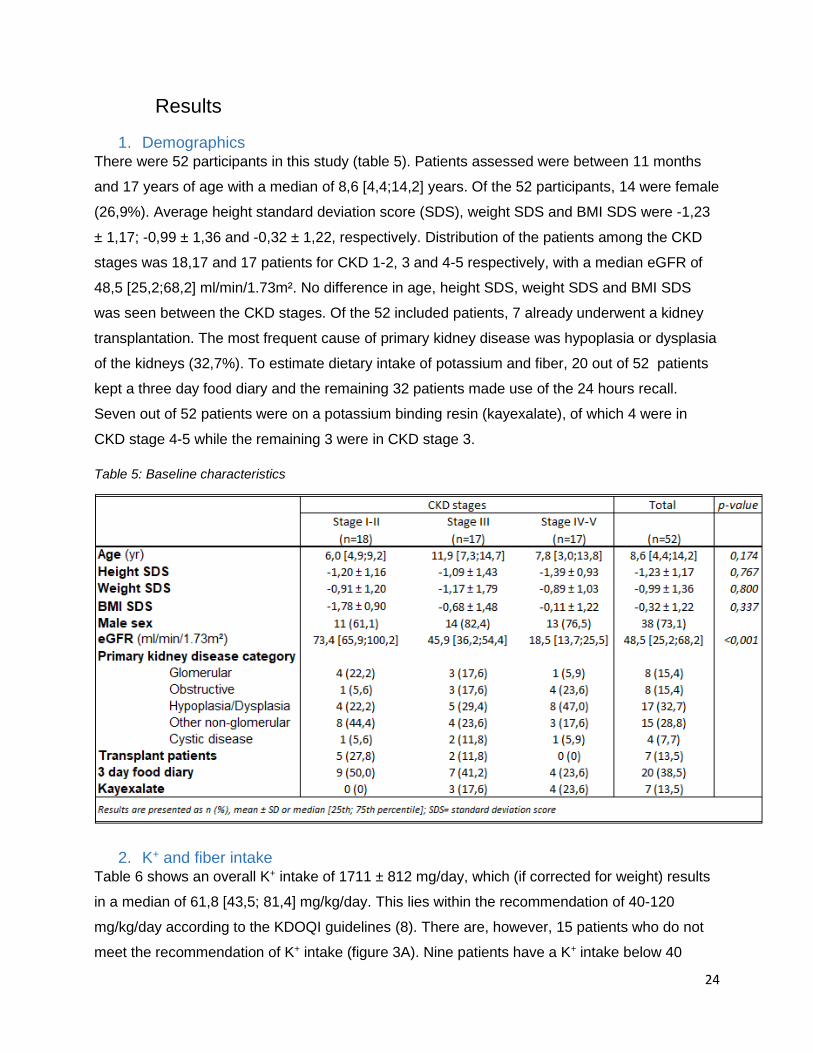
1. Demographics There were 52 participants in this study (table 5). Patients assessed were between 11 months
and 17 years of age with a median of 8,6 [4,4;14,2] years. Of the 52 participants, 14 were female
(26,9%). Average height standard deviation score (SDS), weight SDS and BMI SDS were -1,23
± 1,17; -0,99 ± 1,36 and -0,32 ± 1,22, respectively. Distribution of the patients among the CKD
stages was 18,17 and 17 patients for CKD 1-2, 3 and 4-5 respectively, with a median eGFR of
48,5 [25,2;68,2] ml/min/1.73m². No difference in age, height SDS, weight SDS and BMI SDS
was seen between the CKD stages. Of the 52 included patients, 7 already underwent a kidney
transplantation. The most frequent cause of primary kidney disease was hypoplasia or dysplasia
of the kidneys (32,7%). To estimate dietary intake of potassium and fiber, 20 out of 52 patients
kept a three day food diary and the remaining 32 patients made use of the 24 hours recall.
Seven out of 52 patients were on a potassium binding resin (kayexalate), of which 4 were in
CKD stage 4-5 while the remaining 3 were in CKD stage 3.
Table 5: Baseline characteristics
2. K+ and fiber intake Table 6 shows an overall K+ intake of 1711 ± 812 mg/day, which (if corrected for weight) results
in a median of 61,8 [43,5; 81,4] mg/kg/day. This lies within the recommendation of 40-120
mg/kg/day according to the KDOQI guidelines (8). There are, however, 15 patients who do not
meet the recommendation of K+ intake (figure 3A). Nine patients have a K+ intake below 40
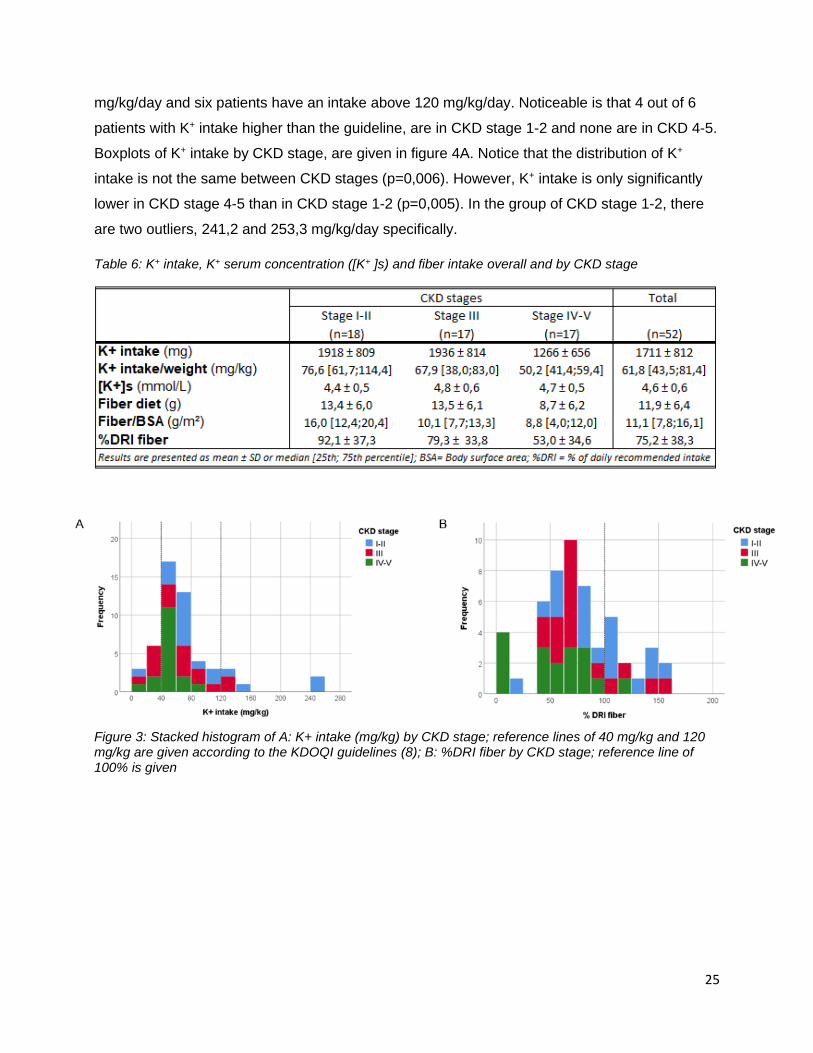
25
mg/kg/day and six patients have an intake above 120 mg/kg/day. Noticeable is that 4 out of 6
patients with K+ intake higher than the guideline, are in CKD stage 1-2 and none are in CKD 4-5.
Boxplots of K+ intake by CKD stage, are given in figure 4A. Notice that the distribution of K+
intake is not the same between CKD stages (p=0,006). However, K+ intake is only significantly
lower in CKD stage 4-5 than in CKD stage 1-2 (p=0,005). In the group of CKD stage 1-2, there
are two outliers, 241,2 and 253,3 mg/kg/day specifically.
Table 6: K+ intake, K+ serum concentration ([K+ ]s) and fiber intake overall and by CKD stage
Figure 3: Stacked histogram of A: K+ intake (mg/kg) by CKD stage; reference lines of 40 mg/kg and 120 mg/kg are given according to the KDOQI guidelines (8); B: %DRI fiber by CKD stage; reference line of 100% is given
26
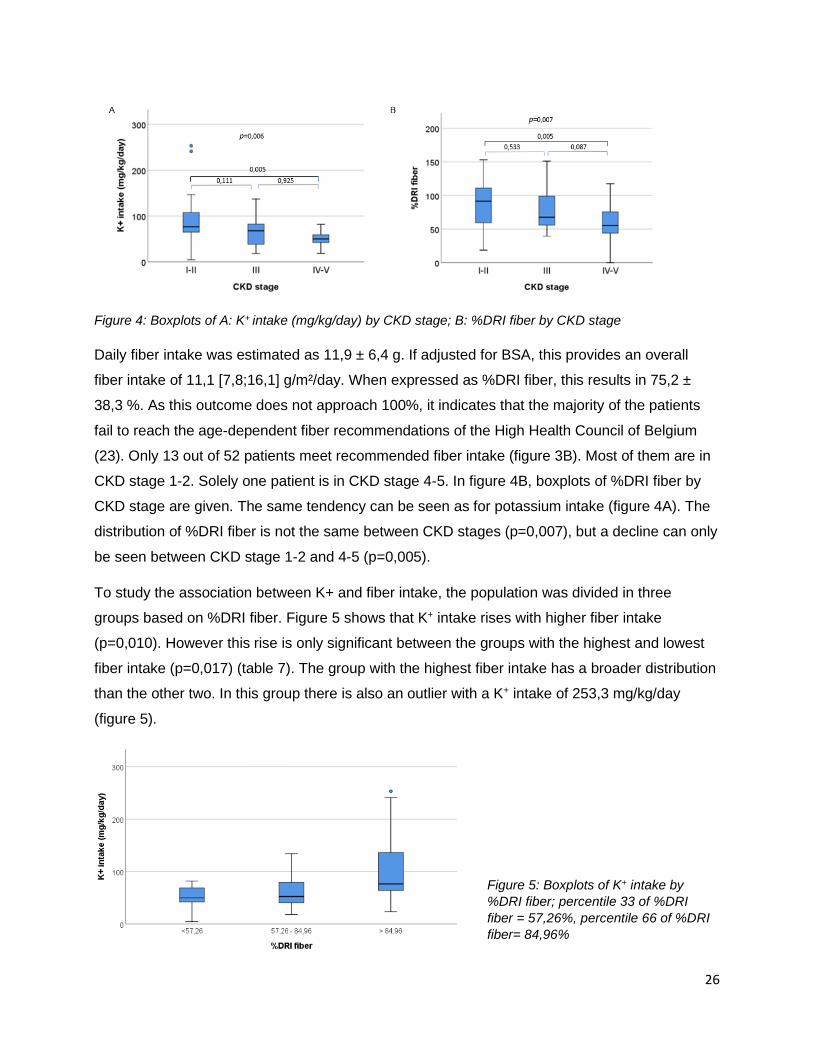
Figure 4: Boxplots of A: K+ intake (mg/kg/day) by CKD stage; B: %DRI fiber by CKD stage
Daily fiber intake was estimated as 11,9 ± 6,4 g. If adjusted for BSA, this provides an overall
fiber intake of 11,1 [7,8;16,1] g/m²/day. When expressed as %DRI fiber, this results in 75,2 ±
38,3 %. As this outcome does not approach 100%, it indicates that the majority of the patients
fail to reach the age-dependent fiber recommendations of the High Health Council of Belgium
(23). Only 13 out of 52 patients meet recommended fiber intake (figure 3B). Most of them are in
CKD stage 1-2. Solely one patient is in CKD stage 4-5. In figure 4B, boxplots of %DRI fiber by
CKD stage are given. The same tendency can be seen as for potassium intake (figure 4A). The
distribution of %DRI fiber is not the same between CKD stages (p=0,007), but a decline can only
be seen between CKD stage 1-2 and 4-5 (p=0,005).
To study the association between K+ and fiber intake, the population was divided in three
groups based on %DRI fiber. Figure 5 shows that K+ intake rises with higher fiber intake
(p=0,010). However this rise is only significant between the groups with the highest and lowest
fiber intake (p=0,017) (table 7). The group with the highest fiber intake has a broader distribution
than the other two. In this group there is also an outlier with a K+ intake of 253,3 mg/kg/day
(figure 5).
Figure 5: Boxplots of K+ intake by
%DRI fiber; percentile 33 of %DRI
fiber = 57,26%, percentile 66 of %DRI
fiber= 84,96%

27
Table 7: K+ intake by %DRI fiber
3. Serum K+ concentration and impact of potassium binding resins The mean K+ serum concentration [K+]s in this population is 4,6 ± 0,6 mmol/L (table 6). This fits
within the reference values of 3,5-5,5 mmol/L for [K+]s in adults and children (neonates
excluded). Only five patients did not meet these reference values. One patient from CKD stage
1-2 had a [K+]s of 3,3 mmol/L and four patients of CKD stage 3 had a [K+]s of more than 5,5
mmol/L (figure 6).
Figure 6: Stacked histogram of [K+]s (mmol/L) by CKD stage, reference lines of 3,5 and 5,5 mmol/L are
given
Figure 7 shows that there is a significant difference in serum [K+] between the CKD stages
(p=0,041). However, no significant difference can be seen between CKD stage 3 and 4-5
(p=0,816), nor between CKD stage 1-2 and 4-5 (p=0,156). CKD stage 3 has a significantly
higher [K+]s than CKD stage 1-2 (p=0,042).
28
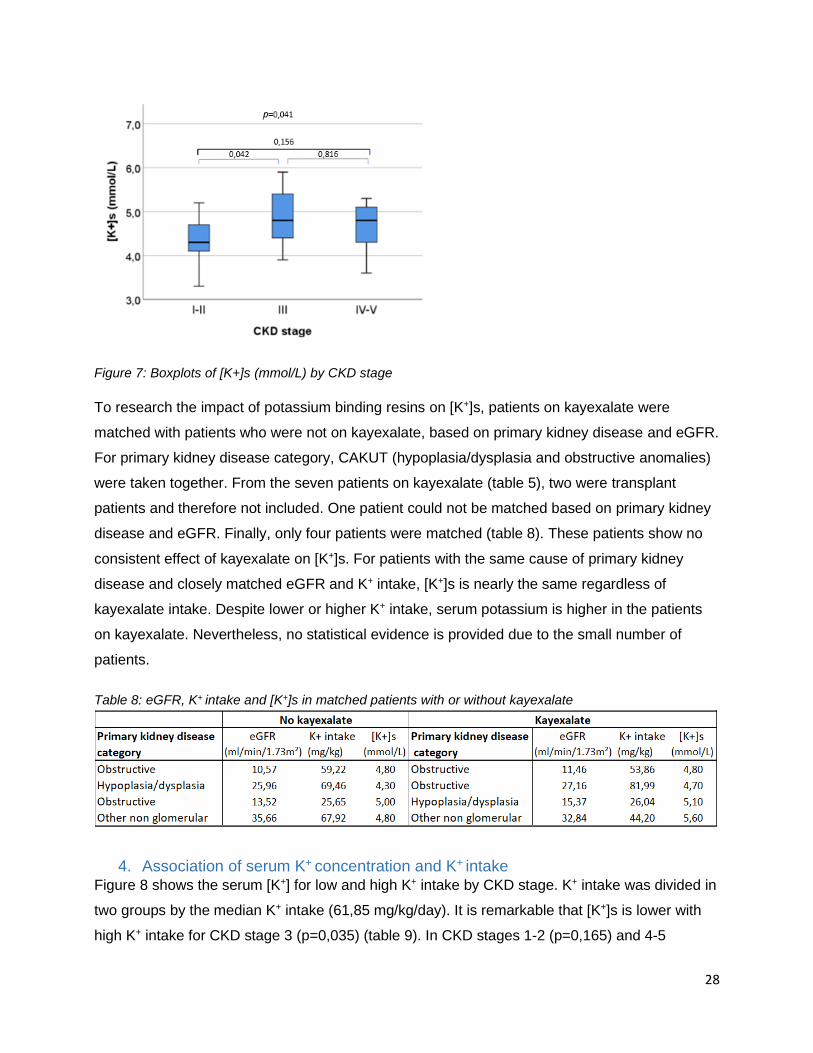
Figure 7: Boxplots of [K+]s (mmol/L) by CKD stage
To research the impact of potassium binding resins on [K+]s, patients on kayexalate were
matched with patients who were not on kayexalate, based on primary kidney disease and eGFR.
For primary kidney disease category, CAKUT (hypoplasia/dysplasia and obstructive anomalies)
were taken together. From the seven patients on kayexalate (table 5), two were transplant
patients and therefore not included. One patient could not be matched based on primary kidney
disease and eGFR. Finally, only four patients were matched (table 8). These patients show no
consistent effect of kayexalate on [K+]s. For patients with the same cause of primary kidney
disease and closely matched eGFR and K+ intake, [K+]s is nearly the same regardless of
kayexalate intake. Despite lower or higher K+ intake, serum potassium is higher in the patients
on kayexalate. Nevertheless, no statistical evidence is provided due to the small number of
patients.
Table 8: eGFR, K+ intake and [K+]s in matched patients with or without kayexalate
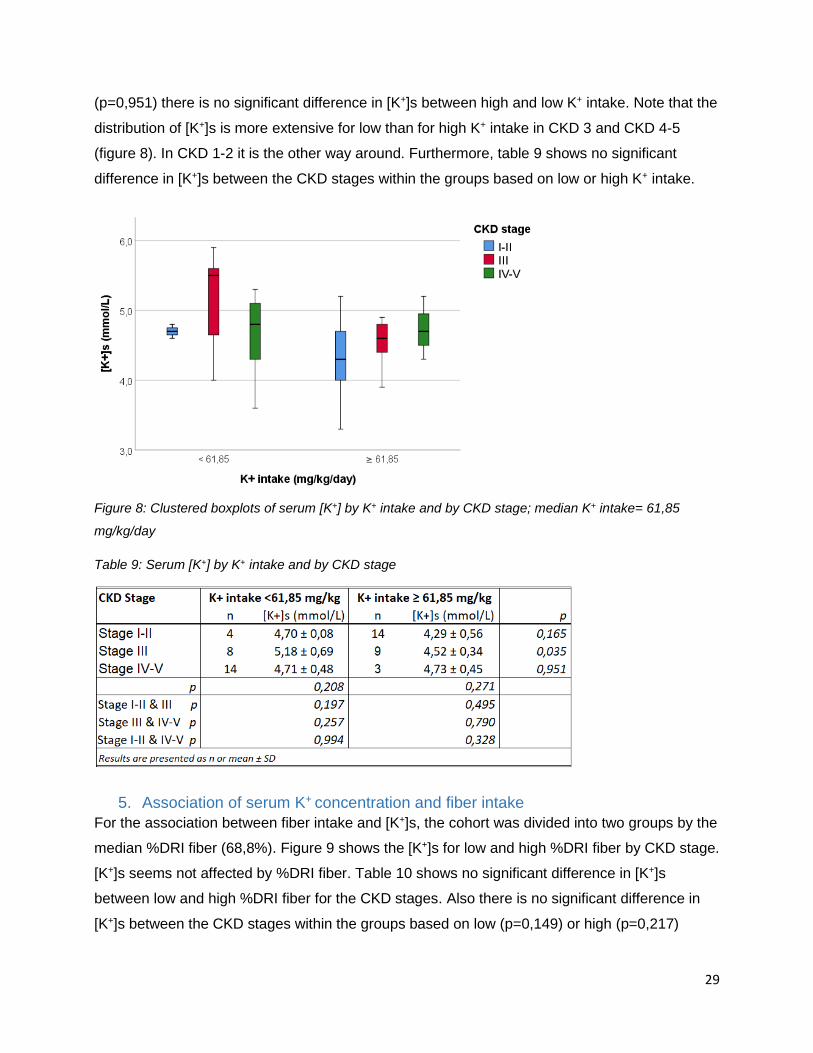
4. Association of serum K+ concentration and K+ intake Figure 8 shows the serum [K+] for low and high K+ intake by CKD stage. K+ intake was divided in
two groups by the median K+ intake (61,85 mg/kg/day). It is remarkable that [K+]s is lower with
high K+ intake for CKD stage 3 (p=0,035) (table 9). In CKD stages 1-2 (p=0,165) and 4-5
29
(p=0,951) there is no significant difference in [K+]s between high and low K+ intake. Note that the
distribution of [K+]s is more extensive for low than for high K+ intake in CKD 3 and CKD 4-5
(figure 8). In CKD 1-2 it is the other way around. Furthermore, table 9 shows no significant
difference in [K+]s between the CKD stages within the groups based on low or high K+ intake.
Figure 8: Clustered boxplots of serum [K+] by K+ intake and by CKD stage; median K+ intake= 61,85
mg/kg/day
Table 9: Serum [K+] by K+ intake and by CKD stage
5. Association of serum K+ concentration and fiber intake
For the association between fiber intake and [K+]s, the cohort was divided into two groups by the
median %DRI fiber (68,8%). Figure 9 shows the [K+]s for low and high %DRI fiber by CKD stage.
[K+]s seems not affected by %DRI fiber. Table 10 shows no significant difference in [K+]s
between low and high %DRI fiber for the CKD stages. Also there is no significant difference in
[K+]s between the CKD stages within the groups based on low (p=0,149) or high (p=0,217)

30
%DRI fiber. In the group of CKD stage 1-2 with low %DRI fiber, there is an outlier with a [K+]s of
3,3 mmol/L (figure 9).
Figure 9: Clustered boxplots of serum [K+] by %DRI fiber and by CKD stage; median %DRI fiber = 68,8%
Table 10: [K+]s by %DRI fiber and by CKD stage
31
Discussion
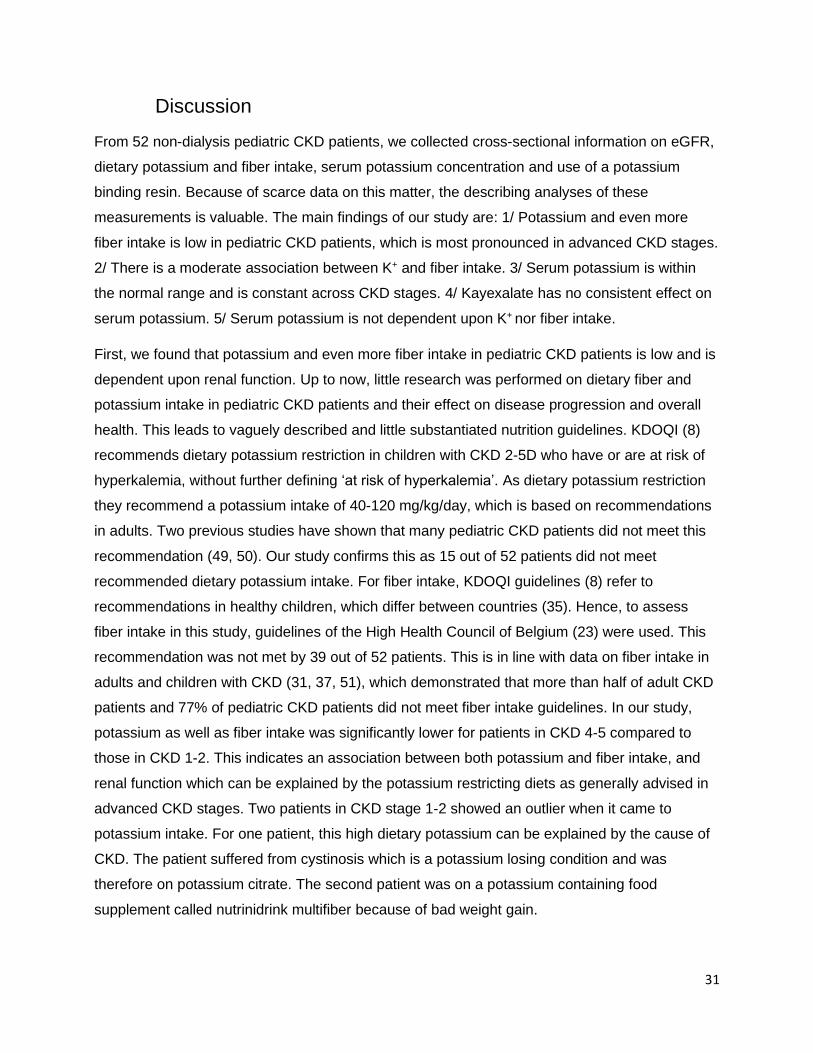
From 52 non-dialysis pediatric CKD patients, we collected cross-sectional information on eGFR,
dietary potassium and fiber intake, serum potassium concentration and use of a potassium
binding resin. Because of scarce data on this matter, the describing analyses of these
measurements is valuable. The main findings of our study are: 1/ Potassium and even more
fiber intake is low in pediatric CKD patients, which is most pronounced in advanced CKD stages.
2/ There is a moderate association between K+ and fiber intake. 3/ Serum potassium is within
the normal range and is constant across CKD stages. 4/ Kayexalate has no consistent effect on
serum potassium. 5/ Serum potassium is not dependent upon K+ nor fiber intake.
First, we found that potassium and even more fiber intake in pediatric CKD patients is low and is
dependent upon renal function. Up to now, little research was performed on dietary fiber and
potassium intake in pediatric CKD patients and their effect on disease progression and overall
health. This leads to vaguely described and little substantiated nutrition guidelines. KDOQI (8)
recommends dietary potassium restriction in children with CKD 2-5D who have or are at risk of
hyperkalemia, without further defining ‘at risk of hyperkalemia’. As dietary potassium restriction
they recommend a potassium intake of 40-120 mg/kg/day, which is based on recommendations
in adults. Two previous studies have shown that many pediatric CKD patients did not meet this
recommendation (49, 50). Our study confirms this as 15 out of 52 patients did not meet
recommended dietary potassium intake. For fiber intake, KDOQI guidelines (8) refer to
recommendations in healthy children, which differ between countries (35). Hence, to assess
fiber intake in this study, guidelines of the High Health Council of Belgium (23) were used. This
recommendation was not met by 39 out of 52 patients. This is in line with data on fiber intake in
adults and children with CKD (31, 37, 51), which demonstrated that more than half of adult CKD
patients and 77% of pediatric CKD patients did not meet fiber intake guidelines. In our study,
potassium as well as fiber intake was significantly lower for patients in CKD 4-5 compared to
those in CKD 1-2. This indicates an association between both potassium and fiber intake, and
renal function which can be explained by the potassium restricting diets as generally advised in
advanced CKD stages. Two patients in CKD stage 1-2 showed an outlier when it came to
potassium intake. For one patient, this high dietary potassium can be explained by the cause of
CKD. The patient suffered from cystinosis which is a potassium losing condition and was
therefore on potassium citrate. The second patient was on a potassium containing food
supplement called nutrinidrink multifiber because of bad weight gain.

32
Second, an association was found between potassium and fiber intake. Potassium intake was
significantly higher in the group with high fiber intake compared to low fiber intake. This could
explain low fiber intake in advanced CKD stages due to potassium restricting diets. No
significant difference in K+ intake was seen between moderate and low fiber intake or moderate
and high fiber intake. The fact that not all foods rich in potassium are rich in fiber and vice-versa
might skew the association.
Third, we found that [K+]s was within the normal range and constant across CKD stages. For 47
out of 52 patients in our cohort, [K+]s was within the normal range of 3,5 to 5,5 mmol/L. In CKD 3
[K+]s was significantly higher than in CKD 1-2. Although not significant, mean [K+]s was higher in
CKD 3 than in CKD 4-5, which is surprising as renal K+ excretion lowers with decreasing eGFR
(52). These results could be explained by the fact that all four of the patients with hyperkalemia
were in CKD stage 3. Two of them were transplant patients and therefore were on tacrolimus,
which decreases K+ excretion. This could explain hyperkalemia in these patients. No explanation
for hyperkalemia in the other two patients, was found.
Fourth, we found no consistent effect of the potassium binding resin kayexalate on [K+]s.
Efficacy and safety of sodium polystyrene sulfonate (kayexalate) is disputed. No robust
randomized controlled clinical trials on long term use of this product are available. There are only
some trials in adult CKD patients which show a lowering effect of kayexalate on [K+]s. Though,
these trials were of short duration and operated with small sample sizes (53-55). One long-term
study showed a fall in [K+]s after 289 months of low dose kayexalate therapy in adult patients on
renin-angiotensin-aldosterone system inhibitors for heart disease (53). Contradictory, one
placebo controlled trial showed no difference in [K+]s and fecal potassium excretion after
kayexalate intake in ESKD patients on hemodialysis (53). With the use of kayexalate, many
adverse effects among which bowel obstruction, intestinal necrosis, electrolyte disturbances and
nausea are described (53-55). In our cohort, neither a difference in [K+]s nor a lower [K+]s in
patients on kayexalate was seen, but no statistical evidence is provided due to small sample
size. The fact that only patients whose baseline [K+]s is high and thus are at risk of
hyperkalemia, are prescribed kayexalate, influences the result. Efficacy of potassium binding
resins is an important matter because intake of chronic medication increases the pill burden,
which is already high in pediatric CKD patients (41-43). Consequently, this could impact QoL of
these patients. Therefore, randomized double-blind controlled trials in patients with marginally
elevated serum potassium and not at risk for acute hyperkalemia, are necessary to research
efficacy, safety and impact on QoL of chronic potassium binding resins in pediatric CKD
patients.
33
Further, our study has shown no influence of K+ intake on [K+]s. The impact of dietary potassium
restriction has been increasingly questioned due to the many potential health benefits of plant-
based foods and fibers (figure 2) (25, 26). It also has an important impact on everyday life of
pediatric CKD patients as potassium restricting diets are strict and difficult to follow. It is often
reported that children experience dietary restrictions as a nuisance (42, 43). A trial by Aparicio-
López et al. (41) showed that 58% of the children on diet restrictions are bothered by them.
Therefore we may assume that potassium restriction could influence QoL of these patients,
however no evidence on this matter is provided. As with the use of potassium binding resins,
potassium restricting diets are based on the assumption that potassium intake and absorption
are important determinants of [K+]s in CKD patients. However, only two trials described a rather
weak association between dietary potassium intake and pre-dialysis serum potassium in adult
hemodialysis patients (25, 39). A recent meta-analysis did show a decline in [K+]s in adult CKD
patients on a potassium restricting diet, but this result was based on very-low-quality evidence
(40). No research on this matter in a pediatric CKD population is published, according to our
knowledge. Thus, our study is the first to describe the association between potassium intake and
[K+]s in pediatric CKD patients. No impact of K+ intake on [K+]s was seen in CKD stages 1-2 and
4-5. Rather unexpectedly, a significantly lower [K+]s was seen with high K+ intake in CKD stage
3. This paradoxical result could emerge from the fact that all four hyperkalemic patients of CKD
stage 3 had low potassium intake. Also, [K+]s did not differ between the CKD stages within the
groups of low or high K+ intake. But [K+]s did slightly differ between CKD stages when potassium
intake was not considered. This could thus be interpreted as a trend for an inverse association of
K+ intake and [K+]s. It raises the question of what came first. It can be presumed that patients
with high [K+]s are more frequently recommended to follow a potassium restricting diet. As [K+]s
is not significantly lower in patients on potassium restriction the role of dietary potassium in [K+]s
could be questioned. As mentioned in the introduction, [K+]s is mediated by a variety of
determinants among which acidosis, aldosterone, vasopressin, epinephrine, insulin, medication,
eGFR and potassium intake. Down to an eGFR of approximately 15 mL/min/1.73m², [K+]s
homeostasis is provided by the kidney. When hyperkalemia arises in these patients, it will more
likely be controlled by determinants apart from potassium intake, as large amounts of dietary
potassium are needed to provoke hyperkalemia. In patients with eGFR <15 mL/min/1.73m²,
[K+]s is more affected by potassium intake (52). Because of this, a prudent interpretation of our
results is necessary. Only three patients of CKD stage 4-5 had a high potassium intake and they
all had an eGFR >15 mL/min/1.73m².

34
At last, our study has shown no association between fiber intake and [K+]s. Dietary fiber has
shown to provide multiple health beneficial effects. In healthy adults, fiber intake is associated
with a reduced cardiovascular risk (32-36). In adult CKD patients it reduces inflammation,
cholesterol, uremic toxin concentrations and mortality (figure 2) (20, 28, 30, 31, 51, 56-58). It
also reduces serum creatinine and is found to be renoprotective (27, 28, 30, 31, 56, 57, 59). Yet,
general fiber intake is low in CKD patients, especially in patients on dietary potassium restriction
due to the positive association of fiber and K+ intake. In the first place, low fiber intake might
affect QoL of CKD patients. Due to low dietary fiber, they miss out on many of the health
beneficial effects. For example, a common problem in CKD patients is constipation, which can
be a side-effect of low fiber intake. QoL of these patients may thus be affected by the lack of
fiber-associated health benefits, due to potassium restriction. However, there is little clinical
evidence on the efficacy of dietary potassium restriction in pediatric CKD patients and no long
term data on overall health are available. This may be the reason for the absence of adjusted
fiber intake guidelines in pediatric CKD patients. Secondly, low fiber intake might influence [K+]s
in CKD patients. Sufficient dietary fiber intake reduces metabolic acidosis and increases fecal
excretion in adult CKD patients, which both can affect [K+]s (figure 2) (27, 29-31, 52, 58).
Potassium in high-fiber foods also has a lower bioavailability and potentially promotes
intracellular potassium distribution by a stimulating effect of fiber on alkaline and insulin (28, 29).
From this we could figure that dietary fiber potentially lowers [K+]s in CKD patients. This could
contribute to the negative association found between K+ intake and [K+]s in CKD stage 3 in our
cohort. Literature describes varying results on the association between fiber intake and [K+]s.
Tyson et al. (60) described a small increase in [K+]s after two weeks of Dietary Approaches to
Stop Hypertension (DASH), which is full of fiber, in adult patients with CKD stage 3. A trial by
Goraya et al. (27) showed no increase in [K+]s in adult CKD stage 4 patients with increased fruit
and vegetable consumption for one year. The latter is in line with our results. No association
between fiber intake and [K+]s was seen. This result may be biased by the small range of fiber
intake in our cohort, which is a consequence of low general fiber intake in pediatric CKD
patients.
The value of our study lies within the presented data on potassium and fiber intake and their
association with [K+]s. Data on fiber and potassium intake in pediatric CKD patients is scarce
and to our knowledge, we are the first to describe their association with [K+]s in these patients.
A big strength of our study is the detailed quantification of dietary intake. Data on potassium and
fiber intake were obtained through 3-day food diaries or 24 hours recall. This is more precise
than the frequently used food frequency questionnaires because recall bias is reduced.
35
Limitations of our study lie within the observational, cross-sectional design, the small sample
size and the dietary quantification method. The observational, cross-sectional design of the
study makes it difficult to assess causality, as no intervention is performed, regarding the impact
of kayexalate, potassium restriction and fiber intake on [K+]s. Another restriction is the rather
small sample size of 52 pediatric CKD patients. Despite the strength of detailed quantification of
dietary intake, this method carries the constitutional risk of over- and underreporting potassium
and fiber intake. Of the study population, 38,5% kept a 3 day food diary. Preferably this
proportion should be larger to reduce daily variability. Seasonal variation was also not taken into
account as the baseline was spread throughout the year. For 35 out of 52 patients, dietary
anamnesis was performed during winter months (October-March), which may lead to lower
reported fiber intake as fewer plant-based foods are consumed during winter. Ideally the
measurement would be performed several times throughout the year to get a global view on
dietary fiber and potassium intake of a patient. Another limitation is the lack of information on
fiber type and source. This can be important due to changing properties in different fiber types.
Considering that even healthy children and adults fail to meet recommendations (36), we
focused on total dietary fiber intake.
Conclusion
This study shows that fiber intake in non-dialysis pediatric CKD patients does not meet the
nutrition guidelines as set for healthy children. Especially with advanced CKD, fiber intake was
low. A moderate association is observed between potassium and fiber intake and no consistent
effect of the potassium binding resin kayexalate on serum potassium could be demonstrated. No
influence of potassium intake nor fiber intake is seen on serum potassium. Except for CKD stage
3 where an inverse relation of potassium intake and serum potassium is described. These
incoherent results suggest that there are other important determinants of serum potassium. As
our study is first to examine this association, present findings are exploratory. Subsequent
research is necessary to validate these hypotheses and identify other determinants of serum
potassium, bearing in mind the difference between CKD stages. Dietary potassium restriction
stays a prudent approach to reduce risk of hyperkalemia in non-dialysis pediatric CKD patients,
especially in patients of CKD 5. Despite, more attention towards fiber intake and validated
nutrition guidelines are needed. As potassium restricting diets in pediatric CKD patients are
widely used but little substantiated, further research on the efficacy, safety and impact on QoL is
needed. Also research on the efficacy and safety of potassium binding resins in pediatric CKD
patients is necessary. The ultimate aim is to provide optimal care and improve QoL of patients
with regard to dietary restrictions and medication burden.

36
References 1. Yaqoob MM, Ashman N. Kidney and urinary tract disease. In: Kumar P, Clark M, editors. Kumar & Clark's Clinical Medicine. 9th ed. London: Elsevier; 2017. p. 723-93. 2. Giebisch G, Windhager E. Section VI The urinary system. In: Boron WF, Boulpaep EL, editors. Medical physiology: a cellular and molecular approach. 2nd ed. Philadelphia: Saunders Elsevier; 2012. p. 747-880. 3. Rennke HG, Denker BM. Renal Pathophysiology: the essentials. 4th ed. Philadelphia: Wolters Kluwer; 2014. 4. Jayaraman R, Van der Voort J. Principles of management of chronic kidney disease. Paediatrics and Child Health. 2010;20(6):291-6. 5. Akchurin OM. Chronic Kidney Disease and Dietary Measures to Improve Outcomes. Pediatr Clin North Am. 2019;66(1):247-67. 6. Mian AN, Schwartz GJ. Measurement and Estimation of Glomerular Filtration Rate in Children. Adv Chronic Kidney Dis. 2017;24(6):348-56. 7. Palaka E, Grandy S, Darlington O, McEwan P, van Doornewaard A. Associations between serum potassium and adverse clinical outcomes: a systematic literature review. Int J Clin Pract2019. 8. National Kidney Foundation. KDOQI Clinical Practice Guideline for Nutrition in Children with CKD: 2008 Update. Am J Kidney Dis. 2009;53(3 Suppl 2):S1-S124. 9. Inker LA, Astor BC, Fox CH, Isakova T, Lash JP, Peralta CA, et al. KDOQI US Commentary on the 2012 KDIGO Clinical Practice Guideline for the Evaluation and Management of CKD. Am J Kidney Dis. 2014;63(5):713-35. 10. Sinha R. Chronic kidney disease in paediatric population. Clinical Queries: Nephrology. 2013;2(3):107-15. 11. National Kidney Foundation. K/DOQI clinical practice guidelines for chronic kidney disease: evaluation, classification, and stratification. Am J Kidney Dis. 2002;39(2 Suppl 1):S1-S266. 12. Kogon AJ, Harshman LA. Chronic Kidney Disease: Treatment of Comorbidities I (Nutrition, Growth, Neurocognitive Function, and Mineral Bone Disease). Current Treatment Options in Pediatrics. 2019;5(2):78-92. 13. Kaspar CD, Bholah R, Bunchman TE. A Review of Pediatric Chronic Kidney Disease. Blood Purif. 2016;41(1-3):211-7. 14. Harmer M, Wootton S, Gilbert R, Anderson C. Association of nutritional status and health-related quality of life in children with chronic kidney disease. Quality of Life Research. 2019;28(6):1565-73. 15. Harambat J, van Stralen KJ, Kim JJ, Tizard EJ. Epidemiology of chronic kidney disease in children. Pediatr Nephrol. 2012;27(3):363-73. 16. Misurac J. Chronic kidney disease in the neonate: etiologies, management, and outcomes. Seminars in Fetal and Neonatal Medicine. 2017;22(2):98-103. 17. Moxey-Mims M. Kidney Disease in African American Children: Biological and Nonbiological Disparities. Am J Kidney Dis. 2018;72(5 Suppl 1):s17-s21. 18. Wong CS, Warady BA, Srivastava T. Clinical presentation and evaluation of chronic kidney disease in children 2018 [Available from: https://www.uptodate.com/contents/clinical-presentation-and-evaluation-of-chronic-kidney-disease-in-children#H8120163. 19. Chand DH, Valentini RP. Chronic Kidney Disease: Treatment of Comorbidities II (Hypertension, Anemia, and Electrolyte Management). Current Treatment Options in Pediatrics. 2019;5(2):93-101. 20. Camerotto C, Cupisti A, D'Alessandro C, Muzio F, Gallieni M. Dietary Fiber and Gut Microbiota in Renal Diets. Nutrients. 2019;11(9). 21. WHO. Guideline: Potassium intake for adults and children Geneva: World Health Organization (WHO); 2012. 22. EFSA. Dietary reference value: advice on potassium: European Food Safety Authority (EFSA); 2016 [Available from: https://www.efsa.europa.eu/en/press/news/161025. 23. HGR. Voedingsaanbevelingen voor België. Brussel: Hoge Gezondheidsraad (HGR); 2016. 24. Nguyen L, Levitt R, Mak RH. Practical nutrition management of children with chronic kidney disease. Clinical Medicine Insights: Urology. 2016;9:1-6. 25. St-Jules DE, Goldfarb DS, Sevick MA. Nutrient Non-equivalence: Does Restricting High-Potassium Plant Foods Help to Prevent Hyperkalemia in Hemodialysis Patients? J Ren Nutr. 2016;26(5):282-7.
37
26. Cases A, Cigarran-Guldris S, Mas S, Gonzalez-Parra E. Vegetable-Based Diets for Chronic Kidney Disease? It Is Time to Reconsider. Nutrients. 2019;11(6). 27. Goraya N, Simoni J, Jo C-H, Wesson DE. A Comparison of Treating Metabolic Acidosis in CKD Stage 4 Hypertensive Kidney Disease with Fruits and Vegetables or Sodium Bicarbonate. Clin J Am Soc Nephrol. 2013;8(3):371-81. 28. Chiavaroli L, Mirrahimi A, Sievenpiper JL, Jenkins DJ, Darling PB. Dietary fiber effects in chronic kidney disease: a systematic review and meta-analysis of controlled feeding trials. Eur J Clin Nutr. 2015;69(7):761-8. 29. Clegg DJ, Hill Gallant KM. Plant-Based Diets in CKD. Clin J Am Soc Nephrol. 2019;14(1):141-3. 30. Cupisti A, Brunori G, Di Iorio BR, D'Alessandro C, Pasticci F, Cosola C, et al. Nutritional treatment of advanced CKD: twenty consensus statements. J Nephrol. 2018;31(4):457-73. 31. Sabatino A, Regolisti G, Gandolfini I, Delsante M, Fani F, Gregorini MC, et al. Diet and enteral nutrition in patients with chronic kidney disease not on dialysis: a review focusing on fat, fiber and protein intake. J Nephrol. 2017;30(6):743-54. 32. Bazzano LA, He J, Ogden LG, Loria CM, Whelton PK. Dietary fiber intake and reduced risk of coronary heart disease in US men and women: The National Health and Nutrition Examination Survey I Epidemiologic Follow-up Study. Archives of Internal Medicine. 2003;163(16):1897-904. 33. Threapleton DE, Greenwood DC, Evans CE, Cleghorn CL, Nykjaer C, Woodhead C, et al. Dietary fibre intake and risk of cardiovascular disease: systematic review and meta-analysis. Bmj. 2013;347:f6879. 34. American Dietetic Association. Position of the American Dietetic Association: Health Implications of Dietary Fiber. Journal of the American Dietetic Association. 2008;108(10):1716-31. 35. Stephen AM, Champ MMJ, Cloran SJ, Fleith M, van Lieshout L, Mejborn H, et al. Dietary fibre in Europe: current state of knowledge on definitions, sources, recommendations, intakes and relationships to health. Nutrition Research Reviews. 2017;30(2):149-90. 36. Soliman GA. Dietary Fiber, Atherosclerosis, and Cardiovascular Disease. Nutrients. 2019;11(5):1155. 37. El Amouri A, Snauwaert E, Foulon A, Vande Moortel C, Van Dyck M, Van Hoeck K, et al. Dietary fibre intake is low in paediatric CKD patients but its impact on levels of gut-derived uraemic toxins remains uncertain. Pediatr Nephrol2020. 38. Sinha AD, Agarwal R. Chronic renal disease progression: treatment strategies and potassium intake. Semin Nephrol. 2013;33(3):290-9. 39. Noori N, Kalantar-Zadeh K, Kovesdy CP, Murali SB, Bross R, Nissenson AR, et al. Dietary potassium intake and mortality in long-term hemodialysis patients. Am J Kidney Dis. 2010;56(2):338-47. 40. Morris A, Krishnan N, Kimani PK, Lycett D. Effect of Dietary Potassium Restriction on Serum Potassium, Disease Progression, and Mortality in Chronic Kidney Disease: A Systematic Review and Meta-Analysis. Journal of Renal Nutrition. 2020;30(4):276-85. 41. Aparicio-López C, Fernández-Escribano A, Garrido-Cantanero G, Luque-de Pablos A, Izquierdo-García E. The influence of clinical situation on health-related quality of life in paediatric chronic kidney disease patients. Nefrologia. 2013;33(1):61-9. 42. Gutman T, Hanson CS, Bernays S, Craig JC, Sinha A, Dart A, et al. Child and Parental Perspectives on Communication and Decision Making in Pediatric CKD: A Focus Group Study. Am J Kidney Dis. 2018;72(4):547-59. 43. Hanson CS, Gutman T, Craig JC, Bernays S, Raman G, Zhang Y, et al. Identifying Important Outcomes for Young People With CKD and Their Caregivers: A Nominal Group Technique Study. American Journal of Kidney Diseases. 2019;74(1):82-94. 44. Tong A, Wong G, McTaggart S, Henning P, Mackie F, Carroll RP, et al. Quality of life of young adults and adolescents with chronic kidney disease. J Pediatr. 2013;163(4):1179-85. 45. Gerson AC, Wentz A, Abraham AG, Mendley SR, Hooper SR, Butler RW, et al. Health-related quality of life of children with mild to moderate chronic kidney disease. Pediatrics. 2010;125(2):e349-57. 46. McKenna AM, Keating LE, Vigneux A, Stevens S, Williams A, Geary DF. Quality of life in children with chronic kidney disease-patient and caregiver assessments. Nephrol Dial Transplant. 2006;21(7):1899-905. 47. HGR. Maten en gewichten: Handleiding voor een gestandaardiseerde kwantificering van voedingsmiddelen. Brussel: Hoge Gezondheidsraad (HGR); 2005. 48. Haycock GB, Schwartz GJ, Wisotsky DH. Geometric method for measuring body surface area: a height-weight formula validated in infants, children, and adults. J Pediatr. 1978;93(1):62-6.
38
49. Chen W, Ducharme-Smith K, Davis L, Hui WF, Warady BA, Furth SL, et al. Dietary sources of energy and nutrient intake among children and adolescents with chronic kidney disease. Pediatr Nephrol. 2017;32(7):1233-41. 50. Kim H, Lim H, Choue R. Compromised Diet Quality is Associated with Decreased Renal Function in Children with Chronic Kidney Disease. Clin Nutr Res. 2014;3(2):142-9. 51. Krishnamurthy VM, Wei G, Baird BC, Murtaugh M, Chonchol MB, Raphael KL, et al. High dietary fiber intake is associated with decreased inflammation and all-cause mortality in patients with chronic kidney disease. Kidney Int. 2012;81(3):300-6. 52. Lehnhardt A, Kemper MJ. Pathogenesis, diagnosis and management of hyperkalemia. Pediatr Nephrol. 2011;26(3):377-84. 53. Sterns RH, Grieff M, Bernstein PL. Treatment of hyperkalemia: something old, something new. Kidney Int. 2016;89(3):546-54. 54. Parks M, Grady D. Sodium Polystyrene Sulfonate for Hyperkalemia. JAMA Internal Medicine. 2019;179(8):1023-4. 55. Beccari MV, Meaney CJ. Clinical utility of patiromer, sodium zirconium cyclosilicate, and sodium polystyrene sulfonate for the treatment of hyperkalemia: an evidence-based review. Core Evid. 2017;12:11-24. 56. Xu H, Huang X, Risérus U, Krishnamurthy VM, Cederholm T, Ärnlöv J, et al. Dietary Fiber, Kidney Function, Inflammation, and Mortality Risk. Clin J Am Soc Nephrol. 2014;9(12):2104-10. 57. Lu L, Huang YF, Wang MQ, Chen DX, Wan H, Wei LB, et al. Dietary fiber intake is associated with chronic kidney disease (CKD) progression and cardiovascular risk, but not protein nutritional status, in adults with CKD. Asia Pac J Clin Nutr. 2017;26(4):598-605. 58. Salmean YA, Zello GA, Dahl WJ. Foods with added fiber improve stool frequency in individuals with chronic kidney disease with no impact on appetite or overall quality of life. BMC Research Notes. 2013;6(1):510. 59. Goraya N, Simoni J, Jo CH, Wesson DE. Treatment of metabolic acidosis in patients with stage 3 chronic kidney disease with fruits and vegetables or oral bicarbonate reduces urine angiotensinogen and preserves glomerular filtration rate. Kidney Int. 2014;86(5):1031-8. 60. Tyson CC, Lin P-H, Corsino L, Batch BC, Allen J, Sapp S, et al. Short-term effects of the DASH diet in adults with moderate chronic kidney disease: a pilot feeding study. Clinical Kidney Journal. 2016;9(4):592-8.