High-affinity potassium and sodium transport systems in plants
Upload
independentCategory
view
2download
0
Changes in Serum Potassium MediateThiazide-Induced Diabetes
Tariq Shafi, Lawrence J. Appel, Edgar R. Miller, III, Michael J. Klag, Rulan S. Parekh
Abstract—Thiazides, recommended as first-line antihypertensive therapy, are associated with an increased risk of diabetes.Thiazides also lower serum potassium. To determine whether thiazide-induced diabetes is mediated by changes inpotassium, we analyzed data from 3790 nondiabetic participants in the Systolic Hypertension in Elderly Program, arandomized clinical trial of isolated systolic hypertension in individuals aged �60 years treated with chlorthalidone orplacebo. Incident diabetes was defined by self-report, antidiabetic medication use, fasting glucose �126 mg/dL, orrandom glucose �200 mg/dL. The mediating variable was change in serum potassium during year 1. Of the 459 incidentcases of diabetes during follow-up, 42% occurred during year 1. In year 1, the unadjusted incidence rates of diabetesper 100 person-years were 6.1 and 3.0 in the chlorthalidone and placebo groups, respectively. In year 1, the adjusteddiabetes risk (hazard ratio) with chlorthalidone was 2.07 (95% CI: 1.51 to 2.83; P�0.001). After adjustment for changein serum potassium, the risk was significantly reduced (hazard ratio: 1.54; 95% CI: 1.09 to 2.17; P�0.01); the extentof risk attenuation (41%; 95% CI: 34% to 49%) was consistent with a mediating effect. Each 0.5-mEq/L decrease inserum potassium was independently associated with a 45% higher adjusted diabetes risk (95% CI: 24% to 70%;P�0.001). After year 1, chlorthalidone use was not associated with increased diabetes risk. In conclusion,thiazide-induced diabetes occurs early after initiating treatment and appears to be mediated by changes in serumpotassium. Potassium supplementation might prevent thiazide-induced diabetes. This hypothesis can and should betested in a randomized trial. (Hypertension. 2008;52:1022-1029.)
Key Words: hypertension � diabetes mellitus � thiazide diuretics � chlorthalidone � hypokalemia � potassium
Hypertension affects �65 million US adults1 and �1billion people worldwide.2 It is the leading risk factor
for coronary heart disease, stroke, and kidney failure. Thia-zide diuretics are currently recommended as the first-linetherapy of hypertension.3 Thiazides, however, are associatedwith an increased risk of developing diabetes. In the SystolicHypertension in the Elderly Program (SHEP), use of thethiazide diuretic chlorthalidone was associated with a 50%higher risk of incident diabetes compared with placebo.4
Similarly, in the Antihypertensive and Lipid Lowering treat-ment to prevent Heart Attack Trial (ALLHAT), treatmentwith chlorthalidone was associated with a 39% increased riskof incident diabetes compared with amlodipine and 48%higher risk compared with lisinopril.5 Continued concernregarding this increased risk of diabetes is one of the primaryfactors limiting the widespread use of thiazide diureticsdespite the national recommendations from the Joint NationalCommittee on Prevention, Detection, Evaluation, and Treat-ment of High Blood Pressure.6–8
Thiazide use increases urinary potassium losses and lowersthe serum potassium level. Because 98% of the total bodypotassium is intracellular, and serum potassium concentrationis tightly regulated, frank hypokalemia (a serum potassium�3.5 mEq/L) only occurs in the setting of severe potassiumdepletion.9–11 A few small studies, with �50 participantsobserved for 1 to 4 weeks, have evaluated the effect ofexperimentally induced hypokalemia on glucose homeosta-sis.9,10,12–14 In these studies, hypokalemia was associated withhyperglycemia because of decreased insulin secretion. Withmoderate potassium losses, serum potassium can decreasefrom baseline but stay above the clinically defined thresholdof hypokalemia. Furthermore, even moderate potassium lossis associated with adverse outcomes, such as increased bloodpressure (BP), increased salt sensitivity, increased boneturnover, and stroke.11 It has been hypothesized that thiazide-induced diabetes may result from thiazide-induced changes inpotassium.15
Received July 28, 2008; first decision August 16, 2008; revision accepted October 2, 2008.From the Department of Medicine, Division of Nephrology (T.S., R.S.P.), and General Internal Medicine (L.J.A., E.R.M., M.J.K.), Department of
Pediatrics, Division of Nephrology (R.S.P.), Johns Hopkins University School of Medicine; Department of Epidemiology (L.J.A., E.R.M., M.J.K.,R.S.P.), Johns Hopkins Bloomberg School of Public Health; and the Welch Center for Prevention, Epidemiology and Clinical Research (L.J.A., E.R.M.,M.J.K., R.S.P.), Baltimore, Md.
Parts of this work were presented in abstract form at the 40th Annual Meeting of the American Society of Nephrology, November 2–5, 2007, SanFrancisco, Calif.
Correspondence to Tariq Shafi, Division of Nephrology, Johns Hopkins University School of Medicine, 4940 Eastern Ave, B2/Room 209, Baltimore,MD 21224-2780. E-mail [email protected]
© 2008 American Heart Association, Inc.
Hypertension is available at http://hyper.ahajournals.org DOI: 10.1161/HYPERTENSIONAHA.108.119438
1022
Epidemiology/Population Studies
by guest on July 24, 2015http://hyper.ahajournals.org/Downloaded from by guest on July 24, 2015http://hyper.ahajournals.org/Downloaded from by guest on July 24, 2015http://hyper.ahajournals.org/Downloaded from

The objective of this study was to determine whetherthiazide-induced changes in serum potassium mediate theeffect of thiazide diuretics on incident diabetes in hyperten-sive individuals participating in a large, randomized trial.
Methods
Design and ParticipantsThe protocol for this analysis of the SHEP deidentified data set16 wasapproved by the Johns Hopkins Medicine Institutional ReviewBoard. Rationale and design of the SHEP trial have been describedpreviously.17,18 Briefly, SHEP was a randomized, multicenter,double-masked, placebo-controlled trial conducted at community-based clinics with recruitment from 1985 to 1988 and follow-upending in 1991. The primary aim of the SHEP trial was to determinewhether antihypertensive treatment reduced the risk of stroke inindividuals aged �60 years with isolated systolic hypertensiondefined as systolic BP �160 mm Hg and diastolic BP �90 mm Hg.
The present analysis includes 3790 (80%) of the 4736 SHEPparticipants. Participants were excluded if they had baseline diabetes(n�686 [14.5%]), no follow-up glucose (n�164 [3.5%]), or nofollow-up serum potassium (n�96 [2%]). Baseline diabetes mellituswas defined by self-report, treatment with antidiabetic agents, fastingglucose �126 mg/dL, or random glucose �200 mg/dL.
InterventionsThe participants were randomly assigned to active therapy ormatched placebo. Systolic BP goal was defined as a reduction of20 mm Hg if systolic BP was between 160 and 179 mm Hg andreduction to systolic BP �160 mm Hg for those with higher BP.Participants were started on either chlorthalidone 12.5 mg daily ormatched placebo. Drug dosage (or matched placebo) was doubled ifthe BP remained above goal at 8 weeks. If the BP remained abovegoal at 16 weeks despite the doubling of dose, atenolol or reserpine(or matched placebo) was added to the regimen.
Pertinent Laboratory MeasurementsSerum potassium was measured at baseline, within a month ofinitiating and/or increasing the dose of chlorthalidone (or matchedplacebo) and then annually. Serum potassium was also measuredagain in follow-up of abnormal values. Potassium supplementationwas prescribed if serum potassium was �3.5 mEq/L at 2 consecutivevisits. Fasting blood samples were obtained at baseline and then atfirst, third, and final annual visits but were not required for studyparticipation. Fasting glucose was measured in 2273 participants(60%) at baseline. Among 1517 participants without fasting glucosemeasurement, random glucose was available for 1374 (91%).
Exposure, Outcome, and Mediating VariablesThe primary exposure for this analysis was treatment with chlortha-lidone. The primary outcome was incident diabetes defined byself-report, treatment with antidiabetic agents, fasting glucose �126mg/dL, random glucose �200 mg/dL, or diabetes noted on hospi-talization records. The mediating variable was change in serumpotassium defined as baseline potassium minus mean potassiumduring year 1. Mean potassium was determined for each individualby averaging all of the available potassium levels for the individualduring year 1 after randomization. We defined our mediatingvariable as the change in serum potassium during year 1, because weexpected most decline in serum potassium to occur early afterinitiating chlorthalidone. Change in potassium during year 1 wasadjusted for baseline potassium to reduce the effect of regression tothe mean.19 Sensitivity analyses were conducted in which themediating variable, mean potassium in year 1, was replaced witheither the highest potassium in year 1 or serum potassium as atime-dependant covariate.
Other CovariatesOther covariates in the model included baseline values for thefollowing: age, gender, race (nonwhite versus white), body massindex (BMI, weight [kilograms]/height2 [meters]), systolic and dia-stolic BPs, serum creatinine, fasting serum glucose, and serumpotassium. Missing data for baseline variables were as follows: BMI1.3%, diastolic BP 0.2%, serum glucose 3.6%, serum potassium4.8%, and serum creatinine 5.0%. Baseline potassium was morelikely to be missing from the placebo group than from the chlortha-lidone group (5.6% versus 4.0%; P�0.02). There were no otherdifferences in missing variables between the 2 groups.
Analytic MethodsContinuous variables were compared using t tests for parametric dataand rank-sum test or robust regression for nonparametric data.Categorical variables were compared using the �2 test. Missingbaseline data values were imputed with 10 data replicates using iceand micombine programs in Stata (Stata Corp).20–22 Participants freeof diabetes were censored at death, at the end of the trial, or at the lastannual visit date for those lost to follow-up. Cumulative incidence ofdiabetes was assessed using the nonparametric Kaplan-Meier prod-uct-limit estimator. Incidence rates (IR) of diabetes were calculatedusing the person-time approach. Linear association between theindependent continuous variables and diabetes was assessed visuallyusing lowess smoothed log-odds plots. In the final model, BMI wasanalyzed as a linear spline with a knot at 20 kg/m2 and fastingglucose as a linear spline with a knot at 100 mg/dL. The associationbetween change in serum potassium and diabetes was linear based onvisual inspection of smoothed log-odds plots, and there was noimprovement in model fit using splines based on quartiles andclinical cutoffs. Cox proportional hazards regression with treatment-time interaction was used to model the adjusted risk of diabetes withchlorthalidone compared to placebo.23 Proportional hazards assump-tions were assessed graphically and by hypothesis-based tests.23
Number needed to harm24 was calculated as recommended forsurvival analysis.25 The mediating variable was defined as a predic-tor hypothesized to lie on the causal pathway between exposure andoutcome. Mediation was assessed in the following 5 steps26: (1)determine whether the exposure (chlorthalidone) predicts the medi-ator (change in serum potassium); (2) determine whether the medi-ator (change in serum potassium) independently predicts the out-come (diabetes); (3) determine the adjusted hazard ratio (HR) ofdiabetes from chlorthalidone without including change in potassiumin the regression model (this HR represents the “total effect” ofchlorthalidone); (4) determine the adjusted HR of diabetes fromchlorthalidone with change in potassium in the regression model(this HR represents the “direct effect” of chlorthalidone without theeffect mediated by changes in potassium); (5) calculate mediation,which represents the change in the coefficient (log HR) of chlortha-lidone after adjustment for change in potassium. Mediation wascalculated as follows: (coefficient for total effect�coefficient fordirect effect)/coefficient for total effect�100. Mediation was con-sidered significant if the log HR was attenuated by �15%. Abias-corrected 95% CI for mediation was calculated using bootstrap-ping with replacement (1000 samples).26
The probability of incident diabetes in year 1 by treatmentassignment and change in potassium was predicted using theadjusted Cox regression model. A number of different sensitivityanalyses were conducted to determine the robustness of our results.The risk of incident diabetes with different doses of chlorthalidone,as well as with the combination of chlorthalidone and atenolol, wasdetermined. The effect of potassium supplementation on incidentdiabetes mellitus was also assessed. Data were analyzed using Stata9.2. Statistical significance was defined as P�0.05 using 2-tailedtests.
ResultsThe baseline characteristics of 3790 participants are present-ed in Table 1. There were no significant differences betweenthe 2 randomized groups. There were 459 incident cases of
Shafi et al Thiazide-Induced Diabetes 1023
by guest on July 24, 2015http://hyper.ahajournals.org/Downloaded from

diabetes during 15 830 person-years of follow-up. Of the 459cases, 266 were in the chlorthalidone group and 193 in theplacebo group. The median follow-up time was 4.4 years(interquartile range: 3.5 to 5.1 years). The higher unadjustedcumulative incidence of diabetes in the chlorthalidone group(Figure 1) was apparent at year 1, when first annual fastingglucose measurements were performed. Of the 459 incidentcases of diabetes, 191 (41.6%) occurred during the first year(chlorthalidone, n�129; placebo, n�62). During year 1, theunadjusted IR of diabetes per 100 person-years in thechlorthalidone group was 6.1 and was significantly higherthan the placebo group (IR: 3.0; P for IR ratio�0.001). Afteryear 1, there was no significant difference in the unadjustedIR of diabetes mellitus between the 2 groups (chlorthalidone:2.4; placebo: 2.3; P for IR ratio�0.7).
Assessment of Change in Serum Potassium as aMediating Variable
Step 1: Chlorthalidone-Induced Change inSerum PotassiumChlorthalidone use was associated with lowering of serumpotassium. During year 1, the average serum potassium (SD)was significantly lower in the chlorthalidone group (4.1 [0.4]mEq/L) than in placebo group (4.5 [0.3] mEq/L; P�0.001).This change represented a decrease of 0.4 (0.4) mEq/L frombaseline in the chlorthalidone group during year 1 (P�0.001).There was no change in serum potassium in the placebogroup.
Step 2: Changes in Serum Potassium and DiabetesDuring year 1, greater decrease in serum potassium wasassociated with a higher unadjusted IR of diabetes (Figure 2).In the fully adjusted Cox proportional hazards model, each0.5-mEq/L decrease in serum potassium from the averagebaseline level was associated with a 45% higher risk ofincident diabetes (95% CI: 24% to 70% higher risk;P�0.001) throughout the study period. The highest risk wasobserved in individuals with a �0.5-mEq/L decrease inserum potassium (Table 2).
Step 3: Chlorthalidone-Induced Diabetes (Total Effectof Chlorthalidone)In a Cox proportional hazards model, adjusted for age,gender, race, BMI, systolic and diastolic BP, serum creati-nine, and fasting glucose (Table 3), the risk of diabetes fromchlorthalidone during year 1 was 2 times higher than placebo(HR: 2.07; 95% CI: 1.51 to 2.83; P�0.001). The numberneeded to harm was 29 (95% CI: 17 to 60). After year 1,chlorthalidone was not associated with increased diabetes risk(HR: 1.08; 95% CI: 0.84 to 1.39; P�0.6).
Step 4: Chlorthalidone-Induced Diabetes(Direct Effect of Chlorthalidone)The Cox model for the total effect of chlorthalidone (step 3)was further adjusted for change in serum potassium. The HRfor the direct effect of chlorthalidone in this model was 1.54(95% CI: 1.09 to 2.17; number needed to harm: 57; 95% CI:27 to 329; P�0.01).
Table 1. Baseline Characteristics of the 3790 NondiabeticParticipants From the SHEP Trial
Characteristics Placebo Chlorthalidone
Subjects randomly assigned 1862 (49.1) 1928 (50.9)
Age, y 72 (6.6) 72.3 (6.7)
Gender
Men 791 (42.5) 812 (42.1)
Women 1071 (57.5) 1116 (57.9)
Race/ethnicity
White 1516 (81.4) 1550 (80.4)
Nonwhite 346 (18.6) 378 (19.6)
Baseline systolic BP, mm Hg 169.9 (9.2) 170.4 (9.5)
Baseline diastolic BP, mm Hg 76.6 (9.6) 76.7 (9.9)
Baseline BMI, kg/m2 27.3 (5.0) 27.4 (4.9)
Baseline fasting glucose, mg/dL
No. available (%) 1102 (59.2) 1171 (60.7)
Mean 98.8 (10.3) 98.9 (10.8)
Estimated GFR, mL/min per 1.73 m2 69.1 (16.0) 68.9 (16.6)
Baseline potassium, mEq/L 4.5 (0.5) 4.5 (0.5)
Data are N (%) or mean (SD). GFR indicates glomular filtration rate. GFR(mL/min/1.73 m2)�186�(Serum Creatinine)�1.154�(age)�0.203�(0.742 iffemale)�(1.210 if African American).
PlaceboChlorthalidone
Number at Risk
4461,0801,6481,7481,7991,8624621,0751,6321,7391,7971,928
0
10%
20%
30%
0 1 2 3 4 5Time Since Randomization (Years)
Placebo
Log-rank p = 0.0008
Cum
ulat
ive
Prop
ortio
n(%
)
Chlorthalidone
Figure 1. Unadjusted cumulative incidence of diabetes in the3790 nondiabetic participants from the SHEP trial.
0
2
4
6
8
10
Inci
denc
e R
ate
(per
100
per
son-
yrs)
PlaceboChlorthalidone
Change in Serum Potassium from Baseline≥0.5 mEq/L Decrease< 0.5 mEq/L Decrease
No. of Participants 1,579 1,075 179 776No. of Cases 52 53 6 67
Figure 2. Unadjusted incidence rates of diabetes in year 1 bychange in serum potassium in the 3790 nondiabetic participantsfrom the SHEP trial.
1024 Hypertension December 2008
by guest on July 24, 2015http://hyper.ahajournals.org/Downloaded from
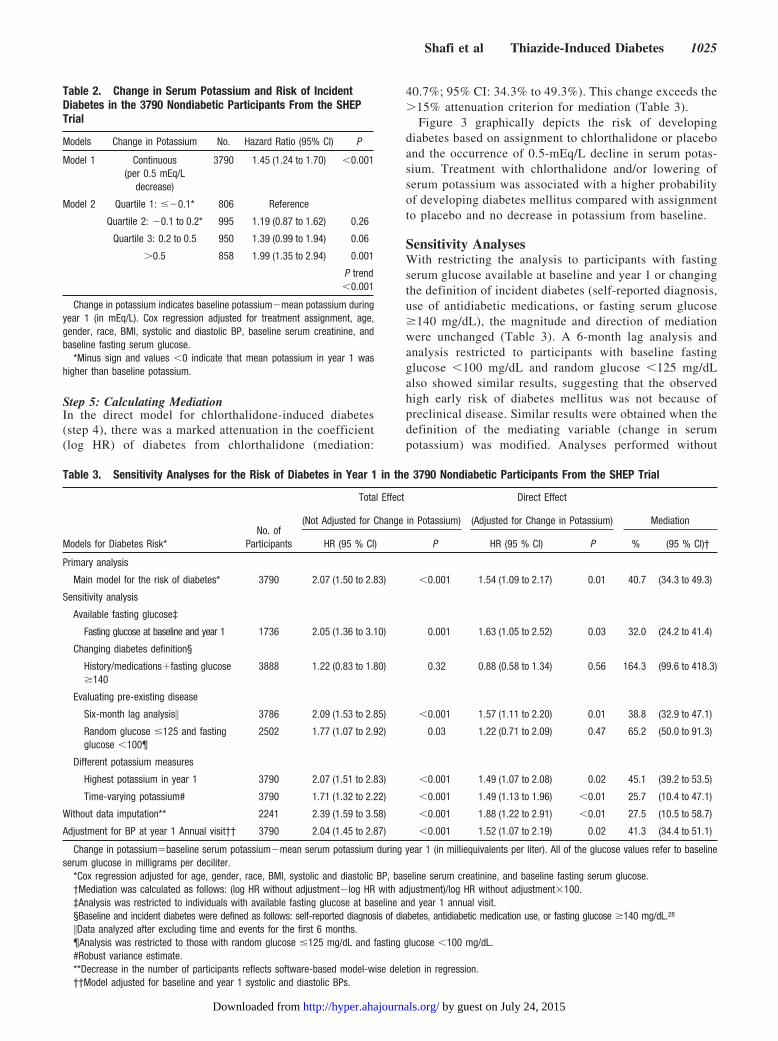
Step 5: Calculating MediationIn the direct model for chlorthalidone-induced diabetes(step 4), there was a marked attenuation in the coefficient(log HR) of diabetes from chlorthalidone (mediation:
40.7%; 95% CI: 34.3% to 49.3%). This change exceeds the�15% attenuation criterion for mediation (Table 3).
Figure 3 graphically depicts the risk of developingdiabetes based on assignment to chlorthalidone or placeboand the occurrence of 0.5-mEq/L decline in serum potas-sium. Treatment with chlorthalidone and/or lowering ofserum potassium was associated with a higher probabilityof developing diabetes mellitus compared with assignmentto placebo and no decrease in potassium from baseline.
Sensitivity AnalysesWith restricting the analysis to participants with fastingserum glucose available at baseline and year 1 or changingthe definition of incident diabetes (self-reported diagnosis,use of antidiabetic medications, or fasting serum glucose�140 mg/dL), the magnitude and direction of mediationwere unchanged (Table 3). A 6-month lag analysis andanalysis restricted to participants with baseline fastingglucose �100 mg/dL and random glucose �125 mg/dLalso showed similar results, suggesting that the observedhigh early risk of diabetes mellitus was not because ofpreclinical disease. Similar results were obtained when thedefinition of the mediating variable (change in serumpotassium) was modified. Analyses performed without
Table 3. Sensitivity Analyses for the Risk of Diabetes in Year 1 in the 3790 Nondiabetic Participants From the SHEP Trial
Models for Diabetes Risk*No. of
Participants
Total Effect Direct Effect
Mediation(Not Adjusted for Change in Potassium) (Adjusted for Change in Potassium)
HR (95 % Cl) P HR (95 % Cl) P % (95 % Cl)†
Primary analysis
Main model for the risk of diabetes* 3790 2.07 (1.50 to 2.83) �0.001 1.54 (1.09 to 2.17) 0.01 40.7 (34.3 to 49.3)
Sensitivity analysis
Available fasting glucose‡
Fasting glucose at baseline and year 1 1736 2.05 (1.36 to 3.10) 0.001 1.63 (1.05 to 2.52) 0.03 32.0 (24.2 to 41.4)
Changing diabetes definition§
History/medications�fasting glucose�140
3888 1.22 (0.83 to 1.80) 0.32 0.88 (0.58 to 1.34) 0.56 164.3 (99.6 to 418.3)
Evaluating pre-existing disease
Six-month lag analysis� 3786 2.09 (1.53 to 2.85) �0.001 1.57 (1.11 to 2.20) 0.01 38.8 (32.9 to 47.1)
Random glucose �125 and fastingglucose �100¶
2502 1.77 (1.07 to 2.92) 0.03 1.22 (0.71 to 2.09) 0.47 65.2 (50.0 to 91.3)
Different potassium measures
Highest potassium in year 1 3790 2.07 (1.51 to 2.83) �0.001 1.49 (1.07 to 2.08) 0.02 45.1 (39.2 to 53.5)
Time-varying potassium# 3790 1.71 (1.32 to 2.22) �0.001 1.49 (1.13 to 1.96) �0.01 25.7 (10.4 to 47.1)
Without data imputation** 2241 2.39 (1.59 to 3.58) �0.001 1.88 (1.22 to 2.91) �0.01 27.5 (10.5 to 58.7)
Adjustment for BP at year 1 Annual visit†† 3790 2.04 (1.45 to 2.87) �0.001 1.52 (1.07 to 2.19) 0.02 41.3 (34.4 to 51.1)
Change in potassium�baseline serum potassium�mean serum potassium during year 1 (in milliequivalents per liter). All of the glucose values refer to baselineserum glucose in milligrams per deciliter.
*Cox regression adjusted for age, gender, race, BMI, systolic and diastolic BP, baseline serum creatinine, and baseline fasting serum glucose.†Mediation was calculated as follows: (log HR without adjustment�log HR with adjustment)/log HR without adjustment�100.‡Analysis was restricted to individuals with available fasting glucose at baseline and year 1 annual visit.§Baseline and incident diabetes were defined as follows: self-reported diagnosis of diabetes, antidiabetic medication use, or fasting glucose �140 mg/dL.28
�Data analyzed after excluding time and events for the first 6 months.¶Analysis was restricted to those with random glucose �125 mg/dL and fasting glucose �100 mg/dL.#Robust variance estimate.**Decrease in the number of participants reflects software-based model-wise deletion in regression.††Model adjusted for baseline and year 1 systolic and diastolic BPs.
Table 2. Change in Serum Potassium and Risk of IncidentDiabetes in the 3790 Nondiabetic Participants From the SHEPTrial
Models Change in Potassium No. Hazard Ratio (95% CI) P
Model 1 Continuous(per 0.5 mEq/L
decrease)
3790 1.45 (1.24 to 1.70) �0.001
Model 2 Quartile 1: ��0.1* 806 Reference
Quartile 2: �0.1 to 0.2* 995 1.19 (0.87 to 1.62) 0.26
Quartile 3: 0.2 to 0.5 950 1.39 (0.99 to 1.94) 0.06
�0.5 858 1.99 (1.35 to 2.94) 0.001
P trend�0.001
Change in potassium indicates baseline potassium�mean potassium duringyear 1 (in mEq/L). Cox regression adjusted for treatment assignment, age,gender, race, BMI, systolic and diastolic BP, baseline serum creatinine, andbaseline fasting serum glucose.
*Minus sign and values �0 indicate that mean potassium in year 1 washigher than baseline potassium.
Shafi et al Thiazide-Induced Diabetes 1025
by guest on July 24, 2015http://hyper.ahajournals.org/Downloaded from

data imputation and analyses adjusting for attained BP atyear 1 also yielded results similar to primary analysis.
Other Risk Factors for DiabetesNonwhite race, higher BMI, and fasting serum glucosewere all independently associated with a higher risk ofdiabetes in year 1 (Table 4). The HR per 10-mg/dLincrease in fasting glucose was 1.87 among those withbaseline fasting glucose �100 mg/dL and 3.23 amongthose with a baseline level �100 mg/dL. At the time of thefirst annual visit, in the active therapy group 65% of theparticipants were taking chlorthalidone �12.5 mg/d, 23%were taking chlorthalidone 25 mg/d, and 12% were takingatenolol in addition to chlorthalidone. Higher doses ofchlorthalidone and the use of atenolol were associated witha higher risk of diabetes in year 1. In “on-treatmentanalyses,” the risk of diabetes was similar to the mainanalysis in those deemed compliant based on urinarychlorthalidone assays. Hypokalemia (serum potassium�3.5 mEq/L) was noted during year 1 in 444 participants(23%) in the chlorthalidone group and 58 participants(3.1%) in the placebo group. Potassium supplement use inyear 1, however, was recorded for only 7.1% and 2.9% ofthe participants in the chlorthalidone and placebo groups,respectively, and the mean (SD) potassium dose was 24(12) mEq/d. These data suggest potassium supplement use,both frequency and amount, were incompletely reported.Adjustment for potassium supplement use in year 1 did notattenuate the risk of diabetes associated with change inserum potassium or chlorthalidone use. Serum potassiumlevels after supplementation were not available in thedatabase.
DiscussionIn our analyses of the hypertensive, nondiabetic participantsin the SHEP trial, 2 principal findings emerged. First,
thiazide-induced diabetes occurred early after initiating ther-apy. The 2-fold higher risk of diabetes from chlorthalidonewas confined to the first year of the study. After year 1,chlorthalidone use was not associated with increased risk ofdiabetes. Second, this chlorthalidone-induced diabetes ap-peared to be mediated by changes in serum potassium. Each0.5-mEq/L decrease in serum potassium from the baselineduring year 1 was associated with a 45% higher risk ofdiabetes, independent of treatment assignment, and this effectpersisted throughout the study period.
Total body potassium depletion is difficult to assess clin-ically. Decline in serum potassium without frank hypokale-mia is generally associated with moderate lowering of totalbody potassium.11 A 0.5-mEq/L decrease in serum potassiumbelow 4 mEq/L represents an �5% or 150- to 200-mEq
0
5
10
15
20
25
Prob
abili
ty o
f Dia
bete
s(%
)
3.0 3.5 4.0 4.5 5.0 5.5 6.0Serum Potassium (mEq/L)
Chlorthalidone + Serum Potassium Decrease = 0.5 mEq/LChlorthalidone (No Potassium Changes)
Placebo (No Potassium Changes)Placebo + Serum Potassium Decrease = 0.5 mEq/L
Available Baseline Potassium Levels*
Figure 3. Predicted probability of developing diabetes in year 1by chlorthalidone use and change in serum potassium in the3790 nondiabetic participants from the SHEP trial. Predictedfrom Cox proportional hazards regression adjusted for age, gen-der, race, baseline systolic and diastolic BP, baseline BMI,baseline creatinine, baseline fasting glucose, and change inserum potassium. Change is serum potassium�baseline serumpotassium � mean serum potassium in year 1. *Each dot nearthe abscissa indicates a data point.
Table 4. Factors Associated With Diabetes Risk in Year 1 inthe 3790 Nondiabetic Participants From the SHEP Trial
Models for Diabetes Risk* HR (95% Cl) P
Model 1: baseline characteristics
Race (Nonwhite vs white) 1.32 (1.06 to 1.64) 0.01
BMI (per 5 kg/m2)† 1.23 (1.12 to 1.34) �0.001
Fasting glucose (per 10 mg/dL)
Fasting glucose �100 mg/dL 1.87 (0.99 to 3.55) 0.05
Fasting glucose �100 mg/dL 3.23 (2.48 to 4.20) �0.001
Models 2 to 4: postrandomizationcharacteristics
Model 2: medication doses
Chlorthalidone (�12.5 mg)vs placebo
1.70 (1.19 to 2.43) 0.003
Chlorthalidone (25 mg) vsplacebo
2.37 (1.55 to 3.65) �0.001
Chlorthalidone (25 mg)�atenolol vs placebo‡
3.16 (1.90 to 5.26) �0.001
P trend�0.001§
Model 3: potassiumsupplement use�
Supplement use vs no use¶ 0.89 (0.47 to 1.68) 0.7
Model 4: On treatmentanalysis#
Chlorthalidone vs placebo 2.30 (1.5 to 3.51) �0.001
*Cox regression adjusted for treatment assignment, age, gender, race, BMI,systolic and diastolic BP, baseline serum creatinine, and baseline fasting serumglucose.
†Above 20 kg/m2.§P value for interaction between chlorthalidone and atenolol�0.93.‡Because of study design (stepped care), atenolol was added if BP was not
at goal with chlorthalidone at 25 mg/d.�Data show any reported potassium supplement use during year 1.¶P value for interaction between potassium supplement use and change in
potassium�0.5.#Data are for on-treatment analysis excluding drop-ins (placebo-assigned
participants with positive urinary chlorthalidone assay) and drop-outs(chlorthalidone-assigned participants with negative urinary chlorthalidoneassay).
1026 Hypertension December 2008
by guest on July 24, 2015http://hyper.ahajournals.org/Downloaded from

decrease in total body potassium.27 In our analysis, greaterdecrease in serum potassium from baseline was associatedwith a higher risk of diabetes. If potassium depletion isunderestimated by serum potassium, then our finding of 41%mediation may be an underestimation, and the actual degreeof mediation may be much higher. We could not detect abeneficial effect of potassium supplementation on diabetes inour analysis. A likely reason for this finding is incompleterecording of potassium supplement use. Other possible rea-sons include a low threshold for initiating supplementation(serum potassium �3.5 mEq/L on 2 occasions) and inade-quate repletion.11
The association between thiazide diuretics and diabetes hasbeen known for �50 years.4,13,28–30 In small clinical experi-ments, potassium depletion induced with9,13,14 or withoutdiuretics10,12 was associated with glucose intolerance, whichreversed with potassium supplementation. Glucose intoler-ance, however, did not improve in a trial of potassiumsupplementation in 16 patients with 6 weeks of follow-up31
and another trial using potassium-sparing diuretics in 202patients followed for 8 weeks.32 A quantitative review ana-lyzing 59 trials with thiazide diuretic arms reported a signif-icant negative correlation between the change in mean serumpotassium and the change in mean serum glucose. Thisanalysis, however, combined results of fasting and randomglucose levels across studies that included diabetic andnondiabetic participants.33 In addition, the dose of thiazidediuretics varied widely: 12.5 to 100.0 mg/d for chlorthalidoneand 12.5 to 400.0 mg/d for hydrochlorothiazide. In a recentanalysis of the 9802 nondiabetic participants of ALLHAT,the adjusted odds for incident diabetes at year 2 in thechlorthalidone group were 38% higher compared with theamlodipine group and 82% higher compared with the lisino-pril group.5 Similar to our study, the odds of chlorthalidone-induced diabetes in the subsequent years were not signifi-cantly higher. Although this ALLHAT analysis addressedpotassium depletion (serum potassium �3.2 mEq/L), it didnot specifically address mediation.
A previous analysis of SHEP, using a 140-mg/dL cutoff forfasting glucose to diagnose diabetes, had noted an increasedincidence of diabetes with chlorthalidone, but the results werenot statistically significant.28 Our analysis, using the currentlyaccepted cutoff for fasting glucose (�126 mg/dL), resulted ina higher number of incident diabetes cases in year 1 (n�191)as compared with the original report from SHEP (n�120).Sensitivity analysis using the older definition (Table 3)resulted in a statistically nonsignificant HR for diabetes inyear 1, but the direction of mediation by change in serumpotassium was similar to the primary analysis.
The cardiovascular risk associated with thiazide-induceddiabetes continues to be a subject of ongoing debate. Somehave suggested that this diabetes is different from “natu-rally occurring” diabetes, whereas others have argued thatthis “new-onset diabetes” is not benign.6,8,15,34,35 Theincreased risk of diabetes with chlorthalidone during year1 noted in our study was based mostly on detectingchanges in fasting serum glucose. This initial increasedrisk, followed by no risk of diabetes for the remainder of
the trial duration, suggests a potential biochemical “un-masking” of diabetes in those individuals at higher risk ofdiabetes at baseline.
Pancreatic release of insulin is controlled via ATP-sensitive potassium channels and L-type calcium channels onthe �-cell surface.36 Increase in plasma glucose closes thepotassium channels and increases insulin secretion. Changesin serum potassium may prevent closure of these channels,and this may be the mechanism behind the decrease in insulinsecretion noted in some studies.12,14,37 Hypertension is oftenassociated with insulin resistance.38 In the presence of insulinresistance, pancreatic �-cells increase insulin production,maintaining euglycemia.39 A decrease in �-cell insulin re-lease because of changes in potassium may lead to hypergly-cemia in individuals with insulin resistance. Thiazides mayalso have effects on glucose homeostasis independent ofthose mediated via potassium. In animal models, thiazidescan reduce glucose-mediated calcium entry into the �-cellsdecreasing insulin secretion,40 and in high doses, such ashydrochlorothiazide 10 mg/kg per day, can increase insulinresistance.41 Thiazides also cause magnesium depletion.Magnesium depletion has been associated with diabetesmellitus in several cohort studies,42–44 and magnesium sup-plementation in diabetics is associated with a decrease infasting glucose levels.45 Whether magnesium depletion alsomediates thiazide-associated diabetes is unknown.
The strength of our study includes its nondiabetic popula-tion at baseline, large sample size and long duration offollow-up, as well as the large number of events providingadequate statistical power to detect differences between the 2groups. The comparison of chlorthalidone with placebo isalso advantageous, because medications such as angiotensin-converting enzyme inhibitors and angiotensin receptor block-ers may reduce the risk of diabetes, as well as increase serumpotassium. Finally, although false-positive results because ofmultiple testing are always a possibility in any analysis, ourstudy was based on an a priori hypothesis, biological plausi-bility, and evidence from previous association studies. Lim-itation of our study includes the potential for uncontrolledconfounding, because diet, physical activity, and magnesiumwere not measured. As discussed above, there may also beresidual confounding, because serum potassium may under-estimate total body potassium depletion. There was alsolimited information available regarding potassium supple-mentation and changes in serum potassium after supplemen-tation. Finally, there is the possibility, albeit unlikely, thatsome variable that is highly correlated with serum potassiumlevels is the mediating variable rather than serum potassium.
Our study has important implications for the clinicalpractitioner and for future research. For the practitioner, ourstudy provides reassurance that diabetes occurring after �1year of thiazide therapy is unlikely to be thiazide induced. Inaddition, nondiabetic patients currently on thiazide therapyfor �1 year are unlikely to develop thiazide-induced diabetes.For future research, our study suggests that trials of potassiumsupplementation to prevent diabetes may not need to last for�1 year to observe a difference in outcomes.
Shafi et al Thiazide-Induced Diabetes 1027
by guest on July 24, 2015http://hyper.ahajournals.org/Downloaded from

PerspectivesThiazide-induced diabetes in hypertensive individuals occursearly after initiating therapy and appears to be mediated bythiazide-induced changes in potassium. Individuals with fast-ing glucose �100 mg/dL, treatment with chlorthalidonedoses �12.5 mg/d, and a decrease in potassium from baseline�0.5 mEq/L are at the highest risk of developing diabetes.Routine supplementation with potassium is a plausible treat-ment to prevent thiazide-induced diabetes. This hypothesiscan and should be tested in randomized, controlled trials.
AcknowledgmentsThe SHEP is conducted and supported by the National Heart, Lung,and Blood Institute in collaboration with the SHEP Investigators.This article was prepared using a limited access data set obtained bythe National Heart, Lung, and Blood Institute and does not neces-sarily reflect the opinions or views of the SHEP or the NationalHeart, Lung, and Blood Institute.
Sources of FundingT.S. was supported by a Renal Disease Training Grant(5T32DK007732-12) from the National Institutes of Health/NationalInstitute of Diabetes and Digestive and Kidney Diseases.
DisclosuresNone.
References1. Fields LE, Burt VL, Cutler JA, Hughes J, Roccella EJ, Sorlie P. The
burden of adult hypertension in the United States 1999 to 2000: a risingtide. Hypertension. 2004;44:398–404.
2. Kearney PM, Whelton M, Reynolds K, Muntner P, Whelton PK, He J.Global burden of hypertension: analysis of worldwide data. Lancet. 2005;365:217–223.
3. Chobanian AV, Bakris GL, Black HR, Cushman WC, Green LA, Izzo JLJr, Jones DW, Materson BJ, Oparil S, Wright JT Jr, Roccella EJ. Seventhreport of the Joint National Committee on Prevention, Detection, Eval-uation, and Treatment of High Blood Pressure. Hypertension. 2003;42:1206–1252.
4. Kostis JB, Wilson AC, Freudenberger RS, Cosgrove NM, Pressel SL,Davis BR, Group SCR. Long-term effect of diuretic-based therapy onfatal outcomes in subjects with isolated systolic hypertension with andwithout diabetes. Am J Cardiol. 2005;95:29–35.
5. Barzilay JI, Davis BR, Cutler JA, Pressel SL, Whelton PK, Basile J,Margolis KL, Ong ST, Sadler LS, Summerson J. Fasting glucoselevels and incident diabetes mellitus in older nondiabetic adults ran-domized to receive 3 different classes of antihypertensive treatment: areport from the Antihypertensive and Lipid-Lowering Treatment toPrevent Heart Attack Trial (ALLHAT). Arch Intern Med. 2006;166:2191–2201.
6. Verdecchia P, Angeli F, Reboldi G. New-onset diabetes, antihypertensivetreatment, and outcome. Hypertension. 2007;50:459–460.
7. Houston MC. ALLHAT debate: diuretics are not preferred, first-lineinitial therapy for hypertension. Arch Intern Med. 2004;164:570 –571.
8. Carter BL, Einhorn PT, Brands M, He J, Cutler JA, Whelton PK,Bakris GL, Brancati FL, Cushman WC, Oparil S, Wright JT Jr.Thiazide-induced dysglycemia: call for research from a working groupfrom the national heart, lung, and blood institute. Hypertension. 2008;52:30 –36.
9. Gorden P. Glucose intolerance with hypokalemia. Failure of short-termpotassium depletion in normal subjects to reproduce the glucose andinsulin abnormalities of clinical hypokalemia. Diabetes. 1973;22:544–551.
10. Rowe JW, Tobin JD, Rosa RM, Andres R. Effect of experimentalpotassium deficiency on glucose and insulin metabolism. Metab Clin Exp.1980;29:498–502.
11. Panel on Dietary Reference Intakes for Electrolytes and Water.Chapter 5. Potassium. In: Dietary Reference Intakes for Water,Potassium, Sodium, Chloride, and Sulfate. Washington, DC: NationalAcademies Press; 2004:186 –268.
12. Sagild U, Andersen V, Andreasen PB. Glucose tolerance and insulinresponsiveness in experimental potassium depletion. Acta Med Scand.1961;169:243–251.
13. Rapoport MI, Hurd HF. Thiazide-induced glucose intolerance treatedwith potassium. Arch Intern Med. 1964;113:405–408.
14. Helderman JH, Elahi D, Andersen DK, Raizes GS, Tobin JD, Shocken D,Andres R. Prevention of the glucose intolerance of thiazide diuretics bymaintenance of body potassium. Diabetes. 1983;32:106–111.
15. Cutler JA. Thiazide-associated glucose abnormalities: prognosis,etiology, and prevention: is potassium balance the key? Hypertension.2006;48:198–200.
16. The Systolic Hypertension in the Elderly Program (SHEP). Availableat: http://www.nhlbi.nih.gov/resources/deca/descriptions/shep.htm.Accessed September 2, 2008.
17. SHEP Cooperative Research Group. Prevention of stroke by antihyper-tensive drug treatment in older persons with isolated systolic hyper-tension. Final results of the Systolic Hypertension in the Elderly Program(SHEP). JAMA. 1991;265:3255–3264.
18. The Systolic Hypertension in the Elderly Program (SHEP) CooperativeResearch Group. Rationale and design of a randomized clinical trial onprevention of stroke in isolated systolic hypertension. J Clin Epidemiol.1988;41:1197–1208.
19. Twisk J, Proper K. Evaluation of the results of a randomized controlledtrial: how to define changes between baseline and follow-up. J ClinEpidemiol. 2004;57:223–228.
20. Donders AR, van der Heijden GJ, Stijnen T, Moons KG. Review: a gentleintroduction to imputation of missing values. J Clin Epidemiol. 2006;59:1087–1091.
21. Royston P. Multiple imputation of missing values: update. Stata J. 2005;5:188–201.
22. Rubin D. Multiple Imputation for Nonresponse in Surveys. New York,NY: Wiley; 1987.
23. Singer JD, Willett JB. Applied Longitudinal Data Analysis. New York,NY: Oxford University Press; 2003.
24. McAlister FA, Straus SE, Guyatt GH, Haynes RB. Users’ guides to themedical literature: XX. Integrating research evidence with the care of theindividual patient. Evidence-Based Medicine Working Group. JAMA.2000;283:2829–2836.
25. Altman DG, Andersen PK. Calculating the number needed to treat fortrials where the outcome is time to an event. BMJ. 1999;319:1492–1495.
26. Vittinghoff E, Shiboski SC, McCullouch CE, Glidden DV. RegressionMethods in Biostatistics: Linear, Logistic, Survival and RepeatedMeasures Models. New York, NY: Springer Science�Business Media,Inc; 2005.
27. Sterns RH, Cox M, Feig PU, Singer I. Internal potassium balance and thecontrol of the plasma potassium concentration. Medicine. 1981;60:339–354.
28. Savage PJ, Pressel SL, Curb JD, Schron EB, Applegate WB, Black HR,Cohen J, Davis BR, Frost P, Smith W, Gonzalez N, Guthrie GP,Oberman A, Rutan G, Probstfield JL, Stamler J. Influence oflong-term, low-dose, diuretic-based, antihypertensive therapy onglucose, lipid, uric acid, and potassium levels in older men and womenwith isolated systolic hypertension: the Systolic Hypertension in theElderly Program. SHEP Cooperative Research Group. Arch InternMed. 1998;158:741–751.
29. Elliott WJ, Meyer PM. Incident diabetes in clinical trials of antihy-pertensive drugs: a network meta-analysis. Lancet. 2007;369:201–207.
30. Wilkins RW. New drugs for the treatment of hypertension. Ann InternMed. 1959;50:1–10.
31. Kaplan NM, Carnegie A, Raskin P, Heller JA, Simmons M. Potassiumsupplementation in hypertensive patients with diuretic-induced hypo-kalemia. N Engl J Med. 1985;312:746–749.
32. Siegel D, Saliba P, Haffner S. Glucose and insulin levels during diuretictherapy in hypertensive men. Hypertension. 1994;23:688–694.
33. Zillich AJ, Garg J, Basu S, Bakris GL, Carter BL. Thiazide diuretics,potassium, and the development of diabetes: a quantitative review.Hypertension. 2006;48:219–224.
1028 Hypertension December 2008
by guest on July 24, 2015http://hyper.ahajournals.org/Downloaded from

34. Phillips RA. New-onset diabetes mellitus less deadly than elevated bloodpressure? Following the evidence in the administration of thiazide diuret-ics. Arch Intern Med. 2006;166:2174–2176.
35. Messerli FH, Bangalore S, Julius S. Risk/benefit assessment of {beta}-blockers and diuretics precludes their use for first-line therapy in hyper-tension. Circulation. 2008;117:2706–2715.
36. Sperling MA. ATP-sensitive potassium channels–neonatal diabetesmellitus and beyond. N Engl J Med. 2006;355:507–510.
37. Howell SL, Taylor KW. Potassium ions and the secretion of insulin by isletsof Langerhans incubated in vitro. Biochem J. 1968;108: 17–24.
38. Burattini R, Di Nardo F, Boemi M, Fumelli P. Deterioration of insulinsensitivity and glucose effectiveness with age and hypertension. Am JHypertens. 2006;19:98–102.
39. Kahn SE, Hull RL, Utzschneider KM. Mechanisms linking obesity toinsulin resistance and type 2 diabetes. Nature. 2006;444:840 –846.
40. Pickkers P, Schachter M, Sever PS, Hughes AD. Do KCa channels andcarbonic anhydrase play a role in thiazide-induced hyperglycaemia? JHum Hypertens. 1995;9:691–693.
41. Reungjui S, Roncal CA, Mu W, Srinivas TR, Sirivongs D, Johnson RJ,Nakagawa T. Thiazide diuretics exacerbate fructose-induced metabolicsyndrome. J Am Soc Nephrol. 2007;18:2724–2731.
42. Chambers EC, Heshka S, Gallagher D, Wang J, Pi-Sunyer FX, PiersonRN Jr. Serum magnesium and type-2 diabetes in African Americansand Hispanics: a New York cohort. J Am Coll Nutr. 2006;25:509 –513.
43. Kao WH, Folsom AR, Nieto FJ, Mo JP, Watson RL, Brancati FL.Serum and dietary magnesium and the risk for type 2 diabetes mel-litus: the Atherosclerosis Risk in Communities Study. Arch InternMed. 1999;159:2151–2159.
44. van Dam RM, Hu FB, Rosenberg L, Krishnan S, Palmer JR. Dietarycalcium and magnesium, major food sources, and risk of type 2diabetes in U.S. black women. Diabetes Care. 2006;29:2238 –2243.
45. Song Y, He K, Levitan EB, Manson JE, Liu S. Effects of oral magnesiumsupplementation on glycaemic control in Type 2 diabetes: a meta-analysisof randomized double-blind controlled trials. Diabet Med. 2006;23:1050–1056.
Shafi et al Thiazide-Induced Diabetes 1029
by guest on July 24, 2015http://hyper.ahajournals.org/Downloaded from
Correction
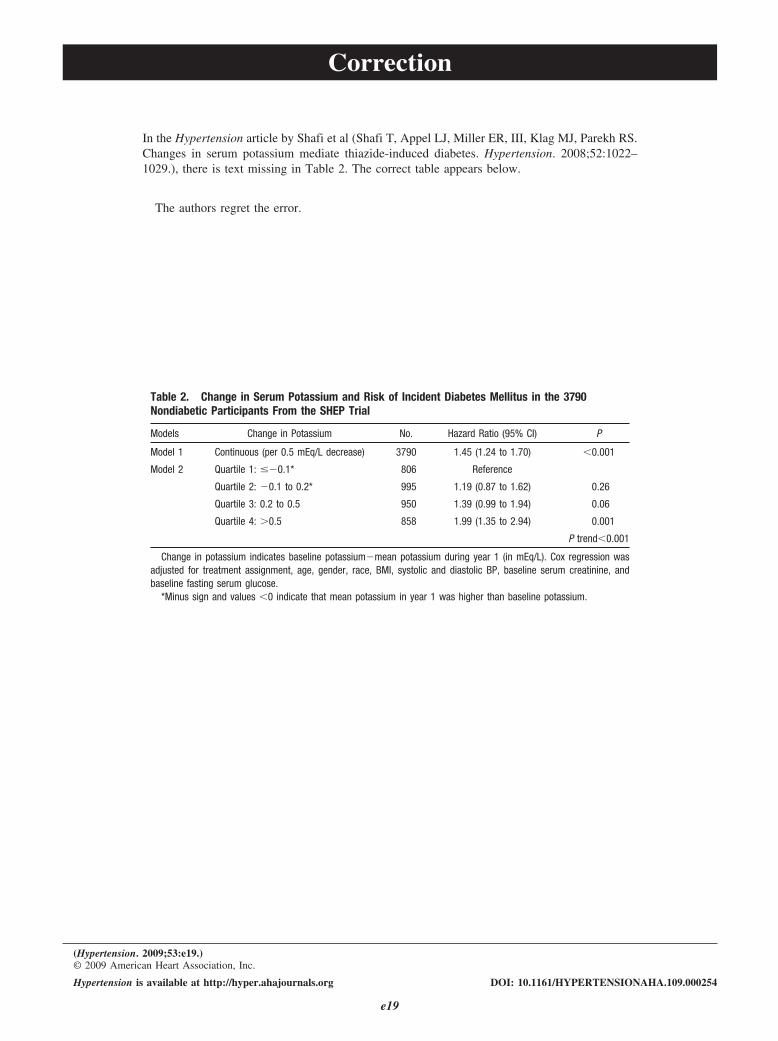
In the Hypertension article by Shafi et al (Shafi T, Appel LJ, Miller ER, III, Klag MJ, Parekh RS.Changes in serum potassium mediate thiazide-induced diabetes. Hypertension. 2008;52:1022–1029.), there is text missing in Table 2. The correct table appears below.
The authors regret the error.
Table 2. Change in Serum Potassium and Risk of Incident Diabetes Mellitus in the 3790Nondiabetic Participants From the SHEP Trial
Models Change in Potassium No. Hazard Ratio (95% CI) P
Model 1 Continuous (per 0.5 mEq/L decrease) 3790 1.45 (1.24 to 1.70) �0.001
Model 2 Quartile 1: ��0.1* 806 Reference
Quartile 2: �0.1 to 0.2* 995 1.19 (0.87 to 1.62) 0.26
Quartile 3: 0.2 to 0.5 950 1.39 (0.99 to 1.94) 0.06
Quartile 4: �0.5 858 1.99 (1.35 to 2.94) 0.001
P trend�0.001
Change in potassium indicates baseline potassium�mean potassium during year 1 (in mEq/L). Cox regression wasadjusted for treatment assignment, age, gender, race, BMI, systolic and diastolic BP, baseline serum creatinine, andbaseline fasting serum glucose.
*Minus sign and values �0 indicate that mean potassium in year 1 was higher than baseline potassium.
(Hypertension. 2009;53:e19.)© 2009 American Heart Association, Inc.
Hypertension is available at http://hyper.ahajournals.org DOI: 10.1161/HYPERTENSIONAHA.109.000254
e19
Tariq Shafi, Lawrence J. Appel, Edgar R. Miller III, Michael J. Klag and Rulan S. ParekhChanges in Serum Potassium Mediate Thiazide-Induced Diabetes
Print ISSN: 0194-911X. Online ISSN: 1524-4563 Copyright © 2008 American Heart Association, Inc. All rights reserved.
is published by the American Heart Association, 7272 Greenville Avenue, Dallas, TX 75231Hypertension doi: 10.1161/HYPERTENSIONAHA.108.119438
2008;52:1022-1029; originally published online November 3, 2008;Hypertension.
http://hyper.ahajournals.org/content/52/6/1022World Wide Web at:
The online version of this article, along with updated information and services, is located on the
http://hyper.ahajournals.org/content/53/2/e19.full.pdfAn erratum has been published regarding this article. Please see the attached page for:
http://hyper.ahajournals.org//subscriptions/
is online at: Hypertension Information about subscribing to Subscriptions:
http://www.lww.com/reprints Information about reprints can be found online at: Reprints:
document. Permissions and Rights Question and Answer this process is available in the
click Request Permissions in the middle column of the Web page under Services. Further information aboutOffice. Once the online version of the published article for which permission is being requested is located,
can be obtained via RightsLink, a service of the Copyright Clearance Center, not the EditorialHypertensionin Requests for permissions to reproduce figures, tables, or portions of articles originally publishedPermissions:
by guest on July 24, 2015http://hyper.ahajournals.org/Downloaded from
Copyright © 2022 FDOKUMEN