Monitoring of Sodium and Potassium in Processed Foods
56
FOOD SAFETY AUTHORITY OF IRELAND Monitoring Sodium and Potassium in Processed Foods September 2003 to December 2020 2022
-
Upload
khangminh22 -
Category
Documents
-
view
3 -
download
0
Transcript of Monitoring of Sodium and Potassium in Processed Foods
FOOD SAFETY AUTHORITY OF IRELAND
Monitoring Sodium and Potassium in Processed Foods
September 2003 to December 2020
2022
FOOD SAFETY AUTHORITY OF IRELAND
Monitoring Sodium and Potassium in Processed Foods
Published by:
Food Safety Authority of Ireland
The Exchange, George’s Dock, IFSC,
Dublin 1, D01 P2V6
T +353 1 817 1300
www.fsai.ie
© FSAI
2022
Applications for reproduction should be made to the FSAI Information Unit
ISBN: 978-1-910348-55-0
Monitoring Sodium and Potassium in Processed Foods
FOOD SAFETY AUTHORITY OF IRELAND Page 1
Contents
ABBREVIATIONS ............................................................................................................... 2
PURPOSE ........................................................................................................................... 3
INTRODUCTION ................................................................................................................. 3
METHOD ............................................................................................................................. 4
1. SAMPLE COLLECTION ..........................................................................................................................4
2. SAMPLE ANALYSIS ................................................................................................................................4
3. STATISTICAL ANALYSIS .......................................................................................................................5
BACKGROUND - TABLE 1 AND 2 ...................................................................................................................8
SOUP ..................................................................................................................................................................9
READY MEALS ............................................................................................................................................... 12
COOKING SAUCES ........................................................................................................................................ 16
SNACKS .......................................................................................................................................................... 19
PROCESSED MEATS ..................................................................................................................................... 24
BREAD PRODUCTS ....................................................................................................................................... 28
BREAKFAST CEREALS ................................................................................................................................ 32
SPREADABLE FATS ...................................................................................................................................... 37
NATURAL CHEESES ..................................................................................................................................... 42
PROCESSED CHEESES ................................................................................................................................ 45
CONDIMENTS ................................................................................................................................................. 48
RESULTS FROM OUT-OF-HOME SOURCES OF SALT SAMPLING ............................. 50
PRE-PACKAGED SANDWICHES .................................................................................................................. 50
FRIED FOODS ................................................................................................................................................ 50
REFERENCES .................................................................................................................. 51
ACKNOWLEDGEMENTS ................................................................................................. 52
Monitoring Sodium and Potassium in Processed Foods
FOOD SAFETY AUTHORITY OF IRELAND Page 1
List of tables and accompanying figures
Table 1 Categories and sub-categories of products sampled from 2003 to 2020 ............................ 6
Table 2 Samples collected from 2003-2020 .................................................................................... 7
Table 3 Soup products (Sodium in mg/100g) ................................................................................ 10
Table 4 Soup Products (Potassium in mg/100g) ........................................................................... 11
Table 5 Ready meals (Sodium in mg/100g) .................................................................................. 14
Table 6 Ready Meals (Potassium in mg/100g) .............................................................................. 15
Table 7 Cooking sauces (Sodium in mg/100g) .............................................................................. 17
Table 8 Cooking Sauces (Potassium in mg/100g) ......................................................................... 18
Table 9 Snacks (Sodium in mg/100g) ........................................................................................... 21
Table 10 Snacks (Potassium in mg/100g) ..................................................................................... 22
Table 11 Processed meats (Sodium in mg/100g) .......................................................................... 25
Table 12 Processed Meats (Potassium in mg/100g) ..................................................................... 26
Table 13 Bread Products (Sodium in mg/100g) ............................................................................. 29
Table 14 Bread Products (Potassium in mg/100g) ........................................................................ 30
Table 15 Breakfast Cereals (Sodium in mg/100g) ......................................................................... 33
Table 16 Breakfast Cereals (Potassium in mg/100g) .................................................................... 35
Table 17 Spreadable Fats (Sodium in mg/100g) ........................................................................... 38
Table 18 Spreadable Fats (Potassium in mg/100g) ....................................................................... 40
Table 19 Natural Cheeses (Sodium in mg/100g) ........................................................................... 43
Table 20 Natural Cheese (Potassium in mg/100g) ........................................................................ 44
Table 21 Processed Cheeses (Sodium in mg/100g) ..................................................................... 46
Table 22 Processed Cheeses (Potassium in mg/100g) ................................................................. 47
Table 23 Condiments (Sodium in mg/100g) .................................................................................. 48
Table 24 Condiments (Potassium in mg/100g) .............................................................................. 49
Table 25 Pre-packaged Sandwiches (Sodium and Potassium in mg/100g) ................................... 50
Table 26 Fried Foods (Sodium and Potassium in mg/100g) .......................................................... 50
Monitoring Sodium and Potassium in Processed Foods
FOOD SAFETY AUTHORITY OF IRELAND Page 2
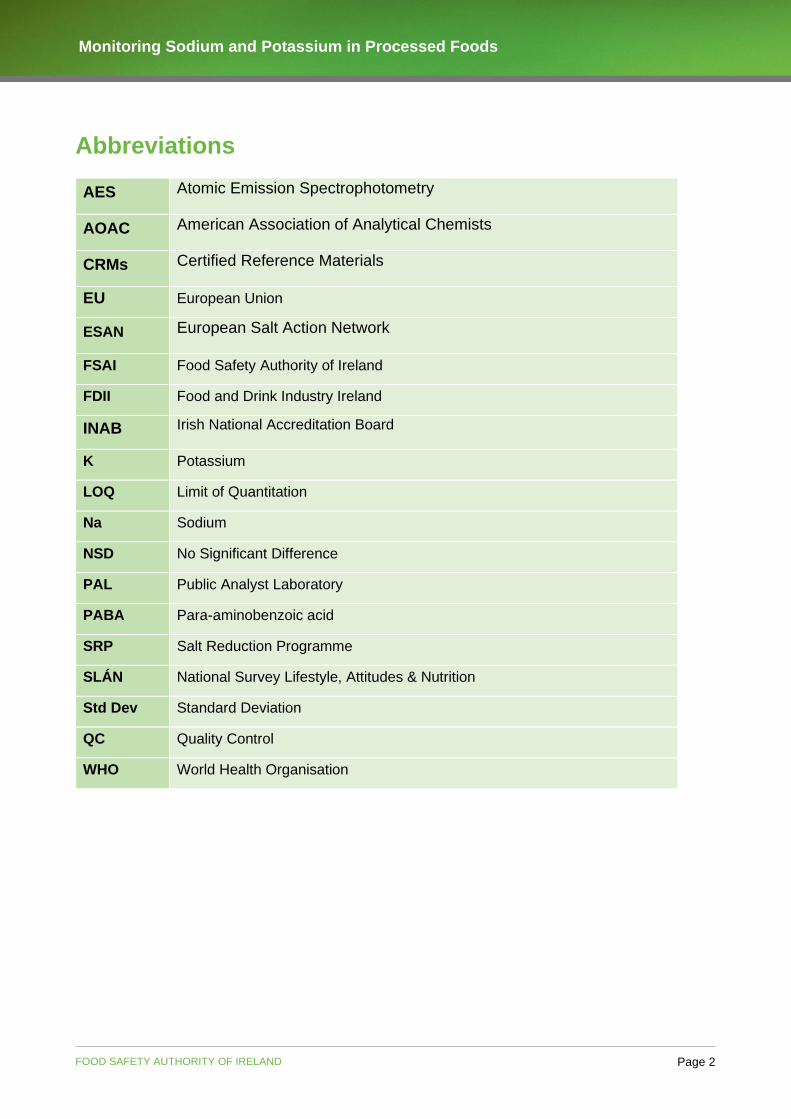
Abbreviations
AES Atomic Emission Spectrophotometry
AOAC American Association of Analytical Chemists
CRMs Certified Reference Materials
EU European Union
ESAN European Salt Action Network
FSAI Food Safety Authority of Ireland
FDII Food and Drink Industry Ireland
INAB Irish National Accreditation Board
K Potassium
LOQ Limit of Quantitation
Na Sodium
NSD No Significant Difference
PAL Public Analyst Laboratory
PABA Para-aminobenzoic acid
SRP Salt Reduction Programme
SLÁN National Survey Lifestyle, Attitudes & Nutrition
Std Dev Standard Deviation
QC Quality Control
WHO World Health Organisation

Monitoring Sodium and Potassium in Processed Foods
FOOD SAFETY AUTHORITY OF IRELAND Page 3
Purpose
The purpose of this report is to provide an overview of the results obtained in the FSAI salt
monitoring surveys which have been conducted on annual basis since 2003.
Introduction
The leading cause of death across the globe are non-communicable diseases (NCDs) such as
cardiovascular disease (CVD), cancers, chronic respiratory diseases and diabetes (Hyseni et al.,
2017). Just over four million annual deaths are thought to be caused by consuming too much salt
(GBD 2015 Risk Factors Collaborators, 2016). Policies on salt reduction have been shown to have
stronger positive effects than interventions targeting sugar and fats (Federici et al., 2019) Salt
reduction policies have also been demonstrated to be more cost effective - a five-year investment
of £15 million by the UK Food Standards Agency (FSA) on a salt reduction programme is
estimated to have prevented 6,000 cardiovascular deaths per year and saved approximately £300
million a year (NICE, 2010).
Acknowledging the importance of reducing salt intake in the Irish population, a voluntary Salt
Reduction Programme (SRP) was established and coordinated by the Food Safety Authority of
Ireland (FSAI) in 2003 (FSAI, 2020a). The SRP was in partnership with the food industry, Food
Drink Ireland (FDI), Retail Ireland and various state bodies and organisations. The goal of the SRP
was to achieve voluntary, gradual and sustained reductions in the salt content of processed foods.
In 2013, the coordination of the SRP was given back to the food industry while the FSAI retained a
monitoring role in terms of salt reformulation (FSAI, 2020b).
In terms of monitoring, the FSAI has identified eleven categories of processed foods which would
impact an individuals’ daily salt intake. The FSAI samples products from one or two of these
processed food categories yearly and sends these foods to the public analyst laboratory in Galway
(GPAL) for sodium and potassium analysis. Owing to the potential use of potassium salt
substitutes in the reformulation of foods, it is deemed important to assess the potassium content of
these products as well as measuring the sodium content. The FSAI has recently published
guidance to assist food businesses in the use of potassium salt substitutes entitled “Guidance Note
36 Best Practice on the Use of Potassium Based Salt Substitutes for the Food Industry”.
It is believed that processed foods and out of home (OOH) foods account for approximately 75% of
an individual’s salt intake (Harnack et al., 2017). While the FSAI has built extensive data in relation
to the monitoring of processed foods, there is little information regarding out of home (OOH) salt
sources in Ireland. Therefore, identifiying this information gap and in line with the
recommendations of the FSAI report “Salt and Health: Review of the Scientific Evidence and

Monitoring Sodium and Potassium in Processed Foods
FOOD SAFETY AUTHORITY OF IRELAND Page 4
Recommendations for Public Policy in Ireland (Revision 1)” (2016), the FSAI undertook a pilot
study in 2020 to investigate the feasibility in collecting OOH lunchtime food options for sodium and
potassium monitoring purposes.
Method
1. Sample collection
• Each year one or two categories of processed foods (n11) are sampled and categorised as
per sub-category (see Table 1)1. Samples are collected from a range of supermarkets and
convenience stores within the locality of the sampling officers.
• Following collection, samples are labelled with a unique identifier survey code and sample
code which corresponds to a populated excel sheet including the FSAI reference code,
sample number, and product label information.
• Photographs of all sides of the product label were taken, uploaded and stored
electronically.
• Samples are transported by courier to Public Analyst’s Laboratory – Galway (GPAL) for
sodium and potassium analysis.
2. Sample analysis
• All samples are analysed by GPAL INAB Registration Number: 009T.
• Samples are initially homogenised either directly or as aqueous slurries (dependent on
sample type) dried and then ashed in a muffle furnace (520°C ± 20°C). Nitric acid is added
to the ash and is acid-digested on a steam bath. The solution is then diluted (if necessary)
and analysed for sodium and potassium using flame photometry (AES= Atomic Emission
Spectrophotometry). Quality control (QC) checks are applied as part of monitoring method
performance including internal and external QC, analysis of certified reference materials
(CRMs) and repeatability. In-House method 1/40 based on AOAC Official Method 969.23
(AOAC Official Methods of Analysis - 18th Edition, 2005).
• Methodology for laboratory analysis of food products for nutritional declarations such as
sodium is not defined in legislation. Many methodologies of laboratory analysis are available
with different degrees of accuracy and applicability. However, allowances for differences
between methodologies for analysis of food products are not applied to the current results
1 Please note that there was no specific randomised approach employed for sampling.

Monitoring Sodium and Potassium in Processed Foods
FOOD SAFETY AUTHORITY OF IRELAND Page 5
• The Limit of Quantitation (LOQ) for samples tested is 10mg/100g for both sodium and
potassium and was dependent on the initial sample weight taken for analysis.
• The average sodium recovery is 92% (range 84 - 100%) based on combined CRM data
(using NIST 1546 Meat & LGC 7103 Biscuit Reference Materials & External QC Data from
Proficiency Testing Schemes).
• The average potassium recovery is 95% (range 92 - 104%) based on combined CRM data
(using NIST 1546 Meat & LGC 7103 Biscuit Reference Materials).
3. Statistical analysis
• Results are analysed using RStudio v4.0.32.
• Frequency statistics (means and standard deviations) and independent t-tests are
employed to assess long term and short-term changes in sodium content of processed
foods.
2 Results from all samples collected since 2003 were re-analysed using R Studio.
Monitoring Sodium and Potassium in Processed Foods
FOOD SAFETY AUTHORITY OF IRELAND Page 6
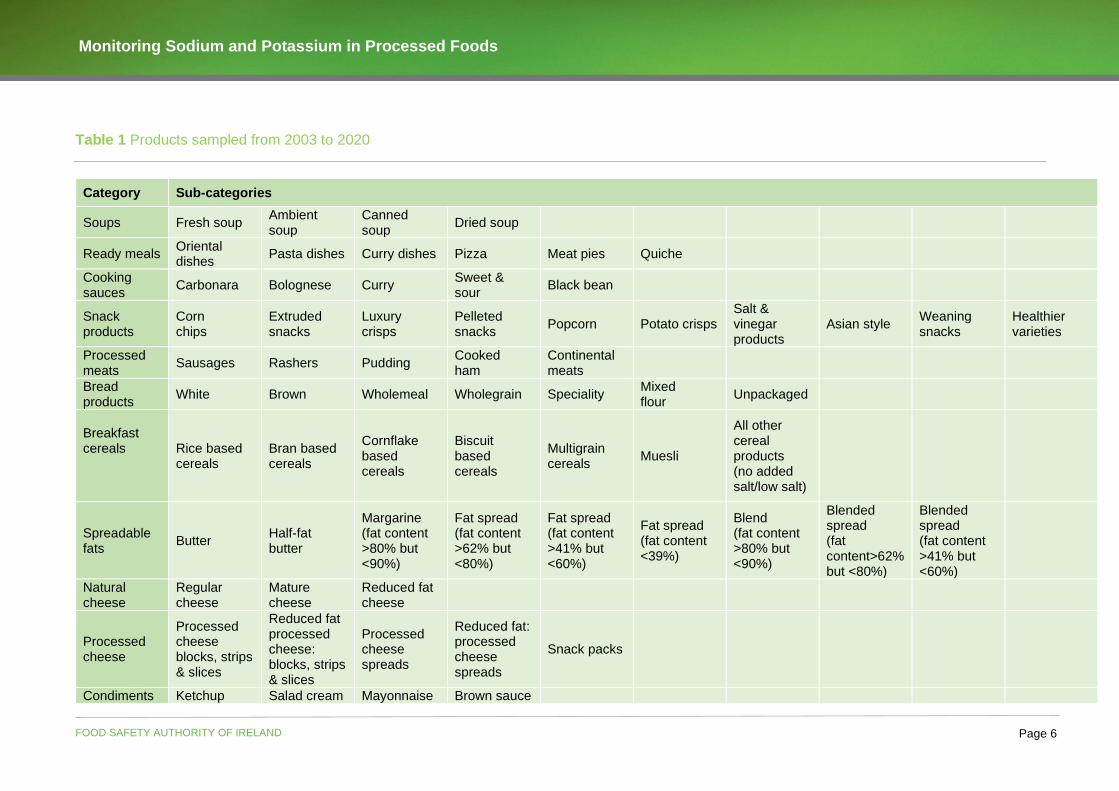
Table 1 Products sampled from 2003 to 2020
Category Sub-categories
Soups Fresh soup Ambient soup
Canned soup
Dried soup
Ready meals Oriental dishes
Pasta dishes Curry dishes Pizza Meat pies Quiche
Cooking sauces
Carbonara Bolognese Curry Sweet & sour
Black bean
Snack products
Corn chips
Extruded snacks
Luxury crisps
Pelleted snacks
Popcorn Potato crisps Salt & vinegar products
Asian style Weaning snacks
Healthier varieties
Processed meats
Sausages Rashers Pudding Cooked ham
Continental meats
Bread products
White Brown Wholemeal Wholegrain Speciality Mixed flour
Unpackaged
Breakfast cereals
Rice based cereals
Bran based cereals
Cornflake based cereals
Biscuit based cereals
Multigrain cereals
Muesli
All other cereal products (no added salt/low salt)
Spreadable fats
Butter Half-fat butter
Margarine (fat content >80% but <90%)
Fat spread (fat content >62% but <80%)
Fat spread (fat content >41% but <60%)
Fat spread (fat content <39%)
Blend (fat content >80% but <90%)
Blended spread (fat content>62% but <80%)
Blended spread (fat content >41% but <60%)
Natural cheese
Regular cheese
Mature cheese
Reduced fat cheese
Processed cheese
Processed cheese blocks, strips & slices
Reduced fat processed cheese: blocks, strips & slices
Processed cheese spreads
Reduced fat: processed cheese spreads
Snack packs
Condiments Ketchup Salad cream Mayonnaise Brown sauce

Monitoring Sodium and Potassium in Processed Foods
FOOD SAFETY AUTHORITY OF IRELAND Page 7
Table 2 Number of Samples collected from 2003-2020
Category 2003 2004 2005 2006 2007 2008 2009 2010 2011 2012 2013 2014 2015 2016 2017 2018 2019 Total
Soups 126 114 42 103 44 429
Ready Meals 51 51 181 283
Cooking Sauces
52 71 48 78 259
Snack Products
136 97 137 102 59 531
Processed Meats
267 194 98 127 148 100 934
Bread Products
100 178 186 123 142 97 e 826
Breakfast Cereals
88 c 119 330 150 687
Spreadable Fats
72 90 90 252
Natural Cheese
34 56 93 d 183
Processed Cheese
36 173 107 316
Condiments 157 157
Unreported Data a
122 82 12 2 218
Total b 188 492 208 520 191 97 292 114 743 231 267 457 530 147 201 190 207 5,075
Monitoring Sodium and Potassium in Processed Foods
FOOD SAFETY AUTHORITY OF IRELAND Page 8
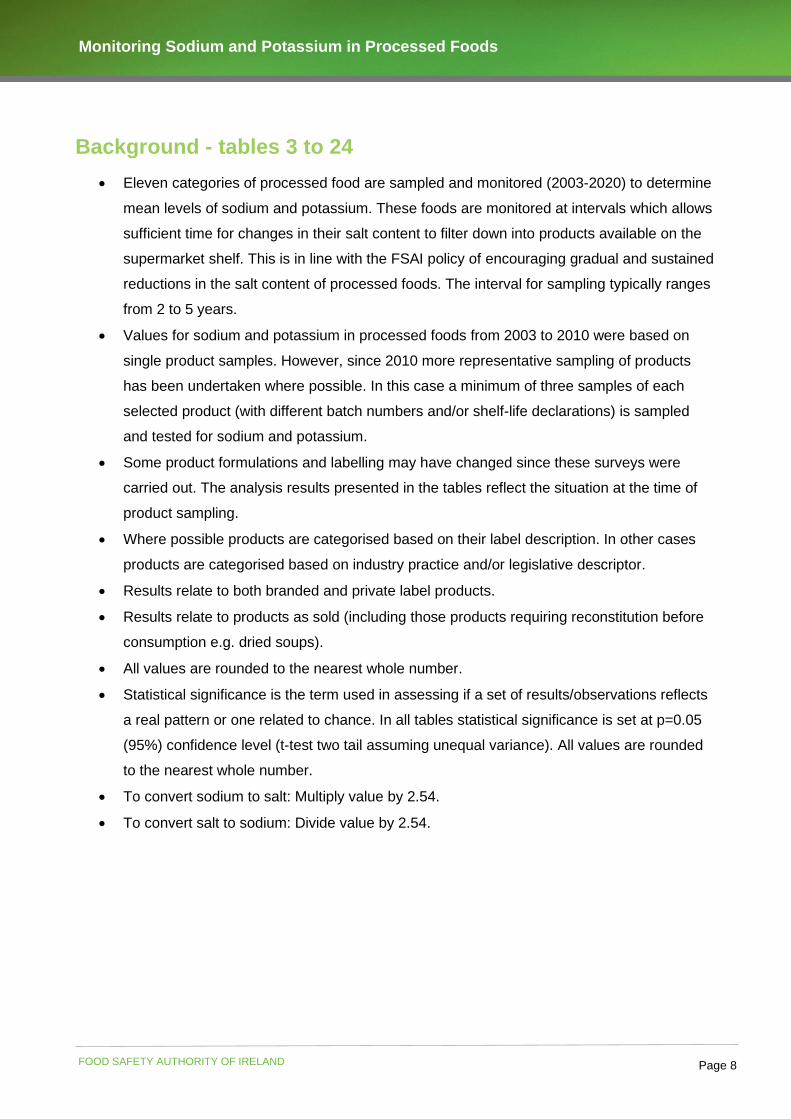
Background - tables 3 to 24
• Eleven categories of processed food are sampled and monitored (2003-2020) to determine
mean levels of sodium and potassium. These foods are monitored at intervals which allows
sufficient time for changes in their salt content to filter down into products available on the
supermarket shelf. This is in line with the FSAI policy of encouraging gradual and sustained
reductions in the salt content of processed foods. The interval for sampling typically ranges
from 2 to 5 years.
• Values for sodium and potassium in processed foods from 2003 to 2010 were based on
single product samples. However, since 2010 more representative sampling of products
has been undertaken where possible. In this case a minimum of three samples of each
selected product (with different batch numbers and/or shelf-life declarations) is sampled
and tested for sodium and potassium.
• Some product formulations and labelling may have changed since these surveys were
carried out. The analysis results presented in the tables reflect the situation at the time of
product sampling.
• Where possible products are categorised based on their label description. In other cases
products are categorised based on industry practice and/or legislative descriptor.
• Results relate to both branded and private label products.
• Results relate to products as sold (including those products requiring reconstitution before
consumption e.g. dried soups).
• All values are rounded to the nearest whole number.
• Statistical significance is the term used in assessing if a set of results/observations reflects
a real pattern or one related to chance. In all tables statistical significance is set at p=0.05
(95%) confidence level (t-test two tail assuming unequal variance). All values are rounded
to the nearest whole number.
• To convert sodium to salt: Multiply value by 2.54.
• To convert salt to sodium: Divide value by 2.54.

Monitoring Sodium and Potassium in Processed Foods
FOOD SAFETY AUTHORITY OF IRELAND Page 9 Page 9
Soup
This section looks at the sodium and potassium content of soup between 2005 and 2017.

Monitoring Sodium and Potassium in Processed Foods
FOOD SAFETY AUTHORITY OF IRELAND Page 10 Page 10
• A significant reduction was found for sodium content of canned and dried soups.
• No significant changes in sodium content were observed for fresh or ambient soups.
• No significant change in potassium content was found for fresh, ambient or canned soups.
• A significant increase in potassium content was observed for dried soup between 2005 and 2014.
Table 3 Soup products (mg/100g)
Category a
Sodium content per year of survey 2005 vs 2017
h
% Sodium content Change
(2005 vs 2017) h
2014 vs 2017 h
% Sodium content Change
(2014 vs 2017) h
2005 2010 2014 2017 g
Fresh soup b 280 (76) 230 (66) 246 f (57) NT NS ▼12
(2005 vs 2014) NS ▲7
Ambient soupc 277 (65) 251 (77) NT 241 (66) NS ▼13 NS
(2010 vs 2017)
▼4 (2010 vs 2017)
Canned soup d 362 (123) 268 (118) 324 (118) 242 (64) <0.001 ▼33 0.003 ▼26
Dried soup e 4083 (1370) 3320 (1055) 3062 (806) NT <0.001
(2005 vs 2014)
▼25 (2005 vs 2014)
NS (2010 vs
2014)
▼8 (2010 vs 2014)
Total samples 126 114 145 44 Overall total = 429
Results presented as means (standard deviations). a Unless otherwise indicated all samples were analysed as sold. Varieties of soup sampled within each category:
mushroom, vegetable, tomato and chicken; b Chilled soup; c Includes ambient soups packed in both flexible retort packs, pouches, tetra-packs and plastic pots; d Some
canned/tinned soups are condensed and diluted before cooking/consumption (dilution varies by manufacturer); e Includes both dried packet, dried instant and concentrated
liquid varieties. Dried and concentrated soups are diluted before cooking/consumption (dilution varies by manufacturer); f Samples taken at time periods (May and October
2013, April to May 2014); g Samples taken in August 2017; h Except were indicated. NS, not significant; NT, not tested.
Monitoring Sodium and Potassium in Processed Foods
FOOD SAFETY AUTHORITY OF IRELAND Page 11 Page 11
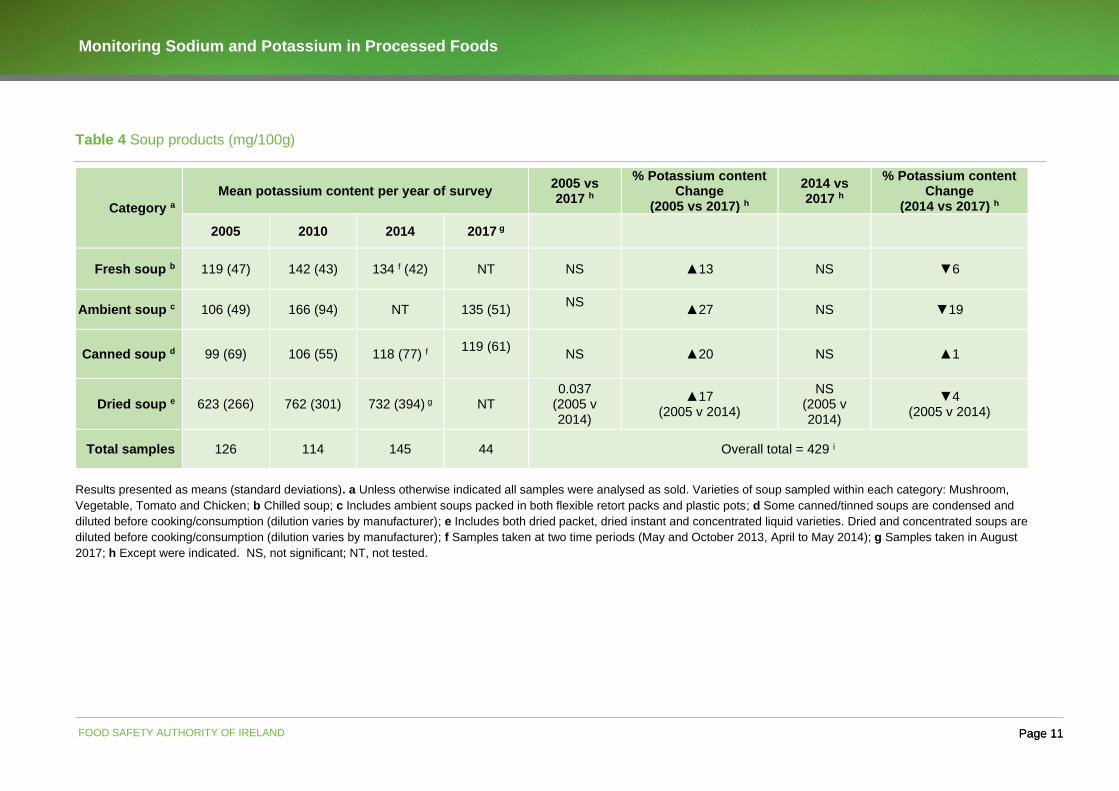
Table 4 Soup products (mg/100g)
Results presented as means (standard deviations). a Unless otherwise indicated all samples were analysed as sold. Varieties of soup sampled within each category: Mushroom,
Vegetable, Tomato and Chicken; b Chilled soup; c Includes ambient soups packed in both flexible retort packs and plastic pots; d Some canned/tinned soups are condensed and
diluted before cooking/consumption (dilution varies by manufacturer); e Includes both dried packet, dried instant and concentrated liquid varieties. Dried and concentrated soups are
diluted before cooking/consumption (dilution varies by manufacturer); f Samples taken at two time periods (May and October 2013, April to May 2014); g Samples taken in August
2017; h Except were indicated. NS, not significant; NT, not tested.
Category a
Mean potassium content per year of survey 2005 vs 2017 h
% Potassium content Change
(2005 vs 2017) h
2014 vs 2017 h
% Potassium content Change
(2014 vs 2017) h
2005 2010 2014 2017 g
Fresh soup b 119 (47) 142 (43) 134 f (42) NT NS ▲13 NS ▼6
Ambient soup c 106 (49) 166 (94) NT 135 (51) NS
▲27 NS ▼19
Canned soup d 99 (69) 106 (55) 118 (77) f 119 (61)
NS ▲20 NS ▲1
Dried soup e 623 (266) 762 (301) 732 (394) g NT 0.037
(2005 v 2014)
▲17 (2005 v 2014)
NS (2005 v 2014)
▼4 (2005 v 2014)
Total samples 126 114 145 44 Overall total = 429 i

Monitoring Sodium and Potassium in Processed Foods
FOOD SAFETY AUTHORITY OF IRELAND Page 12 Page 12
Ready meals
This section looks at the sodium and potassium content of ready meals between 2004 and 2014.
Monitoring Sodium and Potassium in Processed Foods
FOOD SAFETY AUTHORITY OF IRELAND Page 13 Page 13
• No significant change was observed in the sodium content of Oriental Dishes, Meat Pies or Curry Dishes.
• Pasta Dishes reduced their sodium content by 26% between 2004 and 2014.
• No change in the sodium content of Quiches was observed.
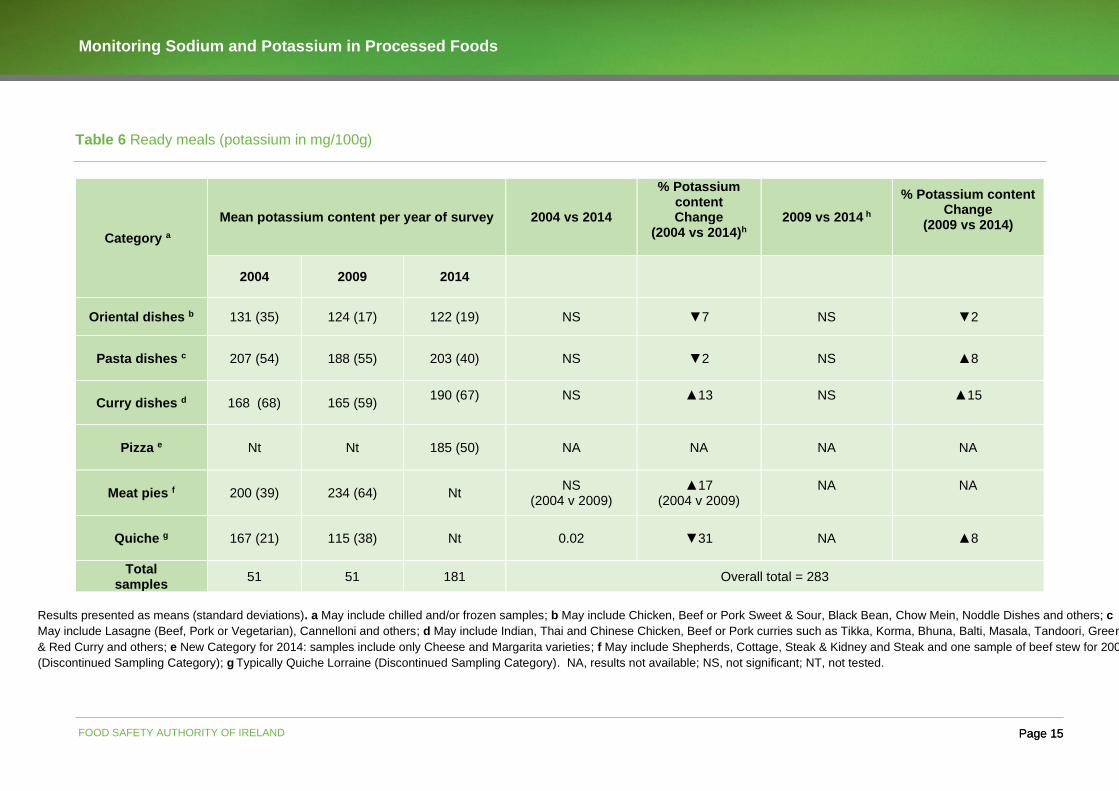
• No changes in potassium content of any of the sub-categories with exception of Quiche which had a significant reduction of 31%.

Monitoring Sodium and Potassium in Processed Foods
FOOD SAFETY AUTHORITY OF IRELAND Page 14 Page 14
Table 5 Ready meals (sodium in mg/100g)
Category a Sodium content per year of survey 2004 vs 2014
% Sodium content Change
(2004 vs 2014)
2009 vs 2014
% Sodium content Change
(2009 vs 2014)
2004 2009 2014
Oriental dishes b 203 (148) 193 (76) 203 (74) NS No change NS ▲5
Pasta dishes c 298 (72) 231 (68) 222 (81) 0.003
▼26 NS ▼4
Curry dishes d 276 (140) 224 (85) 215 (61)
NS ▼22 NS ▼4
Pizza e NT NT 370 (96) NA NA NA NA
Meat pies f 364 (140) 248 (79) NT NS
(2004 v 2009) ▼32
(2004 v 2009) NA NA
Quiche g 398 (153) 308 (82) NT NS
(2004 v 2009) ▼23
(2004 v 2009) NA NA
Total samples 51 51 181 Overall total = 283
Results presented as means (standard deviations). a May include chilled and/or frozen samples; b May include Chicken, Beef or Pork Sweet & Sour, Black Bean, Chow Mein, Noddle Dishes and
others; c May include Lasagne (Beef, Pork or Vegetarian), Cannelloni and others; d May include Indian, Thai and Chinese Chicken, Beef or Pork curries such as Tikka, Korma, Bhuna, Balti, Masala,
Tandoori, Green & Red Curry and others; e New Category for 2014: samples include only Cheese and Margarita varieties; f May include Shepherds, Cottage, Steak & Kidney and Steak and one
sample of beef stew for 2004 (Discontinued Sampling Category); g Typically Quiche Lorraine (Discontinued Sampling Category). NA, results not available; NS, not significant; NT, not tested.
Monitoring Sodium and Potassium in Processed Foods
FOOD SAFETY AUTHORITY OF IRELAND Page 15 Page 15
Table 6 Ready meals (potassium in mg/100g)
Category a
Mean potassium content per year of survey 2004 vs 2014
% Potassium content Change
(2004 vs 2014)h
2009 vs 2014 h
% Potassium content Change
(2009 vs 2014)
2004 2009 2014
Oriental dishes b 131 (35) 124 (17) 122 (19) NS ▼7 NS ▼2
Pasta dishes c 207 (54) 188 (55) 203 (40) NS ▼2 NS ▲8
Curry dishes d 168 (68) 165 (59) 190 (67) NS ▲13 NS ▲15
Pizza e Nt Nt 185 (50) NA NA NA NA
Meat pies f 200 (39) 234 (64) Nt NS
(2004 v 2009) ▲17
(2004 v 2009) NA
NA
Quiche g 167 (21) 115 (38) Nt 0.02 ▼31 NA ▲8
Total samples
51 51 181 Overall total = 283
Results presented as means (standard deviations). a May include chilled and/or frozen samples; b May include Chicken, Beef or Pork Sweet & Sour, Black Bean, Chow Mein, Noddle Dishes and others; c
May include Lasagne (Beef, Pork or Vegetarian), Cannelloni and others; d May include Indian, Thai and Chinese Chicken, Beef or Pork curries such as Tikka, Korma, Bhuna, Balti, Masala, Tandoori, Green
& Red Curry and others; e New Category for 2014: samples include only Cheese and Margarita varieties; f May include Shepherds, Cottage, Steak & Kidney and Steak and one sample of beef stew for 2004
(Discontinued Sampling Category); g Typically Quiche Lorraine (Discontinued Sampling Category). NA, results not available; NS, not significant; NT, not tested.
Monitoring Sodium and Potassium in Processed Foods
FOOD SAFETY AUTHORITY OF IRELAND Page 16 Page 16
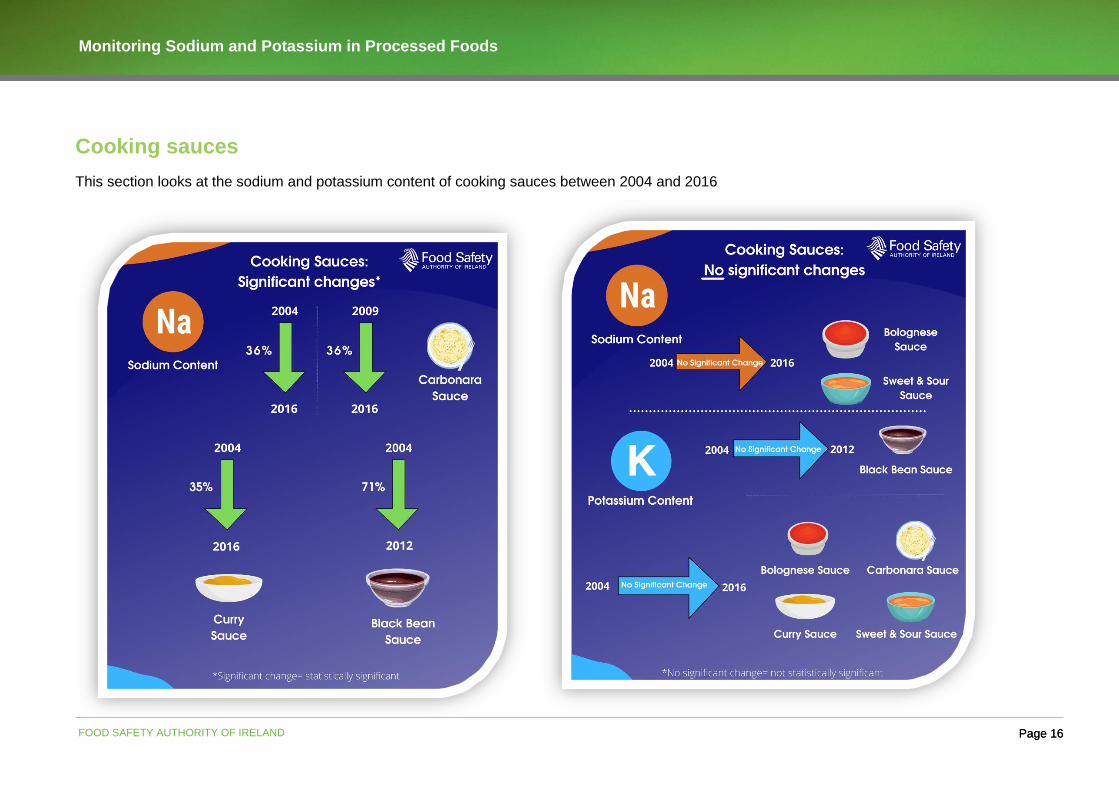
Cooking sauces
This section looks at the sodium and potassium content of cooking sauces between 2004 and 2016

Monitoring Sodium and Potassium in Processed Foods
FOOD SAFETY AUTHORITY OF IRELAND Page 17 Page 17
• The sodium content for black bean sauce reduced by 71% between 2004 and 2012. However, there was no significant reduction in the sodium
content of black bean sauce between 2012 and 2016.
• A significant reduction in the sodium content of curry sauce was observed between 2004 and 2016. However, comparing 2012 and 2016,
there was no significant reduction observed.
• No significant reduction in sodium content was observed for bolognese sauces and sweet & sour sauces.
• No significant changes were observed for potassium content across the time points.
Table 7 Cooking sauces (sodium in mg/100g)
Category a
Mean sodium content
Per year of survey
2004 vs 2016
e
% Sodium
content
Change (2004 vs 2016)
e
2012 vs 2016
e
% Sodium Content
Change (2012 vs 2016) e
2004 2009 2012 2016
Carbonara b 444 (137) 443 (92) NT 286 (85) 0.058 ▼36
0.006
▼36 (2009 vs 2016)
Bolognese c 412 (105) 362 (160) 270 (86) 352 (219) NS ▼15 NS ▲30
Curry d 505 (118) 353 (131) 316 (77) 331 (121) < 0.001 ▼35 NS ▲5
Sweet & sour
379 (197) 340 (163) 270 (96) 260 (56) NS ▼31 NS ▼4
Black bean 1635 (1258) 706 (329) 472 (235) NT 0.05 g ▼71 g NS ▼33
Total samples
52 71 48 78 f Overall total = 259

Monitoring Sodium and Potassium in Processed Foods
FOOD SAFETY AUTHORITY OF IRELAND Page 18 Page 18
Results presented as means (standard deviations). a Includes jarred, pouch and other forms of ambient packaged samples. No fresh cooking sauces were sampled; b Cream based
pasta sauces; c Tomato based pasta sauces and included in 2016, red pesto sauces; d Includes different varieties of curry sauce such as Tikka, Korma, Bhuna, Balti, Masala and
Tandoori; e Unless otherwise stated; f Omitted Black Bean (n2); Chilli Con Carne (n3); Chow Mein (n2); Hoi Sin (n1); Thai Curry (n2). All omitted results are available on request to the
FSAI; g Percentage sodium reduction between 2004 and 2012. NS, not significant; NT, not tested.
Table 8 Cooking sauces (potassium in mg/100g)
Category a Mean potassium content per year of survey 2004 vs 2016 e
% Potassium content Change
(2004 vs 2016) e
2012 vs 2016 e
% Potassium content Change
(2012 vs 2016) e
2004 2009 2012 2016
Carbonara b 64 (26) 77 (43) Nt 45 (20) NS ▼30 NS
(2009 vs 2016) ▼41
(2009 vs 2016)
Bolognese c 353 (69) 315 (70) 282 (56) 349 (51) NS ▼1 NS ▲24
Curry d 186 (41) 180 (48) 211 (103) 171 (69) NS ▼8 NS ▼19
Sweet & sour 109 (37) 99 (18) 103 (24) 115 (35) NS ▲5 NS ▲12
Black bean 156 (124) 104 (29) 122 (21) NT NS
(2004 vs 2012) ▼22
(2004 vs 2012) NS
▲17
Total samples 52 71 48 78 f Overall total = 259
Results presented as means (standard deviations). a Includes jarred, pouch and other forms of ambient packaged samples. No fresh cooking sauces were sampled. Some products
sampled include potassium chloride as an ingredient; b Cream based pasta sauces; c Tomato based pasta sauces and included in 2016, red pesto sauces; d Includes different
varieties of curry sauce such as Tikka, Korma, Bhuna, Balti, Masala and Tandoori; e Unless otherwise stated; f Omitted Black Bean (n=2); Chilli Con Carne (n=3); Chow Mein (n=2);
Hoi Sin (n=1); Thai Curry (n=2). All omitted results are available on request to the FSAI; g Percentage sodium reduction between 2004 and 2012. NS, not significant; NT, not tested.

Monitoring Sodium and Potassium in Processed Foods
FOOD SAFETY AUTHORITY OF IRELAND Page 19 Page 19
Snacks
This section looks at the sodium and potassium content of snacks between 2006 and 2016.

Monitoring Sodium and Potassium in Processed Foods
FOOD SAFETY AUTHORITY OF IRELAND Page 20 Page 20
• No significant reductions in sodium content were observed for any of the sub-categories with the exception of luxury crisps.
• Luxury crisps were found to have a 45% reduction in sodium between 2006 and 2011.
• No changes were observed in the potassium content for the majority of the sub-categories (corn chips, extruded snacks, popcorn, potato
crisps and salt & vinegar products).
• For luxury crisps, a significant increase in potassium content was observed between 2006 and 2011 (55%).
• For pelleted snacks, a significant increase in potassium content was observed between 2006 and 2011 (161%).

Monitoring Sodium and Potassium in Processed Foods
FOOD SAFETY AUTHORITY OF IRELAND Page 21 Page 21
Table 9 Snacks (sodium in mg/100g)
Category
Mean sodium content
Per year of survey
2006 vs 2016 e
% Sodium
content
Change
(2006 vs 2016) e
2013 vs 2016 e
% Sodium
Content
Change
(2013 vs 2016) e
2006 2008 2011 2013 2016
Corn chips
435 (171) 493 (248) 507 (156) NT NT NS
(2006 v 2011) ▲17
NS (2006 v 2011)
▲3
Extruded snacks a
1036 (433) 895 (371) 1006 (161) 984 (277) 1030 (227) NS ▼1 NS ▲5
Luxury crisps b
685 (280) 543 (134) 380 (135) NT NT 0.001
(2006 v 2011) ▼45
(2006 v 2011) 0.020
(2008 v 2011) ▼30
(2008 v 2011)
Pelleted snacks c
846 (416) 778 (424) 778 (108) 880 (175) 755 (21) NS ▼11 NS ▼14
Popcorn 796 (530) 575 (450) 758 (398) NT NT NS
(2006 v 2011) ▼5
(2006 v 2011)
NS (2008 v 2011)
▲32 (2008 v 2011)
Potato crisps b, d
588 (262) 479 (222) 534 (120) 557 (135) 540 (179) NS ▼8 NS ▼3
Salt & vinegar products
890 (355) 836 (253) 759 (180) 852 (282) 794 (217) NS ▼11 NS ▼7
Total samples 136 97 137 102 59 Overall total = 531
Results presented as means (standard deviations). a Food extrusion is a process in which a food material is forced to flow, under one or more varieties of conditions of mixing, heating and shear, through a die which is designed to form and/or puff-dry the ingredients e.g. onion rings can be described as puffed snacks also. There are many different raw materials which can be used for extruded snack production including potato, rice, maize, wheat, corn etc; b Potato (of various varieties) which are sliced (flat, crinkle cut etc), lightly fried in vegetable oil and then sprinkled with flavouring.c There are many different raw materials which can be used for pellet production such as; potato, rice, maize, wheat, corn etc. The pellets are divided into two basic categories, those made from grain (rice, maize, wheat, corn) or those made from potato. The latter being the only one to give the authentic potato taste to the finished product. Pelletised snacks are produced when the raw material is extruded into a recognisable shape, this can be done using a process known as direct expansion or alternatively using a process known as indirect expansion. The direct expanded pellets are produced in a one-step extruder and are ready for consumption following the extrusion

Monitoring Sodium and Potassium in Processed Foods
FOOD SAFETY AUTHORITY OF IRELAND Page 22 Page 22
process. The indirect expanded pellets are extruded and then generally sold on as a semi-manufactured product to companies who finish the process by frying them in hot oil then dosing them with flavouring or seasoning before packaging; d The majority of potato crisps sampled were Cheese and Onion flavour or variations of that flavour; e Unless otherwise stated. NS, not significant; NT, not tested.
Table 10 Snacks (potassium in mg/100g)
Category
Mean potassium content
Per year of survey
2006 to 2016 e
%
Potassium
content
Change
2013 to 2016 e
% Potassium
Content
Change
2006 2008 2011 2013 2016
Corn chips
205 (41) 235 (58) 220 (39) NT NT NS
(2006 v 2011)
▲7 NS
(2008 v 2011)
▼7
Extruded snacks a
362 (298) 377 (227) 304 (83) 371 (180) 312 (124) NS ▼14 NS ▼16
Luxury crisps b
777 (153) 975 (246) 1208 (278) NT NT 0.003
(2006 v 2011)
▲ 55 (2006 v 2011)
NS ▲24
Pelleted snacks c
368 (273) 331 (189) 858 (62) 890 (51) 960 (42) < 0.001 ▲161 NS ▲8
Popcorn 321 (347) 172 (64) 230 (18) NT NT NS
(2006 v 2011)
▼28 NS
(2008 vs 2011)
▲34
Potato crisps b, d
1072 (237) 1116 (224) 1082 (283) 1269 (261) 1139 (219) NS ▲6 0.039 ▼10
Salt & vinegar
products 1030 (568) 872 (311) 994 (363) 1281 (292) 1139 (230) NS ▲11 NS ▼11
Total samples
136 97 137 102 59 Overall total = 531

Monitoring Sodium and Potassium in Processed Foods
FOOD SAFETY AUTHORITY OF IRELAND Page 23 Page 23
Results presented as means (standard deviations). a Food extrusion is a process in which a food material is forced to flow, under one or more varieties of conditions of mixing, heating and
shear, through a die which is designed to form and/or puff-dry the ingredients e.g. onion rings can be described as puffed snacks also. There are many different raw materials which can be
used for extruded snack production including potato, rice, maize, wheat, corn etc. b Potato (of various varieties) which are sliced (flat, crinkle cut etc), lightly fried in vegetable oil and then
sprinkled with flavouring. c There are many different raw materials which can be used for pellet production such as; potato, rice, maize, wheat, corn etc. The pellets are divided into two
basic categories, those made from grain (rice, maize, wheat, corn) or those made from potato. The latter being the only one to give the authentic potato taste to the finished product.
Pelletised snacks are produced when the raw material is extruded into a recognisable shape, this can be done using a process known as direct expansion or alternatively using a process
known as indirect expansion. The direct expanded pellets are produced in a one-step extruder and are ready for consumption following the extrusion process. The indirect expanded pellets
are extruded and then generally sold on as a semi-manufactured product to companies who finish the process by frying them in hot oil then dosing them with flavouring or seasoning before
packaging. d The majority of potato crisps sampled are cheese and onion flavour or variations of that flavour. Some brands of crisps sampled contained Potassium Chloride as an
ingredient. e Unless otherwise stated. NS, not significant; NT, not tested.

Monitoring Sodium and Potassium in Processed Foods
FOOD SAFETY AUTHORITY OF IRELAND Page 24 Page 24
Processed meats
This section looks at the sodium and potassium content of processed meats between 2004 and 2019.

Monitoring Sodium and Potassium in Processed Foods
FOOD SAFETY AUTHORITY OF IRELAND Page 25 Page 25
• There was a significant reduction in the sodium content of all sub-categories with the exception of puddings between 2004 and 2019. In terms
of short-term changes, there was no significant reductions in sodium content observed between 2015 and 2019.
• Sausages, rashers, and cooked ham all had a significant reduction in sodium content in 2015 compared with 2004 (12%, 24% and 17%
respectively).
• Continetnal meats was found to have a higher sodium content in 2019 compared with any of the sub-categories sampled in 2004.
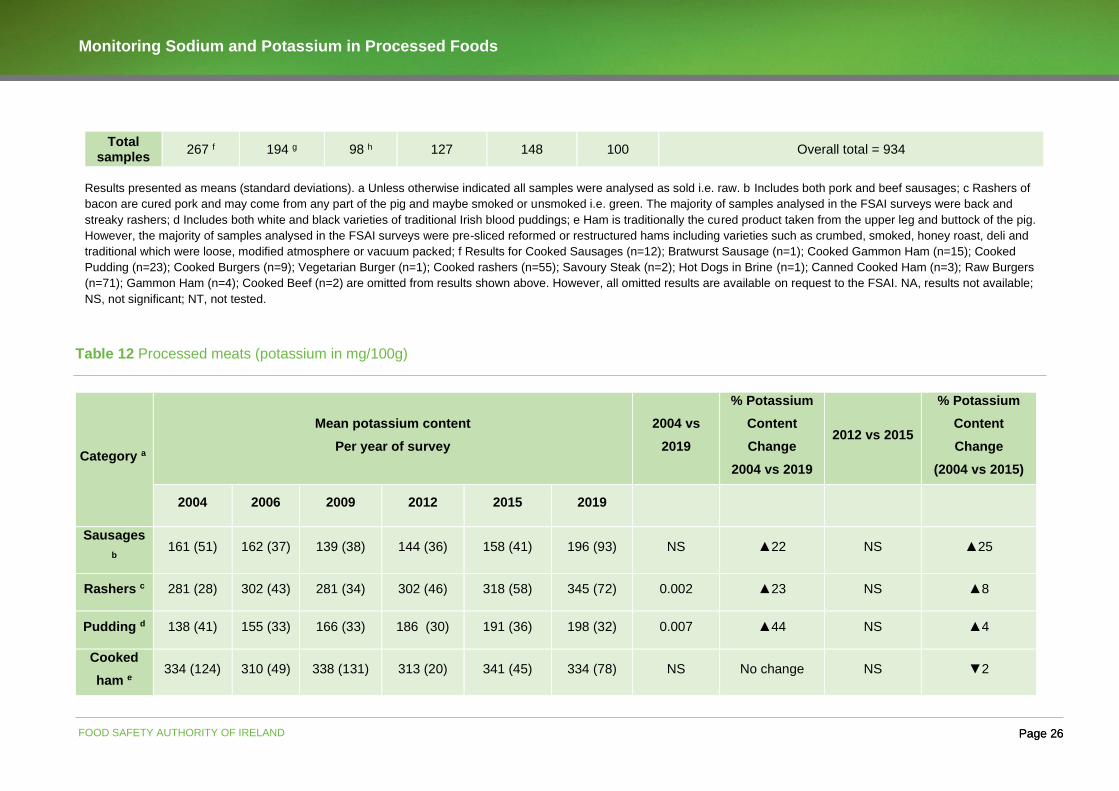
• A significant increase in potassium content was observed for rashers and puddings (23% and 44% respectively).
• No change in potassium content was found for sausages and cooked ham.
Table 11 Processed meats (sodium in mg/100g)
Category a
Mean sodium content
Per year of survey 2004 vs 2019i
% Sodium content Change (2004 vs
2019)
2015 vs 2019i
% Sodium Content
Change
(2015 vs 2019)
2004 2006 2009 2012 2015 2019
Sausages b
881 (235) 950 (243) 810 (101) 823 (135) 782 (170) 776 (139) 0.015 ▼12 NS ▼1
Rashers c 1315 (312)
1098 (297) 1150 (144)
1132 (365) 957 (185) 1002 (252) < 0.001 ▼24 NS ▲5
Pudding d 868 (237) 670 (160) 771 (145) 832 (166) 747 (127) 758 (172) NS ▼13 NS ▲1
Cooked ham e
985 (240) 938 (162) 954 (135) 967 (125) 840 (132) 819 (169) 0.008
▼17 NS
▼3
Continental meats
NT NT NT NT NT 1514 (163) NA NA NA NA
Monitoring Sodium and Potassium in Processed Foods
FOOD SAFETY AUTHORITY OF IRELAND Page 26 Page 26
Total samples
267 f 194 g 98 h 127 148 100 Overall total = 934
Results presented as means (standard deviations). a Unless otherwise indicated all samples were analysed as sold i.e. raw. b Includes both pork and beef sausages; c Rashers of
bacon are cured pork and may come from any part of the pig and maybe smoked or unsmoked i.e. green. The majority of samples analysed in the FSAI surveys were back and
streaky rashers; d Includes both white and black varieties of traditional Irish blood puddings; e Ham is traditionally the cured product taken from the upper leg and buttock of the pig.
However, the majority of samples analysed in the FSAI surveys were pre-sliced reformed or restructured hams including varieties such as crumbed, smoked, honey roast, deli and
traditional which were loose, modified atmosphere or vacuum packed; f Results for Cooked Sausages (n=12); Bratwurst Sausage (n=1); Cooked Gammon Ham (n=15); Cooked
Pudding (n=23); Cooked Burgers (n=9); Vegetarian Burger (n=1); Cooked rashers (n=55); Savoury Steak (n=2); Hot Dogs in Brine (n=1); Canned Cooked Ham (n=3); Raw Burgers
(n=71); Gammon Ham (n=4); Cooked Beef (n=2) are omitted from results shown above. However, all omitted results are available on request to the FSAI. NA, results not available;
NS, not significant; NT, not tested.
Table 12 Processed meats (potassium in mg/100g)
Category a
Mean potassium content
Per year of survey
2004 vs
2019
% Potassium
Content
Change
2004 vs 2019
2012 vs 2015
% Potassium
Content
Change
(2004 vs 2015)
2004 2006 2009 2012 2015 2019
Sausages
b 161 (51) 162 (37) 139 (38) 144 (36) 158 (41) 196 (93) NS ▲22 NS ▲25
Rashers c 281 (28) 302 (43) 281 (34) 302 (46) 318 (58) 345 (72) 0.002 ▲23 NS ▲8
Pudding d 138 (41) 155 (33) 166 (33) 186 (30) 191 (36) 198 (32) 0.007 ▲44 NS ▲4
Cooked
ham e 334 (124) 310 (49) 338 (131) 313 (20) 341 (45) 334 (78) NS No change NS ▼2

Monitoring Sodium and Potassium in Processed Foods
FOOD SAFETY AUTHORITY OF IRELAND Page 27 Page 27
Continent
al meats NT NT NT NT NT 408 (133) NA NA NA NA
Total
samples 267 f 194 g 98 h 127 148 100 Overall total = 834
Results presented as means (standard deviations). a Unless otherwise indicated all samples were analysed as sold i.e. raw. Potassium maybe present in some cured products as a result
of the cure ingredient used e.g. Potassium Nitrate; b Includes both pork and beef sausages; c Rashers of bacon are cured pork and may come from any part of the pig and maybe
smoked or unsmoked i.e. green. The majority of samples analysed in the FSAI surveys were back and streaky rashers. d Includes both white and black varieties of traditional Irish blood
puddings; e Ham is traditionally the cured product taken from the upper leg and buttock of the pig. However, the majority of samples analysed in the FSAI surveys were pre-sliced
reformed or restructured hams including varieties such as crumbed, smoked, honey roast, deli and traditional which were loose, modified atmosphere or vacuum packed; f Results for
Cooked Sausages (n=12); Bratwurst Sausage (n=1); Cooked Gammon Ham (n=15); Cooked Pudding (n=23); Cooked Burgers (n=9); Vegetarian Burger (n=1); Cooked rashers (n=55);
Savoury Steak (n=2); Hot Dogs in Brine (n=1); Canned Cooked Ham (n=3); Raw Burgers (n=71); Gammon Ham (n=4); Cooked Beef (n=2) are omitted from results shown above.
However, all omitted results are available on request to the FSAI; g Results for Cooked Sausages (n=2); Polish Sausage (n=1); Turkey Sausage (n=1); Cooked Rashers (n=3); Cooked
Burgers (n=3); Turkey Rashers (n=2); Raw Burgers (n=7); Gammon Ham (n=8); Cooked Poultry (n=13) Cooked Beef (n=6); Miscellaneous (n=7) are omitted from results shown above.
However, all omitted results are available on request to the FSAI. h Results for Chicken Sausages (n=1); Cooked Burgers (n=1); Raw Burgers (n=9); Gammon Ham (n=20) are omitted
from results shown above. However, all omitted results are available on request to the FSAI. NA, results not available; NS, not significant; NT, not tested.

Monitoring Sodium and Potassium in Processed Foods
FOOD SAFETY AUTHORITY OF IRELAND Page 28 Page 28
Bread products
This section looks at the sodium and potassium content of bread products between 2003 and 2018.
Monitoring Sodium and Potassium in Processed Foods
FOOD SAFETY AUTHORITY OF IRELAND Page 29 Page 29
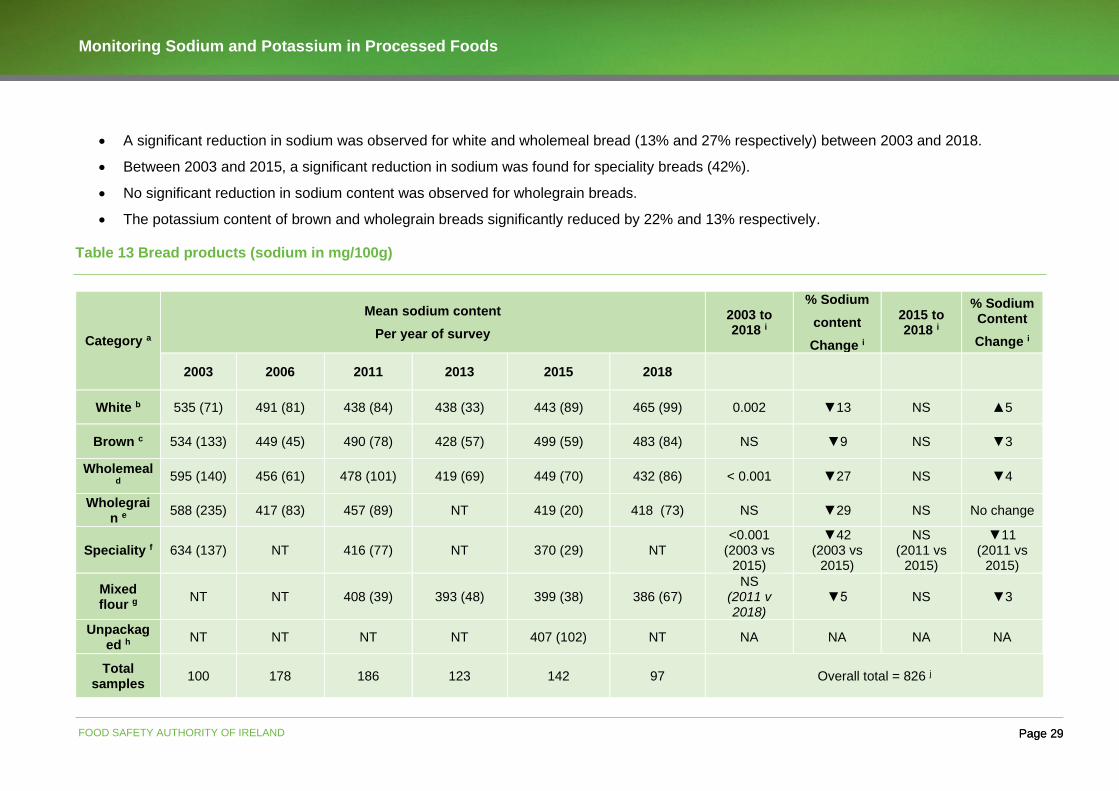
• A significant reduction in sodium was observed for white and wholemeal bread (13% and 27% respectively) between 2003 and 2018.
• Between 2003 and 2015, a significant reduction in sodium was found for speciality breads (42%).
• No significant reduction in sodium content was observed for wholegrain breads.
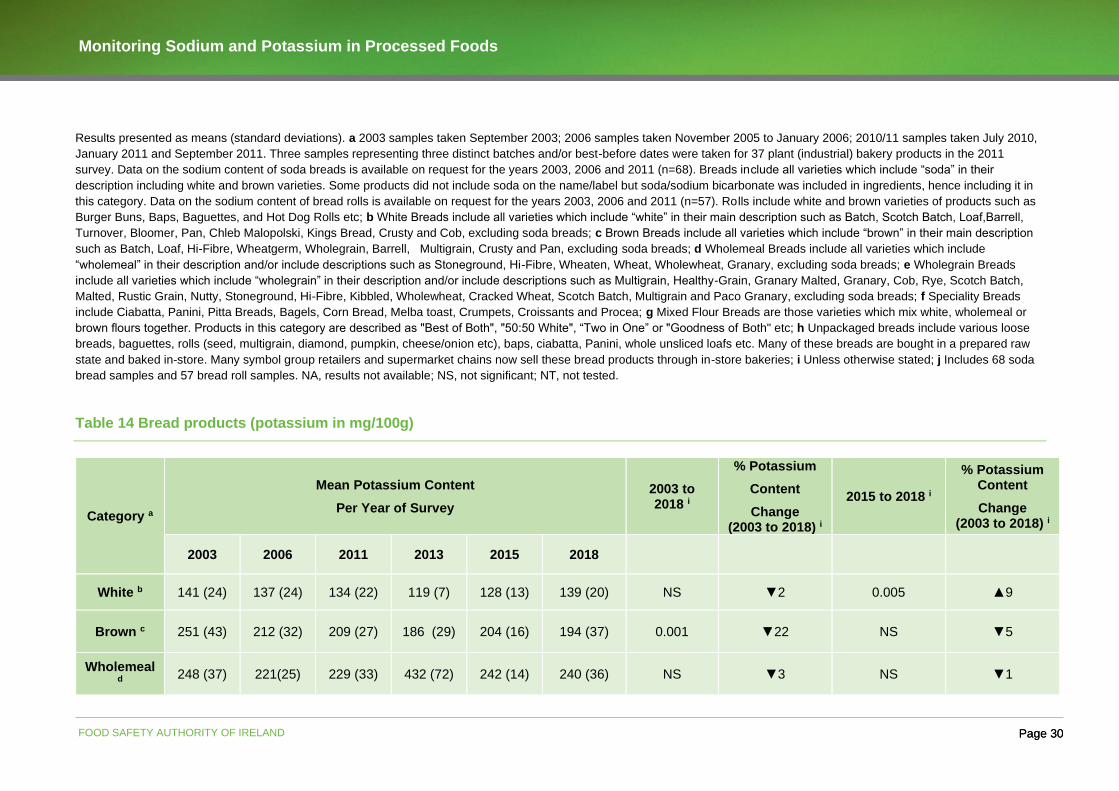
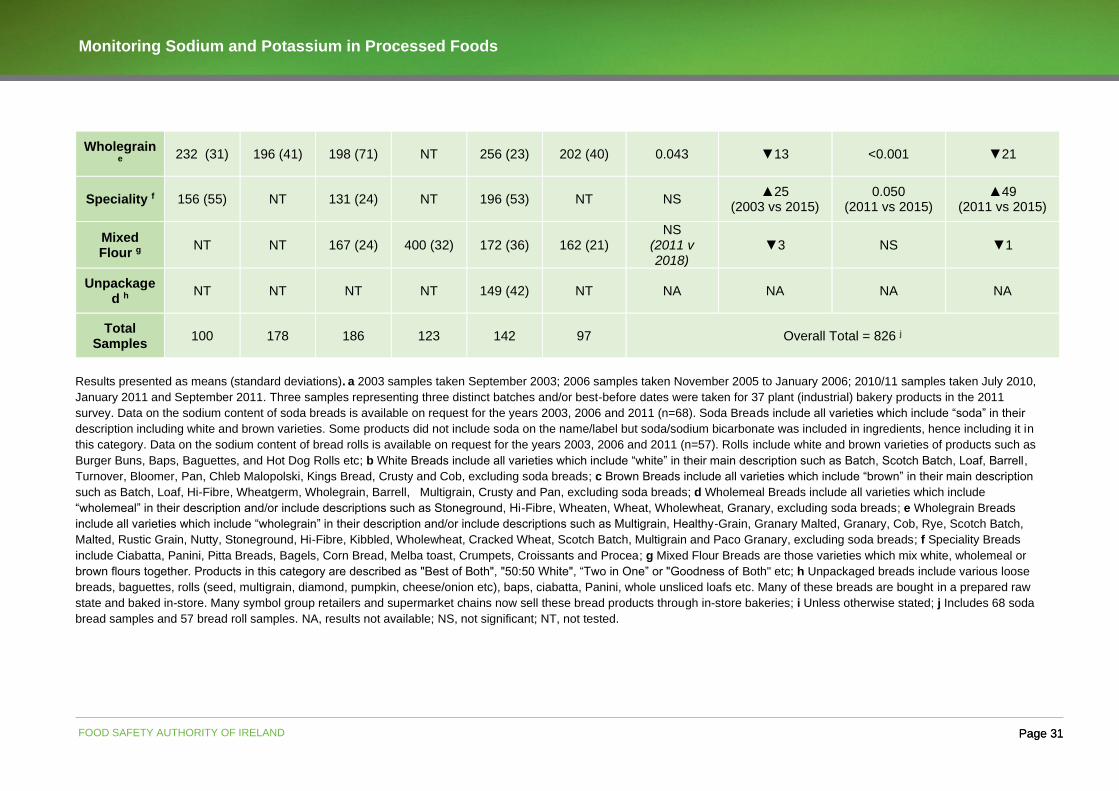
• The potassium content of brown and wholegrain breads significantly reduced by 22% and 13% respectively.
Table 13 Bread products (sodium in mg/100g)
Category a
Mean sodium content
Per year of survey
2003 to 2018 i
% Sodium
content
Change i
2015 to 2018 i
% Sodium Content
Change i
2003 2006 2011 2013 2015 2018
White b 535 (71) 491 (81) 438 (84) 438 (33) 443 (89) 465 (99) 0.002 ▼13 NS ▲5
Brown c 534 (133) 449 (45) 490 (78) 428 (57) 499 (59) 483 (84) NS ▼9 NS ▼3
Wholemeal d
595 (140) 456 (61) 478 (101) 419 (69) 449 (70) 432 (86) < 0.001 ▼27 NS ▼4
Wholegrain e
588 (235) 417 (83) 457 (89) NT 419 (20) 418 (73) NS ▼29 NS No change
Speciality f 634 (137) NT 416 (77) NT 370 (29) NT <0.001
(2003 vs 2015)
▼42 (2003 vs
2015)
NS (2011 vs
2015)
▼11 (2011 vs
2015)
Mixed flour g
NT NT 408 (39) 393 (48) 399 (38) 386 (67) NS
(2011 v 2018)
▼5 NS ▼3
Unpackaged h
NT NT NT NT 407 (102) NT NA NA NA NA
Total samples
100 178 186 123 142 97 Overall total = 826 j
Monitoring Sodium and Potassium in Processed Foods
FOOD SAFETY AUTHORITY OF IRELAND Page 30 Page 30
Results presented as means (standard deviations). a 2003 samples taken September 2003; 2006 samples taken November 2005 to January 2006; 2010/11 samples taken July 2010,
January 2011 and September 2011. Three samples representing three distinct batches and/or best-before dates were taken for 37 plant (industrial) bakery products in the 2011
survey. Data on the sodium content of soda breads is available on request for the years 2003, 2006 and 2011 (n=68). Breads include all varieties which include “soda” in their
description including white and brown varieties. Some products did not include soda on the name/label but soda/sodium bicarbonate was included in ingredients, hence including it in
this category. Data on the sodium content of bread rolls is available on request for the years 2003, 2006 and 2011 (n=57). Rolls include white and brown varieties of products such as
Burger Buns, Baps, Baguettes, and Hot Dog Rolls etc; b White Breads include all varieties which include “white” in their main description such as Batch, Scotch Batch, Loaf,Barrell,
Turnover, Bloomer, Pan, Chleb Malopolski, Kings Bread, Crusty and Cob, excluding soda breads; c Brown Breads include all varieties which include “brown” in their main description
such as Batch, Loaf, Hi-Fibre, Wheatgerm, Wholegrain, Barrell, Multigrain, Crusty and Pan, excluding soda breads; d Wholemeal Breads include all varieties which include
“wholemeal” in their description and/or include descriptions such as Stoneground, Hi-Fibre, Wheaten, Wheat, Wholewheat, Granary, excluding soda breads; e Wholegrain Breads
include all varieties which include “wholegrain” in their description and/or include descriptions such as Multigrain, Healthy-Grain, Granary Malted, Granary, Cob, Rye, Scotch Batch,
Malted, Rustic Grain, Nutty, Stoneground, Hi-Fibre, Kibbled, Wholewheat, Cracked Wheat, Scotch Batch, Multigrain and Paco Granary, excluding soda breads; f Speciality Breads
include Ciabatta, Panini, Pitta Breads, Bagels, Corn Bread, Melba toast, Crumpets, Croissants and Procea; g Mixed Flour Breads are those varieties which mix white, wholemeal or
brown flours together. Products in this category are described as "Best of Both", "50:50 White", “Two in One” or "Goodness of Both" etc; h Unpackaged breads include various loose
breads, baguettes, rolls (seed, multigrain, diamond, pumpkin, cheese/onion etc), baps, ciabatta, Panini, whole unsliced loafs etc. Many of these breads are bought in a prepared raw
state and baked in-store. Many symbol group retailers and supermarket chains now sell these bread products through in-store bakeries; i Unless otherwise stated; j Includes 68 soda
bread samples and 57 bread roll samples. NA, results not available; NS, not significant; NT, not tested.
Table 14 Bread products (potassium in mg/100g)
Category a
Mean Potassium Content
Per Year of Survey
2003 to 2018 i
% Potassium
Content
Change (2003 to 2018) i
2015 to 2018 i
% Potassium Content
Change (2003 to 2018) i
2003 2006 2011 2013 2015 2018
White b 141 (24) 137 (24) 134 (22) 119 (7) 128 (13) 139 (20) NS ▼2 0.005 ▲9
Brown c 251 (43) 212 (32) 209 (27) 186 (29) 204 (16) 194 (37) 0.001 ▼22 NS ▼5
Wholemeal d
248 (37) 221(25) 229 (33) 432 (72) 242 (14) 240 (36) NS ▼3 NS ▼1
Monitoring Sodium and Potassium in Processed Foods
FOOD SAFETY AUTHORITY OF IRELAND Page 31 Page 31
Wholegrain e
232 (31) 196 (41) 198 (71) NT 256 (23) 202 (40) 0.043 ▼13 <0.001 ▼21
Speciality f 156 (55) NT 131 (24) NT 196 (53) NT NS ▲25
(2003 vs 2015) 0.050
(2011 vs 2015) ▲49
(2011 vs 2015)
Mixed Flour g
NT NT 167 (24) 400 (32) 172 (36) 162 (21) NS
(2011 v 2018)
▼3 NS ▼1
Unpackaged h
NT NT NT NT 149 (42) NT NA NA NA NA
Total Samples
100 178 186 123 142 97 Overall Total = 826 j
Results presented as means (standard deviations). a 2003 samples taken September 2003; 2006 samples taken November 2005 to January 2006; 2010/11 samples taken July 2010,
January 2011 and September 2011. Three samples representing three distinct batches and/or best-before dates were taken for 37 plant (industrial) bakery products in the 2011
survey. Data on the sodium content of soda breads is available on request for the years 2003, 2006 and 2011 (n=68). Soda Breads include all varieties which include “soda” in their
description including white and brown varieties. Some products did not include soda on the name/label but soda/sodium bicarbonate was included in ingredients, hence including it in
this category. Data on the sodium content of bread rolls is available on request for the years 2003, 2006 and 2011 (n=57). Rolls include white and brown varieties of products such as
Burger Buns, Baps, Baguettes, and Hot Dog Rolls etc; b White Breads include all varieties which include “white” in their main description such as Batch, Scotch Batch, Loaf, Barrell,
Turnover, Bloomer, Pan, Chleb Malopolski, Kings Bread, Crusty and Cob, excluding soda breads; c Brown Breads include all varieties which include “brown” in their main description
such as Batch, Loaf, Hi-Fibre, Wheatgerm, Wholegrain, Barrell, Multigrain, Crusty and Pan, excluding soda breads; d Wholemeal Breads include all varieties which include
“wholemeal” in their description and/or include descriptions such as Stoneground, Hi-Fibre, Wheaten, Wheat, Wholewheat, Granary, excluding soda breads; e Wholegrain Breads
include all varieties which include “wholegrain” in their description and/or include descriptions such as Multigrain, Healthy-Grain, Granary Malted, Granary, Cob, Rye, Scotch Batch,
Malted, Rustic Grain, Nutty, Stoneground, Hi-Fibre, Kibbled, Wholewheat, Cracked Wheat, Scotch Batch, Multigrain and Paco Granary, excluding soda breads; f Speciality Breads
include Ciabatta, Panini, Pitta Breads, Bagels, Corn Bread, Melba toast, Crumpets, Croissants and Procea; g Mixed Flour Breads are those varieties which mix white, wholemeal or
brown flours together. Products in this category are described as "Best of Both", "50:50 White", “Two in One” or "Goodness of Both" etc; h Unpackaged breads include various loose
breads, baguettes, rolls (seed, multigrain, diamond, pumpkin, cheese/onion etc), baps, ciabatta, Panini, whole unsliced loafs etc. Many of these breads are bought in a prepared raw
state and baked in-store. Many symbol group retailers and supermarket chains now sell these bread products through in-store bakeries; i Unless otherwise stated; j Includes 68 soda
bread samples and 57 bread roll samples. NA, results not available; NS, not significant; NT, not tested.
Monitoring Sodium and Potassium in Processed Foods
FOOD SAFETY AUTHORITY OF IRELAND Page 32 Page 32
Breakfast cereals
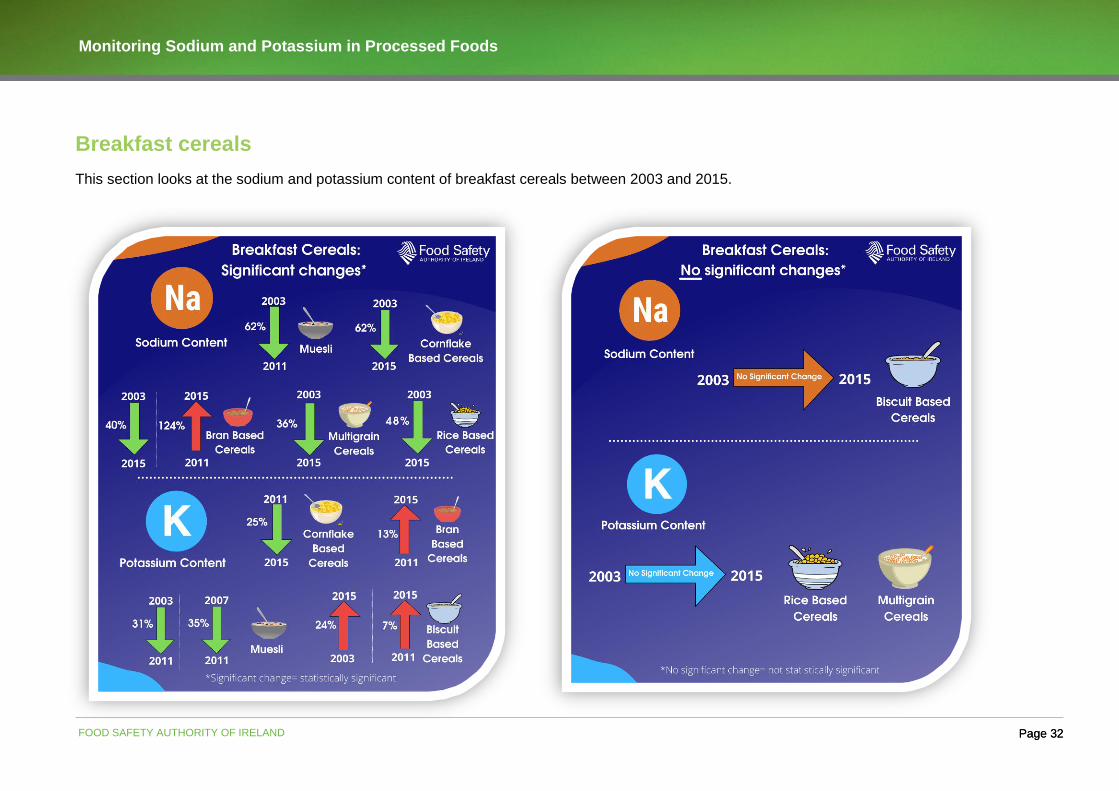
This section looks at the sodium and potassium content of breakfast cereals between 2003 and 2015.

Monitoring Sodium and Potassium in Processed Foods
FOOD SAFETY AUTHORITY OF IRELAND Page 33 Page 33
• Comparing 2003 and 2015, a significant reduction in sodium content was observed for all categories with the exception of biscuit based
cereals. no significant change in sodium content was observed comparing 2011 and 2015 with the exception of bran based cereals (increased
124%).
• A significant increase in potassium content was observed for biscuit based, muesli and all other cereal products (no added salt/low salt) (33%,
42% and 38% respectively).
• In all other cereal products, a significant reduction in potassium content was observed (38%).
Table 15 Breakfast cereals (sodium in mg/100g)
Category
Mean sodium content
Per year of survey 2003 vs 2015 i
% Sodium content change
(2003 vs 2015) i
2011 vs 2015 i
% Sodium content
change (2011 vs 2015)
i
2003 2007 2011 h 2015
Rice based cereals a
555 (168) 535 (215) 301 (79) 290 (90) < 0.001 ▼48 NS ▼4
Bran based cereals b
544 (174) 409 (156) 146 (176) 327 (65) 0.003 ▼40 <0.001 ▲124
Cornflake based cereals
c 718 (213) 551 (101) 309 (117) 276 (74) < 0.001 ▼62 NS ▼11
Biscuit based cereals d
275 (141) 268 (48) 218 (39) 241 (49) Ns ▼12 NS ▲10
Multigrain cereals e
534 (170) 348 (137) 277 (104) 343 (84) 0.015 ▼36 NS ▲24
Muesli f 119 (121) 55 (67) 45 (60) NT 0.03 ▼62
NS ▼19
All other cereal products g
5 (3) 26 (29) 32 (29) NT < 0.001
(2003 vs 2011) ▲481
(2003 vs 2011) NS
(2007 vs 2011) ▲22
(2007 vs 2011)

Monitoring Sodium and Potassium in Processed Foods
FOOD SAFETY AUTHORITY OF IRELAND Page 34 Page 34
(no added salt/low salt)
Total samples 88 119 330 150 Overall total = 687
Results presented as means (standard deviations). a Includes products which are rice based and/or have "Rice" in their main product description. For the year 2003 this category also
includes one corn based product. This category may also include some adult/health cereals which are based on rice; b Bran is the outer layer of cereals including corn (maize), rice,
oats, wheat, barley etc. and is typically produced as a by-product of milling This category includes products which have "Bran" in their main description and other related cereals which
contain bran such as Fruit & Fibre cereals 2003 (n = 3/9); 2007 (n = 7/20); 2011 (n=15/39) representing 5 individual products; c Includes products which have "Cornflake" or "Flake" in
their main description and includes varieties such as Frosted, Honey & Nut etc. Excludes those cornflake based products which have “Bran” in their description; d Includes products
which are predominately wheat/oat based and biscuit shaped; e Includes products which have more than one cereal grain in their ingredient listing. This category may also include
some cereal which contains other ingredients such as nuts and fruit; f Includes products which have "Muesli" in their product description and includes varieties with added fruit, nuts
and no-added sugar/sweetener; g Includes all cereal products which have no added salt i.e. results obtained reflect natural content and variation or levels of salt below 120mg/100g =
Low Sodium/Salt Regulation 1924/2006. This category includes samples of porridge which are also described as Wheatbran, Oatbran, Oatflakes, Oatlets, Oatmeal, Oat Cereal,
Pinhead etc. Other products in this category include various muesli, crunch cluster, wheat puff, Wholewheat, rice and bran based cereals; h The majority of products surveyed in 2011
were sampled three times with three distinct batches and/or best-before dates to provide more representative sampling of products. Total number of samples taken in this survey
number was 330. 14/330 of the samples were porridge products. Of the remaining 316 samples 98 products were sampled 3 or more times (3*98 =294 samples); 9 products were
sampled 2 times (9*2= 18 samples) and 2 products were sampled just once (2*1=2). Therefore a total of 109 individual products were sampled in the 2011 survey excluding porridge
products; i Unless otherwise stated. NS, not significant; NT, not tested.

Monitoring Sodium and Potassium in Processed Foods
FOOD SAFETY AUTHORITY OF IRELAND Page 35 Page 35
Table 16 Breakfast cereals (potassium in mg/100g)
Category
Mean content
Potassium per year of survey
2003 vs 2015 i
% Potassium
content
Change (2003 vs 2015) i
2011 vs 2015 i
% Potassium Content
Change (2011 vs 2015) i
2003 2007 2011 h 2015
Rice based cereals a 182 (73) 161 (58) 195 (75) 181 (72) NS ▼1 NS ▼7
Bran based cereals b 522 (135) 538 (175) 489 (132) 552 (110) NS ▲6 0.012 ▲13
Cornflake based cereals c
110 (61) 91 (31) 152 (104) 115 (90) NS ▲5 0.038 ▼25
Biscuit based cereals d 333 (62) 360 (25) 385 (41) 412 (25) 0.009 ▲24 0.010 ▲7
Multigrain cereals e 237 (63) 274 (79) 307 (108) 285 (120) Ns ▲20 NS ▼7
Muesli f 479 (140) 507 (104) 331 (130) NT 0.002
(2003 vs 2011)
▼31
(2003 vs 2011)
<0.001 (2007 vs
2011)
▼35 (2007 vs 2011)
All other cereal products g
(no added salt/low salt) 465 (256) 398 (189) 287 (87) NT
0.010 (2003 vs
2011)
▼38
(2003 vs 2011)
0.016 (2007 vs
2011)
▼28 (2007 vs 2011)
Total samples 88 119 330 150 Overall total = 687
Results presented as means (standard deviations). aIncludes products which are rice based and/or have "Rice" in their main product description. For the year 2003 this category also
includes one corn based product. This category may also include some adult/health cereals which are based on rice; b Bran is the outer layer of cereals including corn (maize), rice,
oats, wheat, barley etc. and is typically produced as a by-product of milling This category includes products which have "Bran" in their main description and other related cereals which
contain bran such as Fruit & Fibre cereals 2003 (n = 3/9); 2007 (n = 7/20); 2011 (n=15/39) representing 5 individual products; c Includes products which have "Cornflake" or "Flake" in
their main description and includes varieties such as Frosted, Honey & Nut etc. Excludes those cornflake based products which have “Bran” in their description; d Includes products
which are predominately wheat/oat based and biscuit shaped; e Includes products which have more than one cereal grain in their ingredient listing. This category may also include
some cereal which contains other ingredients such as nuts and fruit; f Includes products which have "Muesli" in their product description and includes varieties with added fruit, nuts
and no-added sugar/sweetener; g Includes all cereal products which have no added salt i.e. results obtained reflect natural content and variation or levels of salt below 120mg/100g =
Low Sodium/Salt Regulation 1924/2006. This category includes samples of porridge which are also described as Wheatbran, Oatbran, Oatflakes, Oatlets, Oatmeal, Oat Cereal,
Pinhead etc. Other products in this category include various muesli, crunch cluster, wheat puff, Wholewheat, rice and bran based cereals; h The majority of products surveyed in 2011

Monitoring Sodium and Potassium in Processed Foods
FOOD SAFETY AUTHORITY OF IRELAND Page 36 Page 36
were sampled three times with three distinct batches and/or best-before dates to provide more representative sampling of products. Total number of samples taken in this survey
number was 330. 14/330 of the samples were porridge products. Of the remaining 316 samples 98 products were sampled 3 or more times (3*98 =294 samples); 9 products were
sampled 2 times (9*2= 18 samples) and 2 products were sampled just once (2*1=2). Therefore a total of 109 individual products were sampled in the 2011 survey excluding porridge
products; i Unless otherwise stated.

Monitoring Sodium and Potassium in Processed Foods
FOOD SAFETY AUTHORITY OF IRELAND Page 37 Page 37
Spreadable fats
This section looks at the sodium and potassium content of spreadable fats between 2007 and 2015.
Monitoring Sodium and Potassium in Processed Foods
FOOD SAFETY AUTHORITY OF IRELAND Page 38 Page 38
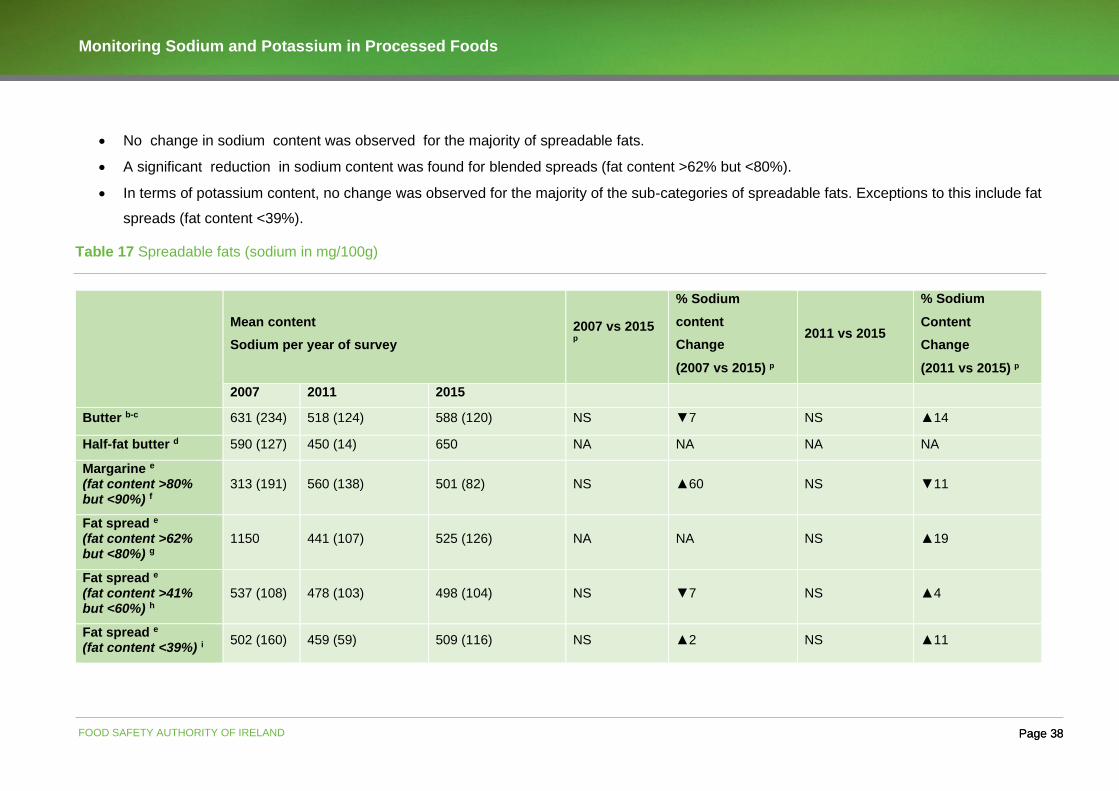
• No change in sodium content was observed for the majority of spreadable fats.
• A significant reduction in sodium content was found for blended spreads (fat content >62% but <80%).
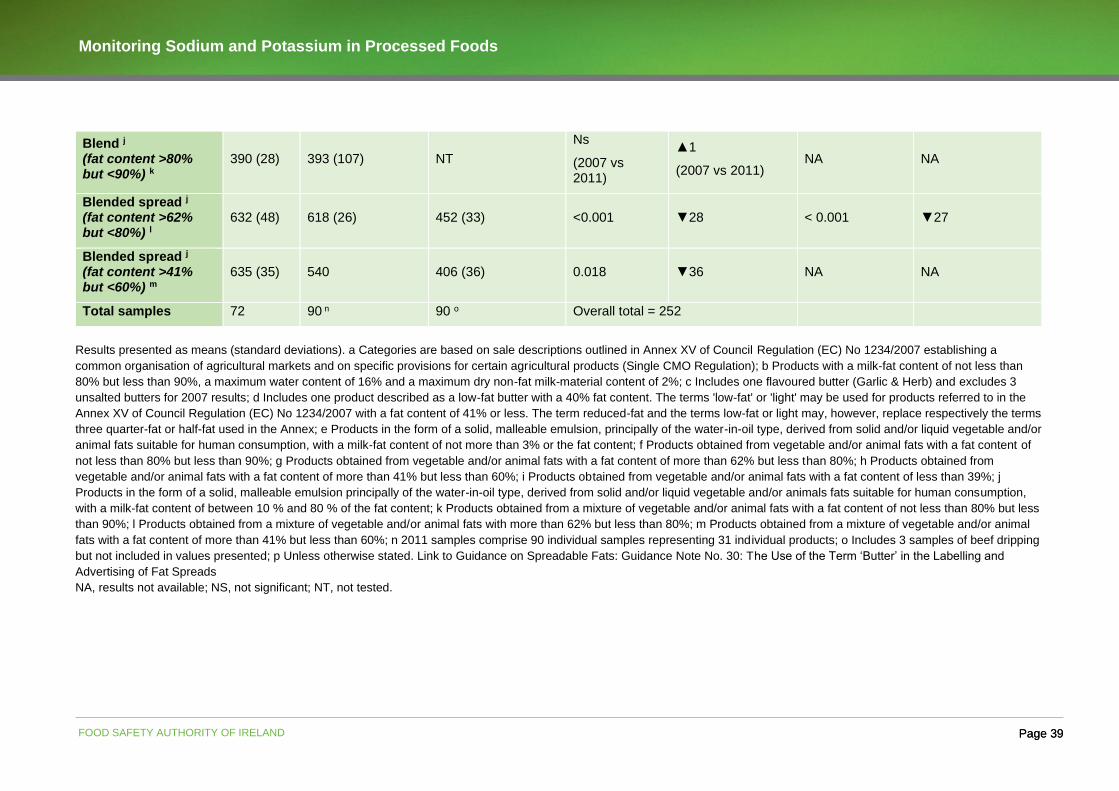
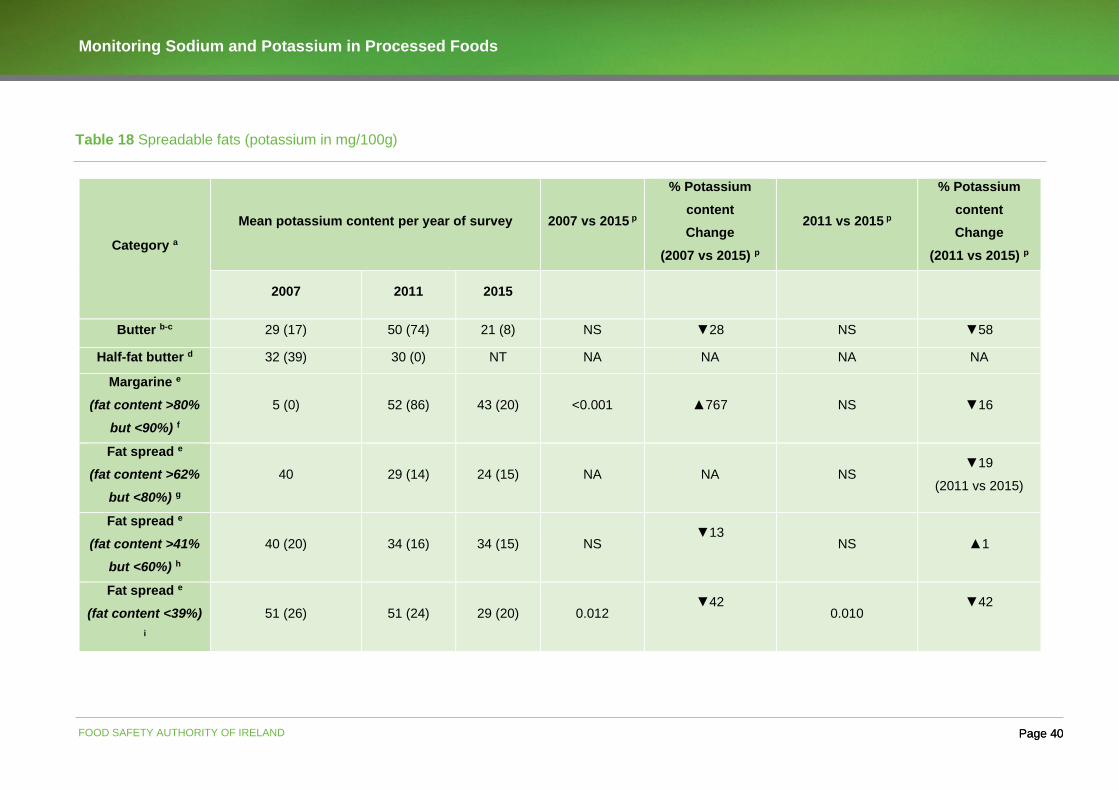
• In terms of potassium content, no change was observed for the majority of the sub-categories of spreadable fats. Exceptions to this include fat
spreads (fat content <39%).
Table 17 Spreadable fats (sodium in mg/100g)
Category a
Mean content
Sodium per year of survey
2007 vs 2015 p
% Sodium
content
Change
(2007 vs 2015) p
2011 vs 2015
% Sodium
Content
Change
(2011 vs 2015) p
2007 2011 2015
Butter b-c 631 (234) 518 (124) 588 (120) NS ▼7 NS ▲14
Half-fat butter d 590 (127) 450 (14) 650 NA NA NA NA
Margarine e (fat content >80% but <90%) f
313 (191) 560 (138) 501 (82) NS ▲60 NS ▼11
Fat spread e (fat content >62% but <80%) g
1150 441 (107) 525 (126) NA NA NS ▲19
Fat spread e (fat content >41% but <60%) h
537 (108) 478 (103) 498 (104) NS ▼7 NS ▲4
Fat spread e (fat content <39%) i
502 (160) 459 (59) 509 (116) NS ▲2 NS ▲11
Monitoring Sodium and Potassium in Processed Foods
FOOD SAFETY AUTHORITY OF IRELAND Page 39 Page 39
Blend j (fat content >80% but <90%) k
390 (28) 393 (107) NT
Ns
(2007 vs 2011)
▲1
(2007 vs 2011) NA NA
Blended spread j (fat content >62% but <80%) l
632 (48) 618 (26) 452 (33) <0.001 ▼28 < 0.001 ▼27
Blended spread j (fat content >41% but <60%) m
635 (35) 540 406 (36) 0.018 ▼36 NA NA
Total samples 72 90 n 90 o Overall total = 252
Results presented as means (standard deviations). a Categories are based on sale descriptions outlined in Annex XV of Council Regulation (EC) No 1234/2007 establishing a
common organisation of agricultural markets and on specific provisions for certain agricultural products (Single CMO Regulation); b Products with a milk-fat content of not less than
80% but less than 90%, a maximum water content of 16% and a maximum dry non-fat milk-material content of 2%; c Includes one flavoured butter (Garlic & Herb) and excludes 3
unsalted butters for 2007 results; d Includes one product described as a low-fat butter with a 40% fat content. The terms 'low-fat' or 'light' may be used for products referred to in the
Annex XV of Council Regulation (EC) No 1234/2007 with a fat content of 41% or less. The term reduced-fat and the terms low-fat or light may, however, replace respectively the terms
three quarter-fat or half-fat used in the Annex; e Products in the form of a solid, malleable emulsion, principally of the water-in-oil type, derived from solid and/or liquid vegetable and/or
animal fats suitable for human consumption, with a milk-fat content of not more than 3% or the fat content; f Products obtained from vegetable and/or animal fats with a fat content of
not less than 80% but less than 90%; g Products obtained from vegetable and/or animal fats with a fat content of more than 62% but less than 80%; h Products obtained from
vegetable and/or animal fats with a fat content of more than 41% but less than 60%; i Products obtained from vegetable and/or animal fats with a fat content of less than 39%; j
Products in the form of a solid, malleable emulsion principally of the water-in-oil type, derived from solid and/or liquid vegetable and/or animals fats suitable for human consumption,
with a milk-fat content of between 10 % and 80 % of the fat content; k Products obtained from a mixture of vegetable and/or animal fats with a fat content of not less than 80% but less
than 90%; l Products obtained from a mixture of vegetable and/or animal fats with more than 62% but less than 80%; m Products obtained from a mixture of vegetable and/or animal
fats with a fat content of more than 41% but less than 60%; n 2011 samples comprise 90 individual samples representing 31 individual products; o Includes 3 samples of beef dripping
but not included in values presented; p Unless otherwise stated. Link to Guidance on Spreadable Fats: Guidance Note No. 30: The Use of the Term ‘Butter’ in the Labelling and
Advertising of Fat Spreads
NA, results not available; NS, not significant; NT, not tested.
Monitoring Sodium and Potassium in Processed Foods
FOOD SAFETY AUTHORITY OF IRELAND Page 40 Page 40
Table 18 Spreadable fats (potassium in mg/100g)
Category a
Mean potassium content per year of survey 2007 vs 2015 p
% Potassium
content
Change
(2007 vs 2015) p
2011 vs 2015 p
% Potassium
content
Change
(2011 vs 2015) p
2007 2011 2015
Butter b-c 29 (17) 50 (74) 21 (8) NS ▼28 NS ▼58
Half-fat butter d 32 (39) 30 (0) NT NA NA NA NA
Margarine e
(fat content >80%
but <90%) f
5 (0) 52 (86) 43 (20) <0.001 ▲767 NS ▼16
Fat spread e
(fat content >62%
but <80%) g
40 29 (14) 24 (15) NA NA NS ▼19
(2011 vs 2015)
Fat spread e
(fat content >41%
but <60%) h
40 (20) 34 (16) 34 (15) NS ▼13
NS ▲1
Fat spread e
(fat content <39%)
i
51 (26) 51 (24) 29 (20) 0.012 ▼42
0.010
▼42

Monitoring Sodium and Potassium in Processed Foods
FOOD SAFETY AUTHORITY OF IRELAND Page 41 Page 41
Blend j
(fat content >80%
but <90%) k
20 (0) 20 (0) NT NA NA NA NA
Blended spread j
(fat content >62%
but <80%) l
42 (27) 58 (54) 28 (22) NS ▼35 NS ▼53
Blended spread j
(fat content >41%
but <60%) m
55 (21) 60 28 (11) NS ▼49 NA NA
Total samples 72 90 n 90 o Overall total = 252
Results presented as means (standard deviations). a Categories are based on sale descriptions outlined in Annex XV of Council Regulation (EC) No 1234/2007 establishing a
common organisation of agricultural markets and on specific provisions for certain agricultural products (Single CMO Regulation). Link to Spreadable Fats Legislation; b Products with
a milk-fat content of not less than 80% but less than 90%, a maximum water content of 16% and a maximum dry non-fat milk-material content of 2%; c Includes one flavoured butter
(Garlic & Herb) and excludes 3 unsalted butters for 2007 results; d Includes one product described as a low-fat butter with a 40% fat content. The terms 'low-fat' or 'light' may be used
for products referred to in the Annex XV of Council Regulation (EC) No 1234/2007 with a fat content of 41% or less. The term reduced-fat and the terms low-fat or light may, however,
replace respectively the terms three quarter-fat or half-fat used in the Annex; e Products in the form of a solid, malleable emulsion, principally of the water-in-oil type, derived from solid
and/or liquid vegetable and/or animal fats suitable for human consumption, with a milk-fat content of not more than 3% or the fat content; f Products obtained from vegetable and/or
animal fats with a fat content of not less than 80% but less than 90%; g Products obtained from vegetable and/or animal fats with a fat content of more than 62% but less than 80%; h
Products obtained from vegetable and/or animal fats with a fat content of more than 41% but less than 60%; i Products obtained from vegetable and/or animal fats with a fat content of
less than 39%; j Products in the form of a solid, malleable emulsion principally of the water-in-oil type, derived from solid and/or liquid vegetable and/or animals fats suitable for human
consumption, with a milk-fat content of between 10 % and 80 % of the fat content; k Products obtained from a mixture of vegetable and/or animal fats with a fat content of not less than
80% but less than 90%; l Products obtained from a mixture of vegetable and/or animal fats with more than 62% but less than 80%; m Products obtained from a mixture of vegetable
and/or animal fats with a fat content of more than 41% but less than 60%; n 2011 samples comprise 90 individual samples representing 31 individual products; o Includes 3 samples of
beef dripping but not included in values presented; p 2007 to 2011 values. Guidance on Spreadable Fats: Guidance Note No. 30: The Use of the Term ‘Butter’ in the Labelling and Advertising of
Fat Spreads
NA, results not available; NS, not significant; NT, not tested.

Monitoring Sodium and Potassium in Processed Foods
FOOD SAFETY AUTHORITY OF IRELAND Page 42 Page 42
Natural cheeses
This section looks at the sodium and potassium content of natural cheeses between 2009 and 2018.

Monitoring Sodium and Potassium in Processed Foods
FOOD SAFETY AUTHORITY OF IRELAND Page 43 Page 43
• The sodium content of mature cheese significantly reduced by 6% comparing 2009 and 2018.
• No changes in the sodium content of regular or reduced fat cheese were observed.
• In terms of potassium content, no significant changes for any of the sub-categories were observed.
Table 19 Natural cheeses (sodium in mg/100g)
Category
Mean sodium content per year of survey 2009 vs 2018
% sodium content Change
(2009 vs 2018)
2012 vs 2018
% sodium content Change
(2012 vs 2018)
2009 2012 2018
Regular b 731 (236) 641 (61) 633 (62) NS ▼13 NS ▼1
Mature c 667 (64) 651 (42) 625 (51) 0.031 ▼6 0.030 ▼4
Reduced fat d 756 (287) 637 (95) 652 (69) NS ▼14 NS ▲2
Total
samples 34 56 93 e Overall total = 183
Results presented as means (standard deviations). a Samples are predominately cheddar or cheddar based cheese products which are the most commonly consumed cheeses in
Ireland; b Regular includes both white and red/coloured cheddars which are labelled as smooth, creamy, medium or mild; c Mature includes both white and red/coloured cheddars
which are mature, extra mature or vintage; d Reduced fat includes both white and red/coloured cheddars or cheddar based cheese products which are labelled light, reduced, half-fat
etc; e Total samples comprise Regular = 33; Mature = 45 and Reduced Fat = 15. NS, not significant.

Monitoring Sodium and Potassium in Processed Foods
FOOD SAFETY AUTHORITY OF IRELAND Page 44 Page 44
Table 20 Natural cheese (potassium in mg/100g)
Category a
Mean potassium content per year of survey 2009 vs 2018
% Potassium content change
(2009 vs 2018)
2012 vs 2018
% Potassium content
Change
(2012 vs 2018)
2009 2012 2018
Regular b 96 (40) 76 (7) 80 (7) NS ▼16 NA ▲5
Mature c 83 (6) 79 (7) 80 (5) NS ▼4 NS ▲2
Reduced fat d 90 (13) 73 (6) 83 (6) NS ▼8 NS ▲13
Total samples
34 56 93 e Overall total = 183
Results presented as means (standard deviations). a Samples are predominately cheddar or cheddar based cheese products which are the most commonly consumed cheeses in
Ireland; b Regular includes both white and red/coloured cheddars which are labelled as smooth, creamy, medium or mild; c Mature includes both white and red/coloured cheddars
which are mature, extra mature or vintage; d Reduced fat includes both white and red/coloured cheddars or cheddar based cheese products which are labelled light, reduced, half-fat
etc; e Total samples comprise Regular = 33; Mature = 45 and Reduced Fat = 1. NS, not significant..
Monitoring Sodium and Potassium in Processed Foods
FOOD SAFETY AUTHORITY OF IRELAND Page 45 Page 45
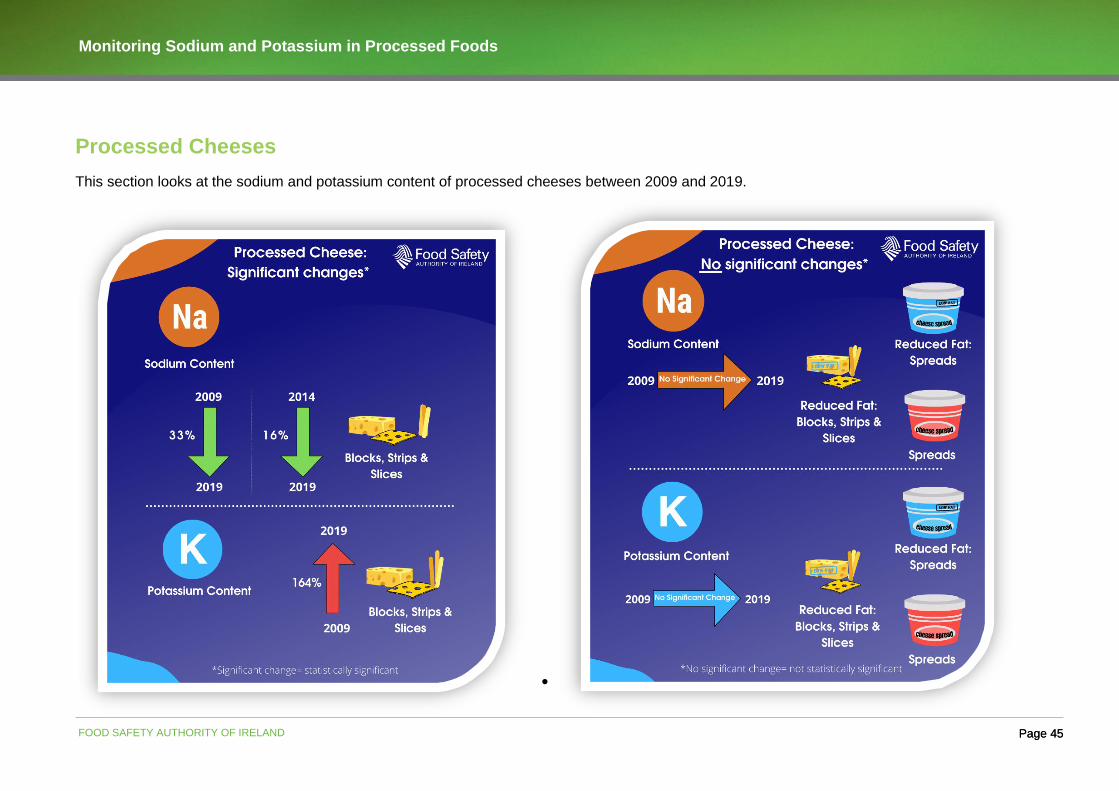
Processed Cheeses
This section looks at the sodium and potassium content of processed cheeses between 2009 and 2019.
•

Monitoring Sodium and Potassium in Processed Foods
FOOD SAFETY AUTHORITY OF IRELAND Page 46 Page 46
• A significant reduction in sodium content was observed for blocks, strips & slices between 2009 and 2019 (33%).
• No reductions in sodium content were found for any of the other sub-categories of processed cheese.
• A significant increase in potassium content was observed for blocks, strips & slices between 2009 and 2019 (164%).
• No changes in potassium content were found for any of the other sub-categories of processed cheese.
Table 21 Processed cheeses (sodium in mg/100g)
Category
Mean sodium content per year of survey
2009 vs 2019
% Sodium content Change
(2009 vs 2019)
2014 to 2019 % Sodium content
Change (2014 vs 2019)
2009 2014 f 2019
Blocks, strips & slices a-b
1095 (330) 867 (261) 732 (219) 0.001 ▼33 0.007 ▼16
Reduced fat: blocks, strips &
slices a-b 1298 (219) 836 (224) 942 (341) NS ▼27 NS ▲13
Spreads c 626 (392) 535 (252) 495 (294) NS ▼21 NS ▼7
Reduced fat: spreads d
612 (310) 376 (238) 396 (223) NS ▼35 NS ▲5
Snack packs e NT NT 591 (205) NA NA NS NA
Total samples
36 173 107 Overall total = 316
Results presented as means (standard deviations). a Includes white and red/coloured cheese slices individually wrapped or not; b Includes white and red/coloured cheese slices which
are light, reduced or half-fat, individually wrapped or not; c Includes white and red/coloured cheese spreads which individually portioned or not and cheese spreads with added
ingredients such as herbs, vegetables and meats and spreads used as cooking sauces; d Includes white and red/coloured cheese spreads which are light, reduced or half-fat,
individually wrapped or not and reduced fat cheese spreads with added ingredients such as herbs, vegetables and meats and spreads used as cooking sauces; e Snack Packs sub-
category include products of crackers/bread sticks with a portion of cheese included often aimed at children. Only the processed cheese portion of the product was analysed for
sodium content; f Taken between October and December 2014, comprising 82 branded and 91 private label samples. NA, results not available; NS, not significant.

Monitoring Sodium and Potassium in Processed Foods
FOOD SAFETY AUTHORITY OF IRELAND Page 47 Page 47
Table 22 Processed cheeses (potassium in mg/100g)
Category
Mean potassium content per year of survey 2009 vs 2019
% Sodium content Change
(2009 vs 2019)
2014 vs 2019
% Sodium content Change
(2014 vs 2019)
2009 2014 f 2019
Blocks, strips & slices a-b
88 (34) 162 (187) 232 (255) 0.001 ▲164 NS ▲44
Reduced fat: blocks, strips &
slices a-b 150 (70) 255 (221) 148 (78) NS ▼1 NS ▼42
Spreads c 164 (76) 206 (143) 162 (67) NS ▼1 NS ▼21
Reduced fat: spreads d
192 (37) 181 (98) 238 (196) NS ▲24 NS ▲32
Snack packs e NT NT 316 (189) NA NA NA NA
Total samples
36 173 107 Overall total = 316
Results presented as means (standard deviations). a Includes white and red/coloured cheese slices individually wrapped or not; b Includes white and red/coloured cheese slices which
are light, reduced or half-fat, individually wrapped or not; c Includes white and red/coloured cheese spreads which individually portioned or not and cheese spreads with added
ingredients such as herbs, vegetables and meats and spreads used as cooking sauces; d Includes white and red/coloured cheese spreads which are light, reduced or half-fat,
individually wrapped or not and reduced fat cheese spreads with added ingredients such as herbs, vegetables and meats and spreads used as cooking sauces; e Snack Packs sub-
category include products of crackers/bread sticks with a portion of cheese included often aimed at children. Only the processed cheese portion of the product was analysed for
sodium content; f Taken between October and December 2014, comprising 82 branded and 91 private label sample. NA, results not available; NS, not significant.

Monitoring Sodium and Potassium in Processed Foods
FOOD SAFETY AUTHORITY OF IRELAND Page 48 Page 48
Condiments
• As Condiments were sampled for the first time in 2017, no changes in sodium and potassium contents can be investigated until the next
sampling point.
Table 23 Condiments (Sodium in mg/100g)
Category a
Sodium content per year of survey
2017 f
Ketchup b 681 (294)
Salad cream c 581 (78)
Mayonnaise d 544 (125)
Brown sauce e 444 (325)
Total samples 157
Results presented as means (standard deviations). a All products sampled and analysed in triplicate [exception one branded tomato ketchup product only available as a single
sample]; b Six branded products produced by four manufacturers and twelve private label products from six retailers; c Two branded products produced by one manufacturer and
seven private label products from four retailers; d Four branded products produced by two manufacturers and twelve private label products from six retailers; e Four branded products
produced by three manufacturers and six private label products from five retailers; f Samples taken in August 2017. NA, results not available.

Monitoring Sodium and Potassium in Processed Foods
FOOD SAFETY AUTHORITY OF IRELAND Page 49 Page 49
Table 24 Condiments (potassium in mg/100g)
Category a Potassium content per year of survey
2017 f
Ketchup b 386 (135)
Salad cream c 27 (8)
Mayonnaise d 29 (17)
Brown sauce e 144 (94)
Total samples 157
a All products sampled and analysed in triplicate [exception one branded tomato ketchup product only available as a single sample] b Six branded products produced by four manufacturers and twelve private label products from six retailers. c Two branded products produced by one manufacturer and seven private label products from four retailers d Four branded products produced by two manufacturers and twelve private label products from six retailers e Four branded products produced by three manufacturers and six private label products from five retailers f Samples taken in August 2017

Monitoring Sodium and Potassium in Processed Foods
FOOD SAFETY AUTHORITY OF IRELAND
Page 50
Page 50
Results from out-of-home sources of salt sampling
Pre-packaged sandwiches
Table 25 Pre-packaged sandwiches (sodium and potassium in mg/100g)
Category
Sodium content per year of survey
Potassium content per year of survey
2020 2020
Blt 492 (66) 199 (44)
Ham & cheese 541 (56) 186 (35)
Total samples 20
Results presented as means (standard deviations). Blt bacon, lettuce & tomato
Fried foods
Table 26 Fried foods (sodium and potassium in mg/100g)
Category
Sodium content per year of survey
Potassium content per year of survey
2020 2020
Fried foodsa 168 (91) 428 (119)
Total samples 8
Results presented as means (standard deviations). a selection of fried foods that were collected as part of a separate
FSAI survey were analysed for sodium and potassium content per 100g. Samples included deep-fried foods including
fish, battered sausage, battered burget and breaded chicken goujons.

Monitoring Sodium and Potassium in Processed Foods
FOOD SAFETY AUTHORITY OF IRELAND
Page 51
Page 51
References
Federici, C., Detzel, P., Petracca, F., Dainelli, L. and Fattore, G. (2019) 'The impact of food
reformulation on nutrient intakes and health, a systematic review of modelling studies', BMC Nutr,
5, pp. 2.
FSAI (2020a) Salt and Health. Available at:
https://www.fsai.ie/science_and_health/salt_and_health.html (Accessed: 20/12 2020).
FSAI (2020b) Salt Reduction Programme - 10 years of progress. Available at:
https://www.fsai.ie/science_and_health/salt_and_health/salt_seminar_2013.html (Accessed: 20/12
2020).
GBD 2015 Risk Factors Collaborators (2016) 'Global, regional, and national comparative risk
assessment of 79 behavioural, environmental and occupational, and metabolic risks or clusters of
risks, 1990-2015: a systematic analysis for the Global Burden of Disease Study 2015', Lancet,
388(10053), pp. 1659-1724.
Harnack, L. J., Cogswell, M. E., Shikany, J. M., Gardner, C. D., Gillespie, C., Loria, C. M., Zhou,
X., Yuan, K. and Steffen, L. M. (2017) 'Sources of Sodium in US Adults From 3 Geographic
Regions', Circulation, 135(19), pp. 1775-1783.
Hyseni, L., Elliot-Green, A., Lloyd-Williams, F., Kypridemos, C., O'Flaherty, M., McGill, R., Orton,
L., Bromley, H., Cappuccio, F. P. and Capewell, S. (2017) 'Systematic review of dietary salt
reduction policies: Evidence for an effectiveness hierarchy?', PLoS One, 12(5), pp. e0177535.
NICE (2010) Guidance on the prevention of cardiovascular disease at the population level.
Available at: http://www.guidance.nice.org.uk/PH25.

Monitoring Sodium and Potassium in Processed Foods
FOOD SAFETY AUTHORITY OF IRELAND
Page 52
Page 51
Acknowledgements
The Food Safety Authority of Ireland would like to acknowledge the role played by the Public
Analyst Laboratory in Galway in providing the analysis of products sampled in all surveys between
2003 and 2020.

Food Safety Authority of Ireland
The Exchange, George’s Dock, IFSC,
Dublin 1, D01 P2V6
T +353 1 817 1300
Join us on LinkedIn
Follow us on Twitter @FSAIinfo
Say hi on Facebook
Visit us on Instagram
Subscribe to our YouTube channel
www.fsai.ie