TRUPACT-II Matrix Depletion Program Final Report
227
INEL/EXT-98-00987 Rev. 1 TRUPACT-II Matrix Depletion Program Final Report October 1999 Idaho National Engineering and Environmental Laboratory Bechtel BWXT Idaho, LLC Transuranic Waste Programs Idaho Falls, Idaho 83415 Developed in conjunction with Benchmark Environmental Corporation Under Subcontract No. C90-132787 Prepared for the U.S. Department of Energy, Assistant Secretary for Environmental Restoration and Waste Management Under DOE-Idaho Operations Office Contract No. DE-AC07-99ID13727
-
Upload
khangminh22 -
Category
Documents
-
view
0 -
download
0
Transcript of TRUPACT-II Matrix Depletion Program Final Report

INEL/EXT-98-00987Rev. 1
TRUPACT-II Matrix Depletion ProgramFinal Report
October 1999
Idaho National Engineering and Environmental LaboratoryBechtel BWXT Idaho, LLC
Transuranic Waste ProgramsIdaho Falls, Idaho 83415
Developed in conjunction withBenchmark Environmental Corporation
Under Subcontract No. C90-132787
Prepared for theU.S. Department of Energy, Assistant Secretary forEnvironmental Restoration and Waste Management
Under DOE-Idaho Operations OfficeContract No. DE-AC07-99ID13727

ii
ABSTRACT
This final report documents the three-year long Matrix Depletion Program (MDP), a cooperativeeffort performed by representatives of the Idaho National Engineering and Environmental Laboratory, LosAlamos National Laboratory, and the Rocky Flats Environmental Technology Site for the U.S. Departmentof Energy Carlsbad Area Office. The MDP determined the dose-dependent gas generating potential, or G-value, for material types defined in the Safety Analysis Report for the TRUPACT-II Shipping Package(SARP). The MDP was designed with three integral components; laboratory experiments to determineeffective G-value with respect to dose for several material matrices, comparisons to hydrogen gas generationmeasurements in real waste drums, and theoretical modeling to confirm the current understanding of matrixdepletion mechanisms. The MDP determined that the dose dependent G-values (“G” value decreases withaccumulated dose) for waste types II and III are substantially lower than the initial bounding G-values usedin the TRUPACT-II SARP.

iii
EXECUTIVE SUMMARY
The Transuranic Package Transporter-II (TRUPACT-II) Matrix Depletion Program (MDP) wasestablished as a joint venture of the U.S. Department of Energy (DOE) National Transuranic (TRU) Programand the DOE Mixed Waste Focus Area, with the objective of investigating the phenomenon of matrixdepletion and arriving at dose dependent G-values for contact-handled (CH) TRU waste material types.Matrix depletion is the reduction in the gas generating potential, or effective G-value, of a target material.Effective G-value is the gas generation potential of a specific material or matrix due to exposure to ionizingradiation. From experimental and empirical results available prior to the MDP, it was known that matrixdepletion decreases the rate of hydrogen gas generation inside CH TRU waste containers. Quantification ofthe dose-dependent behavior of the effective G-values (i.e., hydrogen gas generation rates within wastecontainers) is expected to support justifications for greater wattage limits for CH TRU waste and, ultimately,a revised TRUPACT-II Safety Analysis Report for the TRUPACT-II Shipping Package (TRUPACT-IISARP) (U.S. Nuclear Regulatory Commission [NRC] 1996). Increased wattage limits will allow shipmentof a much greater portion of the current TRU waste inventory.
This report documents TRUPACT-II MDP activities completed during the three-year duration ofthe program. To confirm earlier reports of the dose dependency of effective G-values, the MDP comprisedthree major elements:
C Laboratory experiments for the assessment of effective G-value as a function of dose for severalmatrices and the effects of experimental conditions, including isotope and heating. These results areused to determine a dose dependent G-value that is a statistically derived conservative estimate oneffective G-value by waste material type.
C Measurements of effective G-values and hydrogen concentrations in real waste and comparisonswith MDP effective G-values. These data are used to show that the MDP dose dependent G-valuesare conservative estimators of actual waste material type effective G-values.
C Theoretical analyses using a numerical model that calculates effective G-value as a function of doseby explicitly incorporating fundamental nuclear and molecular mechanisms that result in thegeneration of hydrogen. The analyses are used to show that the current understanding of thesemechanisms, which result in hydrogen generation and matrix depletion, yields results that areconsistent with experimental measurements.
Supporting programs that provided data for comparison with the MDP experiment results, which are theIdaho National Engineering and Environmental Laboratory (INEEL) Gas Generation Test Program (GGTP),the Rocky Flats Environmental Technology Site (RFETS) GGTP, and the TRU Waste CharacterizationProgram (TWCP), are also described.
The MDP was successful in quantifying the dose dependent G-values of waste materials as a resultof matrix depletion. The matrix depletion experiments comprised test cylinders containing polyethylene (PE),wet and dry cellulose, polyvinyl chloride (PVC), and Envirostone matrices impregnated with either Pu or238
Pu radioactive source material. Some cylinders were heated to simulate conditions encountered during239
CH TRU waste transportation and handling. Several sets of cylinders with stable effective G-values andreduced oxygen concentrations were evacuated and backfilled to ambient air oxygen concentrations tosimulate conditions in actual vented drums. Data were collected over a 24-month period, at approximatelybiweekly intervals, totaling 34 sampling episodes.

iv
The dose dependent G-values were compared with results from other experimental programs andwith current TRUPACT-II SARP initial bounding G-values. To enhance the understanding of the matrixdepletion phenomenon, provide input to experimental procedures, and support comparisons to otherexperimental programs, an approach for conducting an uncertainty analysis of effective G-value calculations,as well as two computer models, were developed. One computer model, based on theoretical radiolyticprocesses, illustrates matrix depletion and gas generation in target matrices. The other computer model wasused to simulate hydrogen and methane generation, accumulation, and transport across layers of confinementin waste containers using MDP effective G-values.
Analyses of MDP experimental data indicate that dose dependent G-values lie between 14% (UCL95
value for wet cellulose) and 38% (UTL value for PE) of the applicable TRUPACT-II SARP values,95
depending on the waste material, including those calculated from heated cylinders (e.g., wet cellulose iscomparable to waste material type III-1, solid organic materials). In general, the data patterns are consistentwith theoretical expectations for G-value behavior over time for different waste materials. Mass spectrometeranalyses conducted periodically are in agreement with gas chromatograph analyses used in the experiments.
The MDP effects analysis indicated that only the waste matrix has a significant effect on theeffective G-value. At the 95% confidence level, isotope and temperature (i.e., heating) did not havesignificant effects on the effective G-values. G-value statistics for each waste matrix tested were obtained.Comparisons with actual drum data demonstrate that the MDP G-values are, in fact, greater than the G-values measured in real waste.
The information and results presented in this report may be used to support applications to revisethe appropriate sections of the TRUPACT-II SARP and TRUPACT-II Authorized Methods of Packaging(TRAMPAC) to explain and account for the matrix depletion phenomenon. The original TRUPACT-II SARPinitial bounding G-values will be used to establish the wattage limits for newly generated containers. Whena container has attained an adequate dose level (in Watt @ yr), the lower G-values resulting from the MDPwould be used to establish the allowable wattage for dose-dependent effective containers.
In summary, the MDP testing has demonstrated matrix depletion in simulated TRU waste materials,and the effects of key parameters have been quantified. A theoretical model of the matrix depletionphenomenon has been validated with experimental data. The dose dependent G-values are reproducible,consistent with earlier results, and fall within theoretically predicted bounds. The data demonstrateconsistency with TRUPACT-II SARP limits for waste type I. Reduced effective G-values can be supportedfor waste types II and III after an adequate dose has been received and can be used to support a revision tothe TRUPACT-II SARP.

v
CONTENTS
ABSTRACT . . . . . . . . . . . . . . . . . . . . . . . . . . . . . . . . . . . . . . . . . . . . . . . . . . . . . . . . . . . . . . . . . . . . . ii
EXECUTIVE SUMMARY . . . . . . . . . . . . . . . . . . . . . . . . . . . . . . . . . . . . . . . . . . . . . . . . . . . . . . . . . iii
TABLES . . . . . . . . . . . . . . . . . . . . . . . . . . . . . . . . . . . . . . . . . . . . . . . . . . . . . . . . . . . . . . . . . . . . . . viii
FIGURES . . . . . . . . . . . . . . . . . . . . . . . . . . . . . . . . . . . . . . . . . . . . . . . . . . . . . . . . . . . . . . . . . . . . . . . ix
ACRONYMS . . . . . . . . . . . . . . . . . . . . . . . . . . . . . . . . . . . . . . . . . . . . . . . . . . . . . . . . . . . . . . . . . . . . x
DEFINITIONS . . . . . . . . . . . . . . . . . . . . . . . . . . . . . . . . . . . . . . . . . . . . . . . . . . . . . . . . . . . . . . . . . . xii
1.0 INTRODUCTION . . . . . . . . . . . . . . . . . . . . . . . . . . . . . . . . . . . . . . . . . . . . . . . . . . . . . . . . . . . . 1-1
1.1 Background . . . . . . . . . . . . . . . . . . . . . . . . . . . . . . . . . . . . . . . . . . . . . . . . . . . . . . . . . . 1-2
1.2 Objectives . . . . . . . . . . . . . . . . . . . . . . . . . . . . . . . . . . . . . . . . . . . . . . . . . . . . . . . . . . . 1-4
1.3 Program Description . . . . . . . . . . . . . . . . . . . . . . . . . . . . . . . . . . . . . . . . . . . . . . . . . . . 1-4
1.3.1 Dose . . . . . . . . . . . . . . . . . . . . . . . . . . . . . . . . . . . . . . . . . . . . . . . . . . . . . . . . 1-7
1.3.2 Matrix Materials . . . . . . . . . . . . . . . . . . . . . . . . . . . . . . . . . . . . . . . . . . . . . . . 1-7
1.3.3 Moisture . . . . . . . . . . . . . . . . . . . . . . . . . . . . . . . . . . . . . . . . . . . . . . . . . . . . . 1-7
1.3.4 Temperature . . . . . . . . . . . . . . . . . . . . . . . . . . . . . . . . . . . . . . . . . . . . . . . . . . 1-7
1.3.5 Agitation . . . . . . . . . . . . . . . . . . . . . . . . . . . . . . . . . . . . . . . . . . . . . . . . . . . . 1-8
1.3.6 Particle Size Distribution . . . . . . . . . . . . . . . . . . . . . . . . . . . . . . . . . . . . . . . . 1-8
1.3.7 Isotopic Composition . . . . . . . . . . . . . . . . . . . . . . . . . . . . . . . . . . . . . . . . . . . 1-8
1.3.8 Initial Bounding versus Dose Dependent Effective G-values . . . . . . . . . . . . . 1-8
2.0 MATRIX DEPLETION PROGRAM . . . . . . . . . . . . . . . . . . . . . . . . . . . . . . . . . . . . . . . . . . . . . . 2-1
2.1 Laboratory Experiments . . . . . . . . . . . . . . . . . . . . . . . . . . . . . . . . . . . . . . . . . . . . . . . . . 2-1
2.1.1 Experimental Design . . . . . . . . . . . . . . . . . . . . . . . . . . . . . . . . . . . . . . . . . . . . 2-1
2.1.2 Implementation . . . . . . . . . . . . . . . . . . . . . . . . . . . . . . . . . . . . . . . . . . . . . . . . 2-2
2.1.3 Quality Control . . . . . . . . . . . . . . . . . . . . . . . . . . . . . . . . . . . . . . . . . . . . . . . 2-5
2.2 Real Waste Measurements . . . . . . . . . . . . . . . . . . . . . . . . . . . . . . . . . . . . . . . . . . . . . . . 2-6

vi
2.2.1 Gas Generation Testing Program at the Idaho National Engineering and Environmental Laboratory . . . . . . . . . . . . . . . . . . . . . . . . . . . . . . . . . . . . . . . . . . 2-6
2.2.2 Gas Generation Testing Program at the Rocky Flats Environmental Technology Site . . . . . . . . . . . . . . . . . . . . . . . . . . . . . . . . . . . . . . . . . . . . . . . . . . . . . 2-6
2.2.3 Transuranic Waste Characterization Program . . . . . . . . . . . . . . . . . . . . . . . . . . . . . . 2-7
2.2.4 NEWGVALS . . . . . . . . . . . . . . . . . . . . . . . . . . . . . . . . . . . . . . . . . . . . . . . . . . . . . . . 2-8
2.3 Theoretical Analyses . . . . . . . . . . . . . . . . . . . . . . . . . . . . . . . . . . . . . . . . . . . . . . . . . . . . . . 2-8
2.4 Quality Assurance . . . . . . . . . . . . . . . . . . . . . . . . . . . . . . . . . . . . . . . . . . . . . . . . . . . . . . . . 2-9
2.4.1 LANL Matrix Depletion Experiments . . . . . . . . . . . . . . . . . . . . . . . . . . . . . . . . . . . . . 2-9
2.4.2 INEEL and RFETS TWCP and GGTP . . . . . . . . . . . . . . . . . . . . . . . . . . . . . . . . . . . 2-10
2.4.3 Program Interfaces . . . . . . . . . . . . . . . . . . . . . . . . . . . . . . . . . . . . . . . . . . . . . . . . . . 2-10
3.0 RELATED STUDIES . . . . . . . . . . . . . . . . . . . . . . . . . . . . . . . . . . . . . . . . . . . . . . . . . . . . . . . . 3-1
3.1 The Zerwekh/Kosiewicz Experiments . . . . . . . . . . . . . . . . . . . . . . . . . . . . . . . . . . . . . . . . . 3-1
3.2 The Marshall/Smith/Cappis Experiments . . . . . . . . . . . . . . . . . . . . . . . . . . . . . . . . . . . . . . 3-1
3.2.1 Test Canisters . . . . . . . . . . . . . . . . . . . . . . . . . . . . . . . . . . . . . . . . . . . . . . . . . . . . . . 3-1
3.2.2 TA-55 Waste Drums . . . . . . . . . . . . . . . . . . . . . . . . . . . . . . . . . . . . . . . . . . . . . . . . . 3-4
4.0 MDP RESULTS . . . . . . . . . . . . . . . . . . . . . . . . . . . . . . . . . . . . . . . . . . . . . . . . . . . . . . . . . . . . . 4-1
4.1 Laboratory Experiments . . . . . . . . . . . . . . . . . . . . . . . . . . . . . . . . . . . . . . . . . . . . . . . . . . . 4-1
4.2 Real Waste Measurements . . . . . . . . . . . . . . . . . . . . . . . . . . . . . . . . . . . . . . . . . . . . . . . . . 4-2
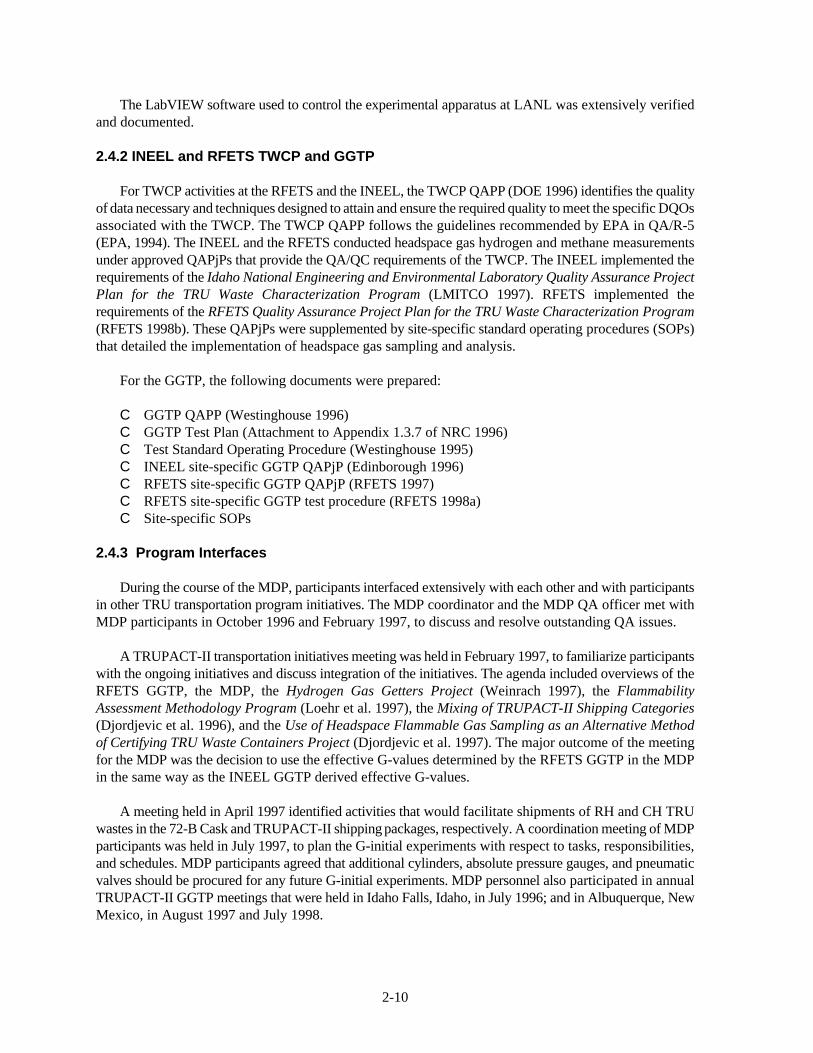
4.2.1 GGTP Results . . . . . . . . . . . . . . . . . . . . . . . . . . . . . . . . . . . . . . . . . . . . . . . . . . . . . . 4-8
4.2.2 TWCP Results . . . . . . . . . . . . . . . . . . . . . . . . . . . . . . . . . . . . . . . . . . . . . . . . . . . . . . 4-8
4.3 Theoretical Analyses . . . . . . . . . . . . . . . . . . . . . . . . . . . . . . . . . . . . . . . . . . . . . . . . . . . . . 4-10
4.4 Synthesis and Comparison to TRUPACT-II SARP Values . . . . . . . . . . . . . . . . . . . . . . . . 4-14
5.0 CONCLUSIONS . . . . . . . . . . . . . . . . . . . . . . . . . . . . . . . . . . . . . . . . . . . . . . . . . . . . . . . . . . . . 5-1
5.1 Dose . . . . . . . . . . . . . . . . . . . . . . . . . . . . . . . . . . . . . . . . . . . . . . . . . . . . . . . . . . . . . . . . . . 5-1
5.2 Matrix Materials . . . . . . . . . . . . . . . . . . . . . . . . . . . . . . . . . . . . . . . . . . . . . . . . . . . . . . . . . 5-1

vii
5.3 Moisture . . . . . . . . . . . . . . . . . . . . . . . . . . . . . . . . . . . . . . . . . . . . . . . . . . . . . . . . . . . . . . . . 5-1
5.4 Temperature . . . . . . . . . . . . . . . . . . . . . . . . . . . . . . . . . . . . . . . . . . . . . . . . . . . . . . . . . . . . . 5-1
5.5 Agitation . . . . . . . . . . . . . . . . . . . . . . . . . . . . . . . . . . . . . . . . . . . . . . . . . . . . . . . . . . . . . . . . 5-2
5.6 Particle Size Distribution . . . . . . . . . . . . . . . . . . . . . . . . . . . . . . . . . . . . . . . . . . . . . . . . . . . 5-2
5.7 Isotopic Composition . . . . . . . . . . . . . . . . . . . . . . . . . . . . . . . . . . . . . . . . . . . . . . . . . . . . . . 5-2
5.8 Initial versus Dose Dependent G-values . . . . . . . . . . . . . . . . . . . . . . . . . . . . . . . . . . . . . . . . 5-2
5.9 The Path Forward . . . . . . . . . . . . . . . . . . . . . . . . . . . . . . . . . . . . . . . . . . . . . . . . . . . . . . . . . 5-2
5.10 Summary . . . . . . . . . . . . . . . . . . . . . . . . . . . . . . . . . . . . . . . . . . . . . . . . . . . . . . . . . . . . . . . 5-3
6.0 REFERENCES . . . . . . . . . . . . . . . . . . . . . . . . . . . . . . . . . . . . . . . . . . . . . . . . . . . . . . . . . . . . . . . 6-1
APPENDICES
A Results of TRUPACT-II Matrix Depletion Program Experiments . . . . . . . . . . . . . . . . . . . . . . . A-1
B TARMATDEP Model Description and Validation Results . . . . . . . . . . . . . . . . . . . . . . . . . . . . B-1
C NEWGVALS Model Description and Evaluation Results . . . . . . . . . . . . . . . . . . . . . . . . . . . . . C-1
D Results of the Gas Generation Testing Program at the Rocky Flats EnvironmentalTechnology Site . . . . . . . . . . . . . . . . . . . . . . . . . . . . . . . . . . . . . . . . . . . . . . . . . . . . . . . . . . . . . D-1
E Postirradiation Examination . . . . . . . . . . . . . . . . . . . . . . . . . . . . . . . . . . . . . . . . . . . . . . . . . . . . E-1

viii
TABLES
1-1 Summary of CH TRU payload waste types. . . . . . . . . . . . . . . . . . . . . . . . . . . . . . . . . . . . . . . . . 1-3
1-2 Summary of CH TRU waste material types. . . . . . . . . . . . . . . . . . . . . . . . . . . . . . . . . . . . . . . . 1-3
1-3 Matrix of MDP participants and responsibilities. . . . . . . . . . . . . . . . . . . . . . . . . . . . . . . . . . . . 1-5
2-1 Test matrix (number of cylinders of each experimental setting). . . . . . . . . . . . . . . . . . . . . . . . . 2-1
2-2 Number of RFETS GGTP drums used in the MDP analyses. . . . . . . . . . . . . . . . . . . . . . . . . . . 2-7
2-3 Number of TWCP samples used in the MDP analyses. . . . . . . . . . . . . . . . . . . . . . . . . . . . . . . . 2-8
4-1 Experimental G-value Statistics (molecules/100 eV). . . . . . . . . . . . . . . . . . . . . . . . . . . . . . . . . 4-1
4-2 Statistics for comparisons of TWCP headspace sampling data and predictions made using experimentally derived G-values. . . . . . . . . . . . . . . . . . . . . . . . . . . . . . . . . . . . . . . . . . . . . . . . 4-9
4-3 Comparison of dose dependent G-values to TRUPACT-II SARP initial bounding G-values. . 4-15

ix
FIGURES
2-1 Schematic of the MDP experimental setup. . . . . . . . . . . . . . . . . . . . . . . . . . . . . . . . . . . . . . . . . 2-3
3-1 Marshall/Smith/Cappis experimental data (PE, G-value vs. time). . . . . . . . . . . . . . . . . . . . . . . . 3-2
3-2 Marshall/Smith/Cappis experimental data (PE, G-value vs. dose). . . . . . . . . . . . . . . . . . . . . . . . 3-2
3-3 Marshall/Smith/Cappis experimental data (cellulose, G-value vs. time). . . . . . . . . . . . . . . . . . . 3-3
3-4 Marshall/Smith/Cappis experimental data (cellulose, G-value vs. dose). . . . . . . . . . . . . . . . . . . 3-3
4-1 Graph of G-value versus accumulated dose for cement matrix. . . . . . . . . . . . . . . . . . . . . . . . . . . 4-3
4-2 Graph of G-value versus accumulated dose for dry cellulose matrix. . . . . . . . . . . . . . . . . . . . . . 4-4
4-3 Graph of G-value versus accumulated dose for wet cellulose matrix. . . . . . . . . . . . . . . . . . . . . . 4-5
4-4 Graph of G-value versus accumulated dose for PVC matrix. . . . . . . . . . . . . . . . . . . . . . . . . . . . 4-6
4-5 Graph of G-value versus accumulated dose for PE matrix. . . . . . . . . . . . . . . . . . . . . . . . . . . . . . 4-7
4-6 Comparison of LANL MDP short-term experimental data with TARMATDEP model. . . . . . . 4-11
4-7 Comparison of LANL MDP short-term experimental data with TARMATDEPpredictive range. . . . . . . . . . . . . . . . . . . . . . . . . . . . . . . . . . . . . . . . . . . . . . . . . . . . . . . . . . . . . 4-12
4-8 Comparison of LANL MDP long-term experimental data with TARMATDEP model. . . . . . . 4-13
x
ACRONYMS
ALARA as low as reasonably achievableCAO Carlsbad Area OfficeCFR Code of Federal RegulationsCH TRU contact-handled transuranicCMR Chemistry and Metallurgy ResearchCOC Certificate of ComplianceDOE U. S. Department of EnergyDQO data quality objectiveEPA U.S. Environmental Protection AgencyeV electron volt(s)FY fiscal yearGC gas chromatographGGMD Gas Generation Matrix DepletionGGTC Gas Generation Test CanisterGGTP Gas Generation Test ProgramGUI graphical user interfaceHDPE high-density polyethyleneIDC item description codeINEEL Idaho National Engineering and Environmental LaboratoryLANL Los Alamos National LaboratoryLDPE low-density polyethyleneLEL lower explosive limitMDL method detection limitMDP Matrix Depletion ProgramMDP QAPP TRUPACT-II Matrix Depletion Program Quality Assurance Program Plan
(Connolly et al. 1997a)MDP Test Plan TRUPACT-II Matrix Depletion Program Test Plan (Connolly et al. 1997b)MS mass spectrometryMT Material TypeNRC U.S. Nuclear Regulatory CommissionPC personal computerPE polyethyleneppm part(s) per millionPVC polyvinyl chlorideQA quality assuranceQAO quality assurance objectiveQAPjP quality assurance project planQAPP quality assurance program planQC quality controlRFETS Rocky Flats Environmental Technology SiteRH TRU remote-handled transuranicSOP standard operating procedureTA Technical AreaTARMATDEP target matrix depletion computer simulation codeTRU transuranicTRUPACT-II Transuranic Package Transporter-IITRUPACT-II SARP Safety Analysis Report for the TRUPACT-II Shipping Package (NRC 1996)TWCP TRU Waste Characterization Program

xi
UCL 95% upper confidence limit95
UTL 95% upper tolerance limit95
WIPP Waste Isolation Pilot Plant

xii
DEFINITIONS
Dose The product of the ionizing radiation or energy emission rate in a testcylinder and the elapsed time since the cylinder’s loading. This isexpressed in terms of Watt @ yr.
Dose-dependent G-value A steady state effective G-value that is dependent on the total amount ofenergy absorbed by a waste matrix. The total amount of energy absorbedis assumed to equal the total amount of energy emitted by theradionuclides within the waste matrix. These are the final statisticallyderived values calculated from the steady state effective G-valuesmeasured during the MDP experiments.
Effective G-value The number of molecular or ionic products (usually gaseous) generated orconsumed per 100 electron-volts (eV) of ionizing radiation emitted.Because the actual amount of energy that is absorbed by the matrix cannotbe directly measured, this is a material parameter that is based on theamount of energy emitted by the particle on the matrix. These are theindividual G-values that were calculated for each sampling event.
Hydrogenous Hydrogen containing.
Initial bounding G-value A G-value that is assumed for a waste matrix that is based on the mosthydrogenous material within that waste matrix and does not account forany matrix depletion effects. These are the values used in the currentTRUPACT-II Shipping Package (NRC 1996) (TRUPACT-II SARP).
Intrinsic G-value The number of molecular or ionic products (usually gaseous) generated orconsumed per 100 electron-volts (eV) of ionizing radiation absorbed bythe matrix. This is a material parameter that is based on the actual amountof energy absorbed by the matrix.
Matrix depletion The phenomenon by which the G-value changes (i.e., gets smaller) as theamount of energy deposited on a matrix depletes the hydrogen bonds inthe surrounding material.
Non-hydrogenous Not hydrogen containing.
Steady state Effective G-values are approaching asymptotic values with dose asdetermined through statistical tests for significance of slopes in effectiveG-values versus dose.
Waste material An individual type of material contained within a waste matrix (e.g.,plastic, paper, etc.).
Waste material type A category describing the general make up of waste as defined by theSafety Analysis Report for the TRUPACT-II SARP TRUPACT-IIShipping Package (NRC 1996).
Waste matrix The waste contained within a container. One waste matrix may containmany waste materials.

1-1
1.0 INTRODUCTION
This report describes Transuranic Package Transporter-II (TRUPACT-II) Matrix Depletion Program(MDP) activities that were completed over the three-year duration of the program. These activities includedprogram development, test design and implementation, experimental setup modifications, quality assurance(QA) documentation revisions, data collection, data management and analysis, computer modelsdevelopment, and program interfaces.
A concern in the packaging and transportation of radioactive waste materials is the formation ofhydrogen gases due to radiolytic breakdown of hydrogen bonds in the waste matrix. The cause of radiolyticbreakdown of these chemical bonds is thought to be primarily due to alpha particle interactions with thetarget material. Therefore, the generation of hydrogen gas is of particular concern in waste contaminated withtransuranic (TRU) isotopes, which are primarily alpha-emitters. The gas generation potential of a targetmaterial can be characterized by its intrinsic G-value, which is defined as the number of molecular or ionicproducts (usually gaseous) generated or consumed per 100 electron-volts (eV) of ionizing radiation absorbedby the material. However, because the energy that is absorbed (i.e., the absorbed dose) by a material cannotbe measured directly, an effective G-value based on energy emitted (i.e., the emitted dose), which can bemeasured, is normally used in analysis. Dose from this perspective is the equivalent of energy emission ratemultiplied by the time elapsed since packaging.
The phenomenon of matrix depletion accounts for the gradual reduction in the rate of hydrogen gasgeneration (i.e., effective G-value) from a material over time and constant exposure to radiation. Hydrogenis removed from the matrix, thus decreasing the number of hydrogen bonds available for radiolyticbreakdown. When the alpha-generating source is dispersed in or on the target material in a particulate form,it will affect only that portion of the target material in a small spherical volume surrounding the sourceparticle. Additionally, some energy is lost within the source particle itself, and some is absorbed bynonhydrogenous materials (such as air) that are part of the waste matrix. Because over time the amount ofavailable hydrogen is reduced, the phenomenon of matrix depletion causes the effective G-value to decreaseasymptotically with increasing dose to a limit that is characteristic of the matrix affected. This asymptotelimit is termed the dose dependent G-value. This phenomenon was verified from experimental and empiricalresults available prior to the MDP, but it was not studied in sufficient detail to predict the impact on the long-term G-value for a specific material matrix.
The MDP was established as a joint venture by the U.S. Department of Energy (DOE) NationalTransuranic Program and the DOE Mixed Waste Focus Area, with the objective of investigating thephenomenon of matrix depletion and arriving at dose-dependent G-values for contact-handled (CH) TRUwaste material types. To confirm earlier reports of the dose dependency of G-values, the MDP comprisedthree major elements:
C Laboratory experiments for the assessment of effective G-value as a function of dose for several matricesand the effects of experimental conditions, including isotope and heating. These results are used to placea statistically derived conservative estimate on the effective G-value by waste material type (i.e., dosedependent G-value).
C Measurements of effective G-values and hydrogen concentrations in real waste and comparisons withdose dependent effective G-values. These data are used to show that the dose dependent G-values areconservative estimators of actual waste material type effective G-values.
C Theoretical analyses using a numerical model that calculates effective G-value as a function of dose byexplicitly incorporating fundamental nuclear and molecular mechanisms that result in the generation of

1-2
hydrogen. The analyses are used to show that the current understanding of these mechanisms, whichresult in hydrogen generation and matrix depletion, yields results that are consistent with experimentalmeasurements.
1.1 Background
The inventory of CH TRU waste currently in retrievable storage at DOE sites is planned for shipmentto, and disposal at, the Waste Isolation Pilot Plant (WIPP) facility. The TRUPACT-II is a reusable shippingcontainer designed for the transportation of CH TRU waste containers to the WIPP facility. Waste containersare 55-gal. drums, standard waste boxes, and ten-drum overpacks.
The TRUPACT-II was designed in accordance with the requirements for Type B packaging found inTitle 10 Code of Federal Regulations Part 71 (10 CFR 71). Upon completion of the design and requiredtesting, the Safety Analysis Report for the TRUPACT-II Shipping Package (U.S. Nuclear RegulatoryCommission [NRC] 1996) (TRUPACT-II SARP) was submitted to the NRC in 1989. Based on the analysespresented in the TRUPACT-II SARP, the NRC issued Certificate of Compliance (COC) No. 9218 for thepackage in August 1989. Subsequently the NRC has approved nine revisions to the TRUPACT-II COC.
A major transportation requirement for the TRUPACT-II is that the concentration of potentiallyflammable gases must not exceed 5% (by volume) in the package or the payload during a 60-day shippingperiod after the TRUPACT-II is sealed. Decomposition of materials caused by radiation (or radiolysis) is thepredominant mechanism of gas generation during transport.
CH TRU waste is classified into four major waste types (I, II, III, and IV) based on chemical and physicalcharacteristics, and is further subdivided into waste material types (I.1, I.2, I.3, II.1, II.2, and III.1) based onbounding flammable gas generation potential, as shown in Tables 1-1 and 1-2 (NRC 1996). Each CH TRUwaste container is assigned a TRUPACT-II shipping category, which is based on a combination of wastematerial type and the packaging (number and type of plastic layers of confinement) of the waste materialswithin the waste container. To demonstrate compliance with the flammable gas requirement, the TRUPACT-II SARP uses theoretical worst-case calculations with initial bounding G-values to establish allowablewattage (decay heat) limits for each TRUPACT-II shipping category. Initial bounding G-values are thetheoretical or assumed maximum for newly-generated wastes.
The maximum allowable wattage limits for each shipping category and for the TRUPACT-II were,therefore, based on the initial effective G-values observed during experiments on the irradiation of materialsfound in TRU waste. The wattage limit calculations assumed a constant effective G-value from the time thewaste was packaged until emplacement at the WIPP facility. The calculations made no allowance fordecreases of the effective G-value with dose, a phenomenon observed by many experimenters (Kazanjian1976; Kosiewicz 1981; Zerwekh 1979; Zerwekh and Warren 1986; Zerwekh et al. 1993; Smith et al. 1994;Marshall et al. 1994; and Smith et al. 1997).
Considering the existing TRUPACT-II wattage limits, it is currently estimated that a large portion of theCH TRU waste container inventory cannot be shipped. A joint effort was conducted at the Idaho NationalEngineering and Environmental Laboratory (INEEL), Los Alamos National Laboratory (LANL), and RockyFlats Environmental Technology Site (RFETS) to determine the impact of existing wattage limits on theshippability of CH TRU waste stored at those sites. Of the total volume of CH TRU waste, it was determinedthat approximately 34% of the waste would not be shippable based on its failure to meet TRUPACT-IIwattage limits. Although the effort was performed at the three named sites, the results are applicable to allDOE sites that plan to ship CH TRU waste to the WIPP facility. The TRUPACT-II SARP contains a GasGeneration Test Program (GGTP) that allows for individual drum testing for those drums that exceed the

1-3
applicable wattage limit. However, implementing the plan for 34% of the CH TRU waste would beprohibitively expensive and time consuming.
Table 1-1. Summary of CH TRU payload waste types.
Waste type Description and examples
I Solidified Aqueous or Homogeneous Inorganic Solids(<1% organics–not including packaging)• Absorbed, adsorbed, or solidified inorganic liquid• Soils, solidified particulates, or sludges formed from precipitates• Concreted inorganic particulate waste
II Solid Inorganics• Glass, metal, crucibles• Other solid inorganics
III Solid Organics• Plastics (e.g., polyethylene [PE], polyvinyl chloride [PVC])• Cellulose (e.g., paper, cloth, wood)• Cemented organic solids• Other solid organics
IV Solidified Organics• Cemented or immobilized organic liquids and solids
Source: NRC 1996.
Table 1-2. Summary of CH TRU waste material types.
Waste type Waste material type Description and examples
I I.1 Absorbed, adsorbed, or solidified inorganic liquids
I I.2 Soils, solidified particulates, or sludges formed fromprecipitation
I I.3 Concreted inorganic particulate waste
II II.1 Solid inorganic materials in plastic bags
II II.2 Solid inorganic materials in metal cans
III III.1 Solid organic materials
Source: NRC 1996.
All TRU waste will ultimately have to be transported to the WIPP facility; therefore, a method to providefor its acceptance for shipment in the TRUPACT-II is needed. A solution for a portion of the waste may liein determining effective G-values as a function of dose and, thus, more realistic TRUPACT-II wattage limits,primarily by accounting for dose-dependence of the effective G-values. Matrix depletion testing was a cost-

1-4
effective method for arriving at dose-dependent G-values that would support higher TRUPACT-II wattagelimits.
1.2 Objectives
The MDP was established with the objective of investigating the phenomenon of matrix depletion andarriving at dose-dependent G-values for each material matrix tested. To specify data quality for MDP datacollection activities, a formal procedure based on U.S. Environmental Protection Agency (EPA) guidancewas used to formulate data quality objectives (DQOs). The procedure includes formulating a problemstatement, a decision, and inputs to the decision; defining study boundaries; formulating the decision rule;establishing tolerable limits on decision errors; and optimizing the design. Appendix A of the TRUPACT-IIMatrix Depletion Program Test Plan (MDP Test Plan) (Connolly et al. 1997b) provides details. Theprimary DQO for the MDP was to ensure with 95% confidence that the true mean effective G-values forsimulated waste materials, when estimated with 10% relative error, will not exceed the dose dependentG-values.
The secondary DQOs of the MDP were:
• To determine with 95% confidence whether or not the effects (e.g., isotope, heating) significantlyinfluence the effective G-values observed in the matrix depletion experiments
• To determine with 95% confidence whether or not the dose dependent G-values are conservativebased on the results of testing on real waste. This implies that a 5% chance of determining thatmatrix depletion experiment results are lower than the real waste testing results when the reverse isactually true.
1.3 Program Description
The MDP was funded based on an INEEL white paper that provided a historical perspective, rationale,approach, and expected benefits. Table 1-3 summarizes assigned program participants and responsibilities.

1-5
Table 1-3. Matrix of MDP participants and responsibilities.
Participant Responsibilities
CAO Overall management; performance of audits; approval ofdocuments; funding
INEEL TRU Waste Program Manager Primary interface between the CAO and the MDPCoordinator; document review and approval; interface
INEEL MDP Coordinator Providing technical direction and coordination; reviewand approval of data, reports, and other documents;resolution of technical issues; determination of futuredirection; forwarding recommendations to the CAO;documentation preparation; interface
INEEL/Benchmark Environmental Preparation of MDP Test Plan, procedures, annual statusCorporation reports, QA documentation, and MDP Final Report;
development of computer models; data reduction andanalysis; performance of audits; documentation reviewand approval; interface
INEEL Data collection under the GGTP; data collection underthe TWCP
RFETS GGTP data collection; TWCP data collection;preparation, review and approval of documents; interface
LANL Design and construction of MDP testing apparatus;preparation of test matrices; collection and validation ofMDP experimental data; preparation of procedures andother documentation; document review and approval;interface
Westinghouse – Waste Isolation Division MDP documentation review; preparation of TRUPACT-(Packaging and Transportation) II SARP revision applications; technical guidance;
interface
MDP activities were grouped into the following areas:
• Documentation and QA. Documents were prepared, reviewed, and approved for the MDP, as wellas for programs that will support revisions to the TRUPACT-II SARP. The TRUPACT-II MatrixDepletion Program Quality Assurance Program Plan (MDP QAPP) (Connolly et al. 1997a) andthe MDP Test Plan provide the program test framework and associated QA requirements. The MDPQAPP also specified the performance-based QA/quality control (QC) requirements that had to bemet by each facility participating in the MDP. Based on the requirements of the MDP QAPP, LANLprepared a QA project plan (QAPjP) for the MDP experiments, and developed, reviewed, andfinalized associated procedures. Documentation of model development and application was preparedfor both computer models. Annual status reports were prepared for the program in fiscal years (FYs)1995, 1996, and mid-1997. The MDP QA Officer and the DOE Carlsbad Area Office (CAO) staffaudited the program, and the results of the audit and corrective actions were documented.

1-6
• Matrix Depletion Testing. Matrix depletion experimental design, implementation, testing, and datacollection. The testing was performed at LANL using test cylinders loaded with simulated TRUwaste materials impregnated with one of two different isotopes of plutonium.
• Headspace Sampling of TRU Waste Drums. Headspace samples were collected and analyzed froma representative subpopulation of existing TRU waste containers at ambient temperatures todetermine hydrogen gas concentrations in drums. Samples were taken from both drum and innerconfinement layers. These activities were performed by the INEEL and RFETS under the WIPPTransuranic Waste Characterization Program (TWCP).
• Drum Testing to Determine Actual Waste G-values. Fifty-five-gal. CH TRU waste drums weretested to quantify hydrogen gas generation rates and effective G-values for comparison to the valuesderived from the MDP testing. This effort was performed at the INEEL and the RFETS under theTRUPACT-II GGTP.
• Data Management. Data from the matrix depletion testing were validated, reduced, and analyzedto establish dose dependent G-values for each waste matrix tested.
• Computer Models Development and Application. Two computer models were developed to enhancethe understanding of the matrix depletion phenomenon and to support comparisons to otherexperimental programs. The target matrix depletion model (TARMATDEP), which simulatedtheoretical radiolytic processes, was used to illustrate matrix depletion and gas generation in targetmatrices. The TRU waste container model (NEWGVALS) was used to simulate hydrogen gasgeneration, accumulation, and transport across layers of confinement in waste containers using dosedependent G-values.
• Statistical Analyses. Statistical analyses compared the dose dependent G-values with container data,model predictions, and current TRUPACT-II SARP values. Statistical comparisons were made ofdose dependent G-values derived from the matrix depletion experiments with the measurementsfrom actual TRU waste drums (i.e., TWCP and GGTP) to justify that the dose dependent G-valuesfrom the matrix depletion experiments are, in fact, conservative.
• Program Interfaces. During the three-year duration of the MDP, participants interfaced extensivelywith each other, as well as with participants in other TRU transportation program initiatives. MDPpersonnel participated in a number of meetings on TRUPACT-II transportation initiatives, includingthree annual GGTP meetings. The objective of these meetings was to familiarize participants withongoing initiatives and discuss integration of the initiatives.
To obtain dose dependent G-values representative of the TRU waste inventory, the matrix depletionexperimental design was developed to quantify the effects of the following variables:
• Dose• Matrix• Moisture• Temperature• Agitation• Particle size distribution• Isotopic composition• Initial versus dose-dependent G-values.

1-7
The following sections provide discussions of how each variable was addressed in the experimentaldesign.
1.3.1 Dose
The effects of dose were evaluated by conducting the experiments over a period of two years to allowthe effective G-values for the various matrices to achieve asymptotic (i.e., stabilized) values over time. Thedose is the product of the ionizing radiation or energy emission rate in each test cylinder (wattage) and theelapsed time from cylinder loading. This is true because of the primary assumptions that all energy emittedis absorbed by the matrix. Dose is expressed in units of Watt @ yr.
1.3.2 Matrix Materials
PE was chosen for the tests because it is commonly found in TRU waste. Additionally, because of itshigh effective G-value observed in previous studies, it is the bounding material for hydrogen gas generationin waste types II and III. PVC was selected because it, along with PE, is abundant in CH TRU waste.
Cellulosics were chosen because they are the bounding material for overall gas generation (i.e., combinedtotal of hydrogen, methane, oxygen, carbon dioxide, and other gases) for waste type III. As a result of thehigher activation energy of cellulose, the potential for flammable gas generation of cellulosics approachesthat of PE at higher temperatures.
Envirostone (representative of a “cement” matrix) was chosen because of the extensive presence ofwater, which is the bounding material for both flammable and overall gas generation in waste type I.Envirostone was tested to confirm that effective G-values obtained for one specific waste type I material areconsistent with current TRUPACT-II SARP initial bounding G-values.
1.3.3 Moisture
The effects of moisture were evaluated by having cylinders with both wet and dry cellulosics. Theobjective was to ascertain whether the presence of water affected effective G-values.
1.3.4 Temperature
The effects of temperature were evaluated by heating selected test cylinders. Heating was intended tosimulate potential over-the-road transportation of waste containers where the temperature within theTRUPACT-II may rise to as high as 146 F during a 60-day transport period.o
1.3.5 Agitation
Agitation effects were previously investigated using test cylinders and materials similar to those usedin the MDP. Those experiments indicated no effect on G-values due to agitation (Zerwekh, 1979; Zerwekher al., 1993; Smith et al., 1997). Agitation of specified test cylinders was planned after steady state G-valueshad been established. The agitation was to be performed on a one-time basis to simulate transportation ofwaste containers, while heating was conducted over time. As described later in this report, the effects ofagitation were not evaluated because the proposed agitation of test cylinders did not represent the conditionsof actual 55-gal. drums during movement and transport.
1.3.6 Particle Size Distribution

1-8
The effects of particle size distribution were evaluated by having two radioactive source materials withsignificantly different particle size distributions. In one case, the particle sizes were approximately 16.6microns in diameter and relatively monodisperse while, for other test cylinders, the spread in particle diameterwas very broad, with a mean particle diameter of around 33 microns. Earlier testing used a mean particlediameter of 3.61 microns (Smith et al. 1997).
1.3.7 Isotopic Composition
The isotopes Pu and Pu were chosen because of their prevalence in TRU waste and high specific239 238
activity, respectively. Pu, which is frequently used as a heat source, provides the majority of the decay heat 238
in TRU waste, while Pu is the predominant plutonium isotope present in the TRU waste inventory.239
Approximately 0.014 g of Material Type (MT)-83, a plutonium isotope blend that is predominately PuO ,2382
and 2.3 g of MT-52, a blend that is predominately PuO , were chosen for the tests. These amounts were2392
chosen because they provided equal decay heats in the tests.
1.3.8 Initial Bounding versus Dose Dependent G-values
The initial bounding G-value for both waste types II and III in the TRUPACT-II SARP was based ongamma irradiation of high-density PE (HDPE) at room temperature based on testing performed in 1959. TheMDP experiments were conducted over adequate dose to allow the effective G-values for the various matricesto achieve asymptotic (i.e., steady-state) values. Thus, the MDP testing allowed comparisons of final, dosedependent G-values with initial bounding G-values documented in the TRUPACT-II SARP.

2-1
2.0 MATRIX DEPLETION PROGRAM
This section documents the three major elements of the MDP: laboratory experiments; real wastemeasurements; and theoretical analyses. This section also discusses QA activities related to the elements andvarious program interfaces of MDP personnel both internally and with personnel involved in otherTRUPACT-II transportation-related initiatives.
2.1 Laboratory Experiments
The first major element of the MDP involved design and implementation of the experimental programto determine dose dependent G-values for various material matrices. The experimental program consistedof selecting four representative material matrices, factorial experiment design, apparatus procurement andassembly, data collection, and QA activities.
2.1.1 Experimental Design
Matrix depletion experiments were conducted at LANL. The experimental design was an aggregate ofseveral designs, each with two replicates. The first was a 3 x 2 in 24 units, which was a full factorial3
involving PE, and wet and dry cellulose. Results from this portion of testing were used to determine theeffective G-values and evaluate the effects of isotope, matrix, and heating. The second portion of the designinvolved PVC testing under limited conditions to facilitate comparisons with other materials and to test thehypothesis that dose dependent G-values based on PVC would not be conservative. The third portion of thedesign was a 2 factorial in four units for Envirostone, which had a reduced number of factors because2
agitation was not relevant. Results from Envirostone would be used to determine dose dependent G-valuesand factor effects to confirm that MDP G-values were consistent with the current TRUPACT-II SARP initialbounding G-values for waste type I.
The total number of test cylinders (60) containing the simulated TRU waste matrix materials wasdetermined based on DQOs developed for the MDP (Connolly et al. 1997b). Table 2-1 shows the breakdownof the number of test cylinders in each experimental setting depicted in the test matrix.
Table 2-1. Test matrix (number of cylinders of each experimental setting).
Pu Pu238 239
Matrix Normal Agitated Heated agitated Normal Agitated Heated agitated
Heated Heatedand and
PE 2 2 2 2 2 2 2 2Dry cellulosics 2 2 2 2 2 2 2 2Wet cellulosics 2 2 2 2 2 2 2 2Cement 2 — 2 — 2 — 2 —(Envirostone)PVC 2 — — — — — — 2
The apparatus for conducting the matrix depletion tests consisted of two major components: (a) a seriesof 1-L test cylinders designed to contain the simulated waste material, and (b) a series of valves, tubing, andmeasurement apparatus for sampling generated gases and quantitatively measuring constituents. To maintain
2-2
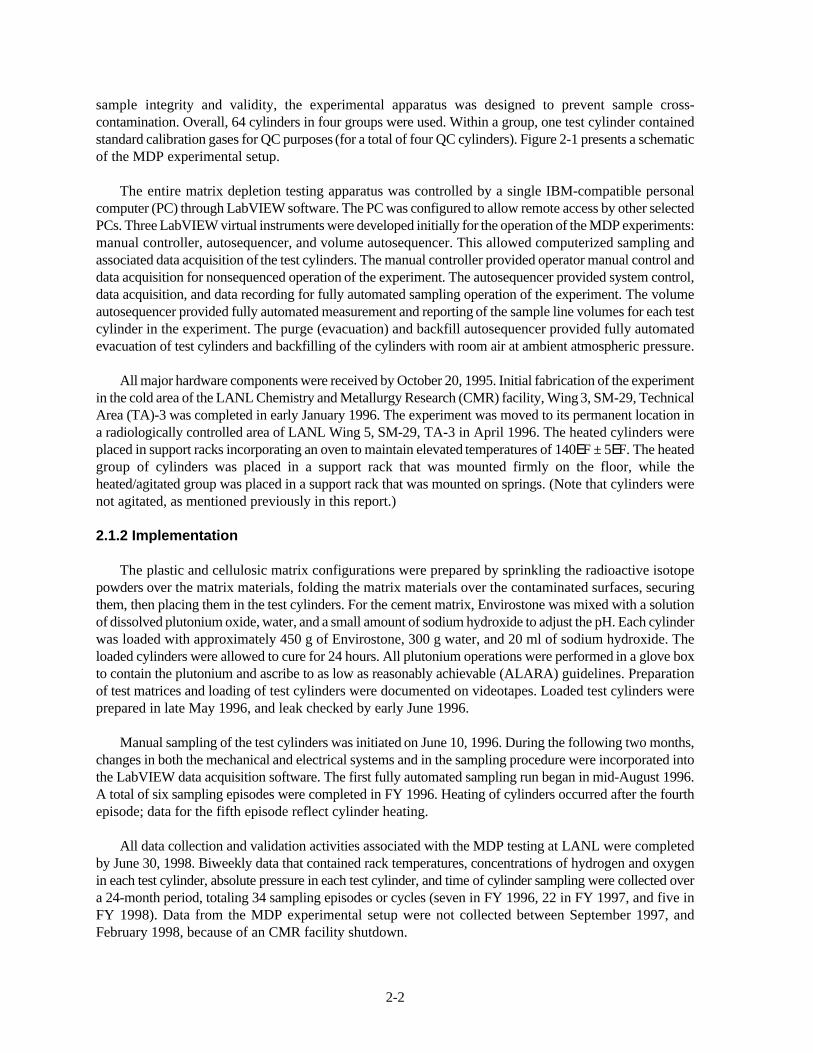
sample integrity and validity, the experimental apparatus was designed to prevent sample cross-contamination. Overall, 64 cylinders in four groups were used. Within a group, one test cylinder containedstandard calibration gases for QC purposes (for a total of four QC cylinders). Figure 2-1 presents a schematicof the MDP experimental setup.
The entire matrix depletion testing apparatus was controlled by a single IBM-compatible personalcomputer (PC) through LabVIEW software. The PC was configured to allow remote access by other selectedPCs. Three LabVIEW virtual instruments were developed initially for the operation of the MDP experiments:manual controller, autosequencer, and volume autosequencer. This allowed computerized sampling andassociated data acquisition of the test cylinders. The manual controller provided operator manual control anddata acquisition for nonsequenced operation of the experiment. The autosequencer provided system control,data acquisition, and data recording for fully automated sampling operation of the experiment. The volumeautosequencer provided fully automated measurement and reporting of the sample line volumes for each testcylinder in the experiment. The purge (evacuation) and backfill autosequencer provided fully automatedevacuation of test cylinders and backfilling of the cylinders with room air at ambient atmospheric pressure.
All major hardware components were received by October 20, 1995. Initial fabrication of the experimentin the cold area of the LANL Chemistry and Metallurgy Research (CMR) facility, Wing 3, SM-29, TechnicalArea (TA)-3 was completed in early January 1996. The experiment was moved to its permanent location ina radiologically controlled area of LANL Wing 5, SM-29, TA-3 in April 1996. The heated cylinders wereplaced in support racks incorporating an oven to maintain elevated temperatures of 140EF ± 5EF. The heatedgroup of cylinders was placed in a support rack that was mounted firmly on the floor, while theheated/agitated group was placed in a support rack that was mounted on springs. (Note that cylinders werenot agitated, as mentioned previously in this report.)
2.1.2 Implementation
The plastic and cellulosic matrix configurations were prepared by sprinkling the radioactive isotopepowders over the matrix materials, folding the matrix materials over the contaminated surfaces, securingthem, then placing them in the test cylinders. For the cement matrix, Envirostone was mixed with a solutionof dissolved plutonium oxide, water, and a small amount of sodium hydroxide to adjust the pH. Each cylinderwas loaded with approximately 450 g of Envirostone, 300 g water, and 20 ml of sodium hydroxide. Theloaded cylinders were allowed to cure for 24 hours. All plutonium operations were performed in a glove boxto contain the plutonium and ascribe to as low as reasonably achievable (ALARA) guidelines. Preparationof test matrices and loading of test cylinders were documented on videotapes. Loaded test cylinders wereprepared in late May 1996, and leak checked by early June 1996.
Manual sampling of the test cylinders was initiated on June 10, 1996. During the following two months,changes in both the mechanical and electrical systems and in the sampling procedure were incorporated intothe LabVIEW data acquisition software. The first fully automated sampling run began in mid-August 1996.A total of six sampling episodes were completed in FY 1996. Heating of cylinders occurred after the fourthepisode; data for the fifth episode reflect cylinder heating.
All data collection and validation activities associated with the MDP testing at LANL were completedby June 30, 1998. Biweekly data that contained rack temperatures, concentrations of hydrogen and oxygenin each test cylinder, absolute pressure in each test cylinder, and time of cylinder sampling were collected overa 24-month period, totaling 34 sampling episodes or cycles (seven in FY 1996, 22 in FY 1997, and five inFY 1998). Data from the MDP experimental setup were not collected between September 1997, andFebruary 1998, because of an CMR facility shutdown.

Vacuum Pump
PressureTransducer
4-Port Valve
TestCannister
SampleCollection Port
GasChromatograph
Heated &Agitated Agitated
Neither Heated
16-Port Valve
Cal Gas 5Cal Gas 4 Purge Gas
Cal Gas 3Cal Gas 2
Cal Gas 1
2-3
Figure 2-1. Schematic of the MDP experimental setup.
2-4
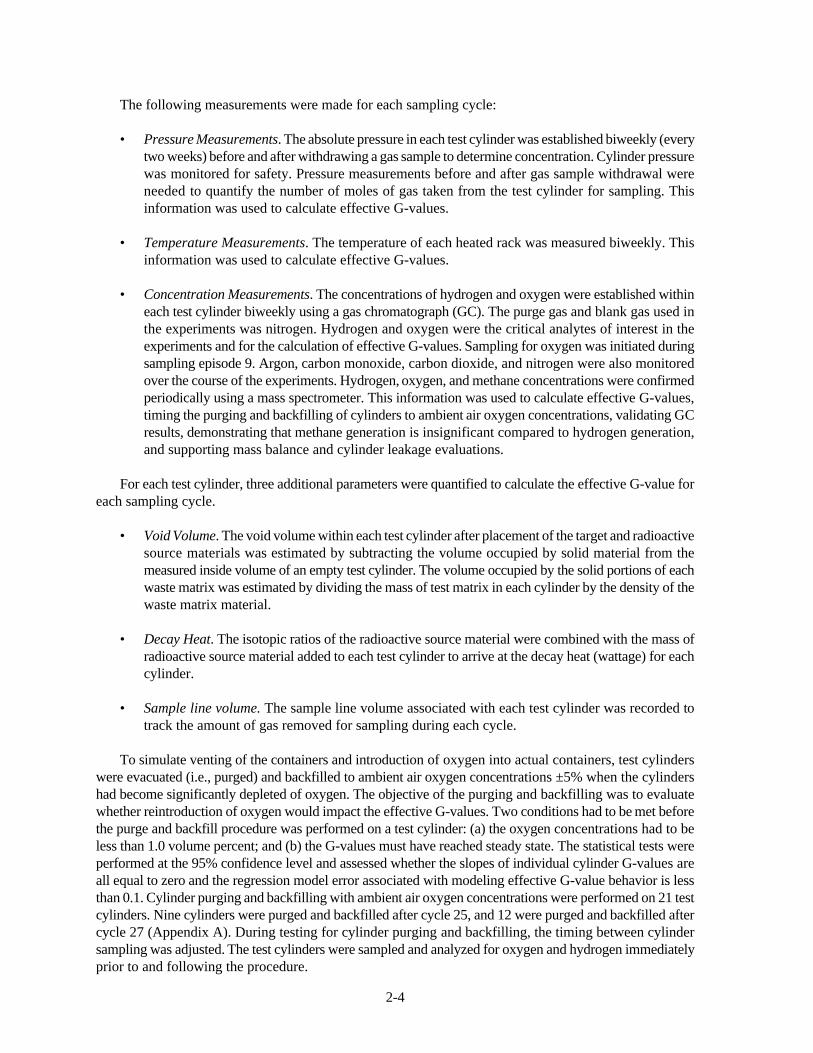
The following measurements were made for each sampling cycle:
• Pressure Measurements. The absolute pressure in each test cylinder was established biweekly (everytwo weeks) before and after withdrawing a gas sample to determine concentration. Cylinder pressurewas monitored for safety. Pressure measurements before and after gas sample withdrawal wereneeded to quantify the number of moles of gas taken from the test cylinder for sampling. Thisinformation was used to calculate effective G-values.
• Temperature Measurements. The temperature of each heated rack was measured biweekly. Thisinformation was used to calculate effective G-values.
• Concentration Measurements. The concentrations of hydrogen and oxygen were established withineach test cylinder biweekly using a gas chromatograph (GC). The purge gas and blank gas used inthe experiments was nitrogen. Hydrogen and oxygen were the critical analytes of interest in theexperiments and for the calculation of effective G-values. Sampling for oxygen was initiated duringsampling episode 9. Argon, carbon monoxide, carbon dioxide, and nitrogen were also monitoredover the course of the experiments. Hydrogen, oxygen, and methane concentrations were confirmedperiodically using a mass spectrometer. This information was used to calculate effective G-values,timing the purging and backfilling of cylinders to ambient air oxygen concentrations, validating GCresults, demonstrating that methane generation is insignificant compared to hydrogen generation,and supporting mass balance and cylinder leakage evaluations.
For each test cylinder, three additional parameters were quantified to calculate the effective G-value foreach sampling cycle.
• Void Volume. The void volume within each test cylinder after placement of the target and radioactivesource materials was estimated by subtracting the volume occupied by solid material from themeasured inside volume of an empty test cylinder. The volume occupied by the solid portions of eachwaste matrix was estimated by dividing the mass of test matrix in each cylinder by the density of thewaste matrix material.
• Decay Heat. The isotopic ratios of the radioactive source material were combined with the mass ofradioactive source material added to each test cylinder to arrive at the decay heat (wattage) for eachcylinder.
• Sample line volume. The sample line volume associated with each test cylinder was recorded totrack the amount of gas removed for sampling during each cycle.
To simulate venting of the containers and introduction of oxygen into actual containers, test cylinderswere evacuated (i.e., purged) and backfilled to ambient air oxygen concentrations ±5% when the cylindershad become significantly depleted of oxygen. The objective of the purging and backfilling was to evaluatewhether reintroduction of oxygen would impact the effective G-values. Two conditions had to be met beforethe purge and backfill procedure was performed on a test cylinder: (a) the oxygen concentrations had to beless than 1.0 volume percent; and (b) the G-values must have reached steady state. The statistical tests wereperformed at the 95% confidence level and assessed whether the slopes of individual cylinder G-values areall equal to zero and the regression model error associated with modeling effective G-value behavior is lessthan 0.1. Cylinder purging and backfilling with ambient air oxygen concentrations were performed on 21 testcylinders. Nine cylinders were purged and backfilled after cycle 25, and 12 were purged and backfilled aftercycle 27 (Appendix A). During testing for cylinder purging and backfilling, the timing between cylindersampling was adjusted. The test cylinders were sampled and analyzed for oxygen and hydrogen immediatelyprior to and following the procedure.
2-5
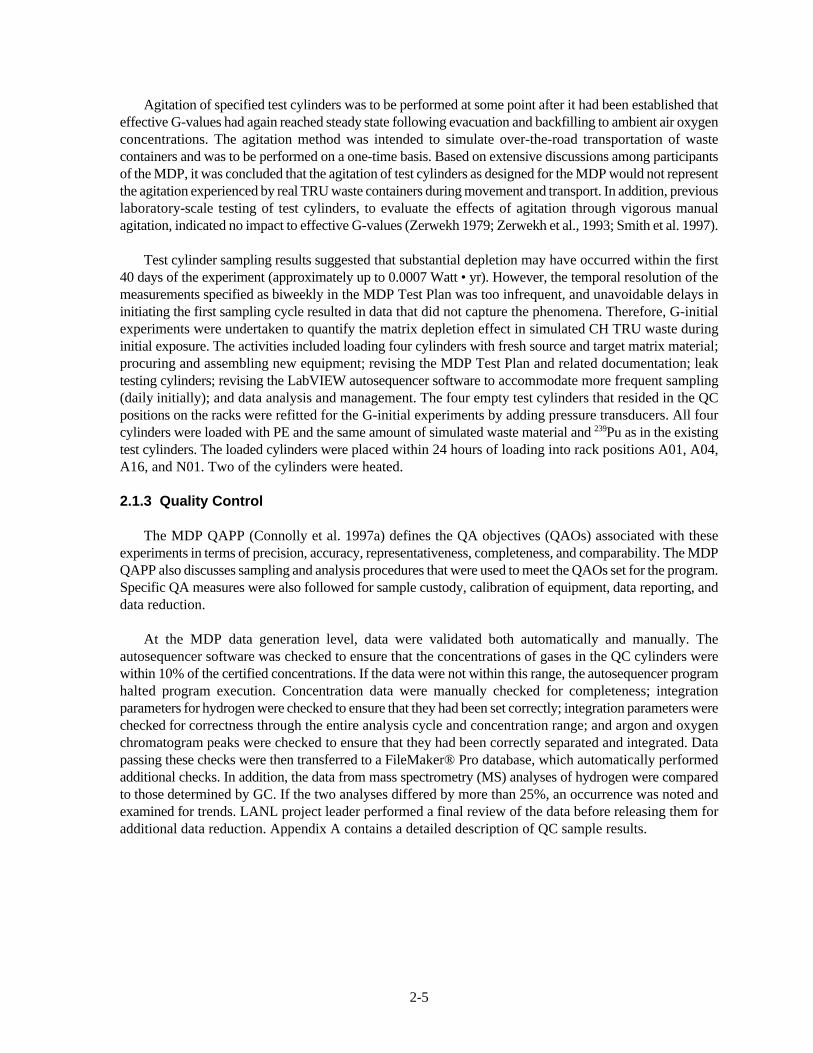
Agitation of specified test cylinders was to be performed at some point after it had been established thateffective G-values had again reached steady state following evacuation and backfilling to ambient air oxygenconcentrations. The agitation method was intended to simulate over-the-road transportation of wastecontainers and was to be performed on a one-time basis. Based on extensive discussions among participantsof the MDP, it was concluded that the agitation of test cylinders as designed for the MDP would not representthe agitation experienced by real TRU waste containers during movement and transport. In addition, previouslaboratory-scale testing of test cylinders, to evaluate the effects of agitation through vigorous manualagitation, indicated no impact to effective G-values (Zerwekh 1979; Zerwekh et al., 1993; Smith et al. 1997).
Test cylinder sampling results suggested that substantial depletion may have occurred within the first40 days of the experiment (approximately up to 0.0007 Watt • yr). However, the temporal resolution of themeasurements specified as biweekly in the MDP Test Plan was too infrequent, and unavoidable delays ininitiating the first sampling cycle resulted in data that did not capture the phenomena. Therefore, G-initialexperiments were undertaken to quantify the matrix depletion effect in simulated CH TRU waste duringinitial exposure. The activities included loading four cylinders with fresh source and target matrix material;procuring and assembling new equipment; revising the MDP Test Plan and related documentation; leaktesting cylinders; revising the LabVIEW autosequencer software to accommodate more frequent sampling(daily initially); and data analysis and management. The four empty test cylinders that resided in the QCpositions on the racks were refitted for the G-initial experiments by adding pressure transducers. All fourcylinders were loaded with PE and the same amount of simulated waste material and Pu as in the existing239
test cylinders. The loaded cylinders were placed within 24 hours of loading into rack positions A01, A04,A16, and N01. Two of the cylinders were heated.
2.1.3 Quality Control
The MDP QAPP (Connolly et al. 1997a) defines the QA objectives (QAOs) associated with theseexperiments in terms of precision, accuracy, representativeness, completeness, and comparability. The MDPQAPP also discusses sampling and analysis procedures that were used to meet the QAOs set for the program.Specific QA measures were also followed for sample custody, calibration of equipment, data reporting, anddata reduction.
At the MDP data generation level, data were validated both automatically and manually. Theautosequencer software was checked to ensure that the concentrations of gases in the QC cylinders werewithin 10% of the certified concentrations. If the data were not within this range, the autosequencer programhalted program execution. Concentration data were manually checked for completeness; integrationparameters for hydrogen were checked to ensure that they had been set correctly; integration parameters werechecked for correctness through the entire analysis cycle and concentration range; and argon and oxygenchromatogram peaks were checked to ensure that they had been correctly separated and integrated. Datapassing these checks were then transferred to a FileMaker® Pro database, which automatically performedadditional checks. In addition, the data from mass spectrometry (MS) analyses of hydrogen were comparedto those determined by GC. If the two analyses differed by more than 25%, an occurrence was noted andexamined for trends. LANL project leader performed a final review of the data before releasing them foradditional data reduction. Appendix A contains a detailed description of QC sample results.

2-6
2.2 Real Waste Measurements
The second major element of the MDP involved hydrogen measurements of actual TRU waste drumsunder the TRUPACT-II GGTP and under the TWCP. The TRUPACT-II GGTP consists of performingcontrolled tests with actual containers of CH TRU waste to quantify the gas generation properties of thewaste under simulated transportation conditions. Whether or not containers of CH TRU waste are tested isbased on their hydrogen gas generation potential. Containers of CH TRU waste that can be shipped withoutthe need for testing are qualified for shipment based on set decay heat limits determined from theoreticalworst-case calculations, as required by the TRUPACT-II SARP. GGTP testing is intended to (a) facilitatethe shipment of waste containers that exceed the decay heat limits or that do not have established theoreticalupper bounds for gas generation potential by showing compliance with applicable hydrogen and total gasgeneration rate limits; and (b) for specific populations of waste, increase the quantity of waste that can beshipped by redefining decay heat limits.
The GGTP testing procedure is described conceptually in Appendix 1.3.7 of the TRUPACT-II SARP.One gas generation test system has been implemented at the INEEL. Another gas generation testing systemhas been developed and tested by the RFETS GGTP.
Headspace gas sampling of TRU waste containers is conducted under the TWCP at the INEEL andRFETS. The sampling includes the drum headspace and the headspace of inner layers of confinement.Headspace gas analytes of interest to the MDP are hydrogen and methane.
2.2.1 Gas Generation Testing Program at the Idaho National Engineering andEnvironmental Laboratory
The testing apparatus used at this facility is based on the general procedure outlined in Attachment 2 ofAppendix 1.3.7 of the TRUPACT-II SARP. The primary purpose of the test setup is to provide a system forthe reproducible measurement of total gas flow rate for the test period, during which the gas generationproperties of the waste drum are monitored by sampling and analyses. The hydrogen gas generation rate iscalculated by multiplying the time-averaged net gas generation rate by the sampled concentration ofhydrogen. The effective G-value for each drum was calculated by combining the measured hydrogen gasgeneration with the wattage of the drum. Individual drums were tested under elevated temperature conditionsthat simulate worst-case thermal conditions expected in a 14-drum TRUPACT-II payload during normaltransport conditions for the specific shipping category of the drum.
As of the end of July 1998, 114 drums had been tested and data on 83 drums had been evaluated. Of the83 drums, 54 passed TRUPACT-II SARP limits for total gas release and flammable gas generation rate.None of the 83 drums failed the hydrogen gas generation rate. Twenty-nine drums failed the total gas releaselimit, even though the container decay heats are below the allowable decay heat limits. Because of theuncertainty in experimental results, INEEL GGTP results were not used for the MDP analyses. Theexperimental design and resulting data are currently undergoing independent technical review.
2.2.2 Gas Generation Testing Program at the Rocky Flats Environmental Technology Site
The RFETS testing system consists of a stainless steel bell jar, a lower explosive limit (LEL) detector,a SUMMA® canister gas sampling connection, and an MS for analysis of gases in the bell jar headspace.To conduct a test, a drum is first placed in the Gas Generation Test Canister (GGTC) and isolated. Initialand final (after approximately two weeks) gas samples are then drawn into evacuated and cleaned SUMMA®canisters. The SUMMA® canister samples are analyzed using an MS. Then, the concentrations of hydrogenand other inorganic gas species in the void space of the GGTC are determined analytically. The change inconcentration versus the change in time is used to determine the hydrogen generation rate. The effective

2-7
hydrogen G-value was calculated for each drum using the measured hydrogen gas generation rate and themean wattage of the drum.
The first 27 drums tested were sampled using an on-line hydrogen analyzer, which was essentially acombustible gas detector calibrated from zero to 50% LEL for hydrogen. This detector is susceptible tointerference by other gases. Due to concern that other gases may be interfering with the measurements ofhydrogen, the remainder of the gas generation tests have been accomplished by means of obtaining batchsamples with SUMMA® canisters and analyzing these on a highly sensitive and accurate sector-scan MS.In general, the on-line analyzer yielded higher calculated effective G-values than the MS. The assays ofradioactive materials in the drums (used to calculate the effective G-value) were performed using eitherpassive-active drum counters or segmented drum counters, both of which have accuracy limited to ±25%.As a result, the calculated effective G-value is only as accurate as the assay of the drum.
The gas generation testing system developed by RFETS in 1995, has been used to test 117 drums as ofthe end of July 1998. Elevated temperature testing at 63EC was initiated on June 10, 1998. EffectiveG-values for 83 of the drums tested at the RFETS under the GGTP were used for comparison with the MDPdose dependent G-values. All of these containers were tested at ambient temperatures. Table 2-2 presentsa breakdown of these drums by waste type. Appendix D presents the individual drum effective G-values andother relevant data.
Table 2-2. Number of RFETS GGTP drums used in the MDP analyses.
Waste type Number of drums
II.1 16
III.1 67
Total 83
2.2.3 Transuranic Waste Characterization Program
The TWCP is a CAO-established program that must be implemented at DOE sites planning to sendwaste to the WIPP facility. The INEEL instituted its TWCP in 1991, and the RFETS instituted its TWCPin 1993. Headspace samples were collected and analyzed for hydrogen and methane from a representativesubpopulation of existing TRU waste containers at ambient temperatures. Samples were taken from theheadspace gases of all CH TRU waste drums, and certain drums underwent innermost layers of confinementsampling. The MDP QAPP describes QA requirements specific to the MDP, which are consistent with theTWCP requirements.
A total of 457 samples collected by the RFETS under the TWCP was used for the MDP analyses. A totalof 428 samples collected by the INEEL under the TWCP were used for the MDP analyses. Table 2-3 presentsa breakdown of the number of samples by waste type and by site. In addition, other container data includingdrum identifier, shipping category, dates of container packaging, container venting, and container sampling,and wattage, were collected and used as input to the NEWGVALS code (Section 2.2.4).
These data, along with dose dependent G-values determined from the MDP laboratory experiments, wereused to predict the concentrations of hydrogen in various confinement layers at the time of sampling for

2-8
comparison to the sampled concentrations. Appendix C provides detailed information on the samples anddrum data that were used in the MDP analyses. The objective was to demonstrate that the dose dependentG-values predict concentrations of hydrogen in drums that is higher than the corresponding measuredhydrogen concentrations.
Table 2-3. Number of TWCP samples used in the MDP analyses.
Waste Type Number of INEEL samples Number of RFETS samplesI 94 113II 137 87III 197 257
Total 428 457
2.2.4 NEWGVALS
NEWGVALS was developed to predict drum headspace hydrogen gas concentrations based on the dosedependent G-values and the measured effective G-values of actual drums. The predicted gas concentrationsusing NEWGVALS were compared with the respective actual waste drum flammable gas concentrations(sum of hydrogen and methane) to show that dose dependent G-values predict drum hydrogen concentrationsthat are greater than measured concentrations. The model mathematically simulates the generation offlammable gas and subsequent transport across layers of confinement in a TRU waste drum. The code usesa step function in effective G-values and actual TRU waste container decay heat or wattages to predictflammable gas concentrations within actual TRU waste containers at any dose up to the cumulative dosewhen the container was sampled for flammable gas under the TWCP. Effective G-values supplied to themodel were determined from the MDP laboratory experiments conducted at LANL.
NEWGVALS is based on the aspiration model documented in Appendix 3.6.11 of the TRUPACT-IISARP (NRC 1998). To account for the various packaging configurations and container conditions, four setsof ordinary differential equations are solved along with the appropriate initial conditions that represent theinitial state of a container. The four sets represent: (a) a sealed container with two void volumes, (b) anaspirating container with two void volumes, (c) a sealed container with three void volumes, and (d) anaspirating container with three void volumes. The concentrations predicted in a sealed container at the timeof venting serve as initial conditions for the differential equations that describe an aspirating container.Appendix C provides a more detailed technical description of the NEWGVALS model.
2.3 Theoretical Analyses
The third major element of the MDP is the theoretical analysis, which was conducted primarily throughdevelopment and use of the target matrix depletion (TARMATDEP) computer simulation code. TheTARMATDEP model was developed to theoretically analyze hydrogen gas generation in TRU. The modeltracks alpha radiation propagation through a source and target material and determines the effects on targetmolecules. Based on user-input dimensions and initial energies, TARMATDEP determines the alpha energyloss profile in two PuO source materials: (a) Pu, and (b) Pu, as well as in five candidate target2
238 239
materials, simulating the contents of TRU waste: PE, PVC, wet and dry cellulose, and cement. The programcalculates the instantaneous number of hydrogen bonds broken, running sum of hydrogen bonds broken, andeffective G-value. The model allows for user specification of both the total duration of modeling, as well asthe time interval between recording of the calculated data. A number of preliminary sensitivity simulationswere made to predict the effective G-value as a function of dose rate and to evaluate the effects of changing

2-9
bond breakage probabilities. Section 4 and Appendix B present results of model simulations; in addition,Appendix B provides a more detailed and technical description of the TARMATDEP model.
2.4 Quality Assurance
The MDP QAPP and the MDP Test Plan provide the program test framework and associated QArequirements for the experimental program, as well as for the validation/verification of the theoretical model,NEWGVALS, and the LabVIEW control software. The MDP Test Plan establishes the scope of the MDP;defines the different MDP components and the relationship between them; describes the selection of the testmatrices, experimental design, and test methodology; and documents methods for data management andanalysis of results.
The MDP QAPP specifies the quality of data required to meet program objectives, waste parameters thatmust be characterized prior to testing, analytical methods, instrument calibration, and administrative QC. TheMDP QAPP also specifies the performance-based QA/QC requirements that must be met by each facilityparticipating in the MDP. The INEEL prepared several procedures for data management, as well asdocumentation of model development and application also for the NEWGVALS and TARMATDEPcomputer models.
Revision 1.0 of the MDP QAPP (Connolly et al. 1997a) was issued in June 1997, and Revision 1.0 ofthe MDP Test Plan (Connolly et al. 1997b) was issued in January 1997. These documents were revised toreflect the changes in the implementation of the TRUPACT-II MDP, the experiments being performed atLANL, and the TWCP.
2.4.1 LANL Matrix Depletion Experiments
LANL matrix depletion experiments were conducted under the Gas Generation Matrix DepletionQuality Assurance Project Plan (GGMD QAPjP) (LANL 1998). The GGMD QAPjP identifies the qualityof the data and the techniques required to ensure that the specific DQOs associated with the program weremet. It follows the guidelines of the TWCP QAPP. In addition, the following procedures were prepared,reviewed, approved, and implemented:
• GGMD Training and Qualification Plan• GGMD Corrective Action and Quality Improvement Plan• GGMD Document Control Plan• GGMD Records Management Plan• GGMD Design Procedure• GGMD Procurement Procedure• GGMD Inspection and Acceptance Plan• GGMD Notebook and Logbook Maintenance Procedure• GGMD Management Assessment Procedure• Verification and Validation of LabVIEW for GGMD• Documentation of LabVIEW for GGMD• Procedure for Loading Test Chambers for Pu and Pu238 239
• Procedure for the Analysis of QC Verification Samples by Gas MS• Test Container Reload Procedure• GGMD Cold test Procedure• Sampling and Quality Control Procedure• Data Generation Level Validation Procedure
2-10
The LabVIEW software used to control the experimental apparatus at LANL was extensively verifiedand documented.
2.4.2 INEEL and RFETS TWCP and GGTP
For TWCP activities at the RFETS and the INEEL, the TWCP QAPP (DOE 1996) identifies the qualityof data necessary and techniques designed to attain and ensure the required quality to meet the specific DQOsassociated with the TWCP. The TWCP QAPP follows the guidelines recommended by EPA in QA/R-5(EPA, 1994). The INEEL and the RFETS conducted headspace gas hydrogen and methane measurementsunder approved QAPjPs that provide the QA/QC requirements of the TWCP. The INEEL implemented therequirements of the Idaho National Engineering and Environmental Laboratory Quality Assurance ProjectPlan for the TRU Waste Characterization Program (LMITCO 1997). RFETS implemented therequirements of the RFETS Quality Assurance Project Plan for the TRU Waste Characterization Program(RFETS 1998b). These QAPjPs were supplemented by site-specific standard operating procedures (SOPs)that detailed the implementation of headspace gas sampling and analysis.
For the GGTP, the following documents were prepared:
C GGTP QAPP (Westinghouse 1996)C GGTP Test Plan (Attachment to Appendix 1.3.7 of NRC 1996)C Test Standard Operating Procedure (Westinghouse 1995)C INEEL site-specific GGTP QAPjP (Edinborough 1996)C RFETS site-specific GGTP QAPjP (RFETS 1997)C RFETS site-specific GGTP test procedure (RFETS 1998a)C Site-specific SOPs
2.4.3 Program Interfaces
During the course of the MDP, participants interfaced extensively with each other and with participantsin other TRU transportation program initiatives. The MDP coordinator and the MDP QA officer met withMDP participants in October 1996 and February 1997, to discuss and resolve outstanding QA issues.
A TRUPACT-II transportation initiatives meeting was held in February 1997, to familiarize participantswith the ongoing initiatives and discuss integration of the initiatives. The agenda included overviews of theRFETS GGTP, the MDP, the Hydrogen Gas Getters Project (Weinrach 1997), the FlammabilityAssessment Methodology Program (Loehr et al. 1997), the Mixing of TRUPACT-II Shipping Categories(Djordjevic et al. 1996), and the Use of Headspace Flammable Gas Sampling as an Alternative Methodof Certifying TRU Waste Containers Project (Djordjevic et al. 1997). The major outcome of the meetingfor the MDP was the decision to use the effective G-values determined by the RFETS GGTP in the MDPin the same way as the INEEL GGTP derived effective G-values.
A meeting held in April 1997 identified activities that would facilitate shipments of RH and CH TRUwastes in the 72-B Cask and TRUPACT-II shipping packages, respectively. A coordination meeting of MDPparticipants was held in July 1997, to plan the G-initial experiments with respect to tasks, responsibilities,and schedules. MDP participants agreed that additional cylinders, absolute pressure gauges, and pneumaticvalves should be procured for any future G-initial experiments. MDP personnel also participated in annualTRUPACT-II GGTP meetings that were held in Idaho Falls, Idaho, in July 1996; and in Albuquerque, NewMexico, in August 1997 and July 1998.

3-1
3.0 RELATED STUDIES
In addition to the activities performed under the MDP, the phenomena of matrix depletion have beenstudied by various researchers over the past 20 years. Most of the experimental work has been related tomatrix depletion and understanding the effects and behavior of effective G-values was conducted at LANL.The following sections summarize relevant portions of this research and provide a brief description of theirresults.
3.1 The Zerwekh/Kosiewicz Experiments
Early experiments conducted at LANL, using plastic matrices and PuO , resulted in the first2382
substantive proof that matrix depletion has an effect on gas generation rates. In 1979, Zerwekh reported ona series of experiments begun in 1977, to explore variables affecting TRU waste gas generation (Zerwekh1979). The experiments focused on low-density polyethylene (LDPE) contaminated with Pu, which238
provided a maximum estimated experimental effective hydrogen G-value of 1.7 molecule/100 eV.
In 1981, Kosiewicz reported on a series of experiments conducted with PuO and PuO powders and238 2392 2
under simulated geologic repository conditions. The matrices consisted of PE, PVC, wet and dry cellulosics,Teflon®, hypalon, neoprene, bitumen, polyurethane, Lucite®, and a composite waste matrix. The resultanteffective G-value for PE ranged from 2.0 to 2.4 (Kosiewicz 1990, 1981), and a conclusive reduction in gasgeneration rates with increasing dose was observed.
3.2 The Marshall/Smith/Cappis Experiments
A new set of experiments focusing on alpha radiolysis was conducted by Marshall, Smith and Cappis(Smith et al. 1997) with the goal of evaluating conditions for safe on-site storage and the applicability of theTRUPACT-II wattage limits for Pu-contaminated combustible waste (Smith et al. 1997). Two different238
experiments were performed under this investigation to determine the gas generation characteristics ofPu-contaminated waste at LANL: (a) six test canisters were loaded with cellulosics or PE (three each),238
contaminated with PuO powder, and then analyzed for gas constituents and quantities over prolonged2382
periods of time; and (b) 50 drums containing Pu-contaminated wastes were sampled for headspace238
hydrogen concentration to determine the Effective G-value for actual wastes being generated at LANL.
3.2.1 Test Canisters
The six 2.06-L test cylinders were made of stainless steel, and sampling was performed on evacuated5-mL volumes. The first pair of canisters contained matrices that were contaminated with approximately 25mg of PuO , which were exposed for a total duration of 1,085 days, at a dose of roughly 0.036 W @ years.238
2
The second pair of canisters contained matrices contaminated with approximately 17 mg of PuO , which2382
were exposed for 945 days at a dose of roughly 0.022 W @ years, The third pair of canisters containedmatrices contaminated with approximately 14 mg of PuO , which were exposed for 795 days at a dose of238
2
roughly 0.018 W @ years. The PuO powder was characterized by a mean diameter of 3.61 microns.2382
The canisters were analyzed by MS for H , CH , N , O , CO, Ar, and H O. Samples were obtained every2 4 2 2 2
few days initially, decreasing to once every few months after the first 365 days. At the conclusion of theexperiments, all six canisters showed H gas generation to be slowing down with increasing dose. The2
Effective G-value for the cellulose simulated waste experiments started at a value of approximately 1.0 anddecreased to 0.3 or below by the time doses reached 4x10 eV. For the PE simulated waste, the effective24
G-value initially ranged from 0.8 to 1.8 and decreased to below 0.3 as doses approached 4x10 24

0.00.20.40.60.81.01.21.41.61.82.0
0.00 0.01 0.02 0.03 0.04
Dose [Watt*yr]
G-V
alu
e
Cappis PE-1
Cappis PE-2
Cappis PE-3
3-2
Figure 3-1. Marshall/Smith/Cappis experimental data (PE, G-value vs. time).
Figure 3-2. Marshall/Smith/Cappis experimental data (PE, G-value vs. dose).

0.0
0.2
0.4
0.6
0.8
1.0
1.2
1.4
0.00 0.01 0.02 0.03 0.04
Dose [Watt*yr]
G-v
alu
e
Cappis drycell-1Cappis drycell-2Cappis drycell-3
3-3
Figure 3-3. Marshall/Smith/Cappis experimental data (cellulose, G-value vs. time).
Figure 3-4. Marshall/Smith/Cappis experimental data (cellulose, G-value vs. dose).

3-4
eV. Figures 3-1 through 3-4 show the resultant effective G-values.
3.2.2 TA-55 Waste Drums
The 50 drums of actual waste at LANL, containing waste contaminated with Pu, were sampled using238
a custom-made drum sampling device that evacuated a 25-mL sample volume. The waste had been loadedinto the drums six months to two years prior to sampling. The effective G-value was calculated for each drumusing a mathematical model that simulates hydrogen generation and diffusion through multiple containmentlayers in 55-gal. drums.
All drum lids were fitted with a single NFT 013-type carbon composite filter, through which gas sampleswere collected. Overall, hydrogen concentrations in mole percent were measured to range from <0.001 to2.06%. The effective G-value calculated for each drum was consistent with the effective G-value derivedfrom the six test canisters, and generally fell well below 1.0. The most notable exception found was a wastedrum containing discarded gloves, which had a effective G-value of 1.7.

4-1
4.0 MDP RESULTS
This section provides the results of the three major elements of the MDP: laboratory experiments to determineeffective G-values for simulated waste materials; comparisons of experimentally derived effective G-values with realwaste measurements; and theoretical analyses. This section provides a synthesis of the three elements of the MDP andcompares the dose dependent G-values to current TRUPACT-II initial bounding G-values. In addition, apostirradiation examination was performed on two of the test cylinders. The results of this examination are detailed inAppendix E.
4.1 Laboratory Experiments
By the end of June 1998, data had been collected for 34 cycles in the MDP experiments. Appendix A presents ananalysis of the data; describes the calculation of effective G-values, determination of data sets used to select effectiveG-values, analysis of effects on effective G-value, and statistical summaries of effective G-values; and presentseffective G-value behavior and values for individual cylinders. Appendix A also summarizes purging episodes andQC data collected over the 34 cycles. In general, the data patterns are consistent with theoretical expectations foreffective G-value behavior for different waste materials. MS data are in good agreement with GC data.
The effects analysis of MDP experimental results showed that only the waste matrix has a significant effect oneffective G-value. Heating and isotope did not have significant effects. Effective G-values follow a normaldistribution for each waste matrix. The individual effective G-values calculated for each sampling event were used tostatistically calculate a dose dependent G-value for each waste matrix. Three statistical methods were used, which are:1) the mean, 2) the 95% upper confidence limit (UCL ), and 3) the 95% upper tolerance limit (UTL ). Table 4-195 95
provides various statistics for the effective G-value for each waste matrix. The tabulated statistics include the numberof observations, the mean effective G-value, the standard deviation of the effective G-values, the standard error of themean, the UCL of the mean effective G-value, the 95 percentile effective G-value, and the UTL . The statistics are95 95
th
based on only steady state effective G-value data, which is determined by the effective G-value exhibiting a zero slopeover time (tested at the 0.05 significance level) by experimental condition (e.g., unheated cylinders with PE and Pu).239
Table 4-1. Experimental G-value Statistics (molecules/100 eV).
Matrix Number of Mean Standard Standard UCL of 95 UTLobservations deviation error of mean percentile
mean
95th
95
Cement 202 0.25 0.18 0.01 0.27 0.49 0.58
Dry cellulose 302 0.27 0.18 0.01 0.29 0.49 0.59
PE 186 0.23 0.22 0.02 0.26 0.56 0.64
PVC 99 0.14 0.19 0.02 0.17 0.44 0.50
Wet cellulose 276 0.44 0.36 0.02 0.48 0.99 1.09
Depending on the experimental condition, zero slopes (i.e., stabilized or statistically constant effective G-valueswith dose) were attained at different cycle numbers, as shown in Table A-4 (Appendix A). The lowest initial cyclenumbers associated with the zero slopes are for cement and PVC matrices; these range from three to six, and

4-2
correspond to doses ranging from 0.0009 to 0.002 Watt @ yr. The highest cycle numbers associated with zero slopesare typically PE and include some wet and dry cellulose data sets; the highest associated dose observed is 0.006 Watt@ yr.
Figures 4-1 through 4-5 show the calculated effective G-value versus dose for each test matrix. These graphscontain data for all of the cylinders for a specific matrix material (e.g., Figure 4-1 contains the data for all of thecylinders containing cement). Analyses were performed on the individual container data to determine the dose atwhich the effective G-value has statistically reached steady state. Each graph contains two types of data: (a)non-steady state (triangles) and (b) steady state (circles). Each graph contains a vertical dotted line that signifies themaximum dose in Watt @ yr required for the effective G-value in any container to reach steady state. Therefore, a fewof the steady state data points (circles) may lie to the left of the vertical line and all of the non-steady state points(triangles) will lie to the left of the vertical line. In addition, to the vertical line, there are two horizontal lines on eachgraph. The solid horizontal line signifies the dose dependent G-value based on the UCL . The dashed horizontal line95
signifies the dose dependent G-value based on the UTL . The horizontal lines show how the dose dependent G-values95
compare to all of the calculated effective G-values.
4.2 Real Waste Measurements
Statistical comparisons were made of the dose dependent G-values derived from the matrix depletionexperiments, with the measurements from actual TRU waste drums to demonstrate that the dose dependent G-valuesfrom the matrix depletion experiments are greater. Two types of comparisons were made using the dose dependentG-values derived from matrix depletion experiments. The first compared the dose dependent G-values with those ofthe GGTP results (Section 4.2.1), and the second compared predicted flammable gas concentrations using the dosedependent G-values with flammable gas concentrations measured in the TWCP (Section 4.2.2).
Because of the simulated waste materials used in the MDP, it was expected that headspace flammable gasconcentrations predicted using the MDP dose dependent G-values would be greater than measured drum flammablegas concentrations. It was also expected that the dose dependent G-values measured in the MDP would be greaterthan the effective G-values calculated from gas generation testing of actual TRU waste containers. In both cases,MDP dose dependent G-values were greater due to the nature of the target material and the geometry of the cylindercontents. This is primarily because other non hydrogenous materials present in actual CH TRU waste are not includedin the MDP. In addition, the target material was directly sprinkled with plutonium oxide, allowing the radioactiveparticles to come into direct contact with the target material. In actual CH TRU waste, the plutonium is dispersed andnot always in such direct contact with hydrogenous materials.

-1.5
-1.0
-0.5
0.0
0.5
1.0
1.5
0.000 0.002 0.004 0.006 0.008 0.010 0.012 0.014
Dose (watt-year)
G-V
alu
e (m
ole
cule
s H
2/10
0 eV
)
Non-Steady StateSteady StateSteady State Dose95% Upper Confidence95% Upper Tolerance
4-3
Figure 4-1. Graph of G-value versus accumulated dose for cement matrix.

-0.2
0.0
0.2
0.4
0.6
0.8
1.0
1.2
1.4
1.6
1.8
0.000 0.002 0.004 0.006 0.008 0.010 0.012 0.014
Dose (watt-year)
G-V
alu
e (m
ole
cule
s H
2/10
0 eV
)
Non-Steady StateSteady StateSteady State Dose95% Upper Confidence95% Upper Tolerance
4-4

4-5
Figure 4-2. Graph of G-value versus accumulated dose for dry cellulose matrix.

-0.5
0.0
0.5
1.0
1.5
2.0
2.5
0.000 0.002 0.004 0.006 0.008 0.010 0.012 0.014
Dose (watt-year)
G-V
alu
e (m
ole
cule
s H
2/10
0 eV
)
Non-Steady StateSteady StateSteady State Dose95% Upper Confidence95% Upper Tolerance
4-6
Figure 4-3. Graph of G-value versus accumulated dose for wet cellulose matrix.

-0.5
0.0
0.5
1.0
1.5
0.000 0.002 0.004 0.006 0.008 0.010 0.012 0.014
Dose (watt-year)
G-V
alu
e (m
ole
cule
s H
2/10
0 eV
)Non-Steady StateSteady StateSteady State Dose95% Upper Confidence95% Upper Tolerance
4-7
Figure 4-4. Graph of G-value versus accumulated dose for PVC matrix.

-0.8
-0.4
0.0
0.4
0.8
1.2
1.6
0.000 0.002 0.004 0.006 0.008 0.010 0.012 0.014
Dose (watt-year)
G-V
alu
e (m
ole
cule
s H
2/10
0 eV
)
Non-Steady StateSteady StateSteady State Dose95% Upper Confidence95% Upper Tolerance
4-8
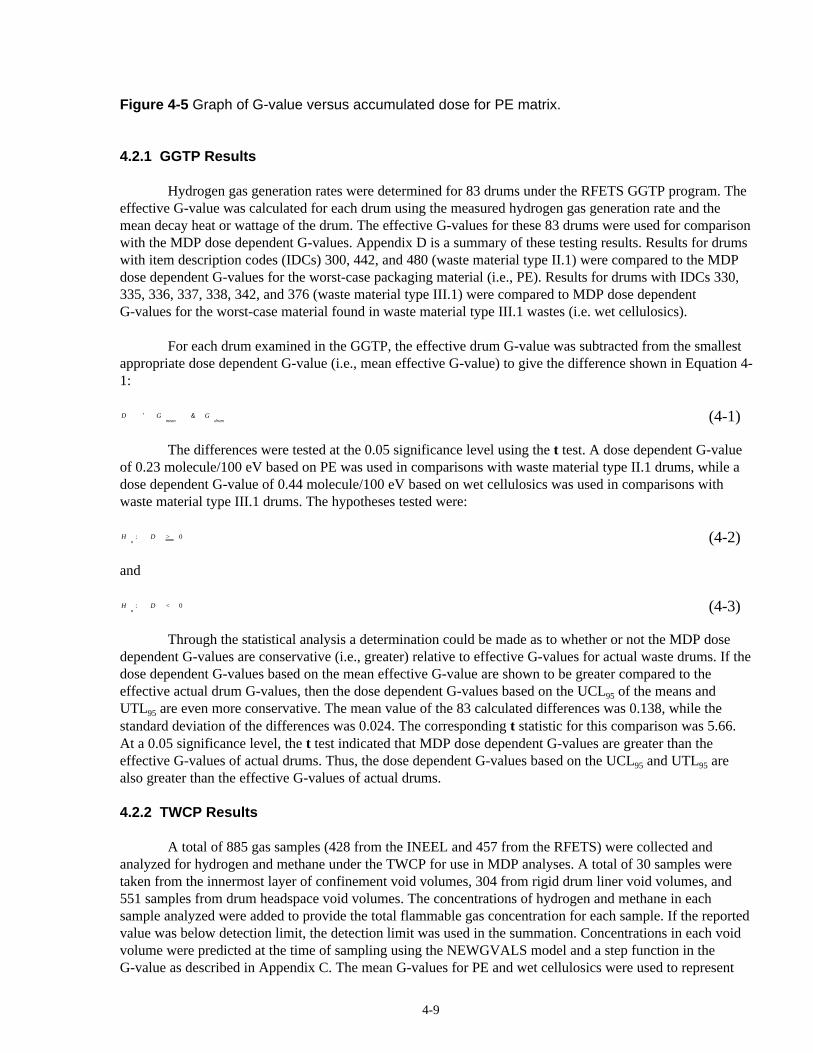
D ' Gmean
& Gdrum
Ho
: D > 0
Ha
: D < 0
4-9
(4-1)
(4-2)
(4-3)
Figure 4-5 Graph of G-value versus accumulated dose for PE matrix.
4.2.1 GGTP Results
Hydrogen gas generation rates were determined for 83 drums under the RFETS GGTP program. Theeffective G-value was calculated for each drum using the measured hydrogen gas generation rate and themean decay heat or wattage of the drum. The effective G-values for these 83 drums were used for comparisonwith the MDP dose dependent G-values. Appendix D is a summary of these testing results. Results for drumswith item description codes (IDCs) 300, 442, and 480 (waste material type II.1) were compared to the MDPdose dependent G-values for the worst-case packaging material (i.e., PE). Results for drums with IDCs 330,335, 336, 337, 338, 342, and 376 (waste material type III.1) were compared to MDP dose dependentG-values for the worst-case material found in waste material type III.1 wastes (i.e. wet cellulosics).
For each drum examined in the GGTP, the effective drum G-value was subtracted from the smallestappropriate dose dependent G-value (i.e., mean effective G-value) to give the difference shown in Equation 4-1:
The differences were tested at the 0.05 significance level using the t test. A dose dependent G-valueof 0.23 molecule/100 eV based on PE was used in comparisons with waste material type II.1 drums, while adose dependent G-value of 0.44 molecule/100 eV based on wet cellulosics was used in comparisons withwaste material type III.1 drums. The hypotheses tested were:
and
Through the statistical analysis a determination could be made as to whether or not the MDP dosedependent G-values are conservative (i.e., greater) relative to effective G-values for actual waste drums. If thedose dependent G-values based on the mean effective G-value are shown to be greater compared to theeffective actual drum G-values, then the dose dependent G-values based on the UCL of the means and95
UTL are even more conservative. The mean value of the 83 calculated differences was 0.138, while the95
standard deviation of the differences was 0.024. The corresponding t statistic for this comparison was 5.66.At a 0.05 significance level, the t test indicated that MDP dose dependent G-values are greater than theeffective G-values of actual drums. Thus, the dose dependent G-values based on the UCL and UTL are95 95
also greater than the effective G-values of actual drums.
4.2.2 TWCP Results
A total of 885 gas samples (428 from the INEEL and 457 from the RFETS) were collected andanalyzed for hydrogen and methane under the TWCP for use in MDP analyses. A total of 30 samples weretaken from the innermost layer of confinement void volumes, 304 from rigid drum liner void volumes, and551 samples from drum headspace void volumes. The concentrations of hydrogen and methane in eachsample analyzed were added to provide the total flammable gas concentration for each sample. If the reportedvalue was below detection limit, the detection limit was used in the summation. Concentrations in each voidvolume were predicted at the time of sampling using the NEWGVALS model and a step function in theG-value as described in Appendix C. The mean G-values for PE and wet cellulosics were used to represent

D ' CB
& C
Ho
: D > 0
Ha
: D < 0
4-10
(4-4)
(4-5)
(4-6)
the dose dependent effective G-values for waste material types II.1 and III.1, respectively. Using the dosedependent G-values based on the UCL of the means and UTL would have yielded even higher predicted95 95
flammable gas concentrations. Appendix C provides the specifics of the modeling, G-value step functionsused, and drum and sample data supplied as input to NEWGVALS, as well as the predicted flammable gasconcentrations in each layer of confinement for use in comparisons with sampled concentrations.
For each sample, the measured flammable gas concentration, C, was subtracted from theNEWGVALS predicted flammable gas concentration, C , as documented in Appendix C, to give theB
following difference:
Location ofsampling
Number of Mean of Standardobservations differences deviation of
(vol% differencesflammable gas) (vol%
flammable gas)
t statistic value
Inner bag void 30 0.623 0.188 3.31
Rigid drum liner 304 2.429 0.375 6.48
Drumheadspace
551 1.688 0.310 5.44

4-11
Overall, the TARMATDEP modeling of the effective G-value versus dose behavior indicatedthat, while the effective G-value is independent of the dose rate (in Watts) incident on a particulartarget matrix, it is highly dependent on the total dose (in Watt @ yrs) applied to a particular targetmatrix. In other words, a finite and known effective G-value can be derived from knowing the properties ofthe contaminant, the properties of the target matrix material, and the total dose applied to the target matrix.

4-12
Figure 4-6. Comparison of LANL MDP short-term experimental data with TARMATDEP model.

100806040200
TARM Upper Limit
Rack A1
Rack H1
Rack HA1
Rack N1
TARM Lower Limit
time [days]
LOWER LIMIT
4-13
Figure 4-7. Comparison of LANL MDP short-term experimental data with TARMATDEP predictive range.

100080060040020000
TARMATDEP Model
Rack A2
Rack A16
Rack H2
Rack H16
Rack HA2
Rack HA16
Rack N2
Rack N16
time [days]
4-14
Figure4-8. Comparison of LANL MDP long-term experimental data with TARMA TDEP model.
4-15

4-16

5-1
5.0 CONCLUSIONS
The three-year MDP is the most comprehensive study of gas generation and matrix depletion phenomenaof simulated TRU waste materials completed to date. The program was developed and implemented undera formal QA program. The matrix depletion experiments were designed using an EPA-established procedurein formulating DQOs that were met.
Validated gas generation data were collected for 34 sampling cycles using the experimental testingapparatus at LANL. Effective G-values were then calculated for each test cylinder for each of the 34sampling cycles. Each cylinder contained one of five simulated TRU waste materials (i.e., PE, PVC, wet anddry cellulose, and cement represented by Envirostone) that were impregnated with one of two isotopicmixtures (one predominantly Pu oxide and the other predominantly Pu oxide). MDP testing has238 239
demonstrated matrix depletion in simulated waste materials, which is consistent with results from pastresearch. The key parameters effecting the effective G-value have been identified and quantified throughtesting and analysis of results. The observed effects of each of the key variables is summarized below.
5.1 Dose
Increasing dose (defined as the product of the decay heat measured in a test cylinder and elapsed timefrom cylinder loading) decreases the effective flammable gas generation rate of hydrogenous materials (suchas plastics and combustibles) due to depletion of the target material in the vicinity of an alpha-emittingradioactive source particle. This effect has been demonstrated through the current MDP testing, previoustesting of similar materials with similar radioactive sources, and theoretical modeling of the matrix depletionphenomena.
5.2 Matrix Materials
The values of the dose dependent G-values are highly dependent on the material that is irradiated.Testing has demonstrated that wet cellulosics yield the highest dose dependent G-values. Wet cellulosics aretypically found in containers containing predominantly combustible wastes (i.e. waste type III). PE is thebounding material for hydrogen gas generation in containers of inorganic solid wastes packaged withinplastic bags (i.e., waste type II).
5.3 Moisture
The effects of moisture were evaluated by having cylinders with both wet and dry cellulosic materials.The dose dependent G-values for wet cellulosics are statistically higher than those of dry cellulosics becauseof the presence of water.
5.4 Temperature
The effects of temperature were evaluated by heating selected test cylinders continuously at 140EF tosimulate worst-case thermal transport conditions. At the 95% confidence level, there was no statisticallysignificant effect of temperature on the dose dependent G-value.

5-2
5.5 Agitation
The effects of agitation were not evaluated because the proposed agitation of test cylinders was foundnot to represent the conditions of actual 55-gal. drums during movement and transport. Previous experimentsthat included agitation of cylinders similar to those used in the MDP indicated that agitation did not affecteffective G-values.
5.6 Particle Size Distribution
The effects of particle size distribution were evaluated by having two radioactive source materials withsignificantly different particle size distributions. In one case, the particle sizes were approximately 16.6microns in diameter and relatively monodisperse, while for other test cylinders, the spread in particle diameterwas very broad, with a mean particle diameter of around 33 microns. Experimental results as well astheoretical simulations indicate that smaller particle diameters yield higher initial G-values. However, for allparticle diameters tested, the effective G-values for individual test cylinders are substantially lower than thedose dependent G-values based on the UCL and UTL for the worst-case materials tested under the MDP.95 95
5.7 Isotopic Composition
Two different isotopes of Pu ( Pu and Pu) were tested at equivalent decay heats for each test cylinder.238 239
At the 95% confidence level, isotopic composition did not have a significant effect on the dose dependentG-value.
5.8 Initial versus Dose Dependent G-values
Initial effective G-values were higher than the dose dependent G-values for all waste matrices exceptEnvirostone, thus supporting the concept of matrix depletion. The dose dependent G-values for PE areconsiderably lower than the initial bounding G-value of 3.4 molecule/100 eV used in the TRUPACT-IISARP. The TRUPACT-II SARP value is based on gamma irradiation experiments conducted in 1959. Thecredibility of experiments conducted prior to 1962 is questionable. More recent data collected since that timeindicate that the maximum initial bounding G-value for alpha irradiation of PE in air is 2.4 molecule/100eV.The dose dependent G-values for PE, PVC, and cellulosics are several times lower than the correspondinginitial bounding G-values.
5.9 The Path Forward
Revision 17 of the TRUPACT-II SARP, through the proposed revised numeric shipping categorynotation, has provided a framework for readily incorporating dose dependent G-values. The new shippingcategory notation uses 10 numeric characters, as shown in the following example:

5-3
Example: XX YYYY ZZZZwhere
XX = Waste Type (10=waste type I, 20=waste type II, 30=waste type III, and40=waste type IV)
YYYY = G-value (x 100)
ZZZZ = Resistance to hydrogen release (x 10 )-4
Thus the dose dependent G-values can be readily represented by the YYYY portion of the shippingcategory notation. The calculation of maximum allowable wattage for a container is calculated through athree-step process:
Step 1: Determine effective G-value for waste material type from look-up table in TRAMPAC (thus MDPdose dependent G-values can readily be added to this look-up table).
Step 2: Determine resistance to hydrogen release by a worksheet.
Step 3: Determine maximum allowable wattage as a function of effective G-value and total resistance tohydrogen release.
Appropriate sections of the TRUPACT-II SARP (including Appendix 3.6.7, “Effective G-values forTRUPACT-II Waste Types”) and the TRAMPAC may be revised to explain the matrix depletionphenomenon; provide a rationale for dose dependent G-values; document the MDP testing and relatedexperimental programs; and summarize MDP results.
5.10 Summary
The dose dependent G-values are reproducible, consistent with earlier results, and fall within theoreticallypredicted bounds. Dose dependent G-values have been derived for each waste material tested. Comparisonswith actual drum data have demonstrated that the dose dependent G-values for worst-case materials by wastetype (i.e., PE for type II, and wet cellulosics for type III) are, in fact, greater than those for actual wastes andare, therefore, good conservative estimators for each respective waste type.
MDP effects analyses indicated that only the waste matrix has a significant effect on the dose dependentG-value. At the 95% confidence level, isotope and temperature (i.e., heating) did not have significant effectson the dose dependent G-values. In addition, the data demonstrate consistency with TRUPACT-II SARPlimits for waste type I. Analyses of MDP experimental data indicate that dose dependent G-values liebetween 14% (UCL value for wet cellulose) and 38% (UTL value for PE) of the applicable TRUPACT-II95 95
SARP initial bounding values, depending on the waste material, and including effective G-values calculatedfrom heated cylinders (e.g., wet cellulose is comparable to waste material type III-1, solid organic materials).In general, the data patterns are consistent with theoretical expectations for effective G-value behavior overtime for different waste materials.
Appropriate sections of the TRUPACT-II SARP and TRAMPAC should be revised to explain andaccount for the matrix depletion phenomenon. The original TRUPACT-II SARP initial bounding G-values

5-4
may be used to establish the wattage limits for newly generated containers. When a container has attainedan adequate dose level, the lower dose dependent G-values may be used to establish the allowable wattagefor the containers (i.e., a step function in G-value from initial high to depleted low).

6-1
6.0 REFERENCES
Connolly et al. (M. J. Connolly, G. R. Hayes, T. J. Krause, and J. S. Burt), TRUPACT-II Matrix DepletionQuality Assurance Program Plan, Rev. 1, INEL 95/0361, Idaho National Engineering andEnvironmental Laboratory, Idaho Falls, Idaho, 1997a.
Connolly et al. (M. J. Connolly, S. M. Djordjevic, V. Banjac, and C. A. Loehr), TRUPACT-II MatrixDepletion Program Test Plan, Rev. 1, INEL 95/0360, Idaho National Engineering and EnvironmentalLaboratory, Idaho Falls, Idaho, 1997b.
DOE, Transuranic Waste Characterization Quality Assurance Program Plan, CAO 94-1010, CurrentRevision, U.S. Department of Energy, Carlsbad Area Office, Carlsbad, New Mexico, 1996.
Djordjevic et al. (S. M. Djordjevic, L. R. Spangler, and M. J. Connolly), Mixing of TRUPACT-II ShippingCategories Final Report, INEL-96/0364, Idaho National Engineering and Environmental Laboratory,Idaho Falls, Idaho, 1996.
Djordjevic et al. (S. M. Djordjevic, L. R. Spangler, M. J. Connolly, and K. J. Liekhus), Use of HeadspaceFlammable Gas Sampling as an Alternative Method of Certifying TRU Waste Containers ProjectFinal Report, INEEL/EXT-97-00720, Idaho National Engineering and Environmental Laboratory, IdahoFalls, Idaho, 1997.
Edinborough, C. R., Quality Assurance Project Plan for the Gas Generation Testing Program at the INEL,INEL-94/0109, Rev. 1, Idaho National Engineering Laboratory, Idaho Falls, Idaho, 1996.
EPA Requirements for Quality Assurance Project Plans for Environmental Data Operations. U.S.Environmental Protection Agency Quality Assurance Management Staff, Washington, D.C., 1994.
LMITCO, Idaho National Engineering and Environmental Laboratory Quality Assurance Project Planfor the TRU Waste Characterization Program, Revision 2. PLN-190, Idaho Falls, Idaho, Idaho NationalEngineering and Environmental Laboratory, 1997.
INEEL. Data Reduction, Validation, and Reporting Procedure for the TRUPACT-II Matrix DepletionProgram, Revision 1. Idaho National Engineering and Environmental Laboratory, Idaho Falls, Idaho,1995.
Kazanjian, A.R. Radiolytic Gas Generation in Plutonium Contaminated Waste Materials, RFP-2469,Rocky Flats Plant, Rockwell International, Golden, Colorado, 1976.
Kosiewicz, S.T. Gas Generation from Organic Transuranic Wastes. I. Alpha Radiolysis at AtmosphericPressure, Nuclear Technology 54: pp. 92-99 , 1981.
Kosiewicz, S.T. Comments on Gas Generation from Organic Transuranic Wastes. I. Alpha Radiolysis atAtmospheric Pressure, Nuclear Technology 92: p. 428, 1990.
LANL, Gas Generation Matrix Depletion Quality Assurance Project Plan, CST-GGMD-QAP1-001/0, LosAlamos National Laboratory, Los Alamos, New Mexico, 1998.

6-2
Loehr et al. (C. A. Loehr, S. M. Djordjevic, K. J. Liekhus, and M. J. Connolly), Flammability AssessmentMethodology Program Phase I - Final Report, INEEL/EXT-97-0352, Idaho National Engineering andEnvironmental Laboratory, Idaho Falls, Idaho, 1995.
Marshall, R. S., and J. H. Cappis. Determining Site-Specific Drum Loading Criteria for StoringCombustible Pu Waste. LA-UR-94-409, Los Alamos, New Mexico, Los Alamos National Laboratory,238
1994.
Marshall et al. (R. S. Marshall, E. L. Callis, J. H. Cappis, J. M. Espinoza, E. M. Foltyn, B. T. Reich, and M.C. Smith). "Determining Site-Specific Drum Loading Criteria for Storing Combustible Pu Waste." Los238
Alamos National Laboratory Report LA-UR-94-409, 9pp.
NRC, Safety Analysis Report for the TRUPACT-II Shipping Package, Rev. 16, Docket No. 71-9218, U.S.Nuclear Regulatory Commission, Washington, D.C., 1996.
RFETS. Rocky Flats Environmental Technology Site Gas Generation Test Program Quality AssuranceProject Plan, Rev. 0, RS-020-001, Rocky Flats Environmental Technology Site, Golden, Colorado,1997.
RFETS. Gas Test Canister Operations, Rev. 1, 4-N01-RES-030-001, Rocky Flats EnvironmentalTechnology Site, Golden, Colorado, 1998a.
RFETS. Rocky Flats Environmental Technology Site TRU Waste Characterization Program QualityAssurance Project Plan, Rev. 2, 95-QAjP-0050, Rocky Flats Environmental Technology Site, Golden,Colorado, 1998b.
Smith et al. (M. C. Smith, R. Marshall, E. L. Callis, J. H. Cappis, J. M. Espinoza, and E. M. Foltyn)"Hydrogen Generation and Release in Stored 238Pu Waste at Los Alamos National Laboratory." HealthPhysics Society, Twenty-Seventh Midyear Meeting, Albany, New York, February 13-16, 1994.
Smith et al. (M.C. Smith., E.L. Callis, J.H. Cappis, E.M. Foltyn, R.S. Marshall, and J. Espinoza. “AlphaRadiolytic Gas Generation: Determination of Effective G-values.” Los Alamos National LaboratoryReport, Los Alamos, New Mexico, 1995.
Smith et al. (M. C. Smith, E. L. Callis, J. H. Cappis, E. M. Foltyn, R. S. Marshall, and J. M. Espinoza)."Alpha Radiolytic Gas Generation: Determination of Effective G-values." Los Alamos NationalLaboratory, Los Alamos, New Mexico, 1997.
Weinrach, J., Test Plan for Hydrogen Getters Project, Los Alamos National Laboratory, Los Alamos, NewMexico, 1997.
Westinghouse. Test Standard Operating Procedure for the TRUPACT-II Gas Generation Test Program.Draft, Rev. 1C, Westinghouse Electric Company, Waste Isolation Division, Carlsbad, New Mexico,1995.
Westinghouse. Quality Assurance Program Plan for the TRUPACT-II Gas Generation Test Program.Draft, Rev. 0, Westinghouse Electric Company, Waste Isolation Division, Carlsbad, New Mexico, 1996.
Zerwekh, A. “Gas Generation from Radiolytic Attack on TRU-Contaminated Hydrogenous Waste.” LosAlamos National Laboratory Report LA-5654-MS, Los Alamos, New Mexico, 1979.

6-3
Zerwekh, A., and J. Warren. “Gas Generation and Migration Studies Involving Recently Generated Pu-238
Contaminated Waste for the TRU Waste Sampling Program.” Los Alamos National Laboratory ReportLA-10732-MS, Los Alamos, New Mexico, 1986.
Zerwekh et al. (A. Zerwekh, J. Warren, and S. T. Kosiewicz). “Effects of Vibration on the Alpha Radiolysisof TRU Wastes.” Proceedings of Waste Management ’93 Conference, Tucson, Arizona, 1993.

A-1
Appendix A
Results of TRUPACT-II MatrixDepletion Program Experiments
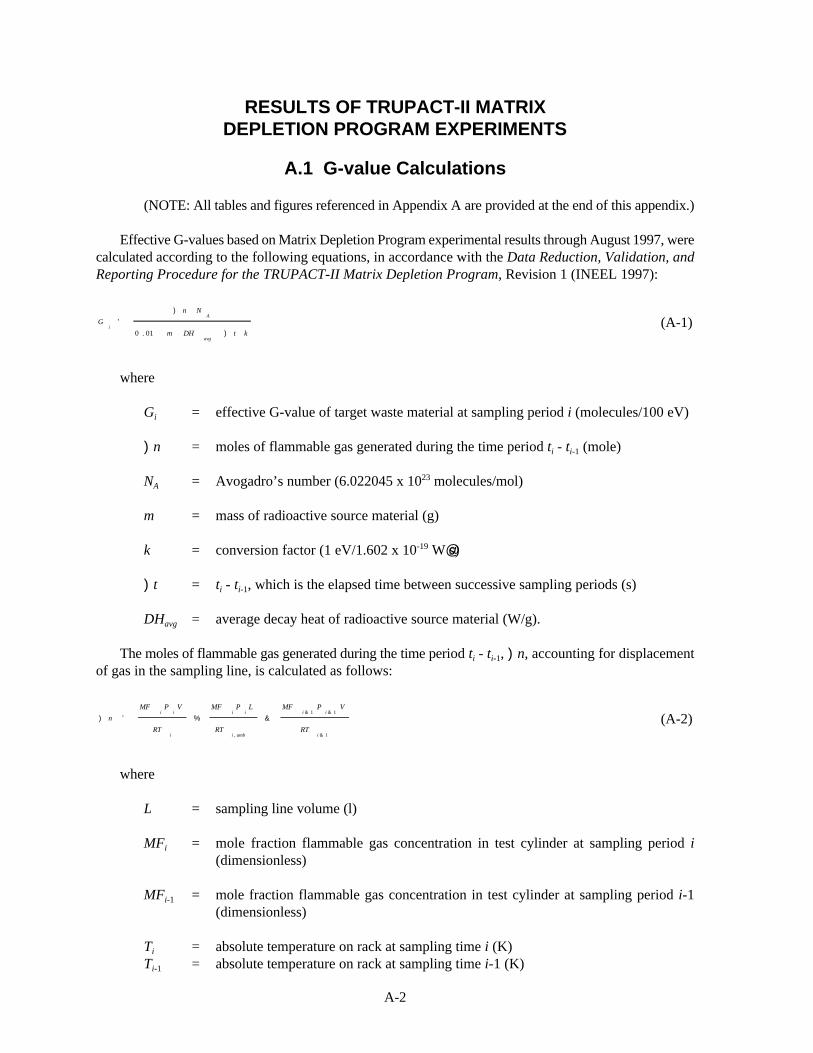
Gi
'
) n NA
0 . 01 m DHavg
) t k
) n '
MFi
Pi
V
RTi
%
MFi
Pi
L
RTi , amb
&
MFi & 1
Pi & 1
V
RTi & 1
A-2
(A-1)
(A-2)
RESULTS OF TRUPACT-II MATRIXDEPLETION PROGRAM EXPERIMENTS
A.1 G-value Calculations
(NOTE: All tables and figures referenced in Appendix A are provided at the end of this appendix.)
Effective G-values based on Matrix Depletion Program experimental results through August 1997, werecalculated according to the following equations, in accordance with the Data Reduction, Validation, andReporting Procedure for the TRUPACT-II Matrix Depletion Program, Revision 1 (INEEL 1997):
where
G = effective G-value of target waste material at sampling period i (molecules/100 eV)i
)n = moles of flammable gas generated during the time period t - t (mole)i i-1
N = Avogadro’s number (6.022045 x 10 molecules/mol)A23
m = mass of radioactive source material (g)
k = conversion factor (1 eV/1.602 x 10 W@s)-19
)t = t - t , which is the elapsed time between successive sampling periods (s)i i-1
DH = average decay heat of radioactive source material (W/g).avg
The moles of flammable gas generated during the time period t - t , )n, accounting for displacementi i-1
of gas in the sampling line, is calculated as follows:
where
L = sampling line volume (l)
MF = mole fraction flammable gas concentration in test cylinder at sampling period ii
(dimensionless)
MF = mole fraction flammable gas concentration in test cylinder at sampling period i-1i-1
(dimensionless)
T = absolute temperature on rack at sampling time i (K)i
T = absolute temperature on rack at sampling time i-1 (K)i-1

A-3
T = absolute ambient temperature at sampling time i (K)i, amb
P = absolute final pressure in test chamber at sampling period i prior to gas samplei
withdrawal for concentration determination (atm)
P = absolute final pressure in test chamber at sampling period i-1 after gas samplei-1
withdrawal for concentration determination (atm)
V = void volume in test chamber (l)
R = universal gas constant (0.08206 atm l/mol K).
A.2 G-value Data Sets
Experimental data validated according to Los Alamos National Laboratory procedures were used tocalculate G-values according to the above equations for cycles 1-34 of original test cylinders and for cycles1-25 of restart cylinders. Cylinder characteristics are described in Table A-1.
Cylinder purging and backfilling with ambient air oxygen concentrations was performed on 21 originaltest cylinders. Nine cylinders were purged and backfilled after cycle 25, and 12 were purged and backfilledafter cycle 27. All cylinders were inadvertently opened to the atmosphere during an unauthorized intrusioninto the computer network at cycle 31. Those cylinders that were at sub-atmospheric pressure conditions werebrought back to the ambient pressure with air, whereas those cylinders that were above atmospheric pressurewere depressurized back to the ambient pressure. Table A-1 identifies purged cylinders and cycles. Cyclesare renumbered in analysis data set to reflect sampling before and after each planned purge; the total numberof cycles in the resulting original test cylinder data set is 38.
For the first cycle(s) after the purging until the cycle with the next available validated hydrogenmeasurement, G-values for purged cylinders were not computed. Also, G-values were not computed acrosspressure discontinuities. Ambient temperatures for calculations are taken as the average of unheated racktemperature measurements for each cycle, except cycle 0 is taken as 25EC. Cylinder void volumes are usedfor the calculations. Data for cylinders designated as heated, but collected prior to heating, and data from aleaking cylinder (A04) are omitted from analysis data sets. Tables A-2 and A-3 provide input measurementsand calculated G-values for original and restart cylinders, respectively.

A-4
Table A-1. Cylinder characteristics for original and restart cylinders.
Cylinder Pu Heated/ Original/code isotope Matrix unheated Purge cycle restarta
N02 239 PE Unheated 30/31 OriginalN03 238 CEM Unheated 26/27 OriginalN04 239 DC Unheated 26/27 OriginalN05 238 PE Unheated OriginalN06 239 WC Unheated OriginalN07 238 PE Unheated OriginalN08 238 PVC Unheated OriginalN09 238 WC Unheated OriginalN10 238 PVC Unheated OriginalN11 238 WC Unheated OriginalN12 239 WC Unheated OriginalN13 238 DC Unheated 26/27 OriginalN14 239 DC Unheated 26/27 OriginalN15 238 DC Unheated 26/27 OriginalN16 239 PE Unheated 30/31 OriginalA02 239 PE Unheated 30/31 OriginalA03 238 CEM Unheated 26/27 OriginalA04 239 DC Unheated OriginalA05 238 WC Unheated OriginalA06 239 WC Unheated OriginalA07 238 WC Unheated OriginalA08 239 CEM Unheated OriginalA09 238 DC Unheated 26/27 OriginalA10 239 CEM Unheated OriginalA11 238 DC Unheated 26/27 OriginalA12 239 WC Unheated OriginalA13 238 PE Unheated OriginalA14 239 DC Unheated 26/27 OriginalA15 238 PE Unheated OriginalA16 239 PE Unheated OriginalH02 239 PE Heated OriginalH03 238 CEM Heated OriginalH04 239 DC Heated 30/31 OriginalH05 238 PE Heated OriginalH06 239 WC Heated OriginalH07 238 PE Heated OriginalH08 239 CEM Heated OriginalH09 238 WC Heated OriginalH10 239 CEM Heated OriginalH11 238 WC Heated Original
Table A-1. (continued).

A-5
Cylinder Pu Heated/ Original/Code Isotope Matrix Unheated Purge Cycle Restarta
H12 239 WC Heated OriginalH13 238 DC Heated 30/31 OriginalH14 239 DC Heated 30/31 OriginalH15 238 DC Heated 30/31 OriginalH16 239 PE Heated Original
HA02 239 PE Heated OriginalHA03 238 CEM Heated OriginalHA04 239 DC Heated 30/31 OriginalHA05 238 WC Heated OriginalHA06 239 WC Heated OriginalHA07 238 WC Heated OriginalHA08 239 PVC Heated 30/31 OriginalHA09 238 DC Heated 30/31 OriginalHA10 239 PVC Heated 30/31 OriginalHA11 238 DC Heated 30/31 OriginalHA12 239 WC Heated OriginalHA13 238 PE Heated OriginalHA14 239 DC Heated OriginalHA15 238 PE Heated OriginalHA16 239 PE Heated OriginalN01 — QC — OriginalA01 — QC — OriginalH01 — QC — Original
HA01 — QC — OriginalN01 239 PE Unheated RestartA01 239 PE Unheated RestartH01 239 PE Heated Restart
HA01 239 PE Heated Restart
a. CEM = CementDC = Dry CellulosePE = PolyethylenePVC = Polyvinyl ChlorideQC = Quality ControlWC = Wet Cellulose

A-6
Table A-2. Measured parameters and calculated G-values for original cylinders.
Code Cycle (atm) (ppm) (Celsius) 100 eV) FlagPressure Hydrogen Temperature (molecules/ Outlier
G-valueWatt @
yrA01 0 0.0A01 2 4935.0 25.00A01 3 5325.0 25.00A01 4 5165.0 25.00A01 5 5199.0A01 6 0.9061 4736.0 24.20A01 7 1.0361 4715.0 24.62A01 8 1.0272 4807.0 23.98A01 9 1.0687 4660.0 23.50A01 10 1.0776 4892.8 22.88A01 11 0.9293 4884.3 23.08A01 12 0.8776 4766.1 23.92A01 13 0.9204 4877.1 22.50A01 14 0.9204 4889.9 22.81A01 15 0.9136 4919.7 23.19A01 16 0.9177 4844.4 23.44A01 17 0.9190 4958.7 23.85A01 33 1.0014 4954.8 56.64A01 34 0.9694 4975.0 56.44A01 35 0.9755 4977.9 56.68A01 36 0.9673 5024.3 56.46A01 37 0.9714 4986.1 56.24A01 38 0.9755 5055.3 56.47A02 0 0.7672 0.0 25.00 0.0000A02 1 0.6536 32498.1 25.00 0.4761 0.0006A02 2 0.6685 46527.0 25.00 0.4234 0.0009A02 3 0.6535 62122.8 25.00 0.4645 0.0011A02 4 0.6612 76587.0 25.00 0.3881 0.0015A02 5 0.6660 85587.4 25.00 0.4150 0.0017A02 6 0.6531 93237.5 24.36 0.3199 0.0019A02 7 0.6687 96171.2 24.92 0.3222 0.0020A02 8 0.6660 104292.0 24.13 0.3873 0.0022A02 9 0.6646 118801.7 23.53 0.7149 0.0024A02 10 0.6639 122761.4 22.96 0.2674 0.0026A02 11 0.6660 135549.7 23.17 0.7167 0.0027A02 12 0.6694 144589.5 23.86 0.4605 0.0029A02 13 0.6639 149692.4 22.62 0.3683 0.0031A02 14 0.6660 157738.5 22.89 0.3579 0.0033A02 15 0.6673 163533.7 23.30 0.3499 0.0035A02 16 0.6667 169039.7 23.50 0.3795 0.0036

Table A-2. (continued).
Code Cycle (atm) (ppm) (Celsius) 100 eV) FlagPressure Hydrogen Temperature (molecules/ Outlier
G-valueWatt @
yr
A-7
A02 17 0.6694 178120.7 23.76 0.4667 0.0039A02 18 0.6667 183597.2 23.79 0.3263 0.0040A02 19 0.6680 191158.7 24.32 0.4449 0.0042A02 20 0.6476 195209.3 23.13 0.0458 0.0044A02 21 0.6660 194576.0 22.52 0.3144 0.0046A02 22 0.6728 201268.7 24.16 0.4787 0.0048A02 23 0.6667 203804.6 23.13 0.1691 0.0049A02 24 0.6714 213973.0 24.53 0.4845 0.0052A02 25 0.6612 218173.0 22.57 0.2824 0.0053A02 28 0.6653 222616.1 23.46 0.3399 0.0055A02 32 0.7354 27765.4 24.97 0.0058A02 33 0.7048 36706.7 24.95 0.3034 0.0061A02 34 0.7551 107060.3 25.48 0.2630 0.0087A02 35 0.7259 120873.8 25.69 0.0092A02 36 0.7279 128995.1 25.84 0.2428 0.0096A02 37 0.7340 135166.2 26.70 0.1927 0.0100A02 38 0.7286 142179.1 26.78 0.2735 0.0102A03 0 0.7631 0.0 25.00 0.0000A03 1 0.8542 10335.0 25.00 0.1563 0.0006A03 2 0.9785 12693.0 25.00 0.2340 0.0007A03 3 0.9204 18849.0 25.00 0.1474 0.0011A03 4 1.0204 25453.0 25.00 0.2119 0.0015A03 5 1.0136 29058.0 25.00 0.1456 0.0017A03 6 1.0061 30740.0 24.44 0.0844 0.0020A03 7 1.0184 32587.0 25.06 0.1340 0.0022A03 8 1.0238 35868.0 24.13 0.1663 0.0024A03 9 1.0170 38731.0 23.51 0.1413 0.0026A03 10 1.0204 41351.8 23.00 0.1617 0.0028A03 11 1.0306 43867.5 23.18 0.1685 0.0031A03 12 1.0469 46493.2 23.72 0.1599 0.0033A03 13 1.0442 48033.3 22.58 0.1340 0.0035A03 14 1.0660 51457.9 22.85 0.1810 0.0038A03 15 1.0735 52968.8 23.34 0.1163 0.0040A03 16 1.0844 54092.4 23.54 0.1302 0.0042A03 17 1.0993 56894.6 23.79 0.1764 0.0045A03 18 1.1102 58033.8 23.76 0.1293 0.0047A03 19 1.1224 60029.4 24.26 0.1633 0.0049A03 20 1.1238 61255.9 23.15 0.1176 0.0051A03 21 1.0095 62388.3 22.51 DA03 22 1.0299 64352.8 24.16 0.0056A03 23 1.0272 65716.4 23.05 0.1055 0.0058

Table A-2. (continued).
Code Cycle (atm) (ppm) (Celsius) 100 eV) FlagPressure Hydrogen Temperature (molecules/ Outlier
G-valueWatt @
yr
A-8
A03 24 1.0605 67267.9 24.68 0.1556 0.0061A03 25 1.0442 68590.6 22.55 0.1021 0.0063A03 26 1.0313 69811.3 22.10 0.0713 0.0065A03 27 0.7571 3156.1 22.00 0.0065A03 28 0.7565 4221.3 23.46 0.4330 0.0065A03 29 0.7844 8827.2 24.51 0.1651 0.0067A03 32 0.8048 13011.7 25.08 0.1694 0.0069A03 33 0.8354 18398.6 24.84 0.1703 0.0072A03 34 1.2857 52536.0 25.52 0.1573 0.0105A03 35 0.8388 56991.3 25.76 0.0112A03 36 0.8844 61526.3 25.92 0.1567 0.0117A03 37 0.9449 64722.0 26.79 0.1465 0.0121A03 38 0.9762 67484.1 26.76 0.1769 0.0125A04 0 0.7649 0.0 25.00 0.0000A04 1 0.6670 28903.7 25.00 0.2468 0.0005A04 2 0.7700 37691.1 25.00 0.2284 0.0008A04 3 0.7534 44605.7 25.00 0.1259 0.0011A04 4 0.7551 47509.2 25.00 0.0586 0.0014A04 5 0.7619 49015.8 25.00 0.0688 0.0016A04 6 0.7286 48495.1 24.44 -0.0463 0.0018A04 7 0.7639 47591.5 25.11 0.0695 0.0020A04 8 0.7639 47523.0 24.19 0.0252 0.0022A04 9 0.7537 49403.5 23.63 0.0616 0.0024A04 10 0.7619 49500.3 23.10 0.0494 0.0025A04 11 0.7571 49398.2 23.22 0.0148 0.0027A04 12 0.7612 48610.0 23.63 0.0082 0.0029A04 13 0.7571 48709.5 22.57 0.0335 0.0030A04 14 0.7558 47830.7 22.81 -0.0022 0.0033A04 15 0.7605 47030.5 23.39 0.0080 0.0035A04 16 0.7612 46691.2 23.52 0.0182 0.0036A04 17 0.7299 46522.4 23.83 -0.0309 0.0038A04 18 0.7537 45089.1 23.73 0.0265 0.0040A04 19 0.7605 44343.1 24.26 0.0114 0.0042A04 20 0.7585 42896.5 23.11 -0.0164 0.0044A04 21 0.7537 42242.0 22.48 -0.0010 0.0045A04 22 0.7660 41546.8 24.13 0.0157 0.0047A04 23 0.7653 41286.7 22.98 0.0180 0.0049A04 24 0.7680 40897.6 24.67 0.0066 0.0051A04 25 0.7578 40311.1 22.52 -0.0028 0.0053A04 28 0.7667 39707.2 23.46 0.0132 0.0054A04 32 0.7667 39254.5 25.05 0.0011 0.0058
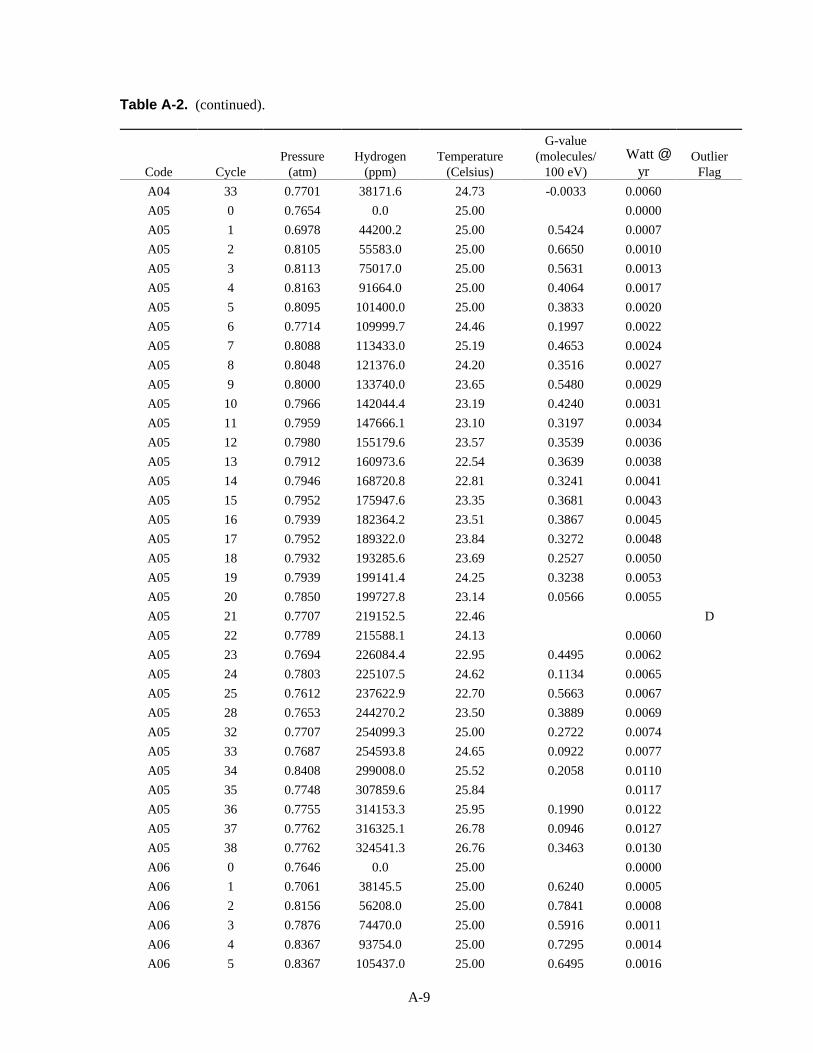
Table A-2. (continued).
Code Cycle (atm) (ppm) (Celsius) 100 eV) FlagPressure Hydrogen Temperature (molecules/ Outlier
G-valueWatt @
yr
A-9
A04 33 0.7701 38171.6 24.73 -0.0033 0.0060A05 0 0.7654 0.0 25.00 0.0000A05 1 0.6978 44200.2 25.00 0.5424 0.0007A05 2 0.8105 55583.0 25.00 0.6650 0.0010A05 3 0.8113 75017.0 25.00 0.5631 0.0013A05 4 0.8163 91664.0 25.00 0.4064 0.0017A05 5 0.8095 101400.0 25.00 0.3833 0.0020A05 6 0.7714 109999.7 24.46 0.1997 0.0022A05 7 0.8088 113433.0 25.19 0.4653 0.0024A05 8 0.8048 121376.0 24.20 0.3516 0.0027A05 9 0.8000 133740.0 23.65 0.5480 0.0029A05 10 0.7966 142044.4 23.19 0.4240 0.0031A05 11 0.7959 147666.1 23.10 0.3197 0.0034A05 12 0.7980 155179.6 23.57 0.3539 0.0036A05 13 0.7912 160973.6 22.54 0.3639 0.0038A05 14 0.7946 168720.8 22.81 0.3241 0.0041A05 15 0.7952 175947.6 23.35 0.3681 0.0043A05 16 0.7939 182364.2 23.51 0.3867 0.0045A05 17 0.7952 189322.0 23.84 0.3272 0.0048A05 18 0.7932 193285.6 23.69 0.2527 0.0050A05 19 0.7939 199141.4 24.25 0.3238 0.0053A05 20 0.7850 199727.8 23.14 0.0566 0.0055A05 21 0.7707 219152.5 22.46 DA05 22 0.7789 215588.1 24.13 0.0060A05 23 0.7694 226084.4 22.95 0.4495 0.0062A05 24 0.7803 225107.5 24.62 0.1134 0.0065A05 25 0.7612 237622.9 22.70 0.5663 0.0067A05 28 0.7653 244270.2 23.50 0.3889 0.0069A05 32 0.7707 254099.3 25.00 0.2722 0.0074A05 33 0.7687 254593.8 24.65 0.0922 0.0077A05 34 0.8408 299008.0 25.52 0.2058 0.0110A05 35 0.7748 307859.6 25.84 0.0117A05 36 0.7755 314153.3 25.95 0.1990 0.0122A05 37 0.7762 316325.1 26.78 0.0946 0.0127A05 38 0.7762 324541.3 26.76 0.3463 0.0130A06 0 0.7646 0.0 25.00 0.0000A06 1 0.7061 38145.5 25.00 0.6240 0.0005A06 2 0.8156 56208.0 25.00 0.7841 0.0008A06 3 0.7876 74470.0 25.00 0.5916 0.0011A06 4 0.8367 93754.0 25.00 0.7295 0.0014A06 5 0.8367 105437.0 25.00 0.6495 0.0016

Table A-2. (continued).
Code Cycle (atm) (ppm) (Celsius) 100 eV) FlagPressure Hydrogen Temperature (molecules/ Outlier
G-valueWatt @
yr
A-10
A06 6 0.8163 111596.0 24.25 0.2734 0.0018A06 7 0.8313 119499.0 25.21 0.7038 0.0020A06 8 0.8293 127622.0 24.24 0.4940 0.0022A06 9 0.8265 142756.0 23.66 0.9026 0.0024A06 10 0.8245 152170.2 23.39 0.6455 0.0025A06 11 0.8252 160286.3 23.12 0.6023 0.0027A06 12 0.8286 168996.5 23.57 0.5542 0.0029A06 13 0.8238 175908.5 22.51 0.6101 0.0030A06 14 0.8156 187298.8 22.78 0.4838 0.0033A06 15 0.8306 187781.2 23.32 0.3114 0.0035A06 16 0.8313 201634.4 23.50 1.0406 0.0036A06 17 0.8333 209045.8 23.83 0.4818 0.0038A06 18 0.8347 216243.2 23.68 0.5987 0.0040A06 19 0.8367 222023.2 24.22 0.4680 0.0042A06 20 0.8306 228340.6 23.15 0.4520 0.0043A06 21 0.8095 232051.1 22.48 DA06 22 0.8190 238467.8 24.09 0.0047A06 23 0.8109 247618.2 22.94 0.5683 0.0049A06 24 0.8245 253287.6 24.64 0.4963 0.0051A06 28 0.8129 264150.7 23.49 0.3394 0.0054A06 29 0.8177 267648.7 24.53 0.3911 0.0056A06 32 0.8204 272447.9 24.98 0.4894 0.0058A06 33 0.8197 279772.9 24.63 0.4454 0.0060A06 35 0.7925 347569.5 25.94 0.0092A06 36 0.7946 357253.9 26.06 0.3804 0.0096A06 37 0.8088 357971.1 26.80 0.2508 0.0100A06 38 0.8088 363106.7 26.84 0.3588 0.0102A07 0 0.7660 0.0 25.00 0.0000A07 1 0.6910 61524.4 25.00 0.8381 0.0006A07 2 0.7919 83006.0 25.00 0.8535 0.0010A07 3 0.6890 103740.9 25.00 0.2310 0.0013A08 0 0.7607 0.0 25.00 0.0000A08 1 0.7276 10394.5 25.00 0.2088 0.0004A08 2 0.8160 14450.0 25.00 0.3897 0.0005A08 3 0.8126 24057.0 25.00 0.3278 0.0008A08 4 0.8163 35117.0 25.00 0.3117 0.0011A08 5 0.8095 40397.0 25.00 0.2500 0.0013A08 6 0.7973 44338.0 24.42 0.1948 0.0015A08 7 0.7973 48517.0 25.24 0.2677 0.0016A08 8 0.7891 55513.0 24.28 0.3354 0.0018A08 9 0.7810 63178.0 23.61 0.3841 0.0020

Table A-2. (continued).
Code Cycle (atm) (ppm) (Celsius) 100 eV) FlagPressure Hydrogen Temperature (molecules/ Outlier
G-valueWatt @
yr
A-11
A08 10 0.7741 71576.0 23.40 0.4552 0.0022A08 11 0.7476 76947.8 23.09 0.1928 0.0023A08 12 0.7646 82921.8 23.50 0.3755 0.0025A08 13 0.7565 87027.9 22.54 0.2805 0.0027A08 14 0.7578 91051.3 22.81 0.1902 0.0029A08 15 0.7592 99428.4 23.26 0.4526 0.0031A08 16 0.7571 103575.5 23.51 0.2795 0.0032A08 17 0.7599 108895.3 23.76 0.2761 0.0034A08 18 0.7565 112644.6 23.64 0.2469 0.0036A08 19 0.7571 118371.6 24.17 0.3337 0.0037A08 20 0.7483 119062.2 23.19 0.0569 0.0039A08 21 0.7340 126047.5 22.50 DA08 22 0.7435 130572.9 24.41 0.0043A08 23 0.7374 132417.2 22.95 0.1429 0.0045A08 24 0.7483 138478.5 24.68 0.3358 0.0047A08 25 0.7354 141582.7 22.65 0.2038 0.0048A08 28 0.7422 146077.9 23.53 0.3260 0.0050A08 32 0.7483 153531.7 24.99 0.2373 0.0053A08 33 0.7578 156714.0 24.57 0.2654 0.0055A08 35 0.7925 195816.5 25.76 0.0086A08 36 0.8027 202840.0 26.14 0.2927 0.0090A08 37 0.8095 197910.9 26.80 -0.0262 0.0093A08 38 0.8095 210088.2 26.80 0.5398 0.0096A09 0 0.7659 0.0 25.00 0.0000A09 1 0.7093 78007.8 25.00 0.6424 0.0006A09 2 0.8352 101339.0 25.00 0.6063 0.0010A09 3 0.8521 132525.0 25.00 0.6263 0.0013A09 4 0.8776 160097.0 25.00 0.4998 0.0018A09 5 0.8776 170416.0 25.00 0.3365 0.0020A09 6 0.8830 183198.0 24.43 0.4835 0.0022A09 7 0.8939 187754.0 25.18 0.3202 0.0024A09 8 0.9082 201878.0 24.32 0.5666 0.0027A09 9 0.9129 214142.0 23.58 0.5045 0.0029A09 10 0.9177 221209.4 23.36 0.3874 0.0031A09 11 0.9265 229466.6 23.19 0.4595 0.0033A09 12 0.9401 239805.1 23.42 0.4857 0.0036A09 13 0.9415 245144.7 22.53 0.4236 0.0038A09 14 0.9633 251751.0 22.80 0.3870 0.0041A09 15 0.9714 254492.3 23.24 0.2819 0.0043A09 16 0.9789 257927.7 23.51 0.3581 0.0045A09 17 0.9891 268319.8 23.77 0.4641 0.0048

Table A-2. (continued).
Code Cycle (atm) (ppm) (Celsius) 100 eV) FlagPressure Hydrogen Temperature (molecules/ Outlier
G-valueWatt @
yr
A-12
A09 18 0.9966 275244.9 23.68 0.4925 0.0050A09 19 0.9884 276941.7 24.04 0.1307 0.0052A09 20 1.0014 285226.9 23.24 0.5891 0.0054A09 21 0.9354 287023.1 22.51 DA09 23 0.9361 293007.9 23.02 -0.0608 0.0061A09 27 0.7612 39466.7 22.50 0.0068A09 28 0.7558 42177.9 23.56 1.0789 0.0068A09 32 0.7320 72304.1 25.05 0.3526 0.0073A09 33 0.7435 88406.5 24.59 0.3402 0.0076A09 35 0.8088 209760.9 25.70 0.0115A09 36 0.8422 222848.9 26.26 0.3290 0.0120A09 37 0.8741 231837.1 26.86 0.2624 0.0125A09 38 0.8830 241904.2 26.82 0.3395 0.0128A10 0 0.7607 0.0 25.00 0.0000A10 1 0.7147 12277.9 25.00 0.2376 0.0004A10 2 0.7985 15627.0 25.00 0.3358 0.0005A10 3 0.7942 26176.0 25.00 0.3441 0.0008A10 4 0.7959 36709.0 25.00 0.2831 0.0011A10 5 0.7823 42708.0 25.00 0.2542 0.0013A10 6 0.7762 47278.0 24.40 0.2311 0.0015A10 7 0.7762 52416.0 25.17 0.3105 0.0016A10 8 0.7354 59935.9 24.13 0.2219 0.0018A10 9 0.7551 68777.1 23.56 0.5434 0.0020A10 10 0.7517 74816.5 23.36 0.3310 0.0022A10 11 0.7456 80084.4 23.16 0.2770 0.0023A10 12 0.7435 86192.3 23.41 0.2869 0.0025A10 13 0.7306 90431.4 22.54 0.2380 0.0027A10 14 0.7361 95402.8 22.76 0.2337 0.0029A10 15 0.7374 99609.1 23.23 0.2451 0.0031A10 16 0.7367 106672.8 23.52 0.4289 0.0032A10 17 0.7381 111665.8 23.75 0.2453 0.0034A10 18 0.7347 115493.4 23.67 0.2381 0.0036A10 19 0.7313 120449.9 24.01 0.2497 0.0038A10 20 0.7265 123520.4 23.26 0.1918 0.0040A10 21 0.7306 128737.5 22.53 0.3270 0.0041A10 22 0.7415 133463.3 24.33 0.3562 0.0043A10 23 0.7354 135748.4 23.05 0.1565 0.0045A10 24 0.7456 141572.0 24.64 0.3198 0.0047A10 25 0.7327 143812.6 22.66 0.1463 0.0048A10 28 0.7415 146954.9 23.59 0.2768 0.0050A10 32 0.7347 153755.4 25.11 0.1531 0.0054

Table A-2. (continued).
Code Cycle (atm) (ppm) (Celsius) 100 eV) FlagPressure Hydrogen Temperature (molecules/ Outlier
G-valueWatt @
yr
A-13
A10 33 0.7469 156545.4 24.60 0.2645 0.0056A10 34 0.8721 193034.0 25.62 0.2219 0.0082A10 35 0.7884 196815.1 25.62 0.0087A10 36 0.7925 203204.8 26.31 0.2278 0.0090A11 0 0.7661 0.0 25.00 0.0000A11 1 0.7115 71539.0 25.00 0.5897 0.0006A11 2 0.8315 97611.0 25.00 0.6313 0.0010A11 3 0.8468 128277.0 25.00 0.6103 0.0013A11 4 0.8776 154484.0 25.00 0.4890 0.0017A11 5 0.8707 165790.0 25.00 0.3296 0.0020A11 6 0.8796 176208.0 24.41 0.4335 0.0022A11 7 0.8898 180258.0 25.14 0.2953 0.0024A11 8 0.9048 192173.0 24.15 0.4852 0.0026A11 9 0.9088 205550.0 23.45 0.5524 0.0029A11 10 0.9136 213124.2 23.27 0.3981 0.0031A11 11 0.9224 221508.1 23.11 0.4578 0.0033A11 12 0.9374 230118.6 23.41 0.4415 0.0035A11 13 0.9415 235649.4 22.68 0.4473 0.0037A11 14 0.9605 242927.6 22.79 0.3837 0.0040A11 15 0.9701 250218.5 23.22 0.4285 0.0042A11 16 0.9748 255618.3 23.42 0.3893 0.0044A11 17 0.9850 262031.5 23.75 0.3698 0.0047A11 18 0.9932 268580.0 23.65 0.4829 0.0049A11 19 0.9966 273002.8 24.05 0.3098 0.0051A11 20 1.0034 277650.7 23.26 0.4144 0.0053A11 21 0.9429 281317.8 22.52 DA11 22 0.9524 284220.6 24.31 0.0058A11 23 0.9429 287292.8 23.04 0.2086 0.0060A11 24 0.9660 294915.7 24.60 0.4567 0.0063A11 25 0.9476 297498.3 22.63 0.1792 0.0064A11 26 0.9293 298007.0 22.50 0.0176 0.0067A11 27 0.7612 25122.5 22.60 0.0067A11 28 0.7565 26868.4 23.57 1.0768 0.0067A11 32 0.7293 55331.0 25.14 0.3343 0.0071A11 33 0.7395 72490.0 24.62 0.3464 0.0074A11 34 1.0109 180361.0 25.65 0.2835 0.0106A11 35 0.8088 196546.8 25.62 0.0113A11 36 0.8422 209341.7 26.28 0.3166 0.0118A11 37 0.8667 221352.8 26.63 0.2652 0.0123A11 38 0.8769 225319.6 26.62 0.2192 0.0126A12 0 0.7633 0.0 25.00 0.0000

Table A-2. (continued).
Code Cycle (atm) (ppm) (Celsius) 100 eV) FlagPressure Hydrogen Temperature (molecules/ Outlier
G-valueWatt @
yr
A-14
A12 1 0.6862 37817.5 25.00 0.6030 0.0005A12 2 0.7868 54641.0 25.00 0.7035 0.0008A12 3 0.7692 78432.6 25.00 0.7902 0.0011A12 4 0.7687 100150.7 25.00 0.6149 0.0014A12 5 0.7619 111974.7 25.00 0.5453 0.0016A12 6 0.7605 119045.6 24.38 0.4387 0.0018A12 7 0.7653 127072.0 25.14 0.5834 0.0020A12 8 0.7639 133551.1 24.16 0.3705 0.0022A12 9 0.7626 149074.1 23.39 0.9124 0.0024A12 10 0.7660 155585.0 23.26 0.4934 0.0025A12 11 0.7646 165260.5 23.06 0.6177 0.0027A12 12 0.7626 168939.2 23.41 0.2305 0.0029A12 13 0.7639 176431.2 22.75 0.6699 0.0030A12 14 0.7694 170348.6 22.77 -0.1146 0.0033A12 15 0.7449 187650.2 23.21 0.6676 0.0035A12 16 0.7531 193847.0 23.47 0.5737 0.0036A12 17 0.7721 190277.1 23.73 0.1421 0.0038A12 18 0.7701 195942.9 23.68 0.4201 0.0040A12 19 0.7687 212322.1 24.05 0.8969 0.0042A12 20 0.7687 205013.3 23.30 -0.2370 0.0044A12 21 0.7612 224374.8 22.57 0.9678 0.0045A12 22 0.7667 222654.0 24.30 0.0587 0.0047A12 23 0.7626 227626.8 23.13 0.3691 0.0049A12 24 0.7551 230849.8 24.04 0.1137 0.0051A12 25 0.7592 236598.3 22.65 0.7307 0.0053A12 28 0.7578 243192.2 23.57 0.4034 0.0055A12 29 0.7612 242892.0 24.49 0.1406 0.0056A12 32 0.7578 250000.5 25.16 0.4492 0.0058A12 33 0.7633 254747.0 24.66 0.3838 0.0060A12 35 0.7925 308358.0 25.24 0.0092A13 0 0.7675 0.0 25.00 0.0000A13 1 0.6697 64307.4 25.00 0.9063 0.0006A13 2 0.7814 89145.0 25.00 0.9260 0.0010A13 3 0.7995 114793.0 25.00 0.8542 0.0013A13 4 0.8163 135110.0 25.00 0.5701 0.0017A13 5 0.8095 146504.0 25.00 0.4918 0.0020A13 6 0.8122 153884.0 24.36 0.4610 0.0022A13 7 0.8170 160468.0 25.11 0.4684 0.0024A13 8 0.8163 171834.0 24.13 0.5554 0.0026A13 9 0.8075 188015.0 23.36 0.7893 0.0028A13 10 0.8054 196977.1 23.20 0.5211 0.0030

Table A-2. (continued).
Code Cycle (atm) (ppm) (Celsius) 100 eV) FlagPressure Hydrogen Temperature (molecules/ Outlier
G-valueWatt @
yr
A-15
A13 11 0.8020 206240.0 23.05 0.5165 0.0033A13 12 0.8034 211620.0 23.34 0.3236 0.0035A13 13 0.7959 219889.2 22.71 0.5278 0.0037A13 14 0.7973 223623.1 22.75 0.2237 0.0040A13 15 0.7952 234073.9 23.21 0.5344 0.0042A13 16 0.7918 240449.2 23.45 0.3860 0.0044A13 17 0.7918 246835.1 23.76 0.3379 0.0046A13 18 0.7878 252562.8 23.65 0.3559 0.0048A13 19 0.7837 258487.9 24.04 0.3002 0.0051A13 20 0.7796 259325.5 23.30 0.1346 0.0053A13 21 0.7599 279891.8 22.55 DA13 22 0.7639 283416.9 24.28 0.0057A13 23 0.7571 284916.0 23.20 0.1318 0.0060A13 24 0.7585 290506.1 24.04 0.2829 0.0062A13 25 0.7510 296329.0 22.69 0.4241 0.0064A13 28 0.7565 300795.9 23.61 0.3711 0.0066A13 32 0.7531 306541.5 25.19 0.1331 0.0071A13 33 0.7599 308726.6 24.71 0.2872 0.0073A13 34 0.7993 333960.0 25.56 0.1329 0.0106A13 35 0.7687 360222.3 25.24 0.0113A13 36 0.7721 344838.6 26.40 -0.2701 0.0117A13 37 0.7633 367960.3 26.53 0.4369 0.0122A13 38 0.7592 368318.0 26.53 0.0734 0.0125A14 0 0.7647 0.0 25.00 0.0000A14 1 0.6911 47909.3 25.00 0.4314 0.0005A14 2 0.7998 69174.0 25.00 0.5332 0.0008A14 3 0.8021 88158.0 25.00 0.4208 0.0011A14 4 0.8095 107376.0 25.00 0.3514 0.0015A14 5 0.8095 117544.0 25.00 0.3518 0.0017A14 6 0.8034 121639.0 24.32 0.1846 0.0018A14 7 0.8041 128305.0 25.06 0.3188 0.0020A14 8 0.8034 137122.0 24.28 0.3199 0.0022A14 9 0.8020 150684.0 23.32 0.5307 0.0024A14 10 0.7986 159339.2 23.19 0.3675 0.0025A14 11 0.8000 166699.9 23.09 0.3566 0.0027A14 12 0.8048 174280.6 23.44 0.3320 0.0029A14 13 0.8014 178056.6 22.77 0.2751 0.0030A14 14 0.8048 186301.6 22.74 0.2987 0.0033A14 15 0.8068 189493.0 23.19 0.2175 0.0035A14 16 0.8075 197875.5 23.42 0.4223 0.0036A14 17 0.8082 200696.0 23.77 0.1786 0.0038

Table A-2. (continued).
Code Cycle (atm) (ppm) (Celsius) 100 eV) FlagPressure Hydrogen Temperature (molecules/ Outlier
G-valueWatt @
yr
A-16
A14 18 0.8095 209155.0 23.64 0.4436 0.0040A14 19 0.8102 212984.6 24.04 0.2359 0.0042A14 20 0.8122 213889.7 23.40 0.1980 0.0044A14 21 0.7864 219908.5 22.86 DA14 22 0.7925 220673.3 24.19 0.0047A14 23 0.7946 223902.9 23.21 0.2722 0.0049A14 24 0.7986 224974.5 24.00 0.1453 0.0051A14 25 0.7959 233586.6 22.71 0.5481 0.0053A14 26 0.7871 235946.5 22.60 0.1385 0.0055A14 27 0.7619 11599.6 23.20 0.0055A14 28 0.7551 12112.5 23.54 0.7677 0.0055A14 32 0.7422 29876.7 25.19 0.2630 0.0058A14 33 0.7517 39949.2 24.69 0.2486 0.0060A14 34 0.8782 120216.0 25.54 0.2022 0.0087A14 35 0.7891 129904.9 25.50 0.0092A14 36 0.8088 141075.8 26.42 0.2585 0.0096A14 37 0.8184 149418.6 26.44 0.1789 0.0100A14 38 0.8252 154304.1 26.47 0.2098 0.0102A15 0 0.7675 0.0 25.00 0.0000A15 1 0.6642 88582.5 25.00 1.1731 0.0006A15 2 0.7968 113883.0 25.00 1.1992 0.0010A15 3 0.7377 146526.4 25.00 0.6796 0.0013A15 4 0.8435 172189.0 25.00 1.1106 0.0017A15 5 0.8367 179546.0 25.00 0.3377 0.0020A15 6 0.8327 196638.0 24.29 0.8957 0.0022A15 7 0.8367 201774.0 25.01 0.4224 0.0024A15 8 0.8415 212063.0 24.39 0.5909 0.0026A15 9 0.8340 232835.0 23.28 1.0720 0.0029A15 10 0.8259 243053.2 22.89 0.5175 0.0031A15 11 0.8265 253620.3 23.04 0.6873 0.0033A15 12 0.8299 265303.9 23.35 0.6515 0.0035A15 13 0.8259 271596.3 22.69 0.5099 0.0037A15 14 0.8293 276560.3 22.72 0.3223 0.0040A15 15 0.8231 283159.8 23.16 0.3293 0.0042A15 16 0.8211 296391.6 23.44 0.7915 0.0044A15 17 0.8211 304051.4 23.78 0.4201 0.0047A15 18 0.8170 311764.5 23.63 0.4914 0.0049A15 19 0.8122 315888.6 24.04 0.2323 0.0051A15 20 0.8088 322704.1 23.37 0.4574 0.0053A15 21 0.7905 326042.4 22.99 DA15 22 0.7884 327580.6 23.88 0.0058

Table A-2. (continued).
Code Cycle (atm) (ppm) (Celsius) 100 eV) FlagPressure Hydrogen Temperature (molecules/ Outlier
G-valueWatt @
yr
A-17
A15 23 0.7830 334390.7 23.31 0.3870 0.0060A15 24 0.7844 339151.2 24.00 0.2847 0.0063A15 25 0.7748 344536.8 22.75 0.3744 0.0065A15 28 0.7748 349861.4 23.52 0.3483 0.0067A15 32 0.7721 374444.1 25.15 0.5659 0.0071A15 33 0.7707 377146.9 24.72 0.2213 0.0074A15 34 0.8170 409791.0 25.54 0.1793 0.0106A15 35 0.7741 409638.9 25.45 0.0113A15 36 0.7755 419738.8 26.46 0.3040 0.0118A15 37 0.7728 421410.5 26.53 0.0898 0.0123A15 38 0.7660 444196.3 26.79 0.7333 0.0126A16 0 0.7665 0.0 25.00 0.0000A16 1 0.6820 31077.3 25.00 0.4137 0.0006A16 33 0.6374 183237.4 24.73 0.2175 0.0062H01 0 0.0H01 2 5029.0 25.00H01 3 5145.0H01 4 5075.0 25.00H01 5 4968.0 57.00H01 6 0.9810 4791.0 57.00H01 7 1.0483 4715.0 57.00H01 8 1.0395 4591.0 57.00H01 9 1.0864 4635.0 57.00H01 10 1.0932 4686.6 57.47H01 11 0.9415 4921.6 57.44H01 12 0.9347 4779.2 57.54H01 13 0.9333 4797.6 57.54H01 14 0.9327 4805.1 57.48H01 15 0.9354 4842.8 57.55H01 16 0.9361 4842.7 57.54H01 17 0.9408 4821.3 57.53H01 18 0.9354 4899.6 57.52H01 19 0.9517 4914.0 57.30H01 20 0.9361 4813.9 54.87H01 21 0.9769 4819.5 54.92H01 22 0.9701 4915.1 54.90H01 23 0.9694 4790.3 54.75H01 24 0.9748 4666.7 54.68H01 25 0.9673 4943.6 54.57H01 28 0.9585 4927.3 54.56H01 29 0.9735 4925.4 54.65

Table A-2. (continued).
Code Cycle (atm) (ppm) (Celsius) 100 eV) FlagPressure Hydrogen Temperature (molecules/ Outlier
G-valueWatt @
yr
A-18
H01 32 0.9728 4928.5 54.28H01 33 0.9980 5005.7 54.90H01 34 0.9707 4807.0 25.59H01 35 0.9599 4988.5 25.74H01 36 0.9755 4943.7 25.84H01 37 0.9701 4960.6 26.80H01 38 0.9762 4791.8 26.76H02 0 0.7654 0.0 25.00 0.0000H02 1 0.6445 34143.0 25.00 0.5024 0.0005H02 2 0.7381 42119.4 25.00 0.5927 0.0007H02 3 0.7285 56361.3 25.00 0.4726 0.0010H02 4 0.7483 69255.4 25.00 0.4006 0.0014H02 5 0.8707 74308.0 57.00 0.4636 0.0016H02 6 0.8517 78468.0 57.00 0.1910 0.0017H02 7 0.8327 84527.0 57.00 0.3103 0.0019H02 8 0.8259 89875.0 57.00 0.2577 0.0021H02 9 0.8150 97155.0 57.00 0.4088 0.0023H02 10 0.8054 99543.5 57.48 0.1230 0.0025H02 11 0.7966 109209.3 57.44 0.5300 0.0026H02 12 0.7891 113053.5 57.52 0.1952 0.0028H02 13 0.7803 117894.3 57.59 0.3157 0.0030H02 14 0.7728 120688.6 57.52 0.1192 0.0032H02 15 0.7612 132106.5 57.57 0.5138 0.0034H02 16 0.7578 132920.1 57.56 0.1054 0.0035H02 17 0.7524 140643.2 57.51 0.3449 0.0038H02 18 0.7456 143698.2 57.54 0.1819 0.0039H02 19 0.7401 148562.8 57.34 0.2612 0.0041H02 20 0.7367 141243.0 54.90 -0.2408 0.0043H02 21 0.7333 152210.8 54.76 0.5216 0.0045H02 22 0.7306 147702.6 55.11 -0.1584 0.0046H02 23 0.7265 154091.9 54.69 0.3511 0.0048H02 24 0.7245 158618.8 54.69 0.2185 0.0051H02 25 0.7197 160355.1 54.50 0.1725 0.0052H02 28 0.7177 160556.4 54.67 0.0747 0.0054H02 32 0.7122 164496.9 54.27 0.1172 0.0057H02 33 0.7190 164041.6 54.90 0.0970 0.0060H02 34 0.7565 172299.1 57.58 0.0559 0.0086H02 35 0.7122 168128.1 57.26 0.0091H02 36 0.7122 167803.4 57.20 0.0419 0.0095H02 37 0.7109 166562.6 57.15 0.0121 0.0099H02 38 0.7095 166685.4 57.24 0.0617 0.0101

Table A-2. (continued).
Code Cycle (atm) (ppm) (Celsius) 100 eV) FlagPressure Hydrogen Temperature (molecules/ Outlier
G-valueWatt @
yr
A-19
H03 0 0.7633 0.0 25.00 0.0000H03 1 1.1524 16068.0 25.00 0.3240 0.0006H03 2 1.3462 20151.0 25.00 0.5356 0.0007H03 3 1.3583 29230.0 25.00 0.3695 0.0011H03 4 1.3605 40989.0 25.00 0.3686 0.0015H03 5 1.7687 40312.0 57.00 0.3793 0.0018H03 6 1.9551 40136.0 57.00 0.3350 0.0020H03 7 1.9850 43198.0 57.00 0.3756 0.0022H03 8 1.9959 46527.0 57.00 0.2883 0.0024H03 9 1.9701 47904.0 57.00 0.1314 0.0026H03 10 1.9204 50801.0 57.46 0.1854 0.0029H03 11 1.7231 52800.8 57.44 -0.2070 0.0031H03 12 1.7048 56527.1 57.51 0.2514 0.0033H03 13 1.7129 60272.3 57.56 0.4251 0.0035H03 14 1.6463 63140.2 57.50 0.0728 0.0038H03 15 1.7163 68214.1 57.57 0.5594 0.0040H03 16 1.7068 70368.7 57.56 0.2212 0.0042H03 17 1.6878 75346.3 57.53 0.3041 0.0045H03 18 1.6769 78355.1 57.52 0.2677 0.0047H03 19 1.6476 81417.4 57.29 0.1915 0.0049H03 20 1.6313 84196.5 54.85 0.2608 0.0051H03 21 1.4340 87802.3 54.75 DH03 22 1.4279 90244.8 54.91 0.0056H03 23 1.4075 91848.9 54.78 0.0983 0.0058H03 24 1.2327 96146.2 54.60 -0.2728 0.0061H03 25 1.4197 99881.5 54.76 1.3239 0.0063H04 0 0.7641 0.0 25.00 0.0000H04 1 0.6826 48119.3 25.00 0.4264 0.0005H04 2 0.7892 59593.0 25.00 0.5252 0.0007H04 3 0.7889 77738.0 25.00 0.3877 0.0010H04 4 0.7619 98413.2 25.00 0.2944 0.0014H04 5 0.8571 104628.0 57.00 0.2745 0.0016H04 6 0.8592 114623.0 57.00 0.3897 0.0017H04 7 0.8585 119653.0 57.00 0.2549 0.0019H04 8 0.8537 127648.0 57.00 0.2604 0.0021H04 9 0.8469 137763.0 57.00 0.3929 0.0023H04 10 0.8361 146891.7 57.49 0.3105 0.0024H04 11 0.8286 153529.7 57.45 0.2724 0.0026H04 12 0.8898 158901.5 57.53 0.5523 0.0028H04 13 0.9088 163547.2 57.56 0.4789 0.0029H04 14 0.9170 168813.6 57.52 0.2566 0.0032

Table A-2. (continued).
Code Cycle (atm) (ppm) (Celsius) 100 eV) FlagPressure Hydrogen Temperature (molecules/ Outlier
G-valueWatt @
yr
A-20
H04 15 0.9177 173821.4 57.58 0.2790 0.0034H04 16 0.9184 177275.8 57.56 0.2786 0.0035H04 17 0.9204 183524.2 57.50 0.2972 0.0037H04 18 0.9218 188726.0 57.54 0.3375 0.0039H04 19 0.9190 190463.5 57.29 0.1790 0.0041H04 20 0.9231 194594.7 54.78 0.3619 0.0043H04 21 0.8850 199929.3 54.76 DH04 22 0.8830 201871.9 54.80 0.0046H04 23 0.8776 206574.0 54.66 0.2443 0.0048H04 24 0.8823 205562.6 54.69 0.1213 0.0050H04 25 0.8748 212939.6 54.72 0.4271 0.0052H04 28 0.8728 213216.1 54.62 0.1365 0.0054H04 29 0.8735 219034.3 54.61 0.3398 0.0055H04 30 0.8599 217804.0 54.23 0.0056H04 32 0.7224 59662.4 54.23 0.0057H04 33 0.6592 74406.3 54.99 0.1304 0.0060H04 34 0.8673 138847.0 57.56 0.1791 0.0086H04 35 0.7558 154758.6 57.24 0.0091H04 36 0.7701 154991.9 57.21 0.0896 0.0095H04 37 0.7259 169502.9 57.18 0.1001 0.0099H04 38 0.7762 166105.8 57.20 0.2229 0.0101H05 0 0.7674 0.0 25.00 0.0000H05 1 0.6821 75112.3 25.00 0.9944 0.0006H05 2 0.7871 93921.0 25.00 0.8321 0.0010H05 3 0.7995 124793.0 25.00 0.9634 0.0013H05 4 0.7959 150110.0 25.00 0.5828 0.0018H05 5 0.9048 167685.0 57.00 0.9664 0.0020H05 6 0.9068 176627.0 57.00 0.5295 0.0023H05 7 0.9116 182254.0 57.00 0.4458 0.0025H05 8 0.9095 189596.0 57.00 0.3616 0.0027H05 9 0.9027 203508.0 57.00 0.7359 0.0029H05 10 0.8952 215382.0 57.50 0.5688 0.0032H05 11 0.8912 225912.1 57.45 0.5868 0.0034H05 12 0.8891 224955.2 57.50 0.0582 0.0036H05 13 0.8816 238826.1 57.57 0.8451 0.0038H05 14 0.8796 247595.0 57.49 0.3776 0.0041H05 15 0.8728 255709.6 57.57 0.3901 0.0043H05 16 0.8667 258067.7 57.57 0.1900 0.0045H05 17 0.8612 257527.5 57.52 0.0452 0.0048H05 18 0.8558 271372.9 57.56 0.7105 0.0050H05 19 0.8476 276400.3 57.35 0.2510 0.0053
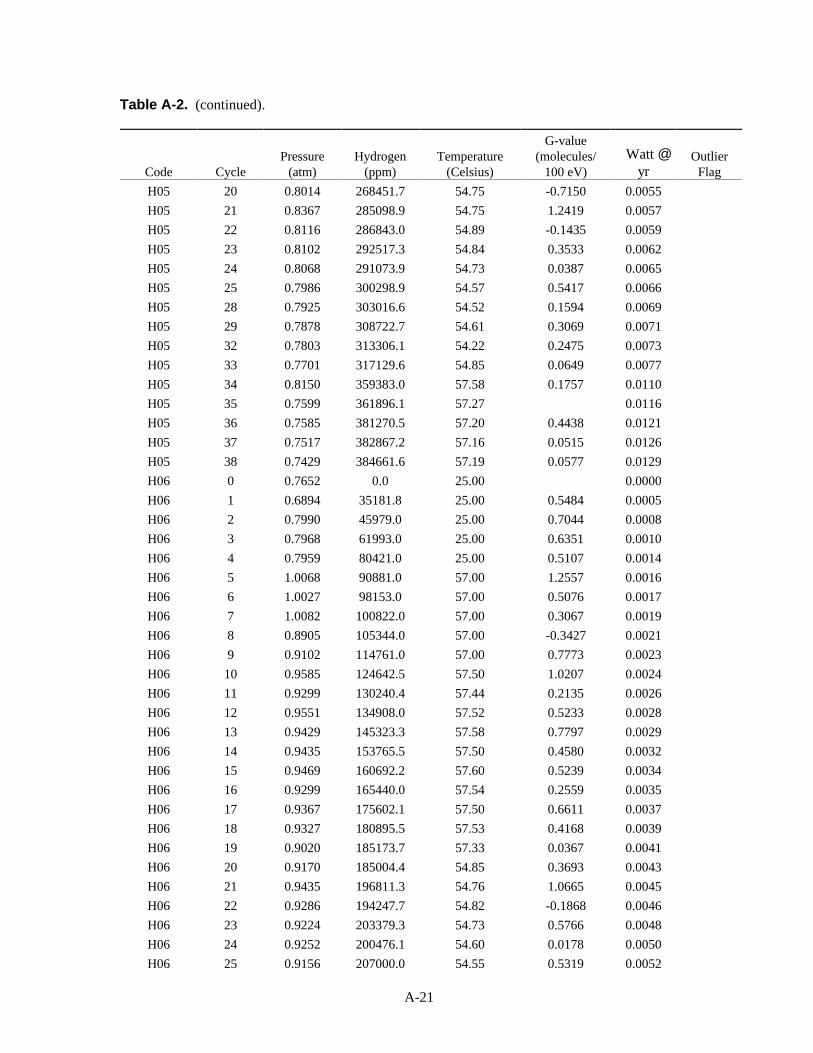
Table A-2. (continued).
Code Cycle (atm) (ppm) (Celsius) 100 eV) FlagPressure Hydrogen Temperature (molecules/ Outlier
G-valueWatt @
yr
A-21
H05 20 0.8014 268451.7 54.75 -0.7150 0.0055H05 21 0.8367 285098.9 54.75 1.2419 0.0057H05 22 0.8116 286843.0 54.89 -0.1435 0.0059H05 23 0.8102 292517.3 54.84 0.3533 0.0062H05 24 0.8068 291073.9 54.73 0.0387 0.0065H05 25 0.7986 300298.9 54.57 0.5417 0.0066H05 28 0.7925 303016.6 54.52 0.1594 0.0069H05 29 0.7878 308722.7 54.61 0.3069 0.0071H05 32 0.7803 313306.1 54.22 0.2475 0.0073H05 33 0.7701 317129.6 54.85 0.0649 0.0077H05 34 0.8150 359383.0 57.58 0.1757 0.0110H05 35 0.7599 361896.1 57.27 0.0116H05 36 0.7585 381270.5 57.20 0.4438 0.0121H05 37 0.7517 382867.2 57.16 0.0515 0.0126H05 38 0.7429 384661.6 57.19 0.0577 0.0129H06 0 0.7652 0.0 25.00 0.0000H06 1 0.6894 35181.8 25.00 0.5484 0.0005H06 2 0.7990 45979.0 25.00 0.7044 0.0008H06 3 0.7968 61993.0 25.00 0.6351 0.0010H06 4 0.7959 80421.0 25.00 0.5107 0.0014H06 5 1.0068 90881.0 57.00 1.2557 0.0016H06 6 1.0027 98153.0 57.00 0.5076 0.0017H06 7 1.0082 100822.0 57.00 0.3067 0.0019H06 8 0.8905 105344.0 57.00 -0.3427 0.0021H06 9 0.9102 114761.0 57.00 0.7773 0.0023H06 10 0.9585 124642.5 57.50 1.0207 0.0024H06 11 0.9299 130240.4 57.44 0.2135 0.0026H06 12 0.9551 134908.0 57.52 0.5233 0.0028H06 13 0.9429 145323.3 57.58 0.7797 0.0029H06 14 0.9435 153765.5 57.50 0.4580 0.0032H06 15 0.9469 160692.2 57.60 0.5239 0.0034H06 16 0.9299 165440.0 57.54 0.2559 0.0035H06 17 0.9367 175602.1 57.50 0.6611 0.0037H06 18 0.9327 180895.5 57.53 0.4168 0.0039H06 19 0.9020 185173.7 57.33 0.0367 0.0041H06 20 0.9170 185004.4 54.85 0.3693 0.0043H06 21 0.9435 196811.3 54.76 1.0665 0.0045H06 22 0.9286 194247.7 54.82 -0.1868 0.0046H06 23 0.9224 203379.3 54.73 0.5766 0.0048H06 24 0.9252 200476.1 54.60 0.0178 0.0050H06 25 0.9156 207000.0 54.55 0.5319 0.0052

Table A-2. (continued).
Code Cycle (atm) (ppm) (Celsius) 100 eV) FlagPressure Hydrogen Temperature (molecules/ Outlier
G-valueWatt @
yr
A-22
H06 28 0.9116 212417.0 54.54 0.3736 0.0054H06 29 0.8891 220836.0 54.76 0.3143 0.0056H06 32 0.8714 225229.1 54.27 0.1794 0.0057H06 33 0.8673 232669.4 54.80 0.2580 0.0061H06 34 0.9381 286373.0 57.60 0.2937 0.0086H06 35 0.7721 289401.9 57.24 0.0091H06 36 0.7701 298125.9 57.21 0.2769 0.0095H06 37 0.7619 319779.8 57.12 0.4643 0.0099H06 38 0.7592 323314.6 57.17 0.2188 0.0101H07 0 0.7676 0.0 25.00 0.0000H07 1 0.6839 64589.5 25.00 0.8452 0.0007H07 2 0.7871 90322.0 25.00 0.8918 0.0010H07 3 0.7916 109724.0 25.00 0.6229 0.0014H07 4 0.7483 136018.0 25.00 0.4402 0.0018H07 5 0.8844 141556.0 57.00 0.6234 0.0021H07 6 0.8837 148826.0 57.00 0.4220 0.0023H07 7 0.8878 156854.0 57.00 0.5156 0.0025H07 8 0.8803 162038.0 57.00 0.2081 0.0028H07 9 0.8769 175202.0 57.00 0.7186 0.0030H07 10 0.8687 187185.0 57.46 0.5432 0.0032H07 11 0.8626 190767.4 57.48 0.2140 0.0034H07 12 0.8571 196517.5 57.53 0.2709 0.0037H07 13 0.8483 202687.7 57.57 0.3599 0.0039H07 14 0.8442 202277.0 57.53 0.0395 0.0042H07 15 0.8367 214488.9 57.57 0.5127 0.0044H07 16 0.8306 221124.4 57.54 0.3631 0.0046H07 17 0.7673 232199.1 57.54 -0.1305 0.0049H07 18 0.8129 230889.3 57.51 0.6273 0.0051H07 19 0.8048 233655.7 57.31 0.1363 0.0053H07 20 0.7925 237736.5 54.79 0.2065 0.0056H07 21 0.8095 242462.6 54.77 0.4818 0.0058H07 22 0.7932 243600.5 54.91 -0.0323 0.0060H07 23 0.7925 246320.6 54.77 0.2184 0.0063H07 24 0.7871 250250.5 54.59 0.1729 0.0066H07 25 0.7782 254590.6 54.48 0.2463 0.0067H07 28 0.7728 256975.9 54.61 0.1330 0.0070H07 32 0.7558 274183.9 54.28 0.2903 0.0074H07 33 0.7422 280266.6 54.91 0.0805 0.0079H07 34 0.7769 298868.0 57.61 0.0875 0.0111H07 35 0.7585 317108.9 57.27 0.0118H07 36 0.7422 312607.7 57.18 -0.1314 0.0123
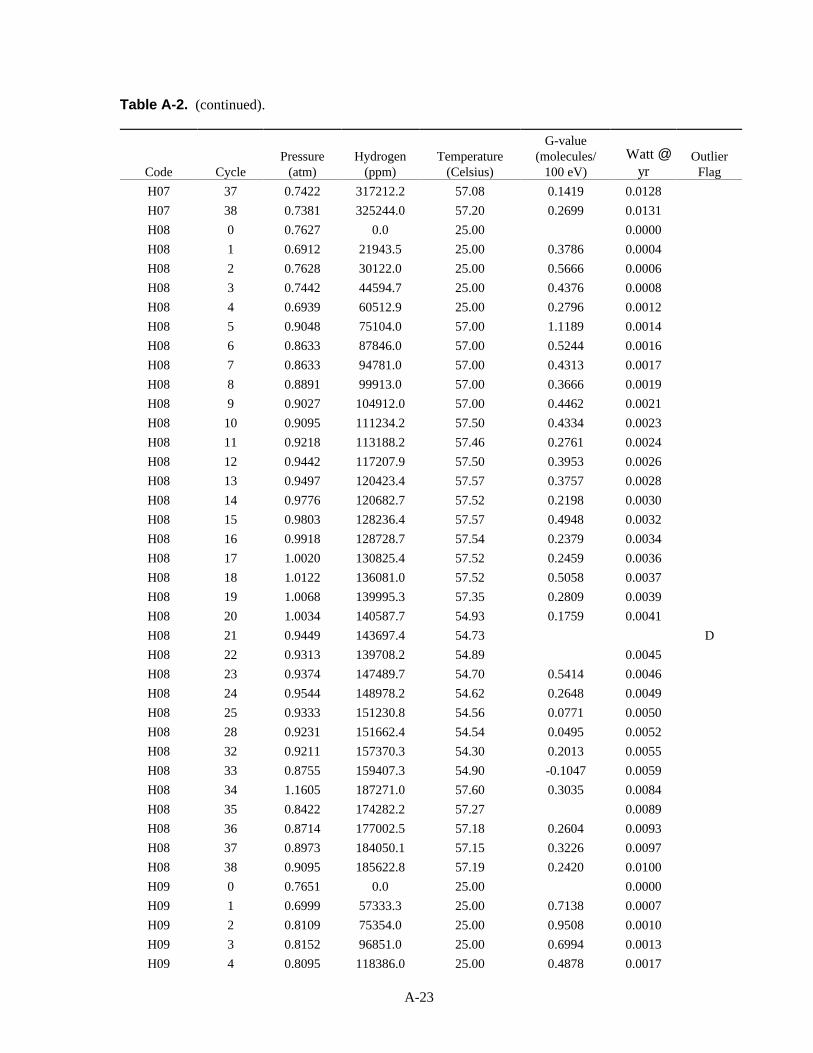
Table A-2. (continued).
Code Cycle (atm) (ppm) (Celsius) 100 eV) FlagPressure Hydrogen Temperature (molecules/ Outlier
G-valueWatt @
yr
A-23
H07 37 0.7422 317212.2 57.08 0.1419 0.0128H07 38 0.7381 325244.0 57.20 0.2699 0.0131H08 0 0.7627 0.0 25.00 0.0000H08 1 0.6912 21943.5 25.00 0.3786 0.0004H08 2 0.7628 30122.0 25.00 0.5666 0.0006H08 3 0.7442 44594.7 25.00 0.4376 0.0008H08 4 0.6939 60512.9 25.00 0.2796 0.0012H08 5 0.9048 75104.0 57.00 1.1189 0.0014H08 6 0.8633 87846.0 57.00 0.5244 0.0016H08 7 0.8633 94781.0 57.00 0.4313 0.0017H08 8 0.8891 99913.0 57.00 0.3666 0.0019H08 9 0.9027 104912.0 57.00 0.4462 0.0021H08 10 0.9095 111234.2 57.50 0.4334 0.0023H08 11 0.9218 113188.2 57.46 0.2761 0.0024H08 12 0.9442 117207.9 57.50 0.3953 0.0026H08 13 0.9497 120423.4 57.57 0.3757 0.0028H08 14 0.9776 120682.7 57.52 0.2198 0.0030H08 15 0.9803 128236.4 57.57 0.4948 0.0032H08 16 0.9918 128728.7 57.54 0.2379 0.0034H08 17 1.0020 130825.4 57.52 0.2459 0.0036H08 18 1.0122 136081.0 57.52 0.5058 0.0037H08 19 1.0068 139995.3 57.35 0.2809 0.0039H08 20 1.0034 140587.7 54.93 0.1759 0.0041H08 21 0.9449 143697.4 54.73 DH08 22 0.9313 139708.2 54.89 0.0045H08 23 0.9374 147489.7 54.70 0.5414 0.0046H08 24 0.9544 148978.2 54.62 0.2648 0.0049H08 25 0.9333 151230.8 54.56 0.0771 0.0050H08 28 0.9231 151662.4 54.54 0.0495 0.0052H08 32 0.9211 157370.3 54.30 0.2013 0.0055H08 33 0.8755 159407.3 54.90 -0.1047 0.0059H08 34 1.1605 187271.0 57.60 0.3035 0.0084H08 35 0.8422 174282.2 57.27 0.0089H08 36 0.8714 177002.5 57.18 0.2604 0.0093H08 37 0.8973 184050.1 57.15 0.3226 0.0097H08 38 0.9095 185622.8 57.19 0.2420 0.0100H09 0 0.7651 0.0 25.00 0.0000H09 1 0.6999 57333.3 25.00 0.7138 0.0007H09 2 0.8109 75354.0 25.00 0.9508 0.0010H09 3 0.8152 96851.0 25.00 0.6994 0.0013H09 4 0.8095 118386.0 25.00 0.4878 0.0017
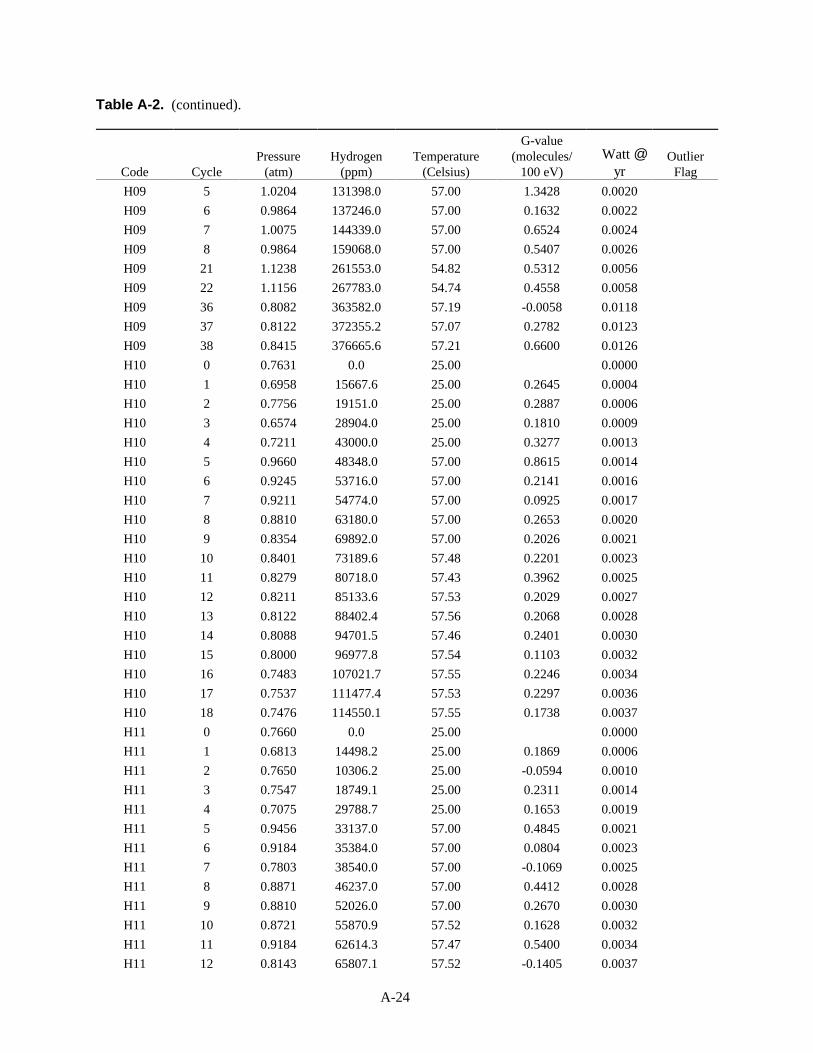
Table A-2. (continued).
Code Cycle (atm) (ppm) (Celsius) 100 eV) FlagPressure Hydrogen Temperature (molecules/ Outlier
G-valueWatt @
yr
A-24
H09 5 1.0204 131398.0 57.00 1.3428 0.0020H09 6 0.9864 137246.0 57.00 0.1632 0.0022H09 7 1.0075 144339.0 57.00 0.6524 0.0024H09 8 0.9864 159068.0 57.00 0.5407 0.0026H09 21 1.1238 261553.0 54.82 0.5312 0.0056H09 22 1.1156 267783.0 54.74 0.4558 0.0058H09 36 0.8082 363582.0 57.19 -0.0058 0.0118H09 37 0.8122 372355.2 57.07 0.2782 0.0123H09 38 0.8415 376665.6 57.21 0.6600 0.0126H10 0 0.7631 0.0 25.00 0.0000H10 1 0.6958 15667.6 25.00 0.2645 0.0004H10 2 0.7756 19151.0 25.00 0.2887 0.0006H10 3 0.6574 28904.0 25.00 0.1810 0.0009H10 4 0.7211 43000.0 25.00 0.3277 0.0013H10 5 0.9660 48348.0 57.00 0.8615 0.0014H10 6 0.9245 53716.0 57.00 0.2141 0.0016H10 7 0.9211 54774.0 57.00 0.0925 0.0017H10 8 0.8810 63180.0 57.00 0.2653 0.0020H10 9 0.8354 69892.0 57.00 0.2026 0.0021H10 10 0.8401 73189.6 57.48 0.2201 0.0023H10 11 0.8279 80718.0 57.43 0.3962 0.0025H10 12 0.8211 85133.6 57.53 0.2029 0.0027H10 13 0.8122 88402.4 57.56 0.2068 0.0028H10 14 0.8088 94701.5 57.46 0.2401 0.0030H10 15 0.8000 96977.8 57.54 0.1103 0.0032H10 16 0.7483 107021.7 57.55 0.2246 0.0034H10 17 0.7537 111477.4 57.53 0.2297 0.0036H10 18 0.7476 114550.1 57.55 0.1738 0.0037H11 0 0.7660 0.0 25.00 0.0000H11 1 0.6813 14498.2 25.00 0.1869 0.0006H11 2 0.7650 10306.2 25.00 -0.0594 0.0010H11 3 0.7547 18749.1 25.00 0.2311 0.0014H11 4 0.7075 29788.7 25.00 0.1653 0.0019H11 5 0.9456 33137.0 57.00 0.4845 0.0021H11 6 0.9184 35384.0 57.00 0.0804 0.0023H11 7 0.7803 38540.0 57.00 -0.1069 0.0025H11 8 0.8871 46237.0 57.00 0.4412 0.0028H11 9 0.8810 52026.0 57.00 0.2670 0.0030H11 10 0.8721 55870.9 57.52 0.1628 0.0032H11 11 0.9184 62614.3 57.47 0.5400 0.0034H11 12 0.8143 65807.1 57.52 -0.1405 0.0037

Table A-2. (continued).
Code Cycle (atm) (ppm) (Celsius) 100 eV) FlagPressure Hydrogen Temperature (molecules/ Outlier
G-valueWatt @
yr
A-25
H11 13 0.8544 71183.0 57.58 0.4889 0.0038H11 14 0.8469 75410.8 57.49 0.1375 0.0041H11 15 0.8510 80896.8 57.60 0.2665 0.0044H11 16 0.8320 82791.9 57.52 0.0508 0.0046H11 17 0.8299 87887.8 57.51 0.1939 0.0049H11 18 0.7490 96415.8 57.54 0.0112 0.0051H11 19 0.8694 94306.4 57.33 0.4934 0.0053H11 20 0.7667 100524.9 54.86 -0.1559 0.0055H11 21 0.8490 113103.4 54.75 0.8886 0.0058H11 22 0.8429 119106.1 54.73 0.2811 0.0060H11 23 0.8388 125948.8 54.77 0.3050 0.0063H11 24 0.8381 133082.9 54.62 0.2814 0.0065H11 25 0.8102 137980.2 54.66 0.1032 0.0067H11 28 0.8327 144749.5 54.60 0.4623 0.0070H11 32 0.8150 158051.4 54.34 0.2455 0.0074H11 35 0.7585 251991.5 57.22 0.0118H12 0 0.7652 0.0 25.00 0.0000H12 1 0.6948 37238.2 25.00 0.5832 0.0005H12 2 0.8067 49575.0 25.00 0.7904 0.0008H12 3 0.7981 67140.0 25.00 0.6557 0.0010H12 4 0.6565 89667.4 25.00 0.1763 0.0014H12 5 0.9252 98231.0 57.00 1.9848 0.0016H12 6 0.9020 105780.0 57.00 0.3759 0.0017H12 7 0.9259 112751.0 57.00 0.6966 0.0019H12 8 0.8551 116438.0 57.00 -0.1743 0.0021H12 9 0.9816 133704.0 57.00 2.1118 0.0023H12 10 0.9415 143903.3 56.06 0.3826 0.0025H12 11 0.9728 153911.3 57.43 1.1485 0.0026H13 0 0.7660 0.0 25.00 0.0000H13 1 0.7037 76529.9 25.00 0.5364 0.0007H13 2 0.8325 96644.0 25.00 0.6536 0.0010H13 3 0.8428 116313.0 25.00 0.4103 0.0014H13 4 0.8571 144344.0 25.00 0.3794 0.0019H13 5 0.9728 153674.0 57.00 0.5266 0.0021H13 6 0.9673 163761.0 57.00 0.3639 0.0023H13 7 1.0048 173529.0 57.00 0.6043 0.0025H13 8 1.0170 178473.0 57.00 0.2453 0.0028H13 9 1.0327 188455.0 57.00 0.4993 0.0030H13 10 1.0299 195873.4 56.48 0.3190 0.0032H13 11 1.0340 203640.9 57.47 0.4240 0.0034H13 12 1.0510 208565.4 57.49 0.3379 0.0036

Table A-2. (continued).
Code Cycle (atm) (ppm) (Celsius) 100 eV) FlagPressure Hydrogen Temperature (molecules/ Outlier
G-valueWatt @
yr
A-26
H13 13 1.0537 215850.0 57.56 0.4625 0.0038H13 14 1.0741 222580.4 57.53 0.3441 0.0041H13 15 1.0374 225272.2 57.58 -0.0159 0.0044H13 16 1.0755 233598.1 57.52 0.7123 0.0046H13 17 1.0796 237472.0 57.50 0.2332 0.0048H13 18 1.0864 242454.9 57.56 0.3888 0.0050H13 19 1.0456 249436.3 54.23 0.1391 0.0053H13 20 1.0517 251314.0 54.79 0.2494 0.0055H13 21 0.9918 258038.4 54.76 DH13 22 0.9769 260611.6 54.84 0.0060H13 23 0.9735 263554.9 54.61 0.1996 0.0062H13 24 0.9850 267304.4 54.69 0.2721 0.0065H13 25 0.9680 272947.1 54.58 0.2297 0.0067H13 28 0.9476 275916.6 54.68 0.0662 0.0069H13 30 0.9286 279162.7 54.33 0.0072H13 32 0.7381 27242.4 54.32 0.0074H13 33 0.7279 52824.8 54.95 0.2792 0.0078H13 34 0.9993 152863.0 57.61 0.2294 0.0110H13 35 0.8088 173455.4 57.25 0.0117H13 36 0.8306 176936.6 57.20 0.1330 0.0122H13 37 0.8592 196805.2 57.09 0.3187 0.0127H13 38 0.8755 199080.5 57.16 0.1757 0.0130H14 0 0.7634 0.0 25.00 0.0000H14 1 0.6766 39292.7 25.00 0.3300 0.0005H14 2 0.7815 49231.0 25.00 0.3725 0.0008H14 3 0.7771 62762.0 25.00 0.2841 0.0010H14 4 0.7755 79774.0 25.00 0.2314 0.0014H14 5 0.8844 84852.0 57.00 0.3347 0.0016H14 6 0.8673 92197.0 57.00 0.2434 0.0017H14 7 0.8830 94353.0 57.00 0.1971 0.0019H14 8 0.8673 101589.0 57.00 0.1853 0.0021H14 9 0.8639 114358.0 57.00 0.4520 0.0023H14 10 0.8537 120956.3 56.82 0.2296 0.0025H14 11 0.8517 126080.3 57.48 0.2609 0.0026H14 12 0.8551 130451.8 57.52 0.2097 0.0028H14 13 0.8531 134328.3 57.57 0.2483 0.0029H14 14 0.8592 139577.9 57.50 0.2038 0.0032H14 15 0.8551 141319.5 57.57 0.1211 0.0034H14 16 0.8333 147092.3 57.55 0.1784 0.0035H14 17 0.8395 151914.3 57.55 0.2140 0.0037H14 18 0.8381 156693.6 57.54 0.2604 0.0039

Table A-2. (continued).
Code Cycle (atm) (ppm) (Celsius) 100 eV) FlagPressure Hydrogen Temperature (molecules/ Outlier
G-valueWatt @
yr
A-27
H14 19 0.8156 158141.3 54.45 0.0623 0.0041H14 20 0.8150 162279.0 54.78 0.2217 0.0043H14 21 0.8027 167503.0 54.85 0.1673 0.0045H14 22 0.7986 170186.4 54.99 0.1628 0.0046H14 23 0.7966 171250.0 54.70 0.1260 0.0048H14 24 0.7939 174577.6 54.70 0.1480 0.0050H14 25 0.7884 178259.8 54.70 0.2285 0.0052H14 28 0.7857 181479.2 54.69 0.1724 0.0054H14 29 0.7803 183756.7 54.33 0.1462 0.0056H14 30 0.7748 184984.9 54.54 0.0056H14 32 0.7510 14052.9 54.39 0.0057H14 33 0.7354 26274.7 55.02 0.1592 0.0061H14 34 0.8483 84085.0 57.63 0.1239 0.0086H14 35 0.7755 94018.9 57.25 0.0091H14 36 0.7823 100923.2 57.18 0.1294 0.0095H14 37 0.7912 107938.1 57.08 0.1255 0.0099H14 38 0.7918 112122.2 57.16 0.1316 0.0101H15 0 0.7655 0.0 25.00 0.0000H15 1 0.7172 76608.6 25.00 0.5924 0.0007H15 2 0.8403 91446.0 25.00 0.6176 0.0010H15 3 0.7916 113766.0 25.00 0.3368 0.0013H15 4 0.8571 142633.0 25.00 0.4973 0.0018H15 6 0.9177 162069.0 57.00 0.2807 0.0022H15 7 0.9660 164384.0 57.00 0.4465 0.0024H15 8 0.9735 173117.0 57.00 0.3223 0.0026H15 9 0.9878 188476.0 57.00 0.6746 0.0028H15 10 0.9810 196102.6 57.03 0.3063 0.0031H15 11 0.9857 202759.6 57.46 0.4188 0.0032H15 12 1.0020 210960.1 57.49 0.4428 0.0035H15 13 1.0034 216315.9 57.56 0.3999 0.0037H15 14 1.0231 223057.3 57.49 0.3590 0.0039H15 15 1.0122 232437.8 57.57 0.3446 0.0042H15 16 1.0048 236544.4 57.54 0.2604 0.0044H15 17 1.0190 240358.5 57.53 0.3031 0.0046H15 18 1.0259 248543.6 57.57 0.5215 0.0048H15 19 0.9776 250347.6 54.52 -0.0671 0.0051H15 20 0.9816 257393.6 54.81 0.4165 0.0053H15 21 0.9238 262674.9 54.80 DH15 22 0.9082 264165.7 54.82 0.0057H15 23 0.9054 269532.0 54.78 0.2744 0.0060H15 24 0.9027 270333.7 54.75 0.1298 0.0062

Table A-2. (continued).
Code Cycle (atm) (ppm) (Celsius) 100 eV) FlagPressure Hydrogen Temperature (molecules/ Outlier
G-valueWatt @
yr
A-28
H15 25 0.8959 274570.1 54.68 0.2852 0.0064H15 28 0.8769 281428.5 54.66 0.1760 0.0067H15 29 0.8728 281697.4 54.46 0.1386 0.0069H15 30 0.8639 286327.5 54.37 0.0069H15 32 0.7422 6499.1 54.33 0.0071H15 33 0.7197 30347.0 54.90 0.2711 0.0075H15 34 0.9741 135038.0 57.60 0.2333 0.0106H15 35 0.7932 152141.3 57.28 0.0113H15 36 0.8184 163641.3 57.20 0.2364 0.0117H15 37 0.8422 175091.3 57.13 0.2218 0.0122H15 38 0.8510 184115.9 57.19 0.2709 0.0125H16 0 0.7661 0.0 25.00 0.0000H16 1 0.6491 34407.9 25.00 0.5213 0.0005H16 2 0.7263 46682.5 25.00 0.6301 0.0008H16 3 0.7022 61628.2 25.00 0.4711 0.0010H16 4 0.6755 77691.5 25.00 0.2998 0.0014H16 5 0.8163 84614.0 57.00 0.7802 0.0016H16 6 0.8020 89375.0 57.00 0.2788 0.0018H16 7 0.8204 95377.0 57.00 0.5294 0.0019H16 8 0.8088 104372.0 57.00 0.3693 0.0021H16 9 0.8034 115984.0 57.00 0.6565 0.0023H16 10 0.7959 123367.1 57.19 0.3870 0.0025H16 11 0.7898 129718.6 57.46 0.4190 0.0026H16 12 0.7871 137424.9 57.46 0.4133 0.0028H16 13 0.7415 149616.7 57.56 0.3341 0.0030H16 14 0.7741 150393.2 57.51 0.3314 0.0032H16 15 0.7680 165472.0 57.58 0.7330 0.0034H16 16 0.7619 171638.7 57.55 0.3864 0.0035H16 17 0.7585 181419.8 57.52 0.4365 0.0038H16 18 0.7531 186897.8 57.53 0.3507 0.0039H16 19 0.7388 188366.0 54.65 0.0837 0.0041H16 20 0.7327 197687.2 55.10 0.4881 0.0043H16 21 0.7463 204032.1 54.74 0.5580 0.0045H16 22 0.7435 208640.7 54.83 0.3179 0.0047H16 23 0.7415 213177.8 54.87 0.3014 0.0048H16 24 0.7401 217182.1 54.74 0.2446 0.0051H16 25 0.7347 224126.4 54.57 0.4962 0.0052H16 28 0.7361 229399.6 54.61 0.3777 0.0054H16 32 0.7293 235962.9 54.30 0.1818 0.0057H16 33 0.7245 248514.5 54.98 0.3272 0.0061H16 34 0.7748 280522.0 57.59 0.1709 0.0086

Table A-2. (continued).
Code Cycle (atm) (ppm) (Celsius) 100 eV) FlagPressure Hydrogen Temperature (molecules/ Outlier
G-valueWatt @
yr
A-29
H16 35 0.7646 299187.8 57.26 0.0091H16 36 0.7599 320790.3 57.21 0.5628 0.0095H16 37 0.7592 322193.7 57.16 0.1127 0.0099H16 38 0.7565 321901.6 57.16 0.0919 0.0101
HA01 0 0.0HA01 2 5301.0 25.00HA01 3 5372.0 25.00HA01 4 4896.0HA01 5 5063.0HA01 6 0.9673 4712.0 41.41HA01 7 1.0401 4698.0 57.29HA01 8 1.0741 4636.0 56.87HA01 9 1.0796 4609.0 56.81HA01 10 1.0680 4828.6 56.77HA01 11 0.9272 4913.0 56.78HA01 12 0.9252 4737.4 56.70HA01 13 0.9204 4802.7 56.74HA01 14 0.9224 4706.0 56.69HA01 15 0.9197 4886.1 56.48HA01 16 0.8776 4934.5 56.65HA01 17 0.9272 4904.6 56.54HA01 18 0.9054 4917.5 56.81HA01 19 0.9367 4825.5 56.55HA01 20 0.9238 4883.7 56.51HA01 21 0.9782 4925.7 56.60HA01 22 0.9660 4766.7 56.58HA01 23 0.9714 4639.9 56.66HA01 24 0.9721 4880.6 56.78HA01 25 0.9667 4859.2 56.80HA01 28 0.9687 4908.2 56.82HA01 29 0.9694 4938.1 56.72HA01 32 0.9701 4901.9 56.72HA01 33 1.0020 4971.7 25.38HA01 34 0.9687 4972.0 25.17HA01 35 0.9639 4954.7 25.21HA02 0 0.7664 0.0 25.00 0.0000HA02 1 0.6690 31819.4 25.00 0.4155 0.0006HA02 2 0.8358 46174.0 25.00 0.6283 0.0010HA02 3 0.6785 63923.6 25.00 0.2173 0.0013HA02 4 0.6871 72868.8 25.00 0.2355 0.0017HA02 5 0.8095 82356.0 42.00 1.0759 0.0018

Table A-2. (continued).
Code Cycle (atm) (ppm) (Celsius) 100 eV) FlagPressure Hydrogen Temperature (molecules/ Outlier
G-valueWatt @
yr
A-30
HA02 6 0.8109 87872.0 42.09 0.4444 0.0020HA02 7 0.7993 90871.0 57.28 -0.0832 0.0021HA02 8 0.7912 98872.0 56.87 0.3327 0.0024HA02 9 0.7871 107771.0 56.93 0.5082 0.0025HA02 10 0.7837 116711.4 56.71 0.4921 0.0027HA02 11 0.7789 122444.0 56.79 0.3774 0.0028HA02 12 0.7748 128847.3 56.74 0.3395 0.0030HA02 13 0.7687 133706.7 56.64 0.3348 0.0032HA02 14 0.7653 140333.4 56.65 0.2665 0.0034HA02 15 0.7592 154161.5 56.41 0.6901 0.0036HA02 16 0.7544 159965.9 56.77 0.3640 0.0038HA02 17 0.7503 166766.8 56.72 0.2988 0.0040HA02 18 0.7422 174523.9 56.75 0.4072 0.0041HA02 19 0.7401 175078.1 56.82 0.0940 0.0043HA02 20 0.7347 181387.0 56.53 0.3496 0.0045HA02 21 0.7299 184915.3 56.70 0.1946 0.0047HA02 22 0.7497 187301.6 56.53 DHA02 23 0.7469 192140.7 56.76 0.0051HA02 24 0.7422 193653.2 56.79 0.1130 0.0053HA02 25 0.7361 199392.4 56.83 0.3865 0.0054HA02 28 0.7340 206139.1 56.84 0.3714 0.0056HA02 32 0.7252 213269.5 56.74 0.1701 0.0060HA02 33 0.7279 219747.2 56.72 0.2309 0.0063HA02 34 0.7646 257896.0 56.51 0.1757 0.0088HA02 35 0.7197 278171.5 56.60 0.0094HA02 36 0.7122 283794.6 56.55 0.1340 0.0097HA02 37 0.7109 286915.6 56.35 0.1246 0.0101HA02 38 0.7088 288901.4 56.39 0.1435 0.0104HA03 0 0.7630 0.0 25.00 0.0000HA03 1 1.0140 25123.0 25.00 0.4411 0.0006HA03 2 1.2101 32092.0 25.00 0.6374 0.0008HA03 3 1.1966 46673.0 25.00 0.4532 0.0012HA03 4 1.2313 61321.0 25.00 0.4133 0.0017HA03 5 1.7007 59272.0 42.00 1.0289 0.0019HA03 6 1.8061 59739.0 41.31 0.4586 0.0020HA03 7 1.7741 62046.0 57.30 -0.0660 0.0022HA03 8 1.8218 66268.0 56.85 0.3938 0.0025HA03 9 1.7959 68696.0 56.60 0.1936 0.0027HA03 10 1.8469 73073.3 56.71 0.5342 0.0030HA03 11 1.7143 75980.6 56.71 -0.1197 0.0032HA03 12 1.7041 80698.8 56.76 0.3479 0.0034

Table A-2. (continued).
Code Cycle (atm) (ppm) (Celsius) 100 eV) FlagPressure Hydrogen Temperature (molecules/ Outlier
G-valueWatt @
yr
A-31
HA03 13 1.7136 82884.9 56.65 0.3347 0.0036HA03 14 1.7483 86930.8 56.65 0.3439 0.0039HA03 15 1.7837 91010.6 56.53 0.4962 0.0041HA03 16 1.7864 92593.2 56.65 0.2561 0.0043HA03 17 1.8095 98213.5 56.56 0.4681 0.0046HA03 18 1.8068 100186.7 56.77 0.2571 0.0048HA03 19 1.8224 102350.4 56.69 0.3134 0.0051HA03 20 1.8224 106104.6 56.54 0.3998 0.0053HA03 21 1.8238 109031.3 56.52 0.3189 0.0055HA03 22 0.8327 100474.9 56.68 DHA03 24 0.8966 112903.4 56.84 -1.1429 0.0063HA03 25 0.9082 115970.0 56.76 0.2886 0.0064HA03 28 0.9299 120685.3 56.84 0.3120 0.0067HA03 29 0.9354 123578.4 56.72 0.2022 0.0069HA03 32 0.9490 128607.2 56.73 0.3486 0.0071HA03 33 0.9694 139704.0 56.75 0.3057 0.0076HA03 34 1.2701 197527.0 56.43 0.3251 0.0108HA03 35 0.8374 191477.8 56.80 0.0115HA03 36 0.8755 199598.6 56.40 0.3292 0.0119HA03 37 0.9211 209234.9 56.32 0.3701 0.0124HA03 38 0.9415 212104.5 56.30 0.2715 0.0128HA04 0 0.7639 0.0 25.00 0.0000HA04 1 0.6775 51280.4 25.00 0.4506 0.0005HA04 2 0.7910 66628.0 25.00 0.5566 0.0008HA04 3 0.7784 86396.0 25.00 0.3632 0.0011HA04 4 0.8027 106935.0 25.00 0.3629 0.0015HA04 5 0.9184 119486.0 42.00 0.8782 0.0016HA04 6 0.9279 123248.0 41.66 0.3341 0.0017HA04 7 0.9088 131254.0 57.27 0.0802 0.0019HA04 8 0.9061 142816.0 56.91 0.3674 0.0021HA04 9 0.9007 150735.0 56.82 0.3512 0.0023HA04 10 0.9054 154416.2 56.74 0.2572 0.0025HA04 11 0.9082 162517.0 56.79 0.4634 0.0026HA04 12 0.9136 170404.9 56.68 0.3890 0.0028HA04 13 0.9150 172230.4 56.68 0.2463 0.0030HA04 14 0.9224 180962.1 56.68 0.3297 0.0032HA04 15 0.9231 187505.2 56.56 0.3513 0.0034HA04 16 0.9238 190110.6 56.66 0.2675 0.0035HA04 17 0.9299 197947.9 56.58 0.3533 0.0038HA04 18 0.9272 201311.0 56.83 0.2583 0.0039HA04 19 0.9293 204119.3 56.65 0.2490 0.0041

Table A-2. (continued).
Code Cycle (atm) (ppm) (Celsius) 100 eV) FlagPressure Hydrogen Temperature (molecules/ Outlier
G-valueWatt @
yr
A-32
HA04 20 0.9279 209469.2 56.56 0.3324 0.0043HA04 21 0.9238 210931.3 56.62 0.1638 0.0045HA04 22 0.7905 211115.4 56.67 DHA04 23 0.7973 218282.7 56.71 0.0049HA04 24 0.8027 221814.5 56.77 0.2658 0.0051HA04 25 0.8020 224081.7 56.77 0.2632 0.0052HA04 28 0.8048 229128.4 56.80 0.2895 0.0054HA04 29 0.8041 231251.7 56.59 0.2081 0.0056HA04 30 0.7993 231119.8 56.74 0.0056HA04 32 0.7510 19438.1 56.70 0.0057HA04 33 0.7374 37723.8 56.75 0.2439 0.0061HA04 34 0.8891 117628.0 56.44 0.1926 0.0086HA04 35 0.7898 126498.0 56.61 0.0091HA04 36 0.7932 138581.0 56.42 0.2140 0.0095HA04 37 0.8088 146630.0 56.47 0.1793 0.0099HA04 38 0.8095 151039.7 56.54 0.1551 0.0101HA05 0 0.7659 0.0 25.00 0.0000HA05 1 0.6865 52802.2 25.00 0.7213 0.0006HA05 2 0.8009 78767.0 25.00 0.8660 0.0010HA05 3 0.7903 105256.0 25.00 0.6945 0.0014HA05 4 0.8231 129526.0 25.00 0.6334 0.0018HA05 5 1.0476 142132.0 42.00 2.2454 0.0020HA05 6 1.0830 148546.0 41.61 0.9354 0.0022HA05 7 1.0435 160603.0 57.26 0.0525 0.0024HA05 8 1.0476 168816.0 56.88 0.4698 0.0027HA05 9 1.0435 182963.0 56.83 0.8779 0.0029HA05 10 1.0320 192355.0 56.82 0.5108 0.0031HA05 11 1.0408 198950.1 56.80 0.6746 0.0033HA05 12 1.0456 208617.5 56.76 0.6630 0.0035HA05 13 0.7762 205104.4 56.65 DHA05 14 1.0531 231681.5 56.72 0.6637 0.0040HA05 15 1.0565 241966.2 56.49 0.7470 0.0042HA05 16 0.9898 249289.6 56.67 -0.3337 0.0044HA05 17 1.0694 261774.0 56.60 1.4644 0.0047HA05 18 1.0646 270841.6 56.75 0.6575 0.0049HA05 19 1.0714 275198.6 56.67 0.4952 0.0051HA05 20 1.0707 279090.7 56.50 0.3964 0.0053HA05 21 1.0741 285072.3 56.61 0.5518 0.0055HA05 22 0.7946 281327.3 56.61 DHA05 29 0.7755 325793.0 56.64 -0.4107 0.0069HA05 34 1.0810 414548.0 56.42

Table A-2. (continued).
Code Cycle (atm) (ppm) (Celsius) 100 eV) FlagPressure Hydrogen Temperature (molecules/ Outlier
G-valueWatt @
yr
A-33
HA06 0 0.7654 0.0 25.00 0.0000HA06 1 0.6857 36467.8 25.00 0.5627 0.0005HA06 2 0.8063 49165.0 25.00 0.7680 0.0008HA06 3 0.7837 69626.0 25.00 0.6253 0.0011HA06 4 0.8095 88492.0 25.00 0.5596 0.0015HA06 5 1.0272 102611.0 42.00 2.2313 0.0016HA06 6 1.0422 106677.0 42.03 0.5774 0.0018HA06 7 1.0027 111953.0 57.24 -0.1881 0.0019HA06 8 0.9925 122352.0 56.78 0.5324 0.0021HA06 9 0.9830 132391.0 56.82 0.6709 0.0023HA06 10 0.9782 144647.2 56.68 0.8127 0.0025HA06 11 0.9735 149887.8 56.75 0.4600 0.0026HA06 12 0.9741 161201.2 56.75 0.7663 0.0028HA06 13 0.9687 167597.9 56.72 0.5770 0.0030HA06 14 0.9673 177175.0 56.65 0.4956 0.0032HA06 15 0.9619 187364.8 56.39 0.6821 0.0034HA06 16 0.9578 194758.5 56.68 0.6142 0.0035HA06 17 0.9592 205661.0 56.68 0.6458 0.0038HA06 18 0.9524 211677.3 56.74 0.4541 0.0039HA06 19 0.9497 213602.7 56.60 0.2386 0.0041HA06 20 0.9435 228137.4 56.68 0.9083 0.0043HA06 21 0.9374 232101.5 56.60 0.3145 0.0045HA06 22 0.7850 232940.5 56.49 DHA06 23 0.7830 225880.8 56.58 0.0049HA06 24 0.7932 250256.0 56.65 1.4590 0.0051HA06 25 0.7912 256962.4 56.76 0.5644 0.0052HA06 28 0.7925 266030.7 56.81 0.5724 0.0054HA06 29 0.7898 271832.3 56.61 0.4347 0.0056HA06 32 0.7905 283182.7 56.65 0.7902 0.0057HA06 33 0.8014 293209.1 56.72 0.4313 0.0061HA06 34 0.8585 355570.0 56.42 0.3152 0.0086HA06 35 0.7735 356434.4 56.60 0.0091HA06 36 0.7755 371580.6 56.47 0.4885 0.0095HA06 37 0.7755 371765.2 56.43 0.1102 0.0099HA06 38 0.7762 377622.2 56.46 0.3635 0.0102HA07 0 0.7660 0.0 25.00 0.0000HA07 1 0.6883 66178.2 25.00 0.8547 0.0006HA07 2 0.8228 95023.0 25.00 0.9897 0.0011HA07 3 0.8152 123041.0 25.00 0.7238 0.0014HA07 4 0.8503 149143.0 25.00 0.6758 0.0019HA07 5 1.0748 162655.0 42.00 2.3875 0.0021

Table A-2. (continued).
Code Cycle (atm) (ppm) (Celsius) 100 eV) FlagPressure Hydrogen Temperature (molecules/ Outlier
G-valueWatt @
yr
A-34
HA07 6 1.1129 168481.0 41.35 0.9591 0.0023HA07 7 1.0755 174476.0 57.32 -0.3604 0.0025HA07 8 1.0707 196800.0 56.88 0.9801 0.0028HA07 9 1.0667 206022.0 56.81 0.5966 0.0030HA07 10 1.0612 217134.4 56.74 0.6500 0.0033HA07 11 1.0619 226079.8 56.79 0.7183 0.0035HA07 12 1.0680 239934.0 56.74 0.8786 0.0037HA07 13 1.0660 244397.1 56.70 0.4614 0.0039HA07 14 1.0687 258781.5 56.79 0.6615 0.0042HA07 15 1.0660 264768.2 56.57 0.4451 0.0044HA07 16 1.0612 274910.7 56.66 0.7291 0.0046HA07 17 1.0680 286085.0 56.65 0.6679 0.0049HA07 18 1.0639 291994.4 56.81 0.4560 0.0051HA07 19 1.0626 299580.1 56.58 0.5497 0.0054HA07 20 1.0537 304691.4 56.54 0.3251 0.0056HA07 21 1.0449 310797.5 56.55 0.3672 0.0059HA07 22 0.7918 309815.1 56.59 DHA07 23 0.7939 288318.8 56.70 0.0064HA07 24 0.8088 328971.3 56.81 1.8902 0.0066HA07 25 0.8082 339594.3 56.68 0.7086 0.0068HA07 28 0.8109 340016.9 56.84 0.2052 0.0070HA07 29 0.8095 347666.8 56.64 0.4730 0.0073HA07 32 0.8122 357805.6 56.68 0.6547 0.0075HA07 33 0.8231 370650.7 56.67 0.4345 0.0079HA07 34 0.9136 441234.0 56.39 0.3385 0.0113HA07 35 0.7912 440116.0 56.69 0.0119HA07 36 0.8075 459145.0 56.51 0.6354 0.0124HA07 37 0.8231 454657.9 56.66 0.1755 0.0129HA07 38 0.8259 468020.8 56.49 0.5694 0.0132HA08 0 0.7638 0.0 25.00 0.0000HA08 1 0.6417 15339.2 25.00 0.2223 0.0005HA08 2 0.7349 22066.8 25.00 0.3368 0.0008HA08 3 0.6995 31972.0 25.00 0.2626 0.0011HA08 4 0.7007 44626.6 25.00 0.2947 0.0015HA08 5 0.7755 51089.0 42.00 0.4980 0.0016HA08 6 0.7694 59012.8 42.23 0.5426 0.0018HA08 7 0.7388 67855.5 57.33 0.2139 0.0019HA08 8 0.7401 76739.8 56.83 0.3820 0.0021HA08 9 0.7361 86712.8 56.88 0.5154 0.0023HA08 10 0.7361 95057.4 56.67 0.4423 0.0025HA08 11 0.7333 101771.7 56.79 0.4165 0.0026

Table A-2. (continued).
Code Cycle (atm) (ppm) (Celsius) 100 eV) FlagPressure Hydrogen Temperature (molecules/ Outlier
G-valueWatt @
yr
A-35
HA08 12 0.7327 107937.5 56.64 0.3268 0.0028HA08 13 0.7293 113514.2 56.71 0.3747 0.0030HA08 15 0.7313 129143.5 56.50 0.3332 0.0034HA08 16 0.7320 133465.6 56.58 0.3272 0.0036HA08 17 0.7313 140708.4 56.68 0.3224 0.0038HA08 18 0.7272 146237.5 56.71 0.3204 0.0039HA08 19 0.6551 149507.2 56.67 -0.4239 0.0041HA08 20 0.6415 153304.9 56.50 0.1072 0.0043HA08 21 0.7204 159911.9 56.61 DHA08 22 0.7170 159595.4 56.47 DHA08 23 0.6680 142689.3 56.61 0.0049HA08 24 0.6782 171281.8 56.77 1.3703 0.0051HA08 25 0.6503 174665.2 56.72 -0.0801 0.0052HA09 0 0.7662 0.0 25.00 0.0000HA09 1 0.6937 66783.9 25.00 0.5499 0.0006HA09 2 0.8296 91416.0 25.00 0.5754 0.0010HA09 3 0.8231 113597.0 25.00 0.3816 0.0014HA09 4 0.8435 140294.0 25.00 0.4064 0.0019HA09 5 0.9660 148692.0 42.00 0.7510 0.0020HA09 6 0.9918 152654.0 40.88 0.4720 0.0022HA09 7 0.9850 165428.0 57.32 0.2303 0.0024HA09 8 1.0020 167241.0 56.84 0.2095 0.0027HA09 9 0.9980 176985.0 56.85 0.4062 0.0029HA09 10 1.0054 188119.7 56.78 0.4984 0.0031HA09 11 1.0102 191518.6 56.73 0.3067 0.0033HA09 12 1.0224 196176.2 56.72 0.3272 0.0035HA09 13 1.0252 201090.5 56.79 0.3791 0.0037HA09 14 1.0340 211294.7 56.77 0.3584 0.0040HA09 15 1.0347 216133.8 56.49 0.3093 0.0042HA09 16 1.0313 220786.4 56.62 0.3130 0.0044HA09 17 1.0435 228381.4 56.69 0.3741 0.0047HA09 18 1.0401 231247.8 56.71 0.2389 0.0049HA09 19 1.0435 236228.4 56.59 0.3308 0.0051HA09 20 1.0381 241605.1 56.53 0.2889 0.0054HA09 21 1.0299 246000.1 56.57 0.2370 0.0056HA09 22 0.7891 243294.0 56.49 DHA09 23 0.7850 227269.0 56.69 0.0061HA09 24 0.8075 253483.5 56.70 0.9469 0.0063HA09 25 0.8109 257854.1 56.77 0.3330 0.0065HA09 28 0.8150 261848.2 56.83 0.2431 0.0067HA09 29 0.8184 268162.8 56.59 0.3431 0.0069

Table A-2. (continued).
Code Cycle (atm) (ppm) (Celsius) 100 eV) FlagPressure Hydrogen Temperature (molecules/ Outlier
G-valueWatt @
yr
A-36
HA09 30 0.8197 266653.1 56.72 0.0071HA09 31 0.7646 24121.6 56.68 0.0071HA09 32 0.7510 26919.6 56.61 0.4797 0.0071HA09 33 0.7293 51821.8 56.77 0.2716 0.0076HA09 34 0.8952 149410.0 56.46 0.2033 0.0107HA09 35 0.8034 164495.0 56.54 0.0113HA09 36 0.8218 174970.9 56.48 0.2147 0.0118HA09 37 0.8422 185066.6 56.45 0.2083 0.0123HA09 38 0.8497 189691.7 56.56 0.1801 0.0126HA10 0 0.7643 0.0 25.00 0.0000HA10 1 0.6442 15063.0 25.00 0.2192 0.0005HA10 2 0.7351 21790.3 25.00 0.3320 0.0008HA10 3 0.7008 31850.0 25.00 0.2685 0.0011HA10 5 0.7619 38858.1 42.00 0.1342 0.0016HA10 6 0.7578 41191.3 41.73 0.1732 0.0018HA10 7 0.7626 42374.0 57.26 -0.0017 0.0019HA10 8 0.7483 44675.5 56.80 0.0811 0.0021HA10 9 0.7286 44910.6 56.80 -0.0189 0.0023HA10 10 0.7524 43561.5 56.75 0.0299 0.0025HA10 11 0.7558 45382.8 56.72 0.1456 0.0026HA10 12 0.7252 45486.4 56.72 -0.0520 0.0028HA10 13 0.7483 45081.6 56.74 0.0938 0.0030HA10 14 0.7476 47346.6 56.73 0.0923 0.0032HA10 15 0.7497 47638.9 56.57 0.0496 0.0034HA10 16 0.7517 46157.3 56.59 -0.0413 0.0036HA10 17 0.7476 48700.3 56.71 0.1068 0.0038HA10 18 0.7524 48744.4 56.74 0.0485 0.0039HA10 19 0.7565 49068.6 56.54 0.0564 0.0041HA10 20 0.7442 50238.5 56.62 0.0451 0.0043HA10 21 0.7633 49034.2 56.66 0.0312 0.0045HA10 22 0.7565 50107.6 56.54 0.0594 0.0047HA10 23 0.7333 42490.2 56.77 -0.3158 0.0049HA10 24 0.7646 49997.2 56.82 0.4858 0.0051HA10 25 0.7476 52861.1 56.73 0.1286 0.0052HA10 28 0.7639 50648.0 56.76 -0.0199 0.0054HA10 32 0.7558 10277.5 56.58 0.0057HA10 33 0.7565 20575.2 56.78 0.2473 0.0061HA10 34 0.6673 43394.5 56.49 0.0594 0.0087HA10 35 0.7088 32022.2 56.69 0.0091HA10 36 0.6884 30051.9 56.42 -0.0524 0.0095HA10 38 0.6422 27525.9 56.60 -0.0475 0.0102

Table A-2. (continued).
Code Cycle (atm) (ppm) (Celsius) 100 eV) FlagPressure Hydrogen Temperature (molecules/ Outlier
G-valueWatt @
yr
A-37
HA11 0 0.7663 0.0 25.00 0.0000HA11 1 0.6857 67739.9 25.00 0.5246 0.0006HA11 2 0.8299 92823.0 25.00 0.5652 0.0010HA11 3 0.8231 115833.0 25.00 0.3762 0.0014HA11 4 0.8571 138522.0 25.00 0.3639 0.0019HA11 5 0.9728 153767.0 42.00 0.9176 0.0021HA11 6 1.0068 153610.0 41.67 0.3351 0.0023HA11 7 1.0027 162090.0 57.25 0.1188 0.0025HA11 8 1.0231 167901.0 56.82 0.3097 0.0028HA11 9 1.0272 177040.0 56.87 0.4220 0.0030HA11 10 1.0272 182385.3 56.66 0.2795 0.0032HA11 11 1.0340 193547.7 56.76 0.5804 0.0034HA11 12 1.0463 200428.6 56.71 0.3819 0.0036HA11 13 1.0490 204519.5 56.71 0.3517 0.0038HA11 14 1.0599 210827.1 56.67 0.2779 0.0041HA11 15 1.0612 217838.0 56.65 0.3703 0.0044HA11 16 1.0578 219227.6 56.49 0.2020 0.0045HA11 17 1.0714 228831.2 56.64 0.4195 0.0048HA11 18 1.0694 231834.8 56.68 0.2515 0.0050HA11 19 1.0714 236787.2 56.44 0.3194 0.0053HA11 20 1.0619 239588.8 56.42 0.1800 0.0055HA11 21 1.0551 245225.7 56.64 0.2786 0.0057HA11 22 0.8211 243310.4 56.51 DHA11 23 0.8136 196691.2 56.61 0.0063HA11 24 0.8381 251489.7 56.72 1.6184 0.0065HA11 25 0.8265 254832.9 56.91 0.1473 0.0067HA11 28 0.8313 259972.0 56.82 0.2859 0.0069HA11 29 0.8333 264427.8 56.74 0.2737 0.0071HA11 30 0.8299 266071.4 56.69 0.0072HA11 32 0.7429 16062.8 56.75 0.0073HA11 33 0.7279 39700.0 56.71 0.2472 0.0078HA11 34 0.9122 138306.0 56.38 0.1956 0.0110HA11 35 0.8088 152385.3 56.62 0.0116HA11 36 0.8259 162788.7 56.37 0.1970 0.0121HA11 37 0.8476 173502.2 56.26 0.1879 0.0127HA11 38 0.8592 178777.5 56.57 0.2201 0.0129HA12 0 0.7631 0.0 25.00 0.0000HA12 1 0.6760 34453.3 25.00 0.5170 0.0005HA12 2 0.7941 45822.0 25.00 0.6808 0.0008HA12 3 0.7732 63762.0 25.00 0.5421 0.0011HA12 4 0.7959 82710.0 25.00 0.5277 0.0015

Table A-2. (continued).
Code Cycle (atm) (ppm) (Celsius) 100 eV) FlagPressure Hydrogen Temperature (molecules/ Outlier
G-valueWatt @
yr
A-38
HA12 5 0.9932 94898.0 42.00 1.8789 0.0016HA12 6 1.0354 98494.0 41.93 0.7585 0.0018HA12 7 0.9333 102983.0 55.07 -0.4396 0.0020HA12 8 0.9599 112723.0 56.84 0.8683 0.0021HA12 9 0.9007 124699.0 56.83 0.3457 0.0023HA12 10 0.9422 131990.8 56.68 0.8641 0.0025HA12 11 0.9422 134891.2 56.75 0.3142 0.0026HA12 12 0.9449 144815.1 56.74 0.6608 0.0028HA12 13 0.9381 153376.3 56.74 0.6929 0.0030HA12 14 0.9367 166467.9 56.79 0.6000 0.0032HA12 15 0.9054 174856.5 56.54 0.2786 0.0034HA12 16 0.8932 181723.3 56.60 0.4280 0.0036HA12 17 0.8197 190502.1 56.66 -0.2031 0.0038HA12 19 0.7694 182450.2 56.56 -0.4305 0.0041HA12 20 0.8102 184569.7 56.47 0.6585 0.0043HA12 21 0.9293 198846.1 56.56 2.2462 0.0045HA12 22 0.7844 201914.6 56.48 DHA12 23 0.7517 180386.1 56.71 0.0049HA12 24 0.7816 211739.3 56.75 2.0229 0.0051HA12 25 0.7653 229484.8 56.77 0.8621 0.0052HA12 28 0.7694 238189.5 56.78 0.5876 0.0054HA12 32 0.7599 251230.2 56.74 0.3250 0.0057HA12 33 0.7755 264830.8 56.72 0.5196 0.0061HA12 35 0.6259 316407.3 56.73 0.0091HA12 36 0.7354 325593.8 56.50 1.3289 0.0095HA12 37 0.7415 333163.2 56.37 0.2751 0.0099HA12 38 0.7456 342798.3 56.63 0.5589 0.0102HA13 0 0.7675 0.0 25.00 0.0000HA13 1 0.6648 45675.4 25.00 0.6123 0.0006HA13 2 0.7756 65268.0 25.00 0.6640 0.0010HA13 3 0.7547 86053.1 25.00 0.5129 0.0014HA13 4 0.7823 100020.0 25.00 0.3663 0.0019HA13 5 0.8912 112778.0 42.00 1.1694 0.0021HA13 6 0.8993 116324.0 41.77 0.3901 0.0022HA13 7 0.8912 121899.0 56.50 0.0215 0.0025HA13 8 0.8796 127216.0 56.85 0.2603 0.0027HA13 9 0.8701 138463.0 56.83 0.5332 0.0029HA13 10 0.8571 144329.9 56.72 0.2599 0.0031HA13 11 0.8476 147437.8 56.81 0.1742 0.0033HA13 12 0.8401 156456.3 56.75 0.3978 0.0035HA13 13 0.8299 159625.8 56.64 0.1838 0.0037

Table A-2. (continued).
Code Cycle (atm) (ppm) (Celsius) 100 eV) FlagPressure Hydrogen Temperature (molecules/ Outlier
G-valueWatt @
yr
A-39
HA13 14 0.8211 162684.5 56.73 0.1008 0.0040HA13 15 0.8116 171292.0 56.61 0.3785 0.0042HA13 16 0.8014 172717.9 56.62 0.0703 0.0044HA13 17 0.7762 177484.1 56.74 0.0440 0.0047HA13 18 0.7844 180775.9 56.73 0.2995 0.0049HA13 19 0.7769 183866.7 56.62 0.1559 0.0051HA13 20 0.7667 188407.3 56.49 0.1764 0.0053HA13 21 0.7633 201134.4 56.62 0.5557 0.0056HA13 22 0.7565 201783.6 56.57 0.0559 0.0058HA13 23 0.7374 190030.2 56.66 -0.4428 0.0061HA13 24 0.7456 209771.1 56.77 0.9741 0.0063HA13 25 0.7265 211648.8 56.71 -0.0365 0.0065HA13 28 0.7252 214659.8 56.99 0.1879 0.0067HA13 32 0.7129 218257.8 56.71 0.0561 0.0071HA13 33 0.7136 219901.6 56.64 0.0862 0.0075HA13 34 0.7483 237296.1 56.42 0.0815 0.0107HA13 35 0.7524 241351.7 56.71 0.0113HA13 36 0.7422 241783.7 56.37 0.0080 0.0117HA13 37 0.7354 244966.2 56.21 0.0671 0.0122HA13 38 0.7259 244375.1 56.59 -0.0297 0.0125HA14 0 0.7644 0.0 25.00 0.0000HA14 1 0.6809 50501.2 25.00 0.4535 0.0005HA14 2 0.7948 63431.0 25.00 0.4992 0.0008HA14 3 0.7824 85103.0 25.00 0.4079 0.0011HA14 4 0.8027 105266.0 25.00 0.3465 0.0015HA14 5 0.9048 113934.0 42.00 0.6727 0.0016HA14 6 0.9238 121768.0 41.64 0.5859 0.0018HA14 7 0.9027 132602.0 56.88 0.1282 0.0020HA14 8 0.8986 135842.0 56.84 0.2014 0.0021HA14 9 0.8980 148648.0 56.91 0.5204 0.0023HA14 10 0.8952 154323.8 56.68 0.2899 0.0025HA14 11 0.8966 159902.8 56.79 0.3561 0.0026HA14 12 0.9034 167212.5 56.61 0.3739 0.0028HA14 13 0.9020 167231.1 56.73 0.1452 0.0030HA14 14 0.9068 177205.8 56.66 0.3361 0.0032HA14 15 0.9054 181261.6 56.53 0.2591 0.0034HA14 16 0.9014 185451.4 56.59 0.2812 0.0035HA14 17 0.9095 187735.3 56.70 0.2091 0.0038HA14 18 0.9068 196014.5 56.75 0.3866 0.0039HA14 19 0.9061 199830.6 56.59 0.2757 0.0041HA14 20 0.9000 207003.7 56.47 0.3286 0.0043
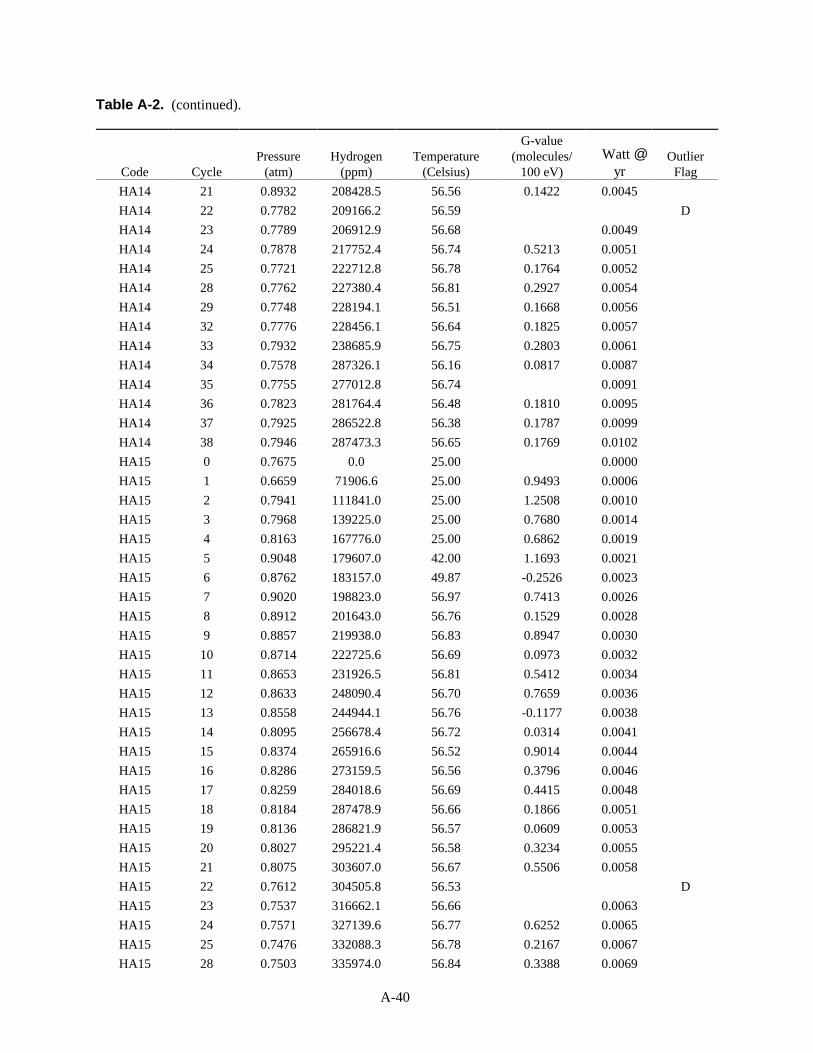
Table A-2. (continued).
Code Cycle (atm) (ppm) (Celsius) 100 eV) FlagPressure Hydrogen Temperature (molecules/ Outlier
G-valueWatt @
yr
A-40
HA14 21 0.8932 208428.5 56.56 0.1422 0.0045HA14 22 0.7782 209166.2 56.59 DHA14 23 0.7789 206912.9 56.68 0.0049HA14 24 0.7878 217752.4 56.74 0.5213 0.0051HA14 25 0.7721 222712.8 56.78 0.1764 0.0052HA14 28 0.7762 227380.4 56.81 0.2927 0.0054HA14 29 0.7748 228194.1 56.51 0.1668 0.0056HA14 32 0.7776 228456.1 56.64 0.1825 0.0057HA14 33 0.7932 238685.9 56.75 0.2803 0.0061HA14 34 0.7578 287326.1 56.16 0.0817 0.0087HA14 35 0.7755 277012.8 56.74 0.0091HA14 36 0.7823 281764.4 56.48 0.1810 0.0095HA14 37 0.7925 286522.8 56.38 0.1787 0.0099HA14 38 0.7946 287473.3 56.65 0.1769 0.0102HA15 0 0.7675 0.0 25.00 0.0000HA15 1 0.6659 71906.6 25.00 0.9493 0.0006HA15 2 0.7941 111841.0 25.00 1.2508 0.0010HA15 3 0.7968 139225.0 25.00 0.7680 0.0014HA15 4 0.8163 167776.0 25.00 0.6862 0.0019HA15 5 0.9048 179607.0 42.00 1.1693 0.0021HA15 6 0.8762 183157.0 49.87 -0.2526 0.0023HA15 7 0.9020 198823.0 56.97 0.7413 0.0026HA15 8 0.8912 201643.0 56.76 0.1529 0.0028HA15 9 0.8857 219938.0 56.83 0.8947 0.0030HA15 10 0.8714 222725.6 56.69 0.0973 0.0032HA15 11 0.8653 231926.5 56.81 0.5412 0.0034HA15 12 0.8633 248090.4 56.70 0.7659 0.0036HA15 13 0.8558 244944.1 56.76 -0.1177 0.0038HA15 14 0.8095 256678.4 56.72 0.0314 0.0041HA15 15 0.8374 265916.6 56.52 0.9014 0.0044HA15 16 0.8286 273159.5 56.56 0.3796 0.0046HA15 17 0.8259 284018.6 56.69 0.4415 0.0048HA15 18 0.8184 287478.9 56.66 0.1866 0.0051HA15 19 0.8136 286821.9 56.57 0.0609 0.0053HA15 20 0.8027 295221.4 56.58 0.3234 0.0055HA15 21 0.8075 303607.0 56.67 0.5506 0.0058HA15 22 0.7612 304505.8 56.53 DHA15 23 0.7537 316662.1 56.66 0.0063HA15 24 0.7571 327139.6 56.77 0.6252 0.0065HA15 25 0.7476 332088.3 56.78 0.2167 0.0067HA15 28 0.7503 335974.0 56.84 0.3388 0.0069

Table A-2. (continued).
Code Cycle (atm) (ppm) (Celsius) 100 eV) FlagPressure Hydrogen Temperature (molecules/ Outlier
G-valueWatt @
yr
A-41
HA15 32 0.7408 345193.4 56.75 0.1840 0.0073HA15 33 0.7463 349849.2 56.77 0.2156 0.0078HA15 34 0.7490 396399.9 56.36 0.1365 0.0111HA15 35 0.7605 394924.9 56.69 0.0117HA15 36 0.7585 396558.8 56.54 0.1049 0.0121HA15 37 0.7544 400817.2 56.36 0.1195 0.0127HA15 38 0.7435 404185.1 56.46 0.0743 0.0130HA16 0 0.7666 0.0 25.00 0.0000HA16 1 0.6693 33666.5 25.00 0.4414 0.0006HA16 2 0.7078 48428.9 25.00 0.4253 0.0010HA16 3 0.6785 63624.7 25.00 0.3907 0.0013HA16 4 0.7143 76368.5 25.00 0.3784 0.0017HA16 5 0.8163 81787.0 42.00 0.7460 0.0018HA16 6 0.8265 84791.0 49.48 0.2076 0.0020HA16 7 0.8122 94628.0 57.09 0.3255 0.0022HA16 8 0.8054 97869.0 56.79 0.2118 0.0024HA16 9 0.7993 110128.0 56.98 0.6629 0.0025HA16 10 0.7918 110081.3 56.64 0.0231 0.0027HA16 11 0.7857 121086.2 56.74 0.6901 0.0029HA16 12 0.7810 128628.9 56.71 0.3938 0.0030HA16 13 0.7741 129586.7 56.78 0.0921 0.0032HA16 14 0.7694 142015.3 56.70 0.4590 0.0034HA16 15 0.7639 152479.9 56.50 0.5608 0.0036HA16 16 0.7585 156750.3 56.63 0.2858 0.0038HA16 17 0.7544 161398.6 56.63 0.2224 0.0040HA16 18 0.7497 172742.9 56.67 0.5874 0.0042HA16 19 0.7456 172450.0 56.64 0.0483 0.0043HA16 20 0.7395 180987.5 56.47 0.4321 0.0045HA16 21 0.7361 187724.5 56.60 0.3758 0.0047HA16 22 0.7510 186290.9 56.42 DHA16 23 0.7463 188888.0 56.69 0.0051HA16 24 0.7456 193993.8 56.79 0.3593 0.0053HA16 25 0.7388 200386.8 56.76 0.3845 0.0054HA16 28 0.7381 205213.3 56.66 0.3308 0.0056HA16 32 0.7293 213255.1 56.66 0.2015 0.0060HA16 33 0.7388 219176.1 56.75 0.2651 0.0063HA16 34 0.7517 270469.9 56.40 0.1914 0.0089HA16 35 0.7565 276382.3 56.64 0.0094HA16 36 0.7476 280257.3 56.47 0.0979 0.0097HA16 37 0.7442 285448.9 56.42 0.1519 0.0101HA16 38 0.7422 288846.7 56.34 0.2355 0.0104

Table A-2. (continued).
Code Cycle (atm) (ppm) (Celsius) 100 eV) FlagPressure Hydrogen Temperature (molecules/ Outlier
G-valueWatt @
yr
A-42
N01 0 0.0N01 2 5102.0 25.00N01 3 5290.0 25.00N01 4 4846.0N01 5 4896.0N01 6 1.0014 4723.0 24.15N01 7 1.0680 4705.0 24.83N01 8 1.1156 4635.0 24.35N01 9 1.0993 4631.0 23.66N01 10 1.1014 4646.2 23.51N01 11 0.9626 4986.4 23.07N01 12 0.9544 4826.5 23.61N01 13 0.9524 4790.2 22.59N01 14 0.9531 4709.2 22.75N01 15 0.9592 4849.4 23.32N01 16 0.9592 4886.4 23.60N01 17 0.9510 4684.2 23.74N01 18 0.9619 4924.4 23.64N01 19 0.9714 4827.6 24.45N01 20 0.9320 4841.1 23.29N01 21 0.9816 4967.6 22.82N01 22 0.9741 4841.1 23.38N01 23 0.9776 4869.8 23.64N01 24 0.9830 4850.7 24.83N01 25 0.9796 4876.6 22.93N01 28 0.9789 4936.4 23.56N01 29 0.9803 4881.1 25.09N01 32 0.9810 4835.1 25.15N01 33 0.9973 4977.8 54.97N01 34 0.9435 4869.0 57.63N01 35 0.9599 4989.9 57.21N01 37 0.9741 5025.4 57.09N01 38 0.9755 5048.4 57.17N02 0 0.7678 0.0 25.00 0.0000N02 1 0.6581 31724.4 25.00 0.4679 0.0006N02 2 0.7295 49768.4 25.00 0.5969 0.0009N02 3 0.6298 61179.3 25.00 0.1270 0.0011N02 4 0.6224 81028.9 25.00 0.3805 0.0016N02 5 0.6422 87470.0 25.00 0.4631 0.0017N02 6 0.6442 90808.1 24.18 0.2744 0.0019N02 7 0.6490 90949.0 24.80 0.0822 0.0020

Table A-2. (continued).
Code Cycle (atm) (ppm) (Celsius) 100 eV) FlagPressure Hydrogen Temperature (molecules/ Outlier
G-valueWatt @
yr
A-43
N02 8 0.6503 103759.3 24.36 0.5245 0.0022N02 9 0.6490 120865.8 23.75 0.8747 0.0024N02 10 0.6340 124262.4 23.40 0.0904 0.0026N02 11 0.6469 138987.3 23.04 1.0499 0.0027N02 12 0.6490 145160.4 23.56 0.3355 0.0029N02 13 0.6449 149681.1 22.56 0.3314 0.0031N02 14 0.6259 161934.9 22.95 0.3031 0.0033N02 15 0.6415 165918.9 23.30 0.4167 0.0035N02 16 0.6429 174340.4 23.59 0.5408 0.0037N02 17 0.6442 180594.4 23.75 0.3099 0.0039N02 18 0.6415 189022.2 23.62 0.4973 0.0040N02 19 0.6456 193945.8 24.49 0.3214 0.0042N02 20 0.6224 197144.0 23.25 -0.0439 0.0044N02 21 0.6395 204715.9 22.91 0.6334 0.0046N02 22 0.6408 211966.1 23.40 0.4542 0.0048N02 23 0.6415 218935.9 23.59 0.4097 0.0050N02 24 0.6463 222332.2 24.80 0.2393 0.0052N02 25 0.6374 226792.4 22.94 0.3037 0.0053N02 28 0.6395 234132.7 23.53 0.4304 0.0055N02 32 0.7279 29383.5 25.24 0.0059N02 33 0.6857 42230.5 25.39 0.2859 0.0062N02 34 0.7415 109513.0 24.99 0.2598 0.0087N02 35 0.7265 118802.0 25.29 0.0093N02 36 0.7333 123071.0 25.86 0.1637 0.0096N02 37 0.7354 138118.2 26.14 0.3829 0.0100N02 38 0.7354 140090.2 26.72 0.1174 0.0103N03 0 0.7632 0.0 25.00 0.0000N03 1 1.0790 15257.0 25.00 0.2937 0.0006N03 2 1.2508 19721.0 25.00 0.4301 0.0008N03 3 1.2360 27852.0 25.00 0.3091 0.0011N03 4 1.1905 40481.0 25.00 0.2785 0.0016N03 5 1.1633 44963.0 25.00 0.2237 0.0018N03 6 1.1374 46730.0 24.22 0.0959 0.0020N03 7 1.1245 51576.0 24.74 0.2727 0.0022N03 8 1.1048 58632.0 24.33 0.2773 0.0025N03 9 1.0844 62918.0 23.69 0.2104 0.0027N03 10 1.0605 68913.9 23.52 0.2569 0.0029N03 11 1.0435 73843.1 23.04 0.2812 0.0031N03 12 1.0354 79131.3 23.58 0.2409 0.0033N03 13 1.0156 83190.3 22.53 0.2278 0.0035N03 14 1.0034 89263.8 22.98 0.2043 0.0038

Table A-2. (continued).
Code Cycle (atm) (ppm) (Celsius) 100 eV) FlagPressure Hydrogen Temperature (molecules/ Outlier
G-valueWatt @
yr
A-44
N03 15 0.9946 93972.0 23.35 0.2182 0.0040N03 16 0.9857 98391.1 23.58 0.2431 0.0042N03 17 0.9823 106244.5 23.75 0.3130 0.0045N03 18 0.9667 109497.0 23.39 0.1495 0.0047N03 19 0.9667 113352.5 24.47 0.2045 0.0049N03 20 0.9422 117329.5 23.17 0.1394 0.0052N03 21 0.9320 121922.3 22.90 0.1957 0.0054N03 22 0.9245 128645.2 23.33 0.3145 0.0056N03 23 0.9190 133019.9 23.57 0.2103 0.0058N03 24 0.9231 137316.7 24.79 0.2054 0.0061N03 25 0.9020 141333.5 23.00 0.1863 0.0063N03 26 0.8932 143741.8 23.80 0.1455 0.0065N03 27 0.7551 4609.6 24.00 0.0065N03 28 0.7531 8508.6 23.49 0.4213 0.0065N03 32 0.7837 24143.9 25.19 0.2873 0.0070N03 33 0.8027 38896.8 25.07 0.2864 0.0074N03 34 0.9592 120203.0 24.99 0.2654 0.0106N03 35 0.7925 129156.5 25.27 0.0112N03 36 0.8088 142046.8 25.94 0.3014 0.0117N03 37 0.8265 149595.7 26.17 0.2036 0.0122N03 38 0.8422 150873.2 26.66 0.1548 0.0125N04 0 0.7649 0.0 25.00 0.0000N04 1 0.6955 49156.9 25.00 0.4363 0.0006N04 2 0.8013 71812.0 25.00 0.5142 0.0009N04 3 0.8008 89080.0 25.00 0.4032 0.0011N04 4 0.8027 112249.0 25.00 0.3479 0.0015N04 5 0.8027 117122.0 25.00 0.2344 0.0017N04 6 0.8014 123105.0 24.27 0.3320 0.0019N04 7 0.8020 122349.0 24.69 0.0557 0.0020N04 8 0.8027 137134.0 24.28 0.4476 0.0022N04 9 0.8000 150858.0 23.60 0.5382 0.0024N04 10 0.8000 160077.4 23.53 0.3787 0.0026N04 11 0.7966 164783.6 23.05 0.2874 0.0027N04 12 0.7986 167403.4 23.54 0.1756 0.0029N04 13 0.7946 177526.0 22.56 0.5246 0.0031N04 14 0.7966 182967.4 22.96 0.2143 0.0033N04 15 0.7986 190791.1 23.32 0.3563 0.0035N04 16 0.8000 193396.6 23.60 0.2339 0.0037N04 17 0.8048 201608.3 23.75 0.3342 0.0039N04 18 0.7946 203844.6 23.71 0.1231 0.0040N04 19 0.8007 205516.3 24.37 0.2062 0.0042

Table A-2. (continued).
Code Cycle (atm) (ppm) (Celsius) 100 eV) FlagPressure Hydrogen Temperature (molecules/ Outlier
G-valueWatt @
yr
A-45
N04 20 0.7946 209534.4 23.14 0.2413 0.0044N04 21 0.7973 210666.7 22.90 0.1780 0.0046N04 22 0.7993 215892.0 23.32 0.3164 0.0048N04 23 0.8027 222894.7 23.53 0.3658 0.0049N04 24 0.8116 224930.9 24.72 0.2038 0.0052N04 25 0.8041 228091.6 23.08 0.2746 0.0053N04 26 0.8048 230158.0 24.00 0.2581 0.0054N04 27 0.7605 17298.8 23.00 0.0054N04 28 0.7510 20685.9 23.32 0.3369 0.0055N04 32 0.7429 37526.0 25.23 0.2553 0.0058N04 33 0.7442 53951.8 25.06 0.2582 0.0062N04 34 0.8714 128337.0 24.92 0.2011 0.0087N04 35 0.7891 137045.0 25.29 0.0092N04 36 0.8041 142568.3 25.99 0.1619 0.0096N04 37 0.8102 152636.3 26.14 0.1965 0.0100N04 38 0.8238 158479.8 26.74 0.2510 0.0103N05 0 0.7658 0.0 25.00 0.0000N05 1 0.6652 92002.9 25.00 1.0946 0.0007N05 2 0.8046 117014.0 25.00 1.4657 0.0010N05 3 0.8126 145609.0 25.00 0.9528 0.0013N05 4 0.7823 178722.0 25.00 0.5382 0.0019N05 5 0.8299 188691.0 25.00 1.1118 0.0021N05 6 0.8340 197083.0 24.30 0.6836 0.0022N05 7 0.7871 194053.0 24.24 -0.5810 0.0025N05 8 0.8449 218379.0 24.27 1.5308 0.0027N05 9 0.8435 235333.0 23.58 0.9522 0.0029N05 10 0.8442 248889.7 23.46 0.7527 0.0032N05 11 0.8422 258066.0 23.03 0.6686 0.0034N05 12 0.8463 264736.8 23.39 0.4535 0.0036N05 13 0.8408 275987.0 22.54 0.7840 0.0038N05 14 0.7980 282382.3 22.93 -0.1836 0.0041N05 15 0.7952 293189.4 23.20 0.5285 0.0043N05 16 0.8367 297656.1 23.57 1.1803 0.0045N05 17 0.8367 305986.8 23.75 0.4269 0.0048N05 18 0.7891 311102.6 23.69 -0.4511 0.0050N05 19 0.8177 314592.1 24.31 0.7433 0.0053N05 20 0.7571 334864.2 23.11 0.0101 0.0055N05 21 0.8150 320755.6 22.91 0.5540 0.0057N05 22 0.8088 329506.7 23.34 0.4408 0.0059N05 23 0.8048 335296.4 23.50 0.3253 0.0062N05 24 0.8054 337879.0 24.69 0.1873 0.0065

Table A-2. (continued).
Code Cycle (atm) (ppm) (Celsius) 100 eV) FlagPressure Hydrogen Temperature (molecules/ Outlier
G-valueWatt @
yr
A-46
N05 25 0.7939 339203.8 23.12 0.1116 0.0066N05 28 0.7891 345034.2 23.37 0.2950 0.0069N05 29 0.7884 351881.4 24.96 0.3738 0.0071N05 32 0.7850 352056.9 25.28 0.1001 0.0073N05 33 0.7837 356086.1 25.08 0.1660 0.0078N05 34 0.7973 398824.0 24.93 0.1632 0.0110N05 35 0.7633 400716.3 25.29 0.0117N05 36 0.7599 418322.8 26.02 0.3967 0.0121N05 37 0.7592 417601.0 26.14 0.0620 0.0126N05 38 0.7592 398542.3 26.69 -0.4481 0.0130N06 0 0.7623 0.0 25.00 0.0000N06 1 0.7003 36092.1 25.00 0.5884 0.0005N06 2 0.8071 56034.0 25.00 0.7490 0.0008N06 3 0.8021 73611.0 25.00 0.6701 0.0011N06 4 0.8027 98788.0 25.00 0.6102 0.0015N06 5 0.8027 104783.0 25.00 0.4293 0.0017N06 6 0.8034 108548.0 24.32 0.3639 0.0018N06 7 0.8034 112151.0 24.37 0.2844 0.0020N06 8 0.8054 125907.0 24.21 0.7012 0.0022N06 9 0.8020 138374.0 23.50 0.7845 0.0024N06 10 0.8034 151972.8 23.49 0.8299 0.0026N06 11 0.7993 157995.9 23.00 0.4866 0.0027N06 12 0.8034 166761.1 23.28 0.5722 0.0029N06 13 0.7980 175969.6 22.57 0.7211 0.0030N06 14 0.7973 182994.9 22.89 0.3532 0.0033N06 15 0.8034 184290.7 23.33 0.2336 0.0035N06 16 0.8034 200617.6 23.53 1.1793 0.0036N06 17 0.8075 207119.8 23.69 0.4317 0.0038N06 18 0.8034 215800.2 23.71 0.5850 0.0040N06 19 0.8082 219048.2 24.29 0.3492 0.0042N06 20 0.7952 225766.9 23.08 0.3763 0.0044N06 21 0.7986 232695.5 22.90 0.5344 0.0046N06 22 0.7986 236420.3 23.31 0.3460 0.0047N06 23 0.7993 242883.2 23.38 0.4156 0.0049N06 24 0.8068 253336.5 24.72 0.7465 0.0051N06 25 0.7966 254806.8 23.15 0.1741 0.0053N06 28 0.7966 251154.7 23.46 -0.0508 0.0055N06 29 0.8027 269486.6 24.89 1.2076 0.0056N06 32 0.8041 273520.7 25.30 0.4176 0.0058N06 33 0.8088 282877.2 25.09 0.4006 0.0062N06 34 0.9109 340119.0 24.93 0.4013 0.0087

Table A-2. (continued).
Code Cycle (atm) (ppm) (Celsius) 100 eV) FlagPressure Hydrogen Temperature (molecules/ Outlier
G-valueWatt @
yr
A-47
N06 35 0.7762 346551.4 25.23 0.0092N06 36 0.7925 351704.5 25.94 0.4079 0.0096N06 37 0.7946 352217.8 26.12 0.1249 0.0100N06 38 0.8075 358099.9 26.66 0.5741 0.0102N07 0 0.7658 0.0 25.00 0.0000N07 1 0.6710 90381.1 25.00 1.0772 0.0007N07 2 0.8082 106775.0 25.00 1.1389 0.0010N07 3 0.8231 134617.0 25.00 0.9545 0.0013N07 4 0.8435 167167.0 25.00 0.7310 0.0019N07 5 0.8367 173907.0 25.00 0.3718 0.0021N07 6 0.8374 183834.0 24.32 0.7149 0.0023N07 7 0.8395 188755.0 24.44 0.3619 0.0025N07 8 0.8415 196677.0 24.20 0.4060 0.0027N07 9 0.8395 215746.0 23.54 1.0222 0.0030N07 10 0.8367 230031.5 23.49 0.7217 0.0032N07 11 0.8327 235837.0 23.02 0.4267 0.0034N07 12 0.8313 245163.5 23.35 0.4789 0.0036N07 13 0.8259 251957.9 22.57 0.4934 0.0038N07 14 0.8218 258732.4 22.89 0.2707 0.0041N07 15 0.8231 266843.5 23.24 0.4738 0.0044N07 16 0.8190 275302.2 23.55 0.5182 0.0046N07 17 0.8190 279092.8 23.70 0.2431 0.0048N07 18 0.8122 287997.1 23.68 0.4611 0.0051N07 19 0.8122 288485.9 24.19 0.1369 0.0053N07 20 0.7980 294401.3 23.07 0.2343 0.0055N07 21 0.7952 295457.9 22.88 DN07 23 0.7884 309024.8 23.43 0.1857 0.0063N07 24 0.7898 313213.0 24.71 0.2781 0.0065N07 25 0.7796 315429.0 23.18 0.1777 0.0067N07 28 0.7755 320248.9 23.49 0.2509 0.0069N07 29 0.7762 326474.2 24.87 0.3671 0.0072N07 32 0.7735 342909.5 25.32 0.8255 0.0074N07 33 0.7728 350816.0 25.13 0.2502 0.0078N07 34 0.8088 375477.0 24.88 0.1378 0.0111N07 35 0.7714 376378.1 25.25 0.0118N07 36 0.7653 385146.8 26.01 0.1851 0.0122N07 37 0.7592 402222.8 26.24 0.3300 0.0127N07 38 0.7585 404370.3 26.70 0.1644 0.0131N08 0 0.7674 0.0 25.00 0.0000N08 1 0.6783 18895.7 25.00 0.2614 0.0006N08 2 0.7663 28914.1 25.00 0.2866 0.0010

Table A-2. (continued).
Code Cycle (atm) (ppm) (Celsius) 100 eV) FlagPressure Hydrogen Temperature (molecules/ Outlier
G-valueWatt @
yr
A-48
N08 3 0.7561 35673.9 25.00 0.1929 0.0013N08 4 0.7483 43701.2 25.00 0.1424 0.0019N08 5 0.7415 46344.7 25.00 0.1265 0.0021N08 6 0.7374 47046.8 24.31 0.0557 0.0022N08 7 0.7320 46933.8 24.45 0.0022 0.0024N08 8 0.7245 53285.2 24.18 0.2156 0.0027N08 9 0.7156 57901.4 23.55 0.1953 0.0029N08 10 0.7122 63058.3 23.43 0.2166 0.0031N08 11 0.7041 65025.3 22.98 0.0989 0.0033N08 12 0.6993 68300.1 23.64 0.1240 0.0036N08 13 0.6898 70710.4 22.56 0.1222 0.0037N08 14 0.6803 73032.0 22.86 0.0585 0.0040N08 15 0.6796 76991.5 23.26 0.1652 0.0043N08 16 0.6762 77967.0 23.50 0.0619 0.0045N08 17 0.6707 82195.9 23.69 0.1339 0.0047N08 18 0.6626 85109.5 23.73 0.1114 0.0049N08 19 0.6612 86717.3 24.15 0.0808 0.0052N08 20 0.6456 87406.9 23.09 -0.0036 0.0054N08 21 0.6490 90455.8 22.88 0.1565 0.0056N08 22 0.6490 88141.1 22.89 -0.0472 0.0058N08 23 0.6456 95504.4 23.36 0.2363 0.0061N08 24 0.6463 98055.0 24.65 0.1124 0.0063N08 25 0.6388 98358.9 23.23 0.0339 0.0065N08 28 0.6429 101567.0 23.52 0.1612 0.0068N08 32 0.6401 105009.5 25.41 0.0646 0.0072N08 33 0.6483 107469.4 25.14 0.0926 0.0076N08 34 0.6667 131526.0 24.90 0.0737 0.0108N08 35 0.7585 122640.2 25.19 0.0114N08 36 0.7476 126214.0 25.94 0.0588 0.0119N08 37 0.7422 125378.1 26.21 -0.0083 0.0124N08 38 0.7422 129908.8 26.68 0.1677 0.0127N09 0 0.7652 0.0 25.00 0.0000N09 1 0.7006 58100.9 25.00 0.7692 0.0007N09 2 0.8206 72219.0 25.00 0.8073 0.0009N09 3 0.6706 98346.0 25.00 0.2486 0.0013N09 4 0.7007 124433.4 25.00 0.5842 0.0018N09 5 0.7075 126859.9 25.00 0.2171 0.0020N09 6 0.7116 138345.1 24.29 0.7378 0.0021N09 7 0.7197 138183.3 24.49 0.1247 0.0024N09 8 0.7259 154212.0 24.17 0.6463 0.0026N09 9 0.7224 178485.4 23.18 1.0818 0.0028

Table A-2. (continued).
Code Cycle (atm) (ppm) (Celsius) 100 eV) FlagPressure Hydrogen Temperature (molecules/ Outlier
G-valueWatt @
yr
A-49
N09 10 0.7327 189757.8 23.41 0.6547 0.0030N09 11 0.7320 190401.5 22.95 0.1470 0.0032N09 12 0.7388 202377.1 23.68 0.6005 0.0035N09 13 0.7354 211679.3 22.53 0.6082 0.0036N09 14 0.7401 219845.6 22.87 0.3653 0.0039N09 15 0.7469 228135.9 23.21 0.5014 0.0042N09 16 0.7490 233661.1 23.49 0.4239 0.0043N09 17 0.7537 245042.8 23.66 0.5309 0.0046N09 18 0.7531 250251.6 23.71 0.3505 0.0048N09 19 0.7571 255239.4 24.15 0.3634 0.0050N09 20 0.7524 255589.8 23.08 0.1087 0.0053N09 21 0.7531 265681.1 22.89 0.5439 0.0055N09 22 0.7517 265143.1 22.82 0.0854 0.0057N09 23 0.7565 276761.4 23.32 0.5756 0.0060N09 24 0.7639 284426.1 24.64 0.5001 0.0062N09 25 0.7558 286119.1 23.27 0.1721 0.0064N09 28 0.7585 291615.8 23.55 0.3785 0.0066N09 32 0.7646 301367.7 25.51 0.3003 0.0070N09 33 0.7701 312556.8 25.18 0.3780 0.0075N09 34 0.8374 347417.0 24.98 0.2120 0.0106N09 35 0.7755 348026.2 25.20 0.0112N09 36 0.7803 352830.9 26.11 0.2117 0.0116N09 37 0.7891 354334.0 26.21 0.1822 0.0121N09 38 0.7918 353024.9 26.65 0.1045 0.0124N10 0 0.7674 0.0 25.00 0.0000N10 1 0.6807 22739.2 25.00 0.3036 0.0006N10 2 0.7632 33431.7 25.00 0.3334 0.0010N10 3 0.7324 41718.3 25.00 0.1777 0.0014N10 4 0.7279 50138.5 25.00 0.1644 0.0018N10 5 0.7211 54538.4 25.00 0.1964 0.0020N10 6 0.7204 55030.9 24.26 0.0627 0.0022N10 7 0.7170 55743.1 24.51 0.0442 0.0024N10 8 0.7109 62574.6 24.13 0.2329 0.0027N10 9 0.7020 69818.0 23.28 0.2948 0.0029N10 10 0.7020 74516.3 23.41 0.2163 0.0031N10 11 0.6946 75808.5 22.95 0.0693 0.0033N10 12 0.6905 78782.8 23.58 0.1159 0.0035N10 13 0.6823 82251.7 22.57 0.1797 0.0037N10 14 0.6660 86753.3 22.87 0.0931 0.0040N10 15 0.6755 90911.9 23.22 0.2236 0.0042N10 16 0.6735 91323.0 23.49 0.0476 0.0044

Table A-2. (continued).
Code Cycle (atm) (ppm) (Celsius) 100 eV) FlagPressure Hydrogen Temperature (molecules/ Outlier
G-valueWatt @
yr
A-50
N10 17 0.6531 96465.3 23.42 0.0978 0.0047N10 18 0.6551 99431.2 23.71 0.1707 0.0049N10 19 0.6605 99798.7 24.16 0.0765 0.0051N10 20 0.6537 101588.3 23.03 0.0842 0.0054N10 21 0.6565 105765.0 22.89 0.2026 0.0056N10 22 0.6612 99648.7 22.82 -0.1549 0.0058N10 23 0.6592 106953.5 23.29 0.2491 0.0061N10 24 0.6626 111104.0 24.63 0.1896 0.0063N10 25 0.6565 111822.2 23.27 0.0681 0.0065N10 28 0.6667 112920.0 23.59 0.1364 0.0067N10 32 0.6660 117414.0 25.50 0.0946 0.0071N10 33 0.6789 119585.2 25.22 0.1122 0.0076N10 34 0.7061 139930.0 24.95 0.0732 0.0107N10 35 0.7592 134558.0 25.17 0.0113N10 36 0.7476 141515.0 25.91 0.1220 0.0118N10 37 0.7422 146908.6 26.16 0.1093 0.0123N10 38 0.7422 146138.2 26.67 0.0180 0.0126N11 0 0.7653 0.0 25.00 0.0000N11 1 0.7026 58125.5 25.00 0.7177 0.0007N11 2 0.8176 75060.0 25.00 0.8069 0.0010N11 3 0.8271 105118.0 25.00 0.8514 0.0014N11 4 0.8367 127172.0 25.00 0.5061 0.0019N11 5 0.8299 138188.0 25.00 0.5431 0.0021N11 6 0.8272 143421.0 24.25 0.3844 0.0023N11 7 0.8299 140904.0 24.56 -0.0279 0.0025N11 8 0.8306 155635.0 24.15 0.6075 0.0027N11 9 0.8279 172687.0 23.34 0.8380 0.0030N11 10 0.8265 184398.3 23.39 0.5901 0.0032N11 11 0.8231 182336.1 22.93 -0.0249 0.0034N11 12 0.8286 197961.1 23.56 0.7559 0.0036N11 13 0.8218 201763.6 22.54 0.2825 0.0038N11 14 0.8218 207631.3 22.86 0.2576 0.0041N11 15 0.8245 217207.7 23.23 0.5105 0.0044N11 16 0.8218 225905.8 23.49 0.5247 0.0046N11 17 0.8245 231145.5 23.47 0.2962 0.0049N11 18 0.8204 236299.4 23.73 0.3053 0.0051N11 19 0.8224 240643.2 24.15 0.3051 0.0053N11 20 0.8136 243617.3 23.02 0.1758 0.0055N11 21 0.8095 249122.5 22.89 0.2919 0.0058N11 22 0.8007 246140.0 22.80 -0.1211 0.0060N11 23 0.8034 263538.2 23.35 0.7416 0.0063

Table A-2. (continued).
Code Cycle (atm) (ppm) (Celsius) 100 eV) FlagPressure Hydrogen Temperature (molecules/ Outlier
G-valueWatt @
yr
A-51
N11 24 0.8082 265299.7 24.62 0.2080 0.0065N11 25 0.7952 269863.6 23.33 0.2400 0.0067N11 28 0.7925 271719.1 23.66 0.1436 0.0069N11 29 0.7966 277425.6 24.74 0.3897 0.0072N11 32 0.7980 284403.3 25.42 0.4441 0.0074N11 33 0.7966 287612.3 25.23 0.1308 0.0078N11 34 0.8721 342691.0 24.96 0.2701 0.0111N11 35 0.7762 351244.0 25.18 0.0118N11 36 0.7898 351814.5 25.76 0.1976 0.0122N11 37 0.7925 357712.0 26.16 0.2003 0.0127N11 38 0.7932 355902.5 26.68 0.0555 0.0131N12 0 0.7629 0.0 25.00 0.0000N12 1 0.7037 37734.6 25.00 0.6175 0.0005N12 2 0.8058 54590.0 25.00 0.6417 0.0009N12 3 0.8060 75289.0 25.00 0.7182 0.0012N12 4 0.8027 96059.0 25.00 0.5456 0.0015N12 5 0.8027 104818.0 25.00 0.5840 0.0017N12 6 0.7952 109095.0 24.37 0.3211 0.0018N12 7 0.8007 108498.0 24.60 0.0786 0.0020N12 8 0.8007 126721.0 24.13 0.8912 0.0022N12 9 0.7980 137932.0 23.30 0.6997 0.0024N12 10 0.7980 152272.3 23.39 0.8724 0.0026N12 11 0.7946 155119.6 22.94 0.2777 0.0027N12 12 0.8000 167170.5 23.53 0.7417 0.0029N12 13 0.7939 174460.9 22.59 0.5830 0.0030N12 14 0.7905 182507.4 22.73 0.3649 0.0033N12 15 0.7980 192638.6 23.23 0.7170 0.0035N12 16 0.7973 199508.7 23.47 0.5597 0.0036N12 17 0.8000 206679.8 23.46 0.4390 0.0039N12 18 0.7959 213804.8 23.71 0.4911 0.0040N12 19 0.8007 211095.5 24.12 0.0356 0.0042N12 20 0.7946 223957.9 23.01 0.7970 0.0044N12 21 0.7932 233925.0 22.88 0.6316 0.0046N12 22 0.7864 231902.0 22.78 -0.0707 0.0047N12 23 0.7918 240001.0 23.33 0.5445 0.0050N12 24 0.7973 246417.3 24.55 0.5028 0.0051N12 25 0.7891 251903.4 23.38 0.4651 0.0053N12 28 0.7884 259968.5 23.71 0.5227 0.0055N12 29 0.7918 261471.2 24.69 0.2562 0.0057N12 32 0.7946 268846.8 25.34 0.6114 0.0058N12 33 0.7959 277754.0 25.23 0.3458 0.0062

Table A-2. (continued).
Code Cycle (atm) (ppm) (Celsius) 100 eV) FlagPressure Hydrogen Temperature (molecules/ Outlier
G-valueWatt @
yr
A-52
N12 34 0.8878 333361.0 24.93 0.3725 0.0087N12 35 0.7762 340828.9 25.14 0.0092N12 36 0.7912 333982.4 25.58 0.0748 0.0096N12 37 0.7946 351360.8 26.12 0.5387 0.0100N12 38 0.8054 349852.5 26.68 0.2524 0.0102N13 0 0.7655 0.0 25.00 0.0000N13 1 0.7214 77682.4 25.00 0.5851 0.0007N13 2 0.8514 96644.0 25.00 0.6256 0.0010N13 3 0.8705 123373.0 25.00 0.5139 0.0014N13 4 0.8707 147493.0 25.00 0.3398 0.0019N13 5 0.8776 156438.0 25.00 0.3856 0.0021N13 6 0.8728 159684.0 24.36 0.1972 0.0023N13 7 0.8789 163715.0 24.61 0.2490 0.0025N13 8 0.8891 175713.0 24.10 0.4009 0.0027N13 9 0.8966 191823.0 23.28 0.6170 0.0030N13 10 0.8980 201311.6 23.37 0.3822 0.0032N13 11 0.9034 201727.7 22.92 0.2010 0.0034N13 12 0.9197 212956.3 23.54 0.4917 0.0036N13 13 0.9204 219105.7 22.55 0.4088 0.0038N13 14 0.9306 227324.9 22.79 0.3141 0.0041N13 15 0.9395 234437.4 23.23 0.3785 0.0043N13 16 0.9374 240921.8 23.49 0.3565 0.0045N13 17 0.9531 239454.3 23.41 0.1685 0.0048N13 18 0.9476 250751.1 23.70 0.4674 0.0050N13 19 0.9578 248907.3 24.10 0.1520 0.0053N13 20 0.9517 259936.9 23.04 0.4602 0.0055N13 21 0.9449 264526.2 22.85 0.2234 0.0057N13 22 0.9163 266614.7 22.94 -0.0309 0.0060N13 23 0.9272 271710.8 23.34 0.3218 0.0062N13 24 0.9313 275838.0 24.51 0.2607 0.0065N13 25 0.9218 279080.4 23.41 0.2503 0.0066N13 26 0.8912 281200.3 22.90 -0.0561 0.0068N13 27 0.7612 28181.8 22.20 0.0068N13 28 0.7531 33321.8 23.75 0.4168 0.0069N13 32 0.7354 57910.4 25.28 0.2901 0.0073N13 33 0.7524 78272.4 25.28 0.2748 0.0078N13 34 0.9755 173345.0 24.96 0.2470 0.0110N13 35 0.7932 187962.4 25.14 0.0117N13 36 0.8259 198879.4 25.59 0.2703 0.0122N13 37 0.8517 209258.6 26.15 0.2392 0.0127N13 38 0.8680 216894.1 26.69 0.2919 0.0130

Table A-2. (continued).
Code Cycle (atm) (ppm) (Celsius) 100 eV) FlagPressure Hydrogen Temperature (molecules/ Outlier
G-valueWatt @
yr
A-53
N14 0 0.7650 0.0 25.00 0.0000N14 1 0.6993 55118.9 25.00 0.5098 0.0006N14 2 0.8073 80532.0 25.00 0.5873 0.0009N14 3 0.8113 99555.0 25.00 0.4247 0.0012N14 4 0.8095 122603.0 25.00 0.3824 0.0016N14 5 0.8095 131224.0 25.00 0.3922 0.0017N14 6 0.8041 136045.0 24.38 0.2768 0.0019N14 7 0.8034 142485.0 24.59 0.3241 0.0020N14 8 0.8041 152584.0 24.07 0.3595 0.0022N14 9 0.8020 168011.0 23.22 0.6160 0.0024N14 10 0.8020 177034.4 23.36 0.4017 0.0026N14 11 0.7973 180070.6 22.89 0.2245 0.0027N14 12 0.8034 191722.9 23.54 0.4946 0.0029N14 13 0.7986 195467.0 22.57 0.2857 0.0031N14 14 0.8027 204792.2 22.74 0.3353 0.0033N14 15 0.8068 209775.8 23.35 0.3024 0.0035N14 16 0.8054 215842.1 23.43 0.3736 0.0037N14 17 0.8122 219796.9 23.44 0.2592 0.0039N14 18 0.8102 223253.8 23.66 0.2508 0.0040N14 19 0.8150 227300.5 24.05 0.2984 0.0042N14 20 0.8102 229652.5 23.09 0.2044 0.0044N14 21 0.8068 225232.2 22.86 -0.0271 0.0046N14 22 0.8007 232606.4 22.96 0.3226 0.0048N14 23 0.8061 238540.1 23.34 0.3261 0.0050N14 24 0.8102 236023.4 24.46 0.0715 0.0052N14 25 0.8034 239703.7 23.38 0.2970 0.0053N14 26 0.7891 242887.3 22.20 0.1839 0.0054N14 27 0.7605 12885.6 22.60 0.0055N14 28 0.7571 15967.9 23.82 0.3649 0.0055N14 32 0.7483 35244.1 25.25 0.3051 0.0058N14 33 0.7524 52458.5 25.25 0.2835 0.0062N14 34 0.8694 129136.0 25.00 0.2118 0.0087N14 35 0.7891 136746.7 25.24 0.0092N14 36 0.8054 145382.0 25.55 0.2221 0.0096N14 37 0.8109 153728.9 26.10 0.1767 0.0100N14 38 0.8252 150853.3 26.74 0.0549 0.0103N15 0 0.7657 0.0 25.00 0.0000N15 1 0.7025 58664.4 25.00 0.4394 0.0007N15 2 0.8209 71423.0 25.00 0.4557 0.0010N15 3 0.8087 91141.0 25.00 0.3253 0.0013N15 4 0.8163 107575.0 25.00 0.2381 0.0018

Table A-2. (continued).
Code Cycle (atm) (ppm) (Celsius) 100 eV) FlagPressure Hydrogen Temperature (molecules/ Outlier
G-valueWatt @
yr
A-54
N15 5 0.8163 118711.0 25.00 0.3834 0.0020N15 6 0.8122 120712.0 24.37 0.1322 0.0022N15 7 0.8136 129540.0 24.59 0.3372 0.0024N15 8 0.8150 134812.0 24.08 0.1821 0.0026N15 9 0.8150 148186.0 23.22 0.4479 0.0028N15 10 0.8150 156844.2 23.35 0.3092 0.0031N15 11 0.8156 161954.8 22.97 0.2773 0.0032N15 12 0.8245 165126.3 23.47 0.1966 0.0035N15 13 0.8238 173625.5 22.58 0.4147 0.0036N15 14 0.8293 177214.7 22.63 0.1605 0.0039N15 15 0.8374 186849.0 23.28 0.3824 0.0042N15 16 0.8354 193475.1 23.44 0.3125 0.0043N15 17 0.8442 199386.4 23.41 0.2570 0.0046N15 18 0.8354 202421.3 23.63 0.1396 0.0048N15 19 0.8313 206780.7 23.81 0.1856 0.0051N15 20 0.8401 209472.6 23.14 0.2644 0.0053N15 21 0.8374 216854.7 22.80 0.2881 0.0055N15 22 0.8245 220359.9 22.94 0.1142 0.0057N15 23 0.8306 222677.5 23.33 0.1832 0.0060N15 24 0.8333 226264.1 24.45 0.2002 0.0062N15 25 0.8259 232806.8 23.34 0.3388 0.0064N15 26 0.8088 235652.7 22.60 0.1031 0.0066N15 27 0.7619 29253.1 22.20 0.0066N15 28 0.7578 32453.7 23.88 0.3434 0.0066N15 32 0.7408 49297.4 25.22 0.2084 0.0070N15 33 0.7463 64097.1 25.31 0.2010 0.0075N15 34 0.8925 140414.0 25.02 0.1814 0.0106N15 35 0.7912 152183.6 25.20 0.0112N15 36 0.8088 162180.5 25.56 0.2078 0.0117N15 37 0.8245 172044.6 26.14 0.1921 0.0121N15 38 0.8320 177663.6 26.78 0.1944 0.0124N16 0 0.7669 0.0 25.00 0.0000N16 1 0.6718 37989.3 25.00 0.4999 0.0006N16 2 0.7027 57261.5 25.00 0.5373 0.0010N16 3 0.6995 71190.6 25.00 0.4301 0.0013N16 4 0.7211 85165.2 25.00 0.3946 0.0017N16 5 0.6476 91156.0 25.00 -0.1328 0.0018N16 6 0.6476 96067.7 24.36 0.3497 0.0020N16 7 0.6558 97094.6 24.63 0.1642 0.0021N16 9 0.6517 120040.7 23.20 0.5025 0.0025N16 10 0.6585 131879.2 23.34 0.6697 0.0027

Table A-2. (continued).
Code Cycle (atm) (ppm) (Celsius) 100 eV) FlagPressure Hydrogen Temperature (molecules/ Outlier
G-valueWatt @
yr
A-55
N16 11 0.6571 136898.2 22.92 0.3617 0.0028N16 12 0.6605 142250.6 23.47 0.3190 0.0030N16 13 0.6565 148845.5 22.63 0.4516 0.0032N16 14 0.6592 158028.5 22.47 0.3859 0.0034N16 15 0.6673 163901.6 23.26 0.4234 0.0036N16 16 0.6639 168961.7 23.42 0.3268 0.0038N16 17 0.6653 176653.3 23.42 0.3688 0.0040N16 19 0.6660 186894.0 23.79 0.2894 0.0043N16 20 0.6619 191765.5 23.13 0.2988 0.0045N16 21 0.7333 197605.2 22.78 DN16 22 0.7361 201274.8 22.90 0.0049N16 23 0.7361 210055.0 23.34 0.4731 0.0051N16 24 0.7401 212900.4 24.38 0.2737 0.0053N16 25 0.7333 217602.1 23.34 0.3866 0.0054N16 28 0.7395 220634.5 23.89 0.3303 0.0056N16 32 0.7306 55349.5 25.19 0.0059N16 33 0.7048 68094.1 25.34 0.2857 0.0063N16 34 0.7639 125933.0 25.17 0.2411 0.0088N16 35 0.7680 137149.4 25.25 0.0094N16 36 0.7755 144129.2 25.54 0.2574 0.0097N16 37 0.7755 150527.4 26.14 0.1895 0.0101N16 38 0.7755 149918.8 26.71 0.0289 0.0104
Code = Cylinder identifier (Hxx and HAxx are heated for cycles >4)Cycle = Sampling cycle for each particular barrelatm = Pressure in atmospheresppm = Concentration in parts per millionG-value = Calculated G-value (molecules/100 eV)Watt @ yr= Dose expressed as multiple of dose rate in watts by time in years
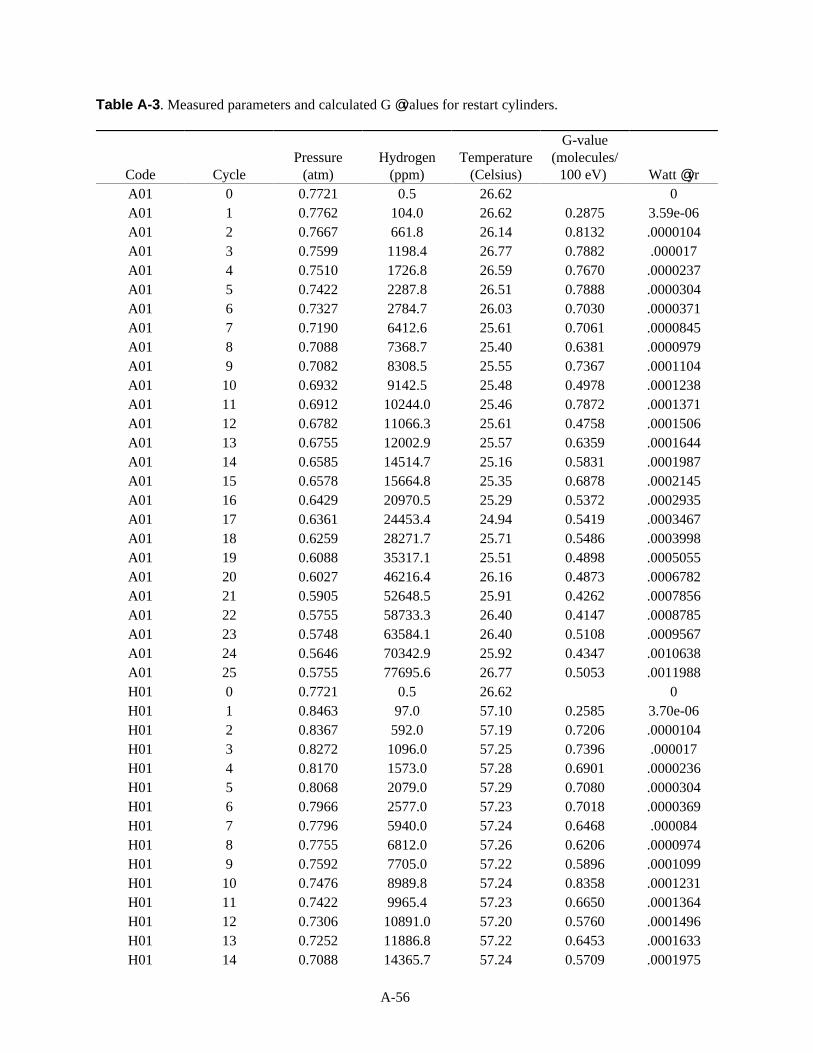
A-56
Table A-3. Measured parameters and calculated G @ values for restart cylinders.
Code Cycle (atm) (ppm) (Celsius) 100 eV) Watt @ yrPressure Hydrogen Temperature (molecules/
G-value
A01 0 0.7721 0.5 26.62 0A01 1 0.7762 104.0 26.62 0.2875 3.59e-06A01 2 0.7667 661.8 26.14 0.8132 .0000104A01 3 0.7599 1198.4 26.77 0.7882 .000017A01 4 0.7510 1726.8 26.59 0.7670 .0000237A01 5 0.7422 2287.8 26.51 0.7888 .0000304A01 6 0.7327 2784.7 26.03 0.7030 .0000371A01 7 0.7190 6412.6 25.61 0.7061 .0000845A01 8 0.7088 7368.7 25.40 0.6381 .0000979A01 9 0.7082 8308.5 25.55 0.7367 .0001104A01 10 0.6932 9142.5 25.48 0.4978 .0001238A01 11 0.6912 10244.0 25.46 0.7872 .0001371A01 12 0.6782 11066.3 25.61 0.4758 .0001506A01 13 0.6755 12002.9 25.57 0.6359 .0001644A01 14 0.6585 14514.7 25.16 0.5831 .0001987A01 15 0.6578 15664.8 25.35 0.6878 .0002145A01 16 0.6429 20970.5 25.29 0.5372 .0002935A01 17 0.6361 24453.4 24.94 0.5419 .0003467A01 18 0.6259 28271.7 25.71 0.5486 .0003998A01 19 0.6088 35317.1 25.51 0.4898 .0005055A01 20 0.6027 46216.4 26.16 0.4873 .0006782A01 21 0.5905 52648.5 25.91 0.4262 .0007856A01 22 0.5755 58733.3 26.40 0.4147 .0008785A01 23 0.5748 63584.1 26.40 0.5108 .0009567A01 24 0.5646 70342.9 25.92 0.4347 .0010638A01 25 0.5755 77695.6 26.77 0.5053 .0011988H01 0 0.7721 0.5 26.62 0H01 1 0.8463 97.0 57.10 0.2585 3.70e-06H01 2 0.8367 592.0 57.19 0.7206 .0000104H01 3 0.8272 1096.0 57.25 0.7396 .000017H01 4 0.8170 1573.0 57.28 0.6901 .0000236H01 5 0.8068 2079.0 57.29 0.7080 .0000304H01 6 0.7966 2577.0 57.23 0.7018 .0000369H01 7 0.7796 5940.0 57.24 0.6468 .000084H01 8 0.7755 6812.0 57.26 0.6206 .0000974H01 9 0.7592 7705.0 57.22 0.5896 .0001099H01 10 0.7476 8989.8 57.24 0.8358 .0001231H01 11 0.7422 9965.4 57.23 0.6650 .0001364H01 12 0.7306 10891.0 57.20 0.5760 .0001496H01 13 0.7252 11886.8 57.22 0.6453 .0001633H01 14 0.7088 14365.7 57.24 0.5709 .0001975

Table A-3. (continued).
Code Cycle (atm) (ppm) (Celsius) 100 eV) Watt @ yrPressure Hydrogen Temperature (molecules/
G-value
A-57
H01 15 0.7088 15546.2 57.23 0.7226 .0002131H01 16 0.6918 21097.8 57.27 0.5520 .0002917H01 17 0.6789 24896.9 57.25 0.5499 .0003444H01 18 0.6755 28803.4 57.19 0.6114 .0003972H01 19 0.6585 36059.4 57.20 0.5054 .000502H01 20 0.6469 47989.9 57.03 0.5190 .0006735H01 21 0.6422 55355.0 57.26 0.5332 .00078H01 22 0.6367 61125.4 57.01 0.4864 .0008722H01 23 0.6265 63280.4 57.11 0.1785 .0009501H01 24 0.6252 70157.0 57.12 0.5173 .0010563H01 25 0.6252 79311.1 57.21 0.5030 .0012015
HA01 0 0.7721 0.5 26.62 0HA01 1 0.8354 101.0 56.73 0.2627 3.74e-06HA01 2 0.8245 585.0 56.79 0.7098 .0000103HA01 3 0.8136 1162.0 55.90 0.8550 .0000168HA01 4 0.8027 1549.0 55.52 0.5649 .0000232HA01 5 0.7946 2038.0 56.10 0.6791 .0000299HA01 6 0.7837 2503.0 56.03 0.6577 .0000364HA01 7 0.7735 5763.0 56.14 0.6434 .0000823HA01 8 0.7585 6941.8 56.09 0.7753 .0000954HA01 9 0.7456 7777.4 56.20 0.5696 .0001076HA01 10 0.7422 8761.1 56.11 0.7052 .0001205HA01 11 0.7293 9735.5 56.22 0.6067 .0001336HA01 12 0.7245 10523.5 56.42 0.5430 .0001466HA01 13 0.7102 11540.3 56.41 0.5783 .00016HA01 14 0.7088 13734.0 56.75 0.5735 .0001933HA01 15 0.6932 15172.3 56.80 0.6858 .0002087HA01 16 0.6830 20566.4 56.68 0.5584 .0002854HA01 17 0.6755 24154.5 56.98 0.5494 .0003371HA01 18 0.6667 28096.3 56.77 0.5937 .0003887HA01 19 0.6551 35128.6 56.57 0.5163 .0004913HA01 20 0.6415 47193.8 56.65 0.5261 .000659HA01 21 0.6252 54579.1 56.41 0.4768 .0007631HA01 22 0.6238 59943.4 56.54 0.4763 .0008535HA01 23 0.6156 63477.9 56.43 0.3318 .0009295HA01 24 0.6102 70000.3 56.48 0.4629 .0010334HA01 25 0.6102 74024.1 56.49 0.2199 .0011917N01 0 0.7721 0.5 26.62 0N01 1 0.7762 124.0 26.62 0.3236 3.81e-06N01 2 0.7660 681.7 26.05 0.8214 .0000105N01 3 0.7599 1223.5 26.76 0.8053 .0000171

Table A-3. (continued).
Code Cycle (atm) (ppm) (Celsius) 100 eV) Watt @ yrPressure Hydrogen Temperature (molecules/
G-value
A-58
N01 4 0.7510 1741.4 26.72 0.7584 .0000237N01 5 0.7422 2282.4 26.31 0.7570 .0000305N01 6 0.7327 2805.5 26.03 0.7454 .0000371N01 7 0.7197 6358.1 25.49 0.7025 .0000839N01 8 0.7088 7334.3 25.40 0.6520 .0000972N01 9 0.7088 8264.0 25.60 0.7328 .0001097N01 10 0.6946 9224.2 25.46 0.6011 .0001228N01 11 0.6918 10154.0 25.52 0.6642 .0001361N01 12 0.6776 11073.7 25.55 0.5328 .0001494N01 13 0.6755 11981.9 25.72 0.6246 .0001631N01 14 0.6633 14516.3 25.15 0.6225 .000197N01 15 0.6585 15395.8 25.35 0.4975 .0002126N01 16 0.6449 20817.0 25.22 0.5613 .0002909N01 17 0.6415 24578.3 24.95 0.6122 .0003435N01 18 0.6299 28379.4 25.75 0.5462 .0003961N01 19 0.6163 35499.4 25.69 0.5174 .0005006N01 20 0.6082 46238.0 26.04 0.4863 .0006715N01 21 0.5918 53167.8 26.05 0.4411 .0007777N01 22 0.5864 59664.5 26.41 0.5326 .0008698N01 23 0.5755 64601.0 26.38 0.4249 .0009472N01 24 0.5755 70539.4 25.97 0.4692 .0010531N01 25 0.5755 73682.5 26.44 0.1786 .0012091
Code = Cylinder identifier (Hxx and HAxx are heated for cycles >4)Cycle = Sampling cycle for each particular barrelatm = Pressure in atmospheresppm = Concentration in parts per millionG-value = Calculated G-value (molecules/100eV)Watt @ yr = Dose expressed as multiple of dose rate in watts by time in years

A-59
A.3 G-value Effects Analysis
For G-value data analysis, data from original test cylinders were selected that exhibited a zero slope overtime for different experimental conditions. Regression analyses and testing of the slope coefficient at the 0.05significance level were performed iteratively for different initial cycle numbers used for the data selection.The iterations and analyses were performed for each experimental condition (e.g., unheated cylinders withpolyethylene and Pu). Table A-4 presents the selected initial cycle numbers and corresponding Watt @ yr239
Table A-5 summarizes regression analysis results.
The data exhibiting a zero slope over time have different initial original cylinder cycle numbers,depending on experimental condition. The lowest initial cycle numbers associated with the zero slopes arefor cement and PVC matrices; these range from 3 to 6 and correspond to Watt @ yr from 0.0009 to 0.002. Thehighest cycle numbers associated with zero slopes are typically PE and include some wet and dry cellulosedata sets; the highest associated Watt @ yr observed is 0.006.
The effects analysis of MDP experimental results was performed with an ANOVA for cylinders withmatrices other than PVC. At the five percent significance level, the analysis showed that matrix has asignificant effect on G-value. In addition, two-way interactions involving matrix are also significant. Heatingand isotope did not have significant effects. Table A-6 provides analysis results.
For cylinders containing PVC, the effects of isotope and heating are confounded because of restrictionson original design. Therefore, data for these cylinders were tested in two sets against all other matrices withthe corresponding characteristics. G-values for PVC were found to be significantly lower than those for othermatrices at the five percent level using a Student’s t test.
Because matrix is the only significant main effect, data were combined over isotope and heatingconditions to generate statistics by matrix. Ninety-five percent upper confidence limits (UCL ) and95
associated statistics for the mean G-value for each matrix tested are given in A-7. The UCL s range from95
0.48 molecule per 100 eV for wet cellulose, to 0.17 molecule per 100 eV for PVC.

A-60
Table A-4. Initial cycle numbers and corresponding Watt @ yr for experimental conditions.
Experimental condition Initial cycle number Watt @ yr
Heated cylinders with cement and Pu 6 .002238
Heated cylinders with cement and Pu 6 .002239
Heated cylinders with dry cellulose and Pu 12 .004238
Heated cylinders with dry cellulose and Pu 30 .006239
Heated cylinders with PE and Pu 19 .005238
Heated cylinders with PE and Pu 18 .004239
Heated cylinders with PVC and Pu 6 .002239
Heated cylinders with wet cellulose and Pu 6 .002238
Heated cylinders with wet cellulose and Pu 6 .002239
Unheated cylinders with cement and Pu 4 .002238
Unheated cylinders with cement and Pu 3 .001239
Unheated cylinders with dry cellulose and Pu 10 .003238
Unheated cylinders with dry cellulose and Pu 4 .002239
Unheated cylinders with PE and Pu 17 .005238
Unheated cylinders with PE and Pu 32 .006239
Unheated cylinders with PVC and Pu 4 .002238
Unheated cylinders with wet cellulose and Pu 19 .005238
Unheated cylinders with wet cellulose and Pu 12 .003239

A-61
Table A-5. Regression analysis results for selected data.
Experimental Number of Independent Standard 95% Confidencecondition observation variable Coefficient error P>|t| intervalt
Heated cylinders 44 time .0000631 .000307 0.205 0.838 -.0005566 .0006827with cement and cons .2389554 .1048567 2.279 0.028 .027346 .4505648
Pu238
Heated cylinders 38 time -.0001555 .0001337 -1.163 0.253 -.0004267 .0001157with cement and cons .3178316 .0451775 7.035 0.000 .2262074 .4094559
Pu239
Heated cylinders 76 time -.0002544 .0001292 -1.969 0.053 -.0005118 3.00e-06with dry cellulose cons .4073895 .0582511 6.994 0.000 .2913218 .5234573and Pu-238
Heated cylinders 21 time -.0001322 .000088 -1.502 0.149 -.0003164 .000052with dry cellulose cons .2526285 .0595368 4.243 0.000 .1280164 .3772405and Pu-239
Heated cylinders 67 time -.0003055 .0001909 -1.600 0.114 -.0006867 .0000757with PE and cons .3404505 .099344 3.427 0.001 .1420469 .5388542Pu-238
Heated cylinders 43 time -.0003238 .0001634 -1.981 0.054 -.0006538 6.27e-06with PE and cons .3898543 .0829314 4.701 0.000 .2223709 .5573377Pu-239
Heated cylinders 41 time -.0003711 .0003025 -1.227 0.227 -.0009829 .0002408with PVC and cons .2800059 .1016631 2.754 0.009 .074373 .4856389Pu-239
Heated cylinders 72 time -.0001276 .0002699 -0.473 0.638 -.0006658 .0004106with wet cellulose cons .4874099 .0970356 5.023 0.000 .2938786 .6809412and Pu-238
Heated cylinders 83 time -.0001271 .0002821 -0.450 0.654 -.0006884 .0004342with wet cellulose cons .5689011 .108461 5.245 0.000 .3530978 .7847044and Pu-239
Unheated 61 time -.0000236 .0000564 -0.418 0.677 -.0001364 .0000892cylinders with cons .2096381 .020818 10.07 0.000 .1679814 .2512948cement and Pu 0238
Unheated 59 time -.0001173 .0000749 -1.567 0.123 -.0002673 .0000326cylinders with cons .3094579 .0242508 12.76 0.000 .2608965 .3580192cement and Pu 1239
Unheated 88 time -.0001938 .0001034 -1.874 0.064 -.0003995 .0000118cylinders with dry cons .3908673 .0441134 8.861 0.000 .3031727 .4785619cellulose and
Pu238
Unheated 117 time -.0001341 .0000827 -1.621 0.108 -.000298 .0000297cylinders with dry cons .2753201 .0304485 9.042 0.000 .2150074 .3356328cellulose and
Pu239
Unheated 60 time -.0003278 .0001707 -1.921 0.060 -.0006694 .0000138cylinders with PE cons .4186594 .0848914 4.932 0.000 .2487309 .588588and Pu238
Unheated 16 time -.0002572 .000159 -1.618 0.128 -.0005982 .0000838cylinders with PE cons .4049732 .1089378 3.717 0.002 .1713249 .6386216and Pu239

Table A-5. (continued).
Experimental Number of Independent Standard 95% Confidencecondition observation variable Coefficient error P>|t| intervalt
A-62
Unheated 58 time -.0001083 .0000557 -1.945 0.057 -.00022 3.27e-06cylinders with cons .1507466 .0216038 6.978 0.000 .1074689 .1940243PVC and Pu238
Unheated 41 time -.0002893 .0001594 -1.815 0.077 -.0006117 .0000331cylinders with wet cons .4064097 .0817387 4.972 0.000 .2410776 .5717419cellulose and
Pu238
Unheated 80 time -.0003532 .0001849 -1.911 0.060 -.0007212 .0000148cylinders with wet cons .5879962 .0785679 7.484 0.000 .4315796 .7444129cellulose and
Pu239

A-63
Table A-6. ANOVA results.
Source Partial SS freedom MS (variance ratio) Prob>FDegrees of F
Model 10.1723188 12 .847693237 13.82 0.0000iso2 .10818072 1 .10818072 1.76 0.1844condit2 .025149739 1 .025149739 0.41 0.5221matrix2 5.50409022 3 1.83469674 29.92 0.0000iso2 @ condit2 .115618597 1 .115618597 1.89 0.1701iso2 @ matrix2 1.75542469 3 .585141565 9.54 0.0000condit2 @ matrix2 1.13817422 3 .379391405 6.19 0.0004Residual 58.4449896 953 .061327376Total 68.6173084 965 .071106019
Number of observations = 966R = Multiple correlation coefficientR-squared = 0.1482Root MSE = .247644Adjusted R-squared = 0.1375

A-64
A.4 G-value Plots
Figures A-1 through A-9 show plots of G-values calculated from data from unheated original testcylinders versus Watt @ yr since loading. Figures A-10 through A-18 show plots of data from heated originaltest cylinders ver time since loading. Figure A-19 shows plots of the four restart test cylinders. All plotsexclude outliers and cylinders with no recent acceptable data.
A.5 Quality Control Data
A.5.1 Gas Chromatograph Quality Control
To ensure the accuracy of the analytical data for hydrogen gas throughout the matrix depletionexperiment, four samples of reference standard hydrogen gas were analyzed before each sampling run. Therewere four cylinders of reference gas, each one being assigned an identification number based on theexperimental group to which it belonged. The four reference gas cylinders were identified as follows:
A01: AgitatedH01: HeatedHA01:Heated and agitatedN01: Neither
The quality assurance objective (QAO) for these quality control (QC) samples is based on the percentrecovery (%R) as compared to the known concentration of 5050 ppm. For the analytical data for the QCsamples and experimental samples within a sampling run to be acceptable, the %R must be within " 10%.The experiment was set up such that a sampling run would be performed only if the QC samples met theestablished QAO. This inherent QC check prevented sampling runs of questionable quality from occurring.
All data points for the reference gases are within the QAO of 90-110 %R. The %R ranges from a lowof 90.91% to a high of 106.38%, with a mean of 96%. The QC hydrogen data have a mean of 4861 ppm anda standard deviation of 160 ppm, indicating a measurement error of only 3.3%. These numbers demonstratethat the experimental samples were analyzed under quality conditions. Therefore, the resulting analytical datacan be applied with high confidence for accuracy.
Blank samples were run after each experimental or QC sample to ensure there was no residue of sampleremaining in the GC column. Continuation of the sampling run after the blank analysis indicated that theblank sample met the QAO of < 3 x MDLs for the target gases. This demonstrates that the analytical resultsfor the experimental samples were not artificially high; thus providing high confidence for accuracy.
Each experimental or QC sample was analyzed in triplicate on the GC. The autosampler drew a specifiedvolume from each cylinder, injecting it in three aliquots into the GC, resulting in three separate analytical runsfor each sample. This provides replicate analytical data for each sample, allowing precision to be measured.Precision for replicate analyses is measured using %RSD. The MDP QAO for %RSD is ± 10%. Each set ofanalytical data met this QAO; therefore, the results from the third aliquot for each sample were recorded.Based on this, the precision of the analytical data can be accepted with high confidence.
A.5.2 Mass Spectrometer Comparability Results
As an additional QC check for comparability, samples were randomly collected and analyzed using a massspectrometer (MS). The samples were analyzed in batches and the calibration of the MS was checked before

A-65
each batch. A batch was analyzed only after the calibration results met all applicable criteria. This ensuresthat the analytical data for the comparative samples are accurate.
The QAO for comparability (i.e., precision) for analytical data from two different instruments is based onthe relative percent difference (RPD) and is ± 25%. Of the 98 samples taken for comparative analysis by theMS, 85 samples (87%) met the RPD QAO. Of the 13 samples that did not meet the QAO, 11 werecontaminated by oxygen in the sample bottle, probably due to a leak in the seal. This is evidenced by theindication of oxygen in the mass spectra for these samples. One of the samples was misidentified as sampleA03, cycle 4. Based on the log book for the MS samples, the correct identification is H03, cycle 4. With thiscorrection, the resulting RPD meets the QAO. The final sample did not meet the QAO due to water vaporin the sample bottle, as evidenced by the mass spectrum. Correction for the water vapor resulted in the RPDmeeting the QAO. Therefore, the precision of the analytical data for the MDP can be trusted with confidence.
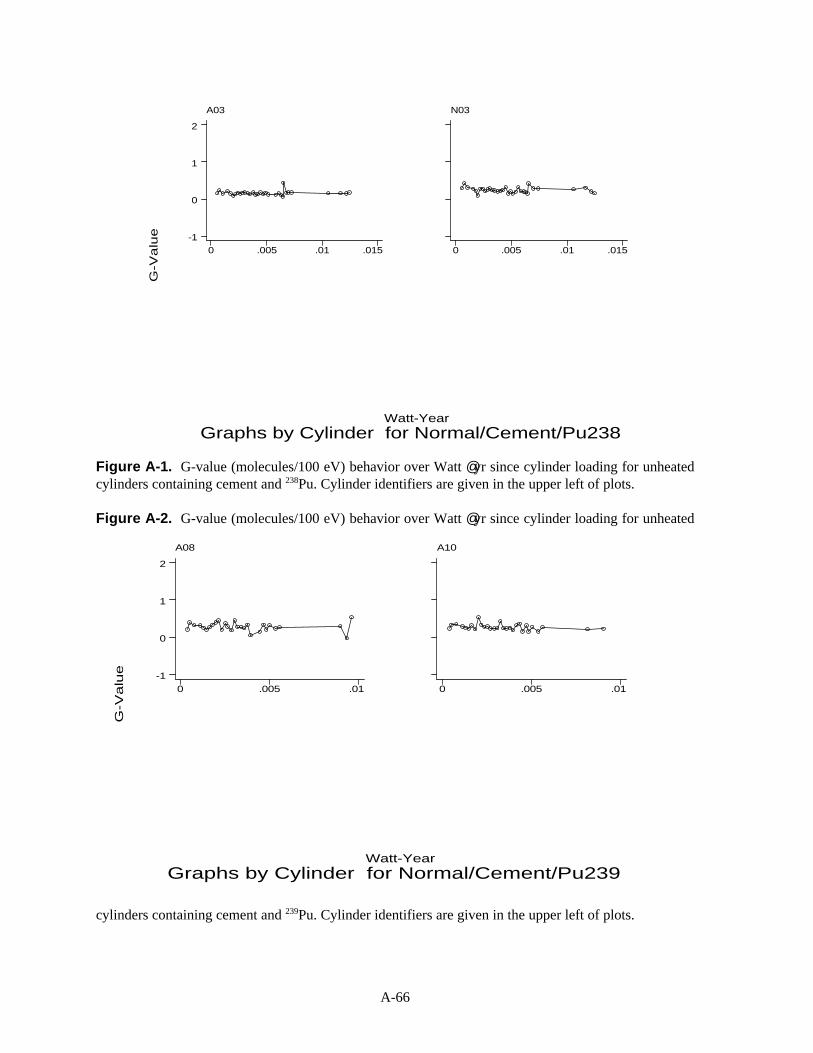
G-V
alu
e
Graphs by Cylinder for Normal/Cement/Pu238Watt-Year
A03
0 .005 .01 .015-1
0
1
2
N03
0 .005 .01 .015
G-V
alu
e
Graphs by Cylinder for Normal/Cement/Pu239Watt-Year
A08
0 .005 .01-1
0
1
2
A10
0 .005 .01
A-66
Figure A-1. G-value (molecules/100 eV) behavior over Watt @ yr since cylinder loading for unheatedcylinders containing cement and Pu. Cylinder identifiers are given in the upper left of plots.238
Figure A-2. G-value (molecules/100 eV) behavior over Watt @ yr since cylinder loading for unheated
cylinders containing cement and Pu. Cylinder identifiers are given in the upper left of plots.239

G-V
alu
e
Graphs by Cylinder for Normal/Dry Cellulose/Pu238Watt-Year
A09
-1
0
1
2
A11
N13
0 .005 .01 .015-1
0
1
2
N15
0 .005 .01 .015
G-V
alu
e
Graphs by Cylinder for Normal/Dry Cellulose/Pu239Watt-Year
A14
-1
0
1
2
N04
0 .005 .01N14
0 .005 .01-1
0
1
2
A-67
Figure A-3. G-value (molecules/100 eV) behavior over Watt @ yr since cylinder loading for unheatedcylinders containing dry cellulose and Pu. Cylinder identifiers are given in the upper left of plots.238
Figure A-4. G-value (molecules/100 eV) behavior over Watt @ yr since cylinder loading for unheatedcylinders containing dry cellulose and Pu. Cylinder identifiers are given in the upper left of plots.239

G-V
alu
e
Graphs by Cylinder for Normal/Polyethylene/Pu238Watt-Year
A13
-1
0
1
2
A15
N05
0 .005 .01 .015-1
0
1
2
N07
0 .005 .01 .015
G-V
alu
e
Graphs by Cylinder for Normal/Polyethylene/Pu239Watt-Year
A02
-1
0
1
2
A16
N02
0 .005 .01-1
0
1
2
N16
0 .005 .01
A-68
Figure A-5. G-value (molecules/100 eV) behavior over Watt @ yr since cylinder loading for unheatedcylinders containing polyethylene and Pu. Cylinder identifiers are given in the upper left of plots.238
Figure A-6. G-value (molecules/100 eV) behavior over Watt @ yr since cylinder loading for unheatedcylinders containing polyethylene and Pu. Cylinder identifiers are given in the upper left of plots.239

G-V
alu
e
Graphs by Cylinder for Normal/PolyvinylChl/Pu238Watt-Year
N08
0 .005 .01 .015-1
0
1
2
N10
0 .005 .01 .015
G-V
alu
e
Graphs by Cylinder for Normal/Wet Cellulose/Pu238Watt-Year
A05
-1
0
1
2
N09
0 .005 .01 .015N11
0 .005 .01 .015-1
0
1
2
A-69
Figure A-7. G-value (molecules/100 eV) behavior over Watt @ yr since cylinder loading for unheatedcylinders containing PVC and Pu. Cylinder identifiers are given in the upper left of plots.238
Figure A-8. G-value (molecules/100 eV) behavior over Watt @ yr since cylinder loading for unheatedcylinders containing wet cellulose and Pu. Cylinder identifiers are given in the upper left of plots.238

G-V
alu
e
Graphs by Cylinder for Normal/Wet Cellulose/Pu239Watt-Year
A06
-1
0
1
2
A12
N06
0 .005 .01-1
0
1
2
N12
0 .005 .01
G-V
alu
e
Graphs by Cylinder for Heated/Cement/Pu238Watt-Year
H03
0 .005 .01 .015
-1
0
1
2
HA03
0 .005 .01 .015
A-70
Figure A-9. G-value (molecules/100 eV) behavior over Watt @ yr since cylinder loading for unheatedcylinders containing wet cellulose and Pu. Cylinder identifiers are given in the upper left of plots.239
Figure A-10. G-value (molecules/100 eV) behavior over Watt @ yr since cylinder loading for heated
cylinders containing cement and Pu. Cylinder identifiers are given in the upper left of plots.238

G-V
alu
e
Graphs by Cylinder for Heated/Cement/Pu239Watt-Year
H08
0 .005 .01-1
0
1
2
H10
0 .005 .01
G-V
alu
e
Graphs by Cylinder for Heated/Dry Cellulose/Pu238Watt-Year
H13
-1
0
1
2
H15
HA09
0 .005 .01 .015-1
0
1
2
HA11
0 .005 .01 .015
A-71
Figure A-11. G-value (molecules/100 eV) behavior over Watt @ yr since cylinder loading for heatedcylinders containing cement and Pu. Cylinder identifiers are given in the upper left of plots.239
Figure A-12. G-value (molecules/100 eV) behavior over Watt @ yr since cylinder loading for heatedcylinders containing dry cellulose and Pu. Cylinder identifiers are given in the upper left of plots.238

G-V
alu
e
Graphs by Cylinder for Heated/Dry Cellulose/Pu239Watt-Year
H04
-1
0
1
2
H14
HA04
.002 .004 .006 .008 .01-1
0
1
2
HA14
.002 .004 .006 .008 .01
G-V
alu
e
Graphs by Cylinder for Heated/Polyethylene/Pu238Watt-Year
H05
-1
0
1
2
H07 HA02
0 .005 .01 .015HA13
0 .005 .01 .015-1
0
1
2
HA15
0 .005 .01 .015
A-72
Figure A-13. G-value (molecules/100 eV) behavior over Watt @ yr since cylinder loading for heatedcylinders containing dry cellulose and Pu. Cylinder identifiers are given in the upper left of plots.239
Figure A-14. G-value (molecules/100 eV) behavior over Watt @ yr since cylinder loading for heatedcylinders containing polyethylene and Pu. Cylinder identifiers are given in the upper left of plots.238

G-V
alu
e
Graphs by Cylinder for Heated/Polyethylene/Pu239Watt-Year
H02
-1
0
1
2
H16
.002 .004 .006 .008 .01HA16
.002 .004 .006 .008 .01-1
0
1
2
G-V
alu
e
Graphs by Cylinder for Heated/PolyvinylChl/Pu239Watt-Year
HA08
.002 .004 .006 .008 .01-1
0
1
2
HA10
.002 .004 .006 .008 .01
A-73
Figure A-15. G-value (molecules/100 eV) behavior over Watt @ yr since cylinder loading for heatedcylinders containing polyethylene and Pu. Cylinder identifiers are given in the upper left of plots.239

A-74
Figure A-16. G-value (molecules/100 eV) behavior over Watt @ yr since cylinder loading for heatedcylinders containing PVC and Pu. Cylinder identifiers are given in the upper left of plots.239

G-V
alu
e
Graphs by Cylinder for Heated/Wet Cellulose/Pu238Watt-Year
H09
-1
0
1
2
3
H11
HA05
0 .005 .01 .015-1
0
1
2
3
HA07
0 .005 .01 .015
G-V
alu
e
Graphs by Cylinder for Heated/Wet Cellulose/Pu239Watt-Year
H06
-1
0
1
2
H12
HA06
.002 .004 .006 .008 .01-1
0
1
2
HA12
.002 .004 .006 .008 .01
A-75
Figure A-17. G-value (molecules/100 eV) behavior over Watt @ yr since cylinder loading for heatedcylinders containing wet cellulose and Pu. Cylinder identifiers are given in the upper left of plots.238
Figure A-18. G-value (molecules/100 eV) behavior over Watt @ yr since cylinder loading for heatedcylinders containing wet cellulose and Pu. Cylinder identifiers are given in the upper left of plots.239

G-V
alu
e
Graphs by Cylinder for Restarted Polyethylene/Pu239Watt-Year
A01
0.2000
0.4000
0.6000
0.8000
1.0000
H01
HA01
0 .0005 .001 .0015
0.2000
0.4000
0.6000
0.8000
1.0000
N01
0 .0005 .001 .0015
A-76
Figure A-19. G-value (molecules/100 eV) behavior over Watt @ yr since cylinder loading for restartedcylinders containing polyethylene and Pu. Cylinder identifiers are given in the upper left of plots.239

B-1
Appendix B
TARMATDEP Model DescriptionAnd Validation Results

B-2

B-3
B.1 TARMATDEP Code Information
Software Name: TARMATDEP
Category: FORTRAN Code Numerical Simulator - Alpha Radiation Transport throughSource and Target Media
Revision Number: 1
Date Last Revised: July 1, 1998
Descriptive Summary: The need for a theoretical program to simulate the real-life phenomenon ofmatrix depletion arose early on in the course of the MDP efforts. To that end,the TARMATDEP program was developed, using the theory of radiationtransport and first-principles of particle collisions. TARMATDEP is aone-dimensional (r-geometry) time-dependent particle transport code thattracks alpha radiation propagation through a source and target material, anddetermines the effects of alpha collisions with target molecules. Based onuser-input dimensions and initial energies, TARMATDEP determines thealpha energy loss profile in two PuO source materials: (1) "Pu-238" and (2)2
"Pu-239", as well as in five candidate target materials, simulating the contentsof TRU waste: (1) polyethylene (PE), (2) poly vinyl chloride (PVC), (3) drycellulose, (4) wet cellulose, and (5) cement.
Using the alpha energy loss profile, the program calculates the followingtime-varying parameters in the target materials: (1) instantaneous number ofhydrogen bonds broken, (2) running sum of hydrogen bonds broken, and (3)effective G-value. The main parameter of interest, the effective G-value, isprovided by TARMATDEP as a function of both time (in sec) as well as dose(in either eV or Watt @ yr, depending on user preference). The calculatedG-value as a function of time or dose can then be compared to experimentalG-values to validate the code, or to other calculated G-values to illustrate thedependence of matrix depletion on various material or geometry parameters.
Related Programs: The program is comprised of the main routine TARMATDEP, the free-formatASCII input file TARMATDEP.INP, and the following ten output files: (1)RADII.DAT, (2) ENERGIES.DAT, (3) ATOMICS.DAT, (4)EDEPOSIT.DAT, (5) H_BONDS.DAT, (6) SUMH_BONDS.DAT, (7)GVALUES.DAT, (8) PROBABLE.DAT, (9) GVALSONLY.DAT, and (10)TARMATDEP.OUT.
Operational Demands: The program currently executes on the Benchmark DEC Alpha workstation.However, since the program is written in standard FORTRAN 77programming language, the source code can be ported to any platformsupporting a FORTRAN 77 compiler, and the executable file re-compiled forthe given platform.
Classification: Limited Distribution, developed as part of a government contract, unclassified.
Status: Operational, with ongoing upgrades and/or code maintenance.

B-4
Origin/source: Developed by Benchmark Environmental Corporation, 4501 Indian SchoolRoad NE, Suite 105, Albuquerque, NM 87110 for the Lockheed IdahoTechnologies Company under Subcontract No. C90-132787.
Author: Voyko Banjac, Ph.D.and Sinisa M. DjordjevicBenchmark Environmental Corporation4501 Indian School Road NESuite 105Albuquerque, NM 87110Phone: (505) 262-2694; Fax: (505) 262-2698
Programmer: Voyko Banjac, Ph.D.Benchmark Environmental Corporation4501 Indian School Road NESuite 105Albuquerque, NM 87110Phone: (505) 262-2694; Fax: (505) 262-2698
Knowledgeable Persons: Voyko Banjac, Ph.D.Benchmark Environmental Corporation4501 Indian School Road NESuite 105Albuquerque, NM 87110Phone: (505) 262-2694; Fax: (505) 262-2698
Sinisa M. DjordjevicDJINDECO Consulting1115 Hupmobile Dr. NEAlbuquerque, NM 87123-1846Phone: (505) 296-4934; Fax: (505) 299-6872
Documentation/References:
Software Users Manual - TARMATDEP (Rev. 1) - User's Manual, Benchmark EnvironmentalCorporation, Albuquerque, NM (under development).
Software Configuration Log - Software Configuration Log for TARMATDEP (under development).
B.2 Description of the TARMATDEP Model
The TARMATDEP program was developed to theoretically analyze hydrogen gas generation in TRUwaste. It tracks alpha radiation propagation through a source and target material and determines the effectson target molecules. The basic radiation transport equation used in TARMATDEP is the linear energyattenuation correlation for alpha particles, which states the amount of energy that an alpha particle ofrepresentative initial energy (in MeV) loses by traversing a fixed length of material (in cm). The linear energyattenuation correlation is calculated separately for each material through which the alpha particle travels, andis dependent on the physical properties of the material in question. For example, the attenuation correlationfor typical alpha source materials such as PuO and PuO is 3,010.3 MeV/cm and 2,865.0 MeV/cm,238 239
2 2

B-5
respectively, while for typical target materials such as polyethylene or cellulose, the attenuation correlationis approximately 886.65 MeV/cm and 36.35 MeV/cm, respectively.
Using the attenuation data for both the source and target materials, as well as material and geometryproperties, TARMATDEP tracks the alpha particles from "birth" in the middle of the source PuO particle2
to their "death" somewhere inside the target matrix. For those cases where the alpha particles traverse theentire thickness of the target matrix, but yet still carry some energy (such as in cellulose, for example, wherethe linear energy attenuation is very small), TARMATDEP determines the total energy deposition within thematrix and then "kills off" the particles once they emerge out the other side of the target matrix.
B.2.1 Radiation Chemistry Theory
TARMATDEP assumes a homogeneous PuO source particle and a homogeneous target matrix of2
specified composition. Basic radiochemistry data on five representative target matrices—PE, PVC, dry andwet cellulose, and cement—such as linear energy attenuation, atomic composition, density, nature andnumber of various chemical bonds, and average bond breakage energy, is provided as part of the free-formatinput file, and is processed by the program. Using the provided radiochemistry data, TARMATDEPdetermines the number of target molecules in the path of each alpha emitted from the PuO source particle.2
Once an alpha is “born” in the PuO particle and enters the target matrix, an “interaction probability”2
function is applied to the alpha to determine how many collisions with target molecules the alpha in questionwill have within each geometry node. The interaction probability function decreases with time and with thetotal number of collisions—i.e., it is proportional to the running sum of collisions over the total number oftarget molecules present in the path of the alpha.
For every alpha interaction with a target molecule, a “bond breakage probability” function is applied tothe alpha to determine how many hydrogen bonds will be broken as a result of the interaction. The programallows the user to specify a desired hydrogen bond breakage probability. For the purposes of the MDPanalyses discussed in this report, the majority of executions of TARMATDEP were conducted to modelmatrix depletion effects on PE, for which a hydrogen bond breakage probability of 0.2 was used (based onresults of radiochemistry work as part of the nuclear rocket program in the 1950’s.). For all other targetmatrix materials, naturally, different hydrogen bond breakage probabilities will need to be used. The actualbond breakage probability is a complex function of the atomic composition of the molecule, the nature andnumber of various chemical bonds comprising the molecule, and the associated bond breakage energies. Fora molecule characterized by predominantly hydrogen bonds, the probability will be greater than that formolecules wherein hydrogen bonds comprise only a small portion of the total number of atomic bonds.
For each geometry node within the target matrix, TARMATDEP tracks the total number of hydrogenbonds broken, and writes it into the “SumH_bonds.dat” file for easy user access. For simplicity,TARMATDEP assumes that one hydrogen gas molecule (H ) is created for every two hydrogen atoms that2
are created (i.e., for every two hydrogen bonds that are broken). For additional simplicity, TARMATDEPalso assumes that the newly-created H molecule instantaneously diffuses through the target matrix and2
relocates itself into the ambient space around the matrix—thus contributing to the flammability level ofhydrogen in the ambient space.
Based on the number of hydrogen bonds broken, the number of hydrogen atoms created, as well as thenumber of H molecules created, TARMATDEP determines the corresponding G-value for each geometry2
node. Since TARMATDEP relies on a straight definition of G-value (number of H molecules created per2
100 eV of energy), it is possible within the program to calculate both “absolute” G-values—as a functionof total alpha energy emitted—as well as “effective” G-values—as a function of alpha energy deposited inthe target matrix. Since all matrix depletion-related studies to date have relied on the effective definition of

B-6
G-value, all TARMATDEP-related work has, in the interests of consistency, been done using that particulardefinition.
Once a given alpha has been tracked through the target matrix to the point where it “dies” (i.e., loses allits energy), the program sums up all the discrete nodal G-values to arrive at a total G-value for a particularmoment in time. The total G-values are then written into the “Gvalues.dat” and “Gvalsonly.dat” files for easyuser access.
B.2.2 Input/Output Description
In its current form, TARMATDEP is fully parametrized, i.e. allows user modification of all pertinentinput data. The parametrization is facilitated by the use of a free-format, ASCII input file called"tarmatdep.inp." The input file contains the entire set of source and target material physical properties, aswell as geometry specifications.
The program allows for user specification of both the total duration of modeling, as well as the timeinterval between recording of the calculated data. Thus, for example, the user can specify two years as thetotal duration of modeling, and then request that calculated data at the end of every month be written to file.Or, alternatively, the duration of the modeling can be set, for example, at 2.5 days, with a recording intervalof 29 minutes; TARMATDEP recognizes any combination of real number and the alphanumerics "secs","mins", "hours", "days", "weeks", "mos", and "years."
As part of recording the calculated data, the program creates up to 10 (ten) files per execution. The filesare: (1) "radii.dat", a listing of the outer and node radii, and node volumes, of the model, (2) "energies.dat",a listing of the alpha energy decrease through the source and target material, (3) "atomics.dat", a listing ofthe total number of source and target material molecules within a given node, (4) "edeposit.dat", a listing ofthe incremental alpha energy deposition in each node, (5) "H_bonds.dat", a listing of the instantaneousnumber of hydrogen bonds broken within a given node, (6) "SumH_bonds.dat", a listing of the running sumof hydrogen bonds broken within a given node, (7) "Gvalues.dat", a listing of the absolute G-values withina given node, as well as a cumulative G-value for each time print interval, (8) "Probable.dat", a listing of thetime-decreasing probability of availability of intact hydrogen bonds for breaking by radiolysis, within a givennode, (9) "Gvalsonly.dat", a summary of only cumulative G-values, for each time print interval, and (10)"Tarmatdep.out", a TARMATDEP-generated output file that is essentially a reprint of the input data and isuseful in debugging (i.e., determining exactly how TARMATDEP interpreted the input data given it). Files"radii.dat", "energies.dat", "atomics.dat", "edeposit.dat", "Probable.dat", and "Tarmatdep.out" are primarilyuseful for debugging and verification purposes. The key files are "H_bonds.dat", "SumH_bonds.dat","Gvalues.dat", and "Gvalsonly.dat", as they provide answers to the question of time-dependent hydrogengeneration by radiolysis in TRU waste.
Each and every one of the eight output files can be activated or suppressed for a given execution ofTARMATDEP. Generally, to save time, it is advisable to limit output to the most important files, namely"Gvalues.dat" and "Gvalsonly.dat".
B.2.3 Execution Length
The duration of executions of TARMATDEP is greatly dependent on the complexity of the geometry(i.e., the number of nodes in the source and the target), the total duration of simulation (which can range fromminutes to thousands of years), and the size of the calculation step (depending on the desired accuracy,anywhere from 0.001 sec to 1.0 day). Certain high-accuracy runs of TARMATDEP took almost 24 hourson the DEC Alpha; generally, though, most runs performed as part of the MDP work took less than one

B-7
minute.
B.2.4 Model Geometry
The program performs particle transport tracking in one dimension--the r-geometry of sphericalcoordinates. Thus, the center of the coordinate system (r=0, time=t) is in the center point of the PuO source2
particle. The radial dimension increases away from the center point of the particle and into the target material.The one-dimensional model collapses the entire target molecule population into one spatial "ray," into whichevery alpha particle is "launched." Since there is only this one angle of traversal, each and every alpha particleencounters the same number of target molecules in its radial path; each subsequent alpha, however, isweighted with a decreasing probability of breaking a hydrogen bond, in order to account for the depletion of"fresh" hydrogen bonds in target molecules encountered along the traversal path of the alphas.
A cross-sectional view of the TARMATDEP model geometry is shown in Figure B-1. In a simplegeometry case, the effects of alpha radiation emanating from only one PuO particle is analyzed. Since in2
most cases a number of PuO particles can be assumed to be "clumped" or agglomerated close together, the2
combined effects of alpha radiation emanating from each of those particles needs to be taken into account,as shown in Figure B-2. For agglomerated scenarios, thus, a separate methodology needs to be employed,so as to take into account the varying paths and varying energies of the alpha radiation. For agglomerationfactors greater than 1.0 (i.e., more than one PuO particle radiating into the target matrix), TARMATDEP2
uses an equivalent "MEGA" particle analogy, wherein a single, large PuO particle is assumed, with a radius2
derived from an equivalent volume equal to the sum of the volumes of the agglomerated particles. All alpharadiation is then either "born" in the middle of the "MEGA" particle or, if the radius of the "MEGA" particleexceeds the alpha range in PuO (i.e., about 18 um), the outer shell equal to the particular alpha range. The2
equivalent "MEGA" PuO particle analogy is depicted in Figure B-3.2
B.2.5 Calculational Algorithm
The top-level calculation algorithm consists of three loops: (1) time loop, (2) radial dimension loop, and(3) target material loop. Thus, for each second of time, a full sweep through the radial dimension and itsassociated nodes is done; for each radial node, in turn, a sweep of the five candidate target materials is done.Thus, the output of TARMATDEP is a series of two-dimensional arrays, with each array comprising theradial dimension (rows) and target material (columns) calculated data, and a different 2-D array for eachsecond in time. To conserve output file size, TARMATDEP only writes to file the output data according tothe user-specified reporting interval (i.e., every second, minute, hour, day, week, month, or year, or anymultiple of the same).
Depending on the user specifications, the algorithm is executed for either the Pu or Pu source238 239
material. The results of the analysis are written to whichever of the eight possible output files the useractivates, for the desired total duration of modeling and the time interval between recording of the calculateddata.

targetmatrix
PuO2particle
radial nodesin target m atrix
PuO2 particlediameter
target matrixthickness
α
B-8
Figure B-1. A cross-sectional view of the TARMATDEP model geometry.

radial nodesin target matrix
PuO2 particlediameter
α
targetmatrix
agglomerated PuO2 particles
B-9
Figure B-2. Combined effects of alpha radiation from agglomerated particles.

radial nodesin target matrix
α
targetmatrix
radius of equivalent PuO2 "MEGA" particle
equivalent PuO2"MEGA" particle
B-10
Figure B-3. The equivalent "MEGA" PuO particle analogy.2

B-11
B.3 TARMATDEP Validation Results
As part of the MDP activities in general, and the TARMATDEP development effort in particular, theprogram was extensively verified (i.e., analyzed to confirm that it is performing as intended) and validatedagainst existing experimental MDP data. Within the general verification efforts, two major applications ofthe TARMATDEP program were conducted: (1) to compare its theoretical predictive results to experimentaldata, and (2) to determine the critical properties or parameters that influence the G-value of a particular targetmatrix.
B.3.1 Validation Against the Marshall/Cappis Experiments
The first set of TARMATDEP executions was carried out using input parameters that simulated theMarshall/Cappis experiments. Two representative TARMATDEP cases were analyzed, one for PE and onefor cellulose. The model results were then plotted against the three combined sets of Marshall/Cappisexperimental results, as shown in Figures B-4 and B-5. Overall, excellent agreement between theMarshall/Cappis experimental data and the theoretical predictive results of TARMATDEP was observed,for the entire range from t=1 day to in excess of t=600 days.
B.3.2 Validation Against the LANL MDP Experiments
The second set of TARMATDEP executions was carried out using input parameters that simulated theLANL MDP experiments. Several representative test cases were analyzed, involving both Pu and Pu,238 239
as well as short-term and long-term G-value behavior. As discussed in Section 4.3 of this report, theTARMATDEP simulations of actual LANL MDP experiments indicated excellent agreement with theexperimental data over a range of t=1 day to in excess of t=800 days.
B.4 Parametric Analysis Using TARMATDEP
As of the end of FY98, the TARMATDEP theoretical model has been extensively validated againstavailable experimental matrix depletion data. In all cases analyzed, TARMATDEP accurately and correctlypredicted the behavior of the G-value curve for any given contaminant, target matrix, and geometry. Thesesuccessful results give credence to the use of TARMATDEP as a tool to analyze the effects of differentproperties or parameters on the G-value.
Using TARMATDEP predictive results, it was determined that the behavior of the G-value vs. dose(or time) curve for any given target matrix was primarily influenced by two parameters: (1) PuO particle2
diameter, and (2) PuO particle agglomeration. A series of analyses were performed with varying particle2
diameters (3.61 um, 15 um, and 36 um) and particle agglomerations (corresponding to 0.01 W, 0.1 W, and1.0 W). The results of the analyses are shown on Figures B-6 through B-12. As can be seen from theenclosed plots, increasing PuO particle diameter has a direct influence on the decrease of the overall G-value2
curve (i.e., the magnitude of the curve), while increasing agglomeration or wattage has a direct influence onthe steepness of the overall G-value curve (i.e., the shape of the curve). Thus, it can be concluded that whilethe magnitude of both the initial, as well as final, G-value is to a large extent dependent on the PuO particle2
diameter, the shape of the G-value curve, on the other hand, is mostly dependent on the PuO particle2
agglomeration along the target matrix. In other words, the highest initial G-values are expected to beassociated with a very small PuO particle diameter and high agglomeration factors, while the lowest long-2
term G-values are expected to be found in waste contaminated with highly agglomerated PuO particles of2
large diameter.

B-12
Figure B-4. Comparison of LANL Cappis/Cassini PuO experimental data with TARMATDEP model.2
Figure B-5. Comparison of LANL Cappis/Cassini PuO experimental data with TARMATDEP model.2

B-13
Analysis of the dependence of initial G-value on PuO particle diameter also indicated that, for any2
given case of particle agglomeration, the initial G-value is bounded and does not increase without limit asthe PuO particle diameter is decreased. As shown in Figure B-13, for the sample case of 1.0 W2
agglomeration and varying PuO particle diameters from 10.0 um down to 0.01 um, the initial G-value2
asymptotes to an upper bound of approximately 1.1 molecules/100 eV. For different target matrices,agglomeration factors, Pu types, and PuO particle diameters, naturally, the G-value asymptote would vary.2
A separate series of TARMATDEP executions were devoted to better understanding of the behaviorof the G-value curve versus both time and dose. Of special interest was the relationship between the G-valueversus time and the G-value versus dose curves, namely the expectation that a TARMATDEP theoreticalsimulation of two separate hypothetical cases, at different dose rates, would yield the same results whensuperimposed on a G-value versus total dose (in Watt @ yr) plot. Thus, two separate runs of TARMATDEPwere carried out, for the same contaminant ( Pu), the same target matrix (PE), and identical particle and238
target dimensions and properties, except for a 100x difference in the dose rate—one at 0.01 W, the other at1.0 W. Both cases were simulated for a total of 400 years, to provide the necessary equivalency.
Figure B-14 shows plots of the resultant G-values versus time, for both the 0.01 W and the 1.0 W cases.The G-value in the 0.01 W case takes a long time (approximately 200 years) to decrease significantly, whilethe G-value in the 1.0 W case, the result of a 100x greater dose, decreases to zero much faster. Overall, theshape and magnitude of the two curves are completely different.
As is shown in Figure B-15, however, once the G-values are plotted versus total dose (i.e., taking intoaccount the 100x difference in the dose rate), the two G-value curves align perfectly over a wide range ofdoses, from D=0.0 to D=4.0 Watt @ yr. Even the slight deviation in G-values starting around 4.0 Watt @ yris due to calculation step inaccuracies, because the 0.01 W case, at 400 years, required the use of asignificantly larger calculation step in order to result in a reasonable execution time. Thus, these simulationsconclusively support the concept of a dose criteria (0.006 Watt @ yr) beyond which G-values have leveled off,approaching the asymptotic value.

6005004003002001000
0.003
0.004
0.005
0.006
0.007
0.01 W,36 um
0.1 W,36 um
1.0 W,36 um
Time [days]
B-14
Figures B-6, B-7, B-8. Analyses of the effects of increasing PuO particle diameter.2

6005004003002001000
0.0
0.2
0.4
0.6
0.8
1.0
1.2
0.01 W,3.61 um
0.01 W,15 um
0.01 W,36 um
Time [days]
6005004003002001000
0.0
0.2
0.4
0.6
0.8
1.0
1.2
0.01 W,3.61 um
0.01 W,15 um
0.01 W,36 um
Time [days]
6005004003002001000
0.0
0.2
0.4
0.6
0.8
1.0
1.2
0.1 W,3.61 um
0.1 W,15 um
0.1 W,36 um
Time [days]
B-15
Figures B-9, B-10, and B-11. Analyses of the effects of increasing PuO wattage.2

B-16

B-17

8007006005004003002001000
0.0
0.2
0.4
0.6
0.8
1.0
1.2
0.01 W,3.61 um
0.1 W,3.61 um
1.0 W,3.61 um
0.01 W,15 um
0.1 W,15 um
1.0 W,15 um
0.01 W,36 um
Time [days]

C-1
Appendix C
NEWGVALS MODEL DESCRIPTIONAND EVALUATION RESULTS

C-2

C-3
C.1 NEWGVALS Code Information
Software Name: NEWGVALS
Category: FORTRAN Code Numerical Simulator - Gas Generation and Transport AcrossLayers in a Waste Container
Revision Number: 1
Date Revised: August 1, 1998
Descriptive Summary: The rationale for the NEWGVALS code is provided in the TRUPACT-IIMatrix Depletion Program Test Plan, INEL-95/0360, Idaho NationalEngineering Laboratory, Idaho Falls, Idaho. The code mathematically simulatesthe generation of flammable gas and subsequent transport across layers ofconfinement in a transuranic waste drum. The code uses experimentally derivedbounding effective G-value step functions, and actual TRU waste containerdecay heat or wattages to predict concentrations within different confinementlayers within actual TRU waste containers up to the age of the container whensampled. The bounding effective G-values were obtained from data analysis ofthe results from the Matrix Depletion testing being performed at LANL. Thepredicted concentrations using the NEWGVALS code were compared with therespective actual waste drum flammable gas concentrations to show that theselected effective G-values are in fact bounding.
The generation of flammable gas within the innermost confinement layer andsubsequent transport across the various confinement layers of an actualcontainer can be simulated by solving the differential equations that describethe unsteady-state mass balances on flammable gas within each confinementlayer of the actual container. The program is based on the TRUPACT-IIaspiration model that is documented in Appendix 3.6.11 of the Safety AnalysisReport for the TRUPACT-II Shipping Package, Revision 14, NRC Docket No.9218, U.S. Nuclear Regulatory Commission, Washington, D.C. To account forthe various packaging configurations and container conditions, four sets ofordinary differential equations (ODEs) are solved along with the appropriateinitial conditions that represent the initial state of a container. The four setsrepresent: (1) a sealed container with two void volumes, (2) an aspiratingcontainer with two void volumes, (3) a sealed container with three voidvolumes, and (4) an aspirating container with three void volumes. Theconcentrations that are predicted in a sealed container at the time of ventingserve as initial conditions for the differential equations that describe anaspirating container. This code differs from the aspiration model in that thedifferential equations are solved numerically because the gas generation rate isbased on a step function in G-value.
Related Programs: The program is comprised of the main routine NEWGVALS along with thefollowing subroutines: READAT; DEFINE; ODEINT; DERIVS; SUBGDIM;RKQS/RKCK; BSSTEP; MMID; and PZEXTR.
Operational Demands: IBM PC Compatible 486, 33 MHZ or higher, 8 Mb memory, DOS 5.0 or

C-4
higher. Fortran source code executable is NEWGVALS.EXE. Size ofexecutable program: 188,996 bytes.
Classification: Limited distribution, developed as part of a government contract, unclassified.
Status: Operational.
Origin/source: Developed by DJINDECO Consulting for Benchmark EnvironmentalCorporation, 4501 Indian School Road NE, Suite 105, Albuquerque, NM87110 for the Lockheed Idaho Technologies Company under Subcontract No.C90-132787.
Author: Sinisa M. DjordjevicDJINDECO Consulting1115 Hupmobile Dr NEAlbuquerque, NM 87123-1846Phone: (505) 296-4934; Fax: (505) 299-6872
Programmer: Sinisa M. DjordjevicDJINDECO Consulting1115 Hupmobile Dr NEAlbuquerque, NM 87123-1846Phone: (505) 296-4934; Fax: (505) 299-6872
Knowledgeable Persons: L. Richie SpanglerBenchmark Environmental Corporation4501 Indian School Road NE, Suite 105Albuquerque, NM 87110(505) 262-2694; FAX (505) 262-2698
Sinisa M. DjordjevicDJINDECO Consulting1115 Hupmobile Dr NEAlbuquerque, NM 87123-1846Phone: (505) 296-4934; Fax: (505) 299-6872
Documentation/References:
Software Users Manual - NEWGVALS (Revision 1) - User's Manual, Benchmark EnvironmentalCorporation, Albuquerque, NM.
Software Configuration Log - Software Configuration Log for NEWGVALS, (copy attached).
C.2 Mathematical Model
The NEWGVALS model was developed to predict flammable gas concentrations in each confinementlayer of a drum. The model mathematically simulates the generation of flammable gas and subsequenttransport across layers of confinement in a TRU waste drum. The model uses a step function inexperimentally determined bounding effective G-values and the drum decay heat or wattage to predict

dC2
dt
' R2
( C1
& C2
)
dC1
dt
'
Cg
RT
PV1
& R1
( C1
& C2
)
C-5
(C-1)
(C-2)
concentrations within each confinement layer of the drum up to the time that the drum is sampled. Thepredicted gas concentrations using NEWGVALS were compared with sampled flammable gas concentrationsto demonstrate that the selected effective G-values are, in fact, bounding. NEWGVALS is based on theaspiration model and equations documented in Appendix 3.6.11 of the SARP (NRC 1996).
Each CH-TRU waste container is designated by a TRUPACT-II shipping category based on wastematerial type and the packaging (number and type of layers of confinement) of the waste materials withinthe waste container. The layers of confinement include polymer (i.e., plastic) bags, rigid drum liners, anddrum filters. The polymer bags are sealed by either a twist-and-tape or a fold-and-tape method. If the bagsare sealed by twist-and-tape, the resulting closure is referred to as a horsetail. Drums of waste type I or wastetype IV are referred to as sludge waste drums and may contain absorbed, adsorbed, or solidified inorganicor organic liquids, soils, or solidified particulates and residues. Sludge waste is typically packaged using atmost two layered large polymer bags within the rigid drum liner. Drums containing waste type II or wastetype III are referred to as solid waste drums that may contain glass, metal, crucibles, plastics, cellulose, orother solid organics and inorganics. Solid waste drums have up to six layers of confinement within the rigiddrum liner: a maximum of two layered large polymer bags containing waste wrapped inside one to four layersof small polymer bags.
Besides the packaging configuration, the drums can be either sealed or aspirating. Aspirating drums arethose that have been vented (i.e., the rigid drum liners punctured and a carbon composite filter installed inthe drum lid). If a container is aspirated for a sufficient period of time (i.e., the aspiration time defined inAppendix 3.6.11 of the SARP) the container attains steady-state or equilibrium conditions between layersof confinement. At steady-state conditions the rate of flammable gas generation by radiolysis equals therelease rate of flammable gas across each layer of confinement.
The generation of flammable gas within the innermost confinement layer and subsequent transport acrossthe various confinement layers of an actual container can be simulated by solving the differential equationsthat describe the unsteady-state mass balances on flammable gas within each confinement layer of the actualcontainer. The same equations that are documented in Appendix 3.6.11 of the SARP were used, except thatthe gas generation rate is a function of dose. To account for the various packaging configurations andcontainer conditions, four sets of differential equations are solved along with the appropriate initialconditions that represent the initial state of a container. The four sets represent: (1) a sealed container withtwo void volumes, (2) an aspirating container with two void volumes, (3) a sealed container with three voidvolumes, and (4) an aspirating container with three void volumes. Data required for each simulation consistof the bounding effective flammable gas G-value functions of dose that were experimentally derived, voidvolumes within the various confinement layers, and experimentally determined release rates of flammablegas across each confinement layer. The systems of ODEs are solved numerically using either of two availabletechniques. Flammable gas generation and transport across the confinement layers will be simulated untilthe time the container was sampled.
C.2.1 Differential Equations for a Container with Two Void Volumes
The first set of differential equations represent a sealed container with two void volumes.
Sealed Container

C1
( t ' 0 ) ' C2
( t ' 0 ) ' 0
dC1
dt
'
Cg
RT
PV1
& R1
( C1
& C2
)
dC2
dt
' R2
( C1
& C2
) & R3
C2
C2
( t ' 0 ) ' C2 , 0
C1
( t ' 0 ) ' C1 , 0
Cg
( t ) '
Q GB
( dose )
k NA
C-6
(C-3)
(C-4)
(C-5)
(C-6)
(C-7)
(C-8)
The following initial conditions represent the initial state of the container:
The second set of differential equations represent an aspirating container with two void volumes. Aspirating Container
The following initial conditions represent the initial state of the container. The actual numerical valuesof C and C are obtained by solving the first set of equations describing a sealed container at the time of1,0 2,0
venting.
where
C (t) = mole or volume fraction of flammable gas within the drum liner void volume at1
time t (dimensionless)C (t) = mole or volume fraction flammable gas within the drum headspace at time t2
(dimensionless)R = effective release rate coefficient of flammable gas from the rigid liner divided by1
the innermost void volume (1/s)R = effective release rate coefficient of flammable gas from the rigid liner divided by2
the headspace void volume. (One value based on the release rate from an intactliner is used in the equations for the concentration in a sealed container. A differentvalue is used with the aspiration equations based on the release of flammable gasfrom the punctured rigid liner hole.) (1/s)
R = effective release rate coefficient of flammable gas from the carbon composite filter3
divided by the headspace void volume (1/s)t = time (s)R = universal gas constant (82.057 atm cm /mol K)3
T = absolute temperature (K)V = void volume within the innermost confinement layer (cm )1
3
C (t) = flammable gas generation rate within the innermost confinement layer (mol/s).g
The generation rate will be calculated from the bounding effective flammable gas G-values for each timesegment. The smallest statistically justifiable time segment will be used in the analyses. The relationshipbetween the bounding effective flammable gas G-value and the flammable gas generation rate is:

dC2
dt
' R2
( C1
& C2
) & R3
( C2
& C3
)
dC3
dt
' R4
( C2
& C3
)
dC1
dt
'
Cg
RT
PV1
& R1
( C1
& C2
)
C1
( t ' 0 ) ' C2
( t ' 0 ) ' C3
( t ' 0 ) ' 0
dC1
dt
'
Cg
RT
PV1
& R1
( C1
& C2
)
dC2
dt
' R2
( C1
& C2
) & R3
( C2
& C3
)
dC3
dt
' R4
( C2
& C3
) & R5
C3
C-7
(C-9)
(C-10)
(C-11)
(C-12)
(C-13)
(C-14)
(C-15)
where
Q = wattage or decay heat of the TRU waste container (W)G (dose) = bounding effective flammable gas G-value step function (molecules/100 eV) B
GN = Avogadro's number (6.022045 x 10 molecules/mol)A
23
k = conversion factor (1.602x10 Ws/eV).-19
C.2.2 Differential Equations for a Container with Three Void Volumes
The first set of differential equations represent a sealed container with three void volumes.
Sealed Container
The following initial conditions represent the initial state of the container:
Aspirating Container
The second set of differential equations represent an aspirating container with three void volumes.
The following initial conditions represent the initial state of the container. The actual numerical valuesof C , C , and C are obtained by solving the first set of equations describing a sealed container at the1,0 2,0 3,0

C1
( t ' 0 ) ' C1 , 0
C2
( t ' 0 ) ' C2 , 0
C3
( t ' 0 ) ' C3 , 0
C-8
(C-16)
(C-17)
(C-18)
time of venting.
where
C (t) = mole or volume fraction flammable gas within the innermost void volume at time t1
(dimensionless)C (t) = mole or volume fraction flammable gas within the rigid drum liner at time t2
(dimensionless)C (t) = mole or volume fraction flammable gas within the drum headspace at time t3
(dimensionless)R = effective release rate coefficient of flammable gas from all bags divided by the1
innermost void volume (1/s)R = effective release rate coefficient of flammable gas from all bags divided by the2
rigid liner void volume (1/s)R = effective release rate coefficient of flammable gas from the rigid liner divided by3
the liner void volume. (One value based on the release from an intact liner is usedin the equations for the concentration profiles in a sealed container. A differentvalue is used with the aspiration equations based on the release of flammable gasfrom the punctured drum liner.) (1/s)
R = effective release rate coefficient of flammable gas from the rigid liner divided by4
the container headspace void volume. (One value based on the release from anintact liner is used in the equations for the concentration profiles in a sealedcontainer. A different value is used with the aspiration equations based on therelease of flammable gas from the punctured drum liner.) (1/s)
R = effective release rate coefficient of flammable gas from the carbon composite filter5
divided by the container headspace void volume. (1/s)
The other variables are as defined earlier.
C.3 Numerical Implementation
The systems of differential equations are solved numerically using either of two available techniques.The user specifies the preferred method in the input file. The two methods included in the code are thefifth-order Runge-Kutta method with adaptive stepsize control, and the Bulirsh-Stoer method withRichardson's extrapolation and adaptive stepsize control. The routines comprising the NEWGVALS programare described below.
C.3.1 Program NEWGVALS Routines
The main program NEWGVALS controls the logic of the code by calling the other subroutines. First,the subroutine READAT is called to read in the input parameters from file NEWGVALS.DAT. For eachdrum listed in the container data file CONTDATA.DAT, the subroutine READAT reads in the requisite

C-9
drum parameters. For each drum, the subroutine DEFINE is called to define the values of the confinementlayer release rates. Flammable gas generation and transport across layers is simulated up to the time of drumsampling by calls to subroutine ODEINT. Finally, for each drum the predicted concentrations of hydrogenand methane are written to the output file CONTDATA.OUT.
C.3.2 Subroutine READAT
The first time subroutine READAT is called the subroutine reads input parameters from the data fileNEWGVALS.DAT. In subsequent calls, the subroutine reads a line from the data file CONTDATA.DAT,which contains actual waste drum data for a single container. Based on the appropriate waste material type,the appropriate bounding effective G-value step function is defined within this routine. The routine alsocalculates the time when the Watt @ yr criteria are satisfied and the lower MDP revised G-values are to beused.
C.3.3 Subroutine DEFINE
Subroutine DEFINE calculates the release rate coefficients of flammable gas across various confinementlayers (i.e., values of R , ..., R ) defined in Section C.2. The appropriate values are calculated for the1 5
flammable gas depending on the waste material type, the number of bag layers, and whether the containeris sealed or aspirating.
C.3.4 Subroutine ODEINT
Subroutine ODEINT implements the Runge-Kutta driver with adaptive stepsize control. The subroutinecauses integration of the differential equations between two times. In one case, the time is the duration thatthe container is sealed, while during aspiration, the time corresponds to the elapsed time between drumventing and sampling. Accuracy, initial stepsize, and minimum stepsize for the integration are specified bythe user in the file NEWGVALS.DAT. The subroutine makes successive calls to the subroutine DERIVS,which calculates the right-hand-side derivative. RKQS is the stepper routine to be used if the Runge-Kuttamethod is to be used, and BSSTEP is the name of the stepper routine to be used if the Bulirsch-Stoer methodis to be used.
C.3.5 Subroutine DERIVS
Subroutine DERIVS is the subroutine that defines or allows calculation of the right-hand sides ofEquations C-1, C-2, C-4, C-5, C-9, C-10, C-11, C-13, C-14, and C-15. The assignment of values to arrayof derivatives DYDT is based on the number of void volumes for that container and whether the containeris sealed or aspirating.
C.3.6 Subroutine SUBGDIM
Subroutine SUBGDIM calculates the flammable gas generation rate using the initial bounding effectiveG-value and the matrix depleted G-value after the Watt @ yr criteria is satisfied, the wattage of the drum andEquation C-8. The subroutine then calculates the term C RT/(PV ) that is used in Equations C-1, C-4, C-9,g 1
and C-13. The subroutine is called by the DERIVS subroutine.
C.3.7 Subroutines RKQS/RKCK
This routine is the stepper routine for the numerical integration of the differential equations if the Runge-Kutta solver is to be used. RKQS/RKCK uses the fifth-order Runge-Kutta solver to advance the solution over

C-10
a time step interval and returns the incremented dependent variables (i.e., the concentrations in eachconfinement layer). Fifth-order Runge-Kutta solver with monitoring of local truncation error ensures accuracyand adjusts the stepsize. Inputs to the routine are the dependent variable vector (i.e., flammable gasconcentrations in each confinement layer) and its derivative at the starting value of the independent variable(i.e., time). Also input are the time stepsize to be attempted, required accuracy, and vector against which theerror is scaled. On output, the dependent variable vector and independent variable (i.e., time) are replacedby their new values. The routine also estimates the next time stepsize. The DERIVS subroutine computesthe right-hand-side derivatives.
C.3.8 Subroutine BSSTEP
This routine is the stepper routine for the numerical integration of the differential equations if theBulirsch-Stoer solver is to be used. Bulirsch-Stoer step with monitoring of local truncation error ensuresaccuracy and adjusts the stepsize. Inputs to the routine are the dependent variable vector (i.e., flammable gasconcentrations in each confinement layer) and its derivative at the starting value of the independent variable(i.e., time). Also input are the time stepsize to be attempted, required accuracy, and vector against which theerror is scaled. On output, the dependent variable vector and independent variable (i.e., time) are replacedby their new values. The routine also estimates the next time stepsize. The DERIVS subroutine computesthe right-hand side derivatives.
C.3.9 Subroutine MMID
Subroutine MMID implements the modified midpoint method as part of the Bulirsch-Stoer technique.The method advances a vector of dependent variables, y(x) from a point x to a point x + H by a sequence ofn substeps each of size h, where h = H/n. Specifically, within the subroutine the dependent variable vectorY (i.e., flammable gas concentrations in each confinement layer) and its derivative vector are input. Alsoinput are the total steps to be made and the number of substeps to be used.
C.3.10 Subroutine PZEXTR
Subroutine PZEXTR makes use of polynomial extrapolation to evaluate NV functions at x=0 by fittinga polynomial to a sequence of estimates with progressively smaller values and corresponding functionvectors. Extrapolated values and their estimated errors are the outputs from the subroutine.
C.3 Input Data Files
Table C-1 lists the parameters used in the NEWGVALS simulations for each waste type includingflammable gas release rate coefficients, void volumes, and the G-value step functions. Table C-2 lists thedata supplied to the NEWGVALS code for containers sampled under the TWCP at the INEEL. Table C-3lists the data supplied to the NEWGVALS code for containers sampled under the TWCP at the RFETS.

C-11
Table C-1. Waste type parameters for NEWGVALS simulations.
Parameter Waste Type I Waste Type II Waste Type III
Drum filter flammable gas release 1.37E-6 1.90E-6 1.90E-6rate coefficient (mole/s/molefraction)
Inner bag flammable gas release 4.17E-7 5.58E-7 5.58E-7rate coefficient(mole/s/mole fraction)
Liner bag flammable gas release 4.67E-6 4.67E-6 4.67E-6rate coefficient(mole/s/mole fraction)
Intact rigid drum liner release rate 1.83E-8 1.83E-8 1.83E-8coefficient(mole/s/mole fraction)
Punctured rigid drum liner release 5.09E-5 5.09E-5 5.09E-5rate coefficient (mole/s/molefraction)
Multiple bag innermost void 34.0 125.1 107.0volume (L)
Rigid drum liner void volume (L) 26.7 13.9 20.4
Annular (i.e., drum headspace) 28.0 28.0 28.0void volume (L)
Initial G-value for 1.6 (for I.1) 1.7 3.4dose < 0.006 Watt @ yr 1.3 (for I.2)(molecules/ 100 eV) 0.4 (for I.3)
MDP revised, matrix depleted 0.25 (for I.1) 0.23 0.44G-value for 0.25 (for I.2)dose > 0.006 Watt @ yr 0.4 (for I.3)(molecules/100 eV)

C-12
Table C-2. INEEL TWCP data supplied as input to the NEWGVALS code.
Site Drum ID IDC Sealed Aspiration Wattage Waste Number of Sampling Flammable gasID no. time time (days) material layers of location concentration(a)
(days) type confinement (Vol%)
(b)
I 371 300 3009 552 0.007973 II.1 4 DH 0.04I 373 300 3012 273 0.07535 II.1 4 DH 0.04I 393 480 2564 552 0.03465 II.1 5 DH 0.04I 401 371 3323 223 0.1017 III.1 5 DH 0.03I 405 480 3778 217 0.06002 II.1 5 DH 0.07I 501 300 2749 389 0.06624 II.1 4 DH 0.06I 558 440 3463 7 0.008164 II.1 6 DH 0.09I 567 371 3402 177 0.1711 III.1 5 DH 0.03I 613 300 2875 559 0.02414 II.1 4 DH 0.126I 827 303 2413 686 0.04185 II.1 4 DH 0.09I 828 300 2415 273 0.01058 II.1 4 DH 0.04I 1016 300 2412 389 0.01399 II.1 4 DH 0.1I 1024 300 2386 389 0.04148 II.1 4 DH 0.06I 1157 339 2701 303 0.04022 III.1 4 DH 0.08I 1161 300 2852 273 0.0467 II.1 4 DH 0.04I 1346 292 3165 1036 0.008292 I.1 0 DH 0.02I 1361 339 2359 288 0.01349 III.1 4 DH 0.07I 1370 339 2368 282 0.05901 III.1 4 DH 0.1I 1493 1 3633 278 0.02945 I.2 2 DH 0.03I 1498 480 2883 561 0.3989 II.1 5 DH 0.05I 1521 292 3100 1043 0.005621 I.1 0 DH 0.06I 1619 300 2606 562 0.03655 II.1 4 DH 0.05I 1633 432 2609 645 0.04992 III.1 4 DH 0.16I 1635 303 2413 686 0.02516 II.1 4 DH 0.09I 1636 320 3610 236 0.1327 II.1 4 DH 0.03I 1655 339 2702 310 0.02185 III.1 4 DH 0.13I 1662 300 2539 555 0.01323 II.1 4 DH 0.04I 1663 432 3323 12 0.03193 III.1 4 DH 5.11I 1667 300 2516 395 0.03481 II.1 4 DH 0.126I 1677 302 2574 385 0.01653 III.1 4 DH 0.125I 1689 302 2444 657 0.02207 III.1 4 DH 0.09I 1692 432 3191 12 0.03419 III.1 4 DH 0.09I 1694 374 3215 243 0.001588 III.1 4 DH 0.03I 1695 339 2814 310 0.0881 III.1 4 DH 0.14I 1697 300 2464 395 0.02194 II.1 4 DH 0.04I 1752 300 2872 395 0.04648 II.1 4 DH 0.04I 1753 339 3236 236 0.01295 III.1 4 DH 0.03I 1754 320 2468 22 0.004689 II.1 4 DH 0.02I 1779 300 2241 391 0.03519 II.1 4 DH 0.08I 1784 339 2705 310 0.02014 III.1 4 DH 0.14I 2077 339 3085 236 0.0147 III.1 4 DH 0.03I 2338 371 2582 663 0.004527 III.1 5 DH 0.13I 2363 371 2348 656 0.5601 III.1 5 DH 0.13I 2365 480 2884 565 0.3807 II.1 5 DH 0.06I 2368 480 3617 265 0.2225 II.1 5 DH 0.06I 2678 432 3338 12 0.007939 III.1 4 DH 0.125I 2712 292 4349 60 0.0694 I.1 0 DH 0.15

Table C-2. (continued).
Site Drum ID IDC Sealed Aspiration Wattage Waste Number of Sampling Flammable gasID no. time time (days) material layers of location concentration(a)
(days) type confinement (Vol%)
(b)
C-13
I 2791 371 2693 663 0.1209 III.1 5 DH 0.13I 2797 432 3327 12 0.05572 III.1 4 DH 0.09I 2814 7 3351 278 0.004017 I.2 2 DH 0.03I 3088 371 2686 663 0.1694 III.1 5 DH 0.13I 3091 371 2557 663 0.06201 III.1 5 DH 0.14I 3268 1 3470 1000 0.031812 I.2 2 DH 0.02I 3277 1 3416 278 0.003302 I.2 2 DH 0.03I 3547 7 3420 237 0.004941 I.2 2 DH 0.03I 3991 339 2278 288 0.08234 III.1 4 DH 0.08I 3997 339 2283 309 0.1595 III.1 4 DH 0.28I 4112 300 2852 386 0.03475 II.1 4 DH 0.05I 4118 480 2991 565 0.003902 II.1 5 DH 0.04I 4119 371 2686 663 0.2874 III.1 5 DH 0.14I 4123 339 2355 288 0.04346 III.1 4 DH 0.11I 4150 300 2329 540 0.04347 II.1 4 DH 0.04I 4160 339 2328 375 0.02159 III.1 4 DH 0.17I 4166 371 2693 663 0.01765 III.1 5 IB 0.036I 4186 339 2387 304 0.02938 III.1 4 DH 0.08I 4196 300 2381 267 0.08248 II.1 4 DH 0.04I 4208 300 2635 379 0.1221 II.1 4 DH 0.16I 4456 7 3834 16 0.08813 I.2 2 DH 0.02I 4799 7 3858 28 0.02393 I.2 2 DH 0.02I 4963 339 2420 375 0.383 III.1 4 DH 0.11I 5012 339 2284 379 0.03121 III.1 4 DH 0.04I 5234 303 2460 676 0.08321 II.1 4 DH 0.09I 5235 432 2452 630 0.08881 III.1 4 DH 0.07I 5415 1 2997 208 0.1464 I.2 2 DH 0.06I 5530 303 2490 262 0.03342 II.1 4 DH 0.04I 5535 432 2573 631 0.1125 III.1 4 DH 0.06I 5607 432 3330 251 0.1324 III.1 4 DH 0.04I 5697 7 2694 217 0.03169 I.2 2 DH 0.03I 5698 7 3550 13 0.002064 I.2 2 DH 0.02I 5880 481 2815 629 0.4193 II.1 5 DH 0.04I 6252 339 3059 172 0.01799 III.1 4 DH 0.03I 6711 7 4168 28 0.000296 I.2 2 DH 0.02I 6857 339 2492 324 0.02605 III.1 4 DH 0.04I 6875 303 3195 11 0.0106 II.1 4 DH 0.93I 6879 432 2463 630 0.05867 III.1 4 DH 0.05I 6918 292 3190 1051 0.03991 I.1 0 DH 0.11I 7034 337 5603 1903 0.007931 III.1 5 DH 0.126I 7061 490 5319 3106 0.002552 III.1 4 DH 0.014I 7104 338 5433 1685 0.000586 III.1 4 DH 0.02I 7170 337 5503 1803 0.000614 III.1 5 DH 0.086I 7231 338 5502 1925 0.04999 III.1 4 DH 0.05I 7262 817 3710 47 0.043376 I.3 2 DH 0.08I 7491 817 3670 47 0.012549 I.3 2 DH 0.03I 7518 330 2702 90 0.02956 III.1 5 DH 0.05

Table C-2. (continued).
Site Drum ID IDC Sealed Aspiration Wattage Waste Number of Sampling Flammable gasID no. time time (days) material layers of location concentration(a)
(days) type confinement (Vol%)
(b)
C-14
I 7594 822 3975 54 0.002945 I.3 2 DH 0.03I 7667 7 2806 229 0.08166 I.2 2 DH 0.03I 8161 822 3742 47 0.011346 I.3 2 DH 0.02I 8203 440 2996 84 0.16 II.1 6 DH 0.09I 8207 336 3136 84 0.1101 III.1 4 DH 0.09I 8218 330 3136 84 0.09855 III.1 5 DH 0.09I 8250 822 2781 208 0.01 I.3 2 DH 0.03I 8262 818 3740 53 0.000924 I.3 2 DH 0.02I 8287 374 2756 90 0.000011 III.1 4 DH 0.05I 8288 818 2760 208 0.0013 I.3 2 DH 0.03I 8355 1 3600 91 0.016443 I.2 2 DH 0.02I 8383 339 2756 229 0.01518 III.1 4 DH 0.034I 8403 817 3655 53 0.077 I.3 2 DH 0.05I 8473 1 3643 35 0.039591 I.2 2 DH 0.04I 8569 807 3489 7 0.0008 I.2 2 DH 0.02I 8683 807 2583 68 0.001 I.2 2 DH 0.05I 8848 440 3019 391 0.01323 II.1 6 DH 0.1I 8859 440 3553 14 0.01187 II.1 6 DH 1.09I 8864 480 3009 552 0.001484 II.1 5 DH 0.04I 8878 480 2990 552 0.016 II.1 5 DH 0.2I 8993 312 3019 676 0.1098 II.1 4 DH 0.09I 9011 7 3729 237 0.00412 I.2 2 DH 0.03I 9180 339 2927 283 0.137 III.1 4 DH 0.29I 9225 481 3099 629 0.1311 II.1 5 DH 0.05I 9252 339 3262 310 0.1235 III.1 4 DH 0.65I 9294 480 3103 548 0.01037 II.1 5 DH 0.05I 9296 440 2967 632 0.00561 II.1 6 DH 0.04I 9299 339 2926 375 0.07217 III.1 4 DH 0.08I 9423 337 3210 508 0.01422 III.1 5 DH 0.034I 9435 337 3205 611 0.003197 III.1 5 DH 0.103I 9449 440 2949 622 0.005978 II.1 6 DH 0.04I 9465 292 3915 1043 0.2306 I.1 0 DH 0.19I 9471 337 3217 227 0.008701 III.1 5 DH 0.03I 9489 337 3206 228 0.004796 III.1 5 DH 0.03I 9587 320 3116 229 0.001615 II.1 4 DH 0.03I 9591 440 3152 83 0.1824 II.1 6 DH 0.12I 9592 440 2947 83 0.1696 II.1 6 DH 0.09I 9599 440 3160 83 0.05952 II.1 6 DH 0.09I 9602 442 3171 618 0.01369 II.1 5 DH 0.05I 9653 480 2994 561 0.05315 II.1 5 DH 0.04I 9694 300 2995 381 0.0562 II.1 4 DH 0.1I 9773 339 6949 380 0.02104 III.1 4 DH 0.09I 10216 338 1376 1855 0.00144 III.1 4 DH 0.086I 10224 338 5488 1925 0.03923 III.1 4 DH 0.07I 10228 1 5483 3014 0.02667 I.2 2 DH 0.06I 10230 330 5391 1925 0.01697 III.1 5 DH 0.09I 10270 337 2355 1756 0.01226 III.1 5 DH 0.05

Table C-2. (continued).
Site Drum ID IDC Sealed Aspiration Wattage Waste Number of Sampling Flammable gasID no. time time (days) material layers of location concentration(a)
(days) type confinement (Vol%)
(b)
C-15
I 10273 337 2268 1411 0.005739 III.1 5 DH 0.03I 10276 337 2321 2184 0.02554 III.1 5 DH 0.03I 10305 442 1977 2410 0.000461 II.1 5 DH 0.03I 10364 337 2253 2197 0.006677 III.1 5 DH 0.04I 10365 337 2253 2265 0.01742 III.1 5 DH 0.02I 10370 337 2337 2153 0.02405 III.1 5 DH 0.03I 10371 337 2293 1620 0.006318 III.1 5 DH 0.02I 10387 337 2309 1400 0.005651 III.1 5 DH 0.03I 10411 337 2059 1965 0.004242 III.1 5 DH 0.05I 10416 337 2059 1672 0.01085 III.1 5 DH 0.04I 10449 300 2034 2551 0.05971 II.1 4 DH 0.014I 10480 374 2021 2581 0.004171 III.1 4 DH 0.014I 10492 480 2033 2008 0.000432 II.1 5 DH 0.04I 10498 480 2064 2003 0.1455 II.1 5 DH 0.05I 10512 337 5573 1573 0.003843 III.1 5 DH 0.02I 10578 432 5608 2105 0.01142 III.1 4 DH 0.097I 10578 432 5608 2105 0.01142 III.1 4 IB 0.181I 10604 2 5566 2853 0.003582 I.2 2 DH 0.014I 10606 330 5463 2131 0.02106 III.1 5 DH 0.09I 10617 336 5476 2468 0.000061 III.1 4 DH 0.03I 10655 330 5481 2468 0.01738 III.1 5 DH 0.06I 10663 337 5596 1712 0.00042 III.1 5 DH 0.086I 10699 330 7698 231 0.01302 III.1 5 DH 0.03I 10705 336 5566 2453 0.0106 III.1 4 DH 0.03I 10734 1 5499 3055 0.077234 I.2 2 DH 0.05I 10739 1 5573 3034 0.042088 I.2 2 DH 0.03I 10797 1 5503 3055 0.06254 I.2 2 DH 0.08I 10800 338 5573 1785 0.024 III.1 4 DH 0.04I 10808 337 5454 1967 0.00481 III.1 5 IB 0.034I 10808 337 5454 1967 0.00481 III.1 5 DH 0.034I 10837 432 5607 2105 0.0173 III.1 4 DH 0.14I 10848 338 5578 1769 0.05097 III.1 4 DH 0.04I 10883 432 5589 2091 0.02182 III.1 4 DH 0.05I 10910 441 5280 3022 0.000595 III.1 5 DH 0.014I 10921 371 5596 2084 0.03025 III.1 5 DH 0.05I 10922 432 5609 3245 0.02633 III.1 4 DH 0.05I 10976 2 5450 2983 0.001039 I.2 2 DH 0.014I 11042 442 1864 2170 0.01809 II.1 5 DH 0.04I 11044 440 1980 2169 0.003545 II.1 6 DH 0.05I 11156 376 2150 2680 0.02043 III.1 4 DH 0.02I 11162 432 2150 2951 0.1259 III.1 4 DH 0.324I 11173 480 2164 2041 0.03429 II.1 5 DH 0.13I 11224 300 590 4232 0.01839 II.1 4 DH 0.014I 11259 330 5480 2468 0.03326 III.1 5 DH 0.03I 11274 440 5620 2453 0.005625 II.1 6 DH 0.03I 11393 480 2986 552 0.00237 II.1 5 DH 0.05I 11415 480 5590 2020 0.002579 II.1 5 DH 0.125

Table C-2. (continued).
Site Drum ID IDC Sealed Aspiration Wattage Waste Number of Sampling Flammable gasID no. time time (days) material layers of location concentration(a)
(days) type confinement (Vol%)
(b)
C-16
I 11416 337 5594 2057 0.004033 III.1 5 DH 0.04I 11433 330 5597 1712 0.000527 III.1 5 DH 0.086I 11482 371 5562 2468 0.001296 III.1 5 DH 0.03I 11498 432 5633 2091 0.02963 III.1 4 DH 0.09I 11607 330 5576 1764 0.000907 III.1 5 DH 0.06I 11637 338 5573 1840 0.02325 III.1 4 DH 0.05I 11638 336 5491 2468 0.002951 III.1 4 DH 0.03I 11653 432 5633 2091 0.02757 III.1 4 DH 0.07I 11695 336 5579 2468 0.000464 III.1 4 DH 0.03I 11699 480 5574 2453 0.007889 II.1 5 DH 0.03I 11735 330 5581 2057 0.005497 III.1 5 DH 0.034I 11749 441 5490 2098 0.007546 III.1 5 DH 0.04I 11799 292 3038 236 0.0127 I.1 0 DH 0.04I 11801 292 3048 226 0.0208 I.1 0 DH 0.06I 12108 292 2290 2313 0.04051 I.1 0 DH 0.09I 12111 337 1717 1791 0.007315 III.1 5 DH 0.03I 12266 1 5571 3037 0.053961 I.2 2 DH 0.05I 12300 970 5598 2468 0.006108 III.1 4 DH 0.03I 12313 336 5580 1712 0.001622 III.1 4 DH 0.03I 12317 1 5595 3062 0.015738 I.2 2 DH 0.02I 12320 336 5586 2057 0.007294 III.1 4 DH 0.04I 12324 335 5561 1573 0.01257 III.1 4 DH 0.02I 12357 480 5581 2433 0.001861 II.1 5 DH 0.04I 12433 338 5489 1785 0.02195 III.1 4 DH 0.04I 12469 1 1967 2502 0.02495 I.2 2 DH 0.04I 12471 338 5579 1840 0.07667 III.1 4 DH 0.05I 12480 2 5353 2983 0.000664 I.2 2 DH 0.014I 12487 440 5489 1916 0.004524 II.1 6 DH 0.04I 12541 442 5476 2164 0.003935 II.1 5 DH 0.04I 12683 1 2354 3153 0.266131 I.2 2 DH 0.09I 12802 337 2387 1840 0.000455 III.1 5 DH 0.08I 12809 480 5599 2020 0.01463 II.1 5 DH 0.04I 12873 2 5566 3141 0.003844 I.2 2 DH 0.02I 12874 336 5594 2131 0.002588 III.1 4 DH 0.09I 12875 432 5597 2091 0.01113 III.1 4 DH 0.097I 12878 480 5597 2000 0.0077 II.1 5 DH 0.126I 12881 432 5580 2468 0.0297 III.1 4 DH 0.08I 12885 330 5588 2468 0.001328 III.1 5 DH 0.03I 12891 330 5496 2057 0.009838 III.1 5 DH 0.034I 12898 490 5289 3014 0.01859 III.1 4 DH 0.014I 12902 338 5587 1743 0.054 III.1 4 DH 0.04I 12914 374 5287 3014 0.000129 III.1 4 DH 0.014I 12986 302 5579 1846 0.002531 III.1 4 DH 0.034I 12998 337 5587 2057 0.01068 III.1 5 DH 0.05I 13003 823 3612 53 0.001 I.3 2 DH 0.02I 13040 823 3597 47 0.001295 I.3 2 DH 0.02I 13042 823 3612 53 0.002361 I.3 2 DH 0.02

Table C-2. (continued).
Site Drum ID IDC Sealed Aspiration Wattage Waste Number of Sampling Flammable gasID no. time time (days) material layers of location concentration(a)
(days) type confinement (Vol%)
(b)
C-17
I 13171 822 3612 53 0.03969 I.3 2 DH 0.26I 13182 817 3656 53 0.041653 I.3 2 DH 0.09I 13184 817 3656 53 0.040472 I.3 2 DH 0.06I 13188 823 3635 53 0.002698 I.3 2 DH 0.02I 13197 823 3639 53 0.002518 I.3 2 DH 0.02I 13204 823 3639 53 0.00519 I.3 2 DH 0.03I 13229 432 3029 12 0.003608 III.1 4 DH 0.125I 13231 300 2380 379 0.1261 II.1 4 DH 0.06I 13252 371 2686 663 0.1422 III.1 5 DH 0.13I 13266 339 2621 303 0.0941 III.1 4 DH 0.12I 13269 440 2797 508 0.003416 II.1 6 DH 0.06I 13313 440 2872 632 0.006308 II.1 6 DH 0.04I 13342 440 2786 392 0.001773 II.1 6 DH 0.05I 13361 292 4095 54 0.006058 I.1 0 DH 0.02I 13527 336 5585 2084 0.001062 III.1 4 DH 0.04I 13531 440 5584 2537 0.009778 II.1 6 DH 0.02I 13620 970 5600 2832 0.0197 III.1 4 DH 0.014I 13661 336 5566 2468 0.000697 III.1 4 DH 0.03I 13677 338 5579 1785 0.09592 III.1 4 DH 0.04I 13696 480 2462 1551 0.002051 II.1 5 DH 0.02I 13751 480 5485 2007 0.00153 II.1 5 DH 0.125I 13763 339 2406 1 0.02838 III.1 4 DH 0.13I 13818 1 3573 278 0.05129 I.2 2 DH 0.04I 13847 300 2666 385 0.02832 II.1 4 DH 0.04I 13860 339 2284 324 0.08593 III.1 4 DH 0.08I 13876 7 3626 302 0.001195 I.2 2 DH 0.03I 13885 292 3087 1042 0.06201 I.1 0 DH 0.21I 14007 1 3113 3 0.6162 I.2 2 DH 0.26I 14330 303 2578 266 0.07183 II.1 4 DH 0.07I 14339 432 2446 650 0.03313 III.1 4 DH 0.13I 14342 303 2596 262 0.1233 II.1 4 DH 0.04I 14345 432 2461 632 0.01963 III.1 4 DH 0.05I 14346 339 2462 374 0.09625 III.1 4 DH 0.12I 14357 339 2585 112 0.01839 III.1 4 DH 0.02I 14362 490 2429 612 0.07629 III.1 4 DH 0.09I 14466 302 2610 670 0.00622 III.1 4 DH 0.314I 14484 300 2693 545 0.149025 II.1 4 DH 0.04I 15241 442 3107 618 0.008252 II.1 5 DH 0.05I 15249 300 3020 262 0.08344 II.1 4 DH 0.04I 15675 480 3023 548 0.08593 II.1 5 DH 0.06I 16597 481 3099 629 0.04594 II.1 5 DH 0.05I 16612 442 3096 629 0.06395 II.1 5 DH 0.04I 16790 300 3063 380 0.005498 II.1 4 DH 0.07I 16986 442 3166 629 0.002706 II.1 5 DH 0.04I 17148 432 3105 630 0.007292 III.1 4 DH 0.05I 17444 300 3062 559 0.01043 II.1 4 DH 0.04I 17491 300 3409 172 0.02066 II.1 4 DH 0.126

Table C-2. (continued).
Site Drum ID IDC Sealed Aspiration Wattage Waste Number of Sampling Flammable gasID no. time time (days) material layers of location concentration(a)
(days) type confinement (Vol%)
(b)
C-18
I 17495 442 3096 650 0.03958 II.1 5 DH 0.04I 17698 292 3935 182 0.3867 I.1 0 DH 0.77I 17709 1 3439 121 0.005946 I.2 2 DH 0.04I 17742 440 3118 629 0.007796 II.1 6 DH 0.04I 17759 432 3104 645 0.003707 III.1 4 IB 0.274I 17759 432 3104 645 0.003707 III.1 4 DH 0.126I 18152 1 3858 643 0.02707 I.2 2 DH 0.024I 18181 292 3849 1041 0.001399 I.1 0 DH 0.02I 18195 292 3875 1040 0.01964 I.1 0 DH 0.06I 18229 292 3875 1040 0.1118 I.1 0 DH 0.08I 18299 376 2505 89 0.01875 III.1 4 DH 0.05I 18413 300 2830 230 0.03744 II.1 4 DH 0.03I 18441 300 3101 83 0.1462 II.1 4 DH 0.09I 18456 822 3937 53 0.007286 I.3 2 DH 0.02I 18476 292 3000 208 0.00824 I.1 0 DH 0.03I 18491 300 2925 84 0.06244 II.1 4 DH 0.09I 18806 800 3710 139 0.050657 I.2 2 DH 0.02I 19410 339 2996 208 0.002744 III.1 4 DH 0.034I 19413 339 2974 229 0.00662 III.1 4 DH 0.044I 19413 339 2974 229 0.00662 III.1 4 IB 0.047I 19413 339 2974 229 0.00662 III.1 4 IB 0.047I 19572 339 3069 83 0.05664 III.1 4 DH 0.11I 19664 803 3723 7 0.0045 I.2 2 DH 0.05I 20903 807 3153 35 0.001875 I.2 2 DH 0.02I 20937 481 2319 2237 0.005337 II.1 5 DH 0.02I 20969 440 2296 2191 0.009684 II.1 6 DH 0.014I 21392 292 3892 307 0.2092 I.1 0 DH 0.34I 21442 1 1783 1717 0.01926 I.2 2 DH 0.08I 21622 480 2366 1783 0.01118 II.1 5 DH 0.04I 21661 374 2402 2297 9.54E-05 III.1 4 DH 0.014I 21740 440 2519 2259 0.1255 II.1 6 DH 0.03I 21806 440 2351 1670 0.01156 II.1 6 DH 0.05I 22023 442 2539 2365 0.000996 II.1 5 DH 0.014I 22102 432 2520 1982 0.04998 III.1 4 DH 0.18I 22119 371 2378 1805 0.134 III.1 5 DH 0.09I 22226 371 2358 2140 0.3812 III.1 5 DH 0.03I 22228 371 2267 1896 0.2113 III.1 5 DH 0.09I 22230 371 2253 1910 0.117 III.1 5 DH 0.09I 22271 480 2319 1733 0.01663 II.1 5 DH 0.05I 22275 480 2134 1877 0.06749 II.1 5 DH 0.05I 22290 376 2269 2574 3.57E-05 III.1 4 DH 0.014I 22291 376 2280 2379 6.27E-05 III.1 4 DH 0.014I 22293 480 2146 1896 0.009918 II.1 5 DH 0.125I 22296 1 2321 1644 0.06173 I.2 2 DH 0.08I 22306 440 2372 1812 0.003201 II.1 6 DH 0.04I 22347 440 2366 1643 0.0649 II.1 6 DH 0.04I 22358 480 2392 1709 0.003205 II.1 5 DH 0.04

Table C-2. (continued).
Site Drum ID IDC Sealed Aspiration Wattage Waste Number of Sampling Flammable gasID no. time time (days) material layers of location concentration(a)
(days) type confinement (Vol%)
(b)
C-19
I 22416 320 2479 2141 0.0484 II.1 4 DH 0.07I 22434 432 2506 1744 0.127 III.1 4 DH 0.15I 22450 320 2645 2134 0.057 II.1 4 DH 0.03I 22511 480 2372 1841 0.00265 II.1 5 DH 0.05I 22517 432 2408 1807 0.0482 III.1 4 DH 0.16I 22539 432 2459 1756 0.1084 III.1 4 DH 0.32I 22549 480 2372 1764 0.003253 II.1 5 IB 0.125I 22552 442 2424 1778 0.008079 II.1 5 DH 0.04I 22790 292 2283 1587 0.02391 I.1 0 DH 0.09I 22803 371 2321 1842 0.1386 III.1 5 DH 0.09I 22811 7 2206 1629 0.001492 I.2 2 DH 0.034I 22874 371 2358 1798 0.1159 III.1 5 DH 0.14I 22880 376 2251 2364 0.000228 III.1 4 DH 0.014I 22920 292 2239 3018 0.07323 I.1 0 DH 0.16I 22923 440 2243 1846 0.004188 II.1 6 DH 0.04I 23005 7 2190 1966 0.001015 I.2 2 DH 0.09I 23033 292 2373 2933 0.04545 I.1 0 DH 0.13I 23041 371 2358 2170 0.2705 III.1 5 DH 0.04I 23048 432 2193 1868 0.0717 III.1 4 DH 0.13I 23211 376 2187 83 0.000025 III.1 4 DH 0.09I 23212 480 2061 2387 0.04851 II.1 5 DH 0.03I 23227 480 2056 1964 0.02176 II.1 5 DH 0.05I 23235 336 2124 2387 0.05278 III.1 4 DH 0.12I 23246 481 2336 2280 0.1793 II.1 5 DH 0.07I 23266 7 2206 2301 0.001179 I.2 2 DH 0.02I 23285 7 2281 1887 0.008244 I.2 2 DH 0.09I 23290 371 2335 2198 0.1409 III.1 5 DH 0.03I 23301 337 2126 1556 0.006745 III.1 5 DH 0.03I 23384 339 1933 1646 0.07953 III.1 4 DH 0.06I 23388 330 2389 1564 0.002529 III.1 5 DH 0.03I 23662 442 2407 1870 0.007999 II.1 5 DH 0.04I 23739 440 2530 2279 0.05366 II.1 6 DH 0.02I 23771 330 2499 2225 0.1163 III.1 5 DH 0.16I 23805 480 2680 1722 0.0385 II.1 5 DH 0.04I 23840 337 2520 1408 0.03826 III.1 5 DH 0.03I 23844 480 2677 1741 0.1482 II.1 5 DH 0.04I 23901 330 2416 1423 0.000042 III.1 5 DH 0.086I 23929 440 2307 2193 0.01352 II.1 6 DH 0.04I 23959 480 2320 1832 0.08892 II.1 5 DH 0.04I 23984 300 2316 2286 0.0628 II.1 4 DH 0.02I 24028 440 2275 2254 0.1405 II.1 6 DH 0.03I 24029 480 2252 1577 0.046 II.1 5 DH 0.04I 24057 292 18281 3058 0.08208 I.1 0 DH 0.19I 24059 292 2584 1945 0.1272 I.1 0 DH 0.38I 24086 337 2507 2176 0.07016 III.1 5 DH 0.06I 24088 337 2288 1863 0.003458 III.1 5 DH 0.04I 24090 337 2313 1499 0.01942 III.1 5 DH 0.03

Table C-2. (continued).
Site Drum ID IDC Sealed Aspiration Wattage Waste Number of Sampling Flammable gasID no. time time (days) material layers of location concentration(a)
(days) type confinement (Vol%)
(b)
C-20
I 24092 337 2289 1868 0.01136 III.1 5 IB 0.126I 24092 337 2289 1868 0.01136 III.1 5 DH 0.126I 24095 337 2381 1510 0.02475 III.1 5 DH 0.03I 24102 337 2366 1870 0.01499 III.1 5 DH 0.05I 24106 337 2403 1864 0.01802 III.1 5 DH 0.04I 24113 337 2344 1869 0.03259 III.1 5 DH 0.05I 24159 336 2501 1232 0.007108 III.1 4 DH 0.03I 24165 337 2330 1821 0.01284 III.1 5 DH 0.04I 24168 330 2480 1736 0.08586 III.1 5 DH 0.04I 24190 480 2845 1098 0.009825 II.1 5 DH 0.03I 24273 442 2380 1897 0.004586 II.1 5 DH 0.04I 24279 442 2505 2310 0.007361 II.1 5 DH 0.014I 24289 440 2382 2285 0.00454 II.1 6 DH 0.03I 24358 480 2751 1699 0.008657 II.1 5 DH 0.05I 24506 374 2121 84 0.000033 III.1 4 DH 0.09I 24662 480 2627 1810 0.006986 II.1 5 DH 0.04I 24786 480 2677 1737 0.008052 II.1 5 DH 0.086I 24807 480 2631 1350 0.004975 II.1 5 DH 0.08I 24862 480 2431 1930 0.01922 II.1 5 DH 0.05I 24884 480 2430 1916 0.016 II.1 5 DH 0.05I 24920 1 2655 2095 0.06473 I.2 2 DH 0.09I 27455 1 2877 2793 0.052005 I.2 2 DH 0.03I 27540 1 2628 2574 0.187952 I.2 2 DH 0.1I 27877 481 2916 2443 0.1293 II.1 5 DH 0.014I 29152 1 3137 2780 0.875811 I.2 2 DH 0.12I 29699 292 3322 2800 0.060003 I.1 0 DH 0.14I 30585 440 3259 2414 0.004579 II.1 6 DH 0.014I 31128 7 2205 2604 0.003228 I.2 2 DH 0.02I 31502 432 2267 2757 0.001342 III.1 4 DH 0.02I 31507 7 2227 2595 0.003311 I.2 2 DH 0.02I 31546 7 49 4787 0.000788 I.2 2 DH 0.02I 31689 7 2268 2412 0.001379 I.2 2 DH 0.014I 31711 1 2296 2532 0.059739 I.2 2 DH 0.02I 31806 7 2360 2661 0.002121 I.2 2 DH 0.02I 32284 339 2237 1358 0.1012 III.1 4 DH 0.26I 32287 7 2013 2299 0.001138 I.2 2 DH 0.03I 32467 337 2334 1638 0.005336 III.1 5 DH 0.04I 32469 337 2326 2083 0.005999 III.1 5 DH 0.03I 32471 337 2340 1148 0.008494 III.1 5 DH 0.02I 32473 337 2326 1632 0.003387 III.1 5 DH 0.04I 32485 337 2334 1632 0.00653 III.1 5 DH 0.04I 32517 339 2288 2065 0.04699 III.1 4 DH 0.11I 32521 339 2288 1416 0.1454 III.1 4 DH 0.33I 32525 339 2289 1324 0.07472 III.1 4 DH 0.2I 32526 339 2326 1344 0.08137 III.1 4 DH 0.1I 32529 336 2088 1540 0.002605 III.1 4 DH 0.086I 32540 480 2293 1667 0.05009 II.1 5 DH 0.05

Table C-2. (continued).
Site Drum ID IDC Sealed Aspiration Wattage Waste Number of Sampling Flammable gasID no. time time (days) material layers of location concentration(a)
(days) type confinement (Vol%)
(b)
C-21
I 32669 480 2265 2086 0.0329 II.1 5 DH 0.04I 32715 337 2226 2091 0.008001 III.1 5 DH 0.03I 32741 480 2246 1609 0.008277 II.1 5 DH 0.04I 32748 339 2264 1182 0.02229 III.1 4 DH 0.08I 33091 339 2251 1432 0.03681 III.1 4 DH 0.1
a. I = INEELb. DH = Drum headspace; IB = Inner bag (Innermost confinement layer)

C-22
Table C-3. RFETS TWCP data supplied as input to the NEWGVALS code.
Site Drum ID time Aspiration material layers of Sampling concentrationID no. IDC (days) time (days) Wattage type confinement location (Vol%)(a)
Sealed Waste Number of Flammable gas
(b)
R D17184 800 2192 0 0.254885 I.2 2 DH 0.603R D35301 800 2227 0 0.366808 I.2 2 DH 0.0033R D60290 800 2324 0 0.123053 I.2 2 DH 0.3577R D61005 800 2698 0 0.087548 I.2 2 DH 4.9286R D61005 800 2698 15 0.087548 I.2 2 RL 0.1464R D61471 800 2527 0 0.254885 I.2 2 DH 3.5007R D63330 800 2702 0 0.087548 I.2 2 DH 7.7303R D63330 800 2702 0 0.087548 I.2 2 RL 5.1857R D63341 800 2670 0 0.087548 I.2 2 DH 7.2299R D63341 800 2670 0 0.087548 I.2 2 RL 6.859R D63344 800 2668 0 0.087548 I.2 2 DH 6.3753R D63344 800 2668 0 0.087548 I.2 2 RL 5.4401R D63484 800 2640 0 0.130186 I.2 2 DH 0.0513R D63484 800 2640 0 0.130186 I.2 2 RL 0.0498R D64197 800 2635 0 0.130186 I.2 2 DH 0.0033R D64197 800 2635 0 0.130186 I.2 2 RL 0.0353R D64383 800 2648 0 0.199001 I.2 2 DH 1.0475R D64383 800 2648 1 0.199001 I.2 2 RL 0.8172R D64631 800 2646 0 0.199001 I.2 2 DH 3.8746R D64631 800 2646 0 0.199001 I.2 2 RL 1.9622R D64632 800 2261 0 0.250653 I.2 2 DH 3.0205R D64997 800 2605 0 0.254885 I.2 2 DH 14.5676R D64997 800 2605 0 0.254885 I.2 2 RL 11.9154R D66525 800 1485 163 0.001176 I.2 2 DH 0.0097R D66525 800 1485 0 0.001176 I.2 2 DH 3.4368R D66525 800 1485 163 0.001176 I.2 2 IB 0.0497R D67434 800 1492 134 0.001176 I.2 2 DH 0.0035R D67434 800 1492 0 0.001176 I.2 2 DH 1.9198R D67434 800 1492 134 0.001176 I.2 2 IB 0.0083R D67436 800 1492 184 0.016302 I.2 2 DH 0.0038R D67436 800 1492 0 0.016302 I.2 2 DH 3.1291R D67436 800 1492 184 0.016302 I.2 2 IB 0.025R D67441 800 1493 134 0.015127 I.2 2 DH 0.0035R D67441 800 1493 0 0.015127 I.2 2 DH 1.4476R D67441 800 1493 134 0.015127 I.2 2 IB 0.0095R D67654 800 1493 169 0.015127 I.2 2 DH 0.0035R D67654 800 1493 0 0.015127 I.2 2 DH 2.5138R D67654 800 1493 169 0.015127 I.2 2 IB 0.0258R D67656 800 2178 0 0.013951 I.2 2 DH 1.3536R D67657 800 1493 170 0.015127 I.2 2 DH 0.0046R D67657 800 1493 0 0.015127 I.2 2 DH 1.7896R D67657 800 1493 170 0.015127 I.2 2 IB 0.0196R D67670 800 2473 0 0.015127 I.2 2 DH 1.2173R D67670 800 2473 1 0.015127 I.2 2 RL 1.2681R D68241 800 2351 0 0.024611 I.2 2 DH 0.1003R D68247 800 1485 167 0.001176 I.2 2 DH 0.0035R D68247 800 1485 0 0.001176 I.2 2 DH 0.0593

Table C-3. (continued).
Site Drum ID time Aspiration material layers of Sampling concentrationID no. IDC (days) time (days) Wattage type confinement location (Vol%)(a)
Sealed Waste Number of Flammable gas
(b)
C-23
R D68247 800 1485 167 0.001176 I.2 2 IB 0.0101R D68254 800 1488 169 0.001176 I.2 2 DH 0.0035R D68254 800 1488 0 0.001176 I.2 2 DH 0.0593R D68254 800 1488 169 0.001176 I.2 2 IB 0.0123R D68255 800 2466 0 0.013951 I.2 2 DH 0.1091R D68255 800 2466 0 0.013951 I.2 2 RL 0.2778R D68256 800 1491 183 0.002351 I.2 2 DH 0.005R D68256 800 1491 0 0.002351 I.2 2 DH 0.6887R D68256 800 1491 183 0.002351 I.2 2 IB 0.0226R D68261 800 2460 0 0.002351 I.2 2 DH 0.1706R D68261 800 2460 0 0.002351 I.2 2 RL 0.1706R D68480 800 1456 182 0.062702 I.2 2 DH 0.0321R D68480 800 1456 0 0.062702 I.2 2 DH 0.1798R D68480 800 1456 182 0.062702 I.2 2 IB 0.1799R D68483 800 2439 0 0.256376 I.2 2 DH 0.2947R D68606 800 2240 0 0.005643 I.2 2 DH 0.0033R D68983 800 2429 0 0.062702 I.2 2 DH 0.0133R D68983 800 2429 15 0.062702 I.2 2 RL 0.0087R D68992 800 2423 0 0.283257 I.2 2 DH 9.1399R D68992 800 2423 14 0.283257 I.2 2 RL 3.125R D69299 800 2407 0 0.149465 I.2 2 DH 12.9093R D69299 800 2407 0 0.149465 I.2 2 RL 12.8742R D69310 800 2212 0 0.202683 I.2 2 DH 2.2688R D69312 800 1427 135 0.149465 I.2 2 DH 0.0153R D69312 800 1427 0 0.149465 I.2 2 DH 10.0655R D69312 800 1427 135 0.149465 I.2 2 IB 0.019R D70213 800 2333 0 0.531714 I.2 2 DH 0.528R D70213 800 2333 0 0.531714 I.2 2 RL 0.7441R D70335 800 2350 0 0.003291 I.2 2 DH 3.0993R D70335 800 2350 1 0.003291 I.2 2 RL 1.0795R D70422 800 2052 0 0.051102 I.2 2 DH 0.7185R D72267 800 1287 191 0.010471 I.2 2 DH 0.0035R D72267 800 1287 0 0.010471 I.2 2 DH 0.0593R D72267 800 1287 191 0.010471 I.2 2 IB 0.022R D72545 800 1278 183 0.009868 I.2 2 DH 0.0035R D72545 800 1278 0 0.009868 I.2 2 DH 0.0593R D72545 800 1278 183 0.009868 I.2 2 IB 0.0232R D76138 1 3136 126 0.120702 I.2 2 DH 0.0165R D76138 1 3136 0 0.120702 I.2 2 DH 0.0147R D76138 1 3136 126 0.120702 I.2 2 IB 0.0803R D76142 1 2755 70 0.123053 I.2 2 DH 0.0129R D76142 1 2755 0 0.123053 I.2 2 DH 0.0078R D76142 1 2755 70 0.123053 I.2 2 IB 0.0488R D76144 1 3755 126 0.134808 I.2 2 DH 0.0341R D76144 1 3755 0 0.134808 I.2 2 DH 0.0097R D76144 1 3755 126 0.134808 I.2 2 IB 0.0838R D76182 1 4486 0 0.257861 I.2 2 DH 0.0762

Table C-3. (continued).
Site Drum ID time Aspiration material layers of Sampling concentrationID no. IDC (days) time (days) Wattage type confinement location (Vol%)(a)
Sealed Waste Number of Flammable gas
(b)
C-24
R D76183 1 2861 309 0.148914 I.2 2 DH 0.0374R D76183 1 2861 0 0.148914 I.2 2 DH 0.0349R D76183 1 2861 309 0.148914 I.2 2 IB 0.1373R D76185 1 1071 63 0.123053 I.2 2 DH 0.0111R D76185 1 1071 0 0.123053 I.2 2 DH 0.0059R D76185 1 1071 63 0.123053 I.2 2 IB 0.0353R D76194 1 3253 0 0.120702 I.2 2 DH 0.021R D76199 1 3001 309 0.132457 I.2 2 DH 0.028R D76199 1 3001 309 0.132457 I.2 2 IB 0.1075R D76205 1 2869 63 0.123053 I.2 2 DH 0.0285R D76205 1 2869 0 0.123053 I.2 2 DH 0.0035R D76205 1 2869 63 0.123053 I.2 2 IB 0.1267R D76287 1 4229 146 0.002351 I.2 2 DH 0.0092R D76287 1 4229 0 0.002351 I.2 2 DH 0.0081R D76287 1 4229 146 0.002351 I.2 2 IB 0.0235R D76302 1 3079 126 0.120702 I.2 2 DH 0.0126R D76302 1 3079 0 0.120702 I.2 2 DH 0.0076R D76302 1 3079 126 0.120702 I.2 2 IB 0.0215R D76305 1 4165 0 0.000235 I.2 2 DH 0.0057R D13364 480 2122 0 0.132457 II.1 4 DH 1.5656R D36606 480 1238 0 0.019632 II.1 4 DH 0.0593R D46848 320 2858 0 0.350303 II.1 4 DH 0.0033R D53211 442 2852 0 0.070531 II.1 4 DH 0.0168R D53211 442 2852 0 0.070531 II.1 4 RL 0.0368R D53886 320 3245 0 0.376964 II.1 4 DH 0.0798R D53886 320 3245 0 0.376964 II.1 4 RL 0.0033R D54192 480 2211 0 3.48E-06 II.1 4 DH 0.0117R D57847 480 1082 0 0.002351 II.1 4 DH 0.0593R D58347 321 3605 0 0.027361 II.1 4 DH 0.0024R D59077 438 2903 0 0.011755 II.1 4 RL 4.5287R D59568 377 3012 331 0.002628 II.1 4 DH 0.0018R D59663 438 2988 0 0.025861 II.1 4 DH 0.0872R D60463 444 1140 0 0.007053 II.1 4 DH 0.0137R D60525 440 2562 0 0.011755 II.1 4 RL 1.4303R D60684 300 3115 252 0.016613 II.1 4 DH 0.0018R D61905 377 3011 330 0.001596 II.1 4 DH 0.0018R D61961 377 3012 330 0.002494 II.1 4 DH 0.0021R D62018 377 3007 335 0.004426 II.1 4 DH 0.0018R D62049 442 2741 0 0.021159 II.1 4 RL 0.1508R D62179 440 3184 0 0.002288 II.1 4 RL 0.0018R D62545 480 2506 0 0.349551 II.1 4 DH 2.0743R D62545 480 2506 0 0.349551 II.1 4 RL 4.3922R D62579 377 3348 0 0.005538 II.1 4 RL 0.003R D62759 442 2742 0 0.007053 II.1 4 RL 0.0454R D63441 442 2733 0 0.002351 II.1 4 DH 0.0838R D63441 442 2733 0 0.002351 II.1 4 RL 0.0859R D63442 442 2733 0 0.018808 II.1 4 DH 1.1065

Table C-3. (continued).
Site Drum ID time Aspiration material layers of Sampling concentrationID no. IDC (days) time (days) Wattage type confinement location (Vol%)(a)
Sealed Waste Number of Flammable gas
(b)
C-25
R D63442 442 2733 0 0.018808 II.1 4 RL 0.6914R D63446 442 2734 0 0.122253 II.1 4 DH 19.4369R D63446 442 2734 0 0.122253 II.1 4 RL 18.7192R D64480 480 2624 0 3.6E-07 II.1 4 DH 0.0033R D64538 442 2697 0 0.000268 II.1 4 RL 0.0116R D64562 442 2690 0 0.00047 II.1 4 DH 0.0439R D64562 442 2690 0 0.00047 II.1 4 RL 0.0443R D64720 312 2877 203 0.024233 II.1 4 DH 0.0018R D64752 480 1321 0 0.003615 II.1 4 DH 0.0593R D65734 480 2071 0 0.032914 II.1 4 DH 0.0059R D65738 300 2878 200 0.037353 II.1 4 DH 0.0018R D65957 312 2844 287 0.002923 II.1 4 DH 0.0018R D66090 300 2835 200 0.027358 II.1 4 DH 0.0037R D66157 480 1526 0 0.002351 II.1 4 DH 0.2771R D66670 442 2566 0 4.51E-05 II.1 4 RL 0.0569R D66679 442 2560 0 0.007053 II.1 4 DH 0.4567R D66682 442 2567 0 0.000801 II.1 4 RL 0.3742R D66709 442 2558 0 0.000364 II.1 4 DH 0.1507R D66709 442 2558 0 0.000364 II.1 4 RL 0.1095R D66773 480 1984 80 0.070531 II.1 4 DH 0.032R D66788 300 2837 229 0.017919 II.1 4 DH 0.0018R D66936 480 2383 0 0.001005 II.1 4 DH 0.3913R D66936 480 2383 0 0.001005 II.1 4 RL 0.1611R D67066 438 2527 0 0.131657 II.1 4 RL 10.9203R D67251 480 1490 0 0.000394 II.1 4 DH 0.0593R D67317 480 1471 0 0.011755 II.1 4 DH 0.4982R D67455 480 2056 0 0.063478 II.1 4 DH 0.4451R D67463 300 2796 229 0.023253 II.1 4 DH 0.0018R D67605 480 2461 0 0.116656 II.1 4 DH 4.3649R D67605 480 2461 0 0.116656 II.1 4 RL 2.3279R D67735 825 1745 0 0.000248 II.1 4 DH 0.0035R D67902 300 2759 200 0.031364 II.1 4 DH 0.0018R D67905 300 2934 0 0.034418 II.1 4 RL 0.0039R D68085 300 2899 0 0.025616 II.1 4 RL 0.0065R D68277 480 1743 0 0.043945 II.1 4 DH 0.0058R D68368 480 2308 0 0.1152 II.1 4 DH 0.6217R D68377 480 1475 0 0.000514 II.1 4 DH 0.0593R D68514 480 2054 0 0.002798 II.1 4 DH 0.3098R D68929 300 2920 0 0.017972 II.1 4 RL 0.0025R D68930 300 3001 0 0.023955 II.1 4 RL 0.0041R D69414 300 2904 0 0.018132 II.1 4 RL 0.0021R D69442 300 2903 0 0.033246 II.1 4 RL 0.0018R D70446 480 1316 0 0.030583 II.1 4 DH 0.0593R D71351 480 1352 0 0.025998 II.1 4 DH 0.0593R D71354 480 1347 0 0.005596 II.1 4 DH 0.0593R D71638 480 1312 0 0.002966 II.1 4 DH 0.0593R D72079 480 1506 0 0.03937 II.1 4 DH 0.0119

Table C-3. (continued).
Site Drum ID time Aspiration material layers of Sampling concentrationID no. IDC (days) time (days) Wattage type confinement location (Vol%)(a)
Sealed Waste Number of Flammable gas
(b)
C-26
R D72371 300 2780 0 0.014535 II.1 4 RL 0.0035R D72384 300 2751 0 0.029319 II.1 4 RL 0.0067R D72831 480 1279 0 0.009404 II.1 4 DH 0.0593R D75978 824 1626 0 0.002313 II.1 4 RL 0.0115R D76714 321 2319 0 0.035921 II.1 4 RL 0.0081R D76716 321 2335 0 0.025865 II.1 4 RL 0.0073R D78336 444 1433 0 0.000743 II.1 4 DH 0.0018R D85299 321 0 813 0.013568 II.1 4 DH 0.0063R D85389 824 0 870 0.007434 II.1 4 DH 0.007R D85406 824 0 870 0.011845 II.1 4 DH 0.0115R D85670 440 0 377 0.001196 II.1 4 DH 0.0133R D86658 480 0 352 0.000989 II.1 4 DH 0.0168R D86663 480 0 349 0.002645 II.1 4 DH 0.0042R D55521 825 2942 0 0.005061 III.1 4 RL 0.0073R D56036 832 2907 0 0.008834 III.1 4 RL 0.0218R D57202 832 2814 0 0.011201 III.1 4 RL 0.0222R D58972 822 2989 0 0.001933 III.1 4 RL 0.0018R D59898 825 3039 0 0.000771 III.1 4 RL 0.0027R D60704 822 2926 0 0.001685 III.1 4 RL 0.0056R D61288 825 2972 0 0.001625 III.1 4 RL 0.0753R D61804 825 2962 0 0.000332 III.1 4 RL 0.0018R D62184 825 2893 0 9.11E-05 III.1 4 RL 0.0063R D62353 831 3068 0 0.000225 III.1 4 RL 0.0018R D62548 822 2990 0 0.003728 III.1 4 RL 0.0282R D63572 825 3030 0 0.000338 III.1 4 RL 0.0018R D64270 832 3058 0 0.000595 III.1 4 RL 0.0026R D64413 825 3010 0 0.001123 III.1 4 RL 0.0035R D64708 339 2818 0 0.001656 III.1 4 RL 0.0037R D65122 822 3037 0 0.000384 III.1 4 RL 0.0018R D65123 831 3135 0 0.011231 III.1 4 RL 0.0396R D65302 831 3085 0 0.000864 III.1 4 RL 0.0023R D65448 825 3003 0 0.005294 III.1 4 RL 0.0018R D65515 822 3003 0 8.59E-05 III.1 4 RL 0.0018R D65721 833 3101 0 0.003027 III.1 4 RL 0.0108R D65722 831 3076 0 0.000238 III.1 4 RL 0.0018R D65768 822 2942 0 0.001337 III.1 4 RL 0.0018R D66126 822 3055 0 0.000733 III.1 4 RL 0.0482R D66464 832 3061 0 0.004 III.1 4 RL 0.0051R D66498 825 2926 0 0.00758 III.1 4 RL 0.0121R D66629 825 3039 0 0.00531 III.1 4 RL 0.0147R D66646 831 3056 0 0.001993 III.1 4 RL 0.0025R D66648 822 2995 0 0.001122 III.1 4 RL 0.0363R D66653 831 3070 0 0.002088 III.1 4 RL 0.0076R D66660 833 3079 0 0.003369 III.1 4 RL 0.0131R D66675 825 3058 0 0.000643 III.1 4 RL 0.0018R D66745 825 2980 0 0.000116 III.1 4 RL 0.0018R D66749 825 2968 0 0.000463 III.1 4 RL 0.0018
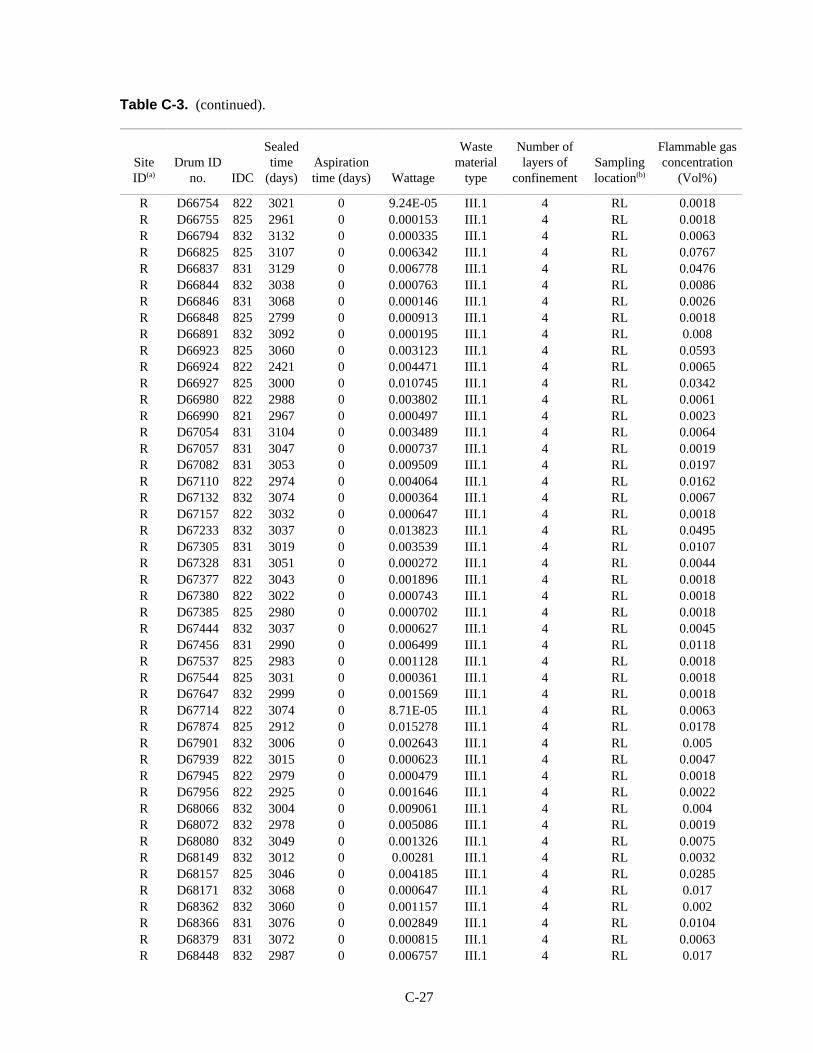
Table C-3. (continued).
Site Drum ID time Aspiration material layers of Sampling concentrationID no. IDC (days) time (days) Wattage type confinement location (Vol%)(a)
Sealed Waste Number of Flammable gas
(b)
C-27
R D66754 822 3021 0 9.24E-05 III.1 4 RL 0.0018R D66755 825 2961 0 0.000153 III.1 4 RL 0.0018R D66794 832 3132 0 0.000335 III.1 4 RL 0.0063R D66825 825 3107 0 0.006342 III.1 4 RL 0.0767R D66837 831 3129 0 0.006778 III.1 4 RL 0.0476R D66844 832 3038 0 0.000763 III.1 4 RL 0.0086R D66846 831 3068 0 0.000146 III.1 4 RL 0.0026R D66848 825 2799 0 0.000913 III.1 4 RL 0.0018R D66891 832 3092 0 0.000195 III.1 4 RL 0.008R D66923 825 3060 0 0.003123 III.1 4 RL 0.0593R D66924 822 2421 0 0.004471 III.1 4 RL 0.0065R D66927 825 3000 0 0.010745 III.1 4 RL 0.0342R D66980 822 2988 0 0.003802 III.1 4 RL 0.0061R D66990 821 2967 0 0.000497 III.1 4 RL 0.0023R D67054 831 3104 0 0.003489 III.1 4 RL 0.0064R D67057 831 3047 0 0.000737 III.1 4 RL 0.0019R D67082 831 3053 0 0.009509 III.1 4 RL 0.0197R D67110 822 2974 0 0.004064 III.1 4 RL 0.0162R D67132 832 3074 0 0.000364 III.1 4 RL 0.0067R D67157 822 3032 0 0.000647 III.1 4 RL 0.0018R D67233 832 3037 0 0.013823 III.1 4 RL 0.0495R D67305 831 3019 0 0.003539 III.1 4 RL 0.0107R D67328 831 3051 0 0.000272 III.1 4 RL 0.0044R D67377 822 3043 0 0.001896 III.1 4 RL 0.0018R D67380 822 3022 0 0.000743 III.1 4 RL 0.0018R D67385 825 2980 0 0.000702 III.1 4 RL 0.0018R D67444 832 3037 0 0.000627 III.1 4 RL 0.0045R D67456 831 2990 0 0.006499 III.1 4 RL 0.0118R D67537 825 2983 0 0.001128 III.1 4 RL 0.0018R D67544 825 3031 0 0.000361 III.1 4 RL 0.0018R D67647 832 2999 0 0.001569 III.1 4 RL 0.0018R D67714 822 3074 0 8.71E-05 III.1 4 RL 0.0063R D67874 825 2912 0 0.015278 III.1 4 RL 0.0178R D67901 832 3006 0 0.002643 III.1 4 RL 0.005R D67939 822 3015 0 0.000623 III.1 4 RL 0.0047R D67945 822 2979 0 0.000479 III.1 4 RL 0.0018R D67956 822 2925 0 0.001646 III.1 4 RL 0.0022R D68066 832 3004 0 0.009061 III.1 4 RL 0.004R D68072 832 2978 0 0.005086 III.1 4 RL 0.0019R D68080 832 3049 0 0.001326 III.1 4 RL 0.0075R D68149 832 3012 0 0.00281 III.1 4 RL 0.0032R D68157 825 3046 0 0.004185 III.1 4 RL 0.0285R D68171 832 3068 0 0.000647 III.1 4 RL 0.017R D68362 832 3060 0 0.001157 III.1 4 RL 0.002R D68366 831 3076 0 0.002849 III.1 4 RL 0.0104R D68379 831 3072 0 0.000815 III.1 4 RL 0.0063R D68448 832 2987 0 0.006757 III.1 4 RL 0.017
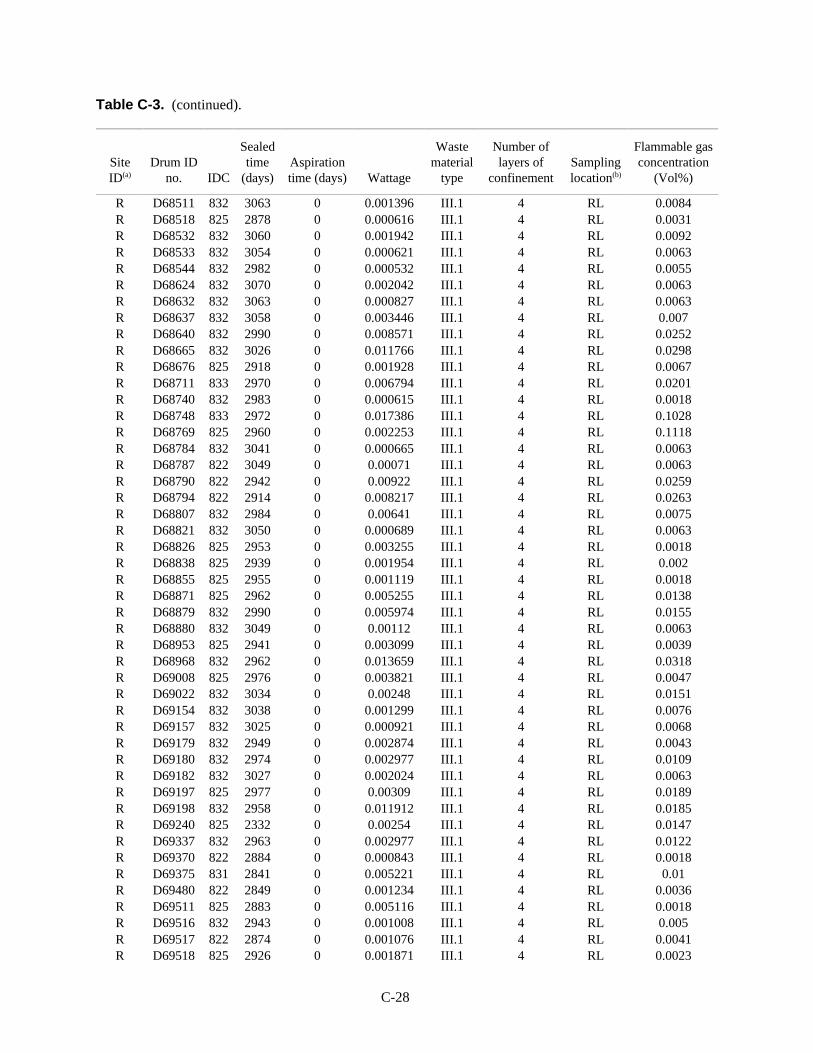
Table C-3. (continued).
Site Drum ID time Aspiration material layers of Sampling concentrationID no. IDC (days) time (days) Wattage type confinement location (Vol%)(a)
Sealed Waste Number of Flammable gas
(b)
C-28
R D68511 832 3063 0 0.001396 III.1 4 RL 0.0084R D68518 825 2878 0 0.000616 III.1 4 RL 0.0031R D68532 832 3060 0 0.001942 III.1 4 RL 0.0092R D68533 832 3054 0 0.000621 III.1 4 RL 0.0063R D68544 832 2982 0 0.000532 III.1 4 RL 0.0055R D68624 832 3070 0 0.002042 III.1 4 RL 0.0063R D68632 832 3063 0 0.000827 III.1 4 RL 0.0063R D68637 832 3058 0 0.003446 III.1 4 RL 0.007R D68640 832 2990 0 0.008571 III.1 4 RL 0.0252R D68665 832 3026 0 0.011766 III.1 4 RL 0.0298R D68676 825 2918 0 0.001928 III.1 4 RL 0.0067R D68711 833 2970 0 0.006794 III.1 4 RL 0.0201R D68740 832 2983 0 0.000615 III.1 4 RL 0.0018R D68748 833 2972 0 0.017386 III.1 4 RL 0.1028R D68769 825 2960 0 0.002253 III.1 4 RL 0.1118R D68784 832 3041 0 0.000665 III.1 4 RL 0.0063R D68787 822 3049 0 0.00071 III.1 4 RL 0.0063R D68790 822 2942 0 0.00922 III.1 4 RL 0.0259R D68794 822 2914 0 0.008217 III.1 4 RL 0.0263R D68807 832 2984 0 0.00641 III.1 4 RL 0.0075R D68821 832 3050 0 0.000689 III.1 4 RL 0.0063R D68826 825 2953 0 0.003255 III.1 4 RL 0.0018R D68838 825 2939 0 0.001954 III.1 4 RL 0.002R D68855 825 2955 0 0.001119 III.1 4 RL 0.0018R D68871 825 2962 0 0.005255 III.1 4 RL 0.0138R D68879 832 2990 0 0.005974 III.1 4 RL 0.0155R D68880 832 3049 0 0.00112 III.1 4 RL 0.0063R D68953 825 2941 0 0.003099 III.1 4 RL 0.0039R D68968 832 2962 0 0.013659 III.1 4 RL 0.0318R D69008 825 2976 0 0.003821 III.1 4 RL 0.0047R D69022 832 3034 0 0.00248 III.1 4 RL 0.0151R D69154 832 3038 0 0.001299 III.1 4 RL 0.0076R D69157 832 3025 0 0.000921 III.1 4 RL 0.0068R D69179 832 2949 0 0.002874 III.1 4 RL 0.0043R D69180 832 2974 0 0.002977 III.1 4 RL 0.0109R D69182 832 3027 0 0.002024 III.1 4 RL 0.0063R D69197 825 2977 0 0.00309 III.1 4 RL 0.0189R D69198 832 2958 0 0.011912 III.1 4 RL 0.0185R D69240 825 2332 0 0.00254 III.1 4 RL 0.0147R D69337 832 2963 0 0.002977 III.1 4 RL 0.0122R D69370 822 2884 0 0.000843 III.1 4 RL 0.0018R D69375 831 2841 0 0.005221 III.1 4 RL 0.01R D69480 822 2849 0 0.001234 III.1 4 RL 0.0036R D69511 825 2883 0 0.005116 III.1 4 RL 0.0018R D69516 832 2943 0 0.001008 III.1 4 RL 0.005R D69517 822 2874 0 0.001076 III.1 4 RL 0.0041R D69518 825 2926 0 0.001871 III.1 4 RL 0.0023

Table C-3. (continued).
Site Drum ID time Aspiration material layers of Sampling concentrationID no. IDC (days) time (days) Wattage type confinement location (Vol%)(a)
Sealed Waste Number of Flammable gas
(b)
C-29
R D69534 825 2985 0 0.000267 III.1 4 RL 0.0063R D69536 825 2914 0 0.000118 III.1 4 RL 0.0018R D69623 832 2951 0 0.011705 III.1 4 RL 0.0019R D69638 832 2966 0 0.009709 III.1 4 RL 0.0204R D69656 832 2923 0 0.001207 III.1 4 RL 0.0053R D69657 832 2943 0 0.003293 III.1 4 RL 0.0187R D69676 339 2850 0 0.015485 III.1 4 RL 0.0606R D69740 825 2939 0 0.000294 III.1 4 RL 0.0018R D69747 822 2855 0 0.006269 III.1 4 RL 0.0103R D69769 825 2182 0 0.001107 III.1 4 RL 0.0049R D69996 831 2985 0 0.002759 III.1 4 RL 0.0295R D70019 825 2861 0 0.002347 III.1 4 RL 0.0036R D70025 821 2867 0 0.001388 III.1 4 RL 0.0023R D70026 822 2847 0 0.001011 III.1 4 RL 0.0028R D70139 832 2900 0 0.001423 III.1 4 RL 0.0028R D70150 832 2928 0 0.000609 III.1 4 RL 0.0098R D70263 822 2827 0 0.001669 III.1 4 RL 0.0095R D70317 832 2954 0 0.000942 III.1 4 RL 0.0039R D70319 825 2884 0 0.0017 III.1 4 RL 0.002R D70332 825 2984 0 0.00234 III.1 4 RL 0.0099R D70378 825 2877 0 0.000525 III.1 4 RL 0.0018R D70387 822 2974 0 0.00051 III.1 4 RL 0.0063R D70392 822 2877 0 0.000682 III.1 4 RL 0.0018R D70460 832 2943 0 0.003934 III.1 4 RL 0.0163R D70464 822 2860 0 0.012126 III.1 4 RL 0.0018R D70501 822 2834 0 0.000826 III.1 4 RL 0.005R D70598 832 2948 0 0.001595 III.1 4 RL 0.0063R D70659 822 2850 0 0.007755 III.1 4 RL 0.0351R D70683 831 2820 0 0.015005 III.1 4 RL 0.0514R D70751 831 2890 0 0.0024 III.1 4 RL 0.0022R D70781 832 2841 0 0.004078 III.1 4 RL 0.0054R D70791 832 2891 0 0.001836 III.1 4 RL 0.0095R D70900 832 2894 0 0.00573 III.1 4 RL 0.0186R D70930 822 2882 0 0.011504 III.1 4 RL 0.0031R D70932 832 2863 0 0.00761 III.1 4 RL 0.015R D71072 825 2825 0 0.000171 III.1 4 RL 0.0393R D71118 832 2793 0 0.004122 III.1 4 RL 0.0035R D71168 832 2898 0 0.002702 III.1 4 RL 0.03R D71184 822 2797 0 0.000371 III.1 4 RL 0.1179R D71191 822 2828 0 0.000661 III.1 4 RL 0.0018R D71211 831 2920 0 0.011922 III.1 4 RL 0.0386R D71214 831 2931 0 0.001537 III.1 4 RL 0.0063R D71218 831 2884 0 0.004392 III.1 4 RL 0.0205R D71230 825 2914 0 0.00218 III.1 4 RL 0.0038R D71260 831 2854 0 0.00555 III.1 4 RL 0.0133R D71289 832 2926 0 0.001973 III.1 4 RL 0.0063R D71493 832 2929 0 0.002466 III.1 4 RL 0.0063

Table C-3. (continued).
Site Drum ID time Aspiration material layers of Sampling concentrationID no. IDC (days) time (days) Wattage type confinement location (Vol%)(a)
Sealed Waste Number of Flammable gas
(b)
C-30
R D71495 832 2906 0 0.001604 III.1 4 RL 0.0038R D71511 822 2765 0 0.000985 III.1 4 RL 0.0026R D71519 822 2757 0 0.000137 III.1 4 RL 0.0018R D71621 832 2859 0 0.003021 III.1 4 RL 0.0132R D71622 832 2830 0 0.00317 III.1 4 RL 0.0036R D71640 832 2840 0 0.000327 III.1 4 RL 0.0018R D71687 825 2136 0 0.002612 III.1 4 RL 0.0269R D71832 832 2842 0 0.001882 III.1 4 RL 0.0061R D71846 831 2820 0 0.013513 III.1 4 RL 0.0151R D71930 825 2150 0 0.001489 III.1 4 RL 0.0018R D71978 832 2899 0 0.000945 III.1 4 RL 0.0063R D71980 832 2806 0 0.00082 III.1 4 RL 0.0044R D72009 825 2813 0 0.003105 III.1 4 RL 0.0019R D72022 825 2761 0 0.000235 III.1 4 RL 0.0018R D72088 832 2799 0 0.000164 III.1 4 RL 0.0018R D72137 825 2711 0 0.000256 III.1 4 RL 0.0018R D72143 822 2850 0 0.000151 III.1 4 RL 0.0018R D72145 825 2731 0 0.000307 III.1 4 RL 0.0018R D72159 821 2859 0 0.012496 III.1 4 RL 0.0161R D72198 822 2770 0 0.00012 III.1 4 RL 0.0018R D72247 832 2783 0 9.61E-05 III.1 4 RL 0.0063R D72252 832 2884 0 0.001292 III.1 4 RL 0.0065R D72404 825 2765 0 0.000316 III.1 4 RL 0.0018R D72450 832 2883 0 0.000766 III.1 4 RL 0.0111R D72600 832 2814 0 0.001251 III.1 4 RL 0.0095R D72610 832 2853 0 0.001005 III.1 4 RL 0.0032R D72652 832 2859 0 0.000368 III.1 4 RL 0.0063R D72672 832 2843 0 0.001446 III.1 4 RL 0.0054R D72780 832 2852 0 0.00095 III.1 4 RL 0.0101R D72820 832 2842 0 0.000379 III.1 4 RL 0.0019R D72843 832 2822 0 0.000401 III.1 4 RL 0.0018R D72850 832 2827 0 0.003467 III.1 4 RL 0.0137R D72893 832 2847 0 0.005846 III.1 4 RL 0.0128R D72924 825 2719 0 0.000824 III.1 4 RL 0.0024R D72927 825 2757 0 0.002025 III.1 4 RL 0.0033R D72930 825 2710 0 0.000556 III.1 4 RL 0.0018R D73038 825 2764 0 0.001659 III.1 4 RL 0.0039R D73058 339 2852 0 0.011747 III.1 4 RL 0.0789R D73201 822 2658 0 0.001933 III.1 4 RL 0.0055R D73225 832 2816 0 0.001785 III.1 4 RL 0.0142R D73228 832 2756 0 0.003942 III.1 4 RL 0.008R D73236 832 2765 0 0.001712 III.1 4 RL 0.0127R D73289 825 2698 0 0.003453 III.1 4 RL 0.0107R D73292 822 2720 0 0.000504 III.1 4 RL 0.0018R D73298 825 2720 0 0.000755 III.1 4 RL 0.0032R D73303 825 2753 0 0.00145 III.1 4 RL 0.0046R D73307 825 2720 0 0.001674 III.1 4 RL 0.0027

Table C-3. (continued).
Site Drum ID time Aspiration material layers of Sampling concentrationID no. IDC (days) time (days) Wattage type confinement location (Vol%)(a)
Sealed Waste Number of Flammable gas
(b)
C-31
R D73349 825 2609 0 0.003623 III.1 4 RL 0.0065R D73363 825 2631 0 0.007096 III.1 4 RL 0.01R D73369 822 2631 0 0.000713 III.1 4 RL 0.0369R D73581 825 2576 0 0.000844 III.1 4 RL 0.0026R D73825 825 2622 0 0.009705 III.1 4 RL 0.0024R D73879 825 2634 0 0.000713 III.1 4 RL 0.0018R D73909 832 2373 0 0.003387 III.1 4 RL 0.0063R D74029 832 2710 0 0.000589 III.1 4 RL 0.0135R D74133 822 2508 0 0.000598 III.1 4 RL 0.0018R D74428 832 2582 0 0.000147 III.1 4 RL 0.0023R D74646 831 2619 0 0.000944 III.1 4 RL 0.0033R D74659 822 2503 0 0.000362 III.1 4 RL 0.0032R D74727 832 2620 0 0.000568 III.1 4 RL 0.0023R D74749 822 2165 0 0.000464 III.1 4 RL 0.0063R D75196 825 2239 0 0.008016 III.1 4 RL 0.024R D75266 832 2556 0 0.001097 III.1 4 RL 0.0063R D75272 339 2307 0 0.005352 III.1 4 RL 0.0188R D75280 339 2462 0 0.006135 III.1 4 RL 0.0167R D75605 832 2445 0 0.000482 III.1 4 RL 0.0018R D75759 822 2338 0 0.016509 III.1 4 RL 0.0188R D75894 825 2474 0 0.001288 III.1 4 RL 0.0063R D76176 339 2303 0 0.00175 III.1 4 RL 0.0103R D76446 825 2269 0 0.00124 III.1 4 RL 0.0019R D76451 825 2268 0 0.000711 III.1 4 RL 0.0018R D76455 825 2361 0 0.000495 III.1 4 RL 0.0018R D76576 825 2238 0 0.000615 III.1 4 RL 0.002R D76639 825 2250 0 0.001997 III.1 4 RL 0.0045R D76776 825 2235 0 0.000423 III.1 4 RL 0.0018R D76831 822 2188 0 0.002864 III.1 4 RL 0.0046R D76934 831 2319 0 0.000838 III.1 4 RL 0.0063R D77114 832 2219 0 0.000733 III.1 4 RL 0.0139R D77225 825 2192 0 0.000856 III.1 4 RL 0.0027R D85061 822 693 0 0.001149 III.1 4 RL 0.0029R D85338 822 584 0 0.010141 III.1 4 RL 0.0118
a. R = RFETSb. RL = Rigid drum liner; DH = Drum headspace; IB = Inner bag (Innermost confinement layer)

C-32
C.4. Output Data Files
The results of the NEWGVALS simulations are summarized in Tables C-4 and C-5. Table C-4 listsNEWGVALS predicted flammable gas concentrations in each layer of confinement and the sampledconcentration of flammable gas for each gas sample obtained under the TWCP at the INEEL. Table C-5 listsNEWGVALS predicted flammable gas concentrations in each layer of confinement and the sampledconcentration of flammable gas for each gas sample obtained under the TWCP at the RFETS.
Table C-4. NEWGVALS predicted confinement layer flammable gas concentrations using INEEL TWCPsampling data.
Site Drum time Aspiration in innermost in rigid drum headspace concentration SamplingID ID no. IDC (days) time (days) layer (Vol%) liner (Vol%) (Vol%) (Vol%) location(a)
Sealed concentration concentration in drum flammable gas
Predicted Predicted hydrogenflammable gas flammable gas concentration Sampled
Predicted
(b)
I 371 300 3009. 552. .3586 .0325 .0313 .0400 DH
I 373 300 3012. 273. 4.2382 .3845 .3708 .0400 DH
I 393 480 2564. 552. 1.4789 .1030 .0993 .0400 DH
I 401 371 3323. 223. 15.0200 1.0566 1.0190 .0300 DH
I 405 480 3778. 217. 5.2231 .3655 .3525 .0700 DH
I 501 300 2749. 389. 2.8151 .2548 .2458 .0600 DH
I 558 440 3463. 7. 1.2943 .6049 .5964 .0900 DH
I 567 371 3402. 177. 27.6888 1.9490 1.8797 .0300 DH
I 613 300 2875. 559. .8578 .0775 .0747 .1260 DH
I 827 303 2413. 686. 1.0913 .0982 .0947 .0900 DH
I 828 300 2415. 273. .6796 .0617 .0595 .0400 DH
I 1016 300 2412. 389. .6628 .0601 .0579 .1000 DH
I 1024 300 2386. 389. 1.6578 .1500 .1446 .0600 DH
I 1157 339 2701. 303. 3.8413 .3505 .3381 .0800 DH
I 1161 300 2852. 273. 2.5956 .2354 .2271 .0400 DH
I 1346 292 3165. 1036. .0000 .0161 .0157 .0200 DH
I 1361 339 2359. 288. 1.4653 .1339 .1291 .0700 DH
I 1370 339 2368. 282. 5.2188 .4759 .4590 .1000 DH
I 1493 1 3633. 278. .0924 .0593 .0577 .0300 DH
I 1498 480 2883. 561. 16.6572 1.1602 1.1187 .0500 DH

Table C-4. (continued).
Site Drum time Aspiration in innermost in rigid drum headspace concentration SamplingID ID no. IDC (days) time (days) layer (Vol%) liner (Vol%) (Vol%) (Vol%) location(a)
Sealed concentration concentration in drum flammable gas
Predicted Predicted hydrogenflammable gas flammable gas concentration Sampled
Predicted
(b)
C-33
I 1521 292 3100. 1043. .0000 .0109 .0106 .0600 DH
I 1619 300 2606. 562. 1.1795 .1065 .1027 .0500 DH
I 1633 432 2609. 645. 2.4731 .2235 .2155 .1600 DH
I 1635 303 2413. 686. .6827 .0615 .0593 .0900 DH
I 1636 320 3610. 236. 9.1541 .8315 .8020 .0300 DH
I 1655 339 2702. 310. 2.2169 .2024 .1952 .1300 DH
I 1662 300 2539. 555. .4865 .0440 .0424 .0400 DH
I 1663 432 3323. 12. 7.6248 2.7530 2.7002 5.1100 DH
I 1667 300 2516. 395. 1.4485 .1311 .1264 .1260 DH
I 1677 302 2574. 385. 1.4484 .1321 .1274 .1250 DH
I 1689 302 2444. 657. 1.1120 .1005 .0969 .0900 DH
I 1692 432 3191. 12. 7.8319 2.8117 2.7578 .0900 DH
I 1694 374 3215. 243. .6156 .0566 .0546 .0300 DH
I 1695 339 2814. 310. 8.1051 .7393 .7131 .1400 DH
I 1697 300 2464. 395. .9558 .0865 .0835 .0400 DH
I 1752 300 2872. 395. 2.0584 .1864 .1798 .0400 DH
I 1753 339 3236. 236. 1.9512 .1787 .1724 .0300 DH
I 1754 320 2468. 22. .7596 .1334 .1303 .0200 DH
I 1779 300 2241. 391. 1.3704 .1240 .1195 .0800 DH
I 1784 339 2705. 310. 2.0728 .1893 .1826 .1400 DH
I 2077 339 3085. 236. 2.0896 .1914 .1846 .0300 DH
I 2338 371 2582. 663. .4699 .0330 .0318 .1300 DH
I 2363 371 2348. 656. 34.1134 2.3763 2.2914 .1300 DH
I 2365 480 2884. 565. 15.8345 1.1029 1.0634 .0600 DH
I 2368 480 3617. 265. 16.6277 1.1629 1.1214 .0600 DH
I 2678 432 3338. 12. 2.5723 .9606 .9424 .1250 DH

Table C-4. (continued).
Site Drum time Aspiration in innermost in rigid drum headspace concentration SamplingID ID no. IDC (days) time (days) layer (Vol%) liner (Vol%) (Vol%) (Vol%) location(a)
Sealed concentration concentration in drum flammable gas
Predicted Predicted hydrogenflammable gas flammable gas concentration Sampled
Predicted
(b)
C-34
I 2712 292 4349. 60. .0000 2.9688 2.9137 .1500 DH
I 2791 371 2693. 663. 7.9755 .5563 .5364 .1300 DH
I 2797 432 3327. 12. 12.6575 4.5393 4.4522 .0900 DH
I 2814 7 3351. 278. .0128 .0082 .0080 .0300 DH
I 3088 371 2686. 663. 11.0870 .7733 .7456 .1300 DH
I 3091 371 2557. 663. 4.0756 .2843 .2741 .1400 DH
I 3268 1 3470. 1000. .0971 .0618 .0602 .0200 DH
I 3277 1 3416. 278. .0105 .0068 .0066 .0300 DH
I 3547 7 3420. 237. .0170 .0111 .0108 .0300 DH
I 3991 339 2278. 288. 6.8501 .6242 .6020 .0800 DH
I 3997 339 2283. 309. 12.3908 1.1281 1.0880 .2800 DH
I 4112 300 2852. 386. 1.5948 .1444 .1393 .0500 DH
I 4118 480 2991. 565. .2952 .0206 .0199 .0400 DH
I 4119 371 2686. 663. 18.6838 1.3030 1.2563 .1400 DH
I 4123 339 2355. 288. 3.8782 .3537 .3411 .1100 DH
I 4150 300 2329. 540. 1.3452 .1214 .1170 .0400 DH
I 4160 339 2328. 375. 1.7427 .1587 .1531 .1700 DH
I 4166 371 2693. 663. 1.3215 .0923 .0890 .0360 IB
I 4186 339 2387. 304. 2.6724 .2438 .2351 .0800 DH
I 4196 300 2381. 267. 3.9019 .3535 .3409 .0400 DH
I 4208 300 2635. 379. 4.9985 .4523 .4362 .1600 DH
I 4456 7 3834. 16. 15.2505 12.1692 11.9383 .0200 DH
I 4799 7 3858. 28. 3.1760 2.5227 2.4746 .0200 DH
I 4963 339 2420. 375. 26.7852 2.4351 2.3485 .1100 DH
I 5012 339 2284. 379. 2.3457 .2135 .2059 .0400 DH
I 5234 303 2460. 676. 2.1474 .1933 .1864 .0900 DH

Table C-4. (continued).
Site Drum time Aspiration in innermost in rigid drum headspace concentration SamplingID ID no. IDC (days) time (days) layer (Vol%) liner (Vol%) (Vol%) (Vol%) location(a)
Sealed concentration concentration in drum flammable gas
Predicted Predicted hydrogenflammable gas flammable gas concentration Sampled
Predicted
(b)
C-35
I 5235 432 2452. 630. 4.2718 .3859 .3721 .0700 DH
I 5415 1 2997. 208. .5215 .3440 .3354 .0600 DH
I 5530 303 2490. 262. 1.7758 .1610 .1553 .0400 DH
I 5535 432 2573. 631. 5.4878 .4958 .4781 .0600 DH
I 5607 432 3330. 251. 15.6686 1.4327 1.3820 .0400 DH
I 5697 7 2694. 217. .1089 .0712 .0694 .0300 DH
I 5698 7 3550. 13. .7836 .6303 .6185 .0200 DH
I 5880 481 2815. 629. 15.9968 1.1132 1.0734 .0400 DH
I 6252 339 3059. 172. 2.8793 .2639 .2545 .0300 DH
I 6711 7 4168. 28. .2009 .1596 .1565 .0200 DH
I 6857 339 2492. 324. 2.3706 .2162 .2085 .0400 DH
I 6875 303 3195. 11. 1.4569 .5040 .4956 .9300 DH
I 6879 432 2463. 630. 2.8711 .2594 .2502 .0500 DH
I 6918 292 3190. 1051. .0000 .0775 .0755 .1100 DH
I 7034 337 5603. 1903. .3199 .0221 .0213 .1260 DH
I 7061 490 5319. 3106. .0715 .0064 .0061 .0140 DH
I 7104 338 5433. 1685. .0219 .0020 .0019 .0200 DH
I 7170 337 5503. 1803. .0358 .0025 .0024 .0860 DH
I 7231 338 5502. 1925. 1.4387 .1281 .1235 .0500 DH
I 7262 817 3710. 47. 4.7505 3.7560 3.6835 .0800 DH
I 7491 817 3670. 47. 1.3601 1.0753 1.0546 .0300 DH
I 7518 330 2702. 90. 5.2361 .3706 .3574 .0500 DH
I 7594 822 3975. 54. .2841 .2243 .2200 .0300 DH
I 7667 7 2806. 229. .2709 .1759 .1714 .0300 DH
I 8161 822 3742. 47. 1.2529 .9907 .9716 .0200 DH
I 8203 440 2996. 84. 14.0820 .8036 .7750 .0900 DH

Table C-4. (continued).
Site Drum time Aspiration in innermost in rigid drum headspace concentration SamplingID ID no. IDC (days) time (days) layer (Vol%) liner (Vol%) (Vol%) (Vol%) location(a)
Sealed concentration concentration in drum flammable gas
Predicted Predicted hydrogenflammable gas flammable gas concentration Sampled
Predicted
(b)
C-36
I 8207 336 3136. 84. 19.0349 1.7549 1.6928 .0900 DH
I 8218 330 3136. 84. 18.0971 1.2852 1.2397 .0900 DH
I 8250 822 2781. 208. .0563 .0370 .0361 .0300 DH
I 8262 818 3740. 53. .0864 .0682 .0669 .0200 DH
I 8287 374 2756. 90. .0124 .0011 .0011 .0500 DH
I 8288 818 2760. 208. .0073 .0048 .0047 .0300 DH
I 8355 1 3600. 91. .3878 .3013 .2954 .0200 DH
I 8383 339 2756. 229. 2.0302 .1858 .1792 .0340 DH
I 8403 817 3655. 53. 7.0477 5.5620 5.4550 .0500 DH
I 8473 1 3643. 35. 3.9484 3.1308 3.0708 .0400 DH
I 8569 807 3489. 7. .6656 .5511 .5413 .0200 DH
I 8683 807 2583. 68. .1170 .0928 .0910 .0500 DH
I 8848 440 3019. 391. 1.0188 .0579 .0558 .1000 DH
I 8859 440 3553. 14. 1.7162 .4459 .4386 1.0900 DH
I 8864 480 3009. 552. .1989 .0139 .0134 .0400 DH
I 8878 480 2990. 552. .8202 .0572 .0552 .2000 DH
I 8993 312 3019. 676. 3.1129 .2805 .2705 .0900 DH
I 9011 7 3729. 237. .0143 .0094 .0092 .0300 DH
I 9180 339 2927. 283. 13.5753 1.2393 1.1953 .2900 DH
I 9225 481 3099. 629. 5.3835 .3749 .3615 .0500 DH
I 9252 339 3262. 310. 12.5389 1.1450 1.1044 .6500 DH
I 9294 480 3103. 548. .5932 .0414 .0399 .0500 DH
I 9296 440 2967. 632. .4101 .0233 .0225 .0400 DH
I 9299 339 2926. 375. 5.9896 .5457 .5264 .0800 DH
I 9423 337 3210. 508. 1.5039 .1055 .1017 .0340 DH
I 9435 337 3205. 611. .4493 .0316 .0305 .1030 DH

Table C-4. (continued).
Site Drum time Aspiration in innermost in rigid drum headspace concentration SamplingID ID no. IDC (days) time (days) layer (Vol%) liner (Vol%) (Vol%) (Vol%) location(a)
Sealed concentration concentration in drum flammable gas
Predicted Predicted hydrogenflammable gas flammable gas concentration Sampled
Predicted
(b)
C-37
I 9449 440 2949. 622. .4316 .0245 .0236 .0400 DH
I 9465 292 3915. 1043. .0000 .4479 .4362 .1900 DH
I 9471 337 3217. 227. 1.7296 .1219 .1176 .0300 DH
I 9489 337 3206. 228. 1.1895 .0839 .0809 .0300 DH
I 9587 320 3116. 229. .3291 .0300 .0289 .0300 DH
I 9591 440 3152. 83. 16.7738 .9578 .9237 .1200 DH
I 9592 440 2947. 83. 14.7071 .8395 .8096 .0900 DH
I 9599 440 3160. 83. 5.7344 .3275 .3158 .0900 DH
I 9602 442 3171. 618. .6821 .0476 .0459 .0500 DH
I 9653 480 2994. 561. 2.3891 .1665 .1606 .0400 DH
I 9694 300 2995. 381. 2.5963 .2352 .2268 .1000 DH
I 9773 339 6949. 380. 3.5420 .3247 .3132 .0900 DH
I 10216 338 1376. 1855. .0437 .0039 .0038 .0860 DH
I 10224 338 5488. 1925. 1.1294 .1006 .0970 .0700 DH
I 10228 1 5483. 3014. .0814 .0518 .0504 .0600 DH
I 10230 330 5391. 1925. .6694 .0462 .0445 .0900 DH
I 10270 337 2355. 1756. .4762 .0329 .0317 .0500 DH
I 10273 337 2268. 1411. .2582 .0179 .0172 .0300 DH
I 10276 337 2321. 2184. .9425 .0649 .0626 .0300 DH
I 10305 442 1977. 2410. .0654 .0045 .0043 .0300 DH
I 10364 337 2253. 2197. .2493 .0172 .0166 .0400 DH
I 10365 337 2253. 2265. .6414 .0442 .0426 .0200 DH
I 10370 337 2337. 2153. .8893 .0613 .0591 .0300 DH
I 10371 337 2293. 1620. .2603 .0180 .0173 .0200 DH
I 10387 337 2309. 1400. .2564 .0178 .0171 .0300 DH
I 10411 337 2059. 1965. .1646 .0114 .0109 .0500 DH

Table C-4. (continued).
Site Drum time Aspiration in innermost in rigid drum headspace concentration SamplingID ID no. IDC (days) time (days) layer (Vol%) liner (Vol%) (Vol%) (Vol%) location(a)
Sealed concentration concentration in drum flammable gas
Predicted Predicted hydrogenflammable gas flammable gas concentration Sampled
Predicted
(b)
C-38
I 10416 337 2059. 1672. .4265 .0294 .0284 .0400 DH
I 10449 300 2034. 2551. .8770 .0780 .0752 .0140 DH
I 10480 374 2021. 2581. .1171 .0104 .0100 .0140 DH
I 10492 480 2033. 2008. .0626 .0043 .0042 .0400 DH
I 10498 480 2064. 2003. 2.8613 .1972 .1901 .0500 DH
I 10512 337 5573. 1573. .1850 .0128 .0124 .0200 DH
I 10578 432 5608. 2105. .3258 .0290 .0280 .0970 DH
I 10578 432 5608. 2105. .3258 .0290 .0280 .1810 IB
I 10604 2 5566. 2853. .0109 .0070 .0068 .0140 DH
I 10606 330 5463. 2131. .8026 .0554 .0534 .0900 DH
I 10617 336 5476. 2468. .0133 .0012 .0011 .0300 DH
I 10655 330 5481. 2468. .6438 .0444 .0428 .0600 DH
I 10663 337 5596. 1712. .0314 .0022 .0021 .0860 DH
I 10699 330 7698. 231. 4.3872 .3098 .2988 .0300 DH
I 10705 336 5566. 2453. .2986 .0266 .0256 .0300 DH
I 10734 1 5499. 3055. .2357 .1500 .1461 .0500 DH
I 10739 1 5573. 3034. .1285 .0818 .0796 .0300 DH
I 10797 1 5503. 3055. .1909 .1215 .1183 .0800 DH
I 10800 338 5573. 1785. .7034 .0627 .0604 .0400 DH
I 10808 337 5454. 1967. .1937 .0134 .0129 .0340 IB
I 10808 337 5454. 1967. .1937 .0134 .0129 .0340 DH
I 10837 432 5607. 2105. .4929 .0439 .0423 .1400 DH
I 10848 338 5578. 1769. 1.4935 .1331 .1283 .0400 DH
I 10883 432 5589. 2091. .6218 .0554 .0534 .0500 DH
I 10910 441 5280. 3022. .0222 .0015 .0015 .0140 DH
I 10921 371 5596. 2084. 1.1592 .0800 .0771 .0500 DH

Table C-4. (continued).
Site Drum time Aspiration in innermost in rigid drum headspace concentration SamplingID ID no. IDC (days) time (days) layer (Vol%) liner (Vol%) (Vol%) (Vol%) location(a)
Sealed concentration concentration in drum flammable gas
Predicted Predicted hydrogenflammable gas flammable gas concentration Sampled
Predicted
(b)
C-39
I 10922 432 5609. 3245. .7373 .0656 .0632 .0500 DH
I 10976 2 5450. 2983. .0032 .0020 .0020 .0140 DH
I 11042 442 1864. 2170. .3545 .0244 .0235 .0400 DH
I 11044 440 1980. 2169. .0962 .0054 .0052 .0500 DH
I 11156 376 2150. 2680. .5725 .0509 .0491 .0200 DH
I 11162 432 2150. 2951. 3.5250 .3136 .3023 .3240 DH
I 11173 480 2164. 2041. .6783 .0468 .0451 .1300 DH
I 11224 300 590. 4232. .2690 .0239 .0231 .0140 DH
I 11259 330 5480. 2468. 1.2299 .0848 .0817 .0300 DH
I 11274 440 5620. 2453. .1495 .0084 .0081 .0300 DH
I 11393 480 2986. 552. .2362 .0165 .0160 .0500 DH
I 11415 480 5590. 2020. .0607 .0042 .0040 .1250 DH
I 11416 337 5594. 2057. .1603 .0111 .0107 .0400 DH
I 11433 330 5597. 1712. .0357 .0025 .0024 .0860 DH
I 11482 371 5562. 2468. .0500 .0035 .0033 .0300 DH
I 11498 432 5633. 2091. .8440 .0751 .0724 .0900 DH
I 11607 330 5576. 1764. .0490 .0034 .0033 .0600 DH
I 11637 338 5573. 1840. .6766 .0603 .0581 .0500 DH
I 11638 336 5491. 2468. .0834 .0074 .0072 .0300 DH
I 11653 432 5633. 2091. .7854 .0699 .0674 .0700 DH
I 11695 336 5579. 2468. .0134 .0012 .0012 .0300 DH
I 11699 480 5574. 2453. .1587 .0109 .0105 .0300 DH
I 11735 330 5581. 2057. .2163 .0149 .0144 .0340 DH
I 11749 441 5490. 2098. .2924 .0202 .0194 .0400 DH
I 11799 292 3038. 236. .0000 .0264 .0257 .0400 DH
I 11801 292 3048. 226. .0000 .0439 .0427 .0600 DH

Table C-4. (continued).
Site Drum time Aspiration in innermost in rigid drum headspace concentration SamplingID ID no. IDC (days) time (days) layer (Vol%) liner (Vol%) (Vol%) (Vol%) location(a)
Sealed concentration concentration in drum flammable gas
Predicted Predicted hydrogenflammable gas flammable gas concentration Sampled
Predicted
(b)
C-40
I 12108 292 2290. 2313. .0000 .0787 .0766 .0900 DH
I 12111 337 1717. 1791. .2837 .0196 .0189 .0300 DH
I 12266 1 5571. 3037. .1647 .1048 .1021 .0500 DH
I 12300 970 5598. 2468. .1722 .0153 .0148 .0300 DH
I 12313 336 5580. 1712. .0520 .0046 .0045 .0300 DH
I 12317 1 5595. 3062. .0480 .0306 .0298 .0200 DH
I 12320 336 5586. 2057. .2092 .0186 .0180 .0400 DH
I 12324 335 5561. 1573. .3873 .0346 .0333 .0200 DH
I 12357 480 5581. 2433. .0395 .0027 .0026 .0400 DH
I 12433 338 5489. 1785. .6432 .0573 .0553 .0400 DH
I 12469 1 1967. 2502. .0762 .0485 .0472 .0400 DH
I 12471 338 5579. 1840. 2.2249 .1982 .1911 .0500 DH
I 12480 2 5353. 2983. .0020 .0013 .0013 .0140 DH
I 12487 440 5489. 1916. .1460 .0082 .0079 .0400 DH
I 12541 442 5476. 2164. .0853 .0059 .0057 .0400 DH
I 12683 1 2354. 3153. .8123 .5169 .5034 .0900 DH
I 12802 337 2387. 1840. .1319 .0091 .0088 .0800 DH
I 12809 480 5599. 2020. .3156 .0218 .0210 .0400 DH
I 12873 2 5566. 3141. .0117 .0075 .0073 .0200 DH
I 12874 336 5594. 2131. .0746 .0066 .0064 .0900 DH
I 12875 432 5597. 2091. .3178 .0283 .0273 .0970 DH
I 12878 480 5597. 2000. .1700 .0117 .0113 .1260 DH
I 12881 432 5580. 2468. .8357 .0744 .0717 .0800 DH
I 12885 330 5588. 2468. .0512 .0035 .0034 .0300 DH
I 12891 330 5496. 2057. .3821 .0264 .0254 .0340 DH
I 12898 490 5289. 3014. .5208 .0463 .0447 .0140 DH

Table C-4. (continued).
Site Drum time Aspiration in innermost in rigid drum headspace concentration SamplingID ID no. IDC (days) time (days) layer (Vol%) liner (Vol%) (Vol%) (Vol%) location(a)
Sealed concentration concentration in drum flammable gas
Predicted Predicted hydrogenflammable gas flammable gas concentration Sampled
Predicted
(b)
C-41
I 12902 338 5587. 1743. 1.5883 .1416 .1365 .0400 DH
I 12914 374 5287. 3014. .0279 .0025 .0024 .0140 DH
I 12986 302 5579. 1846. .0760 .0068 .0065 .0340 DH
I 12998 337 5587. 2057. .4147 .0286 .0276 .0500 DH
I 13003 823 3612. 53. .0905 .0714 .0700 .0200 DH
I 13040 823 3597. 47. .1377 .1088 .1067 .0200 DH
I 13042 823 3612. 53. .2137 .1686 .1654 .0200 DH
I 13171 822 3612. 53. 3.5922 2.8346 2.7799 .2600 DH
I 13182 817 3656. 53. 3.8134 3.0095 2.9516 .0900 DH
I 13184 817 3656. 53. 3.7053 2.9242 2.8679 .0600 DH
I 13188 823 3635. 53. .2457 .1939 .1901 .0200 DH
I 13197 823 3639. 53. .2295 .1811 .1776 .0200 DH
I 13204 823 3639. 53. .4731 .3733 .3661 .0300 DH
I 13229 432 3029. 12. 1.5880 .6056 .5941 .1250 DH
I 13231 300 2380. 379. 4.8052 .4345 .4190 .0600 DH
I 13252 371 2686. 663. 9.3371 .6512 .6279 .1300 DH
I 13266 339 2621. 303. 8.3228 .7589 .7320 .1200 DH
I 13269 440 2797. 508. .3532 .0201 .0194 .0600 DH
I 13313 440 2872. 632. .4362 .0248 .0239 .0400 DH
I 13342 440 2786. 392. .3201 .0182 .0176 .0500 DH
I 13361 292 4095. 54. .0000 .4133 .4056 .0200 DH
I 13527 336 5585. 2084. .0315 .0028 .0027 .0400 DH
I 13531 440 5584. 2537. .2512 .0141 .0136 .0200 DH
I 13620 970 5600. 2832. .5523 .0491 .0474 .0140 DH
I 13661 336 5566. 2468. .0200 .0018 .0017 .0300 DH
I 13677 338 5579. 1785. 2.8015 .2496 .2407 .0400 DH

Table C-4. (continued).
Site Drum time Aspiration in innermost in rigid drum headspace concentration SamplingID ID no. IDC (days) time (days) layer (Vol%) liner (Vol%) (Vol%) (Vol%) location(a)
Sealed concentration concentration in drum flammable gas
Predicted Predicted hydrogenflammable gas flammable gas concentration Sampled
Predicted
(b)
C-42
I 13696 480 2462. 1551. .0602 .0042 .0040 .0200 DH
I 13751 480 5485. 2007. .0387 .0027 .0026 .1250 DH
I 13763 339 2406. 1. 5.3732 4.1208 4.0538 .1300 DH
I 13818 1 3573. 278. .1608 .1030 .1003 .0400 DH
I 13847 300 2666. 385. 1.2732 .1153 .1112 .0400 DH
I 13860 339 2284. 324. 6.6353 .6040 .5826 .0800 DH
I 13876 7 3626. 302. .0038 .0024 .0024 .0300 DH
I 13885 292 3087. 1042. .0000 .1205 .1173 .2100 DH
I 14007 1 3113. 3. 119.6149 100.7374 98.9827 .2600 DH
I 14330 303 2578. 266. 3.6430 .3302 .3185 .0700 DH
I 14339 432 2446. 650. 1.6267 .1470 .1417 .1300 DH
I 14342 303 2596. 262. 6.1838 .5605 .5406 .0400 DH
I 14345 432 2461. 632. 1.0422 .0943 .0910 .0500 DH
I 14346 339 2462. 374. 7.0382 .6402 .6175 .1200 DH
I 14357 339 2585. 112. 3.0503 .2797 .2698 .0200 DH
I 14362 490 2429. 612. 3.7617 .3400 .3278 .0900 DH
I 14466 302 2610. 670. .3964 .0360 .0347 .3140 DH
I 14484 300 2693. 545. 4.7204 .4260 .4108 .0400 DH
I 15241 442 3107. 618. .4533 .0316 .0305 .0500 DH
I 15249 300 3020. 262. 4.7864 .4343 .4188 .0400 DH
I 15675 480 3023. 548. 3.8647 .2694 .2597 .0600 DH
I 16597 481 3099. 629. 1.9602 .1365 .1317 .0500 DH
I 16612 442 3096. 629. 2.6830 .1869 .1802 .0400 DH
I 16790 300 3063. 380. .3968 .0361 .0348 .0700 DH
I 16986 442 3166. 629. .2244 .0157 .0151 .0400 DH
I 17148 432 3105. 630. .5094 .0463 .0447 .0500 DH

Table C-4. (continued).
Site Drum time Aspiration in innermost in rigid drum headspace concentration SamplingID ID no. IDC (days) time (days) layer (Vol%) liner (Vol%) (Vol%) (Vol%) location(a)
Sealed concentration concentration in drum flammable gas
Predicted Predicted hydrogenflammable gas flammable gas concentration Sampled
Predicted
(b)
C-43
I 17444 300 3062. 559. .4376 .0396 .0382 .0400 DH
I 17491 300 3409. 172. 1.7847 .1623 .1565 .1260 DH
I 17495 442 3096. 650. 1.6624 .1158 .1117 .0400 DH
I 17698 292 3935. 182. .0000 1.0375 1.0126 .7700 DH
I 17709 1 3439. 121. .0796 .0606 .0593 .0400 DH
I 17742 440 3118. 629. .5271 .0299 .0289 .0400 DH
I 17759 432 3104. 645. .3119 .0284 .0274 .2740 IB
I 17759 432 3104. 645. .3119 .0284 .0274 .1260 DH
I 18152 1 3858. 643. .0826 .0526 .0512 .0240 DH
I 18181 292 3849. 1041. .0000 .0027 .0026 .0200 DH
I 18195 292 3875. 1040. .0000 .0381 .0371 .0600 DH
I 18229 292 3875. 1040. .0000 .2172 .2115 .0800 DH
I 18299 376 2505. 89. 3.2152 .2958 .2854 .0500 DH
I 18413 300 2830. 230. 2.3022 .2090 .2015 .0300 DH
I 18441 300 3101. 83. 12.3138 1.1216 1.0818 .0900 DH
I 18456 822 3937. 53. .7158 .5653 .5545 .0200 DH
I 18476 292 3000. 208. .0000 .0190 .0185 .0300 DH
I 18491 300 2925. 84. 5.1753 .4713 .4546 .0900 DH
I 18806 800 3710. 139. .3970 .2918 .2856 .0200 DH
I 19410 339 2996. 208. .8061 .0741 .0715 .0340 DH
I 19413 339 2974. 229. 1.1861 .1088 .1049 .0440 DH
I 19413 339 2974. 229. 1.1861 .1088 .1049 .0470 IB
I 19413 339 2974. 229. 1.1861 .1088 .1049 .0470 IB
I 19572 339 3069. 83. 9.9824 .9208 .8884 .1100 DH
I 19664 803 3723. 7. 1.4469 1.1926 1.1711 .0500 DH
I 20903 807 3153. 35. .3838 .3053 .2995 .0200 DH
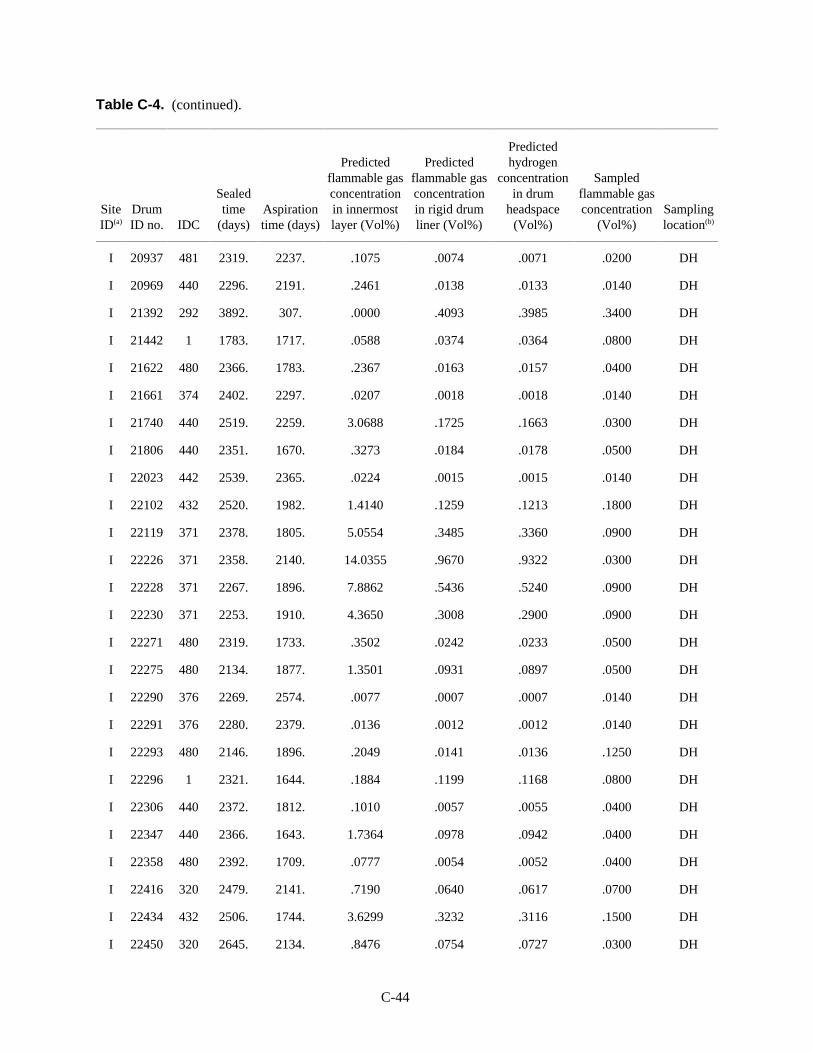
Table C-4. (continued).
Site Drum time Aspiration in innermost in rigid drum headspace concentration SamplingID ID no. IDC (days) time (days) layer (Vol%) liner (Vol%) (Vol%) (Vol%) location(a)
Sealed concentration concentration in drum flammable gas
Predicted Predicted hydrogenflammable gas flammable gas concentration Sampled
Predicted
(b)
C-44
I 20937 481 2319. 2237. .1075 .0074 .0071 .0200 DH
I 20969 440 2296. 2191. .2461 .0138 .0133 .0140 DH
I 21392 292 3892. 307. .0000 .4093 .3985 .3400 DH
I 21442 1 1783. 1717. .0588 .0374 .0364 .0800 DH
I 21622 480 2366. 1783. .2367 .0163 .0157 .0400 DH
I 21661 374 2402. 2297. .0207 .0018 .0018 .0140 DH
I 21740 440 2519. 2259. 3.0688 .1725 .1663 .0300 DH
I 21806 440 2351. 1670. .3273 .0184 .0178 .0500 DH
I 22023 442 2539. 2365. .0224 .0015 .0015 .0140 DH
I 22102 432 2520. 1982. 1.4140 .1259 .1213 .1800 DH
I 22119 371 2378. 1805. 5.0554 .3485 .3360 .0900 DH
I 22226 371 2358. 2140. 14.0355 .9670 .9322 .0300 DH
I 22228 371 2267. 1896. 7.8862 .5436 .5240 .0900 DH
I 22230 371 2253. 1910. 4.3650 .3008 .2900 .0900 DH
I 22271 480 2319. 1733. .3502 .0242 .0233 .0500 DH
I 22275 480 2134. 1877. 1.3501 .0931 .0897 .0500 DH
I 22290 376 2269. 2574. .0077 .0007 .0007 .0140 DH
I 22291 376 2280. 2379. .0136 .0012 .0012 .0140 DH
I 22293 480 2146. 1896. .2049 .0141 .0136 .1250 DH
I 22296 1 2321. 1644. .1884 .1199 .1168 .0800 DH
I 22306 440 2372. 1812. .1010 .0057 .0055 .0400 DH
I 22347 440 2366. 1643. 1.7364 .0978 .0942 .0400 DH
I 22358 480 2392. 1709. .0777 .0054 .0052 .0400 DH
I 22416 320 2479. 2141. .7190 .0640 .0617 .0700 DH
I 22434 432 2506. 1744. 3.6299 .3232 .3116 .1500 DH
I 22450 320 2645. 2134. .8476 .0754 .0727 .0300 DH

Table C-4. (continued).
Site Drum time Aspiration in innermost in rigid drum headspace concentration SamplingID ID no. IDC (days) time (days) layer (Vol%) liner (Vol%) (Vol%) (Vol%) location(a)
Sealed concentration concentration in drum flammable gas
Predicted Predicted hydrogenflammable gas flammable gas concentration Sampled
Predicted
(b)
C-45
I 22511 480 2372. 1841. .0624 .0043 .0042 .0500 DH
I 22517 432 2408. 1807. 1.3734 .1223 .1179 .1600 DH
I 22539 432 2459. 1756. 3.0951 .2756 .2657 .3200 DH
I 22549 480 2372. 1764. .0767 .0053 .0051 .1250 IB
I 22552 442 2424. 1778. .1745 .0120 .0116 .0400 DH
I 22790 292 2283. 1587. .0000 .0464 .0452 .0900 DH
I 22803 371 2321. 1842. 5.2044 .3588 .3458 .0900 DH
I 22811 7 2206. 1629. .0046 .0029 .0028 .0340 DH
I 22874 371 2358. 1798. 4.3755 .3017 .2908 .1400 DH
I 22880 376 2251. 2364. .0493 .0044 .0042 .0140 DH
I 22920 292 2239. 3018. .0000 .1422 .1385 .1600 DH
I 22923 440 2243. 1846. .1240 .0070 .0067 .0400 DH
I 23005 7 2190. 1966. .0031 .0020 .0019 .0900 DH
I 23033 292 2373. 2933. .0000 .0883 .0860 .1300 DH
I 23041 371 2358. 2170. 9.9483 .6854 .6607 .0400 DH
I 23048 432 2193. 1868. 2.0327 .1809 .1744 .1300 DH
I 23211 376 2187. 83. .0232 .0021 .0021 .0900 DH
I 23212 480 2061. 2387. .9354 .0644 .0621 .0300 DH
I 23227 480 2056. 1964. .4352 .0300 .0289 .0500 DH
I 23235 336 2124. 2387. 1.4809 .1318 .1270 .1200 DH
I 23246 481 2336. 2280. 3.4773 .2396 .2309 .0700 DH
I 23266 7 2206. 2301. .0036 .0023 .0022 .0200 DH
I 23285 7 2281. 1887. .0252 .0160 .0156 .0900 DH
I 23290 371 2335. 2198. 5.1773 .3567 .3438 .0300 DH
I 23301 337 2126. 1556. .2807 .0194 .0187 .0300 DH
I 23384 339 1933. 1646. 2.2763 .2027 .1954 .0600 DH

Table C-4. (continued).
Site Drum time Aspiration in innermost in rigid drum headspace concentration SamplingID ID no. IDC (days) time (days) layer (Vol%) liner (Vol%) (Vol%) (Vol%) location(a)
Sealed concentration concentration in drum flammable gas
Predicted Predicted hydrogenflammable gas flammable gas concentration Sampled
Predicted
(b)
C-46
I 23388 330 2389. 1564. .1186 .0082 .0079 .0300 DH
I 23662 442 2407. 1870. .1689 .0117 .0112 .0400 DH
I 23739 440 2530. 2279. 1.3151 .0739 .0713 .0200 DH
I 23771 330 2499. 2225. 4.2749 .2945 .2839 .1600 DH
I 23805 480 2680. 1722. .8087 .0558 .0538 .0400 DH
I 23840 337 2520. 1408. 1.5740 .1088 .1049 .0300 DH
I 23844 480 2677. 1741. 3.0690 .2117 .2041 .0400 DH
I 23901 330 2416. 1423. .0130 .0009 .0009 .0860 DH
I 23929 440 2307. 2193. .3396 .0191 .0184 .0400 DH
I 23959 480 2320. 1832. 1.7964 .1239 .1194 .0400 DH
I 23984 300 2316. 2286. .9274 .0825 .0796 .0200 DH
I 24028 440 2275. 2254. 3.4141 .1919 .1850 .0300 DH
I 24029 480 2252. 1577. .9757 .0673 .0649 .0400 DH
I 24057 292 18281. 3058. .0000 .1594 .1553 .1900 DH
I 24059 292 2584. 1945. .0000 .2471 .2406 .3800 DH
I 24086 337 2507. 2176. 2.5862 .1782 .1718 .0600 DH
I 24088 337 2288. 1863. .1390 .0096 .0093 .0400 DH
I 24090 337 2313. 1499. .7850 .0542 .0523 .0300 DH
I 24092 337 2289. 1868. .4342 .0299 .0289 .1260 IB
I 24092 337 2289. 1868. .4342 .0299 .0289 .1260 DH
I 24095 337 2381. 1510. .9938 .0686 .0662 .0300 DH
I 24102 337 2366. 1870. .5704 .0393 .0379 .0500 DH
I 24106 337 2403. 1864. .6847 .0472 .0455 .0400 DH
I 24113 337 2344. 1869. 1.2286 .0847 .0817 .0500 DH
I 24159 336 2501. 1232. .2383 .0213 .0206 .0300 DH
I 24165 337 2330. 1821. .4930 .0340 .0328 .0400 DH

Table C-4. (continued).
Site Drum time Aspiration in innermost in rigid drum headspace concentration SamplingID ID no. IDC (days) time (days) layer (Vol%) liner (Vol%) (Vol%) (Vol%) location(a)
Sealed concentration concentration in drum flammable gas
Predicted Predicted hydrogenflammable gas flammable gas concentration Sampled
Predicted
(b)
C-47
I 24168 330 2480. 1736. 3.2766 .2260 .2178 .0400 DH
I 24190 480 2845. 1098. .2990 .0208 .0200 .0300 DH
I 24273 442 2380. 1897. .0997 .0069 .0066 .0400 DH
I 24279 442 2505. 2310. .1461 .0101 .0097 .0140 DH
I 24289 440 2382. 2285. .1186 .0067 .0064 .0300 DH
I 24358 480 2751. 1699. .1927 .0133 .0128 .0500 DH
I 24506 374 2121. 84. .0298 .0027 .0026 .0900 DH
I 24662 480 2627. 1810. .1519 .0105 .0101 .0400 DH
I 24786 480 2677. 1737. .1774 .0123 .0118 .0860 DH
I 24807 480 2631. 1350. .1384 .0096 .0093 .0800 DH
I 24862 480 2431. 1930. .3906 .0269 .0260 .0500 DH
I 24884 480 2430. 1916. .3272 .0226 .0218 .0500 DH
I 24920 1 2655. 2095. .1976 .1257 .1224 .0900 DH
I 27455 1 2877. 2793. .1587 .1010 .0984 .0300 DH
I 27540 1 2628. 2574. .5737 .3651 .3555 .1000 DH
I 27877 481 2916. 2443. 2.5035 .1725 .1663 .0140 DH
I 29152 1 3137. 2780. 2.6732 1.7012 1.6566 .1200 DH
I 29699 292 3322. 2800. .0000 .1166 .1135 .1400 DH
I 30585 440 3259. 2414. .1188 .0067 .0064 .0140 DH
I 31128 7 2205. 2604. .0099 .0063 .0061 .0200 DH
I 31502 432 2267. 2757. .0377 .0034 .0032 .0200 DH
I 31507 7 2227. 2595. .0101 .0064 .0063 .0200 DH
I 31546 7 49. 4787. .0024 .0015 .0015 .0200 DH
I 31689 7 2268. 2412. .0042 .0027 .0026 .0140 DH
I 31711 1 2296. 2532. .1823 .1160 .1130 .0200 DH
I 31806 7 2360. 2661. .0065 .0041 .0040 .0200 DH

Table C-4. (continued).
Site Drum time Aspiration in innermost in rigid drum headspace concentration SamplingID ID no. IDC (days) time (days) layer (Vol%) liner (Vol%) (Vol%) (Vol%) location(a)
Sealed concentration concentration in drum flammable gas
Predicted Predicted hydrogenflammable gas flammable gas concentration Sampled
Predicted
(b)
C-48
I 32284 339 2237. 1358. 3.0151 .2689 .2592 .2600 DH
I 32287 7 2013. 2299. .0035 .0022 .0022 .0300 DH
I 32467 337 2334. 1638. .2214 .0153 .0148 .0400 DH
I 32469 337 2326. 2083. .2270 .0157 .0151 .0300 DH
I 32471 337 2340. 1148. .4252 .0295 .0285 .0200 DH
I 32473 337 2326. 1632. .1471 .0102 .0098 .0400 DH
I 32485 337 2334. 1632. .2677 .0185 .0178 .0400 DH
I 32517 339 2288. 2065. 1.3252 .1179 .1137 .1100 DH
I 32521 339 2288. 1416. 4.2887 .3823 .3685 .3300 DH
I 32525 339 2289. 1324. 2.2491 .2006 .1934 .2000 DH
I 32526 339 2326. 1344. 2.4402 .2176 .2098 .1000 DH
I 32529 336 2088. 1540. .0825 .0074 .0071 .0860 DH
I 32540 480 2293. 1667. 1.0433 .0720 .0694 .0500 DH
I 32669 480 2265. 2086. .6497 .0448 .0432 .0400 DH
I 32715 337 2226. 2091. .3003 .0207 .0200 .0300 DH
I 32741 480 2246. 1609. .1864 .0129 .0124 .0400 DH
I 32748 339 2264. 1182. .7125 .0637 .0614 .0800 DH
I 33091 339 2251. 1432. 1.0897 .0971 .0936 .1000 DH
Notes:
a. I = INEELb. DH = Drum headspace; IB = Inner bag (Innermost confinement layer)

C-49
Table C-5 lists NEWGVALS predicted flammable gas concentrations in each layer of confinement andthe sampled concentration of flammable gas for each gas sample obtained under the TWCP at the RFETS.
Table C-5. NEWGVALS predicted confinement layer flammable gas concentrations using RFETS TWCPsampling data.
Site Drum time Aspiration in innermost in rigid drum headspace concentration SamplingID ID no. IDC (days) time (days) layer (Vol%) liner (Vol%) (Vol%) (Vol%) location(a)
Sealed concentration concentration in drum flammable gas
Predicted Predicted hydrogenflammable gas flammable gas concentration Sampled
Predicted
(b)
R D17184 800 2192. 0. 38.2441 38.0639 26.8108 .6030 DH
R D35301 800 2227. 0. 55.5718 55.3198 39.1124 .0033 DH
R D60290 800 2324. 0. 19.7465 19.6616 14.2080 .3577 DH
R D61005 800 2698. 0. 16.2090 16.1483 12.2499 4.9286 DH
R D61005 800 2698. 15. 11.1535 8.8853 8.7166 .1464 RL
R D61471 800 2527. 0. 43.4625 43.2866 31.9644 3.5007 DH
R D63330 800 2702. 0. 16.2301 16.1699 12.2711 7.7303 DH
R D63330 800 2702. 0. 16.2301 16.1699 12.2711 5.1857 RL
R D63341 800 2670. 0. 16.0594 15.9988 12.1012 7.2299 DH
R D63341 800 2670. 0. 16.0594 15.9988 12.1012 6.8590 RL
R D63344 800 2668. 0. 16.0485 15.9883 12.0906 6.3753 DH
R D63344 800 2668. 0. 16.0485 15.9883 12.0906 5.4401 RL
R D63484 800 2640. 0. 23.3698 23.2803 17.4877 .0513 DH
R D63484 800 2640. 0. 23.3698 23.2803 17.4877 .0498 RL
R D64197 800 2635. 0. 23.3302 23.2404 17.4483 .0033 DH
R D64197 800 2635. 0. 23.3302 23.2404 17.4483 .0353 RL
R D64383 800 2648. 0. 35.5255 35.3869 26.5351 1.0475 DH
R D64383 800 2648. 1. 34.9532 29.9516 29.4434 .8172 RL
R D64631 800 2646. 0. 35.5023 35.3612 26.5110 3.8746 DH
R D64631 800 2646. 0. 35.5023 35.3612 26.5110 1.9622 RL
R D64632 800 2261. 0. 38.6758 38.5026 27.4166 3.0205 DH
R D64997 800 2605. 0. 44.6819 44.4933 33.1681 14.5676 DH
R D64997 800 2605. 0. 44.6819 44.4933 33.1681 11.9154 RL

Table C-5. (continued).
Site Drum time Aspiration in innermost in rigid drum headspace concentration SamplingID ID no. IDC (days) time (days) layer (Vol%) liner (Vol%) (Vol%) (Vol%) location(a)
Sealed concentration concentration in drum flammable gas
Predicted Predicted hydrogenflammable gas flammable gas concentration Sampled
Predicted
(b)
C-50
R D66525 800 1485. 163. .0242 .0163 .0159 .0097 DH
R D66525 800 1485. 0. .6369 .6329 .3740 3.4368 DH
R D66525 800 1485. 163. .0242 .0163 .0159 .0497 IB
R D67434 800 1492. 134. .0315 .0221 .0216 .0035 DH
R D67434 800 1492. 0. .6396 .6356 .3765 1.9198 DH
R D67434 800 1492. 134. .0315 .0221 .0216 .0083 IB
R D67436 800 1492. 184. .0609 .0406 .0396 .0038 DH
R D67436 800 1492. 0. 2.2815 2.2699 1.5307 3.1291 DH
R D67436 800 1492. 184. .0609 .0406 .0396 .0250 IB
R D67441 800 1493. 134. .0912 .0653 .0639 .0035 DH
R D67441 800 1493. 0. 2.1604 2.1495 1.4595 1.4476 DH
R D67441 800 1493. 134. .0912 .0653 .0639 .0095 IB
R D67654 800 1493. 169. .0625 .0424 .0414 .0035 DH
R D67654 800 1493. 0. 2.1604 2.1495 1.4595 2.5138 DH
R D67654 800 1493. 169. .0625 .0424 .0414 .0258 IB
R D67656 800 2178. 0. 2.6138 2.6041 1.9761 1.3536 DH
R D67657 800 1493. 170. .0621 .0421 .0410 .0046 DH
R D67657 800 1493. 0. 2.1604 2.1495 1.4595 1.7896 DH
R D67657 800 1493. 170. .0621 .0421 .0410 .0196 IB
R D67670 800 2473. 0. 3.0590 3.0486 2.3705 1.2173 DH
R D67670 800 2473. 1. 3.0143 2.6180 2.5745 1.2681 RL
R D68241 800 2351. 0. 4.4400 4.4222 3.3246 .1003 DH
R D68247 800 1485. 167. .0236 .0158 .0154 .0035 DH
R D68247 800 1485. 0. .6370 .6329 .3740 .0593 DH
R D68247 800 1485. 167. .0236 .0158 .0154 .0101 IB
R D68254 800 1488. 169. .0233 .0156 .0152 .0035 DH

Table C-5. (continued).
Site Drum time Aspiration in innermost in rigid drum headspace concentration SamplingID ID no. IDC (days) time (days) layer (Vol%) liner (Vol%) (Vol%) (Vol%) location(a)
Sealed concentration concentration in drum flammable gas
Predicted Predicted hydrogenflammable gas flammable gas concentration Sampled
Predicted
(b)
C-51
R D68254 800 1488. 0. .6381 .6340 .3751 .0593 DH
R D68254 800 1488. 169. .0233 .0156 .0152 .0123 IB
R D68255 800 2466. 0. 2.8579 2.8481 2.2221 .1091 DH
R D68255 800 2466. 0. 2.8579 2.8481 2.2221 .2778 RL
R D68256 800 1491. 183. .0116 .0081 .0079 .0050 DH
R D68256 800 1491. 0. .8462 .8440 .6208 .6887 DH
R D68256 800 1491. 183. .0116 .0081 .0079 .0226 IB
R D68261 800 2460. 0. .9527 .9510 .8287 .1706 DH
R D68261 800 2460. 0. .9527 .9510 .8287 .1706 RL
R D68480 800 1456. 182. .2268 .1500 .1463 .0321 DH
R D68480 800 1456. 0. 6.9969 6.9542 4.2607 .1798 DH
R D68480 800 1456. 182. .2268 .1500 .1463 .1799 IB
R D68483 800 2439. 0. 42.3360 42.1599 30.7846 .2947 DH
R D68606 800 2240. 0. 1.4162 1.4122 1.1485 .0033 DH
R D68983 800 2429. 0. 10.7415 10.6985 7.9116 .0133 DH
R D68983 800 2429. 15. 7.3553 5.8547 5.7435 .0087 RL
R D68992 800 2423. 0. 46.4386 46.2444 33.6799 9.1399 DH
R D68992 800 2423. 14. 32.6017 25.9603 25.4671 3.1250 RL
R D69299 800 2407. 0. 24.6244 24.5212 17.8901 12.9093 DH
R D69299 800 2407. 0. 24.6244 24.5212 17.8901 12.8742 RL
R D69310 800 2212. 0. 30.7708 30.6318 21.6747 2.2688 DH
R D69312 800 1427. 135. .7612 .5337 .5214 .0153 DH
R D69312 800 1427. 0. 15.6108 15.5091 9.1746 10.0655 DH
R D69312 800 1427. 135. .7612 .5337 .5214 .0190 IB
R D70213 800 2333. 0. 83.7521 83.3878 59.8451 .5280 DH
R D70213 800 2333. 0. 83.7521 83.3878 59.8451 .7441 RL

Table C-5. (continued).
Site Drum time Aspiration in innermost in rigid drum headspace concentration SamplingID ID no. IDC (days) time (days) layer (Vol%) liner (Vol%) (Vol%) (Vol%) location(a)
Sealed concentration concentration in drum flammable gas
Predicted Predicted hydrogenflammable gas flammable gas concentration Sampled
Predicted
(b)
C-52
R D70335 800 2350. 0. 1.0843 1.0818 .9201 3.0993 DH
R D70335 800 2350. 1. 1.0726 .9642 .9491 1.0795 RL
R D70422 800 2052. 0. 7.6808 7.6455 5.3859 .7185 DH
R D72267 800 1287. 191. .0381 .0253 .0246 .0035 DH
R D72267 800 1287. 0. 1.5467 1.5393 1.0287 .0593 DH
R D72267 800 1287. 191. .0381 .0253 .0246 .0220 IB
R D72545 800 1278. 183. .0376 .0252 .0245 .0035 DH
R D72545 800 1278. 0. 1.4869 1.4799 .9922 .0593 DH
R D72545 800 1278. 183. .0376 .0252 .0245 .0232 IB
R D76138 1 3136. 126. 1.0625 .7882 .7715 .0165 DH
R D76138 1 3136. 0. 25.3608 25.2775 19.8914 .0147 DH
R D76138 1 3136. 126. 1.0625 .7882 .7715 .0803 IB
R D76142 1 2755. 70. 3.5256 2.7522 2.6983 .0129 DH
R D76142 1 2755. 0. 22.9842 22.8996 17.4191 .0078 DH
R D76142 1 2755. 70. 3.5256 2.7522 2.6983 .0488 IB
R D76144 1 3755. 126. 1.3348 .9986 .9776 .0341 DH
R D76144 1 3755. 0. 33.3425 33.2471 27.2258 .0097 DH
R D76144 1 3755. 126. 1.3348 .9986 .9776 .0838 IB
R D76182 1 4486. 0. 74.7482 74.5646 63.0434 .0762 DH
R D76183 1 2861. 309. .4584 .2924 .2847 .0374 DH
R D76183 1 2861. 0. 28.6617 28.5589 21.9228 .0349 DH
R D76183 1 2861. 309. .4584 .2924 .2847 .1373 IB
R D76185 1 1071. 63. 1.9214 1.4723 1.4426 .0111 DH
R D76185 1 1071. 0. 10.1944 10.1117 5.1720 .0059 DH
R D76185 1 1071. 63. 1.9214 1.4723 1.4426 .0353 IB
R D76194 1 3253. 0. 26.2219 26.1371 20.7501 .0210 DH

Table C-5. (continued).
Site Drum time Aspiration in innermost in rigid drum headspace concentration SamplingID ID no. IDC (days) time (days) layer (Vol%) liner (Vol%) (Vol%) (Vol%) location(a)
Sealed concentration concentration in drum flammable gas
Predicted Predicted hydrogenflammable gas flammable gas concentration Sampled
Predicted
(b)
C-53
R D76199 1 3001. 309. .4079 .2602 .2534 .0280 DH
R D76199 1 3001. 309. .4079 .2602 .2534 .1075 IB
R D76205 1 2869. 63. 4.3894 3.4414 3.3742 .0285 DH
R D76205 1 2869. 0. 23.8398 23.7550 18.2705 .0035 DH
R D76205 1 2869. 63. 4.3894 3.4414 3.3742 .1267 IB
R D76287 1 4229. 146. .0265 .0199 .0195 .0092 DH
R D76287 1 4229. 0. 1.2007 1.1989 1.0934 .0081 DH
R D76287 1 4229. 146. .0265 .0199 .0195 .0235 IB
R D76302 1 3079. 126. 1.0501 .7783 .7619 .0126 DH
R D76302 1 3079. 0. 24.9416 24.8581 19.4733 .0076 DH
R D76302 1 3079. 126. 1.0501 .7783 .7619 .0215 IB
R D76305 1 4165. 0. .3278 .3270 .2723 .0057 DH
R D13364 480 2122. 0. 9.3532 8.9202 6.1317 1.5656 DH
R D36606 480 1238. 0. 1.2301 1.1633 .7228 .0593 DH
R D46848 320 2858. 0. 31.7634 30.5971 23.0521 .0033 DH
R D53211 442 2852. 0. 6.7170 6.4825 4.9573 .0168 DH
R D53211 442 2852. 0. 6.7170 6.4825 4.9573 .0368 RL
R D53886 320 3245. 0. 38.4983 37.2430 29.0713 .0798 DH
R D53886 320 3245. 0. 38.4983 37.2430 29.0713 .0033 RL
R D54192 480 2211. 0. .0018 .0017 .0012 .0117 DH
R D57847 480 1082. 0. .5414 .5143 .2660 .0593 DH
R D58347 321 3605. 0. 3.4735 3.3820 2.7849 .0024 DH
R D59077 438 2903. 0. 1.4858 1.4461 1.1858 4.5287 RL
R D59568 377 3012. 331. .3010 .0274 .0264 .0018 DH
R D59663 438 2988. 0. 2.8328 2.7462 2.1823 .0872 DH
R D60463 444 1140. 0. .7015 .6701 .4350 .0137 DH

Table C-5. (continued).
Site Drum time Aspiration in innermost in rigid drum headspace concentration SamplingID ID no. IDC (days) time (days) layer (Vol%) liner (Vol%) (Vol%) (Vol%) location(a)
Sealed concentration concentration in drum flammable gas
Predicted Predicted hydrogenflammable gas flammable gas concentration Sampled
Predicted
(b)
C-54
R D60525 440 2562. 0. 1.3670 1.3271 1.0643 1.4303 RL
R D60684 300 3115. 252. 1.1700 .1063 .1025 .0018 DH
R D61905 377 3011. 330. .2530 .0231 .0222 .0018 DH
R D61961 377 3012. 330. .2957 .0269 .0260 .0021 DH
R D62018 377 3007. 335. .3829 .0348 .0336 .0018 DH
R D62049 442 2741. 0. 2.2387 2.1678 1.7051 .1508 RL
R D62179 440 3184. 0. .6448 .6363 .5778 .0018 RL
R D62545 480 2506. 0. 28.0207 26.8678 19.4064 2.0743 DH
R D62545 480 2506. 0. 28.0207 26.8678 19.4064 4.3922 RL
R D62579 377 3348. 0. .9945 .9756 .8512 .0030 RL
R D62759 442 2742. 0. 1.0236 .9993 .8379 .0454 RL
R D63441 442 2733. 0. .6222 .6128 .5450 .0838 DH
R D63441 442 2733. 0. .6222 .6128 .5450 .0859 RL
R D63442 442 2733. 0. 2.0319 1.9688 1.5564 1.1065 DH
R D63442 442 2733. 0. 2.0319 1.9688 1.5564 .6914 RL
R D63446 442 2734. 0. 10.9037 10.4979 7.8659 19.4369 DH
R D63446 442 2734. 0. 10.9037 10.4979 7.8659 18.7192 RL
R D64480 480 2624. 0. .0002 .0002 .0002 .0033 DH
R D64538 442 2697. 0. .1674 .1609 .1185 .0116 RL
R D64562 442 2690. 0. .2935 .2821 .2075 .0439 DH
R D64562 442 2690. 0. .2935 .2821 .2075 .0443 RL
R D64720 312 2877. 203. 1.6837 .1529 .1475 .0018 DH
R D64752 480 1321. 0. .5919 .5705 .3955 .0593 DH
R D65734 480 2071. 0. 2.5919 2.4828 1.7748 .0059 DH
R D65738 300 2878. 200. 2.4770 .2249 .2169 .0018 DH
R D65957 312 2844. 287. .3427 .0312 .0301 .0018 DH

Table C-5. (continued).
Site Drum time Aspiration in innermost in rigid drum headspace concentration SamplingID ID no. IDC (days) time (days) layer (Vol%) liner (Vol%) (Vol%) (Vol%) location(a)
Sealed concentration concentration in drum flammable gas
Predicted Predicted hydrogenflammable gas flammable gas concentration Sampled
Predicted
(b)
C-55
R D66090 300 2835. 200. 1.8598 .1689 .1629 .0037 DH
R D66157 480 1526. 0. .5540 .5364 .3840 .2771 DH
R D66670 442 2566. 0. .0269 .0258 .0187 .0569 RL
R D66679 442 2560. 0. .9858 .9613 .7977 .4567 DH
R D66682 442 2567. 0. .4783 .4588 .3323 .3742 RL
R D66709 442 2558. 0. .2166 .2077 .1503 .1507 DH
R D66709 442 2558. 0. .2166 .2077 .1503 .1095 RL
R D66773 480 1984. 80. 4.2143 .3833 .3697 .0320 DH
R D66788 300 2837. 229. 1.2271 .1115 .1075 .0018 DH
R D66936 480 2383. 0. .5131 .4996 .3733 .3913 DH
R D66936 480 2383. 0. .5131 .4996 .3733 .1611 RL
R D67066 438 2527. 0. 10.8979 10.4630 7.6436 10.9203 RL
R D67251 480 1490. 0. .1410 .1319 .0754 .0593 DH
R D67317 480 1471. 0. .9903 .9479 .6597 .4982 DH
R D67455 480 2056. 0. 4.5771 4.3690 3.0259 .4451 DH
R D67463 300 2796. 229. 1.5071 .1368 .1320 .0018 DH
R D67605 480 2461. 0. 9.4717 9.0866 6.5925 4.3649 DH
R D67605 480 2461. 0. 9.4717 9.0866 6.5925 2.3279 RL
R D67735 825 1745. 0. .1029 .0971 .0601 .0035 DH
R D67902 300 2759. 200. 2.0535 .1865 .1798 .0018 DH
R D67905 300 2934. 0. 3.5761 3.4613 2.7130 .0039 RL
R D68085 300 2899. 0. 2.7426 2.6570 2.0983 .0065 RL
R D68277 480 1743. 0. 2.8873 2.7439 1.8206 .0058 DH
R D68368 480 2308. 0. 8.8339 8.4548 6.0053 .6217 DH
R D68377 480 1475. 0. .1820 .1702 .0967 .0593 DH
R D68514 480 2054. 0. .6072 .5941 .4941 .3098 DH

Table C-5. (continued).
Site Drum time Aspiration in innermost in rigid drum headspace concentration SamplingID ID no. IDC (days) time (days) layer (Vol%) liner (Vol%) (Vol%) (Vol%) location(a)
Sealed concentration concentration in drum flammable gas
Predicted Predicted hydrogenflammable gas flammable gas concentration Sampled
Predicted
(b)
C-56
R D68929 300 2920. 0. 2.0582 1.9978 1.6040 .0025 RL
R D68930 300 3001. 0. 2.6638 2.5836 2.0608 .0041 RL
R D69414 300 2904. 0. 2.0642 2.0033 1.6059 .0021 RL
R D69442 300 2903. 0. 3.4384 3.3274 2.6045 .0018 RL
R D70446 480 1316. 0. 1.7476 1.6478 1.0060 .0593 DH
R D71351 480 1352. 0. 1.5769 1.4909 .9337 .0593 DH
R D71354 480 1347. 0. .6797 .6542 .4622 .0593 DH
R D71638 480 1312. 0. .5686 .5476 .3689 .0593 DH
R D72079 480 1506. 0. 2.3512 2.2235 1.4047 .0119 DH
R D72371 300 2780. 0. 1.6845 1.6355 1.3150 .0035 RL
R D72384 300 2751. 0. 2.9486 2.8507 2.2129 .0067 RL
R D72831 480 1279. 0. .8277 .7910 .5326 .0593 DH
R D75978 824 1626. 0. .5569 .5405 .4016 .0115 RL
R D76714 321 2319. 0. 3.0546 2.9354 2.1605 .0081 RL
R D76716 321 2335. 0. 2.3303 2.2440 1.6813 .0073 RL
R D78336 444 1433. 0. .2561 .2392 .1337 .0018 DH
R D85299 321 0. 813. .2535 .0227 .0219 .0063 DH
R D85389 824 0. 870. .1790 .0161 .0155 .0070 DH
R D85406 824 0. 870. .2252 .0202 .0194 .0115 DH
R D85670 440 0. 377. .0827 .0073 .0070 .0133 DH
R D86658 480 0. 352. .0657 .0057 .0055 .0168 DH
R D86663 480 0. 349. .1749 .0153 .0147 .0042 DH
R D55521 825 2942. 0. 1.8702 1.8286 1.5873 .0073 RL
R D56036 832 2907. 0. 2.5688 2.4975 2.0907 .0218 RL
R D57202 832 2814. 0. 2.9448 2.8549 2.3425 .0222 RL
R D58972 822 2989. 0. 1.2819 1.2638 1.1484 .0018 RL
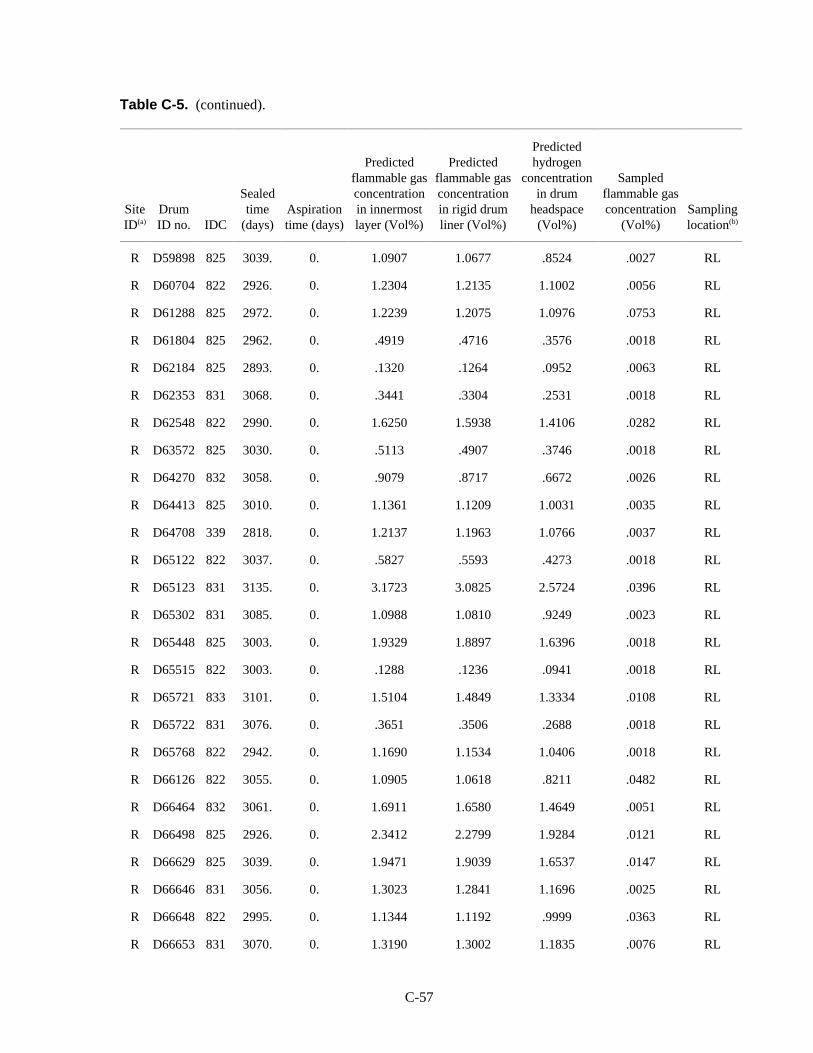
Table C-5. (continued).
Site Drum time Aspiration in innermost in rigid drum headspace concentration SamplingID ID no. IDC (days) time (days) layer (Vol%) liner (Vol%) (Vol%) (Vol%) location(a)
Sealed concentration concentration in drum flammable gas
Predicted Predicted hydrogenflammable gas flammable gas concentration Sampled
Predicted
(b)
C-57
R D59898 825 3039. 0. 1.0907 1.0677 .8524 .0027 RL
R D60704 822 2926. 0. 1.2304 1.2135 1.1002 .0056 RL
R D61288 825 2972. 0. 1.2239 1.2075 1.0976 .0753 RL
R D61804 825 2962. 0. .4919 .4716 .3576 .0018 RL
R D62184 825 2893. 0. .1320 .1264 .0952 .0063 RL
R D62353 831 3068. 0. .3441 .3304 .2531 .0018 RL
R D62548 822 2990. 0. 1.6250 1.5938 1.4106 .0282 RL
R D63572 825 3030. 0. .5113 .4907 .3746 .0018 RL
R D64270 832 3058. 0. .9079 .8717 .6672 .0026 RL
R D64413 825 3010. 0. 1.1361 1.1209 1.0031 .0035 RL
R D64708 339 2818. 0. 1.2137 1.1963 1.0766 .0037 RL
R D65122 822 3037. 0. .5827 .5593 .4273 .0018 RL
R D65123 831 3135. 0. 3.1723 3.0825 2.5724 .0396 RL
R D65302 831 3085. 0. 1.0988 1.0810 .9249 .0023 RL
R D65448 825 3003. 0. 1.9329 1.8897 1.6396 .0018 RL
R D65515 822 3003. 0. .1288 .1236 .0941 .0018 RL
R D65721 833 3101. 0. 1.5104 1.4849 1.3334 .0108 RL
R D65722 831 3076. 0. .3651 .3506 .2688 .0018 RL
R D65768 822 2942. 0. 1.1690 1.1534 1.0406 .0018 RL
R D66126 822 3055. 0. 1.0905 1.0618 .8211 .0482 RL
R D66464 832 3061. 0. 1.6911 1.6580 1.4649 .0051 RL
R D66498 825 2926. 0. 2.3412 2.2799 1.9284 .0121 RL
R D66629 825 3039. 0. 1.9471 1.9039 1.6537 .0147 RL
R D66646 831 3056. 0. 1.3023 1.2841 1.1696 .0025 RL
R D66648 822 2995. 0. 1.1344 1.1192 .9999 .0363 RL
R D66653 831 3070. 0. 1.3190 1.3002 1.1835 .0076 RL

Table C-5. (continued).
Site Drum time Aspiration in innermost in rigid drum headspace concentration SamplingID ID no. IDC (days) time (days) layer (Vol%) liner (Vol%) (Vol%) (Vol%) location(a)
Sealed concentration concentration in drum flammable gas
Predicted Predicted hydrogenflammable gas flammable gas concentration Sampled
Predicted
(b)
C-58
R D66660 833 3079. 0. 1.5720 1.5438 1.3778 .0131 RL
R D66675 825 3058. 0. .9807 .9415 .7207 .0018 RL
R D66745 825 2980. 0. .1735 .1664 .1264 .0018 RL
R D66749 825 2968. 0. .6873 .6590 .5000 .0018 RL
R D66754 822 3021. 0. .1395 .1338 .1021 .0018 RL
R D66755 825 2961. 0. .2264 .2170 .1646 .0018 RL
R D66794 832 3132. 0. .5237 .5033 .3879 .0063 RL
R D66825 825 3107. 0. 2.1772 2.1259 1.8317 .0767 RL
R D66837 831 3129. 0. 2.2730 2.2183 1.9052 .0476 RL
R D66844 832 3038. 0. 1.0922 1.0682 .8450 .0086 RL
R D66846 831 3068. 0. .2237 .2148 .1646 .0026 RL
R D66848 825 2799. 0. 1.1016 1.0799 .8830 .0018 RL
R D66891 832 3092. 0. .3008 .2889 .2218 .0080 RL
R D66923 825 3060. 0. 1.5239 1.4976 1.3411 .0593 RL
R D66924 822 2421. 0. 1.6192 1.5804 1.3458 .0065 RL
R D66927 825 3000. 0. 2.9904 2.9041 2.4143 .0342 RL
R D66980 822 2988. 0. 1.6391 1.6074 1.4210 .0061 RL
R D66990 821 2967. 0. .7367 .7064 .5360 .0023 RL
R D67054 831 3104. 0. 1.6050 1.5760 1.4053 .0064 RL
R D67057 831 3047. 0. 1.0930 1.0640 .8219 .0019 RL
R D67082 831 3053. 0. 2.7807 2.7043 2.2698 .0197 RL
R D67110 822 2974. 0. 1.6870 1.6533 1.4555 .0162 RL
R D67132 832 3074. 0. .5591 .5369 .4116 .0067 RL
R D67157 822 3032. 0. .9794 .9400 .7177 .0018 RL
R D67233 832 3037. 0. 3.6131 3.5026 2.8769 .0495 RL
R D67305 831 3019. 0. 1.5933 1.5637 1.3892 .0107 RL

Table C-5. (continued).
Site Drum time Aspiration in innermost in rigid drum headspace concentration SamplingID ID no. IDC (days) time (days) layer (Vol%) liner (Vol%) (Vol%) (Vol%) location(a)
Sealed concentration concentration in drum flammable gas
Predicted Predicted hydrogenflammable gas flammable gas concentration Sampled
Predicted
(b)
C-59
R D67328 831 3051. 0. .4146 .3980 .3044 .0044 RL
R D67377 822 3043. 0. 1.2800 1.2624 1.1504 .0018 RL
R D67380 822 3022. 0. 1.0926 1.0638 .8208 .0018 RL
R D67385 825 2980. 0. 1.0456 1.0028 .7618 .0018 RL
R D67444 832 3037. 0. .9512 .9129 .6974 .0045 RL
R D67456 831 2990. 0. 2.1625 2.1098 1.8068 .0118 RL
R D67537 825 2983. 0. 1.1358 1.1204 1.0002 .0018 RL
R D67544 825 3031. 0. .5470 .5249 .4008 .0018 RL
R D67647 832 2999. 0. 1.2141 1.1981 1.0906 .0018 RL
R D67714 822 3074. 0. .1336 .1283 .0983 .0063 RL
R D67874 825 2912. 0. 3.7850 3.6631 2.9716 .0178 RL
R D67901 832 3006. 0. 1.4205 1.3975 1.2587 .0050 RL
R D67939 822 3015. 0. .9379 .9000 .6860 .0047 RL
R D67945 822 2979. 0. .7132 .6840 .5196 .0018 RL
R D67956 822 2925. 0. 1.2222 1.2055 1.0927 .0022 RL
R D68066 832 3004. 0. 2.6632 2.5903 2.1749 .0040 RL
R D68072 832 2978. 0. 1.8835 1.8418 1.6003 .0019 RL
R D68080 832 3049. 0. 1.1723 1.1575 1.0527 .0075 RL
R D68149 832 3012. 0. 1.4490 1.4250 1.2799 .0032 RL
R D68157 825 3046. 0. 1.7271 1.6925 1.4912 .0285 RL
R D68171 832 3068. 0. .9902 .9507 .7284 .0170 RL
R D68362 832 3060. 0. 1.1443 1.1296 1.0193 .0020 RL
R D68366 831 3076. 0. 1.4719 1.4476 1.3026 .0104 RL
R D68379 831 3072. 0. 1.0948 1.0750 .8943 .0063 RL
R D68448 832 2987. 0. 2.2110 2.1563 1.8419 .0170 RL
R D68511 832 3063. 0. 1.1880 1.1731 1.0697 .0084 RL

Table C-5. (continued).
Site Drum time Aspiration in innermost in rigid drum headspace concentration SamplingID ID no. IDC (days) time (days) layer (Vol%) liner (Vol%) (Vol%) (Vol%) location(a)
Sealed concentration concentration in drum flammable gas
Predicted Predicted hydrogenflammable gas flammable gas concentration Sampled
Predicted
(b)
C-60
R D68518 825 2878. 0. .8880 .8506 .6393 .0031 RL
R D68532 832 3060. 0. 1.2914 1.2735 1.1609 .0092 RL
R D68533 832 3054. 0. .9465 .9086 .6952 .0063 RL
R D68544 832 2982. 0. .7927 .7602 .5777 .0055 RL
R D68624 832 3070. 0. 1.3135 1.2950 1.1795 .0063 RL
R D68632 832 3063. 0. 1.0940 1.0746 .8992 .0063 RL
R D68637 832 3058. 0. 1.5839 1.5551 1.3853 .0070 RL
R D68640 832 2990. 0. 2.5602 2.4913 2.0972 .0252 RL
R D68665 832 3026. 0. 3.2067 3.1125 2.5776 .0298 RL
R D68676 825 2918. 0. 1.2713 1.2530 1.1345 .0067 RL
R D68711 833 2970. 0. 2.2119 2.1569 1.8406 .0201 RL
R D68740 832 2983. 0. .9162 .8787 .6678 .0018 RL
R D68748 833 2972. 0. 4.2490 4.1103 3.3260 .1028 RL
R D68769 825 2960. 0. 1.3357 1.3154 1.1892 .1118 RL
R D68784 832 3041. 0. 1.0102 .9698 .7410 .0063 RL
R D68787 822 3049. 0. 1.0808 1.0375 .7935 .0063 RL
R D68790 822 2942. 0. 2.6611 2.5868 2.1635 .0259 RL
R D68794 822 2914. 0. 2.4531 2.3868 2.0072 .0263 RL
R D68807 832 2984. 0. 2.1429 2.0910 1.7918 .0075 RL
R D68821 832 3050. 0. 1.0485 1.0065 .7698 .0063 RL
R D68826 825 2953. 0. 1.5296 1.5020 1.3373 .0018 RL
R D68838 825 2939. 0. 1.2819 1.2635 1.1452 .0020 RL
R D68855 825 2955. 0. 1.1326 1.1168 .9929 .0018 RL
R D68871 825 2962. 0. 1.9088 1.8658 1.6166 .0138 RL
R D68879 832 2990. 0. 2.0579 2.0094 1.7294 .0155 RL
R D68880 832 3049. 0. 1.1374 1.1226 1.0086 .0063 RL

Table C-5. (continued).
Site Drum time Aspiration in innermost in rigid drum headspace concentration SamplingID ID no. IDC (days) time (days) layer (Vol%) liner (Vol%) (Vol%) (Vol%) location(a)
Sealed concentration concentration in drum flammable gas
Predicted Predicted hydrogenflammable gas flammable gas concentration Sampled
Predicted
(b)
C-61
R D68953 825 2941. 0. 1.4945 1.4680 1.3093 .0039 RL
R D68968 832 2962. 0. 3.5226 3.4135 2.7942 .0318 RL
R D69008 825 2976. 0. 1.6426 1.6107 1.4231 .0047 RL
R D69022 832 3034. 0. 1.3919 1.3702 1.2384 .0151 RL
R D69154 832 3038. 0. 1.1685 1.1537 1.0473 .0076 RL
R D69157 832 3025. 0. 1.1058 1.0885 .9396 .0068 RL
R D69179 832 2949. 0. 1.4557 1.4310 1.2813 .0043 RL
R D69180 832 2974. 0. 1.4805 1.4551 1.3021 .0109 RL
R D69182 832 3027. 0. 1.3018 1.2833 1.1670 .0063 RL
R D69197 825 2977. 0. 1.4970 1.4706 1.3135 .0189 RL
R D69198 832 2958. 0. 3.1819 3.0862 2.5445 .0185 RL
R D69240 825 2332. 0. 1.3010 1.2753 1.1022 .0147 RL
R D69337 832 2963. 0. 1.4788 1.4533 1.2999 .0122 RL
R D69370 822 2884. 0. 1.0963 1.0736 .8631 .0018 RL
R D69375 831 2841. 0. 1.8695 1.8265 1.5759 .0100 RL
R D69480 822 2849. 0. 1.1460 1.1296 1.0033 .0036 RL
R D69511 825 2883. 0. 1.8597 1.8175 1.5726 .0018 RL
R D69516 832 2943. 0. 1.1129 1.0960 .9555 .0050 RL
R D69517 822 2874. 0. 1.1226 1.1055 .9659 .0041 RL
R D69518 825 2926. 0. 1.2648 1.2468 1.1299 .0023 RL
R D69534 825 2985. 0. .3976 .3814 .2899 .0063 RL
R D69536 825 2914. 0. .1723 .1651 .1246 .0018 RL
R D69623 832 2951. 0. 3.1398 3.0461 2.5131 .0019 RL
R D69638 832 2966. 0. 2.7662 2.6882 2.2437 .0204 RL
R D69656 832 2923. 0. 1.1456 1.1299 1.0096 .0053 RL
R D69657 832 2943. 0. 1.5356 1.5076 1.3410 .0187 RL

Table C-5. (continued).
Site Drum time Aspiration in innermost in rigid drum headspace concentration SamplingID ID no. IDC (days) time (days) layer (Vol%) liner (Vol%) (Vol%) (Vol%) location(a)
Sealed concentration concentration in drum flammable gas
Predicted Predicted hydrogenflammable gas flammable gas concentration Sampled
Predicted
(b)
C-62
R D69676 339 2850. 0. 3.7662 3.6425 2.9414 .0606 RL
R D69740 825 2939. 0. .4319 .4140 .3132 .0018 RL
R D69747 822 2855. 0. 2.0677 2.0166 1.7210 .0103 RL
R D69769 825 2182. 0. 1.1127 1.0808 .7838 .0049 RL
R D69996 831 2985. 0. 1.4399 1.4161 1.2720 .0295 RL
R D70019 825 2861. 0. 1.3418 1.3204 1.1869 .0036 RL
R D70025 821 2867. 0. 1.1708 1.1546 1.0371 .0023 RL
R D70026 822 2847. 0. 1.1119 1.0936 .9381 .0028 RL
R D70139 832 2900. 0. 1.1810 1.1650 1.0505 .0028 RL
R D70150 832 2928. 0. .8923 .8551 .6462 .0098 RL
R D70263 822 2827. 0. 1.2175 1.2001 1.0808 .0095 RL
R D70317 832 2954. 0. 1.1070 1.0891 .9342 .0039 RL
R D70319 825 2884. 0. 1.2291 1.2119 1.0959 .0020 RL
R D70332 825 2984. 0. 1.3601 1.3393 1.2107 .0099 RL
R D70378 825 2877. 0. .7559 .7239 .5441 .0018 RL
R D70387 822 2974. 0. .7585 .7274 .5523 .0063 RL
R D70392 822 2877. 0. .9820 .9405 .7069 .0018 RL
R D70460 832 2943. 0. 1.6519 1.6191 1.4261 .0163 RL
R D70464 822 2860. 0. 3.1501 3.0530 2.5003 .0018 RL
R D70501 822 2834. 0. 1.0955 1.0703 .8351 .0050 RL
R D70598 832 2948. 0. 1.2157 1.1994 1.0884 .0063 RL
R D70659 822 2850. 0. 2.3340 2.2711 1.9108 .0351 RL
R D70683 831 2820. 0. 3.6508 3.5310 2.8507 .0514 RL
R D70751 831 2890. 0. 1.3538 1.3322 1.1982 .0022 RL
R D70781 832 2841. 0. 1.6555 1.6214 1.4195 .0054 RL
R D70791 832 2891. 0. 1.2542 1.2363 1.1184 .0095 RL

Table C-5. (continued).
Site Drum time Aspiration in innermost in rigid drum headspace concentration SamplingID ID no. IDC (days) time (days) layer (Vol%) liner (Vol%) (Vol%) (Vol%) location(a)
Sealed concentration concentration in drum flammable gas
Predicted Predicted hydrogenflammable gas flammable gas concentration Sampled
Predicted
(b)
C-63
R D70900 832 2894. 0. 1.9812 1.9344 1.6631 .0186 RL
R D70930 822 2882. 0. 3.0520 2.9599 2.4349 .0031 RL
R D70932 832 2863. 0. 2.3148 2.2528 1.8993 .0150 RL
R D71072 825 2825. 0. .2418 .2314 .1730 .0393 RL
R D71118 832 2793. 0. 1.6511 1.6165 1.4114 .0035 RL
R D71168 832 2898. 0. 1.4144 1.3907 1.2459 .0300 RL
R D71184 822 2797. 0. .5205 .4979 .3710 .1179 RL
R D71191 822 2828. 0. .9365 .8963 .6701 .0018 RL
R D71211 831 2920. 0. 3.1568 3.0612 2.5184 .0386 RL
R D71214 831 2931. 0. 1.2035 1.1873 1.0756 .0063 RL
R D71218 831 2884. 0. 1.7269 1.6904 1.4764 .0205 RL
R D71230 825 2914. 0. 1.3204 1.3004 1.1744 .0038 RL
R D71260 831 2854. 0. 1.9333 1.8876 1.6234 .0133 RL
R D71289 832 2926. 0. 1.2810 1.2624 1.1431 .0063 RL
R D71493 832 2929. 0. 1.3749 1.3530 1.2180 .0063 RL
R D71495 832 2906. 0. 1.2143 1.1977 1.0840 .0038 RL
R D71511 822 2765. 0. 1.1068 1.0866 .9089 .0026 RL
R D71519 822 2757. 0. .1897 .1814 .1345 .0018 RL
R D71621 832 2859. 0. 1.4645 1.4384 1.2801 .0132 RL
R D71622 832 2830. 0. 1.4901 1.4627 1.2975 .0036 RL
R D71640 832 2840. 0. .4651 .4452 .3333 .0018 RL
R D71687 825 2136. 0. 1.2835 1.2555 1.0605 .0269 RL
R D71832 832 2842. 0. 1.2583 1.2399 1.1182 .0061 RL
R D71846 831 2820. 0. 3.3747 3.2666 2.6523 .0151 RL
R D71930 825 2150. 0. 1.1455 1.1198 .9035 .0018 RL
R D71978 832 2899. 0. 1.1041 1.0854 .9222 .0063 RL

Table C-5. (continued).
Site Drum time Aspiration in innermost in rigid drum headspace concentration SamplingID ID no. IDC (days) time (days) layer (Vol%) liner (Vol%) (Vol%) (Vol%) location(a)
Sealed concentration concentration in drum flammable gas
Predicted Predicted hydrogenflammable gas flammable gas concentration Sampled
Predicted
(b)
C-64
R D71980 832 2806. 0. 1.0956 1.0686 .8206 .0044 RL
R D72009 825 2813. 0. 1.4738 1.4468 1.2836 .0019 RL
R D72022 825 2761. 0. .3250 .3108 .2306 .0018 RL
R D72088 832 2799. 0. .2302 .2202 .1641 .0018 RL
R D72137 825 2711. 0. .3484 .3328 .2455 .0018 RL
R D72143 822 2850. 0. .2154 .2062 .1545 .0018 RL
R D72145 825 2731. 0. .4205 .4018 .2971 .0018 RL
R D72159 821 2859. 0. 3.2165 3.1165 2.5475 .0161 RL
R D72198 822 2770. 0. .1674 .1600 .1189 .0018 RL
R D72247 832 2783. 0. .1342 .1283 .0955 .0063 RL
R D72252 832 2884. 0. 1.1576 1.1415 1.0220 .0065 RL
R D72404 825 2765. 0. .4384 .4192 .3112 .0018 RL
R D72450 832 2883. 0. 1.0968 1.0574 .7963 .0111 RL
R D72600 832 2814. 0. 1.1471 1.1304 1.0013 .0095 RL
R D72610 832 2853. 0. 1.1123 1.0940 .9377 .0032 RL
R D72652 832 2859. 0. .5269 .5045 .3785 .0063 RL
R D72672 832 2843. 0. 1.1794 1.1629 1.0444 .0054 RL
R D72780 832 2852. 0. 1.1039 1.0845 .9138 .0101 RL
R D72820 832 2842. 0. .5400 .5169 .3870 .0019 RL
R D72843 832 2822. 0. .5677 .5432 .4059 .0018 RL
R D72850 832 2827. 0. 1.5386 1.5091 1.3321 .0137 RL
R D72893 832 2847. 0. 1.9827 1.9348 1.6575 .0128 RL
R D72924 825 2719. 0. 1.0976 1.0645 .7939 .0024 RL
R D72927 825 2757. 0. 1.2713 1.2516 1.1221 .0033 RL
R D72930 825 2710. 0. .7574 .7236 .5337 .0018 RL
R D73038 825 2764. 0. 1.2113 1.1935 1.0696 .0039 RL
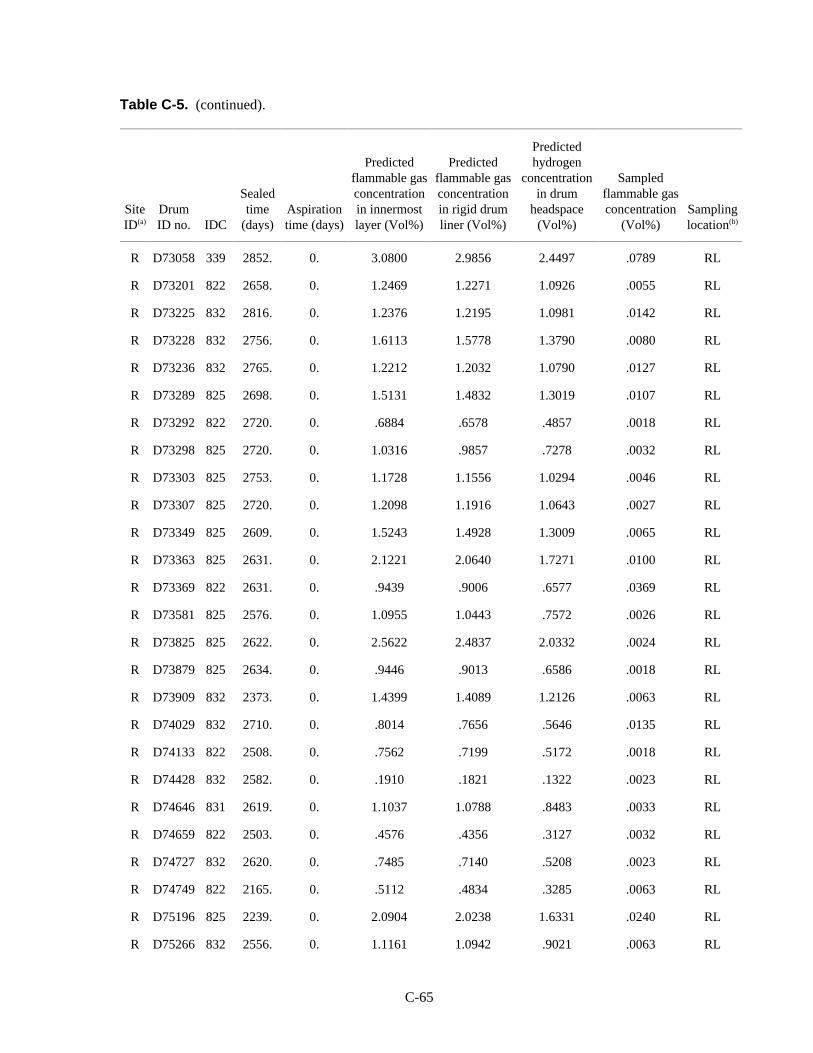
Table C-5. (continued).
Site Drum time Aspiration in innermost in rigid drum headspace concentration SamplingID ID no. IDC (days) time (days) layer (Vol%) liner (Vol%) (Vol%) (Vol%) location(a)
Sealed concentration concentration in drum flammable gas
Predicted Predicted hydrogenflammable gas flammable gas concentration Sampled
Predicted
(b)
C-65
R D73058 339 2852. 0. 3.0800 2.9856 2.4497 .0789 RL
R D73201 822 2658. 0. 1.2469 1.2271 1.0926 .0055 RL
R D73225 832 2816. 0. 1.2376 1.2195 1.0981 .0142 RL
R D73228 832 2756. 0. 1.6113 1.5778 1.3790 .0080 RL
R D73236 832 2765. 0. 1.2212 1.2032 1.0790 .0127 RL
R D73289 825 2698. 0. 1.5131 1.4832 1.3019 .0107 RL
R D73292 822 2720. 0. .6884 .6578 .4857 .0018 RL
R D73298 825 2720. 0. 1.0316 .9857 .7278 .0032 RL
R D73303 825 2753. 0. 1.1728 1.1556 1.0294 .0046 RL
R D73307 825 2720. 0. 1.2098 1.1916 1.0643 .0027 RL
R D73349 825 2609. 0. 1.5243 1.4928 1.3009 .0065 RL
R D73363 825 2631. 0. 2.1221 2.0640 1.7271 .0100 RL
R D73369 822 2631. 0. .9439 .9006 .6577 .0369 RL
R D73581 825 2576. 0. 1.0955 1.0443 .7572 .0026 RL
R D73825 825 2622. 0. 2.5622 2.4837 2.0332 .0024 RL
R D73879 825 2634. 0. .9446 .9013 .6586 .0018 RL
R D73909 832 2373. 0. 1.4399 1.4089 1.2126 .0063 RL
R D74029 832 2710. 0. .8014 .7656 .5646 .0135 RL
R D74133 822 2508. 0. .7562 .7199 .5172 .0018 RL
R D74428 832 2582. 0. .1910 .1821 .1322 .0023 RL
R D74646 831 2619. 0. 1.1037 1.0788 .8483 .0033 RL
R D74659 822 2503. 0. .4576 .4356 .3127 .0032 RL
R D74727 832 2620. 0. .7485 .7140 .5208 .0023 RL
R D74749 822 2165. 0. .5112 .4834 .3285 .0063 RL
R D75196 825 2239. 0. 2.0904 2.0238 1.6331 .0240 RL
R D75266 832 2556. 0. 1.1161 1.0942 .9021 .0063 RL

Table C-5. (continued).
Site Drum time Aspiration in innermost in rigid drum headspace concentration SamplingID ID no. IDC (days) time (days) layer (Vol%) liner (Vol%) (Vol%) (Vol%) location(a)
Sealed concentration concentration in drum flammable gas
Predicted Predicted hydrogenflammable gas flammable gas concentration Sampled
Predicted
(b)
C-66
R D75272 339 2307. 0. 1.7198 1.6739 1.3976 .0188 RL
R D75280 339 2462. 0. 1.8963 1.8449 1.5435 .0167 RL
R D75605 832 2445. 0. .5957 .5665 .4033 .0018 RL
R D75759 822 2338. 0. 3.4411 3.3087 2.5561 .0188 RL
R D75894 825 2474. 0. 1.1359 1.1149 .9406 .0063 RL
R D76176 339 2303. 0. 1.1831 1.1606 .9895 .0103 RL
R D76446 825 2269. 0. 1.1238 1.0981 .8708 .0019 RL
R D76451 825 2268. 0. .8186 .7757 .5370 .0018 RL
R D76455 825 2361. 0. .5921 .5621 .3951 .0018 RL
R D76576 825 2238. 0. .6997 .6627 .4563 .0020 RL
R D76639 825 2250. 0. 1.2127 1.1889 1.0138 .0045 RL
R D76776 825 2235. 0. .4803 .4548 .3131 .0018 RL
R D76831 822 2188. 0. 1.3272 1.2983 1.1032 .0046 RL
R D76934 831 2319. 0. .9854 .9348 .6526 .0063 RL
R D77114 832 2219. 0. .8270 .7829 .5373 .0139 RL
R D77225 825 2192. 0. .9549 .9034 .6170 .0027 RL
R D85061 822 693. 0. .4394 .3825 .1304 .0029 RL
R D85338 822 584. 0. 1.4368 1.3260 .5437 .0118 RL
a. R = RFETSb. RL = Rigid drum liner; DH = Drum headspace; IB = Inner bag (Innermost confinement layer)

D-1
Appendix D
Results of the Gas GenerationTesting Program at the Rocky Flats
Environmental Technology Site

D-2
Table D-1. Shipping category II.1A4 Rocky Flats Environmental Technology Site Gas Generation TestingProgram effective G-values.
Drum rate (molecules/ UCL for percentileno. IDC Watts (moles/sec) MDP matrix 100 eV) mean G-value G-value UTL
Hydrogen gasgeneration Hydrogen G 95eff
95
th
95
1 49536 300 0.0995 1.139E-10 PE/PVC 0.011 0.2600 0.44 0.642 52972 300 0.1053 8.707E-11 PE/PVC 0.008 0.2600 0.44 0.643 53919 300 0.0956 1.161E-10 PE/PVC 0.012 0.2600 0.44 0.644 54583 300 0.1911 0.000E+00 PE/PVC 0.000 0.2600 0.44 0.645 54634 300 0.0858 3.386E-11 PE/PVC 0.004 0.2600 0.44 0.646 55068 300 0.1697 3.521E-10 PE/PVC 0.020 0.2600 0.44 0.647 55073 300 0.0897 3.546E-10 PE/PVC 0.038 0.2600 0.44 0.648 55785 300 0.1326 6.681E-10 PE/PVC 0.049 0.2600 0.44 0.649 57092 442 0.0830 0.000E+00 PE/PVC 0.000 0.2600 0.44 0.6410 57972 300 0.0917 -2.589E-11 PE/PVC -0.003 0.2600 0.44 0.6411 59917 300 0.2399 0.000E+00 PE/PVC 0.000 0.2600 0.44 0.6412 63765 300 0.0468 3.418E-10 PE/PVC 0.070 0.2600 0.44 0.6413 66668 480 0.0975 5.851E-10 PE/PVC 0.058 0.2600 0.44 0.6414 70081 480 0.0702 1.517E-09 PE/PVC 0.208 0.2600 0.44 0.6415 71269 480 0.1619 1.213E-09 PE/PVC 0.072 0.2600 0.44 0.6416 72368 480 0.1443 2.159E-09 PE/PVC 0.144 0.2600 0.44 0.64
Table D-2. Shipping category III.1A4 Rocky Flats Environmental Technology Site Gas Generation TestingProgram effective G-values.
Drum no. IDC Watts (moles/sec) MDP matrix 100 eV) mean G-value G-value UTL
Hydrogen gasgeneration Hydrogen G 95
rate (molecules/ UCL for Percentileeff
95
th
95
1 6330 337 0.3530 3.536E-08 PE/PVC/WC/DC 0.967 0.48 0.99 1.092 6331 337 0.4660 2.822E-08 PE/PVC/WC/DC 0.584 0.48 0.99 1.093 6332 336 0.5586 3.946E-08 PE/PVC/WC/DC 0.682 0.48 0.99 1.094 6334 337 0.3958 2.528E-08 PE/PVC/WC/DC 0.616 0.48 0.99 1.095 6339 337 1.0626 4.373E-08 PE/PVC/WC/DC 0.397 0.48 0.99 1.096 6350 337 0.9622 3.108E-08 PE/PVC/WC/DC 0.312 0.48 0.99 1.097 6354 336 1.1065 1.525E-08 PE/PVC/WC/DC 0.133 0.48 0.99 1.098 11255 330 0.8287 3.416E-08 PE/PVC/WC/DC 0.398 0.48 0.99 1.099 11931 337 0.3178 9.236E-10 PE/PVC/WC/DC 0.028 0.48 0.99 1.09
10 13855 336 0.1229 6.337E-09 PE/PVC/WC/DC 0.498 0.48 0.99 1.0911 20990 336 0.3003 1.051E-09 PE/PVC/WC/DC 0.034 0.48 0.99 1.0912 22901 336 0.4339 6.755E-09 PE/PVC/WC/DC 0.150 0.48 0.99 1.0913 41065 336 0.1112 4.529E-09 PE/PVC/WC/DC 0.393 0.48 0.99 1.0914 41574 336 0.0819 3.624E-09 PE/PVC/WC/DC 0.427 0.48 0.99 1.0915 46817 336 0.0527 -2.838E-09 PE/PVC/WC/DC -0.520 0.48 0.99 1.0916 49139 336 0.0858 2.350E-09 PE/PVC/WC/DC 0.264 0.48 0.99 1.09

Table D-2. (continued).
Drum no. IDC Watts (moles/sec) MDP matrix 100 eV) mean G-value G-value UTL
Hydrogen gasgeneration Hydrogen G 95
rate (molecules/ UCL for Percentileeff
95
th
95
D-3
17 49295 338 0.3549 1.702E-09 PE/PVC/WC/DC 0.046 0.48 0.99 1.0918 50189 335 0.2282 6.007E-10 PE/PVC/WC/DC 0.025 0.48 0.99 1.0919 50475 330 0.4280 2.738E-08 PE/PVC/WC/DC 0.617 0.48 0.99 1.0920 50480 330 0.6503 3.328E-08 PE/PVC/WC/DC 0.494 0.48 0.99 1.0921 54018 330 0.0936 -8.257E-11 PE/PVC/WC/DC -0.009 0.48 0.99 1.0922 54796 330 0.3393 1.249E-08 PE/PVC/WC/DC 0.355 0.48 0.99 1.0923 54992 336 0.0683 -1.826E-10 PE/PVC/WC/DC -0.026 0.48 0.99 1.0924 55010 338 0.3315 2.992E-10 PE/PVC/WC/DC 0.009 0.48 0.99 1.0925 55520 336 0.0995 3.894E-09 PE/PVC/WC/DC 0.378 0.48 0.99 1.0926 56729 337 0.0702 2.960E-09 PE/PVC/WC/DC 0.407 0.48 0.99 1.0927 58918 336 0.2301 4.127E-09 PE/PVC/WC/DC 0.173 0.48 0.99 1.0928 59499 330 0.1034 3.277E-09 PE/PVC/WC/DC 0.306 0.48 0.99 1.0929 60506 336 0.2711 1.013E-08 PE/PVC/WC/DC 0.360 0.48 0.99 1.0930 60512 342 0.0858 1.591E-09 PE/PVC/WC/DC 0.179 0.48 0.99 1.0931 60744 336 0.0488 3.205E-09 PE/PVC/WC/DC 0.634 0.48 0.99 1.0932 61135 336 0.0819 3.842E-09 PE/PVC/WC/DC 0.453 0.48 0.99 1.0933 61245 336 0.0663 2.284E-09 PE/PVC/WC/DC 0.332 0.48 0.99 1.0934 61385 336 0.1989 1.129E-08 PE/PVC/WC/DC 0.548 0.48 0.99 1.0935 61388 335 0.1619 2.670E-09 PE/PVC/WC/DC 0.159 0.48 0.99 1.0936 61797 336 0.2828 6.008E-09 PE/PVC/WC/DC 0.205 0.48 0.99 1.0937 61884 336 0.0936 5.282E-09 PE/PVC/WC/DC 0.545 0.48 0.99 1.0938 62709 300 0.1463 5.593E-10 PE/PVC/WC/DC 0.037 0.48 0.99 1.0939 63074 336 0.0780 3.449E-09 PE/PVC/WC/DC 0.427 0.48 0.99 1.0940 63469 336 0.1736 5.292E-09 PE/PVC/WC/DC 0.294 0.48 0.99 1.0941 63768 336 0.0585 2.284E-09 PE/PVC/WC/DC 0.377 0.48 0.99 1.0942 63772 376 0.1092 4.781E-10 PE/PVC/WC/DC 0.042 0.48 0.99 1.0943 63966 342 0.2126 2.421E-09 PE/PVC/WC/DC 0.110 0.48 0.99 1.0944 64549 336 0.1599 3.645E-09 PE/PVC/WC/DC 0.220 0.48 0.99 1.0945 65057 330 0.7204 8.101E-09 PE/PVC/WC/DC 0.109 0.48 0.99 1.0946 65476 342 0.0975 3.639E-10 PE/PVC/WC/DC 0.036 0.48 0.99 1.0947 65484 330 0.3257 1.346E-08 PE/PVC/WC/DC 0.399 0.48 0.99 1.0948 65560 342 0.0527 5.674E-10 PE/PVC/WC/DC 0.104 0.48 0.99 1.0949 65643 342 0.0351 9.943E-10 PE/PVC/WC/DC 0.273 0.48 0.99 1.0950 66329 337 0.1248 4.965E-09 PE/PVC/WC/DC 0.384 0.48 0.99 1.0951 66543 336 0.4202 1.847E-08 PE/PVC/WC/DC 0.424 0.48 0.99 1.0952 66855 336 0.1014 3.718E-09 PE/PVC/WC/DC 0.354 0.48 0.99 1.0953 66867 337 0.1541 2.547E-09 PE/PVC/WC/DC 0.160 0.48 0.99 1.0954 68067 330 0.3491 2.415E-08 PE/PVC/WC/DC 0.668 0.48 0.99 1.0955 68286 335 0.3276 5.251E-09 PE/PVC/WC/DC 0.155 0.48 0.99 1.0956 68608 337 0.0858 2.007E-09 PE/PVC/WC/DC 0.226 0.48 0.99 1.0957 68655 336 0.5440 1.089E-08 PE/PVC/WC/DC 0.193 0.48 0.99 1.0958 69104 330 0.1775 7.932E-09 PE/PVC/WC/DC 0.431 0.48 0.99 1.0959 69376 330 0.7555 1.429E-08 PE/PVC/WC/DC 0.183 0.48 0.99 1.0960 69907 376 0.1034 1.324E-09 PE/PVC/WC/DC 0.124 0.48 0.99 1.0961 70850 337 0.0780 1.764E-09 PE/PVC/WC/DC 0.218 0.48 0.99 1.0962 70895 330 0.1599 8.164E-09 PE/PVC/WC/DC 0.493 0.48 0.99 1.09

Table D-2. (continued).
Drum no. IDC Watts (moles/sec) MDP matrix 100 eV) mean G-value G-value UTL
Hydrogen gasgeneration Hydrogen G 95
rate (molecules/ UCL for Percentileeff
95
th
95
D-4
63 71852 336 0.3588 3.174E-08 PE/PVC/WC/DC 0.853 0.48 0.99 1.0964 72380 330 0.5928 2.706E-08 PE/PVC/WC/DC 0.440 0.48 0.99 1.0965 72559 336 0.2126 8.120E-09 PE/PVC/WC/DC 0.369 0.48 0.99 1.0966 73268 330 0.1823 8.629E-09 PE/PVC/WC/DC 0.457 0.48 0.99 1.0967 74974 336 0.0936 8.390E-09 PE/PVC/WC/DC 0.865 0.48 0.99 1.09

E-1
Appendix E
Postirradiation Examination

E-2

E-3
POSTIRRADIATION EXAMINATION
Postirradiation examinations were conducted on two test cylinders, TC A04 ( PuO and dry cellulosics)2392
and TC A16 ( PuO and PE). The purpose of these examinations was twofold: (a) to obtain a sample of2392
material for microscopic examination to assess the nature of adherence of the particles to the surface; and(b) to document the gross effects of the test materials’ prolonged exposure to an alpha source. Results ofmicroscopic examination are not yet available, but will be included in a future revision of this document.Figures E-1 through E-3 illustrate the contents of TC A16 at the time of loading (Figure E-1), after it wasremoved from the test cylinder (Figure E-2), and after the PE was unfolded (Figure E-3). There was noapparent degradation of the PE during the course of the experiment. The PE tie was removed, and the PE wascarefully unfolded. A substantial fraction of the PuO was observed in a fold that had been at the bottom of2
the test cylinder. The PE’s inner surface had a mottled appearance, with small patches of PuO2
(approximately 1 cm x 1 cm) adhering to the surface. When viewed at an oblique angle, the PE appeared tobe waffled or dimpled in these patches of adhered PuO ; however, there was no evidence of holes or2
discoloration. The material seemed to retain its elasticity and was not noticeably embrittled.
Figures E-4 through E-6 illustrate the contents of TC A04 at the time of loading (Figure E-4),at the timeof removal from the test cylinder (Figure E-5); and after the dry cellulosics (cheesecloth and paper) wasunfolded (Figure E-6). The tie that held the package together was clipped with a pair of scissors, and thepaper was carefully unfolded. The cheesecloth within the paper wrapping was folded back to expose theregion where PuO was in contact with paper and cheesecloth. It appeared that a substantial fraction of the2
PuO had settled into the fold that had been at the bottom of the test cylinder. The paper was considerably2
discolored (yellows and browns) and degraded where it was in contact with the PuO ; and was quite brittle2
and cracked easily. The cheesecloth was discolored (yellows and browns) and degraded, with many loosefibers plainly evident.

E-4
Figure E-1. Contents of TC A16 (~2.3 grams of PuO and PE) at the time of loading.2392
Figure E-2. The waste matrix when it was removed from TC A16.

E-5
Figure E-3. Contents of TC A16 after removal.
Figure E-4. Contents of TC A04 (~2.3 grams of PuO and dry cellulosics) at the time of loading.2392

E-6
Figure E-5. The waste matrix when it was removed from TC A04.
Figure E-6. Contents of TC A04 after removal.