Subregionalization of Low-Frequency Summer Drought Variability in the Southeastern United States
11
This article was downloaded by: [University of West Florida], [Jason T. Ortegren] On: 19 March 2014, At: 08:22 Publisher: Routledge Informa Ltd Registered in England and Wales Registered Number: 1072954 Registered office: Mortimer House, 37-41 Mortimer Street, London W1T 3JH, UK The Professional Geographer Publication details, including instructions for authors and subscription information: http://www.tandfonline.com/loi/rtpg20 Subregionalization of Low-Frequency Summer Drought Variability in the Southeastern United States Jason T. Ortegren a , Ashley Weatherall b & Justin T. Maxwell c a University of West Florida b University of South Florida c Indiana University Published online: 23 May 2013. To cite this article: Jason T. Ortegren , Ashley Weatherall & Justin T. Maxwell (2014) Subregionalization of Low-Frequency Summer Drought Variability in the Southeastern United States, The Professional Geographer, 66:2, 323-332, DOI: 10.1080/00330124.2013.787008 To link to this article: http://dx.doi.org/10.1080/00330124.2013.787008 PLEASE SCROLL DOWN FOR ARTICLE Taylor & Francis makes every effort to ensure the accuracy of all the information (the “Content”) contained in the publications on our platform. However, Taylor & Francis, our agents, and our licensors make no representations or warranties whatsoever as to the accuracy, completeness, or suitability for any purpose of the Content. Any opinions and views expressed in this publication are the opinions and views of the authors, and are not the views of or endorsed by Taylor & Francis. The accuracy of the Content should not be relied upon and should be independently verified with primary sources of information. Taylor and Francis shall not be liable for any losses, actions, claims, proceedings, demands, costs, expenses, damages, and other liabilities whatsoever or howsoever caused arising directly or indirectly in connection with, in relation to or arising out of the use of the Content. This article may be used for research, teaching, and private study purposes. Any substantial or systematic reproduction, redistribution, reselling, loan, sub-licensing, systematic supply, or distribution in any form to anyone is expressly forbidden. Terms & Conditions of access and use can be found at http://www.tandfonline.com/page/terms- and-conditions
Transcript of Subregionalization of Low-Frequency Summer Drought Variability in the Southeastern United States

This article was downloaded by: [University of West Florida], [Jason T. Ortegren]On: 19 March 2014, At: 08:22Publisher: RoutledgeInforma Ltd Registered in England and Wales Registered Number: 1072954 Registeredoffice: Mortimer House, 37-41 Mortimer Street, London W1T 3JH, UK
The Professional GeographerPublication details, including instructions for authors andsubscription information:http://www.tandfonline.com/loi/rtpg20
Subregionalization of Low-FrequencySummer Drought Variability in theSoutheastern United StatesJason T. Ortegren a , Ashley Weatherall b & Justin T. Maxwell ca University of West Floridab University of South Floridac Indiana UniversityPublished online: 23 May 2013.
To cite this article: Jason T. Ortegren , Ashley Weatherall & Justin T. Maxwell (2014)Subregionalization of Low-Frequency Summer Drought Variability in the Southeastern United States,The Professional Geographer, 66:2, 323-332, DOI: 10.1080/00330124.2013.787008
To link to this article: http://dx.doi.org/10.1080/00330124.2013.787008
PLEASE SCROLL DOWN FOR ARTICLE
Taylor & Francis makes every effort to ensure the accuracy of all the information (the“Content”) contained in the publications on our platform. However, Taylor & Francis,our agents, and our licensors make no representations or warranties whatsoever as tothe accuracy, completeness, or suitability for any purpose of the Content. Any opinionsand views expressed in this publication are the opinions and views of the authors,and are not the views of or endorsed by Taylor & Francis. The accuracy of the Contentshould not be relied upon and should be independently verified with primary sourcesof information. Taylor and Francis shall not be liable for any losses, actions, claims,proceedings, demands, costs, expenses, damages, and other liabilities whatsoever orhowsoever caused arising directly or indirectly in connection with, in relation to or arisingout of the use of the Content.
This article may be used for research, teaching, and private study purposes. Anysubstantial or systematic reproduction, redistribution, reselling, loan, sub-licensing,systematic supply, or distribution in any form to anyone is expressly forbidden. Terms &Conditions of access and use can be found at http://www.tandfonline.com/page/terms-and-conditions
Subregionalization of Low-Frequency Summer Drought Variability
in the Southeastern United States∗
Jason T. OrtegrenUniversity of West Florida
Ashley WeatherallUniversity of South Florida
Justin T. MaxwellIndiana University
Freshwater resources are particularly limited in the Southeastern United States. In recent years, severe summer droughts haveplaced substantial strain on municipal and industrial water resources, emphasizing the need for further research on the causesof long-term moisture deficits. Previous research has identified a Southeast drought region and specific low-frequency ocean-atmosphere influences on drought. In this article, we identify three distinct subregions of low-frequency summer droughtvariability in the Southeastern United States using principal components analysis. Multidecadal drought variability is mostpronounced in the Southeastern Atlantic Coastal States (SEACS) subregion. The SEACS drought variability is significantlyassociated with ocean-atmosphere variability in the Atlantic and Pacific basins. The significance of ocean-atmosphere influenceson drought in the Southeast is spatially confined within only the SEACS subregion. The Eastern Gulf States (EGS) subregionexhibits a long-term increase in summer moisture that is significantly associated with Northern Hemisphere surface temperatureincreases during the last century. The peninsular Florida subregion is characterized by high-frequency drought variability thatis not associated with any of the climate indexes included in this study. Key Words: drought, multidecadal, southeasternUnited States, subregional.
�������������������,�������������������������,��������
�����������������������������,���������������������
������������,���������������������������������������
������ (SEACS)������������������������,������������������
��������������������,���������������������������� (EGS)
���������������,����������������������������������
�������,������������������������: ��, ���, �����, ����
Los recursos de agua dulce son particularmente limitados en los Estados Unidos del sudeste. Sequıas muy severas han hechosentir sus efectos deletereos sobre los recursos hıdricos municipales e industriales en anos recientes, presionando la necesidadde mas investigacion sobre las causas del deficit de humedad a largo plazo. La investigacion precedente ya habıa identificadouna region de sequıa en el sudeste, lo mismo que las influencias especıficas de baja frecuencia que tiene la atmosfera oceanicasobre la sequıa. En este artıculo identificamos en el sudeste de los Estados Unidos tres bien diferenciadas subregiones convariabilidad de sequıa veraniega de baja frecuencia, mediante el uso de analisis de componentes principales. La variabilidadmultidecadal de la sequıa es mas pronunciada en la subregion de los Estados Costeros Atlanticos del Sudeste (ECAS). En elcaso de los ECAS, la variabilidad de la sequıa esta asociada significativamente con la variabilidad de la atmosfera oceanica en lascuencas del Atlantico y el Pacıfico. La significancia de las influencias de la atmosfera oceanica sobre la sequıa en el sudeste estaconfinada espacialmente solo dentro de la subregion ECAS. La subregion de los Estados Orientales del Golfo (EOG) exhibe unincremento de largo plazo en humedad veraniega, que esta significativamente asociada con los incrementos de la temperatura desuperficie experimentados durante el siglo pasado en el Hemisferio Norte. La subregion peninsular de la Florida se caracterizapor una variabilidad de alta frecuencia de la sequıa, que no esta asociada con cualquiera de los ındices climaticos consideradosen este estudio. Palabras clave: sequıa, multidecadal, Estados Unidos del sudeste, subregional.
T he year 2007 was among the driest on recordin the Southeastern United States (Maxwell and
Soule 2009), and the U.S. Federal Emergency Man-agement Agency (FEMA) estimated drought-related
∗The authors wish to thank three anonymous reviewers whose comments helped us improve an earlier version of this article. Bill Tyminski provided valuable feedbackand suggestions.
economic losses during that year to be well over $5 bil-lion (FEMA 2008). Farmers in North Carolina alonelost an estimated $382 million in 2007 (Baker 2007).These losses are likely underestimated, as economic
The Professional Geographer, 66(2) 2014, pages 323–332 C© Copyright 2014 by Association of American Geographers.Initial submission, May 2012; revised submissions, August and September 2012; final acceptance, September 2012.
Published by Taylor & Francis Group, LLC.
Dow
nloa
ded
by [
Uni
vers
ity o
f W
est F
lori
da],
[Ja
son
T. O
rteg
ren]
at 0
8:22
19
Mar
ch 2
014

324 Volume 66, Number 2, May 2014
loss data neither reflect all crop losses nor account forindirect effects of drought, such as increased energyfor cooling (Hayes et al. 2004).
Beyond the impacts on agriculture and energy con-sumption, drought can also significantly increase de-mand for urban and rural water resources (Cook andKrusic 2004). This is especially true during sum-mer, due to increased drought impacts associated withhigher temperatures and because of increased waterdemand for agricultural uses during the middle ofthe growing season (Soule and Meentemeyer 1989;Maxwell et al. 2012). Further, there is evidence that re-gional drought variability might respond to global andhemispheric surface temperature trends, such as thegeneral warming trends observed in the twentieth andearly twenty-first centuries (e.g., Dai, Trenberth, andQian 2004). Although single-year droughts have sig-nificant impacts on local economies and industries inthe Southeastern United States, cumulative moisturedeficiencies associated with sustained dry periods couldbe devastating (Pederson et al. 2012). Additional in-formation on the history of severe multiyear droughtsmight improve long-term forecasting and water re-source management.
Recent findings indicate significant low-frequencyocean-atmosphere influences on warm-season droughtin the Southeastern United States (Enfield, Mestas-Nunez, and Trimble 2001; McCabe, Palecki, andBetancourt 2004; Ortegren et al. 2011). Interan-nual warm-season drought in this region is rela-tively unpredictable and is characterized by substantialrandom variability (Seager, Tzanova, and Nakamura2009). Low-frequency (multidecadal) warm-seasonvariability in the Southeast is closely associatedwith low-frequency variability in Atlantic Ocean seasurface temperatures indexed as the Atlantic Mul-tidecadal Oscillation (AMO), however, and withvariability in the summer mean location of the westflank of the North Atlantic subtropical high-pressurecell (Bermuda high). Multidecadal periods of below-average (above-average) summer moisture are associ-ated with warm (cool) phases of the AMO and withnegative (positive) phases of the Bermuda High index(BHI), during which the west flank of the Bermudahigh is located west (east) of its long-term mean posi-tion. A detailed discussion of the physical mechanismsbehind these associations was provided by Ortegrenet al. (2011). There also is evidence for a Pacific sec-tor influence on drought in the Southeastern UnitedStates, although the specific mechanisms are not aswell understood (Seager, Tzanova, and Nakamura2009).
These associations between drought variability andlow-frequency ocean-atmosphere oscillations indicatethe potential for improved seasonal drought fore-casting and water resource management in a regionwith substantial population growth in recent decades(Seager, Tzanova, and Nakamura 2009). The spatialdelineation of the Southeast used in this study wasdefined by analyzing historic summer drought vari-ability to classify homogenous drought regions in the
344 state climate divisions in the conterminous UnitedStates (Ortegren et al. 2011). The Southeast droughtregion consists of forty-four contiguous state climatedivisions, including all or part of the states of Virginia,North Carolina, South Carolina, Georgia, Florida,Alabama, Mississippi, and Tennessee (Ortegren et al.2011; Figure 1). Warm-season drought variability inthis region is significantly associated with indexes ofNorth Atlantic climate variability.
The region covers a large area, though, including in-terior locations (e.g., Tennessee) as well as coastal areasof the southern Mid-Atlantic and the Gulf of Mexicostates. This raises questions about the spatial patternsof these climatic associations within the region. Thisstudy is an extension of Ortegren et al. (2011) in that itexamines the geographic patterns of drought variabil-ity and ocean-atmosphere forcing of drought withinthe Southeast drought region. A better understand-ing of the geography of terrestrial drought response toocean-atmosphere forcing mechanisms in the South-east is important for improved drought forecasting andreadiness in a region that continues to experience rapidpopulation growth and urbanization (Seager, Tzanova,and Nakamura 2009).
Although some research has examined intraregionaldrought variability in other regions of the UnitedStates, including the Mid-Atlantic region (Polsky et al.2000) and the Pacific Northwest (Miller and Goodrich2007), subregional drought behavior in the South-east has received little attention (Soule 1990). Be-cause the previously identified associations betweenclimate indexes and warm-season drought variabilityin the Southeastern United States might not be uni-form across the region, our specific objectives in thisarticle are as follows:
1. Analyze historic drought variability in the South-east to identify distinct subregions of summerdrought homogeneity.
2. Test for associations between low-frequencysubregional drought variability and various in-dexes of climate variability in the Atlantic andPacific sectors.
3. Identify the subregion(s) of the Southeastin which seasonal drought might be mostpredictable (i.e., Where in the Southeast doeswarm-season drought most closely correspondto large-scale forcing mechanisms?).
Data
Drought DataWe analyzed drought data from state climate divisions(National Climatic Data Center 2012). Climate divi-sions are spatial units delineated within each state inthe United States, and the climate division data areaggregates of data from individual weather stationswithin these spatial units. Therefore, climate divisiondata do not provide detailed information for any indi-vidual location but are appropriate for regional-scale
Dow
nloa
ded
by [
Uni
vers
ity o
f W
est F
lori
da],
[Ja
son
T. O
rteg
ren]
at 0
8:22
19
Mar
ch 2
014

Subregionalization of Low-Frequency Summer Drought Variability 325
analyses of long-term climate behavior (e.g., Soule1990; Ortegren et al. 2011).
For the forty-four state climate divisions includedin the Southeast drought region, we retrieved summeraverage values of the Palmer Hydrological DroughtIndex (PHDI; Palmer 1965) for the period from 1900to 2011 from the National Climatic Data Center(2012). We used the summer (June–July–August) av-erage PHDI as our drought metric for two reasons.First, the Southeast drought region we analyze in thisarticle was previously identified using observed sum-mer average PHDI (Ortegren et al. 2011). Second, thePHDI is a measure of hydrological moisture balance,calculated for a given month using data that includeobserved precipitation and temperature values fromprevious and successive months so that it respondsslowly to changes in moisture availability (Soule 1990).This means the summer average PHDI accounts for
antecedent moisture conditions during the precedingspring, as well as changes in the moisture balance dur-ing the following autumn, and is thus well suited foranalyses of low-frequency warm-season drought (e.g.,Stahle et al. 1998).
Climate DataWe retrieved summer average values for the follow-ing climate indexes for the common period 1900to 2011: (1) the AMO index (National Oceanicand Atmospheric Administration 2012); (2) the Pa-cific Decadal Oscillation (PDO) index (Universityof Washington Joint Institute for the Study ofthe Atmosphere and Ocean 2012); (3) the station-based North Atlantic Oscillation index (NAO; Na-tional Centers for Atmospheric Research 2012b);(4) the Southern Oscillation Index (SOI; Australian
Figure 1 Subregions of summer drought variability in the Southeastern United States. Minor spatial units are stateclimate divisions defined by the National Climatic Data Center. The inset map shows the Southeastern U.S. droughtregion identified by Ortegren et al. (2011). (Color figure available online.)
Dow
nloa
ded
by [
Uni
vers
ity o
f W
est F
lori
da],
[Ja
son
T. O
rteg
ren]
at 0
8:22
19
Mar
ch 2
014

326 Volume 66, Number 2, May 2014
Government Bureau of Meteorology 2012; and (5) theEl Nino/Southern Oscillation index (ENSO; NASA’sGoddard Space Flight Center Global Change MasterDirectory 2012).
We also retrieved summer average values of theBHI and the mean central pressure index (MCP),which track variability in the Bermuda high’s meanlocation and mean strength, respectively. We createdthe BHI and MCP using gridded sea-level air pres-sure (SLP) data from the National Centers for At-mospheric Research (2012a), following the methodsoutlined in Katz, Parlange, and Tebaldi (2003) andOrtegren et al. (2011). The BHI is calculated by sub-tracting the annual summer average SLP near NewOrleans, Louisiana (30◦N, 90◦W), from the annualsummer average SLP near Bermuda (35◦N, 65◦W) andstandardizing these differences. Thus, positive BHIvalues indicate eastward displacement of the west flankof the Bermuda high during summer, and negativevalues indicate westward displacement. The MCP isthe time series of standardized annual summer aver-age maximum SLP at any location over the NorthAtlantic (20◦N–50◦N and 80◦W–0◦). Positive MCPvalues imply a steeper horizontal pressure gradientacross the Atlantic basin and enhanced anticyclonicairflow, and negative MCP values indicate a weakersummer anticyclone. The relatively unstable southerlyairflow and vapor advection into the southeasternUnited States on the west flank of the Bermuda highis more pronounced during stronger phases (i.e., pos-itive values) of the MCP (e.g., Keim 1997). Finally, toexamine potential relationships among drought vari-ability, climate index variability, and large-scale tem-perature trends, we retrieved the time series of summeraverage Northern Hemisphere temperature anomalies(NHTA) for the period from 1900 to 2010 (Jones et al.2010).
Methods
Drought Regionalization and Climate Index DataReductionWe used principal component analysis (PCA) to iden-tify the leading modes of subregional summer droughtvariability. The original input matrix consisted offorty-four variables (state climate divisions), each con-taining 112 observations (summer average PHDI forthe common period 1900–2011). The original unro-tated factor analysis with all components retained in-dicated a substantial drop-off in additional explainedvariance after the third principal component (PC). Us-ing the same input matrix, we ran PCA with threePCs retained and varimax rotation. Varimax rotationis commonly used in climate research because it pro-duces orthogonal (uncorrelated) time series of variabil-ity for each of the retained PCs and tends to identifymodes of variability that are logically and physically in-terpretable (e.g., Richman 1986; Kolivras and Comrie2007; Timilsena and Piechota 2008). We assigned eachstate climate division to one PC based on maximum
factor loading scores after rotation. The group of stateclimate divisions that loaded most heavily on a givenPC was analyzed for spatial contiguity. Each groupingwas then considered a distinct subregion of relativelyhomogenous warm-season drought variability. We re-tained the time series of factor scores for each of thethree rotated PCs to represent warm-season droughtvariability in each of the subregions.
Similarly, we used PCA to reduce the dimensionsof the climate index data to fundamental modes oflarge-scale ocean-atmosphere variability. We input theinterannual time series of summer average climateindex data, evaluated the results of an unrotated anal-ysis, and repeated the analysis with varimax rotationwith the first three PCs retained. Each individual cli-mate index was assigned to one of the three PCs basedon maximum factor loadings. The time series of fac-tor scores from the three PCs represent variability intheir respective groups of individual climate indexes.This procedure reduced the five individual climate in-dexes to three orthogonal time series and illuminatedwhich (if any) of the climate index series exhibitedsimilar variability through time, which might indicateteleconnections between certain individual climate in-dexes, and which might be valuable to future climateresearch.
Correlation Analyses and Significance TestsTo isolate low-frequency variability, we used arunning-mean filter to smooth the time series of sub-regional drought variability (PC factor scores), climateindex variability (individual indexes), and the leadingmodes of climate index variability (PC factor scores;McCabe and Palecki 2006). We smoothed each se-ries with filters of different lengths, including ten-,fifteen-, twenty-, twenty-five-, and thirty-year win-dows. The running-mean calculation was performedusing the window of data values for the given num-ber of preceding years up to and including the year ofinterest, as in Ortegren et al. (2011). Unlike centeredrunning-mean windows, our approach reflects cumu-lative conditions through the current year and betterreflects the timing of shifts in low-frequency variabil-ity. We used Pearson bivariate correlation to examinethe associations between all pairs of variables for eachsmoothing length.
The serial autocorrelation in the smoothed se-ries made traditional significance tests unreliable. Wetherefore estimated the significance of correlations us-ing a Monte Carlo simulation involving 10,000 ran-dom shuffles of one series (without replacement) cor-related with an anchored series. The percentile of theobserved correlation among the 10,000 simulated cor-relations is a reliable estimate of the confidence level ofthe observed correlation coefficient (McCabe, Palecki,and Betancourt 2004). Further, we repeated this exactprocedure for each bivariate correlation using 10,000random resamples of one series (i.e., with replace-ment) correlated with an anchored series. To ensurethe most conservative possible estimate of statistical
Dow
nloa
ded
by [
Uni
vers
ity o
f W
est F
lori
da],
[Ja
son
T. O
rteg
ren]
at 0
8:22
19
Mar
ch 2
014

Subregionalization of Low-Frequency Summer Drought Variability 327
significance, we used the lowest confidence level (high-est p-value estimate) obtained by any method of sig-nificance testing (traditional t test, shuffled, or resam-pled). In this article we report only correlations thatare significant at the 95 percent level or greater (i.e.,p < 0.05).
Results
Subregional Drought VariabilityThe first three PCs of summer PHDI variability ex-plained 75.79 percent (PC1, 54.57 percent; PC2, 12.74percent; PC3, 8.48 percent) of the total variance forthe period from 1900 to 2011. The groups of stateclimate divisions assigned to each PC represent threedistinct summer drought subregions within the South-east (Figure 1). PC1 reflects variability in the SEACS,PC2 reflects variability in the EGS, and PC3 reflectsvariability in Florida (FL). The original map basedon maximum factor loadings contained two “splinter”climate divisions (4.5 percent of the total) that werenoncontiguous with the rest of their respective sub-regions. Both splintered climate divisions were in thestate of Georgia, near the boundary between PC1 andPC2. We suggest that these climate divisions mightrepresent transitional zones of drought variability ordrought influence. For clarity, we assigned each splin-ter division to the PC with which it was spatiallycontiguous.
Multidecadal summer drought variability is evidentin the plot of the SEACS, whereas the EGS andFL variability exhibit no coherent oscillations at thetwenty-year smoothing length (Figure 2). The SEACSexhibits regimes of above-average summer moistureduring the early part of the record and again fromthe late 1960s to the late 1980s. Dry regimes in theSEACS included the 1930s to mid-1960s and the mid-1990s to present. The EGS displays higher frequencyvariability superimposed on a significant (R2 = 0.875,p < 0.001) upward trend (i.e., toward wetter summers)
from the beginning to the end of the series. Withinthis long-term trend of increasing summer moisture,relatively dry regimes in the EGS occurred from thebeginning of the series through the 1930s and fromthe mid-1950s to 1970. A relatively wet regime in theEGS was 1940 to the mid-1950s.
Climate Index Data ReductionThe ENSO index was not significantly associated withsummer drought variability in any subregion at anyof the smoothing lengths we analyzed, probably be-cause it is characterized by high-frequency (two- toseven-year) oscillation and because its primary climateimpacts in the Southeast are most pronounced in theboreal winter season. Thus, we excluded the ENSOindex from this and all subsequent analyses. The firstthree PCs of summer average climate index variabil-ity explained 72.12 percent (PC1, 31.46 percent; PC2,24.53 percent; PC3, 16.13 percent) of the total vari-ance for the period of record. We grouped the indi-vidual climate indexes into PCs based on maximumfactor loadings and confirmed the groupings by exam-ining correlations between individual climate indexesand the respective factor scores of the first three PCsof climate variability. The first PC reflects variabilityin the NAO; we call this factor the “North Atlantic”mode of climate variability (not shown). The secondPC reflects variability in the PDO and SOI; we termthis the “Pacific” mode of climate variability (Figure 3).The third PC reflects variability in the AMO, BHI,and MCP; we call PC3 the “Atlantic” mode of climatevariability (Figure 4).
Ocean-Atmosphere Influences on Low-FrequencyDrought VariabilityWhereas previous research identified associationsbetween low-frequency drought variability and ocean-atmosphere indexes that were strongest at the thirty-year smoothing length for the Southeast as a whole
Figure 2 Time series of subregional drought variability (principal component factor scores) for the first three principalcomponents of PHDI variability in the Southeast for the period 1900 to 2011. The data have been smoothed with atwenty-year running mean filter. Note: SEACS = Southeastern Atlantic Coastal States; EGS = Eastern Gulf States; FL =Florida; PHDI = Palmer Hydrological Drought Index.
Dow
nloa
ded
by [
Uni
vers
ity o
f W
est F
lori
da],
[Ja
son
T. O
rteg
ren]
at 0
8:22
19
Mar
ch 2
014
328 Volume 66, Number 2, May 2014
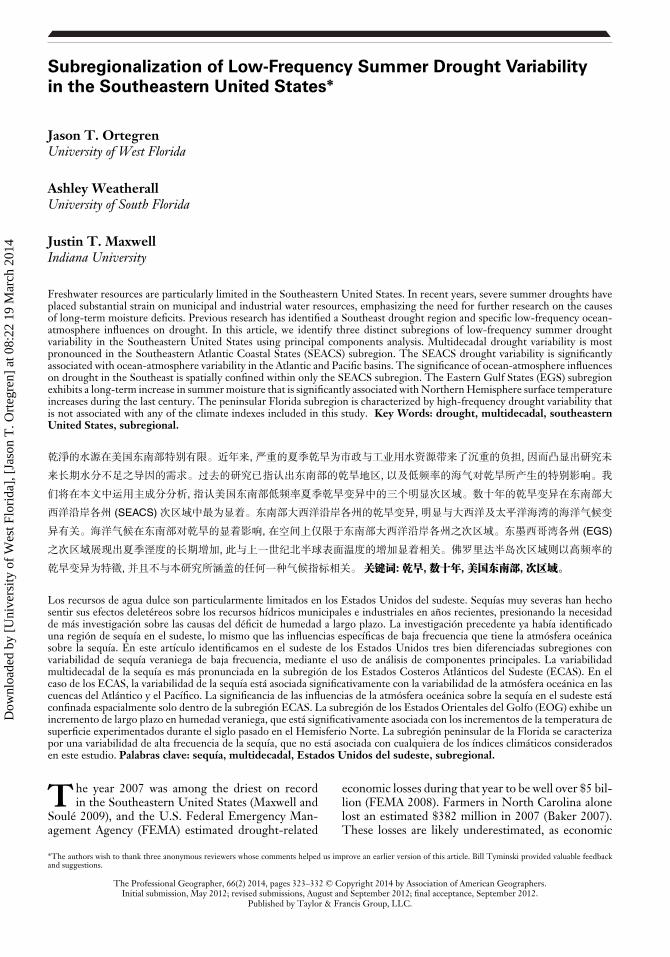
Figure 3 Time series of the Pacific Decadal Oscillation (PDO), the Southern Oscillation Index (SOI), and the Pacific modeof climate index variability. The data have been smoothed with a twenty-year running mean filter.
(Ortegren et al. 2011), the significant associationsbetween subregional drought variability and indexedocean-atmosphere variability in this study were bestreflected when the data were smoothed with a twenty-year filter. Hereinafter, any mention of drought vari-ability refers to the twenty-year smoothed factor scoresof the first three PCs of summer PHDI variability, la-beled SEACS, EGS, and FL, respectively. We usedthe same twenty-year filter to smooth the time se-ries of each individual climate index as well as thetime series of factor scores for the North Atlantic,Pacific, and Atlantic modes of climate variability. Wedid not smooth the Northern Hemisphere summertemperature anomaly data, as the series did not exhibitlow-frequency oscillations. When we compared thetemperature data to the smoothed drought data andthe smoothed climate data, we used the interannualsummer temperature anomalies from 1919 to 2010,the period common to all of the smoothed data series.
Among the three subregions of low-frequencywarm-season drought variability, only the SEACS was
associated with ocean-atmosphere oscillations knownto influence drought in the Southeast as a whole.Specifically, SEACS variability was significantly asso-ciated with the BHI (r = 0.679) and the AMO (r =−0.756; Figure 5). These also were the climate indexesthat most closely corresponded with low-frequencydrought variability in the Southeast as a whole in pre-vious research (Ortegren et al. 2011). At the multi-decadal timescale considered in this article, none ofthe indexes of ocean-atmosphere variability was signif-icantly associated with drought variability in the EGSor FL.
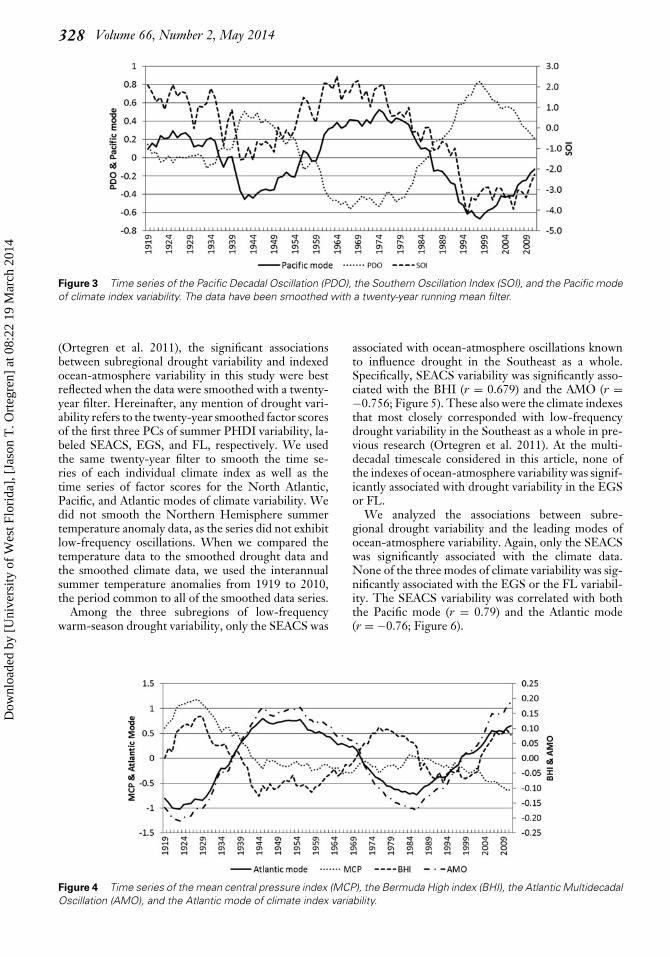
We analyzed the associations between subre-gional drought variability and the leading modes ofocean-atmosphere variability. Again, only the SEACSwas significantly associated with the climate data.None of the three modes of climate variability was sig-nificantly associated with the EGS or the FL variabil-ity. The SEACS variability was correlated with boththe Pacific mode (r = 0.79) and the Atlantic mode(r = −0.76; Figure 6).
Figure 4 Time series of the mean central pressure index (MCP), the Bermuda High index (BHI), the Atlantic MultidecadalOscillation (AMO), and the Atlantic mode of climate index variability.
Dow
nloa
ded
by [
Uni
vers
ity o
f W
est F
lori
da],
[Ja
son
T. O
rteg
ren]
at 0
8:22
19
Mar
ch 2
014

Subregionalization of Low-Frequency Summer Drought Variability 329
Figure 5 Time series of the Southeastern Atlantic Coastal States (SEACS), the Atlantic Multidecadal Oscillation (AMO),and the Bermuda High index (BHI). Note: PHDI = Palmer Hydrological Drought Index.
Temperature Anomaly Associations with Droughtand Climate Index VariabilityThe long-term trend toward wetter summers in theEGS is associated with the NHTA warming trend(Figure 7). The interannual NHTA series is signifi-cantly correlated with both the interannual EGS vari-ability (r = 0.217, p = 0.022) and the twenty-yearfiltered EGS variability (r = 0.657, p < 0.01). TheNHTA variability is not significantly associated withthe SEACS or the FL drought variability, but theNHTA series is significantly associated with the At-lantic mode of climate index variability (Figure 8). Itis noteworthy that this association is stronger betweenthe NHTA and the interannual (unsmoothed) Atlanticmode (r = 0.674, p < 0.01) but remains significant be-tween the NHTA and the twenty-year filtered Atlanticmode (r = 0.318, p < 0.01).
The association between the NHTA and the At-lantic mode likely reflects the associations betweenthe NHTA and two of the three individual climateindexes that are represented by the Atlantic mode.The NHTA series is significantly associated with the
interannual MCP (r = −0.373, p < 0.01) and withthe interannual AMO (r = 0.693, p < 0.01). Thesetwo associations are consistent with theory regard-ing ocean-atmosphere dynamics, as the general trendtoward warmer surface temperatures agrees with atrend toward increased average sea surface tempera-tures in the Atlantic Ocean (i.e., the AMO). Further, awarmer Atlantic Ocean surface is consistent with a gen-eral decrease in central pressure in the Bermuda highthat results from a reduced horizontal temperaturegradient between the Atlantic and the adjacent conti-nents during summer (e.g., Davis et al. 1997; Ortegrenet al. 2011).
Discussion
Our findings indicate that the significant low-frequency associations between warm-season droughtand indexes of ocean-atmosphere variability in theSoutheast are reflected primarily in the SEACS subre-gion. Neither the EGS variability nor the FL vari-ability is significantly correlated with the climate
Figure 6 Time series of the Southeastern Atlantic Coastal States (SEACS), the Pacific mode of climate index variability,and the Atlantic mode of climate index variability. Note: PHDI = Palmer Hydrological Drought Index.
Dow
nloa
ded
by [
Uni
vers
ity o
f W
est F
lori
da],
[Ja
son
T. O
rteg
ren]
at 0
8:22
19
Mar
ch 2
014

330 Volume 66, Number 2, May 2014
Figure 7 Time series of the Eastern Gulf States (EGS) and the time series of Northern Hemisphere summer(June–July–August) surface temperature anomalies (NH JJA Temperature Anomalies). The straight solid line is the lineartrend in EGS drought variability. The straight dashed line is the linear trend in the temperature data. Note: PHDI = PalmerHydrological Drought Index.
index data. Thus, although seasonal drought fore-casts in the region might benefit from the doc-umented drought–climate associations, the benefitsmight largely be confined to the SEACS. Further re-search is necessary to identify both the temporal andspatial constraints of drought–climate associations inthe EGS and FL subregions.
Of particular interest is the significant upward trendin the time series of EGS variability. This trend is notfound in any of the individual climate indexes, nor isit found in the leading modes of ocean-atmospherevariability. However, the EGS trend toward wetnessis associated with increases in the NHTA. This indi-cates that the Atlantic mode of climate index variabilityhas a lesser influence in the EGS region than in theSEACS. The EGS drought variability might be re-sponding more closely to increased NHTA throughincreases in summer convective precipitation. Simi-
larly, the lack of significant association between theSEACS and the NHTA implies that the Atlantic modeforcing mechanisms (AMO, BHI, and MCP) exert astronger influence in the SEACS than in the EGS.This last point is reinforced by the fact that the signif-icant upward trend in EGS summer moisture does notexhibit the strong multidecadal pattern that is presentin the SEACS drought variability; multidecadal vari-ability is more characteristic of the Atlantic mode vari-ability than of the relatively smooth upward trend inNHTA. Future research is needed to assess whetherthe EGS region has experienced more substantial sur-face warming than the SEACS region during the lastcentury. There is some evidence that the SEACS re-gion is a “warming hole,” an area that has not ex-perienced the temperature increases associated withlate-twentieth- and early-twenty-first-century globalwarming (e.g., Liang et al. 2006).
Figure 8 Time series of the Atlantic mode of climate index variability, the twenty-year filtered Atlantic mode of climateindex variability, and the time series of Northern Hemisphere summer (June–July–August) surface temperature (NH Temp)anomalies.
Dow
nloa
ded
by [
Uni
vers
ity o
f W
est F
lori
da],
[Ja
son
T. O
rteg
ren]
at 0
8:22
19
Mar
ch 2
014
Subregionalization of Low-Frequency Summer Drought Variability 331
The FL variability exhibits no long-term trend andis characterized by relatively high-frequency variabilitythat is not associated with either long-term tempera-ture trends or with the large-scale ocean-atmosphereinfluences we examined. It is likely that summerdrought variability in FL is largely controlled by local-scale high-frequency variability such as diurnal land-and sea-breeze interactions.
Whereas the regional analyses of Ortegren et al.(2011) identified significant drought–climate associa-tions concentrated in the thirty-year smoothed data se-ries, the subregional associations we identified are mostprevalent among the twenty-year smoothed series. Ad-ditionally, in the thirty-year smoothed regional analy-ses, none of the climate indexes from the Pacific sector(i.e., SOI and PDO) were significantly associated withdrought variability in the Southeast. In contrast, ourfindings demonstrate that the combined influences ofthe Pacific sector indexes (i.e., the “Pacific mode”) sig-nificantly modulate low-frequency summer droughtbehavior in one subregion (SEACS) of the Southeast.This Pacific sector influence in the SEACS also mighthelp explain the reduced influence of NHTA in theSEACS.
Our findings regarding the influence of the Atlanticmode of climate variability on drought in the SEACSare in agreement with previous findings (e.g., McCabe,Palecki, and Betancourt 2004; Ortegren et al. 2011).The SEACS experiences above-average summer mois-ture during cool phases of the AMO and positive (i.e.,eastward) phases of the BHI. The late 1950s to early1990s is an example of such a regime. Conversely, thelate 1920s to late 1950s was a warm phase of the AMOand the BHI was in a negative (westward) phase, result-ing in below-average summer moisture in the SEACS.
One noteworthy feature of the climate data is thatsince approximately 1996, both the AMO and BHIhave increased (Figure 5). In the instrumental climaterecord, this is the only period greater than ten yearsin which the AMO and BHI were in phase. Histor-ically, warm phases of the AMO (AMO+) coincidedwith negative (westward) phases of the BHI. This un-precedented recent trend toward AMO+ and positive(eastward) BHI might have implications for droughtresponse throughout the Southeast, and particularlyin the SEACS. Typically, AMO+ forces drought inmuch of the continental United States, especially in theSoutheast. Conversely, eastward displacement of theBermuda high (BHI+) during summer typically con-tributes to enhanced vapor advection into the SEACSand above-average summer moisture. The fact thatthe SEACS remains in a dry phase in spite of the re-cent shift to a positive BHI implies that the AMO andMCP forcing might be more important to droughtthan the BHI in the SEACS. This shift in the rela-tionship between two of the significant causes of sum-mer drought in the Southeast implies the possibility ofan internal or external rearrangement of the coupledocean-atmosphere behavior in the Atlantic basin. Al-ternatively, the recent in-phase behavior of these twoindexes might reflect a transition between phases in
both indexes, as one of the oscillations undergoes ashift that will feed back to a corresponding oppositeshift in the other index. Further research on this re-lationship might help isolate the underlying cause(s)of coupled variability in the AMO and the BHI, withsubstantial implications for large-scale forecasting aswell as improvements to regional and global climatemodels.
Conclusions
Within the Southeast, multidecadal warm-seasondrought variability is subregional in scale. Threespatially contiguous subregions of low-frequency sum-mer drought variability exist, and they exhibit differ-ent temporal drought patterns and different responsesto ocean-atmosphere influences. The pronouncedmultidecadal drought variability in the SEACS distin-guishes this subregion from the EGS and FL subre-gions, where multidecadal patterns are more subdued.The EGS variability is significantly associated with thelong-term increase in Northern Hemisphere surfacetemperatures. Further research is necessary to clarifythe physical mechanisms behind this association.
Our results indicate a significant relationship be-tween summer drought variability in the SEACSand the average conditions, during the previous twodecades, of two of the three leading PCs of low-frequency ocean-atmosphere index variability in theAtlantic and Pacific basins. Of interest to regionalwater resource managers and water-intensive indus-tries in the Southeast is our finding that previouslyidentified associations between regional multidecadaldrought variability and indexed climate variability ap-pear to be significant only in the SEACS subregion,including the Carolinas and most of Georgia. Insofaras increasing summer moisture can be considered ben-eficial to municipalities, agriculture, and freshwaterresource managers, the EGS trend is an impor-tant finding. The apparent linkage to increasingsurface temperatures adds to the larger discussionabout regional-scale impacts of hemispheric and globalwarming. These findings could contribute to improvedbaselines for seasonal drought forecasts and enhanceddrought preparation and mitigation planning in thesesubregions. �
Literature Cited
Australian Government Bureau of Meteorology. 2012.Southern Oscillation Index archives. http://www.bom.gov.au/climate/current/soihtm1.shtml (last accessed 13 April2012).
Baker, M. 2007. Relentless North Carolina drought could bedevastating in ’08. USA Today 26 December. http://www.usatoday.com/weather/drought/2007-12-26-nc-droughtN.htm (last accessed 13 April 2012).
Cook, E. R., and P. J. Krusic. 2004. North American summerPDSI reconstructions. IGBP PAGES/World Data Centerfor Paleoclimatology Data Contribution Series No. 2004-045, NOAA/NCDC Paleoclimatology Program, Boulder,CO.
Dow
nloa
ded
by [
Uni
vers
ity o
f W
est F
lori
da],
[Ja
son
T. O
rteg
ren]
at 0
8:22
19
Mar
ch 2
014

332 Volume 66, Number 2, May 2014
Dai, A., K. E. Trenberth, and T. Qian. 2004. A global datasetof Palmer Drought Severity Index for 1870–2002: Rela-tionship with soil moisture and effects of surface warming.Journal of Hydrometeorology 5:1117–30.
Davis, R. E., B. P. Hayden, D. A. Gay, W. L. Phillips, andG. V. Jones. 1997. The North Atlantic subtropical anticy-clone. Journal of Climate 10:728–44.
Enfield, D. B., A. M. Mestas-Nunez, and P. J. Trimble. 2001.The Atlantic Multidecadal Oscillation and its relation torainfall and river flows in the continental U.S. GeophysicalResearch Letters 28, 2077–2080.
Federal Emergency Management Agency (FEMA). 2008. Bil-lion dollar U.S. weather disasters. http://www.ncdc.noaa.gov/oa/reports/billionz.html#chron (last accessed 13 April2012).
Hayes, M. J., M. D. Svoboda, C. L. Knutson, and D. A.Wilhite. 2004. Estimating the economic impacts ofdrought. Extended abstract. 14th Conference on AppliedClimate and 15th Symposium on Global Change and Cli-mate Variations, Lincoln, NE.
Jones, P. D., T. J. Osborn, K. R. Briffa, and D. E.Parker. 2010. Hemispheric seasonal temperature anoma-lies (degrees C), 1850–2010. http://cdiac.ornl.gov/ftp/trends/temp/jonescru/seasnhsh.txt (last accessed 7 August2012).
Katz, R. W., M. B. Parlange, and C. Tebaldi. 2003. Stochas-tic modeling of the effects of large-scale circulation ondaily weather in the Southeastern U.S. Climatic Change60:189–216.
Keim, B. D. 1997. Preliminary analysis of the temporal pat-terns of heavy rainfall across the Southeastern UnitedStates. The Professional Geographer 49:94–104.
Kolivras, K. N., and A. C. Comrie. 2007. Regionalization andvariability of precipitation in Hawaii. Physical Geography28:76–96.
Liang, X. Z., J. Pan, J. Zhu, K. E. Kunkel, J. X. L. Wang,and A. Dai. 2006. Regional climate model downscalingof the U.S. summer climate and future change. Journal ofGeophysical Research 111:D10108.
Maxwell, J., and P. Soule. 2009. United States drought of2007: Historical perspectives. Climate Research 38:95–104.
Maxwell, J. T., P. T. Soule, J. T. Ortegren, and P. A. Knapp.2012. Drought busting tropical cyclones in the southeastAtlantic coastal states, 1950–2008. Annals of the Associationof American Geographers 102:259–75.
McCabe, G. J., and M. A. Palecki. 2006. Multidecadal climatevariability of global lands and oceans. International Journalof Climatology 26:849–65.
McCabe, G. J., M. A. Palecki, and J. L. Betancourt. 2004.Pacific and Atlantic Ocean influences on multidecadaldrought frequency in the United States. Proceedings of theNational Academy of Sciences 101:413641.
Miller, J. A., and G. B. Goodrich. 2007. Regionalization andtrends in winter precipitation in the northwestern USA.Climate Research 33:215–27.
NASA’s Goddard Space Flight Center. 2012. Globalchange master directory. http://www.esrl.noaa.gov/psd/data/correlation/censo.long.data (last accessed 13 April2012).
National Centers for Atmospheric Research. 2012a. CISLresearch data archive 2012. http: http://rda.ucar.edu/datasets/ds010.1/ (last accessed 14 April 2012).
———. 2012b. Climate and global dynamics climate anal-ysis section. http://www.cgd.ucar.edu/cas/jhurrell/indices.data.html#naostatmon (last accessed 13 April 2012).
National Climatic Data Center. 2012. Climate division data.http://www7.ncdc.noaa.gov/CDO/CDODivisionalSelect.jsp# (last accessed 13 April 2012).
National Oceanic and Atmospheric Administration. 2012.Physical sciences division, climate and weather data.http://www.esrl.noaa.gov/psd/data/correlation/amon.us.long.data (last accessed 13 April 2012).
Ortegren, J. T., P. A. Knapp, J. T. Maxwell, W. P. Tyminski,and P. T. Soule. 2011. Ocean-atmosphere influences onlow-frequency warm-season drought variability in the GulfCoast and Southeastern United States. Journal of AppliedMeteorology and Climatology 50:1177–86.
Palmer, W. C. 1965. Meteorological drought. U.S. WeatherBureau Research Paper 45, U.S. Government PrintingOffice, Washington, DC.
Pederson, N., A. R. Bell, T. A. Knight, C. Leland, N.Malcomb, K. J. Anchukaitis, K. Tackett, et al. 2012. Along-term perspective on a modern drought in the Ameri-can Southeast. Environmental Research Letters 7:014034.
Polsky, C., J. Allard, N. Currit, R. Crane, and B. Yarnal. 2000.The Mid-Atlantic region and its climate: Past, present, andfuture. Climate Research 14:161–73.
Richman, M. B. 1986. Rotation of principal components.Journal of Climatology 6:293–335.
Seager, R., Tzanova, A., and Nakamura, J. 2009. Drought inthe Southeastern United States: Causes, variability over thelast millennium, and the potential for future hydroclimatechange. Journal of Climate 22:5021–45.
Soule, P. T. 1990. Spatial patterns of multiple drought typesin the contiguous United States: A seasonal comparison.Climate Research 1:13–21.
Soule, P. T., and V. Meentemeyer. 1989. The drought of1988: Historical rank and recurrence interval. SoutheasternGeographer 29:17–25.
Stahle, D. W., M. K. Cleaveland, D. B. Blanton, M. D.Therrell, and D. A. Gay. 1998. The lost colony andJamestown droughts. Science 280:564–67.
Timilsena, J., and T. Piechota. 2008. Regionalization andreconstruction of snow water equivalent in the up-per Colorado River basin. Journal of Hydrology 352:94–106.
University of Washington Joint Institute for the Studyof the Atmosphere and Ocean. 2012. PDO index.http://jisao.washington.edu/pdo/PDO.latest (last accessed13 April 2012).
JASON T. ORTEGREN is an Assistant Professor in the De-partment of Environmental Studies at the University of WestFlorida, Pensacola, FL 32514. E-mail: [email protected] research interests include hydroclimatology, freshwaterresources, and paleoclimatology.
ASHLEY WEATHERALL is a graduate student in the De-partment of Geography, Environment and Planning at theUniversity of South Florida, Tampa, FL 33620. E-mail:[email protected]. She completed a preliminary ver-sion of this study for her undergraduate honors thesis at theUniversity of West Florida in 2010.
JUSTIN T. MAXWELL is an Assistant Professor inthe Department of Geography at Indiana University,Bloomington, IN 47405. E-mail: [email protected]. Hisresearch interests include dendrochronology, climatology,and forest disturbances.
Dow
nloa
ded
by [
Uni
vers
ity o
f W
est F
lori
da],
[Ja
son
T. O
rteg
ren]
at 0
8:22
19
Mar
ch 2
014