Water-use strategies of six co-existing Mediterranean woody species during a summer drought
13
PHYSIOLOGICAL ECOLOGY - ORIGINAL PAPER Water-use strategies of six co-existing Mediterranean woody species during a summer drought Jose ´ L. Quero • Frank J. Sterck • Jordi Martı ´nez-Vilalta • Rafael Villar Received: 12 May 2010 / Accepted: 13 January 2011 / Published online: 3 February 2011 Ó Springer-Verlag 2011 Abstract Drought stress is known to limit plant perfor- mance in Mediterranean-type ecosystems. We have investigated the dynamics of the hydraulics, gas exchange and morphology of six co-existing Mediterranean woody species growing under natural field conditions during a drought that continued during the entire summer. Based on the observed minimum leaf water potentials, our results suggest that the six co-existing species cover a range of plant hydraulic strategies, from isohydric to anisohydric. These differences are remarkable since the selected indi- viduals grow within several meters of each other, sharing the same environment. Surprisingly, whatever the leaf water potentials were at the end of the dry period, stomatal conductance, photosynthesis and transpiration rates were relatively similar and low across species. This result con- tradicts the classic view that anisohydric species are able to maintain gas exchange for longer periods of time during drought stress. None of the plants showed the expected structural acclimation response to the increasing drought (reduction of leaf-to-sapwood area ratio), thereby rejecting the functional equilibrium hypothesis for our study system. Instead, three of the six species increased photosynthetic area at the branch level. The observed dissimilar patterns of gas exchange, hydraulics and morphology across species seem to be equally successful given that photosynthesis at the leaf level was maintained at similar rates over the whole dry period. Keywords Anisohydric Embolism Isohydric Photosynthesis Stomatal conductance Water potential Abbreviations A Photosynthetic rate per area (lmol CO 2 m -2 s -1 ) A L Branch leaf area (mm 2 ) A S Cross-sectional stem area (mm 2 ) GSF Global site factor (unitless) g s Stomatal conductance per area (mmol H 2 Om -2 s -1 ) E Transpiration rate per area (mmol H 2 Om -2 s -1 ) K h Maximum conductivity (kg m MPa -1 s -1 ) K L Leaf-specific hydraulic conductivity (kg m -1 MPa -1 s -1 ) K S Specific hydraulic conductivity (kg m -1 MPa -1 s -1 ) P 50PLC Pressure causing 50% loss of K h (MPa) PPFD Photosynthetic photon flux density (lmol m -2 s -1 ) Communicated by Hermann Heilmeier. J. L. Quero Forest Ecology and Forest Management Group, Centre for Ecosystem Studies, Wageningen University, 6700 AA Wageningen, The Netherlands F. J. Sterck Forest Ecology and Forest Management Group and Resource Ecology Group, Centre for Ecosystem Studies, Wageningen University, 6700 AA Wageningen, The Netherlands J. Martı ´nez-Vilalta CREAF/Ecology Unit, Autonomous University of Barcelona, Bellaterra, 08193 Barcelona, Spain R. Villar A ´ rea de Ecologı ´a, Facultad de Ciencias, Universidad de Co ´rdoba, 14071 Cordoba, Spain Present Address: J. L. Quero (&) A ´ rea de Biodiversidad y Conservacio ´n, Departamento de Biologı ´a y Geologı ´a, Escuela Superior de Ciencias Experimentales y Tecnologı ´a, Universidad Rey Juan Carlos, 28933 Mostoles, Spain e-mail: [email protected] 123 Oecologia (2011) 166:45–57 DOI 10.1007/s00442-011-1922-3
Transcript of Water-use strategies of six co-existing Mediterranean woody species during a summer drought
PHYSIOLOGICAL ECOLOGY - ORIGINAL PAPER
Water-use strategies of six co-existing Mediterranean woodyspecies during a summer drought
Jose L. Quero • Frank J. Sterck •
Jordi Martınez-Vilalta • Rafael Villar
Received: 12 May 2010 / Accepted: 13 January 2011 / Published online: 3 February 2011
� Springer-Verlag 2011
Abstract Drought stress is known to limit plant perfor-
mance in Mediterranean-type ecosystems. We have
investigated the dynamics of the hydraulics, gas exchange
and morphology of six co-existing Mediterranean woody
species growing under natural field conditions during a
drought that continued during the entire summer. Based on
the observed minimum leaf water potentials, our results
suggest that the six co-existing species cover a range of
plant hydraulic strategies, from isohydric to anisohydric.
These differences are remarkable since the selected indi-
viduals grow within several meters of each other, sharing
the same environment. Surprisingly, whatever the leaf
water potentials were at the end of the dry period, stomatal
conductance, photosynthesis and transpiration rates were
relatively similar and low across species. This result con-
tradicts the classic view that anisohydric species are able to
maintain gas exchange for longer periods of time during
drought stress. None of the plants showed the expected
structural acclimation response to the increasing drought
(reduction of leaf-to-sapwood area ratio), thereby rejecting
the functional equilibrium hypothesis for our study system.
Instead, three of the six species increased photosynthetic
area at the branch level. The observed dissimilar patterns of
gas exchange, hydraulics and morphology across species
seem to be equally successful given that photosynthesis at
the leaf level was maintained at similar rates over the
whole dry period.
Keywords Anisohydric � Embolism � Isohydric �Photosynthesis � Stomatal conductance � Water potential
Abbreviations
A Photosynthetic rate per area (lmol CO2 m-2 s-1)
AL Branch leaf area (mm2)
AS Cross-sectional stem area (mm2)
GSF Global site factor (unitless)
gs Stomatal conductance per area (mmol
H2O m-2 s-1)
E Transpiration rate per area (mmol H2O m-2 s-1)
Kh Maximum conductivity (kg m MPa-1 s-1)
KL Leaf-specific hydraulic conductivity
(kg m-1 MPa-1 s-1)
KS Specific hydraulic conductivity
(kg m-1 MPa-1 s-1)
P50PLC Pressure causing 50% loss of Kh (MPa)
PPFD Photosynthetic photon flux density
(lmol m-2 s-1)
Communicated by Hermann Heilmeier.
J. L. Quero
Forest Ecology and Forest Management Group,
Centre for Ecosystem Studies, Wageningen University,
6700 AA Wageningen, The Netherlands
F. J. Sterck
Forest Ecology and Forest Management Group and Resource
Ecology Group, Centre for Ecosystem Studies, Wageningen
University, 6700 AA Wageningen, The Netherlands
J. Martınez-Vilalta
CREAF/Ecology Unit, Autonomous University of Barcelona,
Bellaterra, 08193 Barcelona, Spain
R. Villar
Area de Ecologıa, Facultad de Ciencias, Universidad de
Cordoba, 14071 Cordoba, Spain
Present Address:J. L. Quero (&)
Area de Biodiversidad y Conservacion, Departamento de
Biologıa y Geologıa, Escuela Superior de Ciencias
Experimentales y Tecnologıa, Universidad Rey Juan Carlos,
28933 Mostoles, Spain
e-mail: [email protected]
123
Oecologia (2011) 166:45–57
DOI 10.1007/s00442-011-1922-3

Wl Leaf water potential (MPa)
Wpd Predawn leaf water potential (MPa)
Introduction
Plants of Mediterranean climates are exposed to a summer
drought period that can last for several successive months
(Archibold 1995). In contrast to many species from deserts
(Levitt 1980; Smith and Nobel 1986) and tropical areas
with strong rainfall seasonality (Lebrija-Trejos 2009), most
Mediterranean plants retain their leaves during the summer
and are therefore expected to be physiologically and mor-
phologically adapted to maintain photosynthesis during dry
periods (di Castri 1981; Joffre et al. 1999). Although plants
experience a continuum of leaf water potentials, two con-
trasting strategies have been proposed (McDowell et al.
2008). At one extreme, plants rapidly close stomata when
confronted with excessively dry soil conditions. Such
plants limit transpiration, maintain relatively high (but
negative) leaf water potentials and thus avoid hydraulic
failure by cavitation of water columns in the xylem. At the
other extreme, plants keep stomata open for longer periods
of time, maintain relatively high transpiration rates and
thus decrease leaf water potentials to more negative values
during the summer. The declining water potential might
cause hydraulic failure by inducing cavitation in the xylem
(Tyree and Zimmermann 2002). Those strategies have been
referred as isohydric and anisohydric strategies, respec-
tively (Jones 1998; Tardieu and Simonneau 1998).
It is far from clear how the iso/anisohydric concept
relates to the life history of plant species and associated
plant traits in Mediterranean climates, where early suc-
cessional shrubs and late-successional shrubs or trees may
coexist for a long periods of time (Thompson 2005)
because succession is very slow in these ecosystems. From
a physiological point of view, early successional species
are known for their high gas exchange rates (De Lillis and
Federici 1993), and those high rates are accompanied by
highly conductive xylem and leaves (Tyree and Zimmer-
mann 2002 and references therein). Such high rates might
be maintained during persisting droughts in the summer,
although they may decline under extreme conditions. In
contrast, late-successional species with lower gas exchange
rates (Quero et al. 2006) are expected to remain physio-
logically active for much longer during the summer
drought, since they consume water at a much slower rate.
Actual proof for the existence of such different strategies
is, however, limited, and it is particularly unclear how they
relate to the isohydric/anisohydric concept (see Bonal and
Guehl 2001, for tropical rainforest tree species).
From a morphological point of view, plants in drought-
stressed environments are expected to invest proportion-
ately more in structures involved in water acquisition and
transport (functional equilibrium hypothesis, Brouwer
1962). It has been proposed that leaf-level homeostasis in
water status is attained due to whole-plant changes in
morphology and anatomy (Bhaskar and Ackerly 2006;
Maseda and Fernandez 2006). For example, plants could
adjust their hydraulic system to drought conditions through
modification of the leaf-to-sapwood area ratio (Sterck et al.
2008; Martınez-Vilalta et al. 2009) to prevent the occur-
rence of low water potentials in plant tissues, reduce the
risk of cavitation of water columns in the xylem (Zweifel
and Zeugin 2008) and delay stomatal closure (Tyree and
Zimmermann 2002).
To date, studies evaluating water-use strategies in plants
have been based on the analysis of diverse variables,
exploring either gas exchange between leaves and the
atmosphere (Acherar and Rambal 1992; Sala and Tenhn-
unen 1994; Medrano et al. 2009), hydraulic properties,
such as vulnerability to xylem cavitation (Salleo et al.
1996; Iovi et al. 2009), or morphological adjustments
(Sterck et al. 2008; Martınez-Vilalta et al. 2009). Although
a number of studies on Mediterranean-type climates have
combined gas exchange measures with hydraulic measures
(i.e. Martınez-Vilalta et al. 2002; Bhaskar et al. 2007), we
are not aware of any such study that included multiple plant
species growing under natural field conditions and cover-
ing, with high temporal resolution, a whole-summer
drought period. Moreover, it is far from clear how mor-
phological adjustments are associated with the variation in
physiological traits during ongoing summer drought for
plants differing in life history. In this paper, we present a
field study of six co-occurring evergreen woody species
that are expected to include a variety of water-use strate-
gies. The main objective of this study was to compare how
these species varied in hydraulics, gas exchange and
morphology over a period of 3 dry summer months, from
the last precipitation in the first week of June until the first
rains in September.
Based on this objective, we state three hypotheses. First,
we expected to encounter both isohydric and anisohydric
species in our study site, with the two species groups
showing contrasting seasonal gas exchange. More specifi-
cally, isohydric species will achieve higher gas exchange
rates early in the summer, but have lower rates later in the
summer because they save water by stomatal closure. On
the contrary, anisohydric species will be less productive
under the more favourable conditions early in the summer,
but will assimilate more (i.e. higher photosynthesis rates)
under stressed conditions during late summer. Secondly,
we expect coordination between the drought stress expe-
rienced (in terms of water potential) and plant attributes
46 Oecologia (2011) 166:45–57
123

that increase drought resistance (Pockman and Sperry
2000) during the Mediterranean summer. Finally, follow-
ing the functional equilibrium model, we expect structural
changes on leaf and sapwood area during the summer
drought to mitigate water stress, resulting in a better water
supply to leaves, expressed by a decreasing leaf-to-sap-
wood area ratio and a corresponding increase in leaf-spe-
cific conductivity.
Materials and methods
Study site
The study was conducted during the spring and summer of
2008 in Sierra de Cardena y Montoro Natural Park
(‘La Vegueta’ area, 320–340 m a.s.l.; 38�140N, 4�120W;
Cordoba, SE Spain) in a 5-ha fenced plot comprising a
Mediterranean shrub community. This plot was selected
because various approximately 1.5-m-tall plants of the six
study species were all found in the same area, with the
different individuals being scattered across the site, thus
providing independent replicates [average distance 9 m,
spatial pattern = random, ‘average nearest neighbour’ tool
ArcGIS v9.2, (ESRI, Redlands, CA)]. Moreover, the area
was fenced 2 years before the study year and was therefore
protected against predation from large herbivores (Cervus
elaphus L.), thus excluding a potentially confounding
factor from this study. The climate is typical Mediterra-
nean, with a mean annual precipitation of 752 mm
(1989–2005), cold and rainy winters, lower rainfall in the
spring and autumn and almost no rainfall in the summer.
The average number of consecutive days without precipi-
tation in the summer is 65 days (2001–2009), with maxi-
mum values of 93 and 89 days in 2008 and 2009,
respectively. Average annual temperature is 15.3�C and
the means of the coldest and hottest months (January and
August) are 7.3 and 25.3�C, respectively. The bedrock is
granodiorite and the soil is a regosol (Quero 2007).
Field sampling
Field data were collected from 12 May to 5 September
2008. The environmental variables included precipitation,
radiation, vapour pressure deficit (VPD), temperature and
physical soil properties. Precipitation was measured using
an on-site pluviometer, and daily values of the remaining
of variables were taken from the closest meteorological
station (approx. 15 km apart, 38�030N, 04�080W, 208 m
a.s.l.; Marmolejo, IFAPA, Junta de Andalucıa, Spain).
Within the plot, we selected six species of different
successional status that are typically found in the study site
(Quero 2007) (Table 1): early successional (Cistus Ta
ble
1S
um
mar
yo
fd
escr
ipti
ve
var
iab
les
amo
ng
stu
die
dsp
ecie
s(n
=6
)
Des
crip
tiv
ev
aria
ble
sP
ista
cia
len
tisc
us
Da
ph
ne
gn
idiu
mQ
uer
cus
ilex
Myr
tus
com
mu
nis
Cis
tus
lad
an
ifer
Ole
aeu
rop
aea
GS
F(g
lob
alsi
tefa
cto
r)0
.81
2±
0.0
65
a0
.70
6±
0.0
62
a0
.87
5±
0.0
25
a0
.78
1±
0.0
38
a0
.71
2±
0.0
59
a0
.73
5±
0.0
44
a
PP
FD
(lm
ol
ph
oto
nm
-2
s-1)
1,3
20
±7
9a
1,3
82
±5
a1
,37
4±
11
a1
,40
2±
5a
1,3
85
±2
0a
1,3
13
±3
7a
Cro
wn
wid
th(m
)1
.96
±0
.33
a1
.44
±0
.23
ab0
.79
±0
.07
b1
.74
±0
.22
ab1
.53
±0
.14
ab1
.74
±0
.31
ab
Cro
wn
dep
th(m
)1
.38
±0
.19
ab1
.05
±0
.21
b0
.97
±0
.12
b1
.15
±0
.15
ab1
.54
±0
.24
ab1
.94
±0
.21
a
Pla
nt
hei
gh
t(m
)1
.38
±0
.19
ab1
.43
±0
.12
ab1
.04
±0
.12
bc
1.1
5±
0.1
5b
1.8
3±
0.2
1ab
1.9
4±
0.2
1a
Dia
met
erm
ain
stem
(mm
)2
8.9
3±
7.2
9a
22
.15
±5
.24
a2
5.2
9±
6.6
8a
20
.86
±5
.03
a2
4.3
±2
.9a
24
.09
±4
.92
a
Bra
nch
len
gth
(cm
)2
0.0
±1
.0a
18
.2±
1.3
ab1
4.4
±1
.6b
19
.9±
0.5
a2
0.2
±0
.9a
20
.3±
1a
P50P
LC
(MP
a)a
3.0
9±
0.5
7b
3.3
4±
0.1
7b
5.6
34
.06
±0
.49
ab6
.2±
0.8
a8
.45
KS
(kg
m-
1M
Pa-
1s-
1)
0.6
94
±0
.05
3a
0.4
55
±0
.01
2ab
0.1
08
±0
.04
4c
0.7
84
±0
.02
3a
0.6
52
±0
.06
8a
0.1
40
±0
.04
1b
c
KL
(kg
m-
1M
Pa-
1s-
1)
1.9
89
10
-4
±3
.5
91
0-
5ab
3.5
19
10
-4
±9
.05
91
0-
5a
4.9
19
10
-5
±1
.64
91
0-
5b
3.2
29
10
-4
±9
.98
91
0-
5a
4.5
19
10
-4
±6
.78
91
0-
5a
8.2
99
10
-5
±2
.42
91
0-
5b
Val
ues
are
giv
enas
the
mea
n±
stan
dar
der
ror
(SE
).V
alu
esfo
llo
wed
by
dif
fere
nt
low
erca
sele
tter
sar
esi
gn
ifica
ntl
yd
iffe
ren
tam
on
gsp
ecie
sat
p\
0.0
5(T
uk
ey’s
Ho
nes
tly
Sig
nifi
can
t
Dif
fere
nce
Po
st-h
oc
test
)
See
Ab
bre
via
tio
ns
and
tex
tfo
rd
efin
itio
ns
and
des
crip
tio
ns
of
the
var
iab
les
aP
50P
LC
[pre
ssu
reca
usi
ng
50
%lo
sso
fm
axim
um
con
du
ctiv
ity
(Kh)]
val
ues
for
Qu
ercu
san
dO
lea
wer
eta
ken
fro
mC
orc
uer
aet
al.
(20
04
)an
dE
nn
ajeh
etal
.(2
00
8)
(see
tex
t)
Oecologia (2011) 166:45–57 47
123

ladanifer L., Daphne gnidium L.) and late successional
shrubs (Pistacia lentiscus L., Myrtus communis L.) and
trees [Quercus ilex ssp. ballota (Desf.) Samp., Olea euro-
paea var. sylvestris Brot.]; these will be referred to by their
genus name hereafter. Six sun-exposed individuals per
species were labelled for monitoring. To characterize the
light environment, a global site factor (GSF) was quantified
per individual with hemispherical photography, according
to Quero et al. (2008a), and PPFD measurements were
taken above each plant at midday on 30 July using an
EMS7 canopy transmission meter (PP-systems, Hitchin,
UK) (Table 1). All 36 individuals had a similar size of
1.34 ± 0.54 m [mean height ± standard deviation (SD)].
Gas exchange and water potential measurements were
performed weekly from 22 May to 28 July, and an extra
measurement was performed on 4 September, just before
the first autumn rains. As no precipitation events were
registered from 4 June to 6 September, we monitored the
entire 2008 summer drought period (Fig. 1). During this
year, the cumulative summer precipitation (7 mm; June–
August) was slightly lower than the averaged 2000–2008
value (10.7 mm; June–August), suggesting that the study
period represented a typical summer season. In addition,
random samples of soil were taken under the studied plants
to measure physical soil properties (Table 2). Bulk density
was measured following standard soil methods (dry soil to
soil volume ratio). The sieved \2-mm-diameter fraction
(fine earth) was used to determine particle size distribution
with the pipette method (Gee and Bauder 1986). Field
capacity was calculated following to Saxton et al. (1986),
and soil compaction was measured with a penetrometer
(Penetrologger; Eijkelkamp Agriserch Equipment, Giesbeek,
The Netherlands) using a cylindrical probe with 3.3-cm2 and
308-angle cone. Soil depth was determined by making a hole
until the bedrock was reached.
Predawn leaf water potentials (Wpd) were measured on
each sampling date between 3 and 4 a.m. in vertically
oriented leader twigs (Scholander et al. 1965) at breast
height, using a pressure bomb (range 0–15 MPa; Mano-
frıgido, Lisbon, Portugal). Photosynthesis was measured on
fully expanded leaves at breast height during the morning
(8–10 a.m., solar time), when photosynthetic rates are at
their maximum (Haase et al. 1999; Munne-Bosch et al.
2003). Although we did not measure diurnal courses in
photosynthesis, the very similar trends observed over the
morning across species were remarkable (see Results sec-
tion) and suggest that among-species differences on diurnal
courses were limited. A gas-exchange portable analyser
(Ciras-2; PP-System), adjusted to have constant conditions
of CO2 concentration (390 ppm), flow (200 cm3 min-1)
and PPFD [800 lmol m-2 s-1; this value provided enough
to light saturate all species based on per-species light
response curves (data not shown)], was used to measure
photosynthesis. Each leaf was kept inside the chamber until
measured values stabilized (approx. 2 min). Net assimila-
tion rate (A), transpiration rate (E), stomatal conductance
(gs) and temperature inside the cuvette were recorded three
times, and the average value was used as the data point in
0
0.5
1
1.5
2
2.5
3
3.5
0
5
10
15
20
25
30
35V
PD
(kPa)
Mea
n te
mp
erat
ure
( o
C)
Rad
iati
on
(MJ
m-2
)P
reci
pit
atio
n (m
m)
Date
Fig. 1 Radiation (thick line),
mean temperature (thin line),
vapour pressure deficit (VPD;
dashed line) and precipitation
(white columns at bottom ofgraph) during the study period.
Precipitation was measured on
site; all other data are from the
Marmolejo meteorological
station (38�0302600N,
04�0704600W, 208 m a.s.l.),
IFAPA, Junta de Andalucıa,
Spain
Table 2 Physical soil properties on the study site
Mean ± standard error
Bulk density (g cm-3) 1.45 ± 0.04 (11)
Clay (%) 3.9 ± 0.3 (4)
Loam (%) 9.4 ± 2.5 (4)
Sand (%) 86.8 ± 2.8 (4)
Field capacity (%) 13.2 ± 0.7 (4)
Soil compaction (MPa) 3.26 ± 0.3 (15)
Soil depth (cm) 50.5 ± 4.6 (25)
Numbers in parenthesis indicate sample size
Soil samples were randomly taken under the studied plants
48 Oecologia (2011) 166:45–57
123
the analysis. When a leaf did not completely fill the cuvette
area (2.5 cm2), a photograph was taken using a digital
camera (Cyber-shot DSC-S75; Sony, Tokyo, Japan). In
order to correct measurements by actual leaf area, the
images were analysed using Image Pro-Plus image analysis
software v4.5 (Media Cybernetic, Bethesda, MD). In the
same branch, additional water potential measurements (Wl)
were synchronized with the measurement of gas exchange.
Immediately after every photosynthetic measurement, an
adjacent leafy twig was collected and measured with the
pressure bomb.
At the beginning of sampling, one branch per individual
was labelled in order to characterize morphological chan-
ges in leaf area and stem section throughout the drought
period at branch level. At each of the sampling dates, stem
diameter was measured to the nearest 0.01 mm at the same
position of the stem using a digital calibre, and the number
of fully expanded leaves was counted. Cross-sectional stem
area (AS) was calculated from measured diameters, taking
the area of a circle into consideration. In order to avoid
monitoring effects for the remaining drought period and to
prevent potential branch death at the end of the drought
period (September), only a subsample of fully expanded
leaves per branch (range 5–20, depending on species) was
harvested on 1 August, and laminas were scanned and
processed with Image Pro-Plus image analysis software
v4.5. We estimated branch leaf area (AL) at every census
by multiplying the number of leaves by the average leaf
area of fully expanded leaves.
Vulnerability to xylem embolism
Vulnerability to xylem embolism was measured on four of
the six studied species (see below for details). We har-
vested 24 stem elements, one per studied individual, at the
end of the experiment (5 September 2008). Stem segments
were collected of each branch that had been also selected
for water potential and gas exchange measurements. In the
laboratory, leaves were removed from the stems, and
approximately 25-cm-long wood segments were re-cut
underwater to be used for hydraulic measurements. Seg-
ments were inserted inside a pressure chamber, with both
ends protruding. Proximal ends were connected to the
measuring circuit, and hydraulic conductivity (Kh,
kg m MPa-1 s-1) and vulnerability curves were measured
according to Sperry and Saliendra (1994; but see also
Martınez-Vilalta et al. 2002). To obtain the maximum
conductivity, we first flushed the segments at high pressure
(approx. 100 kPa) with the measure solution of KCl
(degassed and filtered at 0.22 lm) for 60 min to remove all
native embolisms and then, for 10 min, lowered the pres-
sure difference driving the flow to approximately 6 kPa
and raised the pressure inside the chamber to 0.1 MPa for
10 min. Next, the pressure was lowered to a basal value of
10 kPa, and conductivity was measured again after the
system equilibrated, which took approximately 15 min.
The process was repeated at progressively higher injection
pressures until the loss of conductivity was complete or a
pressure of 7 MPa was reached. The percentage loss of
hydraulic conductivity (PLC) after each applied pressure
(P) was calculated by referring the conductivity after the
treatment to the conductivity at 0.1 MPa: PLC = 100 9
[1 - (Kh, P/Kh,0.1)] (Martınez-Vilalta et al. 2002). PLC was
plotted against P using the model of Pammenter and
Vander Willigen (1998),
PLC ¼ 100
1þ ea� P � P50PLCð Þ ð1Þ
where P50PLC is the pressure causing a 50% loss of Kh, and
a is related to the slope of the curve. A curve was adjusted
for each segment using the nonlinear estimation module in
STATISTICA ver. 7.0; Statsoft, Tulsa, OK), always
resulting in good fits to the measured data points
(R2 C 0.75 in all cases, p \ 0.05). PLC50PLC data for
Quercus and Olea were taken from published vulnerability
curves using the branch dehydration technique (Corcuera
et al. 2004; Ennajeh et al. 2008, respectively), since the air-
injection technique has methodological problems related to
the very long vessels found in both species (Martınez-
Vilalta et al. 2002 for Quercus; Herve Cochard, personal
communication, for Olea).
Specific hydraulic conductivity, KS (kg m-1 MPa-1
s-1) was calculated as the ratio between maximum Kh and
mean cross-sectional area of the segment (without bark),
and leaf-specific hydraulic conductivity, KL (kg m-1
MPa-1 s-1), was calculated as the quotient between max-
imum Kh and distal leaf area, where the leaf area was
measured with a leaf area meter (Li-Cor-3100; Li-Cor,
Lincoln, NE). An estimate of percent loss of hydraulic
conductivity (i.e., native embolism) over the whole sum-
mer was calculated using vulnerability curves obtained in
the lab and Wl measured in the field.
Data analyses
Water potentials, percent loss in hydraulic conductivity in
the field, stomatal conductance and photosynthetic mea-
surements were analysed using repeated measures analysis
of variance (ANOVA; Proc GLM, STATISTICA, ver. 7.0;
Statsoft) where species was introduced as a between-subject
factor and date as a within-subject factor. When the dif-
ferences were significant, a multiple comparison of means
(post hoc Tukey’s Honestly Significant Difference test) was
carried out. We examined bi-variation relationships
between the studied variables through least-squares fitting.
Significance was fixed at the 0.05 alpha level throughout the
Oecologia (2011) 166:45–57 49
123

study. Variables were normalized and log-transformed to
avoid heterocedasticity when required (Zar 1996).
Results
Characterization of the dry environment
The experiment started on 22 May 2008 and lasted until 5
September 2008. The last showers of the summer 2008 fell
on 4 June (7 mm), following which time the plants did not
receive any rain until the end of the experiment. Over this
dry period of 92 days, we expected that plants would be
gradually exposed to drier soil conditions. Atmospheric
conditions, however, also changed. The daily radiation,
mean temperature and VPD increased in June, stabilized
until the beginning of August and then declined slowly
during August (Fig. 1). Analysis of the physical soil
properties revealed a high sand content (approx. 87%,
Table 2), which is due to the granodiorite nature of the
bedrock (Quero 2007). This high sand content could
explain the high soil penetration resistance and bulk den-
sity as well as the low water holding capacity, which may
have some effects on the root capacity to penetrate the soil
and to reach the water. Thus, plants had to face severe soil
conditions, which were aggravated during the dry summer
(see results below).
Plant’s perception of environmental drought
at the leaf level
The dynamics of the physiological (Fig. 2) and structural
traits (Fig. 3) suggest that the plants studied strongly
responded to the water dynamics in the soil and/or atmo-
spheric conditions (see also Table 3). A repeated ANOVA
with species and time as explanatory variables for the
physiological and structural traits (Table 3) showed that
the predawn and midday water potentials differed between
species and time, with a significant time 9 species inter-
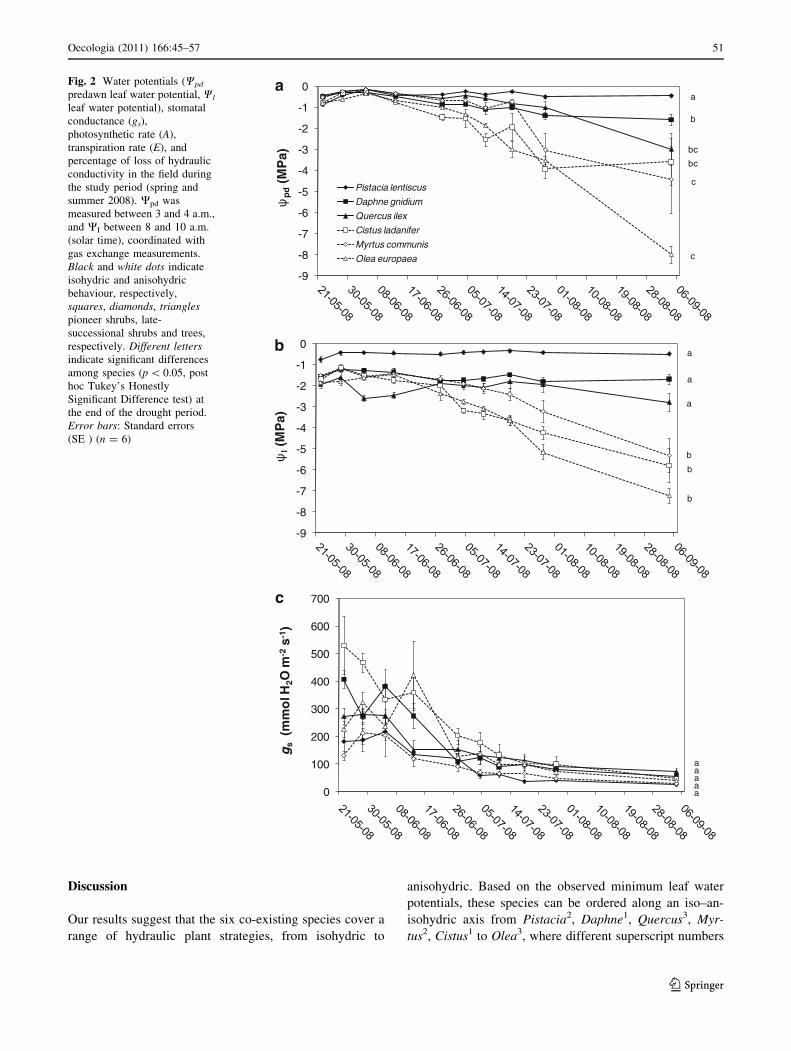
action. Based on leaf water potentials at the end of the
study period, some species tended to maintain the leaf
water potential at the same level and closer to zero across
time (the isohydrics Pistacia, Daphne and Quercus), and
others reduced the water potentials considerably over time
(the anisohydrics Cistus, Myrtus and Olea) (Fig. 2a, b).
After the last rain showers on 4 June, both stomatal con-
ductance and photosynthesis declined in all species until
the end of the study period (Fig. 2c, d). Transpiration
showed a similar pattern over time, with the exception of
an increase over the first three to five sampling dates
(Fig. 2e), probably because the transpirational demand
increased over that period (Fig. 1). The species with the
more negative water potentials (Cistus, Myrtus and Olea)
lost a higher percentage of their conductivity at the end of
the drought period (Fig. 2f).
Plant’s response to environmental drought
at the branch level
Interactive effects of species 9 time were observed for
both morphological variables, AS and AL, as demonstrated
by repeated measures ANOVAs (Table 3, Fig. 3). AS
increased over time for Pistacia and Quercus, but did not
change significantly for the other species (Fig. 3a). AL
increased in Pistacia, Quercus, Myrtus and Cistus, but not
in the other species (Fig. 3b). Accordingly, the resulting
variable (AL:AS) also showed a significant interaction
between time and species: the AL:AS ratio increased with
time for Pistacia, Myrtus and Cistus, but not for the other
species (Fig. 3c). Native KL decreased with time in anis-
ohydric species (Fig. 3d), which can be attributed to the
loss of conductivity over time (Fig. 2f). For isohydric
species, the pattern in KL did not differ with time, because
these plants barely faced any loss in conductivity (native
PLC \20%, Fig. 2f).
Maximum hydraulic conductivities
and vulnerability to embolism
Specific hydraulic conductivity (KS) varied among species,
with both tree species (Quercus and Olea) having the
lowest KS values (Table 1). There were no consistent dif-
ferences in KS between isohydric and anisohydric species.
Leaf-specific conductivity (KL) followed similar trends to
KS, although a trend of increasing KL was observed from
tree to pioneer species. Vulnerability to xylem embolism
varied markedly among species. The parameters of the
fitted vulnerability curves, particularly P50PLC, reflected
differences between isohydric and anisohydric groups, with
P50PLC always being higher for the anisohydric species
within a successional group. Among species, Olea, Cistus
and Quercus were the most resistant (higher P50PLC), fol-
lowed by Myrtus, Daphne and Pistacia (Table 1).
Causal links among gas exchange, water relations
and hydraulics
The trend towards anisohydric species being more resistant
to xylem embolism (within a successional group at least)
was not enough to compensate for their lower minimum
leaf water potential, implying that hydraulic safety margins
were narrower in the anisohydric species (Fig. 4). As a
result, predicted levels of native embolism were lower in
the isohydric species (PLC \20%, Fig. 2f) than in the
anisohydric ones (PLC = 45–65%, Fig. 2f) at the end of
the drought period.
50 Oecologia (2011) 166:45–57
123
Discussion
Our results suggest that the six co-existing species cover a
range of hydraulic plant strategies, from isohydric to
anisohydric. Based on the observed minimum leaf water
potentials, these species can be ordered along an iso–an-
isohydric axis from Pistacia2, Daphne1, Quercus3, Myr-
tus2, Cistus1 to Olea3, where different superscript numbers
-9
-8
-7
-6
-5
-4
-3
-2
-1
0
pd
(MP
a)
Pistacia lentiscus
Daphne gnidium
Quercus ilex
Cistus ladanifer
Myrtus communis
Olea europaea
a
bc
c
c
bc
b
-9
-8
-7
-6
-5
-4
-3
-2
-1
0
l(M
Pa)
a
b
b
b
a
a
0
100
200
300
400
500
600
700
gs
(mm
ol H
2O m
- 2s-
1 )
aaaaa
a
b
c
Fig. 2 Water potentials (Wpd
predawn leaf water potential, Wl
leaf water potential), stomatal
conductance (gs),
photosynthetic rate (A),
transpiration rate (E), and
percentage of loss of hydraulic
conductivity in the field during
the study period (spring and
summer 2008). Wpd was
measured between 3 and 4 a.m.,
and WI between 8 and 10 a.m.
(solar time), coordinated with
gas exchange measurements.
Black and white dots indicate
isohydric and anisohydric
behaviour, respectively,
squares, diamonds, trianglespioneer shrubs, late-
successional shrubs and trees,
respectively. Different lettersindicate significant differences
among species (p \ 0.05, post
hoc Tukey’s Honestly
Significant Difference test) at
the end of the drought period.
Error bars: Standard errors
(SE ) (n = 6)
Oecologia (2011) 166:45–57 51
123

-2
2
6
10
14
18
A(µ
mo
l CO
2m
-2s-
1 )
aa
aaaa
0
1
2
3
4
5
6
E(m
mo
l H2O
m- 2
s-1 )
aaaaa
0
20
40
60
80
100
dle ife
htni
y tivit cu
dn
o cfo
sso
L%
(est
imat
ed f
rom
vu
lner
abili
ty c
urv
es)
Date
a
bbb
a
a
a
bbb
a
a
d
e
f
Fig. 2 continued
52 Oecologia (2011) 166:45–57
123

refer to different successional groups, namely: 1, early
successional shrubs; 2, late successional shrubs; 3, late
successional tree species. Surprisingly, within each suc-
cessional group always one species exhibited more anis-
ohydric behaviour and the other exhibited a more isohydric
one. Contrary to our expectations, isohydric and anisohy-
dric species did not systematically differ in P50PLC. How-
ever, within a successional group, the anisohydric species
were always more resistant to embolism. Additionally,
P50PLC correlated with minimum leaf water potentials
across species, which agrees with the theory that vulnera-
bility to embolism limits the water potentials at which each
species can operate. To the contrary, the species with more
negative leaf water potentials had higher P50PLC values,
which allowed the plant to function close to the point of
hydraulic failure by cavitation despite lower water poten-
tials in the xylem. Indeed, these plants had a much higher
loss of conductivity at the end of the dry season. Surpris-
ingly, plants of all six species—and thus including the full
range of hydraulic strategies—were able to maintain pho-
tosynthesis and invested in new leaf area at the branch level
over the dry period. These results are remarkable and
contrast with our initial hypotheses; as such, they may shed
new light on successful plant strategies in Mediterranean
climates. In the following paragraphs, we discuss our
hypotheses and then draw general conclusions.
Although the six species coexist in the same environ-
ment, leaf water potentials varied greatly among the spe-
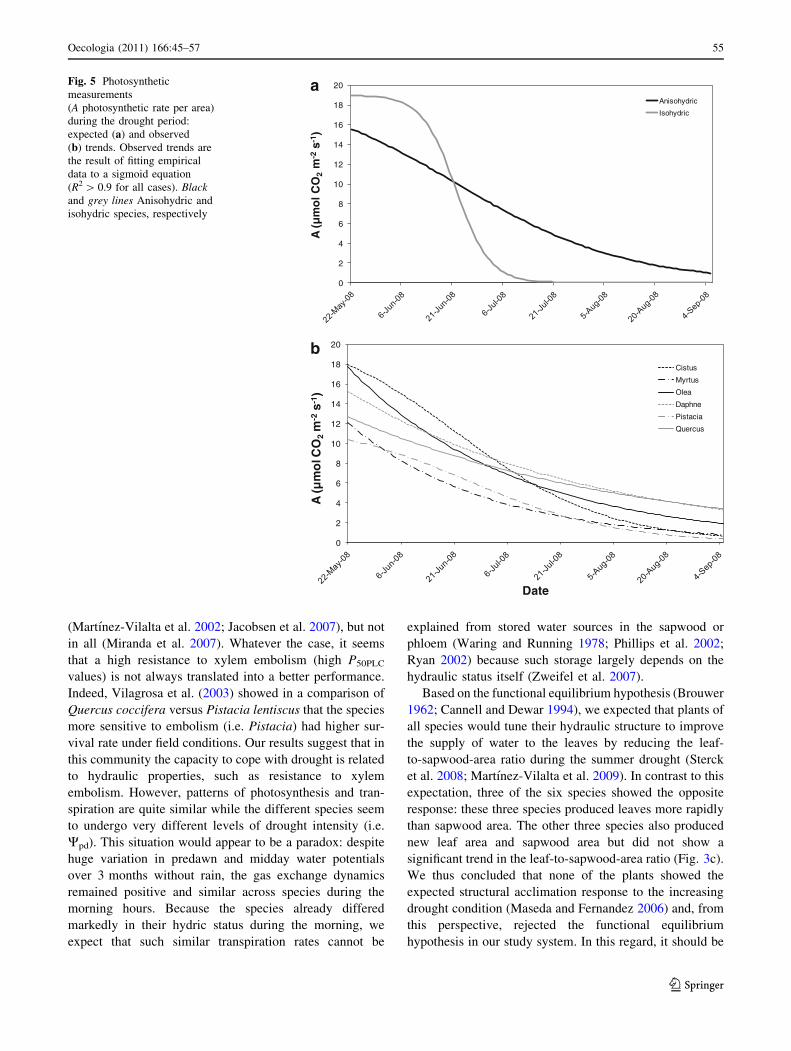
cies, particularly at the end of the dry period. Our first
expectations was that more isohydric plants, i.e. those that
close stomata at relatively high leaf water potentials, than
anisohydric plants would show higher rates of net photo-
synthesis during and after the last showers in the early
summer, but that the former ‘would pay’ for that activity
with an earlier decrease of stomatal conductance and lower
carbon gain later during the summer compared to the latter
(Fig. 5a). This was clearly not the case: whatever the leaf
water potential values, stomatal conductance, photosyn-
thetic, and transpiration rates were relatively similar and
low across species at the end of the dry period (Fig. 5b).
Opposite results to those reported here, i.e. showing leaf
water potential–gas exchange relationships, are usually
found in the literature and have been found in different
species and systems (Wullschleger et al. 1998). In our
study, the more isohydric plants combined higher leaf
water potentials with higher Wpd (a measure of drought
0
2
4
6
8
10
12
14
16
5-Ju
n
12- J
un
27-J
un
10- J
ul
1-A
ug
5-Ju
n
12- J
un
27-J
un
10-J
ul
1-A
ug
5-Ju
n
12- J
un
27- J
un
10-J
ul
1-A
ug
5-Ju
n
12-J
un
27-J
un
10-J
ul
1 -A
ug
5-Ju
n
12- J
un
27-J
un
10-J
ul
1-A
ug
5-Ju
n
12-J
un
27-J
un
10-J
ul
1-A
ug
Daphne gnidium Pistacea lentiscus Quercus ilex Myrtus communis Cistus ladanifer Olea europea
Isohydric Anisohydric
AS
(mm
-2) y
yy
xx yy
y
xx
0
10000
20000
30000
40000
5-Ju
n
12-J
un
27-J
un
10-J
ul
1-A
ug
5-Ju
n
12-J
un
27-J
un
10-J
ul
1-A
ug
5-Ju
n
12-J
un
27-J
un
10-J
ul
1-A
ug
5-Ju
n
12-J
un
27-J
un
10-J
ul
1-A
ug
5-Ju
n
12-J
un
27-J
un
10-J
ul
1-A
ug
5-Ju
n
12-J
un
27-J
un
10-J
ul
1-A
ug
Daphne gnidium Pistacea lentiscus Quercus ilex Myrtus communis Cistus ladanifer Olea europea
Isohydric Anisohydric
AL (
mm
2 )
yy
y
x
x
yxyxy
xyx
y
xyxyx
x
z
yy
xx
0
1000
2000
3000
4000
5-Ju
n12
-Jun
27-J
un10
-Jul
1-A
ug
5-Ju
n12
-Jun
27-J
un10
-Jul
1-A
ug
5-Ju
n12
-Jun
27-J
un10
-Jul
1-A
ug
5-Ju
n12
-Jun
27-J
un10
-Jul
1-A
ug
5-Ju
n12
-Jun
27-J
un10
-Jul
1-A
ug
5-Ju
n12
-Jun
27-J
un10
-Jul
1-A
ug
Daphne gnidium Pistacea lentiscus Quercus ilex Myrtus communis Cistus ladanifer Olea europea
Isohydric Anisohydric
AL:
AS
(m
m2
mm
)
z
yzyz
xy
x
z
yy
x
x
y
xx
xx
0.0000
0.0012
0.0024
0.0036
0.0048
0.0060
5-Ju
n
12-J
un
27-J
un
10-J
ul
1-A
ug
5-Ju
n
12-J
un
27-J
un
10-J
ul
1-A
ug
5-Ju
n
12-J
un
27-J
un
10-J
ul
1-A
ug
5-Ju
n
12-J
un
27-J
un
10-J
ul
1-A
ug
5-Ju
n
12-J
un
27-J
un
10-J
ul
1-A
ug
5-Ju
n
12-J
un
27-J
un
10-J
ul
1-A
ug
Daphne gnidium Pistacea lentiscus Quercus ilex Myrtus communis Cistus ladanifer Olea europea
Isohydric Anisohydric
KL (
kg m
-1 M
Pa-1
s-1
)yz
yzyz
xy
x
zyzyzxyx
yxyxyxyx
.
a
c d
b
Fig. 3 Morphological changes at the branch level during the study
period (spring and summer 2008): AS Cross-sectional stem area, AL
branch leaf area, KL native leaf-specific hydraulic conductivity. When
shown, different letters indicate significant differences within species
(p \ 0.05, post hoc Tukey’s Honestly Significant Difference test)
during the study period. Error bars: SE (n = 6)
Oecologia (2011) 166:45–57 53
123

intensity; Resco et al. 2009), such that they were also able
to maintain transpiration and carbon gain during the whole
summer. Wpd differed across species, and these differences
became larger during the drought period between May and
September (Fig. 2a, b). These differences are remarkable,
since the selected individuals grow within meters of each
other, sharing the same environment. The Wpd suggest that
the soils around the roots of isohydric plants did not dry out
as did the soils around the roots of the more anisohydric
plants. The most obvious explanation for such differences
in leaf water potentials is different rooting depth, as sug-
gested by Bhaskar et al. (2007). Alternatively, it has been
suggested that those differences in plant Wpd do not nec-
essarily reflect differences in access to water and rooting
depth (Donovan et al. 2003), but might result from dif-
ferences in night transpiration. Species that face ongoing
night transpiration (Snyder et al. 2003; Howard et al. 2009;
Rogiers et al. 2009) maintain the depletion zone around
fine roots and create low Wpd, while species without night
transpiration might restore the water conditions around fine
roots during the night. Concentrations of apoplastic solutes
in leaf intercellular spaces have also been proposed as a
mechanism contributing to differences in Wpd (Donovan
et al. 1999). Finally, we might also consider differences in
fine root growth dynamics, with species able to grow rap-
idly to soil pockets with water (‘water foraging’) while
others cannot; however, we are not aware of any studies
reporting on such interspecific differences across co-
existing plant species in Mediterranean areas.
Secondly, we expected coordination between the per-
ceived drought stress and plant vulnerability to xylem
cavitation, which was reflected in the Wl–P50PLC across the
species’ relationship (Fig. 4). It is reasonable that species
experiencing lower leaf water potentials in the field show a
higher resistance to xylem embolism. This relationship has
been found in several studies on Mediterranean ecosystems
Table 3 Results of the repeated measures analyses of variance (ANOVAs) for the study variables at the leaf and branch level, according to the
factors species and time
Study variables Factors Interaction R2
Species Time Species 9 time
Leaf level
Wpd 23.2*** 57.3*** 16.3*** 96.8
Wl 35.0*** 26.9*** 25.1*** 87.1
gs 12.7** 46.1*** 13.4*** 72.2
A 11.3** 46.6*** 18.1*** 75.9
Percent loss field conductivity 24.8*** 23.2*** 20.9*** 68.9
Branch level
AS 70.7*** 2.7*** 2.5** 75.9
AL 67.0*** 12.1*** 12.2*** 91.7
AL:AS 37.2*** 14.2*** 13.4*** 64.9
KL 82.2*** 5.4*** 2.6*** 90.7
The proportion of the explained variance [SSx/SStotal (%)] and the level of significance (* p \ 0.05; ** p \ 0.01; *** p \ 0.001) for each factor
and the interaction are indicated
See Abbreviations and text for definitions and descriptions of the variables
R2 Percentage of total variance explained by the model
0
1
2
3
4
5
6
7
8
9
0 1 2 3 4 5 6 7 8 9
P50
PL
C(M
Pa)
Minimum water potential (–MPa)
Daphne gnidium
Pistacea lentiscus
Quercus ilex
Cistus ladanifer
Myrtus communis
Olea europaea
Regresion line
R2 = 0.67*
Fig. 4 Relationship between minimum water potential and pressure
causing 50% loss of maximum conductivity (P50PLC). Values of
P50PLC for Quercus and Olea were taken from Corcuera et al. (2004)
and Ennajeh et al. (2008), respectively. Black and white dots indicate
isohydric and anisohydric behavior, respectively, squares, diamondsand triangles pioneer shrubs, late-successional shrubs and trees,
respectively. Dotted line is the 1:1 line. Asterisk indicates a significant
relationship (p \ 0.05). Error bars: SE (n = 6)
54 Oecologia (2011) 166:45–57
123
(Martınez-Vilalta et al. 2002; Jacobsen et al. 2007), but not
in all (Miranda et al. 2007). Whatever the case, it seems
that a high resistance to xylem embolism (high P50PLC
values) is not always translated into a better performance.
Indeed, Vilagrosa et al. (2003) showed in a comparison of
Quercus coccifera versus Pistacia lentiscus that the species
more sensitive to embolism (i.e. Pistacia) had higher sur-
vival rate under field conditions. Our results suggest that in
this community the capacity to cope with drought is related
to hydraulic properties, such as resistance to xylem
embolism. However, patterns of photosynthesis and tran-
spiration are quite similar while the different species seem
to undergo very different levels of drought intensity (i.e.
Wpd). This situation would appear to be a paradox: despite
huge variation in predawn and midday water potentials
over 3 months without rain, the gas exchange dynamics
remained positive and similar across species during the
morning hours. Because the species already differed
markedly in their hydric status during the morning, we
expect that such similar transpiration rates cannot be
explained from stored water sources in the sapwood or
phloem (Waring and Running 1978; Phillips et al. 2002;
Ryan 2002) because such storage largely depends on the
hydraulic status itself (Zweifel et al. 2007).
Based on the functional equilibrium hypothesis (Brouwer
1962; Cannell and Dewar 1994), we expected that plants of
all species would tune their hydraulic structure to improve
the supply of water to the leaves by reducing the leaf-
to-sapwood-area ratio during the summer drought (Sterck
et al. 2008; Martınez-Vilalta et al. 2009). In contrast to this
expectation, three of the six species showed the opposite
response: these three species produced leaves more rapidly
than sapwood area. The other three species also produced
new leaf area and sapwood area but did not show a
significant trend in the leaf-to-sapwood-area ratio (Fig. 3c).
We thus concluded that none of the plants showed the
expected structural acclimation response to the increasing
drought condition (Maseda and Fernandez 2006) and, from
this perspective, rejected the functional equilibrium
hypothesis in our study system. In this regard, it should be
0
2
4
6
8
10
12
14
16
18
20
A (µ
mo
l CO
2m
-2s-
1 )
Anisohydric
Isohydric
0
2
4
6
8
10
12
14
16
18
20
A (µ
mo
l CO
2m
-2s-
1 )
Date
Cistus
Myrtus
Olea
Daphne
Pistacia
Quercus
a
b
Fig. 5 Photosynthetic
measurements
(A photosynthetic rate per area)
during the drought period:
expected (a) and observed
(b) trends. Observed trends are
the result of fitting empirical
data to a sigmoid equation
(R2 [ 0.9 for all cases). Blackand grey lines Anisohydric and
isohydric species, respectively
Oecologia (2011) 166:45–57 55
123

pointed out that since acute levels of water stress were only
observed for a short period at the end of the summer, there
might have been no time for structural responses (Quero
et al. 2006, 2008b). Instead, half of the studied species
increased photosynthetic area, which seems to have been a
successful adaptation given that photosynthesis at the leaf
level was maintained over the whole dry period in all
species (Fig. 2d).
The results reported here show that the six Mediterra-
nean species studied performed similarly in terms of gas
exchange during a summer drought lasting for 3 months in
which virtually no rain fell—despite increasing differences
in perceived water stress (leaf water potential) and access
to soil water. Therefore, the differences in leaf water
potentials (i.e., the iso–anisohydric axis found) were likely
to be more related to the need of the plant to avoid large
losses of conductivity in the xylem due to embolism
(Jacobsen et al. 2007) than to functional tradeoffs associ-
ated to the maintenance of gas exchange during the dry
season. Moreover, these plants did not respond to the
ongoing drought by reducing their leaf area. To the con-
trary, their structural responses were opposed to the func-
tional equilibrium hypothesis and suggest that the transport
efficiency in branches may not be a bottleneck for water
transport and gas exchange during the summer drought in
the studied species.
Acknowledgements We thank Saskia Grootemaat for her invalu-
able help during the field monitoring, Lars Markesteijn for his
interesting discussions on hydraulics, Regino Zamora for the logistic
support and Jose Manuel Quero, head of Sierra Cardena y Montoro
Natural Park, for the help and facilities provided during the moni-
toring period. Antonio Dıaz-Espejo put order in our minds during the
design of the measurements and so we could survive during the
summer drought. Purificacion de la Haba and Eloısa Aguera kindly
lent us the IRGA. Vidal Barron helped with the soil determinations
and Pablo Gonzalez Moreno with the spatial analysis. This study was
supported by the postdoctoral grant MCINN (Spain) to J.L.Q (2007-
0572), and by the coordinated Spanish MCINN projects DINAMED
(CGL2005-05830), INTERBOS (CGL2008-04503-CO3-02) and
CGL2007-60120. This research is part of the GLOBIMED network
on forest ecology (http://www.globimed.net/).
References
Acherar M, Rambal S (1992) Comparative water relations of four
Mediterranean oak species. Vegetatio 99(100):177–184
Archibold OW (1995) Ecology of world vegetation. Chapman & Hall,
London
Bhaskar R, Ackerly DD (2006) Ecological relevance of minimum
seasonal water potentials. Physiol Plant 127:353–359
Bhaskar R, Valiente-Banuet A, Ackerly DD (2007) Evolution of
hydraulic traits in closely related species pairs from Mediterra-
nean and non-Mediterranean environments of North America.
New Phytol 176:718–726
Bonal D, Guehl JM (2001) Contrasting patterns of leaf water potential
and gas exchange responses to drought in seedlings of tropical
rainforest species. Funct Ecol 15:490–496
Brouwer R (1962) Nutritive influences on the distribution of dry
matter in the plant. Neth J Agric Sci 10:399–408
Cannell MGR, Dewar RC (1994) Carbon allocation in trees, a review
of concepts for modelling. Adv Ecol Res 20:59–104
Corcuera L, Camarero JJ, Gil-Pelegrın E (2004) Effects of a severe
drought on Quercus ilex radial growth and xylem anatomy. Trees
Struct Funct 18:83–92
Di Castri F (1981) Mediterranean-type shrubland of the world. In: di
Castri F, Goodall DW, Specht RL (eds) Mediterranean-type
shrublands ecosystems of the world, vol 11. Elsevier, Amster-
dam, pp 1–52
Donovan LA, Grise DJ, West JB, Pappert RA, Alder NN, Richards JH
(1999) Predawn disequilibrium between plant and soil water
potentials in two cold-desert shrubs. Oecologia 120:209–217
Donovan LA, Richards JH, Linton MJ (2003) Magnitude and
mechanisms of disequilibrium between predawn plant and soil
water potentials. Ecology 84:463–470
Ennajeh M, Tounekti T, Vadel AM, Khemira H, Cochard H (2008)
Water relations and drought-induced embolism in two olive
(Olea europaea L.) varieties ‘Meski’ and ‘Chemlali’ under
severe drought conditions. Tree Physiol 28:971–976
Gee GW, Bauder JW (1986) Particle size analysis. In: Klute A (ed)
Methods of soil analysis. Part I. Agronomy monograph, vol 9,
2nd edn. ASA and SSSA, Madison, pp 383–411
Haase P, Pugnaire FI, Clark SC, Incoll LD (1999) Diurnal and
seasonal changes in cladode photosynthetic rate in relation to
canopy age structure in the leguminous shrub Retama sphaero-carpa. Funct Ecol 13:640–649
Howard AR, Van Iersel MW, Richards JH, Donovan LA (2009)
Night-time transpiration can decrease hydraulic redistribution.
Plant Cell Environ 32:1060–1070
Iovi K, Kolovou C, Kyparissis A (2009) An ecophysiological
approach of hydraulic performance for nine Mediterranean
species. Tree Physiol 29:889–900
Jacobsen AL, Pratt RB, Ewers FW, Davis SD (2007) Cavitation
resistance among twenty-six chaparral species of southern
California. Ecol Monogr 77:99–115
Joffre R, Rambal S, Damesin C (1999) Functional attributes in
Mediterranean-type ecosystems. In: Pugnaire FI, Valladares F
(eds) Handbook of functional plant ecology. Marcel Dekker,
New York, pp 347–380
Jones HG (1998) Stomatal control of photosynthesis and transpira-
tion. J Exp Bot 49:387–398
Lebrija-Trejos E (2009) Tropical dry forest recovery, processes and
causes of change. PhD thesis. University of Wageningen,
Wageningen
Levitt J (1980) Response of plants to environmental stresses, vol 1,
2nd edn. Academic Press, New York
Lillis De, Federici FM (1993) Gas exchange and resource-use patterns
along a Mediterranean successional gradient. J Veg Sci 4:269–272
Martınez-Vilalta J, Prat E, Oliveras I, Pinol J (2002) Xylem hydraulic
properties of roots and stems of nine Mediterranean woody
species. Oecologia 133:19–29
Martınez-Vilalta J, Cochard H, Mencuccini M, Sterck F, Herrero A,
Korhonen JFJ, Llorens P, Nikinmaa E, Nole A, Poyatos R,
Ripullone F, Sass-Klaassen U, Zweifel R (2009) Hydraulic
adjustment of scots pine across Europe. New Phytol
184:353–364
Maseda PH, Fernandez RJ (2006) Stay wet or else three ways in
which plants can adjust hydraulically to their environment. J Exp
Bot 57:3963–3977
McDowell N, Pockman WT, Allen CD, Breshears DD, Cobb N, Kolb
T, Plaut J, Sperry J, West A, Williams DG, Yepez EA (2008)
Mechanisms of plant survival and mortality during drought, why
do some plants survive while others succumb to drought? New
Phytol 178:719–739
56 Oecologia (2011) 166:45–57
123
Medrano H, Flexas J, Galmes J (2009) Variability in water use
efficiency at the leaf level among Mediterranean plants with
different growth forms. Plant Soil 317:17–29
Miranda JD, Padilla FM, Martınez-Vilalta J, Pugnaire FI (2007)
Woody species of a semi-arid community are only moderately
resistant to cavitation. Funct Plant Biol 37:828–839
Munne-Bosch S, Jubany-Mari T, Alegre L (2003) Enhanced photo-
and antioxidative protection, and hydrogen peroxide accumula-
tion in drought-stressed Cistus clusii and Cistus albidus plants.
Tree Physiol 23:1–12
Pammenter NW, Vander Willigen C (1998) A mathematical and
statistical analysis of the curves illustrating vulnerability of
xylem to cavitation. Tree Physiol 18:589–593
Phillips N, Bond BJ, Mc Dowell NG, Ryan MG (2002) Canopy and
hydraulic conductance in young mature and old Douglas-fir
trees. Tree Physiol 22:205–211
Pockman WT, Sperry JS (2000) Vulnerability of xylem cavitation and
the distribution of Sonora desert vegetation. Am J Bot
87:1287–1299
Quero JM (2007) Parque Natural Sierra de Cardena y Montoro
1989–2005. Servicio de Publicaciones de la Universidad de
Cordoba y Consejerıa de Medio Ambiente de la Junta de
Andalucıa, Cordoba
Quero JL, Villar R, Maranon T, Zamora R (2006) Interactions of
drought and shade effects on seedlings of four Quercus species,
physiological and structural leaf responses. New Phytol
170:819–834
Quero JL, Gomez-Aparicio L, Zamora R, Maestre FT (2008a) Shifts
in the regeneration niche of an endangered tree (Acer opalus ssp
granatense) during ontogeny, using an ecological concept for
application. Basic Appl Ecol 9:635–644
Quero JL, Villar R, Maranon T, Murillo A, Zamora R (2008b) Plastic
response to light and water in four Mediterranean Quercusspecies (Fagaceae). Rev Chil H Nat 81:373–385
Resco V, Ewers BE, Sun W, Huxman TE, Weltzin JF, Williams DG
(2009) Drought-induced hydraulic limitations constrain leaf gas
exchange recovery after precipitation pulses in the C3 woody
legume, Prosopis velutina. New Phytol 181:672–682
Rogiers SY, Greer DH, Hutton RJ, Landsberg JJ (2009) Does night-
time transpiration contribute to anisohydric behaviour in a Vitisvinifera cultivar? J Exp Bot 60:3751–3763
Ryan MG (2002) Canopy processes research. Tree Physiol
22:1035–1043
Sala A, Tenhnunen JD (1994) Site-specific water relations and
stomatal response of Quercus ilex L. in a Mediterranean
watershed. Tree Physiol 14:601–617
Salleo S, Lo Gullo MA, De Paoli D, Zippo M (1996) Xylem recovery
from cavitation induced embolism in young plants of Laurusnobilis, a possible mechanism. New Phytol 132:47–56
Saxton KE, Rawls WJ, Romberger JS, Papendick RI (1986)
Estimating generalized soil–water characteristics from texture.
Soil Sci Soc Am J 50:1031–1036
Scholander PF, Hammel HT, Bradstreet ED, Hemmingsen EA (1965)
Sap pressure in vascular plants. Negative hydrostatic pressure
can be measured in plants. Science 148:339–346
Smith SD, Nobel PS (1986) Deserts. In: Baker NR, Long SP (eds)
Photosynthesis in contrasting environments. Elsevier, Amster-
dam, pp 13–62
Snyder KA, Richards JH, Donovan LA (2003) Night-time conduc-
tance in C-3 and C-4 species, do plants lose water at night? J Exp
Bot 54:861–865
Sperry JS, Saliendra NZ (1994) Intra- and inter-plant variation in
xylem cavitation in Betula occidentalis. Plant Cell Environ
17:1233–1241
Sterck FJ, Zweifel R, Sass-Klaassen U, Chowdhury Q (2008)
Persistent soil drought reduces leaf specific conductivity in
Scots pine (Pinus sylvestris) and pubescent oak (Quercuspubescens). Tree Physiol 28:529–536
Tardieu F, Simonneau T (1998) Variability among species of stomatal
control under fluctuating soil water status and evaporative
demand, modelling isohydric and anisohydric behaviours. J Exp
Bot 49:419–432
Thompson JD (2005) Plant evolution in the Mediterranean. Oxford
University Press, Oxford
Tyree MT, Zimmermann MH (2002) Xylem structure and the ascent
of sap. Springer, New York
Vilagrosa A, Bellot J, Vallejo VR, Gil-Pelegrin E (2003) Cavitation,
stomatal conductance, and leaf dieback in seedlings of two co-
occurring Mediterranean shrubs during an intense drought. J Exp
Bot 54:2015–2024
Waring RH, Running SW (1978) Sapwood water storage: its
contribution to transpiration and effect upon water conductance
through the stems of old-growth Douglas-fir. Plant Cell Environ
1:131–140
Wullschleger SD, Hanson PJ, Tschaplinski TJ (1998) Whole-plant
water flux in understory red maple exposed to altered precip-
itation regimes. Tree Physiol 18:71–79
Zar JH (1996) Biostatistical analysis, 3rd edn. Prentice Hall,
Englewood Cliffs
Zweifel R, Zeugin F (2008) Ultrasonic acoustic emissions in drought-
stressed trees—more than signals from cavitation? New Phytol
179:1070–1079
Zweifel R, Steppe K, Sterck FJ (2007) Stomatal regulation by
microclimate and tree water relations. Interpreting ecophysio-
logical field data with a hydraulic plant model. J Exp Bot
58:2113–2131
Oecologia (2011) 166:45–57 57
123