Subglacial sediment, proglacial lake-level and topographic controls on ice extent and lobe...
19
Subglacial sediment, proglacial lake-level and topographic controls on ice extent and lobe geometries during the Last Glacial Maximum in NW Russia Eiliv Larsen a, b, * , Ola Fredin a, c , Maria Jensen d , Denis Kuznetsov e , Astrid Lyså a , Dmitry Subetto f a Geological Survey of Norway, P.O. Box 6315 Sluppen, NO-7491 Trondheim, Norway b Norwegian University of Science and Technology, Museum of Natural History and Archaeology, NO-7491 Trondheim, Norway c Norwegian University of Science and Technology, Department of Geography, NO-7491 Trondheim, Norway d The University Centre in Svalbard, P.O. Box 156, NO-9171 Longyearbyen, Norway e Institute of Limnology, Russian Academy of Sciences, Sevastyanova Str. 9, St. Petersburg 196105, Russia f Department of Physical Geography & Environment, Alexander Herzen State, Pedagogical University, St. Petersburg 191186, Moika 48, Russia article info Article history: Received 1 June 2012 Received in revised form 7 February 2013 Accepted 14 February 2013 Available online xxx Keywords: Ice sheet Last Glacial Maximum Iceebed interface Iceelake interaction Ice-lobe geometries Ice-lobe dynamics abstract Investigations in sections along the rivers Severnaya Dvina and Vaga, and morphological mapping based on a new digital elevation model and Landsat imagery, allow for a reinterpretation of the extent of the Scandinavian Ice Sheet during the Last Glacial Maximum (LGM). The reconstruction provides a much better link between stratigraphical and morphological expression of glaciation than previous proposals. Most striking is the configuration of long, low-gradient ice-lobes (ice-streams) extending for some 300e400 km up the wide and smooth river valleys. Their extremely low surface gradients are evidenced by glacial trimlines that formed along the sides of the ice-lobes in contact with the gentle valley slopes. In the main valleys, end moraines marking terminal positions are present, whereas drumlins are rare in the peripheral areas of the ice sheet but found in some tributary valleys at somewhat higher elevations. Large drumlin fields, however, are found farther up-ice. The glacial sediment suc- cession is composed of waterlain sediments and tills. The sediments provide evidence of distal ice damming, glacier overriding and retreat, and finally distally glaciolacustrine sedimentation and lake drainage. The diamicton unit associated with the LGM shows evidence of basal coupling, although more striking is the abundant evidence for iceebed decoupling. These include in situ waterlain sediments within tills, and clastic sills running along the till/substrate contact showing lift-off. These features indicate that the weight of the glacier lobes was, to a large extent, carried by pore-water pressure in subglacial sediments, and that subglacial shear and erosion were moderate. Thus, fast ice flow in the lobes is envisaged. The balance between glacier weight and pore-water pressure was probably main- tained over time by the buoyancy effect of glaciers advancing into proglacial lakes. Subglacial lakes may have formed by capture of proglacial lakes during glacial advance. The combination of low-gradient ice and decoupled beds indicate that glacier advance and extent was largely controlled by lake levels and topographic thresholds. This is taken to indicate that steeper-gradient ice much farther upstream was providing the gravitational push. A presumably abrupt change in ice-surface profile is supported by the mapped distribution of glacial bedforms. The model presented herein potentially has wide applicability for large parts of northern Russia as the topographic setting and glacier advance in lakes across fine- grained low-permeable sediments provide very similar conditions. Ó 2013 Elsevier Ltd. All rights reserved. 1. Introduction During recent years there has been substantial progress in un- derstanding the Weichselian ice-sheet history of northern Russia (e.g. Svendsen et al., 2004; Larsen et al., 2006a) and associated ice- dammed lakes (e.g. Mangerud et al., 2004; Lyså et al., 2011). Despite this, there are still unsolved issues in terms of glacial and lake history. Even reconstructions of ice-sheet distribution and their proglacial lakes belonging to the Last Glacial Maximum (LGM), from which there is relatively good stratigraphical and morphological control, are hampered with uncertainty. In the Arkhangelsk region of NW Russia (Fig. 1), this is expressed as widely different in- terpretations of the LGM extent of the ice sheet (e.g. Krasnov, 1974; * Corresponding author. Geological Survey of Norway, P.O. Box 6315 Sluppen, NO- 7491 Trondheim, Norway. E-mail address: [email protected] (E. Larsen). Contents lists available at SciVerse ScienceDirect Quaternary Science Reviews journal homepage: www.elsevier.com/locate/quascirev 0277-3791/$ e see front matter Ó 2013 Elsevier Ltd. All rights reserved. http://dx.doi.org/10.1016/j.quascirev.2013.02.018 Quaternary Science Reviews xxx (2013) 1e19 Please cite this article in press as: Larsen, E., et al., Subglacial sediment, proglacial lake-level and topographic controls on ice extent and lobe geometries during the Last Glacial Maximum in NW Russia, Quaternary Science Reviews (2013), http://dx.doi.org/10.1016/ j.quascirev.2013.02.018
-
Upload
independent -
Category
Documents
-
view
3 -
download
0
Transcript of Subglacial sediment, proglacial lake-level and topographic controls on ice extent and lobe...

at SciVerse ScienceDirect
Quaternary Science Reviews xxx (2013) 1e19
Contents lists available
Quaternary Science Reviews
journal homepage: www.elsevier .com/locate/quascirev
Subglacial sediment, proglacial lake-level and topographic controls on ice extentand lobe geometries during the Last Glacial Maximum in NW Russia
Eiliv Larsen a,b,*, Ola Fredin a,c, Maria Jensen d, Denis Kuznetsov e, Astrid Lyså a, Dmitry Subetto f
aGeological Survey of Norway, P.O. Box 6315 Sluppen, NO-7491 Trondheim, NorwaybNorwegian University of Science and Technology, Museum of Natural History and Archaeology, NO-7491 Trondheim, NorwaycNorwegian University of Science and Technology, Department of Geography, NO-7491 Trondheim, Norwayd The University Centre in Svalbard, P.O. Box 156, NO-9171 Longyearbyen, Norwaye Institute of Limnology, Russian Academy of Sciences, Sevastyanova Str. 9, St. Petersburg 196105, RussiafDepartment of Physical Geography & Environment, Alexander Herzen State, Pedagogical University, St. Petersburg 191186, Moika 48, Russia
a r t i c l e i n f o
Article history:Received 1 June 2012Received in revised form7 February 2013Accepted 14 February 2013Available online xxx
Keywords:Ice sheetLast Glacial MaximumIceebed interfaceIceelake interactionIce-lobe geometriesIce-lobe dynamics
* Corresponding author. Geological Survey of Norwa7491 Trondheim, Norway.
E-mail address: [email protected] (E. Larsen).
0277-3791/$ e see front matter � 2013 Elsevier Ltd.http://dx.doi.org/10.1016/j.quascirev.2013.02.018
Please cite this article in press as: Larsen, E.geometries during the Last Glacial Mj.quascirev.2013.02.018
a b s t r a c t
Investigations in sections along the rivers Severnaya Dvina and Vaga, and morphological mapping basedon a new digital elevation model and Landsat imagery, allow for a reinterpretation of the extent of theScandinavian Ice Sheet during the Last Glacial Maximum (LGM). The reconstruction provides amuch better link between stratigraphical and morphological expression of glaciation than previousproposals. Most striking is the configuration of long, low-gradient ice-lobes (ice-streams) extending forsome 300e400 km up the wide and smooth river valleys. Their extremely low surface gradients areevidenced by glacial trimlines that formed along the sides of the ice-lobes in contact with the gentlevalley slopes. In the main valleys, end moraines marking terminal positions are present, whereasdrumlins are rare in the peripheral areas of the ice sheet but found in some tributary valleys at somewhathigher elevations. Large drumlin fields, however, are found farther up-ice. The glacial sediment suc-cession is composed of waterlain sediments and tills. The sediments provide evidence of distal icedamming, glacier overriding and retreat, and finally distally glaciolacustrine sedimentation and lakedrainage. The diamicton unit associated with the LGM shows evidence of basal coupling, although morestriking is the abundant evidence for iceebed decoupling. These include in situ waterlain sedimentswithin tills, and clastic sills running along the till/substrate contact showing lift-off. These featuresindicate that the weight of the glacier lobes was, to a large extent, carried by pore-water pressure insubglacial sediments, and that subglacial shear and erosion were moderate. Thus, fast ice flow in thelobes is envisaged. The balance between glacier weight and pore-water pressure was probably main-tained over time by the buoyancy effect of glaciers advancing into proglacial lakes. Subglacial lakes mayhave formed by capture of proglacial lakes during glacial advance. The combination of low-gradient iceand decoupled beds indicate that glacier advance and extent was largely controlled by lake levels andtopographic thresholds. This is taken to indicate that steeper-gradient ice much farther upstream wasproviding the gravitational push. A presumably abrupt change in ice-surface profile is supported by themapped distribution of glacial bedforms. The model presented herein potentially has wide applicabilityfor large parts of northern Russia as the topographic setting and glacier advance in lakes across fine-grained low-permeable sediments provide very similar conditions.
� 2013 Elsevier Ltd. All rights reserved.
1. Introduction
During recent years there has been substantial progress in un-derstanding the Weichselian ice-sheet history of northern Russia
y, P.O. Box 6315 Sluppen, NO-
All rights reserved.
, et al., Subglacial sediment, paximum in NW Russia,
(e.g. Svendsen et al., 2004; Larsen et al., 2006a) and associated ice-dammed lakes (e.g. Mangerud et al., 2004; Lyså et al., 2011).Despite this, there are still unsolved issues in terms of glacial andlake history. Even reconstructions of ice-sheet distribution and theirproglacial lakes belonging to the Last Glacial Maximum (LGM), fromwhich there is relatively good stratigraphical and morphologicalcontrol, are hampered with uncertainty. In the Arkhangelsk regionof NW Russia (Fig. 1), this is expressed as widely different in-terpretations of the LGM extent of the ice sheet (e.g. Krasnov, 1974;
roglacial lake-level and topographic controls on ice extent and lobeQuaternary Science Reviews (2013), http://dx.doi.org/10.1016/

Fig. 1. Map showing the study area. Areas covered by Figs. 2 and 3 are framed.
Fig. 2. Map showing locations of the four river sections described in the text, and their lpositions of the Scandinavian Ice Sheet.
E. Larsen et al. / Quaternary Science Reviews xxx (2013) 1e192
Please cite this article in press as: Larsen, E., et al., Subglacial sediment, pgeometries during the Last Glacial Maximum in NW Russia,j.quascirev.2013.02.018
Larsen et al., 1999; Lavrov and Potapenko, 2005; Demidov et al.,2006). The conflicting ice-sheet interpretations (Fig. 2) reflect thecomplexity of such reconstructions in a very low-relief landscape.Moreover, glaciers advanced and retreated in huge proglacial lakes(Kvasov, 1979; Astakhov, 2004, 2006; Mangerud et al., 2004;Svendsen et al., 2004; Larsen et al., 2006a; Lyså et al., 2011) leavingbehind subdued morphological expressions of their ice-marginalpositions. This paper is based on detailed studies of proglacial andsubglacial sediments deposited in the ice-marginal lakes and linkingthese with new morphological evidence of the ice-sheet extent.
The study area is south of the city of Arkhangelsk where lobes ofthe Scandinavian Ice Sheet (SIS) occupied the wide valleys of therivers Dvina and Vaga, damming large proglacial lakes during thelast glaciation (Fig. 2). The bedrock is composed of sedimentaryrocks, mainly Palaeozoic sandstones, siltstones and limestones(Geology of USSR, 1963). Generally, the bedrock is mantled byQuaternary sediments with thicknesses in the order of 20e30 m,but reaching up to 100e120 m in over-deepened valleys(Apukhtin and Krasnov, 1966) as demonstrated in boreholesthrough the present-day floodplains (Devjatova and Loseva, 1964;Biske and Devjatova, 1965; Romanova, 1977). The Quaternary de-posits consist mainly of different glacial, fluvial, lake and marine
ocations relative to four different published reconstructions of the LGM ice-marginal
roglacial lake-level and topographic controls on ice extent and lobeQuaternary Science Reviews (2013), http://dx.doi.org/10.1016/

E. Larsen et al. / Quaternary Science Reviews xxx (2013) 1e19 3
sediments, the oldest of which are of Saalian age (Larsen et al., 1999,2006a; Lyså et al., 2001; Jensen et al., 2009). Land elevations risefrom sea-level in Arkhangelsk to about 40m a.s.l. on the river Dvinaat Kotlas and to about 43 m a.s.l. on the river Vaga near Pasva(Figs. 2 and 3), i.e. over a distance of more than 300 km. The sub-dued topography is interrupted by previously mapped, gentle, end-moraine zones (Yakovlev, 1932; Apukhtin and Krasnov, 1966;Legkova, 1967; Atlasov et al., 1978). Recently, more end morainezones have been mapped in the area (Fredin et al., 2012; Fig. 3).
This study focuses on providing a new and improved recon-struction of the extent of the SIS during the LGM in NW Russia. Itwas made possible by integrating previous stratigraphical data(Larsen et al., 1999; Demidov et al., 2006; Lyså et al., 2011) andmapped end moraines (Fredin et al., 2012) with new sedimento-logical andmorphological data, testifying to ice advance and retreatin the proglacial lakes. The latter required a level of detail con-cerning descriptions of LGM sedimentary units hitherto not pre-sented in other papers (Larsen et al., 2006a; Lyså et al., 2011), and
Fig. 3. Glacial morphological features mapped using digital elevation model data with 90 mof 15 m. End moraines are from Fredin et al. (2012). Glacial features mapped in the Kola P(stippled) ends 50 km to the SE of the map boundary.
Please cite this article in press as: Larsen, E., et al., Subglacial sediment, pgeometries during the Last Glacial Maximum in NW Russia,j.quascirev.2013.02.018
new mapping of subglacial and ice-marginal features. A secondobjective is to develop an improved understanding of subglacialand ice-marginal conditions for the lobes advancing and retreatingin lake basins. Both main goals are necessary steps in order toprovide a deeper understanding of the flow mechanisms involvedfor these types of ice lobes. The LGM ice-dammed lake recon-struction presented herein is considered more accurate than that ofLyså et al. (2011) as the ice margins have changed. However, lakesare only dealt within terms of ice advance, extent and retreat, andare not studied in their own right.
2. Methods
Morphologically distinct end moraines (Fredin et al., 2012),trimlines and drumlins were mapped through on-screen digitisa-tion using digital elevation data (DEM) with 90 m resolution andLandsat TM/ETMþ optical remote-sensing data with a spatial res-olution of 15 m. The DEM consists of Shuttle Radar Topography
resolution and Landsat TM/ETMþ optical remote sensing data with a spatial resolutioneninsula (Hättestrand and Clark, 2006), has not been included. The profile in Fig. 12
roglacial lake-level and topographic controls on ice extent and lobeQuaternary Science Reviews (2013), http://dx.doi.org/10.1016/

E. Larsen et al. / Quaternary Science Reviews xxx (2013) 1e194
Mission (SRTM) digital elevation data (NASA, 2012) south of 60�N,merged in a mosaic with digitised Russian topographic maps atscale 1:100,000 north of 60�N. The digitised Russian topographicmaps were sampled to the same grid resolution and quality as theSRTM data (de Ferranti, 2012). Care was taken to avoid artificial sunangle and azimuth bias when mapping from the elevation model(Smith and Clark, 2005; Smith andWise, 2007), and optical remote-sensing imagery was used to cross-check the interpretation.However, the satellite imagery was at times difficult to interpretdue to land-use patterns, permafrost disintegration and denseforest. Grid resolution of both the DEM and the optical remote-sensing data allows only for detection and mapping of regional-scale glacial landforms, and, in the case of end moraines, theminimum size is in the order of a few hundred metres wide and afew kilometres in length. We thus argue that the dataset is robuston a regional scale but acknowledge that the data resolution is toosparse for detailed geomorphological mapping.
Lithostratigraphical investigations were performed in riversections, and documented through sedimentological logs, sketchesand photos. Altitudes, given in metres a.s.l., were measured withhand levelling and an altimeter using the known river levels asreferences. An accuracy of �1 m is assumed; however, the differ-ence between low and maximum river flood levels may be as muchas 7e8 m (Panin et al., 1999).
Fabric analyses were performed on 25 clasts in diamict sedi-ments, using 0.6e6 cm-long clasts with an a/b ratio �1.5 (Benn,2004). Individual measurements are plotted in lower-hemispherestereographic projections whereby azimuth and dip data are rep-resented as points on a circular net. Specification of the S1, S3-ei-genvalues and V1-eigenvectors are according to Mark (1973) andWoodcock and Naylor (1983). Clast fabrics are considered to have astatistically preferred orientation if the S1 and S3 eigenvalues are�0.52 and �0.17, respectively (Mark, 1973, 1974).
Absolute ages were obtained by means of radiocarbon andluminescence dates. The material for dating was retrieved fromsediments in river sections either below or above till beds, and fromlacustrine sediments genetically associated with a glacial event(Tables 1 and 2). One radiocarbon date was obtained by acceleratormass spectrometry (AMS) at Lund University, Sweden (Table 1). TheCalPal-2007-Hulu curve was used for calibration. This is extendedfor ages beyond the Lateglacial (Hughen et al., 2006). OpticalStimulated Luminescence (OSL) dates on sorted sediments weremade at the Nordic Laboratory for Luminescence Dating, Risø,Denmark (Table 2). All ages are corrected for sediment burial depth,and for water content saturation over the entire burial time(Thomas et al., 2006). Six out of fourteen OSL dates have beenpublished previously (Larsen et al., 1999; Lyså et al., 2011). Two ofthese, from Larsen et al. (1999) were corrected for burial depth inorder tomake them comparable with the rest of the dates (Table 2).The methodology is further described in Thomas et al. (2006).
Reconstruction of the LGM phase glaciation involved 1) mergingof trimlines and drumlins mapped herein with the end morainesmapped by Fredin et al. (2012), 2) applying the sedimentologicaland stratigraphical data to evaluate which ice-marginal featureswere considered to represent the LGM glaciation, and 3) hand-drawing the ice margins by linking these moraines and trimlines.
Table 1Radiocarbon date from Ust Kanza (Fig. 5) with one standard deviation. The CalPal-2007
Lab. ref. Samplecode
Site Dated material Dr
LuS 7845 06-259 06024-10(Ust Kanza)
Indifferent,moss fibres
>2
Please cite this article in press as: Larsen, E., et al., Subglacial sediment, pgeometries during the Last Glacial Maximum in NW Russia,j.quascirev.2013.02.018
3. Results
3.1. Morphological evidence of glacier extent
Distinct ice-marginal moraines, several previously unknown,have been mapped over vast areas of Russia using the new digitalelevationmodel combinedwith optical remote sensing data (Fredinet al., 2012). In the Dvina e Vologda area of NW Russia, end mo-raines detected by this mapping occur across a region wheremultiple interpretations of the LGM ice extent had been proposed(Fig. 2). This prompted us to focus on this region in more detail andexpand on the features provided by Fredin et al. (2012). The resultsof this mapping are shown in Fig. 3.
Major end-moraine zones have been mapped in all the valleyfloors of the Vologda, Severnaya Dvina, Vychegda and Vaga rivers,and the Kuloi and Pinega areas, in some places at different positionsalong the valleys (Fig. 3; Fredin et al., 2012). The valley floor mo-raines are all similar in morphology with arcuate shapes in planview and asymmetric cross-profiles with slightly gentler proximalthan distal slopes. The moraines are commonly 0.5e2 km wide,several kilometres long, and up to 30e50 m high above the valleyfloor. Due to these dimensions, their topography appears subdued.Nevertheless, all mapped valley floor moraines appear distinct, areeasily identified in the remote-sensing data and are not signifi-cantly degraded through fluvial incision.
The shoulders of the major river valleys are only 100e200 mabove the valley floor. The valley sides appear truncated andsharply demarcated (Fig. 4). The river valleys appear smooth,with little fluvial imprint apart from themajor river, and are drapedwith sediments. Above the valley sides, the landscape appearsheavily incised with local highs reflecting a strong fluvial imprint(Fig. 4). We interpret this demarcation between landscapes asreflecting the influence of glacier ice filling the valleys and erodingvalley sides. However, some of the highland areas between the rivervalleys also appear organised into linear elements and could beinterpreted as ice-marginal deposits, although quite degradedthrough fluvial incision (Fig. 4).
In the eastern part of the study area there are few mappedsubglacial landforms, and only linear elements interpreted asdrumlins are recorded at higher ground compared with the mainvalleys (Figs. 3 and 4). Previous studies in this area based on remotesensing and field mapping have also reported little evidence ofsubglacial landforms (Punkari, 1995; Lavrov and Potapenko, 2005).This might be explained by the limited resolution in the datasets.However, the findings in the tributary valleys and along valley sides(Fig. 4) demonstrate that landforms large enough to be recorded dooccur. Alternatively, the lack of such landforms in the main valleysmight be explained by draping by younger sediments. However,where Lateglacial till has been recorded, the overburden is nor-mally only in the order of some 2e5 m (Larsen et al., 1999; Lunkkaet al., 2001). Thus, we conclude that subglacial landforms are sparsein the eastern areas (Fig. 4). In the western areas, subglacial land-forms are very common as is evident from ourmapping (Fig. 3). Therecorded drumlins are often tens of kilometres long and hundredsof metres wide facilitating detection in the remote sensing data.The drumlins are organised in sinusoid, fan shaped flow sets
curve was used for calibration (Hughen et al., 2006).
y weight 14C age(a BP)
Calibrated age(cal. a BP)
Stratigraphicposition
0 mg 15290 � 140 18392 � 301 Above LGM till
roglacial lake-level and topographic controls on ice extent and lobeQuaternary Science Reviews (2013), http://dx.doi.org/10.1016/

Table 2Optically Stimulated Luminescence (OSL) dates from Ust Kanza (Fig. 5), Smotrakovka (Fig. 9; Larsen et al., 1999; in this paper corrected for burial depth), and Ljabla (Fig. 8; Lysået al., 2011). All dates are corrected for burial depth and water content.
Lab. No. Sampleno.
Site no. Site name Burialdepth (cm)
Age (ka) Dose (Gy) (n) Dose rate(Gy/ka)
w.c. (%) Stratigraphicposition
Reference
06 38 45 06-255 06024 Ust Kanza 320 17.0 � 1.0 20.1 � 0.6 18 1.18 � 0.05 26 Above LGM till 1)06 38 46 06-256 06024 Ust Kanza 290 14.5 � 0.8 22.9 � 0.6 21 1.58 � 0.06 25 Above LGM till 1)06 38 47 06-257 06024 Ust Kanza 200 16.5 � 1.0 15.2 � 0.4 16 0.92 � 0.04 21 Above LGM till 1)06 38 48 06-258 06024 Ust Kanza 70 15.7 � 0.9 24.1 � 0.8 29 1.53 � 0.06 25 Above LGM till 1)06 38 49 06-261 06024 Ust Kanza 490 17.9 � 1.1 22.2 � 0.8 15 1.24 � 0.05 21 Above LGM till 1)06 38 50 06-262 06024 Ust Kanza 470 18.9 � 1.0 21.4 � 0.5 29 1.13 � 0.05 21 Above LGM till 1)08 38 26 07-128 07005 Smotrakovka 385 16.5 � 1.3 15.5 � 0.4 24 0.94 � 0.07 20 Below LGM till 1)08 38 27 07-129 07005 Smotrakovka 430 16.8 � 1.3 17.0 � 0.4 37 1.02 � 0.07 19 Below LGM till 1)96 38 07 96030 9614/08002 Smotrakovka 540 17.8 � 1.3 19.4 � 1.0 6 1.09 � 0.05 25 Below LGM till 2)96 38 08 96031 9614/08002 Smotrakovka 550 20.6 � 1.6 18.9 � 0.9 6 0.92 � 0.05 25 Below LGM till 2)06 38 56 06-271 06026 Ljabla 430 20.9 � 1.4 23.6 � 1.0 15 1.13 � 0.05 20 Upper lake sequence 3)06 38 57 06-272 06026 Ljabla 460 21 � 2 21.8 � 1.2 15 1.05 � 0.05 17 Upper lake sequence 3)06 38 54 06-267 06026 Ljabla 430 64 � 6 47 � 2 24 0.73 � 0.06 25 Lower lake sequence 3)06 38 55 06-268 06026 Ljabla 370 57 � 4 49 � 2 22 0.87 � 0.04 24 Lower lake sequence 3)
1) This paper.2) From Larsen et al. (1999, 2006a). Here corrected for burial depth.3) From Lyså et al. (2011).
E. Larsen et al. / Quaternary Science Reviews xxx (2013) 1e19 5
showing ice flow largely towards the southeast and thus resemblethe subglacial landform patterns associated with palaeo-icestreams (Stokes and Clark, 2001). There is a striking eastern limitto much of the south-east oriented drumlin sets along the south-western perimeter of the White Sea. Some morphologicallydegraded south-west oriented drumlins occur in this area and maybe remnants of older Barents Sea based glaciations (Fig. 3). It ap-pears as if LGM and Lateglacial subglacial flow regime changes justwest of or in the White Sea region.
3.2. Sediment evidence of glacial advance and retreat in lakes
It has long been known that former glacier advances in NWRussia were into large proglacial lakes (e.g. Kvasov, 1979). In theSevernaya Dvina and Vaga river valleys, the SIS advancing from thenorthwest dammed large, shallow lakes (e.g. Lavrov andPotapenko, 2005; Lyså et al., 2011). It is implicit from the re-constructions of ice extent that the lobes entering these valleyswere thin and had low gradients (Krasnov, 1974; Larsen et al., 1999;Lavrov and Potapenko, 2005; Demidov et al., 2006). At the sitesdescribed below, the focus is on sediments documenting glacieradvance and retreat in lakes during the LGM phase. Furtherstratigraphical descriptions are only briefly included to put the sitein perspective or to set the present investigation apart from otherstudies based on material from the same site.
3.2.1. TolokonkaThe Tolokonka site is located on the river Dvina about 180 km
upstream from its confluence with Vaga (Fig. 2). It is a 20e30 m-high and 4 km-long section on the right river bank, representinga small window into a sediment body that fills a large part of thevalley (Fig. 5D). Parts of the section are shown in Fig. 5B and C. Thesouthwestern two kilometres of the profile are poorly exposed.Distances along the section are measured from its southwesternend (0-point at UTM 38W 525972 6846573). The focus herein is ona diamicton and associated features occurring in the middle toupper part of the section (Fig. 5C). This is in contrast to a regionalstudy of Eemian to Holocene stratigraphy (Lyså et al., unpublished)where little detail of this diamicton and its implications is included.Thus, only a brief summary of the results from the entire section isgiven below before focussing on the diamicton.
Above Eemian floodplain deposits present at river level, there isa hiatus to Middle Weichselian, fluvial-channel sediments showing
Please cite this article in press as: Larsen, E., et al., Subglacial sediment, pgeometries during the Last Glacial Maximum in NW Russia,j.quascirev.2013.02.018
the drainage directions as of today. These are followed upwards bydeltaic sediments deposited towards the SSE-SSW in the so-calledWhite Sea Lake (Fig. 5C) dammed by coalescing Barents andScandinavian ice sheets (Larsen et al., 2006a). A hiatus representingsome 50,000 years separates these Middle Weichselian beds fromLate Weichselian sediments above (Fig. 5C). The Late Weichselianbeds comprise both diamictic material and associated, fine-grained,sorted sediments deposited in an ice-dammed lake.
The diamicton extends for almost 2 km along the profile in itsnorthern part (Fig. 5A and C). It is found c 20 m above river level tothe south where it tapers out, and dips down to about 10 m aboveriver level to the north. The base of the diamicton is complex.Directly underlying the diamicton, a 5e20 cm-thick, rippled, troughcross-bedded and planar-laminated, medium to coarse sand (Fig. 6,unit P) has an erosional contact to the White Sea Lake sedimentsbelow (Figs. 5 and 6, unit L). At all sites where the flow directionduring deposition could be established from this thin sand body, itwas towards the east. This is opposite to the present-day, westwardfluvial drainage direction and perpendicular to the White Sea Lakedelta foresets. The upper boundary of this thin sand bed to thediamicton is in places sharp and erosive (Fig. 6C), whereas in otherplaces a 2e4 cm-thick tectonised sand layer separates the primarysand from the diamicton (Fig. 6B). Small-scale folds, dragged-outsand and thrust structures have also been observed along thelower diamicton boundary in other places (Fig. 6D and E). In a 5e10 cm-thick interval in the upper part of the sand, mud stringersare both draping and penetrating through bedforms (Fig. 6C, E andF). Such stringers are never found cutting through the underlyingerosional boundary and into the White Sea Lake foresets. In someplaces the sand is capped by an up to 5 cm-thick mud horizonforming a transition between the sand and the diamicton (Fig. 6C, Eand F). The mudediamicton boundary is in most cases sharp. Awedge of diamicton containing crystalline clasts cuts through thislower transitional zone and into the underlying White Sea Lakedeltaic beds (Fig. 6F). The wedge is about 20 cmwide at the base ofthe diamicton and penetrates down more than 50 cm, dipping to-wards the south. The diamicton is usually between 0.5 and 1.0 mthick, reaching a maximum thickness of 1.4 m (Fig. 5). It is compactwith a bluish-grey colour and has a matrix dominated by silt andclay. Sand and gravel clasts are common. Pebbles occur sporadi-cally, and some are striated with secondary cracked surfaces. Thediamicton appears massive in some zones, but lenses, stretched outlaminae and rafts of sand are quite common, some with primary
roglacial lake-level and topographic controls on ice extent and lobeQuaternary Science Reviews (2013), http://dx.doi.org/10.1016/

Fig.
4.Digital
elev
ationmod
elda
taview
edob
lique
lyacross
theVyche
gda,Dvina
andVag
ava
lleys
withad
joiningup
land
s.So
meloba
teen
dmoraine
s,trim
lines
anddrum
linsaremarke
d.Max
imum
valle
yfloo
rto
upland
relie
fis18
0m.
Verticalex
agge
ration
is70
times.
E. Larsen et al. / Quaternary Science Reviews xxx (2013) 1e196
Please cite this article in press as: Larsen, E., et al., Subglacial sediment, proglacial lake-level and topographic controls on ice extent and lobegeometries during the Last Glacial Maximum in NW Russia, Quaternary Science Reviews (2013), http://dx.doi.org/10.1016/j.quascirev.2013.02.018

Fig. 5. Features associated with the Late Weichselian diamicton at Tolokonka. A) Detailed information is from eleven sites between 2.25 and 3.82 m from the SE part of the section. B and C) Photo and simplified sketch of the upperc 15 m of the section in the area where the diamicton is found. D) Digital elevation model showing the morphology where the Tolokonka section is situated, and the morphology of a tributary valley with drumlins formed at theshoulder to the main valley (cf. Fig. 4). AeA0eA00 is a topographic profile along the lateral moraine of the tributary lobe and across the main valley.
E.Larsenet
al./Quaternary
ScienceReview
sxxx
(2013)1e19
7
Pleasecite
thisarticle
inpress
as:Larsen,E.,et
al.,Subglacialsediment,proglaciallake-leveland
topographiccontrols
onice
extentand
lobegeom
etriesduring
theLast
Glacial
Maxim
umin
NW
Russia,Quaternary
ScienceReview
s(2013),
http://dx.doi.org/10.1016/j.quascirev.2013.02.018

E. Larsen et al. / Quaternary Science Reviews xxx (2013) 1e198
Please cite this article in press as: Larsen, E., et al., Subglacial sediment, proglacial lake-level and topographic controls on ice extent and lobegeometries during the Last Glacial Maximum in NW Russia, Quaternary Science Reviews (2013), http://dx.doi.org/10.1016/j.quascirev.2013.02.018

E. Larsen et al. / Quaternary Science Reviews xxx (2013) 1e19 9
depositional structures preserved (Fig. 6A and D). A c 1e2 cm-thickhorizontal zone of sorted sand and silt occurs at many sites alongthe section, separating it into two parts (Figs. 5 and 6A). In thesouthern part of the section, where the diamicton tapers out, itappears as diamict intraclasts in sand (Fig. 6G). The upper transi-tional boundary of the diamicton into the overlying sand is highlyvariable, commonly a complex mixture of intercalated diamict andsand (Fig. 6A, B and G).
The diamicton is interpreted as having been deposited partlysubglacially by grounded ice and partly subaqueously in associationwith the ice. The lower erosive boundary, thrust structures andthe diamicton wedge interpreted as a till wedge, are indicative oficeebed coupling causing entrainment and deformation duringglacial overriding (Dreimanis, 1988; Hart and Boulton, 1991; Kjæret al., 2003). At other places along the profile, however, the pres-ence of slump structures may indicate that the diamicton wasdeposited in close association with the ice, but not directly bygrounded ice (Fig. 5). Lenses and rafts of sub-till material and stri-ated clasts in the diamicton are evidence of iceebed coupling, butunless proven otherwise, entrainment might have occurred far up-stream. Evidence for iceebed decoupling includes the sub-till mudstringers and themud horizon forming the transition between sandand till, both interpreted as clastic sills formed subglacially (Larsenand Mangerud, 1992; Kjær et al., 2006). These are thought to haveformed as injections of fines parallel to the iceebed interface, whenpore-water pressure in sub-ice sediments was high enough to carrythe loadof the overriding ice and cause basal decoupling (Larsen andMangerud, 1992; Kjær et al., 2006). Also, the sorted sedimentsappearing as long stringers within the till bed (Fig. 6A) may beindicative of iceebed decoupling as described by Piotrowski et al.(2004, 2006). Thus, depending on location along the profile, thereis evidence for both coupled and decoupled iceebed conditions(Fig. 5). Permafrost conditions prior to the LGM(Larsenet al., 2006a),most likely made the White Sea Lake sediments act as an imper-meable (frozen) layer, thus explaining why clastic sills are confinedto the thin sand above. At one site (Fig. 6E and F), a sill is both cut byatill wedge and thrusted glaciotectonically, showing that the iceebedinterface changed from decoupled to coupled. The thin, rippled andcross-bedded, sand layer beneath the till was deposited by currentswith a palaeo-flow direction opposite to that of the present-dayriver. This layer is interpreted as having been deposited when icewas damming to thenorth,most likely just prior to overriding by theglacier. As this thin sand layer is found at all sites investigated alongthe profile (Fig. 5), erosion by the overriding ice was probablylimited. This is consistent with the occurrences of sills indicatingthat the ice was supported by pressurised pore water, and only oc-casionally touched the bed and eroded the substratum. The inclinedsurfacewith till on top in the southernhalf of the profile cuts into thebedding in the underlying sediments (Fig. 5C). This erosionprobablyoccurred in the still soft sediments during the drainage of theWhiteSea Lake, leaving this sediment body as a huge erosional remnant inthe valley (Fig. 5D). Thus, it is inferred that the till is draping theunderlying topography, an inference supported by the observationof a subglacial sill at the northernmost and lowest-lying site, indi-cating that the till was deposited by non-eroding ice (Fig. 5). Someresedimentation has occurred along this slope, however, as
Fig. 6. Features associated with the diamicton at Tolokonka. A) Preglacial lacustrine sandslumped deglacial beds at 2.98 km from the 0-point. B) Site at 2.88 km showing preglacia(arrows), diamicton (left), downward-directed injections (right), and slumping. C) Preglacialtransitional, brown fines with a sharp boundary to till at 3.82 km. D) Diamicton at 2.39 kmwalong the base towards proglacial sand (arrows). E) Diamicton at 2.40 km (upper left) abovesand. F) Diamicton at 2.40 km over preglacial sand separated by sills (brown strings). The lattoverlain by a thin diamicton at 2.25 km close to where it pinches out to the south. (For inteweb version of this article.)
Please cite this article in press as: Larsen, E., et al., Subglacial sediment, pgeometries during the Last Glacial Maximum in NW Russia,j.quascirev.2013.02.018
indicated by sedimentary structures and the low S1 value from oneof the sites (Fig. 5).
3.2.2. Ust KanzaThe Ust Kanza section is located on the left bank of the river
Dvina. It extends for some 150 m on either side of the point wherethe small river Kanza enters the Dvina (Fig. 2; UTM: 38W 5625446817640). We investigated two sites in this section, one 10 m to thenorth of the river junction (Fig. 7A), and one 120 m to the south ofthe junction (Fig. 6B).
A lower gravel and sand with an erosive boundary at the base ofthe overlying diamicton is only exposed at the southern site (Fig. 7Band C). At both sites there is a firm, massive, fine-grained andmatrix-supported diamicton (Fig. 7). It has a moderate clast con-tent, but contains crystalline clasts up to boulder size. The upperboundary is erosional with a gravel lag to sandy sediments at onesite (Fig. 7A), and a more gradational boundary with dipping layersof interfingering diamicton and sandy sediments at the other site(Fig. 7B and D). At the latter site, this continues upwards into finelylaminated silt and fine to very fine sand with undulating primarybedding in the upper part. Above c 51 m a.s.l. there is a transition to2e3 cm-thick sets composed of rippled silt alternating with mm-scale, thick, laminated silt to clay (Fig. 7B). The sand has no coun-terpart at the northern end of the profile where a 4 m-thick unit ofrippled and laminated silt is found above the diamicton (Fig. 7A andB). Thus, it may well be that a sandy unit above the diamicton hasbeen eroded away. Upwards, the rippled and laminated siltcoarsens into laminated silt and sand. Farther up, sandy faciesdominate, partly horizontal and partly cross-bedded. A commonfeature in the entire fine-grained unit is that many ripples containmud drapes. Double mud drapes were observed in the cross-bedded sand in the upper part of the unit. Two OSL samples fromthe sandy unit at the southern site were dated to 18.9 and 17.9 ka(Fig. 7B, Table 2), whereas four OSL and one radiocarbon samplefrom the other site gave ages between c 17 and 14 ka (Fig. 7A,Tables 1 and 2).
The diamicton is interpreted as a basal till. The erosive lowerboundary and the fine-grained matrix is related to subglacialoverriding, entrainment and deformation by a glacier (Dreimanis,1988; Hart and Boulton, 1991; Kjær et al., 2003). The southern-most of the two sites (Fig. 7B) shows a gradual transition towaterlain sediments, interpreted to have resulted fromdeglaciationinto an ice-dammed lake. The two OSL ages of 19e18 ka (Fig. 7B),and all dates at the other site (Fig. 7A), support a Late Weichselianage for this lake. Thus, it is evident that these sediments weredeposited in an ice-dammed lake during retreat from the LGMposition. Ust Kanza is the southernmost site in the Dvina valleywhere the presence of a Late Weichselian till can be demonstrated.
3.2.3. LjablaThe Ljabla section is about 10 m high and less than 50 m in
length, located by the river Ljabla which is a small tributary to theSevernaya Dvina (Fig. 2; UTM: 38W 540082 6817077). The fullstratigraphy of the sectionwas described by Lyså et al. (2011). Here,only the middle to upper parts relevant for the present investiga-tion is discussed.
(L), proglacial sand (P), diamicton (bluish) with sorted sand-silt layer (arrows), andl lacustrine sand (L), proglacial sand (P) showing reversed drainage, thin shear zonesand (L), proglacial coarse sand (P) showing reversed drainage, clastic sill (arrows) andith lenses and rafts of underlying sand. Small-scale glacitectonic deformation structuresproglacial sand (P) with sills (arrows). Thrust contact between proglacial and lacustrineer two are both cut by a diamicton wedge. G) Proglacial sand with diamicton intraclastsrpretation of the references to colour in this figure legend, the reader is referred to the
roglacial lake-level and topographic controls on ice extent and lobeQuaternary Science Reviews (2013), http://dx.doi.org/10.1016/

Fig. 7. A and B) Sedimentological logs from the northern and southern parts of the Ust Kanza profile. C) Lower erosive diamicton boundary (log B) and D) upper transitionaldiamicton boundary (log B). See Fig. 2 for location.
E. Larsen et al. / Quaternary Science Reviews xxx (2013) 1e1910
Above the Middle Weichselian White Sea Lake sediments, bedsof fine to medium sand alternating with silty sand erosively overliegravelly sand (Fig. 8; Lyså et al., 2011). The beds dip at 12e15� andgravelly sediments from below are found slumped and intermixedinto the beds (Fig. 8B). Two OSL samples yielded ages of 21 � 2 and20.9 � 1.4 ka (Fig. 8; Lyså et al., 2011). Upon a loaded boundary,massive silt coarsens upwards to stratified sand. The section istopped by more than 2 m of finely laminated clayey silt with anupward-increasing clay content. The lower boundary is erosive(Fig. 8C).
Stratification in the lower LGM sand (Fig. 8) has been suggestedto represent gravity-driven flows on a sloping surface (Lyså et al.,2011). The subsequent deposition of fines is characterised by in-ternal slump and load structures and supports the notion of rapidsubaqueous sedimentation. The OSL ages from this sediment mayindicate that it was deposited distally to the advancing glacier (cf.Larsen et al., 2006a; Lyså et al., 2011). The fine, laminated, clayey silton top indicates a quiet lake sedimentation in an ice-distal position.There is no direct evidence of ice overriding this site during LGMtime.
Please cite this article in press as: Larsen, E., et al., Subglacial sediment, pgeometries during the Last Glacial Maximum in NW Russia,j.quascirev.2013.02.018
3.2.4. SmotrakovkaThe Smotrakovka sections are situated on the right bank of the
river Vaga (Fig. 2). Section 07005 is about 800 m long, and up to30 m high. Some 1.4 km upstream, there is also a shorter section(site 08002). Distances along the sections are measured from theirnortheastern ends (0-point site 07005 at UTM 38W 4023806904019, site 08002 at UTM 38W 402176 9018337).
This study focuses on the upper part of the Smotrakovkasequence containing subaqueously and subglacially depositedglacigenic sediments relating to the LGM phase (Fig. 9AeJ). Thepre-LGM stratigraphy (Fig. 8K) will be presented elsewhere (Lysået al., unpublished). Results from the shorter section (site 08002)have been presented earlier (Larsen et al., 1999; Lyså et al., 2001),but more information is added here (Fig. 9J). The entire sequenceis composed of fluvial sediments overlain by glacigenic sediments(Fig. 9K; Larsen et al., 1999). Palaeocurrent flow directions aresimilar to the present-day fluvial drainage direction, except for theuppermost part where the drainage directions were found to bethe opposite to this (Fig. 9F and J; Larsen et al., 1999; Lyså et al.,2001).
roglacial lake-level and topographic controls on ice extent and lobeQuaternary Science Reviews (2013), http://dx.doi.org/10.1016/

Fig. 8. A) Sedimentological log from the Ljabla section. B) Waterlain sediments showing slumping and intermixing with underlying gravelly unit. C) Fine to medium sand witherosive contact to laminated silt and clay. See Figs. 2 and 7 for location and legend, respectively.
E. Larsen et al. / Quaternary Science Reviews xxx (2013) 1e19 11
The glacigenic succession comprises an up to 5m-thick complexof diamictons to fine-grained sediments. Overall, there is a tri-partition into lower bedded, middle dominantly diamict, and upperbedded/laminated sediments (Figs. 9 and 10A). The lower succes-sion starts with one or more diamictons that may be massive,stratified or with planar-laminated, fine-grained sediments (Fig. 9).The lower boundary to fluvial sand is in places sharp and erosive, inother places sharp and loaded (Fig.10B and C) or conformable to thebedding beneath. Also present is a fine-grained, laminated transi-tion to diamictons (Fig. 9B, D, G, I, J and 10B). In the lower part of thesuccession, the diamictons are often thin, and interbedded withfine-grained sediments containing dropstones (Fig.10D), intraclastsand slump structures. Typically, such zones are found folded andthrusted under more massive and thicker diamicton(s) normallybelonging to the middle part of the glacigenic succession (Fig. 10E).Large lenses or rafts of sand are common within the lower dia-mictons and the frequent occurrence of thinner, stretched-out
Please cite this article in press as: Larsen, E., et al., Subglacial sediment, pgeometries during the Last Glacial Maximum in NW Russia,j.quascirev.2013.02.018
lenses in the diamicton gives it a stratified character (Fig. 10C).Stretched-out lenses in diamictons indicate a compressive stressdirected towards the SE (Fig. 10A and F). The diamictons are fine-grained with a matrix commonly in the mud to sand range. How-ever, crystalline clasts up to boulder size are found, many withstriations (Fig. 10B).
A thicker, more massive and laterally persistent diamicton oc-curs in the middle part of the succession with a sharp and some-times erosional lower boundary (Fig. 9). Striated clasts arecommon. Although the diamicton is generally more massive in themiddle part, lenses of sand are quite common (Fig. 10F).
Towards the transition to the uppermost laminated sediments,the middle diamict unit becomes stratified. The beds appear aswedges with trough or lenticular shapes, and with a lateral extentof more than 100 m. The matrix in these beds lacks the finestfractions. Clasts, from the coarsest sand grains up to cobbles, areenriched along horizons as debris bands or as upwards fining
roglacial lake-level and topographic controls on ice extent and lobeQuaternary Science Reviews (2013), http://dx.doi.org/10.1016/

Fig. 9. AeJ) Sedimentological logs covering the upper parts of the Smotrakovka section from the top of the fluvial sediments and through glaciogenic sediments of the LGM. Nine of the logs are distributed along a section (07005)investigated in 2007 and 2008. The tenth log (08002) is from a section c one kilometre upstream from 07005. This section was first investigated by us in 1996 (Larsen et al., 1999), and revisited in 2008. The two luminescence dates andthe middle fabric plot are from the previous study. The luminescence dates have since then been corrected for burial depth. K) Site 07005, around 160 m showing Early to Middle Weichselian fluvial sediments overlain by theglaciogenic succession.
E.Larsenet
al./Quaternary
ScienceReview
sxxx
(2013)1e19
12Pleasecite
thisarticle
inpress
as:Larsen,E.,et
al.,Subglacialsediment,proglaciallake-leveland
topographiccontrols
onice
extentand
lobegeom
etriesduring
theLast
Glacial
Maxim
umin
NW
Russia,Quaternary
ScienceReview
s(2013),
http://dx.doi.org/10.1016/j.quascirev.2013.02.018

E. Larsen et al. / Quaternary Science Reviews xxx (2013) 1e19 13
horizons forming the base of the beds (Fig. 10G and H). The up-permost sediment is composed mainly of silt to fine sand withlaminae organised as couplets. This sediment is draping the dia-micton surface.
The graded diamicton beds and the fine-grained sediments inthe lower and upper parts of the succession (Fig. 9) are interpretedas subaqueous debris-flow and suspension-settling sedimentsdeposited in front of a glacier advancing (lower) and subsequentlyretreating (upper) across a lake basin. The reversed drainagepattern in the underlying fluvial sediments is interpreted to be arecord of an early phase of ice-damming to the north (Fig. 9F and J).The diamicton in the middle part of the succession is interpreted asa basal till. We relate lower erosive contacts, striated pebbles,sediment intraclasts, deformation structures and the fine-grainedmatrix as being produced by subglacial overriding, entrainmentand deformation by a glacier (Dreimanis, 1988; Hart and Boulton,1991; Kjær et al., 2003). Thus, a glacier with iceebed coupling isenvisaged, but zones with sorted sediment bands within the tillmay indicate phases of iceebed decoupling (Piotrowski et al., 2004,2006). The wedge-shaped diamictons and sorted debris bandsforming a gradual transition from the till are evidence of deglaci-ation and deposition in a lake basin, with the fine-grained lami-nated sediments on top representing the most ice-distal glacialfacies (Larsen et al., 1991; Benn, 1996).
Fabric measurements were performed both in what is inter-preted as basal tills and subaqueous debris flows (Fig. 9A and J).The two till fabrics (upper in Fig. 9A, lower in Fig. 9J) show thatthe principal stress directions were towards the SE to E. The otherthree (Fig. 9A and J) are from debris flows and show stress di-rections oriented within the same sector. Out of the five fabricanalyses (Fig. 9A and J), the two from the till have both the lowestand the highest S1 values, both being within the values expectedfrom tills (Larsen and Piotrowski, 2003). The S1 values fromdebris flows are at the higher end of the scale for such deposits(Larsen and Piotrowski, 2003), and might represent slight reor-ientation during flow. The two till fabrics located almost 1.5 kmapart are interpreted as representing variations in the flow of athin ice lobe. Four OSL samples from two sites taken in fluvialsediments just below the lowest occurrence of diamictons weredated to 16.8 and 16.5, and 20.6 and 17.8 ka (Fig. 9C and J;Table 2). The latter two were obtained in fluvial sediments wherea reversed drainage direction as compared to that of the presentday could be demonstrated. Taking the dates at face value, icedamming to the north was already effective at 20.6 � 1.6 ka,whereas glacier overriding occurred after 16.5 � 1.3 ka (Fig. 9Cand J). The latter is in accordance with the results in Larsen et al.(1999; 2006a).
4. Discussion
4.1. Glacier extent during the Last Glacial Maximum
Since our first reconstruction of the extent of the SIS during theLGM in the Arkhangelsk region (Larsen et al.,1999), we have revisedour interpretations more than once (Demidov et al., 2004, 2006;Larsen et al., 2006a). Moreover, other reconstructions had beenproposed earlier (Fig. 2; Atlasov et al., 1978; Ostanin et al., 1979).Clearly, there has been difficulty in establishing the ice-sheetextent, which is perhaps best reflected in the 600e700 km differ-ence in the frontal position in the Dvina river valley in the re-constructions of Krasnov (1974) and Lavrov and Potapenko (2005)(Fig. 2). The diverse reconstructions are based on the presence orabsence of till beds assigned to the LGM and on tracing landformsthat might represent the maximum position of the ice sheet. Thisapproach is not different from that of Ramsay (1898) who drew the
Please cite this article in press as: Larsen, E., et al., Subglacial sediment, pgeometries during the Last Glacial Maximum in NW Russia,j.quascirev.2013.02.018
line for maximum post-Eemian ice cover just to the south of theconfluence between the Vaga and Dvina rivers. Up to the time ofthe latest published reconstructions, the geomorphological in-terpretations have been based on analyses of topographic andgeological maps at scales 1:100,000 and 1:200,000, satellite imagesat scales 1:500,000 and 1:1,000,000 (Zatulskaya, 1984a,b,c), and insome instances on aerial photographs of different scales.
The Tolokonka and Ust Kanza sites are both situated beyond theLGM ice margin according to most reconstructions, but within themargin as suggested by Lavrov and Potapenko (2005) (Fig. 2). Tillbeds, dating to the Late Weichselian at these sites (Figs. 5C and 7),prompted a reinterpretation of the maximum position in the area.Furthermore, new mapping has demonstrated a large number ofice-marginal features (Fredin et al., 2012). Combining these withthe mapping of drumlins and glacial trimlines (Figs. 3 and 4), andwith results from the sections argues for a revised interpretation ofthe limits of the LGM in the area (Fig. 11). In cases where more thanone mapped end moraine exists beyond the outermost recognisedLGM till bed, postglacial moraine degradation is taken into account.If degradation is the same on two possible LGM positions, the outerone is chosen, whereas the inner alternative is chosen in caseswhere this appears less degraded than the outer moraine. A keypoint of this reconstruction is the mapping and interpretations ofthe trimlines (Figs. 3 and 4). Although the gradients that appearlikely are minimum values, the fluvially dissected upland areasbetween the main valleys with no evidence of glaciations supportthe interpretation of a low-gradient ice surface.
The most striking features of the new LGM reconstruction arethe long ice lobes penetrating far up the gentle valleys and theirseemingly very low ice-surface profiles (Fig. 11). In the Sukhonariver valley we suggest that the maximum position was some150 km farther to the east as compared with the reconstruction byLunkka et al. (2001) who interpreted the LGM position to be locatedat the city of Vologda (Fig. 11). The southernmost site on the riverVaga shown to have been overrun during the LGM is Raibola, southof Smotrakovka (Larsen et al., 1999). Farther to the south, the sitesPasva and Koleshka show no evidence of ice overriding after theEemian (Larsen et al., 1999; Lyså et al., 2001). Consequently, theLGM ice margin was suggested to have been situated between thePasva/Koleshka and the Raibola/Smotrakovka areas (Fig. 2). How-ever, based on the morphological criteria described above, we nowpropose that the maximum position was to the south of all thesesites (Fig. 11). It follows from this that evidence for ice overridingmay be missing or very patchy in some sections, as is the case atTolokonka, and therefore might have been overlooked. Themaximum position for the ice lobe in the Dvina river valley isinterpreted to have been located at the valley floor moraines southof Kotlas, well beyond the Tolokonka and Ust Kanza sites with theLGM till beds (Fig.11). It is likely that the Ljabla site, being located ata higher elevation, was in amarginal position relative to the ice lobein the main valley.
4.2. Terrestrial ice streams in lakes
4.2.1. Ice-sheet configuration and bed conditionsAccording to our new reconstruction, the gradients of the ice
lobes were very low over a distance of some 200e400 km along thevalleys of the Dvina, Vaga and Sukhona rivers (Fig. 11). This couldonly have been the case if the low-gradient, peripheral part of theice sheet was gravitationally driven by steeper gradient ice fartherupstream. It also implies that the basal shear stress of the lobes wasvery low. Thus, it may be inferred that forward translation of thegravitational push was facilitated by weakly coupled to decoupledbeds which has demonstrably taken place (Fig. 5). The advancingice lobes dammed large frontal lakes due to a blocking of
roglacial lake-level and topographic controls on ice extent and lobeQuaternary Science Reviews (2013), http://dx.doi.org/10.1016/

Fig. 10. Features associated with the diamicton(s) at Smotrakovka. A: Site 07005 at 70 m showing variations from fluvial sand (light grey) below via variable diamictic and sandyfacies to laminated, glaciolacustrine on top. B: Site 08002 at 90 m showing fluvial sand (inclined bedding) with an erosional contact to diamicton or to sand with mud intraclasts(stippled), followed upwards by banded and massive diamicton with a striated clast. C: Site 07005 at 70 m. Fluvial sand via diamicton, sheared, folded and stretched-out sand intobedded diamicton with stretched-out lenses of sand. D: Site 07005 at 170 m. Dropstone below diamicton in lacustrine sediments bending into underlying laminae. E: Site 07005 at70 m. Folded and sheared sand below diamicton. F: Site 07005 at 530 m. Diamicton capped by laminated, glaciolacustrine sediments. The diamicton is partly massive, partly withlenses or bands of sorted material. Some bands have lateral extents of several tens of metres. G and H: Site 07005. Examples of diamictons organised as sub-parallel sets commonlyshowing normal grading indicated by triangle, but also reverse grading in some cases.
E. Larsen et al. / Quaternary Science Reviews xxx (2013) 1e1914
northward-flowing rivers. Consequently, glacial advance wasthrough the lakes as demonstrated by the sediment record at, e.g.,Smotrakovka (Fig. 9). The proglacial lakes may have been a sourceof heat and thus lubricated the bed of the advancing glacier with
Please cite this article in press as: Larsen, E., et al., Subglacial sediment, pgeometries during the Last Glacial Maximum in NW Russia,j.quascirev.2013.02.018
the potential to increase flow velocity and thereby lower the sur-face gradient. Possibly more important though is the suggestionthat glaciers advanced across a thin veneer of unfrozen, fine-grained sediments over perennially frozen fine-grained sediments
roglacial lake-level and topographic controls on ice extent and lobeQuaternary Science Reviews (2013), http://dx.doi.org/10.1016/

Fig. 10. (Continued)
E. Larsen et al. / Quaternary Science Reviews xxx (2013) 1e19 15
(Larsen et al., 2006a; Fig. 5C) which prohibited subglacial pore-water drainage. This, in turn, resulted in an increased pore-waterpressure, weakening bed coupling and thus promoting rapid flow(Larsen and Mangerud, 1992; Kjær et al., 2006).
Basal coupling was demonstrated at Ust Kanza (Fig. 7), whereasboth coupled and decoupled iceebed conditions were recorded atTolokonka and Smotrakovka (Figs. 5 and 9). This may be evidenceof transient episodes of basal decoupling and bed lubricationpromoting enhanced sliding (Kjær et al., 2006; Phillips et al.,2012), interspersed with periods when the ice was coupled to itsbed and thus led to deformation of the sediments (Piotrowski andTulaczyk, 1999). Spatial and temporal variations in pore-waterpressure (Boulton et al., 2001; Fischer and Clarke, 2001) or lake-level variations may have caused this to happen. At Tolokonkaand Smotrakovka, we have demonstrated both coupled anddecoupled bed conditions, and at one of the sub-sites it changedfrom being decoupled to coupled (Fig. 5; 2.40 km). This couldeither represent a systematic trend or be indicative of transientbed conditions in time and space, forming a mosaic of deformingand stable areas (Piotrowski et al., 2004, 2006). A widespreadchange to coupled bed conditions would probably have causedmore subglacial erosion than the evidence from Tolokonka
Please cite this article in press as: Larsen, E., et al., Subglacial sediment, pgeometries during the Last Glacial Maximum in NW Russia,j.quascirev.2013.02.018
indicates (Fig. 5). Based on the length of individual lobes and ev-idence for modest erosion, it is suggested that weakly coupled todecoupled bed conditions dominated in the main valleys. Occa-sional subglacial water evacuation is thought to have led to anincrease in the basal shear stress and resulted in erosion andthrusting (Kjær et al., 2006; Stokes et al., 2008). However, thisseems to have had only a moderate effect on the landscape as pre-advance morphologies are preserved. On higher ground, coupledbed conditions may have been more dominant. Along the south-ern side of the Dvina lobe, higher ground deflected the icesouthwards into a tributary lobe towards Kiezema (Fig. 11).Drumlins formed by this ice lobe show that the ice was coupled toits bed, likely causing more erosion and reduced flow velocity(Stokes et al., 2008) as compared with that of the main valleys,although drumlins are also found there but only across thresholdsor along valley sides (Fig. 3). Thus, it seems evident that bedconditions and therefore lobe configuration and extent werestrongly dependent on small variations in topography.
As the ice lobes advanced into large proglacial lakes duringrising water levels, one might envisage a situation similar to shelf-ice conditions with decoupling and ice flotation (Fig.12B). Similarly,a reduced lake-level rise might have caused grounding, bed
roglacial lake-level and topographic controls on ice extent and lobeQuaternary Science Reviews (2013), http://dx.doi.org/10.1016/

Fig. 11. Interpreted ice-sheet and lake extent of the Last Glacial Maximum in NW Russia based on combining digital elevation data (DEM) and Landsat TM/ETMþ remote sensingdata with sedimentological/stratigraphical data. Inserted is a topographic profile (AeA0) along the trimline formed by the ice lobe in the Dvina valley. The straight line(s) is at theelevation of the trimline with the low parts being due to postglacial, mainly fluvial incision. The break in slope may be due to a somewhat erroneous positioning of the profilerelative to the trimline.
E. Larsen et al. / Quaternary Science Reviews xxx (2013) 1e1916
coupling and lowered ice-flow velocity. This may, for instance, havehappened when water spilled over a topographic threshold,thereby increasing the lake area. As lake-level rise ended when thelake was completely filled, this may have caused ice thickening andgroundingwith a final stop at themaximumposition (Fig.12C). Thisis supported by the observation that the elevation of the trimlinenear the maximum position is very close to the elevation of thepasspoint to the south. Following the same kind of reasoning, alake-level drop during retreat may have caused grounding despite athinning of the ice. As topographic conditions, ice-surface gradientsand basal conditions were suitable for formation of subglacial lakes(Livingstone et al., 2012), we do speculate if lakes were capturedduring glacial advance (Fig. 12). Indeed, the very complex diamictsequences encountered at for instance Smotrakovka may lendsupport to such an interpretation (Fig. 9). Thus, we hypothesise thatglacial advance, maximum position and retreat were largelydependent on lake-level variations and threshold elevations andthat subglacial lakes may have formed. It follows that these lobeswere unstable features although it is not known how short-livedthey were. Dates can only crudely bracket the total time spanfrom ice-damming in the north that started some 21e20 ka ago viathe maximum position at about 17e16 ka ago, and into the periodof deglaciation and lake drainage starting shortly thereafter andcompleted within 700 years (Larsen et al., 1999; Lyså et al., un-published; Figs. 7 and 9).
Please cite this article in press as: Larsen, E., et al., Subglacial sediment, pgeometries during the Last Glacial Maximum in NW Russia,j.quascirev.2013.02.018
West of the White Sea, large drumlin fields dominate, in strongcontrast to the eastern areas where subglacial bedforms are rareand confined to areas of higher ground (Fig. 3). Thus, strong ice-bedcoupling must have persisted to the west with drainage of largevolumes of ice (Fig. 12A), as opposed to the eastern areas as dis-cussed above. This is taken to indicate increased ice-flow velocitiestowards the periphery of the ice sheet, and a rather abrupt east-ward lowering of the ice-surface gradient across the area wherebedform occurrence changes.
4.2.2. Regional implicationsPleistocene ice sheets have repeatedly covered the northern
parts of mainland Russia. These spread out from Scandinavia, andfrom the Barents and Kara Seas and dammed huge frontal lakesin the large river valleys south of the ice sheets (e.g. Kvasov,1979; Astakhov, 2004; Mangerud et al., 2004; Svendsen et al.,2004; Larsen et al., 2006a; Lyså et al., 2011). Thick deposits offine-grained sediments have accumulated in these lakes or in theriver valleys during ice-free periods (Mangerud et al., 2004;Jensen et al., 2009). Thus, a typical scenario was that glaciersadvanced into lakes floored by thick fine-grained sediments andunderlain by permafrost (Hubberten et al., 2004; Lyså et al.,2011). These were conditions that enhanced the pore-waterpressure in subglacial sediments, leading to weak basalcoupling and thus low shear strengths. This, in turn, promoted
roglacial lake-level and topographic controls on ice extent and lobeQuaternary Science Reviews (2013), http://dx.doi.org/10.1016/
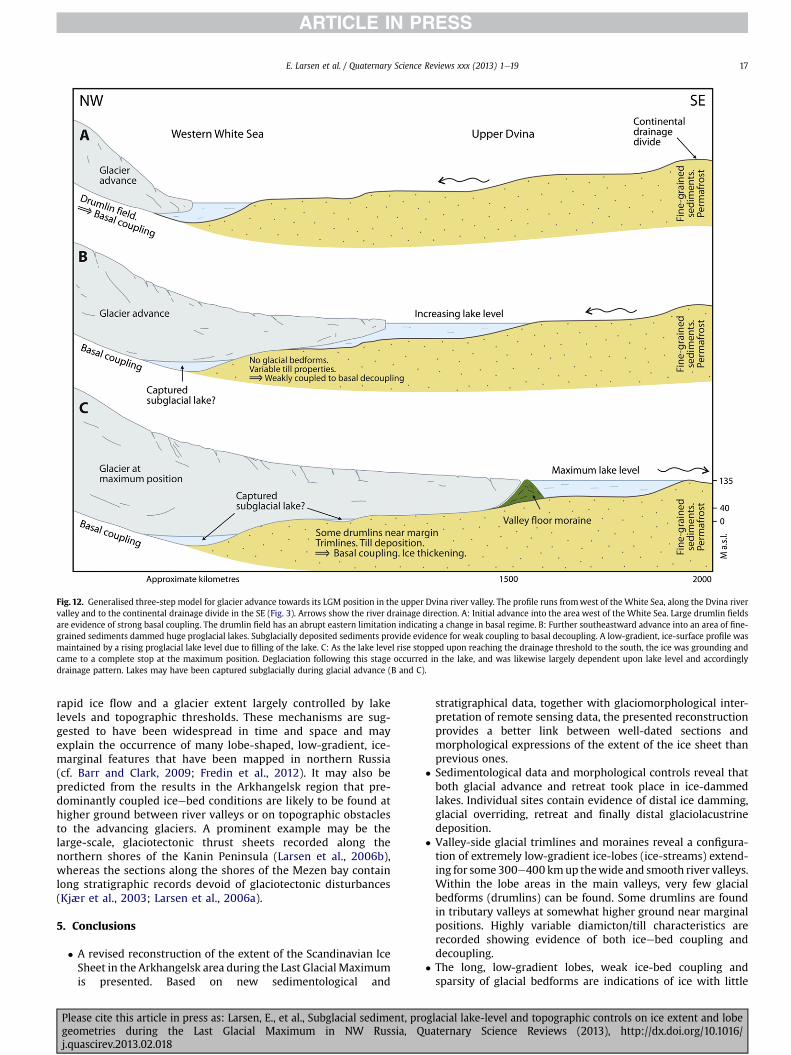
Fig. 12. Generalised three-step model for glacier advance towards its LGM position in the upper Dvina river valley. The profile runs fromwest of the White Sea, along the Dvina rivervalley and to the continental drainage divide in the SE (Fig. 3). Arrows show the river drainage direction. A: Initial advance into the area west of the White Sea. Large drumlin fieldsare evidence of strong basal coupling. The drumlin field has an abrupt eastern limitation indicating a change in basal regime. B: Further southeastward advance into an area of fine-grained sediments dammed huge proglacial lakes. Subglacially deposited sediments provide evidence for weak coupling to basal decoupling. A low-gradient, ice-surface profile wasmaintained by a rising proglacial lake level due to filling of the lake. C: As the lake level rise stopped upon reaching the drainage threshold to the south, the ice was grounding andcame to a complete stop at the maximum position. Deglaciation following this stage occurred in the lake, and was likewise largely dependent upon lake level and accordinglydrainage pattern. Lakes may have been captured subglacially during glacial advance (B and C).
E. Larsen et al. / Quaternary Science Reviews xxx (2013) 1e19 17
rapid ice flow and a glacier extent largely controlled by lakelevels and topographic thresholds. These mechanisms are sug-gested to have been widespread in time and space and mayexplain the occurrence of many lobe-shaped, low-gradient, ice-marginal features that have been mapped in northern Russia(cf. Barr and Clark, 2009; Fredin et al., 2012). It may also bepredicted from the results in the Arkhangelsk region that pre-dominantly coupled iceebed conditions are likely to be found athigher ground between river valleys or on topographic obstaclesto the advancing glaciers. A prominent example may be thelarge-scale, glaciotectonic thrust sheets recorded along thenorthern shores of the Kanin Peninsula (Larsen et al., 2006b),whereas the sections along the shores of the Mezen bay containlong stratigraphic records devoid of glaciotectonic disturbances(Kjær et al., 2003; Larsen et al., 2006a).
5. Conclusions
� A revised reconstruction of the extent of the Scandinavian IceSheet in the Arkhangelsk area during the Last Glacial Maximumis presented. Based on new sedimentological and
Please cite this article in press as: Larsen, E., et al., Subglacial sediment, pgeometries during the Last Glacial Maximum in NW Russia,j.quascirev.2013.02.018
stratigraphical data, together with glaciomorphological inter-pretation of remote sensing data, the presented reconstructionprovides a better link between well-dated sections andmorphological expressions of the extent of the ice sheet thanprevious ones.
� Sedimentological data and morphological controls reveal thatboth glacial advance and retreat took place in ice-dammedlakes. Individual sites contain evidence of distal ice damming,glacial overriding, retreat and finally distal glaciolacustrinedeposition.
� Valley-side glacial trimlines and moraines reveal a configura-tion of extremely low-gradient ice-lobes (ice-streams) extend-ing for some300e400 kmup thewide and smooth river valleys.Within the lobe areas in the main valleys, very few glacialbedforms (drumlins) can be found. Some drumlins are foundin tributary valleys at somewhat higher ground near marginalpositions. Highly variable diamicton/till characteristics arerecorded showing evidence of both iceebed coupling anddecoupling.
� The long, low-gradient lobes, weak ice-bed coupling andsparsity of glacial bedforms are indications of ice with little
roglacial lake-level and topographic controls on ice extent and lobeQuaternary Science Reviews (2013), http://dx.doi.org/10.1016/

E. Larsen et al. / Quaternary Science Reviews xxx (2013) 1e1918
friction towards its bed. The evidence for iceebed decouplingin the main valleys suggests that the weight of the glacier lobeswas, to a large extent, carried by a pressurised subglacialmeltwater layer. Thus, moderate subglacial shear was exertedin accordance with the evidence for little glacial erosion.
� The balance between the weight of the glacier and waterpressure affected the buoyancy of glaciers advancing into lakes.This, along with extremely low surface gradients, indicates thatglacier advance, extension and retreat was to a large extentcontrolled by lake levels and topographic thresholds, withsteeper-gradient ice farther upstream providing the gravita-tional push. Subglacial lakes may have formed by capture ofproglacial lakes during glacial advance.
� Up-ice of the lobate area, large drumlin fields have beenmapped. These show strong bed coupling, probable reducedflow velocities as compared with the lobes, and, accordingly, asteeper ice-surface profile.
� Fine-grained sediment substrates, topographic conditions andglacial advances into lakes were features common to mostareas of northern Russia, suggesting that the proposed flowmodel for low-gradient ice lobes might have wide applicabilityboth in time and space.
Acknowledgements
The paper is contribution to the IPY SciencePub project no.175937/S30 (www.ngu.no/sciencepub) funded by the ResearchCouncil of Norway (NFR), and the GLACIPET project no. 169291(www.ngu.no/glacipet) financed by the NFR’s PETROMAKS pro-gram and Statoil ASA. Evgenij Vyatkin and Gudmund Løvø assistedduring the fieldwork. Valery Shebotinov, Aurelien van Welden andHilde Krogh participated in the field group at Tolokonka andcontributed to fruitful discussions. Ice-to-bed hydraulic conditionswere discussed with Atle Dagestad. Irene Lundquist preparedgraphics, Monica Winsborrow read the manuscript critically, andDavid Roberts corrected the English language. Jan Piotrowski andone anonymous reviewed the manuscript. To all these persons andinstitutions we extend our sincere thanks.
References
Apukhtin, N.I., Krasnov, I.I., 1966. Map of Quaternary deposits of the north-westernEuropean part of USSR. Scale 1:2500 000 (Karta chetvertichnykh otlozheniySevero-Zapada Evropeiskoi chasti SSSR). In: Apukthin, N.I., Krasnov, I.I. (Eds.), Ge-ology of the North-western European USSR (Geologia chetvertichnykt otlozheniySevero-Zapada Evropeiskoi chasti SSSR). Nedra, Leningrad, p. 344 (in Russian).
Astakhov, V.I., 2006. Evidence of late Pleistocene ice-dammed lakes in West Siberia.Boreas 35, 607e621.
Astakhov, V.I., 2004. Middle Pleistocene glaciations of the Russian north. Quater-nary Science Reviews 23, 1285e1311.
Atlasov, R.R., Bukreev, V.A., Levina, N.B., Ostanin, V.E., 1978. Osobennosti reljefakraevoi zony valdaiskogo oledeneniya na OnegoeVazhskom mezhdurechje i vdoline r. Vagi (Relief characteristics of the marginal zone of Valdaian glaciationon OnegaeVaga interfluve and in Vaga river valley). In: Kraevye obrazovaniamaterikovych oledeneniy. Naukova Dumka, Kiev, pp. 30e38.
Barr, I.D., Clark, C.D., 2009. Distribution and pattern of moraines in far NE Russiareveal former glacial extent. Journal of Maps, 186e193.
Benn, D.I., 2004. Macrofabric. In: Evans, D.J.A., Benn, D.I. (Eds.), A Practical Guide tothe Study of Glacial Sediments. Arnold, London, pp. 93e114.
Benn, D.I., 1996. Subglacial and subaqueous processes near a glacier grounding line:sedimentological evidence from a former ice-dammed lake, Achnasheen,Scotland. Boreas 25, 23e36.
Biske, G.S., Devjatova, E.I., 1965. Antropogenovyi period v Arktike i Subarktike.Trudy Nauchno-Issledovatelskogo Instituta Geologii Arktiki GosudarstvennogoGeologichyeskogo Komiteta SSSR 43 (Pleistocene Marine Transgressions in theNorth of Europe). Nedra, Moscow, pp. 155e176 (in Russian, with Englishsummary).
Boulton, G.S., Dobbie, K.E., Zatsepin, S., 2001. Sediment deformation beneath gla-ciers and its coupling to the subglacial hydraulic system. Quaternary Interna-tional 86, 3e28.
de Ferranti, J., 2012. http://www.viewfinderpanoramas.org/dem3.html.
Please cite this article in press as: Larsen, E., et al., Subglacial sediment, pgeometries during the Last Glacial Maximum in NW Russia,j.quascirev.2013.02.018
Demidov, I.N., Houmark-Nielsen, M., Kjær, K.H., Larsen, E., 2006. The last Scandi-navian Ice Sheet in northwestern Russia: ice flow patterns and decay dynamics.Boreas 35, 425e443.
Demidov, I.N., Houmark-Nielsen, M., Kjær, K.H., Larsen, E., Lyså, A., Funder, S.,Lunkka, J.-P., Saarnisto, M., 2004. Valdaian glacial maxima in the Arkhangelskdistrict of Northwest Russia. In: Ehlers, J., Gibbard, P.L. (Eds.), Quaternary Gla-ciations e Extent and Chronology. Part I: Europe. Elsevier, pp. 321e336.
Devjatova, E.I., Loseva, E.I., 1964. Stratigrafia i paleogeografia chetvertichnogoperioda v basseine r. Mezeni. Komi Filial Institut Geologii, Acad. Nauk SSSR,Moscow, 105 pp (in Russian).
Dreimanis, A., 1988. Tills: their genetic terminology and classification. In:Goldthwait, R.P., Matsch, C.L. (Eds.), Genetic Classification of Glacigenic De-posits. A.A. Balkema, Rotterdam, pp. 17e67.
Fischer, U., Clarke, G.K.C., 2001. Review of subglacial hydromechanical coupling:Trapridge Glacier, Yukon Territory, Canada. Quaternary International 86, 29e43.
Fredin, O., Rubensdotter, L., van Welden, A., Larsen, E., Lyså, A., 2012. Distribution ofice marginal moraines in NW Russia. Journal of Maps. http://www.tandfonline.com/doi/abs/10.1080/17445647.2012.708536.
Geology of USSR, 1963. Map of Mineral resources of Arkhangelsk, Vologda areas andKomi ASSR, scale 1:2500 000 (SSSR Tum II. Arkhangelskaya, Vologodskayaoblast i Komi ASSR). In: Zoricheva, A.I. (Ed.), Gelogy of the USSR. In: Volkov, C.N.(Ed.),, Part 1 Moscow, vol. II, p. 1079 (in Russian).
Hart, J.K., Boulton, G.S., 1991. The interrelation of glaciotectonic and glaciodeposi-tional processes within the glacial environment. Quaternary Science Reviews10, 335e350.
Hättestrand, C., Clark, C., 2006. The glacial geomorphology of Kola Peninsula andadjacent areas in the Murmansk Region, Russia. Journal of Maps 2006, 30e42.
Hubberten, H.V., Andreev, A., Astakhov, V.I., Demidov, I., Dowdeswell, J.A.,Henriksen, M., Hjort, C., Houmark-Nielsen, M., Jakobsson, M., Kuzmina, S.,Larsen, E., Lunkka, J.P., Lyså, A., Mangerud, J., Møller, P., Saarnisto, M.,Schirrmeister, L., Sher, A.V., Siegert, C., Siegert, M.J., Svendsen, J.I., 2004. Theperiglacial climate and environment in northern Eurasia during the LastGlaciation. Quaternary Science Reviews 23, 1333e1357.
Hughen, K., Southon, J., Lehman, S., Bertrand, C., Turnbull, J., 2006. Marine-derived14C calibration and activity record for the past 50,000 years updated from theCaricao Basin. Quaternary Science Reviews 25, 3216e3227.
Jensen, M., Demidov, I.N., Larsen, E., Lyså, A., 2009. Quaternary palaeoenvironmentsand multi-storey valley-fill architecture along the Mezen and Severnaya Dvinariver valleys, Arkhangelsk region, NW Russia. Quaternary Science Reviews 28,2489e2506.
Kjær, K.H., Demidov, I.N., Larsen, E., Nielsen, J.K., 2003. Mezen Bay e a key area forestablishing a glacial event stratigraphy for the Weicselian in Northern Russia.Journal of Quaternary Science 18, 73e93.
Kjær, K.H., Larsen, E., van der Meer, J., Ingólfsson, Ó., Krüger, J., Benediktsson, Í.Ö.,Knudsen, C.G., Schomacker, A., 2006. Subglacial decoupling at the sediment/bedrock interface: a new mechanism for rapid flowing ice. Quaternary ScienceReviews 25, 2704e2712.
Krasnov, I.I. (Ed.), 1974. Karta chetvertichnyh otlozhenii Evropeiskoi chasti SSSR(Map of the Quaternary deposits of the European part of the USSR. Scale 1:1.5million). Ministerstvo geologii SSSR.
Kvasov, D.D., 1979. Late-Quaternary history of large lakes and inland seas of easternEurope. Annales Academiae Scientiarum Fennicae AIII, 1e71.
Larsen, E., Kjær, K.H., Demidov, I.N., Funder, S., Grøsfjeld, K., Houmark-Nielsen, M.,Jensen, M., Linge, H., Lyså, A., 2006a. Late Pleistocene glacial and lake history ofnorthwestern Russia. Boreas 35, 394e424.
Larsen, E., Kjær, K.H., Jensen, M., Demidov, I., Håkansson, L., Paus, Aa, 2006b. EarlyWeichselian palaeoenvironments reconstructed from a mega-scale thrust-faultcomplex, Kanin Peninsula, NW Russia. Boreas 35, 476e492.
Larsen, E., Longva, O., Follestad, B.A., 1991. Formation of De Geer moraines and im-plications for deglaciation dynamics. Journal of Quaternary Science 6, 263e277.
Larsen, E., Lyså, A., Demidov, I.N., Funder, S., Houmark-Nielsen, M., Kjær, K.H.,Murray, A.S., 1999. Age and extent of the Scandinavian ice sheet in northwestRussia. Boreas 28, 115e132.
Larsen, E., Mangerud, J., 1992. Subglacially Formed Clastic Dikes. In: Sveriges Geo-logiska Undersökning Ser. Ca 81, pp. 163e170.
Larsen, N.K., Piotrowski, J.A., 2003. Fabric pattern in a basal till succession and itssignificance for reconstructing subglacial processes. Journal of SedimentaryResearch 73, 725e734.
Lavrov, A.C., Potapenko, L.M., 2005. Neopleistocene of the Northeastern RussianPlain. Aerogeologia, Moscow, 229 pp, 5 maps (in Russian).
Legkova, V.G., 1967. The north-west part of the Arkhangelsk region (Severo-zapadArkhangelskoi oblasti). In: Apukhtin, N., Krasnov, I. (Eds.), Quaternary Geologyof the North-west European Part of USSR (Geologia chetvertichnykh otlozheniySevero-Zapada Evropeiskoi chasti SSSR). Nedra, Leningrad, pp. 172e191 (inRussian).
Livingstone, S.J., Clark, C.D., Piotrowski, J.A., Tranter, M., Bentley, M.J., Hodson, A.,Swift, D.A., Woodward, J., 2012. Theoretical framework and diagnostic criteriafor the identification of palaeo-subglacial lakes. Quaternary Science Reviews 53,88e110.
Lyså, A., Demidov, I.N., Houmark-Nielsen, M., Larsen, E., 2001. Late Pleistocenestratigraphy and sedimentary environment of the Arkhangelsk area, northwestRussia. Global and Planetary Change 31, 179e199.
Lyså, A., Jensen, M.A., Larsen, E., Fredin, O., Demidov, I.N., 2011. Ice-distal landscapeand sediment signatures evidencing damming and drainage of large pro-glacialalkes, northwest Russia. Boreas 40, 481e497.
roglacial lake-level and topographic controls on ice extent and lobeQuaternary Science Reviews (2013), http://dx.doi.org/10.1016/

E. Larsen et al. / Quaternary Science Reviews xxx (2013) 1e19 19
Lunkka, J.P., Saarnisto, M., Gey, V., Demidov, I., Kiselova, V., 2001. Extent and age ofthe Last Glacial Maximum in the southeastern sector of the Scandinavian IceSheet. Global and Planetary Change 31, 407e425.
Mangerud, J., Jacobsson, M., Alexanderson, H., Astakhov, V., Clarke, G.C.K.,Henriksen, M., Hjort, C., Krinnerm, G., Lunkkja, J.-P., Möller, P., Murray, A.,Nikolskaya, O., Saarnisto, M., Svendsen, J.-I., 2004. Ice-dammed lakes andrerouting of the drainage of northern Eurasia during the Last Glaciation. Qua-ternary Science Reviews 23, 1313e1332.
Mark, D.M., 1973. Analysis of axial orientation data including till fabrics. GeologicalSociety of America Bulletin 84, 1369e1374.
Mark, D.M., 1974. On the interpretation of till fabric. Geology 2, 101e104.National Aeronautics and Space Administration (NASA), 2012. http://landsat.gsfc.
nasa.gov/.Ostanin, V.Ye., Atlasov, R.R., Bucreyev, V.A., Levina, N.B., 1979. Terminal Formations
and Valdaian Glaciation Limit in the Vaga River Basin (Kraevye obrazovania igranitsa valdaiskogo oledenina v basseine r. Vagi). In: Geomorphologia 1. ANSSSR, pp. 72e76 (in Russian).
Panin, A.V., Sidorchuk, A., Yu, Chernov, A.V., 1999. Historical background to flood-plain morphology: examples from the East European Plain. In: Marriott, S.B.(Ed.), Floodplains: Interdisciplinary Approaches. In: Alexander, J. (Ed.),,Geological Society, London, Special Publications, vol 163, pp. 217e229.
Phillips, E.R., Everest, J., Reeves, H., 2012. Micromorphological evidence for sub-glacial multiphase sedimentation and deformation during overpressurised fluidflow associated with hydrofracturing. Boreas, http://dx.doi.org/10.1111/j.1502-3885.2012.00261.x.
Piotrowski, J.A., Larsen, N.J., Junge, F.W., 2004. Reflection on soft subglacial beds as amosaic of deforming and stable spots. Quaternary Science Reviews 23, 993e1000.
Piotrowski, J.A., Larsen, N.K.,Menzies, J.,Wysota,W., 2006. Formation of subglacial tillunder transient bed conditions: deposition, deformation, and basal decouplingunder a Weichselian ice sheet lobe, central Poland. Sedimentology 53, 83e106.
Piotrowski, J.A., Tulaczyk, S., 1999. Subglacial conditions under the last ice sheet innorthwest Germany: ice-bed separation and enhanced basal sliding? Quater-nary Science Reviews 18, 737e751.
Punkari, M., 1995. Glacial flow systems in the zone of confluence between theScandinavian and Novaja Zemlya Ice Sheets. Quaternary Science Reviews 14,589e603.
Ramsay, W., 1898. Über die Geolgische Entwicklung der Halbinsel Kola in derQuartärzeit. Mit einer Karte und fünf Tafeln. Fennia 16, 1e151.
Please cite this article in press as: Larsen, E., et al., Subglacial sediment, pgeometries during the Last Glacial Maximum in NW Russia,j.quascirev.2013.02.018
Romanova, V., 1977. In: Chebotaryova, N. (Ed.), Struktura i dinamika posledniegolednikovogo pokrova Evropy (Structure and dynamics of the last ice sheet ofEurope). Nauka, Moscow, 143 pp. (in Russian).
Smith,M.J., Clark, C.D., 2005.Methods for the visualization of digital elevationmodelsfor landform mapping. Earth Surface Processes and Landforms 30, 885e900.
Smith, M.J., Wise, S.M., 2007. Problems of bias in mapping linear landforms fromsatellite imagery. International Journal of Applied Earth Observation and Geo-information 9, 65e78.
Stokes, C.R., Clark, C.D., 2001. Palaeo-ice streams. Quaternary Science Reviews 20,1437e1457.
Stokes, C.R., Lian, O.B., Tulaczyk, S., Clark, C.D., 2008. Superimposition of ribbedmoraines on a palaeo-ice-stream bed: implications for ice stream dynamics andshutdown. Earth Surface Processes and Landforms 33, 593e609.
Svendsen, J.-I., Alexanderson, H., Astakhov, V.I., Demidov, I., Dowdeswell, J.A.,Funder, S., Gataullin, V., Henriksen, M., Hjort, C., Houmark-Nielsen, M.,Hubberten, H.W., Ingòlfsson, Ò., Jacobsson, M., Kjær, K.H., Larsen, E.,Lokrantz, H., Lunkka, J.-P., Lyså, A., Mangerud, J., Matiouchkov, A., Murray, A.,Möller, P., Niessen, F., Nikolskaya, O., Polyak, L., Saarnisto, M., Siegert, C.,Siegert, M.J., Spielhagen, R.F., Stein, R., 2004. Late Quaternary ice sheet history ofNorthern Eurasia. Quaternary Science Reviews 23, 1229e1271.
Thomas, P.J., Murray, A.S., Kjær, K.H., Funder, S., Larsen, E., 2006. Optically Stimu-lated Luminescence (OSL) dating of glacial sediments from Arctic Russia e
depositional bleaching and methodological aspects. Boreas 35, 587e599.Woodcock, N.H., Naylor, M.A., 1983. Randomness testing in three-dimensional
orientation data. Journal of Structural Geology 5, 539e548.Yakovlev, S.A., 1932. Quaternary Map of European USSR and Adjacent Areas, Scale 1:
2 500 000 (O karte otlozheniy chetvertichnoi sisterny Evropeiskoi chasti USSR isoprdelnykh s nei territoriy v masshtabe 1:2 500 000). In: Trudy II mezhdu-narodnoi konferentsii po izucheniyu chetvertichnogo perioda Evropy, vypusk 1,Leningrad, Moscow, pp. 91e103 (in Russian).
Zatulskaya, T. Yu, 1984a. Gosudarstvennaya karta chetvertichnyh otlozhenii (StateMap of the Quaternary Deposits). Sheet Q-38-XXV-XXVI. Pinega. Scale 1:200000. List Q-38-XXV-XXVI. Pinega. VSEGEI, Leningrad.
Zatulskaya, T. Yu, 1984b. Gosudarstvennaya karta chetvertichnyh otlozhenii (Statemap of the Quaternary deposits). Sheet Q-38-XXXI-XXXII. Pochezer’e. Scale 1:200000. List Q-38-XXV-XXVI. Pochezer’e. VSEGEI, Leningrad.
Zatulskaya, T. Yu, 1984c. Gosudarstvennaya karta chetvertichnyh otlozhenii (StateMap of the Quaternary Deposits). Sheet List Q-38-XXI-XXII. Mezen. Scale 1:200000. List Q-38-XXI-XXII. Mezen. VSEGEI, Leningrad.
roglacial lake-level and topographic controls on ice extent and lobeQuaternary Science Reviews (2013), http://dx.doi.org/10.1016/