RESEARCH ARTICLES Characterization of subglacial pathways...Gangotri Glacier System
9
RESEARCH ARTICLES CURRENT SCIENCE, VOL. 107, NO. 4, 25 AUGUST 2014 613 *For correspondence. (e-mail: [email protected]) Characterization of subglacial pathways draining two tributary meltwater streams through the lower ablation zone of Gangotri glacier system, Garhwal Himalaya, India Jose George Pottakkal, Alagappan Ramanathan*, Virendra Bahadur Singh, Parmanand Sharma, Mohd. Farooq Azam and Anurag Linda School of Environmental Sciences, Jawaharlal Nehru University, New Delhi 110 067, India An attempt has been made to characterize the subgla- cial pathways that transport the meltwaters from Chaturangi and Raktavarn glaciers through the lower ablation zone of the Gangotri glacier, Indian Hima- laya, by means of dye tracer experiments. These inac- tive tributaries of the Gangotri glacier contribute significantly to the proglacial discharge, which is dominantly controlled by air temperature (0–20C at the measurement site) rather than rainfall (117 mm from June to September 2008). The breakthrough flow velocities, ranging from 0.6 to 1.7 ms –1 and dispersivity values varying between 2.1 and 17.5 m, decreased with bulk discharges in the proglacial stream (R 2 = 0.66), indicating flow through highly effi- cient subglacial channels that develop during the melt season with increased meltwater influx. However, the dye return curves giving high velocities in a narrow range from 1.3 to 1.7 ms –1 as seasonal discharges were peaking, are interpreted as indicative of flow through pressurized channel/s. In general, the subglacial channels routing meltwater from these input points are arguably controlled by recharge hydrographs rather than channel geometry during the ablation sea- son. Closely spaced dye tests need to be carried out to better understand the factors that control the diurnal and seasonal development of these hydrological path- ways, which are important for downstream water management. Keywords: Ablation zone, dye tracer experiments, gla- cier system, meltwater, subglacial drainage. THE size and shape of subglacial flow pathways exert a strong influence over the pressure and speed at which meltwaters are routed through glaciers 1 . Glacier drainage system governs how meltwater is routed through the gla- cier, which in turn influences ice flow dynamics by affecting basal water pressures and sliding rates 2 . Since majority of the bulk run-off from temperate glaciers is derived from meltwater generated at the glacier surface, it is likely that changes within the englacial/subglacial drainage system are linked directly to surface processes that control how meltwater is delivered to it 3 . Thus, sea- sonal changes in the bulk run-off hydrographs from gla- ciers may reflect both the effect of supraglacial melt removal and routing to the englacial/subglacial system 4 as well as consequent changes in the efficiency and mor- phology of the system 5 . Since the interior of a glacier and its bed is inaccessible for direct observation, tracers become a useful tool for understanding the subglacial drainage and its development. Glaciers in the Alps and Rockies have been extensively studied to understand their subglacial systems and their seasonal development through dye tracer experiments, bore-hole investigations, etc. 3,6,7 . These studies suggest that subglacial drainage system imposes short-term storage effects on run-off that decreases during a melt season since the drainage system of a glacier tends to become more efficient at carrying large discharges through the glacier as the melt season progresses. Velocities in the subglacial drainage system also increase linearly with discharge, implying an effec- tive decrease in apparent sinuosity 6 . The relationship between discharge and velocity as measured at the pro- glacial gauging station is often used to identify whether subglacial channels linking the injection site to the meas- urement site are unfilled and flowing, like surface streams, at atmospheric pressure, or whether they are filled with meltwater and pressurized above atmospheric pressure 8 . Flow velocity through subglacial drainage sys- tem is dependent on the character of flow pathways through which the water has travelled 1 . Breakthrough velocities of >0.2 ms –1 are commonly interpreted as in- dicative of flow through hydraulically efficient drainage systems, while those lesser than this value are indicative of flow through inefficient distributed hydrologic sys- tems 9–11 . A switching between distributed and channel- ized systems for subglacial drainage in the ablation zone of Dokriani glacier, Garhwal Himalaya was inferred based on transit velocities obtained from dye tracer
Transcript of RESEARCH ARTICLES Characterization of subglacial pathways...Gangotri Glacier System

RESEARCH ARTICLES
CURRENT SCIENCE, VOL. 107, NO. 4, 25 AUGUST 2014 613
*For correspondence. (e-mail: [email protected])
Characterization of subglacial pathways draining two tributary meltwater streams through the lower ablation zone of Gangotri glacier system, Garhwal Himalaya, India Jose George Pottakkal, Alagappan Ramanathan*, Virendra Bahadur Singh, Parmanand Sharma, Mohd. Farooq Azam and Anurag Linda School of Environmental Sciences, Jawaharlal Nehru University, New Delhi 110 067, India
An attempt has been made to characterize the subgla-cial pathways that transport the meltwaters from Chaturangi and Raktavarn glaciers through the lower ablation zone of the Gangotri glacier, Indian Hima-laya, by means of dye tracer experiments. These inac-tive tributaries of the Gangotri glacier contribute significantly to the proglacial discharge, which is dominantly controlled by air temperature (0–20C at the measurement site) rather than rainfall (117 mm from June to September 2008). The breakthrough flow velocities, ranging from 0.6 to 1.7 ms–1 and dispersivity values varying between 2.1 and 17.5 m, decreased with bulk discharges in the proglacial stream (R2 = 0.66), indicating flow through highly effi-cient subglacial channels that develop during the melt season with increased meltwater influx. However, the dye return curves giving high velocities in a narrow range from 1.3 to 1.7 ms–1 as seasonal discharges were peaking, are interpreted as indicative of flow through pressurized channel/s. In general, the subglacial channels routing meltwater from these input points are arguably controlled by recharge hydrographs rather than channel geometry during the ablation sea-son. Closely spaced dye tests need to be carried out to better understand the factors that control the diurnal and seasonal development of these hydrological path-ways, which are important for downstream water management. Keywords: Ablation zone, dye tracer experiments, gla-cier system, meltwater, subglacial drainage. THE size and shape of subglacial flow pathways exert a strong influence over the pressure and speed at which meltwaters are routed through glaciers1. Glacier drainage system governs how meltwater is routed through the gla-cier, which in turn influences ice flow dynamics by affecting basal water pressures and sliding rates2. Since majority of the bulk run-off from temperate glaciers is
derived from meltwater generated at the glacier surface, it is likely that changes within the englacial/subglacial drainage system are linked directly to surface processes that control how meltwater is delivered to it3. Thus, sea-sonal changes in the bulk run-off hydrographs from gla-ciers may reflect both the effect of supraglacial melt removal and routing to the englacial/subglacial system4 as well as consequent changes in the efficiency and mor-phology of the system5. Since the interior of a glacier and its bed is inaccessible for direct observation, tracers become a useful tool for understanding the subglacial drainage and its development. Glaciers in the Alps and Rockies have been extensively studied to understand their subglacial systems and their seasonal development through dye tracer experiments, bore-hole investigations, etc.3,6,7. These studies suggest that subglacial drainage system imposes short-term storage effects on run-off that decreases during a melt season since the drainage system of a glacier tends to become more efficient at carrying large discharges through the glacier as the melt season progresses. Velocities in the subglacial drainage system also increase linearly with discharge, implying an effec-tive decrease in apparent sinuosity6. The relationship between discharge and velocity as measured at the pro-glacial gauging station is often used to identify whether subglacial channels linking the injection site to the meas-urement site are unfilled and flowing, like surface streams, at atmospheric pressure, or whether they are filled with meltwater and pressurized above atmospheric pressure8. Flow velocity through subglacial drainage sys-tem is dependent on the character of flow pathways through which the water has travelled1. Breakthrough velocities of >0.2 ms–1 are commonly interpreted as in-dicative of flow through hydraulically efficient drainage systems, while those lesser than this value are indicative of flow through inefficient distributed hydrologic sys-tems9–11. A switching between distributed and channel-ized systems for subglacial drainage in the ablation zone of Dokriani glacier, Garhwal Himalaya was inferred based on transit velocities obtained from dye tracer

RESEARCH ARTICLES
CURRENT SCIENCE, VOL. 107, NO. 4, 25 AUGUST 2014 614
experiments through one ablation season12. Recently, Covington et al.13 used pipe flow approach to develop a conceptual and mathematical framework for determining the influence of conduit recharge and conduit geometry on proglacial hydrographs suggesting two limiting cases: in the first, the conduit system remains in near hydraulic equilibrium with slow changes in storage volume, and the recharge and discharge hydrographs are similar (recharge-dominated limit), whereas in the second limiting case, rapid changes in recharge result in increased storage and a discharge hydrograph different from the recharge hydrograph (geometry-dominated limit). A rare study combining dye-tracing with direct observation of conduit geometry in Rieperbreen, an outlet glacier of Foxfonnal ice cap, Svalbard, suggested that seasonal changes in subglacial hydrological systems could be strongly influ-enced by seasonal changes in the hydraulic capacity of channelized zones, rather than simply by changes in the configuration of the subglacial drainage system14. Another commonly used parameter derived from the shape of breakthrough curves is dispersivity (d, in m), which represents the rate of spreading of a tracer cloud (described by the dispersion coefficient, D, in m2s–1) rela-tive to the rate of advection of the tracer during transit through a flow system (u, in ms–1)8,15. Dispersion is a process by which a dye cloud in a fluid spreads out as it travels downstream. The dispersivity de-scribes the rate of dispersion of the dye cloud relative to its rate of advection through the glacier, which has been used to infer the complexity of the flow path that it has followed6,10. In general, more dispersed tracer returns (d > 10) reflect inefficient drainage pathways, while highly peaked, less dispersed (d < 10) curves are inter-preted in terms of flow through efficient channels8. Unlike Alpine and sub-polar glaciers, Himalayan glaciers are found at a much higher altitude, more debris-covered and also variously influenced by the Asian mon-soon as well as by neotectonic activity16,17, which make them more complex and less amenable to scientific re-search. Thus, studies that address the routing of meltwater through the glaciers are rare in the Himalaya. The progla-cial discharges monitored during 2000–2006 ablation sea-sons suggest that discharges peak between end July and early August18. The changes in time lag and time to peak are inversely correlated with variations in discharge on this glacier19. The higher percentage of coarser particles found towards the end of the melt season suggests a sub-glacial sediment evacuation pattern that indicates pro-gressively more interconnected drainage system with advancing melt season in the Gangotri glacier18. The lower ablation zone of the Gangotri glacier is character-ized by a thick debris cover and fracturing of ice with numerous supraglacial lakes and ponds. Variations in glacier surface velocities in the lower part of the Gangotri glacier suggest that subsequent to peak melting and dis-charge in July/August, flow velocities decrease to slower
than average levels20. Also unlike moulins fed by supra-glacial channels, these input streams which transport a large amount of sediment-laden water must be active the year round and the subglacial drainage development may have additional forcing factors. Nienow et al.3 opines that dramatic changes in subglacial/englacial systems may occur in glaciers where large streams form on the glacier sur-face and enter it at only a small number of input points. An interesting assessment of water transport in glaciers suggests that conduit density is primarily determined by the number of locations on the surface where water sinks into the aquifer along high-permeability pathways, rather than by the total surface area of the drainage basin21. The present work attempts to understand the seasonal deve-lopment of the subglacial drainages that service the Chaturangi and Raktavarn glacier meltwater streams dis-charging into the lower ablation zone of the Gangotri gla-cier, by injecting known quantities of a dye tracer into the glacier near the inlets of these streams.
Study area
The Gangotri glacier system (3043–3101N and 7900–7917E) is the source of the River Ganga, important to the socio-economic life and culture of northern India, that it has been declared the national river of India. This sys-tem comprises three major glacier tributaries, namely Chaturangi glacier (length 22.45 km; area 67.70 sq. km), Raktavarn glacier (length 15.90 km; area 55.30 sq. km) and Kirti glacier (length 11.05 km; area 33.14 sq. km), with the main Gangotri glacier (length 30.20 km; area 86.32 sq. km) as the trunk part of the system19. Of these, Raktavarn and Chaturangi glaciers have receded 3.4 and 0.6 km respectively, from the main glacier trunk (dis-tances measured on Google Earth image, 2010) and are discharging their meltwaters into the lower ablation zone of the Gangotri glacier tongue (Figure 1) although the Chaturangi glacier was reportedly an active tributary feeding the Gangotri glacier prior to 1971 (ref. 22). Their sediment-laden meltwater streams flow through morainic material at steep slopes and enter the Gangotri glacier at the eastern margin near the glacier base (Figure 2). The glacier basin being located in the rain shadow region has a mean seasonal rainfall of about 260 mm (117 mm during June–September 2008) and air tempera-tures vary from 0C to 20C during the ablation season below the snout of the glacier23. Bhagirathi, the meltwater stream that emerges from the Gangotri glacier terminus is important as a source of water for the Garhwal region, with several operational and under construction hydro-electric power projects.
Methods
During the 2008 melt season, dye tracer tests were carried out injecting known quantities of rhodamine B near the

RESEARCH ARTICLES
CURRENT SCIENCE, VOL. 107, NO. 4, 25 AUGUST 2014 615
entry points of meltwater streams of Raktavarn (2100 m upstream) and Chaturangi glaciers (4300 m upstream) into the Gangotri glacier as well as into a supraglacial channel. This dye was chosen as the tracer as it has been successfully used in glaciers around the world to deline-ate subglacial hydrology and is non-toxic at ppb levels. Dye emergence was detected by a Turner Designs model 10-AU Continuous Flow Field Fluorometer about 1000 m below the Gangotri glacier terminus. A 25 mm flow cell was used and measurement intervals were either 5 or 10 sec. Injections were conducted along both the rising
Figure 1. Location map of Gangotri glacier with tracer injection points and detection site.
Figure 2. Sediment-laden Chaturangi glacier meltwater stream dis-charging into Gangotri glacier.
and falling limbs of the seasonal bulk discharge hydro-graph. All injections, except one, were carried out between 10:30 a.m. and 12:00 p.m. when discharges at the meas-urement site on the proglacial stream began to increase, while the 21 June injection was carried out as discharge peaked for the day (Table 1). A single injection on 2 Sep-tember was carried out on an active supraglacial channel between these two injection sites. Discharge measure-ments were carried out from June to September 2008 using area–velocity method at the measurement site, the stage being measured manually at regular intervals and surface flow velocity computed from wooden floats. This site was chosen for having a single channel with no braiding and a comparatively straight stretch, and suited logistically for long-term observations. During the tracer experiments, discharge measurements were carried out at half-hourly intervals by recording the stage beginning with the time of injection and continuing up to end of the experiment. Apart from these, daily rainfall was also recorded using a standard rain gauge near the dye detection site.
Data processing
The experimental data obtained as dye return curves were normalized to make them independent of discharge and amount of tracer injected following Schuler et al.24. In this study the dispersion coefficient; velocity and disper-sivity have been calculated according to the following equations derived by Brugman9, applied only for the rising limb14 of the normalized breakthrough curve D = (x2(tm – t1)2)/4tm
2t1ln[2(tm/t1)0.5], (1)
u = x/tm, (2)
d = D/u, (3) where x is the straight line distance between the points of dye injection and detection, tm the time to maximum dye concentration taken from field data, and t1 the time when the dye concentration reaches half its peak value on the rise to peak concentration. Tracer load was overestimated by six of the tests (Table 1), probably due to the com-bined effect of fluorescence from sediment and some drift in the instrument, because of which the area under the falling limb of the dye breakthrough curve could be ex-aggerated. However, this does not affect the main results as the travel time, velocity and dispersivity of the dye cloud has been calculated based on the rising limb of the dye breakthrough curve. There was no significant correla-tion observed between percentage dye recovered and straight-line velocity (r = 0.18) or dispersivity (r = 0.10).
Results
Figure 3 gives the seasonal discharge hydrograph and daily rainfall for the 2008 field season with the dye tracer

RESEARCH ARTICLES
CURRENT SCIENCE, VOL. 107, NO. 4, 25 AUGUST 2014 616
T
able
1.
Dye
trac
er e
xper
imen
t dat
a fo
r Cha
tura
ngi a
nd R
akta
varn
stre
ams
and
a su
prag
laci
al c
hann
el
Stra
ight
Dis
pers
ion
Tran
sit
line
In
ject
ion
Trav
el
coef
ficie
nt
velo
city
D
ispe
rsiv
ity
Dis
char
ge a
t D
isch
arge
at
Ave
rage
dai
ly
Dye
di
stan
ce
Trac
er
time
time
D
u d
dye
inje
ctio
n dy
e pe
ak
disc
harg
e re
cove
ry
Dat
e
Inpu
t poi
nt
(m)
(g)
(h)
(min
) (m
2 s–1)
(ms–1
) (m
) (m
3 s–1)
(m3 s–1
) (m
3 s-1)
(%)
21 Ju
ne
Rak
tava
rn S
. 21
00
500
16:3
5 2
3.7
25.3
1.
5 17
.1
97.9
99
.4
87.1
9
5.2
22 Ju
ne
Cha
tura
ngi S
. 43
00
250
11:0
0 4
3.6
11.3
1.
5 7
.4
73.4
77
.2
79.5
8
8.4
3 Ju
ly
Cha
tura
ngi S
. 43
00
500
11:1
5 5
2.3
4.3
1.
4 3
.1
75.4
76
.8
77.9
6
8.2
12 Ju
ly
Cha
tura
ngi S
. 43
00
500
10:5
5 4
1.5
3.5
1.
7 2
.1
90.0
90
.4
96.3
21
6.6
23 Ju
ly
Rak
tava
rn S
. 21
00
500
14:2
5 2
7.7
19.3
1.
3 15
.3
89.6
90
.9
89.1
8
9.8
29 A
ugus
t R
akta
varn
S.
2100
50
0 11
:13
25.
8 23
.7
1.4
17.5
58
.2
60.1
64
.4
194.
8 30
Aug
ust
Cha
tura
ngi S
. 43
00
500
11:3
5 5
9.8
7.2
1.
2 6
.5
49.0
51
.4
51.9
15
1.0
31 A
ugus
t R
akta
varn
S.
2100
50
0 10
:55
34.
5 13
.7
1.0
13.5
39
.9
41.2
43
.1
134.
4 1
Sept
embe
r C
hatu
rang
i S.
4300
50
0 10
:40
67.
7 8
.0
1.1
7.5
32
.3
34.3
37
.4
76.
2 2
Sept
embe
r Su
prag
laci
al C
. 38
00
500
11:5
5 18
9.0
7.7
0.
3 23
.1
33.2
40
.9
37.9
13
8.0
24 S
epte
mbe
r C
hatu
rang
i S.
4300
50
0 11
:11
104.
2 1
.8
0.7
2.6
10
.9
10.9
10
.9
137.
4 25
Sep
tem
ber
Rak
tava
rn S
. 21
00
500
10:3
5 5
5.5
1.9
0.
6 3
.1
8.8
8
.8
8.0
7
1.0
S, S
trea
m; C
, Cha
nnel
.
RESEARCH ARTICLES
CURRENT SCIENCE, VOL. 107, NO. 4, 25 AUGUST 2014 617
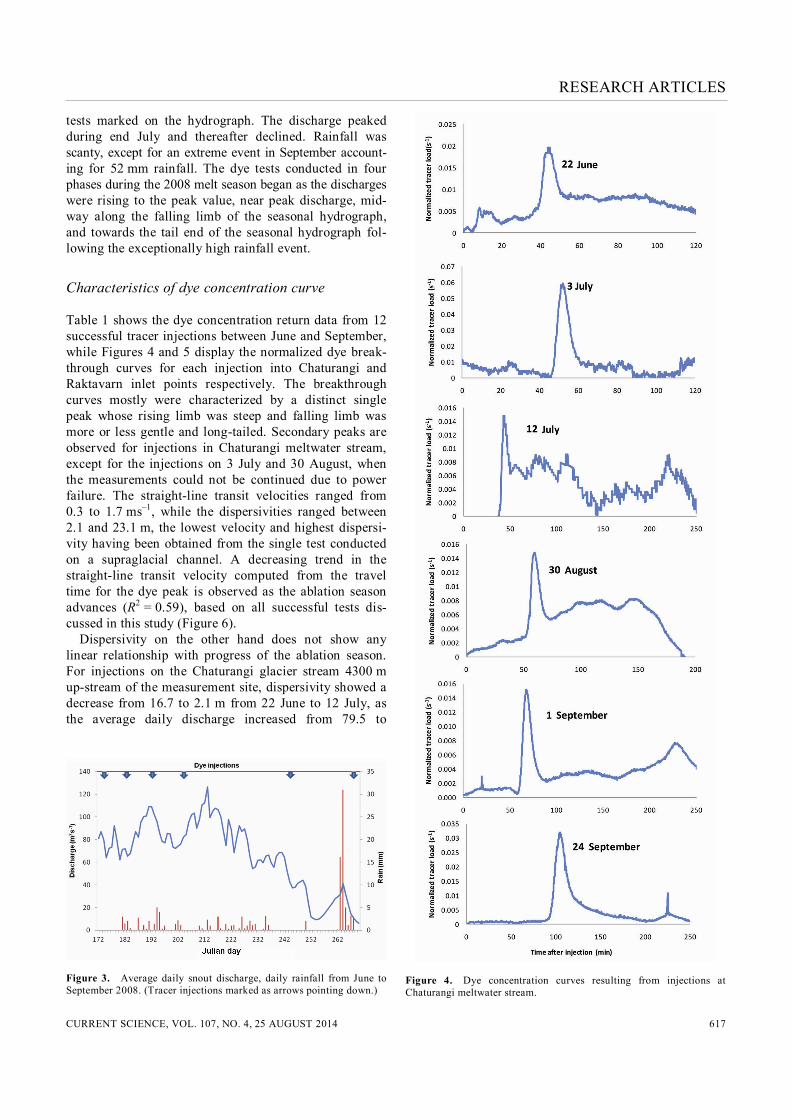
tests marked on the hydrograph. The discharge peaked during end July and thereafter declined. Rainfall was scanty, except for an extreme event in September account-ing for 52 mm rainfall. The dye tests conducted in four phases during the 2008 melt season began as the discharges were rising to the peak value, near peak discharge, mid-way along the falling limb of the seasonal hydrograph, and towards the tail end of the seasonal hydrograph fol-lowing the exceptionally high rainfall event.
Characteristics of dye concentration curve
Table 1 shows the dye concentration return data from 12 successful tracer injections between June and September, while Figures 4 and 5 display the normalized dye break-through curves for each injection into Chaturangi and Raktavarn inlet points respectively. The breakthrough curves mostly were characterized by a distinct single peak whose rising limb was steep and falling limb was more or less gentle and long-tailed. Secondary peaks are observed for injections in Chaturangi meltwater stream, except for the injections on 3 July and 30 August, when the measurements could not be continued due to power failure. The straight-line transit velocities ranged from 0.3 to 1.7 ms–1, while the dispersivities ranged between 2.1 and 23.1 m, the lowest velocity and highest dispersi-vity having been obtained from the single test conducted on a supraglacial channel. A decreasing trend in the straight-line transit velocity computed from the travel time for the dye peak is observed as the ablation season advances (R2 = 0.59), based on all successful tests dis-cussed in this study (Figure 6). Dispersivity on the other hand does not show any linear relationship with progress of the ablation season. For injections on the Chaturangi glacier stream 4300 m up-stream of the measurement site, dispersivity showed a decrease from 16.7 to 2.1 m from 22 June to 12 July, as the average daily discharge increased from 79.5 to
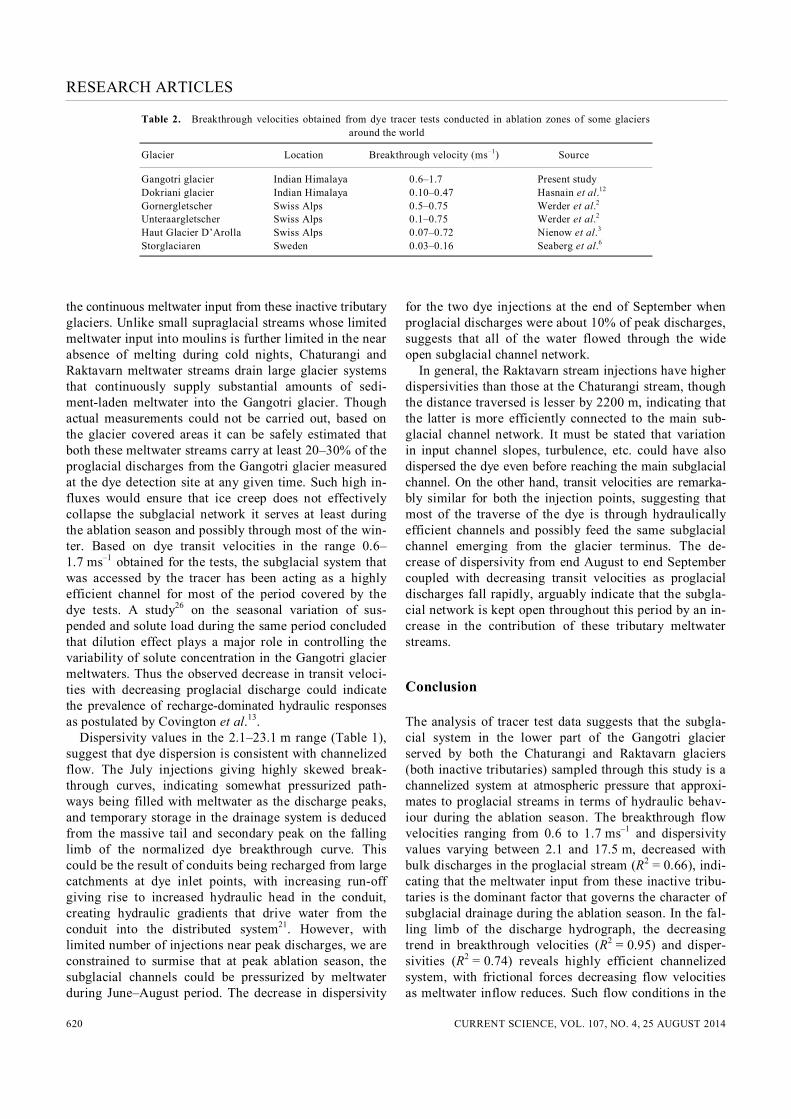
Figure 3. Average daily snout discharge, daily rainfall from June to September 2008. (Tracer injections marked as arrows pointing down.)
Figure 4. Dye concentration curves resulting from injections at Chaturangi meltwater stream.

RESEARCH ARTICLES
CURRENT SCIENCE, VOL. 107, NO. 4, 25 AUGUST 2014 618
96.3 m3s–1 on the rising limb of the seasonal discharge hydrograph, while it was 6.5, 7.5 and 2.6 m for injections on 30 August, 1 September and 24 September respec-tively, as diurnal discharges fell from 51.9 through 37.4
to 10.9 m3s–1. On the Raktavarn stream further down the glacier, the dispersivity remained relatively stable throughout the season, varying within a narrow range of 13.5–17.5 m from June to end August, when the average daily discharge decreased from 87.1 to 43.1 m3s–1, while showing a significant reduction to 3.1 m as diurnal
Figure 5. Dye concentration curves resulting from injections at Rak-tavarn meltwater stream.
discharges decreased rapidly to 8.0 m3s–1. The 2 Septem-ber supraglacial channel dye injection gave a dispersivity of 23.1 m, significantly higher than that for Raktavarn (13.5 m) and Chaturangi (7.5 m) streams carried out on the preceding days.
Proglacial discharge–velocity–dispersivity relationships
The breakthrough velocities and dispersivities obtained from the 12 tests were plotted against proglacial dis-charge at the time of dye peak (Figure 7 a), which showed a strong positive linear relationship between discharge and velocity (R2 = 0.66), while obtaining only a weakly positive power function between proglacial discharge and dispersivity (R2 = 0.14). For tests conducted on the rising limb of the seasonal discharge hydrograph, the relation-ships between discharge and velocity (R2 = 0.02) as well as dispersivity (R2 = 0.43) are weak and moderate respec-tively (Figure 7 b), while for the recession limb of the seasonal hydrograph discharge and velocity (R2 = 0.95) as well as dispersivity (R2 = 0.74) are strongly correlated (Figure 7 c). Tests conducted on the drainage from Chaturangi glacier, gave a very strong velocity–discharge relationship (R2 = 0.98) and a discharge–dispersivity rela-tionship described by a polynomial function (R2 = 0.65; Figure 8 a). However, experiments carried out at Raktavarn glacier input give strong power functions that approxi-mate linear regression for both velocity–discharge (R2 = 0.95) and discharge–dispersivity relationships (R2 = 0.91; Figure 8 b).
Discussion
The results of the dye tracer experiments presented above suggest that the lower part of the ablation zone of the Gangotri glacier sampled by dye tracer tests has a highly efficient channelized drainage system transporting water
Figure 6. Transit velocities and dispersivities plotted against date.

RESEARCH ARTICLES
CURRENT SCIENCE, VOL. 107, NO. 4, 25 AUGUST 2014 619
pockets at appreciably high velocities to the glacier ter-minus. For both the injection points on the Chaturangi and Raktavarn glacier meltwater streams, the break-through peaks (Figures 4 and 5) become smoother and delayed with the progress of ablation season. Along the falling limb of the discharge hydrograph, regardless of injection point, transit velocities decrease with discharge with a strong cross-correlation (breakthrough velocities ranging between 0.6 and 1.7 ms–1 are indicative that effi-cient subglacial channels in the lower ablation zone of the Gangotri glacier were closely linked to the injection points at Chaturangi glacier and Raktavarn glacier melt-water streams). This is in agreement with the observation of Fountain and Walder25 that low-pressure englacial and subglacial conduits exist near the valley walls of ablation zones of most temperate glaciers. This is also corroborated
Figure 7. Transit velocity (u) and dispersivity (d) plotted against peak discharge (Qpeak). a, Whole season; b, Rising limb; c, Recession limb of seasonal discharge hydrograph.
by the gradual shifting of the main ice cave at the Gangotri glacier terminus from the centre flowline to the eastern flank, observed during the last decade. This also gives rise to the paradoxical situation of a glacier trunk covered with thick debris that retards ablation, being opened up from the flanks by meltwater influx from inactive tributary glaciers and valley slopes. The subgla-cial sediment evacuation observed by Haritashya et al.18 could be accentuated by the subglacially entrained sedi-ments from these tributary meltwaters being twice sorted in each subglacial location – first under the tributary and then in a short while under the trunk glacier. A single injection carried out on 2 September on a supra-glacial channel on the Gangotri glacier tongue about 3800 m upstream of the measurement site, gave a transit velocity of 0.3 ms–1, about 30% of that obtained for Rak-tavarn and Chaturangi streams carried out on preceding days, suggesting that this channel is served by inefficient englacial/subglacial pathways, unlike those routing melt-waters from Raktavarn and Chaturangi glaciers. Table 2 compares transit velocities obtained from dye tracer tests conducted in the ablation zones of glaciers in the Himalaya and elsewhere. The breakthrough velocity ranges obtained from the present study are significantly higher than those obtained from injections into ablation zones of other temperate glaciers and imply that the sub-glacial system that drains the Chaturangi and Raktavarn meltwaters through the lower ablation zone of the Gangotri glacier is far more efficient and appears to be kept so by
Figure 8. Transit velocity (u) and dispersivity (d) plotted against peak discharge (Qpeak). a, Chaturangi; b, Raktavarn inlet injections.
RESEARCH ARTICLES
CURRENT SCIENCE, VOL. 107, NO. 4, 25 AUGUST 2014 620
Table 2. Breakthrough velocities obtained from dye tracer tests conducted in ablation zones of some glaciers around the world
Glacier Location Breakthrough velocity (ms–1) Source
Gangotri glacier Indian Himalaya 0.6–1.7 Present study Dokriani glacier Indian Himalaya 0.10–0.47 Hasnain et al.12 Gornergletscher Swiss Alps 0.5–0.75 Werder et al.2 Unteraargletscher Swiss Alps 0.1–0.75 Werder et al.2 Haut Glacier D’Arolla Swiss Alps 0.07–0.72 Nienow et al.3 Storglaciaren Sweden 0.03–0.16 Seaberg et al.6
the continuous meltwater input from these inactive tributary glaciers. Unlike small supraglacial streams whose limited meltwater input into moulins is further limited in the near absence of melting during cold nights, Chaturangi and Raktavarn meltwater streams drain large glacier systems that continuously supply substantial amounts of sedi-ment-laden meltwater into the Gangotri glacier. Though actual measurements could not be carried out, based on the glacier covered areas it can be safely estimated that both these meltwater streams carry at least 20–30% of the proglacial discharges from the Gangotri glacier measured at the dye detection site at any given time. Such high in-fluxes would ensure that ice creep does not effectively collapse the subglacial network it serves at least during the ablation season and possibly through most of the win-ter. Based on dye transit velocities in the range 0.6–1.7 ms–1 obtained for the tests, the subglacial system that was accessed by the tracer has been acting as a highly efficient channel for most of the period covered by the dye tests. A study26 on the seasonal variation of sus-pended and solute load during the same period concluded that dilution effect plays a major role in controlling the variability of solute concentration in the Gangotri glacier meltwaters. Thus the observed decrease in transit veloci-ties with decreasing proglacial discharge could indicate the prevalence of recharge-dominated hydraulic responses as postulated by Covington et al.13. Dispersivity values in the 2.1–23.1 m range (Table 1), suggest that dye dispersion is consistent with channelized flow. The July injections giving highly skewed break-through curves, indicating somewhat pressurized path-ways being filled with meltwater as the discharge peaks, and temporary storage in the drainage system is deduced from the massive tail and secondary peak on the falling limb of the normalized dye breakthrough curve. This could be the result of conduits being recharged from large catchments at dye inlet points, with increasing run-off giving rise to increased hydraulic head in the conduit, creating hydraulic gradients that drive water from the conduit into the distributed system21. However, with limited number of injections near peak discharges, we are constrained to surmise that at peak ablation season, the subglacial channels could be pressurized by meltwater during June–August period. The decrease in dispersivity
for the two dye injections at the end of September when proglacial discharges were about 10% of peak discharges, suggests that all of the water flowed through the wide open subglacial channel network. In general, the Raktavarn stream injections have higher dispersivities than those at the Chaturangi stream, though the distance traversed is lesser by 2200 m, indicating that the latter is more efficiently connected to the main sub-glacial channel network. It must be stated that variation in input channel slopes, turbulence, etc. could have also dispersed the dye even before reaching the main subglacial channel. On the other hand, transit velocities are remarka-bly similar for both the injection points, suggesting that most of the traverse of the dye is through hydraulically efficient channels and possibly feed the same subglacial channel emerging from the glacier terminus. The de-crease of dispersivity from end August to end September coupled with decreasing transit velocities as proglacial discharges fall rapidly, arguably indicate that the subgla-cial network is kept open throughout this period by an in-crease in the contribution of these tributary meltwater streams.
Conclusion
The analysis of tracer test data suggests that the subgla-cial system in the lower part of the Gangotri glacier served by both the Chaturangi and Raktavarn glaciers (both inactive tributaries) sampled through this study is a channelized system at atmospheric pressure that approxi-mates to proglacial streams in terms of hydraulic behav-iour during the ablation season. The breakthrough flow velocities ranging from 0.6 to 1.7 ms–1 and dispersivity values varying between 2.1 and 17.5 m, decreased with bulk discharges in the proglacial stream (R2 = 0.66), indi-cating that the meltwater input from these inactive tribu-taries is the dominant factor that governs the character of subglacial drainage during the ablation season. In the fal-ling limb of the discharge hydrograph, the decreasing trend in breakthrough velocities (R2 = 0.95) and disper-sivities (R2 = 0.74) reveals highly efficient channelized system, with frictional forces decreasing flow velocities as meltwater inflow reduces. Such flow conditions in the

RESEARCH ARTICLES
CURRENT SCIENCE, VOL. 107, NO. 4, 25 AUGUST 2014 621
subglacial drainage fed by the large meltwater streams from the Chaturangi and Raktavarn glaciers may affect solute acquisition rates in the lower ablation zone. In view of the fact that both these meltwater input points serve its eastern margin¸ the variation in ice flow veloci-ties along E–W profiles in the lower ablation zone of the Gangotri glacier merits investigation. However, as a significant portion of straight-line distance for both injec-tion points was covered in the proglacial stream, a series of closely spaced tracer experiments covering both these injection points and other meltwater inlets in the lower ablation zone with detection site close to the glacier ter-minus need to be carried out. Such detailed studies cover-ing seasonal and diurnal development of the glacier hydrological system are important not only for under-standing the glacier dynamics, but also downstream water resource management.
1. Hubbard, B. and Nienow, P., Alpine subglacial hydrology. Qua-ternary Sci. Rev., 1997, 16, 939–955.
2. Werder, M. A., Schuler, T. V. and Funk, M., Short term variations of tracer transit speed on alpine glaciers. Cryosphere, 2010, 4, 381–396.
3. Nienow, P. W., Sharp, M. and Willis, I. C., Seasonal changes in the morphology of the subglacial drainage system, Haut Glacier d’Arolla, Switzerland. Earth Surface Process. – Land, 1998, 23, 825–843.
4. Fountain, A. G., Effect of snow and firn hydrology on the physical and chemical characteristics of glacial runoff. Hydrol. Process., 1996, 10, 509–521.
5. Rothlisberger, H. and Lang, H., Glacial hydrology. In Glacio-Fluvial Sediment Transfer: An Alpine Perspective (eds Gurnell, A. M. and Clark, M. J.), John Wiley, London, 1987, pp. 207–284.
6. Seaberg, S. Z., Seaberg, J. Z., Hooke, R. L. and Seaberg, D. W., Character of the englacial and subglacial drainage system in the lower part of the ablation area of Storglaciaren, Sweden, as revealed by dye tracer studies. J. Glaciol., 1988, 34, 217–227.
7. Walder, J. S. and Fowler, A. C., Channelised subglacial drainage over a deformable bed. J. Glaciol., 1994, 40, 3–15.
8. Hubbard, B. and Glasser, N., Field Techniques in Glaciology and Glacial Geomorphology, John Wiley, London, 2005, p. 400.
9. Brugman, M. M., Water flow at the base of a surging glacier. Ph D thesis, California Institute of Technology, Pasadena, CA, 1986, p. 134.
10. Hock, R. and Hooke, R. L., Evolution of the internal drainage sys-tem in the lower part of the ablation area of storglacieren, Sweden. Geol. Soc. Am. Bull., 1993, 105(4), 537–546.
11. Krimmel, R. M., Tangborn, M. V. and Meier, M. F., Water flow through a temperate glacier. IAHS Publicaton, 1973, 107, 1160–1170.
12. Hasnain, S. I., Jose, P. G., Ahmad, S. and Negi, D. C., Character of subglacial drainage system in the ablation area of Dokriani gla-cier, India as revealed by dye tracer studies. J. Hydrol., 2001, 248, 216–223.
13. Covington, M. D., Banwell, A. F., Gulley, J., Saar, M. O., Willis, I. and Wicks, C. M., Quantifying the effects of glacier conduit
geometry and recharge on proglacial hydrograph form. J. Hydrol., 2012, 414–415, 59–71.
14. Gulley, J. D., Walthard, P., Martin, J., Banwell, A. F., Benn, D. I. and Catania, G., Conduit roughness and dye-trace breakthrough curves: why slow velocity and high dispersivity may not reflect flow in distributed systems. J. Glaciol., 2012, 58(211); doi: 10.3189/2012JoG11J115.
15. Kohler, J., Determining the extent of pressurized flow beneath Storglaciaren, Sweden, using results of tracer experiments and measurements of input and output discharge. J. Glaciol., 1995, 41(138), 217–231.
16. Bali, R., Awasthi, D. D. and Tiwari, N. K., Neotectonic control on the geomorphic evolution of the Gangotri Glacier Valley, Garhwal Himalaya. Gondwana Res., 2003, 6, 829–838.
17. Joshi, G. R. and Hayashi, D., Neotectonic deformation and short-ening along the Himalayan front in the Garhwal region by finite element modeling. Boll. Geofis. Teorica Appl., 2008, 49, 228–233.
18. Haritashya, U. K., Kumar, A. and Singh, P., Particle size charac-teristics of suspended sediment transported in meltwater from the Gangotri Glacier, central Himalaya – An indicator of subglacial sediment evacuation. Geomorphology, 2010, 122, 140–152.
19. Singh, P., Kumar, A. and Kishore, N., Meltwater storage and delaying characteristics of Gangotri Glacier (Indian Himalayas) during ablation season. Hydrol. Process., 2010; DOI:10.1002/ hyp.7828.
20. Scherler, D., Leprince, S. and Strecker, M. R., Glacier-surface ve-locities in alpine terrain from optical satellite imagery – accuracy improvement and quality assessment. Remote Sensing Environ., 2008, 112, 3806–3819.
21. Gulley, J. D., Grabiec, M., Martin, J. B., Jania, J., Catania, G. and Glowacki, P., The effect of discrete recharge by moulins and heterogeneity in flow-path efficiency at glacier beds on sub- glacial hydrology. J. Glaciol., 2012, 58(211); doi:10.3189/ 2012JoG11J189.
22. Naithani, A. K., Nainwal, H. C., Sati, K. K. and Prasad, C., Geo-morphological evidences of retreat of the Gangotri glacier. Curr. Sci., 2001, 80, 87–88.
23. Singh, P., Haritashya, U. K., Ramasastri, K. S. and Kumar, N., Diurnal variations in discharge and suspended sediment concentra-tion, including runoff-delaying characteristics, of the Gangotri Glacier in the Garhwal Himalayas. Hydrol. Process., 2005, 19, 1445–1457.
24. Schuler, T., Fischer, U. H. and Gudmundsson, G. H., Diurnal vari-ability of subglacial drainage conditions as revealed by tracer ex-periments, J. Geophys. Res., 2004, 109, F02008; doi:10.1029/ 2003JF000082.
25. Fountain, A. G. and Walder, J. S., Water flow through temperate glaciers. Rev. Geophys., 1998, 36, 299–328.
26. Singh, V. B., Ramanathan, A. L., Pottakkal, J. G. and Kumar, M., Seasonal variation of the solute and suspended sediment load in Gangotri glacier meltwater, central Himalaya, India. J. Asian Earth Sci., 2014, 79, 224–234.
ACKNOWLEDGEMENTS. We thank the Department of Science and Technology, New Delhi for financial support and Jawaharlal Nehru University, New Delhi for providing the necessary research facilities. Received 31 January 2014; revised accepted 2 July 2014