The accuracy of ab initio molecular geometries for systems containing second-row atoms
12
The accuracy of ab initio molecular geometries for systems containing second-row atoms Sonia Coriani a and Domenico Marchesan Dipartimento di Scienze Chimiche, Università degli Studi di Trieste, via Licio Giorgieri 1, I-34127 Trieste, Italy Jürgen Gauss Institut für Physikalische Chemie, Universität Mainz, D-55099 Mainz, Germany Christof Hättig Forschungszentrum Karlsruhe, Institute of Nanotechnology, P.O. Box 3640, D-76021 Karlsruhe, Germany Trygve Helgaker Department of Chemistry, University of Oslo, P. O. Box 1033 Blindern, N-0315 Oslo, Norway Poul Jørgensen Department of Chemistry, University of Århus, Langelandsgade 140, DK-8000 Århus C, Denmark Received 1 August 2005; accepted 9 September 2005; published online 9 November 2005 The performance of the standard hierarchy of ab initio models—that is, Hartree–Fock theory, second-order Møller–Plesset theory, coupled-cluster singles-and-doubles theory, and coupled-cluster singles-doubles-approximate-triples theory—in combination with correlation-consistent basis sets is investigated for equilibrium geometries of molecules containing second-row elements. From an analysis on a collection of 31 molecules yielding statistical samples of 41 bond distances and 13 bond angles, the statistical errors mean deviation, mean absolute deviation, standard deviation, and maximum absolute deviation are established at each level of theory. The importance of core correlation is examined by comparing calculations in the frozen-core approximation with calculations where all electrons are correlated. © 2005 American Institute of Physics. DOI: 10.1063/1.2104387 I. INTRODUCTION The prediction of molecular equilibrium structures is one of the most common tasks of computational chemistry. In- deed, equilibrium structures are usually accurately deter- mined by standard electronic-structure models and often con- stitute a valid alternative to experimental measurements. 1 In particular, with the establishment of the standard hierarchies of basis sets one-electron space and wave-function models N-electron space over the last two decades, the accuracy of such calculations can now be systematically improved to- wards the exact solution—see, for example, the discussion in Ref. 2. For molecules containing first-row atoms, the errors in the determination of equilibrium structures employing the standard series of N-electron models consisting of Hartree– Fock HF theory, 2,3 second-order Møller–Plesset MP2 per- turbation theory, 4–6 coupled-cluster singles-and-doubles CCSD theory, 7 and coupled-cluster singles-doubles- approximate-triples CCSDT theory 8,9 together with the correlation-consistent basis sets of Dunning and co-workers 10–18 are nowadays well established. Several sta- tistical studies have been carried out on closed-shell mol- ecules containing only hydrogen and first-row atoms, for which experimental data are well known. In a large basis-set study using cc-pVQZ sets, it was found that the mean maxi- mum absolute bond-length errors are 2.6 8.5, 0.5 1.7, 0.7 2.5, and 0.1 0.6 pm for the HF, MP2, CCSD, and CCSDT models, respectively. 1,19–21 For molecules containing second-row atoms, the intrin- sic errors i.e., the errors in the basis-set limit are less well established, partly because of the more demanding computa- tional requirements for such atoms more electrons and partly because the correlation-consistent core-valence basis sets only recently became available for these atoms. 16,17 Al- though many coupled-cluster equilibrium geometries ob- tained with these basis sets have been reported during the last three or four years see, for example, Refs. 17 and 22– 24, no statistical analysis of the performance of the different approaches has been carried out apart from Puzzarini’s study on the XBS and XCP series X =H,F,Cl. 22 Taking advantage of the development of the DALTON Ref. 25 and ACESII Refs. 26 and 27 computer codes for the computation of CCSDT molecular gradients 28–30 and of the development of core-valence correlation-consistent basis sets for second- and third-row atoms, 17 we here analyze the performance of the standard ab initio models HF, MP2, CCSD, and CCSDT for the calculation of equilibrium structures of molecules containing one or more second-row atoms, paying special attention to the importance of core correlation. a FAX: 390405583903. Electronic mail: [email protected] THE JOURNAL OF CHEMICAL PHYSICS 123, 184107 2005 0021-9606/2005/12318/184107/12/$22.50 © 2005 American Institute of Physics 123, 184107-1 Downloaded 14 Sep 2007 to 142.150.190.39. Redistribution subject to AIP license or copyright, see http://jcp.aip.org/jcp/copyright.jsp
-
Upload
independent -
Category
Documents
-
view
5 -
download
0
Transcript of The accuracy of ab initio molecular geometries for systems containing second-row atoms
THE JOURNAL OF CHEMICAL PHYSICS 123, 184107 �2005�
The accuracy of ab initio molecular geometries for systems containingsecond-row atoms
Sonia Coriania� and Domenico MarchesanDipartimento di Scienze Chimiche, Università degli Studi di Trieste, via Licio Giorgieri 1,I-34127 Trieste, Italy
Jürgen GaussInstitut für Physikalische Chemie, Universität Mainz, D-55099 Mainz, Germany
Christof HättigForschungszentrum Karlsruhe, Institute of Nanotechnology, P.O. Box 3640, D-76021 Karlsruhe, Germany
Trygve HelgakerDepartment of Chemistry, University of Oslo, P. O. Box 1033 Blindern, N-0315 Oslo, Norway
Poul JørgensenDepartment of Chemistry, University of Århus, Langelandsgade 140, DK-8000 Århus C, Denmark
�Received 1 August 2005; accepted 9 September 2005; published online 9 November 2005�
The performance of the standard hierarchy of ab initio models—that is, Hartree–Fock theory,second-order Møller–Plesset theory, coupled-cluster singles-and-doubles theory, and coupled-clustersingles-doubles-approximate-triples theory—in combination with correlation-consistent basis sets isinvestigated for equilibrium geometries of molecules containing second-row elements. From ananalysis on a collection of 31 molecules �yielding statistical samples of 41 bond distances and 13bond angles�, the statistical errors �mean deviation, mean absolute deviation, standard deviation, andmaximum absolute deviation� are established at each level of theory. The importance of corecorrelation is examined by comparing calculations in the frozen-core approximation withcalculations where all electrons are correlated. © 2005 American Institute of Physics.�DOI: 10.1063/1.2104387�
I. INTRODUCTION
The prediction of molecular equilibrium structures is oneof the most common tasks of computational chemistry. In-deed, equilibrium structures are usually accurately deter-mined by standard electronic-structure models and often con-stitute a valid alternative to experimental measurements.1 Inparticular, with the establishment of the standard hierarchiesof basis sets �one-electron space� and wave-function models�N-electron space� over the last two decades, the accuracy ofsuch calculations can now be systematically improved to-wards the exact solution—see, for example, the discussion inRef. 2.
For molecules containing first-row atoms, the errors inthe determination of equilibrium structures employing thestandard series of N-electron models consisting of Hartree–Fock �HF� theory,2,3 second-order Møller–Plesset �MP2� per-turbation theory,4–6 coupled-cluster singles-and-doubles�CCSD� theory,7 and coupled-cluster singles-doubles-approximate-triples �CCSD�T�� theory8,9 together with thecorrelation-consistent basis sets of Dunning andco-workers10–18 are nowadays well established. Several sta-tistical studies have been carried out on closed-shell mol-ecules containing only hydrogen and first-row atoms, forwhich experimental data are well known. In a large basis-set
a�
FAX: �390405583903. Electronic mail: [email protected]0021-9606/2005/123�18�/184107/12/$22.50 123, 1841
Downloaded 14 Sep 2007 to 142.150.190.39. Redistribution subject to
study using cc-pVQZ sets, it was found that the mean �maxi-mum� absolute bond-length errors are 2.6 �8.5�, 0.5 �1.7�, 0.7�2.5�, and 0.1 �0.6� pm for the HF, MP2, CCSD, andCCSD�T� models, respectively.1,19–21
For molecules containing second-row atoms, the intrin-sic errors �i.e., the errors in the basis-set limit� are less wellestablished, partly because of the more demanding computa-tional requirements for such atoms �more electrons� andpartly because the correlation-consistent �core-valence� basissets only recently became available for these atoms.16,17 Al-though many coupled-cluster equilibrium geometries ob-tained with these basis sets have been reported during thelast three or four years �see, for example, Refs. 17 and 22–24�, no statistical analysis of the performance of the differentapproaches has been carried out apart from Puzzarini’s studyon the XBS and XCP series �X=H,F,Cl�.22
Taking advantage of the development of the DALTON
�Ref. 25� and ACESII �Refs. 26 and 27� computer codes forthe computation of CCSD�T� molecular gradients28–30 and ofthe development of core-valence correlation-consistent basissets for second- and third-row atoms,17 we here analyze theperformance of the standard ab initio models HF, MP2,CCSD, and CCSD�T� for the calculation of equilibriumstructures of molecules containing one or more second-rowatoms, paying special attention to the importance of core
correlation.© 2005 American Institute of Physics07-1
AIP license or copyright, see http://jcp.aip.org/jcp/copyright.jsp
able.
184107-2 Coriani et al. J. Chem. Phys. 123, 184107 �2005�
II. COMPUTATIONAL DETAILS
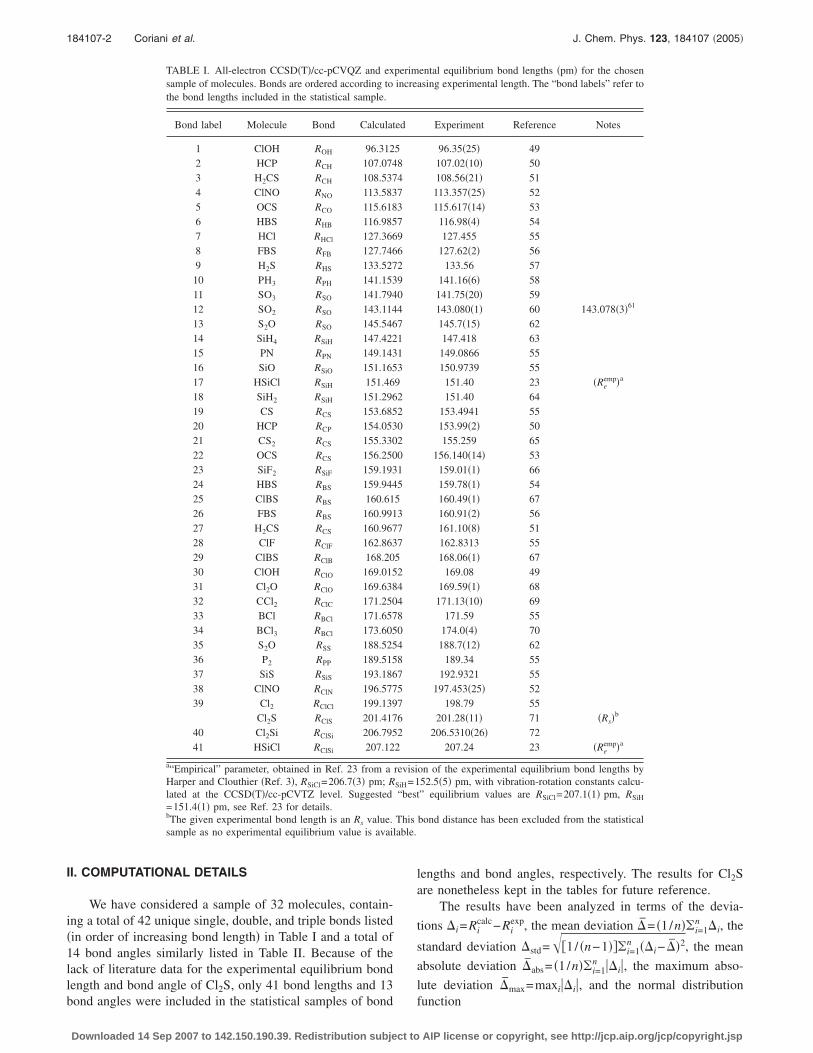
We have considered a sample of 32 molecules, contain-ing a total of 42 unique single, double, and triple bonds listed�in order of increasing bond length� in Table I and a total of14 bond angles similarly listed in Table II. Because of thelack of literature data for the experimental equilibrium bondlength and bond angle of Cl2S, only 41 bond lengths and 13
TABLE I. All-electron CCSD�T�/cc-pCVQZ and exsample of molecules. Bonds are ordered according tothe bond lengths included in the statistical sample.
Bond label Molecule Bond Calculat
1 ClOH ROH 96.3122 HCP RCH 107.0743 H2CS RCH 108.5374 ClNO RNO 113.5835 OCS RCO 115.6186 HBS RHB 116.9857 HCl RHCl 127.3668 FBS RFB 127.7469 H2S RHS 133.527
10 PH3 RPH 141.15311 SO3 RSO 141.79412 SO2 RSO 143.11413 S2O RSO 145.54614 SiH4 RSiH 147.42215 PN RPN 149.14316 SiO RSiO 151.16517 HSiCl RSiH 151.4618 SiH2 RSiH 151.29619 CS RCS 153.68520 HCP RCP 154.05321 CS2 RCS 155.33022 OCS RCS 156.25023 SiF2 RSiF 159.19324 HBS RBS 159.94425 ClBS RBS 160.6126 FBS RBS 160.99127 H2CS RCS 160.96728 ClF RClF 162.86329 ClBS RClB 168.2030 ClOH RClO 169.01531 Cl2O RClO 169.63832 CCl2 RClC 171.25033 BCl RBCl 171.65734 BCl3 RBCl 173.60535 S2O RSS 188.52536 P2 RPP 189.51537 SiS RSiS 193.18638 ClNO RClN 196.57739 Cl2 RClCl 199.139
Cl2S RClS 201.41740 Cl2Si RClSi 206.79541 HSiCl RClSi 207.12
a“Empirical” parameter, obtained in Ref. 23 from aHarper and Clouthier �Ref. 3�, RSiCl=206.7�3� pm; Rlated at the CCSD�T�/cc-pCVTZ level. Suggested=151.4�1� pm, see Ref. 23 for details.bThe given experimental bond length is an Rs value.sample as no experimental equilibrium value is avail
bond angles were included in the statistical samples of bond
Downloaded 14 Sep 2007 to 142.150.190.39. Redistribution subject to
lengths and bond angles, respectively. The results for Cl2Sare nonetheless kept in the tables for future reference.
The results have been analyzed in terms of the devia-
tions �i=Ricalc−Ri
exp, the mean deviation �̄= �1/n��i=1n �i, the
standard deviation �std=��1/ �n−1���i=1n ��i− �̄�2, the mean
absolute deviation �̄abs= �1/n��i=1n ��i�, the maximum abso-
lute deviation �̄max=maxi��i�, and the normal distribution
ental equilibrium bond lengths �pm� for the chosenasing experimental length. The “bond labels” refer to
Experiment Reference Notes
96.35�25� 49107.02�10� 50108.56�21� 51113.357�25� 52115.617�14� 53
116.98�4� 54127.455 55
127.62�2� 56133.56 57
141.16�6� 58141.75�20� 59143.080�1� 60 143.078�3�61
145.7�15� 62147.418 63
149.0866 55150.9739 55
151.40 23 �Reemp�a
151.40 64153.4941 55153.99�2� 50155.259 65
156.140�14� 53159.01�1� 66159.78�1� 54160.49�1� 67160.91�2� 56161.10�8� 51162.8313 55168.06�1� 67
169.08 49169.59�1� 68
171.13�10� 69171.59 55
174.0�4� 70188.7�12� 62
189.34 55192.9321 55
197.453�25� 52198.79 55
201.28�11� 71 �Rs�b
206.5310�26� 72207.24 23 �Re
emp�a
on of the experimental equilibrium bond lengths by52.5�5� pm, with vibration-rotation constants calcu-
t” equilibrium values are RSiCl=207.1�1� pm, RSiH
bond distance has been excluded from the statistical
perimincre
ed
5847379629047113
92202015
5377
5244804875762
2
revisi
SiH=1“bes
This
function
AIP license or copyright, see http://jcp.aip.org/jcp/copyright.jsp

184107-3 Systems containing second-row atoms J. Chem. Phys. 123, 184107 �2005�
TABLE II. All-electron CCSD�T�/cc-pCVQZ and experimental equilibrium bond angles �°� for the chosensample of molecules. Angles are ordered according to increasing experimental angle. The “labels” refer to thebond angles which are included in the statistical sample.
Label Molecule Angle Calculated Experiment Reference Notes
1 SiH2 ��HSiH� 92.203 92.08 642 H2S ��HSH� 92.290 92.11 573 PH3 ��HPH� 93.482 93.33�2� 584 HSiCl ��HSiCl� 95.303 94.66 23 ��e
emp�a
5 SiF2 ��FSiF� 100.911 100.76�2� 666 Cl2Si ��ClSiCl� 101.529 101.3240�16� 727 HOCl ��ClOH� 102.770 102.45�42� 49
Cl2S ��ClSCl� 102.706 102.71�09� 71 ��s�b
8 CCl2 ��ClCCl� 109.279 109.22�10� 699 Cl2O ��ClOCl� 110.982 110.88�1� 6810 ClNO ��ClNO� 113.339 113.320�13� 5211 H2CS ��HCH� 116.294 116.30�25� 7412 S2O ��SSO� 118.038 118.01�43� 6213 SO2 ��OSO� 119.485 119.329�2� 60
aEmpirical parameter, obtained in Ref. 23 from revision of the experimental equilibrium bond angle by Harperand Clouthier �Ref. 73�, ��HSiCl�=96.9�5�°, by means of vibration-rotation constants calculated at theCCSD�T�/cc-pCVTZ level. Suggested best equilibrium value is ��HSiCl�=95.0�5�°, see Ref. 23 for details.bThe given experimental angle is a �s value. This bond angle has been excluded from the statistical sample, asno experimental equilibrium estimate is available.
FIG. 1. Deviations �i from experiment of the calculated equilibrium bond distances �pm� for the chosen sample of molecules in the valence cc-pVXZ �frozen
core� and core-valence cc-pCVXZ �all electron� basis sets. The numbers in abscissa indicate the bond labels listed in Table I.Downloaded 14 Sep 2007 to 142.150.190.39. Redistribution subject to AIP license or copyright, see http://jcp.aip.org/jcp/copyright.jsp
184107-4 Coriani et al. J. Chem. Phys. 123, 184107 �2005�
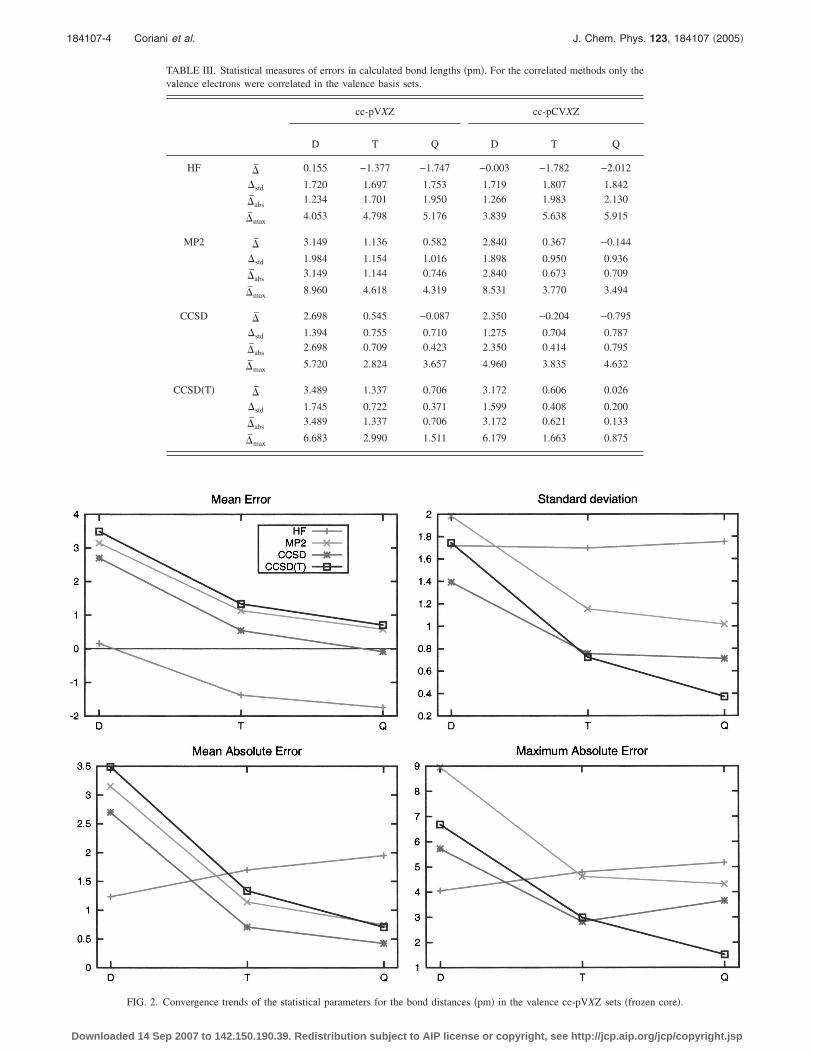
TABLE III. Statistical measures of errors in calculated bond lengths �pm�. For the correlated methods only thevalence electrons were correlated in the valence basis sets.
cc-pVXZ cc-pCVXZ
D T Q D T Q
HF �̄ 0.155 −1.377 −1.747 −0.003 −1.782 −2.012
�std 1.720 1.697 1.753 1.719 1.807 1.842
�̄abs1.234 1.701 1.950 1.266 1.983 2.130
�̄max4.053 4.798 5.176 3.839 5.638 5.915
MP2 �̄ 3.149 1.136 0.582 2.840 0.367 −0.144
�std 1.984 1.154 1.016 1.898 0.950 0.936
�̄abs3.149 1.144 0.746 2.840 0.673 0.709
�̄max8.960 4.618 4.319 8.531 3.770 3.494
CCSD �̄ 2.698 0.545 −0.087 2.350 −0.204 −0.795
�std 1.394 0.755 0.710 1.275 0.704 0.787
�̄abs2.698 0.709 0.423 2.350 0.414 0.795
�̄max5.720 2.824 3.657 4.960 3.835 4.632
CCSD�T� �̄ 3.489 1.337 0.706 3.172 0.606 0.026
�std 1.745 0.722 0.371 1.599 0.408 0.200
�̄abs3.489 1.337 0.706 3.172 0.621 0.133
�̄max6.683 2.990 1.511 6.179 1.663 0.875
FIG. 2. Convergence trends of the statistical parameters for the bond distances �pm� in the valence cc-pVXZ sets �frozen core�.
Downloaded 14 Sep 2007 to 142.150.190.39. Redistribution subject to AIP license or copyright, see http://jcp.aip.org/jcp/copyright.jsp
ond
184107-5 Systems containing second-row atoms J. Chem. Phys. 123, 184107 �2005�
���� =1
�2��std
exp�−1
2� − �̄
�std2� . �1�
Even though we cannot claim that the deviations follow anormal distribution, it is useful to represent the data in termsof such a function to obtain a visualization of the variouslevels of theory. Whereas the center of the distribution isrelated to systematic errors, its width reflects unsystematicerrors characteristic of the approximation.
The calculations were performed with a developmentversion of DALTON,25 containing the gradient implementationof Ref. 28, and with ACESII,26,27 using the gradient imple-mentation described in Refs. 29 and 31. We used the thecorrelation-consistent polarized valence basis sets cc-pVXZ,12,13 the standard polarized core-valence basis sets cc-pCVXZ, the weighted polarized core-valence basis sets cc-pwCVXZ �Refs. 17 and 18�, and the revised polarized va-lence basis sets cc-pV�X+d�Z.16 All sets were used with car-dinal numbers 2�X�4.
All calculations with valence basis sets were carried outin the frozen-core approximation, whereas the core-valencecalculations were carried out with only the second-row 1selectrons frozen, as recommended in Ref. 17. The latter cal-
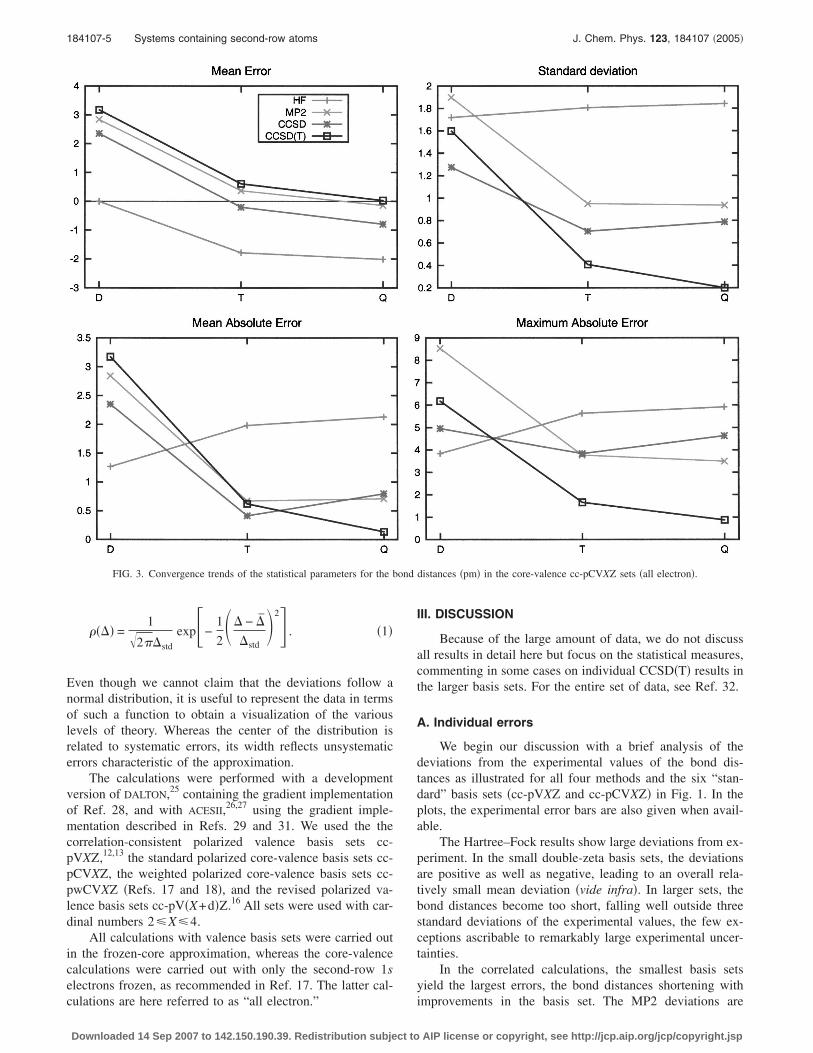
FIG. 3. Convergence trends of the statistical parameters for the b
culations are here referred to as “all electron.”
Downloaded 14 Sep 2007 to 142.150.190.39. Redistribution subject to
III. DISCUSSION
Because of the large amount of data, we do not discussall results in detail here but focus on the statistical measures,commenting in some cases on individual CCSD�T� results inthe larger basis sets. For the entire set of data, see Ref. 32.
A. Individual errors
We begin our discussion with a brief analysis of thedeviations from the experimental values of the bond dis-tances as illustrated for all four methods and the six “stan-dard” basis sets �cc-pVXZ and cc-pCVXZ� in Fig. 1. In theplots, the experimental error bars are also given when avail-able.
The Hartree–Fock results show large deviations from ex-periment. In the small double-zeta basis sets, the deviationsare positive as well as negative, leading to an overall rela-tively small mean deviation �vide infra�. In larger sets, thebond distances become too short, falling well outside threestandard deviations of the experimental values, the few ex-ceptions ascribable to remarkably large experimental uncer-tainties.
In the correlated calculations, the smallest basis setsyield the largest errors, the bond distances shortening with
distances �pm� in the core-valence cc-pCVXZ sets �all electron�.
improvements in the basis set. The MP2 deviations are
AIP license or copyright, see http://jcp.aip.org/jcp/copyright.jsp
mple
184107-6 Coriani et al. J. Chem. Phys. 123, 184107 �2005�
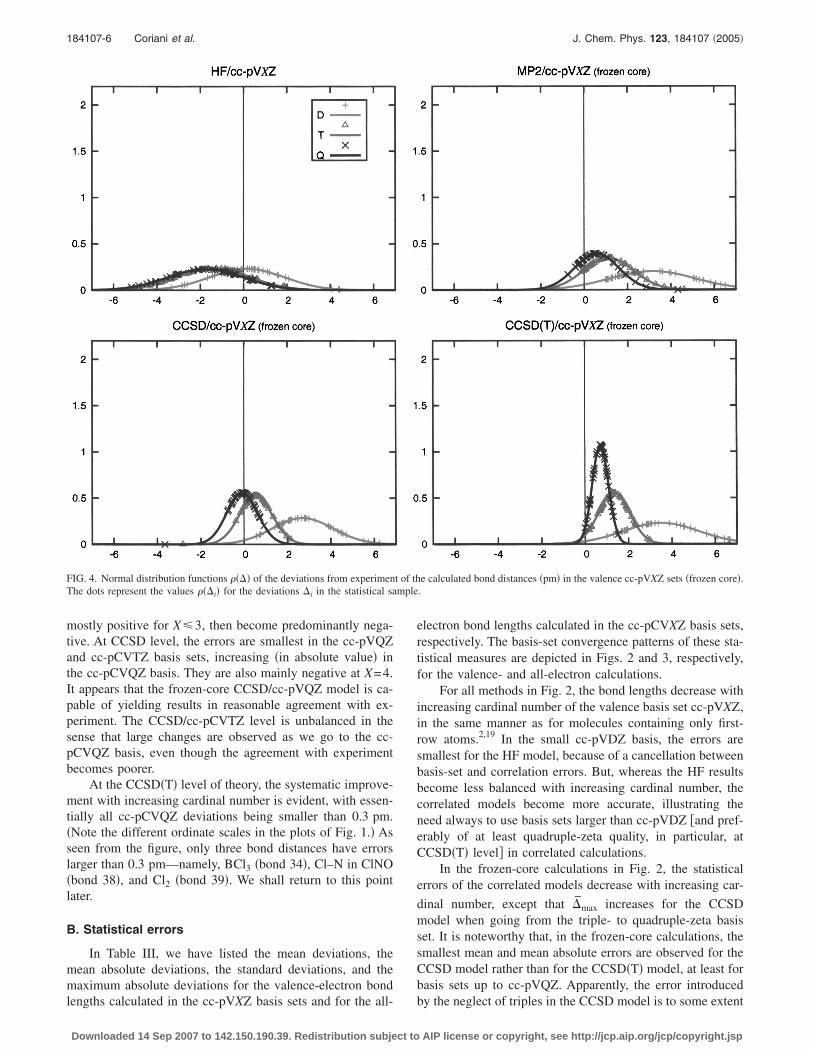
mostly positive for X�3, then become predominantly nega-tive. At CCSD level, the errors are smallest in the cc-pVQZand cc-pCVTZ basis sets, increasing �in absolute value� inthe cc-pCVQZ basis. They are also mainly negative at X=4.It appears that the frozen-core CCSD/cc-pVQZ model is ca-pable of yielding results in reasonable agreement with ex-periment. The CCSD/cc-pCVTZ level is unbalanced in thesense that large changes are observed as we go to the cc-pCVQZ basis, even though the agreement with experimentbecomes poorer.
At the CCSD�T� level of theory, the systematic improve-ment with increasing cardinal number is evident, with essen-tially all cc-pCVQZ deviations being smaller than 0.3 pm.�Note the different ordinate scales in the plots of Fig. 1.� Asseen from the figure, only three bond distances have errorslarger than 0.3 pm—namely, BCl3 �bond 34�, Cl–N in ClNO�bond 38�, and Cl2 �bond 39�. We shall return to this pointlater.
B. Statistical errors
In Table III, we have listed the mean deviations, themean absolute deviations, the standard deviations, and themaximum absolute deviations for the valence-electron bond
FIG. 4. Normal distribution functions ���� of the deviations from experimenThe dots represent the values ���i� for the deviations �i in the statistical sa
lengths calculated in the cc-pVXZ basis sets and for the all-
Downloaded 14 Sep 2007 to 142.150.190.39. Redistribution subject to
electron bond lengths calculated in the cc-pCVXZ basis sets,respectively. The basis-set convergence patterns of these sta-tistical measures are depicted in Figs. 2 and 3, respectively,for the valence- and all-electron calculations.
For all methods in Fig. 2, the bond lengths decrease withincreasing cardinal number of the valence basis set cc-pVXZ,in the same manner as for molecules containing only first-row atoms.2,19 In the small cc-pVDZ basis, the errors aresmallest for the HF model, because of a cancellation betweenbasis-set and correlation errors. But, whereas the HF resultsbecome less balanced with increasing cardinal number, thecorrelated models become more accurate, illustrating theneed always to use basis sets larger than cc-pVDZ �and pref-erably of at least quadruple-zeta quality, in particular, atCCSD�T� level� in correlated calculations.
In the frozen-core calculations in Fig. 2, the statisticalerrors of the correlated models decrease with increasing car-
dinal number, except that �̄max increases for the CCSDmodel when going from the triple- to quadruple-zeta basisset. It is noteworthy that, in the frozen-core calculations, thesmallest mean and mean absolute errors are observed for theCCSD model rather than for the CCSD�T� model, at least forbasis sets up to cc-pVQZ. Apparently, the error introduced
e calculated bond distances �pm� in the valence cc-pVXZ sets �frozen core�..
t of th
by the neglect of triples in the CCSD model is to some extent
AIP license or copyright, see http://jcp.aip.org/jcp/copyright.jsp
184107-7 Systems containing second-row atoms J. Chem. Phys. 123, 184107 �2005�
canceled by the neglect of core correlation. Still, the perfor-mance of the CCSD�T� model is more systematic, with thesmallest standard deviation and smallest maximum error inthe cc-pVQZ basis.
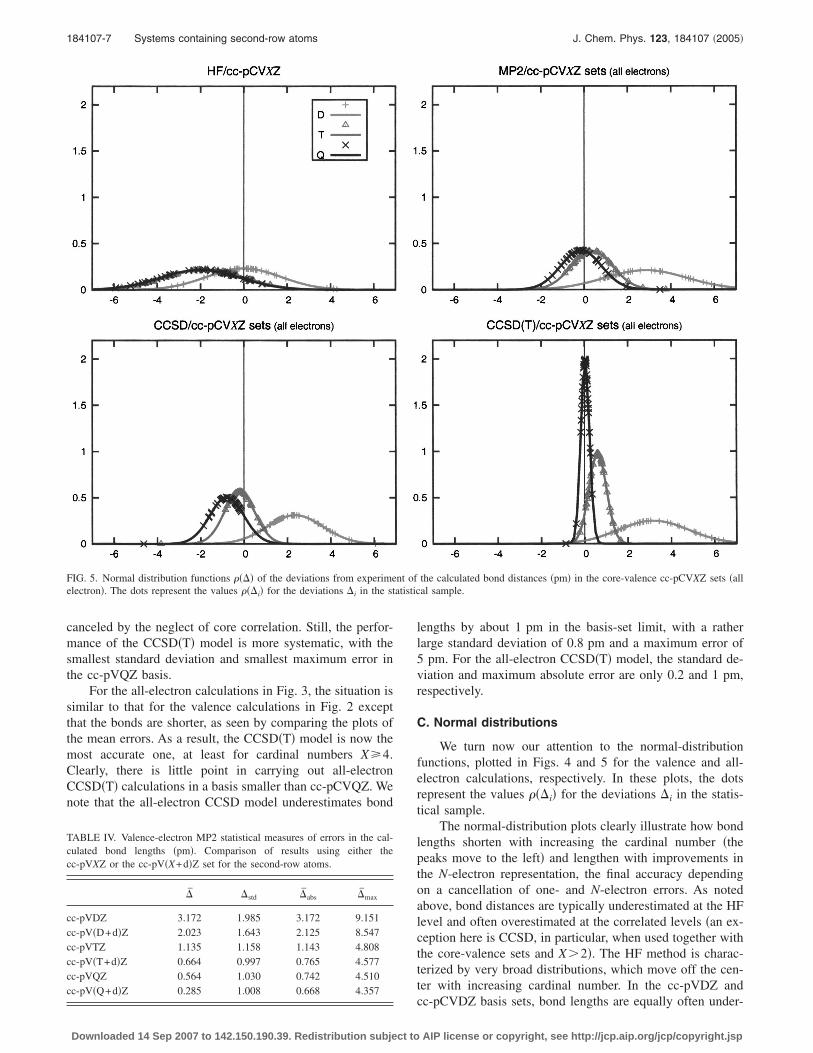
For the all-electron calculations in Fig. 3, the situation issimilar to that for the valence calculations in Fig. 2 exceptthat the bonds are shorter, as seen by comparing the plots ofthe mean errors. As a result, the CCSD�T� model is now themost accurate one, at least for cardinal numbers X�4.Clearly, there is little point in carrying out all-electronCCSD�T� calculations in a basis smaller than cc-pCVQZ. Wenote that the all-electron CCSD model underestimates bond
TABLE IV. Valence-electron MP2 statistical measures of errors in the cal-culated bond lengths �pm�. Comparison of results using either thecc-pVXZ or the cc-pV�X+d�Z set for the second-row atoms.
�̄ �std �̄abs �̄max
cc-pVDZ 3.172 1.985 3.172 9.151cc-pV�D+d�Z 2.023 1.643 2.125 8.547cc-pVTZ 1.135 1.158 1.143 4.808cc-pV�T+d�Z 0.664 0.997 0.765 4.577cc-pVQZ 0.564 1.030 0.742 4.510cc-pV�Q+d�Z 0.285 1.008 0.668 4.357
FIG. 5. Normal distribution functions ���� of the deviations from experimeelectron�. The dots represent the values ���i� for the deviations �i in the st
Downloaded 14 Sep 2007 to 142.150.190.39. Redistribution subject to
lengths by about 1 pm in the basis-set limit, with a ratherlarge standard deviation of 0.8 pm and a maximum error of5 pm. For the all-electron CCSD�T� model, the standard de-viation and maximum absolute error are only 0.2 and 1 pm,respectively.
C. Normal distributions
We turn now our attention to the normal-distributionfunctions, plotted in Figs. 4 and 5 for the valence and all-electron calculations, respectively. In these plots, the dotsrepresent the values ���i� for the deviations �i in the statis-tical sample.
The normal-distribution plots clearly illustrate how bondlengths shorten with increasing the cardinal number �thepeaks move to the left� and lengthen with improvements inthe N-electron representation, the final accuracy dependingon a cancellation of one- and N-electron errors. As notedabove, bond distances are typically underestimated at the HFlevel and often overestimated at the correlated levels �an ex-ception here is CCSD, in particular, when used together withthe core-valence sets and X�2�. The HF method is charac-terized by very broad distributions, which move off the cen-ter with increasing cardinal number. In the cc-pVDZ and
the calculated bond distances �pm� in the core-valence cc-pCVXZ sets �allal sample.
nt ofatistic
cc-pCVDZ basis sets, bond lengths are equally often under-
AIP license or copyright, see http://jcp.aip.org/jcp/copyright.jsp
184107-8 Coriani et al. J. Chem. Phys. 123, 184107 �2005�
estimated and overestimated by HF theory; in larger basissets, they are mostly but not invariably underestimated.Basis-set convergence is already reached in the cc-pVTZ ba-sis, although some changes are observed when the cardinalnumber is incremented further and when core functions areadded.
For the correlated models, our first observation is thatthe double-zeta basis sets �even with core functions in-cluded� are too small, producing bonds that are always toolong. A considerable improvement is observed at the triple-zeta level, although a quadruple-zeta basis is needed in
TABLE V. Comparison of frozen-core CCSD�T�/CCSD�T�/cc-pCVQZ and cc-pwCVQZ bond lengthssubset of 22 bonds in the chosen sample of molecule
Label Molecule Bond cc-pVQZ cc-pV
I HCP RCH 107.2180 107II OCS RCO 115.8270 115III HBS RHB 117.2069 117IV HCl RHCl 127.6926 127V FBS RFB 128.0376 128VI PN RPN 149.8680 149VII SiO RSiO 152.0055 151VIII HSiCl RHSi 151.938 151IX CS RCS 154.3483 154X HCP RCP 154.7278 154XI OCS RCS 156.8986 156XII SiF2 RSiF 160.0077 159XIII HBS RBS 160.5829 160XIV ClBS RBS 161.236 161XV FBS RBS 161.6221 161XVI ClF RClF 163.6086 163XVII ClBS RClB 168.843 168XVIII BCl RBCl 172.4609 172XIX P2 RPP 190.5176 190XX SiS RSiS 194.1928 193XXI Cl2 RClCl 200.3013 199XXII HSiCl RClSi 208.216 207
aFrom Ref. 22.bFrom Ref. 50.cFrom Ref. 53.dFrom Ref. 54.eFrom Ref. 55.fFrom Ref. 56.gFrom Ref. 23.hFrom Ref. 66.iFrom Ref. 67.
TABLE VI. CCSD�T� statistical measures of errors in the calculated bondlengths �pm�. Comparison of results obtained using the cc-pVQZ,cc-pV�Q+d�Z, cc-pCVQZ, and cc-pwCVQZ basis sets for a subset of 22bonds.
Valence only All electron
cc-pVQZ cc-pV�Q+d�Z cc-pCVQZ cc-pwCVQZ
�̄ 0.755 0.548 0.102 0.024
�std 0.347 0.225 0.106 0.097
�̄abs0.755 0.548 0.121 0.069
�̄max1.511 0.934 0.350 0.268
Downloaded 14 Sep 2007 to 142.150.190.39. Redistribution subject to
CCSD�T� theory for convergence. In passing, we note thatthe quadruple-zeta basis set is not needed for the connectedtriple excitations as such but rather for the doubles, which inCCSD�T� theory need to be more accurately described thanin CCSD theory in order for the small triples correction to betruely useful.33
Comparing the CCSD and MP2 models �both of whichignore connected triples�, we first note that the MP2 modelgives longer bonds than does the CCSD model. This behav-ior, which occurs also for molecules consisting only of first-row atoms, is typical of second-order perturbationtheory,1,19–21 as well as of the perturbative corrections used inCCSD�T�. It is likewise observed, in fact, for CCSD�T� bonddistances relative to CCSDT distances.34,35 We next note thatthe normal distributions are slightly more central and peakedin valence-electron CCSD theory than in valence-electronMP2 theory. However, with core correlation included, theMP2 model typically gives a slightly better geometry, theall-electron CCSD/cc-pCVQZ bonds being too short. Thebetter description of the electrons provided by the CCSDmodel is mainly reflected in its standard deviation, which issmaller than in MP2 theory. Also, the CCSD model is morerobust than the MP2 model in the sense that it gives feweroutliers.
QZ and cc-pV�Q+d�Z bond lengths, all-electronexperimental equilibrium bond lengths �pm� for a
�Z cc-pCVQZ cc-pwCVQZ Experiment
107.0748 107.07a 107.02�10�b
115.6183 115.5986 115.617�14�c
116.9857 116.97a 116.98�4�d
127.3669 127.3421 127.455e
127.7466 127.70a 127.62�2�f
149.1431 149.0271 149.0866e
151.1653 150.9617 150.9739e
151.469 151.4003 151.40g
153.6852 153.6083 153.4941e
154.0530 153.97a 153.99�2�b
156.2500 156.1823 156.140�14�c
159.1931 159.0208 159.01�1�h
159.9445 159.88a 159.78�1�d
160.615 160.54 160.49�1�i
160.9913 160.92a 160.91�2�f
162.8637 162.8194 162.8313e
168.205 168.16a 168.06�1�i
171.6578 171.5827 171.59e
189.5158 189.4113 189.34e
193.1867 193.0563 192.9321e
199.1397 199.0584 198.79e
207.122 207.0036 207.24g
cc-pV, ands.
�Q+d
.2167
.8430
.2113
.5602
.0448
.6295
.7041
.7962
.1527
.5467
.6851
.6874
.4561
.1173
.4879
.1823
.6855
.3078
.1931
.8663
.6573
.7836
The CCSD�T� method shows an overall systematic be-
AIP license or copyright, see http://jcp.aip.org/jcp/copyright.jsp
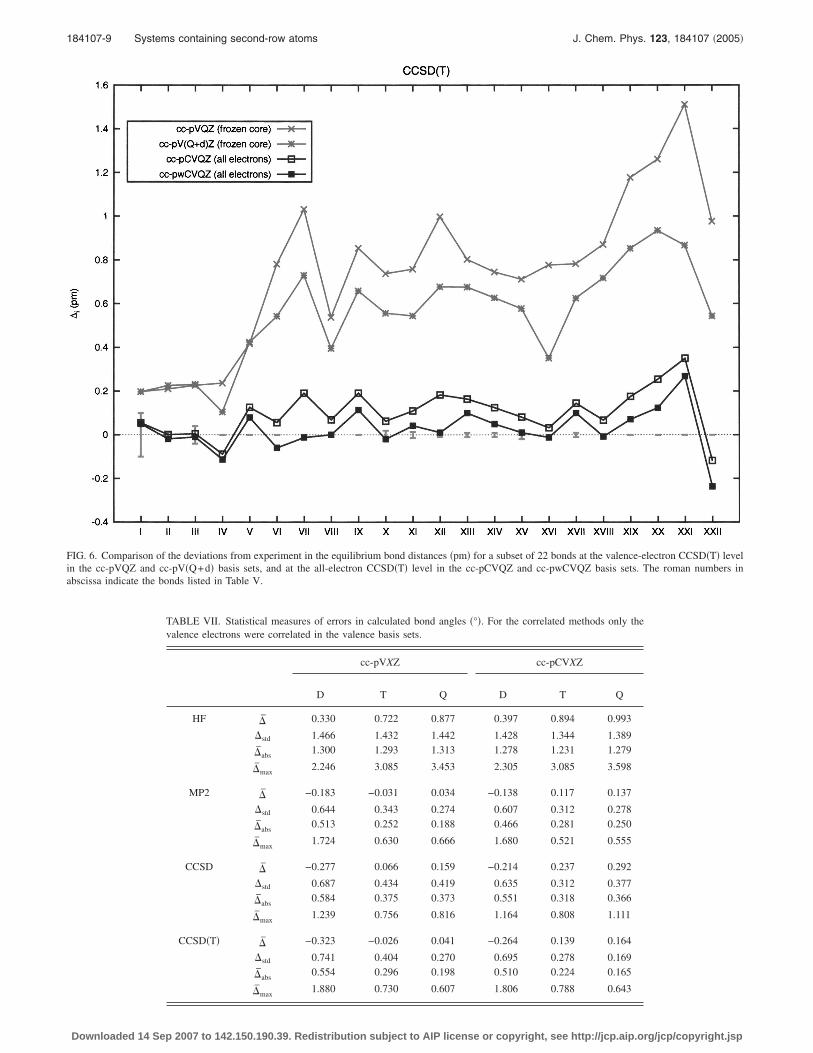
abscissa indicate the bonds listed in Table V.
184107-9 Systems containing second-row atoms J. Chem. Phys. 123, 184107 �2005�
TABLE VII. Statistical measures of errors in calculated bond angles �°�. For the correlated methods only thevalence electrons were correlated in the valence basis sets.
cc-pVXZ cc-pCVXZ
D T Q D T Q
HF �̄ 0.330 0.722 0.877 0.397 0.894 0.993
�std 1.466 1.432 1.442 1.428 1.344 1.389
�̄abs1.300 1.293 1.313 1.278 1.231 1.279
�̄max2.246 3.085 3.453 2.305 3.085 3.598
MP2 �̄ −0.183 −0.031 0.034 −0.138 0.117 0.137
�std 0.644 0.343 0.274 0.607 0.312 0.278
�̄abs0.513 0.252 0.188 0.466 0.281 0.250
�̄max1.724 0.630 0.666 1.680 0.521 0.555
CCSD �̄ −0.277 0.066 0.159 −0.214 0.237 0.292
�std 0.687 0.434 0.419 0.635 0.312 0.377
�̄abs0.584 0.375 0.373 0.551 0.318 0.366
�̄max1.239 0.756 0.816 1.164 0.808 1.111
CCSD�T� �̄ −0.323 −0.026 0.041 −0.264 0.139 0.164
�std 0.741 0.404 0.270 0.695 0.278 0.169
�̄abs0.554 0.296 0.198 0.510 0.224 0.165
�̄max1.880 0.730 0.607 1.806 0.788 0.643
FIG. 6. Comparison of the deviations from experiment in the equilibrium bond distances �pm� for a subset of 22 bonds at the valence-electron CCSD�T� levelin the cc-pVQZ and cc-pV�Q+d� basis sets, and at the all-electron CCSD�T� level in the cc-pCVQZ and cc-pwCVQZ basis sets. The roman numbers in
Downloaded 14 Sep 2007 to 142.150.190.39. Redistribution subject to AIP license or copyright, see http://jcp.aip.org/jcp/copyright.jsp
184107-10 Coriani et al. J. Chem. Phys. 123, 184107 �2005�
havior, the distributions becoming narrower and more centralwith each increment in the cardinal number—in particular,when core correlation is included, see Fig. 5. It is importantto note, however, that high accuracy is only achieved withlarge basis sets and with all electrons correlated. Thus, at thedouble-zeta level, bond lengths are in some cases overesti-mated by more than 6 pm; in the cc-pCVQZ basis and withall electrons correlated, the largest deviation from experi-ment is 0.9 pm, the mean absolute error and standard devia-tion being 0.13 and 0.20 pm, respectively—see Table III.
It should be noted, however, that the all-electronCCSD�T�/cc-pCVQZ statistics are strongly affected by theinclusion in the sample of ClNO and BCl3, for which thedeviations are larger than 0.3 pm. If these molecules are ex-cluded, the mean absolute error and standard deviation arereduced to 0.10 and 0.12 pm, respectively—see also thecomparison of the cc-pCVQZ and cc-pwCVQZ in Sec. III D.
Thus, the high accuracy of the all-electron CCSD�T�model in a core-valence quadruple-zeta basis, already ob-served for molecules containing only first-row atoms, is alsoobserved for molecules containing second-row atoms. Inspite of the fact that the cc-pCVQZ does not represent thebasis-set limit for the CCSD�T� model and in spite of the factthat the CCSD�T� model is not equal to the fullconfiguration-interaction �FCI� model �noting that quadrupleexcitations have been found to be important in otherinstances36,37�, it does represent a cost-effective way to cal-culate bond distances with an accuracy comparable to experi-ment.
D. The revised valence and weighted core-valencebasis sets
We conclude our discussion of bond lengths by compar-ing the performance of the revised cc-pV�X+d�Z basis sets�designed for improved convergence of dissociation energiesfor molecules with second-row atoms� and the standard va-lence cc-pVXZ basis sets, and by comparing the performanceof the weighted core-valence cc-pwCVQZ basis sets and thestandard cc-pCVQZ basis sets.
In Table IV, we have collected the statistical parametersobtained at the valence-electron MP2 level of theory, usingeither the cc-pVXZ basis for all atoms or the cc-pV�X+d�Zbasis for the second-row atoms and the cc-pVXZ basis forthe remaining atoms. The reductions in the mean and maxi-mum absolute deviations are small, at least at the quadruple-zeta level of theory: 0.67 and 4.4 pm, respectively, in the cc-pV�Q+d�Z basis versus 0.74 and 4.5 pm in the cc-pVQZ set.By contrast, a larger change is observed in the mean devia-tion, which is reduced from 0.56 pm in the standard basis to0.29 pm in the revised basis. As expected, mainly bond dis-tances involving second-row atoms are appreciably affectedby the use of the revised basis sets, the effect on the otherbonds being marginal �in particular on those between H andfirst-row atoms�.
In Table V, we compare the results obtained at thevalence-electron CCSD�T� level using either the cc-pVQZbasis or the cc-pV�Q+d�Z basis for the second-row atoms,
for a subset of the considered molecules containing 22Downloaded 14 Sep 2007 to 142.150.190.39. Redistribution subject to
bonds. For almost all bonds, and in particular those tosecond-row atoms, a small but significant shortening is ob-served when the cc-pV�Q+d�Z basis is used, improving theagreement with experiment. The effect on the statistical pa-rameters is summarized in Table VI. Although we thereforeadvocate the use of the revised basis sets for second-rowatoms, it should be recognized that, for a significant andsystematic improvement relative to experiment, it is neces-sary to correlate the core electrons.
In Table V we also compare the all-electron CCSD�T�bond lengths obtained in the cc-pCVQZ and cc-pwCVQZbasis sets with experiment. The corresponding relative devia-tions from the experimental values are shown in Fig. 6, to-gether with those for the standard and revised valence sets.In general, the deviations from experiment are smaller for thecc-pwCVQZ basis sets than for the cc-pCVQZ set. The sta-tistical parameters, recalculated for these bonds, are also col-lected in Table VI. A slight improvement is observed for all
statistical measures: �̄�cc-pCVQZ�=0.10 pm vs �̄�cc-pwCVQZ�=0.02 pm; �std�cc-pCVQZ�=0.106 vs �std�cc-
pwCVQZ�=0.097; �̄abs�cc-pCVQZ�=0.12 pm vs �̄abs�cc-
pwCVQZ�=0.07 pm and �̄max�cc-pCVQZ�=0.35 pm vs
�̄max�cc-pwCVQZ�=0.27 pm. From Fig. 6, we note that theimprovement with the weighted basis arises from a shorten-ing of bond lengths. However, this improvement is marginalcompared with the improvement observed by going from thecc-pCVTZ basis to the cc-pCVQZ basis. Still, since the cc-pwCVQZ and cc-pCVQZ basis sets are of the same size, werecommend the use of the weighted basis sets.
E. Statistics on bond angles
In Table II, we have listed the experimental bond anglesfor the molecules in Table I, along with the CCSD�T�/cc-pCVQZ bond angles. In Table VII the statistical errors forthe standard levels of theory are collected, in the same man-ner as those for the bond lengths in Table III. Note that,whereas our bond-length analysis is based on a rather largesample of 41 bond lengths, the bond-angle sample contains13 bond angles—a rather small sample, especially in view ofthe relatively large uncertainties in some of the experimentalangles.
The errors in the bond angles follow the same pattern asfor the bond lengths, which again are similar to those foundfor molecules containing only hydrogen and first-rowatoms.2,20 In general, bond angles increase with increasingcardinal number, so as to offset the increased repulsion be-tween the two nonbonded atoms that follows from the simul-taneous bond-length contraction.2 From Tables II and VII, itappears that bond angles are relatively easily calculated towithin a few tenths of a degree.
Comparing Tables III and VII, we note that the differ-ences among the correlated models appear to be smaller forbond angles than for bond lengths. In the same manner, thedifferences between valence- and all-electron errors aresmaller for bond angles than for bond lengths. However,these differences may not be intrinsic to the computational
models but may follow from larger errors in the experimentalAIP license or copyright, see http://jcp.aip.org/jcp/copyright.jsp
184107-11 Systems containing second-row atoms J. Chem. Phys. 123, 184107 �2005�
bond angles than in the experimental bond distances �as re-flected in the larger error bars for the bond angles�.
IV. CONCLUSIONS
For molecules containing second-row atoms, we haveexamined the errors in bond distances and bond angles cal-culated with the standard N-electron models HF, MP2,CCSD, and CCSD�T� using correlation-consistent basis setswith cardinal numbers X�4, with and without core correla-tion included. At the all-electron CCSD�T�/cc-pCVQZ levelof theory, the mean absolute errors are 0.13 pm for bondlengths and 0.2° for bond angles; without core correlation,the CCSD�T�/cc-pVQZ errors are 0.7 pm and 0.2°, respec-tively. Without core correlation, the errors in the equilibriumstructures are thus almost 1 pm. The errors are slightly re-duced by using the cc-pwCVQZ basis rather than the cc-pCVQZ basis. At the all-electron CCSD/cc-pCVQZ level oftheory, the mean absolute errors are 0.8 pm and 0.4°, respec-tively, while the corresponding MP2 errors of 0.7 pm and0.3° are slightly smaller—that is, about an order or magni-tude larger than at the CCSD�T� level of theory.
To reduce errors below 0.1 pm, we must improve theone-electron description by going beyond the quadruple-zetalevel or by using basis-set extrapolation,38,39 and we mustalso improve the N-electron description by relaxing thetriples34,40 and by including higher excitations. For mol-ecules consisting of first-row atoms, basis-set extension be-yond X=4 shortens bonds by about 0.1 pm, triples relaxationshortens them further by a smaller amount, whereas the in-clusion of quadruples lengthen the bonds by0.1–0.2 pm,36,37,41–44 leading to a well balancing of the er-rors in calculations at the CCSD�T�/cc-pCVQZ level. A simi-lar cancellation of errors may be expected for molecules con-taining also second-row atoms judging from the results ofthis investigation.
Another aspect that warrants further attention is the ac-curacy of the experimental data. The experimental data usedin this investigation are of variable accuracy, depending onthe system complexity. The statistical analysis depends criti-cally on this accuracy, as demonstrated, for instance, by thereduction of the CCSD�T�/cc-pCVQZ mean absolute error to0.1 pm if the data for ClNO and BCl3 are not taken intoaccount. Even though it could be argued that the large devia-tions between calculated and experimental results for ClNOdepend on an incomplete treatment of electroncorrelation,45,46 it may in general be appropriate to revise theexperimental data. Empirical equilibrium geometries, basedon experimental rotational constants and calculatedvibration-rotation interaction constants,21,47,48 offer an attrac-tive route to more accurate reference data. Such a revision,previously undertaken for molecules containing first-rowatoms,21 is planned for molecules containing second-row at-oms.
ACKNOWLEDGMENTS
One of the authors �S.C.� thanks C. Degli Esposti, A.Halkier, and C. Puzzarini for fruitful discussions. This work
has been supported by the Danish Research Council �GrantDownloaded 14 Sep 2007 to 142.150.190.39. Redistribution subject to
No. 9901973� and by the European Training and ResearchNetworks MOLPROP �“Molecular Properties and MolecularMaterials,” Contract No. HPRN-CT-2000-00013� andNANOQUANT �“Understanding Nanomaterials from aQuantum Perspective,” Contract No. MRTN-CT-2003-506842�. One of the authors �S.C.� acknowledges supportfrom the Italian Ministero dell’Istruzione, Università eRicerca �MIUR�, Programmi di ricerca di interesse nazionale�PRIN2004�. One of the authors �J.G.� acknowledges supportfrom the Deutsche Forschungsgemeinschaft and the Fondsder Chemischen Industrie.
1 T. Helgaker, T. A. Ruden, P. Jørgensen, J. Olsen, and W. Klopper, J.Phys. Org. Chem. 17, 913 �2004�.
2 T. Helgaker, P. Jørgensen, and J. Olsen, Molecular Electronic-StructureTheory �Wiley, Chichester, 2000�.
3 A. Szabo and N. Ostlund, Modern Quantum Chemistry �McGraw-Hill,New York, 1982�.
4 C. Møller and M. S. Plesset, Phys. Rev. 46, 618 �1934�.5 M. Head-Gordon, J. A. Pople, and M. J. Frisch, Chem. Phys. Lett. 153,503 �1988�.
6 S. Sæbø and J. Almlöf, Chem. Phys. Lett. 154, 83 �1989�.7 G. D. Purvis and R. J. Bartlett, J. Chem. Phys. 76, 1910 �1982�.8 K. Raghavachari, G. W. Trucks, J. A. Pople, and M. Head-Gordon,Chem. Phys. Lett. 157, 479 �1989�.
9 R. J. Bartlett, J. D. Watts, S. A. Kucharski, and J. Noga, Chem. Phys.Lett. 165, 513 �1990�.
10 T. H. Dunning, Jr., J. Chem. Phys. 90, 1007 �1989�.11 R. A. Kendall, T. H. Dunning, Jr., and R. J. Harrison, J. Chem. Phys. 96,
6796 �1992�.12 D. E. Woon and T. H. Dunning, Jr., J. Chem. Phys. 98, 1358 �1993�.13 D. E. Woon and T. H. Dunning, Jr., J. Chem. Phys. 100, 2975 �1994�.14 D. E. Woon and T. H. Dunning, Jr., J. Chem. Phys. 103, 4572 �1995�.15 A. K. Wilson, D. E. Woon, K. A. Peterson, and T. H. Dunning, Jr., J.
Chem. Phys. 110, 7667 �1999�.16 T. H. Dunning, Jr., K. A. Peterson, and A. K. Wilson, J. Chem. Phys.
114, 9244 �2001�.17 K. A. Peterson and T. H. Dunning, Jr., J. Chem. Phys. 117, 10548 �2002�.18 The basis sets were obtained from the Extensible Computational Chem-
istry Environment Basis Set Database, Version 1.0, as developed anddistributed by the Molecular Science Computing Facility, Environmentaland Molecular Sciences Laboratory which is part of the Pacific NorthwestLaboratory, P. O. Box 999, Richland, Washington 99352, USA, andfunded by the U. S. Department of Energy. PNL is a multiprogram labo-ratory operated by Batelle Memorial Institute for the U.S. Department ofEnergy under Contract No. DE-AC06–76RLO 1830.
19 T. Helgaker, J. Gauss, P. Jørgensen, and J. Olsen, J. Chem. Phys. 106,6430 �1997�.
20 K. L. Bak, J. Gauss, P. Jørgensen, J. Olsen, T. Helgaker, and J. F. Stanton,J. Chem. Phys. 114, 6548 �2001�.
21 F. Pawlowski, P. Jørgensen, J. Olsen, F. Hegelund, T. Helgaker, J. Gauss,K. L. Bak, and J. F. Stanton, J. Chem. Phys. 116, 6482 �2002�.
22 C. Puzzarini, Phys. Chem. Chem. Phys. 6, 344 �2004�.23 J. Vazquez and J. F. Stanton, J. Phys. Chem. A 106, 4429 �2002�.24 G. Winnewisser, F. Lewen, S. Thorwirth, M. Behnke, J. Hahn, J. Gauss,
and E. Herbst, Chem.-Eur. J. 9, 5501 �2003�.25 T. Helgaker, H. J. A. Jensen, P. Jørgensen et al., computer code DALTON
Release 1.2, 2001, see http://www.kjemi.uio.no/software/dalton/dalton.html.
26 J. F. Stanton, J. Gauss, J. D. Watts, W. J. Lauderdale, and R. J. Bartlett,computer code ACESII, 1992, see also http://www.aces2.de.
27 J. F. Stanton, J. Gauss, J. D. Watts, W. J. Lauderdale, and R. J. Bartlett,Int. J. Quantum Chem., Quantum Chem. Symp. 26, 879 �1992�.
28 K. Hald, A. Halkier, P. Jørgensen, S. Coriani, C. Hättig, and T. Helgaker,J. Chem. Phys. 118, 2985 �2003�.
29 J. D. Watts, J. Gauss, and R. J. Bartlett, Chem. Phys. Lett. 200, 1 �1992�.30 J. D. Watts, J. Gauss, and R. J. Bartlett, J. Chem. Phys. 98, 8718 �1993�.31 J. Gauss, J. F. Stanton, and R. J. Bartlett, J. Chem. Phys. 95, 2623 �1991�.32
See EPAPS Document No. E-JCPSA6-123-304540 for the complete setAIP license or copyright, see http://jcp.aip.org/jcp/copyright.jsp
184107-12 Coriani et al. J. Chem. Phys. 123, 184107 �2005�
of data. This document can be reached via a direct link in the onlinearticle’s HTML reference section or via the EPAPS homepage �http://www.aip.org/pubservs/epaps.html�.
33 W. Klopper, J. Noga, H. Koch, and T. Helgaker, Theor. Chem. Acc. 97,164 �1997�.
34 A. Halkier, P. Jørgensen, J. Gauss, and T. Helgaker, Chem. Phys. Lett.274, 235 �1997�.
35 D. A. Feller and J. A. Sordo, J. Chem. Phys. 112, 5604 �2000�.36 T. A. Ruden, T. Helgaker, P. Jørgensen, and J. Olsen, J. Chem. Phys. 121,
5874 �2004�.37 M. Heckert, M. Kállay, and J. Gauss, Mol. Phys. 103, 2109 �2005�.38 M. Heckert, M. Kállay, J. Gauss, D. Tew, and W. Klopper �to be submit-
ted�.39 F. Pawlowski, A. Halkier, P. Jørgensen, K. L. Bak, T. Helgaker, and W.
Klopper, J. Chem. Phys. 118, 2539 �2003�.40 J. Gauss and J. F. Stanton, J. Chem. Phys. 116, 1773 �2002�.41 S. A. Kucharski, J. D. Watts, and R. J. Bartlett, Chem. Phys. Lett. 302,
295 �1999�.42 S. A. Kucharski, M. Kolaski, and R. J. Bartlett, J. Chem. Phys. 114, 892
�2001�.43 M. Musial, S. A. Kucharski, M. Kolaski, and R. J. Bartlett, J. Mol.
Struct.: THEOCHEM 547, 269 �2001�.44 S. Hirata, T. Yanai, W. A. de Jong, T. Nakajima, and K. Hirao, J. Chem.
Phys. 120, 3297 �2004�.45 C. L. Janssen and I. M. Beck Nielsen, Chem. Phys. Lett. 290, 423
�1998�.46 I. M. Beck Nielsen and C. L. Janssen, Chem. Phys. Lett. 310, 568
�1999�.47 J. F. Stanton, C. L. Lopreore, and J. Gauss, J. Chem. Phys. 108, 7190
�1998�.48 P. Pulay, W. Meyer, and J. Boggs, J. Chem. Phys. 68, 5077 �1968�.49 W. Darlene Anderson, M. C. L. Gerry, and R. Wellington Davis, J. Mol.
Spectrosc. 115, 117 �1986�.50 C. Puzzarini, R. Tarroni, P. Palmieri, J. Demaison, and M. L. Senent, J.
Chem. Phys. 105, 3132 �1996�.51 P. H. Turner, L. Halonen, and I. M. Mills, J. Mol. Spectrosc. 88, 402
�1981�.52 G. Cazzoli, C. Degli Esposti, P. Palmieri, and S. Simeone, J. Mol.
Spectrosc. 97, 165 �1983�.
Downloaded 14 Sep 2007 to 142.150.190.39. Redistribution subject to
53 J. Lahaye, R. Vandenhaute, and A. Fayt, J. Mol. Spectrosc. 123, 48�1987�.
54 P. Turner and I. Mills, Mol. Phys. 46, 161 �1982�.55 K. P. Huber and G. H. Herzberg, Molecular Spectra and Molecular Struc-
ture, Constants of Diatomic Molecules �Van Nostrand-Reinhold, NewYork, 1979�.
56 L. Bizzocchi and C. Degli Esposti, J. Chem. Phys. 115, 7041 �2001�.57 T. H. Edwards, N. K. Moncur, and L. E. Snyder, J. Chem. Phys. 46, 2139
�1967�.58 D. A. Helms and W. Gordy, J. Mol. Spectrosc. 66, 206 �1977�.59 V. Meyer, D. Sutter, and H. Dreizler, Z. Naturforsch., A: Phys. Sci. 46,
710 �1991�.60 Y. Morino, M. Tanimoto, and S. Saito, Acta Chem. Scand., Ser. A 42,
346 �1988�.61 J. Flaud and W. J. Lafferty, J. Mol. Spectrosc. 161, 396 �1993�.62 J. Lindenmayer, H. D. Rudolph, and H. Jones, J. Mol. Spectrosc. 119, 56
�1986�.63 K. Ohno, H. Matsuura, Y. Endo, and E. Hirota, J. Mol. Spectrosc. 111, 73
�1985�.64 C. Yamada, H. Kanamori, E. Hirota, N. Nishiwaki, N. Itabashi, K. Kato,
and T. Goto, J. Chem. Phys. 91, 4582 �1989�.65 J. H. Callomon, E. Hirota, T. Iijima, K. Kuchitsu, and W. J. Lafferty, in
Landolt-Börnstein: Structure Data of Free Polyatomic Molecules, editedby K. Hellwege and A. M. Hellwege, Landolt-Börnstein, New Series,Group II, Vol. 15 �Springer, Berlin, 1987�.
66 H. Shoji, T. Tanaka, and E. Hirota, J. Mol. Spectrosc. 47, 268 �1973�.67 L. Bizzocchi, C. Degli Esposti, and C. Puzzarini, J. Mol. Spectrosc. 216,
177 �2002�.68 M. Sugie, M. Ayabe, H. Takeo, and C. Matsumura, J. Mol. Struct. 352/
353, 259 �1995�.69 J. Demaison, L. Margulès, J. M. L. Martin, and J. E. Boggs, Phys. Chem.
Chem. Phys. 4, 87 �2002�.70 A. G. Gerhikov, V. P. Spiridonov, and E. Z. Zasorin, J. Mol. Struct.:
THEOCHEM 99, 1 �1983�.71 L. Bizzocchi, L. Cludi, C. Degli Esposti, and A. Giorgi, J. Mol.
Spectrosc. 204, 275 �2000�.72 M. Fujitake and E. Hirota, Spectrochim. Acta, Part A 50, 1345 �1994�.73 W. W. Harper and D. J. Clouthier, J. Chem. Phys. 106, 9461 �1997�.74 J. L. Duncan, Mol. Phys. 28, 1177 �1974�.
AIP license or copyright, see http://jcp.aip.org/jcp/copyright.jsp