Heading encoding in the macaque ventral intraparietal area (VIP)

SRwNC
BouaMBRpdiDCp
K
A(nafpt1epwwEeua
s(pn1sI
F
A
R
0d
ubcortical and Ventral Prefrontal Cortical Neuralesponses to Facial Expressions Distinguish Patientsith Bipolar Disorder and Major Depression
atalia S. Lawrence, Andrew M. Williams, Simon Surguladze, Vincent Giampietro, Michael J. Brammer,hristopher Andrew, Sophia Frangou, Christine Ecker, and Mary L. Phillips
ackground: Bipolar disorder (BD) is characterised by abnormalities in mood and emotional processing, but the neural correlatesf these, their relationship to depressive symptoms, and the similarities with deficits in major depressive disorder (MDD) remainnclear. We compared responses within subcortical and prefrontal cortical regions to emotionally salient material in patients with BPnd MDD using functional magnetic resonance imaging.ethods: We measured neural responses to mild and intense expressions of fear, happiness, and sadness in euthymic and depressedD patients, healthy control subjects, and depressed MDD patients.esults: Bipolar disorder patients demonstrated increased subcortical (ventral striatal, thalamic, hippocampal) and ventralrefrontal cortical responses particularly to mild and intense fear, mild happy, and mild sad expressions. Healthy control subjectsemonstrated increased subcortical responses to intense happy and mild fear, and increased dorsal prefrontal cortical responses tontense sad expressions. Overall, MDD patients showed diminished neural responses to all emotional expressions except mild sadness.epression severity correlated positively with hippocampal response to mild sadness in both patient groups.onclusions: Compared with healthy controls and MDD patients, BD patients demonstrated increased subcortical and ventralrefrontal cortical responses to both positive and negative emotional expressions.
ey Words: Bipolar disorder, depression, facial expressions, fMRI
bnormalities in emotion processing have previously beendemonstrated in patients with affective disorders such asbipolar disorder (BD) and major depressive disorder
MDD) (Phillips et al 2003b), but little is known about theeuropsychological and neuroanatomical correlates of thesebnormalities and the extent to which they are state or traiteatures of the disorders. The neural basis of the reportederceptual bias toward negative, and away from positive, emo-ional stimuli in MDD patients (David and Cutting 1990; Gur et al992; Suslow et al 2001; Surguladze et al, in press) and that of themotional lability frequently observed in BD patients remainoorly understood, for example. Furthermore, the extent tohich neural abnormalities distinguish BD from MDD patientsith similar illness severity and medication remains unexplored.lucidating the nature of abnormalities in neural response tomotive stimuli in BD and MDD will, therefore, help to increasenderstanding of the functional neuroanatomical basis of vulner-bility to, and symptoms of, these psychiatric disorders.
Abnormalities in the identification of emotional facial expres-ions, a process of critical importance for social interactionDarwin 1872/1965), have previously been demonstrated inatients with BD. Depressed BD patients show impaired recog-ition of happy and sad facial expressions (Rubinow and Post992) and a bias toward identifying neutral facial expressions asad (George et al 1998; Gur et al 1992; Lior and Nachson 1999).n euthymic patients with BD, findings indicate an enhanced
rom the Sections of Neuroscience and Emotion (NSL, AMW, SS, CE, MLP)and Neurobiology of Psychosis (SF); Division of Psychological Medicine,Brain Image Analysis Unit (VG, MJB); and Neuroimaging Research Group(CA), Institute of Psychiatry, London, United Kingdom.
ddress reprint requests to Dr. Natalia S. Lawrence, Section of Neuroscienceand Emotion, Box PO69, De Crespigny Park, London SE5 8AF, UnitedKingdom.
eceived July 22, 2003; revised November 18, 2003; accepted November 20,2003.
006-3223/04/$30.00oi:10.1016/j.biopsych.2003.11.017
ability to discriminate expressions of disgust (Harmer et al 2002).Studies employing nonfacial emotion processing tasks, includingthe emotional Stroop task (Williams et al 1996) and the affectivego/no-go task (Murphy et al 1999), have demonstrated atten-tional biases toward negatively valenced stimuli in depressed BDpatients (Lyon et al 1999; Murphy et al 1999) and in manicpatients, biases toward negative (Lyon et al 1999) and positive(Murphy et al 1999) stimuli. These findings indicate in BDpatients impaired recognition of emotional stimuli and an atten-tional bias toward positive and negative stimuli, with the latterbeing associated with depressive episodes in particular.
In MDD, some studies have reported a generalized emotionidentification deficit (Jaeger et al 1987; Rubinow and Post 1992;Persad and Polivy 1993; Mikhailova et al 1996; Asthana et al1998), while others have demonstrated an attentional bias towardnegative emotional material. Studies have demonstrated a spe-cific impairment in the identification of happy expressions(Suslow et al 2001) and a response bias away from identifyingexpressions as happy (Surguladze et al, in press) and towardidentifying expressions as sad (David and Cutting 1990; Gur et al1992; Hale 1998). Studies employing nonfacial stimuli havefurther shown negative emotional biases during memory recall(Bradley et al 1996), the emotional Stroop task (Kerr and Phillips2002; Williams et al 1996), and an affective go/no-go task(Murphy et al 1999). It is unclear whether these abnormalitiespersist in MDD patients during remission.
Studies employing a variety of techniques have highlightedthe importance of specific subcortical regions in the response toemotionally salient material (Calder et al 2001; Davis and Whalen2001), namely, the amygdala, ventral striatum (including caudatenucleus, ventral putamen, and globus pallidus), and dorsomedialnucleus of the thalamus, in addition to the hippocampus andparahippocampal gyrus (Alexander et al 1990; Calder et al 2001).These regions may be involved both in the identification andgeneration of emotional states (Phillips et al 2003a). There is alsoincreasing evidence for the role of different regions of ventraland dorsal prefrontal cortex in the generation and regulation ofemotional states, respectively, in response to emotionally salient
BIOL PSYCHIATRY 2004;55:578–587© 2004 Society of Biological Psychiatry
mMcr“rbv
tspcs(tBmfdrarsn
ampsIomaacece(tnTctctp
wspifBteaaette
N.S. Lawrence et al BIOL PSYCHIATRY 2004;55:578–587 579
aterial (e.g., Beauregard et al 2001; Levesque et al 2003;ayberg et al 1999; reviewed in Phillips et al 2003a). In the
urrent study, these subcortical, ventral, and dorsal prefrontalegions and the hippocampus, referred to subsequently assubcortical and prefrontal regions,” were therefore included asegions of interest (ROIs), and between-group differences inlood oxygen level dependent (BOLD) response within acti-ated clusters located within these regions were examined.
Previous research has demonstrated increased amygdala ac-ivation and decreased right dorsolateral prefrontal cortex re-ponses to fearful facial expressions in a group of stable bipolaratients (Yurgelun-Todd et al 2000, 2001). Additionally, in-reased subcortical (basal ganglia) activity has been demon-trated in BD patients during performance of a motor taskCaligiuri et al 2003), supporting previous findings of hyperme-abolism in striatal (Drevets et al 1997; O’Connell et al 1995;lumberg et al 2000) and pallidal (Mayberg 2001) regions inanic and depressed BD patients, respectively. These initial
indings suggest increased activity in subcortical regions andecreased dorsal prefrontal cortical activity in BD patients inesponse to emotionally salient stimuli and also during cognitivend motor task performance. The extent to which these findingsepresent symptom-related activity and the relative magnitude ofubcortical and prefrontal cortical responses to positive andegative stimuli in BD remain unexplored.
In MDD patients, emerging evidence indicates increasedctivity within subcortical regions at rest and during task perfor-ance (Drevets et al 1992, 1995; Mayberg et al 1999) and aositive correlation between amygdalar metabolism and depres-ion severity (Abercrombie et al 1998; Drevets et al 1992).ncreased activation of the left amygdala to masked presentationf facial expressions, which resolves with antidepressant treat-ent (Sheline et al 2001), and decreased attenuation of the
mygdalar response to emotional words (Siegle et al 2002) havelso been reported in these patients. Furthermore, studies haveonsistently demonstrated in patients during a major depressivepisode reduced activity within dorsal regions of the prefrontalortex (e.g., Baxter et al 1989; Buchsbaum et al 1997; Goodwint al 1993) but increased activity within ventral prefrontal cortexDrevets et al 1992, 1995), including enhanced response withinhe rostral anterior cingulate gyrus and orbitofrontal cortex toegative emotional stimuli (Elliott et al 2002; Phillips et al 2003b).ogether, these findings indicate increased activity within sub-ortical and ventral prefrontal cortical regions to negative emo-ional stimuli and decreased activity within dorsal prefrontalortical regions in MDD patients. It is unclear, however, whetherhe magnitude of these abnormal neural responses correlateositively with depressive symptom severity.
We wished to examine the nature of functional abnormalitiesithin subcortical and prefrontal cortical regions in response to
ocially salient emotive stimuli in BD and MDD patients. Inarticular, we aimed to determine whether in BD abnormalities
n subcortical and prefrontal cortical responses to emotionalacial expressions were symptom related and whether depressedD and MDD patients could be distinguished on the basis of
hese responses. Therefore, we measured neural responses inuthymic and depressed BD patients, depressed MDD patients,nd healthy volunteers to facial expressions of positive (happy)nd negative (sad and fear) emotions compared with neutralxpressions. These emotional expressions represent, respec-ively, displays of social approval, internal distress, and externalhreat. We employed expressions of mild and intense emotion toxamine whether abnormal neural responses in both patient
groups occurred both to subtle and prototypical expressions offacial emotion, the former approximating more closely expres-sions observed in everyday life. We therefore reasoned that anybetween-group differences in neural response to such stimuliwould emerge more clearly in response to the subtle expres-sions. We did not specifically wish to determine the effect ofemotional category or intensity per se on patterns of subcorticaland prefrontal cortical response to these stimuli, however, nordid we wish to examine between-group differences in neuralresponse to faces per se, since these were beyond the focus ofour study. Based on current data we predicted that:
1. Bipolar disorder patients would demonstrate an enhancedresponse in subcortical regions previously identified asimportant in processing positive and negative emotionalexpressions to all expressions, including an enhancedamygdalar response to fearful expressions; and
2. Major depressive disorder patients would demonstrate in-creased activity within these subcortical regions to negativebut not positive facial expressions.
Findings to date did not permit us to make specific predic-tions regarding the nature of prefrontal cortical responses tofacial expressions in BD and MDD patients compared withhealthy volunteers, although they would suggest decreaseddorsal prefrontal cortical responses in both patient populations.
Methods and Materials
ParticipantsTwelve participants with a diagnosis of bipolar I affective
disorder (DSM-IV criteria, American Psychiatric Association 1994)and 9 participants with a diagnosis of major depressive disorder(DSM-IV criteria, American Psychiatric Association 1994) wererecruited from the South London and Maudsley National HealthService Trust. Eleven healthy control subjects (CON) were re-cruited from the local community. Ethical approval was obtainedfrom the Ethical Committee of the South London and MaudsleyTrust and Institute of Psychiatry. All participants signed a state-ment of informed consent. All participants were right-handed(Edinburgh Handedness Inventory, Oldfield 1971) and matchedfor age (overall mean 41 � 11 years) and gender ratio (c. 40%females). The BD and CON groups were matched for years ofeducation (respectively, mean 15.4 � SD 1.6 and mean 17.1 �SD 3), but the MDD group had fewer years of education than theCON group (13.44 � 2.45, p � .05). Exclusion criteria included ahistory of head injury, illicit substance abuse, and comorbiddiagnoses. Mean duration of illness in BD patients was 15.4 �13.4 years, and in MDD patients, mean duration of illness was 8� 5 years. Bipolar disorder patients without any episodes ofmania or major depression in the previous 6 months wererecruited for the study. There were no residual manic symptomsin the BD patients, as assessed using the Mania Rating Scale(Young et al 1978); mania scores ranged from 2 to 7. Depressionseverity was measured in all groups on the day of testing usingthe Beck Depression Inventory (BDI) (Beck et al 1961). MeanBDI scores were greater in MDD than BD patients (respectively,31.8 � 11.8 and 15.3 � 9.2), while both patient groups hadhigher BDI scores than CON group, whose mean BDI score was2.27 � 2.28. Three BD patients were euthymic (BDI � 9) at thetime of testing, seven patients reported mild symptoms ofdepression (BDI 10–19), and two patients had moderate tosevere depression (BDI � 20). Two MDD patients were mildlydepressed, two were moderately depressed (BDI � 20), and five
www.elsevier.com/locate/biopsych
wmiatwoM(nmt
P
idmmi(oipneapt3iaisdtsn(iProi
eTFfjiods
I
1aRnbs
580 BIOL PSYCHIATRY 2004;55:578–587 N.S. Lawrence et al
w
ere severely depressed (BDI � 30). All BD patients were takingedication; five (45%) were on selective serotonin reuptake
nhibitors (SSRIs), five (45%) were on atypical antipsychotics,nd nine (82%) were on mood stabilizers. Three (27%) wereaking lithium, four (36%) were taking sodium valproate, 2 (18%)ere taking carbamazepine, and one (9%) was taking lam-trigine. Six BD patients were taking combination treatments. AllDD patients were taking antidepressant medication; three
33%) were taking SSRIs, four (44%) were taking selectiveoradrenaline reuptake inhibitors, one (11%) was taking aonoamine oxidase inhibitor, and one (11%) was taking a
ricyclic antidepressant.
rocedureSubjects participated in three, 6-minute experiments employ-
ng event-related functional magnetic resonance imaging (fMRI),escribed previously (Surguladze et al 2003). In each experi-ent, subjects were presented with 10 different facial identities,anipulated by computer software to depict 50% and 100%
ntensities of one emotion (either sadness, happiness, or fear)Young et al 2002), in addition to a 100% neutral expression. Inne experiment, subjects viewed 20 prototypically happy (10dentities with expressions of 100% happiness, each stimulusresented twice), 20 mildly happy (expressions of 50% happi-ess), and 20 neutral (100% neutral) expressions. In the otherxperiments, subjects viewed similar numbers of neutral, mildlynd prototypically sad or fearful expressions. Facial stimuli wereresented for 2 seconds each in a pseudorandom order. Duringhe interstimulus interval, the duration of which was varied fromto 8 seconds according to a Poisson distribution with average
nterval of 4.9 seconds, subjects viewed a fixation cross. Wedopted an event-related design with a variable interstimulusnterval to reduce habituation of the BOLD response in regionsuch as the amygdala, since habituation is a problem in blockesigns with highly repetitive and predictable stimulus presen-ation (e.g., Breiter et al 1996). Previous studies have demon-trated that neural responses to emotional stimuli depend on theature of the task performed. Since performance on an implicitgender decision) task is more reliably associated with responsesn subcortical and extrastriate cortical regions (Morris et al 1996;hillips et al 1997), we asked participants to decide the genderather than the emotional expression of each face and press onef two buttons accordingly with the right thumb. All subjectsdentified the gender of the faces correctly.
After the scanning session, participants completed a comput-rized test of emotion identification and the Recognition Memoryest (Warrington 1984) or the Short Recognition Memory Test foraces (Warrington 1996) as an indirect measure of nonemotionalace perception. The emotion identification task required sub-ects to identify neutral faces and expressions of mild (50%) andntense (100%) sadness, happiness, fear, and disgust presentedn a laptop computer screen in a pseudorandom order. Majorepressive disorder and BD patients did not differ from controlubjects on the performance of either task.
mage AcquisitionMagnetic resonance images were acquired using a GE Signa
.5 Tesla system (General Electric, Milwaukee, Wisconsin) withn operating console and software (Advanced Nuclear Magneticesonance, Woburn, Massachusetts) for gradient echo echopla-ar imaging (EPI) at the Maudsley Hospital. A quadratureirdcage head coil was used for radiofrequency (RF) transmis-ion and reception. One hundred and eighty T2*-weighted
ww.elsevier.com/locate/biopsych
images depicting BOLD contrast were acquired at each of 16near-axial noncontiguous 7-mm thick planes parallel to theintercommissural (anterior commissure-posterior commissure[AC-PC]) line: echo time (TE) � 40 milliseconds, repetition time(TR) � 2 seconds, in-plane resolution � 3.44 mm, interslice gap� .7 mm, matrix size � 64 � 64 pixels. High-resolution inversionrecovery EPI images were acquired for subsequent localizationof functional activation (3-mm thick, near-axial slices: TE � 73milliseconds, time to inversion [TI] � 180 milliseconds, TR � 16seconds, in-plane resolution � 1.72 mm, interslice gap � .3 mm,matrix size � 128 � 128 pixels).
fMRI Data AnalysisIndividual Analysis. Before time series analysis, data were
processed to remove low-frequency signal changes and motion-related artifacts (Bullmore et al 1999a) and smoothed using aGaussian filter (full-width half-maximum [FWHM] 7.2 mm). Theresponses at each voxel were then analyzed using Gammavariate functions (peak responses weighted from 4 to 8 seconds)convolved with each contrast vector (i.e., experimental condi-tion) to model the BOLD response. Following least-squaresfitting of this model, a goodness of fit statistic (sum of squareratio [SSQ]) composed of the ratio of model to residual sum ofsquares was calculated for each contrast. The distribution of thesame statistics under the null hypothesis of no experimentaleffect was then calculated by wavelet-based resampling of thetime series at each voxel and refitting the models to the resa-mpled data (Bullmore et al 2001; Breakspear et al, in press). Anexperimentally derived null distribution of the goodness of fitstatistic was then derived by following this procedure 10 times ateach intracerebral voxel and combining the resulting data.Activations for any contrast at any required p value can then bedetermined by obtaining the appropriate critical values from thenull distribution. Individual brain activation maps were producedfor each subject within each emotion experiment for neutralexpressions compared with the fixation cross baseline, and foreach emotion intensity compared with neutral expressions.
Group MappingTo extend inference to the group level, the observed and
randomized SSQ ratio maps were transformed into standardspace (Talairach and Tournoux 1988) by a two-stage process(Brammer et al 1997) using spatial transformations computed foreach subject’s high-resolution structural scan. A group activationmap was produced for each experimental condition by testingthe median observed SSQ ratio over all subjects at each voxel instandard space (median values were used to minimize outliereffects) against a critical value of the permutation distribution formedian SSQ ratio ascertained from the spatially transformedwavelet-permuted data (Brammer et al 1997). For greater sensi-tivity and to reduce the multiple comparison problem encoun-tered in fMRI, hypothesis testing was carried out at the clusterlevel using methods developed by Bullmore et al (1999b).Essentially, this involved first thresholding at a voxelwise prob-ability of false activation of .025, combining all three-dimensional(3D) contiguous activated voxels into clusters and then assessingthe probability of occurrence of clusters under the null hypoth-esis by reference to the distributions produced when the nulldata, produced by time-series permutation, were similarly ana-lyzed. At a clusterwise probability of false activation of .001 inthis series of experiments, the expected number of false-positiveactivations over the whole of standard space was less than 1 (.5).
G
fvgaatsiiieoaeeptbdeg(wbwifst(ddecwwaccpo
wspgebBtadSlh
R
N
n
N.S. Lawrence et al BIOL PSYCHIATRY 2004;55:578–587 581
roup DifferencesSeveral functional ROIs were selected for further analysis
rom the 50% intensity versus neutral and the 100% intensityersus neutral expression maps for each emotion from eachroup. These functional ROIs included clusters of significantctivation located in subcortical regions (amygdala, ventral stri-tum, thalamus), the hippocampus/parahippocampal gyrus, ven-ral prefrontal regions involved in the perception of emotionaltimuli, and dorsal prefrontal cortical regions believed to benvolved in the regulation of emotion. As outlined in thentroduction, our analytical approach was to examine activationn areas suggested (from the literature) to be important inmotional processing and which were significantly activated byur tasks. Care was taken to select ROIs from all three groups,nd approximately 20 ROIs were selected for each of the sixmotional versus neutral contrasts (three categories of emotion,ach at two intensities). The SSQ ratio, as a measure of the meanower of neural response, was then extracted from each func-ional ROI in each participant. The SSQ is analogous to a Z scoreut, unlike a Z score, does not rely on the assumptions of normalistribution of data. Mean SSQ values within ROIs for eachmotional versus neutral contrast were compared across all threeroups using nonparametric between-subject comparisonsKruskal-Wallis test for k independent groups) with SPSS soft-are (SPSS, Inc., Chicago, Illinois). Outliers were removedefore these between-group comparisons and a p-value of .01as considered significant to minimize type I errors. Regions of
nterest showing a significant overall group effect at p � .01 wereurther examined for differences between separate groups usingpecific nonparametric pairwise contrasts. Mean SSQ values inhese ROIs were also extracted from the control conditionneutral expressions versus fixation cross in each of the threeifferent emotion experiments) to control for any between-groupifferences in baseline neural response to faces per se withinach experiment. Finally, simple nonparametric (Spearman)orrelation analyses were carried out using SPSS to determinehether SSQ values in each ROI showed a significant correlationith depressive symptoms (BDI score), both within each groupnd across all subjects. In addition, since the MDD group hadompleted fewer years of education than the CON group,orrelations between SSQ and years of education were com-uted within each group to determine any influence of this factorn brain activation.
Medication effects on neural response during task performanceere assessed within each patient group by dividing patients into
ubgroups determined by whether they were taking or not taking aarticular type of medication. In ROIs in which significant between-roup differences in SSQ had been demonstrated in response tomotion-neutral expression contrasts, mean SSQs were comparedetween patient subgroups with Mann–Whitney U tests in SPSS.ipolar disorder patients were divided into subgroups taking or not
aking lithium, antipsychotic, and antidepressant medications. Sincell MDD patients were taking antidepressant medication, they wereivided into four subgroups (levels 1–4) according to the criteria ofackeim (2001), with those within levels 1 to 2 coded as theow-dose subgroup and those within levels 3 to 4 coded as theigh-dose subgroup.
esults
eural Responses to Facial ExpressionsGroup activation maps for 50% and 100% emotional versus
eutral expressions for happy, sad, and fearful faces were
generated as described above. Numerous brain regions wereconsistently activated more to emotional faces than to neutralfaces. These included the cerebellum, bilateral fusiform gyri,middle and superior temporal gyri, several subcortical regions(amygdala, parahippocampal cortex, thalamus, caudate, puta-men), ventral and dorsal prefrontal cortex, precuneus, andinferior parietal cortex. Full details (coordinates, cluster size) ofthe group activation maps are available on request. To test ourspecific predictions, we focus here on between-group compari-sons of neural responses within our specific theoretical andfunctional ROIs in subcortical, ventral, and dorsal prefrontalregions to these emotion-neutral contrasts.
Tables 1, 2, and 3 describe the ROIs selected from the groupmaps for detailed comparison for each emotion-neutral condi-tion. These regions showed significant overall between-groupdifferences in neural response (SSQ) using the Kruskal-Wallis testfor three groups (p � .01). Results of post hoc pairwise between-group contrasts (Mann–Whitney U scores) are given in the finalcolumn. Tables 1, 2, and 3 also indicate which ROIs weresignificantly correlated with depression scores and years ofeducation within groups and in which ROIs there were signifi-cant effects of medication.
Differences in Neural Response to Fearful ExpressionsBipolar disorder patients demonstrated a significantly greater
neural response to mild fear than either CON subjects or MDDpatients in the right globus pallidus/anterior thalamus (Table 1,Figure 1). In response to intense fear, BD patients showed asignificantly larger neural response than either CON subjects orMDD patients in a cluster encompassing the left amygdala andventrolateral prefrontal cortex (Brodmann’s area [BA] 47) (Table1, Figure 2). Closer examination of this cluster revealed that thebetween-group difference in activation in the ventrolateral pre-frontal cortex (22 voxels) was greater than that within theamygdala (10 voxels).
Control subjects demonstrated a significantly greater neuralresponse to mild fear than both patient groups in a clusterencompassing the right amygdala and hippocampus and in theright dorsolatersal prefrontal cortex (Table 1). Both CON subjectsand BD patients demonstrated a significantly greater response tomild fear than MDD patients in the left medial prefrontal cortex.In response to intense fear, both CON subjects and BD patientsshowed a greater neural response than MDD patients in the rightglobus pallidus/anterior thalamus.
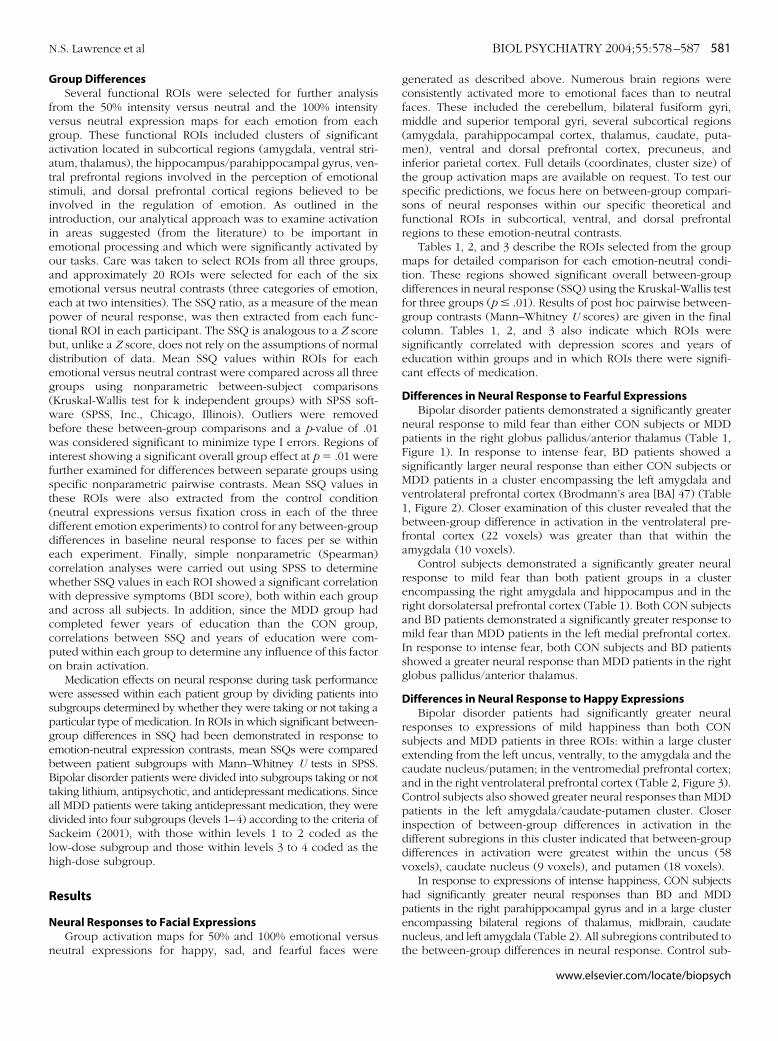
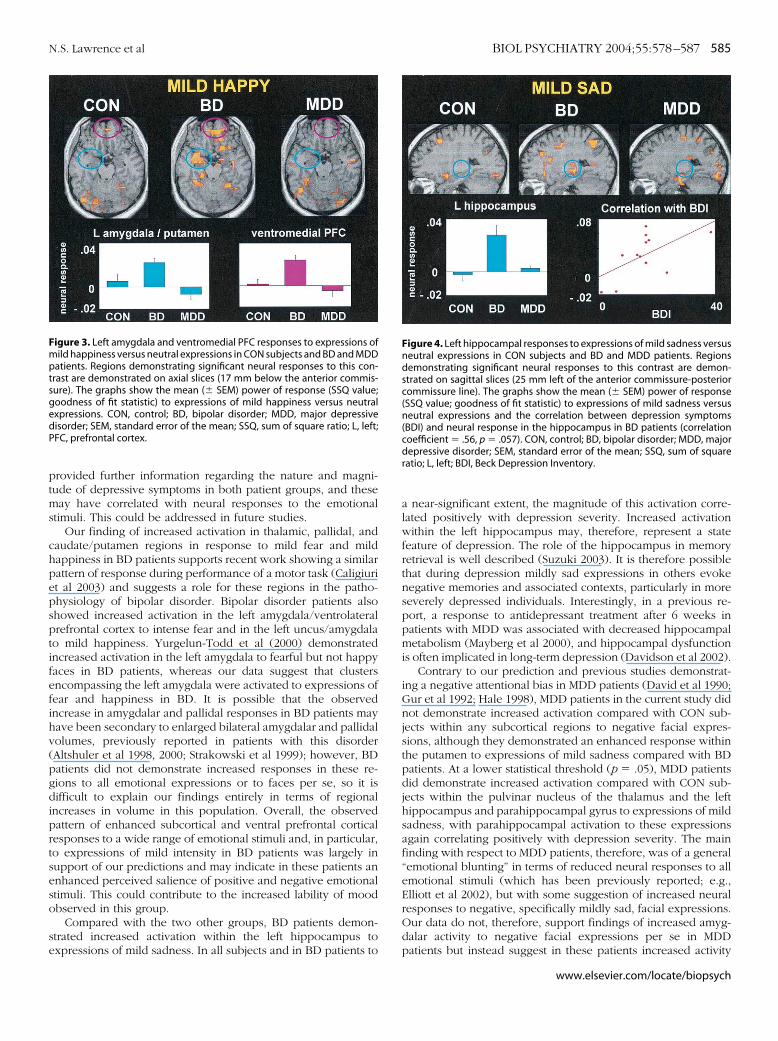
Differences in Neural Response to Happy ExpressionsBipolar disorder patients had significantly greater neural
responses to expressions of mild happiness than both CONsubjects and MDD patients in three ROIs: within a large clusterextending from the left uncus, ventrally, to the amygdala and thecaudate nucleus/putamen; in the ventromedial prefrontal cortex;and in the right ventrolateral prefrontal cortex (Table 2, Figure 3).Control subjects also showed greater neural responses than MDDpatients in the left amygdala/caudate-putamen cluster. Closerinspection of between-group differences in activation in thedifferent subregions in this cluster indicated that between-groupdifferences in activation were greatest within the uncus (58voxels), caudate nucleus (9 voxels), and putamen (18 voxels).
In response to expressions of intense happiness, CON subjectshad significantly greater neural responses than BD and MDDpatients in the right parahippocampal gyrus and in a large clusterencompassing bilateral regions of thalamus, midbrain, caudatenucleus, and left amygdala (Table 2). All subregions contributed tothe between-group differences in neural response. Control sub-
www.elsevier.com/locate/biopsych

jir
D
rjpa
T
Ba
5
1
d
T
BG
5
1
p
582 BIOL PSYCHIATRY 2004;55:578–587 N.S. Lawrence et al
w
ects and BD patients also showed greater neural responses tontense happiness than MDD patients in the right ventral andight dorsolateral prefrontal cortex.
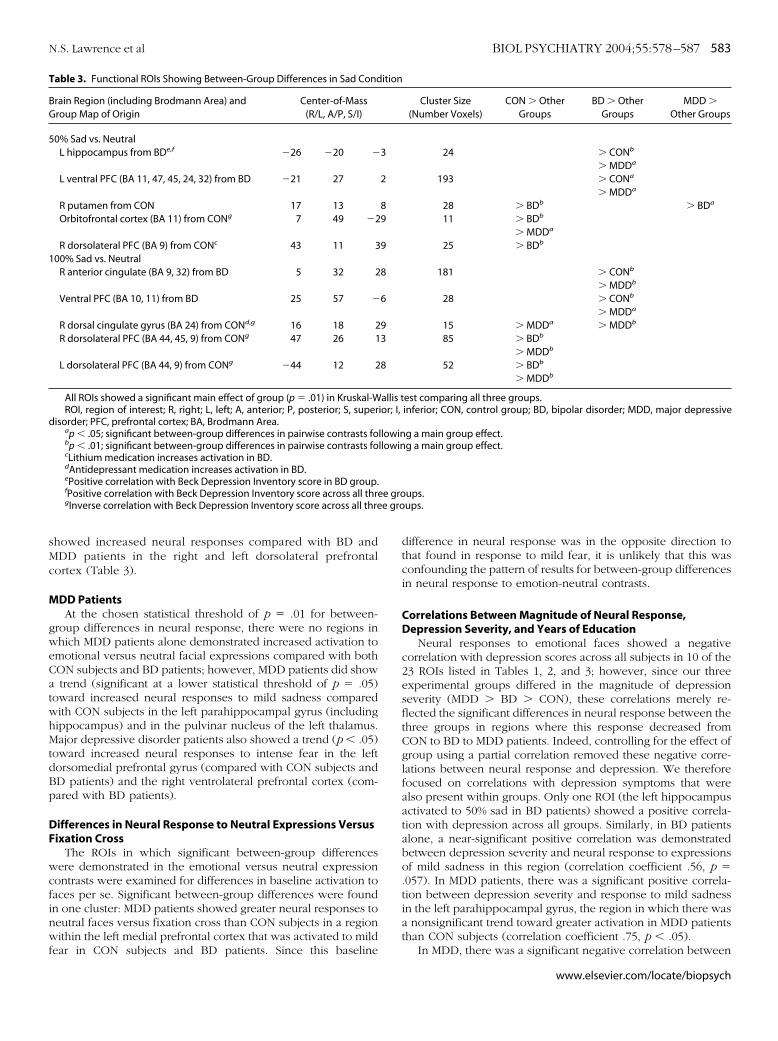
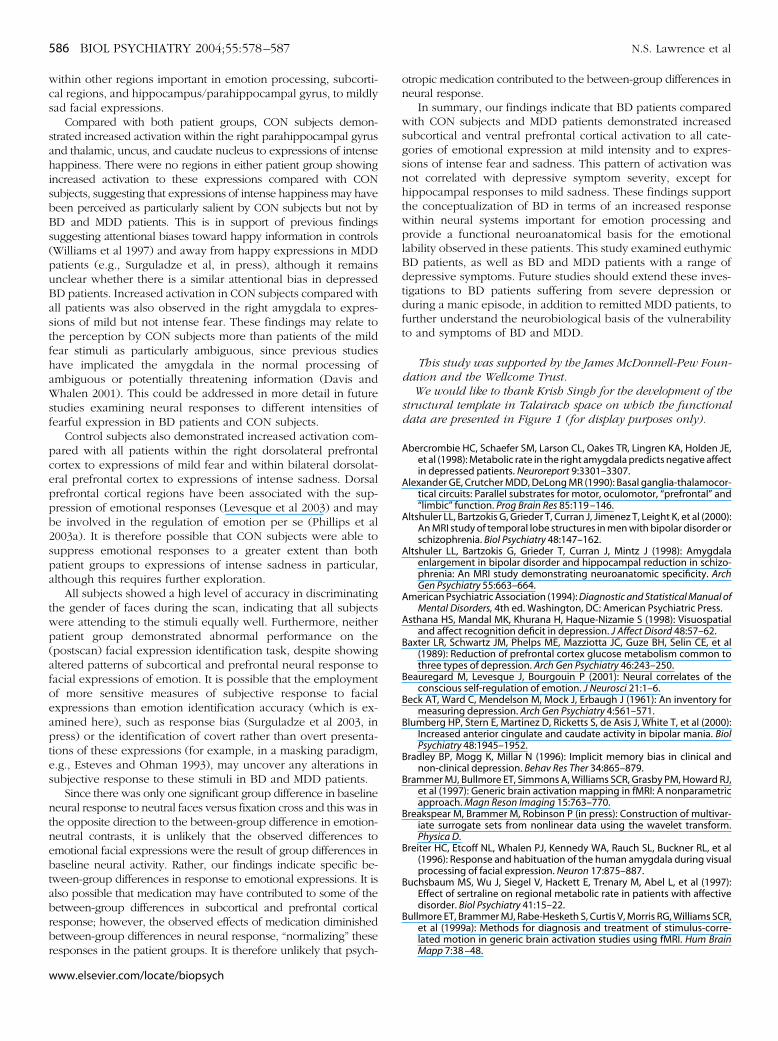
ifferences in Neural Response to Sad ExpressionsBipolar disorder patients showed a significantly greater neural
esponse to expressions of mild sadness than either CON sub-ects or MDD patients in the left hippocampus and left ventralrefrontal cortex (Table 3, Figure 4). Bipolar disorder patientslso showed significantly greater neural responses to intense
ww.elsevier.com/locate/biopsych
sadness than CON subjects and MDD patients in the right ventralprefrontal cortex and in a large cluster including ventral anddorsal right anterior cingulate gyrus.
To mild sadness, CON subjects showed significantly greaterneural responses than both patient groups in the orbitofrontalcortex and greater response than BD patients in the rightputamen and right dorsolateral prefrontal cortex. Major de-pressive disorder patients also showed significantly greaterneural responses to mild sadness than BD patients in the rightputamen. In the intense sadness condition, CON subjects
able 1. Functional ROIs Showing Between-Group Differences in Activation in Fear Condition
rain Region (including Brodmann Area)nd Group Map of Origin
Center-of-Mass(R/L, A/P, S/I)
Cluster Size(Number Voxels)
CON � OtherGroups
BD � OtherGroups
MDD � OtherGroups
0% Fear vs. NeutralR globus pallidus/anterior thalamus from BDc 11 �4 4 43 �CONa
�MDDb
R amygdala/hippocampus from CONe 20 �6 �11 36 �BDa �MDDa
�MDDb
L medial PFC (BA 10, 11, 47) from CONd,e �30 44 �8 22 �MDDb �MDDb
R dorsolateral PFC (BA 44) from CON 48 9 27 25 �MDDb
�BDa
00% Fear vs. NeutralL amygdala/ventrolateral PFC (BA 47) from BD �25 10 �18 47 �CONa
�MDDb
R parahippocampal gyrus/globus pallidus/anterior thalamus from CONe
9 �6 1 58 � MDDb �MDDa
All ROIs showed a significant main effect of group (p � .01) in Kruskal-Wallis test comparing all three groups.ROI, region of interest; R, right; L, left; A, anterior; P, posterior; S, superior; I, inferior; CON, control group; BD, bipolar disorder; MDD, major depressive
isorder; PFC, prefrontal cortex; BA, Brodmann Area.ap � .05; significant between-group differences in pairwise contrasts following a main group effect.bp � .01; significant between-group differences in pairwise contrasts following a main group effect.cLithium medication reduces activation in BD.dMDD patients show greater activation than control subjects to baseline contrast (neutral faces vs. fixation cross).eInverse correlation with Beck Depression Inventory score across all three groups.
able 2. Functional ROIs Showing Between-Group Differences in Happy Condition
rain Region (including Brodmann Area) androup Map of Origin
Center-of-Mass(R/L, A/P, S/I)
Cluster Size(Number Voxels)
CON � OtherGroups
BD � OtherGroups
MDD � OtherGroups
0% Happy vs. NeutralL uncus/amygdala/caudate/putamen from BD �25 6 �16 131 � MDDa � CONa
� MDDb
ventromedial PFC (BA 10, 11) from BDc 11 49 �6 244 � CONb
� MDDb
R ventrolateral PFC (BA 47) from BD 19 24 �6 41 � CONa
� MDDa
00% Happy vs. NeutralThalamus/midbrain/amygdala/globus
pallidus/caudate from CONd,f,g�4 �5 �1 87 � BDa
� MDDb
R parahippocampal gyrus from CONg 17 �28 �13 15 � BDb
� MDDb
R ventral PFC (BA 10, 47, 45, 46) from BD 37 44 4 147 � MDDa � MDDb
R dorsolateral PFC (BA 44, 45, 9) from CONe,g 47 15 21 88 � MDDb � MDDa
All ROIs showed a significant main effect of group (p � .01) in Kruskal-Wallis test comparing all three groups.ROI, region of interest; R, right; L, left; A, anterior; S, superior; I, inferior; CON, control group; BD, bipolar disorder; MDD, major depressive disorder; PFC,
refrontal cortex; BA, Brodmann Area.ap � .05; significant between-group differences in pairwise contrasts following a main group effect.bp � .01, significant between-group differences in pairwise contrasts following a main group effect.cHigh doses of antidepressant medication increases activation in MDD.dAntidepressant medication increases activation in BD.eAntipsychotic medication reduces activation in BD.fInverse correlation with education in MDD group.gInverse correlation with Beck Depression Inventory score across all three groups.
sMc
M
gweCatwhMtdBp
DF
wcfinwf
T
BG
5
1
d
N.S. Lawrence et al BIOL PSYCHIATRY 2004;55:578–587 583
howed increased neural responses compared with BD andDD patients in the right and left dorsolateral prefrontal
ortex (Table 3).
DD PatientsAt the chosen statistical threshold of p � .01 for between-
roup differences in neural response, there were no regions inhich MDD patients alone demonstrated increased activation tomotional versus neutral facial expressions compared with bothON subjects and BD patients; however, MDD patients did showtrend (significant at a lower statistical threshold of p � .05)
oward increased neural responses to mild sadness comparedith CON subjects in the left parahippocampal gyrus (includingippocampus) and in the pulvinar nucleus of the left thalamus.ajor depressive disorder patients also showed a trend (p � .05)
oward increased neural responses to intense fear in the leftorsomedial prefrontal gyrus (compared with CON subjects andD patients) and the right ventrolateral prefrontal cortex (com-ared with BD patients).
ifferences in Neural Response to Neutral Expressions Versusixation Cross
The ROIs in which significant between-group differencesere demonstrated in the emotional versus neutral expression
ontrasts were examined for differences in baseline activation toaces per se. Significant between-group differences were foundn one cluster: MDD patients showed greater neural responses toeutral faces versus fixation cross than CON subjects in a regionithin the left medial prefrontal cortex that was activated to mild
ear in CON subjects and BD patients. Since this baseline
able 3. Functional ROIs Showing Between-Group Differences in Sad Cond
rain Region (including Brodmann Area) androup Map of Origin
Center-of-Mass(R/L, A/P, S/I)
0% Sad vs. NeutralL hippocampus from BDe,f �26 �20 �
L ventral PFC (BA 11, 47, 45, 24, 32) from BD �21 27
R putamen from CON 17 13Orbitofrontal cortex (BA 11) from CONg 7 49 �2
R dorsolateral PFC (BA 9) from CONc 43 11 300% Sad vs. Neutral
R anterior cingulate (BA 9, 32) from BD 5 32 2
Ventral PFC (BA 10, 11) from BD 25 57 �
R dorsal cingulate gyrus (BA 24) from CONd,g 16 18 2R dorsolateral PFC (BA 44, 45, 9) from CONg 47 26 1
L dorsolateral PFC (BA 44, 9) from CONg �44 12 2
All ROIs showed a significant main effect of group (p � .01) in Kruskal-WROI, region of interest; R, right; L, left; A, anterior; P, posterior; S, super
isorder; PFC, prefrontal cortex; BA, Brodmann Area.ap � .05; significant between-group differences in pairwise contrasts fobp � .01; significant between-group differences in pairwise contrasts focLithium medication increases activation in BD.dAntidepressant medication increases activation in BD.ePositive correlation with Beck Depression Inventory score in BD group.fPositive correlation with Beck Depression Inventory score across all thregInverse correlation with Beck Depression Inventory score across all thre
difference in neural response was in the opposite direction tothat found in response to mild fear, it is unlikely that this wasconfounding the pattern of results for between-group differencesin neural response to emotion-neutral contrasts.
Correlations Between Magnitude of Neural Response,Depression Severity, and Years of Education
Neural responses to emotional faces showed a negativecorrelation with depression scores across all subjects in 10 of the23 ROIs listed in Tables 1, 2, and 3; however, since our threeexperimental groups differed in the magnitude of depressionseverity (MDD � BD � CON), these correlations merely re-flected the significant differences in neural response between thethree groups in regions where this response decreased fromCON to BD to MDD patients. Indeed, controlling for the effect ofgroup using a partial correlation removed these negative corre-lations between neural response and depression. We thereforefocused on correlations with depression symptoms that werealso present within groups. Only one ROI (the left hippocampusactivated to 50% sad in BD patients) showed a positive correla-tion with depression across all groups. Similarly, in BD patientsalone, a near-significant positive correlation was demonstratedbetween depression severity and neural response to expressionsof mild sadness in this region (correlation coefficient .56, p �.057). In MDD patients, there was a significant positive correla-tion between depression severity and response to mild sadnessin the left parahippocampal gyrus, the region in which there wasa nonsignificant trend toward greater activation in MDD patientsthan CON subjects (correlation coefficient .75, p � .05).
In MDD, there was a significant negative correlation between
Cluster Size(Number Voxels)
CON � OtherGroups
BD � OtherGroups
MDD �Other Groups
24 � CONb
� MDDa
193 � CONa
� MDDa
28 � BDb � BDa
11 � BDb
� MDDa
25 � BDb
181 � CONb
� MDDb
28 � CONb
� MDDa
15 � MDDa � MDDb
85 � BDb
� MDDb
52 � BDb
� MDDb
est comparing all three groups.inferior; CON, control group; BD, bipolar disorder; MDD, major depressive
g a main group effect.g a main group effect.
ups.ups.
ition
3
2
89
9
8
6
93
8
allis tior; I,
llowinllowin
e groe gro
www.elsevier.com/locate/biopsych

yspcaasgEbyo
TE
ptgasstmcmiuporcnir
FvRdggsnBt
584 BIOL PSYCHIATRY 2004;55:578–587 N.S. Lawrence et al
w
ears of education and magnitude of neural response to expres-ions of intense happiness within the large thalamus/caudate/utamen cluster activated in control subjects (correlation coeffi-ient �.79, p � .05). Major depressive disorder patients showedreduced neural response in this region relative to CON subjectsnd were less educated. The inverse nature of this correlationuggested, however, that the less educated MDD patients had areater rather than smaller neural response within this region.ducation differences did not, therefore, contribute to the overalletween-group effect. There were no other correlations betweenears of education and magnitude of neural response within anyther ROIs in any group.
he Effect of Psychotropic Medication on Neural Responses tomotional Versus Neutral Expressions
All medication effects were significant at p � .05. In BDatients, lithium medication normalized neural responses towardhose observed in CON subjects in two regions: in the rightlobus pallidus/thalamus in response to expressions of mild fearnd in the right dorsal prefrontal cortex in response to mildadness. Similarly, BD patients taking antidepressant medicationhowed a normalization (increase) in neural responses towardhose observed in CON subjects in two regions: in the thalamus/idbrain to intense happy expressions and in the right dorsal
ingulate gyrus to intense sad expressions. Since the aboveedication effects diminished rather than increased differences
n neural responses between BD patients and CON subjects, it isnlikely that medication effects contributed to the observedattern of between-group differences in activation. Bipolar dis-rder patients taking antipsychotic medication demonstratededuced neural responses within the right dorsolateral prefrontalortex to expressions of intense happiness compared with thoseot taking antipsychotic medication. Finally, MDD patients tak-ng higher doses of antidepressants showed increased neuralesponses to mild happiness in the ventromedial prefrontal
igure 1. Globus pallidus/thalamic responses to expressions of mild fearersus neutral expressions in CON subjects and BD and MDD patients.egions demonstrating significant neural responses to this contrast areemonstrated on axial slices (4 mm above the anterior commissure). Theraphs show the mean (� SEM) of the mean power of response (SSQ value;oodness of fit statistic) to expressions of mild fear versus neutral expres-ions. Positive values indicate greater responses to fearful expressions, andegative values indicate greater responses to neutral faces. CON, control;D, bipolar disorder; MDD, major depressive disorder; SEM, standard error ofhe mean; SSQ, sum of square ratio; L, Left; R, Right.
ww.elsevier.com/locate/biopsych
cortex compared with MDD patients taking lower doses. Again,these latter medication effects diminished between-group differ-ences in neural response and were not, therefore, contributing tothe overall pattern of results.
Discussion
The roles of subcortical, ventral, and dorsal prefrontal corticalregions in the response to emotionally salient stimuli have beenpreviously highlighted, with specific patterns of functional ab-normalities within these regions reported in BD and MDDpatients (Phillips et al 2003a, 2003b). We aimed to examine theextent to which patterns of activation within these regions toemotionally salient stimuli distinguished BD and MDD patients.In particular, we wished to determine whether a pattern ofincreased subcortical response to facial expressions of positiveand negative emotion characterized BD patients. As predicted,BD patients showed increased responses compared with CONsubjects in subcortical regions to positive and negative facialexpressions: within the left amygdala/caudate nucleus/putamento expressions of mild happiness; within the right globus palli-dus/thalamus to expressions of mild fear; and within the leftamygdala/ventrolateral prefrontal cortex to expressions of in-tense fear. Bipolar disorder patients also demonstrated increasedactivation within the ventral prefrontal cortex to expressions ofmild happiness and mild and intense sadness compared withCON subjects and increased activation to all facial expressionscompared with MDD patients in similar subcortical and ventralprefrontal cortical regions.
There were no correlations between the magnitude of re-sponse within the above regions and depression severity in theBD patients, suggesting that the pattern of increased subcorticaland ventral prefrontal response to happy and fearful facialexpressions in BD patients was not symptom-related. We em-ployed one self-rating scale for depression severity, however; it ispossible that other measures of depression severity may have
Figure 2. Left amygdala/ventrolateral PFC responses to expressions of in-tense fear versus neutral expressions in CON subjects and BD and MDDpatients. Regions demonstrating significant neural responses to this con-trast are demonstrated on axial slices (17 mm below the anterior commis-sure). The graphs show the mean (� SEM) power of response (SSQ value;goodness of fit statistic) to expressions of intense fear versus neutral expres-sions. CON, control; BD, bipolar disorder; MDD, major depressive disorder;SEM, standard error of the mean; SSQ, sum of square ratio; PFC, prefrontalcortex.
ptms
chpepsptifefihv(pgdiprtseso
se
FmptsgedP
N.S. Lawrence et al BIOL PSYCHIATRY 2004;55:578–587 585
rovided further information regarding the nature and magni-ude of depressive symptoms in both patient groups, and theseay have correlated with neural responses to the emotional
timuli. This could be addressed in future studies.Our finding of increased activation in thalamic, pallidal, and
audate/putamen regions in response to mild fear and mildappiness in BD patients supports recent work showing a similarattern of response during performance of a motor task (Caligiurit al 2003) and suggests a role for these regions in the patho-hysiology of bipolar disorder. Bipolar disorder patients alsohowed increased activation in the left amygdala/ventrolateralrefrontal cortex to intense fear and in the left uncus/amygdalao mild happiness. Yurgelun-Todd et al (2000) demonstratedncreased activation in the left amygdala to fearful but not happyaces in BD patients, whereas our data suggest that clustersncompassing the left amygdala were activated to expressions ofear and happiness in BD. It is possible that the observedncrease in amygdalar and pallidal responses in BD patients mayave been secondary to enlarged bilateral amygdalar and pallidalolumes, previously reported in patients with this disorderAltshuler et al 1998, 2000; Strakowski et al 1999); however, BDatients did not demonstrate increased responses in these re-ions to all emotional expressions or to faces per se, so it isifficult to explain our findings entirely in terms of regionalncreases in volume in this population. Overall, the observedattern of enhanced subcortical and ventral prefrontal corticalesponses to a wide range of emotional stimuli and, in particular,o expressions of mild intensity in BD patients was largely inupport of our predictions and may indicate in these patients annhanced perceived salience of positive and negative emotionaltimuli. This could contribute to the increased lability of moodbserved in this group.
Compared with the two other groups, BD patients demon-trated increased activation within the left hippocampus toxpressions of mild sadness. In all subjects and in BD patients to
igure 3. Left amygdala and ventromedial PFC responses to expressions ofild happiness versus neutral expressions in CON subjects and BD and MDD
atients. Regions demonstrating significant neural responses to this con-rast are demonstrated on axial slices (17 mm below the anterior commis-ure). The graphs show the mean (� SEM) power of response (SSQ value;oodness of fit statistic) to expressions of mild happiness versus neutralxpressions. CON, control; BD, bipolar disorder; MDD, major depressiveisorder; SEM, standard error of the mean; SSQ, sum of square ratio; L, left;FC, prefrontal cortex.
a near-significant extent, the magnitude of this activation corre-lated positively with depression severity. Increased activationwithin the left hippocampus may, therefore, represent a statefeature of depression. The role of the hippocampus in memoryretrieval is well described (Suzuki 2003). It is therefore possiblethat during depression mildly sad expressions in others evokenegative memories and associated contexts, particularly in moreseverely depressed individuals. Interestingly, in a previous re-port, a response to antidepressant treatment after 6 weeks inpatients with MDD was associated with decreased hippocampalmetabolism (Mayberg et al 2000), and hippocampal dysfunctionis often implicated in long-term depression (Davidson et al 2002).
Contrary to our prediction and previous studies demonstrat-ing a negative attentional bias in MDD patients (David et al 1990;Gur et al 1992; Hale 1998), MDD patients in the current study didnot demonstrate increased activation compared with CON sub-jects within any subcortical regions to negative facial expres-sions, although they demonstrated an enhanced response withinthe putamen to expressions of mild sadness compared with BDpatients. At a lower statistical threshold (p � .05), MDD patientsdid demonstrate increased activation compared with CON sub-jects within the pulvinar nucleus of the thalamus and the lefthippocampus and parahippocampal gyrus to expressions of mildsadness, with parahippocampal activation to these expressionsagain correlating positively with depression severity. The mainfinding with respect to MDD patients, therefore, was of a general“emotional blunting” in terms of reduced neural responses to allemotional stimuli (which has been previously reported; e.g.,Elliott et al 2002), but with some suggestion of increased neuralresponses to negative, specifically mildly sad, facial expressions.Our data do not, therefore, support findings of increased amyg-dalar activity to negative facial expressions per se in MDDpatients but instead suggest in these patients increased activity
Figure 4. Left hippocampal responses to expressions of mild sadness versusneutral expressions in CON subjects and BD and MDD patients. Regionsdemonstrating significant neural responses to this contrast are demon-strated on sagittal slices (25 mm left of the anterior commissure-posteriorcommissure line). The graphs show the mean (� SEM) power of response(SSQ value; goodness of fit statistic) to expressions of mild sadness versusneutral expressions and the correlation between depression symptoms(BDI) and neural response in the hippocampus in BD patients (correlationcoefficient � .56, p � .057). CON, control; BD, bipolar disorder; MDD, majordepressive disorder; SEM, standard error of the mean; SSQ, sum of squareratio; L, left; BDI, Beck Depression Inventory.
www.elsevier.com/locate/biopsych
wcs
sahisbBs(puBastfhaWsf
pceppb2spa
twp(afoeaptes
ntnebtabrbr
586 BIOL PSYCHIATRY 2004;55:578–587 N.S. Lawrence et al
w
ithin other regions important in emotion processing, subcorti-al regions, and hippocampus/parahippocampal gyrus, to mildlyad facial expressions.
Compared with both patient groups, CON subjects demon-trated increased activation within the right parahippocampal gyrusnd thalamic, uncus, and caudate nucleus to expressions of intenseappiness. There were no regions in either patient group showingncreased activation to these expressions compared with CONubjects, suggesting that expressions of intense happiness may haveeen perceived as particularly salient by CON subjects but not byD and MDD patients. This is in support of previous findingsuggesting attentional biases toward happy information in controlsWilliams et al 1997) and away from happy expressions in MDDatients (e.g., Surguladze et al, in press), although it remainsnclear whether there is a similar attentional bias in depressedD patients. Increased activation in CON subjects compared withll patients was also observed in the right amygdala to expres-ions of mild but not intense fear. These findings may relate tohe perception by CON subjects more than patients of the mildear stimuli as particularly ambiguous, since previous studiesave implicated the amygdala in the normal processing ofmbiguous or potentially threatening information (Davis andhalen 2001). This could be addressed in more detail in future
tudies examining neural responses to different intensities ofearful expression in BD patients and CON subjects.
Control subjects also demonstrated increased activation com-ared with all patients within the right dorsolateral prefrontalortex to expressions of mild fear and within bilateral dorsolat-ral prefrontal cortex to expressions of intense sadness. Dorsalrefrontal cortical regions have been associated with the sup-ression of emotional responses (Levesque et al 2003) and maye involved in the regulation of emotion per se (Phillips et al003a). It is therefore possible that CON subjects were able touppress emotional responses to a greater extent than bothatient groups to expressions of intense sadness in particular,lthough this requires further exploration.
All subjects showed a high level of accuracy in discriminatinghe gender of faces during the scan, indicating that all subjectsere attending to the stimuli equally well. Furthermore, neitheratient group demonstrated abnormal performance on thepostscan) facial expression identification task, despite showingltered patterns of subcortical and prefrontal neural response toacial expressions of emotion. It is possible that the employmentf more sensitive measures of subjective response to facialxpressions than emotion identification accuracy (which is ex-mined here), such as response bias (Surguladze et al 2003, inress) or the identification of covert rather than overt presenta-ions of these expressions (for example, in a masking paradigm,.g., Esteves and Ohman 1993), may uncover any alterations inubjective response to these stimuli in BD and MDD patients.
Since there was only one significant group difference in baselineeural response to neutral faces versus fixation cross and this was inhe opposite direction to the between-group difference in emotion-eutral contrasts, it is unlikely that the observed differences tomotional facial expressions were the result of group differences inaseline neural activity. Rather, our findings indicate specific be-ween-group differences in response to emotional expressions. It islso possible that medication may have contributed to some of theetween-group differences in subcortical and prefrontal corticalesponse; however, the observed effects of medication diminishedetween-group differences in neural response, “normalizing” theseesponses in the patient groups. It is therefore unlikely that psych-
ww.elsevier.com/locate/biopsych
otropic medication contributed to the between-group differences inneural response.
In summary, our findings indicate that BD patients comparedwith CON subjects and MDD patients demonstrated increasedsubcortical and ventral prefrontal cortical activation to all cate-gories of emotional expression at mild intensity and to expres-sions of intense fear and sadness. This pattern of activation wasnot correlated with depressive symptom severity, except forhippocampal responses to mild sadness. These findings supportthe conceptualization of BD in terms of an increased responsewithin neural systems important for emotion processing andprovide a functional neuroanatomical basis for the emotionallability observed in these patients. This study examined euthymicBD patients, as well as BD and MDD patients with a range ofdepressive symptoms. Future studies should extend these inves-tigations to BD patients suffering from severe depression orduring a manic episode, in addition to remitted MDD patients, tofurther understand the neurobiological basis of the vulnerabilityto and symptoms of BD and MDD.
This study was supported by the James McDonnell-Pew Foun-dation and the Wellcome Trust.
We would like to thank Krish Singh for the development of thestructural template in Talairach space on which the functionaldata are presented in Figure 1 (for display purposes only).
Abercrombie HC, Schaefer SM, Larson CL, Oakes TR, Lingren KA, Holden JE,et al (1998): Metabolic rate in the right amygdala predicts negative affectin depressed patients. Neuroreport 9:3301–3307.
Alexander GE, Crutcher MDD, DeLong MR (1990): Basal ganglia-thalamocor-tical circuits: Parallel substrates for motor, oculomotor, “prefrontal” and“limbic” function. Prog Brain Res 85:119 –146.
Altshuler LL, Bartzokis G, Grieder T, Curran J, Jimenez T, Leight K, et al (2000):An MRI study of temporal lobe structures in men with bipolar disorder orschizophrenia. Biol Psychiatry 48:147–162.
Altshuler LL, Bartzokis G, Grieder T, Curran J, Mintz J (1998): Amygdalaenlargement in bipolar disorder and hippocampal reduction in schizo-phrenia: An MRI study demonstrating neuroanatomic specificity. ArchGen Psychiatry 55:663–664.
American Psychiatric Association (1994): Diagnostic and Statistical Manual ofMental Disorders, 4th ed. Washington, DC: American Psychiatric Press.
Asthana HS, Mandal MK, Khurana H, Haque-Nizamie S (1998): Visuospatialand affect recognition deficit in depression. J Affect Disord 48:57–62.
Baxter LR, Schwartz JM, Phelps ME, Mazziotta JC, Guze BH, Selin CE, et al(1989): Reduction of prefrontal cortex glucose metabolism common tothree types of depression. Arch Gen Psychiatry 46:243–250.
Beauregard M, Levesque J, Bourgouin P (2001): Neural correlates of theconscious self-regulation of emotion. J Neurosci 21:1–6.
Beck AT, Ward C, Mendelson M, Mock J, Erbaugh J (1961): An inventory formeasuring depression. Arch Gen Psychiatry 4:561–571.
Blumberg HP, Stern E, Martinez D, Ricketts S, de Asis J, White T, et al (2000):Increased anterior cingulate and caudate activity in bipolar mania. BiolPsychiatry 48:1945–1952.
Bradley BP, Mogg K, Millar N (1996): Implicit memory bias in clinical andnon-clinical depression. Behav Res Ther 34:865–879.
Brammer MJ, Bullmore ET, Simmons A, Williams SCR, Grasby PM, Howard RJ,et al (1997): Generic brain activation mapping in fMRI: A nonparametricapproach. Magn Reson Imaging 15:763–770.
Breakspear M, Brammer M, Robinson P (in press): Construction of multivar-iate surrogate sets from nonlinear data using the wavelet transform.Physica D.
Breiter HC, Etcoff NL, Whalen PJ, Kennedy WA, Rauch SL, Buckner RL, et al(1996): Response and habituation of the human amygdala during visualprocessing of facial expression. Neuron 17:875–887.
Buchsbaum MS, Wu J, Siegel V, Hackett E, Trenary M, Abel L, et al (1997):Effect of sertraline on regional metabolic rate in patients with affectivedisorder. Biol Psychiatry 41:15–22.
Bullmore ET, Brammer MJ, Rabe-Hesketh S, Curtis V, Morris RG, Williams SCR,et al (1999a): Methods for diagnosis and treatment of stimulus-corre-lated motion in generic brain activation studies using fMRI. Hum BrainMapp 7:38 –48.
B
B
C
C
D
D
D
D
D
D
D
E
E
G
G
G
H
H
J
K
L
L
L
M
M
M
M
N.S. Lawrence et al BIOL PSYCHIATRY 2004;55:578–587 587
ullmore ET, Long C, Suckling J, Fadili J, Calvert GA, Zelaya F, et al (2001):Coloured noise and computational inference in neurophysiological(fMRI) time series analysis: Resampling methods in time and waveletdomains. Hum Brain Mapp 12:61–78.
ullmore ET, Suckling J, Overmeyer S, Rabe-Hesketh S, Taylor E, Brammer MJ(1999b): Global, voxel and cluster tests, by theory and permutation, for adifference between two groups of structural MR images of the brain. IEEETrans Med Imaging 18:32–42.
alder AJ, Lawrence AD, Young AW (2001): Neuropsychology of fear andloathing. Nat Rev Neurosci 2:352–363.
aligiuri MP, Brown GG, Meloy MJ, Eberson SC, Kindermann SS, Frank LR, etal (2003): An fMRI study of affective state and medication on cortical andsubcortical brain regions during motor performance in bipolar disorder.Psychiatry Res 123:171–182.
arwin C (1872/1965): The Expression of the Emotions in Man and Animals.Chicago: University of Chicago Press.
avid AS, Cutting J (1990): Affect, affective disorder and schizophrenia: Aneuropsychological investigation of right hemisphere function. Br J Psy-chiatry 156:491–495.
avidson RJ, Pizzagalli D, Nitschke JB, Putnam K (2002): Depression: Per-spectives from affective neuroscience. Annu Rev Psychol 53:545–574.
avis M, Whalen PJ (2001): The amygdala: Vigilance and emotion. Mol Psy-chiatry 6:3–34.
revets WC, Price JL, Simpson JR, Todd RD, Reich T, Vannier M, et al (1997):Subgenual prefrontal cortex abnormalities in mood disorders. Nature386:824 –827.
revets WC, Price JL, Videen TO, Todd RD, Raichle ME (1995): Metabolicabnormalities in the subgenual prefrontal cortex and ventral striatum inmood disorders. Neurosci Abstr 21:260.
revets WC, Videen TO, Price JL, Preskorn SH, Carmichael ST, Raichle ME(1992): A functional anatomical study of unipolar depression. J Neurosci12:3628 –3641.
lliott R, Rubinsztein JS, Sahakian BJ, Dolan RJ (2002): The neural basis ofmood-congruent emotional processing biases in depression. Arch GenPsychiatry 59:597–604.
steves F, Ohman A (1993): Masking the face: Recognition of emotionalfacial expressions as a function of the parameters of backward masking.Scand J Psychol 34:1–18.
eorge MS, Huggins T, McDermut W, Priti P, Rubinow D, Post RM (1998):Abnormal facial emotion recognition in depression: Serial testing in anultra-rapid-cycling patient. Behav Modif 22:192–204.
oodwin GM, Austin MP, Dougall N, Ross M, Murray C, O’Carroll RE, et al(1993): State changes in brain activity shown by the uptake of 99 mTc-exametazime with single photon emission tomography in major depres-sion before and after treatment. J Affect Disord 29:243–253.
ur RC, Erwin RJ, Gur RE, Zwil AS, Heimberg C, Kraemer HC (1992): Facialemotion discrimination: II. Behavioral findings in depression. PsychiatryRes 42:241–251.
ale WW (1998): Judgment of facial expressions and depression persistence.Psychiatry Res 80:265–274.
armer CJ, Grayson L, Goodwin GM (2002): Enhanced recognition of disgustin bipolar illness. Biol Psychiatry 51:298 –304.
aeger J, Borod J, Peselow E (1987): Depressed patients have atypical hemis-pace biases in the perception of emotional chimeric faces. J AbnormPsychol 96:321–324.
err N, Phillips M (2002): Selective attention and emotional processing inbipolar disorder. Biol Psychiatry 51:207S.
evesque J, Eugene F, Joanette Y, Paquette V, Mensour B, Beaudoin G, et al(2003): Neural circuitry underlying voluntary suppression of sadness.Biol Psychiatry 53:502–510.
ior R, Nachson I (1999): Impairments in judgment of chimeric faces byschizophrenic and affective patients. Int J Neurosci 97:185–209.
yon HM, Startup M, Bentall RP (1999): Social cognition and the manicdefense: Attributions, selective attention, and self-schema in bipolaraffective disorder. J Abnorm Psychol 108:273–282.
ayberg H (2001): Is there a future for PET studies of metabolism and bloodflow in affective disorders research. Biol Psychiatry 49:6S.
ayberg HS, Brannan SK, Tekell JL, Silva A, Mahurin RK, McGinnis S, et al(2000): Regional metabolic effects of fluoxetine in major depression:Serial changes and relationship to clinical response. Biol Psychiatry48:830 –843.
ayberg HS, Liotti M, Brannan SK, McGinnis S, Mahurin RK, Jarabek PA, et al(1999): Reciprocal limbic-cortical function and negative mood: Converg-ing PET findings in depression and normal sadness. Am J Psychiatry156:675–682.
ikhailova ES, Vladimirova TV, Iznak AF, Tsusulkovskaya EJ, Sushko NV(1996): Abnormal recognition of facial expression of emotions in de-
pressed patients with major depression disorder and schizotypal per-sonality disorder. Biol Psychiatry 40:697–705.
Morris JS, Frith CD, Perrett DI, Rowland D, Young AW, Calder AJ, et al (1996):A differential neural response in the human amygdala to fearful andhappy facial expressions. Nature 383:812–815.
Murphy FC, Sahakian BJ, Rubinsztein JS, Michale A, Rogers RD, Robbins TW,et al (1999): Emotional bias and inhibitory control processes in maniaand depression. Psychol Med 29:1307–1321.
O’Connell RA, van Heertum RL, Luck D, Yudd AP, Cueva JE, Billick SB, et al(1995): Single-photon emission computed tomography of the brain inacute mania and schizophrenia. J Neuroimaging 5:101–104.
Oldfield RC (1971): The assessment and analysis of handedness: The Edin-burgh Inventory. Neuropsychologia 102:97–113.
Persad S, Polivy J (1993): Differences between depressed and nondepressedindividuals in the recognition of and response to facial cues. J AbnormPsychol 102:358 –368.
Phillips ML, Drevets WC, Rauch SL, Lane RD (2003a): The neurobiology ofemotion perception I: The neural basis of normal emotion perception.Biol Psychiatry 54:504 –514.
Phillips ML, Drevets WC, Rauch SL, Lane RD (2003b): The neurobiology ofemotion perception II: Implications for major psychiatric disorders. BiolPsychiatry 54:515–528.
Phillips ML, Young AW, Senior C, Calder AJ, Perrett D, Brammer M, et al(1997): A specific neural substrate for perception of facial expressions ofdisgust. Nature 389:495–498.
Rubinow DR, Post RM (1992): Impaired recognition of affect in facial expres-sion in depressed patients. Biol Psychiatry 31:947–953.
Sackeim HA (2001): The definition and meaning of treatment-resistant de-pression. J Clin Psychiatry 62(suppl 16):1–17.
Sheline YI, Barch DM, Donnelly JM, Ollinger JM, Snyder AZ, Mintun MA(2001): Increased amygdalar response to masked emotional faces indepressed subjects resolves with antidepressant treatment: An fMRIstudy. Biol Psychiatry 50:651–659.
Siegle G, Steinhauer SR, Thase ME, Stenger A, Carter CS (2002): Can’t shakethat feeling: Event-related fMRI assessment of sustained amygdala ac-tivity in response to emotional information in depressed individuals. BiolPsychiatry 51:693–707.
Strakowski SM, DelBello MP, Sax KW, Zimmerman ME, Shear PK, Hawkins JM,et al (1999): Brain magnetic resonance imaging of structural abnormali-ties in bipolar disorder. Arch Gen Psychiatry 56:254 –260.
Surguladze SA, Brammer MJ, Young AW, Andrew C, Travis MJ, Williams SCR,et al (2003): A preferential increase in the extrastriate response to signalsof danger. Neuroimage 19:1317–1328.
Surguladze S, Young AW, Senior C, Brebion G, Travis MJ, Phillips ML (inpress): Recognition accuracy and response bias to happy and sad facialexpressions in patients with major depression. Neuropsychology.
Suslow T, Junghanns K, Arolt V (2001): Detection of facial expressions ofemotions in depression. Percept Mot Skills 92:857–868.
Suzuki WA (2003): Declarative versus episodic: Two theories put to the test.Neuron 38:135–144.
Talairach J, Tournoux P (1988): Co-Planar Stereotaxic Atlas of the HumanBrain. New York: Thieme, Stuttgart.
Warrington EK (1984): Recognition Memory Test. Windsor, UK: NFER-NELSONPublishing Company.
Warrington EK (1996): Short Recognition Memory Test for Faces. Hove, UK:Psychology Press.
Williams JMG, Mathews A, McLeod C (1996): The emotional stroop task andpsychopathology. Psychol Bull 120:3–24.
Williams JMG, Watts FM, Macleod C, Mathews A (1997): CognitivePsychology and Emotional Disorders, 2nd ed. New York: John Wiley &Sons Ltd.
Young AW, Perrett DI, Calder AJ, Sprengelmeyer R, Ekman P (2002): FacialExpressions of Emotion: Stimuli and Tests (FEEST). Bury St. Edmunds, UK:Thames Valley Test Company.
Young RC, Biggs JT, Ziegler VE, Meyer DA (1978): A rating scale for mania:Reliability, validity and sensitivity. Br J Psychiatry 133:429 –435.
Yurgelun-Todd DA, Gruber SA, Kanayama G, Killgore WD, Baird AA, YoungAD (2000): FMRI during affect discrimination in bipolar affective disor-der. Bipolar Disord 2:237–248.
Yurgelun-Todd DA, Gruber SA, Kilgore WDS, Young AD (2001): DifferentialfMRI activation in bipolar patients during affect discrimination. Biol Psy-chiatry 49:279S.
www.elsevier.com/locate/biopsych
Copyright © 2022 FDOKUMEN