Identification of novel genes regulated in the developing human ventral mesencephalon
11
Identification of novel genes regulated in the developing human ventral mesencephalon Jesper Roland Jørgensen a, ⁎ , Bengt Juliusson a , Karen Friis Henriksen b , Claus Hansen b , Steen Knudsen c , Thomas Nordahl Petersen a,c , Nikolaj Blom a,c , Åke Seiger d , Lars U. Wahlberg a a NsGene A/S, Baltorpvej 154, DK-2750 Ballerup, Denmark b The Wilhelm Johannsen Centre for Functional Genome Research, Department of Medical Genetics, IMBG, Panum Institute, University of Copenhagen, Blegdamsvej 3, Bldg. 24.4, DK-2200 Copenhagen N, Denmark c Center for Biological Sequence Analysis (CBS), Technical University of Denmark (DTU), Bldg. 208, DK-2800 Lyngby, Denmark d Department of NEUROTEC, Karolinska Institutet, University Hospital Huddinge, S-141 86, Sweden Received 11 July 2005; revised 18 October 2005; accepted 13 December 2005 Available online 10 February 2006 Abstract In the human embryo, from approximately 6 weeks gestational age (GA), dopaminergic (DA) neurons can be found in the ventral mesencephalon (VM). More specifically, the post-mitotic neurons are located in the ventral part of the tegmentum (VT), whereas no mature DA neurons are found in the neighboring dorsal part. We used Affymetrix HG-U133 GeneChip technology to compare genome-wide expression profiles of ventral and dorsal tegmentum from 8 weeks GA human embryos, in order to identify genes involved in specification, differentiation, and survival of mesencephalic DA (mDA) neurons. Known mDA marker genes including ALDH1A1, DAT1, VMAT2, TH, CALB1, NURR1, FOXA1, GIRK2, PITX3, RET, and DRD2 topped the list of 96 genes from HG-U133Awith higher expression in VT, validating the experimental set-up. In addition, 28 probes from HG-U133B were identified whereof most are annotated to UniGene clusters with no gene associated or to genes of unknown function. Of these, the fifteen most regulated transcripts, representing changes down to 56% could be verified by quantitative real-time PCR (Q-PCR) on a developmental series of subdissected human embryonic and fetal brain material, resulting in not only a regional but also a temporal expression profile. This revealed a distinct DA-associated profile for in particular a putative transcription factor (FLJ45455) and the uncharacterized transmembrane proteins KIAA1145 and SLC10A4. The data presented here may help to device cell replacement and regenerative therapies for Parkinson's disease (PD). © 2005 Elsevier Inc. All rights reserved. Keywords: Mesencephalon; Tegmentum; Microarray; Affymetrix; Gene expression; Dopaminergic differentiation; Neural stem cells; Novel genes; Bioinformatics; Parkinson's disease Introduction In PD, the degeneration of mDA neurons causes symptoms characterized by tremor, rigidity, and akinesia (Lang and Lozano, 1998a,b). Although symptomatic treatment is available and relatively effective during the early stages of the disease, the DA neuron degeneration continues, and no disease modifying or long-term effective treatments are available. Transplantation of first trimester fetal mesencephalic tissue containing immature mDA neurons has demonstrated beneficial effects in Parkinson patients and is regarded as a proof-of-principle that neural replacement can work in the human brain (Winkler et al., 2005). However, both practically and ethically, this approach is not a realistic large-scale treatment. Therefore, much research is currently geared towards finding alternative and more defined sources of DA neurons. In particular, stem/neural progenitor cells have received much attention as they have the potential to generate large numbers of DA neurons in a standardized and controlled fashion (Roybon et al., 2004). It has been shown in rodents (Kim et al., 2002; Studer et al., 1998; Bjorklund et al., 2002) and recently also in non-human primates (Takagi et al., Experimental Neurology 198 (2006) 427 – 437 www.elsevier.com/locate/yexnr ⁎ Corresponding author. Fax: +45 4460 8989. E-mail address: [email protected] (J.R. Jørgensen). 0014-4886/$ - see front matter © 2005 Elsevier Inc. All rights reserved. doi:10.1016/j.expneurol.2005.12.023
-
Upload
independent -
Category
Documents
-
view
0 -
download
0
Transcript of Identification of novel genes regulated in the developing human ventral mesencephalon
98 (2006) 427–437www.elsevier.com/locate/yexnr
Experimental Neurology 1
Identification of novel genes regulated in the developinghuman ventral mesencephalon
Jesper Roland Jørgensen a,⁎, Bengt Juliusson a, Karen Friis Henriksen b, Claus Hansen b,Steen Knudsen c, Thomas Nordahl Petersen a,c, Nikolaj Blom a,c,
Åke Seiger d, Lars U. Wahlberg a
a NsGene A/S, Baltorpvej 154, DK-2750 Ballerup, Denmarkb The Wilhelm Johannsen Centre for Functional Genome Research, Department of Medical Genetics, IMBG, Panum Institute, University of Copenhagen,
Blegdamsvej 3, Bldg. 24.4, DK-2200 Copenhagen N, Denmarkc Center for Biological Sequence Analysis (CBS), Technical University of Denmark (DTU), Bldg. 208, DK-2800 Lyngby, Denmark
d Department of NEUROTEC, Karolinska Institutet, University Hospital Huddinge, S-141 86, Sweden
Received 11 July 2005; revised 18 October 2005; accepted 13 December 2005Available online 10 February 2006
Abstract
In the human embryo, from approximately 6 weeks gestational age (GA), dopaminergic (DA) neurons can be found in the ventralmesencephalon (VM). More specifically, the post-mitotic neurons are located in the ventral part of the tegmentum (VT), whereas no mature DAneurons are found in the neighboring dorsal part. We used Affymetrix HG-U133 GeneChip technology to compare genome-wide expressionprofiles of ventral and dorsal tegmentum from 8 weeks GA human embryos, in order to identify genes involved in specification, differentiation,and survival of mesencephalic DA (mDA) neurons. Known mDA marker genes including ALDH1A1, DAT1, VMAT2, TH, CALB1, NURR1,FOXA1, GIRK2, PITX3, RET, and DRD2 topped the list of 96 genes from HG-U133Awith higher expression in VT, validating the experimentalset-up. In addition, 28 probes from HG-U133B were identified whereof most are annotated to UniGene clusters with no gene associated or togenes of unknown function. Of these, the fifteen most regulated transcripts, representing changes down to 56% could be verified by quantitativereal-time PCR (Q-PCR) on a developmental series of subdissected human embryonic and fetal brain material, resulting in not only a regional butalso a temporal expression profile. This revealed a distinct DA-associated profile for in particular a putative transcription factor (FLJ45455) andthe uncharacterized transmembrane proteins KIAA1145 and SLC10A4. The data presented here may help to device cell replacement andregenerative therapies for Parkinson's disease (PD).© 2005 Elsevier Inc. All rights reserved.
Keywords: Mesencephalon; Tegmentum; Microarray; Affymetrix; Gene expression; Dopaminergic differentiation; Neural stem cells; Novel genes; Bioinformatics;Parkinson's disease
Introduction
In PD, the degeneration of mDA neurons causes symptomscharacterized by tremor, rigidity, and akinesia (Lang andLozano, 1998a,b). Although symptomatic treatment is availableand relatively effective during the early stages of the disease, theDA neuron degeneration continues, and no disease modifyingor long-term effective treatments are available. Transplantationof first trimester fetal mesencephalic tissue containing immature
⁎ Corresponding author. Fax: +45 4460 8989.E-mail address: [email protected] (J.R. Jørgensen).
0014-4886/$ - see front matter © 2005 Elsevier Inc. All rights reserved.doi:10.1016/j.expneurol.2005.12.023
mDA neurons has demonstrated beneficial effects in Parkinsonpatients and is regarded as a proof-of-principle that neuralreplacement can work in the human brain (Winkler et al., 2005).However, both practically and ethically, this approach is not arealistic large-scale treatment. Therefore, much research iscurrently geared towards finding alternative and more definedsources of DA neurons. In particular, stem/neural progenitorcells have received much attention as they have the potential togenerate large numbers of DA neurons in a standardized andcontrolled fashion (Roybon et al., 2004). It has been shown inrodents (Kim et al., 2002; Studer et al., 1998; Bjorklund et al.,2002) and recently also in non-human primates (Takagi et al.,

428 J.R. Jørgensen et al. / Experimental Neurology 198 (2006) 427–437
2005) that transplantation of DA neurons derived from stemcells can lead to symptomatic recovery in animal models of PD.However, the generation of similar cells from human sourceshas not been equally successful. Instead of replacing DAneurons through transplantation, an alternative therapeuticstrategy for PD is to protect or regenerate the remainingendogenous DA neurons or their precursors that may exist in theadult brain. GDNF is one example of a potent factor importantfor the development of DA neurons in vivo (Lin et al., 1993)that have shown beneficial effects in PD models and patients(Kirik et al., 2004). Similarly, factors of importance forspecifying the DA phenotype during development may havetherapeutic potential if delivered to the relevant endogenous ortransplantable precursor cells.
In higher vertebrates, the majority of DA neurons are locatedwithin the substantia nigra (SN) and the ventral tegmental area(VTA) in the mesencephalon. In the human embryo, immatureDA neurons can be found in the ventral part of the tegmentumfrom approximately 6 weeks GA (Almqvist et al., 1996). Theyarise near the mid/hindbrain boundary (isthmus) and the floorplate by the combined actions of two secreted signalingproteins, fibroblast growth factor 8 and sonic hedgehog(Hynes and Rosenthal, 1999). Even though many factorsinvolved in DA neuron specification and survival are known(Vitalis et al., 2005), the ontogeny of the system remainsobscure. It is therefore necessary to identify factors and markersexpressed during this developmental timeframe in order to learnto control the fate and survival of expandable DA neuronprogenitors in cell replacement or regenerative treatmentstrategies for PD.
In this study, we set out to investigate the expression profileof developing human mesencephalic tissue using AffymetrixGeneChip technology and precisely dissected human firsttrimester tissues in combination with Q-PCR verificationtechniques. Several known and unknown genes with relevancefor ventral mesencephalic development and dopaminergicspecification and function were found.
Materials and methods
Samples and RNA extraction
Embryonic tissue was recovered from first trimester routineabortions using standard vacuum aspiration techniques at the
Fig. 1. Illustration of midbrain dissections into dorsal and ve
Karolinska University Hospital, Huddinge, Sweden. Thecollection was approved by the Human Ethics Committee ofthe Huddinge University Hospital, Karolinska Institute, and isin accordance with the guidelines of the Swedish NationalBoard of Health and Welfare (Socialstyrelsen). The GA of eachspecimen was determined by size and anatomy according to theatlas of England (England, 1988). A total of 14 humanembryonic and fetal brain tissue samples, 5 to 10 weeks GA,were used for this study. Cases were rapidly subdissected intofore- and midbrain. For cases older than 7 weeks GA, midbrainsamples were further subdissected into ventral and dorsaltegmentum (VT and DT) as illustrated in Fig. 1. Afterdissection, tissues were instantly frozen in liquid nitrogen andstored at −80°C. Subsequently, total RNA was extracted usingTrizol (Invitrogen, Carlsbad, CA) according to the manufac-turer's instructions. To concentrate RNA and to remove tracesof chromosomal DNA, RNeasy on column DNase digestionwith RNase-Free DNase was used (QIAgen, Germany) andRNA subsequently eluted in ultra pure H2O. The quality ofRNA samples for GeneChip analysis was assessed using theAgilent Bioanalyser 2100 and the RNA 6000LabChip. TheOD260/280 was measured to 1.88 ± 0.05 (mean ± SD) for theremaining RNA samples to be used for Q-PCR analysis.
Affymetrix microarray
Two 8 weeks GA midbrains were subdissected into a dorsaland ventral tegmentum and RNA extracted. Two independentrounds of amplification were performed for one sampleaccording to the MessageAMPTM aRNA protocol (Ambion,Austin, TX), whereas only one round of amplification wasperformed for the other, resulting in three ventral samples andthree dorsal samples. After purification and fragmentation, 15μg biotinylated cRNA was hybridized for 16 h at 45°C to theAffymetrix Human Genome U133 Chip Set, consisting of twoarrays, HG-U133A and HG-U133B (Affymetrix, Santa Clara,CA). Samples were first applied to HG-U133A containingmostly well-substantiated human genes and then transferred toHG-U133B, primarily representing ESTs. In total, almost45,000 probe sets representing more than 39,000 transcriptsare present (www.affymetrix.com). Washing of the arrays andstaining with a streptavidin–phycoerythrin conjugate were doneusing the GeneChip Fluidics Station 400, and subsequentscanning was done with the Affymetrix GeneArray Scanner, all
ntral tegmentum. See Materials and methods for details.

429J.R. Jørgensen et al. / Experimental Neurology 198 (2006) 427–437
according to manufacturer's instructions (Affymetrix, SantaClara, CA).
Array analysis
Primary analysis was done using the software-packageGenePublisher (Knudsen et al., 2003). In short, qspline(Workman et al., 2002) was used for normalization, bg.adjust(Irizarry et al., 2003) was used for background correction, andthe Li–Wong method (Li and Wong, 2001) was used forexpression index calculation. For further analysis, data obtainedfrom GenePublisher were formatted as a tab-delimited text fileand imported into Microsoft Excel2000. For each probe ID, thefile contained signal values, fold change, a P value calculatedfrom a t test and finally gene annotation including accessionnumber and UniGene cluster identifier. Subsequently, a low-stringency filter was applied as follows. First, the average signalvalues should be larger than 50. Second, the P value should besmaller than 0.04. Finally, the signal log2ratio (SLR) should belarger than 0.5, to identify genes that are expressed higher in theVT compared to the DT.
cDNA synthesis
Using RT-PCR, all RNA samples used in this study weretested negative for the presence of genomic DNA. (Table 3,supporting information). Aliquots of 2.5 μg RNAwere used astemplate for cDNA synthesis with an RNAseH-deficient reversetranscriptase derived from MoMLV (SuperScript) and a poly-dT primer. cDNA from all samples was synthesized at the sametime using the same mastermix to avoid technical variations.
Quantitative real-time PCR
All primers were designed using Clone Manager Suite 7.1from Sci Ed Software (Cary, NC) and ordered from TAGCopenhagen A/S, Denmark (Table 3, supporting information).Where possible, primers were designed to be intron spanningamplifying 150 to 400 bp. The optimal annealing temperaturefor each primerset was determined by gradient RT-PCR (PTC-225, MJ Research, Waltham, MA) with cDNA prepared fromUniversal Human Reference RNA (Stratagene, La Jolla, CA) orSubstantia Nigra total RNA (BD, Palo Alto, CA) as template.Gel electrophoresis and melting curve analysis were used toverify that a single PCR product of the predicted size wasgenerated. The product was subsequently isolated using theGENECLEAN II Kit (Qbiogene Inc., Irvine, CA) and seriallydiluted over eight decades to be used for generation of astandard curve. Using approximately 20 ng of each cDNAsample as template, Q-PCR was done in duplicates in anOpticon-2 thermocycler (MJ Research, Waltham, MA), usingLightCycler-FastStart DNA Master SYBR Green I kit (Roche,Germany). All amplifications were performed in a total volumeof 10 μl containing 3 mMMgCl2, 12% sucrose, and 1× reactionbuffer included in the LightCycler kit. The PCR cycling profileconsisted of a 10-min pre-denaturation step at 98°C followed by35 three-step cycles; at 98°C for 10 s, at the optimized annealing
temperature indicated in Table 3 for the specific gene for 20 s,and finally at 72°C for 20 s. The relative amount of RNA wascalculated according to the standard curve for the particularprimer set and normalized to the level of GAPDH, functioningas an internal control message. The variation in GAPDHexpression was only 3.2-fold from the lowest to the highestsample over the whole panel of fetal brain cDNA (2.0 ± 0.6,mean ± SD).
To visualize multiple expression profiles, Q-PCR data wereformatted as a tab-delimited text file and uploaded to theClustArray Server v1.01 (http://chianti.ucsd.edu/ClustArray/).Clustering was done with weighted pair-group mathematicalaverage algorithm (WPGMA) using Euclidian distance asdistance measure. Purely for cosmetic reasons, some branchesof the resulting dendogram were flipped using Adobe IllustratorCS 11.0.0.
Results
Experimental setup and RNA quality
Since only 5–10% of the total cell population in the humanfetal VM is made up of DA progenitors/neurons, a gene couldbe regulated several fold in the DA subpopulation but dilutedout in the total RNA mix used for array analysis. Therefore, weaimed at dissecting only part of the VT as close as possible towhere DA neurons are expected (Fig. 1). For comparison, theadjacent DT was used. In both cases, the neighboring lateraltissue was discarded. This way, two closely related regions werecompared, in which DA neurons are only expected to be presentin the VT sample. The subdissected 8-week tegmental samplesyielded RNA amounts between 10 and 18 μg. Using the AgilentBioanalyzer 2100, clear 28S and 18S peaks with a [28S/18S]ratio N2 were observed for all samples. Also it should be notedthat there was no noise between the peaks or low molecularweight contaminations (data not shown). This indicated overallhigh quality and non-degraded RNA samples. Aliquots of 5 μgwere amplified resulting in 18–30 μg biotin-labeled cRNA, ofwhich 15 μg was used for array analysis on the Human GenomeU133 Set.
Few genes are differentially expressed between VT and DT
First, we carried out a detailed analysis of data from HG-U133A because in this case, the presence of known DA markergenes can be used as a guide to design an effective data filter fordetection of similarly regulated genes on the HG-U133B chip.To get an initial overview, data were plotted as a volcano plot(Wolfinger et al., 2001) showing the relationship between Pvalues and log2 transformed fold changes (Fig. 2). From theoriginal data, high similarity between the expression profiles ofVT and DT is evident from the very narrow plot. Only very fewprobes are changed more than twofold. However, it is clear thatseveral probes demonstrate higher fold changes for the originaldata set compared to the permutations. In particular, one genestands out with a high fold change of 2.87 (log2) and a P valueof 1.2 × 10⁻⁷. This is aldehyde dehydrogenase 1 family member

Fig. 2. The relationship between P values and log2 fold change for all probe setson HG-U133A are shown as a Volcano plot with permutations included. In front,in red, the original data representing VT versus DT. Behind, other colorsrepresenting permutations of the samples. All 18 possible permutations weremade, but since half of them are mirror images of each other, only nine areshown in the plot. The stippled box indicates the low stringency filter used foridentification of probes up-regulated in VT. The arrow indicates ALDH1A1with fold a change of 2.87 (log2) and a P value of 1.2 × 10⁻⁷.
430 J.R. Jørgensen et al. / Experimental Neurology 198 (2006) 427–437
A1 (ALDH1A1), one of the earliest markers of DA phenotype(McCaffery and Drager, 1994). For most differentiallyexpressed probes, P values higher than 10−3 are observed,meaning several potential false positives by chance alone from astatistical point of view. As the array data are not statisticallysignificant, we applied a low stringency filter to the data fromHG-U133A as an alternative analysis, in an attempt to filter outdifferently expressed genes.
Known DA genes top the list of regulated genes on HG-U133A
Sorting away probes with signal values smaller than 50, Pvalues larger than 0.04 or SLR smaller than 0.5, generated a listof 107 probes, which were finally arranged with descendingfold changes (Tables 1 and 4, the latter as supportinginformation). It can be seen from Table 1 that the mostregulated probes represent ALDH1A1, DAT1, VMAT2, TH,Calbindin 1, NURR1, and FOXA1. These are all genesinvolved in DA differentiation or genes characterizing themore matured phenotype. As mentioned, ALDH1A1 is one ofthe earliest markers of the DA phenotype (McCaffery andDrager, 1994), whereas the dopamine transporter DAT1 and thevesicular monoamine transporter VMAT2 both representphenotypic markers for the mature DA neuron. Tyrosinehydroxylase is the initial and rate-limiting enzyme in thesynthesis of the catecholamines including dopamine (Goridisand Rohrer, 2002). DA neurons are often defined by theirexpression of TH in the absence of dopamine β-hydroxylase,
the enzyme that converts dopamine to noradrenaline. Calbindin1 (28 kDa) is co-expressed in a subset of TH positive neurons inthe developing human VM (Verney et al., 2001) and have alsobeen shown to be expressed in the adult SN (Damier et al.,1999). Therefore, Calbindin 1 (28 kDa) is often used as a non-phenotypic marker of DA neurons. Three probes for NURR1,an orphan nuclear receptor with essential functions in DAdevelopment (Perlmann and Wallen-Mackenzie, 2004), exist onHG-U133A, and all are among the most up-regulated as seen inTable 1. FOXA1, also known as HNF3a, is expressed from E8/9in mice (Ang et al., 1993), and as such, it may be one of theearliest cell type specific genes expressed by DA neurons in theVM (Thuret et al., 2004b). FLJ21924 and Cerebellin are alsofound in the top of the list, but these genes have not previouslybeen associated with DA neurons. PITX2 is indeed expressed inboth the developing and adult midbrain, however, not by DAneurons (Asbreuk et al., 2002). Instead PITX2 is found in thesubthalamic nucleus rostral to the SN and VTA (Martin et al.,2004). As the last probe regulated more than twofold, IGF1 isalso detected as differentially expressed in agreement withprevious immunohistochemical studies (Garcia-Segura et al.,1991).
For probes with less than a twofold change, several genesknown to be expressed by DA neurons are found. All fourannotated probes for α-synuclein (SNCA) demonstrated ahigher expression in VT compared to DT, supported byimmunohistological studies in humans detecting SNCA in SNfrom 15 weeks GA (Galvin et al., 2001). In parallel, for the D2dopamine receptor (DRD2), known to be expressed by DAneurons (Meador-Woodruff et al., 1994), all four probesexisting on the HG-U133A chip demonstrated a higherexpression in VT. The inward rectifying potassium channelKCNJ6, also called Girk2, is detected as higher expressed in theVT in agreement with studies demonstrating high expression inthe DA neurons of SN and VTA (Inanobe et al., 1999; Liao etal., 1996). A missense mutation in Girk2 is responsible for theneurological phenotype of the weaver mouse where DAneurons of the SN are selectively degraded (Schmidt et al.,1982).
Although the expression level is low, differential expressionis also observed for the receptor tyrosine kinase subunit, RET, inagreement with in situ studies in mouse (Golden et al., 1999).PITX3, a bicoid-related homeodomain transcription factor, waslikewise identified as higher expressed in VT in agreement withits expression being restricted to the developing eye and mostimportantly to DA progenitors. In the brain, PITX3 is expressedspecifically in the SN and VTA (Smidt et al., 1997), and it hasbeen shown to be required for DA neuron development in SN(Nunes et al., 2003). Although widely distributed in the brain,BDNF expression has been detected in the SNc and VTA, anddual in situ hybridization with TH confirms the DA nature ofthese cells (Seroogy et al., 1994). Finally, EPHA5 has beendemonstrated to be expressed by midbrain DA neurons (Yue etal., 1999) which is also the case for ERBB4 (Thuret et al.,2004a; Steiner et al., 1999).
In addition to the well-described DA genes above, several ofthe identified genes in Table 1 have previously been associated

Table 1Genes up-regulated in the ventral tegmentum
Gene Alias Gene ID GO annotation VT DT Change
ALDH1A1* AHD2 216 Catalytic 316 43 7.31SLC6A3* DAT1 6531 Transporter 462 104 4.44SLC18A2* VMAT2 6571 Transporter 214 61 3.51TH* 7054 Catalytic 655 257 2.55CALB1 Calbindin 1,
28kD793 Binding 337 137 2.46
NR4A2* Nurr1 4929 Transcription 908 381 2.38FOXA1* HNF3A 3169 Transcription 648 278 2.33NR4A2* Nurr1 4929 Transcription 507 217 2.33FLJ21924* 79832 – 374 164 2.28CBLN1* 869 – 185 82 2.27PITX2* PTX2 5308 Transcription 266 122 2.17NR4A2* Nurr1 4929 Transcription 724 344 2.10IGF1* Somatomedin C 3479 Signal
transduction112 53 2.10
STK17A DRAK1 9263 Catalytic 68 35 1.96CADPS2 93664 – 234 121 1.93PAQR6 FLJ22672 79957 Signal
transduction705 383 1.84
GABRB1 2560 Transporter 178 97 1.84SNCA α-Synuclein 6622 – 352 199 1.78PPP1R3C PP1R5 5507 Catalytic 327 184 1.78SNCA α-Synuclein 6622 – 555 315 1.77SCARB2 CD36L2 950 Signal
transduction490 278 1.77
COBLL1 KIAA0977 22837 – 154 89 1.73ARHGAP6 RHOGAP6 395 Signal
transduction111 64 1.72
MYRIP Exophilin 25924 Binding 235 138 1.71HBLD2 hIscA 81689 – 150 89 1.69DRD2 D2R 1813 Signal
transduction402 239 1.68
KCNJ6 GIRK2 3763 Transporter 473 283 1.67RET HSCH1 5979 Signal
transduction64 38 1.67
FLJ11627 – – 96 57 1.67COPG2 2-COP 26958 Transporter 63 38 1.66FLJ20130 54830 Transporter 121 73 1.66FOXB1 FKH5 27023 Transcription 170 102 1.66RRAS2 TC21 22800 Binding 245 149 1.64PITX3* PTX3 5309 Transcription 167 102 1.64PHLDA1 TDAG51 22822 – 173 106 1.62CORIN CRN 10699 Catalytic 90 56 1.62BDNF 627 Signal
transduction128 80 1.61
SNCA α-Synuclein 6622 – 326 203 1.60DSCR1L1 ZAKI-4 10231 Binding 531 331 1.60DLK1* FA-1 8788 Binding 289 181 1.59ATXN7L1 KIAA1218 57485 – 130 82 1.58TRIM9 SPRING 114088 Catalytic 643 408 1.58RBMS1 YC1 5937 Binding 236 150 1.57ZNF73 7624 Transcription 102 65 1.57GRM8 GLUR8 2918 Signal
transduction73 47 1.56
SLC17A6 VGLUT2 57084 Transporter 619 398 1.56PCDH11X 83259 Binding 235 151 1.56BCL2L2 Bcl-w 599 – 289 187 1.55C10orf3 FLJ10540 55165 – 85 55 1.55NEBL Nebulette 10529 Binding 139 91 1.54PPEF2 5470 Catalytic 85 55 1.54SNCA α-Synuclein 6622 – 310 203 1.53CLDN11 Claudin 11 5010 Structural 106 70 1.52UBE2D1 UBC4/5 7321 Catalytic 438 288 1.52
(continued on next page)
Table 1 (continued)
Gene Alias Gene ID GO annotation VT DT Change
PLS3 Plastin 3 5358 Bining 104 69 1.52EPHA5 EHK1 2044 Signal
transduction116 77 1.51
IL-17RC MGC10763 84818 Signaltransduction
186 124 1.51
CHRNA7 NACHRA7 1139 Signaltransduction
224 149 1.51
ERBB4 HER4 2066 Signaltransduction
670 444 1.51
Data from HG-U133A was sorted as described in the text and listed withdescending fold changes. Some genes are represented by several probes. Gene,in the first column, refers to the approved gene symbol defined by the HUGOGene Nomenclature Committee, whereas the second column refers to what maybe a more commonly known alias. GeneID can be used directly for looking upthe specific sequence in Entrez Gene at National Center for Biotechnologyinformation (NCBI) (http://www.ncbi.nlm.nih.gov/entrez/query.fcgi?db=gene).Where possible, for each gene, the GO annotation column refers to themolecular function defined by the Gene Ontology Consortium (Ashburner et al.,2000). GO categories were annotated using AmiGO (http://www.godatabase.org/cgi-bin/amigo/go.cgi) and checked manually. VT and DT refer to theaverage probe signal from ventral and dorsal tegmental samples respectively.Finally, in the last column, the change in gene expression expressed as VT/DT.Probes with less than a 1.5 change are listed in Table 4 as supplementaryinformation. Genes in bold are verified by literature as differentially expressed(see Results for references), whereas genes analyzed by Q-PCR in Fig. 4 aremarked by an asterisk (*).
431J.R. Jørgensen et al. / Experimental Neurology 198 (2006) 427–437
with VM. As an example, SLC17A6, also called VGLUT2, hasbeen detected in SN (Aihara et al., 2000) but also very recentlyin neonatal rat dopamine neurons in culture (Dal Bo et al.,2004). Furthermore, CHRNA7 (Jones and Wonnacott, 2004),FOXB1 (Alvarez-Bolado et al., 2000), DSCR1L1 (Siddiq et al.,2001), DLK1 (Jensen et al., 2001), TRIM9 (Berti et al., 2002),PCDH11X (Blanco et al., 2000), and TRPM3 (Lee et al., 2003)have been shown to be expressed in the SN/VTA area by PCRor in situ hybridization.
Verification of HG-U133A data by literature mining
An important part of the validation is looking into theliterature as above to compare the results from the arrayexperiment with existing data. It should be noted that most datain the literature are based on rodent studies. Gene expressionpatterns may therefore vary between species and developmentalstage. Nevertheless, if a gene has been shown to be specificallyexpressed by DA neurons in rodents or specifically located inthe SN/VTA area, we take that as supporting evidence of humanarray data demonstrating a higher expression in VT comparedDT. Adding up, as can be seen from Fig. 3, a high hit rate,especially in the top of the list, was noted. For probes with a foldchange higher than two, an 85% hit rate (11/13) was observed.Including all probes with a fold change higher than 1.5,approximately half of them could be verified (29/59). Towardsthe bottom of the list, for probes with a fold change less than 1.5(see Table 4, supporting information), there are only a fewknown marker genes, indicating that a more stringent filtercould have been applied, but that would at the same time limitthe opportunity of finding new DA genes. Overall, considering
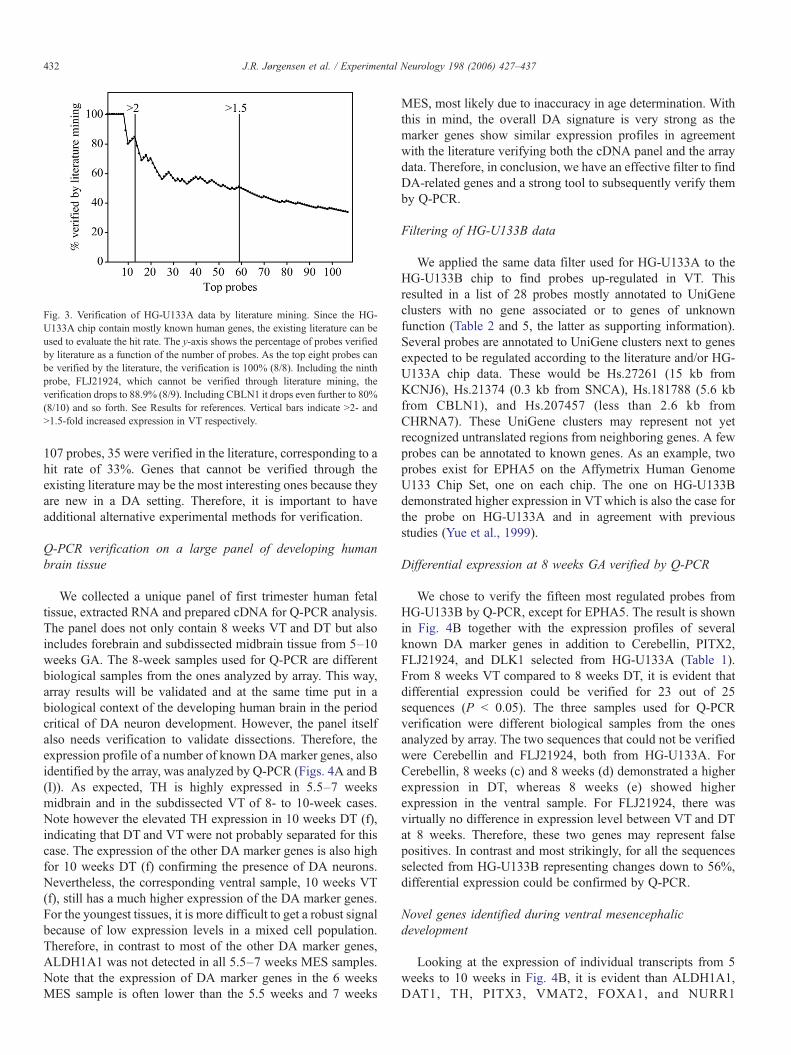
Fig. 3. Verification of HG-U133A data by literature mining. Since the HG-U133A chip contain mostly known human genes, the existing literature can beused to evaluate the hit rate. The y-axis shows the percentage of probes verifiedby literature as a function of the number of probes. As the top eight probes canbe verified by the literature, the verification is 100% (8/8). Including the ninthprobe, FLJ21924, which cannot be verified through literature mining, theverification drops to 88.9% (8/9). Including CBLN1 it drops even further to 80%(8/10) and so forth. See Results for references. Vertical bars indicate N2- andN1.5-fold increased expression in VT respectively.
432 J.R. Jørgensen et al. / Experimental Neurology 198 (2006) 427–437
107 probes, 35 were verified in the literature, corresponding to ahit rate of 33%. Genes that cannot be verified through theexisting literature may be the most interesting ones because theyare new in a DA setting. Therefore, it is important to haveadditional alternative experimental methods for verification.
Q-PCR verification on a large panel of developing humanbrain tissue
We collected a unique panel of first trimester human fetaltissue, extracted RNA and prepared cDNA for Q-PCR analysis.The panel does not only contain 8 weeks VT and DT but alsoincludes forebrain and subdissected midbrain tissue from 5–10weeks GA. The 8-week samples used for Q-PCR are differentbiological samples from the ones analyzed by array. This way,array results will be validated and at the same time put in abiological context of the developing human brain in the periodcritical of DA neuron development. However, the panel itselfalso needs verification to validate dissections. Therefore, theexpression profile of a number of known DA marker genes, alsoidentified by the array, was analyzed by Q-PCR (Figs. 4A and B(I)). As expected, TH is highly expressed in 5.5–7 weeksmidbrain and in the subdissected VT of 8- to 10-week cases.Note however the elevated TH expression in 10 weeks DT (f),indicating that DT and VT were not probably separated for thiscase. The expression of the other DA marker genes is also highfor 10 weeks DT (f) confirming the presence of DA neurons.Nevertheless, the corresponding ventral sample, 10 weeks VT(f), still has a much higher expression of the DA marker genes.For the youngest tissues, it is more difficult to get a robust signalbecause of low expression levels in a mixed cell population.Therefore, in contrast to most of the other DA marker genes,ALDH1A1 was not detected in all 5.5–7 weeks MES samples.Note that the expression of DA marker genes in the 6 weeksMES sample is often lower than the 5.5 weeks and 7 weeks
MES, most likely due to inaccuracy in age determination. Withthis in mind, the overall DA signature is very strong as themarker genes show similar expression profiles in agreementwith the literature verifying both the cDNA panel and the arraydata. Therefore, in conclusion, we have an effective filter to findDA-related genes and a strong tool to subsequently verify themby Q-PCR.
Filtering of HG-U133B data
We applied the same data filter used for HG-U133A to theHG-U133B chip to find probes up-regulated in VT. Thisresulted in a list of 28 probes mostly annotated to UniGeneclusters with no gene associated or to genes of unknownfunction (Table 2 and 5, the latter as supporting information).Several probes are annotated to UniGene clusters next to genesexpected to be regulated according to the literature and/or HG-U133A chip data. These would be Hs.27261 (15 kb fromKCNJ6), Hs.21374 (0.3 kb from SNCA), Hs.181788 (5.6 kbfrom CBLN1), and Hs.207457 (less than 2.6 kb fromCHRNA7). These UniGene clusters may represent not yetrecognized untranslated regions from neighboring genes. A fewprobes can be annotated to known genes. As an example, twoprobes exist for EPHA5 on the Affymetrix Human GenomeU133 Chip Set, one on each chip. The one on HG-U133Bdemonstrated higher expression in VTwhich is also the case forthe probe on HG-U133A and in agreement with previousstudies (Yue et al., 1999).
Differential expression at 8 weeks GA verified by Q-PCR
We chose to verify the fifteen most regulated probes fromHG-U133B by Q-PCR, except for EPHA5. The result is shownin Fig. 4B together with the expression profiles of severalknown DA marker genes in addition to Cerebellin, PITX2,FLJ21924, and DLK1 selected from HG-U133A (Table 1).From 8 weeks VT compared to 8 weeks DT, it is evident thatdifferential expression could be verified for 23 out of 25sequences (P b 0.05). The three samples used for Q-PCRverification were different biological samples from the onesanalyzed by array. The two sequences that could not be verifiedwere Cerebellin and FLJ21924, both from HG-U133A. ForCerebellin, 8 weeks (c) and 8 weeks (d) demonstrated a higherexpression in DT, whereas 8 weeks (e) showed higherexpression in the ventral sample. For FLJ21924, there wasvirtually no difference in expression level between VT and DTat 8 weeks. Therefore, these two genes may represent falsepositives. In contrast and most strikingly, for all the sequencesselected from HG-U133B representing changes down to 56%,differential expression could be confirmed by Q-PCR.
Novel genes identified during ventral mesencephalicdevelopment
Looking at the expression of individual transcripts from 5weeks to 10 weeks in Fig. 4B, it is evident than ALDH1A1,DAT1, TH, PITX3, VMAT2, FOXA1, and NURR1

Fig. 4. Q-PCR analysis of gene expression in first trimester human brain tissue. A panel of human fetal brain tissues 5 to 10 weeks GAwas collected and subdissectedwhere possible. MES: mesencephalon, FBr: forebrain, DT: dorsal tegmentum and VT: ventral tegmentum. Lower case letters (a–f) indicate samples from the samebiological cases respectively. (A) TH expression showed as bar graph. Using ClustArray, the Q-PCR expression profile can be translated to a color scale, which isuseful for showing many expression profiles simultaneously as in panel B. (B) Expression profiles of known DA marker genes and additional sequences selected fromHG-U133A and HG-U133B. Profiles are shown in a color scale where cyan is low, yellow is high, and grey represents missing samples. The stippled box indicates8 weeks DTand VT. For these samples a t test was used to evaluate the statistical significance of differential expression. The average fold change (8 weeks FC) and theP value for each gene are shown in the table right to the diagram. Data were clustered into two clusters, I and II.
433J.R. Jørgensen et al. / Experimental Neurology 198 (2006) 427–437
representing known DA marker genes cluster together in the topof the diagram with a strong DA signature (I). For this group ofgenes, the differential expression between VT and DT is verydistinct, and a robust signal is observed from the youngermidbrain samples coinciding with the time of DA induction inthe human fetus (Almqvist et al., 1996; Verney, 1999).
All the genes not previously associated with the DAphenotype are found in the second cluster (II). Here, the DAsignature remains strong for several genes, but in general, theoverall differential signal is weaker compared to group I. With alarge and very significant up-regulation in VT at 8 weeks andincreased expression in the young midbrain samples, the DAsignature is most evident for SLC10A4. This is a type 2membrane protein of unknown function belonging to the
sodium/bile acid co-transporter family. The Q-PCR analysis ofLOC284033 expression also revealed a DA-like profile. UsingProtFun and SignalP (www.cbs.dtu.dk), the 123-amino-acidlarge hypothetical protein LOC284033 is predicted as a growthfactor with a probable signal peptide cleavage site. Q-PCRexpression analysis on more than 25 different adult tissuesrevealed expression only in the CNS with particular highexpression in SN, cerebellum, and spinal cord (data not shown).However, mouse and rat homologues could not be found andneither did we succeed in heterologous expression of histidinetagged LOC284033. Therefore, it was speculated thatLOC284033 might represent the UTR region of the neighboringwell-conserved FLJ45455 less than 3 kb away. This wassupported by Q-PCR analysis with primers in separate exons of
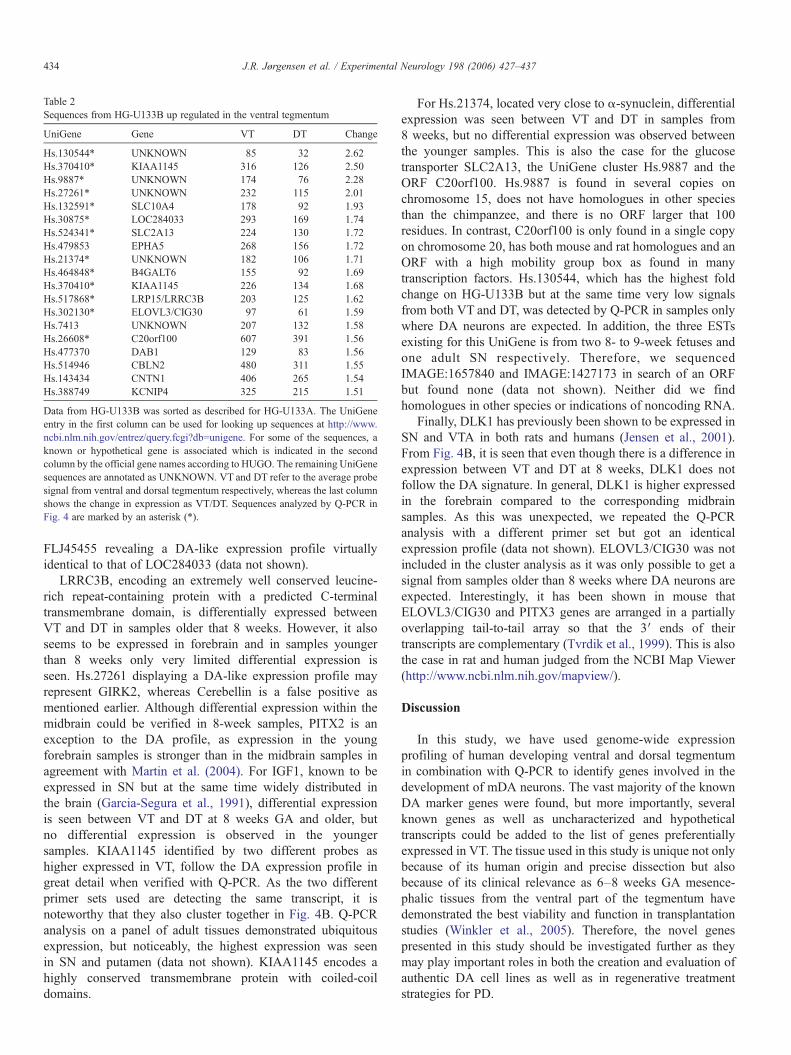
Table 2Sequences from HG-U133B up regulated in the ventral tegmentum
UniGene Gene VT DT Change
Hs.130544* UNKNOWN 85 32 2.62Hs.370410* KIAA1145 316 126 2.50Hs.9887* UNKNOWN 174 76 2.28Hs.27261* UNKNOWN 232 115 2.01Hs.132591* SLC10A4 178 92 1.93Hs.30875* LOC284033 293 169 1.74Hs.524341* SLC2A13 224 130 1.72Hs.479853 EPHA5 268 156 1.72Hs.21374* UNKNOWN 182 106 1.71Hs.464848* B4GALT6 155 92 1.69Hs.370410* KIAA1145 226 134 1.68Hs.517868* LRP15/LRRC3B 203 125 1.62Hs.302130* ELOVL3/CIG30 97 61 1.59Hs.7413 UNKNOWN 207 132 1.58Hs.26608* C20orf100 607 391 1.56Hs.477370 DAB1 129 83 1.56Hs.514946 CBLN2 480 311 1.55Hs.143434 CNTN1 406 265 1.54Hs.388749 KCNIP4 325 215 1.51
Data from HG-U133B was sorted as described for HG-U133A. The UniGeneentry in the first column can be used for looking up sequences at http://www.ncbi.nlm.nih.gov/entrez/query.fcgi?db=unigene. For some of the sequences, aknown or hypothetical gene is associated which is indicated in the secondcolumn by the official gene names according to HUGO. The remaining UniGenesequences are annotated as UNKNOWN. VT and DT refer to the average probesignal from ventral and dorsal tegmentum respectively, whereas the last columnshows the change in expression as VT/DT. Sequences analyzed by Q-PCR inFig. 4 are marked by an asterisk (*).
434 J.R. Jørgensen et al. / Experimental Neurology 198 (2006) 427–437
FLJ45455 revealing a DA-like expression profile virtuallyidentical to that of LOC284033 (data not shown).
LRRC3B, encoding an extremely well conserved leucine-rich repeat-containing protein with a predicted C-terminaltransmembrane domain, is differentially expressed betweenVT and DT in samples older that 8 weeks. However, it alsoseems to be expressed in forebrain and in samples youngerthan 8 weeks only very limited differential expression isseen. Hs.27261 displaying a DA-like expression profile mayrepresent GIRK2, whereas Cerebellin is a false positive asmentioned earlier. Although differential expression within themidbrain could be verified in 8-week samples, PITX2 is anexception to the DA profile, as expression in the youngforebrain samples is stronger than in the midbrain samples inagreement with Martin et al. (2004). For IGF1, known to beexpressed in SN but at the same time widely distributed inthe brain (Garcia-Segura et al., 1991), differential expressionis seen between VT and DT at 8 weeks GA and older, butno differential expression is observed in the youngersamples. KIAA1145 identified by two different probes ashigher expressed in VT, follow the DA expression profile ingreat detail when verified with Q-PCR. As the two differentprimer sets used are detecting the same transcript, it isnoteworthy that they also cluster together in Fig. 4B. Q-PCRanalysis on a panel of adult tissues demonstrated ubiquitousexpression, but noticeably, the highest expression was seenin SN and putamen (data not shown). KIAA1145 encodes ahighly conserved transmembrane protein with coiled-coildomains.
For Hs.21374, located very close to α-synuclein, differentialexpression was seen between VT and DT in samples from8 weeks, but no differential expression was observed betweenthe younger samples. This is also the case for the glucosetransporter SLC2A13, the UniGene cluster Hs.9887 and theORF C20orf100. Hs.9887 is found in several copies onchromosome 15, does not have homologues in other speciesthan the chimpanzee, and there is no ORF larger that 100residues. In contrast, C20orf100 is only found in a single copyon chromosome 20, has both mouse and rat homologues and anORF with a high mobility group box as found in manytranscription factors. Hs.130544, which has the highest foldchange on HG-U133B but at the same time very low signalsfrom both VT and DT, was detected by Q-PCR in samples onlywhere DA neurons are expected. In addition, the three ESTsexisting for this UniGene is from two 8- to 9-week fetuses andone adult SN respectively. Therefore, we sequencedIMAGE:1657840 and IMAGE:1427173 in search of an ORFbut found none (data not shown). Neither did we findhomologues in other species or indications of noncoding RNA.
Finally, DLK1 has previously been shown to be expressed inSN and VTA in both rats and humans (Jensen et al., 2001).From Fig. 4B, it is seen that even though there is a difference inexpression between VT and DT at 8 weeks, DLK1 does notfollow the DA signature. In general, DLK1 is higher expressedin the forebrain compared to the corresponding midbrainsamples. As this was unexpected, we repeated the Q-PCRanalysis with a different primer set but got an identicalexpression profile (data not shown). ELOVL3/CIG30 was notincluded in the cluster analysis as it was only possible to get asignal from samples older than 8 weeks where DA neurons areexpected. Interestingly, it has been shown in mouse thatELOVL3/CIG30 and PITX3 genes are arranged in a partiallyoverlapping tail-to-tail array so that the 3′ ends of theirtranscripts are complementary (Tvrdik et al., 1999). This is alsothe case in rat and human judged from the NCBI Map Viewer(http://www.ncbi.nlm.nih.gov/mapview/).
Discussion
In this study, we have used genome-wide expressionprofiling of human developing ventral and dorsal tegmentumin combination with Q-PCR to identify genes involved in thedevelopment of mDA neurons. The vast majority of the knownDA marker genes were found, but more importantly, severalknown genes as well as uncharacterized and hypotheticaltranscripts could be added to the list of genes preferentiallyexpressed in VT. The tissue used in this study is unique not onlybecause of its human origin and precise dissection but alsobecause of its clinical relevance as 6–8 weeks GA mesence-phalic tissues from the ventral part of the tegmentum havedemonstrated the best viability and function in transplantationstudies (Winkler et al., 2005). Therefore, the novel genespresented in this study should be investigated further as theymay play important roles in both the creation and evaluation ofauthentic DA cell lines as well as in regenerative treatmentstrategies for PD.

435J.R. Jørgensen et al. / Experimental Neurology 198 (2006) 427–437
One of the primary challenges working with microarrays,and especially arrays covering the entire human genome, is tolimit the number of false positives. As the array data in thisstudy were not statistically significant on their own, wedesigned a low stringency data filter taking into account bothexpression level, fold change, and significance. For the filteredprobes on HG-U133A with a fold change higher than 1.5, halfof them could be verified by literature mining. However, itshould be noted that verification through literature is oftenbased on rodent data where an exact match to the humandevelopmental stage used in the array analysis is not possible.Nevertheless, if a gene has been demonstrated to be specificallyexpressed by DA neurons, we took it as confirmation,regardless of the developmental stage and species. For HG-U133B data, verification by literature mining is not an option asmost probes represent ESTs, but the same data filter designedfor HG-U133A can be used to identify differentially expressedtranscripts. For all the filtered probes from HG-U133B from thetop down to 1.56-fold regulation, we were able to verifydifferential expression by Q-PCR, confirming a very effectivedata filter. Hence, we may expect many of the genes identifiedon HG-U133A, with similar fold changes, also to bedifferentially expressed.
The concept of fold change is complicated when workingwith mixed cell populations. A gene could be regulatedseveral fold in a subpopulation like the DA neurons butdiluted out in the total RNA mix used for array or Q-PCRanalysis. Therefore, it may still be interesting to look at geneswith very small changes. In situ hybridization with TH co-stain would be the method to reveal the DA nature of thegenes identified in this study. However, factors important inthe development of the DA phenotype do not have to beexpressed by the DA cells themselves. Secreted factors fromsurrounding glia may be especially important for instructingthe developing DA neuron. It would be interesting to studythe expression of the identified sequences in animal modelswith loss of DA neurons like the weaver mouse (Schmidt etal., 1982), the PITX3 deficient aphakia mouse (Nunes et al.,2003), or the knock-out animals of NURR1 (Zetterstrom etal., 1997), EN1/EN2 (Simon et al., 2001), or LMX1B (Smidtet al., 2000). Also, the other way around, gene inactivationstudies for some of the novel genes could shed more light onthe at least three separate pathways involved in DAdevelopment (Burbach et al., 2003; Vitalis et al., 2005).
We chose to verify the array data on a panel of subdissectedbrain tissue ranging from 5 to 10 weeks GA. The 8-weeksamples used for Q-PCR verification are different biologicalsamples from the ones analyzed by array. We did not observe aparticular good correlation between the fold changes detectedby the two techniques. However, this is not only because ofbiological variation between samples but more due to the factthat two situations were compared where biologically relevantexpression levels may be only expected in one of them. This ismost distinct for the DA marker genes expected only to beexpressed in VT. Since the dynamic range is much larger and inparticular because the detection limit is much lower for Q-PCRcompared to the array technique, a higher fold change with Q-
PCR was often noted. However, by including samples for Q-PCR verification from different brain regions and of differentages, a spatial and temporal DA expression profile could beseen that was followed by all the known DA genes tested.Several sequences of unknown function also followed this DAsignature. Of particular interest is SLC10A4 where virtually allESTs are from neuroblastomas or glioblastomas. The vastmajority of neuroblastomas produce catecholamines includingdopamine and human glioblastomas contain stem cell likeneural precursors (Galli et al., 2004). These data support a roleof the uncharacterized membrane protein SLC10A4 in DAprogenitors.
With a simple array setup, the vast majority of genes alreadyknown to be involved in DA development were identified.However, the GDNF family receptor alpha 1 (GFRA1) and thetranscription factors LMXB1, EN1, and EN2 were notidentified as differentially expressed between 8 weeks humanVT and DT. Both GFRA1 and LMXB1 were below thedetection limit of the GeneChip, but when analyzed by Q-PCR,the expected expression profile of GFRA1 was similar to theother DA marker genes shown in Fig. 4 (data not shown). EN1and EN2 appear in the neuroectoderm in mouse around E8 andwill subsequently mark the midbrain/hindbrain border (Simonet al., 2004). Shortly after, mDA neurons gradually begin toexpress the two engrailed genes. In the adult, EN1 is highlyexpressed in all adult midbrain DA neurons whereas EN2 inonly a subset (Simon et al., 2001). With this dynamic expressionpattern, we did not know whether to expect the engrailed genesto be preferentially expressed in human 8 weeks VT. However,from the chip, a very robust signal was observed for bothengrailed genes. For EN1, there was no difference between VTand DT but EN2 showed 1.6-fold higher expression in DT.
Even though we were able to verify preferential VTexpression for the vast majority of the sequences identified onthe array, it cannot be excluded that some of these genes playroles in other developmental pathways not associated with DAneurons that may be active in the dorsal versus the ventraltegmentum at 8 weeks GA. PITX2 is an example of such a geneas it is not expressed by mDA neurons but found in thesubthalamic nucleus. Still, PITX2 is important for normalmidbrain development (Martin et al., 2004). As mentioned, cellssurrounding the developing DA neurons may be important fortheir proper development. Also for this reason did we choose todo the analysis on non-sorted material representing the in vivosituation.
To our knowledge, no genome-wide expression profiling ofdeveloping DA neurons using non-manipulated human materialhas been previously done. Expression profiles of lasermicrodissected adult rat DA neurons have recently beeninvestigated by Affymetrix arrays and custom cDNA arraysrespectively to elucidate catecholaminergic diversity (Greene etal., 2005; Grimm et al., 2004). Although the purpose of thesestudies were different from ours, data can be used to identifygenes expressed by DA neurons in general and in particular bymDA neurons. However, the overlap with our data is limited toTH, VMAT, ALDH1A1, ZAKI-4, RAB3B, and VGLUT2 forGrimm et al. (2004) and to Calbindin, DRD2, ADRA1B,

436 J.R. Jørgensen et al. / Experimental Neurology 198 (2006) 427–437
BDNF, and IGF1 for Greene et al. (2005). In another study alsousing adult rats, fluoro-gold labeling combined with lasercapture microdissection was used to compare the expressionprofile of midbrain DA neurons to non-DA cortical neurons(Yao et al., 2005). Of the 18 genes identified as enriched in SN,the DA marker genes, TH, VMAT2 and ALDH1A1 overlappedwith our study. Finally, in an attempt to find genes exclusive tothe mDA cell population, PCR-based differential display wasused to compare mouse mDA neurons from embryonic wildtype and EN1/2 double mutants to DA neurons from adultolfactory bulb (Thuret et al., 2004b). Of the five genes identifiedby Thuret et al. (2004a,b) as restricted to mDA neurons,FOXA1 and ERBB4 were also identified in our study, whereasMAP1B, EBF3, and SYT1 were all highly but not differentiallyexpressed.
In conclusion, this study demonstrates the power ofAffymetrix gene expression analyses in combination with Q-PCR on well-dissected human first trimester developing tissuesto identify known and unknown genes with relevance for DAdevelopment. This method can be applied to other anatomicalregions in a similar manner and a database of human geneexpression during the first trimester could thus be generated. Inaddition, we have discovered known and unknown genesrelated to DA development that need to be studied further inhopes of discovering the cues necessary to push DA progenitorsinto functioning mDA neurons. These data could help to makecell replacement and regenerative therapies for PD a reality.
Acknowledgments
This work was supported by the EU projects DANCE(QLRT-2000-02120) and EuroStemCell (LSHBCT-2003-503005). The Wilhelm Johannsen Centre for FunctionalGenome Research is established by the Danish NationalResearch Foundation. The authors would like to thank ThomasJensen and Bettina Starup Mentz for the excellent technicalassistance.
Appendix A. Supplementary data
Supplementary data associated with this article can be foundin the online version at doi:10.1016/j.expneurol.2005.12.023.
References
Aihara, Y., Mashima, H., Onda, H., Hisano, S., Kasuya, H., Hori, T., Yamada, S.,Tomura, H., Yamada, Y., Inoue, I., Kojima, I., Takeda, J., 2000. Molecularcloning of a novel brain-type Na(+)-dependent inorganic phosphatecotransporter. J. Neurochem. 74, 2622–2625.
Almqvist, P.M., Akesson, E., Wahlberg, L.U., Pschera, H., Seiger, A.,Sundstrom, E., 1996. First trimester development of the human nigrostriataldopamine system. Exp. Neurol. 139, 227–237.
Alvarez-Bolado, G., Zhou, X., Cecconi, F., Gruss, P., 2000. Expression ofFoxb1 reveals two strategies for the formation of nuclei in the developingventral diencephalon. Dev. Neurosci. 22, 197–206.
Ang, S.L., Wierda, A., Wong, D., Stevens, K.A., Cascio, S., Rossant, J., Zaret,K.S., 1993. The formation and maintenance of the definitive endodermlineage in the mouse: involvement of HNF3/forkhead proteins. Develop-ment 119, 1301–1315.
Asbreuk, C.H., Vogelaar, C.F., Hellemons, A., Smidt, M.P., Burbach, J.P., 2002.CNS expression pattern of Lmx1b and coexpression with ptx genes suggestfunctional cooperativity in the development of forebrain motor controlsystems. Mol. Cell. Neurosci. 21, 410–420.
Ashburner, M., Ball, C.A., Blake, J.A., Botstein, D., Butler, H., Cherry, J.M.,Davis, A.P., Dolinski, K., Dwight, S.S., Eppig, J.T., Harris, M.A., Hill, D.P.,Issel-Tarver, L., Kasarskis, A., Lewis, S., Matese, J.C., Richardson, J.E.,Ringwald, M., Rubin, G.M., Sherlock, G., 2000. Gene ontology: tool for theunification of biology. The Gene Ontology Consortium. Nat. Genet. 25,25–29.
Berti, C., Messali, S., Ballabio, A., Reymond, A., Meroni, G., 2002. TRIM9 isspecifically expressed in the embryonic and adult nervous system. Mech.Dev. 113, 159–162.
Bjorklund, L.M., Sanchez-Pernaute, R., Chung, S., Andersson, T., Chen, I.Y.,McNaught, K.S., Brownell, A.L., Jenkins, B.G., Wahlestedt, C., Kim, K.S.,Isacson, O., 2002. Embryonic stem cells develop into functionaldopaminergic neurons after transplantation in a Parkinson rat model. Proc.Natl. Acad. Sci. U. S. A. 99, 2344–2349.
Blanco, P., Sargent, C.A., Boucher, C.A., Mitchell, M., Affara, N.A., 2000.Conservation of PCDHX in mammals; expression of human X/Y genespredominantly in brain. Mamm. Genome 11, 906–914.
Burbach, J.P., Smits, S., Smidt, M.P., 2003. Transcription factors in thedevelopment of midbrain dopamine neurons. Ann. N. Y. Acad. Sci. 991,61–68.
Dal Bo, G., St Gelais, F., Danik, M., Williams, S., Cotton, M., Trudeau, L.E.,2004. Dopamine neurons in culture express VGLUT2 explaining theircapacity to release glutamate at synapses in addition to dopamine. J.Neurochem. 88, 1398–1405.
Damier, P., Hirsch, E.C., Agid, Y., Graybiel, A.M., 1999. The substantia nigra ofthe human brain: I. Nigrosomes and the nigral matrix, a compartmentalorganization based on calbindin D(28K) immunohistochemistry. Brain 122(Pt. 8), 1421–1436.
England, M.A., 1988. A Color Atlas of Life before Birth. Normal FetalDevelopment. Wolfe Medical Publication, London.
Galli, R., Binda, E., Orfanelli, U., Cipelletti, B., Gritti, A., De Vitis, S., Fiocco,R., Foroni, C., Dimeco, F., Vescovi, A., 2004. Isolation and characterizationof tumorigenic, stem-like neural precursors from human glioblastoma.Cancer Res. 64, 7011–7021.
Galvin, J.E., Schuck, T.M., Lee, V.M., Trojanowski, J.Q., 2001.Differential expression and distribution of alpha-, beta-, and gamma-synuclein in the developing human substantia nigra. Exp. Neurol. 168,347–355.
Garcia-Segura, L.M., Perez, J., Pons, S., Rejas, M.T., Torres-Aleman, I., 1991.Localization of insulin-like growth factor I (IGF-I)-like immunoreactivity inthe developing and adult rat brain. Brain Res. 560, 167–174.
Golden, J.P., DeMaro, J.A., Osborne, P.A., Milbrandt, J., Johnson Jr., E.M.,1999. Expression of neurturin, GDNF, and GDNF family-receptor mRNA inthe developing and mature mouse. Exp. Neurol. 158, 504–528.
Goridis, C., Rohrer, H., 2002. Specification of catecholaminergic andserotonergic neurons. Nat. Rev., Neurosci. 3, 531–541.
Greene, J.G., Dingledine, R., Greenamyre, J.T., 2005. Gene expression profilingof rat midbrain dopamine neurons: implications for selective vulnerability inparkinsonism. Neurobiol. Dis. 18, 19–31.
Grimm, J., Mueller, A., Hefti, F., Rosenthal, A., 2004. Molecular basis forcatecholaminergic neuron diversity. Proc. Natl. Acad. Sci. U. S. A. 101,13891–13896.
Hynes, M., Rosenthal, A., 1999. Specification of dopaminergic and serotonergicneurons in the vertebrate CNS. Curr. Opin. Neurobiol. 9, 26–36.
Inanobe, A., Yoshimoto, Y., Horio, Y., Morishige, K.I., Hibino, H., Matsumoto,S., Tokunaga, Y., Maeda, T., Hata, Y., Takai, Y., Kurachi, Y., 1999.Characterization of G-protein-gated K+ channels composed of Kir3.2subunits in dopaminergic neurons of the substantia nigra. J. Neurosci. 19,1006–1017.
Irizarry, R.A., Hobbs, B., Collin, F., Beazer-Barclay, Y.D., Antonellis, K.J.,Scherf, U., Speed, T.P., 2003. Exploration, normalization, and summaries ofhigh density oligonucleotide array probe level data. Biostatistics 4,249–264.
Jensen, C.H., Meyer, M., Schroder, H.D., Kliem, A., Zimmer, J., Teisner, B.,

437J.R. Jørgensen et al. / Experimental Neurology 198 (2006) 427–437
2001. Neurons in the monoaminergic nuclei of the rat and human centralnervous system express FA1/dlk. NeuroReport 12, 3959–3963.
Jones, I.W., Wonnacott, S., 2004. Precise localization of alpha7 nicotinicacetylcholine receptors on glutamatergic axon terminals in the rat ventraltegmental area. J. Neurosci. 24, 11244–11252.
Kim, J.H., Auerbach, J.M., Rodriguez-Gomez, J.A., Velasco, I., Gavin, D.,Lumelsky, N., Lee, S.H., Nguyen, J., Sanchez-Pernaute, R., Bankiewicz, K.,McKay, R., 2002. Dopamine neurons derived from embryonic stem cellsfunction in an animal model of Parkinson's disease. Nature 418, 50–56.
Kirik, D., Georgievska, B., Bjorklund, A., 2004. Localized striatal delivery ofGDNF as a treatment for Parkinson disease. Nat. Neurosci. 7, 105–110.
Knudsen, S., Workman, C., Sicheritz-Ponten, T., Friis, C., 2003. GenePublisher:automated analysis of DNA microarray data. Nucleic Acids Res. 31,3471–3476.
Lang, A.E., Lozano, A.M., 1998a. Parkinson's disease. First of two parts. N.Engl. J. Med. 339, 1044–1053.
Lang, A.E., Lozano, A.M., 1998b. Parkinson's disease. Second of two parts. N.Engl. J. Med. 339, 1130–1143.
Lee, N., Chen, J., Sun, L., Wu, S., Gray, K.R., Rich, A., Huang, M., Lin, J.H.,Feder, J.N., Janovitz, E.B., Levesque, P.C., Blanar, M.A., 2003. Expressionand characterization of human transient receptor potential melastatin 3(hTRPM3). J. Biol. Chem. 278, 20890–20897.
Li, C., Wong, W.H., 2001. Model-based analysis of oligonucleotide arrays:model validation, design issues and standard error application. GenomeBiol. 2, RESEARCH0032.1–RESEARCH0032.11.
Liao, Y.J., Jan, Y.N., Jan, L.Y., 1996. Heteromultimerization of G-protein-gatedinwardly rectifying K+ channel proteins GIRK1 and GIRK2 and theiraltered expression in weaver brain. J. Neurosci. 16, 7137–7150.
Lin, L.F., Doherty, D.H., Lile, J.D., Bektesh, S., Collins, F., 1993. GDNF: a glialcell line-derived neurotrophic factor for midbrain dopaminergic neurons.Science 260, 1130–1132.
Martin, D.M., Skidmore, J.M., Philips, S.T., Vieira, C., Gage, P.J., Condie, B.G.,Raphael, Y., Martinez, S., Camper, S.A., 2004. PITX2 is required for normaldevelopment of neurons in the mouse subthalamic nucleus and midbrain.Dev. Biol. 267, 93–108.
McCaffery, P., Drager, U.C., 1994. High levels of a retinoic acid-generatingdehydrogenase in the meso-telencephalic dopamine system. Proc. Natl.Acad. Sci. U. S. A. 91, 7772–7776.
Meador-Woodruff, J.H., Damask, S.P., Watson Jr., S.J., 1994. Differentialexpression of autoreceptors in the ascending dopamine systems of thehuman brain. Proc. Natl. Acad. Sci. U. S. A. 91, 8297–8301.
Nunes, I., Tovmasian, L.T., Silva, R.M., Burke, R.E., Goff, S.P., 2003. Pitx3 isrequired for development of substantia nigra dopaminergic neurons. Proc.Natl. Acad. Sci. U. S. A. 100, 4245–4250.
Perlmann, T., Wallen-Mackenzie, A., 2004. Nurr1, an orphan nuclear receptorwith essential functions in developing dopamine cells. Cell Tissue Res. 318,45–52.
Roybon, L., Christophersen, N.S., Brundin, P., Li, J.Y., 2004. Stem cell therapyfor Parkinson's disease: where do we stand? Cell Tissue Res. 318, 261–273.
Schmidt, M.J., Sawyer, B.D., Perry, K.W., Fuller, R.W., Foreman, M.M., Ghetti,B., 1982. Dopamine deficiency in the weaver mutant mouse. J. Neurosci. 2,376–380.
Seroogy, K.B., Lundgren, K.H., Tran, T.M., Guthrie, K.M., Isackson, P.J., Gall,C.M., 1994. Dopaminergic neurons in rat ventral midbrain express brain-derived neurotrophic factor and neurotrophin-3 mRNAs. J. Comp. Neurol.342, 321–334.
Siddiq, A., Miyazaki, T., Takagishi, Y., Kanou, Y., Hayasaka, S., Inouye, M.,Seo, H., Murata, Y., 2001. Expression of ZAKI-4 messenger ribonucleicacid in the brain during rat development and the effect of hypothyroidism.Endocrinology 142, 1752–1759.
Simon, H.H., Saueressig, H., Wurst, W., Goulding, M.D., O'Leary, D.D., 2001.Fate of midbrain dopaminergic neurons controlled by the engrailed genes. J.Neurosci. 21, 3126–3134.
Simon, H.H., Thuret, S., Alberi, L., 2004. Midbrain dopaminergic neurons:control of their cell fate by the engrailed transcription factors. Cell TissueRes. 318, 53–61.
Smidt, M.P., van Schaick, H.S., Lanctot, C., Tremblay, J.J., Cox, J.J., van derKleij, A.A., Wolterink, G., Drouin, J., Burbach, J.P., 1997. A homeodomaingene Ptx3 has highly restricted brain expression in mesencephalicdopaminergic neurons. Proc. Natl. Acad. Sci. U. S. A. 94, 13305–13310.
Smidt, M.P., Asbreuk, C.H., Cox, J.J., Chen, H., Johnson, R.L., Burbach, J.P.,2000. A second independent pathway for development of mesencephalicdopaminergic neurons requires Lmx1b. Nat. Neurosci. 3, 337–341.
Steiner, H., Blum, M., Kitai, S.T., Fedi, P., 1999. Differential expression ofErbB3 and ErbB4 neuregulin receptors in dopamine neurons and forebrainareas of the adult rat. Exp. Neurol. 159, 494–503.
Studer, L., Tabar, V., McKay, R.D., 1998. Transplantation of expandedmesencephalic precursors leads to recovery in parkinsonian rats. Nat.Neurosci. 1, 290–295.
Takagi, Y., Takahashi, J., Saiki, H., Morizane, A., Hayashi, T., Kishi, Y.,Fukuda, H., Okamoto, Y., Koyanagi, M., Ideguchi, M., Hayashi, H.,Imazato, T., Kawasaki, H., Suemori, H., Omachi, S., Iida, H., Itoh, N.,Nakatsuji, N., Sasai, Y., Hashimoto, N., 2005. Dopaminergic neuronsgenerated from monkey embryonic stem cells function in a Parkinsonprimate model. J. Clin. Invest. 115, 102–109.
Thuret, S., Alavian, K.N., Gassmann, M., Lloyd, C.K., Smits, S.M., Smidt, M.P.,Klein, R., Dyck, H., Simon, H.H., 2004a. The neuregulin receptor, ErbB4, isnot required for normal development and adult maintenance of the substantianigra pars compacta. J. Neurochem. 91, 1302–1311.
Thuret, S., Bhatt, L., O'Leary, D.D., Simon, H.H., 2004b. Identification anddevelopmental analysis of genes expressed by dopaminergic neurons of thesubstantia nigra pars compacta. Mol. Cell. Neurosci. 25, 394–405.
Tvrdik, P., Asadi, A., Kozak, L.P., Nuglozeh, E., Parente, F., Nedergaard, J.,Jacobsson, A., 1999. Cig30 and Pitx3 genes are arranged in a partiallyoverlapping tail-to-tail array resulting in complementary transcripts. J. Biol.Chem. 274, 26387–26392.
Verney, C., 1999. Distribution of the catecholaminergic neurons in the centralnervous system of human embryos and fetuses. Microsc. Res. Tech. 46,24–47.
Verney, C., Zecevic, N., Ezan, P., 2001. Expression of calbindin D28K in thedopaminergic mesotelencephalic system in embryonic and fetal humanbrain. J. Comp. Neurol. 429, 45–58.
Vitalis, T., Cases, O., Parnavelas, J.G., 2005. Development of thedopaminergic neurons in the rodent brainstem. Exp. Neurol. 191(Suppl. 1), S104–S112.
Winkler, C., Kirik, D., Bjorklund, A., 2005. Cell transplantation in Parkinson'sdisease: how can we make it work? Trends Neurosci. 28, 86–92.
Wolfinger, R.D., Gibson, G., Wolfinger, E.D., Bennett, L., Hamadeh, H.,Bushel, P., Afshari, C., Paules, R.S., 2001. Assessing gene significance fromcDNA microarray expression data via mixed models. J. Comput. Biol. 8,625–637.
Workman, C., Jensen, L.J., Jarmer, H., Berka, R., Gautier, L., Nielser, H.B.,Saxild, H.H., Nielsen, C., Brunak, S., Knudsen, S., 2002. A new non-linearnormalization method for reducing variability in DNA microarray experi-ments. Genome Biol. 3, RESEARCH0048.1–RESEARCH0048.16.
Yao, F., Yu, F., Gong, L., Taube, D., Rao, D.D., MacKenzie, R.G., 2005.Microarray analysis of fluoro-gold labeled rat dopamine neuronsharvested by laser capture microdissection. J. Neurosci. Methods 143,95–106.
Yue, Y., Widmer, D.A., Halladay, A.K., Cerretti, D.P., Wagner, G.C., Dreyer,J.L., Zhou, R., 1999. Specification of distinct dopaminergic neuralpathways: roles of the Eph family receptor EphB1 and ligand ephrin-B2. J.Neurosci. 19, 2090–2101.
Zetterstrom, R.H., Solomin, L., Jansson, L., Hoffer, B.J., Olson, L., Perlmann,T., 1997. Dopamine neuron agenesis in Nurr1-deficient mice. Science 276,248–250.