
visible light photoinitiation of mesenchymal stem cell-laden ...
Upload
khangminh22Category
view
0download
0
Study of collagen organization in cell-laden hydrogels and animal tissue
samples for effective tissue engineering scaffolds
by
Anuraag Boddupalli
A dissertation submitted to the graduate faculty
in partial fulfillment of the requirements for the degree of
DOCTOR OF PHILOSOPHY
Major: Chemical Engineering
Program of Study Committee:
Kaitlin Bratlie, Major Professor
Andrew Hillier
Surya Mallapragada
Ian Schneider
Shan Jiang
The student author, whose presentation of the scholarship herein was approved by the
program of study committee, is solely responsible for the content of this dissertation. The
Graduate College will ensure this dissertation is globally accessible and will not permit
alterations after a degree is conferred.
Iowa State University
Ames, Iowa
2018
Copyright © Anuraag Boddupalli, 2018. All rights reserved.

ii
TABLE OF CONTENTS
Page
ACKNOWLEDGMENTS ............................................................................................... vi
ABSTRACT ..................................................................................................................... vii
CHAPTER 1. GENERAL INTRODUCTION ............................................................... 1
CHAPTER 2. METHODS FOR IMPLANT ACCEPTANCE AND WOUND
HEALING: MATERIAL SELECTION AND IMPLANT LOCATION
MODULATE MACROPHAGE AND FIBROBLAST PHENOTYPES ...................... 4 2.1. Introduction ............................................................................................................ 4 2.2. Influence of Material Selection on the Host Response ........................................... 8
2.2.1. Natural Materials ............................................................................................ 8
2.2.1.1. Alginate ............................................................................................... 9 2.2.1.2. Chitosan ............................................................................................. 10
2.2.1.3. Hyaluronic Acid ................................................................................ 14
2.2.2. Synthetic Materials ....................................................................................... 15 2.2.2.1. Biodegradable Synthetic Materials ................................................... 16
2.2.2.2. Non-Biodegradable Synthetic Materials ........................................... 18
2.2.2.3. Hybrid Materials................................................................................ 20 2.2.3. Summary of Material Selection .................................................................... 21
2.3. Effect of Surface Topology and Functionalization on the FBR and
Biocompatibility .......................................................................................................... 22 2.3.1. Effect of decellularized scaffolds ................................................................. 22 2.2.2. Surface shapes and coatings ......................................................................... 24
2.2.3. Effect of pore size......................................................................................... 26
2.2.3. Study of mechanotransduction and cell signaling pathways ........................ 29
2.4. Location and biocompatibility response ............................................................... 30
2.4.1. Lungs ....................................................................................................... 31 2.3.2. Bones ....................................................................................................... 33
2.3.3. Heart ........................................................................................................ 35 2.3.4. Liver ........................................................................................................ 37 2.3.5. Skin ......................................................................................................... 38
2.3.6. Design principles for disparate implant locations ................................... 41 2.5. Summary Table ..................................................................................................... 42
2.6. Conclusions .......................................................................................................... 43
2.7. References ............................................................................................................ 45
CHAPTER 3. SECOND HARMONIC GENERATION IMAGING ......................... 56 3.1. Introduction .......................................................................................................... 56
3.2. State of the art ....................................................................................................... 59 3.3. Analysis Techniques ............................................................................................. 63

iii
3.3.1. Susceptibility Measurements ........................................................................ 63 3.3.2. Polarization Resolved SHG imaging ............................................................ 66
3.3.3. Fast Fourier Transform Analysis .................................................................. 67 3.3.4. F/B Ratio Measurements .............................................................................. 68 3.3.5. Grey Local Correlation Matrix ..................................................................... 69 3.3.6. Second Harmonic to Autofluorescence Aging Index of Dermis .................. 71 3.3.7. Depth Dependent Decay Measurements ...................................................... 73
3.4. Different Cancer Staging Methods ....................................................................... 74 3.4.1. Metavir Scoring system ................................................................................ 74
3.4.2. TNM system.................................................................................................. 74 3.4.3. Tumor Associated Collagen Signatures ........................................................ 75
3.5. Future Perspectives and Conclusions ................................................................... 77
3.6. References ............................................................................................................ 78
CHAPTER 4. COLLAGEN ORGANIZATION OF FIBROBLASTS
ENCAPSULATED IN PH RESPONSIVE METHACRYLATED ALGINATE
HYDROGELS ................................................................................................................. 84 4.1. Introduction .......................................................................................................... 85 4.2. Experimental ......................................................................................................... 87
4.2.1. Materials ....................................................................................................... 87 4.2.2. Methacrylated Alginate (ALGMA) Synthesis ............................................. 87
4.2.3. Hydrogel Fabrication and Characterization ................................................. 89 4.2.4. In vitro Degradation ..................................................................................... 89 4.2.5. Cell Culture and Viability Assay.................................................................. 90
4.2.6. SHG Microscopy Imaging of the gels .......................................................... 90
4.2.7. Statistical analysis ........................................................................................ 92 4.3. Results .................................................................................................................. 92
4.3.1. Characterization of ALGMA hydrogels ....................................................... 92
4.3.2. Compressive Moduli .................................................................................... 93 4.3.4. Swelling Response ....................................................................................... 94
4.3.4. Degradation Kinetics .................................................................................... 94
4.3.5. Cytocompatibility of ALGMA hydrogels .................................................... 95 4.3.6. SHG Microscopy .......................................................................................... 96 4.3.7. PCA ............................................................................................................ 100
4.4. Discussion ........................................................................................................... 103 4.5. Conclusions ........................................................................................................ 108
4.6. References .......................................................................................................... 108
CHAPTER 5. POLY-L-ARGININE MODIFICATIONS ALTER THE
ORGANIZATION AND SECRETION OF COLLAGEN IN SKH1-E MICE ....... 113 5.1. Introduction ........................................................................................................ 114 5.2. Materials and Methods ....................................................................................... 117
5.2.1. Materials ..................................................................................................... 117 5.2.2. PLR Modification ....................................................................................... 118 5.2.3. Ethics Statement. ........................................................................................ 118
iv
5.2.4. Animals ...................................................................................................... 118 5.2.5. Subcutaneous Injections ............................................................................. 119
5.2.6. Collagen Gel Preparation ........................................................................... 119 5.2.7. Second Harmonic Generation (SHG) ......................................................... 120 5.2.8. Image Processing ........................................................................................ 120 5.2.9. Statistics and Data Analysis ....................................................................... 122
5.3. Results ................................................................................................................ 122
5.3.1. Collagen Signal .......................................................................................... 122 5.3.2. Collagen Organization ................................................................................ 124 5.3.3. Collagen III Secretion ................................................................................ 128 5.3.4. Statistical Analysis ..................................................................................... 130
5.4. Discussion ........................................................................................................... 134
5.4.1. Collagen Signal Comparisons .................................................................... 134 5.4.2. Collagen Organization Response ............................................................... 135 5.4.3. Collagen III Response ................................................................................ 136
5.4.4. PCA ............................................................................................................ 138
5.5. Conclusions ........................................................................................................ 141
5.6. References .......................................................................................................... 141
CHAPTER 6. SECOND HARMONIC GENERATION IMAGING OF
COLLAGEN FIBER ORIENTATION AS A MARKER FOR SCARRING ......... 146 6.1. Introduction ........................................................................................................ 146
6.2. Materials and Methods ....................................................................................... 148 6.2.1. Materials ..................................................................................................... 148 6.2.2. Second Harmonic Generation (SHG) ......................................................... 149
6.2.3. Image Processing ........................................................................................ 149
6.2.4. Statistics and Data Analysis ....................................................................... 150 6.3. Results ................................................................................................................ 151
6.3.1. Fibrin Scaffold Treatment .......................................................................... 151
6.3.2. Partial Thickness Scaffold Treatments applied for 4 days ......................... 152 6.3.3. Full Thickness Scaffold Treatments compared over 14 and 21 days ......... 154
6.3.4. Full Thickness scaffold Treatments compared over 14 and 21 days—
Set II ..................................................................................................................... 155 6.3.5. Full Thickness Scaffold Treatments compared over 21 and 42 days ......... 157
6.4. Discussion ........................................................................................................... 159 6.4.1. Fibrin Scaffold Treatment .......................................................................... 160 6.4.2. Partial Thickness Scaffold Treatments applied for 4 days ......................... 160
6.4.3. Full Thickness Scaffold Treatments compared over 14 and 21 days ......... 161 6.4.4. Full Thickness Scaffold Treatments compared over 14 and 21 days—
Set II ..................................................................................................................... 162 6.4.5. Full Thickness Scaffold Treatments compared over 21 and 42 days ......... 162
6.5. Conclusions ........................................................................................................ 163
6.6. References .......................................................................................................... 164
v
CHAPTER 7. SECOND HARMONIC GENERATION MICROSCOPY OF
COLLAGEN ORGANIZATION IN TUNABLE, ENVIRONMENTALLY
RESPONSIVE ALGINATE HYDROGELS .............................................................. 167 7.1. Introduction ........................................................................................................ 168 7.2. Experimental ....................................................................................................... 171
7.2.1. Materials ..................................................................................................... 171 7.2.2. Methacrylated Alginate (ALGMA) Synthesis ........................................... 171
7.2.3. Hydrogel Fabrication and Characterization ............................................... 172 7.2.4. In Vitro Degradation .................................................................................. 173 7.2.5. Cell Culture and Viability Assay................................................................ 173 7.2.6. Second Harmonic Generation Microscopy of the gels ............................... 174 7.2.7. Statistical analysis ...................................................................................... 176
7.3. Results ................................................................................................................ 176 7.3.1. Characterization of ALGMA Hydrogels .................................................... 176 7.3.2. Compressive Moduli .................................................................................. 177
7.3.3. Swelling Response ..................................................................................... 178
7.3.4. Degradation Kinetics .................................................................................. 179 7.3.5. Cytocompatibility of ALGMA hydrogels .................................................. 180 7.3.6. SHG Microscopy ........................................................................................ 182
7.4. Discussion ........................................................................................................... 185 7.5. Conclusions ........................................................................................................ 192
7.6. References .......................................................................................................... 192
CHAPTER 8. PHOTOMASK-TUNED AND FIBRONECTIN-MODIFIED
ALGINATE HYDROGELS FOR STUDYING FIBROBLAST
MORPHOLOGY AND COLLAGEN ORGANIZATION ....................................... 200
8.1. Introduction ........................................................................................................ 201 8.2. Experimental ....................................................................................................... 203
8.2.1. Materials ..................................................................................................... 203
8.2.2. Methacrylated Alginate (ALGMA) Synthesis ........................................... 203 8.2.3. Hydrogel Fabrication and Characterization ............................................... 204
8.2.5. Cell Culture and Proliferation Assay.......................................................... 205
8.2.6. Second Harmonic Generation Microscopy of the gels ............................... 206 8.2.7. Immunocytochemical Staining ................................................................... 207 8.2.8. Statistical Analysis ..................................................................................... 208
8.3. Results ................................................................................................................ 208 8.3.1. Compressive Moduli .................................................................................. 208
8.3.2. Cell Viability .............................................................................................. 209 8.3.3. Immunocytochemistry ................................................................................ 210
8.3.4. Secreted Collagen Levels ........................................................................... 211 8.3.5. Collagen Organization ................................................................................ 212
8.4. Discussion ........................................................................................................... 215 8.5. Conclusions ........................................................................................................ 222
8.6. References .......................................................................................................... 222
CHAPTER 9. GENERAL CONCLUSION ................................................................ 230

vi
ACKNOWLEDGMENTS
I would like to thank my major professor, Dr. Kaitlin Bratlie for her patience and
guidance throughout the course of my graduate studies here at Iowa State University. I
would also like thank Dr. Andrew Hillier, Dr. Surya Mallapragada, Dr. Ian Schneider and
Dr. Shan Jiang for their vital inputs, and for serving on my advisory committee. I am
grateful for the support of my friends and group members, Hannah Bygd, Lida Zhu,
Zhuqing Li, and Zihao Xu for their support in working long hours at the labs. I am also
grateful for the support of Jake Nuhn, Juan Wang and Eric Hare for their valuable advice
and productive collaboration.
Finally, I would like to thank my family for their unconditional and unconventional
love and support. For my parents, Prasanna and Radha, who have always encouraged me
to pursue my academic ambitions and instilled in me the love for science and reading. For
my brother, Aravind who has been a reliable sounding board for ideas and advice. And last
but not the least, my wife, Nadia for her immense support, patience and encouragement to
never give up on my dreams, no matter how tough they seemed.
This work was supported by the National Science Foundation under Grant No.
CBET 1227867, the Roy J. Carver Charitable Trust Grant No. 13-4265, and the Mike and
Denise Mack faculty fellowship to Dr. Kaitlin Bratlie.
vii
ABSTRACT
The interaction of biomaterials with biological systems is a complex process, that
is triggered in response to implants and wounds. It is essential to understand the phases of
wound healing response, particularly the interactions of immune cells such as macrophages
and fibroblasts, with the local extracellular matrix which can influence implant acceptance
or the restoration of the damaged wound site. Materials properties such as compressive
modulus, surface geometry, functionalization, and topology can be tuned to modulate the
inflammatory and fibrotic responses to wounds and implants.
Naturally derived materials, such as alginate, are widely used biomaterials owing
to their biocompatibility and the diverse crosslinking strategies that can be used for
fabrication. Soft alginate gels can be synthesized after methacrylation to be relatively stable
under physiological conditions, while retaining pH sensitivity, which can be useful in the
treatment of chronic wounds. Studying the collagen response to NIH/3T3 fibroblasts
encapsulated in these soft hydrogels can develop wound healing strategies to promote
faster wound healing. The transition of collagen organization from aligned to isotropic
states in the dually crosslinked stiffer methacrylated alginate (ALGMA) hydrogels shows
promise towards the development of topical gels for wound care.
Modifying the surface properties using arginine-like derivatives is effective in
modulating the fibroblast response to implanted glass beads in SKH1-E mice. Collagen
response to modified glass beads using SHG microscopy was evaluated using several
factors such as collagen amount, secretion of collagen III, and organization of collagen.
The albizziin modification showed both isotropic collagen organization as well similar
collagen type III as unwounded skin. Furthermore, statistical analysis uncovered

viii
correlations between SHG derived parameters and the materials properties of the chemical
modifiers. Collagen type III was correlated with the surface tension of the modifier, and an
empirical equation was derived relating materials parameters with the observed collagen
measurements.
The effectiveness of diverse wound care strategies on shallow and deep wounds on
porcine subjects was conducted using SHG microscopy. Treatment duration, as well as
scaffold preparation were instrumental in reducing a scarring response and accelerating
wound closure rates. By combining the understanding of wound healing in diverse tissue
environments, with environmentally responsive wound dressings, it is possible to improve
the quality of life for millions of patients across the world.
1
CHAPTER 1
GENERAL INTRODUCTION
There is an urgent need to understand the challenges of designing biocompatible materials.
All materials used in tissue engineering trigger some level of biological responses upon
implantation. Common challenges associated with the host response are failures due to chronic
inflammatory responses as well as the formation of the avascular, fibrotic sheath around the
implant. The avascular, chronic inflammatory host response can thus contribute to incomplete
healing of percutaneous wounds for dermal implants and higher rates of infection from
opportunistic pathogens.1,2 In the United States alone, over 25% of the GDP will be expended on
research and development of novel biomaterials by 2040.3 Our main motivation for these research
projects was to conceptualize a rational design for tissue engineering scaffolds that could
incorporate influences of material properties, biochemical responses and biological activity.
The Advanced Healthcare Materials paper submitted in this thesis as Chapter 2 addresses
the challenges associated with understanding the key role played by material characteristics that
can influence implant compliance within natural tissue environments. By considering diverse types
of material scaffolds as well as cellular responses from macrophages and fibroblasts, detailed
insight was obtained on the need to elucidate cell-matrix interactions from a biomedical
engineering perspective.
Second Harmonic Generation microscopy has enabled sensitive label-free detection and
analysis of collagen response from cells proliferating in diverse biological environments. Chapters
3 focuses on the current state of the art techniques that have been studied using similar high content
imaging platforms for analyzing biomedical scaffolds and their applications. With the combined
insight from multimodal imaging techniques and the need for rational design of scaffolds, research
2
was conducted on soft, tunable hydrogel materials that can be fabricated for diverse applications.
As implant failures are commonly observed as a result of inflammatory responses or unfavorable
fibrotic encapsulation. The host responses to implanted materials are similar to those following
injury.4,5 Cells recruited to the wound play a key role in the series of inflammatory response based
process. The normal wound-process is restored after the foreign objects such as pathogens,
unrecognized proteins etc. are either dissolved, degraded or phagocytosed.5 Fibrous encapsulation
of implants isolates the implant from the host tissue. Over the Chapters 4 and 5, we focus on the
effect of modifying the surface topology of implants through diverse strategies as well as identify
key parameters that can guide rational design of biomaterials.
The collaborative research carried out in conjunction with the Corporate Research
Materials Lab at 3M, facilitated a detailed study into the effect of different scaffolds to avoid
scarring responses in porcine subjects. By carefully analyzing the samples for collagen-related
biomarkers, it was possible for this blind study to provide unbiased insight into wound healing.
We have included some of the most interesting results from this collaboration as Chapter 6. The
perspective obtained from this collaboration was critical us to understand the challenges for
designing scaffolds for lungs, heart, liver, skin, and bone systems. For successfully tuning the in
vivo fibrotic response and the non-specific adsorption of proteins that can foul the implant surface
and trigger undesirable responses, it was essential to work with stiffer alginate hydrogels to have
the NIH/3T3 fibroblasts interact with physiologically relevant stiffnesses. Stiffer substrates, such
as musculoskeletal regions, often trigger inflammatory responses while those for softer tissues,
like liver and lungs, incite an anti-inflammatory response from the native macrophages and
fibroblasts.6,7 By evaluating the tunability of collagen organization to the different crosslinking
3
strategies for methacrylated alginate hydrogels, it was possible for us initiate decoupling of cell-
matrix interaction cues in Chapter 7.
The combination of most of the research on tunable, soft hydrogels for tissue
engineering applications is explained in greater detail in Chapter 8 through the study of
photomask-tuned alginate hydrogels that can mimic natural tissue environments. Through
decoupling the influence of crosslinking mechanism on the collagen and overall cell-matrix
interaction, it was possible to selectively observe the influence of mechanical stiffness on how
cells secrete and organize collagen. This study thus becomes a fitting culmination of our analysis
techniques for visualizing how cells sense the local microenvironment which can inform design of
effective tissue engineering scaffolds.
References
1. Bryers, J. D., Giachelli, C. M. & Ratner, B. D. Engineering biomaterials to integrate and
heal: The biocompatibility paradigm shifts. Biotechnology and Bioengineering 109, 1898–
1911 (2012).
2. Ratner, B. D. A paradigm shift: biomaterials that heal. Polym. Int. 56, 1183–1185 (2007).
3. Place, E. S., Evans, N. D. & Stevens, M. M. Complexity in biomaterials for tissue
engineering. Nat. Mater. 8, 457–470 (2009).
4. Mutsaers, S. E., Bishop, J. E., McGrouther, G. & Laurent, G. J. Mechanisms of tissue
repair: From wound healing to fibrosis. Int. J. Biochem. Cell Biol. 29, 5–17 (1997).
5. Avula, M. N., Rao, A. N., McGill, L. D., Grainger, D. W. & Solzbacher, F. Foreign body
response to subcutaneous biomaterial implants in a mast cell-deficient Kitw-Sh murine
model. Acta Biomater. 10, 1856–1863 (2014).
6. Quinlan, A. M. T. & Billiar, K. L. Investigating the role of substrate stiffness in the
persistence of valvular interstitial cell activation. J. Biomed. Mater. Res. - Part A 100 A,
2474–2482 (2012).
7. Ali, M. Y., Chuang, C.-Y. & Saif, M. T. a. Reprogramming cellular phenotype by soft
collagen gels. Soft Matter 10, 8829–37 (2014).
4
CHAPTER 2
METHODS FOR IMPLANT ACCEPTANCE AND WOUND HEALING:
MATERIAL SELECTION AND IMPLANT LOCATION MODULATE
MACROPHAGE AND FIBROBLAST PHENOTYPES
Modified from a manuscript published in Advanced Healthcare Materials, 5(20) 2575-2594
(2016)
This review is focused on materials and methods used to induce phenotypic changes in
macrophages and fibroblasts. Herein, we give a brief overview on how changes in the phenotypes
of macrophages and fibroblasts are critical biomarkers for identification of implant acceptance,
wound healing effectiveness and also essential for evaluating the regeneration capabilities of some
hybrid strategies. The different types of cells present during FBR have been extensively studied
for evaluating the response to different materials, and there are varied material approaches towards
fabrication of biocompatible, and non-cytotoxic substrates. We discuss how natural and synthetic
materials have been used to engineer desirable outcomes in lung, heart, liver, skin, and
musculoskeletal implants, and it has been observed that certain properties such as rigidity, surface
shapes and porosity play a key role in the progression of the immune response. Several fabrication
strategies are discussed to control the phenotype of infiltrating macrophages and fibroblasts:
decellularization of scaffolds, surface coatings, implant shape, and pore size apart from
biochemical signaling pathways that can inhibit or accelerate unfavorable immune response. It is
essential hence to factor all the different design principles, material fabrication criteria for
evaluating the choice of implant materials or regenerative therapeutic strategies.
2.1. Introduction
The field of biomaterials is an evolving interface between different synergistic topics of science
and engineering. The growth of the field of tissue engineering has a huge impact on the cost of
healthcare all over the world, to the effect that by 2040 over 25% of the total US GDP shall be

5
invested in biomaterials research and development1. There is hence clearly. a growing need for
technologies that can provide treatment, while promoting regeneration of healthy parenchymal and
stromal tissue2. This niche is met by applying transdisciplinary principles from fields such as
biological engineering, biochemistry, materials science, and chemical engineering to fabricate
implants or scaffolds. However, the innate and complex intricacies in biological responses to
material properties are challenging to predict a priori, meaning that implant failure often occurs
as a result of inflammation3 and fibrous encapsulation4. Abating or eliminating such host responses
is of central importance in current bio-implant design. There are several key characteristics
involved in the host response to biomaterials, two of which are activation of macrophages and
fibroblasts.5 These cells are essential to tissue regeneration, with the former mediating
inflammation and the latter can instigate fibrous encapsulation.
Macrophages are thought to exist on a spectrum of phenotypes bookended by classical
activated M1 macrophages and alternatively activated M2 macrophage. Another description of
macrophage activation uses an analogy of a color wheel, in which classically activated, wound-
healing, and regulatory macrophages occupy the ‘primary colors’ that blend into ‘shades’ of
macrophage activation. M1 macrophages can be activated by lipopolysaccharides (LPS) or
interferon-γ (IFN-γ) and produce cytokines and chemokines such as tumor necrosis factors-α
(TNF-α), interleukin-1 (IL-1), interleukin-6 (IL-6), and nitric oxide; while M2 macrophages can
be induced by IL-4 and release cytokines including tumor growth factor-β (TGF-β) and IL-106–9.
M1 macrophages are also known as inflammatory macrophages, which aid in ‘sterilizing’ the
wound environment after injury, such as implantation of a biomaterial; in contrast, M2
macrophages are often termed anti-inflammatory and relieve inflammation and aid in tissue
formation. These two contrary function allow macrophages to play critical roles in host responses9.
6
Despite in depth studies examining macrophage function in the implant milieu, their response and
activation pathways are not completely understood. Macrophages function differently depending
on their location10 and can be further polarized into several sub-phenotype base on their
microenviroment6.
The substrate and chemically sensitive differentiation of fibroblasts into myofibroblasts has
been confirmed to have dramatic influence on the reorganization of the extracellular matrix
(ECM)11. Myofibroblasts have been studied for their role in tumor stroma remodeling and their
influence on modifications of the ECM. Their presence is mediated by two main factors: de novo
stress due to contractile actin bundles being activated and through mechanical stress12. Both these
factors are also inherently linked to macrophage polarization towards acute or chronic responses.
The contractile actin bundles mediated change in ECM activity has been observed to be
responsible for the secretion of TGF-β or its latent form, which also results in classical activation
of M1 macrophage response13. Similarly, the mechanical stress has been known to play a role in
the activation of the matrix metalloproteinases (MMPs), which are themselves responsible for
activating TGF-β, from its latent form. Both fibroblasts and myofibroblasts secrete collagen and
exert mechanical influence to alter ECM organization as a function of the material properties of
implants or wounds.
It is known that shortly after implantation, protein adsorption at the implant surface will take
place in seconds, followed by neutrophils adhesion which last 1 or 2 days14. Generally, monocytes
will be recruited to the site of injury and will differentiate into macrophage within one week after
implantation. If the material is not able to be phagocytosed, macrophage presence will persist, and
eventually culminates in macrophage fusion into multinucleate giant cells followed by fibrous
encapsulation of the foreign body15. Initially, host responses to different implants were classified
7
primarily on the basis of the fibrotic capsule that was formed. Further studies have displayed a
diversity of cytokines and growth factors that intricately influence the acceptance of the implant,
and its long-term stability in vivo.
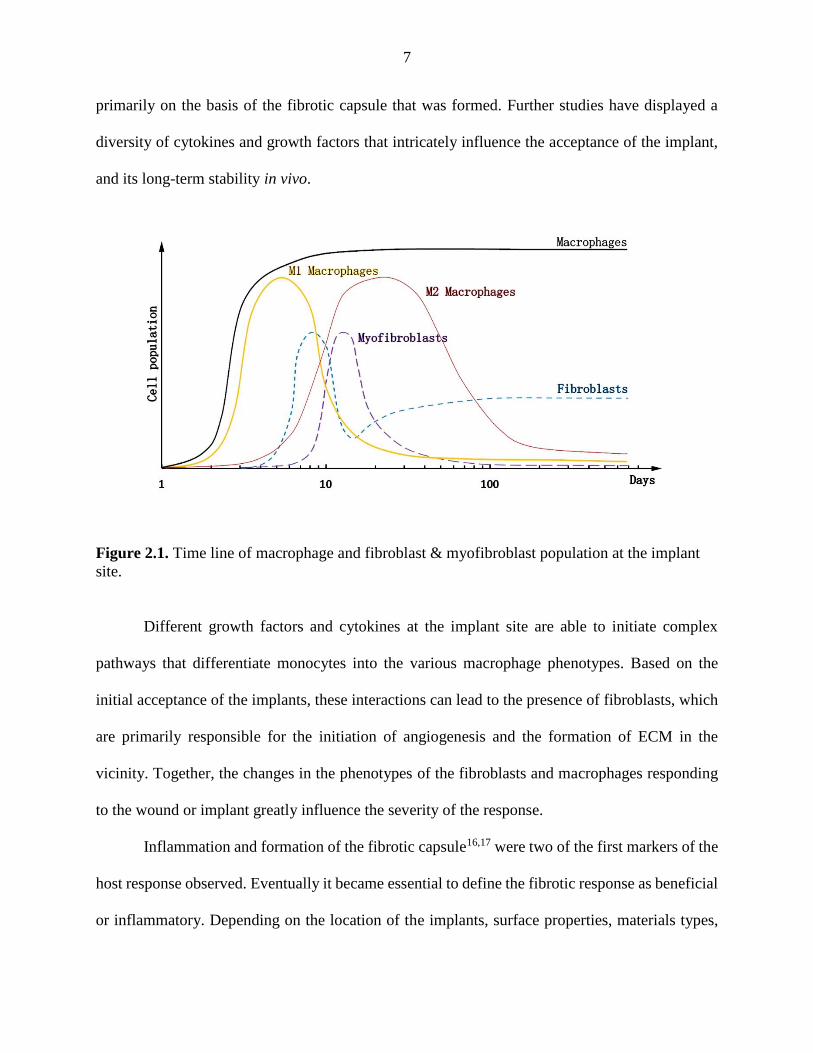
Figure 2.1. Time line of macrophage and fibroblast & myofibroblast population at the implant
site.
Different growth factors and cytokines at the implant site are able to initiate complex
pathways that differentiate monocytes into the various macrophage phenotypes. Based on the
initial acceptance of the implants, these interactions can lead to the presence of fibroblasts, which
are primarily responsible for the initiation of angiogenesis and the formation of ECM in the
vicinity. Together, the changes in the phenotypes of the fibroblasts and macrophages responding
to the wound or implant greatly influence the severity of the response.
Inflammation and formation of the fibrotic capsule16,17 were two of the first markers of the
host response observed. Eventually it became essential to define the fibrotic response as beneficial
or inflammatory. Depending on the location of the implants, surface properties, materials types,
8
and time-scales over which the studies were conducted, the extent of the host response was found
to vary greatly.
Herein, we describe the macrophages and fibroblast response to bio implants with various
materials, structures, and implant locations as a result of FBR. The purpose of this review is to
organize current effort in modulating macrophage and fibroblast response to reduce FBR caused
by bio implant and analysis how material selection and implant geometry structure can reduce
FBR. This review provided the design principle of biocompatible implant with different implant
locations.
2.2. Influence of Material Selection on the Host Response
Material selection is one of the primary factors for consideration in designing biomedical
implants. Here, we have classified biomaterials into three main types: natural, synthetic, and hybrid
materials. Natural materials derive from living sources and are generally bio-friendly. Synthetic
materials have potentially infinite diversity and are generally more amenable to sterilization and
fabrication processes16. Hybrid materials aim to combine the advantages of both natural materials
and synthetic materials through physical and/or chemical linkages of the two types of materials.
This section will discuss…
2.2.1 Natural Materials
Natural materials can be either bioactive or bioinert. Dermatan sulfate injection could
significantly reduce myofibroblast and macrophage concentration and collagen content in
inflammation environment17. Conversely, silk is relatively inert to cell: silicone implant coated
with spider silk protein was able to reduce cytokine release and inhibit monocytes differentiation
into macrophages18. In other cases, less cell population was found on silk fibroin and human
tropoelastin hybrid protein coated scaffolds19.
9
However, natural materials often have several functions with micro-environment
dependence20. Improper usage of natural materials can also lead to enhanced FBR. Material such
as chondroitin sulfate proteoglycans were known to cause inflammation and delay healing process
after spinal cord injury. On the contrast, chondroitinase ABC injection could cause large-scale
digestion and restore healing process21,22.
Because of the variability and uncertainty during natural synthesis, the same categories of
natural material can also differ in size and functional groups. Correct understanding and
appropriate application of natural materials are essential for reducing FBR. The following sections
will analysis different cell response principles for alginate, chitosan, and hyaluronic acid.
2.2.1.1. Alginate
Alginate is a polysaccharide derived from algae. Alginate has been widely used for drug
encapsulation or tissue engineering owing to its low toxicity, good biocompatibility, and gelation
under mild conditions with divalent cations. In addition, the structure of alginate is similar to the
ECM of living tissues and it provides a moist, inert microenvironment for encapsulated cells.
Alginate is generally considered to elicit an anti-inflammatory response and high molecular
weight alginate (500 kDa) has been shown to reduce pro-inflammatory cytokines IL-1β and IL-
623. However, a recent study showed that cell responses can be modified through changing the
ratio of guluronic acid (G block) to mannuronic acid (M block). Previous research has shown that
alginate containing 94% M block leads to higher TNF-α secretion than LPS stimulation in
RAW264.7 macrophages while polymannuronate (100% M block) of a similar molecular weight
produces significantly less TNF-α24. Further research demonstrated that this effect was more
pronounced when comparing alginate degradation products from the G block and M block25,26.
Alginate oligosaccharides, particularly unsaturated guluronate oligosaccharide prepared by
10
enzymatic degradation (GOS-ED), induce strong inflammatory responses, measured by nitrite
production, in RAW264.7 cells with a concentration and molecular weight dependence26.
However, alginate oligosaccharides degraded either by acid hydrolysis or oxidation showed no
significant effect on naïve RAW264.7 cells, and oxidative degraded G block (GOS-OD) can even
reduce inflammatory response in LPS induced RAW264.7 macrophages in a concentration
dependent manner25. Pathway study found that GOS-OD can efficiently inhibit LPS binding to
cell surface and reduce cell activation25.
The material properties of alginate are highly affected by the G/M ratio. One obvious
difference that arises from altering the G/M ratio is the mechanical properties of the resulting gel.
The G block forms an ‘egg box’ structure in the presence of di- and tri-valent cations, resulting in
improved crosslinking and higher stiffness compared to M block rich alginate hydrogels27. There
are a limited number of studies interrogating the relationship between the FBR and the G/M ratio
of alginate. Many of the studies that have been performed have inconsistent results28–31. One of
the previous studies claimed alginate with MG blocks or M block only, but not G block only, could
stimulate human monocytes derived macrophage to produce inflammation cytokines such as TNF-
α, IL-1, and IL-6. The alginate with lower G/M ratio resulted in higher cytokines release.30
However, other recent study showed alginate with 60% M block can induce higher amount of
TNF-α than 75% M block alginate, and alginate with M block only didn’t show significant
difference in TNF-α production compare with control group.24 There is a clear need to better
understand the how the G/M ratio influences host responses.
2.2.1.2. Chitosan
Another natural material whose material properties and host responses are impacted by the
ratio of its monomers and molecular weight is chitosan. Chitosan is partially deacetylated chitin
11
(poly-N-acetylglucosamine), which is the main component of crustacean shells. Chitosan can be
biodegradable with a degree of deacetylation (DD) ranging from 15% to 85%32. It is also insoluble
in human body fluid at high molecular weight s(MW>20kDa)33. Cellular responses to chitosan
change with differing DD32–35.
The effect of DD is known to provoke a stronger antimicrobial response in chitosan with a
higher DD36,37. Further studies have shown that high molecular weight chitosan scaffolds
(MW=890-830 KDa) with 95% DD significantly reduce cellular adhesion and had a lower M1/M2
ratio, measured by surface receptors CD206 for M2 macrophages and CCR7 for M1 macrophages,
compared to chitosan scaffolds with 85% DD35. Further reducing the DD of high molecular weight
chitosan (76% DD) resulted in high secretion of inflammatory cytokine IL-1β in bone marrow
derived mouse macrophages in vitro, while chitin (7% DD) was a less potent stimulator of the M1
response34. Taken together, these responses suggest a non-linear relationship between
inflammation response and DD.
Mechanistic studies have also been performed to ascertain the effect of the acylation on the
inflammasome, with multiple pathways implicated. IL-1β release in the presence of 76% DD
chitosan inhibited in both peritoneal and bone marrow derived macrophages harvested from
NLRP3-/- mice compared to wild type (WT). Pathways including K+ efflux, reactive oxygen
species generation, and lysosomal destabilization were also involved. All of these pathways are
necessary for peak IL-1β release in response to chitosan34. Pathways were also varied by
macrophage initial phenotype: in M0 and M2a macrophage, IL-1ra could be induced by 80% DD
chitosan but not 98% DD chitosan without active IL-4/STAT-6 axis, while there was no significant
difference in M1 macrophage32. Moreover, 80% DD chitosan at both medium and low molecular
weight was reported to cause delayed STAT-1 activation, but 98% DD chitosan cannot.32
12
Although the mechanisms of macrophage activation as a result of chitosan acylation have
been widely studied, the results are not directly comparable owing to the use of different
macrophage cell lines, different molecular weights, and sources of chitosan. Other difficulties in
comparing chitosan activation of macrophages stem from limited studies comparing a variety of
DD. Some studies have even compared the acylation effect on macrophages using chitosan with
molecular weights that differ by orders of magnitude36, which may lead to a less reliable conclusion
since molecular weight of chitosan might also impact cellular responses and modulate the FBR.
Since the inflammatory response is not linearly related to DD34,35, there is a need for systematic
studies over a range of DD for consistent molecular weight. The effect of chitosan on different
macrophage polarization is also necessary to provide a better picture on how implanted chitosan
would modulate the innate immune response.
Molecular weight of chitosan over the range of 50 to 300 kDa does not have a significant
effect on macrophage response.38 Similar to alginate, very low molecular weight chitosan, ,
specifically degradation products termed chitosan oligosaccharide (COS), have been reported to
induce a strong inflammatory response39,40. Chitosan enzymatic hydrolyzed with a degree of
polymerization of 3-6 was found to greatly enhance inflammatory responses by increasing TNF-α
and NO production in RAW 264.7 macrophages. COS induced inflammation is caused mainly by
activating toll like receptor-4.39 Interestingly, 20 kDa chitosan has little to no effect on macrophage
morphology and CD40 expression while COS with an average molecular weight 750 Da causes
M1 activation.40 Even though high molecular weight chitosan does not induce a strong
inflammatory response, degradation of the implant may result in an undesirable M1 macrophages
response at these later time points. Chitosan (80%DD) with molecular weights ranging from 150
to 10,000 Da were implanted into skeletally aged rabbits’ knee trochlea. These low molecular
13
weight materials have a faster degrade rate.41 High degradation rates can lead to massive release
of COS and further cause serious implant inflammation; conversely, low degradation rates may
effect tissue regeneration.
Chitosan is generally known to induce a higher inflammatory response than glass slides
and tissue culture plastic in vitro.42–44 Higher cell mobility was observed for human primary
monocytes derived macrophages cultured on chitosan film compare to tissue culture polystyrene
plates.43 Other studies have shown increased M1 markers such as IL-6, TNF-α, and IL-1β42. Anti-
inflammatory cytokines increased significantly after 10 days. Mechanistic studies have shown that
macrophages recognize chitosan via CD206.42
Loading chitosan with drug or chemokines can also modulate cellular responses. Chitosan
nanoparticles loaded with the non-steroidal anti-inflammatory drug (NSAID) diclofenac reduces
IL-6 and prostoglandin E2 (PGE2) secretion from LPS activated human macrophages while
increasing TNF-α release45. In contrast, chitosan encapsulating the anticancer agent methylglyoxal
leads to high inflammatory mRNA expression including IL-6, IL-1β, TLR-4, and TNF-α in
Sarcoma-180 tumor bearing mice46. It has been reported that maleimide-streptavidin modified
methacrylamide chitosan hydrogel can loaded with growth factors such as IFN-γ and remain at
high concentration in chitosan scaffold with less than 20% release after one month in vitro.
However, when these materials were implanted into ???, they did not show observable differences
compared to chitosan implants without the growth factor47.
14
2.2.1.3. Hyaluronic Acid
Native hyaluronic acid (HA) is a non-sulfated glycosaminoglycan (GAG) with molecular
weights up to 10 million Da.48 HA can be naturally degraded and re-synthesized in vivo.49 HA is
known to interact with several cell surface markers, such as CD44. and can influence the FBR in
a molecular weight dependent manner.50
HA has distinct biological functions at different molecular weights. High molecular weight
HA often lead to anti-inflammation51 and low molecular weight HA can cause inflammation52.
Recently, HA molecular weight effects on macrophage reprogramming and cytokine release have
been demonstrated.53 HA molecular weight spanning 10-1 to 103 kDa were tested in macrophages
polarized with LPS/IFN-γ or IL-4 along with naïve cells. Very high (103 kDa) and very low
molecular weight (10-1 kDa) HA has direct influence on macrophage polarization regardless of the
initial phenotype53. In different phenotypes, most anti-inflammatory cytokines increase
logarithmically with molecular weight; in contrast, most pro-inflammatory decrease
logarithmically53. Similar studies were performed on LPS/IFN-γ activated human peripheral blood
monocytes obtained from donors. IL-1β production after incubation with 5 to 1,700 kDa HA
showed a decrease with molecular weight without a clearly identifiable trend. Large variety was
found between each donor, and was used to explain the lack of a trend48.
Although numerous studies on cellular responses to HA have been conducted in vitro, there
is large uncertainty in the effect of HA molecular weight in vivo. One interesting phenomenon
found both in vivo and in vitro showed that LPS activated macrophage could increase HA synthase
(HAS) 1 and HAS 2 mRNA expression and decrease hyaluronidases54. However, despite the
reduction in hyaluronidases, rapid degradation of HA was still observed in macrophages even
15
though the HA concentration increased in other tissues54, which suggested LPS activated
macrophage may be able to degrade HA without hyaluronidases. HA synthase is able to synthesize
high molecular weight HA50, thus upregulation of synthase will lead to high molecular weight HA
and reduce the inflammatory response caused by HA. The rapid degradation of HA in macrophages
may abrogate this effect since low molecular weight HA is pro-inflammatory. The mechanism
behind this response is still unknown.
The main surface marker that recognizes HA is CD44, which is upregulated in
inflammatory environments.53 Although IL-4 and LPS/INF-γ activated macrophage have similar
levels of CD44 expression, IL-4 induced M2 macrophage can cause CD44 sulfation by post-
translational modifications such as increasing chondroitin sulfate, while TNF-α can significantly
reduce the sulfation and HA binding to macrophages55. Since inhibition of chondroitin sulfate
adhesion on CD44 could increase HA binding, chondroitin sulfate also regulates HA binding55.
Considering these factors, HA with pre-sulfating treatment may also reduce macrophage adhesion
and induce an anti-inflammatory response. In fact, collagen films coated with 16% sulfated
hyaluronic acid cultured with macrophages in vitro lead to increased M2 cytokines such as IL-10
and lower M1 cytokines such as TNF-α and IL-12 compared to 6% sulfated HA followed by native
HA56,57.
2.2.2. Synthetic Materials
Compared to natural materials, synthetic materials are generally less biocompatibility.
However, due to their high plasticity, synthetic materials can easily be fabricated to have tunable
mechanical properties, controlled degradation, and various structures 60,61. Unlike natural
materials, many synthetic materials are more resistant to increased temperature and can be
processed or sterilized easily. Synthetic materials are generally divided into bio-degradable and
non-biodegradable categories.
16
2.2.2.1. Biodegradable Synthetic Materials
Polymers such as poly(lactic acid) (PLA) and poly(lactic-co-glycolic acid) (PLGA) are
commonly used biodegradable materials. An ideal biodegradable implant can maintain their
function and degrade without releasing cytotoxic substances. One of the major advantages of using
biodegradable implant is that a second surgical intervention is not required16. With controlled
degradation kinetics, tissue regeneration rates ideally match the degradation process.
PLA has been used for clinical application and has a low in vivo degradation rate ranging
from months to years62. Because PLA alone often induces relatively high inflammatory response
in the early stage of implantation63–65, PLA copolymer or surface coated PLA have been
synthesized to improve host responses. Cardiovascular stent implants composed of high molecular
weight PLA blended with phospholipid polymer bearing phosphorylcholine groups was able to
reduce thrombus formation and significantly decrease inflammatory cytokines, IL-6, IL-1β, and
TNF-α, released compared with PLA alone when implanted subcutaneously in rats and in arteries
of rats or rabbits64. Unlike most natural materials, which cannot be processed under harsh reaction
conditions, PLA implants can be fabricated through various processes including hot-melt
extrusion62 due to its thermal and chemical stability.
The degradation behavior of synthetic material implant is mainly determined by polymer
structure, molecular weight, morphology, and implant environment. Shape memory material
composed of polyhedral oligomeric silsesquioxane (POSS) and PLA star-shaped copolymers
exhibited a relationship between delay in degradation and PLA chain length63. Both in vitro and
in vivo degradation studies on POSS-PLA found that there was a lag phase period preceding a
rapid degradation phase, in which the lag phase showed less than 10% degradation in 2-6 months
with a dependence on PLA chain length while 90% of the mass was lost in 2 months during the
17
degradation phase regardless of PLA chain length63. Interestingly, longer PLA chain length
extended the lag phase but showed no observable effect in changing the degradation rate in the
later phase63. This could be a result of the dense PLA chain in outermost layer that delayed body
fluid interfusion. Relatively mild inflammatory responses were observed when implanted
subcutaneously in rats comparing to PLA alone. Through controlling PLA chain length, POSS-
PLA implants could be applied to mid or long-term therapy such as bone bridging.
One disadvantage of biodegradable synthetic materials is that, in many cases, degradation
products are not biocompatible and will lead to inflammatory response. A secondary acute
inflammation was often observed in the site of implant during the rapid degradation period63. Thus,
how to design a bio-implant that can stay functional as long as the therapy requires and then
degrade at a controlled rate that will not lead to a strong acute inflammation becomes an issue.
One common used method to reduce implant host response is combining implant with anti-
inflammatory drug such as dexamethasone62,66. Biodegradable materials can achieve diffusion and
degradation mediated control release. Both PLA and PLGA based polymers can perform sustained
drug release kinetics and have a reduction in the late stage of implantation62,66.
One effective solution recently developed is, rather than avoiding release of harmful
degradation products, combining a secondary material to degradable implant that can neutralize
degradation product. Materials with buffer capabilities such as apatitic nanoparticles can
significantly reduce the acidic environment in the implant site caused by PLA or PLGA
degradation products67. Reduced degradation rate and host responses, including macrophage
infiltration and fibrous encapsulation have been reported67.
Degradation product can also be active pharmaceutical ingredients68–71. Calcium phosphate
cement (CPC) implants containing PLGA microparticles have been developed recently as bone
18
implants68. The research hypothesized that the acidic degradation product of PLGA could be
neutralized by calcium phosphate, which would eliminate the inflammatory response caused by
PLGA degradation while further releasing calcium and phosphate ions that favor bone
regeneration68. Although the degree of neutralization and amount of ion released was not tested,
the implantation outcome in femoral condyle of rabbits showed enhanced bone formation without
inflammation in CPC with PLGA comparing to CPC alone or CPC with other non-degradable
microparticles68. CPC has also been coupled to PLGA through end group modified PLGA. 69 Here,
acid terminated PLGA showed a higher degradation and bone formation rate compared to end-
capped PLGA69. In addition, the degradation rate of CPC-PLGA was only slightly affected by
PLGA molecular weight and microparticle size but was highly dependent on PLGA end group and
particle morphology70,71. With appropriate end group modification to control degradation rate, this
CPC-PLGA implant could be applied to various situations. By combining different materials that
can neutralize opponents’ degradation products, these studies provided a novel strategy to reduce
degradation induced inflammation.
2.2.2.2. Non-Biodegradable Synthetic Materials
Non-biodegradable materials are often used as permanent implants and can avoid
cytotoxicity and inflammatory responses caused by degradation products. Titanium is the most
commonly used permanent bone implant. Applications include dental implants and total joint
arthroplasty implants. Although it has been reported that titanium alloy, compared to zirconium
alloy, leads to a higher inflammatory response through increased IL-6 and TNF-α release in
osteoblasts and fibroblasts72, titanium is still the first choice for bone implant due to its mechanical
properties and chemical resistance. Several methods have been developed to reduce the
inflammation caused by titanium implant such as modifying surface chemistry73,74 or surface
19
pattern modification75. Hydrophilic surface modified titanium can significantly decrease
inflammatory cytokines TNF-α, IL-1, and IL-1β gene expression in THP-1 and RAW264.7
macrophages73,74. Surface modifications with calcium or strontium ions also induces more anti-
inflammatory M2 J774.A1 macrophages76.
Non-biodegradable polymers are often used for surface modification of biodegradable or
natural materials to change their chemical and physical properties. Poly(ethylene glycol) (PEG), a
highly hydrophilic polymer widely used in hydrogel and drug implants, is often conjugated to
implants or particle surfaces to increase their wettability or water solubility77. PEG also has a
‘stealth’ capability78 as it can avoid cell recognition and reduce protein and cell adhesion79.
Poly(propylene) (PP) is more generally used as a mesh implant. It was reported to activate both
inflammatory IL-6 and anti-inflammatory cytokine IL-1RA7 and cause chronic inflammation80.
Such inflammation could be largely decreased by coating with a polyurethane based hydrogel81.
Despite the improved mechanical properties of non-degradable biopolymers, biodegradable
materials are often favored since they do not require secondary surgery and favor tissue
regeneration. In addition, for permanent implant applications, it is important to note that non-
biodegradable implant are susceptible to wear. Implant abrasion is one of the reasons for
permanent implant failure, which was often found in joint implants. Wear mediated particles can
lead to inflammation82, which can further cause perennial overexpression of TNF-α and IL-1β83.
Coating these materials with one that is lubricating could possibly reduce the abrasion.

20
2.2.3. Hybrid Materials
On the basis of the above studies, a compelling case can be made for the inclusion of hybrid
materials for implants. Since most natural materials do not have the range of mechanical properties
that synthetic materials86 and many synthetic materials lead to inflammatory responses, there are
increasing interests in developing hybrid materials that incorporate the advantages of both natural
and synthetic materials to form biocompatible and mechanically tunable implant.
One of the most common hybrid implants are the type where synthetic scaffolds are coated
with natural materials to reduce the host response. From its wide range of properties, silk fibroin
protein, which is extracted from silkworm or spider-silk, is considered a potential candidate due
to its mechanical resilience87. Hybrid scaffolds can be created by combining electrospun silk fibers
with tunable gelatin hydrogels to synthesize musculoskeletal implants87. By dosing these scaffolds
with nano-doses of hydroxyapatite, biomineralization was observed which can be further improved
to combat bone degradation and resorption due to ailments such as arthritis87. Naïve silicone
implants with thin spider silk proteins show a minimal inflammatory response, reduced fibrosis,
and inhibited differentiation of monocytes to macrophages20. The hybrid surfaces abated the
transition of fibroblasts to myofibroblasts88. Those positive responses, which were also concurred
by experiments conducted by other groups, such as Kundu et al. who used silk fibroin composite
hydrogels derived from silkworm, and Mooney et al. who used fibroin extracted from spider silk89–
91, indicated that silk coated hybrid scaffolds had a better performance for reducing inflammatory
responses as compared to purely natural implants. Through the studies conducted on silk proteins
and their tunable or biocompatible nature91 these hybrid substrates can be used as rigorous models
for understanding the immune response in different locations within the body.
Other than coating natural materials on synthetic scaffold surfaces for improved
biocompatibility, the combination of natural and synthetic material was also developed for the
21
purpose of morphological modification. As some natural materials are pH sensitive, chitosan at
pH lower than 6 is positive charged. This allows negative charged material, poly(γ-glutamic acid),
to form self-assembled multi-layer structures with chitosan through electrostatic interactions90.
Such structures offer chitosan with drug delivery capability, and successfully reprogramed
macrophage response with drug loaded. Chitosan-PGA loaded with diclofenac was reported to
decrease PGE2 released from LPS activated human monocytes derived macrophages45.
The combination of synthetic and natural materials certainly increases the materials space
for biomedical implants, but also results in high lab-to-lab differences. One example is alginate-
polylysine (PLL) microcapsules. Alginate-PLL microcapsules have been developed since 1980 93.
However, alginate-PLL microcapsules with different G/M ratios and molecular weights were
fabricated, leading to results that are difficult to compare94. Even with similar physiochemical
properties, Alginate-PLL microcapsules could lead to various inflammatory responses due to
differences in the G/M ratio94. This effect was magnified in vivo as the zeta potential increases
significantly for alginate-PLL particles with 53% G-block but remains unchanged for 43% G-
block after 1 day implantation94. Silk fibroins coated titanium particles were also reported to
function differently dependent on the biological source of silk95.
2.2.4. Summary of Material Selection
Both natural and synthetic materials exhibit distinct properties, in which natural materials
generally are biocompatible while synthetic materials have higher plasticity and are more easily
modified. Current efforts in material selection mostly lies in reducing the inflammatory response
caused by the bioimplant. One overarching theme is that most materials can be modified through
molecular weight, and both natural and synthetic materials with small molecular weight,
particularly degradation products, can lead to inflammation. Moreover, host responses to natural
materials are further influenced by factors such as surface modification and monomer ratio.
22
Currently, most cellular responses mechanisms have not been completely developed. Detailed host
responses to different natural, synthetic, and hybrid materials are listed in Table 2.1.
2.3. Effect of Surface Topology and Functionalization on the FBR and Biocompatibility
The local geometry of nanoparticles and scaffolds show very interesting effects on the host
response. Through subtle changes in the exposed surface area, the shape of the surface available
for interaction, and the overall geometry of the material, it has been observed that the host response
can be triggered towards biocompatibility or extended fibrosis. For different cell types such as
macrophages, changes in the geometry greatly influence their ability to phagocytose and thereby
limit their interactions with the material, which in turn influences the signaling pathways for
polarization. On the other hand, the geometry and material characteristics as a whole have been
shown to influence fibroblast activation and differentiation, based on the local stress observed.
This section will focus on three main geometrical considerations for designing biomaterials
implants. The first aspect is the effect of decellularized scaffolds, wherein the aim is to observe
cell interactions in a noise-free microenvironment. The second is the shape of the implant,
including the impact of the radius of curvature on macrophage and fibroblast phenotype. Finally,
the impact of pore size will be discussed, including its impact on cell differentiation.
2.3.1. Effect of Decellularized Scaffolds
Macrophage presence and phenotype at the site of implantation is essential for
vascularization. In this section, we aim to elucidate the influence of decellularized scaffolds on the
FBR. Decellularized scaffolds are ones obtained from different sources such as the trachea,
esophagus, lungs, etc. as well as through murine versions of the same. The intense degradation of
the ECM allows for removal of most of the triggers for the inflammatory response apart from
GAGs, proteoglycans, and smaller blood proteins. GAGs are highly polar polysaccharide
23
compounds that perform a wide range of functions such as tissue hydration, coagulation, and
enzyme activation.9 By ensuring that there are no residual cytokines such as TGF-β present in the
decellularized scaffolds,10–12 macrophage responses can be studied in a tunable, noise-free
microenvironment.
Another important facet of decellularized scaffolds is their ability to provide viable models
to study invasive diseases, which show increased FBR type symptoms. Idiopathic pulmonary
fibrosis (IPF) has been studied in depth for over 15 years.13,14 By treating healthy decellularized
lung scaffolds with bleomycin, it is possible to model how IPF biopsies showed local regions of
high rigidity. These regions when cultured with fibroblasts showed increased differentiation to
myofibroblasts, and higher presence of CD68+ macrophages. The progression of fibrosis, and
subsequent macrophage and fibroblast phenotypic changes, can be readily observed in the de novo
environment with reduced interference from inherently present cellular receptors and cytokines.15
Surface coatings of these de novo scaffolds can be used for manipulating the host response
for increased biocompatibility. Myofibroblast differentiation from fibroblasts are readily observed
in vitro under these conditions, and further research has been detailed under specific case studies
for the work done on improving the biocompatibility of lung implants.16,17
Coating implant surfaces with NSAIDs can reduce the FBR and also the infiltration of
macrophages into the drug-releasing implant.18 Different modes of inoculation, primarily oral or
through implants, were compared, which showed that sustained oral doses of salicylic acid led to
renal failure, as compared to an improved non-inflammatory response and acceptance of the
implant itself. Furthermore, they compared the degraded by-products of scaffold hydrogels such
as PLGA over longer periods of time compared to simpler poly-L-lactic acid (PLLA) hydrogels
24
coated with salicylic acid, which showed that there were no inflammatory response by-products
produced by the NSAIDs coated implants.
2.3.2. Surface Shapes and Coatings
Hydrogel based treatments have gained traction over the past several decades as novel
systems for drug delivery, regenerative therapeutics, and sustainable in vitro models.19,20 Their
jelly like natural structure provides a moist and relatively inert microenvironment, which is
necessary for tissue engineering and 3D cell culture applications. Hydrogels have proven
biocompatibility especially when comprised of components such as collagen, hyaluronic acid, or
alginate. These hydrogels can be easily functionalized to produce a tunable microenvironments for
changing macrophage and fibroblast phenotypes in a controlled fashion.21,22 Anseth and co-
workers23 have demonstrated 3D cell culture as a necessary tool for understanding cellular
behavior especially for the progression of the host response. Their work indicated that different
types of cells had a preference for specific underlying shapes and symmetries which are
intrinsically related to mechanotransduction signals.23
As discussed previously, alginates are a popular material for biomedical implants due to
low toxicity, easy tunability, and good biocompatibility in both liquid and hydrogel form. Coated
alginates and hydrogels provide a similarly tunable environment. Kolhar et al.24 demonstrated that
the shape and coatings of different alginate microcapsules directly influences the adhesion and
migration of RBE4 rat brain endothelial cells and the efficiency of drug delivery. Surface and
shape effects of different biomaterial interactions have been found to vary greatly for different
locations.25 As macrophages are phagocytes, modifications in shapes and coatings have been
observed to be valid parameters to study this aspect of the host response. Wolf et al.26 described
in detail the effect that different scaffold geometries have on the host response, and observed how
the 2D sheets and powder scaffolds work best for a rapid wound healing response based on their
25
ease of phagocytosis, whereas multi-sheet or tubular implants show the most compatible response
for bone tissue implants.
Based on the observation that most hydrophilic, non-coated synthetic materials, elicited a
highly inflammatory response in vivo, it became essential to explore combinations of natural and
synthetic substrates for FBR studies. Hashizume et al.27 focused on polyester urethane urea
(PEUU) combined with decellularized ECM scaffolds, the former contribute to the elastomeric
properties while the latter contributed to its biocompatibility. The PEUU/ECM hybrid showed
cellular infiltration by macrophages and better incorporation into the abdominal wall. However,
both the naïve PEUU and the composite material showed myofibroblast differentiation. This study
mentioned that longer time periods would be necessary for eventual scaffold degradation and
further characterization of macrophage polarization, as compared to generally visualizing CD68+
macrophage infiltration, would be essential to determine the end result initiated by the scaffold.
The FBR is influenced by the topology of the underlying substrates on the innate host
response. Many research groups studied this response mechanism, such as Mooney and co-
workers,28 who demonstrated the importance of material shape and surface chemistry for an
improved adaptive immune system boost strategy using mesoporous, cylindrical silicon rods
(MSRs) as a host for immune cells. This technique can be modified by tuning the size of pores and
the length of these MSRs. Subcutaneous implants of the MSRs loaded with specific factors such
as granulocyte macrophage colony-stimulating factor, were analyzed to see how effectively they
resulted in proliferation of bone marrow-derived dendritic cells. The efficacy of this new system
was tested against conventional methods and the results showed that MSR based adjuvant therapy
was 2.5 times more effective with more scope for improvement based on optimization of the aspect
26
ratio of scaffolds. Further work is being conducted on controlling the degradation kinetics of the
MSRs for clinical studies, which will allow for even better positive host responses.
Device geometry plays an important role in macrophage and fibroblast activation. Different
sized and shaped materials have resulted in unabated inflammation, formation of FGBCs, fibrosis,
and uncontrolled damage to neighboring tissues. 29 All of these events are significant in the FBR
to different implants and dictate the phenotypes of macrophage and fibroblast in the surrounding
ECM and tissue. The studies showed how 1.5 mm circular particles elicit the most optimal
biocompatibility, irrespective of material composition. They also suggested potential strategies for
improving the FBR to biomaterials by focusing on porosity-based influences.
2.3.3. Effect of Pore Sizes
Both natural and synthetic materials show varied biocompatibilities depending on their
surface properties. One important factor is their pore size, which in the case of natural materials
are not as rigidly controlled as it can be in synthetic materials. It is essential to observe the
interaction of innate cell responses with these porous materials. This section of the review aims to
distil the seminal papers, which demonstrate the variability of the FBR depending on the pore sizes
of the underlying substrates and establish trends for macrophage and fibroblast phenotypic
changes.
An early proof of concept regarding the macrophage effect on the FBR mediated by porous
substrates was conducted by Sussman et al.30 Their study showed a clear difference between the
FBR towards porous and non-porous materials where the former showed a thinner fibrotic capsule,
along with improved vascularization. They suggested a possible hypothesis for this difference
could be attributed to a greater fraction of fibrous material in the pores, which affected the
acceptance of the implant. In such systems, the acceptance of the implants was judged on the basis
of greater vascularization, thinner fibrotic response, and an absence of both the inflammatory type
27
aspect of the M1 response as well as remodeling associated M2 macrophages. Down regulation of
the M2 response could be attributed to cellular adhesion, which was markedly decreased in the
case of the porous implant materials, with almost none for the 34 μm pores, and a negligible
response for the 160 μm pores, as well. There was an interesting atypical non-inflammatory
response observed for the adhered M1 macrophages, which has great potential in terms of sub-
classifications of phenotype changes in the host response. Specifically, due to the combination of
surface area, pore size, etc., the 34 μm porous implants produced a combined M1 and M2 response
which should be further studied.
Decellularized organ models can be used to understand the mechanisms behind IPF, and
showed how changes in pore size could provide treatments to alleviate the compromised lung
capacity due to fibrosis.31 The role played by porous ECM substrates was analyzed where the L-
TGF-β activation is improbable after stripping of such proteins during decellularization, thereby
placing emphasis on mechanical and adhesion cues in the microenvironment. Organized healthy
ECM versus chaotic and disordered ECM in IPF samples was observed, along with increased
myofibroblast differentiation showing high α-smooth muscle actin (α-SMA) levels, a protein
characteristic of myofibroblasts, as compared to healthy tissues. The similarity of TGF-β levels
could also be extrapolated towards assuming that there was lesser M1 macrophage presence. On
the basis of the images published, this area of research could benefit from multimodal imaging to
simultaneously evaluate biochemical and mechanical factors. Similar studies were also carried by
Phipps et al.32 where they used large pore sized (on the order of 10 µm) based scaffolds for better
biomineralization for bone tissue regeneration.
Pore size effects on the progression of FBR, and vascularization of implants has been
evaluated using different models. Studies on how pore size influences cellular responses were
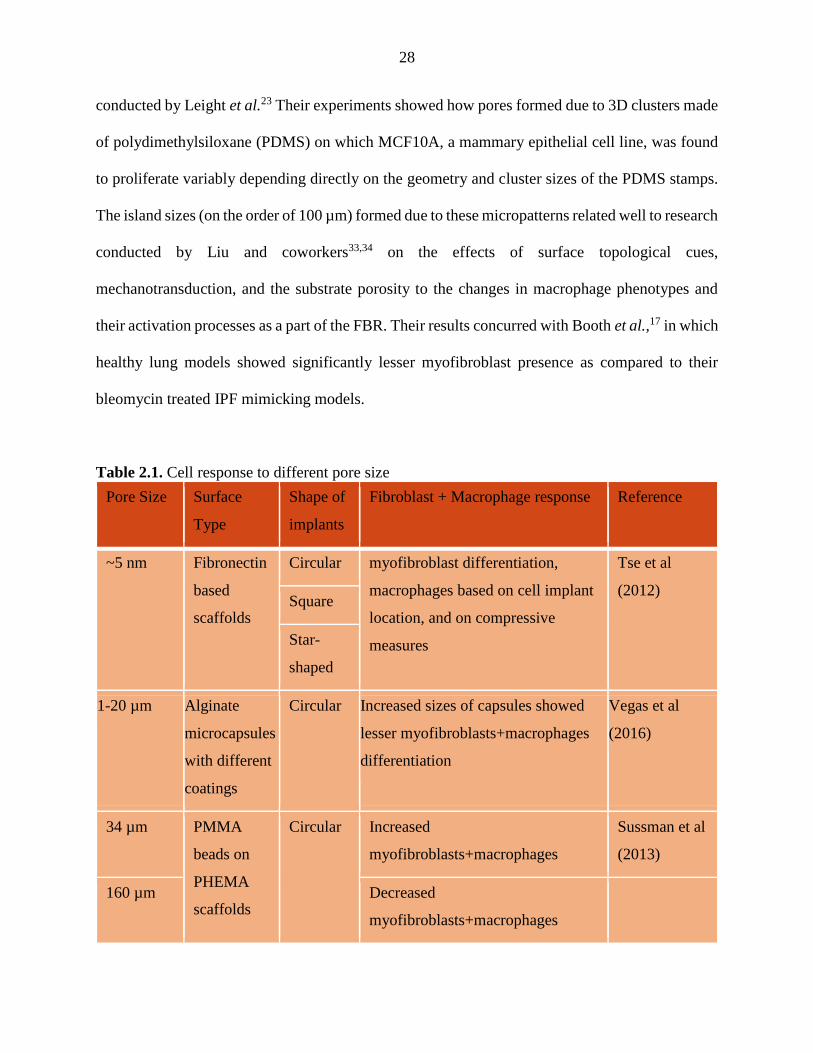
28
conducted by Leight et al.23 Their experiments showed how pores formed due to 3D clusters made
of polydimethylsiloxane (PDMS) on which MCF10A, a mammary epithelial cell line, was found
to proliferate variably depending directly on the geometry and cluster sizes of the PDMS stamps.
The island sizes (on the order of 100 µm) formed due to these micropatterns related well to research
conducted by Liu and coworkers33,34 on the effects of surface topological cues,
mechanotransduction, and the substrate porosity to the changes in macrophage phenotypes and
their activation processes as a part of the FBR. Their results concurred with Booth et al.,17 in which
healthy lung models showed significantly lesser myofibroblast presence as compared to their
bleomycin treated IPF mimicking models.
Table 2.1. Cell response to different pore size
Pore Size Surface
Type
Shape of
implants
Fibroblast + Macrophage response Reference
~5 nm Fibronectin
based
scaffolds
Circular myofibroblast differentiation,
macrophages based on cell implant
location, and on compressive
measures
Tse et al
(2012) Square
Star-
shaped
1-20 µm Alginate
microcapsules
with different
coatings
Circular Increased sizes of capsules showed
lesser myofibroblasts+macrophages
differentiation
Vegas et al
(2016)
34 µm PMMA
beads on
PHEMA
scaffolds
Circular Increased
myofibroblasts+macrophages
Sussman et al
(2013)
160 µm Decreased
myofibroblasts+macrophages
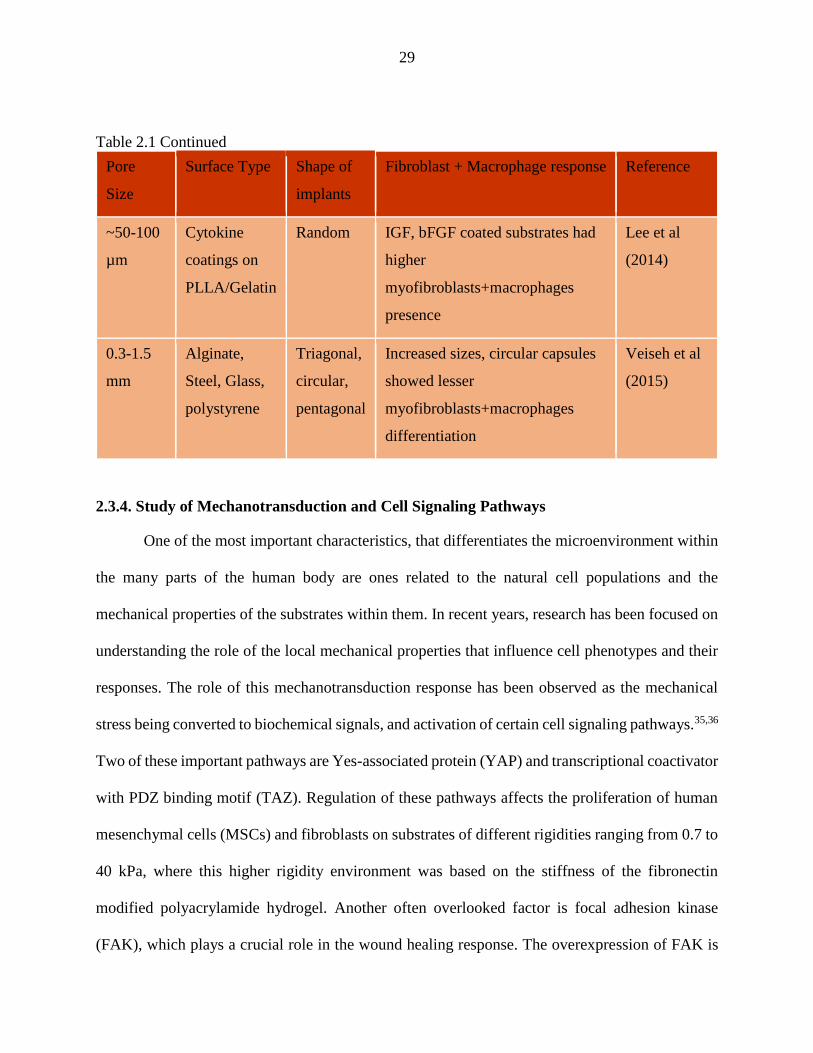
29
Table 2.1 Continued
Pore
Size
Surface Type Shape of
implants
Fibroblast + Macrophage response Reference
~50-100
µm
Cytokine
coatings on
PLLA/Gelatin
Random IGF, bFGF coated substrates had
higher
myofibroblasts+macrophages
presence
Lee et al
(2014)
0.3-1.5
mm
Alginate,
Steel, Glass,
polystyrene
Triagonal,
circular,
pentagonal
Increased sizes, circular capsules
showed lesser
myofibroblasts+macrophages
differentiation
Veiseh et al
(2015)
2.3.4. Study of Mechanotransduction and Cell Signaling Pathways
One of the most important characteristics, that differentiates the microenvironment within
the many parts of the human body are ones related to the natural cell populations and the
mechanical properties of the substrates within them. In recent years, research has been focused on
understanding the role of the local mechanical properties that influence cell phenotypes and their
responses. The role of this mechanotransduction response has been observed as the mechanical
stress being converted to biochemical signals, and activation of certain cell signaling pathways.35,36
Two of these important pathways are Yes-associated protein (YAP) and transcriptional coactivator
with PDZ binding motif (TAZ). Regulation of these pathways affects the proliferation of human
mesenchymal cells (MSCs) and fibroblasts on substrates of different rigidities ranging from 0.7 to
40 kPa, where this higher rigidity environment was based on the stiffness of the fibronectin
modified polyacrylamide hydrogel. Another often overlooked factor is focal adhesion kinase
(FAK), which plays a crucial role in the wound healing response. The overexpression of FAK is
30
what results in the formation of hypertrophic scars or keloids in mammals.37 Similar to the studies
conducted on YAP/TAZ, the responses of certain FAK-inhibited mice, and their wound healing
response has been evaluated. Interesting results were obtained when valvular interstitial cells
(VICs) were used to understand the fibroblast and macrophage activating pathways such as
PI3K/AKT pathways, after being cultured or co-cultured on soft or stiff PEG scaffolds.21,38 Up
regulation of the pathway was obtained as a response to the local rigidities and cytokines coatings.
Sadtler et al.39 added to this theory through their observations of how biomaterial treated injuries
responded differently, based on the treatment of the surface and rigidity of the scaffold in contact
with the wound itself. The above factors affected the cell phenotype towards a quiescent or
deactivated state for soft substrates, and towards a highly activated state on stiffer substrates. These
cell-signaling and mechanotransduction studies thus motivated a detailed review of the host
responses observed for different organs within the body, to understand what conditions could be
modified in the implant or regeneration therapies to suit the purpose most efficiently.
2.4. Location and Biocompatibility response
Recent studies have shown the important role that macrophage and fibroblast phenotype
play in the host response,40 by affecting the level of fibrosis observed. It is essential to understand
the changes in their expression of phenotypes, depending on their location. There is no one favored
phenotype for both macrophages and fibroblasts that positively affects bioimplants throughout the
human body. Over the course of this section we aim to address this concern, by examining different
organs and how their host response varies for both in vivo and in vitro studies. In this section, we
will give a brief overview of important cell signaling pathways that influence the host response.
31
Then we will focus on biomaterial interaction studies for the different locations of implants within
the body for lungs, bones, liver, skin, and heart.
2.4.1. Lungs
The effect of inhibiting different prostaglandins, for identification of critical points leading
to a fibrotic response, has been the focus of theories formulated and experiments conducted by
Hinz and co-workers41 over the past 20 years. Liu et al.16 and Dearth et al.42 hypothesized that
inhibition of specific prostaglandin receptors such as PGE2 and the COX-1/2 (cyclooxygenase-
1/2) pathways causes stiffness driven activation of macrophages, which further leads to fibrosis.
Bleomycin treated lungs are models for IPF affected lungs, and their stiffness was found to
be significantly higher than healthy tissue, which showed a median stiffness range between 3 to 5
kPa. Certain collagen rich regions in the IPF model showed high stiffness ranging from 25.6 to 40
kPa. These locally pre-calcified regions were shown to increase CD68+ macrophage presence and
resulted in high levels of α-SMA, indicating the alterations were connected to myofibroblast
differentiation. Shifting lung fibroblasts from soft to stiff substrates and reversing this process was
also studied for up to 5 weeks to analyze the reversibility of this myofibroblast conversion.43–45
Even after returning the cells to soft substrates, the cells showed active markers for myofibroblasts
indicating that the effect of the initial substrate could have long term effects on cell phenotype, as
seen in Figure 2.2.
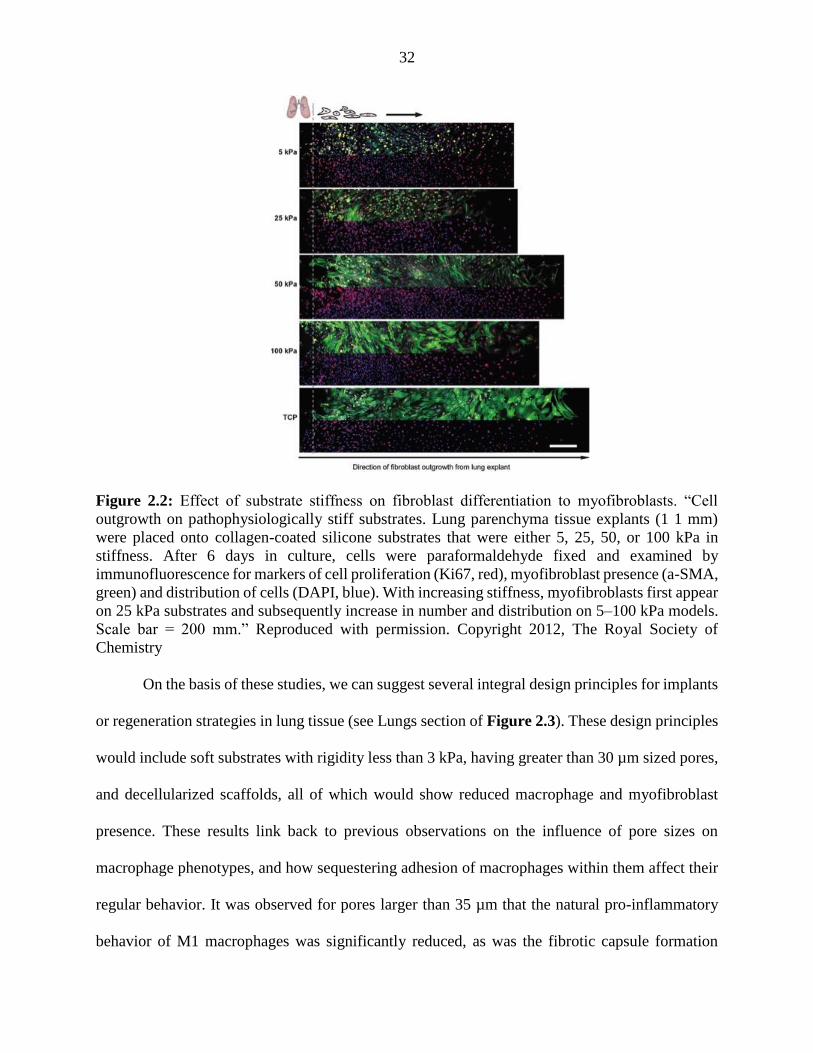
32
Figure 2.2: Effect of substrate stiffness on fibroblast differentiation to myofibroblasts. “Cell
outgrowth on pathophysiologically stiff substrates. Lung parenchyma tissue explants (1 1 mm)
were placed onto collagen-coated silicone substrates that were either 5, 25, 50, or 100 kPa in
stiffness. After 6 days in culture, cells were paraformaldehyde fixed and examined by
immunofluorescence for markers of cell proliferation (Ki67, red), myofibroblast presence (a-SMA,
green) and distribution of cells (DAPI, blue). With increasing stiffness, myofibroblasts first appear
on 25 kPa substrates and subsequently increase in number and distribution on 5–100 kPa models.
Scale bar = 200 mm.” Reproduced with permission. Copyright 2012, The Royal Society of
Chemistry
On the basis of these studies, we can suggest several integral design principles for implants
or regeneration strategies in lung tissue (see Lungs section of Figure 2.3). These design principles
would include soft substrates with rigidity less than 3 kPa, having greater than 30 µm sized pores,
and decellularized scaffolds, all of which would show reduced macrophage and myofibroblast
presence. These results link back to previous observations on the influence of pore sizes on
macrophage phenotypes, and how sequestering adhesion of macrophages within them affect their
regular behavior. It was observed for pores larger than 35 µm that the natural pro-inflammatory
behavior of M1 macrophages was significantly reduced, as was the fibrotic capsule formation
33
mediated by M2 macrophages. These large pore size effects show host responses where there is
inhibited fibroblast to myofibroblast differentiation, also contributing to a thinner fibrotic capsule,
due to lower collagen secreted by the fibroblast cells. This is a very important aspect of modulating
these material properties, as lower myofibroblast differentiation results in inhibited fibrosis
alleviates and, in some cases, improves compromised lung capacity symptoms faced by patients
suffering from IPF or cystic fibrosis.
2.4.2. Bone
The process of bone tissue engineering involves fabrication of constructs for culturing cells,
delivering growth factors, and exerting mechanical stimuli.46 There is limited information
available regarding the effect different materials have on both macrophages and fibroblasts after
implantation.47 Two common strategies are generally employed for bone tissue engineering and
dental implants. These were based on reprogramming stem cell lines12,48 into bone tissue using
growth factors or using mechanotransduction to induce differentiation towards osteoblasts.49
Hydroxyapatite coatings on scaffolds made of collagen I have been shown to improve MSC
adhesion and differentiation into osteoblasts.32,46 Such coated scaffolds have significant
advantages over previous stem cell based bone tissue engineering approaches. A popular addition
to these scaffolds is the inoculation with MSCs instead of previously used embryonic stem cells,
as the latter can result in teratomas.50
Chemically modified hydrogels have been fabricated with different surface groups exposed
to the ECM for interrogating their influence on bone regeneration pathways. The use of RGD-
modified diacrylate hydrogels for improving biomineralization was studied by Eliseef et al.51
These RGD modified substrates stimulated the production of bone-production proteins such as
osteocalcin, and they had a 2.5-fold increase in osteocalcin compared to non-RGD modified
substrates. This response was a marker for regenerating healthy bone tissue around areas that have
34
suffered from debilitating diseases such as volumetric muscle loss (VML). VML has been studied
in mammals as the loss of function and resorption of bone in areas that have previously been treated
for other tumors or due to shock damage.52 Hybrid substrates and therapies to regenerate functional
bone tissue in such areas with the help of decellularized mouse ECM scaffolds seeded with
perivascular stem cells have been proposed.53 These scaffolds have shown positive remodeling
responses when transplanted into rat aortic valves by successfully recruiting M2 macrophages and
myofibroblasts.
Another common technique for bone tissue engineering is based on growth factor mediated
reprogramming.54 For cases where there is severe muscle loss, there are several problems for
treatment that include acceptance of new tissue and lack of available healthy tissue for implants.
By pairing the ability of myofibroblasts to infiltrate gelatinous tissues and the acceptance of PLLA
based scaffolds, a hybrid protocol was suggested to accelerate muscle regeneration at the site.
Adding myogenic growth factors and observing their sustained presence within the implants
activated STAT6 pathways, which resulted in both types of macrophages being differentiated at
the site of the implants from freely circulating monocytes. The overall angiogenesis due to the
activation of these pathways was a useful strategy showing the best empirical results for muscular
regeneration, which was further modified using insulin-like growth factor treatment on gelatinous
hydrogels.
On the basis of these studies on musculoskeletal implants and the innate response, we
propose the following design principles: implants must be relatively stiff (>40 kPa), have small
pores (~50 nm) or non-porous substrates, increased surface roughness to promote osteoblast
differentiation, and a higher M2 macrophage and myofibroblast presence. The higher rigidity
would be promoting the myofibroblast differentiation for the remodeling and initiation of M2
35
macrophages. The small pores would keep the macrophages non-adhered to the surface and
exhibiting their standard host response.
2.4.3. Heart
Cardiomyocytes are specialized cardiac cells, which are integral for the synchronous
involuntary muscle function in the heart. Novel strategies for the treatment of congenital heart
diseases where tissue engineered heart valves (TEHVs) are fabricated using biocompatible
scaffolds (made of fibrin and thrombin coated tissue culture plastic plates) containing VICs have
been proposed.55 Much like fibroblasts, VICs have a quiescent or dormant state where they freely
circulate, and an activated state, which is initiated by certain cell signaling pathways (mostly
GATA binding protein-4 and Tbox protein-5) that lead to ECM alterations. Neonatal human
dermal fibroblasts can replace the VICs seeded in the scaffolds for TEHVs and the subsequent
aortic remodeling. However, there are significant concerns that VICs in their activated state
produce more ECM components and show high levels of α-SMA, which could result in fibrosis,
leading to arterial blocking, rather than valve remodeling. To combat this concern, comparisons of
pediatric VICs and dermal fibroblasts on different substrates were conducted to determine what
components favor remodeling of the TEHVs, such that there are no adverse responses. Collagen
type I was found to modulate the fibrosis to levels which would induce smooth angiogenesis
around the fibrotic capsule. Wessels et al.56 explored similar solutions using epicardially derived
fibroblast cells (EPDCs), which have been transformed from cardiac fibroblasts to MSCs and can
play a very important role in the process of valve healing in vivo. The formation of atrioventricular
(AV) valves by these VICs can be potentially useful for providing treatment strategies for
congenital heart defects in infants. Though the studies were unable to conclusively use EPDCs in
scaffolds for AV rebuilding because of inconclusive myocardial staining, the process may yet be
useful for studies of other heart diseases.
36
The biocompatibility of synthetically derived hyaluronic acid based hydrogels57 has been
well established. Chang et al.57 injected blood-growth factor based solutions in hyaluronic acid
based hydrogels and surmised that there is need to optimize several parameters: gelation time to
avoid pulmonary embolisms during injection, pore sizes to allow for transport of metabolites, and
degradation kinetics to avoid unwanted host responses to erosion products. These formulations
promoted angiogenesis, improved cell function, and reduced CD44+ macrophages. The second
approach for cardiac implants, analogous to pulmonary and musculoskeletal implants, was the
strategy of reprogramming of fibroblasts into functional cardiomyocytes using a mixture of
transcription factors and cytokines. Qian et al.58 worked on treating quiescent fibroblasts with
retroviral infection of Gata4, Mef2c, and Tbx4 doses that can potentially create techniques to heal
organs in vivo by forming cardiomyocytes. These three genes are responsible for ECM alterations
and activation of fibrocytes or quiescent fibroblasts to myofibroblasts, which concurs with their
effectiveness in tracking VICs cell signaling responses. Lineage tracking was employed to monitor
induced cardiomyocyte activity and their genetic signature was compared to native
cardiomyocytes and non-infected heart cells.
Based on the above review, optimal material properties for cardiac reprogramming of
myofibroblasts and repair are very similar to those identified for lung implants. The important
factors are that the material be soft (<3 kPa), and have large pores (>30 µm), and reduce M2
macrophage and myofibroblast responses to avoid fibrosis and plaque to accumulate on the cardiac
tissue. For heart implants it is essential to mediate a reduced fibrotic response to inhibit scarring
of the cardiac tissue, which can disrupt its natural beatings. The adhesion of the macrophages
within the pores of these surfaces would prevent an overall lower activated macrophage or
myofibroblast response.
37
2.4.4. Liver
The mortality rates for diseases brought on by liver fibrosis is very high, at about 20% one
month after diagnosis,59 and can progress to non-treatable stages rapidly. It has been established
that the hepatic stellate macrophages, known as Kupffer cells, play a key role in the progression
of liver fibrosis.60 The change in the phenotype of monocytes to polarized M1, M2, or Kupffer
macrophages is mediated by different cell activated signaling pathways and are also linked to the
inducible nitric oxide synthase and arginine stimulated classical M1/M2 polarization signals. The
range of interactions between these different factors influencing the fibrotic capsule formation
necessitates the need for liver fibrosis studies in vitro and in vivo.61
As fibrosis is a dynamic process, spanning multiple stages, it has been difficult to
characterize based on the interactions of fibroblasts and macrophages. Macrophages play a critical
role in the activation and differentiation of fibroblasts into myofibroblasts through the release of
cytokines such as IL-13 and TGF-β.62 Modifying these cytokine release pathways in macrophages
inhibited hepatic stellate cells, thereby reducing the fibrotic response. This key dynamic between
macrophages and fibroblasts has perhaps been the best understood for liver fibrosis compared to
other organs.62
Different cell signaling pathways established for the progression of liver fibrosis and its
inhibition have been widely studied. There are two major types of host responses that can be
observed as a part of liver fibrosis progression, one for reducing liver scarring and the other for
liver regeneration. 61 It was logically concluded that different polarized responses of macrophages
would be essential for these diametrically opposed roles in the host response, and this is further
detailed in Figure 2.3. Macrophages are critically involved in both the injury and repair of the
tissue, and it is possible to alter their polarizations to prevent fibrosis from progressing. These
38
findings illustrate the great need for clinical studies to observe the multi-cell participation in liver
fibrosis.
Recruitment of GR1+ monocytes during liver injury is essential for the progression of liver
fibrosis.60 This study corroborates research conducted by Duffield et al.61 on macrophage
phenotypic changes in liver injury or repair states. The activation of GR1+ at different stages of
fibrosis through TGF-β was studied to evaluate the threshold levels of cytokine that activate the
monocytes. The role played by different macrophage polarizations that can inhibit fibrosis was
studied and identified the effect of arginase-1 expressing macrophages on a rat model, which was
exhibiting schistosomiasis, via thioacetamide induction. 63
Key design principles for implants used for liver repair and fibrosis reduction have been
identified based on the review above. For the purpose of reduction of liver scarring, there is a need
for soft scaffolds or substrates (<2 kPa),64 with large pores (>30 µm), which can stimulate M1
macrophage response themselves or through classic activation via cytokines like IL-4. For the
explicit purpose of liver repair and regeneration, it is essential to have stiff scaffolds (>40 kPa)16
which are non-porous or smooth, such that they can incite an increased M2 macrophage presence.
2.4.5. Skin
Skin undergoes a specific wound healing response. Macrophages are generally maintained
at low levels in healthy skin, but can differentiate from monocytes in blood vessels shortly after
implantation or injury and cause acute inflammation.65 Fibrotic encapsulation of dermal implants
is highly related to the interaction between M2 macrophages and fibroblasts. Cytokines released
by M2 macrophages, including TGF-β and MMPs, are known to enhance collagen production and
endothelial cell migration, respectively. This further results in FGF-2 and PDGF production, which
have been reported to cause myofibroblast differentiation.66
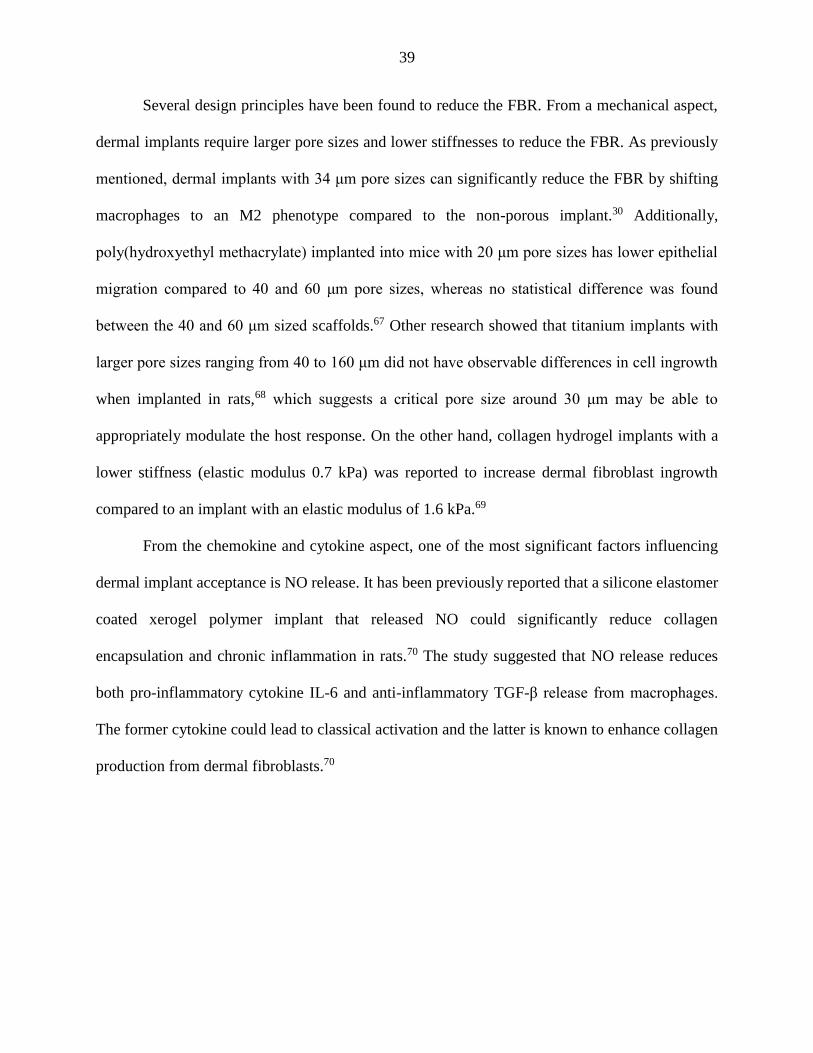
39
Several design principles have been found to reduce the FBR. From a mechanical aspect,
dermal implants require larger pore sizes and lower stiffnesses to reduce the FBR. As previously
mentioned, dermal implants with 34 μm pore sizes can significantly reduce the FBR by shifting
macrophages to an M2 phenotype compared to the non-porous implant.30 Additionally,
poly(hydroxyethyl methacrylate) implanted into mice with 20 μm pore sizes has lower epithelial
migration compared to 40 and 60 μm pore sizes, whereas no statistical difference was found
between the 40 and 60 μm sized scaffolds.67 Other research showed that titanium implants with
larger pore sizes ranging from 40 to 160 μm did not have observable differences in cell ingrowth
when implanted in rats,68 which suggests a critical pore size around 30 μm may be able to
appropriately modulate the host response. On the other hand, collagen hydrogel implants with a
lower stiffness (elastic modulus 0.7 kPa) was reported to increase dermal fibroblast ingrowth
compared to an implant with an elastic modulus of 1.6 kPa.69
From the chemokine and cytokine aspect, one of the most significant factors influencing
dermal implant acceptance is NO release. It has been previously reported that a silicone elastomer
coated xerogel polymer implant that released NO could significantly reduce collagen
encapsulation and chronic inflammation in rats.70 The study suggested that NO release reduces
both pro-inflammatory cytokine IL-6 and anti-inflammatory TGF-β release from macrophages.
The former cytokine could lead to classical activation and the latter is known to enhance collagen
production from dermal fibroblasts.70
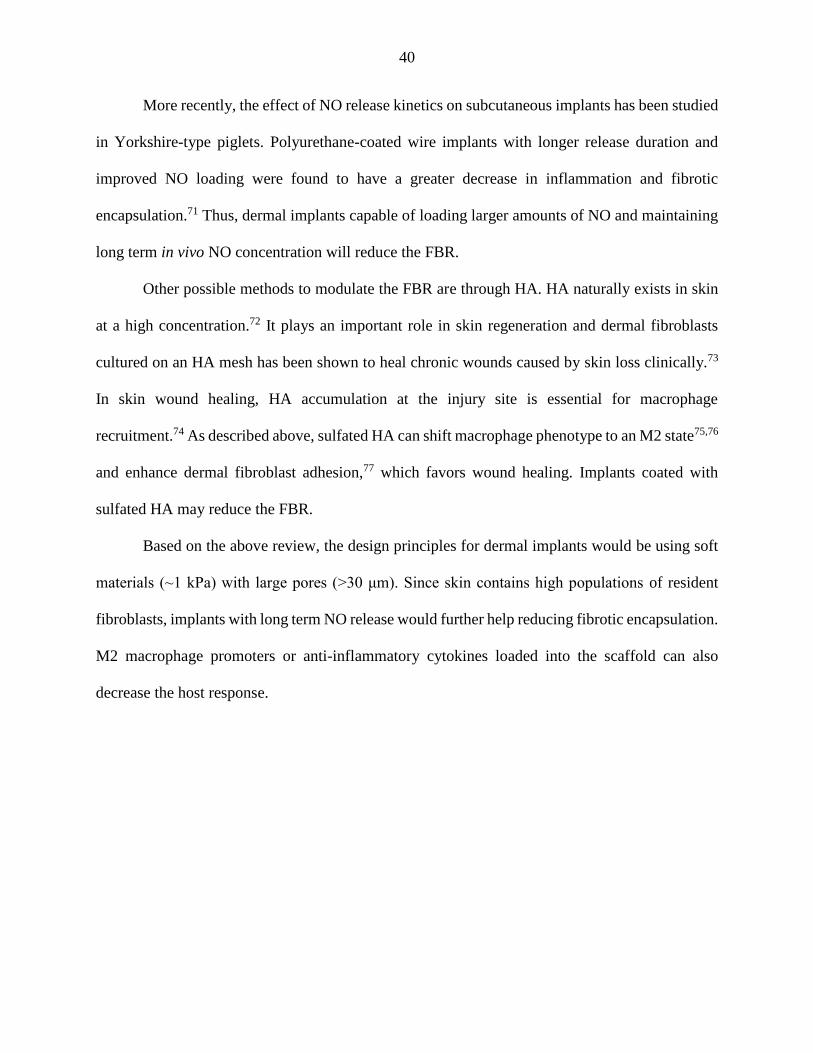
40
More recently, the effect of NO release kinetics on subcutaneous implants has been studied
in Yorkshire-type piglets. Polyurethane-coated wire implants with longer release duration and
improved NO loading were found to have a greater decrease in inflammation and fibrotic
encapsulation.71 Thus, dermal implants capable of loading larger amounts of NO and maintaining
long term in vivo NO concentration will reduce the FBR.
Other possible methods to modulate the FBR are through HA. HA naturally exists in skin
at a high concentration.72 It plays an important role in skin regeneration and dermal fibroblasts
cultured on an HA mesh has been shown to heal chronic wounds caused by skin loss clinically.73
In skin wound healing, HA accumulation at the injury site is essential for macrophage
recruitment.74 As described above, sulfated HA can shift macrophage phenotype to an M2 state75,76
and enhance dermal fibroblast adhesion,77 which favors wound healing. Implants coated with
sulfated HA may reduce the FBR.
Based on the above review, the design principles for dermal implants would be using soft
materials (~1 kPa) with large pores (>30 μm). Since skin contains high populations of resident
fibroblasts, implants with long term NO release would further help reducing fibrotic encapsulation.
M2 macrophage promoters or anti-inflammatory cytokines loaded into the scaffold can also
decrease the host response.
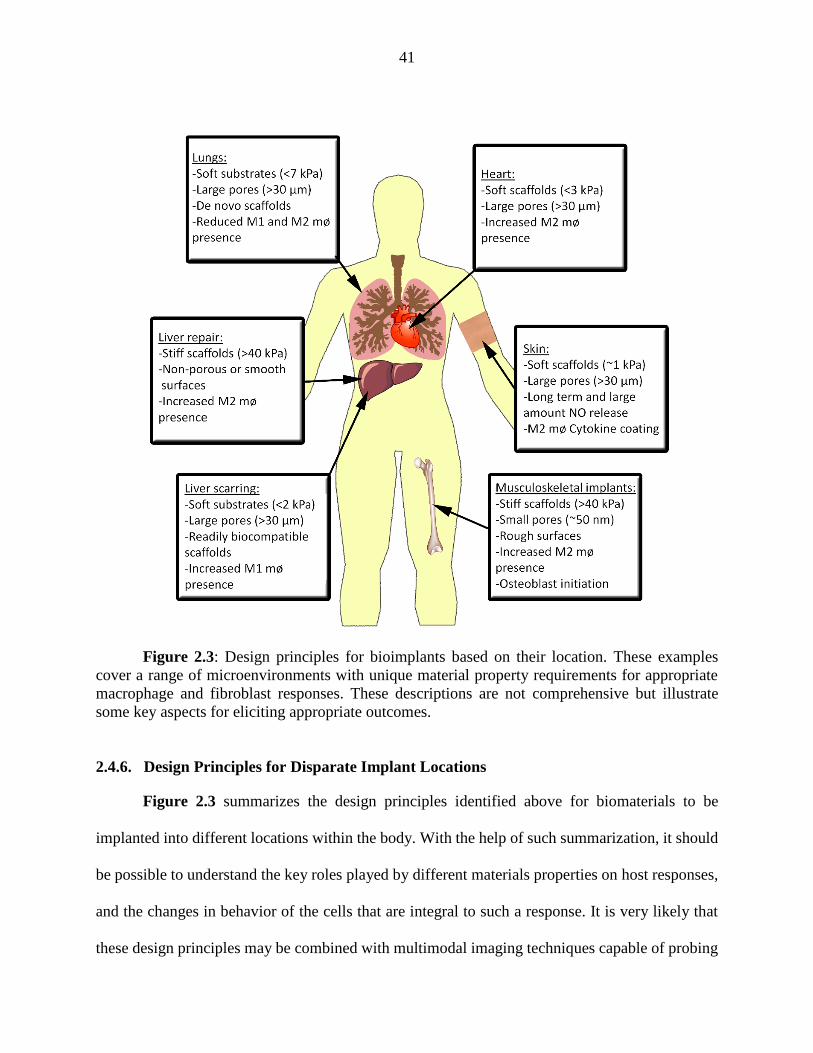
41
Figure 2.3: Design principles for bioimplants based on their location. These examples
cover a range of microenvironments with unique material property requirements for appropriate
macrophage and fibroblast responses. These descriptions are not comprehensive but illustrate
some key aspects for eliciting appropriate outcomes.
2.4.6. Design Principles for Disparate Implant Locations
Figure 2.3 summarizes the design principles identified above for biomaterials to be
implanted into different locations within the body. With the help of such summarization, it should
be possible to understand the key roles played by different materials properties on host responses,
and the changes in behavior of the cells that are integral to such a response. It is very likely that
these design principles may be combined with multimodal imaging techniques capable of probing
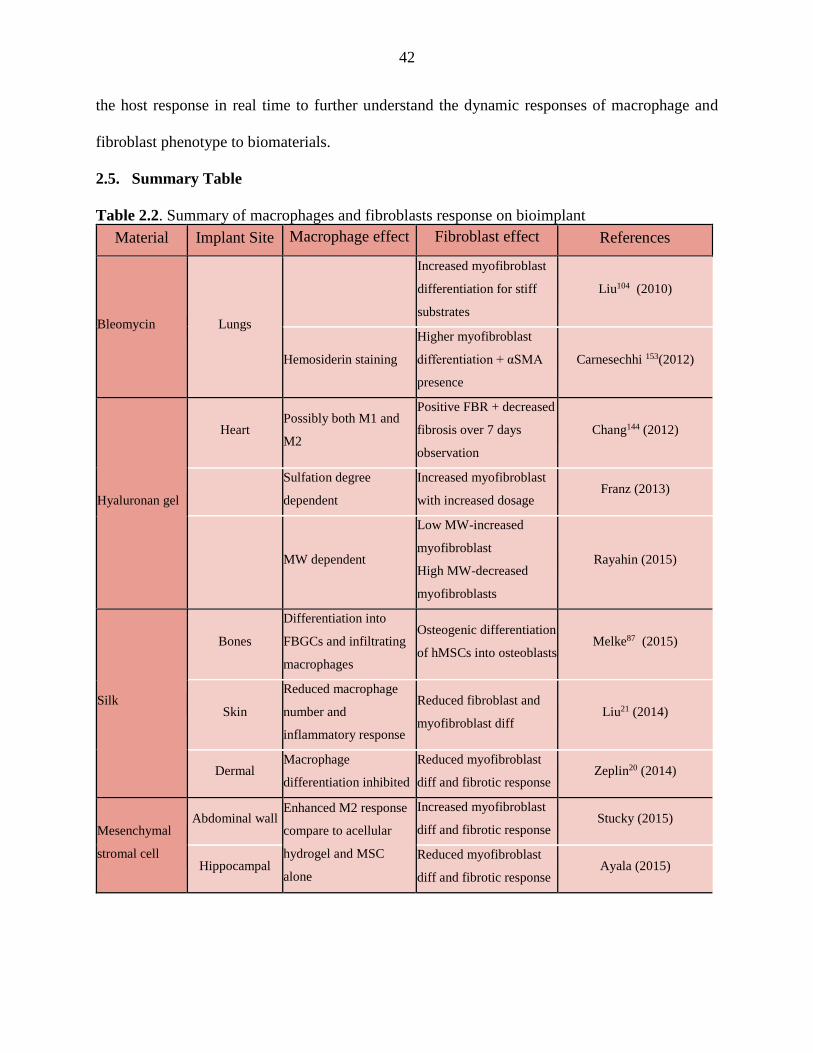
42
the host response in real time to further understand the dynamic responses of macrophage and
fibroblast phenotype to biomaterials.
2.5. Summary Table
Table 2.2. Summary of macrophages and fibroblasts response on bioimplant
Material Implant Site Macrophage effect Fibroblast effect References
Bleomycin Lungs
Increased myofibroblast
differentiation for stiff
substrates
Liu104 (2010)
Hemosiderin staining
Higher myofibroblast
differentiation + αSMA
presence
Carnesechhi 153(2012)
Hyaluronan gel
Heart Possibly both M1 and
M2
Positive FBR + decreased
fibrosis over 7 days
observation
Chang144 (2012)
Sulfation degree
dependent
Increased myofibroblast
with increased dosage Franz (2013)
MW dependent
Low MW-increased
myofibroblast
High MW-decreased
myofibroblasts
Rayahin (2015)
Silk
Bones
Differentiation into
FBGCs and infiltrating
macrophages
Osteogenic differentiation
of hMSCs into osteoblasts Melke87 (2015)
Skin
Reduced macrophage
number and
inflammatory response
Reduced fibroblast and
myofibroblast diff Liu21 (2014)
Dermal Macrophage
differentiation inhibited
Reduced myofibroblast
diff and fibrotic response Zeplin20 (2014)
Mesenchymal
stromal cell
Abdominal wall Enhanced M2 response
compare to acellular
hydrogel and MSC
alone
Increased myofibroblast
diff and fibrotic response Stucky (2015)
Hippocampal Reduced myofibroblast
diff and fibrotic response Ayala (2015)
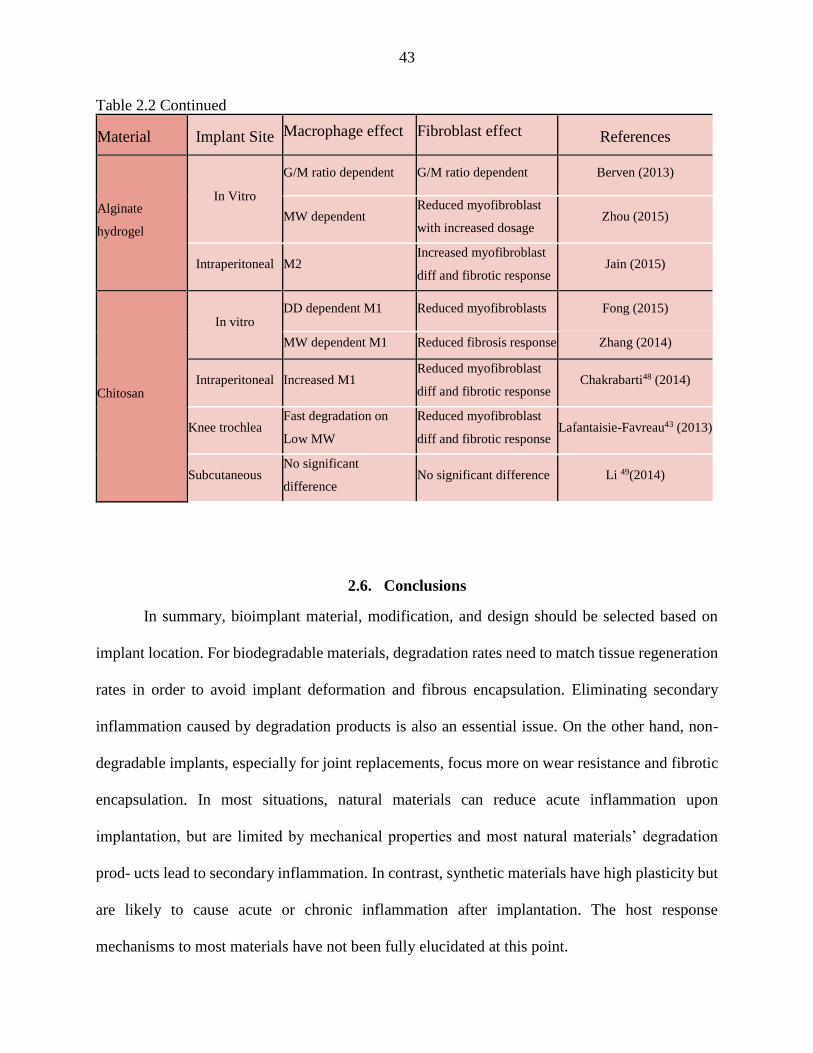
43
Table 2.2 Continued
Material Implant Site Macrophage effect Fibroblast effect References
Alginate
hydrogel
In Vitro
G/M ratio dependent G/M ratio dependent Berven (2013)
MW dependent Reduced myofibroblast
with increased dosage Zhou (2015)
Intraperitoneal M2 Increased myofibroblast
diff and fibrotic response Jain (2015)
Chitosan
In vitro DD dependent M1 Reduced myofibroblasts Fong (2015)
MW dependent M1 Reduced fibrosis response Zhang (2014)
Intraperitoneal Increased M1 Reduced myofibroblast
diff and fibrotic response Chakrabarti48 (2014)
Knee trochlea Fast degradation on
Low MW
Reduced myofibroblast
diff and fibrotic response Lafantaisie-Favreau43 (2013)
Subcutaneous No significant
difference No significant difference Li 49(2014)
2.6. Conclusions
In summary, bioimplant material, modification, and design should be selected based on
implant location. For biodegradable materials, degradation rates need to match tissue regeneration
rates in order to avoid implant deformation and fibrous encapsulation. Eliminating secondary
inflammation caused by degradation products is also an essential issue. On the other hand, non-
degradable implants, especially for joint replacements, focus more on wear resistance and fibrotic
encapsulation. In most situations, natural materials can reduce acute inflammation upon
implantation, but are limited by mechanical properties and most natural materials’ degradation
prod- ucts lead to secondary inflammation. In contrast, synthetic materials have high plasticity but
are likely to cause acute or chronic inflammation after implantation. The host response
mechanisms to most materials have not been fully elucidated at this point.
44
Several challenges remain for developing biomaterials with the appropriate host response
for lungs, heart, liver, skin, and musculoskeletal implants. Depending on the natural mechanical
properties of organ systems, the design principles differ greatly. For example, stiff substrates elicit
an appropriate remodeling response for bone implants, while softer substrates incite an anti-
inflammatory response from macrophages and fibroblasts participating at the site of the implant.
Furthermore, by understanding the effect of certain geometric cues affecting macrophages
phagocytosis and stress sensing mechanisms in fibroblasts, more considerations were listed. On
the basis of all these cues, the design principles can be applied to tailor the host response in these
organs based also on the nature of the system they are exposed to, namely for regeneration
strategies.
On reviewing the research conducted on the role played by both these cell types, there is a
need for concurrent studies in order to better understand the host response and evaluate the factors
that polarize cells. With the focus in biomedical sciences shifting towards non-invasive techniques
of observation, there is a strong case for popularizing non-linear optics and/or multi- modal
imaging to elucidate the subtle changes in behavior of the cells that are present as a part of the
FBR. Though there has been some research conducted on the timeline of such responses such as
Langer and coworkers,40,89,139, 180-182 and Bratlie and coworkers,183 the common factor lacking
across many such studies has been the application of techniques for efficient internal imaging.
Non-linear optics have shown themselves as a useful tool to have in many such systems. Through
the application of second harmonic generation microscopy combined with other bio- chemical
imaging techniques such as two photon electron fluorescence microscopy,169 it has been shown
that we can identify the progression of innate response in deep tissues. 184, 185 Over the course of
the next decade, these methods may improve in terms of spatial and temporal resolution such that
45
real-time observations of macrophages, fibroblasts, and myofibroblasts become more
commonplace.
Acknowledgments
This review was co-authored by Lida Zhu and I. We co-wrote the Introduction and
Conclusion sections. Lida Zhu wrote the majority of the Materials Selection sections and designed
the summary figure.
2.7. References
[1] E. S. Place, N. D. Evans, M. M. Stevens, Nat. Mater. 2009, 8, 457.
[2] N. M. Vacanti, H. Cheng, P. S. Hill, J. D. T. Guerreiro, T. T. Dang, M. Ma, S. Watson, N. S.
Hwang, R. Langer, D. G. Anderson, Bio- macromolecules 2012, 13, 3031.
[3] A. J. Rao, C. Nich, L. S. Dhulipala, E. Gibon, R. Valladares, S. Zwingenberger, R. L. Smith,
S. B. Goodman, J. Biomed. Mater. Res. - Part A 2013, 101 A, 1926.
[4] H. C. Bygd, K. D. Forsmark, K. M. Bratlie, Clin. Transl. Med. 2014, 3.
[5] D. F. Williams, Biomaterials 2008, 29, 2941. [6] A. Mantovani, S. K. Biswas, M. R.
Galdiero, A. Sica, M. Locati, J. Pathol. 2013, 229, 176.
[7] P. J. Murray, J. E. Allen, S. K. Biswas, E. A. Fisher, D. W. Gilroy, S. Goerdt, S. Gordon, J.
A. Hamilton, L. B. Ivashkiv, T. Lawrence, M. Locati, A. Mantovani, F. O. Martinez, J.-L.
Mege, D. M. Mosser, G. Natoli, J. P. Saeij, J. L. Schultze, K. A. Shirey, A. Sica, J. Suttles,
I. Udalova, J. A. van Ginderachter, S. N. Vogel, T. A. Wynn, Immu- nity 2014, 41, 14.
[8] D. M. Mosser, J. P. Edwards, Nat. Rev. Immunol. 2008, 8, 958. [9] N. B. Hao, M. H. Lü, Y.
H. Fan, Y. L. Cao, Z. R. Zhang, S. M. Yang, Clin. Dev. Immunol. 2012, 2012, 948098.
[10] S. J. Galli, N. Borregaard, T. A. Wynn, Nat Immunol 2011, 12, 1035.
[11] G. S. A. Boersema, N. Grotenhuis, Y. Bayon, J. F. Lange, Y. M. Bastiaansen-Jenniskens,
Biores. Open Access 2016, 5, 6.
[12] T. a. Wynn, A. Chawla, J. W. Pollard, Nature 2013, 496, 445. [13] P. J. Murray, T. a. Wynn,
Nat. Rev. Immunol. 2011, 11, 723. [14] B. Hinz, S. H. Phan, V. J. Thannickal, M.
Prunotto, A. Desmoulière, J. Varga, O. De Wever, M. Mareel, G. Gabbiani, Am. J. Pathol.
2012, 180, 1340.
[15] M. Otranto, V. Sarrazy, F. Bonte, B. Hinz, G. Gabbiani, A. Desmouliere, F. Bonté, B. Hinz,
G. Gabbiani, A. Desmouliere, Cell Adhes. Migr. 2012, 6, 203.

46
[16] B. Hinz, S. H. Phan, V. J. Thannickal, A. Galli, M.-L. Bochaton-Pia llat, G. Gabbiani, Am.
J. Pathol. 2007, 170, 1807.
[17] J. J. M. Anderson, Annu. Rev. Mater. Res. 2001, 31, 81. [18] M. T. Wolf, C. L. Dearth, C.
A. Ranallo, S. T. LoPresti, L. E. Carey, K. A. Daly, B. N. Brown, S. F. Badylak,
Biomaterials 2014, 35, 6838.
[19] T. A. Wynn, L. Barron, Semin. Liver Dis. 2011, 30, 245.
[20] L. Barron, T. a. Wynn, Am. J. Physiol. Gastrointest. Liver Physiol. 2011, 300, G723.
[21] G. Zhou, M. S. Niepel, S. Saretia, T. Groth, J. Biomed. Mater. Res. - Part A 2015, 493.
[22] D. Akilbekova, K. M. Bratlie, PLoS One 2015, 10, e0130386.
[23] B. Rolfe, J. Mooney, B. Zhang, S. Jahnke, S. Jane Le, Y.-Q. Chau, Q. Huang, H. Wang, G.
Campbell, J. Campbell, Regenera- tive Medicine and Tissue Engineering - Cells and
Biomaterials (Ed.: D. Eberli), InTech, Croatia 2011, Ch. 23, DOI: 10.5772/21790.
[24] M. F. Maitz, Biosurface and Biotribology 2015, 1, 161.
[25] C. L. R. Belmiro, R. G. Gonçalves, E. O. Kozlowski, A. F. Werneck, C. M. Takyia, M.
Leite-Jr., M. S. G. Pavão, Brazilian J. Med. Biol. Res. 2011, 44, 624.
[26] P. H. Zeplin, N. C. Maksimovikj, M. C. Jordan, J. Nickel, G. Lang, A. H. Leimer, L. Römer,
T. Scheibel, Adv. Funct. Mater. 2014, 24, 2658.
[27] H. Liu, S. G. Wise, J. Rnjak-Kovacina, D. L. Kaplan, M. M. M. Bilek, A. S. Weiss, J. Fei,
S. Bao, Biomaterials 2014, 35, 5138.
[28] R. Tejero, E. Anitua, G. Orive, Prog. Polym. Sci. 2014, 39, 1406. [29] S. Y. Seo, G. H. Lee,
S. G. Lee, S. Y. Jung, J. O. Lim, J. H. Choi, Car- bohydr. Polym. 2012, 90, 109.
[30] L. Berven, R. Solberg, H. H. T. Truong, Ø. Arlov, F. Lillelund Aachmann, G. Skjåk-Bræk,
W. M. Egge-Jacobsen, H. Thidemann Johansen, A. B. C. Samuelsen, Bioact.
Carbohydrates Diet. Fibre 2013, 2, 30.
[31] R. Zhou, X. Shi, Y. Gao, N. Cai, Z. Jiang, X. Xu, 2015. [32] X. Xu, X. Wu, Q. Wang, N.
Cai, H. Zhang, Z. Jiang, M. Wan, T. Oda, J. Agric. Food Chem. 2014, 62, 3168.
[33] N. C. Hunt, A. M. Smith, U. Gbureck, R. M. Shelton, L. M. Grover, Acta Biomater. 2010,
6, 3649.
[34] J. L. Drury, R. G. Dennis, D. J. Mooney, Biomaterials 2004, 25, 3187. [35] B. J. Spargo, A.
S. Rudolph, F. M. Rollwagen, Biomaterials 1994, 15, 853.
[36] I. Constantinidis, I. Rask, R. C. Long, A. Sambanis, R. C. Long Jr., R. C. L. Jr.,
Biomaterials 1999, 20, 2019.
[37] M. Otterlei, K. Ostgaard,
G. Skjåk-Braek, O. Smidsrød, P. Soon-Shiong, T. Espevik, J. Immunother. (1991). 1991, 10,
286.
47
[38] G. Klöck, A. Pfeffermann, C. Ryser, P. Gröhn, B. Kuttler, H. J. Hahn, U. Zimmermann,
Biomaterials 1997, 18, 707.
[39] M. Tanihara, Y. Suzuki, E. Yamamoto, A. Noguchi, Y. Mizushima, J. Biomed. Mater. Res.
2001, 56, 216.
[40] A. J. Vegas, O. Veiseh, J. C. Doloff, M. Ma, H. H. Tam, K. Bratlie, J. Li, A. R. Bader, E.
Langan, K. Olejnik, P. Fenton, J. W. Kang, J. Hollister-Locke, M. A. Bochenek, A. Chiu,
S. Siebert, K. Tang, S. Jhunjhunwala, S. Aresta-Dasilva, N. Dholakia, R. Thakrar, T.
Vietti, M. Chen, J. Cohen, K. Siniakowicz, M. Qi, J. McGarrigle, S. Lyle, D. M. Harlan,
D. L. Greiner, J. Oberholzer, G. C. Weir, R. Langer, D. G. Anderson, Nat. Biotechnol.
2016, 34, 345.
[41] D. Fong, M. B. Ariganello, J. Girard-Lauziere, C. D. Hoemann, Acta Biomater. 2015, 12,
183.
[42] T. Mori, M. Murakami, M. Okumura, T. Kadosawa, T. Uede, T. Fujinaga, J. Vet. Med. Sci.
2005, 67, 51.
[43] M. I. Oliveira, S. G. Santos, M. J. Oliveira, A. L. Torres, M. A. Barbosa, Eur. Cells Mater.
2012, 24, 136.
[44] Y. Gu, W. Zhang, H. Wang, W. Y. Lee, Colloids Surfaces B Biointer- faces 2014, 117, 42.
[45] Z.-S. Wen, L.-J. Liu, Y.-L. Qu, X.-K. Ouyang, L.-Y. Yang, Z.-R. Xu, Mar. Drugs 2013, 11,
3582.
[46] D. Silva, R. Arancibia, C. Tapia, C. Acuña-Rougier, M. Diaz-Dosque, M. Cáceres, J.
Martínez, P. C. Smith, J. Periodontal Res. 2013, 48, 677.
[47] H. Ueno, F. Nakamura, M. Murakami, M. Okumura, T. Kadosawa, T. Fujinaga,
Biomaterials 2001, 22, 2125.
[48] M. S. Benhabiles, R. Salah, H. Lounici, N. Drouiche, M. F. A. Goosen, N. Mameri, Food
Hydrocoll. 2012, 29, 48
[49] A. B. Vishu Kumar, M. C. Varadaraj, L. R. Gowda, R. N. Tharanathan, Biochem. J. 2005,
391, 167.
[50] D. P. Vasconcelos, A. C. Fonseca, M. Costa, I. F. Amaral, M. a. Barbosa, A. P. Águas, J. N.
Barbosa, Biomaterials 2013, 34, 9952.
[51] C. L. Bueter, C. K. Lee, J. P. Wang, G. R. Ostroff, C. a. Specht, S. M. Levitz, J. Immunol.
2014, 192, 5943
[52] G. I. Howling, P. W. Dettmar, P. A. Goddard, F. C. Hampson, M. Dornish, E. J. Wood,
Biomaterials 2001, 22, 2959.
[53] Y. Okamoto, A. Inoue, K. Miyatake, K. Ogihara, Y. Shigemasa, S. Minami, Macromol.
Biosci. 2003, 3, 587.
[54] T. C. Chou, E. Fu, E. C. Shen, Biochem. Biophys. Res. Commun. 2003, 308, 403.

48
[55] P. Zhang, W. Liu, Y. Peng, B. Han, Y. Yang, Int. Immunopharmacol. 2014, 23, 254.
[56] G. J. Wu, C. H. Wu, G. J. Tsai, J. Funct. Foods 2015, 12, 70. [57] Y. Lu, A. Shah, R. A.
Hunter, R. J. Soto, M. H. Schoenfisch, Acta Biomater. 2015, 12, 62.
[58] N. Yang, W. H. Li, Mater. Lett. 2015, 138, 154. [59] C.-H. Lafantaisie-Favreau, J. Guzmán-
Morales, J. Sun, G. Chen, A. Harris, T. D. Smith, A. Carli, J. Henderson, W. D. Stanish, C. D.
Hoemann, BMC Musculoskelet. Disord. 2013, 14, 27.
[60] C. Ji, A. Khademhosseini, F. Dehghani, Biomaterials 2011, 32, 9719. [61] R. M. Gonçalves,
A. C. L. Pereira, I. O. Pereira, M. J. Oliveira, M. A. Barbosa, J. Mater. Sci. Mater. Med. 2015,
26, 5496.
[62] A. Chakrabarti, D. Talukdar, A. Pal, M. Ray, Cell. Immunol. 2014, 287, 27.
[63] H. Li, A. M. Koenig, P. Sloan, N. D. Leipzig, Biomaterials 2014, 35, 9049.
[64] L. F. Baeva, D. B. Lyle, M. Rios, J. J. Langone, M. M. Lightfoote, J. Biomed. Mater. Res. A
2014, 102, 305.
[65] R. Stern, Eur. J. Cell Biol. 2004, 83, 317. [66] A. Fakhari, C. Berkland, Acta Biomater.
2013, 9, 7081. [67] J. M. Delmage, D. R. Powars, P. K. Jaynes, S. E. Allerton, Ann. Clin. Lab.
Sci. 1986, 16, 303.
[68] P. W. Noble, Matrix Biol. 2002, 21, 25. [69] J. E. Rayahin, J. S. Buhrman, Y. Zhang, T. J.
Koh, R. a. Gemeinhart, ACS Biomater. Sci. Eng. 2015, 1, 481.
[70] R. D. Price, M. G. Berry, H. A. Navsaria, J. Plast. Reconstr. Aesthet. Surg. 2007, 60, 1110.
[71] M. a. Croce, K. Dyne, F. Boraldi, D. Quaglino, G. Cetta, R. Tiozzo, I. Pasquali Ronchetti,
Tissue Cell 2001, 33, 326.
[72] M. Y. Chang, Y. Tanino, V. Vidova, M. G. Kinsella, C. K. Chan, P. Y. Johnson, T. N.
Wight, C. W. Frevert, Matrix Biol. 2014, 35, 162.
[73] C. M. McKee, M. B. Penno, M. Cowman, M. D. Burdick, R. M. Strieter, C. Bao, P. W.
Noble, J. Clin. Invest. 1996, 98, 2403.
[74] B. Ruffell, G. F. T. Poon, S. S. M. Lee, K. L. Brown, S. L. Tjew, J. Cooper, P. Johnson, J.
Biol. Chem. 2011, 286, 19179.
[75] S. Franz, F. Allenstein, J. Kajahn, I. Forstreuter, V. Hintze, S. Möller, J. C. Simon, Acta
Biomater. 2013, 9, 5621.
[76] J. Kajahn, S. Franz, E. Rueckert, I. Forstreuter, V. Hintze, S. Moeller, J. C. Simon,
Biomatter 2012, 2, 226.
[77] A. van der Smissen, V. Hintze, D. Scharnweber, S. Moeller, M. Schnabelrauch, A. Majok, J.
C. Simon, U. Anderegg, Biomate- rials 2011, 32, 8938.
[78] P. A. Gunatillake, R. Adhikari, N. Gadegaard, Eur. Cells Mater. 2003, 5, 1.
49
[79] A. R. Nectow, K. G. Marra, D. L. Kaplan, Tissue Eng. Part B Rev. 2012, 18, 40.
[80] C. A. Sundback, J. Y. Shyu, Y. Wang, W. C. Faquin, R. S. Langer, J. P. Vacanti, T. A.
Hadlock, Biomaterials 2005, 26, 5454.
[81] Y. Wang, Y. M. Kim, R. Langer, J. Biomed. Mater. Res. A 2003, 66, 192. [82] R. A. Allen,
W. Wu, M. Yao, D. Dutta, X. Duan, T. N. Bachman, H. C. Champion, D. B. Stolz, A. M.
Robertson, K. Kim, J. S. Isenberg, Y. Wang, Biomaterials 2014, 35, 165.
www.MaterialsViews.com
[83] D. Li, G. Guo, R. Fan, J. Liang, X. Deng, F. Luo, Z. Qian, Int. J. Pharm. 2013, 441, 365.
[84] T. M. Filion, J. Xu, M. L. Prasad, J. Song, Biomaterials 2011, 32, 985. [85] H. Il Kim, K.
Ishihara, S. Lee, J. H. Seo, H. Y. Kim, D. Suh, M. U. Kim, T. Konno, M. Takai, J. S. Seo,
Biomaterials 2011, 32, 2241.
[86] J. Zhou, Y. T. Tsai, H. Weng, L. Tang, Free Radic. Biol. Med. 2012, 52, 218.
[87] P. S. C. Sacchetin, R. F. Setti, P. D. T. V. E. Rosa, Â. M. Moraes, Mater. Sci. Eng. C 2016,
58, 870.
[88] Y. Lee, J. Kwon, G. Khang, D. Lee, Tissue Eng. Part A 2012, 18, 1967. [89] T. T. Dang, K.
M. Bratlie, S. R. Bogatyrev, X. Y. Chen, R. Langer, D. G. Anderson, Biomaterials 2011, 32,
4464.
[90] W. Ji, F. Yang, H. Seyednejad, Z. Chen, W. E. Hennink, J. M. Anderson, J. J. J. P. van den
Beucken, J. A. Jansen, Biomate- rials 2012, 33, 6604.
[91] H. Liao, X. F. Walboomers, W. J. E. M. Habraken, Z. Zhang, Y. Li, D. W. Grijpma, A. G.
Mikos, J. G. C. Wolke, J. A. Jansen, Acta Bio- mater. 2011, 7, 1752.
[92] R. P. Felix Lanao, S. C. G. Leeuwenburgh, J. G. C. Wolke, J. A. Jansen, Biomaterials 2011,
32, 8839.
[93] R. P. Felix Lanao, S. C. G. Leeuwenburgh, J. G. C. Wolke, J. A. Jansen, Acta Biomater.
2011, 7, 3459.
[94] J. W. M. Hoekstra, J. Ma, A. S. Plachokova, E. M. Bronkhorst, M. Bohner, J. Pan, G. J.
Meijer, J. A. Jansen, J. J. J. P. Van Den Beucken, Acta Biomater. 2013, 9, 7518.
[95] J. Kang, S. P. Schwendeman, Biomaterials 2002, 23, 239. [96] G. Zhu, S. R. Mallery, S. P.
Schwendeman, Nat. Biotechnol. 2000, 18, 52.
[97] A. Dalal, V. Pawar, K. McAllister, C. Weaver, N. J. Hallab, J. Biomed. Mater. Res. - Part A
2012, 100 A, 2147.
[98] S. Hamlet, M. Alfarsi, R. George, S. Ivanovski, Clin. Oral Implants Res. 2012, 23, 584.
[99] M. A. Alfarsi, S. M. Hamlet, S. Ivanovski, J. Biomed. Mater. Res. - Part A 2014, 102, 60.

50
[100] S. Lee, J. Choi, S. Shin, Y. M. Im, J. Song, S. S. Kang, T. H. Nam, T. J. Webster, S. H.
Kim, D. Khang, Acta Biomater. 2011, 7, 2337.
[101] C.-H. Lee, Y.-J. Kim, J.-H. Jang, J.-W. Park, Nanotechnology 2016, 27, 085101.
[102] A. J. Krych, F. Wanivenhaus, K. W. Ng, S. Doty, R. F. Warren, S. A. Maher, J. Mater. Sci.
Mater. Med. 2013, 24, 2429.
[103] C. Gong, X. Wei, X. Wang, Y. Wang, G. Guo, Y. Mao, F. Luo, Z. Qian, Nanotechnology
2010, 21, 215103.
[104] Y. (Chezy) Barenholz, J. Control. Release 2012, 160, 117.
[105] I. C. Saldarriaga Fernandez, J. F. da Silva Domingues, T. G. van Kooten, S. Metzger, D.
W. Grainger, H. J. Busscher, H. C. van der Mei, Eur. Cells Mater. 2011, 21, 73.
[106] S. Roman, I. Urbánková, G. Callewaert, F. Lesage, C. Hillary, N. I. Osman, C. R. Chapple,
J. Deprest, S. MacNeil, J. Urol. 2016, 196, 261.
[107] D. P. Poppas, J. J. Sung, C. M. Magro, J. Chen, J. P. Toyohara, B. J. Ramshaw, D. Felsen,
Hernia 2016, 20, 623.
[108] D. Weyhe, P. Hoffmann, O. Belyaev, K. Mros, C. Muller, W. Uhl, F. Schmitz, Regul.
Pept. 2007, 138, 10.
[109] M. L. Konstantinovic, E. Pille, M. Malinowska, E. Verbeken, D. Ridder, J. Deprest, Int.
Urogynecol. J. Pelvic Floor Dysfunct. 2007, 18, 619.
[110] E. M. Greenfield, M. a. Beidelschies, J. M. Tatro, V. M. Goldberg, A. G. Hise, J. Biol.
Chem. 2010, 285, 32378.
[111] E. Jacobi-Gresser, K. Huesker, S. Schutt, Int. J. Oral Maxillofac. Surg. 2013, 42, 537.
[112] E. M. Engelhardt, L. A. Micol, S. Houis, F. M. Wurm, J. Hilborn, J. A. Hubbell, P. Frey,
Biomaterials 2011, 32, 3969.
[113] J. Melke, S. Midha, S. Ghosh, K. Ito, S. Hofmann, Acta Biomater. 2015, 31, 2015.09.005.
[114] A. E. Thurber, F. G. Omenetto, D. L. Kaplan, Biomaterials 2015, 71, 145
115] D. Naskar, S. Nayak, T. Dey, S. C. Kundu, Sci. Rep. 2014, 4, 4745.
[116] B. Kundu, N. E. Kurland, S. Bano, C. Patra, F. B. Engel, V. K. Yadavalli, S. C. Kundu,
Prog. Polym. Sci. 2014, 39, 251.
[117] J. R. Mauney, G. M. Cannon, M. L. Lovett, E. M. Gong, D. Di Vizio, P. Gomez, D. L.
Kaplan, R. M. Adam, C. R. Estrada, Biomaterials 2011, 32, 808.
[118] A. P. Cardoso, R. M. Gonçalves, J. C. Antunes, M. L. Pinto, A. T. Pinto, F. Castro, C.
Monteiro, M. A. Barbosa, M. J. Oliveira, Acta Biomater. 2015, 23, 157.
51
[119] D. An, Y. Ji, A. Chiu, Y. C. Lu, W. Song, L. Zhai, L. Qi, D. Luo, M. Ma, Biomaterials
2015, 37, 40.
[120] P. De Vos, B. De Haan, R. Van Schilfgaarde, Biomaterials 1997, 18, 273.
[121] P. de Vos, M. Spasojevic, B. J. de Haan, M. M. Faas, Biomaterials 2012, 33, 5552.
[122] T. J. Keane, I. T. Swinehart, S. F. Badylak, Methods 2015, 84, 25.
[123] B. N. Brown, R. Londono, S. Tottey, L. Zhang, K. a. Kukla, M. T. Wolf, K. a. Daly, J. E.
Reing, S. F. Badylak, Acta Biomater. 2012, 8, 978.
[124] K. E. M. Benders, P. R. van Weeren, S. F. Badylak, D. B. F. Saris, W. J. A. Dhert, J.
Malda, Trends Biotechnol. 2013, 31, 169.
[125] Y. Hong, A. Huber, K. Takanari, N. J. Amoroso, R. Hashizume, S. F. Badylak, W. R.
Wagner, Biomaterials 2011, 32, 3387.
[126] T. J. Keane, R. Londono, N. J. Turner, S. F. Badylak, Biomaterials 2012, 33, 1771.
[127] American Thoracic Society, International Multidisciplinary Consensus Classification of
the Idiopathic Interstitial Pneumonias 2002.
[128] G. Raghu, H. R. Collard, J. J. Egan, F. J. Martinez, J. Behr, K. K. Brown, T. V. Colby, J. F.
Cordier, K. R. Flaherty, J. A. Lasky, D. A. Lynch, J. H. Ryu, J. J. Swigris, A. U. Wells, J.
Ancochea, D. Bouros, C. Carvalho, U. Costabel, M. Ebina, D. M. Hansell, T. Johkoh, D. S. Kim,
T. E. King, Y. Kondoh, J. Myers, N. L. Müller, A. G. Nicholson, L. Richeldi, M. Selman, R. F.
Dudden, B. S. Griss, S. L. Protzko, H. J. Schünemann, Am. J. Respir. Crit. Care Med. 2011, 183,
788.
[129] F. Liu, J. D. Mih, B. S. Shea, A. T. Kho, A. S. Sharif, A. M. Tager, D. J. Tschumperlin, J.
Cell Biol. 2010, 190, 693.
[130] A. J. Booth, R. Hadley, A. M. Cornett, A. A. Dreffs, S. A. Matthes, J. L. Tsui, K. Weiss, J.
C. Horowitz, V. F. Fiore, T. H. Barker, B. B. Moore, F. J. Martinez, L. E. Niklason, E. S. White,
Am. J. Respir. Crit. Care Med. 2012, 186, 866.
[131] Y. Chandorkar, N. Bhaskar, G. Madras, B. Basu, Biomacromolecules 2015, 16, 636.
[132] J. A. Burdick, K. S. Anseth, Biomaterials 2002, 23, 4315. [133] H. Wang, M. W. Tibbitt,
S. J. Langer, L. a. Leinwand, K. S. Anseth, Proc. Natl. Acad. Sci. USA 2013, 110, 19336.
[134] M. W. Tibbitt, K. S. Anseth, Biotechnol. Bioeng. 2009, 103, 655. [135] J. L. Leight, W. F.
Liu, R. R. Chaturvedi, S. Chen, M. T. Yang, S. Raghavan, C. S. Chen, Cell. Mol. Bioeng. 2012,
5, 299.
[136] J. A. Champion, S. Mitragotri, Pharm. Res. 2009, 26, 244. [137] M. T. Wolf, C. L. Dearth,
S. B. Sonnenberg, E. G. Loboa, S. F. Badylak, Adv. Drug Deliv. Rev. 2015, 84, 208.
52
[138] J. Kim, W. A. Li, Y. Choi, S. A. Lewin, C. S. Verbeke, G. Dranoff, D. J. Mooney, Nat.
Biotechnol. 2015, 33, 64.
[139] O. Veiseh, J. C. Doloff, M. Ma, A. J. Vegas, H. H. Tam, A. R. Bader, J. Li, E. Langan, J.
Wyckoff, W. S. Loo, S. Jhunjhunwala, A. Chiu, S. Siebert, K. Tang, J. Hollister-Lock, S. Aresta-
Dasilva, M. Bochenek, J. Mendoza-Elias, Y. Wang, M. Qi, D. M. Lavin, M. Chen, N. Dholakia,
R. Thakrar, I. Lacík, G. C. Weir, J. Oberholzer, D. L. Greiner, R. Langer, D. G. Anderson, Nat.
Mater. 2015, 14, 643.
[140] E. M. Sussman, M. C. Halpin, J. Muster, R. T. Moon, B. D. Ratner, Ann. Biomed. Eng.
2014, 42, 1508.
[141] M. C. Phipps, W. C. Clem, J. M. Grunda, G. A. Clines, S. L. Bellis, Biomaterials 2012, 33,
524.
[142] W. F. Liu, Cardiovasc. Res. 2012, 95, 215.
[143] T. U. Luu, S. C. Gott, B. W. K. Woo, M. P. Rao, W. F. Liu, ACS Appl. Mater. Interfaces
2015, 7, 28665.
[144] S. Dupont, L. Morsut, M. Aragona, E. Enzo, S. Giulitti, M. Cordenonsi, F. Zanconato, J.
Le Digabel, M. Forcato, S. Bicciato, N. Elvassore, S. Piccolo, Nature 2011, 474, 179.
[145] F. Calvo, N. Ege, A. Grande-Garcia, S. Hooper, R. P. Jenkins, S. I. Chaudhry, K.
Harrington, P. Williamson, E. Moeendarbary, G. Charras, E. Sahai, Nat. Cell Biol 2013, 15, 637.
[146] V. W. Wong, K. C. Rustad, S. Akaishi, M. Sorkin, J. P. Glotzbach, M. Januszyk, E. R.
Nelson, K. Levi, J. Paterno, I. N. Vial, A. a. Kuang, M. T. Longaker, G. C. Gurtner, Nat. Med.
2011, 18, 148.
[147] H. Wang, S. M. Haeger, A. M. Kloxin, L. A. Leinwand, K. S. Anseth, PLoS One 2012, 7,
e39969.
[148] K. Sadtler, K. Estrellas, B. W. Allen, M. T. Wolf, H. Fan, A. J. Tam, C. H. Patel, B. S.
Luber, H. Wang, K. R. Wagner, J. D. Powell, F. Housseau, D. M. Pardoll, J. H. Elisseeff,
Biomaterials 2016, 352, 366.
[149] C. L. Dearth, P. F. Slivka, S. A. Stewart, T. J. Keane, J. K. Tay,
R. Londono, Q. Goh, F. X. Pizza, S. F. Badylak, Acta Biomater. 2015, 31, 50.
[150] C. Yang, M. W. Tibbitt, L. Basta, K. S. Anseth, Nat. Mater. 2014, 13, 645.
[151] C. M. Kirschner, K. S. Anseth, Acta Mater. 2013, 61, 931. [152] A. M. Kloxin, A. M.
Kasko, C. N. Salinas, K. S. Anseth, Science 2009, 324, 59.
[153] S. A. Park, S. H. Lee, W. D. Kim, Bioprocess Biosyst. Eng. 2011, 34, 505.
[154] L. Vi, G. S. Baht, H. Whetstone, A. Ng, Q. Wei, R. Poon, S. Mylvaganam, M. Grynpas, B.
A. Alman, J. Bone Miner. Res. 2015, 30, 1090.

53
[155] B. DUAN, L. A. Hockaday, S. Das, C. Y. Xu, J. T. Butcher, Tissue Eng. Part C Methods
2015, 21, 150127064141008.
[156] L. Bao, L. He, J. Chen, Z. Wu, J. Liao, L. Rao, J. Ren, H. Li, H. Zhu, L. Qian, Y. Gu, H.
Dai, X. Xu, J. Zhou, W. Wang, C. Cui, L. Xiao, Nat. Publ. Gr. 2011, 21, 600.
[157] F. Yang, C. G. Williams, D. A. Wang, H. Lee, P. N. Manson, J. Elisseeff, Biomaterials
2005, 26, 5991.
[158] B. T. Corona, X. Wu, C. L. Ward, J. S. McDaniel, C. R. Rathbone, T. J. Walters,
Biomaterials 2013, 34, 3324.
[159] M. T. Wolf, K. A. Daly, J. E. Reing, S. F. Badylak, Biomaterials 2012, 33, 2916.
[160] Y. M. Ju, A. Atala, J. J. Yoo, S. J. Lee, Acta Biomater. 2014, 10, 4332.
[161] M. Fahrenholtz, H. Liu, D. Kearney, L. Wadhwa, C. Fraser, K. Grande-Allen, J.
Cardiovasc. Dev. Dis. 2014, 1, 146.
[162] A. Wessels, M. J. B. van den Hoff, R. F. Adamo, A. L. Phelps, M. M. Lockhart, K. Sauls,
L. E. Briggs, R. A. Norris, B. van Wijk, J. M. Perez-Pomares, R. W. Dettman, J. B. E. Burch,
Dev. Biol. 2012, 366, 111.
[163] C. Y. Chang, A. T. Chan, P. A. Armstrong, H. C. Luo, T. Higuchi, I. A. Strehin, S.
Vakrou, X. Lin, S. N. Brown, B. O’Rourke,
T. P. Abraham, R. L. Wahl, C. J. Steenbergen, J. H. Elisseeff, M. R. Abraham, Biomaterials
2012, 33, 8026.
[164] L. Qian, Y. Huang, C. I. Spencer, A. Foley, V. Vedantham, L. Liu, S. J. Conway, J.-D. Fu,
D. Srivastava, Nature 2012, 485, 593.
[165] Q. Peng, S. Zhuo, P. T. C. So, H. Yu, Appl. Phys. Lett. 2015, 106, 083701.
[166] K. R. Karlmark, R. Weiskirchen, H. W. Zimmermann, N. Gassler, F. Ginhoux, C. Weber,
M. Merad, T. Luedde, C. Trautwein, F. Tacke, Hepatology 2009, 50, 261.
[167] J. S. Duffield, S. J. Forbes, C. M. Constandinou, S. Clay, M. Partolina, S. Vuthoori, S. Wu,
R. Lang, J. P. Iredale, J. Clin. Invest. 2005, 115, 56.
[168] J. T. Pesce, T. R. Ramalingam, M. M. Mentink-Kane, M. S. Wilson, K. C. El Kasmi, A.
M. Smith, R. W. Thompson, A. W. Cheever, P. J. Murray, T. a. Wynn, PLoS Pathog. 2009, 5,
e1000371.
[169] L. Gailhouste, Y. Le Grand, C. Odin, D. Guyader, B. Turlin, F. Ezan, Y. Désille, T.
Guilbert, A. Bessard, C. Frémin, N. Theret, G. Baffet, Y. Le Grand, J. Hepatol. 2010, 52, 398.
[170] G. C. Gurtner, S. Werner, Y. Barrandon, M. T. Longaker, Nature 2008, 453, 314.
[171] B. M. Delavary, W. M. van der Veer, M. van Egmond, F. B. Niessen, R. H. J. Beelen,
Immunobiology 2011, 216, 753.

54
[172] R. Kalluri, E. G. Neilson, J. Clin. Invest. 2003, 112, 1776.
[173] R. a. Underwood, M. L. Usui, G. Zhao, K. D. Hauch, M. M. Takeno, B. D. Ratner, A. J.
Marshall, X. Shi, J. E. Olerud, P. Fleckman, J. Biomed. Mater. Res. - Part A 2011, 98, 499.
[174] B. J. Farrell, B. I. Prilutsky, J. M. Ritter, S. Kelley, K. Popat, M. Pitkin, J. Biomed. Mater.
Res. - Part A 2014, 102, 1305.
[175] J. H. Jeong, Y. Liang, M. Jang, C. Cha, C. Chu, H. Lee, W. Jung, J. W. Kim, S. a. Boppart,
H. Kong, Tissue Eng. Part A 2013, 19, 1275.
[176] E. M. Hetrick, H. L. Prichard, B. Klitzman, M. H. Schoenfisch, 2009, 28, 4571.
[177] S. P. Nichols, A. Koh, N. L. Brown, M. B. Rose, B. Sun, D. L. Slomberg, D. A. Riccio, B.
Klitzman, M. H. Schoenfisch, Bio- materials 2012, 33, 6305.
[178] J. Necas, L. Bartosikova, P. Brauner, J. Kolar, Vet. Med. (Praha). 2008, 53, 397.
[179] D. A. Hollander, C. Soranzo, S. Falk, J. Windolf, J. Trauma 2001, 50, 1125.
[180] W. F. Liu, M. Ma, K. M. Bratlie, T. T. Dang, R. Langer, D. G. Anderson, Biomaterials
2011, 32, 1796.
[181] M. Ma, W. F. Liu, P. S. Hill, K. M. Bratlie, D. J. Siegwart, J. Chin, M. Park, J. Guerreiro,
D. G. Anderson, Adv. Mater. 2011, 23, H189.
[182] K. M. Bratlie, T. T. Dang, S. Lyle, M. Nahrendorf, R. Weissleder, R. Langer, D. G.
Anderson, PLoS One 2010, 5, e10032.
[183] H. C. Bygd, K. D. Forsmark, K. M. Bratlie, Biomaterials 2015, 56, 187.
[184] Y. Zhang, M. L. Akins, K. Murari, J. Xi, M.-J. Li, K. Luby-Phelps, M. Mahendroo, X. Li,
Proc. Natl. Acad. Sci. USA 2012, 109, 12878.
[185] H. Bao, A. Boussioutas, R. Jeremy, S. Russell, M. Gu, Opt. Express 2010, 18, 1255.
[186] J. L. Balestrini, S. Chaudhry, V. Sarrazy, A. Koehler, B. Hinz, Integr. Biol. 2012, 4, 410.
[187] C. Lee, J. Shin, J. S. Lee, E. Byun, J. H. Ryu, S. H. Um, D.-I. Kim, H. Lee, S.-W. Cho,
Biomacromolecules 2013, 14, 2004.
[188] C. A. McCaslin, D. N. Petrusca, C. Poirier, K. A. Serban, G. G. Anderson, I. Petrache, J.
Cyst. Fibros. 2015, 14, 70.
[189] K. B. Fonseca, D. B. Gomes, K. Lee, S. G. Santos, A. Sousa, E. A. Silva, D. J. Mooney, P.
L. Granja, C. C. Barrias, Biomacro- molecules 2014, 15, 380.
[190] S. Jain, M. Amiji, Biomacromolecules 2012, 13, 1074.
[191] S. Jain, T.-H. Tran, M. Amiji, Biomaterials 2015, 61, 162.

55
[192] S. Carnesecchi, C. Deffert, Y. Donati, O. Basset, B. Hinz, O. Preynat-Seauve, C. Guichard,
J. L. Arbiser, B. Banfi, J.-C. Pache, C. Barazzone-Argiroffo, K.-H. Krause, Antioxid. Redox
Signal. 2011, 15, 607.
[193] K. Bartus, N. D. James, A. Didangelos, K. D. Bosch, J. Verhaagen, R. J. Yanez-Munoz, J.
H. Rogers, B. L. Schneider, E. M. Muir, E. J. Bradbury, J. Neurosci. 2014, 34, 4822.
[194] A. Didangelos, M. Iberl, E. Vinsland, K. Bartus, E. J. Bradbury, J. Neurosci. 2014, 34,
16424.
[195] P. Korn, M. C. Schulz, V. Hintze, U. Range, R. Mai, U. Eckelt, M. Schnabelrauch, S.
Müller, J. Becher, D. Scharnweber, B. Stadlinger, J. Biomed. Mater. Res. - Part A 2014, 102,
2334.
[196] G. K. Tan, Y. Tabata, Acta Biomater. 2014, 10, 2684. [197] S. M. Van Putten, D. T. A.
Ploeger, E. R. Popa, R. A. Bank, Acta Bio- mater. 2013, 9, 6502.
[198] F. Wei, P. F. Slivka, C. L. Dearth, S. F. Badylak, Biomaterials 2015, 46, 131.
[199] B. M. Sicari, J. L. Dziki, B. F. Siu, C. J. Medberry, C. L. Dearth, S. F. Badylak,
Biomaterials 2014, 35, 8605.
[200] B. N. Brown, J. E. Valentin, A. M. Stewart-akers, G. P. Mccabe, S. F. Badylak,
Biomaterials 2009, 30, 1482.
[201] B. V. Fearing, M. E. Van Dyke, Acta Biomater. 2014, 10, 3136.
[202] M. Borrelli, N. Joepen, S. Reichl, D. Finis, M. Schoppe, G. Geerling, S. Schrader,
Biomaterials 2015, 42, 112.
[203] L. A. Pace, J. F. Plate, T. L. Smith, M. E. Van Dyke, Biomaterials 2013, 34, 5907.
[204] J. M. Tse, G. Cheng, J. A. Tyrrell, S. A. Wilcox-Adelman, Y. Boucher, R. K. Jain, L. L.
Munn, Proc. Natl. Acad. Sci. USA 2012, 109, 911
56
CHAPTER 3
MULTIMODAL IMAGING OF HARMONOPHORES AND APPLICATION
OF HIGH CONTENT IMAGING FOR EARLY CANCER DETECTION
Modified from a manuscript published in Materials Discovery, 1, 10-20 (2015)
The importance of cancer detection has grown exponentially over the past few years, as
medical costs and our demand for better quality of living rise. Multimodal imaging techniques aim
to improve the efficiency of current diagnostic methods and provide greater insight into the
mechanism of tumor metastasis. Second harmonic generation (SHG) microscopy is one such non-
destructive imaging technique available to researchers for detecting the changes in the morphology
of chiral molecules such as collagen, which are selectively imaged by this technique. Researchers
aim to understand the role played by changes in collagen morphology in tumor development, by
combining SHG with other non-linear optics instruments. Different cancer diagnoses have been
shown to be detected efficiently by these methods, with higher clarity than the standard protocols
available. This is a significant improvement, especially in the case of aggressive, invasive tumor
types such as basal cell carcinoma (BCC) and invasive ductal carcinoma (IDC). Analyzing the
data produced by such multimodal imaging methods is currently a nascent field. The aim of this
review is to provide an overview of the analysis techniques currently used in this field of high
content imaging and establish concurrence of methods to further improve the understanding and
efficiency of cancer detection.
3.1 Introduction
The latest reports from the National Cancer Initiative show that Cancer has grown to
become the 2nd largest cause for death in the United States, behind only heart disease. Beyond the
emotional trauma suffered by families across countries worldwide, cancer also has a very high
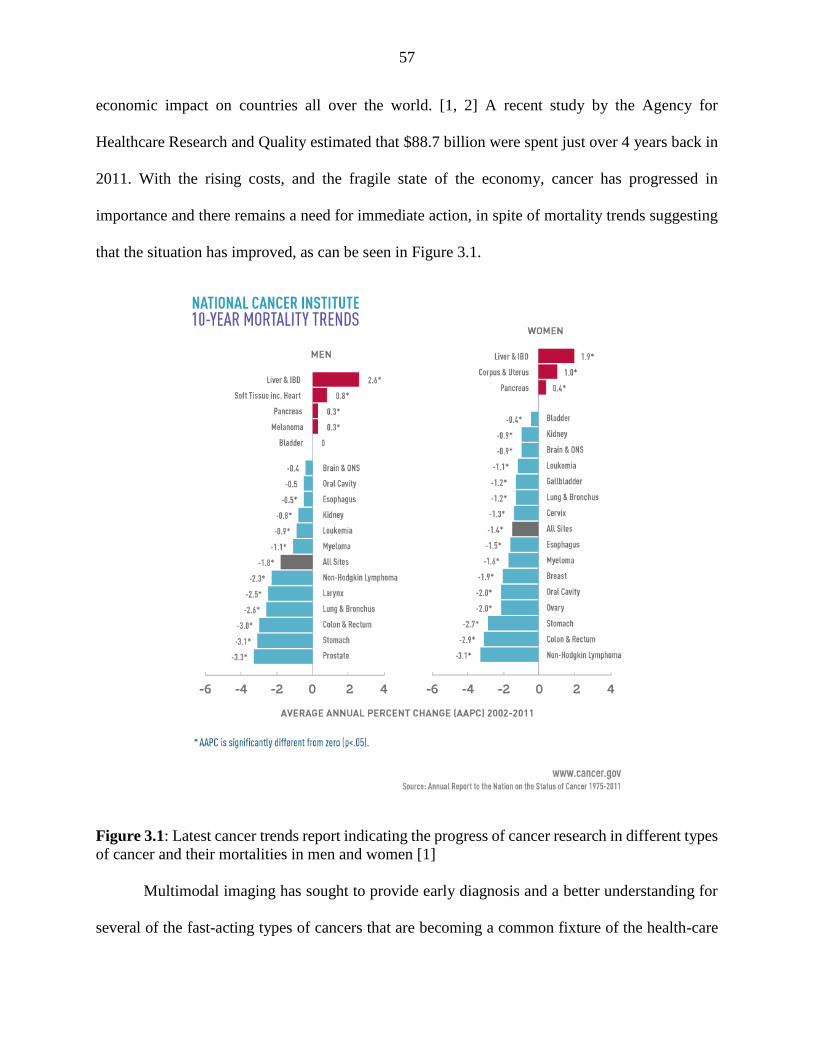
57
economic impact on countries all over the world. [1, 2] A recent study by the Agency for
Healthcare Research and Quality estimated that $88.7 billion were spent just over 4 years back in
2011. With the rising costs, and the fragile state of the economy, cancer has progressed in
importance and there remains a need for immediate action, in spite of mortality trends suggesting
that the situation has improved, as can be seen in Figure 3.1.
Figure 3.1: Latest cancer trends report indicating the progress of cancer research in different types
of cancer and their mortalities in men and women [1]
Multimodal imaging has sought to provide early diagnosis and a better understanding for
several of the fast-acting types of cancers that are becoming a common fixture of the health-care
58
sector. Techniques such as second harmonic generation (SHG) microscopy have provided
researchers a hybrid imaging technique which can offer biochemical insights into clinical samples,
and yield information on a multitude of tumor diagnoses. SHG imaging uses two incoming photons
having the same wavelength, scatter after interacting with a chiral molecule, and produce one
photon of exactly half the incoming wavelength. The nature, intensity of this scattering phenomena
can provide information into the internal structure of the tissues. [3, 4]
SHG imaging has been shown to have many advantages over traditional
immunohistochemistry staining techniques or fluorescence microscopy. It is a non-linear optical
approach toward imaging tissues both in-situ as well as being a part of endomicroscopy approaches
[5, 6, 7] The SHG imaging approach is a non-staining, energy conservative technique. This is most
suitable for non-destructive imaging of tissues, while simultaneously allowing for the internal
visualization of the samples be clear. The most important prerequisite condition for SHG-active
sites within the tissues is for there to be a non-centrosymmetric salient component within, which
are selectively detected by the incident beam. Common examples of SHG active molecules, known
as harmonophores are collagen types I and III, myosin (when present within acto-myosin
complexes), and cholesterol crystals (ChC) which are chiral in nature. [8, 9, 10]
Studies conducted by Su et al. [11] have shown that extracellular matrix (ECM) alterations
are a very important indicator for different kinds of tumor growth within corneal, colonic, cardiac,
breast, and ovarian tissues. Intensity based SHG imaging can yield clear images of the
modifications of the tissue structure, by elucidating collagen orientation changes in the ECM, as
can be seen in Figure 3.2, which is an image taken of a sub-dermal tumor in a mouse, from the
studies conducted by Brown. [12]

59
Figure 3.2: SHG image of a melanoma growth in sub-dermal tissue of a mouse. Image width was
6.6 mm. [12]
The most common challenge in methods such as SHG are that there is a complex amount
of data generated for each tissue imaging, based on the fact that the harmonophores show varying
intensity with polarization of the incident beams. These intensities, measurements of the forward,
backward-scattering beams, and the variations of the angular pitch of the harmonophores
necessitate a need for detailed analysis of the data generated. A significant concurrence needs to
be achieved for the understanding of the results generated by this field of high content imaging.
2.2 State of the Art
It is interesting to note that the discovery of SHG as an imaging tool was by accident, and
a consequence of experiments carried out to know more about piezoelectricity. Two young
researchers Fukada and Yasuda, who were working on a piece of Achilles tendon observed that
there observed to a macroscopic polarity to the sample. This polarity was hypothesized to be a
consequence of charged repeating groups in crystal form, which was further confirmed by Lang a
few years later to also show pyroelectric properties. [13] Together these created the breakthrough
which allowed for biological molecules having chiral symmetry be visualized in a non-linear
manner, without compromising on the structural or chemical integrity of the samples. One of the
first examples shown to be easily differentiated on the basis of SHG imaging were rat tail tendons
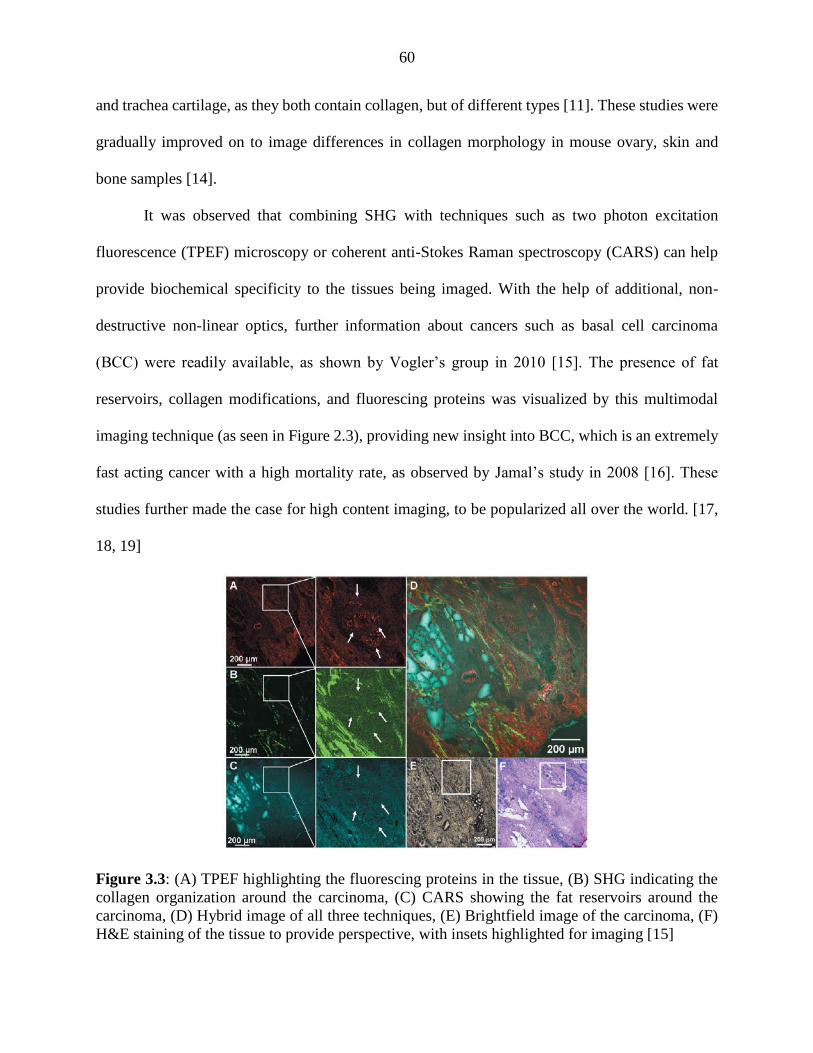
60
and trachea cartilage, as they both contain collagen, but of different types [11]. These studies were
gradually improved on to image differences in collagen morphology in mouse ovary, skin and
bone samples [14].
It was observed that combining SHG with techniques such as two photon excitation
fluorescence (TPEF) microscopy or coherent anti-Stokes Raman spectroscopy (CARS) can help
provide biochemical specificity to the tissues being imaged. With the help of additional, non-
destructive non-linear optics, further information about cancers such as basal cell carcinoma
(BCC) were readily available, as shown by Vogler’s group in 2010 [15]. The presence of fat
reservoirs, collagen modifications, and fluorescing proteins was visualized by this multimodal
imaging technique (as seen in Figure 2.3), providing new insight into BCC, which is an extremely
fast acting cancer with a high mortality rate, as observed by Jamal’s study in 2008 [16]. These
studies further made the case for high content imaging, to be popularized all over the world. [17,
18, 19]
Figure 3.3: (A) TPEF highlighting the fluorescing proteins in the tissue, (B) SHG indicating the
collagen organization around the carcinoma, (C) CARS showing the fat reservoirs around the
carcinoma, (D) Hybrid image of all three techniques, (E) Brightfield image of the carcinoma, (F)
H&E staining of the tissue to provide perspective, with insets highlighted for imaging [15]
61
As demonstrated for BCC, dermal tissues were one of the first to get imaged using SHG
due to the ease of access and availability of samples [20, 21]. Chen and his group showed SHG
and TPEF as a viable hybrid imaging tool [22], by simultaneously imaging collagen and elastin
respectively. There was a clear difference observed on how the scars and normal dermis showed
different levels of elastin and collagen presence.
Cicchi et al. demonstrated in 2010, how structurally different hypertrophic scarring in
keloids is from healthy dermis at the micron scale [23, 9]. It was observed that normal dermis
contained a randomly mixed presence of collagen and elastin, whereas keloids showed well
aligned boundaries of collagen with very minimal presence of elastin. As keloids are present only
in humans [22, 24, 25], and the nature of keloids have been shown to be influenced by the melanin
content, studies such as these hold great promise in the fields of tissue engineering. These studies
were further substantiated by independently analyzing the orientation of the collagen fibers
formed, through fast Fourier transform (FFT) analysis. It was clear the isotropic nature of collagen
fibers in keloids matched well with the visual observations made previously by Su et al. in 2011.
[21, 23, 25, 26, 27]
The success of SHG imaging spurred interest in the early detection of breast cancer. In
order to understand the significant difference between the clarity of tissue sections, Ambekar
compared the hematoxylin & eosin stained (H&E) sections with the collagen mapped using SHG
[28]. The sensitivity of SHG in detecting changes in collagen morphology has proved to be a game
changer for this aspect of breast cancer detection at an early stage, as shown in Figure 2.4. Several
groups such as Brown, Burke, Conklin, Ajeti have defined aspects of breast cancer types based on
SHG [29, 20, 31, 32]
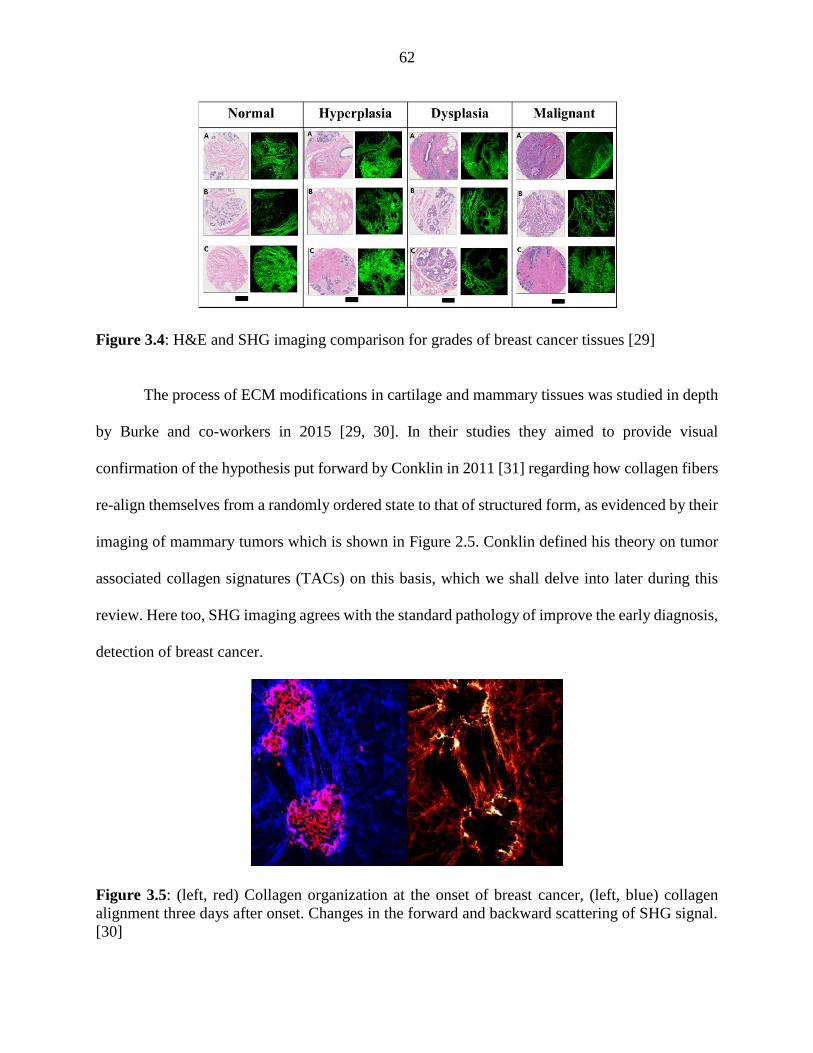
62
Figure 3.4: H&E and SHG imaging comparison for grades of breast cancer tissues [29]
The process of ECM modifications in cartilage and mammary tissues was studied in depth
by Burke and co-workers in 2015 [29, 30]. In their studies they aimed to provide visual
confirmation of the hypothesis put forward by Conklin in 2011 [31] regarding how collagen fibers
re-align themselves from a randomly ordered state to that of structured form, as evidenced by their
imaging of mammary tumors which is shown in Figure 2.5. Conklin defined his theory on tumor
associated collagen signatures (TACs) on this basis, which we shall delve into later during this
review. Here too, SHG imaging agrees with the standard pathology of improve the early diagnosis,
detection of breast cancer.
Figure 3.5: (left, red) Collagen organization at the onset of breast cancer, (left, blue) collagen
alignment three days after onset. Changes in the forward and backward scattering of SHG signal.
[30]
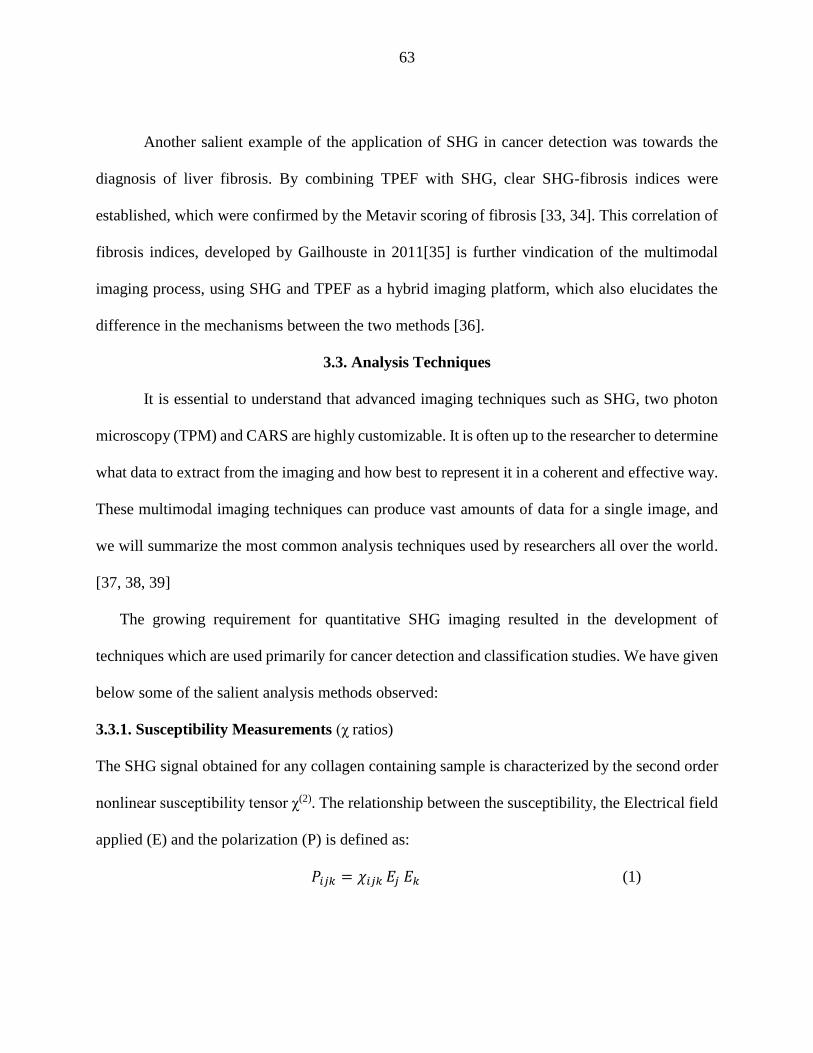
63
Another salient example of the application of SHG in cancer detection was towards the
diagnosis of liver fibrosis. By combining TPEF with SHG, clear SHG-fibrosis indices were
established, which were confirmed by the Metavir scoring of fibrosis [33, 34]. This correlation of
fibrosis indices, developed by Gailhouste in 2011[35] is further vindication of the multimodal
imaging process, using SHG and TPEF as a hybrid imaging platform, which also elucidates the
difference in the mechanisms between the two methods [36].
3.3. Analysis Techniques
It is essential to understand that advanced imaging techniques such as SHG, two photon
microscopy (TPM) and CARS are highly customizable. It is often up to the researcher to determine
what data to extract from the imaging and how best to represent it in a coherent and effective way.
These multimodal imaging techniques can produce vast amounts of data for a single image, and
we will summarize the most common analysis techniques used by researchers all over the world.
[37, 38, 39]
The growing requirement for quantitative SHG imaging resulted in the development of
techniques which are used primarily for cancer detection and classification studies. We have given
below some of the salient analysis methods observed:
3.3.1. Susceptibility Measurements (χ ratios)
The SHG signal obtained for any collagen containing sample is characterized by the second order
nonlinear susceptibility tensor χ(2). The relationship between the susceptibility, the Electrical field
applied (E) and the polarization (P) is defined as:
𝑃𝑖𝑗𝑘 = 𝜒𝑖𝑗𝑘 𝐸𝑗 𝐸𝑘 (1)

64
For small molecules, it is understood that the main contributors to the susceptibility value are the
C=O and the N-H groups present in the amide bonds. [40] Hence, this tensor is indicative of the
collagen directionality within the imaged domains. For ease of analysis as well as approximation
based on the point sized light source and the sample thickness not exceeding 5 μm, we consider
the samples to observe cylindrical symmetry and follow the Kleinmann rules. The relation thus
shall exhibit only two independent components: χXXX and χXYY= χXZZ = χYXY = χZXZ = χYYX= χZXX
where X is the direction of the collagen fibrils [4, 27]
An incident electric field E0 then induces the following second harmonic wave in the fibril frame
XYZ:
𝐸𝜒2𝜔 ∝ [𝜒𝑋𝑋𝑋 𝑐𝑜𝑠2(𝛼 − 𝜑) + 𝜒𝑋𝑋𝑋 𝑠𝑖𝑛2(𝛼 − 𝜑)] 𝐸0
2 (2a)
𝐸𝑌2𝜔 ∝ [𝜒𝑋𝑌𝑌 sin 2 (𝛼 − 𝜑)] 𝐸0
2 (2b)
In the above equations, α and φ stand for the laser excitation polarization angle and the
fibril orientation angle, respectively, with respect to a fixed direction in the laboratory frame,
usually taken as the X axis which is considered here to be the collagen fibril axis. This is valid
because the lamellae within the collagen shall be parallel to the axis, and hence within plane of the
electrical field E0. The total polarized collagen intensity is then given by:
𝐼2𝜔 = 𝐾 (|𝜌 𝑐𝑜𝑠2(𝛼 − 𝜑) + 𝑠𝑖𝑛2 (𝛼 − 𝜑)|2 + |𝑠𝑖𝑛 2(𝛼 − 𝜑)|2 (3)
In the above equation, K is a constant merging the squared incident intensity and setup
geometrical parameters. Two quantitative parameters appear in this expression: (i) the angle
difference of α and φ, of the laser excitation polarization to the collagen fibrils axis within lamellar
domains; (ii) the ratio ρ, which reflects the anisotropy of the nonlinear response of these lamellar
domains and is calculated as ρ = χXXX/χXYY. This approach to calculate the polarization anisotropy

65
(ρ) and susceptibility (P) is valid for both forward scattered SHG as well as backward scattered
SHG signals. [22]
In some cases, where the methylene contribution is considered separately, some of the
above assumptions don’t hold true for all the tensor elements. Some cases studies and theoretical
models show the polarizability of the sample denoted by β in such cases. Resulting in the system
getting defined by three related elements:
𝜒𝑋𝑋𝑋 = 𝑁(𝑝)𝛽(𝑝) 𝑐𝑜𝑠3 𝜃(𝑝) + 𝑁(𝑚)𝛽(𝑚) cos 𝜃(𝑚) (4a)
𝜒𝑋𝑌𝑌 =1
2 𝑁(𝑝)𝛽(𝑝) cos 𝜃(𝑝) 𝑠𝑖𝑛2𝜃(𝑝) (4b)
𝜒𝑌𝑌𝑋 =1
2 𝑁(𝑝)𝛽(𝑝) cos 𝜃(𝑝) 𝑠𝑖𝑛2𝜃(𝑝) + 𝑁(𝑚)𝛽(𝑚) cos 𝜃(𝑚) (4c)
In these above equations, N(p) and N(m) refer to the number of peptide and methylene groups in the
system respectively. And the θ(p) represents the pitch angle to which the collagen is oriented, and
accordingly determined as per the following equations:
a= χXXX/χXYY and b=χYYX/χXYY
And, 𝑡𝑎𝑛2 𝜃(𝑝) = 2
𝑎 − 𝑏 + 1 (5)
Studies conducted by Jung Su [11], on cartilage imaging relied on using these equations and
susceptibility ratios in order to characterize differences between collagen type I and type II in rats,
as shown in Figure 2.6 [27, 35, 41].

66
Figure 3.6: Normalized SHG intensity observed relative to the polarization angle [11]
Jung Su et al., also demonstrated the clear change in intensity observed with respect to change in
polarization. They highlighted one of the first examples of collagen morphologies being different
in tendons and cartilage tissues, with the change in morphology from wavy, random signals to well
aligned fibers.
3.3.2. Polarization Resolved SHG imaging
As the intensity of the SHG signal obtained for collagen presence is dependent on not just
the concentration, but also the degree of ordering of the fibers, spacing, and the overall anisotropy
of the collagen in the samples. This approach can be taken up in multiple applications, such as on
the basis of the polarization anisotropy, or as separate measurements for each incident polarization
angle. On the basis of polarization anisotropy, the images intensity was normalized over the
following equation [42]:
𝑃𝐴 = 𝐼||− 𝐼⊥
𝐼||+ 𝐼⊥ (6)
Here, the I|| values were for those with horizontal polarization and I⊥ values for the vertically
polarized imaging. PA values of 0 signify a high order of stochasticity, and those tending towards
1 or -1 are more uniaxial in orientation.
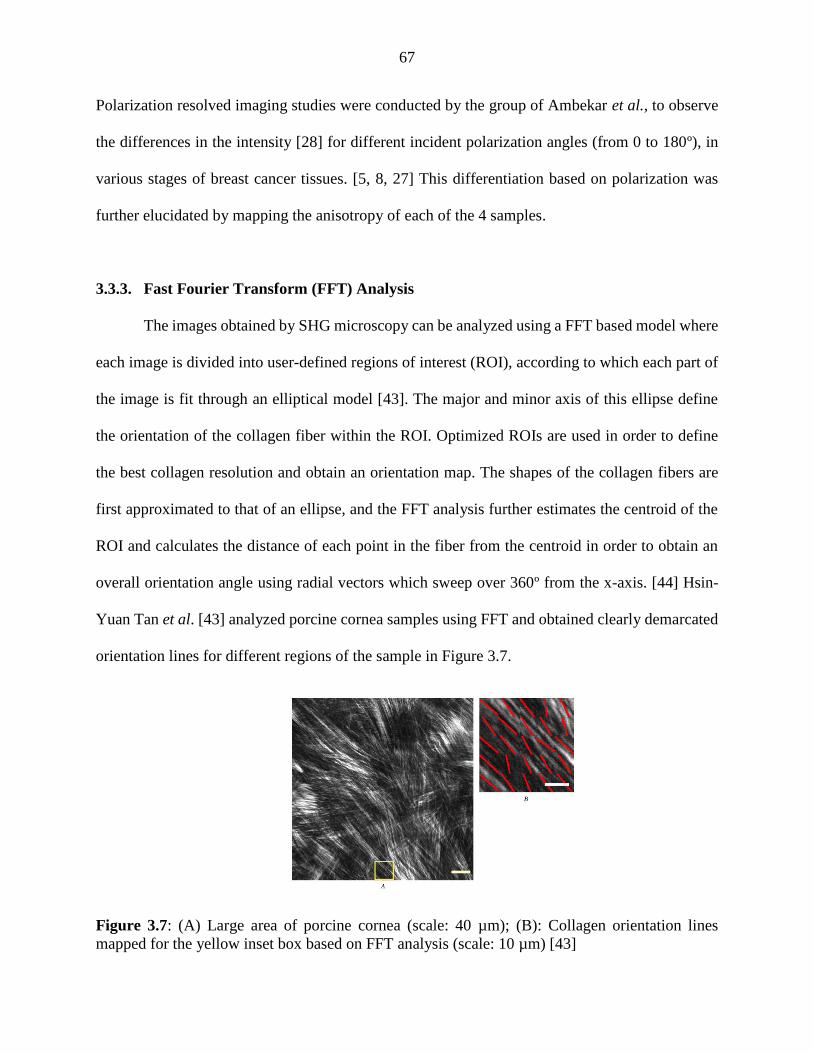
67
Polarization resolved imaging studies were conducted by the group of Ambekar et al., to observe
the differences in the intensity [28] for different incident polarization angles (from 0 to 180º), in
various stages of breast cancer tissues. [5, 8, 27] This differentiation based on polarization was
further elucidated by mapping the anisotropy of each of the 4 samples.
3.3.3. Fast Fourier Transform (FFT) Analysis
The images obtained by SHG microscopy can be analyzed using a FFT based model where
each image is divided into user-defined regions of interest (ROI), according to which each part of
the image is fit through an elliptical model [43]. The major and minor axis of this ellipse define
the orientation of the collagen fiber within the ROI. Optimized ROIs are used in order to define
the best collagen resolution and obtain an orientation map. The shapes of the collagen fibers are
first approximated to that of an ellipse, and the FFT analysis further estimates the centroid of the
ROI and calculates the distance of each point in the fiber from the centroid in order to obtain an
overall orientation angle using radial vectors which sweep over 360º from the x-axis. [44] Hsin-
Yuan Tan et al. [43] analyzed porcine cornea samples using FFT and obtained clearly demarcated
orientation lines for different regions of the sample in Figure 3.7.
Figure 3.7: (A) Large area of porcine cornea (scale: 40 µm); (B): Collagen orientation lines
mapped for the yellow inset box based on FFT analysis (scale: 10 µm) [43]

68
Akilbekova et al. used the FFT analysis in order to obtain resolved orientations of the
collagen in the samples [45]. They were able to obtain shape description values for each of the
samples, showing the different overall distribution of the collagen, differentiating between systems
where the collagen was well-aligned to those which showed a random distribution [8, 31]
3.3.4. F/B Ratio Measurements
Another analysis technique used the nature of SHG measurements having a forward and
backward scattering component, hitherto referred as F-SHG and B-SHG respectively. It has been
understood that the F-SHG imaging is extremely sensitive to the presence of large collagen bundles
which are of the order of the magnitude of the incoming SHG signal, whereas the B-SHG is
sensitive to the septa and interstices created by randomly distributed small deposits of collagen,
where the forward signal gets collected, but the backward signal is propagated stronger. The ratio
of these two area percentages or intensities observed in the samples is often denoted as the F/B
ratio, and taken as measure of the evolution of collagen alterations in the sample [46]
For each of the sample images, a stack is created, where a threshold is applied such that
the signal to noise ratio is optimized for the individual F-SHG and B-SHG measurements. This
threshold is used to create a mask, where all the non-collagen areas are automatically allotted a
null value, with the collagen areas having value of 1. This sort of binary differentiation of the
images brings the signal to the highest clarity. Depending on the types of cancer or tissue studied,
the area percentage or the average intensity values are measured for each image in the F-SHG
stack and divided by the corresponding images for the B-SHG one [47]
Groups such as Latour et al., [41] took additional care to ensure the validity of such
measurements by polarization resolving F/B ratio studies. As collagen is known to be anisotropic,
69
they were able to obtain even higher resolutions of the stromae observed in cornea samples, this
analysis was combined with the direction maps created for the collagen alignment.
Another method of representing F/B ratio data is through statistically calculating the
difference in the ratios, observed for different types of healthy and cancer tissues [46]. Many
different types of non-parametric testing such as the Newman-Keuls test, help calculate the
standard deviation and variances without compromising the integrity of the data. Kottman et al.,
recently published their work on understanding the alteration in the ECM [48] as observed in
different lung cancer tissues. Here, they studied an early detection strategy to differentiate between
a highly invasive cryptogenic organizing pneumonia (COP) from usual interstitial pneumonia
(UIP) and healthy tissue. UIP is characterized usually by decrease in lung volume and non-
productive cough and is a common yet highly serious medical condition amongst smokers. UIP or
idiopathic pulmonary fibrosis (IFP) patients often need to undergo lung transplantation after
diagnosis. On the other hand, COP can be characterized by the presence of granular buds in the
alveoli and bronchioles. Most cases of COP are cured within three months of treatment with
corticosteroids unlike for UIP, where such treatments are largely ineffective [49, 50]. In cases such
as these, an early detection method such as SHG F/B ratio analysis can potentially avoid fatalities.
3.3.5. Grey Local Correlation Matrix (GLCM)
GLCM is a statistical method to analyze texture in greyscale images [51]. It analyzes each
ROI, with relation to its neighboring areas. This method can be set to analyze the images even on
a pixel by pixel basis, by changing the offset, accounting for different channels within the image.
It can be classified largely on the basis of three applications:
a. On the basis of weighted means which are multiplied to the GLCM values depending
on distance from the main diagonal:

70
i. For analyzing dissimilarity (D) where the weights multiplied to the GLCM
values increase as you move away from the diagonal
∑ 𝑃𝑖.𝑗|𝑖 − 𝑗|𝑁−1𝑖,𝑗=0 (7)
ii. For analyzing contrast (C) where the weights multiplied to the GLCM
values decrease as you move away from the diagonal, also known as sum
of squares variance.
∑ 𝑃𝑖.𝑗(𝑖 − 𝑗)2𝑁−1𝑖,𝑗=0 (8)
iii. For analyzing homogeneity (H) where the weights multiplied to the GLCM
values decrease exponentially as you move away from the diagonal. This is
most applicable to images having a high contrast range.
∑𝑃𝑖,𝑗
1+(𝑖−𝑗)2𝑁−1𝑖,𝑗=0 (9)
b. On the basis of spatial matrix values, complete measurements based on orderliness.
Similar to contrast wise measurements, Orderliness measures are calculated with
GLCM weighted averages on the basis that:
iv. Weights that increase with commonness shall increase with orderliness
v. Weights that decrease with commonness shall increase with disorder
The three orderliness measures defined under the GLCM theory are:
• ASM or Energy mean which can be calculated by the following equation
typically for cases where the matrix is highly orderly.
∑ 𝑃𝑖,𝑗2
𝑁−1
𝑖,𝑗=0
• Max Probability (MAX): Simply records the highest value of the matrix in
the center
71
• Entropy measurement based completely on the disorderliness of the system,
and calculated by:
∑ 𝑃𝑖,𝑗 (−ln
𝑁−1
𝑖,𝑗=0
𝑃𝑖,𝑗 )
c. On the basis of statistics, calculating the GLCM mean, median and variance
The correlation (R) of each pixel to its neighboring ones are calculated as:
In these equations, the expectation values are denoted by µ and the standard
deviations are denoted by σ.
𝑅 = ∑(𝑖 − 𝜇𝑖) (𝑗 − 𝜇𝑗) 𝑝𝑖.𝑗
𝜎𝑖𝜎𝑗𝑖.𝑗 (10a)
𝜇𝑖 = ∑ 𝑖 . 𝑝𝑖,𝑗𝑁𝑖=1 ; 𝜇𝑗 = ∑ 𝑖 . 𝑝𝑖,𝑗
𝑁𝑖=1 (10b)
𝜎𝑖 = √1
𝑁−1 . ∑ 𝑖. 𝑝𝑖,𝑗
𝑁𝑖=1 ; 𝜎𝑗 = √
1
𝑁−1 . ∑ 𝑗. 𝑝𝑖,𝑗
𝑁𝑖=1 (10c)
By modifying the offset values and studying the correlation, more information about the texture
can be measured, as the offset directly influences the distance between each neighboring ROI taken
into consideration. The group of Cicchi et al. [23] did important work on imaging and
understanding the structural differences between keloids (K) and normal human dermis (HD) using
the GLCM data analysis techniques. On the basis of calculating the homogeneity, correlation, and
energy for different ROI values, they obtained a clear trend to tell apart normal dermis samples
from excessively scarred keloid tissue.
3.3.6. Second Harmonic to Autofluorescence Aging Index of Dermis (SAAID)
In the field of dermatology, it became necessary to be able to image collagen for a variety
of applications. Tissue engineering [9, 23, 42] also benefited from the studies conducted on
quantifying the collagen density, especially when it could give more information on the
proportions of elastin present alongside it. Such multimodal imaging studies were carried out by
72
researchers all over the world, where SHG was combined with any autofluorescence imaging
technique which targeted the elastin present in the tissue samples.
SAAID has been devised as a measure of the collagen fiber intensity based on the hybrid
TPEF imaging done along with SHG. The combined intensity values are used to calculate SAAID
as per the following formula:
𝑆𝐴𝐴𝐼𝐷 = 𝐼𝑆𝐻𝐺 − 𝐼𝑇𝑃𝐸𝐹
𝐼𝑆𝐻𝐺 + 𝐼𝑇𝑃𝐸𝐹 (11)
It can be used as a measure of the collagen to elastin ratio in the dermal samples, as the
elastin can be tagged with TPEF-active fluorescent markers, and the SHG will specifically only
show collagen density. The SAAID is a very useful tool hence to determine the difference between
normal skin, keloids and normal scars. As humans are the only mammals who exhibit the presence
of keloids in response to physical trauma or at times surgery [21, 52], this analysis technique helps
evaluate the tendency of certain tissues to develop to the keloids stage, where the elastin is
significantly higher than for normal skin or scars.
Using these notations, the SAAID value hence approaches -1 when the collagen present in
the sample is completely replaced by the elastin. In 2014, the group of Cicchi and Pavone [42],
used the SAAID values to evaluate the effectiveness of laser ablative treatment in removing scarred
tissue from normal dermis. In this study, they evaluated over three age groups of patients. Group
I consisted of those less than 35 years of age, Group 2 had age between 35 and 60, whereas the
last group had age above 60. Their images and results indicated clear differences in the amounts
of collagen and elastin present, after multimodal imaging pre and post laser treatment [9, 23]
The results showed clearly that the SAAID values for normal skin was close to -1 due to
the high presence of elastin, whereas the scores for keloids and scar tissues were closed to 1 owing
to the higher concentration of collagen in the samples. The SAAID value measurements are often
73
accompanied in every study by two-sample parametric test, to be sure of statistical differences
observed for the different sample types and also evaluate the standard deviation and means.
3.3.7. Depth Dependent Decay Measurements
In order for techniques such as SHG and TPEF to be comparably applicable to imaging
different kinds of tumors, research groups devised the depth dependent decay (DDD) studies
analysis method, which helps quantify the SHG signal differing from the change in the focal plane.
It was observed that the signal intensity would exponentially increase with the increase in depth,
and such a system could be easily represented by a first order equation where ‘x’ represented the
imaging depth, and ‘y’ represented the SHG collagen intensity. For such systems, A is the pre-
exponential scaling factor, C is the proportionality constant which ensures the non-collagen areas
to have a null value. [22, 53, 54]
𝑦 = 𝐴𝑒−𝑘𝑥 + 𝐶 (12)
The k value obtained from the above equation is the DDD factor which is completely
dependent on the sample absorption and composition. It can be easily obtained the collagen
intensities against the different focal plane depths and extrapolated as per the exponential equation
to obtain the k values for different samples.
Many groups such as Chen et al., [22] in Taiwan have studied the differences between
cartilage, tendons, and normal skin using SHG. They applied the DDD model to identify the
difference between hypertrophic scars and normal dermis in this study.
These DDD studies can also be utilized for differentiating between collagen mixtures of
different proportions due the sensitivity of the k values observed. Ajeti et al., [32] used the DDD
study to identify how collagen type I and V showed very different absorption and scattering
74
properties, the results of which could go a long way in analyzing different artificial tissue samples
and their preparation.
3.4. Different Cancer Staging methods
Imaging methods such as SHG, have been shown to have a significant number of advantages over
traditional cancer scoring systems. The different data analysis approaches that can be applied to
the SHG data provide greater details about the sample [56], and at the same time, they do not
damage the sample or use stains of any kind. It is essential though to see how the standard scoring
systems can be combined with SHG analysis to provide concurrence for cancer diagnoses. We
shall discuss below, some commonly used oncological scoring systems:
3.4.1. Metavir Scoring system
In this system, the severity of the liver cancer diagnosis, observed through
histopathological examination of a liver biopsy, is made on the basis of two levels [33, 34]. Firstly,
on the basis of inflammation, where it is graded from A0 to A4-ranging from ‘no activity’ to
‘severe activity’. And secondly, on the basis of the stage of fibrosis observed as:
• F0—No fibrosis
• F1—Portal fibrosis without septa
• F2—Portal fibrosis with few septa
• F3—Numerous septa without cirrhosis
• F4—Cirrhosis
3.4.2. TNM system
The TNM system for classifying severity of cancer is one of the most commonly accepted
and used to differentiate between different stages of cancer. Unlike the Metavir Scoring system,
75
the TNM scoring applies to a wide range of cancer diagnoses.
In this system, each letter signifies a different key characteristic of the cancer diagnosis
[55]. Starting with T, which denotes the size and hence reach of the primary tumor. For invasive
cancer types, it is essential to know whether the cancer has spread to the nearby lymph nodes, and
is denoted by N. And lastly, M denotes whether the cancer has spread to other parts of the body,
forming secondary tumors in a process defined as metastasis-denoted by M. The values assigned
to each of the letters can hence reveal a lot of information about the cancer diagnosis in a short,
clear manner.
For the primary tumor (T) classifications, TX represents that the tumor could not be
evaluated. T0 indicates the absence of the primary tumor, whereas Tis shows that the tumor is non-
invasive at this stage. T1, T2, T3 and T4 all denote the size of the tumor.
In the regional lymph nodes (N) scoring, similarly NX represents non-evaluable tumor
presence lymph node, N0 shows absence of tumor in the nodes. And N1, N2 and N3 denote the
severity of the lymph node involvement, indicating the number of lymph nodes affected.
For the metastasis (M) scoring, MX shows that the metastasis could not be evaluated, M0 denotes
absence of the invasiveness, and M1 shows its presence [56].
3.4.3. Tumor Associated Collagen Signatures (TACS)
For the purpose of understanding and defining key characteristics observed in collagen
morphologies in cancer tissues, the group of Provenzano et al. [57] introduced the nomenclature
of TACS. Studies had shown that in the cases of hyperplasia, adenocarcinoma and ductal
carcinoma observed in mice, there were consistent epithelial clusters surrounded by an increased
presence of collagen. These collagen morphologies were observed to always be one of three types,
which helped classify the severity and invasiveness of the cancer diagnosis in the subjects [31].
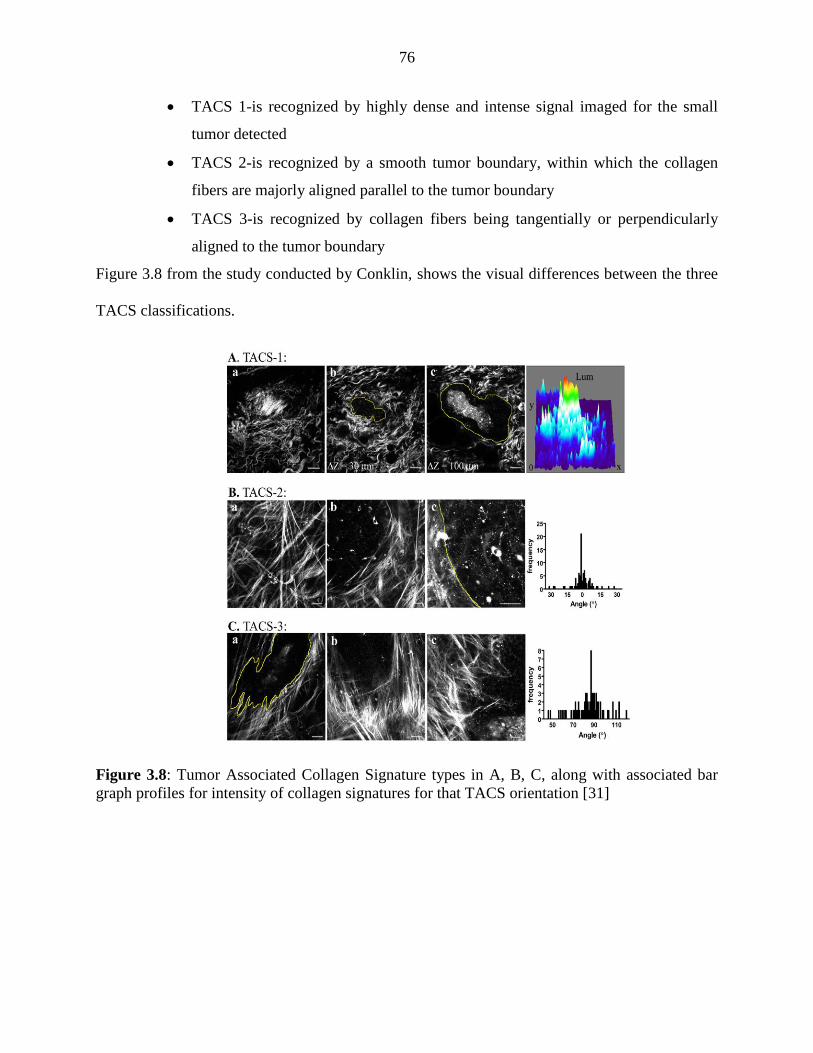
76
• TACS 1-is recognized by highly dense and intense signal imaged for the small
tumor detected
• TACS 2-is recognized by a smooth tumor boundary, within which the collagen
fibers are majorly aligned parallel to the tumor boundary
• TACS 3-is recognized by collagen fibers being tangentially or perpendicularly
aligned to the tumor boundary
Figure 3.8 from the study conducted by Conklin, shows the visual differences between the three
TACS classifications.
Figure 3.8: Tumor Associated Collagen Signature types in A, B, C, along with associated bar
graph profiles for intensity of collagen signatures for that TACS orientation [31]
77
3.5. Future Perspectives and Conclusions
Positive trends have been observed for many of the cancer detection techniques, which
have shown that these multimodal imaging techniques using SHG in combination with TPEF or
CARS, have concurred with the standard pathology in place. This is a very important step in the
establishment of protocol for early cancer detection, which shall improve the quality of living for
the families affected by these deadly diseases, [57] which are often based on genetic traits
We have discussed the varied applications of SHG and the different high content imaging
approaches towards cancer research [57, 58, 59]. It is evident that these methods, produce highly
complex data, and it thus requires the need for big data analysis. Over the course of our survey of
the latest work using SHG analysis, we tried to observe certain trends and preferences for using
set techniques for the treatment of data, but it was very difficult to do so. Consensus established
for optimized methods of testing which satisfy researchers across borders can help in global
benefits. A possible step forward to this goal would be to encourage inter-disciplinary research
projects to combat cancer types in laboratories and universities across the world. With the
advancements, in the field of analytics, it would surely not be very long before non-parametric
testing of data [59] as recommended in this review become the norm. Thereby reducing any bias
of the data, based on the technique themselves, and establishing concurrence sooner with the
existing clinical pathologies.
78
3.6. References
1. American Cancer Society. Cancer Facts & Figures 2015. Atlanta, Ga. 2015.
2. Rahib, L., Smith, B. D., Aizenberg, R., Rosenzweig, A. B., Fleshman, J. M., & Matrisian,
L. M. (2014). Projecting cancer incidence and deaths to 2030: The unexpected burden of
thyroid, liver, and pancreas cancers in the United States. Cancer Research, 74(11), 2913–
2921. doi:10.1158/0008-5472.CAN-14-0155
3. Burke, K., Tang, P., & Brown, E. (2013). Second harmonic generation reveals matrix
alterations during breast tumor progression. Journal of Biomedical Optics, 18(3), 31106.
doi:10.1117/1.JBO.18.3.031106
4. Golaraei, A., Cisek, R., Krouglov, S., Navab, R., Niu, C., Sakashita, S., Barzda, V. (2014).
Characterization of collagen in non-small cell lung carcinoma with second harmonic
polarization microscopy. Biomedical Optics Express, 5(10), 3562.
doi:10.1364/BOE.5.003562
5. Bao, H., Boussioutas, A., Jeremy, R., Russell, S., & Gu, M. (2010). Second harmonic
generation imaging via nonlinear endomicroscopy. Optics Express, 18(2), 1255–1260.
doi:10.1364/OE.18.001255
6. Zhang, Y., Akins, M. L., Murari, K., Xi, J., Li, M.-J., Luby-Phelps, K., … Li, X. (2012).
A compact fiber-optic SHG scanning endomicroscope and its application to visualize
cervical remodeling during pregnancy. Proceedings of the National Academy of Sciences,
109(32), 12878–12883. doi:10.1073/pnas.1121495109
7. Rivera, D. R., Brown, C. M., Ouzounov, D. G., Pavlova, I., Kobat, D., Webb, W. W., &
Xu, C. (2011). Compact and flexible raster scanning multiphoton endoscope capable of
imaging unstained tissue. Proceedings of the National Academy of Sciences, 108(43),
17598–17603. doi:10.1073/pnas.1114746108
8. Suhalim, J. L., Chung, C.-Y., Lilledahl, M. B., Lim, R. S., Levi, M., Tromberg, B. J., &
Potma, E. O. (2012). Characterization of Cholesterol Crystals in Atherosclerotic Plaques
Using Stimulated Raman Scattering and Second-Harmonic Generation Microscopy.
Biophysical Journal, 102(8), 1988–1995. doi:10.1016/j.bpj.2012.03.016
9. Cicchi, R., Matthäus, C., Meyer, T., Lattermann, A., Dietzek, B., Brehm, B. R., … Pavone,
F. S. (2014). Non-linear imaging and characterization of atherosclerotic arterial tissue
using combined two photon fluorescence, second-harmonic generation and CARS
microscopy. Multiphoton Microscopy in the Biomedical Sciences XIV, 9329, 894807.
doi:10.1117/12.2037018
10. Liu, H., Qin, W., Shao, Y., Liu, Q., Ma, Z., Borg, T. K., & Gao, B. Z. (2012). Live
Cardiomycyte Imaging via Hybrid TPEF-SHG Microscopy. Proceedings of SPIE, 8225,
822524–822524–7. doi:10.1117/12.908381
79
11. Su, P. J., Chen, W. L., Li, T. H., Chou, C. K., Chen, T. H., Ho, Y. Y., … Dong, C. Y.
(2010). The discrimination of type I and type II collagen and the label-free imaging of
engineered cartilage tissue. Biomaterials, 31(36), 9415–9421.
doi:10.1016/j.biomaterials.2010.08.055
12. Brown, E., McKee, T., diTomaso, E., Pluen, A., Seed, B., Boucher, Y., & Jain, R. K.
(2003). Dynamic imaging of collagen and its modulation in tumors in vivo using second-
harmonic generation. Nature Medicine, 9(6), 796–800. doi:10.1038/nm879
13. Freund, I., Deutsch, M., & Sprecher, A. (1986). Optical Second-harmonic Microscopy,
Crossed-beam Summation, and Small-angle Scattering in Rat-tail Tendon. Biophysical
Journal, 50, 693–712.
14. Chen, X., Nadiarynkh, O., Plotnikov, S., & Campagnola, P. J. (2012). Second harmonic
generation microscopy for quantitative analysis of collagen fibrillar structure. Nature
Protocols, 7(4), 654–69. doi:10.1038/nprot.2012.009
15. Vogler, N., Meyer, T., Akimov, D., Latka, I., Krafft, C., Bendsoe, N., … Popp, J. (2010).
Multimodal imaging to study the morphochemistry of basal cell carcinoma. Journal of
Biophotonics, 3(10-11), 728–736. doi:10.1002/jbio.201000071
16. Jemal, A., Siegel, R., Ward, E., Hao, Y., Xu, J., Murray, T., & Thun, M. J. (2008). Cancer
statistics, 2008. CA: A Cancer Journal for Clinicians, 58(2), 71–96.
doi:10.3322/CA.2007.0010
17. Seidenari, S., Arginelli, F., Dunsby, C., French, P., König, K., Magnoni, C., … Ponti, G.
(2012). Multiphoton laser tomography and fluorescence lifetime imaging of basal cell
carcinoma: Morphologic features for non-invasive diagnostics. Experimental
Dermatology, 21(11), 831–836. doi:10.1111/j.1600-0625.2012.01554.x
18. Seidenari, S., Arginelli, F., Bassoli, S., Cautela, J., Cesinaro, A. M., Guanti, M., … König,
K. (2013). Diagnosis of BCC by multiphoton laser tomography. Skin Research and
Technology, 19(1), 297–304. doi:10.1111/j.1600-0846.2012.00643.x
19. Heuke, S., Vogler, N., Meyer, T., Akimov, D., Kluschke, F., Röwert-Huber, H.-J., … Popp,
J. (2013). Detection and Discrimination of Non-Melanoma Skin Cancer by Multimodal
Imaging. Healthcare, 1(1), 64–83. doi:10.3390/healthcare1010064
20. Sun, C.-K., Chen, C.-C., Chu, S.-W., Tsai, T.-H., Chen, Y.-C., & Lin, B.-L. (2003).
Multiharmonic-generation biopsy of skin. Optics Letters, 28(24), 2488–2490.
doi:10.1364/OL.28.002488
21. Lilledahl, M., Olderøy, M., Finnøy, A., Olstad, K., & Brinchman, J. E. (2015). Second
harmonic generation imaging in tissue engineering and cartilage pathologies, 9329,
93291C. doi:10.1117/12.2081583
80
22. Chen, G., Chen, J., Zhuo, S., Xiong, S., Zeng, H., Jiang, X., … Xie, S. (2009). Nonlinear
spectral imaging of human hypertrophic scar based on two-photon excited fluorescence
and second-harmonic generation. British Journal of Dermatology, 161(1), 48–55.
doi:10.1111/j.1365-2133.2009.09094.x
23. Cicchi, R., Kapsokalyvas, D., De Giorgi, V., Maio, V., Van Wiechen, A., Massi, D., …
Pavone, F. S. (2010). Scoring of collagen organization in healthy and diseased human
dermis by multiphoton microscopy. Journal of Biophotonics, 3(1-2), 34–43.
doi:10.1002/jbio.200910062
24. Linares, H. A., Kischer, C. W., Dobrkovsky, M., & Larson, D. L. (1972). The histotypic
organization of collagen of the hypertrophic scar in humans. The Journal of Investigative
Dermatology, 59(4), 323–332.
25. English, R. S., & Shenefelt, P. D. (1999). Keloids and hypertrophic scars. Dermatologic
Surgery, 25(8), 631–638. doi:10.1046/j.1524-4725.1999.98257.x
26. Thrasivoulou, C., Virich, G., Krenacs, T., Korom, I., & Becker, D. L. (2011). Optical
delineation of human malignant melanoma using second harmonic imaging of collagen.
Biomedical Optics Express, 2(5), 1282–1295. doi:10.1364/BOE.2.001282
27. Su, P. J., Chen, W. L., Chen, Y. F., & Dong, C. Y. (2011). Determination of collagen
nanostructure from second-order susceptibility tensor analysis. Biophysical Journal,
100(8), 2053–2062. doi:10.1016/j.bpj.2011.02.015
28. Ambekar, R., Lau, T.-Y., Walsh, M., Bhargava, R., & Toussaint, K. C. (2012). Quantifying
collagen structure in breast biopsies using second-harmonic generation imaging.
Biomedical Optics Express, 3(9), 2021. doi:10.1364/BOE.3.002021
29. Burke, R. M., Madden, K. S., Perry, S. W., Zettel, M. L., & Brown, E. B. (2013). Tumor-
associated macrophages and stromal TNF-α regulate collagen structure in a breast tumor
model as visualized by second harmonic generation. Journal of Biomedical Optics, 18(8),
86003. doi:10.1117/1.JBO.18.8.086003
30. Burke, K. A., Dawes, R. P., Cheema, M. K., Benoit, D. S. W., Perry, S. W., & Brown, E.
(2015). Second-harmonic generation scattering directionality predicts tumor cell motility
in collagen gels. Journal of Biomedical Optics, 20(5), 051024–1–051024–9.
doi:10.1117/1.JBO.20.5.051024
31. Conklin, M. W., Eickhoff, J. C., Riching, K. M., Pehlke, C. a., Eliceiri, K. W., Provenzano,
P. P., … Keely, P. J. (2011). Aligned collagen is a prognostic signature for survival in
human breast carcinoma. American Journal of Pathology, 178(3), 1221–1232.
doi:10.1016/j.ajpath.2010.11.076
32. Ajeti, V., Nadiarnykh, O., Ponik, S. M., Keely, P. J., Eliceiri, K. W., & Campagnola, P. J.
(2011). Structural changes in mixed Col I/Col V collagen gels probed by SHG microscopy:
implications for probing stromal alterations in human breast cancer. Biomedical Optics
Express, 2(8), 2307–2316. doi:10.1364/BOE.2.002307
81
33. Poynard, T., Bedossa, P., & Opolon, P. (1997). Natural history of liver fibrosis progression
in patients with chronic hepatitis C. The Lancet, 349(9055), 825-832.
34. Bedossa, P., Dargère, D., & Paradis, V. (2003). Sampling variability of liver fibrosis in
chronic hepatitis C. Hepatology, 38(6), 1449-1457.
35. Gailhouste, L., Grand, Y. Le, Odin, C., Guyader, D., Turlin, B., Ezan, F., … Baffet, G.
(2010). Fibrillar collagen scoring by second harmonic microscopy: A new tool in the
assessment of liver fibrosis. Journal of Hepatology, 52(3), 398–406.
doi:10.1016/j.jhep.2009.12.009
36. Strupler, M., Pena, a-M., Hernest, M., Tharaux, P.-L., Martin, J.-L., Beaurepaire, E., &
Schanne-Klein, M.-C. (2007). Second harmonic imaging and scoring of collagen in fibrotic
tissues. Optics Express, 15(7), 4054–4065. doi:10.1364/OE.15.004054
37. Breunig, H. G., Weinigel, M., Bückle, R., Kellner-Höfer, M., Lademann, J., Darvin, M. E.,
… König, K. (2013). Clinical coherent anti-Stokes Raman scattering and multiphoton
tomography of human skin with a femtosecond laser and photonic crystal fiber. Laser
Physics Letters, 10(2), 025604. doi:10.1088/1612-2011/10/2/025604
38. Hovhannisyan, V. a., Su, P. J., Lin, S. J., & Dong, C. Y. (2009). Quantifying
thermodynamics of collagen thermal denaturation by second harmonic generation imaging.
Applied Physics Letters, 94(23), 2007–2010. doi:10.1063/1.3142864
39. Meyer, T., Chemnitz, M., Baumgartl, M., Gottschall, T., Pascher, T., Matthäus, C., …
Popp, J. (2013). Expanding multimodal microscopy by high spectral resolution coherent
anti-stokes Raman scattering imaging for clinical disease diagnostics. Analytical
Chemistry, 85(14), 6703–6715. doi:10.1021/ac400570w
40. Plotnikov, S. V., Millard, A. C., Campagnola, P. J., & Mohler, W. A. (2006).
Characterization of the myosin-based source for second-harmonic generation from muscle
sarcomeres. Biophysical journal, 90(2), 693-703. doi:10.1529/biophysj.105.071555
41. Latour, G., Gusachenko, I., Kowalczuk, L., Lamarre, I., & Schanne-Klein, M. (2012). In
vivo structural imaging of the cornea by polarization-resolved second harmonic
microscopy. Biomedical Optics Express, 3(1), 1. doi:10.1364/BOE.3.000001
42. Cicchi, R., Kapsokalyvas, D., Troiano, M., Campolmi, P., Morini, C., Massi, D., …
Pavone, F. S. (2014). In vivo non-invasive monitoring of collagen remodelling by two-
photon microscopy after micro-ablative fractional laser resurfacing. Journal of
Biophotonics, 7(11-12), 914–925. doi:10.1002/jbio.201300124
43. Tan, H. Y., Chang, Y. L., Lo, W., Hsueh, C. M., Chen, W. L., Ghazaryan, A. a., … Dong,
C. Y. (2013). Characterizing the morphologic changes in collagen crosslinked-treated
corneas by Fourier transform-second harmonic generation imaging. Journal of Cataract and
Refractive Surgery, 39(5), 779–788. doi:10.1016/j.jcrs.2012.11.036
82
44. Chen, T., Hilton, M. J., Brown, E. B., Zuscik, M. J., & Awad, H. A. (2013). Engineering
superficial zone features in tissue engineered cartilage. Biotechnology and bioengineering,
110(5), 1476-1486. doi: 10.1002/bit.24799
45. Akilbekova, D., & Bratlie, K. M. (2015). Quantitative Characterization of Collagen in the
Fibrotic Capsule Surrounding Implanted Polymeric Microparticles through Second
Harmonic Generation Imaging. Plos One, 10(6), e0130386.
doi:10.1371/journal.pone.0130386
46. Peng, Q., Zhuo, S., So, P. T. C., & Yu, H. (2015). Improving liver fibrosis diagnosis based
on forward and backward second harmonic generation signals. Applied Physics Letters,
106(8), 083701. doi:10.1063/1.4913907
47. Nadiarnykh, O., LaComb, R. B., Brewer, M. a, & Campagnola, P. J. (2010). Alterations of
the extracellular matrix in ovarian cancer studied by Second Harmonic Generation imaging
microscopy. BMC Cancer, 10, 94. doi:10.1186/1471-2407-10-94
48. Kottmann, R. M., Sharp, J., Owens, K., Salzman, P., Xiao, G.-Q., Phipps, R. P., … Perry,
S. W. (2015). Second harmonic generation microscopy reveals altered collagen
microstructure in usual interstitial pneumonia versus healthy lung. Respiratory Research,
16(1), 1–13. doi:10.1186/s12931-015-0220-8
49. Cordier, J. F. (2006). Cryptogenic organising pneumonia. European Respiratory Journal,
28(2), 422–446. doi:10.1183/09031936.06.00013505
50. Lynch 3rd, J. P., Saggar, R., Weigt, S. S., Zisman, D. A., & White, E. S. (2006, December).
Usual interstitial pneumonia. In Seminars in respiratory and critical care medicine (Vol.
27, No. 6, pp. 634-651).doi:10.1055/s-2006-957335
51. Linke, J., McDermid, G. J., Pape, A. D., McLane, A. J., Laskin, D. N., Hall-Beyer, M., &
Franklin, S. E. (2009). The influence of patch-delineation mismatches on multi-temporal
landscape pattern analysis. Landscape Ecology, 24(2), 157-170. doi: 10.1007/s10980-008-
9290-z
52. Rudolph, R. (1987). Wide spread scars, hypertrophic scars, and keloids. Clinics in plastic
surgery, 14(2), 253-260. PMID: 3581659
53. Zhuo, S., Yan, J., Chen, G., Shi, H., Zhu, X., Lu, J., … Xie, S. (2012). Label-free imaging
of basement membranes differentiates normal, precancerous, and cancerous colonic tissues
by second-harmonic generation microscopy. PLoS ONE, 7(6), 4–7.
doi:10.1371/journal.pone.0038655
54. Zhuo, S., Zhu, X., Wu, G., Chen, J., & Xie, S. (2011). Quantitative biomarkers of colonic
dysplasia based on intrinsic second-harmonic generation signal. Journal of Biomedical
Optics, 16(12), 120501. doi:10.1117/1.3659715
83
55. Perry, S. W., Burke, R. M., & Brown, E. B. (2012). Two Photon and Second Harmonic
Microscopy in Clinical and Translational Cancer Research. Annals of Biomedical
Engineering, 40(2), 277–291. doi:10.1007/s10439-012-0512-9.
56. Sobin, L. H., & Fleming, I. D. (1997). TNM classification of malignant tumors, fifth edition
(1997). Cancer, 80(9), 1803–1804. doi:10.1002/(SICI)1097-
0142(19971101)80:9<1803::AID-CNCR16>3.0.CO;2-9
57. Provenzano, P. P., Eliceiri, K. W., Campbell, J. M., Inman, D. R., White, J. G., & Keely,
P. J. (2006). Collagen reorganization at the tumor-stromal interface facilitates local
invasion. BMC Medicine, 4(1), 38. doi:10.1186/1741-7015-4-38
58. Jiang, X., Zhong, J., Liu, Y., Yu, H., Zhuo, S., & Chen, J. (2011). Two-photon fluorescence
and second-harmonic generation imaging of collagen in human tissue based on
multiphoton microscopy. Scanning, 33(1), 53–56. doi:10.1002/sca.20219
59. Birk, J. W., Tadros, M., Moezardalan, K., Nadyarnykh, O., Forouhar, F., Anderson, J., &
Campagnola, P. (2014). Second harmonic generation imaging distinguishes both high-
grade dysplasia and cancer from normal colonic mucosa. Digestive Diseases and Sciences,
59(7), 1529–1534. doi:10.1007/s10620-014-3121-7
84
CHAPTER 4
COLLAGEN ORGANIZATION OF FIBROBLASTS ENCAPSULATED IN
PH RESPONSIVE METHACRYLATED ALGINATE HYDROGELS
Modified from a manuscript published in Journal of Biomedical Materials Research Part A
(2018)
The pH of dermal wounds shifts from neutral during the inflammatory phase to slightly
basic in the tissue remodeling phase. Stage specific wound treatment can be developed using
environmentally responsive alginate hydrogels. The chemistry of these networks dictates swelling
behavior. Here, we fabricated alginate hydrogels using chain growth, step growth, and combined
mixed mode gelation methods to crosslink methacrylated alginate (ALGMA) and gain control over
swelling responses. Methacrylation of the alginate network was confirmed through NMR
spectroscopy. Strontium cations were introduced to fabricate stiffer, dually crosslinked hydrogels.
Dual crosslinking significantly decreased the swelling response over the pH range of 3 to 9 for
step growth and chain growth hydrogels, with no impact on mixed mode hydrogels. The extent of
crosslinking altered the hydrogel degradation profiles under accelerated degradation conditions.
Encapsulated NIH/3T3 fibroblasts in the different ALGMA hydrogels remained viable with
greater cell proliferation in the stiffer gels. Collagen organization deposited by the NIH/3T3
fibroblasts was monitored using second harmonic generation (SHG) microscopy and was
influenced by the crosslinking mechanism. Ionic chain growth and ionic mixed mode crosslinked
ALGMA hydrogels caused relatively isotropic collagen organization, particularly 10 days post-
cell encapsulation. Principal component analysis (PCA) was employed to uncover correlations
between the observed properties. The ability of these environmentally responsive gels to induce
isotropic collagen and respond to pH changes means they hold promise as phase specific wound
dressings.
85
4.1. Introduction
Wound healing responses are dynamic processes with both cell types and their
populations changing throughout the process.1 The sequence of events following injury can be
divided into four overlapping phases: hemostasis, inflammation, proliferation, and remodeling.2
Depending on the physiological response from the inflammatory phase to proliferation, wounds
can be classified as acute or chronic.3 Chronic wounds can result from a compromised immune
response, as is common in diabetes.4 Diabetic foot ulcers occur in over 15 to 25% of diabetics,
with an annual incidence rate of over 10%.5 A recent study showed that there has been an
approximately three fold increase in the cost of skin disease related medical expenses from $29 to
75 billion in the past 13 years.6,7 The economic burden and high incidence rate of chronic wounds
demonstrates the need for rapid and effective treatments for these afflictions.
Alginate has been widely used as a biomaterial for applications in wound healing and tissue
engineering as it is naturally occurring, relatively inexpensive, can provide a moist environment
suitable for encapsulated cells, and can be gelled under mild conditions. Divalent cations are
typically used to ionically crosslink alginate in situ.8 However, these physical interactions are
weak, meaning that divalent cations can be easily displaced by physiologically abundant
monovalent sodium.9 Chain and step growth crosslinked hydrogels have been used to
encapsulating cells for drug release and tissue engineering applications.10 Thiol-ene chemistry is a
facile and selective reaction that can be used to crosslink a wide variety of naturally and synthetic
polymers.11 This method is a viable modification strategy to chemically crosslink biological
molecules using thiodendrimers, which is a significant improvement on previous copper based
crosslinking reactions which caused cytotoxicity.12 Alginate hydrogels covalently crosslinked
86
through chain growth and click chemistry are cytocompatible, mechanically tunable hydrogels that
are capable of providing a good approximation for studying in vivo biomaterial interactions.
In situ photocrosslinkable polymers are a promising construct for fabricating hydrogel for
varied applications such as drug release systems, as well as tunable sensors for biomedical
applications.13 Ultraviolet (UV) light can be used to initiate free radical polymerization to
covalently crosslink functional methacrylate groups on the polymer chain and induce liquid-solid
transitions of cell-gel formulations. Previous studies showed successful crosslinking of alginate
and hyaluronic acid based hydrogels using methacrylate functional groups to prepare tissue
engineering constructs.14 These functional hydrogels were used to encapsulate chondrocytes in an
osteochondral defect model.15 Increased collagen secretion, swelling responses, and
biocompatibility of encapsulated cells were some of the key parameters identified in these studies
that can be further studied for the development of environmentally responsive hydrogels
synthesized from methacrylated polysaccharides.15,16
An integral aspect of developing topical formulations to aid in the wound healing response
is to synthesize environmentally responsive hydrogels.17 The chemical structure of the polymer
network plays a major role in the response to different environmental cues. Many properties such
as ionization equilibrium, counterion species, and ion concentration can control the pH response
of ionically crosslinked hydrogels.16,18 However, less focus has been paid to pH responses of
covalently crosslinked hydrogels. In this study, we present a method for functionalizing very low
viscosity alginate using methacrylic anhydride to improve the mechanical properties and
degradation kinetics of the hydrogel. This allows us to photo-crosslink ALGMA through step
growth, chain growth, or a combination of the two, termed mixed mode to form soft yet
biocompatible hydrogels. We investigated the mechanical properties, swelling responses under
87
diverse pH conditions, degradation kinetics, cytocompatibility, and collagen deposition by
encapsulated NIH/3T3 fibroblasts in the hydrogels. With the use of statistical analytical techniques
such as PCA, we aimed to identify key factors that can improve rational design for the synthesis
of a hydrogel formulation that can be used for tissue engineering applications pertinent to the
treatment of chronic wounds.
4.2. Experimental
4.2.1. Materials
Very low viscosity alginic acid (CAS 9005-38-3) was obtained from Alfa Aesar
(Tewksbury, MA). Other materials were purchased through Sigma Aldrich (St. Louis, MO) and
were used as received, unless otherwise stated. Fresh deionized water (Milli-Q, Thermo Scientific
Nanopure, Waltham, MA) was used throughout this study.
4.2.2. Methacrylated Alginate (ALGMA) Synthesis
ALGMA was prepared as previously described.19 Briefly, a 1% (w/v) solution of very low
viscosity alginic acid in DI water was prepared. While the solution was mixing, 16 mL of
methacrylic anhydride was slowly added. The pH was maintained between 8 to 9 using 5 M NaOH
while reacting at 4 ℃ for 24 h. The solution was dialyzed for 48 h against water using a molecular
weight cutoff membrane of 13,000 Da. The dialysate was changed twice daily. The solution was
lyophilized (4.5L, Labconco, Kansas City, MO) and the ALGMA was collected as a white, soft
solid. This reaction is illustrated in Figure 4.1.
NMR was used to confirm methacrylation of the alginic acid. Solutions of alginate and
ALGMA were prepared using standard protocols.20,21 Briefly, ALGMA was dissolved in D2O and
lyophilized three times to replace all protons with deuterium before ~12.5 mg of polymer was
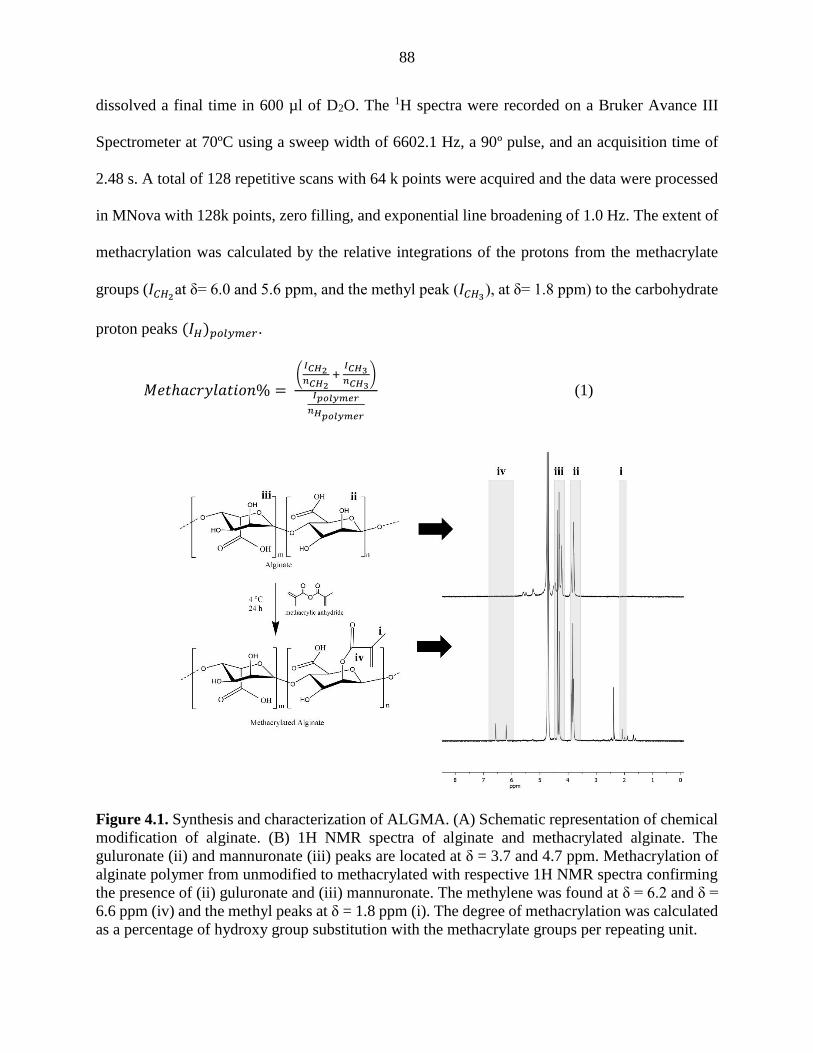
88
dissolved a final time in 600 µl of D2O. The 1H spectra were recorded on a Bruker Avance III
Spectrometer at 70ºC using a sweep width of 6602.1 Hz, a 90º pulse, and an acquisition time of
2.48 s. A total of 128 repetitive scans with 64 k points were acquired and the data were processed
in MNova with 128k points, zero filling, and exponential line broadening of 1.0 Hz. The extent of
methacrylation was calculated by the relative integrations of the protons from the methacrylate
groups (𝐼𝐶𝐻2at δ= 6.0 and 5.6 ppm, and the methyl peak (𝐼𝐶𝐻3
), at δ= 1.8 ppm) to the carbohydrate
proton peaks (𝐼𝐻)𝑝𝑜𝑙𝑦𝑚𝑒𝑟.
𝑀𝑒𝑡ℎ𝑎𝑐𝑟𝑦𝑙𝑎𝑡𝑖𝑜𝑛% = (
𝐼𝐶𝐻2𝑛𝐶𝐻2
+ 𝐼𝐶𝐻3𝑛𝐶𝐻3
)
𝐼𝑝𝑜𝑙𝑦𝑚𝑒𝑟
𝑛𝐻𝑝𝑜𝑙𝑦𝑚𝑒𝑟
(1)
Figure 4.1. Synthesis and characterization of ALGMA. (A) Schematic representation of chemical
modification of alginate. (B) 1H NMR spectra of alginate and methacrylated alginate. The
guluronate (ii) and mannuronate (iii) peaks are located at δ = 3.7 and 4.7 ppm. Methacrylation of
alginate polymer from unmodified to methacrylated with respective 1H NMR spectra confirming
the presence of (ii) guluronate and (iii) mannuronate. The methylene was found at δ = 6.2 and δ =
6.6 ppm (iv) and the methyl peaks at δ = 1.8 ppm (i). The degree of methacrylation was calculated
as a percentage of hydroxy group substitution with the methacrylate groups per repeating unit.
89
4.2.3. Hydrogel Fabrication and Characterization
To 10 ml of DI water, 300 mg of ALGMA was dissolved to obtain a 3% (w/v) solution.
Irgacure 2959 (10 mg) was added to the stock solution. Three different gelation reactions, step
growth, chain growth, and mixed mode polymerization were used to obtain different hydrogels.
For chain growth gels, an aliquot of the stock solution was degassed under vacuum. For step
growth polymerization, 250 µl of 4 mg/ml dithiothreitol (DTT) was added to the stock solution.
For the mixed mode polymerization, 250 µl of 4 mg/ml DTT was added to the stock solution and
it was degassed. All three pre-gels were exposed to UV light (365 nm, 2 W/cm2) for 10 minutes.
For preparation of dually crosslinked ALGMA hydrogels, 100 l of 0.2 M SrCl2 was added after
the gels were exposed to UV light.
Hydrogel pegs (6 mm thick, 16 mm diameter, n = 4) were placed between two glass slides
on top of which weights were added. Height changes and cross-section areas of the hydrogel pegs
were measured through Image-J (NIH, Bethesda, MD). The compressive modulus was defined as
the slope of the linear region in the stress-strain curve in the 5 – 15% strain range.
To measure the swelling ratios, the hydrogels (n = 3) were dried at room temperature in a
desiccator. The solid was then swelled in 1 mM acetate buffer solution at pH 3, 5, 7.4, or 9 for 2
days. The wet and dry weights were recorded, and the swelling ratios were calculated using
equation (1), where M𝑤 is the wet mas and M𝑑 is the dry mass.
S =M𝑤 − 𝑀𝑑
𝑀𝑑 (2)
4.2.4. In Vitro Degradation
For each gelation method, 1 ml of hydrogel was exposed to UV light and placed in 0.1 mM
NaOH to determine how the crosslinking mechanisms affected gel stability and degradation
90
profiles. The hydrogels were first equilibrated for 24 h in water before measuring the initial mass
to eliminate swelling effects. The mass of the hydrogel (n = 3) was measured every 24 h and
compared with the initial mass.
4.2.5. Cell Culture and Viability Assay
NIH/3T3 fibroblasts (ATCC, Manassas, VA) were cultured at 37°C with 5% CO2 in
complete medium (CM, Dulbecco’s modified Eagle’s medium (Thermo Scientific) supplemented
with 10% bovine calf serum, 100 U/L penicillin, and 100 μg/ml streptomycin). To 48 well plates,
200 μl of cell solution at 1 107 cells/ml was mixed with 300 μl hydrogel. Both live and dead
controls were made in which the cells were plated directly on the tissue culture plastic in the
absence of hydrogel. After 48 h, the dead control was aspirated and 300 μl of 70% ethanol was
added for 10 minutes to kill the cells. The supernatant in each well was then aspirated and replaced
with 150 μl phosphate buffered saline (PBS) with 0.3 μl of 1 mg/ml calcein-AM and 1.12 μl of 1
mg/ml 7-aminoactinomycin D (7-AAD) and incubated for 40 mins. Images were taken with a
EVOS Floid Cell Image Station (Thermo Scientific) using the red (excitation/emission 586/646
nm) and the green channels (482/532 nm).
4.2.6. SHG Microscopy Imaging of the gels
NIH/3T3 fibroblasts were suspended at a concentration of 1 107 cells/ml and mixed with
an equal volume of hydrogel precursor solution. This solution (100 μl) was pipetted between two
glass coverslips, exposed to UV light for crosslinking, and placed in Petri dishes containing CM.
The cells were fed every three days. Negative controls consisting of gels without cells were also
prepared. After 5, 7, or 10 days, the samples were fixed in 10% formalin solution and imaged.
All samples were imaged using a mode-locked Ti:Sapphire laser (100 fs pulse width, 1
kHz repetition rate, Libra, Coherent, Santa Clara, CA) that produces an 800 nm fundamental. The
91
average power at the sample image plane was controlled using a combination of a half-wave plate
and a Glan-Thompson polarizer (Thorlabs, Newton, NJ). Second harmonic signal was collected in
the transmission mode. For this setup, an inverted microscope (AmScope, Irvine, CA) and Nikon
Plan Fluorite objective (20 , 0.50 NA, 2.1 mm WD, Nikon, Melville, NY) was used to focus the
beam and the SHG transmission was collected with a Nikon water immersion objective (40 , 0.8
NA, 3.5 mm WD, Nikon). The transmitted SHG signal was reflected by a dichroic mirror
(DMLP425T, Thorlabs) and separated from the fundamental beam with two short pass filters <
450nm (FGB37M, Thorlabs) and 808 nm notch filter (NF-808.0-E-25.0M, Melles Griot,
Rochester, NY), before detection by an intensified CCD (iCCD, iStar 334T, Andor, Belfast, UK).
Polarized SHG imaging was conducted using a Glan-Thompson polarizer and a half-wave plate
mounted on a motor driven rotational stage (Thorlabs) to achieve linear polarization. Images of
the samples were collected every 10° from 0° to 350°. A minimum of three images for each
experimental condition was taken. From this collection of images, regions of interest (ROI) were
fit using the following equation:
𝐼𝑆𝐻𝐺 = 𝑐 ∙ {[𝑠𝑖𝑛2(𝜃𝑒 − 𝜃𝑜) + (𝜒𝑧𝑧𝑧
𝜒𝑧𝑥𝑥) 𝑐𝑜𝑠2(𝜃𝑒 − 𝜃𝑜) ]
2
+ (𝜒𝑥𝑧𝑥
𝜒𝑧𝑥𝑥)
2
sin2(2(𝜃𝑒 − 𝜃𝑜))} (3)
where 𝜒𝑧𝑧𝑧
𝜒𝑧𝑥𝑥 and
𝜒𝑥𝑧𝑥
𝜒𝑧𝑥𝑥 are second-order susceptibility tensor element ratios, 𝜃𝑒 and 𝜃𝑜 are incident
polarization angle and collagen fiber angle, respectively, and c is a normalization constant. The
orientation angle of collagen in each ROI was calculated and a histogram was generated. Collagen
organization was measured by fitting the orientation angle histogram with a Gaussian fit over a
180 profile and full-width at half maximum (FWHM) values were obtained. Collagen types were
identified using a previously described method.22 Briefly, collagen gels with varying collagen type
III concentrations were imaged using SHG microscopy and the data was fit using equation 2.
92
Histograms of 𝜒𝑥𝑧𝑥
𝜒𝑧𝑥𝑥 revealed the present of two peaks: one at ~0.8, which is assigned to collagen
type III and the second at ~1.2, corresponding to collagen type I. The ratios of these integrated
peaks were plotted against collagen type III concentration to yield a standard curve. This curve
was used to estimate collagen type III concentrations in the imaged hydrogels.
4.2.7. Statistical Analysis
All data was subjected to statistical analysis and values are reported as mean ± standard
deviation (SD). Statistical significance of the mean comparisons was determined by a two-way
ANOVA. Pair-wise comparisons were analyzed with Tukey’s honest significant difference test.
Differences were considered statistically significant for p < 0.05. Principal component analysis
was conducted to uncover the correlations between the characterized properties of the gels and the
collagen response from the encapsulated fibroblasts.
4.3 Results
4.3.1. Characterization of ALGMA Hydrogels
ALGMA was characterized using 1H NMR spectroscopy (Figure 4.1), using a previously
described protocol.23 The mannuronic acid content of the unmodified alginate was determined to
be 45 ± 2%, with ii and iii labeling the guluronate and mannuronate residue peaks.24 Two peaks
appear in the ALGMA spectrum at 6.0 and 6.4 ppm, which are assigned to the methylene and
methacrylamide protons, labeled as iv (Figure 4.1). The extent of methacrylation was calculated
through the relative integration of the methacrylate and methyl peak (at 1.8 ppm, labeled as i) to
those from the protons of the modified alginate, as 25 ± 2%, using a previously described
procedure.25
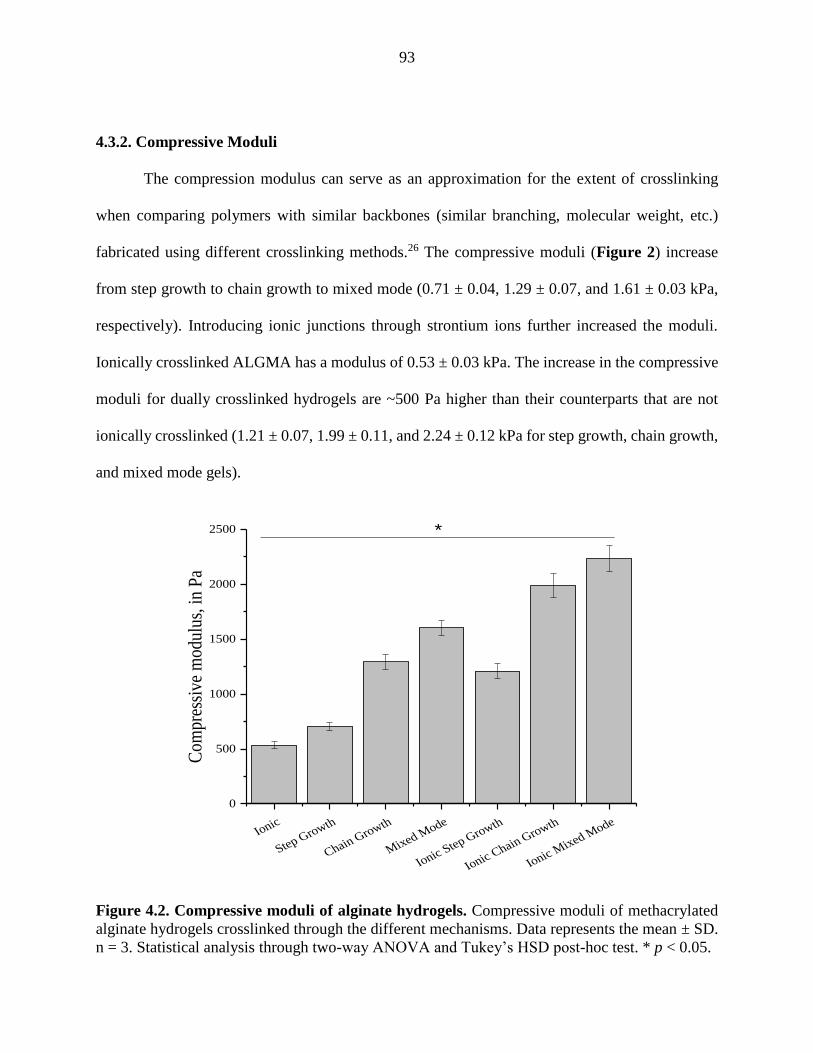
93
4.3.2. Compressive Moduli
The compression modulus can serve as an approximation for the extent of crosslinking
when comparing polymers with similar backbones (similar branching, molecular weight, etc.)
fabricated using different crosslinking methods.26 The compressive moduli (Figure 2) increase
from step growth to chain growth to mixed mode (0.71 ± 0.04, 1.29 ± 0.07, and 1.61 ± 0.03 kPa,
respectively). Introducing ionic junctions through strontium ions further increased the moduli.
Ionically crosslinked ALGMA has a modulus of 0.53 ± 0.03 kPa. The increase in the compressive
moduli for dually crosslinked hydrogels are ~500 Pa higher than their counterparts that are not
ionically crosslinked (1.21 ± 0.07, 1.99 ± 0.11, and 2.24 ± 0.12 kPa for step growth, chain growth,
and mixed mode gels).
Figure 4.2. Compressive moduli of alginate hydrogels. Compressive moduli of methacrylated
alginate hydrogels crosslinked through the different mechanisms. Data represents the mean ± SD.
n = 3. Statistical analysis through two-way ANOVA and Tukey’s HSD post-hoc test. * p < 0.05.
Ionic
Step Growth
Chain Growth
Mixed Mode
Ionic Step Growth
Ionic Chain Growth
Ionic Mixed M
ode
0
500
1000
1500
2000
2500
Com
pres
sive
mod
ulus
, in
Pa
*
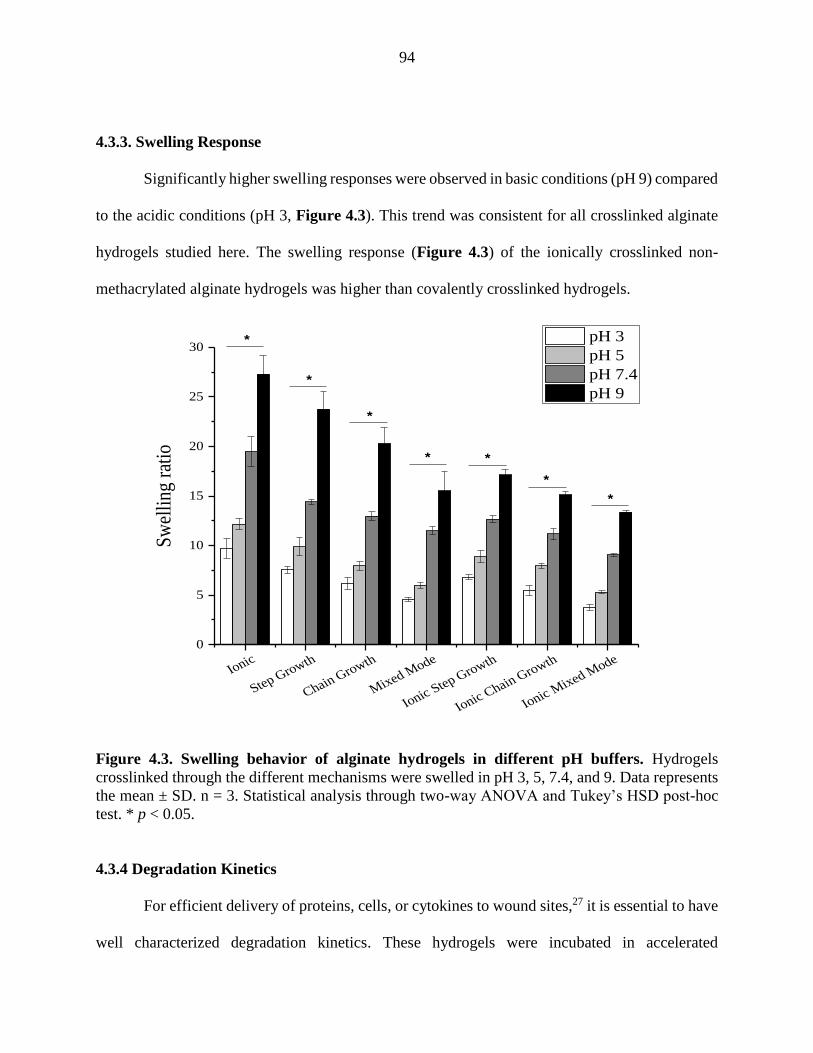
94
4.3.3. Swelling Response
Significantly higher swelling responses were observed in basic conditions (pH 9) compared
to the acidic conditions (pH 3, Figure 4.3). This trend was consistent for all crosslinked alginate
hydrogels studied here. The swelling response (Figure 4.3) of the ionically crosslinked non-
methacrylated alginate hydrogels was higher than covalently crosslinked hydrogels.
Figure 4.3. Swelling behavior of alginate hydrogels in different pH buffers. Hydrogels
crosslinked through the different mechanisms were swelled in pH 3, 5, 7.4, and 9. Data represents
the mean ± SD. n = 3. Statistical analysis through two-way ANOVA and Tukey’s HSD post-hoc
test. * p < 0.05.
4.3.4 Degradation Kinetics
For efficient delivery of proteins, cells, or cytokines to wound sites,27 it is essential to have
well characterized degradation kinetics. These hydrogels were incubated in accelerated
Ionic
Step Growth
Chain Growth
Mixed Mode
Ionic Step Growth
Ionic Chain Growth
Ionic Mixed M
ode
0
5
10
15
20
25
30
*
*
**
*
*
Sw
elli
ng r
atio
pH 3
pH 5
pH 7.4
pH 9*
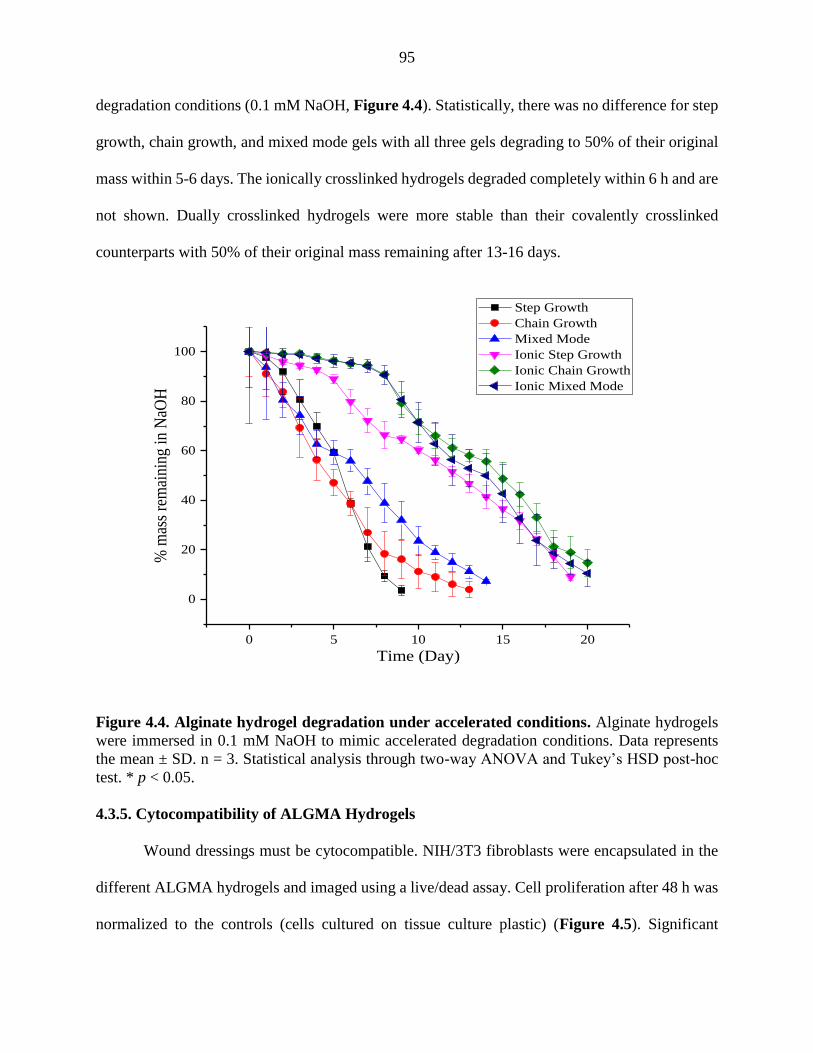
95
degradation conditions (0.1 mM NaOH, Figure 4.4). Statistically, there was no difference for step
growth, chain growth, and mixed mode gels with all three gels degrading to 50% of their original
mass within 5-6 days. The ionically crosslinked hydrogels degraded completely within 6 h and are
not shown. Dually crosslinked hydrogels were more stable than their covalently crosslinked
counterparts with 50% of their original mass remaining after 13-16 days.
Figure 4.4. Alginate hydrogel degradation under accelerated conditions. Alginate hydrogels
were immersed in 0.1 mM NaOH to mimic accelerated degradation conditions. Data represents
the mean ± SD. n = 3. Statistical analysis through two-way ANOVA and Tukey’s HSD post-hoc
test. * p < 0.05.
4.3.5. Cytocompatibility of ALGMA Hydrogels
Wound dressings must be cytocompatible. NIH/3T3 fibroblasts were encapsulated in the
different ALGMA hydrogels and imaged using a live/dead assay. Cell proliferation after 48 h was
normalized to the controls (cells cultured on tissue culture plastic) (Figure 4.5). Significant
0 5 10 15 20
0
20
40
60
80
100
% m
ass
rem
aini
ng i
n N
aOH
Time (Day)
Step Growth
Chain Growth
Mixed Mode
Ionic Step Growth
Ionic Chain Growth
Ionic Mixed Mode
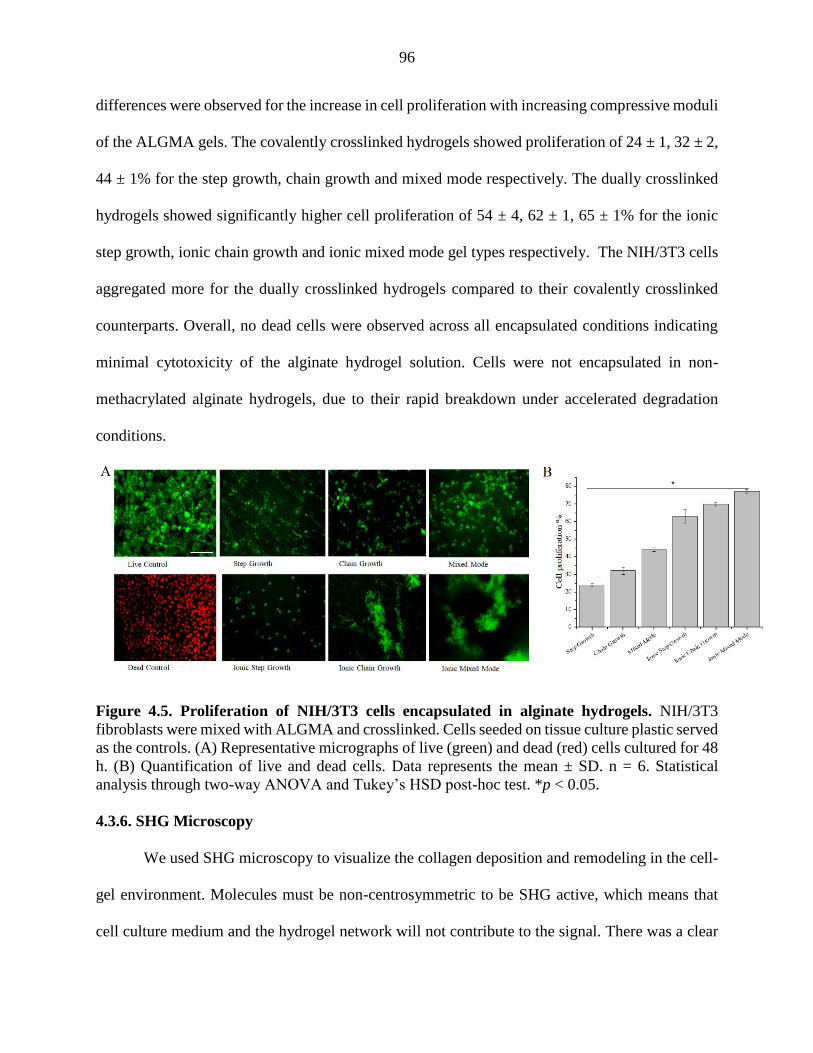
96
differences were observed for the increase in cell proliferation with increasing compressive moduli
of the ALGMA gels. The covalently crosslinked hydrogels showed proliferation of 24 ± 1, 32 ± 2,
44 ± 1% for the step growth, chain growth and mixed mode respectively. The dually crosslinked
hydrogels showed significantly higher cell proliferation of 54 ± 4, 62 ± 1, 65 ± 1% for the ionic
step growth, ionic chain growth and ionic mixed mode gel types respectively. The NIH/3T3 cells
aggregated more for the dually crosslinked hydrogels compared to their covalently crosslinked
counterparts. Overall, no dead cells were observed across all encapsulated conditions indicating
minimal cytotoxicity of the alginate hydrogel solution. Cells were not encapsulated in non-
methacrylated alginate hydrogels, due to their rapid breakdown under accelerated degradation
conditions.
Figure 4.5. Proliferation of NIH/3T3 cells encapsulated in alginate hydrogels. NIH/3T3
fibroblasts were mixed with ALGMA and crosslinked. Cells seeded on tissue culture plastic served
as the controls. (A) Representative micrographs of live (green) and dead (red) cells cultured for 48
h. (B) Quantification of live and dead cells. Data represents the mean ± SD. n = 6. Statistical
analysis through two-way ANOVA and Tukey’s HSD post-hoc test. *p < 0.05.
4.3.6. SHG Microscopy
We used SHG microscopy to visualize the collagen deposition and remodeling in the cell-
gel environment. Molecules must be non-centrosymmetric to be SHG active, which means that
cell culture medium and the hydrogel network will not contribute to the signal. There was a clear
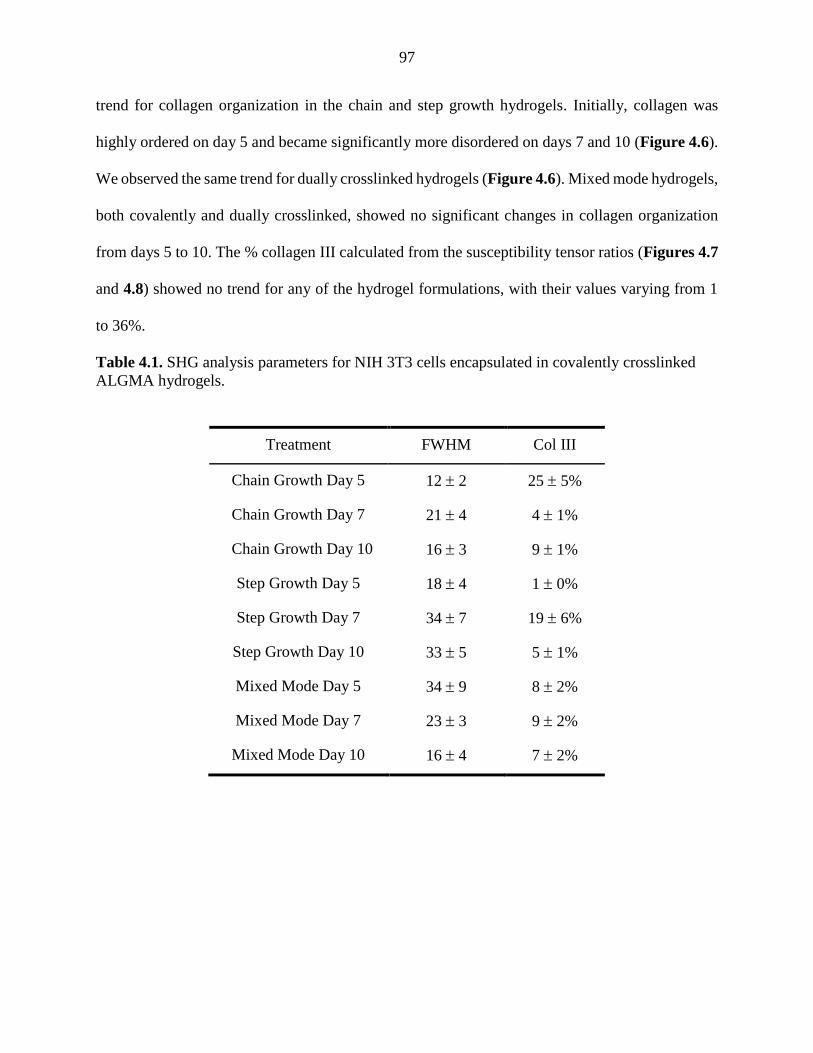
97
trend for collagen organization in the chain and step growth hydrogels. Initially, collagen was
highly ordered on day 5 and became significantly more disordered on days 7 and 10 (Figure 4.6).
We observed the same trend for dually crosslinked hydrogels (Figure 4.6). Mixed mode hydrogels,
both covalently and dually crosslinked, showed no significant changes in collagen organization
from days 5 to 10. The % collagen III calculated from the susceptibility tensor ratios (Figures 4.7
and 4.8) showed no trend for any of the hydrogel formulations, with their values varying from 1
to 36%.
Table 4.1. SHG analysis parameters for NIH 3T3 cells encapsulated in covalently crosslinked
ALGMA hydrogels.
Treatment FWHM Col III
Chain Growth Day 5 12 2 25 5%
Chain Growth Day 7 21 4 4 1%
Chain Growth Day 10 16 3 9 1%
Step Growth Day 5 18 4 1 0%
Step Growth Day 7 34 7 19 6%
Step Growth Day 10 33 5 5 1%
Mixed Mode Day 5 34 9 8 2%
Mixed Mode Day 7 23 3 9 2%
Mixed Mode Day 10 16 4 7 2%
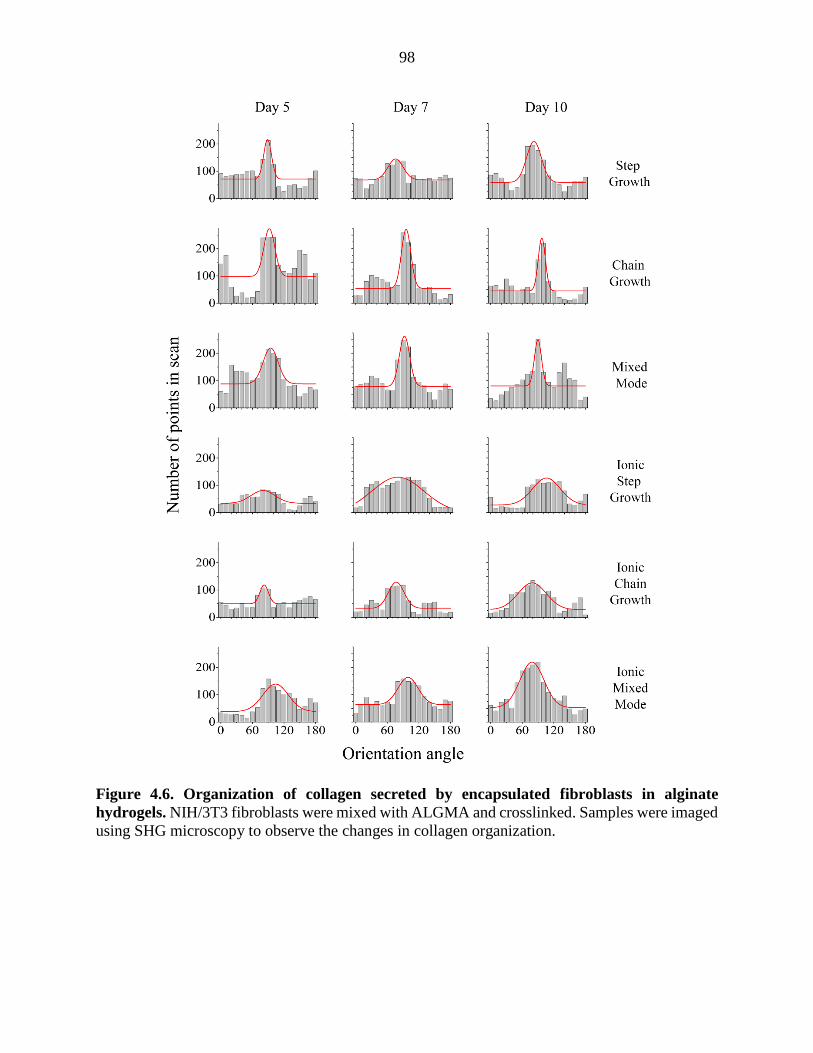
98
Figure 4.6. Organization of collagen secreted by encapsulated fibroblasts in alginate
hydrogels. NIH/3T3 fibroblasts were mixed with ALGMA and crosslinked. Samples were imaged
using SHG microscopy to observe the changes in collagen organization.
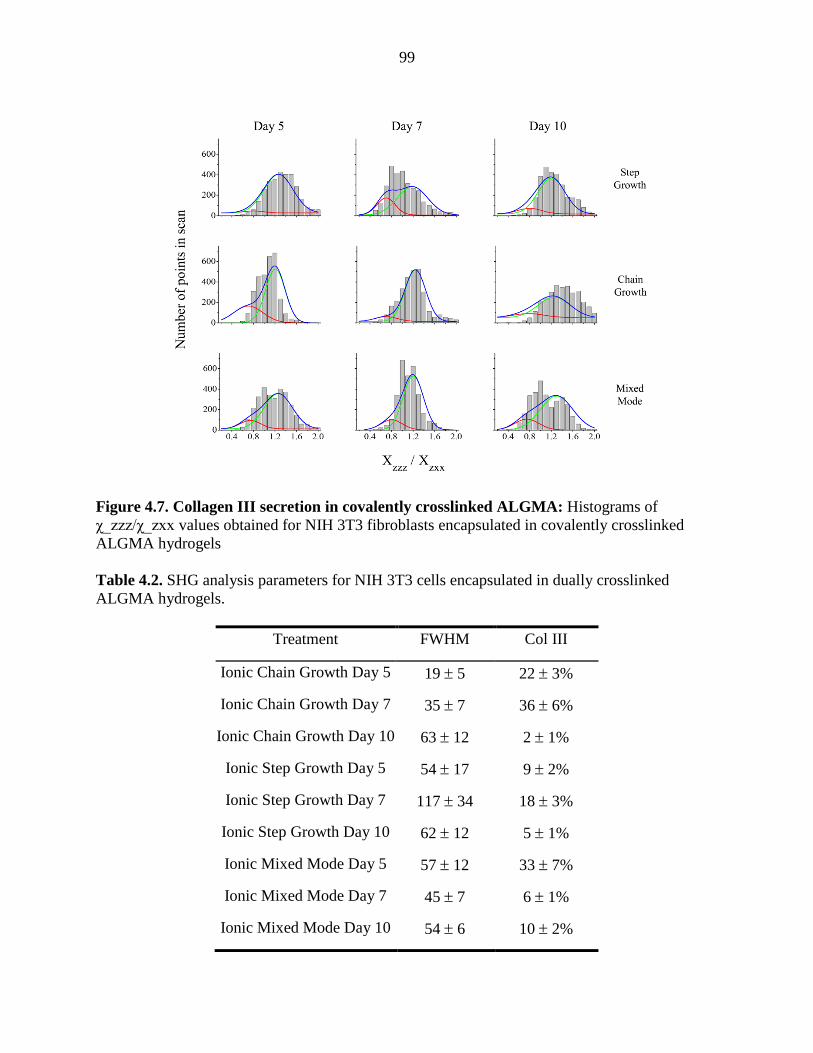
99
Figure 4.7. Collagen III secretion in covalently crosslinked ALGMA: Histograms of
χ_zzz/χ_zxx values obtained for NIH 3T3 fibroblasts encapsulated in covalently crosslinked
ALGMA hydrogels
Table 4.2. SHG analysis parameters for NIH 3T3 cells encapsulated in dually crosslinked
ALGMA hydrogels.
Treatment FWHM Col III
Ionic Chain Growth Day 5 19 5 22 3%
Ionic Chain Growth Day 7 35 7 36 6%
Ionic Chain Growth Day 10 63 12 2 1%
Ionic Step Growth Day 5 54 17 9 2%
Ionic Step Growth Day 7 117 34 18 3%
Ionic Step Growth Day 10 62 12 5 1%
Ionic Mixed Mode Day 5 57 12 33 7%
Ionic Mixed Mode Day 7 45 7 6 1%
Ionic Mixed Mode Day 10 54 6 10 2%
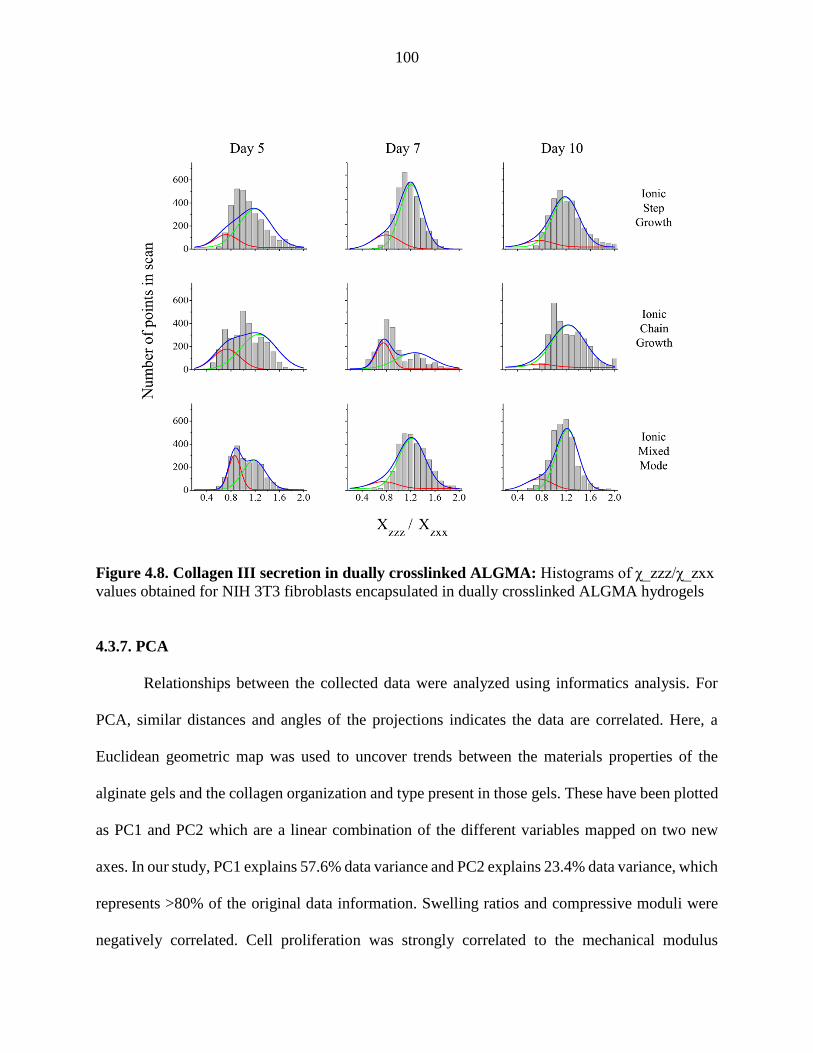
100
Figure 4.8. Collagen III secretion in dually crosslinked ALGMA: Histograms of χ_zzz/χ_zxx
values obtained for NIH 3T3 fibroblasts encapsulated in dually crosslinked ALGMA hydrogels
4.3.7. PCA
Relationships between the collected data were analyzed using informatics analysis. For
PCA, similar distances and angles of the projections indicates the data are correlated. Here, a
Euclidean geometric map was used to uncover trends between the materials properties of the
alginate gels and the collagen organization and type present in those gels. These have been plotted
as PC1 and PC2 which are a linear combination of the different variables mapped on two new
axes. In our study, PC1 explains 57.6% data variance and PC2 explains 23.4% data variance, which
represents >80% of the original data information. Swelling ratios and compressive moduli were
negatively correlated. Cell proliferation was strongly correlated to the mechanical modulus
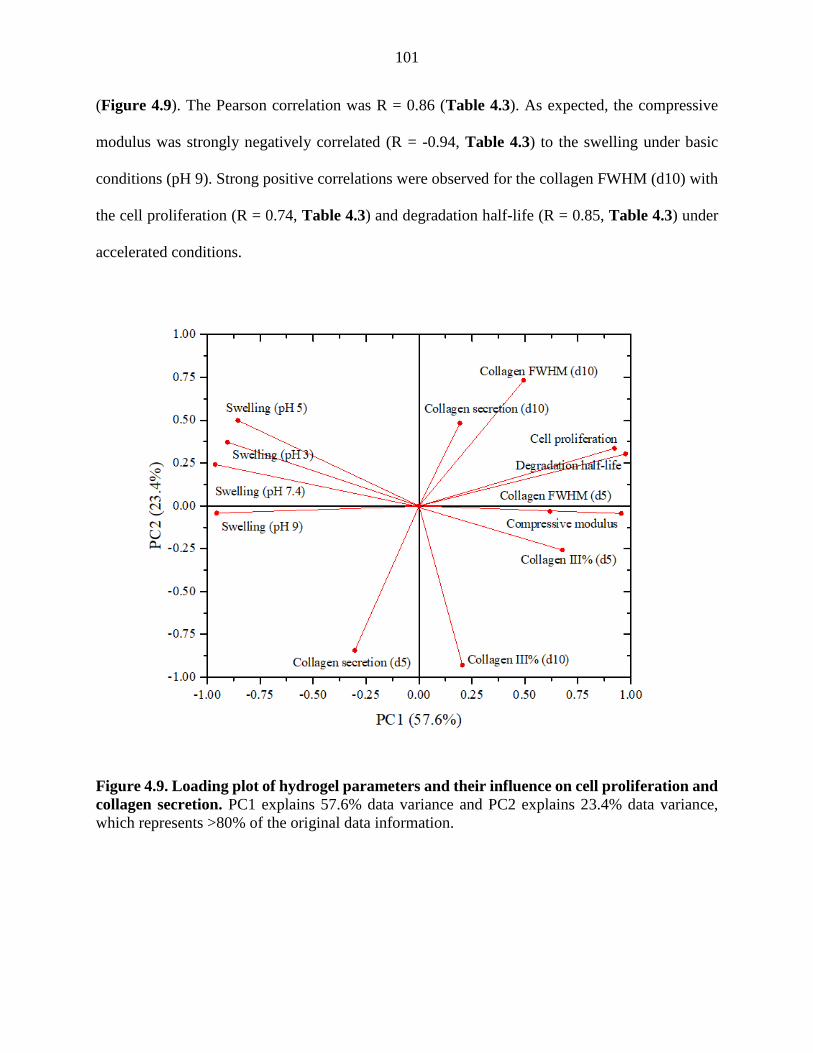
101
(Figure 4.9). The Pearson correlation was R = 0.86 (Table 4.3). As expected, the compressive
modulus was strongly negatively correlated (R = -0.94, Table 4.3) to the swelling under basic
conditions (pH 9). Strong positive correlations were observed for the collagen FWHM (d10) with
the cell proliferation (R = 0.74, Table 4.3) and degradation half-life (R = 0.85, Table 4.3) under
accelerated conditions.
Figure 4.9. Loading plot of hydrogel parameters and their influence on cell proliferation and
collagen secretion. PC1 explains 57.6% data variance and PC2 explains 23.4% data variance,
which represents >80% of the original data information.
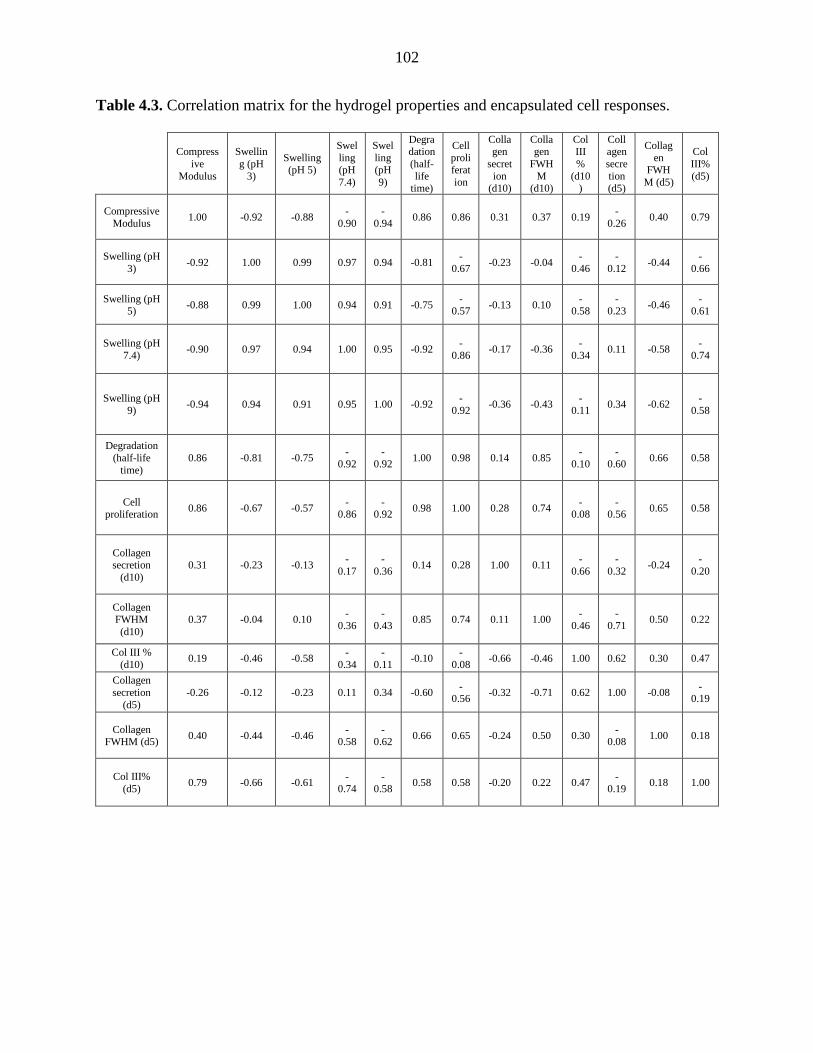
102
Table 4.3. Correlation matrix for the hydrogel properties and encapsulated cell responses.
Compress
ive
Modulus
Swellin
g (pH
3)
Swelling (pH 5)
Swel
ling (pH
7.4)
Swel
ling (pH
9)
Degradation
(half-
life time)
Cell
proliferat
ion
Collagen
secret
ion (d10)
Collagen
FWH
M (d10)
Col III
%
(d10)
Collagen
secre
tion (d5)
Collag
en FWH
M (d5)
Col
III%
(d5)
Compressive
Modulus 1.00 -0.92 -0.88
-
0.90
-
0.94 0.86 0.86 0.31 0.37 0.19
-
0.26 0.40 0.79
Swelling (pH
3) -0.92 1.00 0.99 0.97 0.94 -0.81
-
0.67 -0.23 -0.04
-
0.46
-
0.12 -0.44
-
0.66
Swelling (pH 5)
-0.88 0.99 1.00 0.94 0.91 -0.75 -
0.57 -0.13 0.10
-0.58
-0.23
-0.46 -
0.61
Swelling (pH
7.4) -0.90 0.97 0.94 1.00 0.95 -0.92
-
0.86 -0.17 -0.36
-
0.34 0.11 -0.58
-
0.74
Swelling (pH
9) -0.94 0.94 0.91 0.95 1.00 -0.92
-
0.92 -0.36 -0.43
-
0.11 0.34 -0.62
-
0.58
Degradation
(half-life
time)
0.86 -0.81 -0.75 -
0.92 -
0.92 1.00 0.98 0.14 0.85
-0.10
-0.60
0.66 0.58
Cell proliferation
0.86 -0.67 -0.57 -
0.86 -
0.92 0.98 1.00 0.28 0.74
-0.08
-0.56
0.65 0.58
Collagen secretion
(d10)
0.31 -0.23 -0.13 -
0.17
-
0.36 0.14 0.28 1.00 0.11
-
0.66
-
0.32 -0.24
-
0.20
Collagen FWHM
(d10)
0.37 -0.04 0.10 -
0.36
-
0.43 0.85 0.74 0.11 1.00
-
0.46
-
0.71 0.50 0.22
Col III %
(d10) 0.19 -0.46 -0.58
-
0.34
-
0.11 -0.10
-
0.08 -0.66 -0.46 1.00 0.62 0.30 0.47
Collagen
secretion
(d5)
-0.26 -0.12 -0.23 0.11 0.34 -0.60 -
0.56 -0.32 -0.71 0.62 1.00 -0.08
-0.19
Collagen FWHM (d5)
0.40 -0.44 -0.46 -
0.58 -
0.62 0.66 0.65 -0.24 0.50 0.30
-0.08
1.00 0.18
Col III%
(d5) 0.79 -0.66 -0.61
-
0.74
-
0.58 0.58 0.58 -0.20 0.22 0.47
-
0.19 0.18 1.00
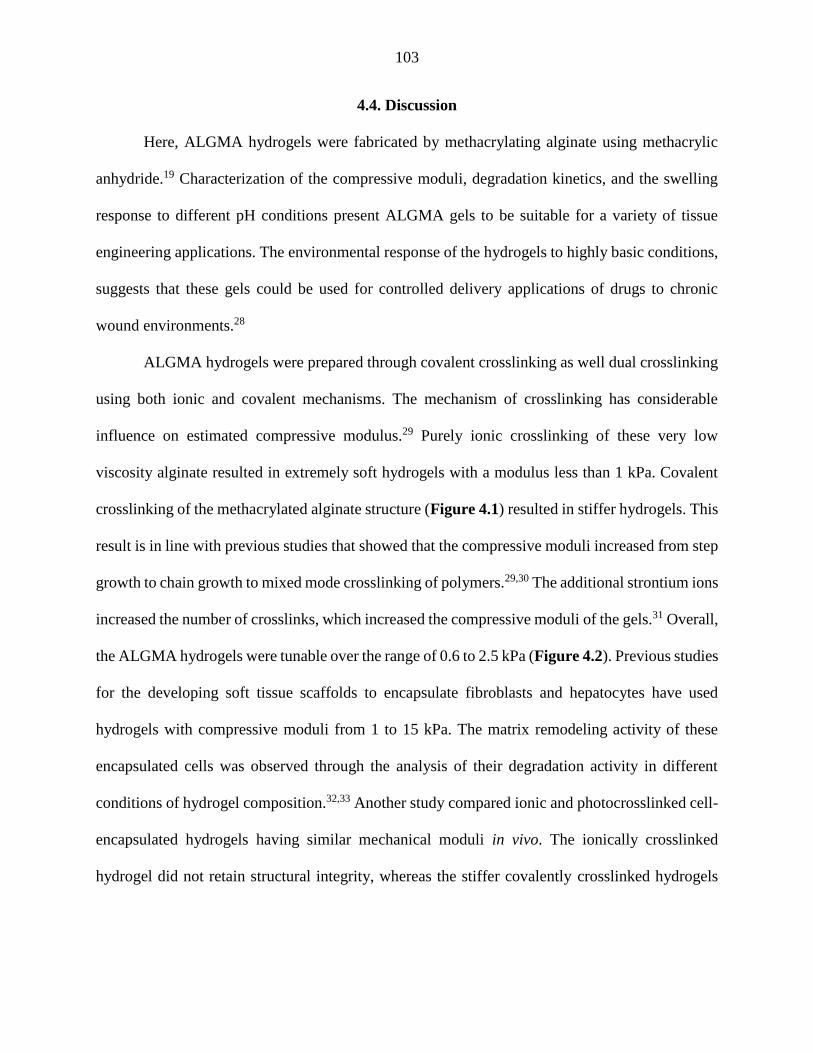
103
4.4. Discussion
Here, ALGMA hydrogels were fabricated by methacrylating alginate using methacrylic
anhydride.19 Characterization of the compressive moduli, degradation kinetics, and the swelling
response to different pH conditions present ALGMA gels to be suitable for a variety of tissue
engineering applications. The environmental response of the hydrogels to highly basic conditions,
suggests that these gels could be used for controlled delivery applications of drugs to chronic
wound environments.28
ALGMA hydrogels were prepared through covalent crosslinking as well dual crosslinking
using both ionic and covalent mechanisms. The mechanism of crosslinking has considerable
influence on estimated compressive modulus.29 Purely ionic crosslinking of these very low
viscosity alginate resulted in extremely soft hydrogels with a modulus less than 1 kPa. Covalent
crosslinking of the methacrylated alginate structure (Figure 4.1) resulted in stiffer hydrogels. This
result is in line with previous studies that showed that the compressive moduli increased from step
growth to chain growth to mixed mode crosslinking of polymers.29,30 The additional strontium ions
increased the number of crosslinks, which increased the compressive moduli of the gels.31 Overall,
the ALGMA hydrogels were tunable over the range of 0.6 to 2.5 kPa (Figure 4.2). Previous studies
for the developing soft tissue scaffolds to encapsulate fibroblasts and hepatocytes have used
hydrogels with compressive moduli from 1 to 15 kPa. The matrix remodeling activity of these
encapsulated cells was observed through the analysis of their degradation activity in different
conditions of hydrogel composition.32,33 Another study compared ionic and photocrosslinked cell-
encapsulated hydrogels having similar mechanical moduli in vivo. The ionically crosslinked
hydrogel did not retain structural integrity, whereas the stiffer covalently crosslinked hydrogels
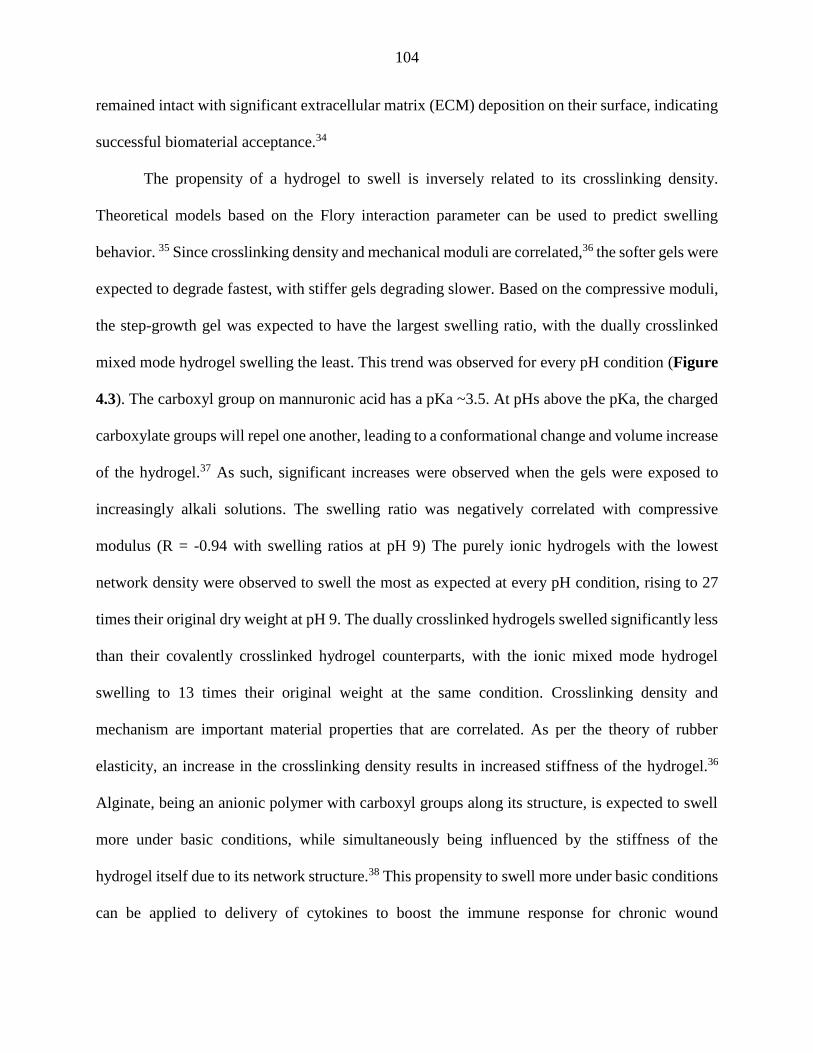
104
remained intact with significant extracellular matrix (ECM) deposition on their surface, indicating
successful biomaterial acceptance.34
The propensity of a hydrogel to swell is inversely related to its crosslinking density.
Theoretical models based on the Flory interaction parameter can be used to predict swelling
behavior. 35 Since crosslinking density and mechanical moduli are correlated,36 the softer gels were
expected to degrade fastest, with stiffer gels degrading slower. Based on the compressive moduli,
the step-growth gel was expected to have the largest swelling ratio, with the dually crosslinked
mixed mode hydrogel swelling the least. This trend was observed for every pH condition (Figure
4.3). The carboxyl group on mannuronic acid has a pKa ~3.5. At pHs above the pKa, the charged
carboxylate groups will repel one another, leading to a conformational change and volume increase
of the hydrogel.37 As such, significant increases were observed when the gels were exposed to
increasingly alkali solutions. The swelling ratio was negatively correlated with compressive
modulus (R = -0.94 with swelling ratios at pH 9) The purely ionic hydrogels with the lowest
network density were observed to swell the most as expected at every pH condition, rising to 27
times their original dry weight at pH 9. The dually crosslinked hydrogels swelled significantly less
than their covalently crosslinked hydrogel counterparts, with the ionic mixed mode hydrogel
swelling to 13 times their original weight at the same condition. Crosslinking density and
mechanism are important material properties that are correlated. As per the theory of rubber
elasticity, an increase in the crosslinking density results in increased stiffness of the hydrogel.36
Alginate, being an anionic polymer with carboxyl groups along its structure, is expected to swell
more under basic conditions, while simultaneously being influenced by the stiffness of the
hydrogel itself due to its network structure.38 This propensity to swell more under basic conditions
can be applied to delivery of cytokines to boost the immune response for chronic wound
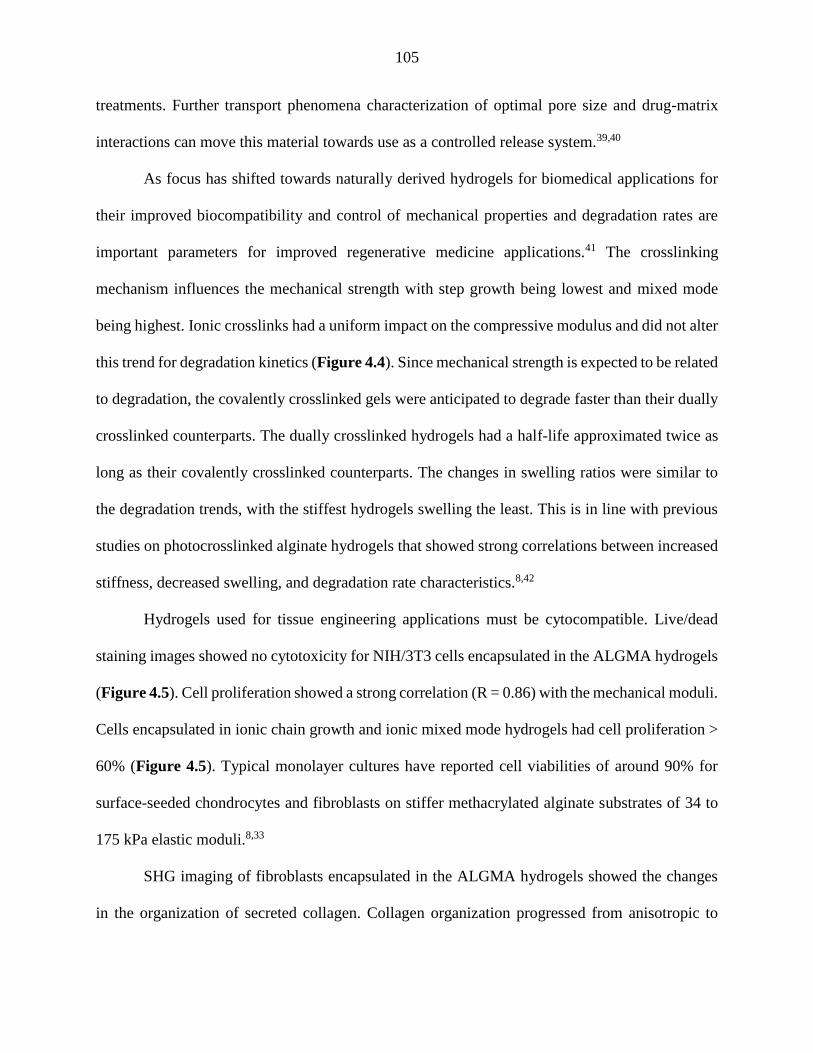
105
treatments. Further transport phenomena characterization of optimal pore size and drug-matrix
interactions can move this material towards use as a controlled release system.39,40
As focus has shifted towards naturally derived hydrogels for biomedical applications for
their improved biocompatibility and control of mechanical properties and degradation rates are
important parameters for improved regenerative medicine applications.41 The crosslinking
mechanism influences the mechanical strength with step growth being lowest and mixed mode
being highest. Ionic crosslinks had a uniform impact on the compressive modulus and did not alter
this trend for degradation kinetics (Figure 4.4). Since mechanical strength is expected to be related
to degradation, the covalently crosslinked gels were anticipated to degrade faster than their dually
crosslinked counterparts. The dually crosslinked hydrogels had a half-life approximated twice as
long as their covalently crosslinked counterparts. The changes in swelling ratios were similar to
the degradation trends, with the stiffest hydrogels swelling the least. This is in line with previous
studies on photocrosslinked alginate hydrogels that showed strong correlations between increased
stiffness, decreased swelling, and degradation rate characteristics.8,42
Hydrogels used for tissue engineering applications must be cytocompatible. Live/dead
staining images showed no cytotoxicity for NIH/3T3 cells encapsulated in the ALGMA hydrogels
(Figure 4.5). Cell proliferation showed a strong correlation (R = 0.86) with the mechanical moduli.
Cells encapsulated in ionic chain growth and ionic mixed mode hydrogels had cell proliferation >
60% (Figure 4.5). Typical monolayer cultures have reported cell viabilities of around 90% for
surface-seeded chondrocytes and fibroblasts on stiffer methacrylated alginate substrates of 34 to
175 kPa elastic moduli.8,33
SHG imaging of fibroblasts encapsulated in the ALGMA hydrogels showed the changes
in the organization of secreted collagen. Collagen organization progressed from anisotropic to
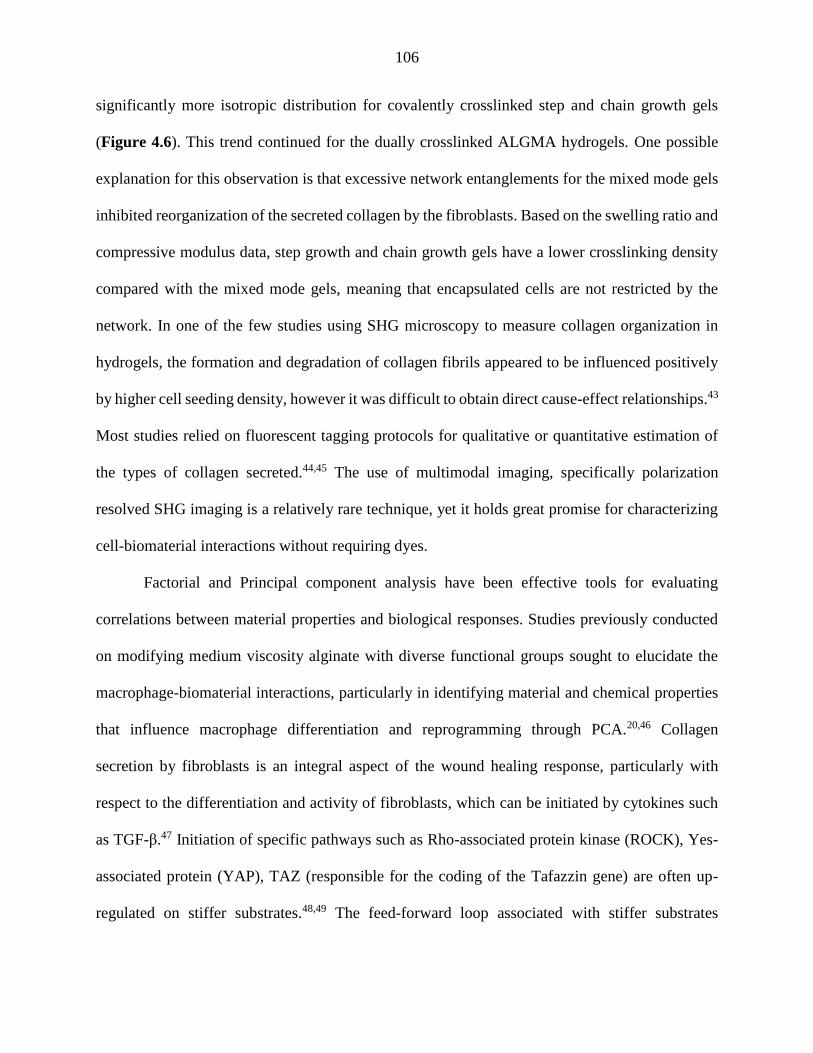
106
significantly more isotropic distribution for covalently crosslinked step and chain growth gels
(Figure 4.6). This trend continued for the dually crosslinked ALGMA hydrogels. One possible
explanation for this observation is that excessive network entanglements for the mixed mode gels
inhibited reorganization of the secreted collagen by the fibroblasts. Based on the swelling ratio and
compressive modulus data, step growth and chain growth gels have a lower crosslinking density
compared with the mixed mode gels, meaning that encapsulated cells are not restricted by the
network. In one of the few studies using SHG microscopy to measure collagen organization in
hydrogels, the formation and degradation of collagen fibrils appeared to be influenced positively
by higher cell seeding density, however it was difficult to obtain direct cause-effect relationships.43
Most studies relied on fluorescent tagging protocols for qualitative or quantitative estimation of
the types of collagen secreted.44,45 The use of multimodal imaging, specifically polarization
resolved SHG imaging is a relatively rare technique, yet it holds great promise for characterizing
cell-biomaterial interactions without requiring dyes.
Factorial and Principal component analysis have been effective tools for evaluating
correlations between material properties and biological responses. Studies previously conducted
on modifying medium viscosity alginate with diverse functional groups sought to elucidate the
macrophage-biomaterial interactions, particularly in identifying material and chemical properties
that influence macrophage differentiation and reprogramming through PCA.20,46 Collagen
secretion by fibroblasts is an integral aspect of the wound healing response, particularly with
respect to the differentiation and activity of fibroblasts, which can be initiated by cytokines such
as TGF-β.47 Initiation of specific pathways such as Rho-associated protein kinase (ROCK), Yes-
associated protein (YAP), TAZ (responsible for the coding of the Tafazzin gene) are often up-
regulated on stiffer substrates.48,49 The feed-forward loop associated with stiffer substrates
107
influencing fibroblasts to secrete more collagen and other ECM proteins is a biomarker for cancer
associated fibroblasts, as well.50,51 Thus, rational design of tunable hydrogels for chronic wound
treatment may be improved through PCA analytical methods that examine multiple facets of
materials design. The positive correlation between the swelling responses at different pH
conditions and compressive moduli indicated that there was strong connection for all those trends
driven by their shared negative correlation to the latter (all between R = -0.88 and -0.94). The
initial collagen secretion showed a strong negative correlation with the FWHM of collagen
organization on the final day of the cell-gel SHG observations. This suggests that cellular activity
was driving these changes. Though it was difficult to ascertain an overall trend for the collagen
type III levels, the PCA showed that there was a strong negative correlation between collagen type
III levels and the collagen secretion levels.
The modulation of collagen secretion by fibroblasts in hydrogels for understanding
mechanical cues that can alter wound healing, using non-linear optics is a relatively new approach
for tissue engineering. Collagen gels have been studied in the past for their efficacy in hastening
the wound healing progress towards granular tissue formation.52 The structure and orientation of
collagen fibers have been studied for their influence on cell-mediated migration, which could play
an important role in the remodeling of the wound site.53 The relatively aligned collagen
organization in response to the softer covalently crosslinked hydrogels, was in contrast to the
relatively more isotropic response on the dually crosslinked hydrogel. Coupled with the
moderately strong correlation of the FWHM at d5 to the compressive modulus in Figure 4.7, there
is some basis for the hypothesis that the initial collagen organization being influenced by the
mechanical properties of the encapsulating hydrogel. Histological studies have shown that
collagen is highly aligned in hypertrophic and keloid scar tissues as compared to being stochastic
108
in normal skin.54,55Highly aligned collagen fibers have been observed with increased collagen III
% for inguinal hernia56 Greater interest has been generated towards replicating isotropic collagen
organization for improved wound healing, particularly for treatment of chronic wounds.57 Dually
crosslinked hydrogels show promise as hydrogels that promote isotropic collagen organization,
and when combined with their moderately wide range of swelling responses, as viable drug
delivery systems to promote chronic wound healing.
4.5. Conclusions
In this study, we successfully fabricated different methacrylated alginate hydrogels using
covalent and ionic crosslinking strategies with tunable mechanical properties. Diverse
polymerization mechanisms (such as step and chain growth) were used to fabricate alginate
hydrogels ranging from very soft at 0.7 kPa to relatively stiffer gels prepared through dual ionic
and covalent crosslinking. We demonstrated possible links between the increased swelling
response and the crosslinking mechanisms for all hydrogel formulations under basic pH
conditions, as expected from the anionic nature of the alginate polymer. Stiffer gels swelled to a
lesser extent than softer gels across the same pH condition, possibly due to differences arising
from the rubber elasticity theory. These ALGMA hydrogels were found to be cytocompatible when
encapsulating NIH/3T3 fibroblasts. Stiffer gels were able to induce isotropic collagen
organization, similar to that of healthy dermal tissues.
4.6. References
1. Diegelmann, R. F. & Evans, M. C. Wound healing: an overview of acute, fibrotic and
delayed healing. Front. Biosci. 9, 283–9 (2004).
2. Enoch, S., Leaper, D. J. & Beldon, P. Basic science of wound healing. Surg. 28, 409–412
(2010).
109
3. Schneider, L. A., Korber, A., Grabbe, S. & Dissemond, J. Influence of pH on wound-
healing: A new perspective for wound-therapy? Arch. Dermatol. Res. 298, 413–420 (2007).
4. Edmonds, M., Bates, M., Doxford, M., Gough, A. & Foster, A. Topical treatment: Which
dressing to choose. Diabetes. Metab. Res. Rev. 16, 47–50 (2000).
5. Centers for Disease Control and Prevention [CDCP]. National diabetes statistics report:
Estimates of diabetes and its burden in the united states. 2009–2012 (2017).
doi:10.1177/1527154408322560
6. Lim, H. W. et al. The burden of skin disease in the United States. J. Am. Acad. Dermatol.
76, 958–972.e2 (2017).
7. Bickers, D. R. et al. The burden of skin diseases: 2004. A joint project of the American
Academy of Dermatology Association and the Society for Investigative Dermatology. J.
Am. Acad. Dermatol. 55, 490–500 (2006).
8. Jeon, O., Bouhadir, K. H., Mansour, J. M. & Alsberg, E. Photocrosslinked alginate
hydrogels with tunable biodegradation rates and mechanical properties. Biomaterials 30,
2724–2734 (2009).
9. Baer, A. E., Wang, J. Y., Kraus, V. B. & Setton, L. A. Collagen gene expression and
mechanical properties of intervertebral disc cell-alginate cultures. J. Orthop. Res. 19, 2–10
(2001).
10. Crescenzi, V., Cornelio, L., Di Meo, C., Nardecchia, S. & Lamanna, R. Novel hydrogels
via click chemistry: Synthesis and potential biomedical applications. Biomacromolecules
8, 1844–1850 (2007).
11. Polizzotti, B. D., Fairbanks, B. D. & Anseth, K. S. Three-dimensional biochemical
patterning of click-based composite hydrogels via thiolene photopolymerization.
Biomacromolecules 9, 1084–1087 (2008).
12. Dondoni, A. The emergence of thiol-ene coupling as a click process for materials and
bioorganic chemistry. Angew. Chemie - Int. Ed. 47, 8995–8997 (2008).
13. Peppas, N. A., Hilt, J. Z., Khademhosseini, A. & Langer, R. Hydrogels in biology and
medicine: From molecular principles to bionanotechnology. Adv. Mater. 18, 1345–1360
(2006).
14. Smeds, K. A. & Grinstaff, M. W. Photocrosslinkable polysaccharides for in situ hydrogel
formation. J. Biomed. Mater. Res. 54, 115–121 (2001).
15. Nettles, D. L., Vail, T. P., Morgan, M. T., Grinstaff, M. W. & Setton, L. A.
Photocrosslinkable hyaluronan as a scaffold for articular cartilage repair. Ann. Biomed. Eng.
32, 391–397 (2004).
110
16. Podual, K., Doyle, F. J. & Peppas, N. A. Preparation and dynamic response of cationic
copolymer hydrogels containing glucose oxidase. Polymer (Guildf). 41, 3975–3983 (2000).
17. Peppas, N. A. & Khare, A. R. Preparation, structure and diffusional behavior of hydrogels
in controlled release. Adv. Drug Deliv. Rev. 11, 1–35 (1993).
18. Scott, R. A. & Peppas, N. A. Highly crosslinked, PEG-containing copolymers for sustained
solute delivery. Biomaterials 20, 1371–1380 (1999).
19. Chou, A. I. & Nicoll, S. B. Characterization of photocrosslinked alginate hydrogels for
nucleus pulposus cell encapsulation. J. Biomed. Mater. Res. - Part A 91, 187–194 (2009).
20. Bygd, H. C. & Bratlie, K. M. The effect of chemically modified alginates on macrophage
phenotype and biomolecule transport. J. Biomed. Mater. Res. - Part A 104, 1707–1719
(2016).
21. ASTM. Standard Test Method for Bulk Properties of Textured Yarns. 81, 4–9 (2016).
22. Akilbekova, D. & Bratlie, K. M. Quantitative characterization of collagen in the fibrotic
capsule surrounding implanted polymeric microparticles through second harmonic
generation imaging. PLoS One 10, 1–17 (2015).
23. Bygd, H. C., Forsmark, K. D. & Bratlie, K. M. Altering in vivo macrophage responses with
modified polymer properties. Biomaterials 56, 187–197 (2015).
24. Grasdalen, H. High-field, 1H-n.m.r. spectroscopy of alginate: sequential structure and
linkage conformations. Carbohydr. Res. 118, 255–260 (1983).
25. Bae, H. et al. Cell-laden microengineered pullulan methacrylate hydrogels promote cell
proliferation and 3D cluster formation. Soft Matter 7, 1903–1911 (2011).
26. Rowley, J. A., Madlambayan, G. & Mooney, D. J. Alginate hydrogels as synthetic
extracellular matrix materials. Biomaterials 20, 45–53 (1999).
27. Paul, W. & Sharma, C. P. Chitosan and Alginate Wound Dressings : A Short Review.
Trends Biomater. Artif. Organs 18, 18–23 (2004).
28. Harding, K., Morris, H. & Patel, G. Science, Medicine, and the Future: Healing chronic
wounds. Br. Med. J. 326, 433–436 (2003).
29. Reddy, S. K., Anseth, K. S. & Bowman, C. N. Modeling of network degradation in mixed
step-chain growth polymerizations. Polymer (Guildf). 46, 4212–4222 (2005).
30. Kharkar, P. M., Kloxin, A. M. & Kiick, K. L. Dually degradable click hydrogels for
controlled degradation and protein release. J. Mater. Chem. B 2, 5511–5521 (2014).
111
31. Samorezov, J. E., Morlock, C. M. & Alsberg, E. Dual Ionic and Photo-Crosslinked Alginate
Hydrogels for Micropatterned Spatial Control of Material Properties and Cell Behavior.
Bioconjug. Chem. 26, 1339–1347 (2015).
32. Chan, A. W. & Neufeld, R. J. Tuneable semi-synthetic network alginate for absorptive
encapsulation and controlled release of protein therapeutics. Biomaterials 31, 9040–9047
(2010).
33. Hunt, N. C., Smith, A. M., Gbureck, U., Shelton, R. M. & Grover, L. M. Encapsulation of
fibroblasts causes accelerated alginate hydrogel degradation. Acta Biomater. 6, 3649–3656
(2010).
34. Chou, A. I., Akintoye, S. O. & Nicoll, S. B. Photo-crosslinked alginate hydrogels support
enhanced matrix accumulation by nucleus pulposus cells in vivo. Osteoarthr. Cartil. 17,
1377–1384 (2009).
35. Peppas, N. A., Huang, Y., Torres-Lugo, M., Ward, J. H. & Zhang, J. Physiochemical
foundations and structural design of hydrogels in medicine and biology. Annu. Rev. Biomed.
Eng. 2, 9–29 (2000).
36. Anseth, K. S., Bowman, C. N. & Brannon-Peppas, L. Mechanical properties of hydrogels
and their experimental determination. Biomaterials 17, 1647–1657 (1996).
37. Chan, A. W. & Neufeld, R. J. Modeling the controllable pH-responsive swelling and pore
size of networked alginate based biomaterials. Biomaterials 30, 6119–6129 (2009).
38. Khare, A. R. & Peppas, N. A. Swelling/deswelling of anionic copolymer gels. Biomaterials
16, 559–567 (1995).
39. Jeon, O., Powell, C., Solorio, L. D., Krebs, M. D. & Alsberg, E. Affinity-based growth
factor delivery using biodegradable, photocrosslinked heparin-alginate hydrogels. J.
Control. Release 154, 258–266 (2011).
40. Drury, J. L. & Mooney, D. J. Hydrogels for tissue engineering: Scaffold design variables
and applications. Biomaterials 24, 4337–4351 (2003).
41. Nicodemus, G. D. & Bryant, S. J. Cell Encapsulation in Biodegradable Hydrogels for Tissue
Engineering Applications. Tissue Eng. Part B. Rev. 14, 149–165 (2008).
42. Jeon, O., Powell, C., Ahmed, S. M. & Alsberg, E. Biodegradable, photocrosslinked alginate
hydrogels with independently tailorable physical properties and cell adhesivity. Tissue Eng.
Part A 16, 2915–2925 (2010).
43. Olderøy, M. et al. Biochemical and structural characterization of neocartilage formed by
mesenchymal stem cells in alginate hydrogels. PLoS One 9, (2014).
44. Stuart, K. & Panitch, A. Characterization of gels composed of blends of collagen I, collagen
III, and chondroitin sulfate. Biomacromolecules 10, 25–31 (2009).
112
45. Chen, X. G., Wang, Z., Liu, W. S. & Park, H. J. The effect of carboxymethyl-chitosan on
proliferation and collagen secretion of normal and keloid skin fibroblasts. Biomaterials 23,
4609–4614 (2002).
46. Bygd, H. C. & Bratlie, K. M. Investigating the synergistic effects of combined modified
alginates on macrophage phenotype. Polymers (Basel). 8, 422 (2016).
47. Gabbiani, G. The myofibroblast in wound healing and fibrocontractive diseases. J. Pathol.
200, 500–503 (2003).
48. Wynn, T. A. Cellular and molecular mechanisms of fibrosis. J. Pathol. 214, 199–210
(2008).
49. Calvo, F. et al. Mechanotransduction and YAP-dependent matrix remodelling is required
for the generation and maintenance of cancer-associated fibroblasts. Nat Cell Biol 15, 637–
646 (2013).
50. Mao, Y., Keller, E. T., Garfield, D. H., Shen, K. & Wang, J. Stromal cells in tumor
microenvironment and breast cancer. Cancer Metastasis Rev. 32, 303–315 (2013).
51. Grainger, D. W. All charged up about implanted biomaterials. Nat. Biotechnol. 31, 507–509
(2013).
52. Tronci, G. et al. Protease-sensitive atelocollagen hydrogels promote healing in a diabetic
wound model. J. Mater. Chem. B 4, 7249–7258 (2016).
53. Yasui, T., Tohno, Y. & Araki, T. Determination of collagen fiber orientation in human tissue
by use of polarization measurement of molecular second-harmonic-generation light. 43, 10–
14 (2004).
54. Verhaegen, P. D. H. M. et al. Differences in collagen architecture between keloid,
hypertrophic scar, normotrophic scar, and normal skin: An objective histopathological
analysis. Wound Repair Regen. 17, 649–656 (2009).
55. Verhaegen, P. D. H. M. et al. Collagen bundle morphometry in skin and scar tissue: A novel
distance mapping method provides superior measurements compared to Fourier analysis. J.
Microsc. 245, 82–89 (2012).
56. Klinge, U. et al. Synthesis of type I and III collagen, expression of fibronectin and matrix
metalloproteinase 1 and 13 in hernias of patients with inguinal hernia. Int J Surg Invest. 1,
219–227 (1999).
57. Greaves, N. S., Ashcroft, K. J., Baguneid, M. & Bayat, A. Current understanding of
molecular and cellular mechanisms in fibroplasia and angiogenesis during acute wound
healing. J. Dermatol. Sci. 72, 206–217 (2013).
113
CHAPTER 5
POLY-L-ARGININE MODIFICATIONS ALTER THE ORGANIZATION
AND SECRETION OF COLLAGEN IN SKH1-E MICE
Functionalized biomaterials interface with tissue upon implantation. There is a growing
need to understand how materials properties influence this interaction so that efficient tissue
engineering systems can be developed. In this study, we characterize collagen organization in
response to functionalized glass beads implanted in SKH1-E mice. Poly-L-arginine (PLR) was
modified with arginine derivatives to create a functionalized surface and was coated on glass
beads. Tissue sections were removed 28 days post-implantation and were imaged using second
harmonic generation (SHG) microscopy. These chemical modifications were able to alter the
collagen distribution from highly aligned to disordered (~17 to 80° full width at half-maximum
(FWHM)) and the collagen III/I ratio (0.02 to 0.42). Principal component analysis (PCA)
comparing the physical properties of the modifiers (e.g. hydrophobicity, molar volume, freely
rotating bonds, polarizability) with the SHG analytically derived parameters (e.g. collagen III/I
ratio, collagen orientation) was performed. Chemical properties of the PLR-like modifications
including lipophilicity, along with the number of freely rotating bonds and the polarizability had
significant effects on collagen organization, both in terms of collagen orientation as well as the
production of collagen III. These findings demonstrate the possibility of tuning the foreign body
response in terms of collagen deposition and organization, to positively influence the acceptance
of implanted biomaterials.
114
5.1. Introduction
The foreign body response is a complex series of processes initiated upon implantation of
a biomaterial. The affected tissue responds to the implant through the secretion of chemokines,
cytokines, and matrix metalloproteinases (MMPs) in an attempt to restore normal function at the
implant site.1 Different cell types participate in the foreign body response with specific roles as the
tissue seeks to halt blood flow and repair the damaged extracellular matrix (ECM).2–4 The foreign
body response interferes with the cascade of cell signaling pathways involved in normal wound
closure by extending the inflammatory response phase.5 This hindered wound healing response to
the implant consists of protein adsorption on the implant surface, recruitment of monocytes,
monocyte differentiation from macrophages, macrophage fusion into foreign body giant cells,
differentiation and activation of fibroblasts to myofibroblasts, and fibrotic encapsulation.6 Post
inflammation fibroblasts and myofibroblasts secrete collagen, particularly types I and III, in the
case of dermal tissues to synthesize a fibrotic layer in response to the implant. The organization of
collagen in this fibrous collagen-rich layer can vary from well-aligned to a stochastic distribution
of collagen fibrils.7 These deposited collagen fibrils become active components of the basement
membrane reconstruction, by promoting the attachment of endothelial cells.8 During the
remodeling phase of wound healing, collagen fibers are aligned stochastically similar to that of
unwounded tissues.9 Healed tissues often do not recover their full mechanical strength, regaining
only around 80% to the levels prior to the tissue damage.10 Scar tissue or incompletely healed
tissue contain bundles of organized collagen fibers, compared to the isotropic organization in
undamaged tissue.11 In scar tissue, collagen type III is replaced by fibrillar collagen type III, as
observed in fibrotic capsules around implant sites.12 Isotropic collagen orientation with similar
levels of collagen III as that in healthy dermal tissues, would be the ideal collagen response to
implanted biomaterials.13
115
Multimodal imaging techniques such as second harmonic generation microscopy (SHG)
enable sensitive, dye-free imaging of collagen in various clinical samples.14 In this non-linear
microscopy process, two photons of the same wavelength are impinged spatially and temporally
on a sample. When these photons interact with non-centrosymmetric moieties, they double in
frequency.15 The non-centrosymmetric chemical structure of collagen arising from its triple helical
structure, make it an SHG-active biomolecule. Changes in collagen density, organization, and type
can be determined using SHG analysis. Other biomolecules that have been imaged using SHG are
myosin in muscle tissue and cholesterol crystals in atherosclerotic plaques.16,17 SHG microscopy
of triple helical collagen fibers can provide more information about the collagen response through
susceptibility tensor analysis.14,15 These parameters are linked to the material properties, based on
the molecular origins of the collagen signal arising from the ratio of their methylene to peptide
bonds.18 Polarization resolved SHG microscopy is capable of differentiating between diverse types
of collagen in dermal samples by generating a map of the susceptibility tensor components.
Specifically, the ratio of collagen types I and III can be estimated by analyzing ratio of the
nonlinear susceptibility tensor elements.14 Collagen type I is significantly more prevalent than type
III in human skin, and the ratio of III/I is ~ 30% for unwounded adult dermis.19 As wound healing
progresses, this ratio can rise to ~ 90% and gradually decreases during the re-epithelialization
process.20 Elevated levels of collagen type III are linked to a prolonged wound healing process. In
some cases, these elevated levels are associated with hypertrophic scarring or internal injuries such
as inguinal hernia.21,20,22 However, there is no consensus on the role played by collagen type III on
the wound healing process, or the biomaterials properties that can induce different levels of
collagen type III. It has been observed that as wound healing progresses towards the granulation
phase, collagen I is replaced by collagen III particularly for tissues that undergo significant
116
mechanical stress, which indicates a difference in mechanotransductive signaling roles in the two
types of collagen in the ECM23,24. This change in significant tissue strength for higher collagen III
is also observed for tissues prone to developing different types of hernias.20 During scar tissue
formation, collagen type III is organized with collagen type I in aligned bundles, while they are
stochastically arranged in healthy tissue.13
Our study focuses on the analysis of the collagen response to functionalized glass beads
implanted in SKH1-E mice. These mice are commonly used for studying dermal wound healing
responses as they are hairless, making application and observation of topical treatments relatively
easy.25,26 We used a library of chemical modifiers based off the amino acid arginine and its
derivatives, which have been previously studied for their ability to influence the synthesis of
collagen by fibroblasts in in vitro,27 to examine how materials properties alter collagen
organization. In another study examining collagen responses to materials, functionalized
polystyrene microparticles were studied and it was found that dimethylamino functionalized
particles resulted in isotropic collagen organization and a thin fibrotic capsule.28 Poly-L-arginine
(PLR) modified with arginine derivatives and coated on glass beads showed the influence of
collagen directionality on the speed of fibroblast migration and secretion of angiogenetic cytokines
such as vascular endothelial growth factor.29 Here, we have uncovered physicochemical properties
of these materials that correlate with collagen organization and the ratio of collagen type III/I.
Analyses such as this aim to improve rational design for biomaterials that can tune the fibrotic
response towards better implant acceptance.
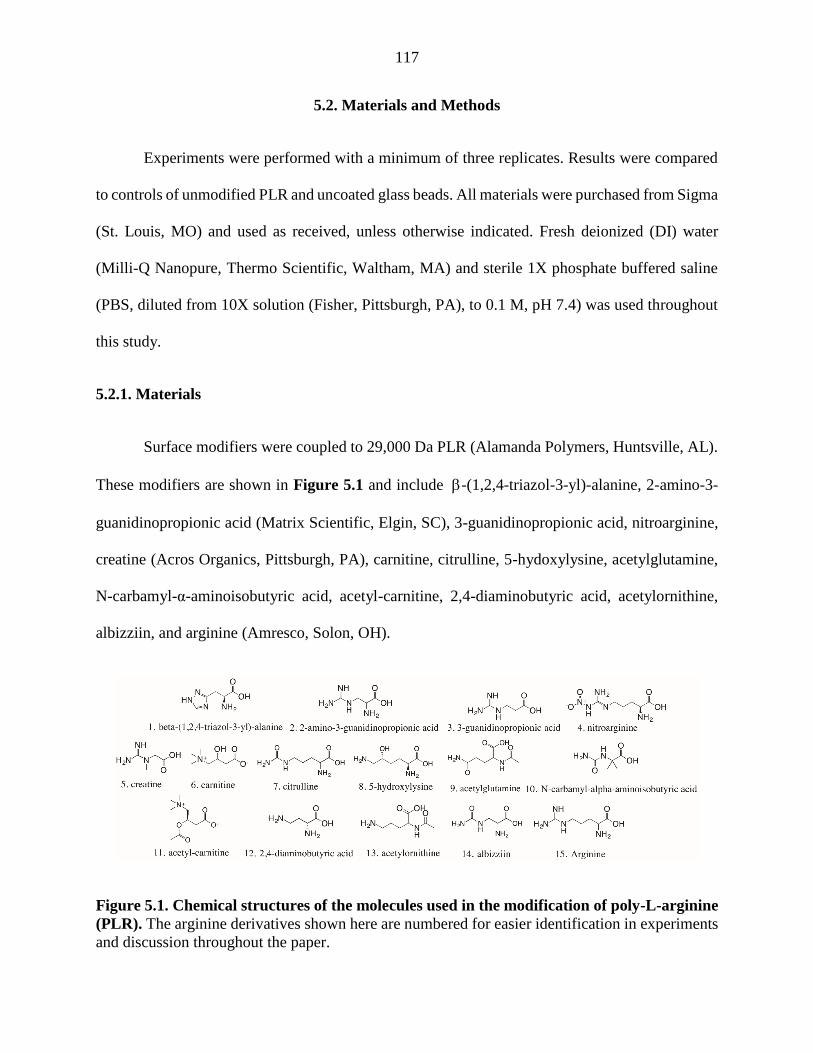
117
5.2. Materials and Methods
Experiments were performed with a minimum of three replicates. Results were compared
to controls of unmodified PLR and uncoated glass beads. All materials were purchased from Sigma
(St. Louis, MO) and used as received, unless otherwise indicated. Fresh deionized (DI) water
(Milli-Q Nanopure, Thermo Scientific, Waltham, MA) and sterile 1X phosphate buffered saline
(PBS, diluted from 10X solution (Fisher, Pittsburgh, PA), to 0.1 M, pH 7.4) was used throughout
this study.
5.2.1. Materials
Surface modifiers were coupled to 29,000 Da PLR (Alamanda Polymers, Huntsville, AL).
These modifiers are shown in Figure 5.1 and include -(1,2,4-triazol-3-yl)-alanine, 2-amino-3-
guanidinopropionic acid (Matrix Scientific, Elgin, SC), 3-guanidinopropionic acid, nitroarginine,
creatine (Acros Organics, Pittsburgh, PA), carnitine, citrulline, 5-hydoxylysine, acetylglutamine,
N-carbamyl-α-aminoisobutyric acid, acetyl-carnitine, 2,4-diaminobutyric acid, acetylornithine,
albizziin, and arginine (Amresco, Solon, OH).
Figure 5.1. Chemical structures of the molecules used in the modification of poly-L-arginine
(PLR). The arginine derivatives shown here are numbered for easier identification in experiments
and discussion throughout the paper.
118
5.2.2. PLR Modification
The fifteen different modifiers (Figure 5.1) were coupled to PLR using 1-ethyl-3-(3-
dimethylaminopropyl)carbodiimide (EDC, Oakwood Chemical, West Colombia, SC). These
materials were modified as previously described29 using 4 ml of a 2.5 mg/ml solution of PLR in
PBS with 100 molar equivalents of arginine derivative. EDC (200 mg) was added to the
scintillation vial and stirred for 4 h at room temperature. The modified polymers were dialyzed
against H2O for 24 h and subsequently lyophilized (4.5 L, Labconco, Kansas City, MO). The
modified PLR was re-suspended in PBS at 0.1% w/v and stored at -20C.
5.2.3. Ethics Statement
The research protocol was approved by the local animal ethics committees at Iowa State
University (Institutional Animal Care and Use Committee) prior to initiation of the study.
5.2.4. Animals
6-week-old female SKH1-E mice were obtained from Charles River Laboratories
(Wilmington, MA). The mice were maintained at the animal facilities in the College of Veterinary
Medicine at Iowa State University, accredited by the American Association of Laboratory Animal
care, and were housed under standard conditions with a 12-hour light/dark cycle. Both water and
food were provided ad libitum.
119
5.2.5. Subcutaneous Injections
Animal tissue specimens previously obtained29 were used here. Briefly, injections were
performed according to ISO 10993-6:2007. Glass beads (105 – 150 μm, Warrington, PA) were
sterilized via autoclave and were coated with each of the fifteen modified PLRs, PLL (poly-L-
lysine), and unmodified PLR. Uncoated glass beads were also tested. Mice were anesthetized via
isoflurane inhalation at a concentration of 1-4% isoflurane/balance O2 to minimize movement. The
backs of the mice were scrubbed with 70% isopropyl alcohol and five modified glass beads (10%
v/v, 100 μl) were injected in an array format with a sixth injection of unmodified PLR coated
beads. All experiments were conducted in quintuplicate. After 28 days, the mice were euthanized
via CO2 asphyxiation. The injected beads and surrounding tissue was excised. Sections were fixed
in 10% formalin, embedded in paraffin, sectioned into 5 μm slides, and mounted on glass slides.
5.2.6. Collagen Gel Preparation
Collagen type I (BD Biosciences, Franklin Lakes, NJ) was solubilized in acetic acid (20
mM) at 10 mg/mL to prepare a stock solution. This solution was mixed on ice with 10 PBS, 1
M NaOH and deionized water to prepare aliquots of 1, 2, 4 and 6 mg/mL of collagen type I
solutions. This solution was then pipetted on to glass coverslips and gelled at 37°C for 1 h.
120
5.2.7. Second Harmonic Generation (SHG)
The laser system is a mode-locked Ti:sapphire laser (100 fs pulse width, 1 kHz repetition rate,
Libra, Coherent, Santa Clara, CA) that produces an 800 nm fundamental. The average power at
the samples was kept at 1 – 10 mW to avoid tissue damage using a half-wave plate and a Glan-
Thompson polarizer (Thorlabs, Newton, NJ). SHG images were collected in transmission mode.
An inverted microscope stage (AmScope, Irvine, CA) and a 20 Nikon Plan Fluorite objective
(0.50 NA, 2.1 mm) were used to focus the 800 nm beam. The second harmonic signal was collected
with a 40 Nikon water immersion objective (0.8 NA, 3.5 mm). The signal was reflected with a
dichroic mirror (Thorlabs) and the fundamental beam was removed using a short pass filter < 450
nm (Thorlabs) and an 808 nm notch filter (Melles Griot, Rochester, NY). The signal was detected
using an intensified CCD camera (iCCD, iStar 334T, Andor, Belfast, UK) with 512 512 active
pixels. The polarization of the incoming beam was changed using a Glan-Thompson polarizer and
a half-wave plate mounted on a motor driven rotational stage (Thorlabs). These optics were
inserted before the focusing objective.
Images of tissue sections and collagen standard curve samples were collected every 10
from 0 to 350. A minimum of three sets of polarization images for each experimental condition
were taken. Birefringence was calculated to be within the resolution of the polarization angles for
the thickness of tissues (5 μm) used in this study.
5.2.8. Image Processing
The intensity of the second harmonic signal of collagen as a function of polarization
angle of the incident laser beam can be written as:
121
(1)
where and are second-order susceptibility tensor element ratios; e and 0 are the
incident polarization angle and collagen fiber angle, respectively; and c is a normalization constant.
Tensor elements can be used as a contrast mechanism for distinguishing sources of SHG signal.12,30
Images were filtered using a median noise filter (3 3) to attenuate the salt and pepper noise in
the acquired images (ImageJ, NIH, Bethesda, MD). Images were binned to obtain regions of
interest (ROIs) of 2 2 pixels. Collagen orientation angles and second-order susceptibility tensor
element ratios were determined for every ROI by fitting to a Levenberg-Marquardt algorithm using
Matlab (MathWorks, Natick, MA). Photon counts below 5 counts per pixel were excluded from
the analysis as this was determined to be below the limit of detection for this setup. The limit of
detection was determined by measuring ambient noise detected by the iCCD when the incoming
light was blocked. The Matlab script generated images displaying the orientation angles of
collagen determined for each ROI and heat maps for the second-order susceptibility tensor element
ratios. Histograms for both were also obtained.
ISHG = c × sin2 qe -q0( )+czzzczxx
æ
èç
ö
ø÷cos2 qe -q0( )
é
ëê
ù
ûú
2
+cxzxczxx
æ
èç
ö
ø÷
2
sin2 2 qe -q0( )( )ì
íï
îï
ü
ýï
þï
c zzz
c zxx
c xzx
c zxx
122
5.2.9. Statistics and Data Analysis
Statistical analysis was performed using JMP® statistical software (Cary, NC). Statistical
significance of the mean comparisons was determined by a two-way ANOVA. Pair-wise
comparisons were analyzed with Tukey’s honest significant difference test. Differences were
considered statistically significant for p < 0.05. Principal component analysis (PCA) was
conducted to explain relationships between modifier properties and experimentally derived
parameters. The principal components were calculated as linear combinations of the plotted
parameters, to denote the directions of maximum variance. The correlations between different
properties can be observed as projected values against the two principal components (PC1 and
PC2).
5.3. Results
5.3.1. Collagen Signal
Collagen signal was measured and compared against a standard curve of collagen
concentration versus SHG signal intensity which was fit using the equation below (R2 = 0.99,
Figure 5.2A).
ISHG = (-7.75 × 105)x2 + (3.14 × 107)x (2)
where x is the collagen concentration in mg/mL
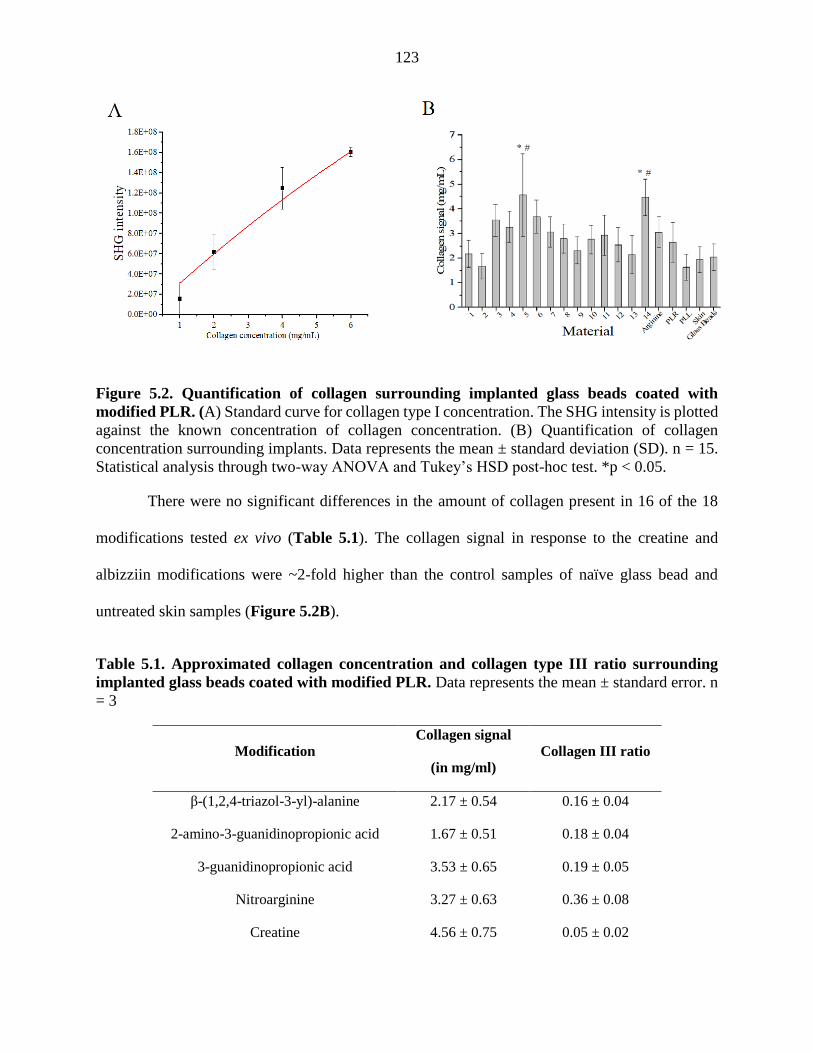
123
Figure 5.2. Quantification of collagen surrounding implanted glass beads coated with
modified PLR. (A) Standard curve for collagen type I concentration. The SHG intensity is plotted
against the known concentration of collagen concentration. (B) Quantification of collagen
concentration surrounding implants. Data represents the mean ± standard deviation (SD). n = 15.
Statistical analysis through two-way ANOVA and Tukey’s HSD post-hoc test. *p < 0.05.
There were no significant differences in the amount of collagen present in 16 of the 18
modifications tested ex vivo (Table 5.1). The collagen signal in response to the creatine and
albizziin modifications were ~2-fold higher than the control samples of naïve glass bead and
untreated skin samples (Figure 5.2B).
Table 5.1. Approximated collagen concentration and collagen type III ratio surrounding
implanted glass beads coated with modified PLR. Data represents the mean ± standard error. n
= 3
Modification
Collagen signal
(in mg/ml) Collagen III ratio
β-(1,2,4-triazol-3-yl)-alanine 2.17 ± 0.54 0.16 ± 0.04
2-amino-3-guanidinopropionic acid 1.67 ± 0.51 0.18 ± 0.04
3-guanidinopropionic acid 3.53 ± 0.65 0.19 ± 0.05
Nitroarginine 3.27 ± 0.63 0.36 ± 0.08
Creatine 4.56 ± 0.75 0.05 ± 0.02
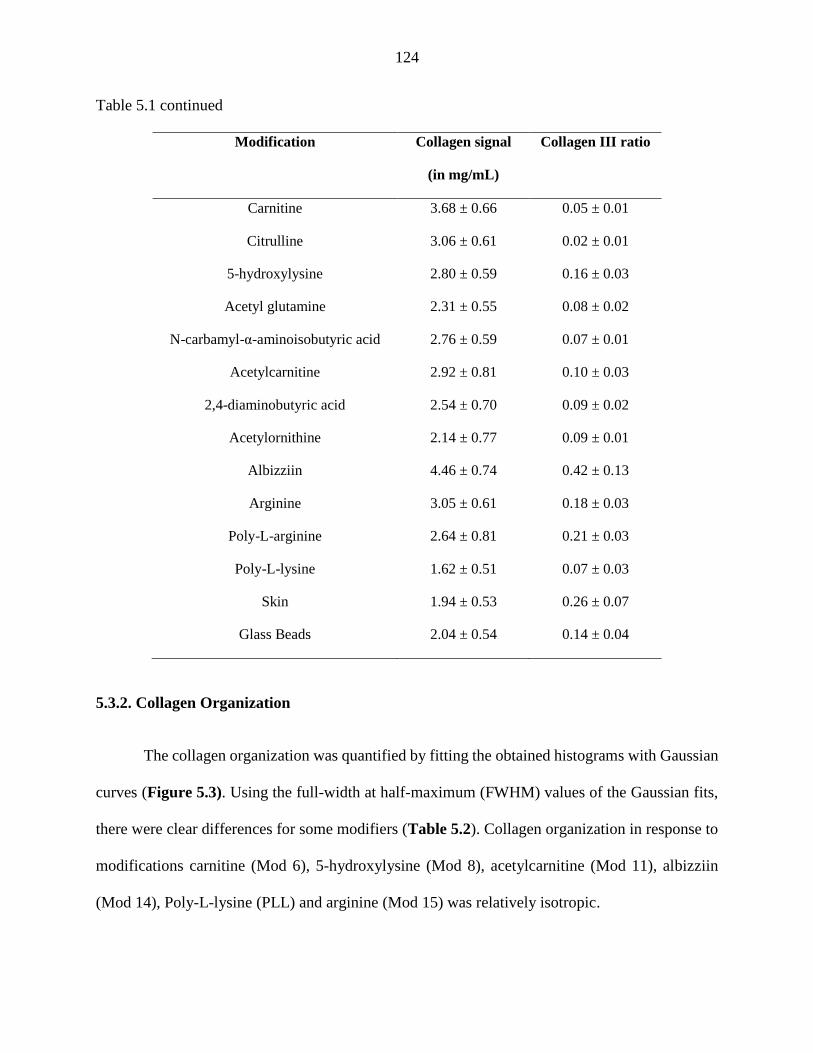
124
Table 5.1 continued
Modification Collagen signal
(in mg/mL)
Collagen III ratio
Carnitine 3.68 ± 0.66 0.05 ± 0.01
Citrulline 3.06 ± 0.61 0.02 ± 0.01
5-hydroxylysine 2.80 ± 0.59 0.16 ± 0.03
Acetyl glutamine 2.31 ± 0.55 0.08 ± 0.02
N-carbamyl-α-aminoisobutyric acid 2.76 ± 0.59 0.07 ± 0.01
Acetylcarnitine 2.92 ± 0.81 0.10 ± 0.03
2,4-diaminobutyric acid 2.54 ± 0.70 0.09 ± 0.02
Acetylornithine 2.14 ± 0.77 0.09 ± 0.01
Albizziin 4.46 ± 0.74 0.42 ± 0.13
Arginine 3.05 ± 0.61 0.18 ± 0.03
Poly-L-arginine 2.64 ± 0.81 0.21 ± 0.03
Poly-L-lysine 1.62 ± 0.51 0.07 ± 0.03
Skin 1.94 ± 0.53 0.26 ± 0.07
Glass Beads 2.04 ± 0.54 0.14 ± 0.04
5.3.2. Collagen Organization
The collagen organization was quantified by fitting the obtained histograms with Gaussian
curves (Figure 5.3). Using the full-width at half-maximum (FWHM) values of the Gaussian fits,
there were clear differences for some modifiers (Table 5.2). Collagen organization in response to
modifications carnitine (Mod 6), 5-hydroxylysine (Mod 8), acetylcarnitine (Mod 11), albizziin
(Mod 14), Poly-L-lysine (PLL) and arginine (Mod 15) was relatively isotropic.
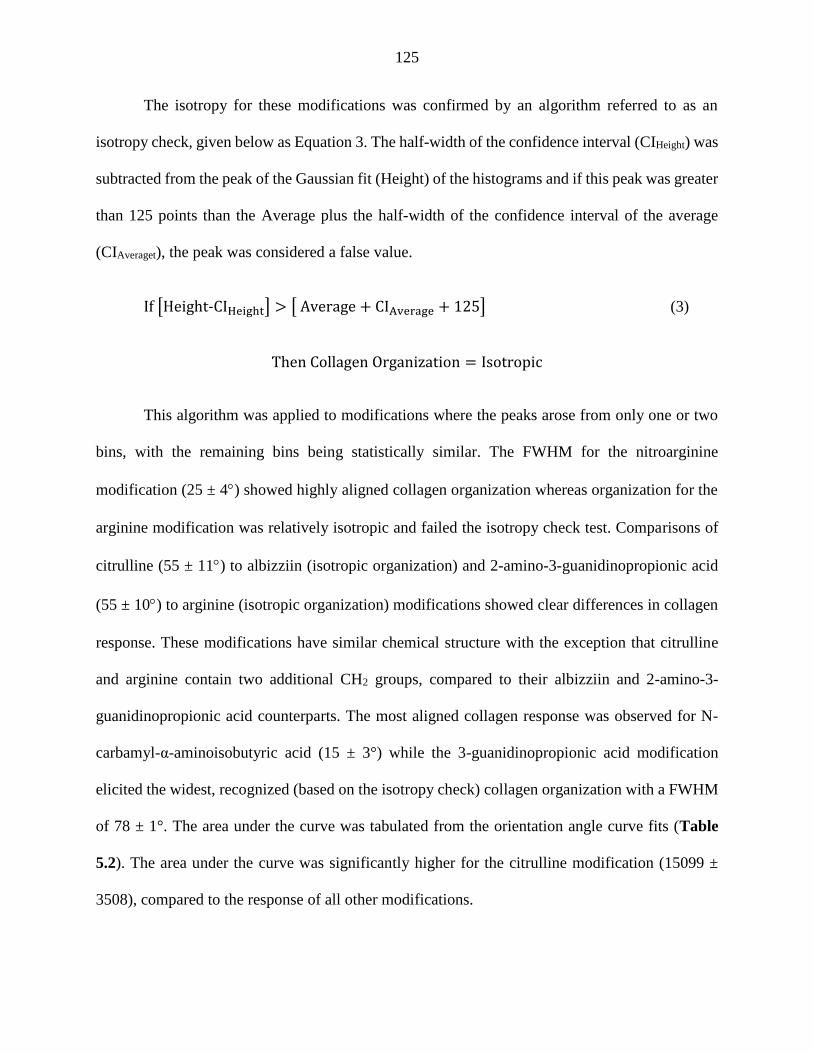
125
The isotropy for these modifications was confirmed by an algorithm referred to as an
isotropy check, given below as Equation 3. The half-width of the confidence interval (CIHeight) was
subtracted from the peak of the Gaussian fit (Height) of the histograms and if this peak was greater
than 125 points than the Average plus the half-width of the confidence interval of the average
(CIAveraget), the peak was considered a false value.
If [Height-CIHeight] > [ Average + CIAverage + 125] (3)
Then Collagen Organization = Isotropic
This algorithm was applied to modifications where the peaks arose from only one or two
bins, with the remaining bins being statistically similar. The FWHM for the nitroarginine
modification (25 ± 4) showed highly aligned collagen organization whereas organization for the
arginine modification was relatively isotropic and failed the isotropy check test. Comparisons of
citrulline (55 ± 11) to albizziin (isotropic organization) and 2-amino-3-guanidinopropionic acid
(55 ± 10) to arginine (isotropic organization) modifications showed clear differences in collagen
response. These modifications have similar chemical structure with the exception that citrulline
and arginine contain two additional CH2 groups, compared to their albizziin and 2-amino-3-
guanidinopropionic acid counterparts. The most aligned collagen response was observed for N-
carbamyl-α-aminoisobutyric acid (15 ± 3°) while the 3-guanidinopropionic acid modification
elicited the widest, recognized (based on the isotropy check) collagen organization with a FWHM
of 78 ± 1°. The area under the curve was tabulated from the orientation angle curve fits (Table
5.2). The area under the curve was significantly higher for the citrulline modification (15099 ±
3508), compared to the response of all other modifications.
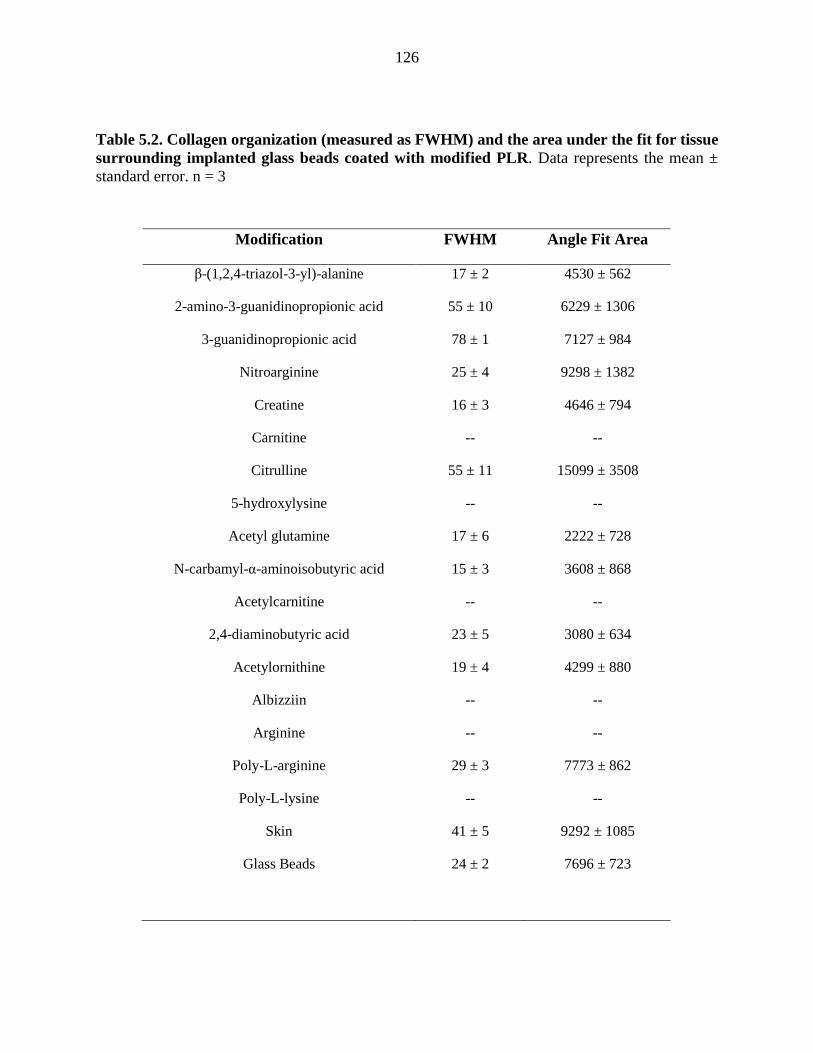
126
Table 5.2. Collagen organization (measured as FWHM) and the area under the fit for tissue
surrounding implanted glass beads coated with modified PLR. Data represents the mean ±
standard error. n = 3
Modification FWHM Angle Fit Area
β-(1,2,4-triazol-3-yl)-alanine 17 ± 2 4530 ± 562
2-amino-3-guanidinopropionic acid 55 ± 10 6229 ± 1306
3-guanidinopropionic acid 78 ± 1 7127 ± 984
Nitroarginine 25 ± 4 9298 ± 1382
Creatine 16 ± 3 4646 ± 794
Carnitine -- --
Citrulline 55 ± 11 15099 ± 3508
5-hydroxylysine -- --
Acetyl glutamine 17 ± 6 2222 ± 728
N-carbamyl-α-aminoisobutyric acid 15 ± 3 3608 ± 868
Acetylcarnitine -- --
2,4-diaminobutyric acid 23 ± 5 3080 ± 634
Acetylornithine 19 ± 4 4299 ± 880
Albizziin -- --
Arginine -- --
Poly-L-arginine 29 ± 3 7773 ± 862
Poly-L-lysine -- --
Skin 41 ± 5 9292 ± 1085
Glass Beads 24 ± 2 7696 ± 723
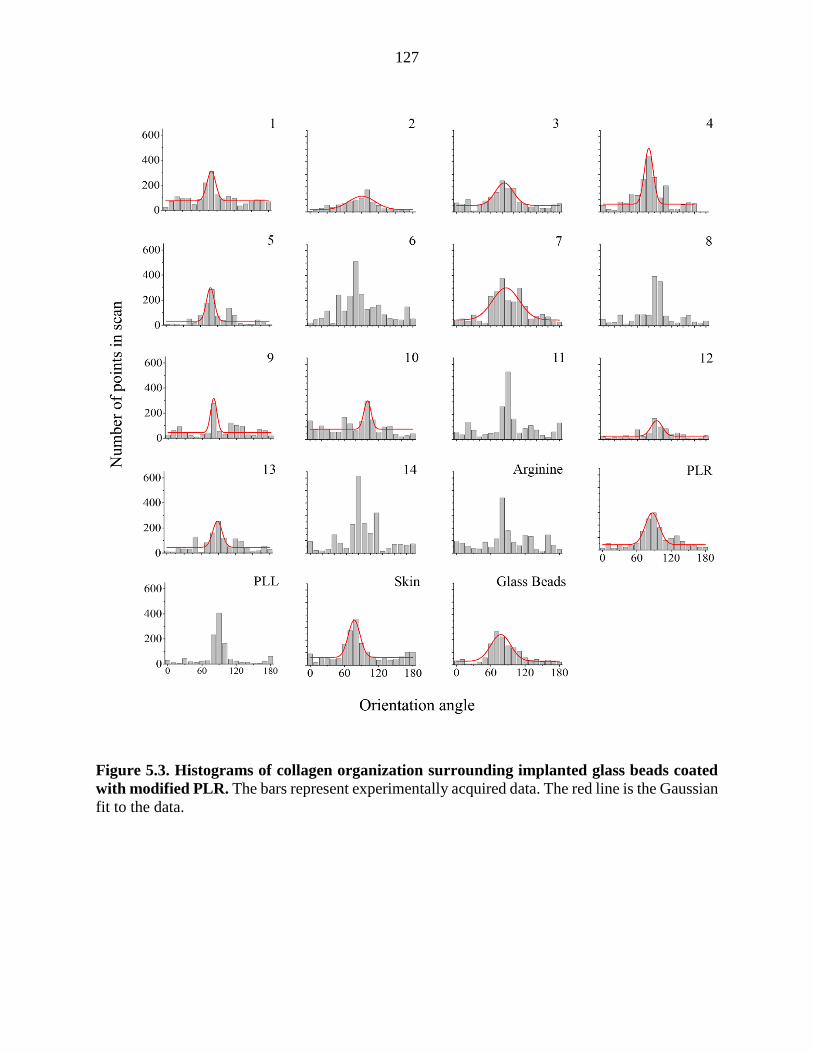
127
Figure 5.3. Histograms of collagen organization surrounding implanted glass beads coated
with modified PLR. The bars represent experimentally acquired data. The red line is the Gaussian
fit to the data.
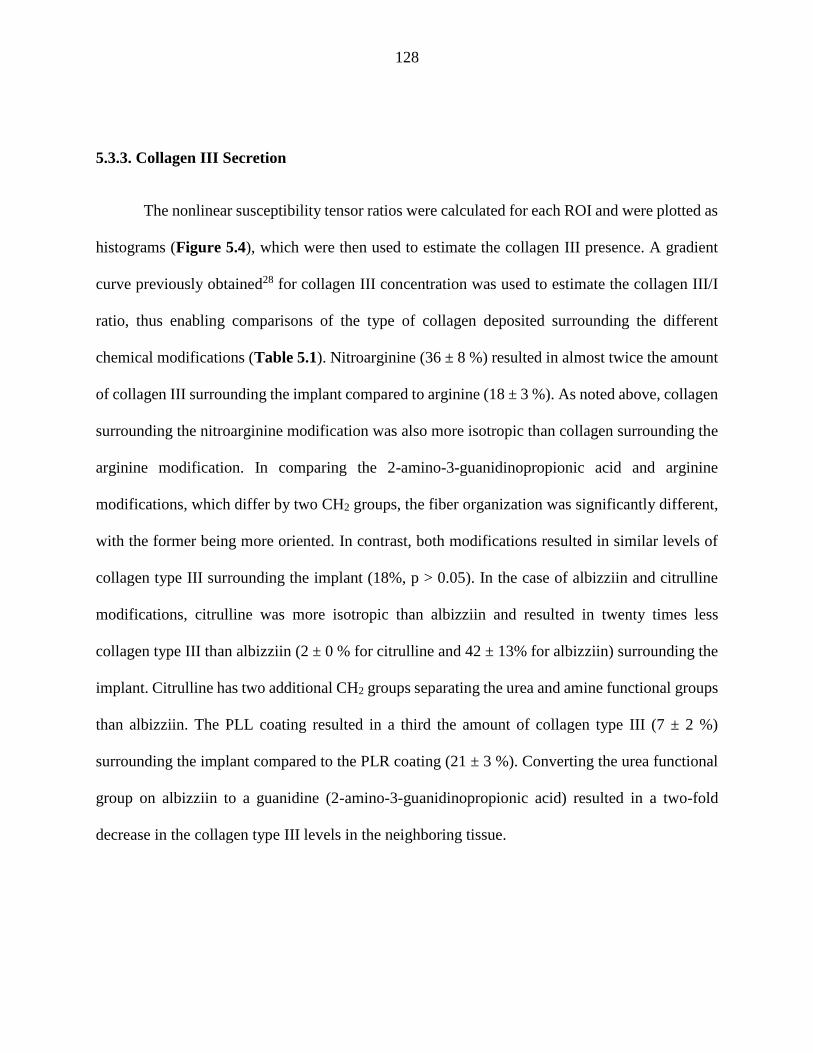
128
5.3.3. Collagen III Secretion
The nonlinear susceptibility tensor ratios were calculated for each ROI and were plotted as
histograms (Figure 5.4), which were then used to estimate the collagen III presence. A gradient
curve previously obtained28 for collagen III concentration was used to estimate the collagen III/I
ratio, thus enabling comparisons of the type of collagen deposited surrounding the different
chemical modifications (Table 5.1). Nitroarginine (36 ± 8 %) resulted in almost twice the amount
of collagen III surrounding the implant compared to arginine (18 ± 3 %). As noted above, collagen
surrounding the nitroarginine modification was also more isotropic than collagen surrounding the
arginine modification. In comparing the 2-amino-3-guanidinopropionic acid and arginine
modifications, which differ by two CH2 groups, the fiber organization was significantly different,
with the former being more oriented. In contrast, both modifications resulted in similar levels of
collagen type III surrounding the implant (18%, p > 0.05). In the case of albizziin and citrulline
modifications, citrulline was more isotropic than albizziin and resulted in twenty times less
collagen type III than albizziin (2 ± 0 % for citrulline and 42 ± 13% for albizziin) surrounding the
implant. Citrulline has two additional CH2 groups separating the urea and amine functional groups
than albizziin. The PLL coating resulted in a third the amount of collagen type III (7 ± 2 %)
surrounding the implant compared to the PLR coating (21 ± 3 %). Converting the urea functional
group on albizziin to a guanidine (2-amino-3-guanidinopropionic acid) resulted in a two-fold
decrease in the collagen type III levels in the neighboring tissue.
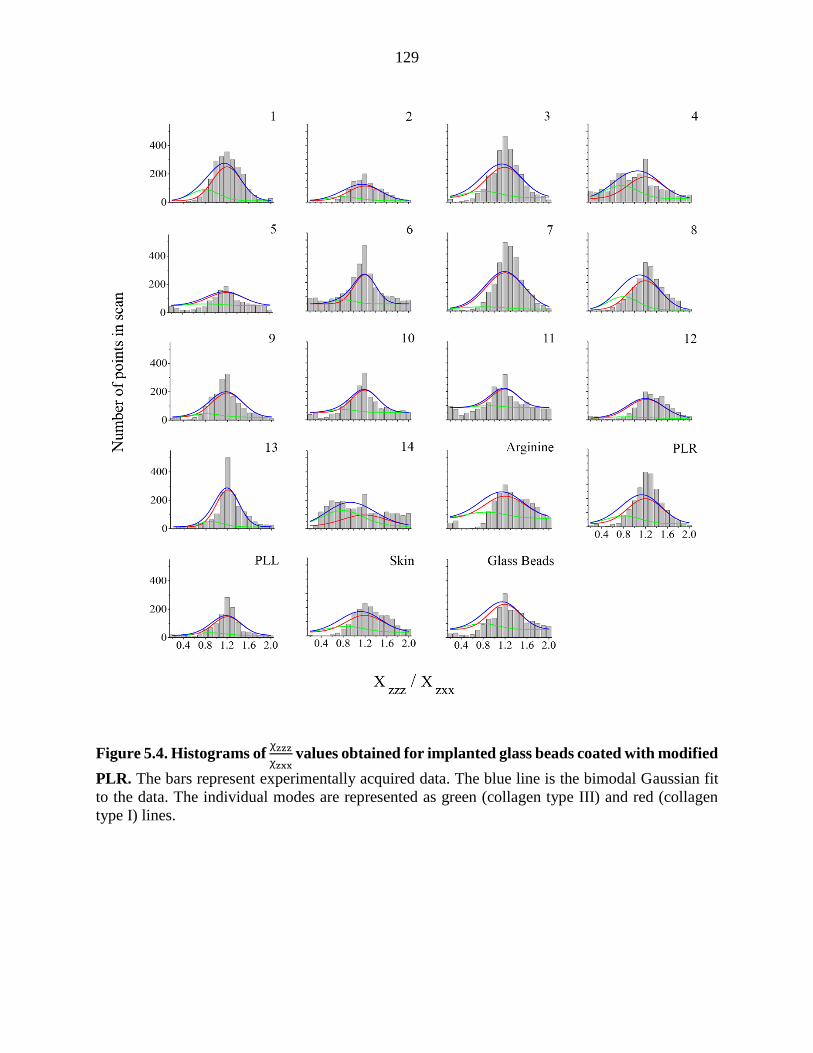
129
Figure 5.4. Histograms of χzzz
χzxx values obtained for implanted glass beads coated with modified
PLR. The bars represent experimentally acquired data. The blue line is the bimodal Gaussian fit
to the data. The individual modes are represented as green (collagen type III) and red (collagen
type I) lines.
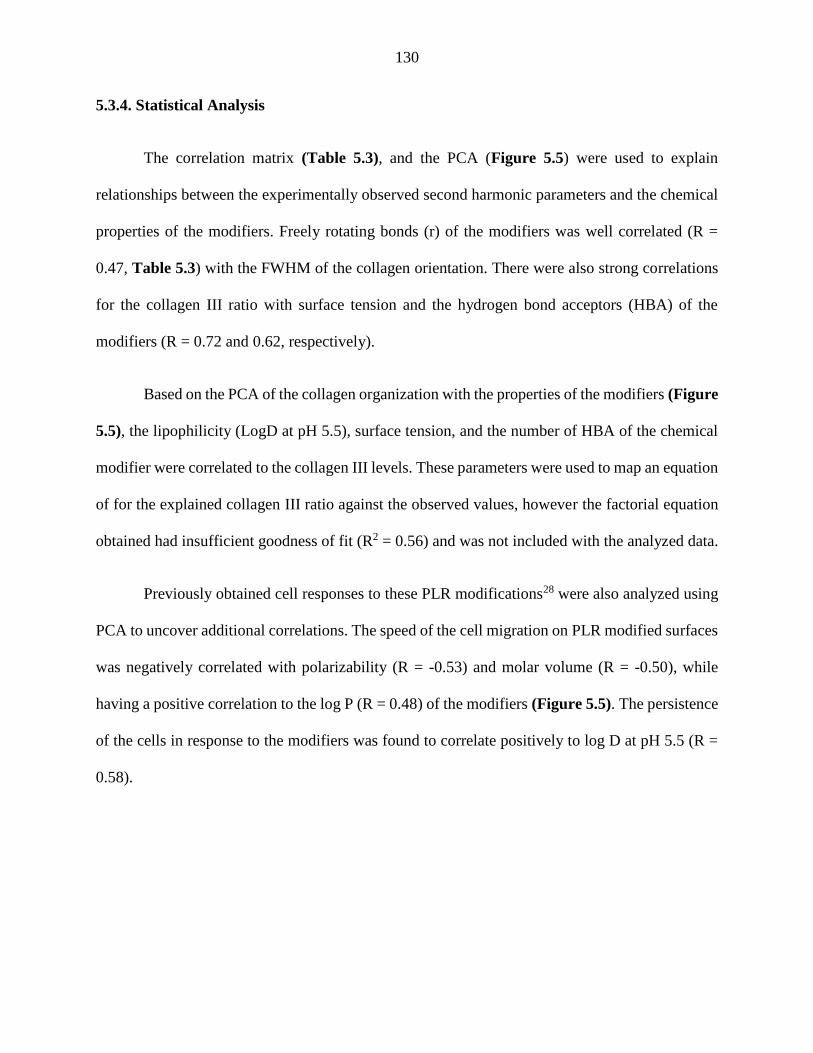
130
5.3.4. Statistical Analysis
The correlation matrix (Table 5.3), and the PCA (Figure 5.5) were used to explain
relationships between the experimentally observed second harmonic parameters and the chemical
properties of the modifiers. Freely rotating bonds (r) of the modifiers was well correlated (R =
0.47, Table 5.3) with the FWHM of the collagen orientation. There were also strong correlations
for the collagen III ratio with surface tension and the hydrogen bond acceptors (HBA) of the
modifiers (R = 0.72 and 0.62, respectively).
Based on the PCA of the collagen organization with the properties of the modifiers (Figure
5.5), the lipophilicity (LogD at pH 5.5), surface tension, and the number of HBA of the chemical
modifier were correlated to the collagen III levels. These parameters were used to map an equation
of for the explained collagen III ratio against the observed values, however the factorial equation
obtained had insufficient goodness of fit (R2 = 0.56) and was not included with the analyzed data.
Previously obtained cell responses to these PLR modifications28 were also analyzed using
PCA to uncover additional correlations. The speed of the cell migration on PLR modified surfaces
was negatively correlated with polarizability (R = -0.53) and molar volume (R = -0.50), while
having a positive correlation to the log P (R = 0.48) of the modifiers (Figure 5.5). The persistence
of the cells in response to the modifiers was found to correlate positively to log D at pH 5.5 (R =
0.58).
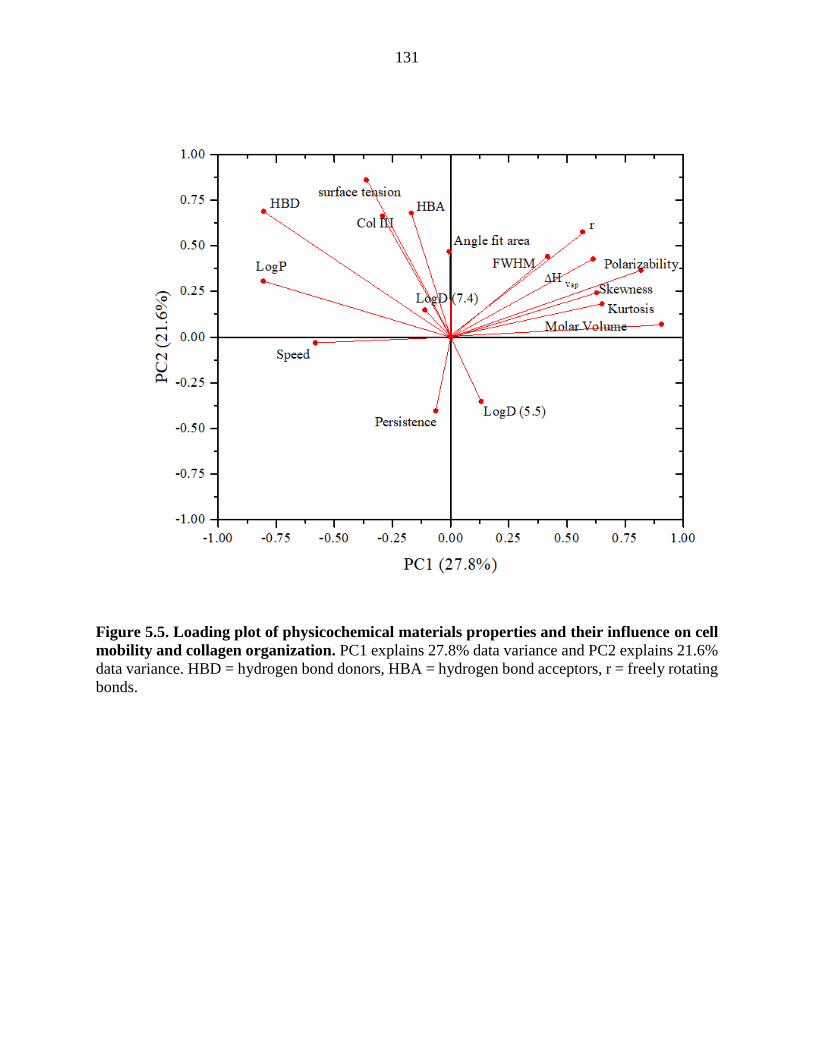
131
Figure 5.5. Loading plot of physicochemical materials properties and their influence on cell
mobility and collagen organization. PC1 explains 27.8% data variance and PC2 explains 21.6%
data variance. HBD = hydrogen bond donors, HBA = hydrogen bond acceptors, r = freely rotating
bonds.
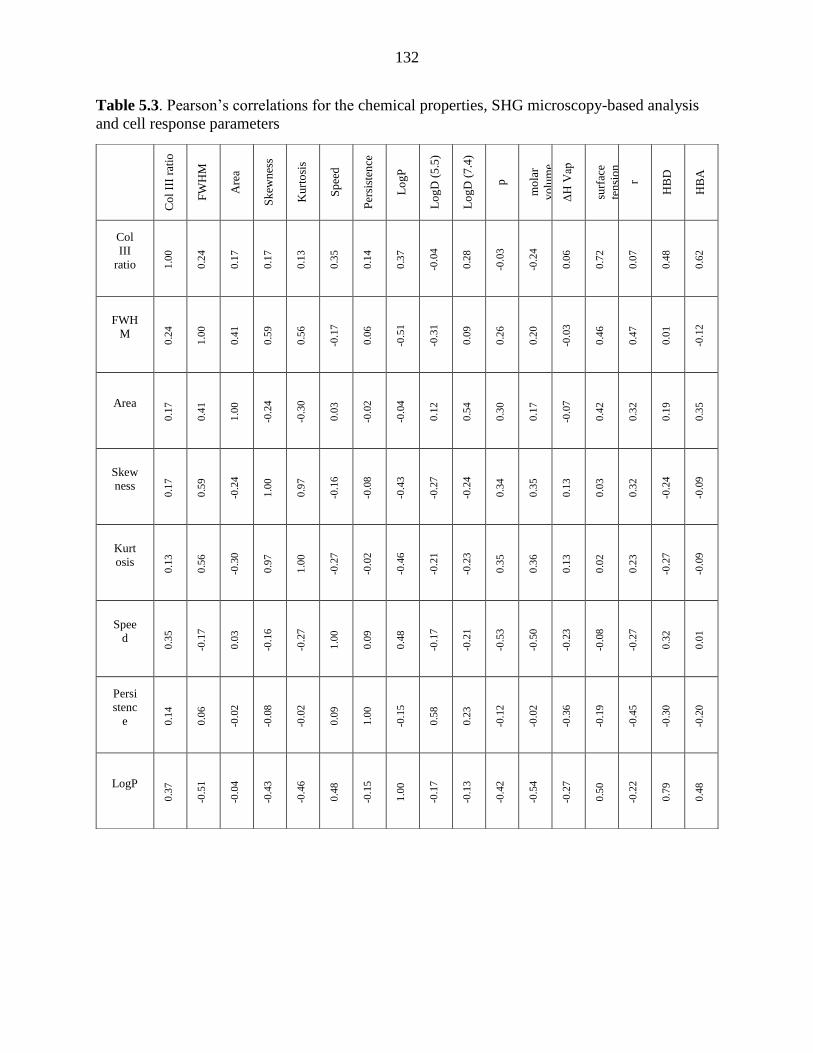
132
Table 5.3. Pearson’s correlations for the chemical properties, SHG microscopy-based analysis
and cell response parameters
C
ol
III
rati
o
FW
HM
Are
a
Sk
ewn
ess
Ku
rto
sis
Sp
eed
Per
sist
ence
Lo
gP
Lo
gD
(5
.5)
Lo
gD
(7
.4)
p
mo
lar
vo
lum
e
ΔH
Vap
surf
ace
ten
sio
n
r
HB
D
HB
A
Col
III
ratio 1.0
0
0.2
4
0.1
7
0.1
7
0.1
3
0.3
5
0.1
4
0.3
7
-0.0
4
0.2
8
-0.0
3
-0.2
4
0.0
6
0.7
2
0.0
7
0.4
8
0.6
2
FWH
M
0.2
4
1.0
0
0.4
1
0.5
9
0.5
6
-0.1
7
0.0
6
-0.5
1
-0.3
1
0.0
9
0.2
6
0.2
0
-0.0
3
0.4
6
0.4
7
0.0
1
-0.1
2
Area
0.1
7
0.4
1
1.0
0
-0.2
4
-0.3
0
0.0
3
-0.0
2
-0.0
4
0.1
2
0.5
4
0.3
0
0.1
7
-0.0
7
0.4
2
0.3
2
0.1
9
0.3
5
Skew
ness
0.1
7
0.5
9
-0.2
4
1.0
0
0.9
7
-0.1
6
-0.0
8
-0.4
3
-0.2
7
-0.2
4
0.3
4
0.3
5
0.1
3
0.0
3
0.3
2
-0.2
4
-0.0
9
Kurt
osis
0.1
3
0.5
6
-0.3
0
0.9
7
1.0
0
-0.2
7
-0.0
2
-0.4
6
-0.2
1
-0.2
3
0.3
5
0.3
6
0.1
3
0.0
2
0.2
3
-0.2
7
-0.0
9
Spee
d
0.3
5
-0.1
7
0.0
3
-0.1
6
-0.2
7
1.0
0
0.0
9
0.4
8
-0.1
7
-0.2
1
-0.5
3
-0.5
0
-0.2
3
-0.0
8
-0.2
7
0.3
2
0.0
1
Persi
stenc
e 0.1
4
0.0
6
-0.0
2
-0.0
8
-0.0
2
0.0
9
1.0
0
-0.1
5
0.5
8
0.2
3
-0.1
2
-0.0
2
-0.3
6
-0.1
9
-0.4
5
-0.3
0
-0.2
0
LogP
0.3
7
-0.5
1
-0.0
4
-0.4
3
-0.4
6
0.4
8
-0.1
5
1.0
0
-0.1
7
-0.1
3
-0.4
2
-0.5
4
-0.2
7
0.5
0
-0.2
2
0.7
9
0.4
8
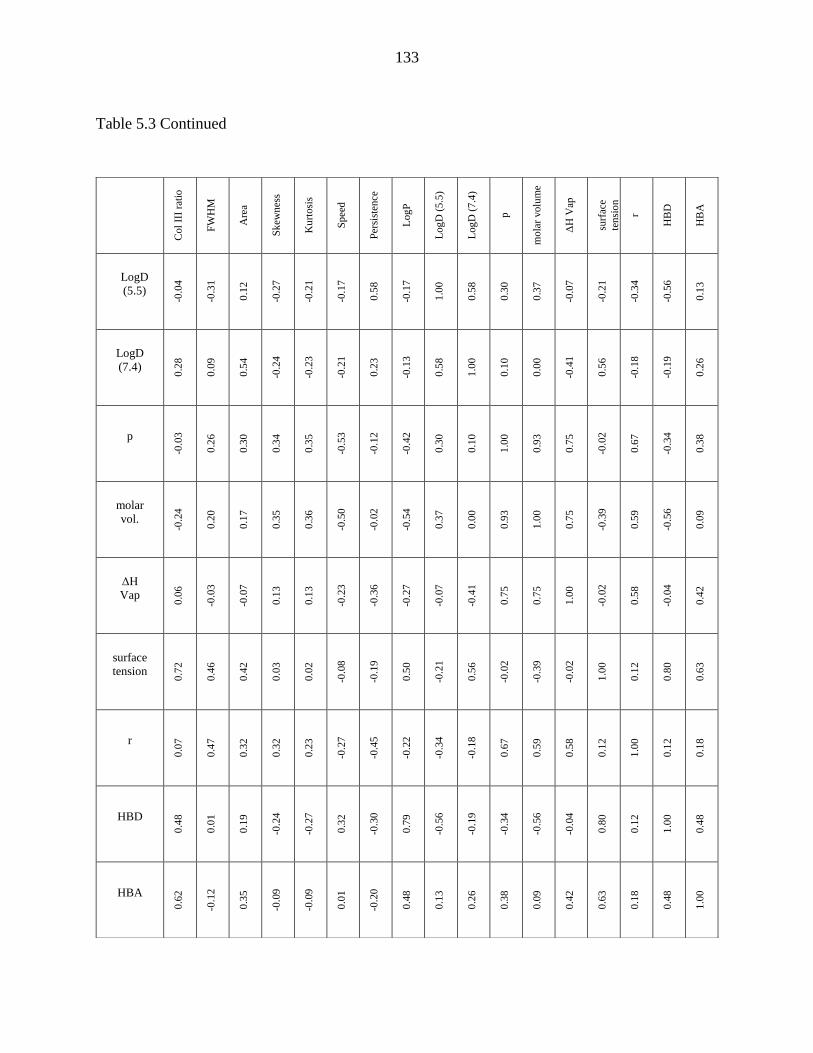
133
Table 5.3 Continued
Col
III
rati
o
FW
HM
Are
a
Sk
ewn
ess
Ku
rtosi
s
Sp
eed
Per
sist
ence
Log
P
Log
D (
5.5
)
Log
D (
7.4
)
p
mo
lar
volu
me
ΔH
Vap
surf
ace
ten
sio
n
r
HB
D
HB
A
LogD
(5.5)
-0.0
4
-0.3
1
0.1
2
-0.2
7
-0.2
1
-0.1
7
0.5
8
-0.1
7
1.0
0
0.5
8
0.3
0
0.3
7
-0.0
7
-0.2
1
-0.3
4
-0.5
6
0.1
3
LogD
(7.4)
0.2
8
0.0
9
0.5
4
-0.2
4
-0.2
3
-0.2
1
0.2
3
-0.1
3
0.5
8
1.0
0
0.1
0
0.0
0
-0.4
1
0.5
6
-0.1
8
-0.1
9
0.2
6
p
-0.0
3
0.2
6
0.3
0
0.3
4
0.3
5
-0.5
3
-0.1
2
-0.4
2
0.3
0
0.1
0
1.0
0
0.9
3
0.7
5
-0.0
2
0.6
7
-0.3
4
0.3
8
molar
vol.
-0.2
4
0.2
0
0.1
7
0.3
5
0.3
6
-0.5
0
-0.0
2
-0.5
4
0.3
7
0.0
0
0.9
3
1.0
0
0.7
5
-0.3
9
0.5
9
-0.5
6
0.0
9
ΔH
Vap
0.0
6
-0.0
3
-0.0
7
0.1
3
0.1
3
-0.2
3
-0.3
6
-0.2
7
-0.0
7
-0.4
1
0.7
5
0.7
5
1.0
0
-0.0
2
0.5
8
-0.0
4
0.4
2
surface
tension
0.7
2
0.4
6
0.4
2
0.0
3
0.0
2
-0.0
8
-0.1
9
0.5
0
-0.2
1
0.5
6
-0.0
2
-0.3
9
-0.0
2
1.0
0
0.1
2
0.8
0
0.6
3
r
0.0
7
0.4
7
0.3
2
0.3
2
0.2
3
-0.2
7
-0.4
5
-0.2
2
-0.3
4
-0.1
8
0.6
7
0.5
9
0.5
8
0.1
2
1.0
0
0.1
2
0.1
8
HBD
0.4
8
0.0
1
0.1
9
-0.2
4
-0.2
7
0.3
2
-0.3
0
0.7
9
-0.5
6
-0.1
9
-0.3
4
-0.5
6
-0.0
4
0.8
0
0.1
2
1.0
0
0.4
8
HBA
0.6
2
-0.1
2
0.3
5
-0.0
9
-0.0
9
0.0
1
-0.2
0
0.4
8
0.1
3
0.2
6
0.3
8
0.0
9
0.4
2
0.6
3
0.1
8
0.4
8
1.0
0
134
5.4. Discussion
Collagen organization and type are indicators of implant acceptance as well as the stage of
the wound healing processes. Collagen is secreted and remodeled by stromal cells such as
fibroblasts and myofibroblasts to promote wound contraction.31 SHG microscopy is a high
information, dye-less, non-linear optical technique that can visualize collagen organization and
type in diverse tissues.15,28,32 By examining how chemical modifications alter collagen
organization, rational design of biomaterials can be improved.
5.4.1. Collagen Signal Comparisons
The collagen signal for the 18 different modifications was estimated to be in the range of
2 to 5 mg/mL. Modification 5 (creatine) resulted in significantly higher collagen secretion at an
estimated 4.56 ± 0.75 mg/mL, almost twice that of the control skin sample (1.94 ± 0.53 mg/mL).
Creatine is a stimulant for promoting collagen secretion by fibroblasts in dermal tissues.33 In
another study, creatine supplements were observed significantly increase skin firmness through
stimulating procollagen secretion and collagen alignment in young and aged humans, which was
measured in vivo using multiphoton laser scanning microscopy.34 The effect of the PLR-like
modifications on the differentiation of fibroblasts associated with collagen synthesis and the
wound healing response showed that it is possible to tune the modifier’s chemical properties to
enhance angiogenesis related biomarkers such as VEGF.29 Statistical analysis on the chemical
structure of the modifier and its influence on in vivo collagen organization indicated the modifier’s
hydrophobicity was positively correlated to the collagen type III deposition.
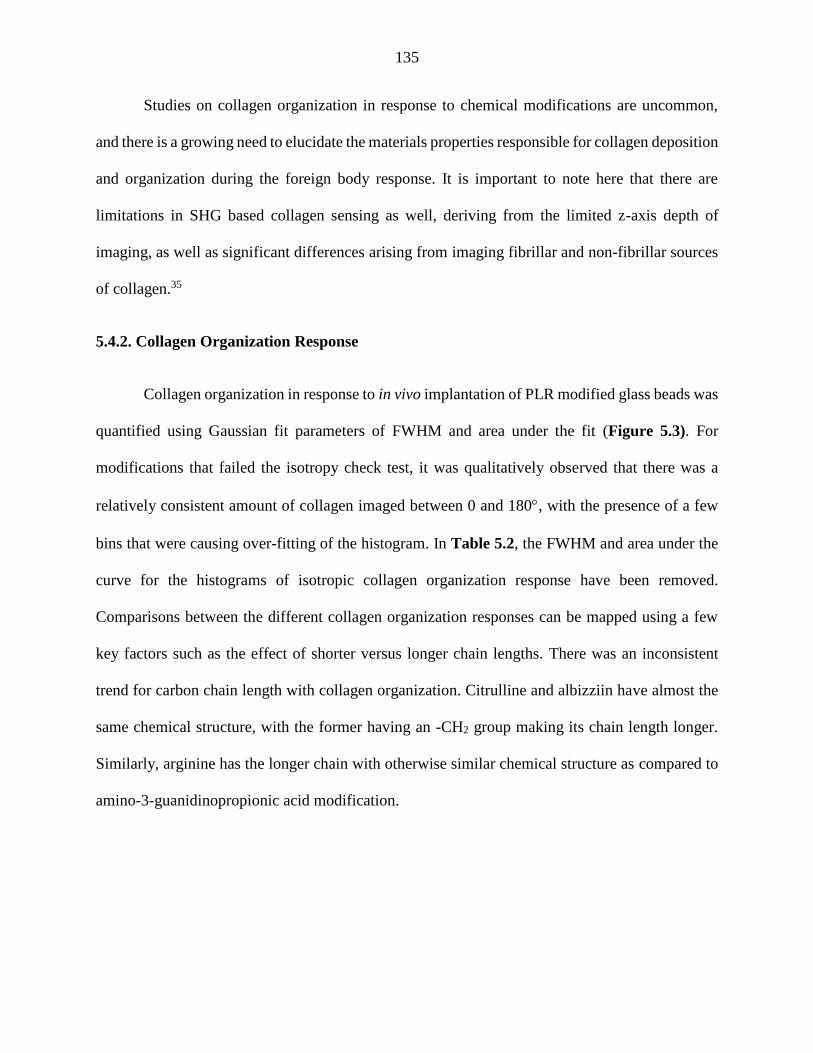
135
Studies on collagen organization in response to chemical modifications are uncommon,
and there is a growing need to elucidate the materials properties responsible for collagen deposition
and organization during the foreign body response. It is important to note here that there are
limitations in SHG based collagen sensing as well, deriving from the limited z-axis depth of
imaging, as well as significant differences arising from imaging fibrillar and non-fibrillar sources
of collagen.35
5.4.2. Collagen Organization Response
Collagen organization in response to in vivo implantation of PLR modified glass beads was
quantified using Gaussian fit parameters of FWHM and area under the fit (Figure 5.3). For
modifications that failed the isotropy check test, it was qualitatively observed that there was a
relatively consistent amount of collagen imaged between 0 and 180, with the presence of a few
bins that were causing over-fitting of the histogram. In Table 5.2, the FWHM and area under the
curve for the histograms of isotropic collagen organization response have been removed.
Comparisons between the different collagen organization responses can be mapped using a few
key factors such as the effect of shorter versus longer chain lengths. There was an inconsistent
trend for carbon chain length with collagen organization. Citrulline and albizziin have almost the
same chemical structure, with the former having an -CH2 group making its chain length longer.
Similarly, arginine has the longer chain with otherwise similar chemical structure as compared to
amino-3-guanidinopropionic acid modification.
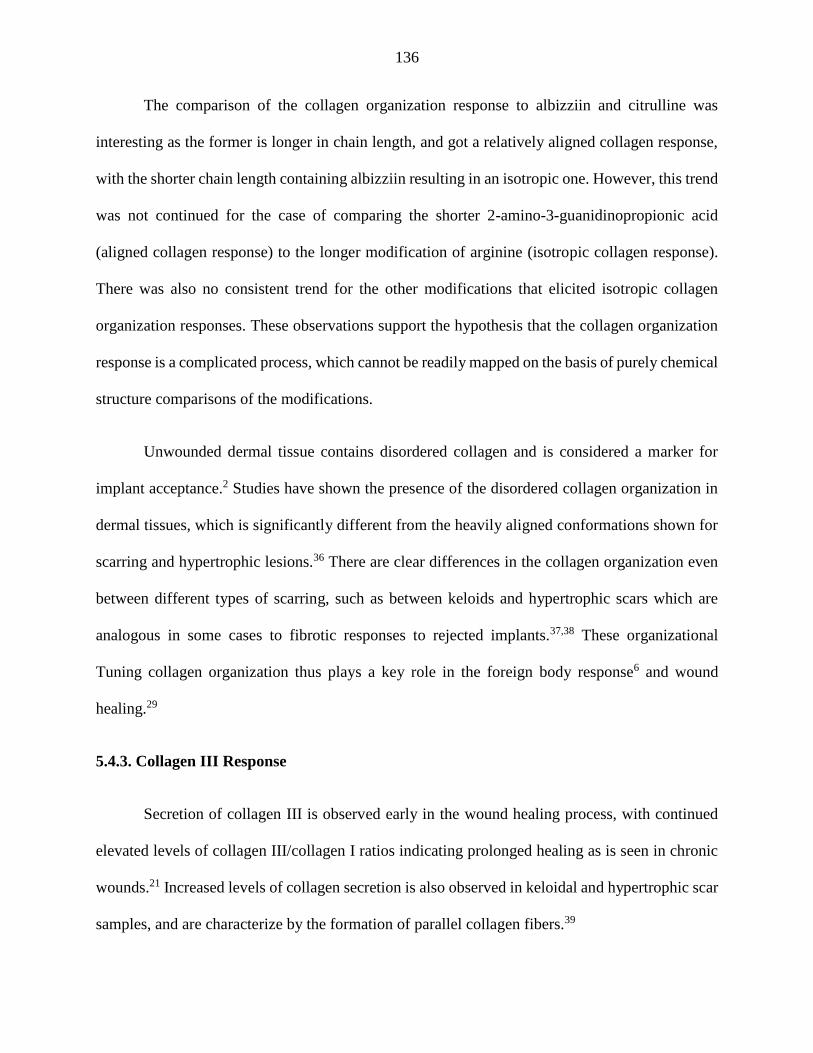
136
The comparison of the collagen organization response to albizziin and citrulline was
interesting as the former is longer in chain length, and got a relatively aligned collagen response,
with the shorter chain length containing albizziin resulting in an isotropic one. However, this trend
was not continued for the case of comparing the shorter 2-amino-3-guanidinopropionic acid
(aligned collagen response) to the longer modification of arginine (isotropic collagen response).
There was also no consistent trend for the other modifications that elicited isotropic collagen
organization responses. These observations support the hypothesis that the collagen organization
response is a complicated process, which cannot be readily mapped on the basis of purely chemical
structure comparisons of the modifications.
Unwounded dermal tissue contains disordered collagen and is considered a marker for
implant acceptance.2 Studies have shown the presence of the disordered collagen organization in
dermal tissues, which is significantly different from the heavily aligned conformations shown for
scarring and hypertrophic lesions.36 There are clear differences in the collagen organization even
between different types of scarring, such as between keloids and hypertrophic scars which are
analogous in some cases to fibrotic responses to rejected implants.37,38 These organizational
Tuning collagen organization thus plays a key role in the foreign body response6 and wound
healing.29
5.4.3. Collagen III Response
Secretion of collagen III is observed early in the wound healing process, with continued
elevated levels of collagen III/collagen I ratios indicating prolonged healing as is seen in chronic
wounds.21 Increased levels of collagen secretion is also observed in keloidal and hypertrophic scar
samples, and are characterize by the formation of parallel collagen fibers.39
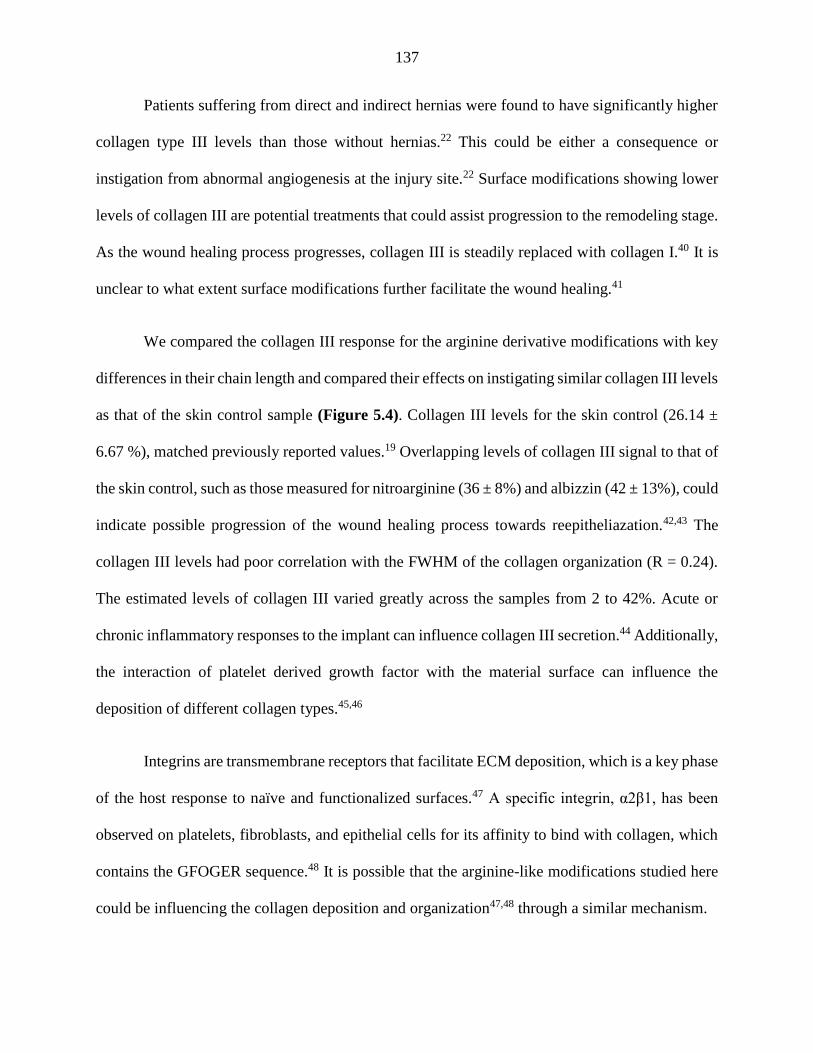
137
Patients suffering from direct and indirect hernias were found to have significantly higher
collagen type III levels than those without hernias.22 This could be either a consequence or
instigation from abnormal angiogenesis at the injury site.22 Surface modifications showing lower
levels of collagen III are potential treatments that could assist progression to the remodeling stage.
As the wound healing process progresses, collagen III is steadily replaced with collagen I.40 It is
unclear to what extent surface modifications further facilitate the wound healing.41
We compared the collagen III response for the arginine derivative modifications with key
differences in their chain length and compared their effects on instigating similar collagen III levels
as that of the skin control sample (Figure 5.4). Collagen III levels for the skin control (26.14 ±
6.67 %), matched previously reported values.19 Overlapping levels of collagen III signal to that of
the skin control, such as those measured for nitroarginine (36 ± 8%) and albizzin (42 ± 13%), could
indicate possible progression of the wound healing process towards reepitheliazation.42,43 The
collagen III levels had poor correlation with the FWHM of the collagen organization (R = 0.24).
The estimated levels of collagen III varied greatly across the samples from 2 to 42%. Acute or
chronic inflammatory responses to the implant can influence collagen III secretion.44 Additionally,
the interaction of platelet derived growth factor with the material surface can influence the
deposition of different collagen types.45,46
Integrins are transmembrane receptors that facilitate ECM deposition, which is a key phase
of the host response to naïve and functionalized surfaces.47 A specific integrin, α2β1, has been
observed on platelets, fibroblasts, and epithelial cells for its affinity to bind with collagen, which
contains the GFOGER sequence.48 It is possible that the arginine-like modifications studied here
could be influencing the collagen deposition and organization47,48 through a similar mechanism.
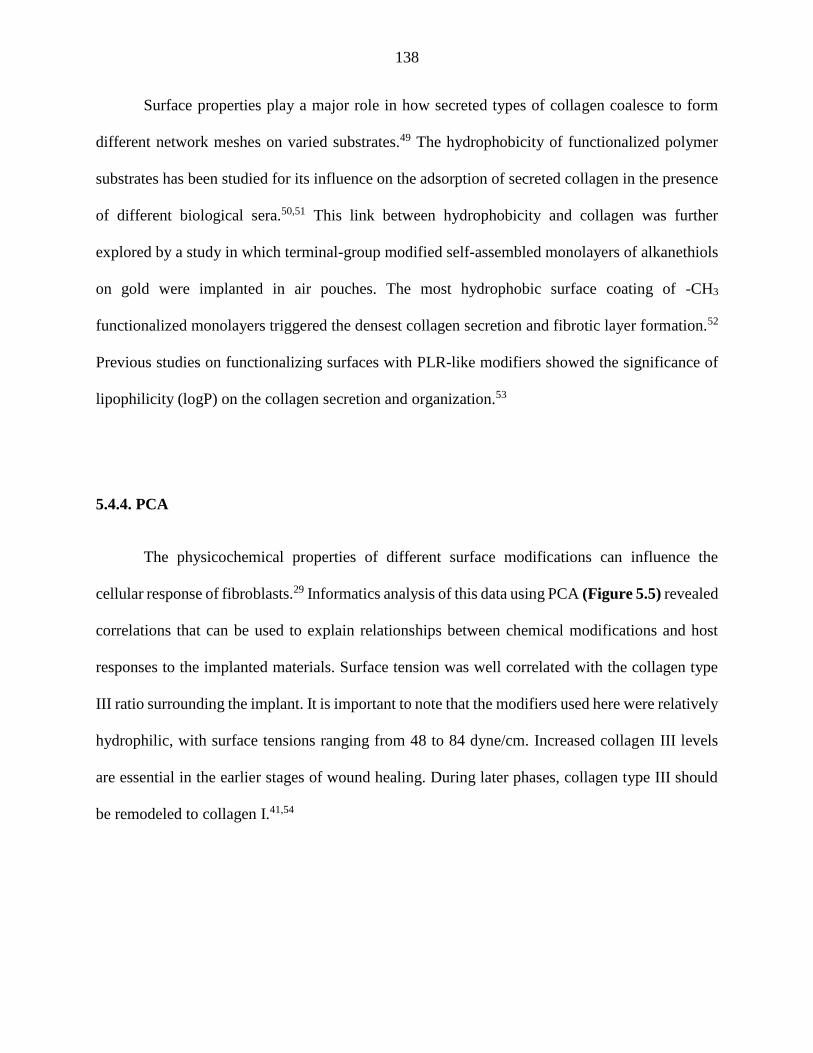
138
Surface properties play a major role in how secreted types of collagen coalesce to form
different network meshes on varied substrates.49 The hydrophobicity of functionalized polymer
substrates has been studied for its influence on the adsorption of secreted collagen in the presence
of different biological sera.50,51 This link between hydrophobicity and collagen was further
explored by a study in which terminal-group modified self-assembled monolayers of alkanethiols
on gold were implanted in air pouches. The most hydrophobic surface coating of -CH3
functionalized monolayers triggered the densest collagen secretion and fibrotic layer formation.52
Previous studies on functionalizing surfaces with PLR-like modifiers showed the significance of
lipophilicity (logP) on the collagen secretion and organization.53
5.4.4. PCA
The physicochemical properties of different surface modifications can influence the
cellular response of fibroblasts.29 Informatics analysis of this data using PCA (Figure 5.5) revealed
correlations that can be used to explain relationships between chemical modifications and host
responses to the implanted materials. Surface tension was well correlated with the collagen type
III ratio surrounding the implant. It is important to note that the modifiers used here were relatively
hydrophilic, with surface tensions ranging from 48 to 84 dyne/cm. Increased collagen III levels
are essential in the earlier stages of wound healing. During later phases, collagen type III should
be remodeled to collagen I.41,54
139
Larger FWHM values indicate isotropic collagen organization. Unwounded skin is
isotropic.55 Kurtosis and skewness parameters are markers for the collagen organization. Skewness
is considered a measure of symmetry for the statistical distribution and kurtosis is defined as a
measure of whether the normal distribution is heavy or light-tailed. Together, these statistical
parameters provide an analytical insight into the collagen organization beyond just the FWHM. In
our study, we observed in the PCA (Figure 5.5) that unlike the FWHM, the skewness and kurtosis
were positively correlated to the polarizability and molar volume of the modifiers. Polarizability
has been studied as an intrinsic aspect to consider for the quantitative structure activity
relationships (QSAR) analysis of diverse chemical structures influencing biological interactions
such as nerve toxicity in frogs.56 This influence of polarizability and its correlation to the fit
parameters indicates that it could play a possible role in the alignment of collagen fibers as a part
of biomaterial interactions.
Using PCA, we attempted to derive an empirical equation for the collagen III ratio in
response to the implanted surfaces. However, this equation could not sufficiently explain the
variability in the collagen III levels in response to the modification with a poor R2 and Q2 fit of
0.56 and 0.4 respectively. The FWHM of the deposited collagen was not determined for all of the
modifiers since some of these failed the isotropy check. Therefore, an empirical equation for the
FWHM was not determined. It is possible though to discuss the strong correlations of some of the
chemical parameters of the modifier to the collagen organization response with respect to
biomaterial interactions.
140
The number of HBD, HBA, and surface tension of the modifiers are closely linked to the
hydrophobicity and surface charge of the functionalized substrate. Previous research on the
hydrophobicity of surfaces showed that rat hepatocytes and schwannoma cells preferred
hydrophobic surfaces with functionalized ECM proteins.51 Considering the salient observations
from the collagen organization and the collagen III levels together, it can be stated that albizziin
modification elicited the best collagen response under the in vivo conditions.
Altering the cell adhesion, migration, and proliferation on functionalized surfaces can
improve wound healing and implant acceptance.57,58 Modifying the underlying substrates with
different ligand chemistries influences cell attachment and the subsequent production of ECM
proteins that are integral aspects of the foreign body response.59 Migration studies on these surfaces
indicated that NIH/3T3 fibroblasts migrated faster on creatine coated substrates.29 In our SHG
based analysis, we observed higher levels of collagen secretion and orientation in response to the
creatine modified glass surface, which is in line with the aforementioned study. When the
migration-based cell response parameters (i.e., speed and persistence) were combined with the ex
vivo SHG analysis and chemical properties in a PCA plot, we uncovered correlations with the
chemical properties of the modifier. The negative Pearson’s correlations for the speed with
polarizability (R = -0.53) and molar volume (R = -0.50) were noted from the PCA, as possible
influences on how the cell migration can be influenced by the electrochemical and physical
properties of the modifier (Table 5.3). The positive correlation of the cell persistence to the LogD
(5.5) (R = 0.58) and negative correlation to the number of freely rotating bonds in the chemical
modifier structure (R = -0.45), indicates the effect that the solubility of such chemical modifiers
has on how cells migrate across functionalized surfaces.
141
5.5. Conclusions
The collagen response to functionalized glass beads coated with modified PLRs was
studied to better understand how chemical modifications can impact implant acceptance. Tissue
sections were removed 28 days post-implantation and showed some significant differences in the
measured collagen signal intensity, in particular for the creatine and albizziin modifications.
Increased collagen type III had a positive correlation with hydrogen bond acceptors in the modifier
structure and surface tension. PCA also uncovered correlations between the freely rotating bonds,
and the enthalpy of vaporization of the modifier on the organization of collagen response to
modified PLR coated glass beads. The insights obtained from correlating the chemical properties
of the PLR modifications to the SHG imaging derived parameters can further the design principles
for improving implant acceptance.
5.6 References
1. Anderson, J. M., Rodriguez, A. & Chang, D. T. Foreign body reaction to biomaterials.
Semin. Immunol. 20, 86–100 (2008).
2. Boddupalli, A., Zhu, L. & Bratlie, K. M. Methods for Implant Acceptance and Wound
Healing: Material Selection and Implant Location Modulate Macrophage and Fibroblast
Phenotypes. Adv. Healthc. Mater. (2016). doi:10.1002/adhm.201600532
3. Trindade, R., Albrektsson, T., Tengvall, P. & Wennerberg, A. Foreign Body Reaction to
Biomaterials: On Mechanisms for Buildup and Breakdown of Osseointegration. Clin.
Implant Dent. Relat. Res. 1–12 (2014). doi:10.1111/cid.12274
4. Bryers, J. D., Giachelli, C. M. & Ratner, B. D. Engineering biomaterials to integrate and
heal: The biocompatibility paradigm shifts. Biotechnology and Bioengineering 109, 1898–
1911 (2012).
5. Ziats, N. P., Miller, K. M. & Anderson, J. M. In vitro and in vivo interactions of cells with
biomaterials. Biomaterials 9, 5–13 (1988).
6. Kastellorizios, M., Tipnis, N. & Burgess, D. J. Foreign body reaction to subcutaneous
implants. Advances in Experimental Medicine and Biology 865, (2015).
142
7. Olderøy, M. et al. Biochemical and structural characterization of neocartilage formed by
mesenchymal stem cells in alginate hydrogels. PLoS One 9, (2014).
8. Singer, A. J. & Clark, R. a F. Cutaneous Wound Healing. N. Engl. J. Med. 341, 738–746
(1999).
9. Martin, P. Wound Healing--Aiming for Perfect Skin Regeneration. Science (80-. ). 276, 75–
81 (1997).
10. Clark, J. a., Cheng, J. C. Y. & Leung, K. S. Mechanical properties of normal skin and
hypertrophic scars. Burns 22, 443–446 (1996).
11. Linares, H. A., Kischer, C. W., Dobrkovsky, M. & Larson, D. L. The histotypic organization
of collagen of the hypertrophic scar in humans. J. Invest. Dermatol. 59, 323–332 (1972).
12. Clore, J. N., Cohen, I. K. & Diegelmann, R. F. Quantitation of Collagen Types I and III
during Wound Healing in Rat Skin. Proc. Soc. Exp. Biol. Med. 161, 337–340 (1979).
13. Van Zuijlen, P. P. M. et al. Collagen morphology in human skin and scar tissue: No
adaptations in response to mechanical loading at joints. Burns 29, 423–431 (2003).
14. Chen, X., Nadiarynkh, O., Plotnikov, S. & Campagnola, P. J. Second harmonic generation
microscopy for quantitative analysis of collagen fibrillar structure. Nat. Protoc. 7, 654–69
(2012).
15. Boddupalli, A. & Bratlie, K. M. Multimodal imaging of harmonophores and application of
high content imaging for early cancer detection. Mater. Discov. 1, 10–20 (2016).
16. Suhalim, J. L. et al. Characterization of Cholesterol Crystals in Atherosclerotic Plaques
Using Stimulated Raman Scattering and Second-Harmonic Generation Microscopy.
Biophys. J. 102, 1988–1995 (2012).
17. Plotnikov, S. V, Millard, A. C., Campagnola, P. J. & Mohler, W. a. Characterization of the
myosin-based source for second-harmonic generation from muscle sarcomeres. Biophys. J.
90, 693–703 (2006).
18. Su, P. J. et al. The discrimination of type I and type II collagen and the label-free imaging
of engineered cartilage tissue. Biomaterials 31, 9415–9421 (2010).
19. Velnar, T., Bailey, T. & Smrkolj, V. The Wound Healing Process: An Overview of the
Cellular and Molecular Mechanisms. J. Int. Med. Res. 37, 1528–1542 (2009).
20. Koruth, S. & Narayanaswamy Chetty, Y. V. Hernias- Is it a primary defect or a systemic
disorder? Role of collagen III in all hernias- A case control study. Ann. Med. Surg. 19, 37–
40 (2017).
143
21. Zhang, K., Garner, W., Cohen, L., Rodriguez, J. & Phan, S. Increased Types I and III
Collagen and Transforming Growth Factor-β1 mRNA and Protein in Hypertrophic Burn
Scar. J. Invest. Dermatol. 104, 750–754 (1995).
22. Klinge, U. et al. Synthesis of type I and III collagen, expression of fibronectin and matrix
metalloproteinase 1 and 13 in hernias of patients with inguinal hernia. Int J Surg Invest. 1,
219–227 (1999).
23. Tomasek J. J., Gabbiani G., Hinz B., Chaponnier C., B. R. A. Myofibroblasts and mechano-
regulation of connective tissue remodelling. Nat. Rev. Mol. Cell Biol 3, 346–63 (2002).
24. Tomasek, J. J., Gabbiani, G., Hinz, B., Chaponnier, C. & Brown, R. a. Myofibroblasts and
mechano-regulation of connective tissue remodelling. Nat. Rev. Mol. Cell Biol. 3, 349–63
(2002).
25. Benavides, F., Oberyszyn, T. M., VanBuskirk, A. M., Reeve, V. E. & Kusewitt, D. F. The
hairless mouse in skin research. J. Dermatol. Sci. 53, 10–18 (2009).
26. Palero, J. A., de Bruijn, H. S., van der Ploeg van den Heuvel, A., Sterenborg, H. J. C. M. &
Gerritsen, H. C. Spectrally Resolved Multiphoton Imaging of In Vivo and Excised Mouse
Skin Tissues. Biophys. J. 93, 992–1007 (2007).
27. Bygd, H. C., Forsmark, K. D. & Bratlie, K. M. Altering invivo macrophage responses with
modified polymer properties. Biomaterials 56, (2015).
28. Akilbekova, D. & Bratlie, K. M. Quantitative characterization of collagen in the fibrotic
capsule surrounding implanted polymeric microparticles through second harmonic
generation imaging. PLoS One 10, 1–17 (2015).
29. Bygd, H. C., Akilbekova, D., Muñoz, A., Forsmark, K. D. & Bratlie, K. M. Poly-l-arginine
based materials as instructive substrates for fibroblast synthesis of collagen. Biomaterials
63, 47–57 (2015).
30. Gavin, H. P. The Levenberg-Marquardt method for nonlinear least squares curve-fitting
problems. Department of Civil and Environmental Engineering, Duke University (2013).
31. Wynn, T. A. Cellular and molecular mechanisms of fibrosis. J. Pathol. 214, 199–210
(2008).
32. Ajeti, V. et al. Structural changes in mixed Col I/Col V collagen gels probed by SHG
microscopy: implications for probing stromal alterations in human breast cancer. Biomed.
Opt. Express 2, 2307–2316 (2011).
33. Knott, A. et al. A novel treatment option for photoaged skin. J. Cosmet. Dermatol. 7, 15–
22 (2008).
34. Fischer, F. et al. Folic acid and creatine improve the firmness of human skin in vivo. J.
Cosmet. Dermatol. 10, 15–23 (2011).
144
35. Gailhouste, L. et al. Fibrillar collagen scoring by second harmonic microscopy: A new tool
in the assessment of liver fibrosis. J. Hepatol. 52, 398–406 (2010).
36. Ehrlich, H. P. et al. Morphological and immunochemical differences between keloid and
hypertrophic scar. Am. J. Pathol. 145, 105–113 (1994).
37. English, R. S. & Shenefelt, P. D. Keloids and hypertrophic scars. Dermatologic Surg. 25,
631–638 (1999).
38. Cicchi, R. et al. In vivo non-invasive monitoring of collagen remodelling by two-photon
microscopy after micro-ablative fractional laser resurfacing. J. Biophotonics 7, 914–925
(2014).
39. Verhaegen, P. D. H. M. et al. Differences in collagen architecture between keloid,
hypertrophic scar, normotrophic scar, and normal skin: An objective histopathological
analysis. Wound Repair Regen. 17, 649–656 (2009).
40. Volk, S. W., Wang, Y., Mauldin, E. a, Liechty, K. W. & Adams, S. L. Diminished type III
collagen promotes myofibroblast differentiation and increases scar deposition in cutaneous
wound healing. Cells. Tissues. Organs 194, 25–37 (2011).
41. Gabbiani, G. The myofibroblast in wound healing and fibrocontractive diseases. J. Pathol.
200, 500–503 (2003).
42. Volk, S. W., Wang, Y., Mauldin, E. A., Liechty, K. W. & Adams, S. L. Diminished type III
collagen promotes myofibroblast differentiation and increases scar deposition in cutaneous
wound healing. Cells Tissues Organs 194, 25–37 (2011).
43. Brisson, B. K. et al. Type III collagen directs stromal organization and limits metastasis in
a murine model of breast cancer. Am. J. Pathol. 185, 1471–1486 (2015).
44. Lee, Y., Kwon, J., Khang, G. & Lee, D. Reduction of inflammatory responses and
enhancement of extracellular matrix formation by vanillin-incorporated poly(lactic-co-
glycolic acid) scaffolds. Tissue Eng. Part A 18, 1967–78 (2012).
45. Roberts, A. B. et al. Transforming growth factor type beta: rapid induction of fibrosis and
angiogenesis in vivo and stimulation of collagen formation in vitro. Proc. Natl. Acad. Sci.
83, 4167–4171 (1986).
46. Grotendorst, G. R., Seppä, H. E., Kleinman, H. K. & Martin, G. R. Attachment of smooth
muscle cells to collagen and their migration toward platelet-derived growth factor. Proc.
Natl. Acad. Sci. U. S. A. 78, 3669–72 (1981).
47. Zeltz, C. & Gullberg, D. The integrin-collagen connection - a glue for tissue repair? J. Cell
Sci. 129, 1284–1284 (2016).
48. Emsley, J., Knight, C. G., Farndale, R. W., Barnes, M. J. & Liddington, R. C. Structural
Basis of Collagen Recognition by Integrin α2β1. Cell 101, 47–56 (2000).
145
49. Brown, B. N. et al. Surface characterization of extracellular matrix scaffolds. Biomaterials
31, 428–437 (2010).
50. Dewez, J., Berger, V., Schneider, Y. & Rouxhet, P. Influence of Substrate Hydrophobicity
on the Adsorption of Collagen in the Presence of Pluronic F68, Albumin, or Calf Serum. J.
Colloid Interface Sci. 191, 1–10 (1997).
51. Dewez, J. L. et al. Adhesion of mammalian cells to polymer surfaces: From physical
chemistry of surfaces to selective adhesion on defined patterns. Biomaterials 19, 1441–1445
(1998).
52. Barbosa, J. N., Madureira, P., Barbosa, M. A. & Águas, A. P. The influence of functional
groups of self-assembled monolayers on fibrous capsule formation and cell recruitment. J.
Biomed. Mater. Res. - Part A 76, 737–743 (2006).
53. Ma, L., Bygd, H. C. & Bratlie, K. M. Improving selective targeting to macrophage
subpopulations through modifying liposomes with arginine based materials. Integr. Biol. 9,
58–67 (2017).
54. Otranto, M. et al. The role of the myofibroblast in tumor stroma remodeling. Cell Adhes.
Migr. 6, 203–219 (2012).
55. Cicchi, R. et al. Scoring of collagen organization in healthy and diseased human dermis by
multiphoton microscopy. J. Biophotonics 3, 34–43 (2010).
56. Hansch, C. et al. On the role of polarizability in chemical - Biological interactions. J. Chem.
Inf. Comput. Sci. 43, 120–125 (2003).
57. Mann, B. K. & West, J. L. Cell adhesion peptides alter smooth muscle cell adhesion,
proliferation, migration, and matrix protein synthesis on modified surfaces and in polymer
scaffolds. J. Biomed. Mater. Res. 60, 86–93 (2002).
58. Yang, Z. et al. Bioactive Plasma-Polymerized Bipolar Films for Enhanced Endothelial Cell
Mobility. Macromol. Biosci. 11, 797–805 (2011).
59. Luttikhuizen, D. T., Harmsen, M. C. & Van Luyn, M. J. A. Cellular and molecular dynamics in the
foreign body reaction. Tissue Eng. 12, 1955–1970 (2006).
146
CHAPTER 6
SECOND HARMONIC GENERATION IMAGING OF COLLAGEN FIBER
ORIENTATION AS A MARKER FOR SCARRING
More than US$25 billion was spent on costs related to chronic wound care treatment in the
United States in 2008. In addition to the high cost, chronic wounds affect over 6.5 million people.1
These slow-healing wounds are often seen in people suffering from diabetes and obesity. Wound
care accounts for a significant economic expenditure in not just the US, but all over the world. The
Corporate Research of Materials Lab at 3M collaborated with the Bratlie lab to understand the
wound healing process from the perspective of changes in collagen that can be sensitively analyzed
using Second Harmonic Generation (SHG) microscopy. By imaging tissues that have been
subjected diverse treatment strategies, the Bratlie lab conducted a blind study on the effectiveness
of the wound healing process. The ability of specific treatments to induce isotropic collagen
organization, as well as similar collagen III % to unwounded tissue, were used to evaluate the
efficacy of over 20 formulations spread across 272 tissue sections so far.
6.1. Introduction
A wound has been defined as a “a break in the epithelial integrity of the skin and may be
accompanied by disruption of the structure and function of underlying normal tissue”.2 They are
not limited to physical trauma, but can also be caused by diseases that cause internal or external
damage to organs. The disruption of the local tissue environment causes the instigation of a cascade
of biological responses including blood coagulation, inflammatory, and chronic wound healing.3
147
The natural wound healing process is timely and ordered, seeking to restore anatomic
functionality of damaged tissues.4,5 The wound healing response varies greatly depending on the
health status of the subject, particularly when treating for acute versus chronic wounds.5 Stochastic
collagen order occurs in unwounded dermis, while scar tissue from hypertrophic scars is more
aligned in parallel arrays.6 Collagen III typically rapidly decreases once wound healing progresses
towards granulation tissue formation. Sustained, elevated levels of the collagen type III are
associated with delayed healing response.7,8 Isotropic collagen orientation6 with similar levels of
collagen III8 as unwounded tissue would be the ideal outcome for a wound dressing.
Polarized SHG microscopy can sensitively visualize collagen organization in diverse
clinical samples, without the use of dyes or complicated tagging protocols.9 SHG microscopy is a
non-linear interaction between two incident laser beams with samples, resulting in the generation
of photon that are frequency doubled.10 This technique can quantitatively characterize collagen
organization in rat tail tendons and cartilage tissue.11 As this technique is a second-order optical
process, non-centrosymmetric molecules are SHG active under the electric dipole approximation,
while non-centrosymmetric molecules do not contribute to the signal.
The susceptibility tensor elements measure using SHG are related to the material
properties.9,12 Shifts in these susceptibility elements can be used to differentiate between different
types of collagen signal based on differences in peptide or methylene binding.11 By extracting
these susceptibility tensors, a map of collagen type III to collagen type I can be obtained.9 The
ratio of collagen III/I is approximately 30% for unwounded dermal tissues.13,14 Collagen III levels
remain elevated in prolonged wound healing responses, as seen in hypertrophic scarring and
inguinal hernias.7,15,16
148
There is no consensus, however, on the exact role played by collagen III in the wound
healing process. During the granulation tissue formation phase, the replacement of collagen I by
collagen III is higher in tissues that undergo greater mechanical stress.17 This indicates possible
differences for the role played by the two types of collagen in terms of how they respond to
mechanotransducive cues. The up-regulation of collagen III indicates decreases in mechanical
remodeling of the wound site.15 In injuries from burns, it is common to see well aligned collagen
in scar tissue, compared to disorganized unwounded dermis.14,18
Our study evaluates five different wound treatments provided by 3M, as a blind study.
Considerable information regarding the wound healing formulations were proprietary to 3M, and
thus the treatments are defined with the limited titles assigned to each of them.
6.2. Materials and Methods
All the imaging studies were conducted in triplicate for each sample. Results were
compared to controls as provided by 3M. Preserved tissue samples from porcine subjects were
used throughout this study.
6.2.1. Materials
Treatments were prepared under confidential conditions by the researchers at the Corporate
Research Materials Laboratory at 3M.
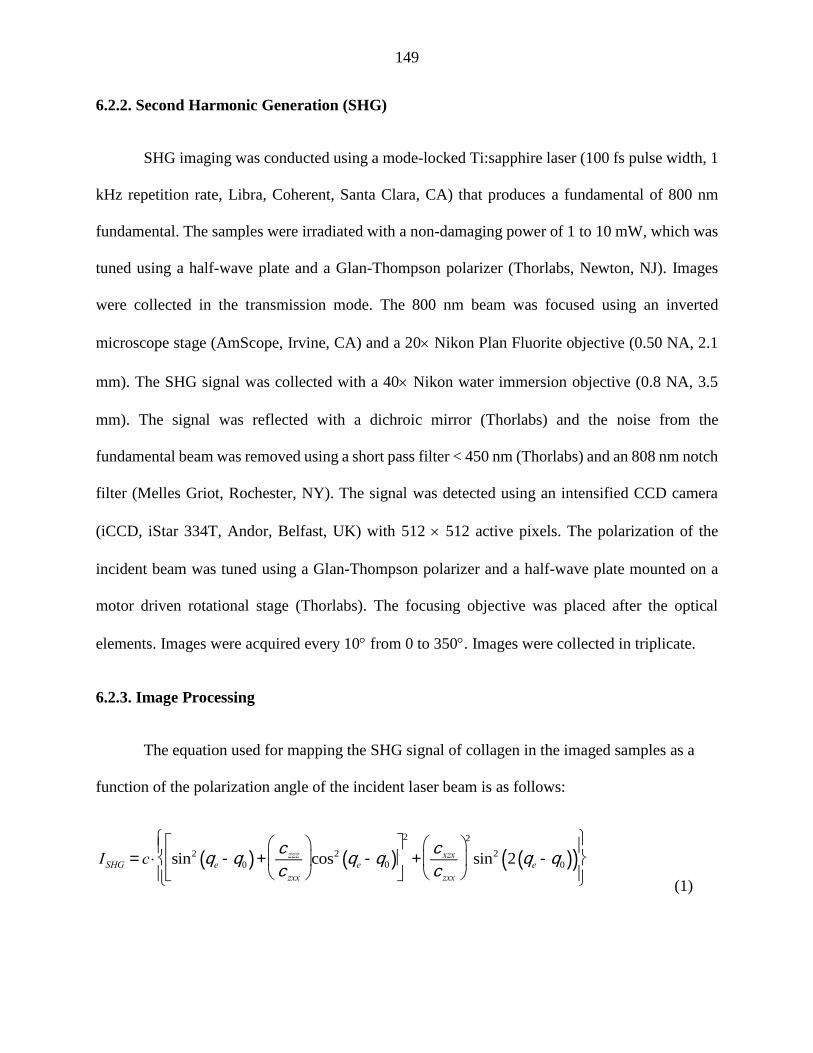
149
6.2.2. Second Harmonic Generation (SHG)
SHG imaging was conducted using a mode-locked Ti:sapphire laser (100 fs pulse width, 1
kHz repetition rate, Libra, Coherent, Santa Clara, CA) that produces a fundamental of 800 nm
fundamental. The samples were irradiated with a non-damaging power of 1 to 10 mW, which was
tuned using a half-wave plate and a Glan-Thompson polarizer (Thorlabs, Newton, NJ). Images
were collected in the transmission mode. The 800 nm beam was focused using an inverted
microscope stage (AmScope, Irvine, CA) and a 20 Nikon Plan Fluorite objective (0.50 NA, 2.1
mm). The SHG signal was collected with a 40 Nikon water immersion objective (0.8 NA, 3.5
mm). The signal was reflected with a dichroic mirror (Thorlabs) and the noise from the
fundamental beam was removed using a short pass filter < 450 nm (Thorlabs) and an 808 nm notch
filter (Melles Griot, Rochester, NY). The signal was detected using an intensified CCD camera
(iCCD, iStar 334T, Andor, Belfast, UK) with 512 512 active pixels. The polarization of the
incident beam was tuned using a Glan-Thompson polarizer and a half-wave plate mounted on a
motor driven rotational stage (Thorlabs). The focusing objective was placed after the optical
elements. Images were acquired every 10 from 0 to 350. Images were collected in triplicate.
6.2.3. Image Processing
The equation used for mapping the SHG signal of collagen in the imaged samples as a
function of the polarization angle of the incident laser beam is as follows:
(1)
ISHG = c × sin2 qe -q0( )+czzzczxx
æ
èç
ö
ø÷cos2 qe -q0( )
é
ëê
ù
ûú
2
+cxzxczxx
æ
èç
ö
ø÷
2
sin2 2 qe -q0( )( )ì
íï
îï
ü
ýï
þï
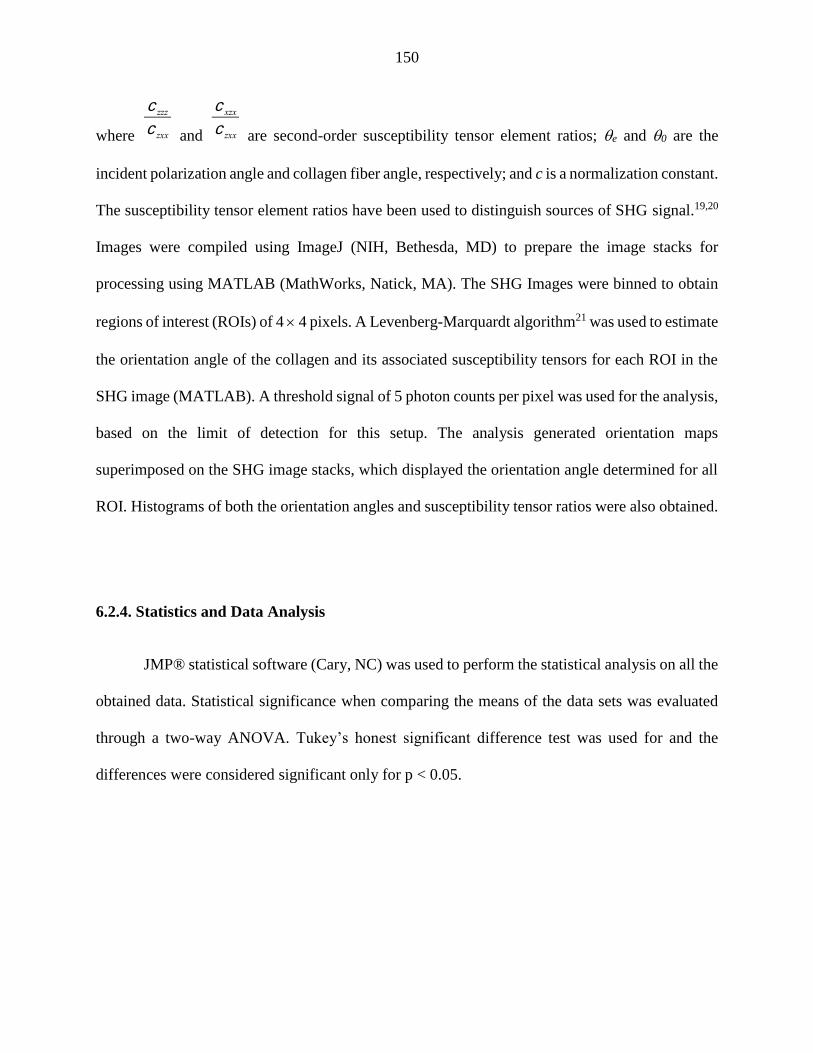
150
where and are second-order susceptibility tensor element ratios; e and 0 are the
incident polarization angle and collagen fiber angle, respectively; and c is a normalization constant.
The susceptibility tensor element ratios have been used to distinguish sources of SHG signal.19,20
Images were compiled using ImageJ (NIH, Bethesda, MD) to prepare the image stacks for
processing using MATLAB (MathWorks, Natick, MA). The SHG Images were binned to obtain
regions of interest (ROIs) of 4 4 pixels. A Levenberg-Marquardt algorithm21 was used to estimate
the orientation angle of the collagen and its associated susceptibility tensors for each ROI in the
SHG image (MATLAB). A threshold signal of 5 photon counts per pixel was used for the analysis,
based on the limit of detection for this setup. The analysis generated orientation maps
superimposed on the SHG image stacks, which displayed the orientation angle determined for all
ROI. Histograms of both the orientation angles and susceptibility tensor ratios were also obtained.
6.2.4. Statistics and Data Analysis
JMP® statistical software (Cary, NC) was used to perform the statistical analysis on all the
obtained data. Statistical significance when comparing the means of the data sets was evaluated
through a two-way ANOVA. Tukey’s honest significant difference test was used for and the
differences were considered significant only for p < 0.05.
c zzz
c zxx
c xzx
c zxx
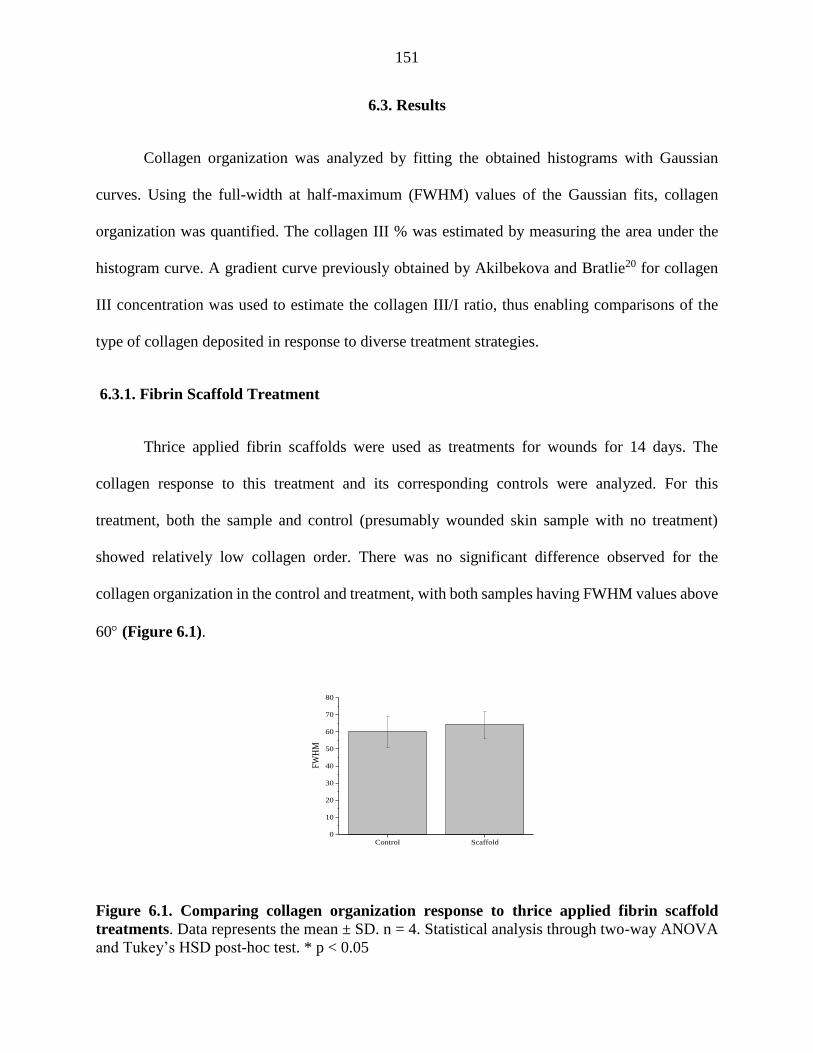
151
6.3. Results
Collagen organization was analyzed by fitting the obtained histograms with Gaussian
curves. Using the full-width at half-maximum (FWHM) values of the Gaussian fits, collagen
organization was quantified. The collagen III % was estimated by measuring the area under the
histogram curve. A gradient curve previously obtained by Akilbekova and Bratlie20 for collagen
III concentration was used to estimate the collagen III/I ratio, thus enabling comparisons of the
type of collagen deposited in response to diverse treatment strategies.
6.3.1. Fibrin Scaffold Treatment
Thrice applied fibrin scaffolds were used as treatments for wounds for 14 days. The
collagen response to this treatment and its corresponding controls were analyzed. For this
treatment, both the sample and control (presumably wounded skin sample with no treatment)
showed relatively low collagen order. There was no significant difference observed for the
collagen organization in the control and treatment, with both samples having FWHM values above
60 (Figure 6.1).
Figure 6.1. Comparing collagen organization response to thrice applied fibrin scaffold
treatments. Data represents the mean ± SD. n = 4. Statistical analysis through two-way ANOVA
and Tukey’s HSD post-hoc test. * p < 0.05
Control Scaffold0
10
20
30
40
50
60
70
80
FW
HM
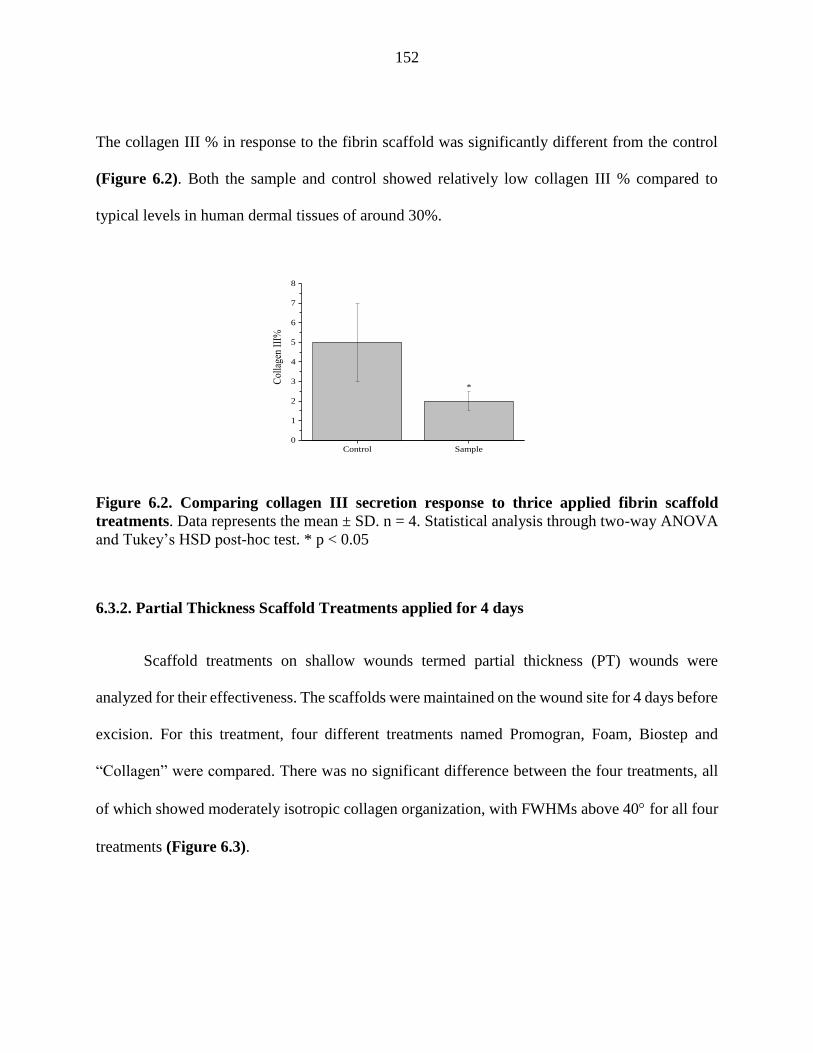
152
The collagen III % in response to the fibrin scaffold was significantly different from the control
(Figure 6.2). Both the sample and control showed relatively low collagen III % compared to
typical levels in human dermal tissues of around 30%.
Figure 6.2. Comparing collagen III secretion response to thrice applied fibrin scaffold
treatments. Data represents the mean ± SD. n = 4. Statistical analysis through two-way ANOVA
and Tukey’s HSD post-hoc test. * p < 0.05
6.3.2. Partial Thickness Scaffold Treatments applied for 4 days
Scaffold treatments on shallow wounds termed partial thickness (PT) wounds were
analyzed for their effectiveness. The scaffolds were maintained on the wound site for 4 days before
excision. For this treatment, four different treatments named Promogran, Foam, Biostep and
“Collagen” were compared. There was no significant difference between the four treatments, all
of which showed moderately isotropic collagen organization, with FWHMs above 40 for all four
treatments (Figure 6.3).
Control Sample0
1
2
3
4
5
6
7
8
*
Col
lage
n II
I%
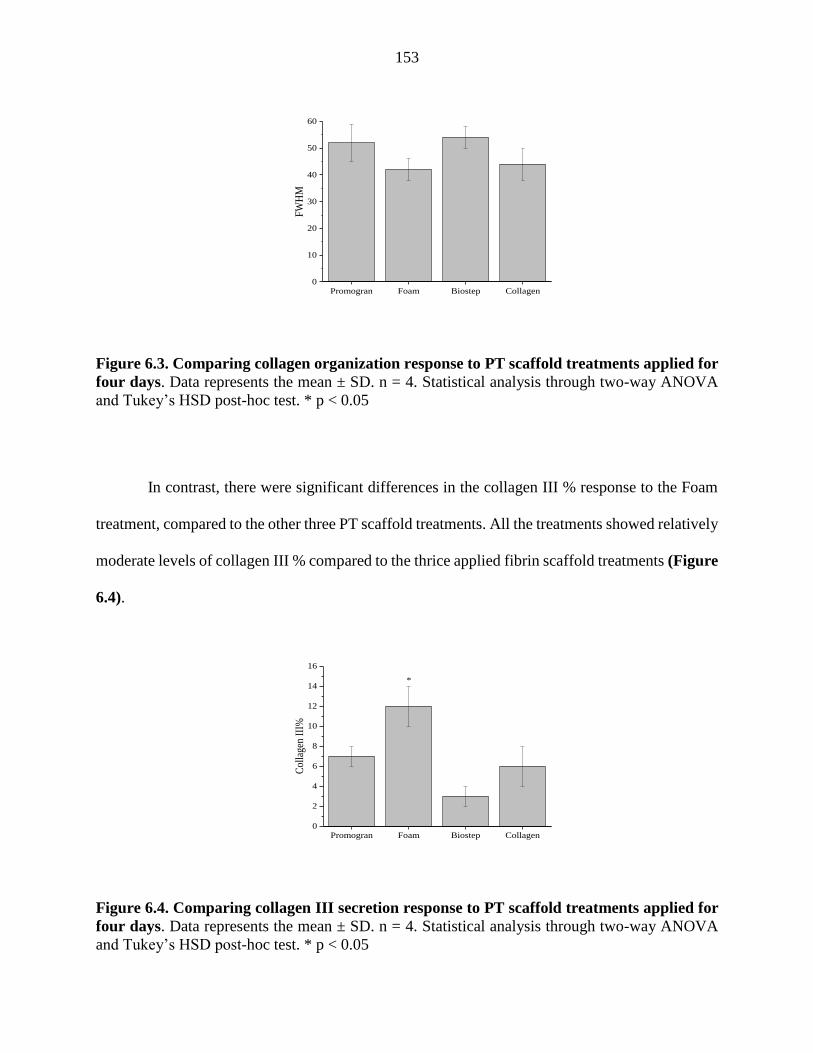
153
Figure 6.3. Comparing collagen organization response to PT scaffold treatments applied for
four days. Data represents the mean ± SD. n = 4. Statistical analysis through two-way ANOVA
and Tukey’s HSD post-hoc test. * p < 0.05
In contrast, there were significant differences in the collagen III % response to the Foam
treatment, compared to the other three PT scaffold treatments. All the treatments showed relatively
moderate levels of collagen III % compared to the thrice applied fibrin scaffold treatments (Figure
6.4).
Figure 6.4. Comparing collagen III secretion response to PT scaffold treatments applied for
four days. Data represents the mean ± SD. n = 4. Statistical analysis through two-way ANOVA
and Tukey’s HSD post-hoc test. * p < 0.05
Promogran Foam Biostep Collagen0
10
20
30
40
50
60
FW
HM
Promogran Foam Biostep Collagen0
2
4
6
8
10
12
14
16
*
Col
lage
n II
I%
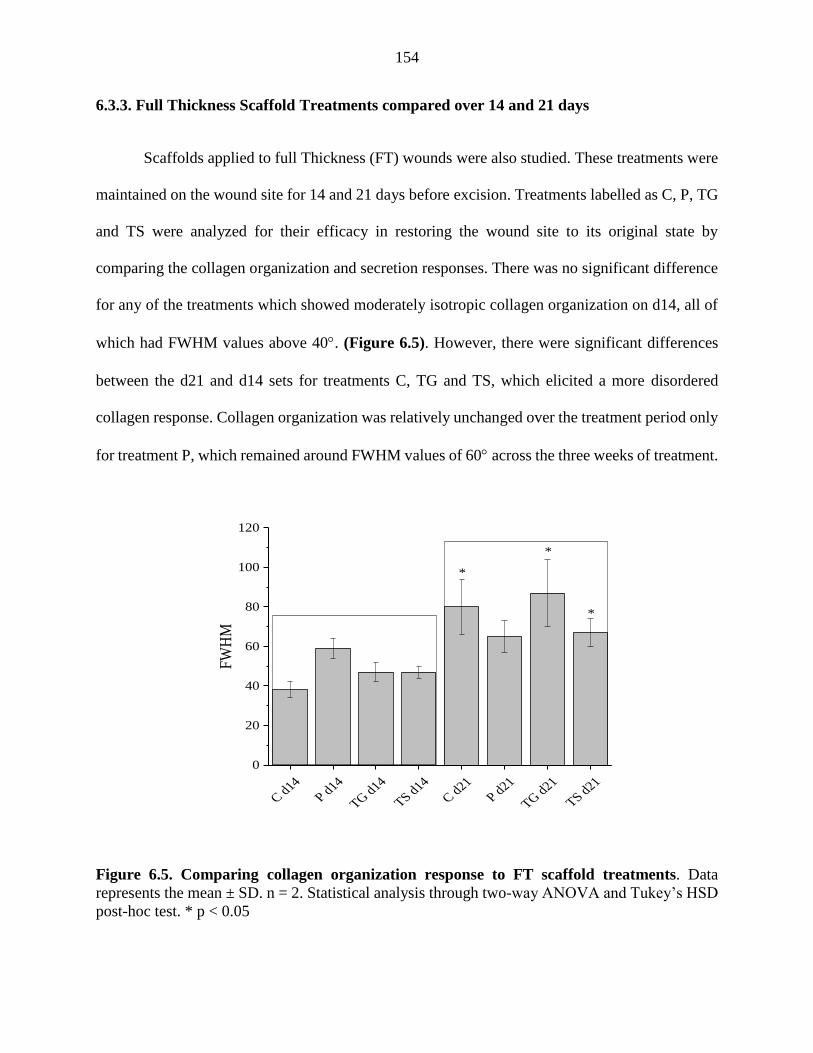
154
6.3.3. Full Thickness Scaffold Treatments compared over 14 and 21 days
Scaffolds applied to full Thickness (FT) wounds were also studied. These treatments were
maintained on the wound site for 14 and 21 days before excision. Treatments labelled as C, P, TG
and TS were analyzed for their efficacy in restoring the wound site to its original state by
comparing the collagen organization and secretion responses. There was no significant difference
for any of the treatments which showed moderately isotropic collagen organization on d14, all of
which had FWHM values above 40. (Figure 6.5). However, there were significant differences
between the d21 and d14 sets for treatments C, TG and TS, which elicited a more disordered
collagen response. Collagen organization was relatively unchanged over the treatment period only
for treatment P, which remained around FWHM values of 60 across the three weeks of treatment.
Figure 6.5. Comparing collagen organization response to FT scaffold treatments. Data
represents the mean ± SD. n = 2. Statistical analysis through two-way ANOVA and Tukey’s HSD
post-hoc test. * p < 0.05
C d14
P d14
TG d
14
TS d14
C d21
P d21
TG d
21
TS d21
0
20
40
60
80
100
120
*
*
FW
HM
*
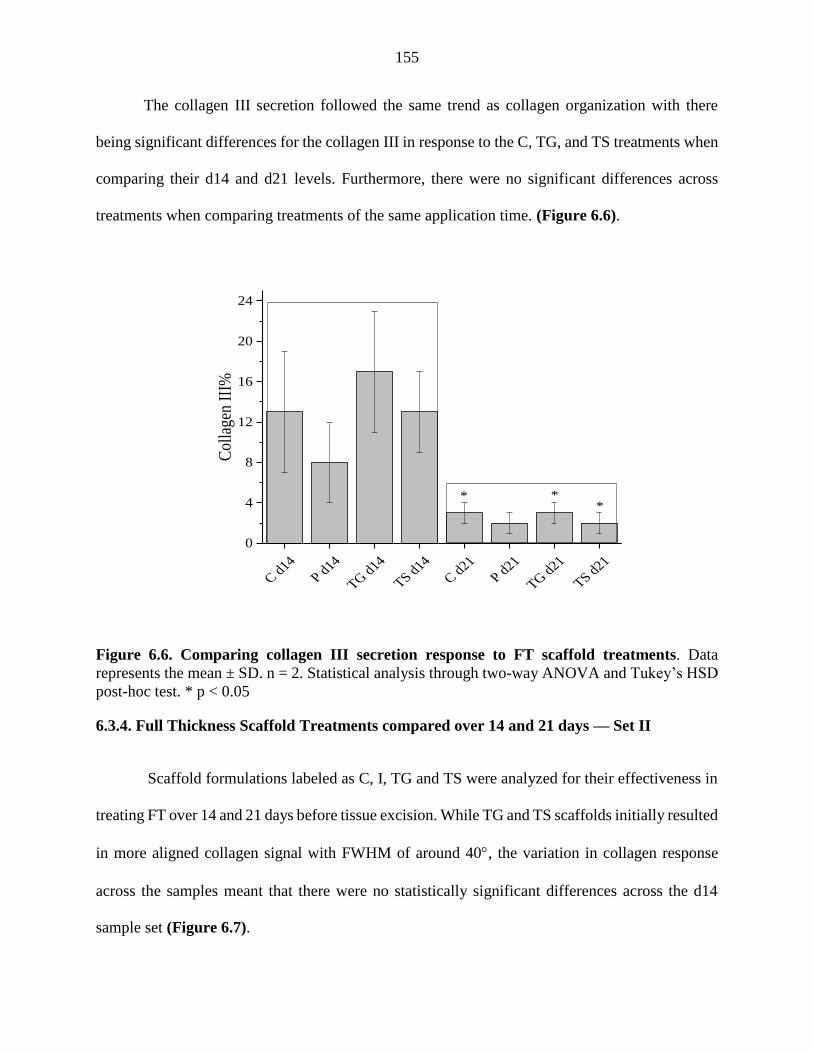
155
The collagen III secretion followed the same trend as collagen organization with there
being significant differences for the collagen III in response to the C, TG, and TS treatments when
comparing their d14 and d21 levels. Furthermore, there were no significant differences across
treatments when comparing treatments of the same application time. (Figure 6.6).
Figure 6.6. Comparing collagen III secretion response to FT scaffold treatments. Data
represents the mean ± SD. n = 2. Statistical analysis through two-way ANOVA and Tukey’s HSD
post-hoc test. * p < 0.05
6.3.4. Full Thickness Scaffold Treatments compared over 14 and 21 days — Set II
Scaffold formulations labeled as C, I, TG and TS were analyzed for their effectiveness in
treating FT over 14 and 21 days before tissue excision. While TG and TS scaffolds initially resulted
in more aligned collagen signal with FWHM of around 40, the variation in collagen response
across the samples meant that there were no statistically significant differences across the d14
sample set (Figure 6.7).
C d14
P d14
TG d
14
TS d14
C d21
P d21
TG d
21
TS d21
0
4
8
12
16
20
24
***
Col
lage
n II
I%
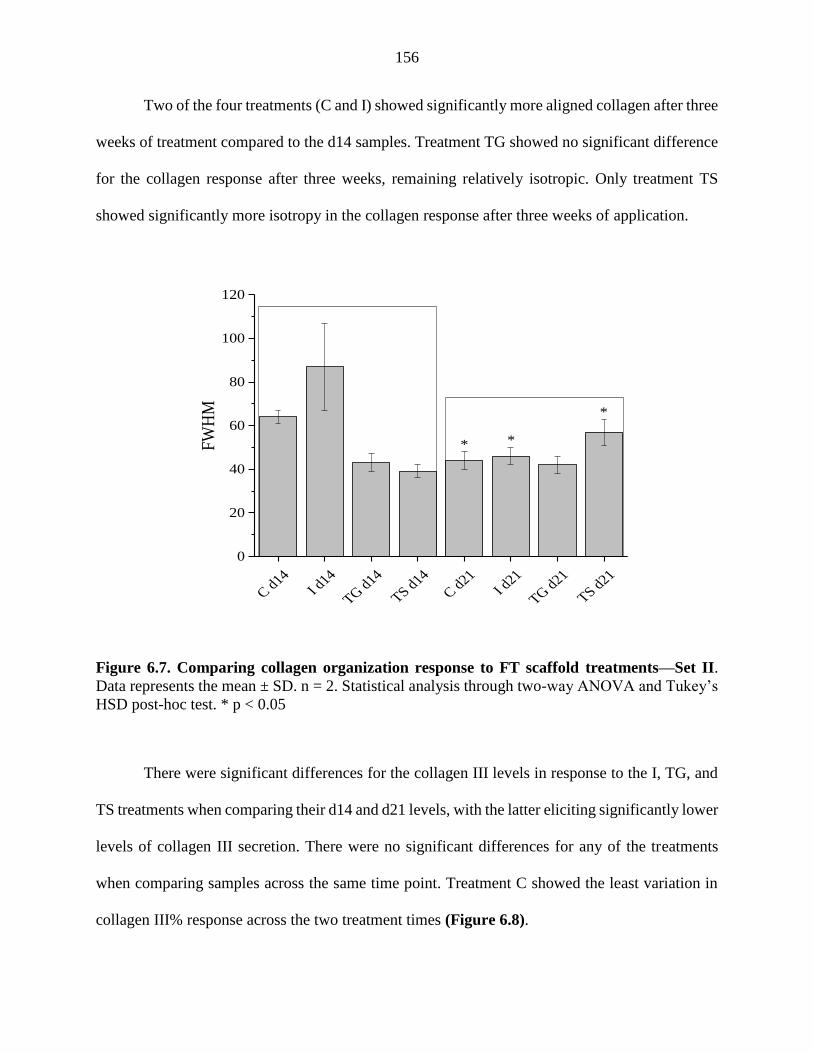
156
Two of the four treatments (C and I) showed significantly more aligned collagen after three
weeks of treatment compared to the d14 samples. Treatment TG showed no significant difference
for the collagen response after three weeks, remaining relatively isotropic. Only treatment TS
showed significantly more isotropy in the collagen response after three weeks of application.
Figure 6.7. Comparing collagen organization response to FT scaffold treatments—Set II.
Data represents the mean ± SD. n = 2. Statistical analysis through two-way ANOVA and Tukey’s
HSD post-hoc test. * p < 0.05
There were significant differences for the collagen III levels in response to the I, TG, and
TS treatments when comparing their d14 and d21 levels, with the latter eliciting significantly lower
levels of collagen III secretion. There were no significant differences for any of the treatments
when comparing samples across the same time point. Treatment C showed the least variation in
collagen III% response across the two treatment times (Figure 6.8).
C d14
I d14
TG d
14
TS d14
C d21
I d21
TG d
21
TS d21
0
20
40
60
80
100
120
*
**FW
HM
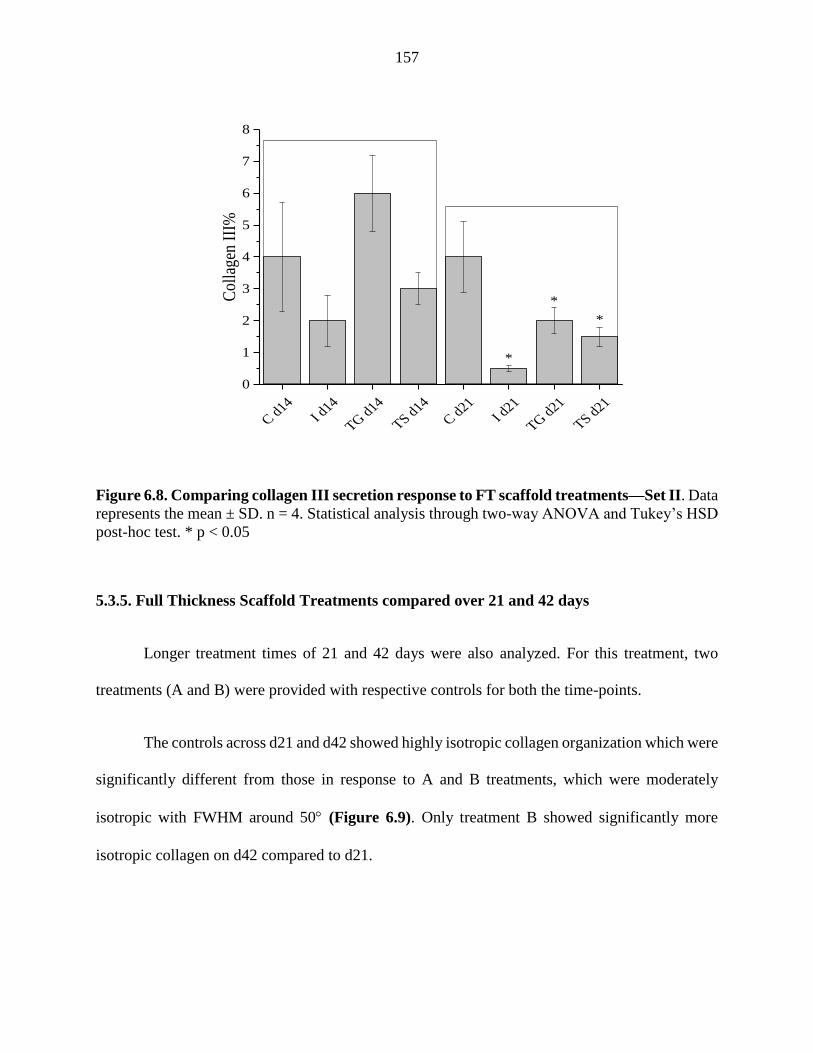
157
Figure 6.8. Comparing collagen III secretion response to FT scaffold treatments—Set II. Data
represents the mean ± SD. n = 4. Statistical analysis through two-way ANOVA and Tukey’s HSD
post-hoc test. * p < 0.05
5.3.5. Full Thickness Scaffold Treatments compared over 21 and 42 days
Longer treatment times of 21 and 42 days were also analyzed. For this treatment, two
treatments (A and B) were provided with respective controls for both the time-points.
The controls across d21 and d42 showed highly isotropic collagen organization which were
significantly different from those in response to A and B treatments, which were moderately
isotropic with FWHM around 50 (Figure 6.9). Only treatment B showed significantly more
isotropic collagen on d42 compared to d21.
C d14
I d14
TG d
14
TS d14
C d21
I d21
TG d
21
TS d21
0
1
2
3
4
5
6
7
8
*
*
*
Col
lage
n II
I%
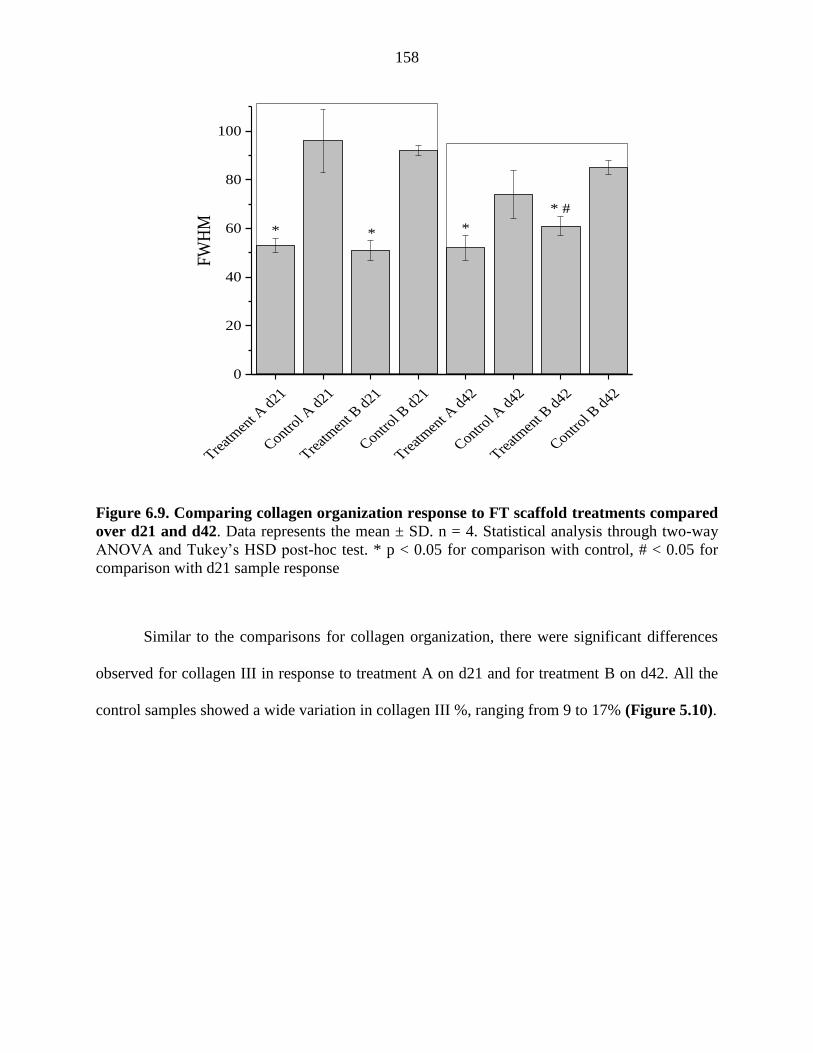
158
Figure 6.9. Comparing collagen organization response to FT scaffold treatments compared
over d21 and d42. Data represents the mean ± SD. n = 4. Statistical analysis through two-way
ANOVA and Tukey’s HSD post-hoc test. * p < 0.05 for comparison with control, # < 0.05 for
comparison with d21 sample response
Similar to the comparisons for collagen organization, there were significant differences
observed for collagen III in response to treatment A on d21 and for treatment B on d42. All the
control samples showed a wide variation in collagen III %, ranging from 9 to 17% (Figure 5.10).
Treat
men
t A d
21
Control A
d21
Treat
men
t B d
21
Control B
d21
Treat
men
t A d
42
Control A
d42
Treat
men
t B d
42
Control B
d42
0
20
40
60
80
100
* #
***
FW
HM
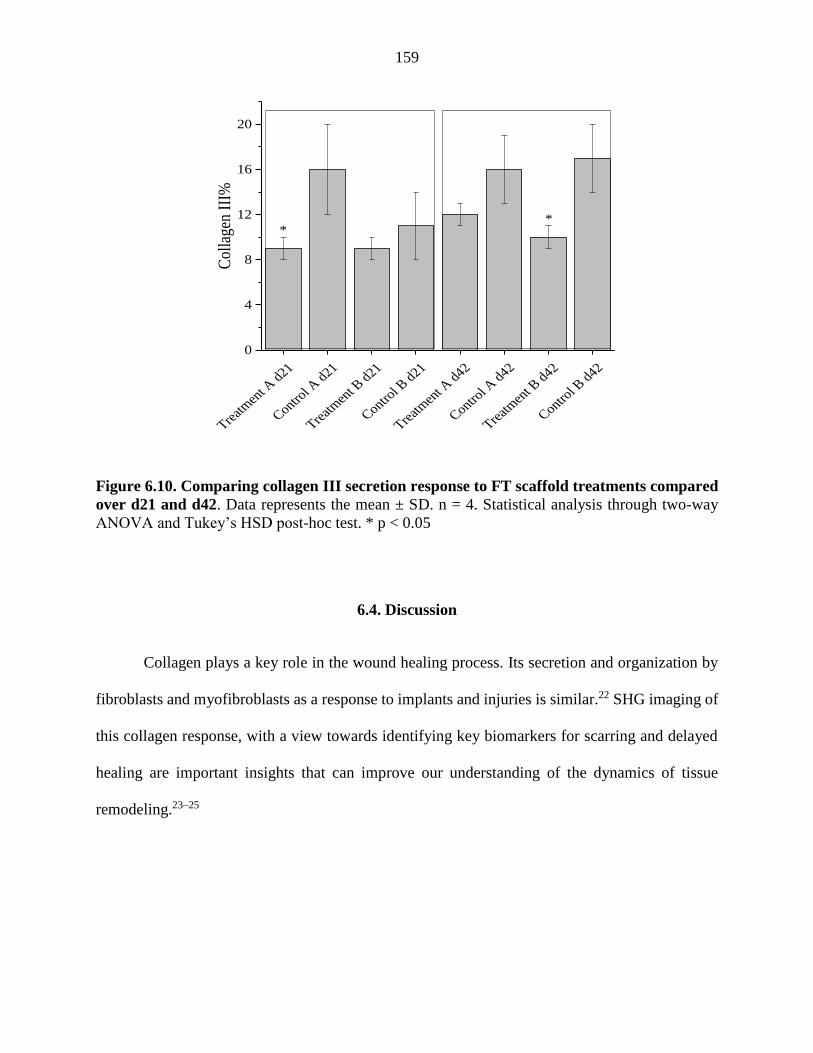
159
Figure 6.10. Comparing collagen III secretion response to FT scaffold treatments compared
over d21 and d42. Data represents the mean ± SD. n = 4. Statistical analysis through two-way
ANOVA and Tukey’s HSD post-hoc test. * p < 0.05
6.4. Discussion
Collagen plays a key role in the wound healing process. Its secretion and organization by
fibroblasts and myofibroblasts as a response to implants and injuries is similar.22 SHG imaging of
this collagen response, with a view towards identifying key biomarkers for scarring and delayed
healing are important insights that can improve our understanding of the dynamics of tissue
remodeling.23–25
Treat
men
t A d
21
Control A
d21
Treat
men
t B d
21
Control B
d21
Treat
men
t A d
42
Control A
d42
Treat
men
t B d
42
Control B
d42
0
4
8
12
16
20
**
Col
lage
n II
I%
160
6.4.1. Fibrin Scaffold Treatment
Collagen organization in response to the thrice applied fibrin scaffold treatment was
analyzed (Figure 6.1). The treatment efficacy can be considered good, as there were no significant
differences in the collagen alignment compared to the control. Both showed isotropic collagen
signal, with high FWHM values. The collagen secretion responses to the treatments indicated that
the fibrin treatment elicited significantly lower collagen III% (Figure 6.2). Fibrin scaffold
treatments have been studied for their ability to promote clotting by aiding the natural platelet
response to stem the blood flow at the wound site.26 Fibrin based scaffolds can controllably deliver
cytokines such as basic fibroblast growth factor to promote wound healing for diabetic mice,27 as
well as for treatment of dermal wounds.28 The efficacy of the 3M fibrin scaffold would
undoubtedly have considered these successful design principles from previous studies for
fabricating their product.
6.4.2. Partial Thickness Scaffold Treatment applied for 4 days
The effectiveness of the scaffolds for PT wounds was evaluated based on their ability to
induce isotropic collagen organization within a short application period of 4 days. All four
treatments showed relatively moderate levels of collagen disorder with similar FWHM values
(Figure 6.3). Within these comparisons, it was only possible to acquire more information about
the Promogran and Biostep wound dressings.
161
The Foam and Collagen named treatments appeared to be 3M test-products. As there were
no control samples defined for these samples, it can only be speculated that the goal of this study
was to compare the efficacy of the Foam and Collagen treatments as compared to commercially
available treatments in Promogran and Biostep.29,30 The collagen III levels are difficult to compare
for without controls, with the Foam showing significantly higher levels amongst the four sample
sets (Figure 6.4).
6.4.3. Full Thickness Scaffold Treatments compared over 14 and 21 days
The effectiveness of the scaffolds for the FT wounds was evaluated for their ability to
induce isotropic collagen organization over 2 and 3 weeks of application. All four treatments (C,
P, TG and TS) showed relatively moderate levels of collagen disorder with comparable FWHM
values when comparing their responses on d14 and d21 (Figure 6.5). The progression of
moderately to highly isotropic collagen order by d21 was noted. This transition is in line with
similar studies examining the timeline of wound healing across dermal wounds, which have shown
that myofibroblast activity and its associated remodeling peaks by week 3, after which the extent
of wound closure varies greatly over weeks to even months for the wound closure to be complete.2
The P treatment showing no changes in collagen organization could be either a case of halted
healing or a scarring response. The scarring response becomes more probable since the collagen
III levels did not significantly change from d14 to d21 (Figure 6.6). Since these levels are lower
than what has been reported for hypertrophic scarring, this would need to be confirmed through
clinical observations.31 In the absence of controls, it was only possible to compare the relative
efficacy of the different scaffold treatments as given.
162
6.4.4. Full Thickness Scaffold Treatments compared over 14 and 21 days—Set II
The effectiveness of the scaffolds for the FT wounds was evaluated based on their ability
to induce isotropic collagen organization over 2 and 3 weeks of application. All four treatments
(C, I, TG and TS) showed moderate to relatively aligned collagen when comparing between their
responses on d14 and d21 (Figure 6.7). Unlike Set I, there was no progression of moderately
isotropic to highly isotropic states of collagen order by d21 for two of the four formulations
analyzed. This lack of collagen isotropic levels by three weeks of application for treatments C and
I, can be presumed a marker for either limited healing or scar formation.18 The treatment TG having
no changes in collagen organization is likely a result of scarring. Unlike treatment P from Set I,
the scarring response cannot be judged by comparing the collagen III % levels across d14 and d21,
as the only treatment that shows no statistical change was treatment C (Figure 6.8). There are
some studies that examine other markers for wound healing, such as presence of myofibroblasts
and the expression of alpha-smooth muscle actin for scarring responses.32 This study stands in
good contrast to the previous scaffold study of the same time period showing salient differences
in wound healing response with what can be speculated as similar formulations of 3M treatment.
6.4.5. Full Thickness Scaffold Treatments compared over 21 and 42 days
Treatments A and B compared with their controls over 3 and 6 weeks of treatment showed
interesting variations in collagen organization. Even with both the controls and samples showing
relatively elevated levels of isotropic collagen, there were statistically significant differences in
the higher disorder of the control samples for both d21 and d42 sets.
163
This was less significant for the d42 sets, where collagen organization is remodeled to that of
unwounded tissues.22 In the case of treatment B there were significant differences from d21 to d42
(Figure 6.9). The wide range of collagen III levels for the two treatments and their controls
indicated that these treatments were not influencing the secretion of different collagen types as
much as some of the above-mentioned treatments (Figure 6.10).
6.5. Conclusions
The analysis of wound healing samples from 3M provided valuable insight into the
tunability of collagen organization and secretion in response to diverse treatments and
formulations. Comparisons to the controls for some treatments were useful for understanding the
extent of healing in the porcine subjects. Some treatments were statistically different compared to
the other formulations within the same set. For most treatments studied over extended time periods,
it was observed that collagen organization progressed to a more isotropic state and the collagen III
% rose to similar levels as that of unwounded tissues. However, in the FT wound set II treated
with scaffolds, the collagen response to treatments showed significantly higher alignment that
could indicate scarring. Increased collagen type III was not commonly observed for most treatment
sets as compared to their shorter time-point counterparts or controls.
Acknowledgements
This work was supported by the external collaboration between CRML and Dr. Kaitlin
Bratlie, which started from December 2016. The research was also supported by National
Science Foundation under Grant No. CBET-1227867 and the Roy J. Carver Charitable Trust
Grant No. 13-4254. Dr. Kaitlin Bratlie is grateful for the Michael and Denise Mack Faculty
Fellowship.

164
6.6 References
1. Sen, C. K. et al. Human skin wounds: A major and snowballing threat to public health and
the economy: PERSPECTIVE ARTICLE. Wound Repair Regen. 17, 763–771 (2009).
2. Enoch, S., Leaper, D. J. & Beldon, P. Basic science of wound healing. Surg. 28, 409–412
(2010).
3. Singer, A. J. & Clark, R. a F. Cutaneous Wound Healing. N. Engl. J. Med. 341, 738–746
(1999).
4. Martin, P. Wound Healing--Aiming for Perfect Skin Regeneration. Science (80-. ). 276, 75–
81 (1997).
5. Morton, L. M. & Phillips, T. J. Wound healing and treating wounds Differential diagnosis
and evaluation of chronic wounds. J. Am. Acad. Dermatol. 74, 589–605 (2016).
6. Linares, H. A., Kischer, C. W., Dobrkovsky, M. & Larson, D. L. The histotypic organization
of collagen of the hypertrophic scar in humans. J. Invest. Dermatol. 59, 323–332 (1972).
7. Zhang, K., Garner, W., Cohen, L., Rodriguez, J. & Phan, S. Increased Types I and III
Collagen and Transforming Growth Factor-β1 mRNA and Protein in Hypertrophic Burn
Scar. J. Invest. Dermatol. 104, 750–754 (1995).
8. Clore, J. N., Cohen, I. K. & Diegelmann, R. F. Quantitation of Collagen Types I and III
during Wound Healing in Rat Skin. Proc. Soc. Exp. Biol. Med. 161, 337–340 (1979).
9. Chen, X., Nadiarynkh, O., Plotnikov, S. & Campagnola, P. J. Second harmonic generation
microscopy for quantitative analysis of collagen fibrillar structure. Nat. Protoc. 7, 654–69
(2012).
10. P. J. Campagnola, Loew, L. M., Campagnola, P. J. & Loew, L. M. Second-harmonic
imaging microscopy for visualizing biomolecular arrays in cells, tissues and organisms. Nat
Biotech 21, 1356–1360 (2003).
11. Su, P. J. et al. The discrimination of type I and type II collagen and the label-free imaging
of engineered cartilage tissue. Biomaterials 31, 9415–9421 (2010).
12. Chen, W. L. et al. Second harmonic generation ?? tensor microscopy for tissue imaging.
Appl. Phys. Lett. 94, 2007–2010 (2009).
13. Bailey, A. J., Sims, T. J., Le Lous, M. & Bazin, S. Collagen polymorphism in experimental
granulation tissue. Biochem. Biophys. Res. Commun. 66, 1160–1165 (1975).
14. Robson, M. C., Steed, D. L. & Franz, M. G. Wound Healing: Biologic Features and
Approaches to Maximize Healing Trajectories. Curr. Probl. Surg. 38, 1–140 (2001).
165
15. Koruth, S. & Narayanaswamy Chetty, Y. V. Hernias- Is it a primary defect or a systemic
disorder? Role of collagen III in all hernias- A case control study. Ann. Med. Surg. 19, 37–
40 (2017).
16. Klinge, U. et al. Synthesis of type I and III collagen, expression of fibronectin and matrix
metalloproteinase 1 and 13 in hernias of patients with inguinal hernia. Int J Surg Invest. 1,
219–227 (1999).
17. Wei, S., Chow, L. T. C., Shum, I. O. L., Qin, L. & Sanderson, J. E. Left and right ventricular
collagen type I/III ratios and remodeling post-myocardial infarction. J. Card. Fail. 5, 117–
126 (1999).
18. Van Zuijlen, P. P. M. et al. Collagen morphology in human skin and scar tissue: No
adaptations in response to mechanical loading at joints. Burns 29, 423–431 (2003).
19. Su, P. J., Chen, W. L., Chen, Y. F. & Dong, C. Y. Determination of collagen nanostructure
from second-order susceptibility tensor analysis. Biophys. J. 100, 2053–2062 (2011).
20. Akilbekova, D. & Bratlie, K. M. Quantitative characterization of collagen in the fibrotic
capsule surrounding implanted polymeric microparticles through second harmonic
generation imaging. PLoS One 10, 1–17 (2015).
21. Gavin, H. The Levenberg-Marquardt method for nonlinear least squares curve-fitting
problems. Dep. Civ. Environ. Eng. Duke Univ. 1–15 (2011).
22. Wynn, T. A. Cellular and molecular mechanisms of fibrosis. J. Pathol. 214, 199–210
(2008).
23. Ajeti, V. et al. Structural changes in mixed Col I/Col V collagen gels probed by SHG
microscopy: implications for probing stromal alterations in human breast cancer. Biomed.
Opt. Express 2, 2307–2316 (2011).
24. Bygd, H. C., Akilbekova, D., Muñoz, A., Forsmark, K. D. & Bratlie, K. M. Poly-l-arginine
based materials as instructive substrates for fibroblast synthesis of collagen. Biomaterials
63, 47–57 (2015).
25. Boddupalli, A. & Bratlie, K. M. Multimodal imaging of harmonophores and application of
high content imaging for early cancer detection. Mater. Discov. (2015).
doi:10.1016/j.md.2015.11.002
26. CLARK, R. A. F. Fibrin and Wound Healing. Ann. N. Y. Acad. Sci. 936, 355–367 (2006).
27. Losi, P. et al. Fibrin-based scaffold incorporating VEGF- and bFGF-loaded nanoparticles
stimulates wound healing in diabetic mice. Acta Biomater. 9, 7814–7821 (2013).
28. Carriel, V. et al. Epithelial and stromal developmental patterns in a novel substitute of the
human skin generated with fibrin-agarose biomaterials. Cells Tissues Organs 196, 1–12
(2012).
166
29. Acelity, S. by. Promogran wound dressings.
30. Nephew, S. and. Biostep: Collagen Matrix Dressings.
31. Cameron, A. M., Adams, D. H., Greenwood, J. E., Anderson, P. J. & Cowin, A. J. A novel
murine model of hypertrophic scarring using subcutaneous infusion of bleomycin. Plast.
Reconstr. Surg. 133, 69–78 (2014).
32. Darby, I. A., Laverdet, B., Bonté, F. & Desmoulière, A. Fibroblasts and myofibroblasts in
wound healing. Clin. Cosmet. Investig. Dermatol. 7, 301–311 (2014).
CHAPTER 7
SECOND HARMONIC GENERATION MICROSCOPY OF COLLAGEN
ORGANIZATION IN TUNABLE, ENVIRONMENTALLY RESPONSIVE ALGINATE
HYDROGELS
We synthesized photocrosslinked, environmentally responsive alginate hydrogels for tissue
engineering applications. Methacrylated alginate (ALGMA) hydrogels were prepared across a
variety and combination of ionic, covalent (chain growth, step growth, and mixed mode)
crosslinking strategies to obtain a range of compressive moduli from 9.3 ± 0.2 kPa for the softest
ionically crosslinked hydrogels to 22.6 ± 0.3 kPa for the dually crosslinked ionic mixed mode gels.
The swelling behavior of the alginate hydrogels was significantly higher at basic pH conditions.
Stiffer gels consistently swell to a lesser degree compared to softer gels for all conditions. These
hydrogels were stable – retaining >80% of their original mass for three weeks – when incubated
in a basic solution of diluted sodium hydroxide, which mimicked accelerated degradation
conditions. Encapsulated NIH/3T3 fibroblasts remained viable and proliferated significantly more
in stiffer hydrogel substrates compared to softer gels. Additionally, the collagen secreted by
encapsulated fibroblasts was quantifiably comparable using second harmonic generation (SHG)
microscopy imaging. Fibroblasts encapsulated in the softer hydrogels secreted significantly less
collagen than the stiffer gels. The collagen in these softer gels was also more aligned than the
stiffer gels. The ability to tune collagen organization using hydrogels has potential applications
ranging from corneal wound healing where organized collagen is desired to epithelial wound
scaffolds where a random organization is preferable.
168
7.1. Introduction
The human body contains natural tissue environments with dynamic and diverse
mechanical properties.1 Dynamic changes occur from regular maintenance of homeostasis, wound
healing, or a response to implants.2 Cells reside within these tissues ensconced in a three-
dimensional scaffold known as the extracellular matrix (ECM), which responds to both
macroscopic as well as microscopic perturbations.3 The ECM comprises of different combinations
of proteins like collagen, glycosaminoglycans, and adhesive glycoproteins which vary from organ
to organ.4 The macroscopic aspects derive from how the ECM provides structural integrity to the
native tissue as well as a separation between different layers of tissue organization.5 On a smaller
scale, there are biochemical cues provided by the proteins that comprise the ECM, such as collagen
and fibronectin, that can instigate diverse cell signaling pathways,6,7 alter cell shape,8 as well as
changes in cytoskeletal organization,1,9 and stress fiber formation,10 These aspects of the cell-
matrix interactions are influential for several critical processes including angiogenesis,11
organogenesis,12 wound healing,13 as well as response to diseases14 and tumor metastasis.15
The goal of tissue engineering is to recapitulate the natural, dynamic in vivo environment
in order to minimize unwanted host responses as well as replicate lost tissue.16 Tissue engineering
covers not just the obvious motive of improving current healthcare solutions, but also to decrease
costs associated with global healthcare, which is expected to rise to 8% of the US GDP by 2040.17
An ideal material for tissue engineering scaffolds would be biocompatible, mechanically tunable,
and have degradation rates that match tissue regeneration rates.18,19 Natural polymers, with their
similarity to the ECM are easy to obtain, modify, and apply to diverse tissue engineering
applications.20
169
Alginate is an anionic, polysaccharide which derives from seaweed or bacteria and has
been effectively used as a supporting scaffold or tunable delivery system for tissue repair.21 It can
be easily crosslinked using divalent cations, as well interact with a wide variety of proteoglycans
and polyelectrolytes. The carboxylic acid moiety on alginate renders it pH-responsive and it can
be used to deliver diverse payloads.22 Unlike conventional cationic crosslinking of hydrogels, we
explored covalent crosslinking facilitated by methacrylation of the alginate backbone so that
alginate could be chemically crosslinked through photoinitiated mechanisms.23 Covalently
crosslinked hydrogels are more stable in vivo, unlike ionically crosslinked alginate which degrades
rapidly due to preferential replacement of divalent cations by monovalent ones.24 UV-
crosslinkable methacrylated alginate (ALGMA) hydrogel formulations show structural stability,
tunability of crosslinking mechanisms as well as significant cytocompatibility for use as cell-
encapsulation platforms to study secretion of ECM proteins in vitro 25,26 ECM proteins like
collagen play a critical role in the structural integrity and cell-material interactions across a range
of biological processes such as the host response.27,28 Both fibroblasts and myofibroblasts secrete
collagen types I and III, as a critical part of their mechanotransduction processes.29 It has been
observed that there is a great need to understand the mechanisms through which stromal cells sense
diverse materials and the kinetics of ECM protein secretion particularly as to how dysregulation
in collagen deposition has been linked to rejected implants as shown by over the top fibrotic
response.27,30 These studies inspired preparation of tunable alginate hydrogel environments that
can be used for studying collagen organization under very soft, responsive conditions.31
170
Diverse crosslinking strategies can be employed to fabricate a range of materials properties
of ALGMA hydrogels. Chain growth polymerization can be initiated using photoinitiators yja
Irgacure 2959 in a degassed solution of the hydrogel to form dense chains of methacrylated
alginate networks.32,33 Step growth polymerization occurs through thiol-ene photoclick chemistry
wherein the free radical from cleavage of the photoinitiator abstracts a proton from the thiol
crosslinker to create a thiyl radical. Subsequent propagation of the step growth mechanism takes
place through the reaction of the thiyl radical and the vinyl group.34 . A combination of step and
chain growth termed mixed mode has been previously studied to prepare hybrid covalent
crosslinks in the ALGMA solutions.31,35,36 To further increase the range of mechanical properties,
ionic crosslinking of the covalently crosslinked hydrogels has been done using naturally derived
polymers like alginate37, carrageenan38 and hyaluronan.39 Collagen secretion levels from
encapsulated fibroblasts has been largely evaluated using fluorescent tagging or SDS-PAGE.40,41
Second harmonic generation (SHG) microscopy allows for sensitive, high-content-imaging of not
just secreted collagen, but also collagen organization.42,43 In this study, we use SHG microscopy
and subsequent data analysis to examine how hydrogel stiffness can tune collagen organization
from tuned to stochastic when encapsulating NIH/3T3 fibroblasts. The ability to influence collagen
organization is a relatively unexplored are with previous research focused on visualizing the
collagen alignment in neocartilage secreted by primary mesenchymal stem cells showing no direct
cause-effect relationships.44 We sought to decouple the effects of crosslinking density and
compressive moduli, as well as crosslinking mechanism on how scaffolds influence remodeling
by encapsulated fibroblasts. For specific applications such as skin grafts, cartilage repair, and
corneal wound healing, being able to tune collagen organization to avoid compliance mismatch
171
from the local microenvironment will further improve scaffolds by better recapitulating the native
environment.
6.2. Experimental
7.2.1. Materials
Medium viscosity alginic acid (CAS 9005-38-3) was obtained from MP Biomedicals
Fisher Scientific (Hampton, NH) and methacrylic anhydride (CAS 760-93-00) was supplied by
Sigma Aldrich (St. Louis, MO). 2-hydroxy-4′-(2-hydroxyethoxy)-2-methylpropiophenone
(Irgacure 2959) was obtained from Sigma-Aldrich (St. Louis) and dithiothreitol (DTT) was
obtained from VWR Chemicals (Batavia, IL). Other materials were purchased through Sigma
Aldrich (St. Louis) and were used as received, unless otherwise stated. Fresh deionized water
(Milli-Q, Thermo Scientific Nanopure, Waltham, MA) was used throughout this study.
7.2.2. Methacrylated Alginate (ALGMA) Synthesis
Methacrylated alginate solutions were prepared based on a previously described protocol.31
A 1% (w/v) solution of medium viscosity alginic acid in DI water was prepared by mixing 2 g
alginic acid powder in 200 mL of DI water. Methacrylic anhydride (16 mL) was slowly added to
the solution. The pH of the solution was maintained between 8 and 9 using aliquots of 5 M NaOH
at 4 ℃. After 24 h, the methacrylated alginate solution was dialyzed against water using a
molecular weight cutoff membrane of 13,000 Da for two days with dialysate being refreshed twice
daily. The final dialyzed product was lyophilized (4.5 L, Labconco, Kansas City, MO). NMR was
used to confirm methacrylation of the alginic acid. Solutions of alginate and ALGMA were
prepared using standard protocols.45 The % methacrylation was calculated by the relative
integration of the protons from the methacrylate group (𝐼𝐶𝐻2 at δ = 6.0 and 5.6 ppm) and the
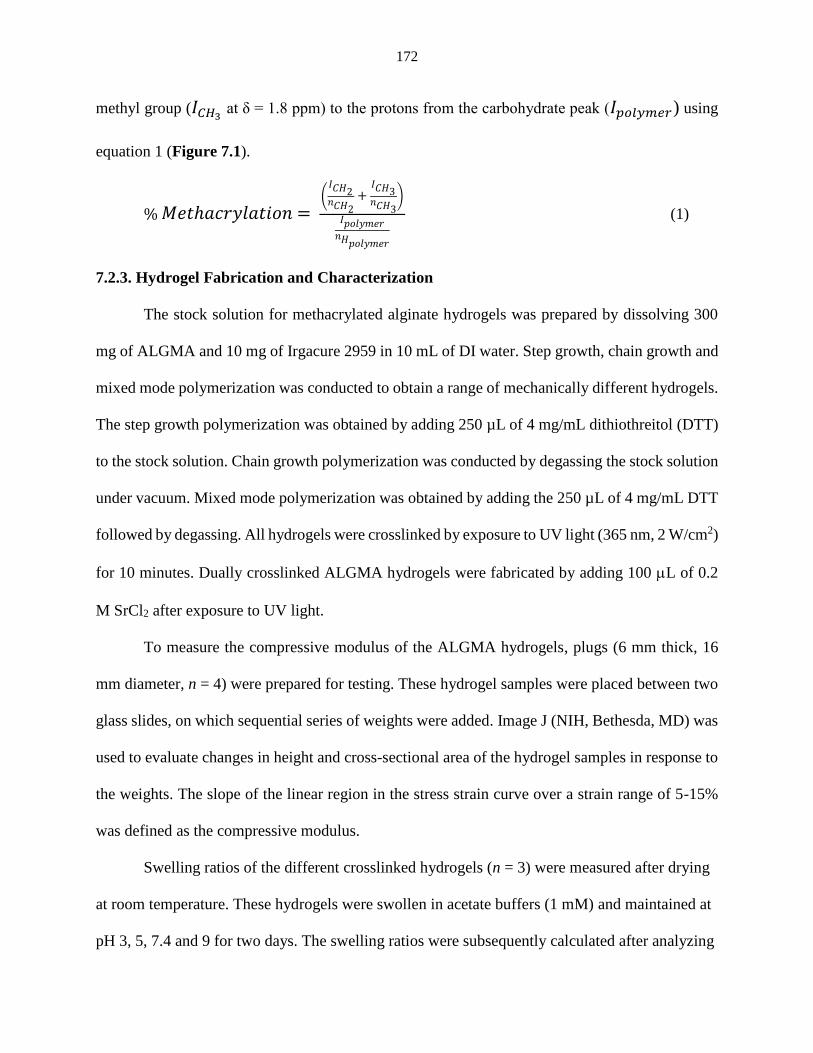
172
methyl group (𝐼𝐶𝐻3 at δ = 1.8 ppm) to the protons from the carbohydrate peak (𝐼𝑝𝑜𝑙𝑦𝑚𝑒𝑟) using
equation 1 (Figure 7.1).
% 𝑀𝑒𝑡ℎ𝑎𝑐𝑟𝑦𝑙𝑎𝑡𝑖𝑜𝑛 = (
𝐼𝐶𝐻2𝑛𝐶𝐻2
+ 𝐼𝐶𝐻3𝑛𝐶𝐻3
)
𝐼𝑝𝑜𝑙𝑦𝑚𝑒𝑟𝑛𝐻𝑝𝑜𝑙𝑦𝑚𝑒𝑟
(1)
7.2.3. Hydrogel Fabrication and Characterization
The stock solution for methacrylated alginate hydrogels was prepared by dissolving 300
mg of ALGMA and 10 mg of Irgacure 2959 in 10 mL of DI water. Step growth, chain growth and
mixed mode polymerization was conducted to obtain a range of mechanically different hydrogels.
The step growth polymerization was obtained by adding 250 µL of 4 mg/mL dithiothreitol (DTT)
to the stock solution. Chain growth polymerization was conducted by degassing the stock solution
under vacuum. Mixed mode polymerization was obtained by adding the 250 µL of 4 mg/mL DTT
followed by degassing. All hydrogels were crosslinked by exposure to UV light (365 nm, 2 W/cm2)
for 10 minutes. Dually crosslinked ALGMA hydrogels were fabricated by adding 100 L of 0.2
M SrCl2 after exposure to UV light.
To measure the compressive modulus of the ALGMA hydrogels, plugs (6 mm thick, 16
mm diameter, n = 4) were prepared for testing. These hydrogel samples were placed between two
glass slides, on which sequential series of weights were added. Image J (NIH, Bethesda, MD) was
used to evaluate changes in height and cross-sectional area of the hydrogel samples in response to
the weights. The slope of the linear region in the stress strain curve over a strain range of 5-15%
was defined as the compressive modulus.
Swelling ratios of the different crosslinked hydrogels (n = 3) were measured after drying
at room temperature. These hydrogels were swollen in acetate buffers (1 mM) and maintained at
pH 3, 5, 7.4 and 9 for two days. The swelling ratios were subsequently calculated after analyzing
173
the recorded dry and wet weights using equation 2 where Md is the dry mass and Mw is the wet
mass.
Swelling ratio =M𝑤−𝑀𝑑
𝑀𝑑 (2)
7.2.4. In Vitro Degradation
To test the degradation of the hydrogels, the gels were placed in accelerated degradation
conditions (0.1 mM NaOH). After equilibrating these gels for one day in solution, masses were
recorded for each consecutive day. The % mass remining was compared with the initial mass and
recorded for each time-point.
7.2.5. Cell Culture and Proliferation Assay
NIH/3T3 fibroblasts (ATCC, Manassas, VA) were passaged at 37°C with 5% CO2 in
Dulbecco’s modified Eagle’s medium (Cellgro, Thermo Scientific) supplemented with 10%
bovine calf serum, penicillin (100 U/L) and streptomycin (100 μg/mL), referred to as complete
medium (CM). Cell suspension aliquots of 200 μL (1 107 cells/mL) were mixed 300 μL of the
different hydrogel solutions and were pipetted into 48 well plates. For each plate, live and dead
controls were made by plating cells directly on tissue culture plastic. The plates were incubated
for 48 h. The medium in the dead control wells was aspirated and replaced with 300 μL of 70%
ethanol for 10 minutes. Subsequently, the supernatant in all wells was aspirated. To each well 150
μL of working solution (2μM calcein AM (AnaSpec, Fremont, CA) and 7.5 μM of 7-
aminoacinomycin D (Tonbo Biosciences, San Diego, CA) in phosphate buffered saline (PBS))
was added and the plates were incubated for 30 – 40 min at 37°C in 5% CO2. Fluorescent images
were taken using EVOS Floid Cell Image Station (Thermo Scientific) with the red
(excitation/emission 586/646 nm) and green channels (482/532 nm) set to visualize the dead and
live cells respectively. Live and dead cells were quantified at an excitation/emission of 485/528
174
nm and 645/490 nm, respectively, using a plate reader (BioTek Synergy HT Multidetection
Microplate Reader, Biotek, Winooski, VT). The percentage of live cells was determined using the
following equation:
% 𝒍𝒊𝒗𝒆 𝒄𝒆𝒍𝒍𝒔 = 𝑭(𝟓𝟐𝟖)𝒔𝒂𝒎𝒑𝒍𝒆− 𝑭(𝟓𝟐𝟖)𝑫𝒆𝒂𝒅 𝑪𝒐𝒏𝒕𝒓𝒐𝒍
𝑭(𝟓𝟐𝟖)𝑳𝒊𝒗𝒆 𝑪𝒐𝒏𝒕𝒓𝒐𝒍− 𝑭(𝟓𝟐𝟖)𝑫𝒆𝒂𝒅 𝑪𝒐𝒏𝒕𝒓𝒐𝒍 × 𝟏𝟎𝟎% (3)
where 𝑭(𝟓𝟐𝟖)𝒔𝒂𝒎𝒑𝒍𝒆 is the fluorescent signal at 528 nm from the cell laden samples,
𝑭(𝟓𝟐𝟖)𝑫𝒆𝒂𝒅 𝑪𝒐𝒏𝒕𝒓𝒐𝒍 is the fluorescent signal at 528 nm from the lysed control samples, and
𝑭(𝟓𝟐𝟖)𝑳𝒊𝒗𝒆 𝑪𝒐𝒏𝒕𝒓𝒐𝒍 is the fluorescent signal at 528 nm from the control samples.
7.2.6. Second Harmonic Generation Microscopy of the gels
Equal volumes of suspended NIH/3T3 fibroblasts (1 107 cells/mL) were mixed with
hydrogel solutions. The cell-gel suspension (100 μL) was pipetted between two coverslips, which
were exposed to UV light (365 nm, 2 W/cm2) for 10 min. These gelled samples were then placed
in Petri dishes containing CM. Medium was replaced every three days. Negative controls were
prepared by crosslinking the gels without cells. All samples were preserved in 10% formalin before
imaging.
A mode-locked Ti: Sapphire laser (100 fs pulse width, 1 kHz repetition rate obtained from
Libra, Coherent, Santa Clara, California) that operates with an 800 nm fundamental, was used to
image all samples. A half-wave plate and Glan-Thompson polarizer (Thorlabs, Newton, New
Jersey) was used to control the power at the sample stage. The second harmonic signal from the
interaction with the samples was collected in transmission mode.
To image these samples, an inverted microscope (Amscope, Irvine, California) and a Nikon
Plan Fluorite objective (20 , 0.50 NA, 2.1 mm WD, Nikon, Melville, New York) was used to
focus the beam. The SHG transmission was collected using a Nikon water immersion objective
(40 , 0.8 NA, 3.5 mm WD, Nikon, Melville, New York). This signal was reflected by a dichroic
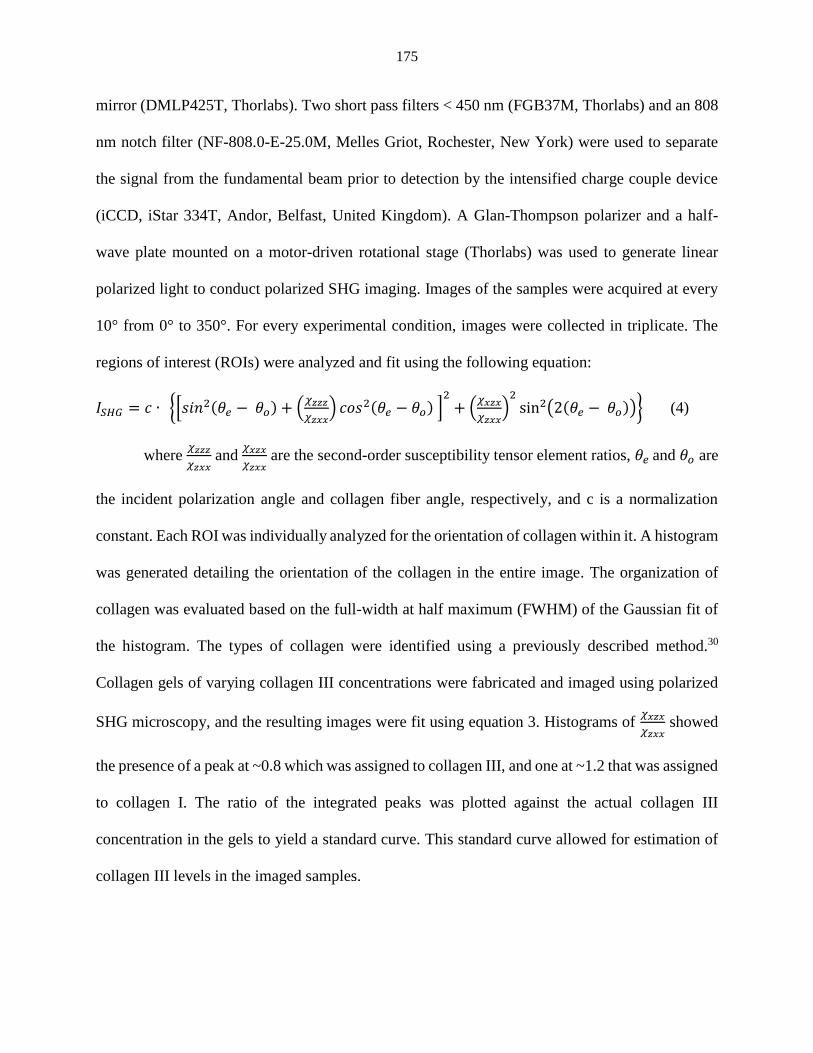
175
mirror (DMLP425T, Thorlabs). Two short pass filters < 450 nm (FGB37M, Thorlabs) and an 808
nm notch filter (NF-808.0-E-25.0M, Melles Griot, Rochester, New York) were used to separate
the signal from the fundamental beam prior to detection by the intensified charge couple device
(iCCD, iStar 334T, Andor, Belfast, United Kingdom). A Glan-Thompson polarizer and a half-
wave plate mounted on a motor-driven rotational stage (Thorlabs) was used to generate linear
polarized light to conduct polarized SHG imaging. Images of the samples were acquired at every
10° from 0° to 350°. For every experimental condition, images were collected in triplicate. The
regions of interest (ROIs) were analyzed and fit using the following equation:
𝐼𝑆𝐻𝐺 = 𝑐 ∙ {[𝑠𝑖𝑛2(𝜃𝑒 − 𝜃𝑜) + (𝜒𝑧𝑧𝑧
𝜒𝑧𝑥𝑥) 𝑐𝑜𝑠2(𝜃𝑒 − 𝜃𝑜) ]
2
+ (𝜒𝑥𝑧𝑥
𝜒𝑧𝑥𝑥)
2
sin2(2(𝜃𝑒 − 𝜃𝑜))} (4)
where 𝜒𝑧𝑧𝑧
𝜒𝑧𝑥𝑥 and
𝜒𝑥𝑧𝑥
𝜒𝑧𝑥𝑥 are the second-order susceptibility tensor element ratios, 𝜃𝑒 and 𝜃𝑜 are
the incident polarization angle and collagen fiber angle, respectively, and c is a normalization
constant. Each ROI was individually analyzed for the orientation of collagen within it. A histogram
was generated detailing the orientation of the collagen in the entire image. The organization of
collagen was evaluated based on the full-width at half maximum (FWHM) of the Gaussian fit of
the histogram. The types of collagen were identified using a previously described method.30
Collagen gels of varying collagen III concentrations were fabricated and imaged using polarized
SHG microscopy, and the resulting images were fit using equation 3. Histograms of 𝜒𝑥𝑧𝑥
𝜒𝑧𝑥𝑥 showed
the presence of a peak at ~0.8 which was assigned to collagen III, and one at ~1.2 that was assigned
to collagen I. The ratio of the integrated peaks was plotted against the actual collagen III
concentration in the gels to yield a standard curve. This standard curve allowed for estimation of
collagen III levels in the imaged samples.
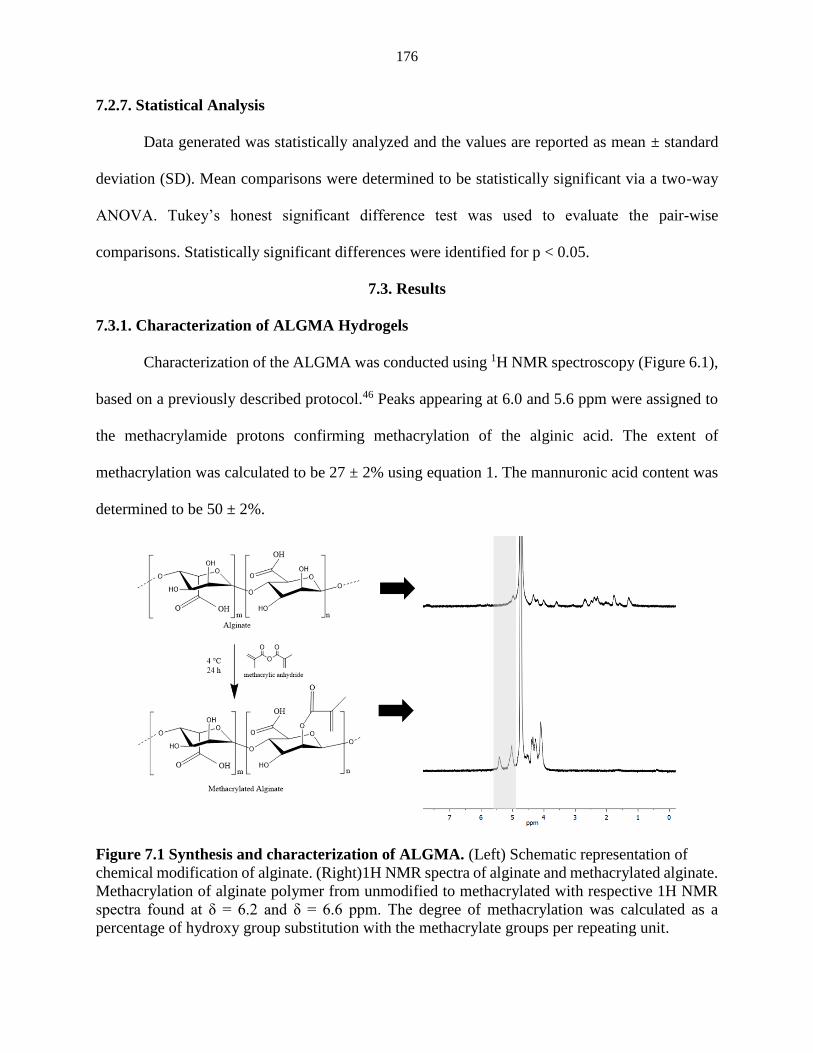
176
7.2.7. Statistical Analysis
Data generated was statistically analyzed and the values are reported as mean ± standard
deviation (SD). Mean comparisons were determined to be statistically significant via a two-way
ANOVA. Tukey’s honest significant difference test was used to evaluate the pair-wise
comparisons. Statistically significant differences were identified for p < 0.05.
7.3. Results
7.3.1. Characterization of ALGMA Hydrogels
Characterization of the ALGMA was conducted using 1H NMR spectroscopy (Figure 6.1),
based on a previously described protocol.46 Peaks appearing at 6.0 and 5.6 ppm were assigned to
the methacrylamide protons confirming methacrylation of the alginic acid. The extent of
methacrylation was calculated to be 27 ± 2% using equation 1. The mannuronic acid content was
determined to be 50 ± 2%.
Figure 7.1 Synthesis and characterization of ALGMA. (Left) Schematic representation of
chemical modification of alginate. (Right)1H NMR spectra of alginate and methacrylated alginate.
Methacrylation of alginate polymer from unmodified to methacrylated with respective 1H NMR
spectra found at δ = 6.2 and δ = 6.6 ppm. The degree of methacrylation was calculated as a
percentage of hydroxy group substitution with the methacrylate groups per repeating unit.
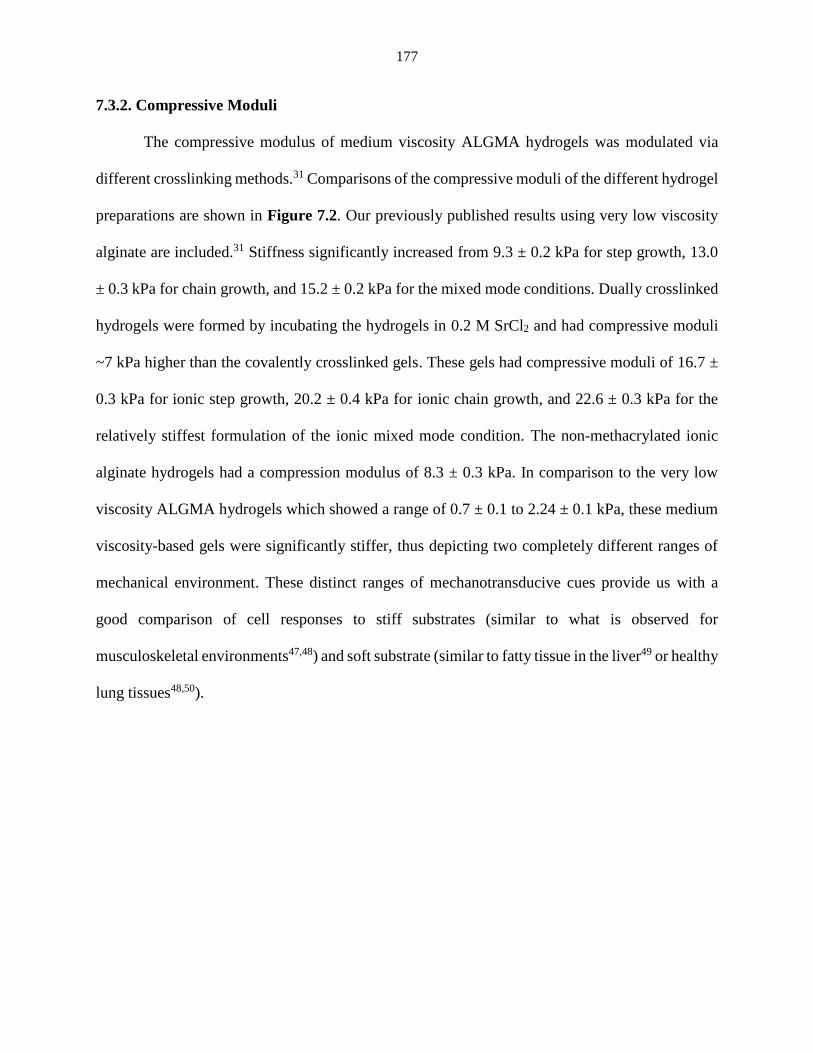
177
7.3.2. Compressive Moduli
The compressive modulus of medium viscosity ALGMA hydrogels was modulated via
different crosslinking methods.31 Comparisons of the compressive moduli of the different hydrogel
preparations are shown in Figure 7.2. Our previously published results using very low viscosity
alginate are included.31 Stiffness significantly increased from 9.3 ± 0.2 kPa for step growth, 13.0
± 0.3 kPa for chain growth, and 15.2 ± 0.2 kPa for the mixed mode conditions. Dually crosslinked
hydrogels were formed by incubating the hydrogels in 0.2 M SrCl2 and had compressive moduli
~7 kPa higher than the covalently crosslinked gels. These gels had compressive moduli of 16.7 ±
0.3 kPa for ionic step growth, 20.2 ± 0.4 kPa for ionic chain growth, and 22.6 ± 0.3 kPa for the
relatively stiffest formulation of the ionic mixed mode condition. The non-methacrylated ionic
alginate hydrogels had a compression modulus of 8.3 ± 0.3 kPa. In comparison to the very low
viscosity ALGMA hydrogels which showed a range of 0.7 ± 0.1 to 2.24 ± 0.1 kPa, these medium
viscosity-based gels were significantly stiffer, thus depicting two completely different ranges of
mechanical environment. These distinct ranges of mechanotransducive cues provide us with a
good comparison of cell responses to stiff substrates (similar to what is observed for
musculoskeletal environments47,48) and soft substrate (similar to fatty tissue in the liver49 or healthy
lung tissues48,50).
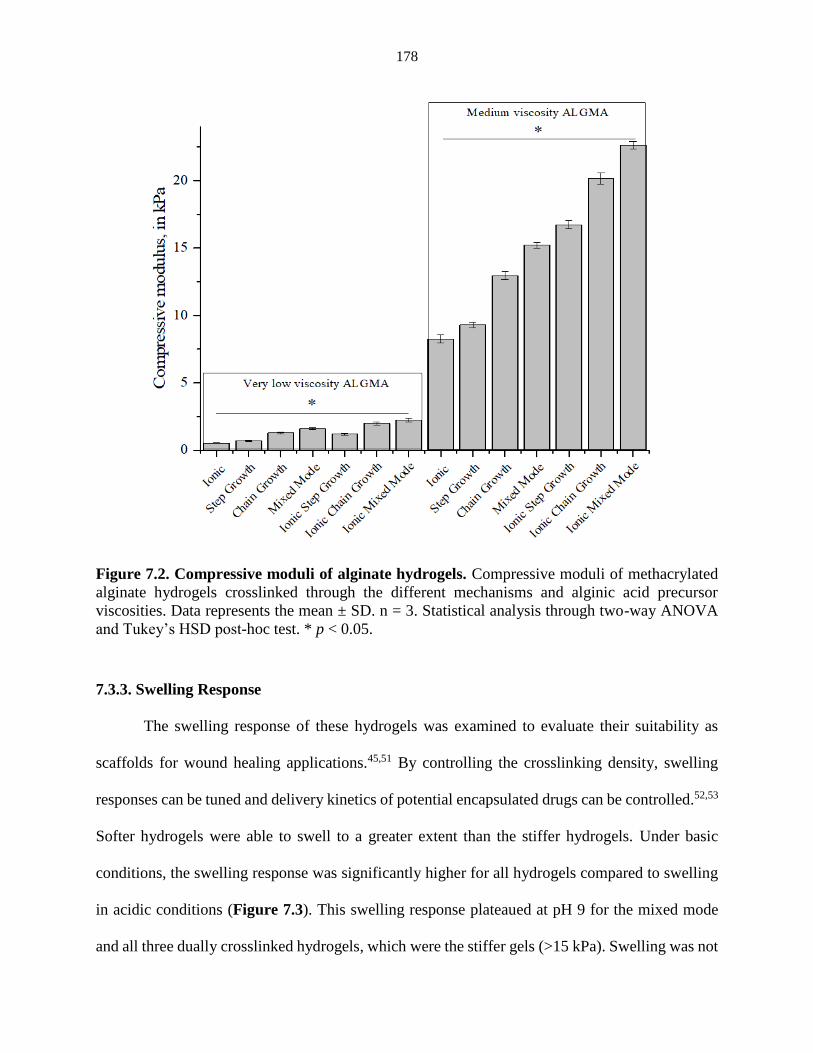
178
Figure 7.2. Compressive moduli of alginate hydrogels. Compressive moduli of methacrylated
alginate hydrogels crosslinked through the different mechanisms and alginic acid precursor
viscosities. Data represents the mean ± SD. n = 3. Statistical analysis through two-way ANOVA
and Tukey’s HSD post-hoc test. * p < 0.05.
7.3.3. Swelling Response
The swelling response of these hydrogels was examined to evaluate their suitability as
scaffolds for wound healing applications.45,51 By controlling the crosslinking density, swelling
responses can be tuned and delivery kinetics of potential encapsulated drugs can be controlled.52,53
Softer hydrogels were able to swell to a greater extent than the stiffer hydrogels. Under basic
conditions, the swelling response was significantly higher for all hydrogels compared to swelling
in acidic conditions (Figure 7.3). This swelling response plateaued at pH 9 for the mixed mode
and all three dually crosslinked hydrogels, which were the stiffer gels (>15 kPa). Swelling was not
179
statistically significant for the dually crosslinked hydrogels at pH 3 and at pH 5. One interesting
finding was that at pH 7.4 and 9, the swelling response increased from the mixed mode gels to the
ionic step growth gels and then decreased again. This may result from the Sr2+ interaction with the
free carboxylic acid groups, mitigating the otherwise downward trend.
Figure 7.3. Swelling response of the medium viscosity alginate hydrogels in a range of pH
buffers. Hydrogels crosslinked through different mechanisms were swelled in pH 3, 5, 7.4, and 9
sodium acetate buffers. Data represents the mean ± SD. n = 3. Statistical analysis through two-way
ANOVA and Tukey’s HSD post-hoc test. * p < 0.05.
7.3.4. Degradation Kinetics
Hydrogels should have degradation kinetics that are similar to the tissue regeneration
rate.54,55 All of the hydrogels in this study were incubated in 0.1 mM NaOH to mimic accelerated
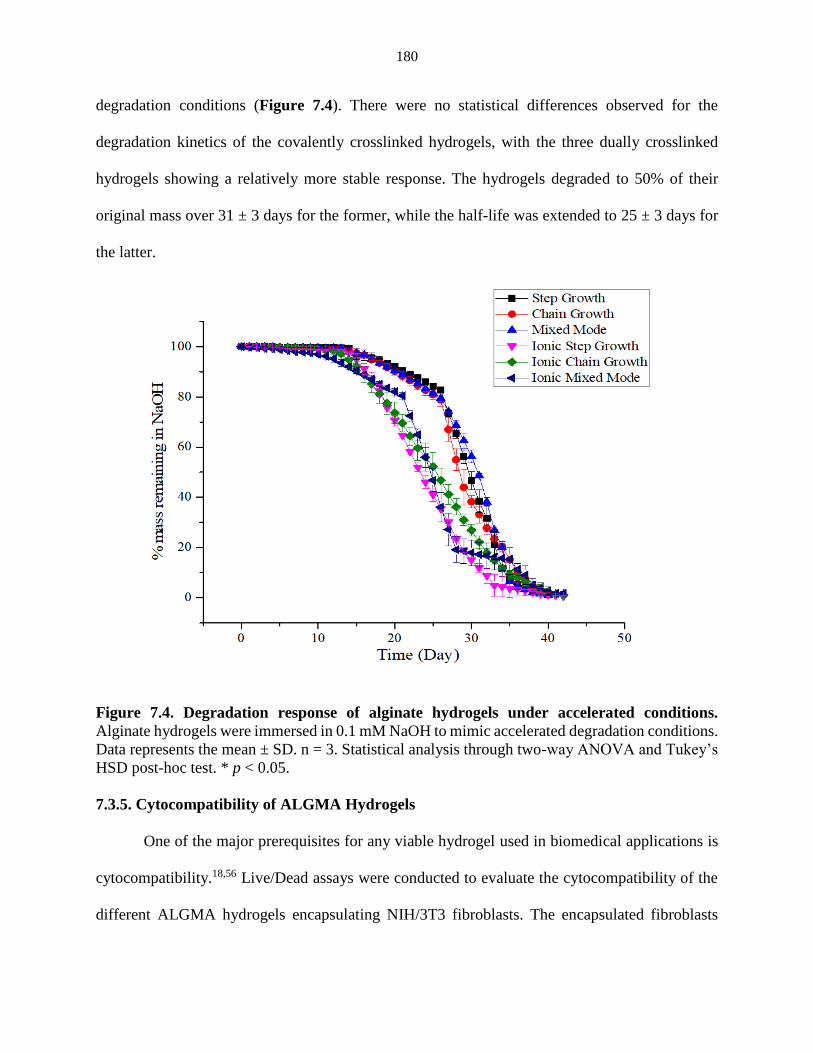
180
degradation conditions (Figure 7.4). There were no statistical differences observed for the
degradation kinetics of the covalently crosslinked hydrogels, with the three dually crosslinked
hydrogels showing a relatively more stable response. The hydrogels degraded to 50% of their
original mass over 31 ± 3 days for the former, while the half-life was extended to 25 ± 3 days for
the latter.
Figure 7.4. Degradation response of alginate hydrogels under accelerated conditions.
Alginate hydrogels were immersed in 0.1 mM NaOH to mimic accelerated degradation conditions.
Data represents the mean ± SD. n = 3. Statistical analysis through two-way ANOVA and Tukey’s
HSD post-hoc test. * p < 0.05.
7.3.5. Cytocompatibility of ALGMA Hydrogels
One of the major prerequisites for any viable hydrogel used in biomedical applications is
cytocompatibility.18,56 Live/Dead assays were conducted to evaluate the cytocompatibility of the
different ALGMA hydrogels encapsulating NIH/3T3 fibroblasts. The encapsulated fibroblasts
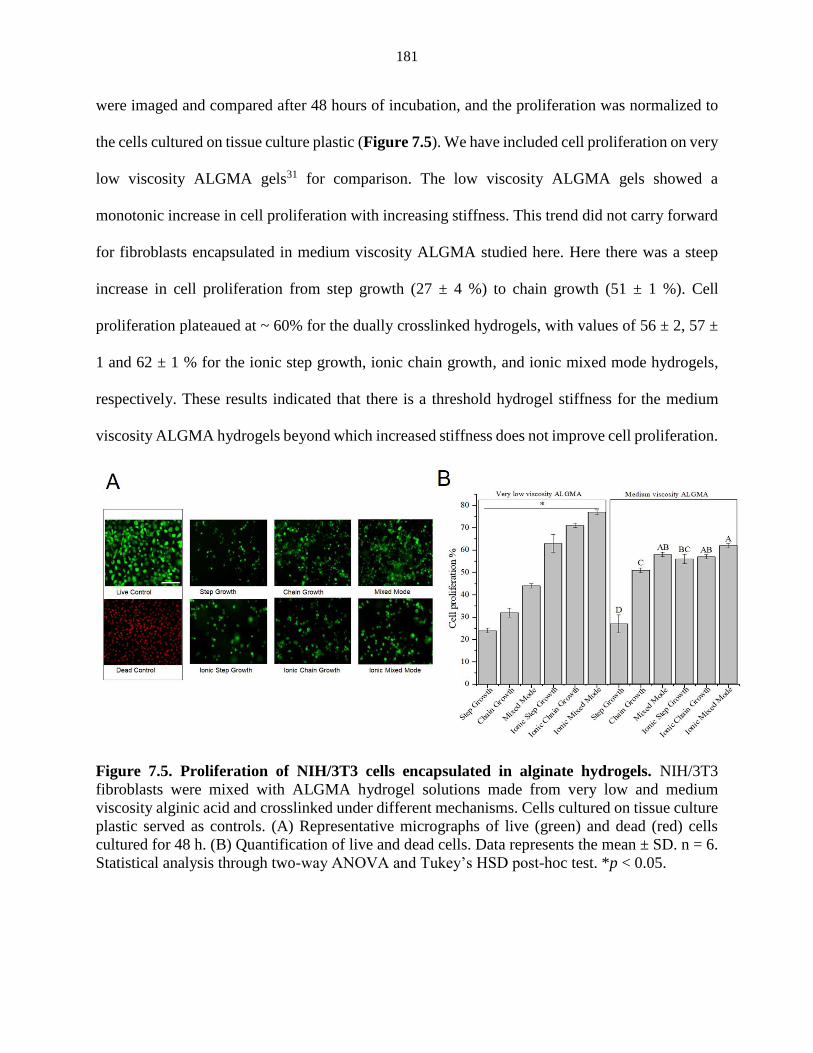
181
were imaged and compared after 48 hours of incubation, and the proliferation was normalized to
the cells cultured on tissue culture plastic (Figure 7.5). We have included cell proliferation on very
low viscosity ALGMA gels31 for comparison. The low viscosity ALGMA gels showed a
monotonic increase in cell proliferation with increasing stiffness. This trend did not carry forward
for fibroblasts encapsulated in medium viscosity ALGMA studied here. Here there was a steep
increase in cell proliferation from step growth (27 ± 4 %) to chain growth (51 ± 1 %). Cell
proliferation plateaued at ~ 60% for the dually crosslinked hydrogels, with values of 56 ± 2, 57 ±
1 and 62 ± 1 % for the ionic step growth, ionic chain growth, and ionic mixed mode hydrogels,
respectively. These results indicated that there is a threshold hydrogel stiffness for the medium
viscosity ALGMA hydrogels beyond which increased stiffness does not improve cell proliferation.
Figure 7.5. Proliferation of NIH/3T3 cells encapsulated in alginate hydrogels. NIH/3T3
fibroblasts were mixed with ALGMA hydrogel solutions made from very low and medium
viscosity alginic acid and crosslinked under different mechanisms. Cells cultured on tissue culture
plastic served as controls. (A) Representative micrographs of live (green) and dead (red) cells
cultured for 48 h. (B) Quantification of live and dead cells. Data represents the mean ± SD. n = 6.
Statistical analysis through two-way ANOVA and Tukey’s HSD post-hoc test. *p < 0.05.
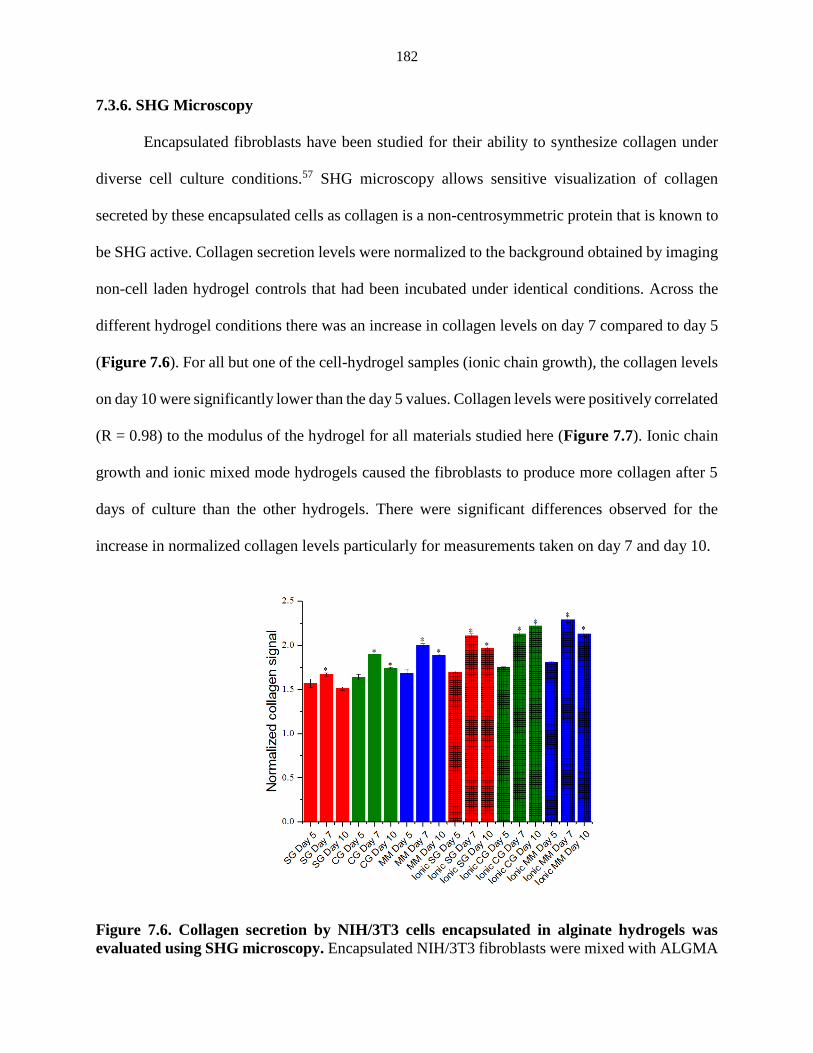
182
7.3.6. SHG Microscopy
Encapsulated fibroblasts have been studied for their ability to synthesize collagen under
diverse cell culture conditions.57 SHG microscopy allows sensitive visualization of collagen
secreted by these encapsulated cells as collagen is a non-centrosymmetric protein that is known to
be SHG active. Collagen secretion levels were normalized to the background obtained by imaging
non-cell laden hydrogel controls that had been incubated under identical conditions. Across the
different hydrogel conditions there was an increase in collagen levels on day 7 compared to day 5
(Figure 7.6). For all but one of the cell-hydrogel samples (ionic chain growth), the collagen levels
on day 10 were significantly lower than the day 5 values. Collagen levels were positively correlated
(R = 0.98) to the modulus of the hydrogel for all materials studied here (Figure 7.7). Ionic chain
growth and ionic mixed mode hydrogels caused the fibroblasts to produce more collagen after 5
days of culture than the other hydrogels. There were significant differences observed for the
increase in normalized collagen levels particularly for measurements taken on day 7 and day 10.
Figure 7.6. Collagen secretion by NIH/3T3 cells encapsulated in alginate hydrogels was
evaluated using SHG microscopy. Encapsulated NIH/3T3 fibroblasts were mixed with ALGMA
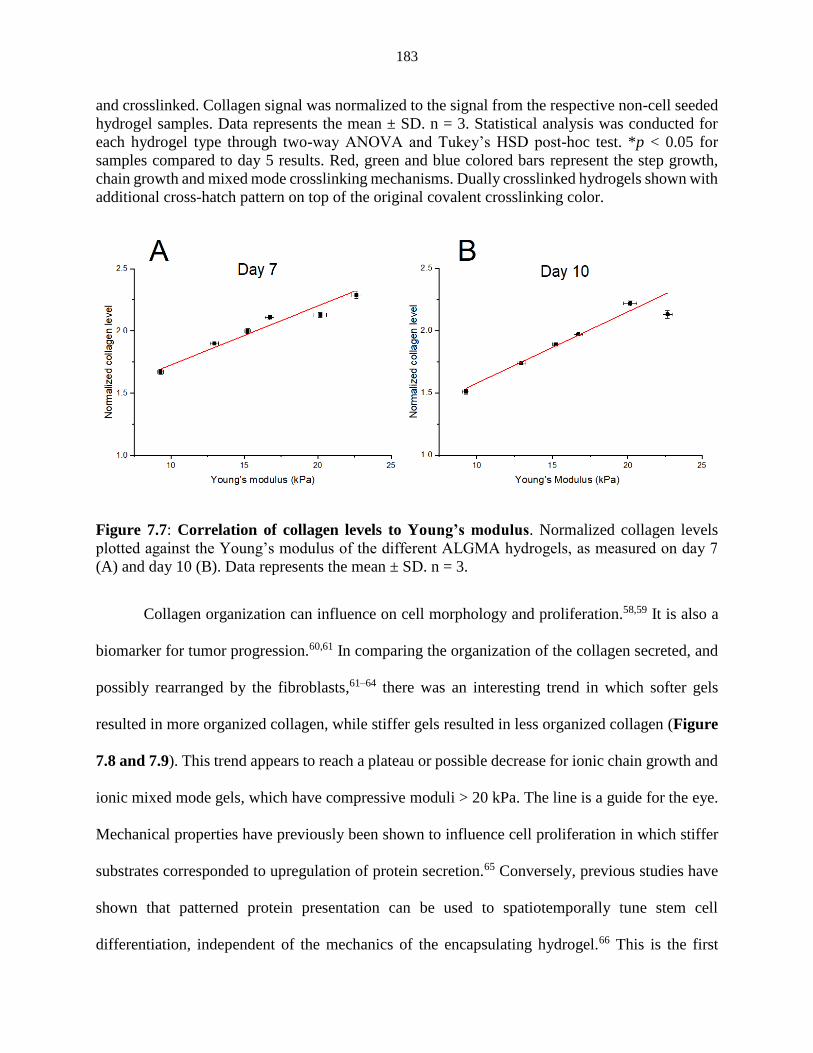
183
and crosslinked. Collagen signal was normalized to the signal from the respective non-cell seeded
hydrogel samples. Data represents the mean ± SD. n = 3. Statistical analysis was conducted for
each hydrogel type through two-way ANOVA and Tukey’s HSD post-hoc test. *p < 0.05 for
samples compared to day 5 results. Red, green and blue colored bars represent the step growth,
chain growth and mixed mode crosslinking mechanisms. Dually crosslinked hydrogels shown with
additional cross-hatch pattern on top of the original covalent crosslinking color.
Figure 7.7: Correlation of collagen levels to Young’s modulus. Normalized collagen levels
plotted against the Young’s modulus of the different ALGMA hydrogels, as measured on day 7
(A) and day 10 (B). Data represents the mean ± SD. n = 3.
Collagen organization can influence on cell morphology and proliferation.58,59 It is also a
biomarker for tumor progression.60,61 In comparing the organization of the collagen secreted, and
possibly rearranged by the fibroblasts,61–64 there was an interesting trend in which softer gels
resulted in more organized collagen, while stiffer gels resulted in less organized collagen (Figure
7.8 and 7.9). This trend appears to reach a plateau or possible decrease for ionic chain growth and
ionic mixed mode gels, which have compressive moduli > 20 kPa. The line is a guide for the eye.
Mechanical properties have previously been shown to influence cell proliferation in which stiffer
substrates corresponded to upregulation of protein secretion.65 Conversely, previous studies have
shown that patterned protein presentation can be used to spatiotemporally tune stem cell
differentiation, independent of the mechanics of the encapsulating hydrogel.66 This is the first
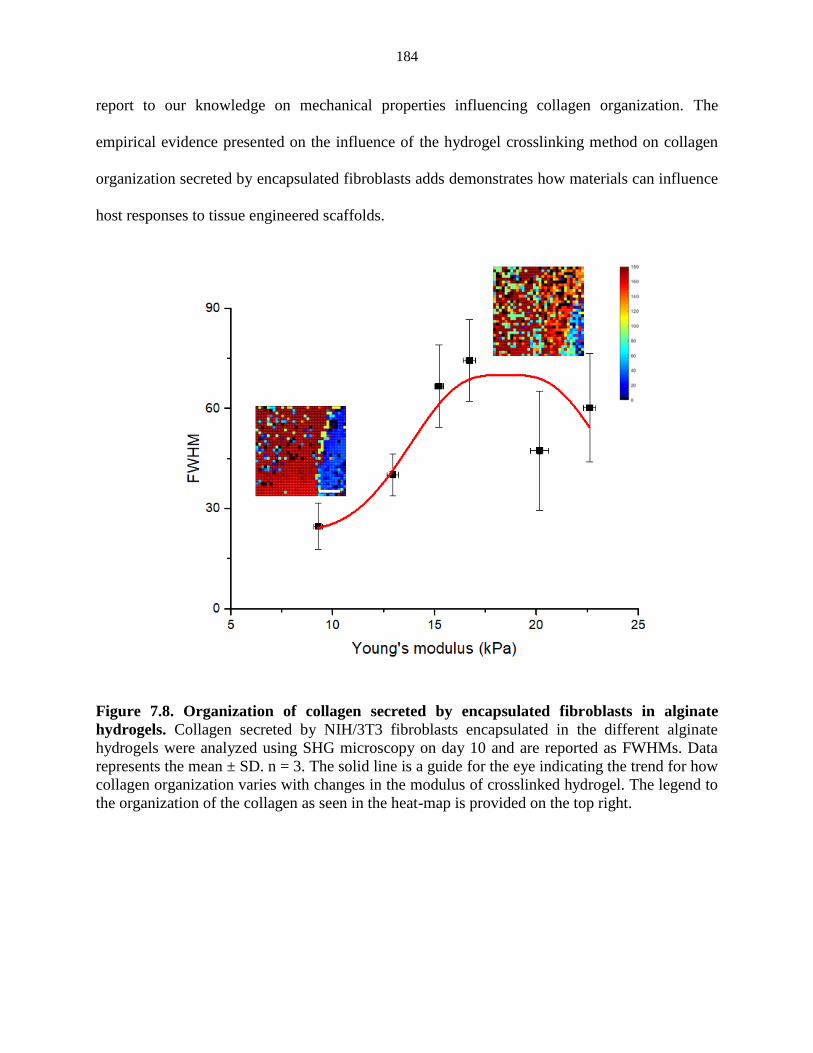
184
report to our knowledge on mechanical properties influencing collagen organization. The
empirical evidence presented on the influence of the hydrogel crosslinking method on collagen
organization secreted by encapsulated fibroblasts adds demonstrates how materials can influence
host responses to tissue engineered scaffolds.
Figure 7.8. Organization of collagen secreted by encapsulated fibroblasts in alginate
hydrogels. Collagen secreted by NIH/3T3 fibroblasts encapsulated in the different alginate
hydrogels were analyzed using SHG microscopy on day 10 and are reported as FWHMs. Data
represents the mean ± SD. n = 3. The solid line is a guide for the eye indicating the trend for how
collagen organization varies with changes in the modulus of crosslinked hydrogel. The legend to
the organization of the collagen as seen in the heat-map is provided on the top right.
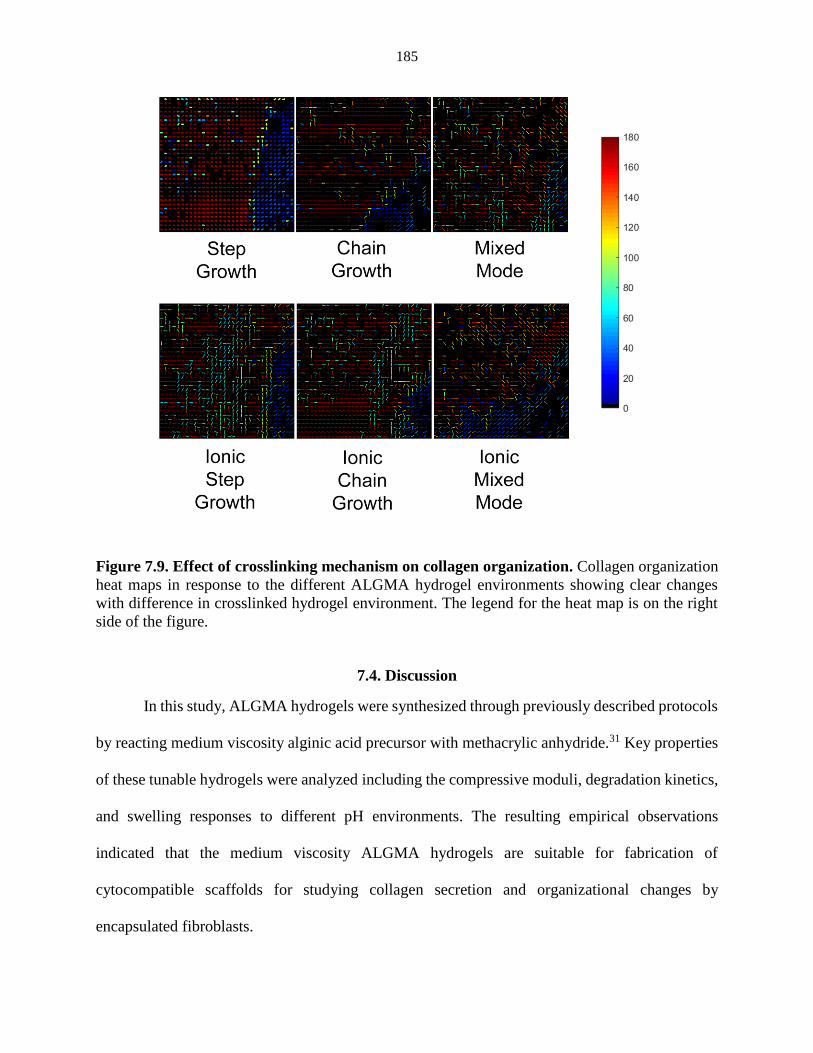
185
Figure 7.9. Effect of crosslinking mechanism on collagen organization. Collagen organization
heat maps in response to the different ALGMA hydrogel environments showing clear changes
with difference in crosslinked hydrogel environment. The legend for the heat map is on the right
side of the figure.
7.4. Discussion
In this study, ALGMA hydrogels were synthesized through previously described protocols
by reacting medium viscosity alginic acid precursor with methacrylic anhydride.31 Key properties
of these tunable hydrogels were analyzed including the compressive moduli, degradation kinetics,
and swelling responses to different pH environments. The resulting empirical observations
indicated that the medium viscosity ALGMA hydrogels are suitable for fabrication of
cytocompatible scaffolds for studying collagen secretion and organizational changes by
encapsulated fibroblasts.
186
Most cells are anchorage dependent and adhere to underlying substrates forming focal
adhesions. This cell-substrate interaction senses substrate stiffness by the cell reaching out through
the actin-myosin cytoskeleton and is critical to the subsequent expression of secreted proteins as
well as differentiation to activated phenotypes.8,49 Ionic, covalent, and a combination of the two
(dual crosslinking) crosslinking mechanisms were employed to prepare medium viscosity
ALGMA hydrogels with compressive moduli in the range of 8.3 ± 0.3 to 22.6 ± 0.3 kPa (Figure
7.2). From these measurements, it is evident that there is a considerable influence from both the
alginic acid precursor as well the crosslinking mechanism on the compressive moduli with our
previously studied very low viscosity based ALGMA hydrogels restricted within a range of 0.5 ±
0.1 to 2.2 ± 0.1 kPa,31 compared to the significantly stiffer ones synthesized here from medium
viscosity precursors. The overall trend of the increase in compressive moduli conforms to the
theory of rubber elasticity.31,67 We are primarily concerned with how hydrogel properties can
influence collagen organization. As such, this range of mechanical environments will allow us to
disentangle trends between hydrogel stiffness and collagen alignment as this range of moduli
traverses previously observed thresholds for fibroblasts to express actin stress fibers and
differentiate to myofibroblasts.68,69 Some studies have indicated the presence of an intermediate
stage of proto-myofibroblasts that not express α-smooth muscle actin, while still showing
significantly higher overall actin expression.70,71 Another study used chemically modified, soft
alginate hydrogels with compressive moduli over the range of ~10 to 12 kPa, that showed low
immune cell activation, and significantly reduced fibrotic response.72
Acute wound sites show rapid transition in pH from slightly acidic immediately after injury
to basic conditions during granulation tissue formation, to more neutral levels upon
reepitheliazation.73,74 Chronic wounds remain slightly alkali, which makes the wound site more
187
susceptible to opportunistic pathogens.74,75 Hence, an important aspect of designing biocompatible
scaffolds from naturally derived, anionic polymers is utilizing their natural tendency to swell under
basic pH conditions.76,77 Responsive scaffolds that swell in alkaline pH can be used to deliver
payloads of cytokines and chemokines to boost the natural wound healing process, and
dynamically mitigate the chronicity of the wound site.78,79 As the crosslinking density is inversely
related to the swelling response,67 it was expected that the softer purely ionically or covalently
crosslinked hydrogels would swell more than the dually crosslinked gels. This trend held for
previously studied very low viscosity ALGMA gels,31 as well as the gels prepared here from
medium viscosity alginic acid (Figure 7.3). All the ALGMA hydrogels swelled the most at pH 9
condition, which makes these viable materials for preparing scaffolds for chronic wound
treatments. Further studies can be conducted to evaluate the kinetics of using such responsive
hydrogels for drug delivery to chronic wounds, by studying the transport of clinically relevant
biomolecules from swollen hydrogels.22 To this end, there have been studies carried out using
additional stages of wound treatment using acidified solutions,80 allo-grafts derived from neonatal
foreskin to instigate accelerated wound healing81 as well as synthetically derived scaffolds such as
Apligraf®, which closely resembles the structure of natural skin.82 An environmentally responsive
scaffold that can be tuned to deliver payloads of wound-healing relevant growth factors or patient-
derived stromal cells could personalize wound care management with minimal immune
rejection.83,84
The degradation of hydrogels results in decreased crosslink density over time.85 Alginate
hydrogels are very stable in PBS. Thus, to measure hydrolytic degradation, the ALGMA gels were
incubated in a basic solution of 0.1 mM sodium hydroxide.86,87 Covalently crosslinked ALGMA
hydrogels derived from very low viscosity degraded to 50% of their original mass within 6 ± 1
188
days with dually crosslinking increasing the half-life to 13 ± 2 days. The gels fabricated here were
almost 5 times as stable, with half-lives of 31 ± 3 days (Figure 7.4). However, dually crosslinking
the medium viscosity gels did not increase the half-life (25 ± 3 days). Ideally, degradation kinetics
of the scaffold should match tissue regeneration rates. Potential inflammatory or fibrotic responses
can result if these rates are not equivalent.88
Scaffolds must be cytocompatible..89 NIH/3T3 cells showed no cell death when
encapsulated in the different crosslinked ALGMA hydrogels (Figure 7.5B). Additionally, the
encapsulated cells had cell proliferation above 50% compared to the controls of tissue culture
plastic (TCP), with the exception of step-growth gels. When looking at the compressive moduli
and cell proliferation (Figure 7.5A), it appears that there was a threshold compressive modulus
beyond which the cell proliferation showed few significant changes with increased crosslinking
density. 3D encapsulation of cells allows for relatively better approximations of the natural in vivo
conditions, as compared to surface seeding studies.18 Comparing the cell morphology in the
live/dead assay, there were no differences for the different hydrogel environments which agrees
with Huebsch et al.65 In an effort to decouple the mechanical effects of 3D modified alginate
matrices on the morphology of human mesenchymal stem cells (hMSCs, which are similar in many
ways to fibroblasts), the cells were encapsulated in alginate hydrogels of varying Young’s modulus
and fixed concentration of the RGD motif that was used to increase cell adhesion. There were no
significant changes in morphology observed when cultured for 2h, 24h and even one week under
encapsulated conditions. Such studies indicate the complexity in using nanoporous cell
encapsulation hydrogels such as alginate for studying the changes in cell morphology responses.
The plateaued trend of the cell proliferation to the dually crosslinked hydrogels introduces the
possibility that once the ALGMA hydrogels are uniformly crosslinked above 20 kPa, would it be
189
possible to disentangle the effect of gelation mechanism and the rigidity to determine which factor
holds greater significance on cellular responses.90,91
Fibroblasts have mechanical memory regarding the stiffness of the substrates they are
cultured on, particularly with respect to how they differentiate to myofibroblasts that has been
positively correlated to over-secretion of collagen I.48,57,92 Qualitative as well as quantitative
analysis of the secreted collagen using SHG microscopy has allowed for an informed rational
design of biocompatible materials.30,93 Here, we see a significant increase of the collagen levels on
day 7 for all hydrogel conditions compared to day 5 (Figure 7.6). This was expected as protein
deposition typically increases with culture time. The overall timeline can vary based on several
factors such size, shape and topography of the environment.94 As such, the ionic chain growth gel
may have a different timeline related to its crosslinking mechanism compared with the other gels.
The positive correlation of the collagen levels to the modulus of the underlying substrate
conformed to previous studies in which stiffer substrates cause stromal cells to secrete more ECM
proteins particular around day 7 to day 10.56,95 The decrease in collagen levels beyond day 7 may
result from an increase in MMP-13 (collagenase).95 These results could also indicate an
upregulation in overall cell activity which may be a precursor for fibroblast-to-myofibroblast
differentiation, particularly in the stiffer microenvironments.96 Similarly, Huebsch et al. found that
alginate hydrogels encapsulating hMSCs instigated osteogenic differentiation when the gels were
stiffer. Encapsulated, with a biphasic influence of the modulus on ECM secretion.65 Beyond just
the quantification of the collagen levels, it is of great importance to understand the influence of
collagen organization.58 There is a dearth of studies conducted on the tunability of local collagen
organization using sensitive visualization techniques. As has been previously stated, the timeline
of collagen secretion and its organization can determine the fate of implanted materials and
190
understanding how materials alter these responses will allow us to improve implant compatibility
and prevent a fibrotic response.30
The organization of collagen in the ECM influences the remodeling of wounds,97 as well
as acceptance of implants.30 Aligned collagen is found in specific natural environments such as
mammalian tendons as well as cornea.98,99 Stochastic collagen is present in natural dermis.100
Keeping collagen alignment in mind, we can determine how materials properties will change
cellular responses and this understanding can improve scaffold design for tissue repair in different
organs.22 Collagen angles were measured using SHG and were plotted using a heat map to better
visualize regions of organization. Softer step growth gels (~10 kPa) can be seen as having a lower
FWHM, which the hydrogel resulted in more aligned collagen (Figure 7.10). This can be
visualized in the heat map in which there are large regions of collagen having the same orientation
angle. The FWHM of collagen decreases with increasing compressive modulus, which means the
collagen is more isotropic. The heat map shows that there is a large variation in collagen angles
for the ionic step growth condition (~15 kPa) (Figures 7.8 and 7.9). This suggests that not only
mechanical stiffness of the underlying substrate influences collagen response, necessitating further
research on disentangling the influence of crosslinking mechanism on cell interactions. As this
study is limited to collagen based analysis, future studies on the expression of FAK and MAPK
expression along with quantified immunocytochemical staining of cells cultured in or on such
scaffolds could further elucidate the mechanism that is causing collagen organization.101,102 This
study provides further development of SHG microscopy as a platform for visualizing the influence
of materials properties in tunable hydrogels to how cells sense their local microenvironment.
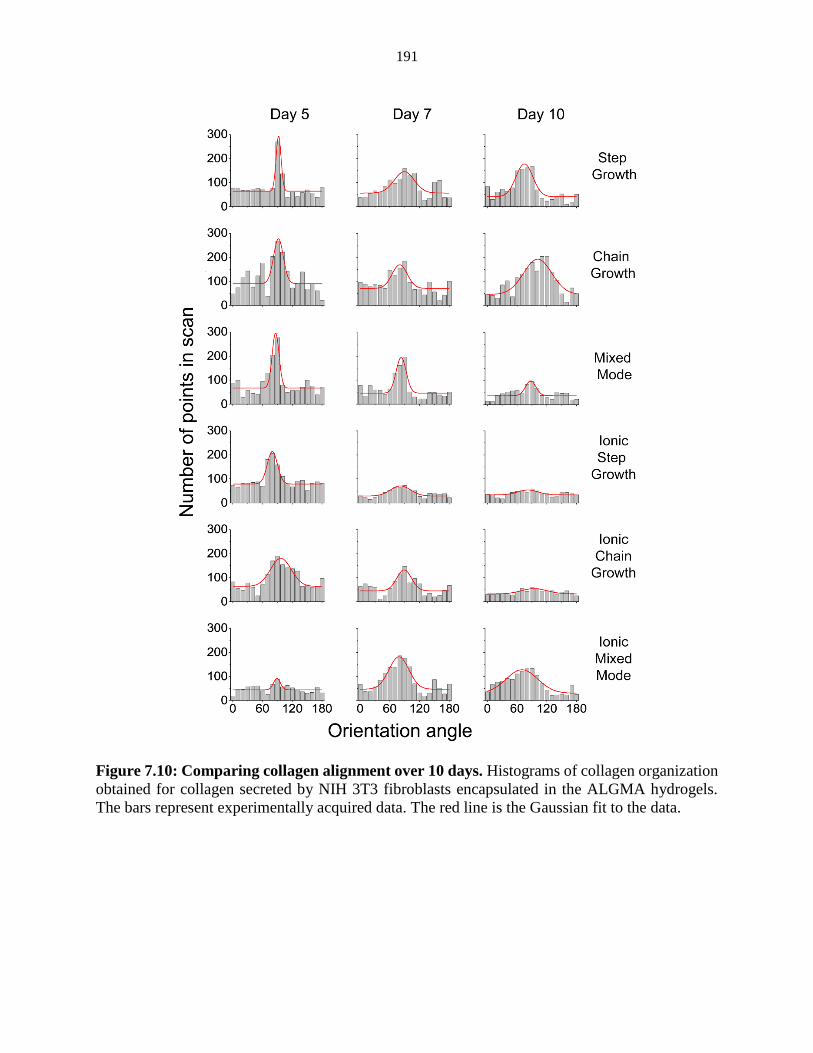
191
Figure 7.10: Comparing collagen alignment over 10 days. Histograms of collagen organization
obtained for collagen secreted by NIH 3T3 fibroblasts encapsulated in the ALGMA hydrogels.
The bars represent experimentally acquired data. The red line is the Gaussian fit to the data.
192
7.5. Conclusions
We successfully fabricated methacrylated alginate hydrogels from medium viscosity
alginic acid through ionic, covalent, and a combination of ionic and covalent crosslinking
mechanisms. These mechanisms yielded a range of hydrogels that were stiffer, pH responsive as
well as significantly more robust under accelerated degradation conditions of incubation compared
to hydrogels fabricated from very low viscosity alginate. NIH/3T3 fibroblasts encapsulated in
these hydrogels showed no cell death and a preferred threshold stiffness above which cell
proliferation was > 60 % compared to TCP controls. Collagen secretion in response to the
encapsulation conditions was positively correlated with the modulus for all environments.
Collagen was more isotropic for the mixed mode and ionic step growth conditions, whereas the
softer gels resulted in more anisotropic organization. The detailed characterization of the influence
of crosslinking mechanisms for these responsive ALGMA hydrogels indicates the need for
including it as an important factor for the fabrication of tissue engineering scaffolds.
Acknowledgements
This work was supported by the Roy J. Carver Charitable Trust Grant No. 13-4265.
7.6 References
1. Discher, D. E., Janmey, P. A. & Wang, Y. Tissue Cells Feel and Respond to the Stiffness
of Their Substrate. Science (80-. ). 310, 1139–1143 (2005).
2. Nelson, C. M. & Bissell, M. J. Of Extracellular Matrix, Scaffolds, and Signaling: Tissue
Architecture Regulates Development, Homeostasis, and Cancer. Annu. Rev. Cell Dev. Biol.
22, 287–309 (2006).
3. Tibbitt, M. W. & Anseth, K. S. Hydrogels as extracellular matrix mimics for 3D cell culture.
Biotechnol. Bioeng. 103, 655–663 (2009).
4. Rosso, F., Giordano, A., Barbarisi, M. & Barbarisi, A. From Cell-ECM Interactions to
Tissue Engineering. J. Cell. Physiol. 199, 174–180 (2004).
193
5. Aamodt, J. M. & Grainger, D. W. Extracellular matrix-based biomaterial scaffolds and the
host response. Biomaterials 86, 68–82 (2016).
6. Jikko, A., Harris, S. E., Chen, D., Mendrick, D. L. & Damsky, C. H. Collagen Integrin
Receptors Regulate Early Osteoblast Differentiation Induced by BMP-2. J. Bone Miner.
Res. 14, 1075–1083 (1999).
7. Plikus, M. V et al. Regeneration of fat cells from myofibroblasts during wound healing.
Science (80-. ). 8792, 1–12 (2017).
8. Yeung, T. et al. Effects of substrate stiffness on cell morphology, cytoskeletal structure, and
adhesion. Cell Motil. Cytoskeleton 60, 24–34 (2005).
9. Discher, D. E. et al. Matrix Mechanosensing: From Scaling Concepts in ’Omics Data to
Mechanisms in the Nucleus, Regeneration, and Cancer. Annu. Rev. Biophys. 46, 295–315
(2017).
10. Burridge, K. & Guilluy, C. Focal adhesions, stress fibers and mechanical tension. Exp. Cell
Res. 343, 14–20 (2016).
11. Lee, P. F., Bai, Y., Smith, R. L., Bayless, K. J. & Yeh, a. T. Angiogenic responses are
enhanced in mechanically and microscopically characterized, microbial transglutaminase
crosslinked collagen matrices with increased stiffness. Acta Biomater. 9, 7178–7190 (2013).
12. Stamenkovic, I. Extracellular matrix remodelling: the role of matrix metalloproteinases. J.
Pathol. 200, 448–464 (2003).
13. Gurtner, G. C., Werner, S., Barrandon, Y. & Longaker, M. T. Wound repair and
regeneration. Nature 453, 314–321 (2008).
14. Bao, P. et al. The Role of Vascular Endothelial Growth Factor in Wound Healing. J. Surg.
Res. 153, 347–358 (2009).
15. Loeffler, M., Krüger, J. A., Niethammer, A. G. & Reisfeld, R. A. Targeting tumor-
associated fibroblasts improves cancer chemotherapy by increasing intratumoral drug
uptake. J. Clin. Invest. 116, 1955–1962 (2006).
16. Bryers, J. D., Giachelli, C. M. & Ratner, B. D. Engineering biomaterials to integrate and
heal: The biocompatibility paradigm shifts. Biotechnology and Bioengineering 109, 1898–
1911 (2012).
17. Harrison, R. H., St-Pierre, J.-P. & Stevens, M. M. Tissue Engineering and Regenerative
Medicine: A Year in Review. Tissue Eng. Part B Rev. 20, 1–16 (2014).
18. Kharkar, P. M., Kiick, K. L. & Kloxin, A. M. Designing degradable hydrogels for
orthogonal control of cell microenvironments. Chem. Soc. Rev. 42, 7335–7372 (2013).
19. Peyton, S. R., Raub, C. B., Keschrumrus, V. P. & Putnam, A. J. The use of poly (ethylene
194
glycol ) hydrogels to investigate the impact of ECM chemistry and mechanics on smooth
muscle cells. Biomaterials 27, 4881–4893 (2006).
20. Jeon, O., Powell, C., Ahmed, S. M. & Alsberg, E. Biodegradable, photocrosslinked alginate
hydrogels with independently tailorable physical properties and cell adhesivity. Tissue Eng.
Part A 16, 2915–2925 (2010).
21. Lee, K. Y. & Mooney, D. J. Alginate: Properties and biomedical applications. Prog. Polym.
Sci. 37, 106–126 (2012).
22. Jeon, O., Powell, C., Solorio, L. D., Krebs, M. D. & Alsberg, E. Affinity-based growth
factor delivery using biodegradable, photocrosslinked heparin-alginate hydrogels. J.
Control. Release 154, 258–266 (2011).
23. Rowley, J. A., Madlambayan, G. & Mooney, D. J. Alginate hydrogels as synthetic
extracellular matrix materials. Biomaterials 20, 45–53 (1999).
24. Baer, A. E., Wang, J. Y., Kraus, V. B. & Setton, L. A. Collagen gene expression and
mechanical properties of intervertebral disc cell-alginate cultures. J. Orthop. Res. 19, 2–10
(2001).
25. Chen, W. L. et al. Second harmonic generation χ tensor microscopy for tissue imaging.
Appl. Phys. Lett. 94, (2009).
26. Chou, A. I., Akintoye, S. O. & Nicoll, S. B. Photo-crosslinked alginate hydrogels support
enhanced matrix accumulation by nucleus pulposus cells in vivo. Osteoarthr. Cartil. 17,
1377–1384 (2009).
27. Kastellorizios, M., Tipnis, N. & Burgess, D. J. Foreign body reaction to subcutaneous
implants. Advances in Experimental Medicine and Biology 865, (2015).
28. Gay, S., Vijanto, J., Raekallio, J. & Penttinen, R. Collagen types in early phases of wound
healing in children. Acta Chir. Scand. 144, 205–211 (1978).
29. Gabbiani, G. The myofibroblast in wound healing and fibrocontractive diseases. J. Pathol.
200, 500–503 (2003).
30. Akilbekova, D. & Bratlie, K. M. Quantitative characterization of collagen in the fibrotic
capsule surrounding implanted polymeric microparticles through second harmonic
generation imaging. PLoS One 10, 1–17 (2015).
31. Boddupalli, A. & Bratlie, K. M. Collagen organization deposited by fibroblasts
encapsulated in pH responsive methacrylated alginate hydrogels. J. Biomed. Mater. Res.
Part A (2018). doi:10.1002/jbm.a.36482
32. Shih, H. & Lin, C.-C. Cross-Linking and Degradation of Step-Growth Hydrogels Formed
by Thiol-Ene Photoclick Chemistry. Biomacromolecules 13, 2003–2012 (2012).
195
33. Mironi-harpaz, I., Yingquan, D., Venkatraman, S. & Seliktar, D. Photopolymerization of
cell-encapsulating hydrogels : Crosslinking efficiency versus cytotoxicity. Acta Biomater.
8, 1838–1848 (2012).
34. Reddy, S. K., Anseth, K. S. & Bowman, C. N. Modeling of network degradation in mixed
step-chain growth polymerizations. Polymer (Guildf). 46, 4212–4222 (2005).
35. Salinas, C. N. & Anseth, K. S. Mixed Mode Thiol - Acrylate Photopolymerizations for the
Synthesis of PEG - Peptide Hydrogels. Macromolecules 41, 6019–6026 (2008).
36. Zhu, L. & Bratlie, K. M. pH sensitive methacrylated chitosan hydrogels with tunable
physical and chemical properties. Biochem. Eng. J. 132, 38–46 (2018).
37. Samorezov, J. E., Morlock, C. M. & Alsberg, E. Dual Ionic and Photo-Crosslinked Alginate
Hydrogels for Micropatterned Spatial Control of Material Properties and Cell Behavior.
Bioconjug. Chem. 26, 1339–1347 (2015).
38. Marques, P., Gomes, M. E., Khademhosseini, A. & Link, C. Photocrosslinkable Kappa-
Carrageenan Hydrogels for Tissue Engineering Applications Accessed. Adv. Healthc.
Mater. 2, 895–907 (2018).
39. Tan, H., Li, H., Rubin, P. J. & Marra, K. G. Controlled Gelation and Degradation Rates of
Injectable Hyaluronic Acid-based Hydrogels through a Double Crosslinking Strategy. J.
Tissue Eng. Regen. Med. 5, 790–797 (2011).
40. Stuart, K. & Panitch, A. Characterization of gels composed of blends of collagen l, collagen
III, and chondroitin sulfate. Biomacromolecules 10, 25–31 (2009).
41. Chen, X. G., Wang, Z., Liu, W. S. & Park, H. J. The effect of carboxymethyl-chitosan on
proliferation and collagen secretion of normal and keloid skin fibroblasts. Biomaterials 23,
4609–4614 (2002).
42. Boddupalli, A. & Bratlie, K. M. Multimodal imaging of harmonophores and application of
high content imaging for early cancer detection. Mater. Discov. 1, 10–20 (2016).
43. P. J. Campagnola & Loew, L. M. Second-harmonic imaging microscopy for visualizing
biomolecular arrays in cells, tissues and organisms. Nat Biotech 21, 1356–1360 (2003).
44. Olderøy, M. et al. Biochemical and structural characterization of neocartilage formed by
mesenchymal stem cells in alginate hydrogels. PLoS One 9, (2014).
45. Chou, A. I. & Nicoll, S. B. Characterization of photocrosslinked alginate hydrogels for
nucleus pulposus cell encapsulation. J. Biomed. Mater. Res. - Part A 91, 187–194 (2009).
46. Bygd, H. C. & Bratlie, K. M. The effect of chemically modified alginates on macrophage
phenotype and biomolecule transport. J. Biomed. Mater. Res. - Part A 104, 1707–1719
(2016).
196
47. Hutmacher, D. W. Scaffolds in tissue engineering bone and cartilage. Biomaterials 21,
2529–2543 (2000).
48. Balestrini, J. L., Chaudhry, S., Sarrazy, V., Koehler, A. & Hinz, B. The mechanical memory
of lung myofibroblasts. Integr. Biol. 4, 410 (2012).
49. Wells, R. G. The role of matrix stiffness in regulating cell behavior. Hepatology 47, 1394–
1400 (2008).
50. Liu, F. et al. Feedback amplification of fibrosis through matrix stiffening and COX-2
suppression. J. Cell Biol. 190, 693–706 (2010).
51. Slaughter, B. V., Khurshid, S. S., Fisher, O. Z., Khademhosseini, A. & Peppas, N. A.
Hydrogels in Regenerative Medicine. Adv. Mater. 21, 3307–3329 (2009).
52. Anseth, K. S., Bowman, C. N. & Brannon-Peppas, L. Mechanical properties of hydrogels
and their experimental determination. Biomaterials 17, 1647–1657 (1996).
53. Podual, K., Doyle, F. J. & Peppas, N. A. Preparation and dynamic response of cationic
copolymer hydrogels containing glucose oxidase. Polymer (Guildf). 41, 3975–3983 (2000).
54. Almeida, C. R. et al. Impact of 3-D printed PLA- and chitosan-based scaffolds on human
monocyte/macrophage responses: Unraveling the effect of 3-D structures on inflammation.
Acta Biomater. 10, 613–622 (2014).
55. Rydholm, A. E., Bowman, C. N. & Anseth, K. S. Degradable thiol-acrylate photopolymers:
Polymerization and degradation behavior of an in situ forming biomaterial. Biomaterials
26, 4495–4506 (2005).
56. Kloxin, A. M., Kasko, A. M., Salinas, C. N. & Anseth, K. S. Photodegradable hydrogels for
dynamic tuning of physical and chemical properties. Science 324, 59–63 (2009).
57. Holt, D. J., Chamberlain, L. M. & Grainger, D. W. Cell-cell signaling in co-cultures of
macrophages and fibroblasts. Biomaterials 31, 9382–9394 (2010).
58. Yasui, T., Tohno, Y. & Araki, T. Characterization of collagen orientation in human dermis
by two-dimensional second-harmonic-generation polarimetry. J. Biomed. Opt. 9, 259–64
(2004).
59. Berry, D. P., Harding, K. G., Stanton, M. R., Jasani, B. & Ehrlich, H. P. Human wound
contraction: collagen organization, fibroblasts, and myofibroblasts. Plastic and
reconstructive surgery 102, 124-131; discussion 132-134 (1998).
60. Conklin, M. W. et al. Aligned collagen is a prognostic signature for survival in human breast
carcinoma. Am. J. Pathol. 178, 1221–1232 (2011).
61. Provenzano, P. P. et al. Collagen reorganization at the tumor-stromal interface facilitates
local invasion. BMC Med. 4, 38 (2006).
197
62. Van Zuijlen, P. P. M. et al. Collagen morphology in human skin and scar tissue: No
adaptations in response to mechanical loading at joints. Burns 29, 423–431 (2003).
63. Cook, H., Stephens, P., Davies, K. J., Harding, K. G. & Thomas, D. W. Defective
extracellular matrix reorganization by chronic wound fibroblasts is associated with
alterations in TIMP-1, TIMP-2, and MMP-2 activity. J. Invest. Dermatol. 115, 225–233
(2000).
64. Grinnell, F. Fibroblast-collagen-matrix contraction: growth-factor signalling and
mechanical loading. Trends Cell Biol. 10, 362–365 (2000).
65. Huebsch, N. et al. Harnessing traction-mediated manipulation of the cell/matrix interface
to control stem-cell fate. Nat. Mater. 9, 518–26 (2010).
66. DeForest, C. A. & Tirrell, D. A. A photoreversible protein-patterning approach for guiding
stem cell fate in three-dimensional gels. Nat. Mater. 14, 523–531 (2015).
67. Flory, P. J. & Rehner, J. Statistical mechanics of cross-linked polymer networks II.
Swelling. J. Chem. Phys. 11, 521–526 (1943).
68. Tomasek, J. J., Gabbiani, G., Hinz, B., Chaponnier, C. & Brown, R. A. Myofibroblasts and
mechano-regulation of connective tissue remodelling. Nat. Rev. Mol. Cell Biol. 3, 349–363
(2002).
69. Hinz, B. The myofibroblast: Paradigm for a mechanically active cell. J. Biomech. 43, 146–
155 (2010).
70. McAnulty, R. J. Fibroblasts and myofibroblasts: Their source, function and role in disease.
Int. J. Biochem. Cell Biol. 39, 666–671 (2007).
71. Chaponnier, C. & Gabbiani, G. Tissue repair , contraction , and the myofibroblast factors
involved in myofibroblastic. Wound Repair Regen. 13, 7–12 (2005).
72. Vegas, A. J. et al. Combinatorial hydrogel library enables identification of materials that
mitigate the foreign body response in primates. Nat. Biotechnol. (2016).
doi:10.1038/nbt.3462
73. Schneider, L. A., Korber, A., Grabbe, S. & Dissemond, J. Influence of pH on wound-
healing: A new perspective for wound-therapy? Arch. Dermatol. Res. 298, 413–420 (2007).
74. Gethin, G. The significance of surface pH in chronic wounds. Wounds UK 3, 52–56 (2007).
75. Schreml, S. et al. The impact of the pH value on skin integrity and cutaneous wound healing.
J. Eur. Acad. Dermatology Venereol. 24, 373–378 (2010).
76. Lee, K. Y. et al. Controlling mechanical and swelling properties of alginate hydrogels
independently by cross-linker type and cross-linking density. Macromolecules 33, 4291–
4294 (2000).
198
77. Khare, A. R. & Peppas, N. A. Swelling/deswelling of anionic copolymer gels. Biomaterials
16, 559–567 (1995).
78. Jeong, S. I., Jeon, O., Krebs, M. D., Hill, M. C. & Alsberg, E. Biodegradable photo-
crosslinked alginate nanofibre scaffolds with tuneable physical properties, cell adhesivity
and growth factor release. Eur. Cells Mater. 24, 331–343 (2012).
79. Lokhande, G. et al. Nanoengineered injectable hydrogels for wound healing application.
Acta Biomater. 70, 35–47 (2018).
80. Leveen, H. H. et al. Chemical acidification of wounds. An adjuvant to healing and the
unfavorable action of alkalinity and ammonia. Ann. Surg. 178, 745–753 (1973).
81. Phillips, T. J., Kehinde, O., Green, H. & Gilchrest, B. A. Treatment of skin ulcers with
cultured epidermal allografts. J. Am. Acad. Dermatol. 21, 191–199 (1989).
82. Eaglstein, W. H. & Falanga, V. Tissue engineering and the development of Apligraf, a
human skin equivalent. Cutis. 62, 1–8 (1998).
83. Eiselt, P., Yeh, J., Latvala, R. K., Shea, L. D. & Mooney, D. J. Porous carriers for
biomedical applications based on alginate hydrogels. Biomaterials 21, 1921–1927 (2000).
84. Chan, A. W., Whitney, R. A. & Neufeld, R. J. Semisynthesis of a controlled stimuli-
responsive alginate hydrogel. Biomacromolecules 10, 609–616 (2009).
85. Cha, C., Kohman, R. E. & Kong, H. Biodegradable polymer crosslinker: independent
control of stiffness, toughness, and hydrogel degradation rate. Adv. Funct. Mater. 19, 3056–
3062 (2009).
86. Browning, M. B., Cereceres, S. N., Luong, P. T. & Cosgriff-Hernandez, E. M.
Determination of the in vivo degradation mechanism of PEGDA hydrogels. J. Biomed.
Mater. Res. - Part A 102, 4244–4251 (2014).
87. Coutinho, D. F. et al. Modified Gellan Gum hydrogels with tunable physical and mechanical
properties. Biomaterials 31, 7494–7502 (2010).
88. Dinnes, D. L. M., Santerre, J. P. & Labow, R. S. Influence of biodegradable and non-
biodegradable material surfaces on the differentiation of human monocyte-derived
macrophages. Differentiation 76, 232–244 (2008).
89. Jeon, O., Bouhadir, K. H., Mansour, J. M. & Alsberg, E. Photocrosslinked alginate
hydrogels with tunable biodegradation rates and mechanical properties. Biomaterials 30,
2724–2734 (2009).
90. Ruskowitz, E. R. & Deforest, C. A. Photoresponsive biomaterials for targeted drug delivery
and 4D cell culture. Nat. Rev. Mater. 3, (2018).
91. Nemir, S., Hayenga, H. N. & West, J. L. PEGDA Hydrogels With Patterned Elasticity :
199
Novel Tools for the Study of Cell Response to Substrate Rigidity. Biotechnol. Bioeng. 105,
636–644 (2010).
92. Boersema, G. S. A., Grotenhuis, N., Bayon, Y., Lange, J. F. & Bastiaansen-Jenniskens, Y.
M. The Effect of Biomaterials Used for Tissue Regeneration Purposes on Polarization of
Macrophages. Biores. Open Access 5, 6–14 (2016).
93. Bygd, H. C., Akilbekova, D., Muñoz, A., Forsmark, K. D. & Bratlie, K. M. Poly-l-arginine
based materials as instructive substrates for fibroblast synthesis of collagen. Biomaterials
63, 47–57 (2015).
94. Anderson, J. M. Biological Responses to Materials. Annu. Rev. Mater. Res. 31, 81–110
(2001).
95. Salinas, C. N. & Anseth, K. S. The enhancement of chondrogenic differentiation of human
mesenchymal stem cells by enzymatically regulated RGD functionalities. Biomaterials 29,
2370–2377 (2008).
96. Klingberg, F., Hinz, B. & White, E. S. The myofibroblast matrix: Implications for tissue
repair andfibrosis. J. Pathol. 229, 298–309 (2013).
97. English, R. S. & Shenefelt, P. D. Keloids and hypertrophic scars. Dermatologic Surg. 25,
631–638 (1999).
98. Su, P. J. et al. The discrimination of type I and type II collagen and the label-free imaging
of engineered cartilage tissue. Biomaterials 31, 9415–9421 (2010).
99. Meek, K. M. & Boote, C. The organization of collagen in the corneal stroma. Exp. Eye Res.
78, 503–512 (2004).
100. Linares, H. A., Kischer, C. W., Dobrkovsky, M. & Larson, D. L. The histiotypic
organization of collagen of the hypertrophic scar in humans. J. Invest. Dermatol. 59, 323–
332 (1972).
101. Goffin, J. M. et al. Focal adhesion size controls tension-dependent recruitment of ??-smooth
muscle actin to stress fibers. J. Cell Biol. 172, 259–268 (2006).
102. Trappmann, B. et al. Extracellular-matrix tethering regulates stem-cell fate. Nat. Mater. 11,
742–742 (2012).
CHAPTER 8
PHOTOMASK-TUNED AND FIBRONECTIN-MODIFIED ALGINATE HYDROGELS
FOR STUDYING FIBROBLAST MORPHOLOGY AND COLLAGEN ORGANIZATION
Methacrylated alginate hydrogels were synthesized across a range of stiffness (6.9 ± 0.4 to 20.2 ±
kPa) using photomasks to tune the amount of UV exposure. NIH/3T3 fibroblasts were viable for
ten days of culture when surface seeded on these hydrogels. The proliferation of fibroblasts was
significantly higher on the stiffer hydrogels, and further surface functionalization of the gel with
fibronectin increased cell confluence on these substrates. The cells had a rounded morphology
after two days, with stellate morphology observed after four days. After ten days the stiffer
substrates were almost completely covered with NIH/3T3 cells that were expressing -smooth
muscle actin. Collagen secretion and organization from the surface-seeded fibroblasts was
visualized using second harmonic generation (SHG) microscopy. For both the fibronectin
modified and naïve substrates collagen was significantly less organized on the softer substrates
and more aligned on stiffer substrates. Cell spreading normalized to secreted collagen on the
different hydrogels indicated a clear influence of the stiffness on the cell morphology as well as
collagen levels for both four and ten days of culture. This study showed the substantial influence
of cell adhesion motifs as well as substrate stiffness on cell morphology and organization of
collagen.
201
8.1. Introduction
The primary aim of tissue engineering is to recapitulate the intricate complexities of natural
tissues so they can be used for treating diseased, damaged, or missing tissue.1–3 To develop more
effective scaffolds, the role of biomaterials properties on cell-matrix interactions must be
understood to develop enhanced design criteria.4,5 In the United States alone, it has been reported
that over 77 people receive transplants daily which is still does not cover the demand for the same
resulting in wait-listing over 98,000 patients for an average of three years or more.6,7 Regenerative
medicine seeks to cover these shortages by fabricating tunable, biocompatible materials.
Hydrogels fulfil many of the material requirements for tissue scaffolds with their tunable
mechanical properties, ease of functionalization, and, in the case of naturally derived materials,
their compositional similarity to natural extracellular matrix (ECM).8 It is possible to tailor
hydrogels with finely tuned scaffold properties to alter cell adhesion and proliferation, as well as
degradation kinetics such that they are similar to that of natural tissue growth.9,10 The interaction
between cells and the ECM is an integral aspect of how tissues maintain homeostasis.11 Through
diverse scales of interaction with the ECM, from the molecular to the macroscopic, cells are able
to sense dynamic changes in their microenvironment.12 With such a significant influence of the
ECM over cell adhesion, differentiation, and proliferation, there is a need to engineer interactions
that can increase the compliance of scaffolds.13,14
202
Naturally derived hydrogel materials such as alginic acid derived from algae or seaweed
can be used as a scaffold for tissue engineering applications.15–17 Alginate can be crosslinked
through ionic binding or through covalent bonds after chemically modifying alginate.18,19
Although ionic crosslinking is relatively facile and rapid, ion exchange with monovalent ions in
physiological media can result in a loss of mechanical stability.20,21 Through methacrylation of
these alginate networks, hydrogels can be formed through chain growth polymerization using
photocrosslinking.22 By tuning the opacity of photomasks, it is possible to further tune the UV
exposure and result in a gradient of hydrogel stiffnesses.23 To increase the cytocompatibility of
such hydrogel gradients, fibronectin (FN), laminin, and collagen have been used to mimic natural
tissue environments by providing cell adhesion motifs for better cell attachment.24–26 Patterns of
such photocrosslinked platforms have been previously used to study the differentiation and
mechanotransducive sensitivity of mesenchymal stem cells.27,28 These studies showed that both
the magnitude and the spatial organization of the stiff regions influenced the differentiation of stem
cells to more elongated morphologies. Collagen is a key component of mammalian connective
tissue systems.29 Collagen has both organizational and compositional differences in different
tissues that dictates the function of the tissue.30–32 Previous studies characterizing collagen secreted
by cells using molecular biology techniques or expensive dyes have been unable to completely
capture the intricacies of the cell-matrix interactions.33,34 Second harmonic generation (SHG)
microscopy is a powerful tool that can provide detailed mapping of collagen organization in a wide
range of tissue samples.35–37
203
In this study, we characterize cell viability, phenotype, and collagen secretion in response
to FN-modified as well as naïve alginate scaffolds prepared across a gradient of stiffnesses through
photocrosslinking. Fluorescent immunocytochemical staining and live/dead assays provided
insight into the biocompatibility and cell morphology of surface-seeded NIH/3T3 fibroblasts.
Using the sensitive, dye-less visualization of collagen through SHG imaging, we examined how
substrate stiffness influenced collagen secretion and alignment. Through our analysis, we propose
design criteria for achieving different collagen organization based on hydrogel stiffness.
8.2. Experimental
8.2.1. Materials
Medium viscosity alginic acid (CAS 9005-38-3) was procured from MP Biomedicals
Fisher Scientific (Hampton, NH). Dithiothreitol (DTT) was supplied by VWR Chemicals (Batavia,
IL). All other materials used for the experiments were procured from Sigma Aldrich (St. Louis,
MO) and used as received, unless otherwise specified. Deionized (DI) water (Milli-Q, Thermo
Scientific Nanopure, Waltham, MA) was used throughout these experiments.
8.2.2. Methacrylated Alginate (ALGMA) Synthesis
The medium viscosity alginic acid precursor was used to prepare alginate solutions and
methacrylated as described previously.38 Briefly, 2 g of alginic acid powder was dissolved in 200
mL of DI water to prepare a 1 % (w/v) solution. The modification of this solution was initiated by
slowly adding 16 mL of methacrylic anhydride. The pH was maintained between 8 and 9 using
aliquots of 5 M NaOH at 4 ℃. This reaction was stopped after 24h, and the methacrylated alginate
(ALGMA) was transferred to molecular weight cutoff membranes of 13,000 Da. The ALGMA
was dialyzed against DI water for two days, with the dialysate refreshed twice a day. The final
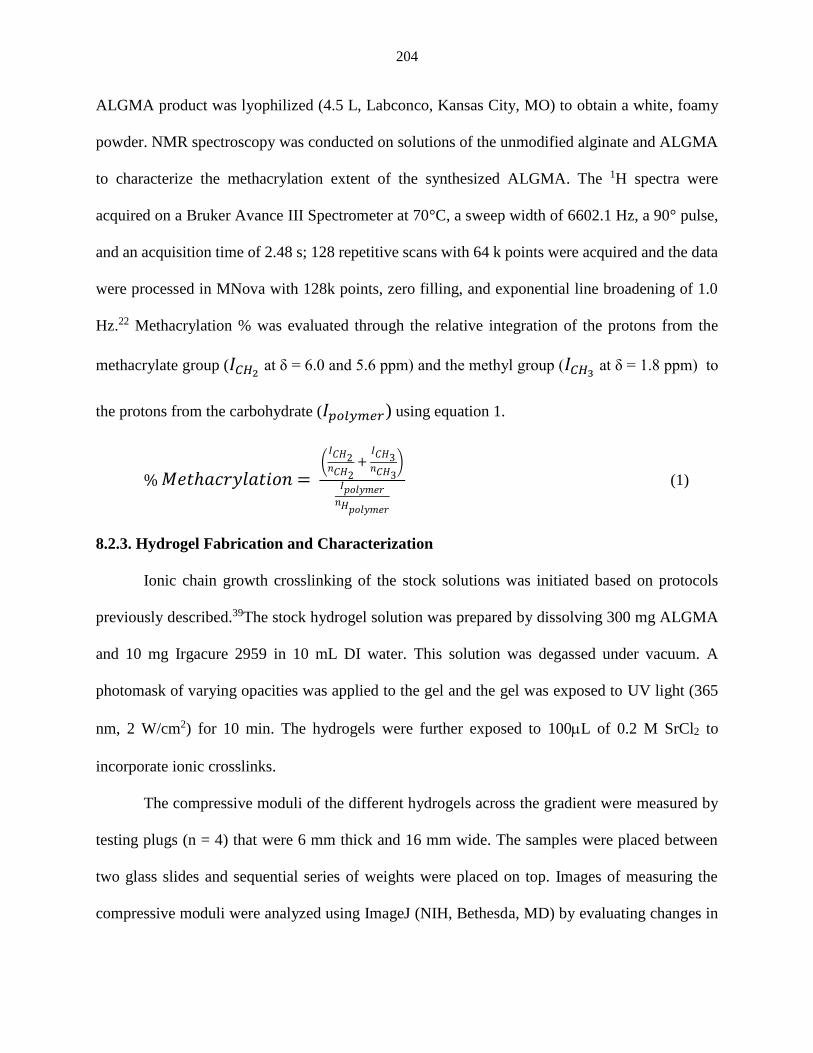
204
ALGMA product was lyophilized (4.5 L, Labconco, Kansas City, MO) to obtain a white, foamy
powder. NMR spectroscopy was conducted on solutions of the unmodified alginate and ALGMA
to characterize the methacrylation extent of the synthesized ALGMA. The 1H spectra were
acquired on a Bruker Avance III Spectrometer at 70°C, a sweep width of 6602.1 Hz, a 90° pulse,
and an acquisition time of 2.48 s; 128 repetitive scans with 64 k points were acquired and the data
were processed in MNova with 128k points, zero filling, and exponential line broadening of 1.0
Hz.22 Methacrylation % was evaluated through the relative integration of the protons from the
methacrylate group (𝐼𝐶𝐻2 at δ = 6.0 and 5.6 ppm) and the methyl group (𝐼𝐶𝐻3
at δ = 1.8 ppm) to
the protons from the carbohydrate (𝐼𝑝𝑜𝑙𝑦𝑚𝑒𝑟) using equation 1.
% 𝑀𝑒𝑡ℎ𝑎𝑐𝑟𝑦𝑙𝑎𝑡𝑖𝑜𝑛 = (
𝐼𝐶𝐻2𝑛𝐶𝐻2
+ 𝐼𝐶𝐻3𝑛𝐶𝐻3
)
𝐼𝑝𝑜𝑙𝑦𝑚𝑒𝑟𝑛𝐻𝑝𝑜𝑙𝑦𝑚𝑒𝑟
(1)
8.2.3. Hydrogel Fabrication and Characterization
Ionic chain growth crosslinking of the stock solutions was initiated based on protocols
previously described.39The stock hydrogel solution was prepared by dissolving 300 mg ALGMA
and 10 mg Irgacure 2959 in 10 mL DI water. This solution was degassed under vacuum. A
photomask of varying opacities was applied to the gel and the gel was exposed to UV light (365
nm, 2 W/cm2) for 10 min. The hydrogels were further exposed to 100L of 0.2 M SrCl2 to
incorporate ionic crosslinks.
The compressive moduli of the different hydrogels across the gradient were measured by
testing plugs (n = 4) that were 6 mm thick and 16 mm wide. The samples were placed between
two glass slides and sequential series of weights were placed on top. Images of measuring the
compressive moduli were analyzed using ImageJ (NIH, Bethesda, MD) by evaluating changes in
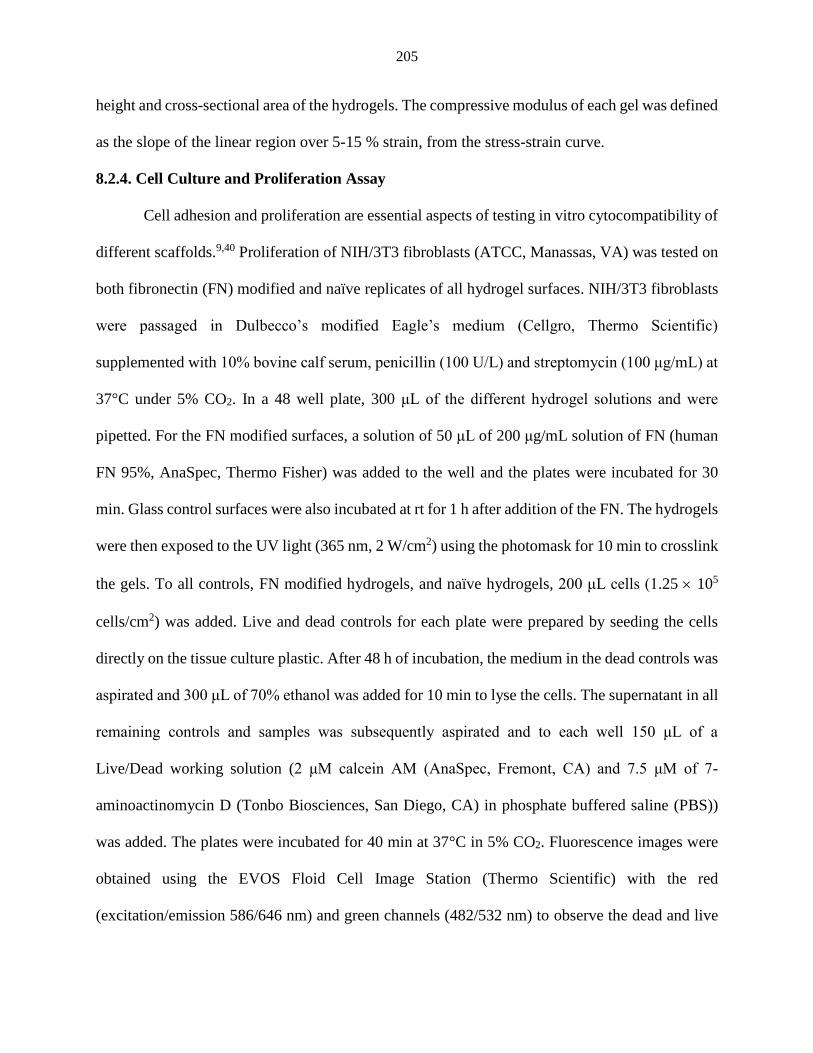
205
height and cross-sectional area of the hydrogels. The compressive modulus of each gel was defined
as the slope of the linear region over 5-15 % strain, from the stress-strain curve.
8.2.4. Cell Culture and Proliferation Assay
Cell adhesion and proliferation are essential aspects of testing in vitro cytocompatibility of
different scaffolds.9,40 Proliferation of NIH/3T3 fibroblasts (ATCC, Manassas, VA) was tested on
both fibronectin (FN) modified and naïve replicates of all hydrogel surfaces. NIH/3T3 fibroblasts
were passaged in Dulbecco’s modified Eagle’s medium (Cellgro, Thermo Scientific)
supplemented with 10% bovine calf serum, penicillin (100 U/L) and streptomycin (100 μg/mL) at
37°C under 5% CO2. In a 48 well plate, 300 μL of the different hydrogel solutions and were
pipetted. For the FN modified surfaces, a solution of 50 μL of 200 μg/mL solution of FN (human
FN 95%, AnaSpec, Thermo Fisher) was added to the well and the plates were incubated for 30
min. Glass control surfaces were also incubated at rt for 1 h after addition of the FN. The hydrogels
were then exposed to the UV light (365 nm, 2 W/cm2) using the photomask for 10 min to crosslink
the gels. To all controls, FN modified hydrogels, and naïve hydrogels, 200 μL cells (1.25 105
cells/cm2) was added. Live and dead controls for each plate were prepared by seeding the cells
directly on the tissue culture plastic. After 48 h of incubation, the medium in the dead controls was
aspirated and 300 μL of 70% ethanol was added for 10 min to lyse the cells. The supernatant in all
remaining controls and samples was subsequently aspirated and to each well 150 μL of a
Live/Dead working solution (2 μM calcein AM (AnaSpec, Fremont, CA) and 7.5 μM of 7-
aminoactinomycin D (Tonbo Biosciences, San Diego, CA) in phosphate buffered saline (PBS))
was added. The plates were incubated for 40 min at 37°C in 5% CO2. Fluorescence images were
obtained using the EVOS Floid Cell Image Station (Thermo Scientific) with the red
(excitation/emission 586/646 nm) and green channels (482/532 nm) to observe the dead and live
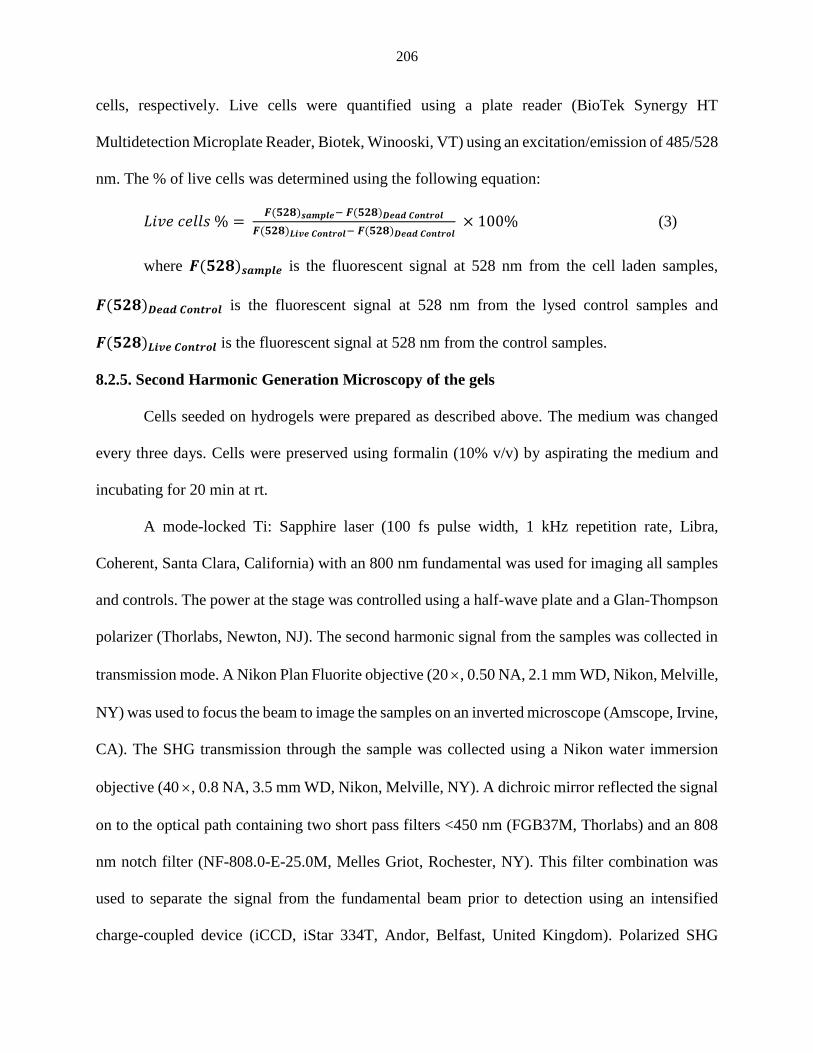
206
cells, respectively. Live cells were quantified using a plate reader (BioTek Synergy HT
Multidetection Microplate Reader, Biotek, Winooski, VT) using an excitation/emission of 485/528
nm. The % of live cells was determined using the following equation:
𝐿𝑖𝑣𝑒 𝑐𝑒𝑙𝑙𝑠 % = 𝑭(𝟓𝟐𝟖)𝒔𝒂𝒎𝒑𝒍𝒆− 𝑭(𝟓𝟐𝟖)𝑫𝒆𝒂𝒅 𝑪𝒐𝒏𝒕𝒓𝒐𝒍
𝑭(𝟓𝟐𝟖)𝑳𝒊𝒗𝒆 𝑪𝒐𝒏𝒕𝒓𝒐𝒍− 𝑭(𝟓𝟐𝟖)𝑫𝒆𝒂𝒅 𝑪𝒐𝒏𝒕𝒓𝒐𝒍 × 100% (3)
where 𝑭(𝟓𝟐𝟖)𝒔𝒂𝒎𝒑𝒍𝒆 is the fluorescent signal at 528 nm from the cell laden samples,
𝑭(𝟓𝟐𝟖)𝑫𝒆𝒂𝒅 𝑪𝒐𝒏𝒕𝒓𝒐𝒍 is the fluorescent signal at 528 nm from the lysed control samples and
𝑭(𝟓𝟐𝟖)𝑳𝒊𝒗𝒆 𝑪𝒐𝒏𝒕𝒓𝒐𝒍 is the fluorescent signal at 528 nm from the control samples.
8.2.5. Second Harmonic Generation Microscopy of the gels
Cells seeded on hydrogels were prepared as described above. The medium was changed
every three days. Cells were preserved using formalin (10% v/v) by aspirating the medium and
incubating for 20 min at rt.
A mode-locked Ti: Sapphire laser (100 fs pulse width, 1 kHz repetition rate, Libra,
Coherent, Santa Clara, California) with an 800 nm fundamental was used for imaging all samples
and controls. The power at the stage was controlled using a half-wave plate and a Glan-Thompson
polarizer (Thorlabs, Newton, NJ). The second harmonic signal from the samples was collected in
transmission mode. A Nikon Plan Fluorite objective (20 , 0.50 NA, 2.1 mm WD, Nikon, Melville,
NY) was used to focus the beam to image the samples on an inverted microscope (Amscope, Irvine,
CA). The SHG transmission through the sample was collected using a Nikon water immersion
objective (40 , 0.8 NA, 3.5 mm WD, Nikon, Melville, NY). A dichroic mirror reflected the signal
on to the optical path containing two short pass filters <450 nm (FGB37M, Thorlabs) and an 808
nm notch filter (NF-808.0-E-25.0M, Melles Griot, Rochester, NY). This filter combination was
used to separate the signal from the fundamental beam prior to detection using an intensified
charge-coupled device (iCCD, iStar 334T, Andor, Belfast, United Kingdom). Polarized SHG
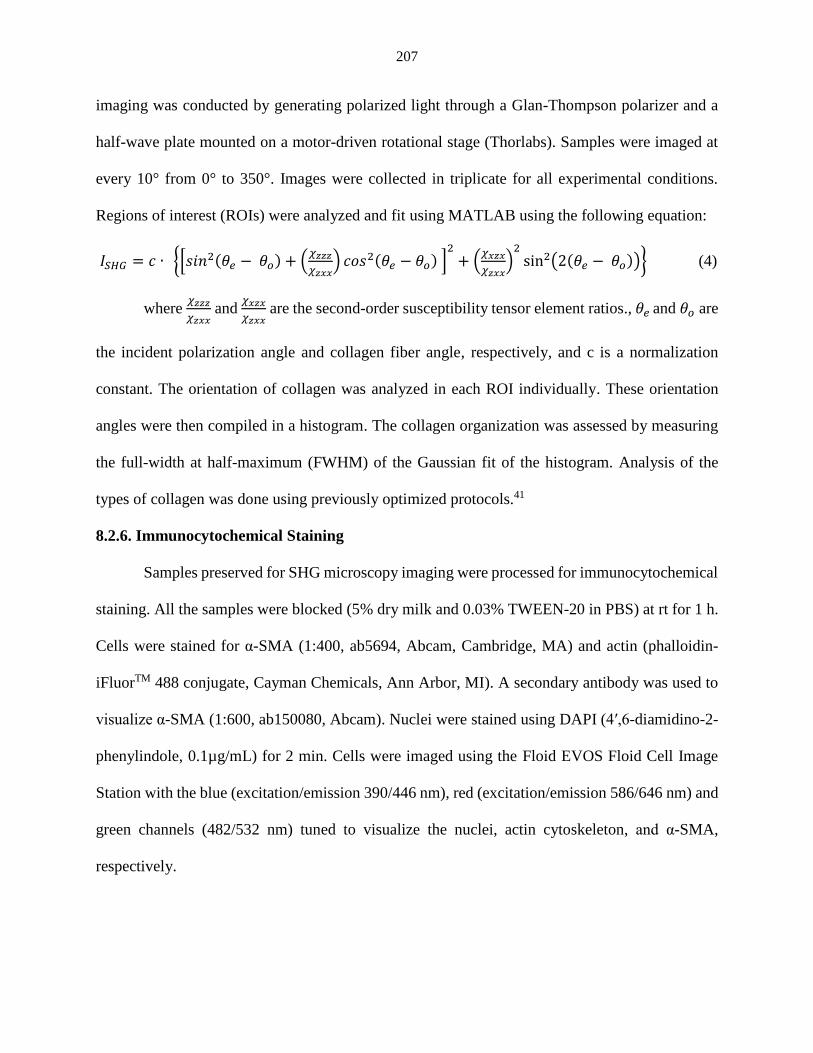
207
imaging was conducted by generating polarized light through a Glan-Thompson polarizer and a
half-wave plate mounted on a motor-driven rotational stage (Thorlabs). Samples were imaged at
every 10° from 0° to 350°. Images were collected in triplicate for all experimental conditions.
Regions of interest (ROIs) were analyzed and fit using MATLAB using the following equation:
𝐼𝑆𝐻𝐺 = 𝑐 ∙ {[𝑠𝑖𝑛2(𝜃𝑒 − 𝜃𝑜) + (𝜒𝑧𝑧𝑧
𝜒𝑧𝑥𝑥) 𝑐𝑜𝑠2(𝜃𝑒 − 𝜃𝑜) ]
2
+ (𝜒𝑥𝑧𝑥
𝜒𝑧𝑥𝑥)
2
sin2(2(𝜃𝑒 − 𝜃𝑜))} (4)
where 𝜒𝑧𝑧𝑧
𝜒𝑧𝑥𝑥 and
𝜒𝑥𝑧𝑥
𝜒𝑧𝑥𝑥 are the second-order susceptibility tensor element ratios., 𝜃𝑒 and 𝜃𝑜 are
the incident polarization angle and collagen fiber angle, respectively, and c is a normalization
constant. The orientation of collagen was analyzed in each ROI individually. These orientation
angles were then compiled in a histogram. The collagen organization was assessed by measuring
the full-width at half-maximum (FWHM) of the Gaussian fit of the histogram. Analysis of the
types of collagen was done using previously optimized protocols.41
8.2.6. Immunocytochemical Staining
Samples preserved for SHG microscopy imaging were processed for immunocytochemical
staining. All the samples were blocked (5% dry milk and 0.03% TWEEN-20 in PBS) at rt for 1 h.
Cells were stained for α-SMA (1:400, ab5694, Abcam, Cambridge, MA) and actin (phalloidin-
iFluorTM 488 conjugate, Cayman Chemicals, Ann Arbor, MI). A secondary antibody was used to
visualize α-SMA (1:600, ab150080, Abcam). Nuclei were stained using DAPI (4′,6-diamidino-2-
phenylindole, 0.1µg/mL) for 2 min. Cells were imaged using the Floid EVOS Floid Cell Image
Station with the blue (excitation/emission 390/446 nm), red (excitation/emission 586/646 nm) and
green channels (482/532 nm) tuned to visualize the nuclei, actin cytoskeleton, and α-SMA,
respectively.
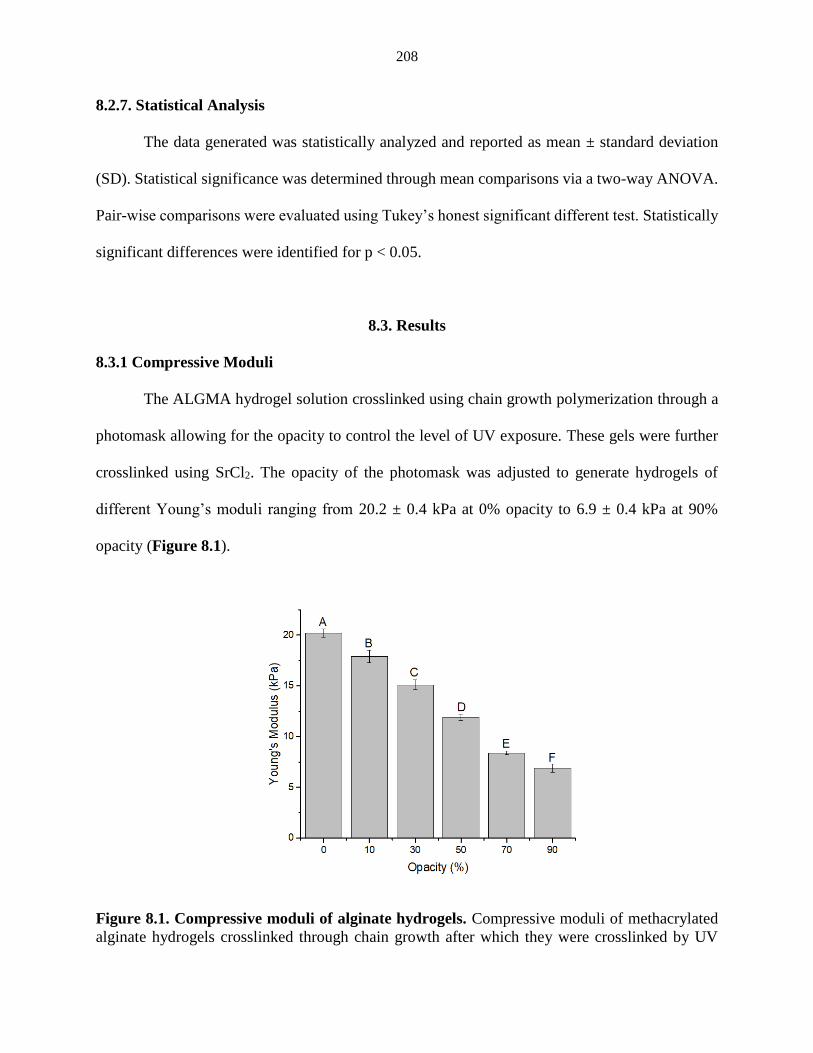
208
8.2.7. Statistical Analysis
The data generated was statistically analyzed and reported as mean ± standard deviation
(SD). Statistical significance was determined through mean comparisons via a two-way ANOVA.
Pair-wise comparisons were evaluated using Tukey’s honest significant different test. Statistically
significant differences were identified for p < 0.05.
8.3. Results
8.3.1 Compressive Moduli
The ALGMA hydrogel solution crosslinked using chain growth polymerization through a
photomask allowing for the opacity to control the level of UV exposure. These gels were further
crosslinked using SrCl2. The opacity of the photomask was adjusted to generate hydrogels of
different Young’s moduli ranging from 20.2 ± 0.4 kPa at 0% opacity to 6.9 ± 0.4 kPa at 90%
opacity (Figure 8.1).
Figure 8.1. Compressive moduli of alginate hydrogels. Compressive moduli of methacrylated
alginate hydrogels crosslinked through chain growth after which they were crosslinked by UV
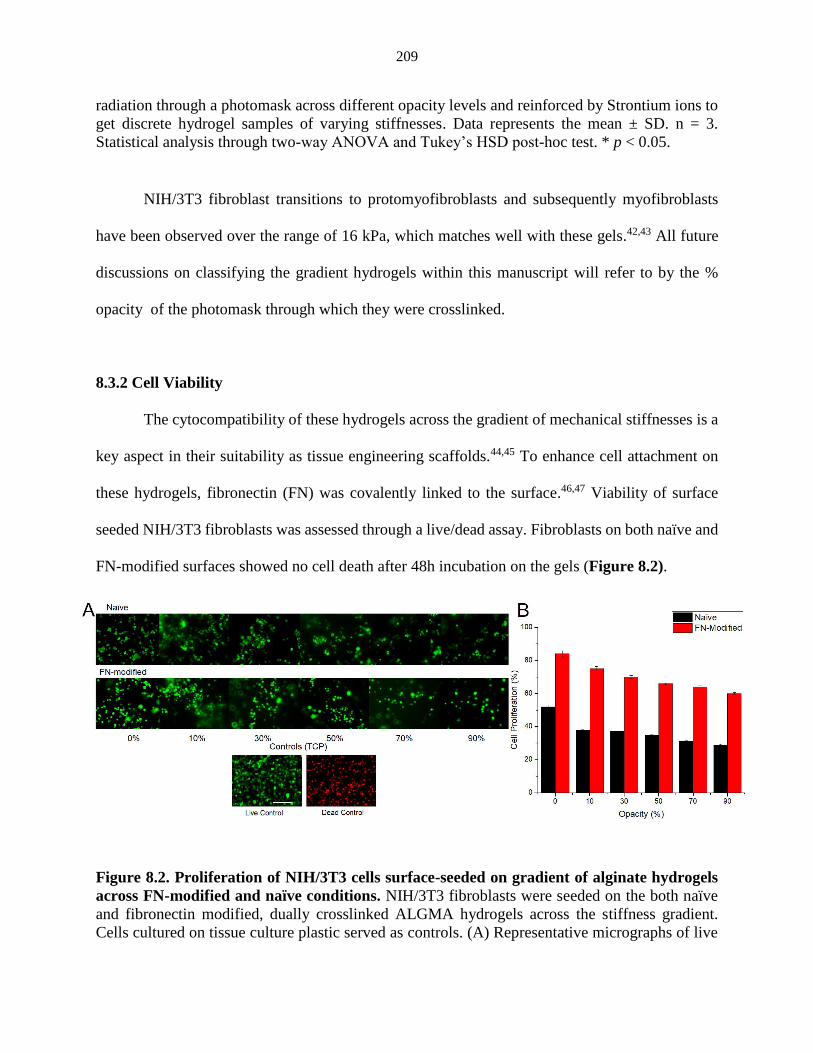
209
radiation through a photomask across different opacity levels and reinforced by Strontium ions to
get discrete hydrogel samples of varying stiffnesses. Data represents the mean ± SD. n = 3.
Statistical analysis through two-way ANOVA and Tukey’s HSD post-hoc test. * p < 0.05.
NIH/3T3 fibroblast transitions to protomyofibroblasts and subsequently myofibroblasts
have been observed over the range of 16 kPa, which matches well with these gels.42,43 All future
discussions on classifying the gradient hydrogels within this manuscript will refer to by the %
opacity of the photomask through which they were crosslinked.
8.3.2 Cell Viability
The cytocompatibility of these hydrogels across the gradient of mechanical stiffnesses is a
key aspect in their suitability as tissue engineering scaffolds.44,45 To enhance cell attachment on
these hydrogels, fibronectin (FN) was covalently linked to the surface.46,47 Viability of surface
seeded NIH/3T3 fibroblasts was assessed through a live/dead assay. Fibroblasts on both naïve and
FN-modified surfaces showed no cell death after 48h incubation on the gels (Figure 8.2).
Figure 8.2. Proliferation of NIH/3T3 cells surface-seeded on gradient of alginate hydrogels
across FN-modified and naïve conditions. NIH/3T3 fibroblasts were seeded on the both naïve
and fibronectin modified, dually crosslinked ALGMA hydrogels across the stiffness gradient.
Cells cultured on tissue culture plastic served as controls. (A) Representative micrographs of live
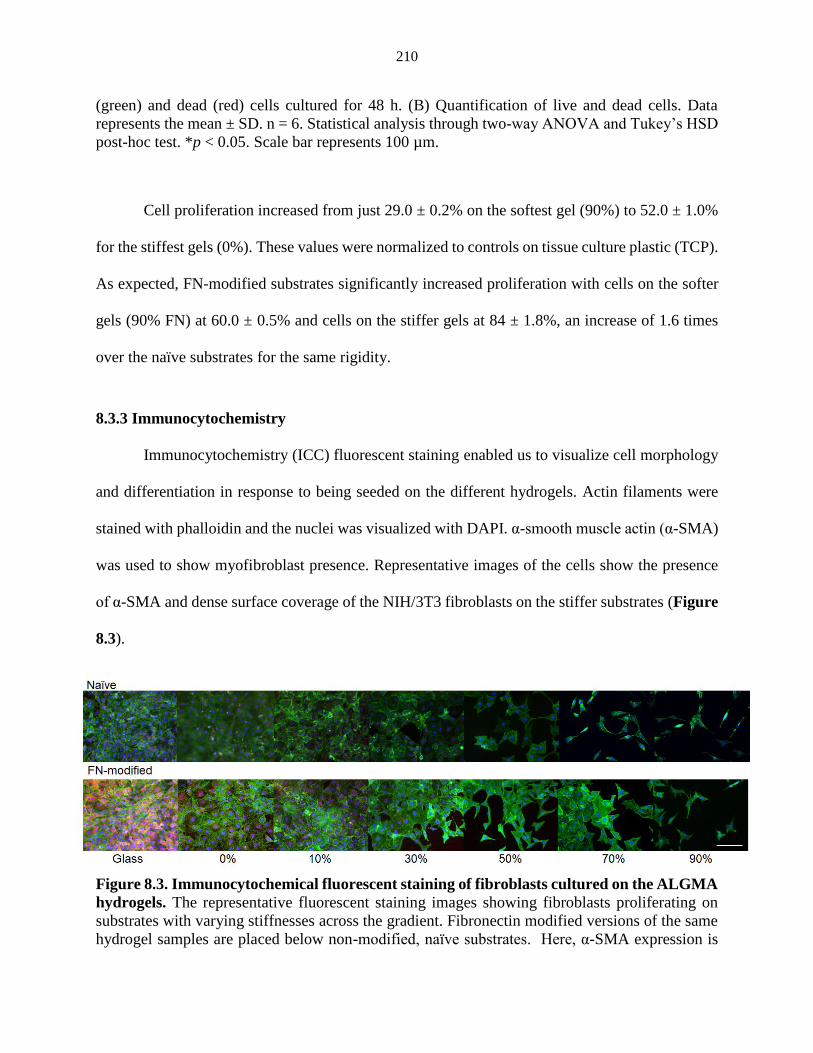
210
(green) and dead (red) cells cultured for 48 h. (B) Quantification of live and dead cells. Data
represents the mean ± SD. n = 6. Statistical analysis through two-way ANOVA and Tukey’s HSD
post-hoc test. *p < 0.05. Scale bar represents 100 µm.
Cell proliferation increased from just 29.0 ± 0.2% on the softest gel (90%) to 52.0 ± 1.0%
for the stiffest gels (0%). These values were normalized to controls on tissue culture plastic (TCP).
As expected, FN-modified substrates significantly increased proliferation with cells on the softer
gels (90% FN) at 60.0 ± 0.5% and cells on the stiffer gels at 84 ± 1.8%, an increase of 1.6 times
over the naïve substrates for the same rigidity.
8.3.3 Immunocytochemistry
Immunocytochemistry (ICC) fluorescent staining enabled us to visualize cell morphology
and differentiation in response to being seeded on the different hydrogels. Actin filaments were
stained with phalloidin and the nuclei was visualized with DAPI. α-smooth muscle actin (α-SMA)
was used to show myofibroblast presence. Representative images of the cells show the presence
of α-SMA and dense surface coverage of the NIH/3T3 fibroblasts on the stiffer substrates (Figure
8.3).
Figure 8.3. Immunocytochemical fluorescent staining of fibroblasts cultured on the ALGMA
hydrogels. The representative fluorescent staining images showing fibroblasts proliferating on
substrates with varying stiffnesses across the gradient. Fibronectin modified versions of the same
hydrogel samples are placed below non-modified, naïve substrates. Here, α-SMA expression is
211
stained red, the cytoskeletal structure is stained green, and nuclei are blue colored. Scale bar
represents 100 µm.
Unlike the live/dead assay, which were carried out after two days, these samples were
incubated for ten days. This longer time period allowed for greater cell proliferation a on the stiffer,
naive substrates as well as all FN-modified gel surfaces.32 On the softer substrates, the fibroblasts
exhibited stellate morphology, indicating their potential ECM remodeling activity which will be
discussed further.48
8.3.4 Secreted Collagen Levels
We are interested in the influence mechanical stiffness has on collagen secreted by
fibroblasts to better understand how materials properties influence the host response49 to improve
rational design of scaffolds. Collagen is a non-centrosymmetric protein and is SHG active. Here,
we quantified collagen secreted by NIH/3T3 fibroblasts in response to these hydrogel substrates.
Combining the analysis from ICC staining of the cell-hydrogel samples with the SHG microscopy,
the collagen signal was normalized to the number of nuclei stained by DAPI (Figure 8.5). This
normalization allowed us to gauge the influence of the underlying substrates while controlling for
differences in cell numbers on each substrate. For 30% and softer hydrogel samples, more collagen
was measured on FN-modified substrates compared with the naïve substrates. There were no
differences observed for the stiffer FN and naïve surfaces. Glass controls had significantly more
collagen than the softer gels.
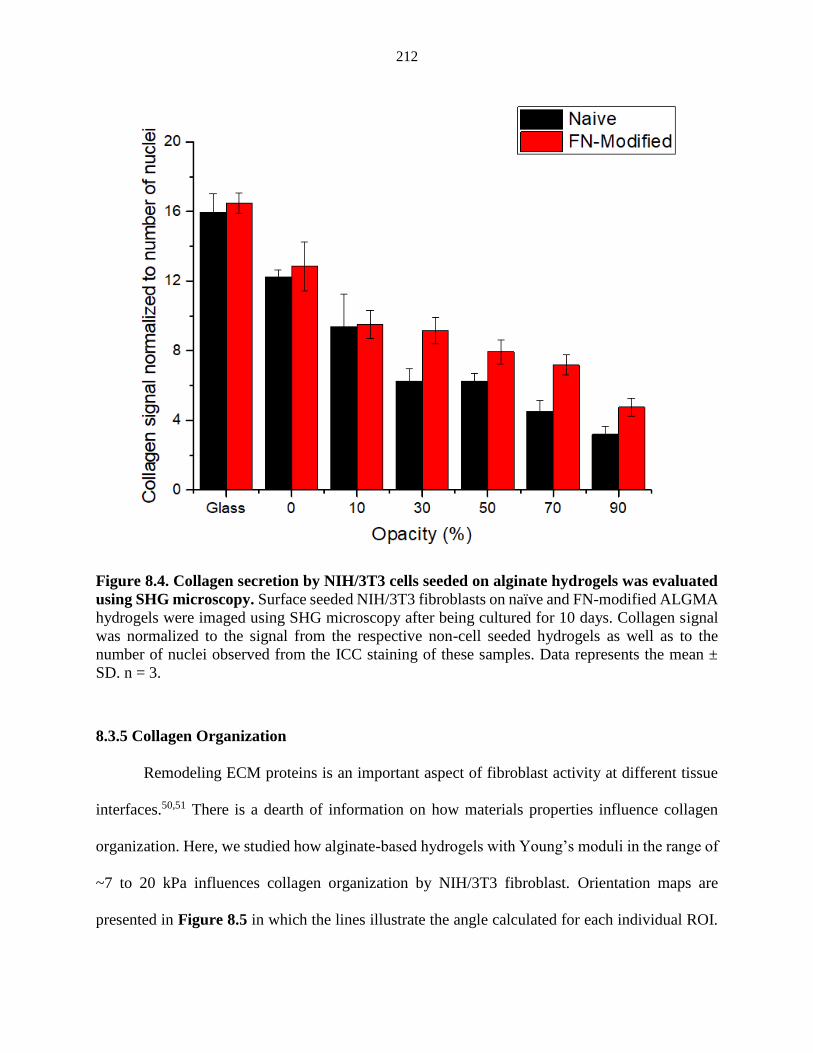
212
Figure 8.4. Collagen secretion by NIH/3T3 cells seeded on alginate hydrogels was evaluated
using SHG microscopy. Surface seeded NIH/3T3 fibroblasts on naïve and FN-modified ALGMA
hydrogels were imaged using SHG microscopy after being cultured for 10 days. Collagen signal
was normalized to the signal from the respective non-cell seeded hydrogels as well as to the
number of nuclei observed from the ICC staining of these samples. Data represents the mean ±
SD. n = 3.
8.3.5 Collagen Organization
Remodeling ECM proteins is an important aspect of fibroblast activity at different tissue
interfaces.50,51 There is a dearth of information on how materials properties influence collagen
organization. Here, we studied how alginate-based hydrogels with Young’s moduli in the range of
~7 to 20 kPa influences collagen organization by NIH/3T3 fibroblast. Orientation maps are
presented in Figure 8.5 in which the lines illustrate the angle calculated for each individual ROI.
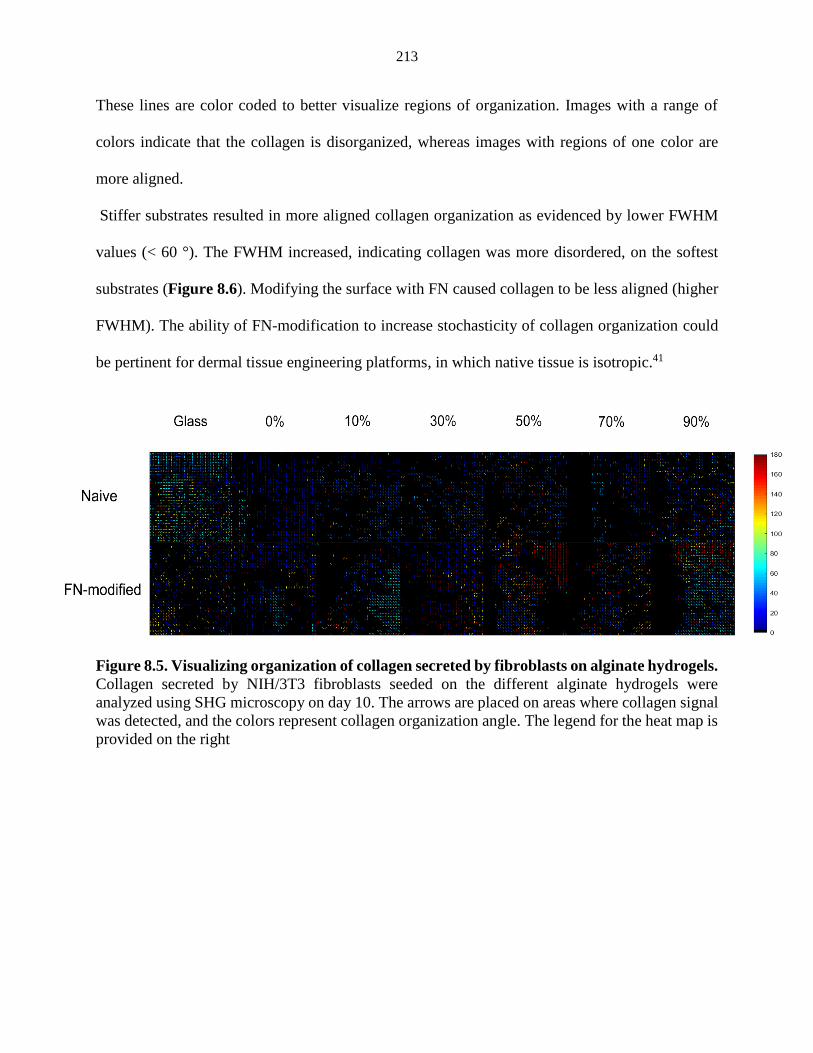
213
These lines are color coded to better visualize regions of organization. Images with a range of
colors indicate that the collagen is disorganized, whereas images with regions of one color are
more aligned.
Stiffer substrates resulted in more aligned collagen organization as evidenced by lower FWHM
values (< 60 °). The FWHM increased, indicating collagen was more disordered, on the softest
substrates (Figure 8.6). Modifying the surface with FN caused collagen to be less aligned (higher
FWHM). The ability of FN-modification to increase stochasticity of collagen organization could
be pertinent for dermal tissue engineering platforms, in which native tissue is isotropic.41
Figure 8.5. Visualizing organization of collagen secreted by fibroblasts on alginate hydrogels.
Collagen secreted by NIH/3T3 fibroblasts seeded on the different alginate hydrogels were
analyzed using SHG microscopy on day 10. The arrows are placed on areas where collagen signal
was detected, and the colors represent collagen organization angle. The legend for the heat map is
provided on the right
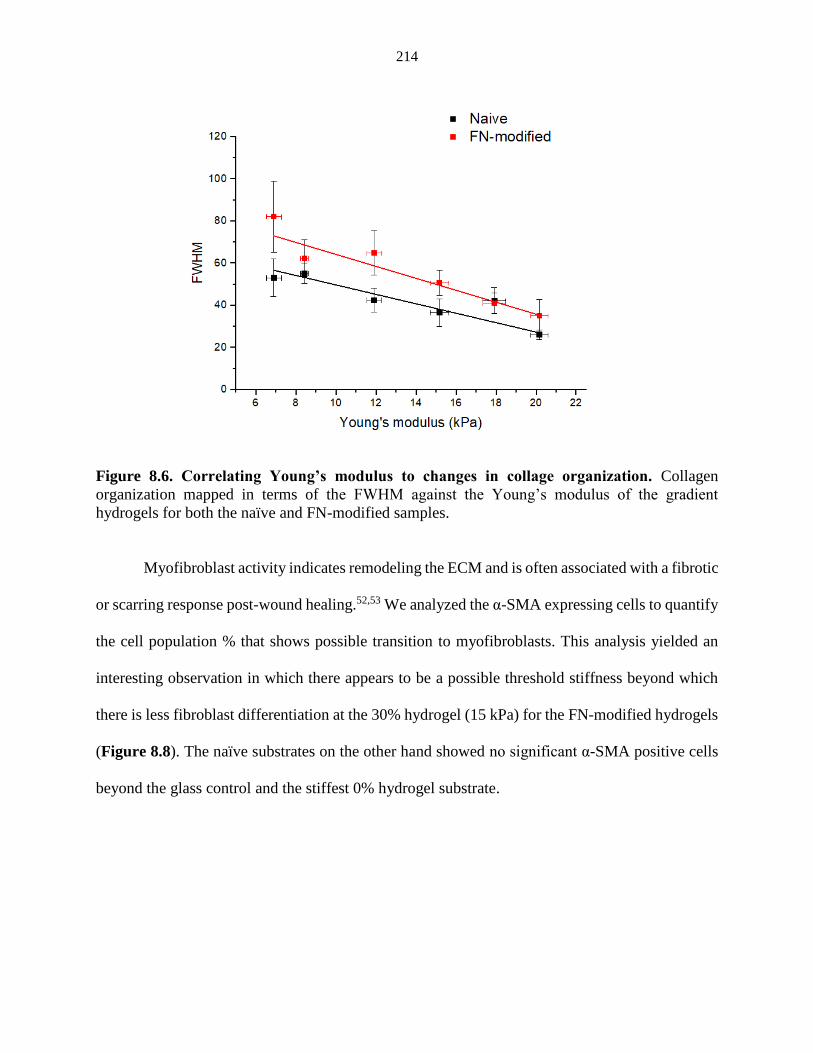
214
Figure 8.6. Correlating Young’s modulus to changes in collage organization. Collagen
organization mapped in terms of the FWHM against the Young’s modulus of the gradient
hydrogels for both the naïve and FN-modified samples.
Myofibroblast activity indicates remodeling the ECM and is often associated with a fibrotic
or scarring response post-wound healing.52,53 We analyzed the α-SMA expressing cells to quantify
the cell population % that shows possible transition to myofibroblasts. This analysis yielded an
interesting observation in which there appears to be a possible threshold stiffness beyond which
there is less fibroblast differentiation at the 30% hydrogel (15 kPa) for the FN-modified hydrogels
(Figure 8.8). The naïve substrates on the other hand showed no significant α-SMA positive cells
beyond the glass control and the stiffest 0% hydrogel substrate.
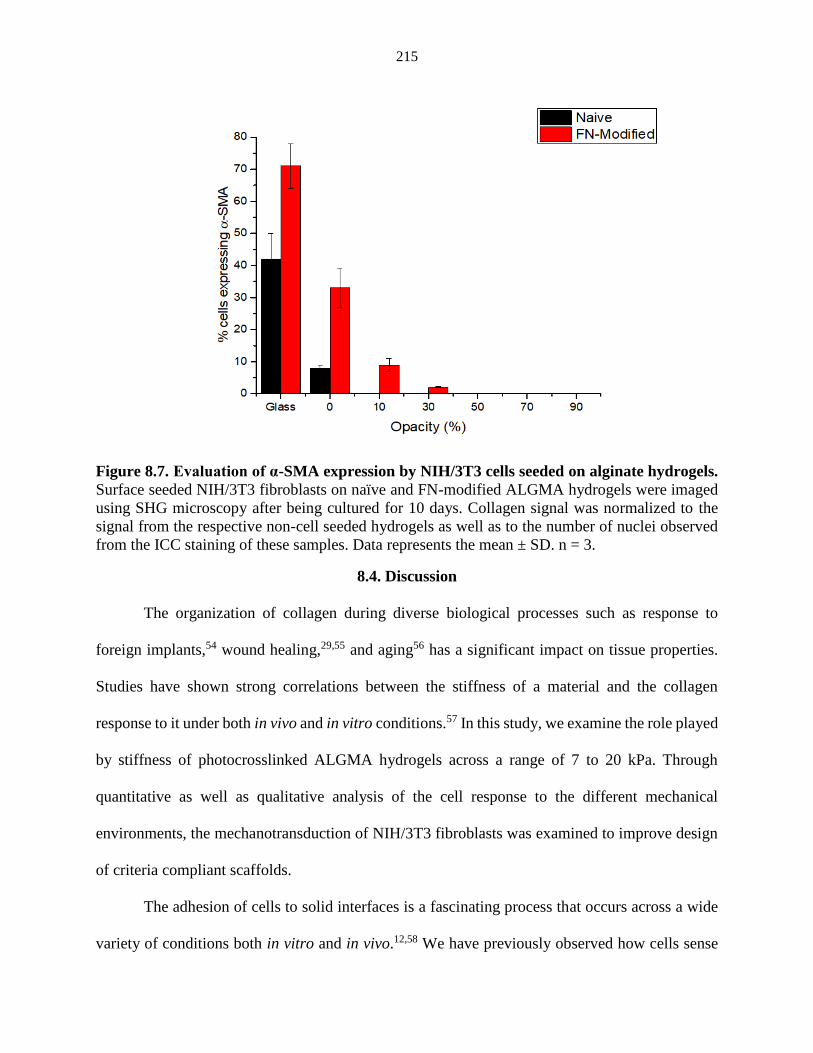
215
Figure 8.7. Evaluation of α-SMA expression by NIH/3T3 cells seeded on alginate hydrogels.
Surface seeded NIH/3T3 fibroblasts on naïve and FN-modified ALGMA hydrogels were imaged
using SHG microscopy after being cultured for 10 days. Collagen signal was normalized to the
signal from the respective non-cell seeded hydrogels as well as to the number of nuclei observed
from the ICC staining of these samples. Data represents the mean ± SD. n = 3.
8.4. Discussion
The organization of collagen during diverse biological processes such as response to
foreign implants,54 wound healing,29,55 and aging56 has a significant impact on tissue properties.
Studies have shown strong correlations between the stiffness of a material and the collagen
response to it under both in vivo and in vitro conditions.57 In this study, we examine the role played
by stiffness of photocrosslinked ALGMA hydrogels across a range of 7 to 20 kPa. Through
quantitative as well as qualitative analysis of the cell response to the different mechanical
environments, the mechanotransduction of NIH/3T3 fibroblasts was examined to improve design
of criteria compliant scaffolds.
The adhesion of cells to solid interfaces is a fascinating process that occurs across a wide
variety of conditions both in vitro and in vivo.12,58 We have previously observed how cells sense
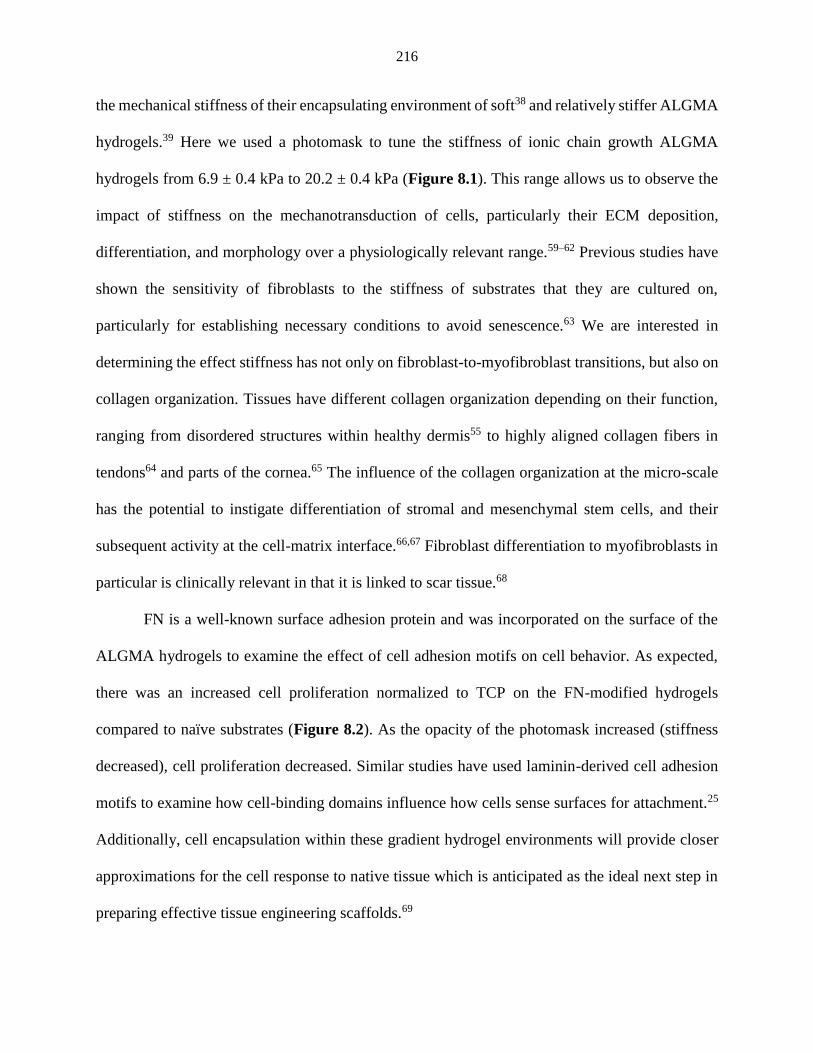
216
the mechanical stiffness of their encapsulating environment of soft38 and relatively stiffer ALGMA
hydrogels.39 Here we used a photomask to tune the stiffness of ionic chain growth ALGMA
hydrogels from 6.9 ± 0.4 kPa to 20.2 ± 0.4 kPa (Figure 8.1). This range allows us to observe the
impact of stiffness on the mechanotransduction of cells, particularly their ECM deposition,
differentiation, and morphology over a physiologically relevant range.59–62 Previous studies have
shown the sensitivity of fibroblasts to the stiffness of substrates that they are cultured on,
particularly for establishing necessary conditions to avoid senescence.63 We are interested in
determining the effect stiffness has not only on fibroblast-to-myofibroblast transitions, but also on
collagen organization. Tissues have different collagen organization depending on their function,
ranging from disordered structures within healthy dermis55 to highly aligned collagen fibers in
tendons64 and parts of the cornea.65 The influence of the collagen organization at the micro-scale
has the potential to instigate differentiation of stromal and mesenchymal stem cells, and their
subsequent activity at the cell-matrix interface.66,67 Fibroblast differentiation to myofibroblasts in
particular is clinically relevant in that it is linked to scar tissue.68
FN is a well-known surface adhesion protein and was incorporated on the surface of the
ALGMA hydrogels to examine the effect of cell adhesion motifs on cell behavior. As expected,
there was an increased cell proliferation normalized to TCP on the FN-modified hydrogels
compared to naïve substrates (Figure 8.2). As the opacity of the photomask increased (stiffness
decreased), cell proliferation decreased. Similar studies have used laminin-derived cell adhesion
motifs to examine how cell-binding domains influence how cells sense surfaces for attachment.25
Additionally, cell encapsulation within these gradient hydrogel environments will provide closer
approximations for the cell response to native tissue which is anticipated as the ideal next step in
preparing effective tissue engineering scaffolds.69
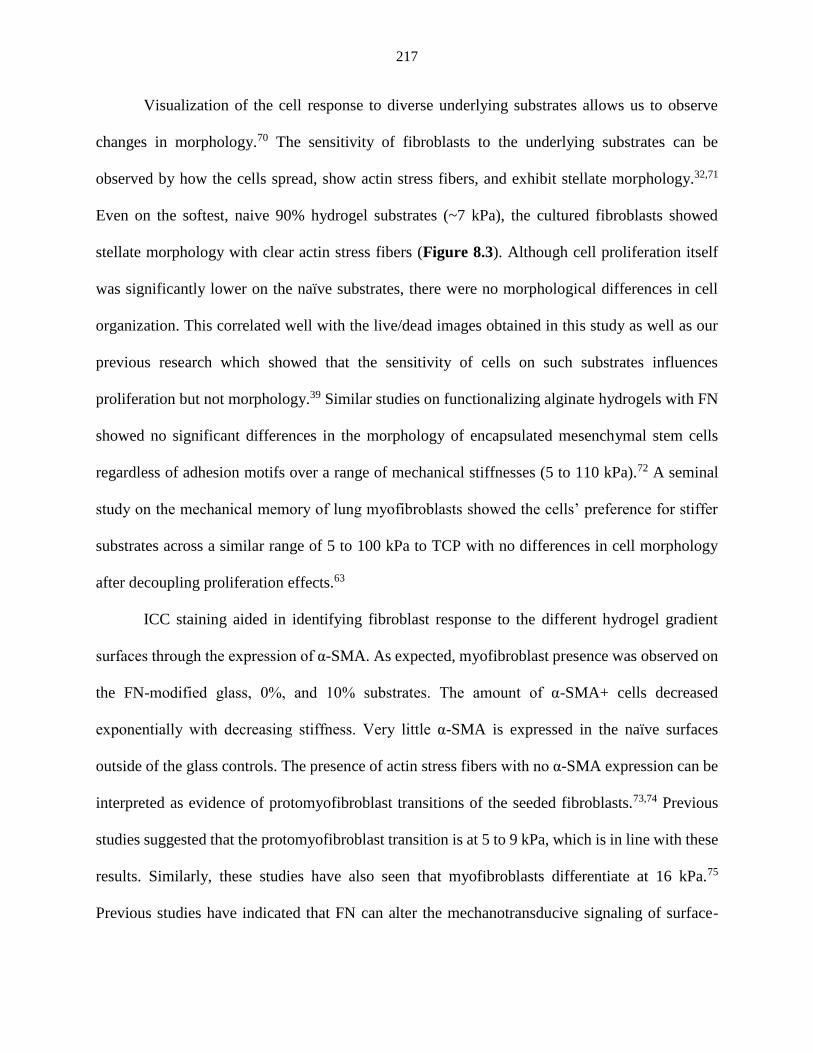
217
Visualization of the cell response to diverse underlying substrates allows us to observe
changes in morphology.70 The sensitivity of fibroblasts to the underlying substrates can be
observed by how the cells spread, show actin stress fibers, and exhibit stellate morphology.32,71
Even on the softest, naive 90% hydrogel substrates (~7 kPa), the cultured fibroblasts showed
stellate morphology with clear actin stress fibers (Figure 8.3). Although cell proliferation itself
was significantly lower on the naïve substrates, there were no morphological differences in cell
organization. This correlated well with the live/dead images obtained in this study as well as our
previous research which showed that the sensitivity of cells on such substrates influences
proliferation but not morphology.39 Similar studies on functionalizing alginate hydrogels with FN
showed no significant differences in the morphology of encapsulated mesenchymal stem cells
regardless of adhesion motifs over a range of mechanical stiffnesses (5 to 110 kPa).72 A seminal
study on the mechanical memory of lung myofibroblasts showed the cells’ preference for stiffer
substrates across a similar range of 5 to 100 kPa to TCP with no differences in cell morphology
after decoupling proliferation effects.63
ICC staining aided in identifying fibroblast response to the different hydrogel gradient
surfaces through the expression of α-SMA. As expected, myofibroblast presence was observed on
the FN-modified glass, 0%, and 10% substrates. The amount of α-SMA+ cells decreased
exponentially with decreasing stiffness. Very little α-SMA is expressed in the naïve surfaces
outside of the glass controls. The presence of actin stress fibers with no α-SMA expression can be
interpreted as evidence of protomyofibroblast transitions of the seeded fibroblasts.73,74 Previous
studies suggested that the protomyofibroblast transition is at 5 to 9 kPa, which is in line with these
results. Similarly, these studies have also seen that myofibroblasts differentiate at 16 kPa.75
Previous studies have indicated that FN can alter the mechanotransducive signaling of surface-
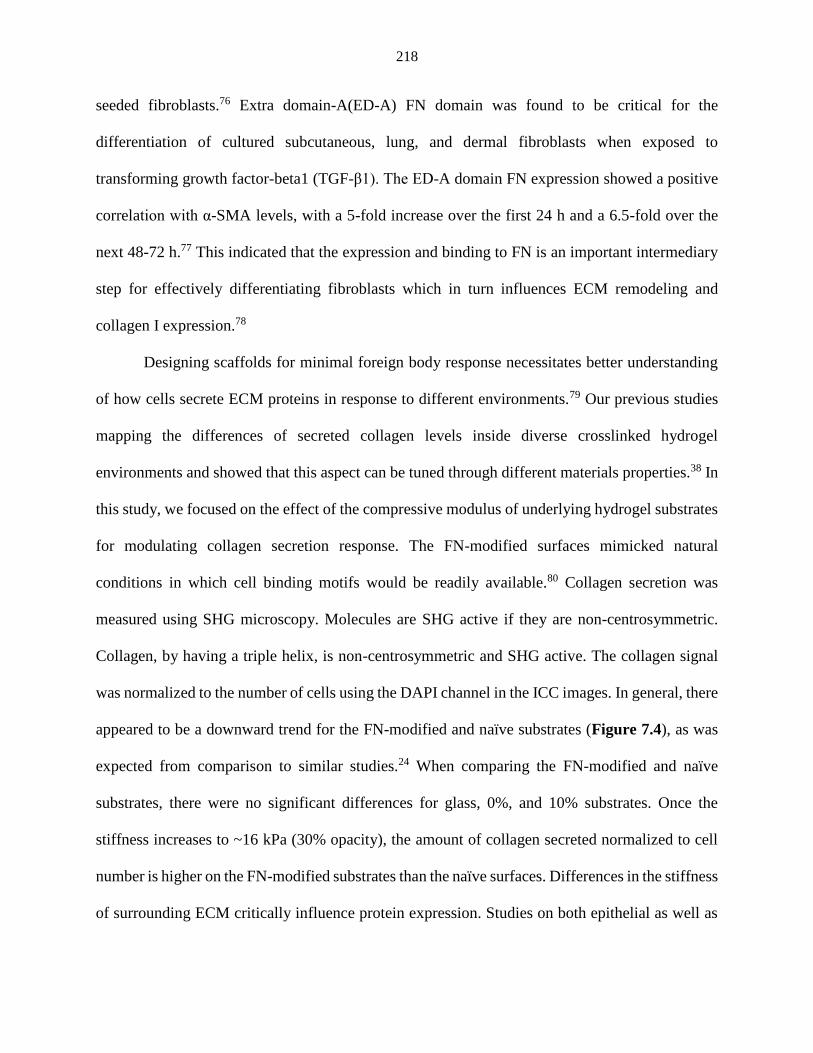
218
seeded fibroblasts.76 Extra domain-A(ED-A) FN domain was found to be critical for the
differentiation of cultured subcutaneous, lung, and dermal fibroblasts when exposed to
transforming growth factor-beta1 (TGF-β1). The ED-A domain FN expression showed a positive
correlation with α-SMA levels, with a 5-fold increase over the first 24 h and a 6.5-fold over the
next 48-72 h.77 This indicated that the expression and binding to FN is an important intermediary
step for effectively differentiating fibroblasts which in turn influences ECM remodeling and
collagen I expression.78
Designing scaffolds for minimal foreign body response necessitates better understanding
of how cells secrete ECM proteins in response to different environments.79 Our previous studies
mapping the differences of secreted collagen levels inside diverse crosslinked hydrogel
environments and showed that this aspect can be tuned through different materials properties.38 In
this study, we focused on the effect of the compressive modulus of underlying hydrogel substrates
for modulating collagen secretion response. The FN-modified surfaces mimicked natural
conditions in which cell binding motifs would be readily available.80 Collagen secretion was
measured using SHG microscopy. Molecules are SHG active if they are non-centrosymmetric.
Collagen, by having a triple helix, is non-centrosymmetric and SHG active. The collagen signal
was normalized to the number of cells using the DAPI channel in the ICC images. In general, there
appeared to be a downward trend for the FN-modified and naïve substrates (Figure 7.4), as was
expected from comparison to similar studies.24 When comparing the FN-modified and naïve
substrates, there were no significant differences for glass, 0%, and 10% substrates. Once the
stiffness increases to ~16 kPa (30% opacity), the amount of collagen secreted normalized to cell
number is higher on the FN-modified substrates than the naïve surfaces. Differences in the stiffness
of surrounding ECM critically influence protein expression. Studies on both epithelial as well as
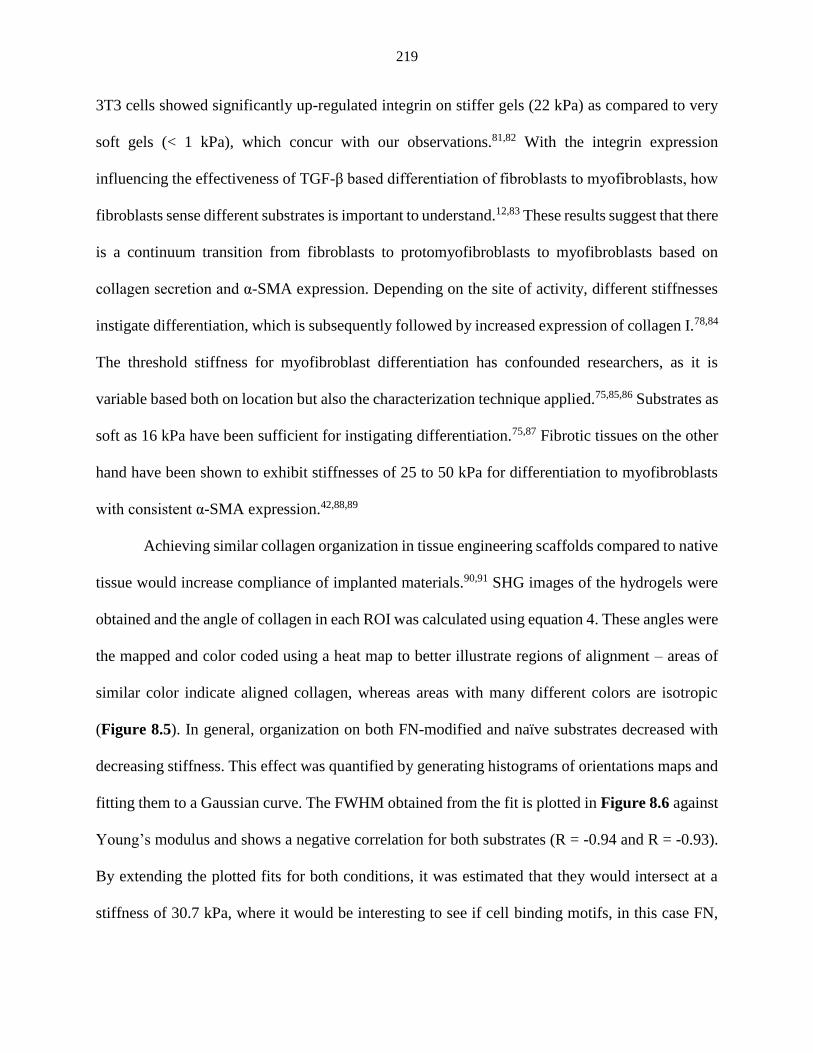
219
3T3 cells showed significantly up-regulated integrin on stiffer gels (22 kPa) as compared to very
soft gels (< 1 kPa), which concur with our observations.81,82 With the integrin expression
influencing the effectiveness of TGF-β based differentiation of fibroblasts to myofibroblasts, how
fibroblasts sense different substrates is important to understand.12,83 These results suggest that there
is a continuum transition from fibroblasts to protomyofibroblasts to myofibroblasts based on
collagen secretion and α-SMA expression. Depending on the site of activity, different stiffnesses
instigate differentiation, which is subsequently followed by increased expression of collagen I.78,84
The threshold stiffness for myofibroblast differentiation has confounded researchers, as it is
variable based both on location but also the characterization technique applied.75,85,86 Substrates as
soft as 16 kPa have been sufficient for instigating differentiation.75,87 Fibrotic tissues on the other
hand have been shown to exhibit stiffnesses of 25 to 50 kPa for differentiation to myofibroblasts
with consistent α-SMA expression.42,88,89
Achieving similar collagen organization in tissue engineering scaffolds compared to native
tissue would increase compliance of implanted materials.90,91 SHG images of the hydrogels were
obtained and the angle of collagen in each ROI was calculated using equation 4. These angles were
the mapped and color coded using a heat map to better illustrate regions of alignment – areas of
similar color indicate aligned collagen, whereas areas with many different colors are isotropic
(Figure 8.5). In general, organization on both FN-modified and naïve substrates decreased with
decreasing stiffness. This effect was quantified by generating histograms of orientations maps and
fitting them to a Gaussian curve. The FWHM obtained from the fit is plotted in Figure 8.6 against
Young’s modulus and shows a negative correlation for both substrates (R = -0.94 and R = -0.93).
By extending the plotted fits for both conditions, it was estimated that they would intersect at a
stiffness of 30.7 kPa, where it would be interesting to see if cell binding motifs, in this case FN,
220
would lose their ability to influence collagen organization at this higher stiffness. In examining
glass, which is approximately 3 GPa, the amount of collagen secreted per cell does not appear to
be influenced by FN, however, FN does influence the presence of myofibroblasts. Using these
experimental observations, we can formulate some basic design principles for achieving the
desired collagen organization for a particular application. First, relatively soft hydrogels can be
used as dermal wound dressings, which would require isotropic collagen alignment.92 Patients
suffering from burn wounds in particular show significantly ordered conformation at the surface,
which can be treated with scaffolds that instigate stochastic neo-collagen secretion to boost the
healing process.93,94 On the other hand, one of the critical differences in diseased versus healthy
lung tissue has been observed as the increased stiffness of the former.78,95 Cartilage tissue is more
aligned and would require hydrogels ~ 15 kPa based on collagen alignment, which are significantly
softer than the stiffness of cartilage (>0.5 MPa) observed in human subjects. 96–98 Collagen
organization within tissues such as the cornea is complex as it varies greatly with highly aligned
fibers observed in bundles, which on a bigger scale are a part of a dense network of connective
tissue.67,99,100 Aligned collagen has been observed in mechanically stiffer environments like bones
and tendons where relatively rigid scaffolds can be applied to obtain greater compliance of the
secreted collagen response to guide tuning of disordered collagen which get deposited upon
injury.101 The influence of such tuned hydrogel systems to elicit diverse organization of secreted
collagen (Figure 8.8) can help inform innovative tissue engineering platforms for diverse
biomedical applications.
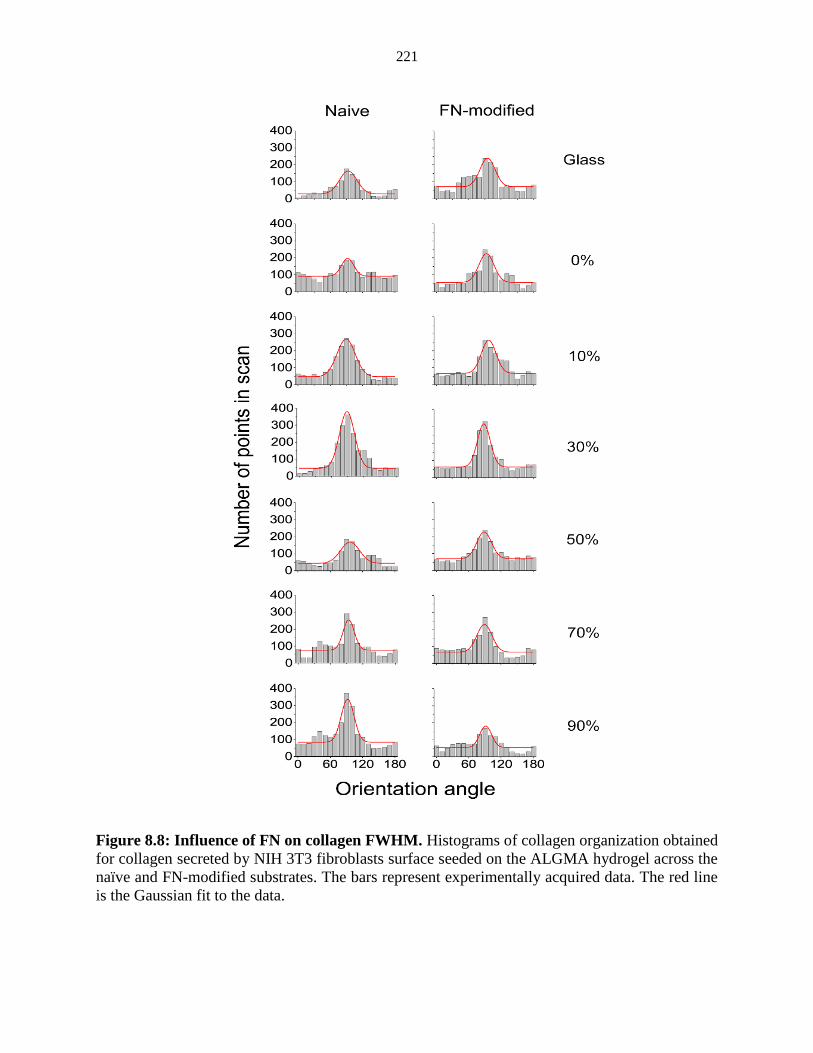
221
Figure 8.8: Influence of FN on collagen FWHM. Histograms of collagen organization obtained
for collagen secreted by NIH 3T3 fibroblasts surface seeded on the ALGMA hydrogel across the
naïve and FN-modified substrates. The bars represent experimentally acquired data. The red line
is the Gaussian fit to the data.
222
8.5. Conclusions
In this study, we fabricated ALGMA hydrogels across a range of mechanical stiffnesses (7
– 22 kPa) using photomasks to control the crosslinking density for examining the influence of
mechanical cues on cell morphology and collagen secretion. NIH/3T3 fibroblasts showed no
cytotoxic response to being seeded on these substrates. FN surface modifications increased cell
proliferation across all conditions. A clear influence of the stiffness of the hydrogel gradient
substrates on the NIH/3T3 fibroblasts was seen with a positive correlation for secreted collagen
levels, as well as cell proliferation. Modifying the surface with FN also increased myofibroblast
differentiation as well as the disorder of collagen deposited by these cells. In-depth
characterization through the ICC staining and SHG imaging provides design guidelines for
effective tissue scaffolds that can be tuned for specific natural implant environments.
Acknowledgments
This work was supported by the Roy J. Carver Charitable Trust Grant No. 13-4265.
8.6 References
1. Khademhosseini, A. & Bong, G. C. Microscale technologies for tissue engineering. 2009
IEEE/NIH Life Sci. Syst. Appl. Work. LiSSA 2009 103, 56–57 (2009).
2. Anderson, J. M. & McNally, A. K. Biocompatibility of implants: lymphocyte/macrophage
interactions. Semin. Immunopathol. 33, 221–233 (2011).
3. Peppas, N. A., Hilt, J. Z., Khademhosseini, A. & Langer, R. Hydrogels in biology and
medicine: From molecular principles to bionanotechnology. Adv. Mater. 18, 1345–1360
(2006).
4. Harrison, R. H., St-Pierre, J.-P. & Stevens, M. M. Tissue Engineering and Regenerative
Medicine: A Year in Review. Tissue Eng. Part B Rev. 20, 1–16 (2014).
5. Gailit, J. & Clark, R. A. Wound repair in the context of extracellular matrix. Curr. Opin.
Cell Biol. 6, 717–725 (1994).
223
6. Langer, R. & Peppas, N. A. Advances in Biomaterials, Drug Delivery, and
Bionanotechnology. AIChE J. 49, 2990–3006 (2003).
7. Slaughter, B. V., Khurshid, S. S., Fisher, O. Z., Khademhosseini, A. & Peppas, N. A.
Hydrogels in Regenerative Medicine. Adv. Mater. 21, 3307–3329 (2009).
8. Rosales, A. M. & Anseth, K. S. The design of reversible hydrogels to capture extracellular
matrix dynamics. Nat. Rev. Mater. 1, 1–16 (2016).
9. Kharkar, P. M., Kiick, K. L. & Kloxin, A. M. Designing degradable hydrogels for
orthogonal control of cell microenvironments. Chem. Soc. Rev. 42, 7335–7372 (2013).
10. Nicodemus, G. D. & Bryant, S. J. Cell {Encapsulation} in {Biodegradable} {Hydrogels}
for {Tissue} {Engineering} {Applications}. Tissue Eng. Part B. Rev. 14, 149–165 (2008).
11. Humphrey, J. D., Dufresne, E. R. & Schwartz, M. A. Mechanotransduction and extracellular
matrix homeostasis. Nat. Rev. Mol. Cell Biol. 15, 802–812 (2014).
12. Discher, D. E., Janmey, P. A. & Wang, Y. Tissue Cells Feel and Respond to the Stiffness
of Their Substrate. Science (80-. ). 310, 1139–1143 (2005).
13. Reinhart-king, C. A., Dembo, M. & Hammer, D. A. Cell-Cell Mechanical Communication
through Compliant Substrates. Biophys. J. 95, 6044–6051 (2008).
14. Trappmann, B. et al. Extracellular-matrix tethering regulates stem-cell fate. Nat. Mater. 11,
742–742 (2012).
15. Lee, K. Y. & Mooney, D. J. Alginate: Properties and biomedical applications. Prog. Polym.
Sci. 37, 106–126 (2012).
16. Constantinidis, I., Rask, I., Long, R. C. & Sambanis, A. Effects of alginate composition on
the metabolic, secretory, and growth characteristics of entrapped βTC3 mouse insulinoma
cells. Biomaterials 20, 2019–2027 (1999).
17. Balakrishnan, B., Mohanty, M., Umashankar, P. R. & Jayakrishnan, A. Evaluation of an in
situ forming hydrogel wound dressing based on oxidized alginate and gelatin. Biomaterials
26, 6335–6342 (2005).
18. Chou, A. I., Akintoye, S. O. & Nicoll, S. B. Photo-crosslinked alginate hydrogels support
enhanced matrix accumulation by nucleus pulposus cells in vivo. Osteoarthr. Cartil. 17,
1377–1384 (2009).
19. Sun, J. & Tan, H. Alginate-based biomaterials for regenerative medicine applications.
Materials (Basel). 6, 1285–1309 (2013).
20. Kuo, C. K. & Ma, P. X. Ionically crosslinked alginate hydrogels as scaffolds for tissue
engineering : Part 1 . Structure , gelation rate and mechanical properties. Biomaterials 22,
511–521 (2001).
224
21. Baer, A. E., Wang, J. Y., Kraus, V. B. & Setton, L. A. Collagen gene expression and
mechanical properties of intervertebral disc cell-alginate cultures. J. Orthop. Res. 19, 2–10
(2001).
22. Chou, A. I. & Nicoll, S. B. Characterization of photocrosslinked alginate hydrogels for
nucleus pulposus cell encapsulation. J. Biomed. Mater. Res. - Part A 91, 187–194 (2009).
23. Samorezov, J. E., Morlock, C. M. & Alsberg, E. Dual Ionic and Photo-Crosslinked Alginate
Hydrogels for Micropatterned Spatial Control of Material Properties and Cell Behavior.
Bioconjug. Chem. 26, 1339–1347 (2015).
24. Marin-Pareja, N. et al. Different Organization of Type I Collagen Immobilized on Silanized
and Nonsilanized Titanium Surfaces Affects Fibroblast Adhesion and Fibronectin
Secretion. ACS Appl. Mater. Interfaces 7, 20667–20677 (2015).
25. Zhu, Y. et al. Potent laminin-inspired antioxidant regenerative dressing accelerates wound
healing in diabetes. Proc. Natl. Acad. Sci. 115, 6816–6821 (2018).
26. Saeidi, N. et al. Disorganized collagen scaffold interferes with fibroblast mediated
deposition of organized extracellular matrix in vitro. Biotechnol. Bioeng. 109, 2683–2698
(2012).
27. Yang, C. et al. Spatially patterned matrix elasticity directs stem cell fate. Proc. Natl. Acad.
Sci. 113, E4439–E4445 (2016).
28. Mellati, A. et al. Microengineered 3D cell-laden thermoresponsive hydrogels for mimicking
cell morphology and orientation in cartilage tissue engineering. Biotechnol. Bioeng. 114, 1–
15 (2017).
29. Verhaegen, P. D. H. M. et al. Differences in collagen architecture between keloid,
hypertrophic scar, normotrophic scar, and normal skin: An objective histopathological
analysis. Wound Repair Regen. 17, 649–656 (2009).
30. Jikko, A., Harris, S. E., Chen, D., Mendrick, D. L. & Damsky, C. H. Collagen Integrin
Receptors Regulate Early Osteoblast Differentiation Induced by BMP-2. J. Bone Miner.
Res. 14, 1075–1083 (1999).
31. Wenzel G.I., Anvari B., Mazhar A., Pikkula B., O. J. S. . & Wenzel, Gentiana I., Bahman
Anvari, Amaan, Mazhar, Brian, Pikkula, J. S. O. Laser-induced collagen remodeling and
deposition within the basilar membrane of the mouse cochlea. J Biomed Opt 12, 021007
(2007).
32. Beningo, K. A., Dembo, M. & Wang, Y. -l. Responses of fibroblasts to anchorage of dorsal
extracellular matrix receptors. Proc. Natl. Acad. Sci. 101, 18024–18029 (2004).
33. Stuart, K. & Panitch, A. Characterization of gels composed of blends of collagen l, collagen
III, and chondroitin sulfate. Biomacromolecules 10, 25–31 (2009).
225
34. Chen, X. G., Wang, Z., Liu, W. S. & Park, H. J. The effect of carboxymethyl-chitosan on
proliferation and collagen secretion of normal and keloid skin fibroblasts. Biomaterials 23,
4609–4614 (2002).
35. Tilbury, K. & Campagnola, P. J. Applications of second-harmonic generation imaging
microscopy in ovarian and breast cancer. Perspect. Medicin. Chem. 7, 21–32 (2015).
36. Chen, X., Nadiarynkh, O., Plotnikov, S. & Campagnola, P. J. Second harmonic generation
microscopy for quantitative analysis of collagen fibrillar structure. Nat. Protoc. 7, 654–69
(2012).
37. Nadiarnykh, O., LaComb, R. B., Brewer, M. a & Campagnola, P. J. Alterations of the
extracellular matrix in ovarian cancer studied by Second Harmonic Generation imaging
microscopy. BMC Cancer 10, 94 (2010).
38. Boddupalli, A. & Bratlie, K. M. Collagen organization deposited by fibroblasts
encapsulated in pH responsive methacrylated alginate hydrogels. J. Biomed. Mater. Res.
Part A (2018). doi:10.1002/jbm.a.36482
39. Boddupalli, A. & Bratlie, K. M. Second harmonic generation microscopy of collagen
organization in tunable, environmentally responsive alginate hydrogels. Complet. Manuscr.
(2018).
40. Ji, C., Khademhosseini, A. & Dehghani, F. Enhancing cell penetration and proliferation in
chitosan hydrogels for tissue engineering applications. Biomaterials 32, 9719–29 (2011).
41. Akilbekova, D. & Bratlie, K. M. Quantitative characterization of collagen in the fibrotic
capsule surrounding implanted polymeric microparticles through second harmonic
generation imaging. PLoS One 10, 1–17 (2015).
42. Hinz, B. The myofibroblast: Paradigm for a mechanically active cell. J. Biomech. 43, 146–
155 (2010).
43. Goffin, J. M. et al. Focal adhesion size controls tension-dependent recruitment of ??-smooth
muscle actin to stress fibers. J. Cell Biol. 172, 259–268 (2006).
44. Kloxin, A. M., Kasko, A. M., Salinas, C. N. & Anseth, K. S. Photodegradable hydrogels for
dynamic tuning of physical and chemical properties. Science 324, 59–63 (2009).
45. Hao, Y., Shih, H., Muňoz, Z., Kemp, A. & Lin, C. C. Visible light cured thiol-vinyl
hydrogels with tunable degradation for 3D cell culture. Acta Biomater. 10, 104–114 (2014).
46. Keselowsky, B. G., Collard, D. M. & García, A. J. Surface chemistry modulates fibronectin
conformation and directs integrin binding and specificity to control cell adhesion. J.
Biomed. Mater. Res. Part A 66A, 247–259 (2003).
226
47. Wang, H., Haeger, S. M., Kloxin, A. M., Leinwand, L. A. & Anseth, K. S. Redirecting
valvular myofibroblasts into dormant fibroblasts through light-mediated reduction in
substrate modulus. PLoS One 7, (2012).
48. Li, Z. et al. Transforming growth factor-β and substrate stiffness regulate portal fibroblast
activation in culture. Hepatology 46, 1246–1256 (2007).
49. Kastellorizios, M., Tipnis, N. & Burgess, D. J. Foreign body reaction to subcutaneous
implants. Advances in Experimental Medicine and Biology 865, (2015).
50. Wang, J. et al. Degradation and Remodeling of Epitaxially Grown Collagen Fibrils. Cell.
Mol. Bioeng. (2018). doi:10.1007/s12195-018-0547-6
51. Bellows, C. G., Melcher, A. H. & Aubin, J. E. Contraction and organization of collagen gels
by cells cultured from periodontal ligament, gingiva and bone suggest functional differences
between cell types. J Cell Sci 50, 299–314 (1981).
52. Petrov, V. V, Fagard, R. H. & Lijnen, P. J. Stimulation of collagen production by
transforming growth factor-beta1 during differentiation of cardiac fibroblasts to
myofibroblasts. Hypertension 39, 258–63 (2002).
53. Li, B. & Wang, J. H. C. Fibroblasts and myofibroblasts in wound healing: Force generation
and measurement. J. Tissue Viability 20, 108–120 (2011).
54. Stephan, S. B. et al. Biopolymer implants enhance the efficacy of adoptive T-cell therapy.
Nat. Biotechnol. 33, 97–101 (2015).
55. Linares, H. A., Kischer, C. W., Dobrkovsky, M. & Larson, D. L. The histiotypic
organization of collagen of the hypertrophic scar in humans. J. Invest. Dermatol. 59, 323–
332 (1972).
56. Cicchi, R. et al. Scoring of collagen organization in healthy and diseased human dermis by
multiphoton microscopy. J. Biophotonics 3, 34–43 (2010).
57. Marinucci, L. et al. Biocompatibility of collagen membranes crosslinked with
glutaraldehyde or diphenylphosphoryl azide: an in vitro study. J. Biomed. Mater. Res. A 67,
504–509 (2003).
58. Stevens, M. M. & George, J. H. Exploring and Engineering the Cell Surface Interface.
Science (80-. ). 310, 1135–1138 (2005).
59. Boddupalli, A., Zhu, L. & Bratlie, K. M. Methods for Implant Acceptance and Wound
Healing: Material Selection and Implant Location Modulate Macrophage and Fibroblast
Phenotypes. Adv. Healthc. Mater. 5, (2016).
60. Young, J. L., Holle, A. W. & Spatz, J. P. Nanoscale and mechanical properties of the
physiological cell-ECM microenvironment. Exp. Cell Res. 343, 3–6 (2016).
227
61. Schrader, J. et al. Matrix stiffness modulates proliferation, chemotherapeutic response, and
dormancy in hepatocellular carcinoma cells. Hepatology 53, 1192–1205 (2011).
62. Bott, K. et al. The effect of matrix characteristics on fibroblast proliferation in 3D gels.
Biomaterials 31, 8454–8464 (2010).
63. Balestrini, J. L., Chaudhry, S., Sarrazy, V., Koehler, A. & Hinz, B. The mechanical memory
of lung myofibroblasts. Integr. Biol. 4, 410 (2012).
64. Stoller, P. C., Celliers, P. M., Reiser, K. M. & Rubenchik, A. M. Imaging collagen
orientation using polarization-modulated second harmonic generation. Multiphot. Microsc.
Biomed. Sci. II 4620, 157–165 (2002).
65. Latour, G., Gusachenko, I., Kowalczuk, L., Lamarre, I. & Schanne-Klein, M. In vivo
structural imaging of the cornea by polarization-resolved second harmonic microscopy.
Biomed. Opt. Express 3, 1 (2012).
66. Johnson, C. & Galis, Z. S. Matrix Metalloproteinase-2 and -9 Differentially Regulate
Smooth Muscle Cell Migration and Cell-Mediated Collagen Organization. Arterioscler.
Thromb. Vasc. Biol. 24, 54–60 (2004).
67. Cicchi, R. et al. From molecular structure to tissue architecture: Collagen organization
probed by SHG microscopy. J. Biophotonics 6, 129–142 (2013).
68. Sarrazy, V., Billet, F., Micallef, L., Coulomb, B. & Desmoulière, A. Mechanisms of
pathological scarring: Role of myofibroblasts and current developments. Wound Repair
Regen. 19, 10–15 (2011).
69. Weber, L. M. & Anseth, K. S. Hydrogel encapsulation environments functionalized with
extracellular matrix interactions increase islet insulin secretion. Matrix Biol. 27, 667–673
(2008).
70. Fahrenholtz, M. et al. Characterization of Dermal Fibroblasts as a Cell Source for Pediatric
Tissue Engineered Heart Valves. J. Cardiovasc. Dev. Dis. 1, 146–162 (2014).
71. Discher, D. E., Discher, D. E., Janmey, P. & Wang, Y. Tissue Cells Feel and Respond to
the Stiffness of Their Substrate. Science (80-. ). 310, 1139–1143 (2005).
72. Huebsch, N. et al. Harnessing traction-mediated manipulation of the cell/matrix interface
to control stem-cell fate. Nat. Mater. 9, 518–26 (2010).
73. Chaponnier, C. & Gabbiani, G. Tissue repair , contraction , and the myofibroblast factors
involved in myofibroblastic. Wound Repair Regen. 13, 7–12 (2005).
74. McAnulty, R. J. Fibroblasts and myofibroblasts: Their source, function and role in disease.
Int. J. Biochem. Cell Biol. 39, 666–671 (2007).
228
75. Goffin, J. M. et al. Focal adhesion size controls tension-dependent recruitment of α-smooth
muscle actin to stress fibers. J. Cell Biol. 172, 259–268 (2006).
76. Serini, G. et al. The fibronectin domain ED-A is crucial for myofibroblastic phenotype
induction by transforming growth factor-β1. J. Cell Biol. 142, 873–881 (1998).
77. Serini, G. & Gabbiani, G. Mechanisms of myofibroblast activity and phenotypic
modulation. Exp. Cell Res. 250, 273–83 (1999).
78. Zhang, K., Rekhter, M. D., Gordon, D. & Phan, S. H. Myofibroblasts and their role in lung
collagen gene expression during pulmonary fibrosis. A combined immunohistochemical
and in situ hybridization study. Am J Pathol 145, 114–125 (1994).
79. Avula, M. N., Rao, A. N., McGill, L. D., Grainger, D. W. & Solzbacher, F. Foreign body
response to subcutaneous biomaterial implants in a mast cell-deficient Kitw-Sh murine
model. Acta Biomater. 10, 1856–1863 (2014).
80. Grotendorst, G. R., Seppä, H. E., Kleinman, H. K. & Martin, G. R. Attachment of smooth
muscle cells to collagen and their migration toward platelet-derived growth factor. Proc.
Natl. Acad. Sci. U. S. A. 78, 3669–72 (1981).
81. Yeung, T. et al. Effects of substrate stiffness on cell morphology, cytoskeletal structure, and
adhesion. Cell Motil. Cytoskeleton 60, 24–34 (2005).
82. Von Der Mark, K., Park, J., Bauer, S. & Schmuki, P. Nanoscale engineering of biomimetic
surfaces: Cues from the extracellular matrix. Cell Tissue Res. 339, 131–153 (2010).
83. Wells, R. G. Tissue mechanics and fibrosis. Biochim. Biophys. Acta - Mol. Basis Dis. 1832,
884–890 (2013).
84. G. Gabbiani, M. Le Lous, A. J. Bailey, Delaunay, A., S. B. Collagen and Myofibroblasts of
Granulation Tissue A Chemical, Ultrastructural and Immunologic Study. Virchows Arch. B
Cell Path. 21, 133–145 (1976).
85. Tomasek, J. J., Gabbiani, G., Hinz, B., Chaponnier, C. & Brown, R. a. Myofibroblasts and
mechano-regulation of connective tissue remodelling. Nat. Rev. Mol. Cell Biol. 3, 349–63
(2002).
86. Hinz, B. et al. The Myofibroblast. Am. J. Pathol. 170, 1807–1816 (2007).
87. Kim, D. H. et al. Mechanosensitivity of fibroblast cell shape and movement to anisotropic
substratum topography gradients. Biomaterials 30, 5433–5444 (2009).
88. Darby, I. A., Laverdet, B., Bonté, F. & Desmoulière, A. Fibroblasts and myofibroblasts in
wound healing. Clin. Cosmet. Investig. Dermatol. 7, 301–311 (2014).
229
89. Hinz, B. Tissue stiffness, latent TGF-β1 Activation, and mechanical signal transduction:
Implications for the pathogenesis and treatment of fibrosis. Curr. Rheumatol. Rep. 11, 120–
126 (2009).
90. Ghanaati, S. et al. Evaluation of the tissue reaction to a new bilayered collagen matrix in
vivo and its translation to the clinic. Biomed. Mater. 6, (2011).
91. Battiston, K. G., Labow, R. S., Simmons, C. A. & Santerre, J. P. Immunomodulatory
polymeric scaffold enhances extracellular matrix production in cell co-cultures under
dynamic mechanical stimulation. Acta Biomater. 24, 74–86 (2015).
92. Yasui, T., Tohno, Y. & Araki, T. Determination of collagen fiber orientation in human tissue
by use of polarization measurement of molecular second-harmonic-generation light. Appl.
Opt. 43, 2861 (2004).
93. Yasui, T., Tanaka, R., Hase, E., Fukushima, S. & Araki, T. In vivo time-lapse imaging of
skin burn wound healing using second-harmonic generation microscopy. Proc. SPIE 8948,
89480B (2014).
94. Ribeiro, M. S. et al. Effects of low-intensity polarized visible laser radiation on skin burns:
a light microscopy study. J. Clin. Laser Med. Surg. 22, 59–66 (2004).
95. Liu, F. et al. Feedback amplification of fibrosis through matrix stiffening and COX-2
suppression. J. Cell Biol. 190, 693–706 (2010).
96. Herzog, W. et al. Material and functional properties of articular cartilage and patellofemoral
contact mechanics in an experimental model of osteoarthritis. J. Biomech. 31, 1137–1145
(1998).
97. Mansfield, J. C., Winlove, C. P., Moger, J. & Matcher, S. J. Collagen fiber arrangement in
normal and diseased cartilage studied by polarization sensitive nonlinear microscopy. J.
Biomed. Opt. 13, 044020 (2008).
98. Chen, T., Hilton, M. J., Brown, E. B., Zuscik, M. J. & Awad, H. A. Engineering superficial
zone features in tissue engineered cartilage. Biotechnol. Bioeng. 110, 1476–86 (2013).
99. Boote, C., Hayes, S., Abahussin, M. & Meek, K. M. Mapping collagen organization in the
human cornea: Left and right eyes are structurally distinct. Investig. Ophthalmol. Vis. Sci.
47, 901–908 (2006).
100. Tenboll, A. et al. Controlled deposition of highly oriented type I collagen mimicking In
Vivo collagen structures. Langmuir 26, 12165–12172 (2010).
101. Fung, D. T. et al. Second harmonic generation imaging and fourier transform spectral
analysis reveal damage in fatigue-loaded tendons. Ann. Biomed. Eng. 38, 1741–1751
(2010).
230
CHAPTER 9
GENERAL CONCLUSION
Over the course of this research, detailed insight into the complex nature of cell-matrix interaction
was obtained. Particularly from the perspective of tuning soft, biocompatible materials into
physiologically relevant approximations of natural tissue environments, it was possible to evaluate
cell proliferation and ECM secretion that is critical to wound healing, foreign body response and
synthesis of bioactive scaffolds. Methacrylated alginate hydrogels were observed to swell
significantly more under basic pH conditions, and demonstrate a range of viable crosslinking
mechanisms, and thereby considered appropriate for responsive tissue engineering scaffolds. The
collaborative studies with 3M provided a wide variety of wound healing tests that contributed to
understanding the complexity of wound healing processes, particularly those relevant to reduction
of scarring responses. Decoupling the influence of covalent crosslinking chemistry from the cell-
matrix interactions, provided insight into fibroblast differentiation and collagen fiber organization
that will inform future studies on making extracellular matrices more compliant to the natural
microenvironments. The overall goal of these studies on cell-laden hydrogels, animal tissue
samples was achieved on the basis of the insight that has been obtained on the significant role
played by collagen organization that needs to be considered for diverse biomaterial scaffolds.
Copyright © 2022 FDOKUMEN