Assessment of the immunoprotective character of β-cell laden ...
27
University of Twente Assessment of the immunoprotective character of β-cell laden PEG-TA microgels over time Thesis to conclude the bachelor assignment of Max Visser Committee chair: dr. J.C.H. Leijten Daily supervisor: dr. N.M. Ara´ ujo da Cunha Gomes External member: dr. R. Bansal Authored by Max Visser Executed at Developmental Bioengineering University of Twente June 23, 2021 1
-
Upload
khangminh22 -
Category
Documents
-
view
0 -
download
0
Transcript of Assessment of the immunoprotective character of β-cell laden ...
University of Twente
Assessment of the immunoprotective characterof β-cell laden PEG-TA microgels over time
Thesis to conclude the bachelor assignment of Max Visser
Committee chair: dr. J.C.H. LeijtenDaily supervisor: dr. N.M. Araujo da Cunha GomesExternal member: dr. R. Bansal
Authored by Max VisserExecuted at Developmental Bioengineering
University of TwenteJune 23, 2021
1

CONTENTS
Contents
Summary 4
Samenvatting 5
Acknowledgments 6
1 Introduction 71.1 Diabetes . . . . . . . . . . . . . . . . . . . . . . . . . . . . . . . . . . . . . . . . . . . . 71.2 Treatment options . . . . . . . . . . . . . . . . . . . . . . . . . . . . . . . . . . . . . . 71.3 Cell encapsulation . . . . . . . . . . . . . . . . . . . . . . . . . . . . . . . . . . . . . . 81.4 Microgel production . . . . . . . . . . . . . . . . . . . . . . . . . . . . . . . . . . . . . 91.5 Immune response . . . . . . . . . . . . . . . . . . . . . . . . . . . . . . . . . . . . . . . 10
2 Aim and methodology 112.1 Research objectives . . . . . . . . . . . . . . . . . . . . . . . . . . . . . . . . . . . . . . 112.2 MIN6 Cells . . . . . . . . . . . . . . . . . . . . . . . . . . . . . . . . . . . . . . . . . . 112.3 Experiment outline . . . . . . . . . . . . . . . . . . . . . . . . . . . . . . . . . . . . . . 11
3 Methods 123.1 MIN6 cell culturing . . . . . . . . . . . . . . . . . . . . . . . . . . . . . . . . . . . . . . 123.2 Microgel fabrication . . . . . . . . . . . . . . . . . . . . . . . . . . . . . . . . . . . . . 123.3 Cell encapsulation . . . . . . . . . . . . . . . . . . . . . . . . . . . . . . . . . . . . . . 143.4 Stainings . . . . . . . . . . . . . . . . . . . . . . . . . . . . . . . . . . . . . . . . . . . 14
3.4.1 Fluorescent image characterization . . . . . . . . . . . . . . . . . . . . . . . . . 15
4 Results 174.1 Microgel fabrication . . . . . . . . . . . . . . . . . . . . . . . . . . . . . . . . . . . . . 174.2 Viability assessment . . . . . . . . . . . . . . . . . . . . . . . . . . . . . . . . . . . . . 184.3 Immunofluorescence . . . . . . . . . . . . . . . . . . . . . . . . . . . . . . . . . . . . . 204.4 Fluorescent IgG antibodies . . . . . . . . . . . . . . . . . . . . . . . . . . . . . . . . . 214.5 Actin staining . . . . . . . . . . . . . . . . . . . . . . . . . . . . . . . . . . . . . . . . . 22
5 Discussion 235.1 Aim . . . . . . . . . . . . . . . . . . . . . . . . . . . . . . . . . . . . . . . . . . . . . . 235.2 Immunoprotective character . . . . . . . . . . . . . . . . . . . . . . . . . . . . . . . . . 235.3 Therapeutic potential . . . . . . . . . . . . . . . . . . . . . . . . . . . . . . . . . . . . 235.4 Future outlook . . . . . . . . . . . . . . . . . . . . . . . . . . . . . . . . . . . . . . . . 24
6 Conclusion 24
Bibliography 25
Supplementary data 27
3
CONTENTS
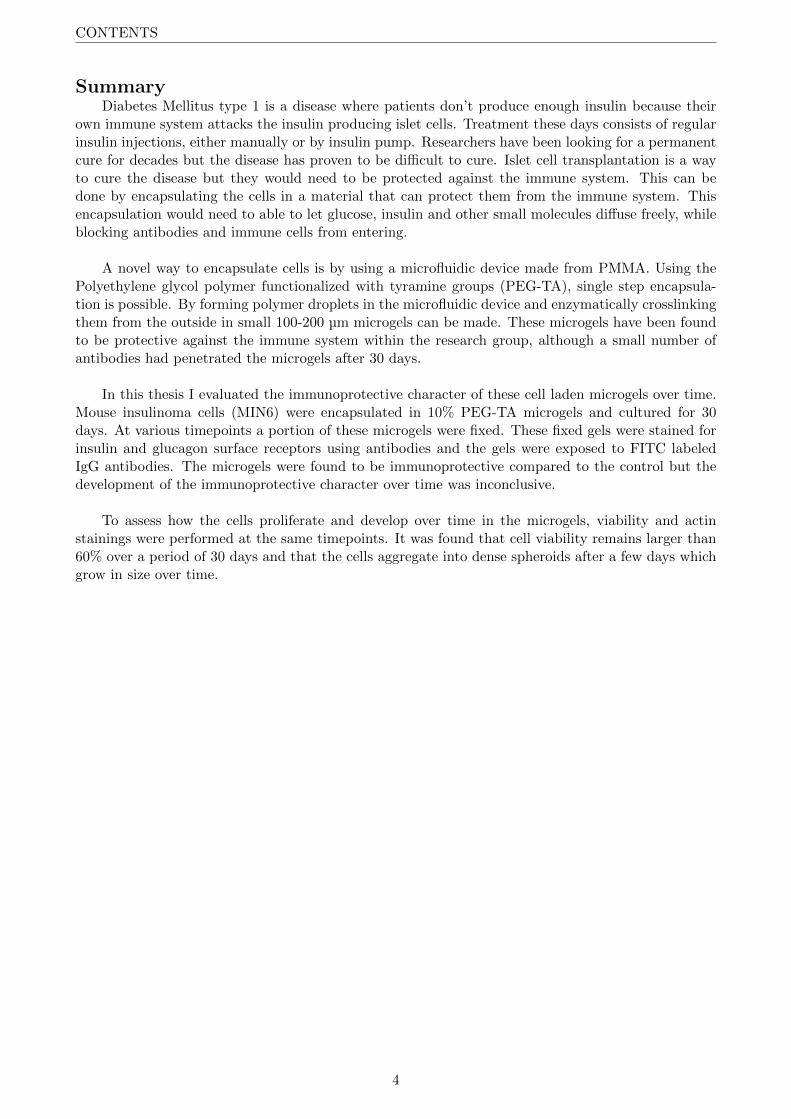
SummaryDiabetes Mellitus type 1 is a disease where patients don’t produce enough insulin because their
own immune system attacks the insulin producing islet cells. Treatment these days consists of regularinsulin injections, either manually or by insulin pump. Researchers have been looking for a permanentcure for decades but the disease has proven to be difficult to cure. Islet cell transplantation is a wayto cure the disease but they would need to be protected against the immune system. This can bedone by encapsulating the cells in a material that can protect them from the immune system. Thisencapsulation would need to able to let glucose, insulin and other small molecules diffuse freely, whileblocking antibodies and immune cells from entering.
A novel way to encapsulate cells is by using a microfluidic device made from PMMA. Using thePolyethylene glycol polymer functionalized with tyramine groups (PEG-TA), single step encapsula-tion is possible. By forming polymer droplets in the microfluidic device and enzymatically crosslinkingthem from the outside in small 100-200 µm microgels can be made. These microgels have been foundto be protective against the immune system within the research group, although a small number ofantibodies had penetrated the microgels after 30 days.
In this thesis I evaluated the immunoprotective character of these cell laden microgels over time.Mouse insulinoma cells (MIN6) were encapsulated in 10% PEG-TA microgels and cultured for 30days. At various timepoints a portion of these microgels were fixed. These fixed gels were stained forinsulin and glucagon surface receptors using antibodies and the gels were exposed to FITC labeledIgG antibodies. The microgels were found to be immunoprotective compared to the control but thedevelopment of the immunoprotective character over time was inconclusive.
To assess how the cells proliferate and develop over time in the microgels, viability and actinstainings were performed at the same timepoints. It was found that cell viability remains larger than60% over a period of 30 days and that the cells aggregate into dense spheroids after a few days whichgrow in size over time.
4
CONTENTS
SamenvattingDiabetes Mellitus type 1 is een ziekte waarbij patienten niet genoeg insuline produceren omdat
hun eigen immuunsysteem de insuline producerende β-cellen aanvalt. De behandeling bestaat tegenwo-ordig uit regelmatige insuline injecties, hetzij met de hand, hetzij met een insulinepomp. Onderzoekerszijn al tientallen jaren op zoek naar een permanent geneesmiddel, maar de ziekte blijkt moeilijk tegenezen. β-celltransplantatie is een manier om de ziekte te genezen, maar deze zouden beschermdmoeten worden tegen het immuunsysteem. Dit kan door de cellen te encapsuleren in een materiaaldat ze kan beschermen tegen het immuunsysteem. Deze encapsulering zou glucose, insuline en anderekleine moleculen vrij moeten laten diffunderen, terwijl antilichamen en immuuncellen worden geblok-keerd.
Een nieuwe manier om cellen te encapsuleren is door gebruik te maken van een microfluidischechip gemaakt van PMMA. Met behulp van het polyethyleenglycolpolymeer, gefunctionaliseerd mettyraminegroepen (PEG-TA) is inkapseling in een stap mogelijk. Door polymeerdruppeltjes in de chipte vormen en ze enzymatisch van buiten naar binnen te crosslinken kunnen microgels van 100-200 µmgemaakt worden. Deze microgels bleken binnen de onderzoeksgroep beschermend te zijn tegen hetimmuunsysteem, hoewel er na 30 dagen enkele antilichamen in de microgels waren binnengedrongen.
In deze thesis heb ik het immunoprotectieve karakter van deze celbeladen microgels in de loop vande tijd geevalueerd. Muis insulinoma cellen (MIN6) werden geencapsuleerd in 10% PEG-TA-microgelsen gedurende 30 dagen verzorgd. Op verschillende tijdstippen werd een deel van deze microgels gefix-eerd. Deze gefixeerde gels werden gekleurd op insuline- en glucagon-celmembraanreceptors met behulpvan antilichamen en de gels werden blootgesteld aan FITC-gelabelde IgG-antilichamen. De microgelsbleken immuunbeschermend te zijn in vergelijking met de controle, maar over de ontwikkeling van hetimmuunbeschermende karakter in de tijd kon geen conclusie getrokken worden.
Om te beoordelen hoe de cellen zich in de loop van de tijd in de microgels prolifereren en on-twikkelen, werden er levensvatbaarheid en actinekleuringen op dezelfde tijdstippen uitgevoerd. Erwerd vastgesteld dat de levensvatbaarheid van cellen gedurende een periode van 30 dagen groter blijftdan 60% en dat de cellen na een paar dagen aggregeren tot dichte spheroıden die in de loop van detijd groter worden.
5

CONTENTS
AcknowledgementsFirst of all I want to express my greatest gratitude to dr. Nuno Araujo da Cunha Gomes for his
daily supervision and continual support. His knowledge, experience, helpful attitude, feedback andabove all enthusiasm were of great value to me. Despite being his first bachelor student he has donean amazing job. I would also like to thank dr. Jeroen Leijten and dr. Ruchi Bansal for their timeand constructive feedback as part of the examination committee. I would also like to thank BarbaraZoetebier-Liszka for producing the PEG-TA and Bas van Loo for the lending of any microfluidic ma-terials.
Also I’d like to thank ing. Irene Konings and dr. Jacqueline Plass for making sure we could workon the labs despite all the corona measures and for always being there for any questions. Finally I’dlike to thank the DBE group and everyone in it for the advice, guidance and the general positive vibe.I have really enjoyed working there for 10 weeks.
6
1 INTRODUCTION
1 Introduction
1.1 Diabetes
Diabetes Mellitus type 1 is a very prevalent disease in the world, especially in western countries.The prevalence is almost one in 1700 people [1] and is growing worldwide. It is an auto-immunedisease, meaning the immune system attacks and kills insulin producing β-cells in the pancreas[2][3].The β-cells in the pancreas are the only cells in the body that can produce insulin. Insulin, togetherwith its antagonist glucagon, is used by the body to regulate the blood sugar level[4]. The releaseof insulin causes a decrease in blood sugar level as cells either take up or convert glucose for storagefrom the blood stream[5]. The release of glucagon causes an increase in blood sugar level as muscleand liver cells release stored glucose back into blood stream. A shortage of insulin can thus causehyperglycaemia(too high blood sugar level)[6]. Chronic hyperglycaemia can eventually lead to lifethreatening vascular diseases and all sorts of problems in the kidneys, brain and eyes.
The exact cause is not known yet, but certain genes make a person more susceptible for thedisease. Genetics alone, however, cannot explain the disease’s prevalence and certain environmentalfactors might also cause the autoimmune reaction. Factors such as diet and viral infections duringyouth might play a large role in the development of the disease[3].
The exact immune reaction is also not known, but it is suspected both the innate and the adap-tive immune system play a role in the reaction. Many pathways are involved and not one part of theimmune system is solely responsible for the disease. It seems especially killer t-cells of the adaptiveimmune system and autoantibodies for certain components of islet cells are the largest contributorsto islet cell death[3].
1.2 Treatment options
Insulin therapyOne way or another the pancreas doesn’t produce enough insulin. The pancreas might still producesome insulin, which is useful for the prevention of other associated problems such as retinopathy[2], butnot enough to regulate the blood sugar level properly. These days the most common treatment[2][7]of the disease is the injection of exogenous insulin to the body to regulate blood sugar levels. This isusually done manually, but these days devices such as insulin pumps and continuous glucose monitorsare slowly becoming the norm[2]. This helps patients regulate their blood sugar level more properly,but not perfectly and it does not provide permanent a cure for the disease.
Pancreas transplantationThe search for that permanent cure has been ongoing for decades and pancreas transplantation pro-vides the way of (temporarily) curing diabetes type 1[8]. This method still has some major flaws;however, the donor pool is very small, it requires major surgery and even then, only 80% of the trans-planted patients achieve a 3-year survival rate[8]. You also still face the same problems which causedthe disease in the first place since the immune system will continue to attack the transplanted pan-creas, so very heavy immunosuppressive therapy is needed. Despite its potential benefits researchershave thus been looking at different methods of curing the disease.
Cell transplantationThe mass of cells in the pancreas that actually produce insulin is very low (only 2%) and scientists havebeen looking at the transplantation of islet cells or other insulin producing cells as an alternative[8].In 2000 a breakthrough protocol[2] in islet cell transplantation was found but unfortunately the ini-tially positive results deteriorated after 5 years to the point where only 10% remained independentfrom external insulin. Currently, with advances made in isolation techniques and immunosuppressivetherapy, islet cell transplantation provides the best approach for the cure for diabetes type 1[8] sinceit requires significantly less invasive surgery than a pancreas transplantation. It is plagued by someof the same drawbacks of pancreas transplantation; only 20% of patients remain insulin dependentafter 5 years, islet cell extraction from pancreases is very low and the donor pool is still very small[8].Patients also still need to take heavy immunosuppressive medicine.
7

1 INTRODUCTION
1.3 Cell encapsulation
A way to mitigate some of these drawbacks is to encapsulate the transplanted cells in a protectivehydrogel network with a biocompatible character[8]. Encapsulation also allows the transplantation ofallogeneic or even xenogeneic cells. In the future human stem cells or pig islet cells might be used fortransplantation, thereby solving the limited donor problem.
Such hydrogels would need to be able to allow the diffusion of oxygen, glucose, insulin, nutrientsand waste products, while also protecting its contents from the immune system by repelling antibod-ies and immune cells (see figure 1). Microencapsulation of cells has a few distinct advantages anddisadvantages[8]: Its size allows the ready diffusion of particles and due to the number of microgelspresent a transplantation is not immediately compromised if one of the gels breaks or is removed bythe immune system.
Figure 1: Properties of cell encapsulation
A major disadvantage of microgels is the limited number of biomaterials that is sufficiently pro-tective against the immune system and suitable for encapsulation. Alginate is currently the mostused polymer for cell encapsulation purposes[9]. It has a good track record on biocompatibility andbiodegradability. The material[10], is derived from natural sources (usually algae) and is crosslinkedvia ionic reactions. The pores of alginate gels are too large to provide immunoprotection[10] (pro-tecting against the effect of an antigen) so researchers usually coat these gels with other syntheticpolymers. Since alginate is derived from natural sources the gels also need to be purified extensivelybefore transplantation[9][10], otherwise specific molecules such as proteins or toxins can elicit a strongimmune response.
For these reasons researchers have been looking for another suitable material for encapsulation.One of these is the synthetic polymer polyethylene glycol (PEG)[11], which is already being used asa coating for alginate microgels[10]. It is a biocompatible, low protein fouling and inert material. Itdoesn’t degrade very fast and has mechanical properties closely resembling soft tissue. Due to its highhydrophilicity, it is very hydrated and therefore allows easy diffusion. Finally, it’s synthetic natureallows for easier production and more consistent batches compared to natural polymers.
The host immune response remains, even with the right biomaterial, a difficult challenge to over-come and will be discussed in more detail in subsection 1.5.
8
1 INTRODUCTION
Another current disadvantage of encapsulation is the suboptimal production of the microgels fortherapeutical purposes. One needs a large number of cell laden microgels to achieve any effect onthe body’s metabolism. Batches are also usually polydisperse, meaning it is very hard to consistentlyget a single size of microgel. Microgel production is also usually associated with harsh solvents andUV/ionic based crosslinking reactions which can damage cells.
A new method used by van Loo et al.[12] uses a microfluidic device to produce microgels. Hewas able to encapsulate relatively high number of cells in monodisperse microgels based on single stepenzymatic crosslinking, thereby eliminating many of the drawbacks mentioned. I am using a similarsingle step encapsulation method using the 8-arm PEG polymer, functionalized with tyramine groups(PEG-TA).
1.4 Microgel production
To create microgels using the microfluidic method a precursor polymer solution with horseradish per-oxidase (HRP) is flowed together with an oil through the microfluidic device. The two fluids areimmiscible and the polymer therefore breaks up in the oil and forms small droplets of about 100-200µm. The workings of microfluidic device will be discussed in detail in the methods section. Thesedroplets are captured by an exchangeable silica nozzle which allows for easy replacement of the nozzlewithout replacing the entire chip. These hydrophobic nozzles are handcrafted by a design of TomKamperman[13]. The droplets are then led through a hydrogen peroxide (H2O2) bath. The HRP en-zyme mediates the coupling of the phenol groups of the tyramine groups[12][14]. Since H2O2 diffusesinwards from the bath, the crosslinking happens from the outside in, thus leaving a hollow core. Byvarying the H2O2 concentration, residence time in the bath and the concentration of the PEG-TAdifferent types of microgels can be made. This can vary between incomplete crosslinking to soft coremicrogels[12](see figure 2). By varying the flow speed ratio of the polymer and oil, differently sizedmicrogels can be made.
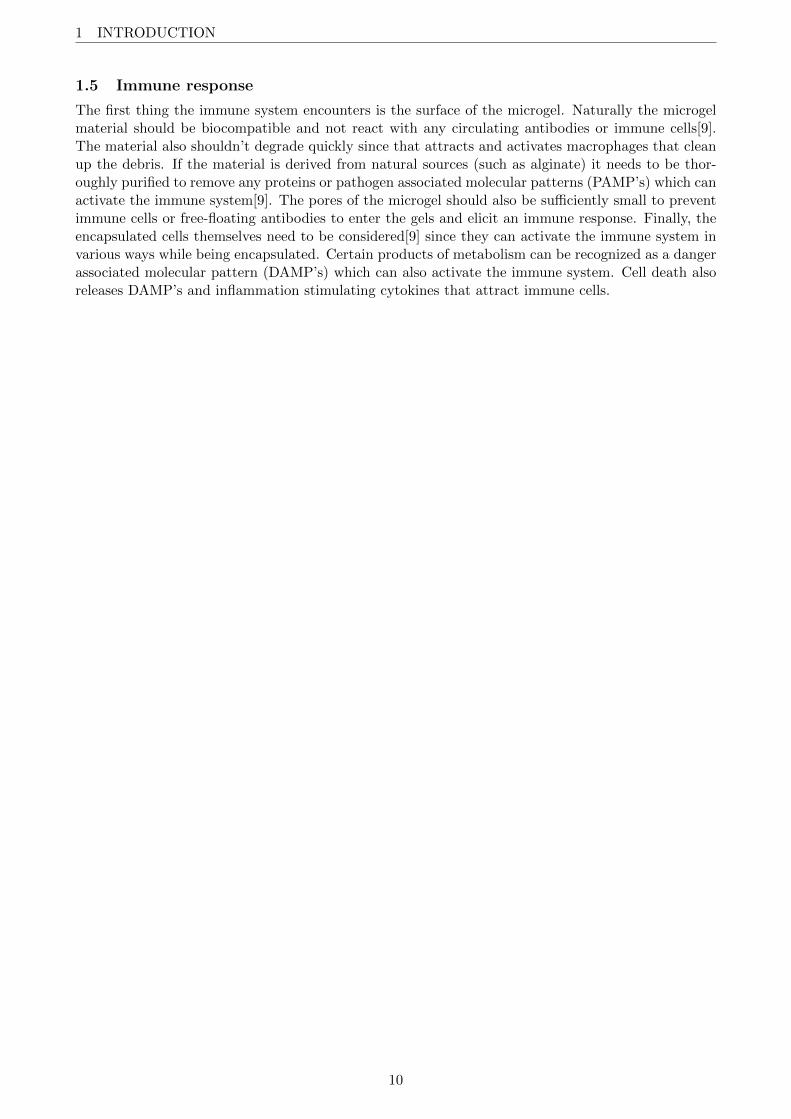
Actual cell encapsulation can be done by mixing the cells with the precursor polymer solution[12].Due to the outside in crosslinking the cells become encapsulated in a polymer microgel. The H2O2diffuses inwards from the outside and is consumed in the process of crosslinking so the cells are notexposed to toxic concentrations[12]. Most cells reside in the middle of the microgel, but some can beentrapped in the crosslinked polymer which can lead to earlier cell death or a compromised microgel.It is also important that the microgel shell is not too thick since this would impede the diffusion ofnutrients and waste products. Long term cell culture is possible with encapsulated cells[12]. Cellsusually aggregate into dense spheroids after 24 hours and have been found to be remain viable afterperiods of 28 days.
(a) (b)
Figure 2: Microgels stained by Ethidium Homodimer-1. (a) shows an example of crosslinkedhollow core microgels. (b) shows an example of broken microgels which is the result of incompletecrosslinking
9
1 INTRODUCTION
1.5 Immune response
The first thing the immune system encounters is the surface of the microgel. Naturally the microgelmaterial should be biocompatible and not react with any circulating antibodies or immune cells[9].The material also shouldn’t degrade quickly since that attracts and activates macrophages that cleanup the debris. If the material is derived from natural sources (such as alginate) it needs to be thor-oughly purified to remove any proteins or pathogen associated molecular patterns (PAMP’s) which canactivate the immune system[9]. The pores of the microgel should also be sufficiently small to preventimmune cells or free-floating antibodies to enter the gels and elicit an immune response. Finally, theencapsulated cells themselves need to be considered[9] since they can activate the immune system invarious ways while being encapsulated. Certain products of metabolism can be recognized as a dangerassociated molecular pattern (DAMP’s) which can also activate the immune system. Cell death alsoreleases DAMP’s and inflammation stimulating cytokines that attract immune cells.
10
2 AIM AND METHODOLOGY
2 Aim and methodology2.1 Research objectives
Following the work of my supervisor, dr. N.M. Araujo da Cunha Gomes, I have tested the immuno-protective character of cell laden PEG-TA microgels over time. He found that some antibodies wereable to penetrate the microgels after 30 days. This was a snapshot in time, however, so I was taskedto assess this antibody penetration over a period of 30 days. To do this I have encapsulated cells in a10% PEG-TA microgel for the assessment. Encapsulated cells in a 2.5% PEG-TA microgel providedthe control since these microgels are experimentally tested to not be immunoprotective.
We hypothesized that when the cell aggregates inside the microgel become sufficiently large theymight push against the microgel, stretching and enlarging it. This stretching might also enlarge poresin the microgel shell enough to allow antibodies to enter the microgels. Using fluorescent IgG antibod-ies and immunofluorescence I tried to quantify this penetration over time. I have also experimentedwith the production of the microgels and have performed a live/dead and actin staining on the encap-sulated cells at various timepoints.
2.2 MIN6 Cells
To perform these experiments a suitable cell type is needed. The eventual goal is to transplant thesemicrogels with glucose responsive insulin producing cells, such as islet cells, so it is useful to loadthe microgels with such cells during research. An alternative is to use stem cells differentiated toislet cells. For the purpose of research about the encapsulation material, however, both are a verycostly method. Another alternative is the MIN6B1 cell line. This is an established insulinoma betacell line derived from a transgenic mouse[15]. According to Ishihara et al.[15] This cell line closelyresembles the glucose responsiveness of human islet cells and is much more available which make theman attractive choice for proof of principle research. Because of these reasons I will be using the MIN6cell line. They have a very distinct morphology and have the tendency to grow on top of each otherand readily form aggregates. This means that confluency is usually higher than it looks to be undera microscope and the aggregate formation needs to be considered during encapsulation since such cellclumps can clog the fluid lines of the microfluidic device mentioned above.
2.3 Experiment outline
Microgels and encapsulated cells can be characterized in a large variety of ways. I have visualized themicrogels by staining the tyramine groups of the microgels with Ethidium Homodimer-1 (EthD-1).The cells were characterized with a live/dead staining, immunofluorescence staining, actin stainingand incubation with fluorescent FITC labelled IgG antibodies.
The microgels themselves can be see clearly under a phase-contrast microscope but can also beseen under a fluorescent microscope using EthD-1 which stains the tyramine groups of PEG-TA[12][14].This can then be seen as a red fluorescent signal. This method showed the outline of the crosslinkedshell much more clearly than the image under a phase-contrast microscope could.
The live/dead staining, along with the actin staining, was done to show how the cells proliferateand develop at specific intervals over time. The used cells have the tendency to aggregate over timeso this should be visible with these stainings.
Beta cells have insulin surface receptors[16] which can be visualized with immunofluorescence(IF). The used MIN6 cells have also been experimentally tested to have glucagon surface receptors.The technique of IF uses specific antibodies to bind to the desired target to be stained. Fluorescentsecondary antibodies then attach to these primary antibodies which then show a signal under afluorescent microscope. Another way to test antibody diffusion is to expose the gels to non-specificfluorescent labelled IgG antibodies. Since my aim was to prove the immunoprotective character of themicrogels, I have performed immunofluorescence staining for insulin and glucagon surface receptorsand exposed the gels to FITC labelled IgG antibody to prove the antibody diffusion inhibition to thecells in the core of the microgels.
11
3 METHODS
3 Methods
3.1 MIN6 cell culturing
MIN6B1 cells were cultured in standard culture medium containing DMEM (Gibco), 10% FBS and1% Penicillin-streptomycin (P/S). Betamercaptoethanol(Gibco) was added to the culture to a totalmolarity of 71mM whenever the medium was changed. Whenever confluency was reached (about70-80%) the cells were subcultured. The medium was removed and the cells were washed with 1xPBS(Gibco). The PBS was removed and cells were trypsinized with 0,25% trypsin-EDTA(Gibco) andincubated for 3 min to detach the cells(37◦C , 5% CO2). The trypsin was inactivated by culturemedium with FBS and this was centrifuged at 300g for 5 minutes. The supernatant was removed andthe cells were resuspended in fresh culture medium. Cells were counted if necessary and 1.5 millioncells were seeded on a new T175 flask. The cells were kept in an incubator (37◦C , 5% CO2). Themedium was changed every 2-3 days.
3.2 Microgel fabrication
Stock solutionssolid 8-arm PEG-TA 20 KDa polymer batches were made by dr. B. Zoetebier-Liszka. Solid PEG-TAwas dissolved in PBS for a final concentration of 10% PEG-TA. HRP(263 U/mg, Sigma Aldrich) wasdissolved in this precursor polymer mixture for a final concentration of 80U/ml. The same was doneto make a 2.5% PEG-TA solution, also with an HRP final concentration of 80U/ml. A 3% SPAN80 so-lution was made by dissolving SPAN80(Sigma Aldrich) in hexadecane oil(99%, Acros Organics) whichwas sterilized by passing through a 0.2 µm filter. SPAN80 is an emulsifier which helps to stabilize theformed polymer droplets in the oil phase.
Nozzle fabricationThe nozzle consists of a silica string with an inner diameter(I.D) of 200µm and outer diameter (O.D) of350µm (Polymicro Technologies). Pieces of about 4cm were cleaned in a plasma cleaner (FemtoScienceCUTE) and made hydrophobic by filling with a water repellent (AQUAPEL Glass Treatment). Thenozzles were blown dry with N2. The nozzle was inserted into the end of silicone tubing (I.D. 0.30mm, O.D. 0.64 mm, Helix Medical) and a glass capillary (I.D. 0.70 mm, O.D. 0.87 mm, VitroCom)was slid over the connection to seal it. A drop of glue was used to secure this glass capillary and thesilica nozzle to the silicone tubing.
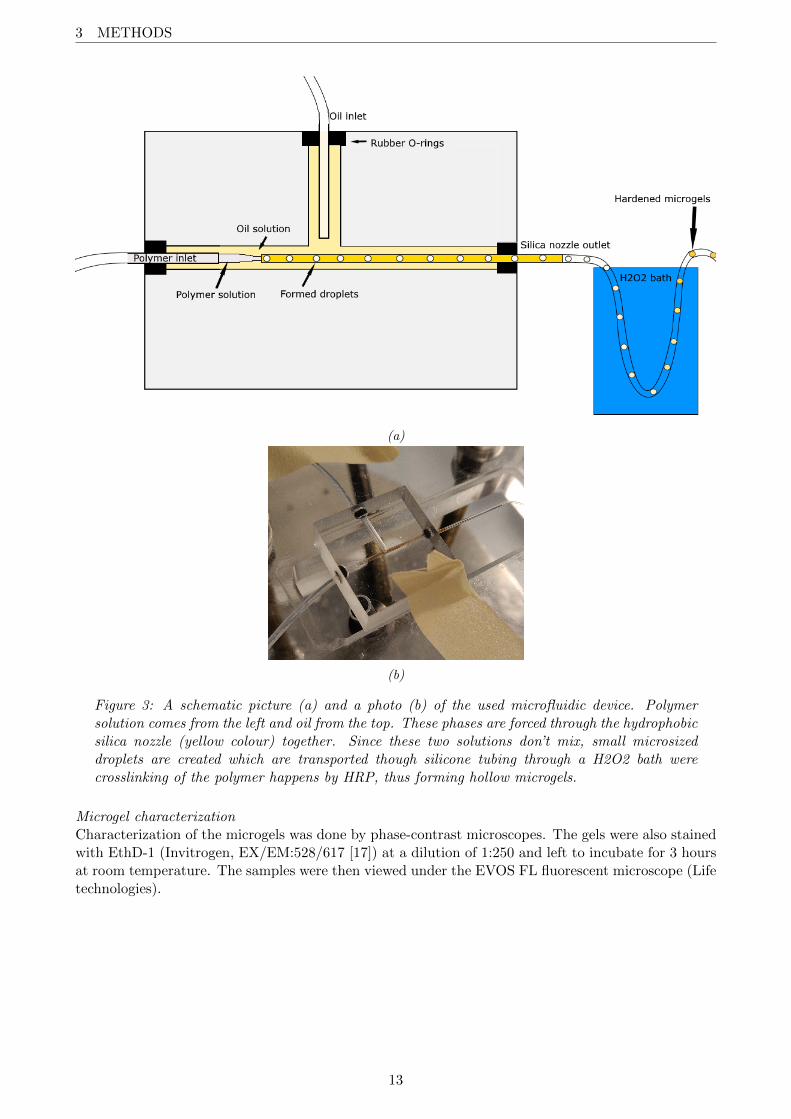
Microgel fabricationDroplets were formed by flowing the polymer mixture, either 2.5 or 10 % PEG-TA, together withthe SPAN80/hexadecane solution through the T-junction chip (see figure 3). The flow was providedby a syringe pump (neMESYS, Cetoni). Oil flowed from the top from a 5ml Hamilton syringe andpolymer from the left from a 0.5 ml Hamilton syringe. The connections to the chip were sealed usingrubber O-rings. The chip was held in place under a camera with the chip illuminated from below. Thepolymer is forced with the oil through the nozzle, and since both fluids are immiscible the polymerbreaks up into small droplets. By varying the flow speed ratios droplets of different sizes could bemade. The flow rates used were 7.5 µL/min for the polymer and 40 µL/min for the oil. These flowrates were experimentally tested by Nuno Gomes to produce microgels of about 150-200µm. Otherflow rate combinations were also tested. The formed droplets were led through silicone tubing of about30 cm going through a 30% H2O2 bath at room temperature. Outside-in crosslinking of the Tyraminegroups, creating hollow microgels, is done by the HRP enzyme, catalysed by the H202 which diffusesthrough the silicone tubing. The residence time in the H2O2 bath was about 6-10 seconds. Collectionof the microgels happened when a stable droplet train was observed by the camera. After collectionthe SPAN80 was removed from the microgels by repeatedly washing in pure hexadecane until theemulsion broke. PBS was added and the solution, now free of oil, was stored in the fridge.
12
3 METHODS
(a)
(b)
Figure 3: A schematic picture (a) and a photo (b) of the used microfluidic device. Polymersolution comes from the left and oil from the top. These phases are forced through the hydrophobicsilica nozzle (yellow colour) together. Since these two solutions don’t mix, small microsizeddroplets are created which are transported though silicone tubing through a H2O2 bath werecrosslinking of the polymer happens by HRP, thus forming hollow microgels.
Microgel characterizationCharacterization of the microgels was done by phase-contrast microscopes. The gels were also stainedwith EthD-1 (Invitrogen, EX/EM:528/617 [17]) at a dilution of 1:250 and left to incubate for 3 hoursat room temperature. The samples were then viewed under the EVOS FL fluorescent microscope (Lifetechnologies).
13
3 METHODS
3.3 Cell encapsulation
The protocol for cell encapsulation was mostly the same as for microgel fabrication but differed slightly.The 0.5ml polymer syringe was cleaned with 70% ethanol and left to dry overnight in sterile condi-tions. The 10% and 2.5% PEG-TA in PBS polymer precursor solution were also made under sterileconditions.
Cell preparationThe cultured MIN6 cells were trypsinized the same way as mentioned in cell culturing, were resus-pended in standard culture medium without FBS after centrifugation and were dropped though a40 µm grid cell strainer. The MIN6 cells have the tendency to clump together and this could causecomplications for the polymer flow in the microfluidic device. The strainer removed the larger aggre-gates from the cell suspension while the medium without FBS slows down aggregate formation, sinceFBS accelerates cell aggregation. The strained cells were centrifuged and resuspended in standardculture medium without FBS. Cells were counted with a burker-turk counting chamber. 10 millioncells were then added to the polymer precursor solution. This solution consisted of PBS with 10%PEG-TA, 8,33% optiprep (Sigma Aldrich), 80U/ml HRP and 31.7% standard culture medium withoutFBS with 10 million cells.
A 2.5% PEG-TA solution was made for the control. This solution consisted of PBS with 2.5%PEG-TA, 8,33% optiprep, 80U/ml HRP and 69% standard culture medium without FBS with 10million cells. The optiprep is used to match the density of this cell/polymer mixture to the density ofthe standard polymer solution.
Cell encapsulationThe precursor polymer solution was inserted into the sterile 0.5ml syringe, together with a small,sterilized magnet. This syringe was attached to the microfluidic device and the setup was run at thesame flow rate as described for microgel fabrication. The small magnet in the syringe was movedoccasionally, to prevent the clumping of cells in the polymer solution. The collected microgels withencapsulated cells were washed with PBS in a laminar flow hood until the emulsion broke and theresulting microgels were seeded on a suspension culture wells plate with standard culture mediumand put in an incubator (37◦C , 5% CO2). 50% of the medium was refreshed every 2-3 days. Theremainder of the polymer precursor solution was seeded on a tissue culture plate to provide a controlfor polymer toxicity.
FixationAt the timepoints of 24 hours, 4 days, 7 days, 14 days and 30 days a portion of the microgels werefixated in 4% PFA after being washed twice with PBS. After fixation the gels were put on PBS andstored in the fridge until fixation of all timepoints had taken place after which the different stainingswere performed.
3.4 Stainings
Live/dead stainingThese stainings were done in parallel with the fixation, so after 24 hours, 4 days, 7 days, 14 days and 30days after encapsulation a portion of the cultured microgels was removed and stained. Live/dead stain-ing(ThermoFisher) consisting of Calcein AM at a final dilution of 1:2000 and ethidium homodimer-1at a final dilution of 1:500 was added to the sample and left to incubate for 30 minutes (37◦C , 5%CO2). EthD-1 emits at 617nm and Calcein AM emits at 517nm, so the samples were viewed underthe RFP and GFP filter cubes of the EVOS FL microscope respectively.
14

3 METHODS
Immunofluorescence stainingThe fixed gels were washed with PBS containing 0.25% Triton X-100 and left to incubate for 10 min-utes to permeabilize the cell membrane. The gels were washed twice with PBS and blocked with a1% BSA in 1x PBS solution for at least 20 minutes. The BSA was removed and 1% BSA with theprimary antibodies was added and left to incubate overnight at 4◦C. The gels were then washed twicewith PBS and the secondary antibodies were added in a 1% BSA solution for 1 hour in the dark atroom temperature. The gels were washed twice with PBS and PBS with 1:100 DAPI staining (Ther-mofisher, 62248) was added for 5 minutes in the dark at room temperature to stain the cell nuclei.The DAPI solution was removed and fresh PBS was put on. The samples were then viewed under theEVOS FL microscope and later under the Zeiss KSM 880 laser confocal microscope. DAPI under theDAPI filter, glucagon under the GFP filter and insulin under the CY5 filter.
For the insulin staining the mouse anti-insulin primary antibody (NovusBio, NBP2-34260) ata dilution of 1:200 in 1% BSA was used. The secondary antibody was the donkey anti-mouse Alex-aFluor647 antibody (Abcam, ab150107) at a dilution of 1:200 in 1% BSA. The emission of this antibodypeaks at a wavelength of 668nm (deep red).For the glucagon staining the rabbit anti-glucagon antibody (ThermoFisher, PA5-88094) at a dilutionof 1:100 in 1% BSA was used. The secondary antibody was the goat anti-rabbit AlexaFluor488 anti-body (Abcam, ab150077)at a dilution of 1:250 in 1% BSA. The emission of this antibody peaks at awavelength of 520nm (green).
Antibody incubationFITC labelled IgG antibodies (20mg/ml, F9636 Sigma Aldrich) were added to the sample at a dilutionof 1:400 in PBS. The sample was then left to incubate for 24 hours at room temperature in the dark.FITC emission peaks at about 519 nm so the sample was viewed under the GFP filter of the EVOSFL microscope and later under the Zeiss KSM 880 laser confocal microscope.
Actin stainingPhalloidin is used for the staining of f-actin filaments. The fixed samples were permeabilized with0.25% Triton X-100 for 10 minutes. The gels were washed twice with PBS and phalloidin Alex-aFluor488 (Invitrogen, A12379), at a 1:40 dilution in PBS was added. The samples were incubatedfor 30 min in the dark at room temperature. After this time the gels were washed and DAPI at adilution of 1:100 in PBS was added. The samples were finally washed with PBS and viewed under theZeiss KSM 880
3.4.1 Fluorescent image characterization
The aggregate formation of the cells prevents regular cell counting for the viability assessment. Analternative method is to calculate and compare the corrected total fluorescence of the microgels(CTF)[18]. Using ImageJ, I could calculate the area integrated intensity of a specific colour chan-nel and region. This is the sum of all the pixel values in that region, or the total fluorescent intensityin that region. The CTF could then be calculated by removing the background noise via:
CTF= Integrated density - (area of the region * mean fluorescence value of a background reading).Although the sum of the intensities of the green (live) and red (dead) fluorescent components
don’t add up to 100%, for the purpose of a semi-quantification it can be useful to assume this. Theviability can then be calculated by:
viability = CTFlive/(CTFlive + CTFdead) (1)
The selected area in this case would be the entire microgel and the background noise the autofluores-cence of the microgels.
15

3 METHODS
The same CTF technique could also be used for the IF staining. The antibodies randomly staincells within the microgel so by determining the total fluorescence within a microgel I can comparedifferent microgels of different conditions with each other. This is assuming all microgels are the samesize. This value is the CTF mentioned before where the background noise in this case would be theautofluorescence of the microgels. The DAPI staining confirmed that the measured signal was specificand originating from cells.
For the fluorescent FITC antibody incubation I looked at the mean intensity of the backgroundsignal, and the mean intensity in the microgels themselves. There should be no specific binding toany structure, but a diffused green signal inside the microgels if the antibodies have penetrated. Itwas therefore useful to compare the mean fluorescent intensity of the inside with the outside of themicrogels. By dividing the mean intensity inside the microgels with the intensity of the outside, Igot a ratio which could be used to compare different conditions. A higher ratio would mean morepenetration of the antibody.
16
4 RESULTS
4 Results
4.1 Microgel fabrication
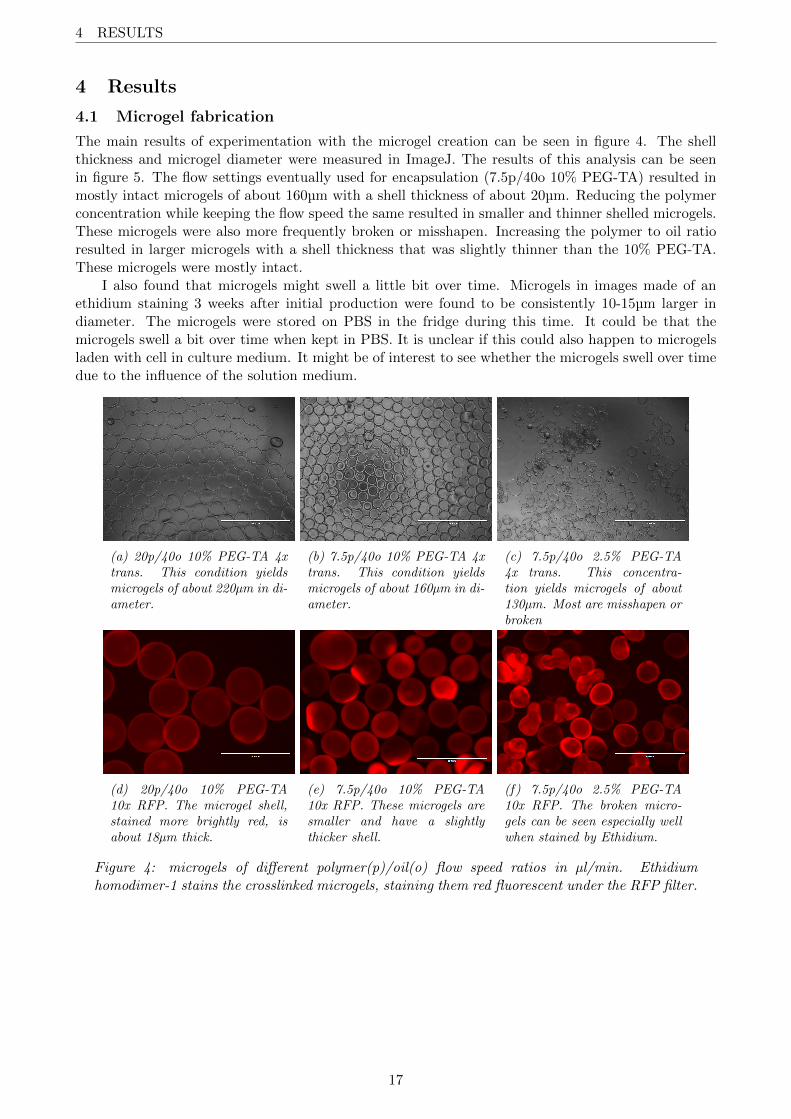
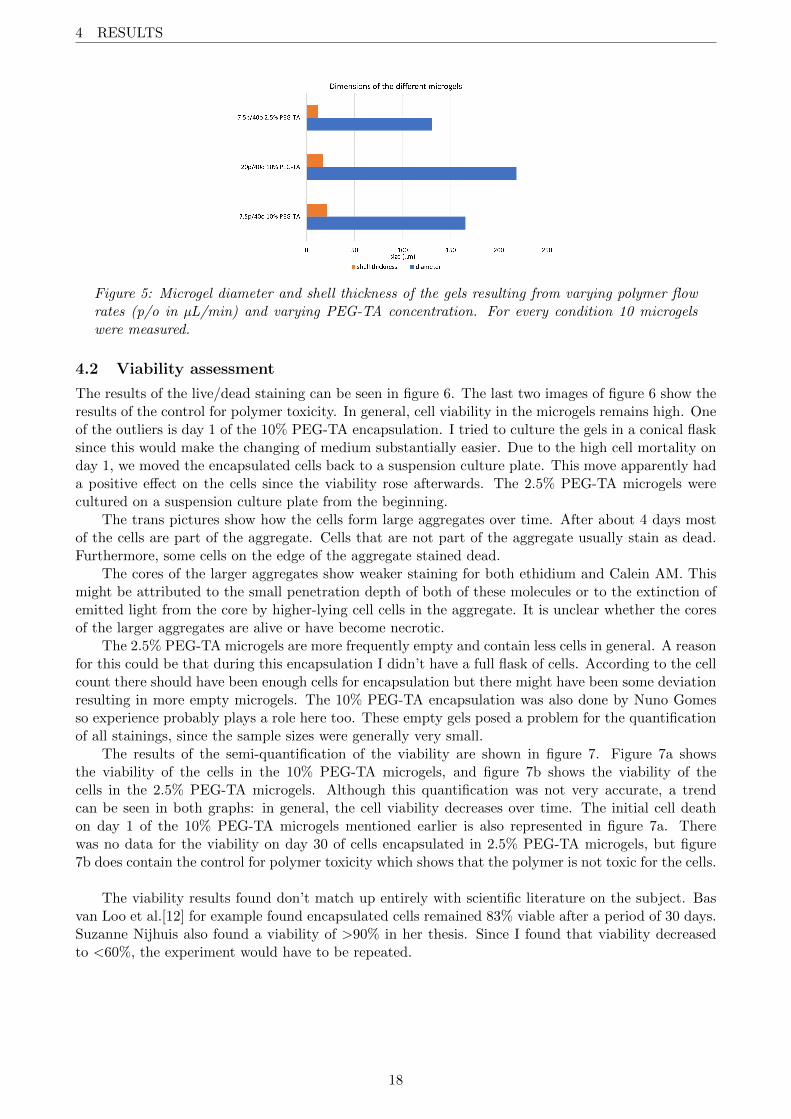
The main results of experimentation with the microgel creation can be seen in figure 4. The shellthickness and microgel diameter were measured in ImageJ. The results of this analysis can be seenin figure 5. The flow settings eventually used for encapsulation (7.5p/40o 10% PEG-TA) resulted inmostly intact microgels of about 160µm with a shell thickness of about 20µm. Reducing the polymerconcentration while keeping the flow speed the same resulted in smaller and thinner shelled microgels.These microgels were also more frequently broken or misshapen. Increasing the polymer to oil ratioresulted in larger microgels with a shell thickness that was slightly thinner than the 10% PEG-TA.These microgels were mostly intact.
I also found that microgels might swell a little bit over time. Microgels in images made of anethidium staining 3 weeks after initial production were found to be consistently 10-15µm larger indiameter. The microgels were stored on PBS in the fridge during this time. It could be that themicrogels swell a bit over time when kept in PBS. It is unclear if this could also happen to microgelsladen with cell in culture medium. It might be of interest to see whether the microgels swell over timedue to the influence of the solution medium.
(a) 20p/40o 10% PEG-TA 4xtrans. This condition yieldsmicrogels of about 220µm in di-ameter.
(b) 7.5p/40o 10% PEG-TA 4xtrans. This condition yieldsmicrogels of about 160µm in di-ameter.
(c) 7.5p/40o 2.5% PEG-TA4x trans. This concentra-tion yields microgels of about130µm. Most are misshapen orbroken
(d) 20p/40o 10% PEG-TA10x RFP. The microgel shell,stained more brightly red, isabout 18µm thick.
(e) 7.5p/40o 10% PEG-TA10x RFP. These microgels aresmaller and have a slightlythicker shell.
(f) 7.5p/40o 2.5% PEG-TA10x RFP. The broken micro-gels can be seen especially wellwhen stained by Ethidium.
Figure 4: microgels of different polymer(p)/oil(o) flow speed ratios in µl/min. Ethidiumhomodimer-1 stains the crosslinked microgels, staining them red fluorescent under the RFP filter.
17
4 RESULTS
Figure 5: Microgel diameter and shell thickness of the gels resulting from varying polymer flowrates (p/o in µL/min) and varying PEG-TA concentration. For every condition 10 microgelswere measured.
4.2 Viability assessment
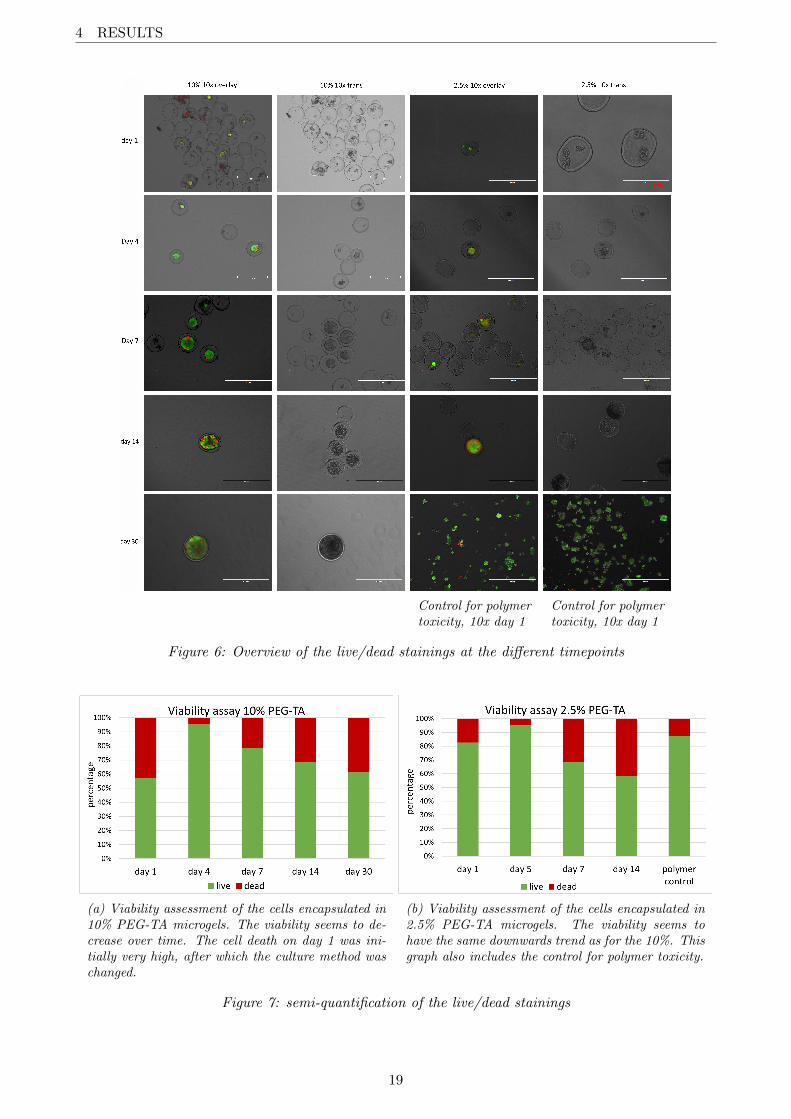
The results of the live/dead staining can be seen in figure 6. The last two images of figure 6 show theresults of the control for polymer toxicity. In general, cell viability in the microgels remains high. Oneof the outliers is day 1 of the 10% PEG-TA encapsulation. I tried to culture the gels in a conical flasksince this would make the changing of medium substantially easier. Due to the high cell mortality onday 1, we moved the encapsulated cells back to a suspension culture plate. This move apparently hada positive effect on the cells since the viability rose afterwards. The 2.5% PEG-TA microgels werecultured on a suspension culture plate from the beginning.
The trans pictures show how the cells form large aggregates over time. After about 4 days mostof the cells are part of the aggregate. Cells that are not part of the aggregate usually stain as dead.Furthermore, some cells on the edge of the aggregate stained dead.
The cores of the larger aggregates show weaker staining for both ethidium and Calein AM. Thismight be attributed to the small penetration depth of both of these molecules or to the extinction ofemitted light from the core by higher-lying cell cells in the aggregate. It is unclear whether the coresof the larger aggregates are alive or have become necrotic.
The 2.5% PEG-TA microgels are more frequently empty and contain less cells in general. A reasonfor this could be that during this encapsulation I didn’t have a full flask of cells. According to the cellcount there should have been enough cells for encapsulation but there might have been some deviationresulting in more empty microgels. The 10% PEG-TA encapsulation was also done by Nuno Gomesso experience probably plays a role here too. These empty gels posed a problem for the quantificationof all stainings, since the sample sizes were generally very small.
The results of the semi-quantification of the viability are shown in figure 7. Figure 7a showsthe viability of the cells in the 10% PEG-TA microgels, and figure 7b shows the viability of thecells in the 2.5% PEG-TA microgels. Although this quantification was not very accurate, a trendcan be seen in both graphs: in general, the cell viability decreases over time. The initial cell deathon day 1 of the 10% PEG-TA microgels mentioned earlier is also represented in figure 7a. Therewas no data for the viability on day 30 of cells encapsulated in 2.5% PEG-TA microgels, but figure7b does contain the control for polymer toxicity which shows that the polymer is not toxic for the cells.
The viability results found don’t match up entirely with scientific literature on the subject. Basvan Loo et al.[12] for example found encapsulated cells remained 83% viable after a period of 30 days.Suzanne Nijhuis also found a viability of >90% in her thesis. Since I found that viability decreasedto <60%, the experiment would have to be repeated.
18
4 RESULTS
Control for polymertoxicity, 10x day 1
Control for polymertoxicity, 10x day 1
Figure 6: Overview of the live/dead stainings at the different timepoints
(a) Viability assessment of the cells encapsulated in10% PEG-TA microgels. The viability seems to de-crease over time. The cell death on day 1 was ini-tially very high, after which the culture method waschanged.
(b) Viability assessment of the cells encapsulated in2.5% PEG-TA microgels. The viability seems tohave the same downwards trend as for the 10%. Thisgraph also includes the control for polymer toxicity.
Figure 7: semi-quantification of the live/dead stainings
19
4 RESULTS
4.3 Immunofluorescence
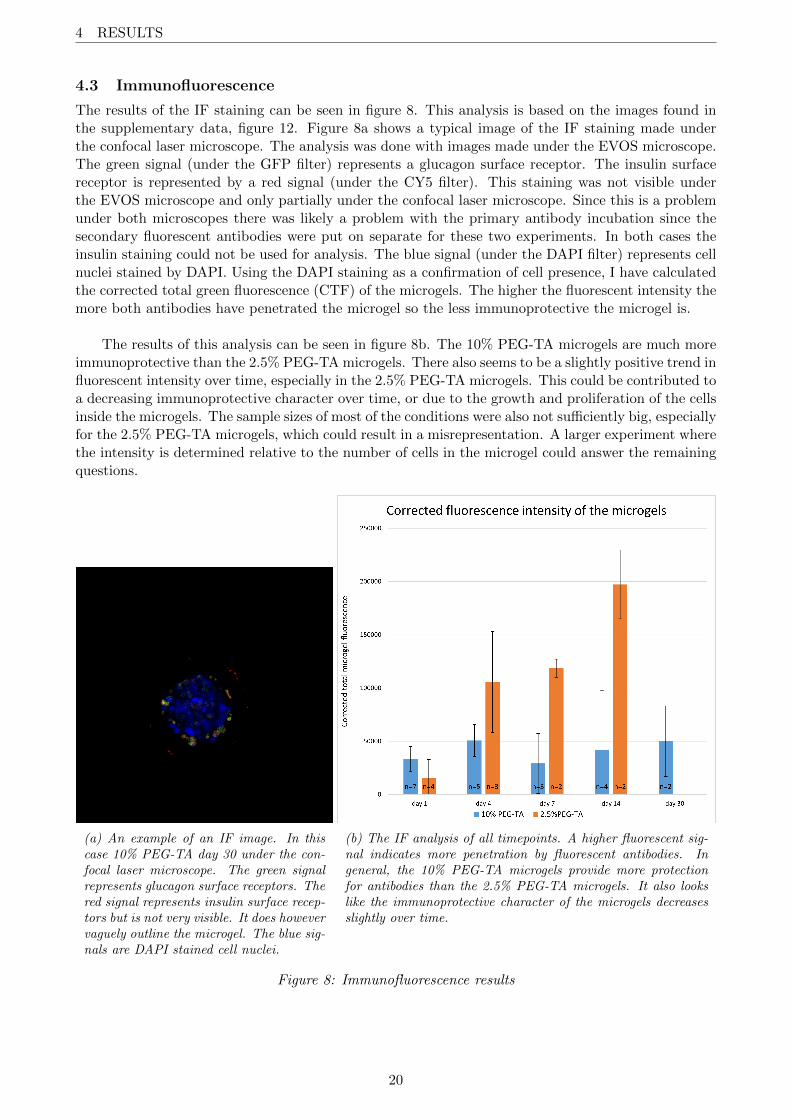
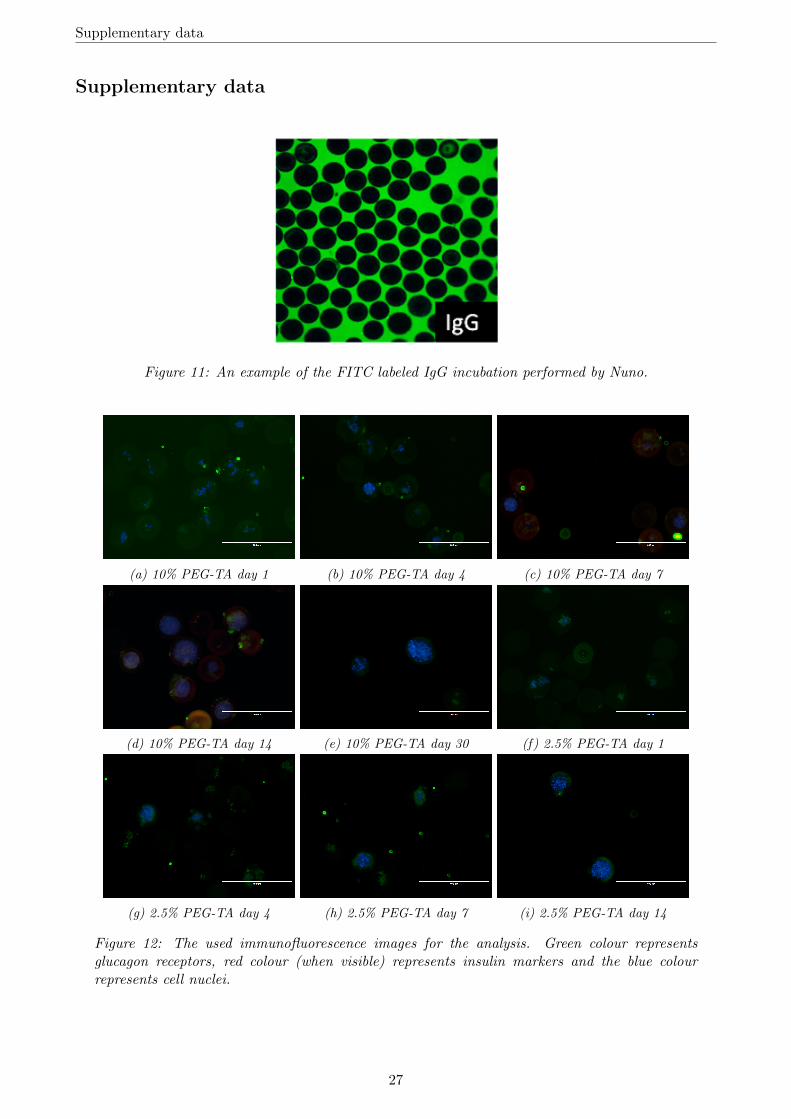
The results of the IF staining can be seen in figure 8. This analysis is based on the images found inthe supplementary data, figure 12. Figure 8a shows a typical image of the IF staining made underthe confocal laser microscope. The analysis was done with images made under the EVOS microscope.The green signal (under the GFP filter) represents a glucagon surface receptor. The insulin surfacereceptor is represented by a red signal (under the CY5 filter). This staining was not visible underthe EVOS microscope and only partially under the confocal laser microscope. Since this is a problemunder both microscopes there was likely a problem with the primary antibody incubation since thesecondary fluorescent antibodies were put on separate for these two experiments. In both cases theinsulin staining could not be used for analysis. The blue signal (under the DAPI filter) represents cellnuclei stained by DAPI. Using the DAPI staining as a confirmation of cell presence, I have calculatedthe corrected total green fluorescence (CTF) of the microgels. The higher the fluorescent intensity themore both antibodies have penetrated the microgel so the less immunoprotective the microgel is.
The results of this analysis can be seen in figure 8b. The 10% PEG-TA microgels are much moreimmunoprotective than the 2.5% PEG-TA microgels. There also seems to be a slightly positive trend influorescent intensity over time, especially in the 2.5% PEG-TA microgels. This could be contributed toa decreasing immunoprotective character over time, or due to the growth and proliferation of the cellsinside the microgels. The sample sizes of most of the conditions were also not sufficiently big, especiallyfor the 2.5% PEG-TA microgels, which could result in a misrepresentation. A larger experiment wherethe intensity is determined relative to the number of cells in the microgel could answer the remainingquestions.
(a) An example of an IF image. In thiscase 10% PEG-TA day 30 under the con-focal laser microscope. The green signalrepresents glucagon surface receptors. Thered signal represents insulin surface recep-tors but is not very visible. It does howevervaguely outline the microgel. The blue sig-nals are DAPI stained cell nuclei.
(b) The IF analysis of all timepoints. A higher fluorescent sig-nal indicates more penetration by fluorescent antibodies. Ingeneral, the 10% PEG-TA microgels provide more protectionfor antibodies than the 2.5% PEG-TA microgels. It also lookslike the immunoprotective character of the microgels decreasesslightly over time.
Figure 8: Immunofluorescence results
20
4 RESULTS
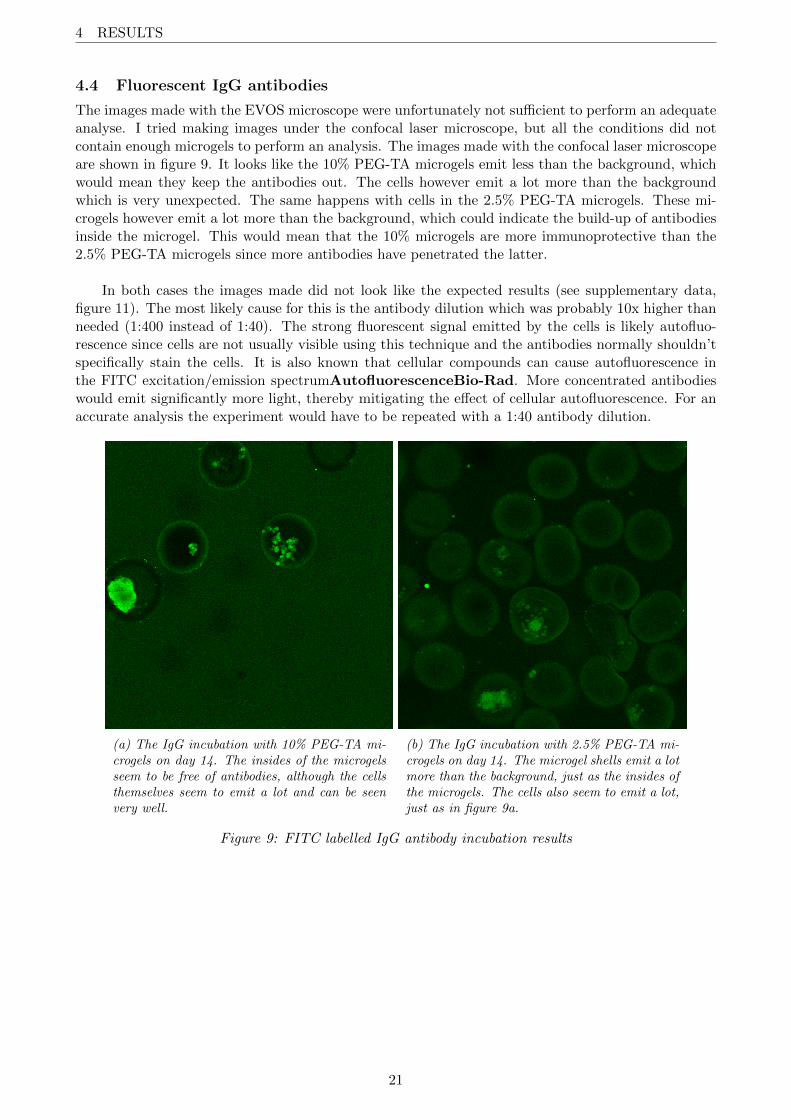
4.4 Fluorescent IgG antibodies
The images made with the EVOS microscope were unfortunately not sufficient to perform an adequateanalyse. I tried making images under the confocal laser microscope, but all the conditions did notcontain enough microgels to perform an analysis. The images made with the confocal laser microscopeare shown in figure 9. It looks like the 10% PEG-TA microgels emit less than the background, whichwould mean they keep the antibodies out. The cells however emit a lot more than the backgroundwhich is very unexpected. The same happens with cells in the 2.5% PEG-TA microgels. These mi-crogels however emit a lot more than the background, which could indicate the build-up of antibodiesinside the microgel. This would mean that the 10% microgels are more immunoprotective than the2.5% PEG-TA microgels since more antibodies have penetrated the latter.
In both cases the images made did not look like the expected results (see supplementary data,figure 11). The most likely cause for this is the antibody dilution which was probably 10x higher thanneeded (1:400 instead of 1:40). The strong fluorescent signal emitted by the cells is likely autofluo-rescence since cells are not usually visible using this technique and the antibodies normally shouldn’tspecifically stain the cells. It is also known that cellular compounds can cause autofluorescence inthe FITC excitation/emission spectrumAutofluorescenceBio-Rad. More concentrated antibodieswould emit significantly more light, thereby mitigating the effect of cellular autofluorescence. For anaccurate analysis the experiment would have to be repeated with a 1:40 antibody dilution.
(a) The IgG incubation with 10% PEG-TA mi-crogels on day 14. The insides of the microgelsseem to be free of antibodies, although the cellsthemselves seem to emit a lot and can be seenvery well.
(b) The IgG incubation with 2.5% PEG-TA mi-crogels on day 14. The microgel shells emit a lotmore than the background, just as the insides ofthe microgels. The cells also seem to emit a lot,just as in figure 9a.
Figure 9: FITC labelled IgG antibody incubation results
21
4 RESULTS
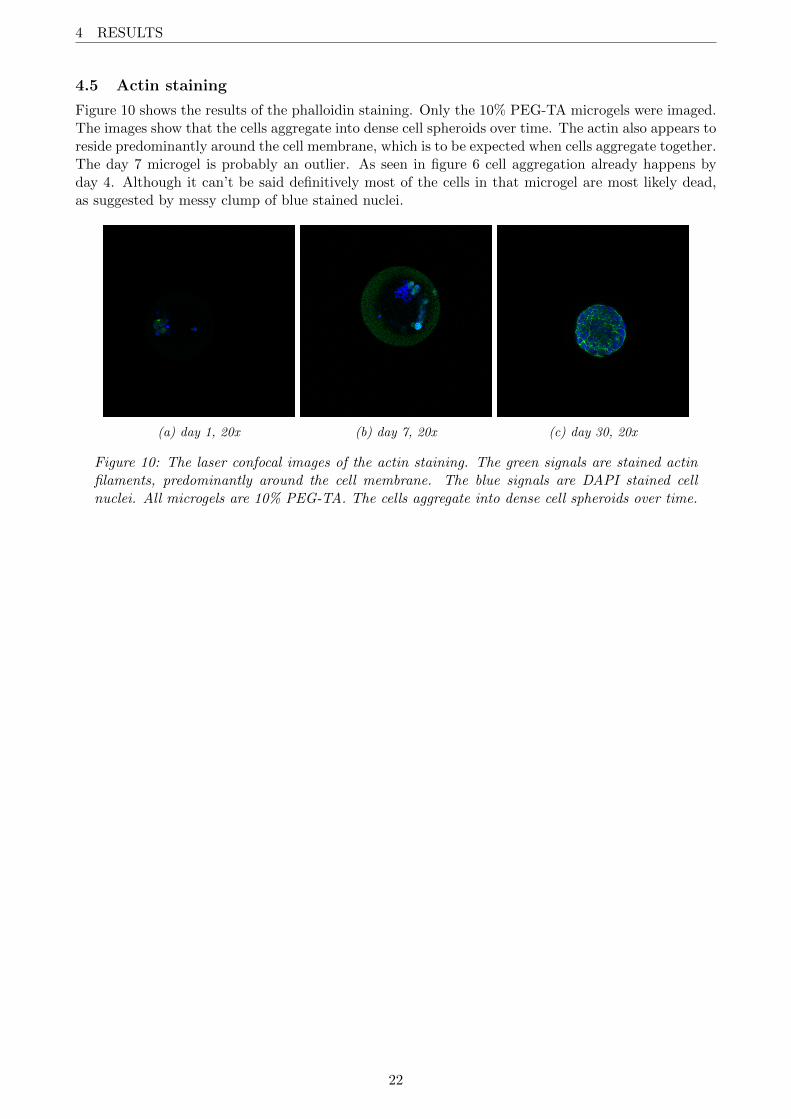
4.5 Actin staining
Figure 10 shows the results of the phalloidin staining. Only the 10% PEG-TA microgels were imaged.The images show that the cells aggregate into dense cell spheroids over time. The actin also appears toreside predominantly around the cell membrane, which is to be expected when cells aggregate together.The day 7 microgel is probably an outlier. As seen in figure 6 cell aggregation already happens byday 4. Although it can’t be said definitively most of the cells in that microgel are most likely dead,as suggested by messy clump of blue stained nuclei.
(a) day 1, 20x (b) day 7, 20x (c) day 30, 20x
Figure 10: The laser confocal images of the actin staining. The green signals are stained actinfilaments, predominantly around the cell membrane. The blue signals are DAPI stained cellnuclei. All microgels are 10% PEG-TA. The cells aggregate into dense cell spheroids over time.
22
5 DISCUSSION
5 Discussion5.1 Aim
The method used to fabricate the used microgels is new and promising but the theoretic propertiesof these microgels need to be tested for the use in vivo. One of these properties is the ability to beimmunoprotective, meaning protective against the effects of antigens. In the context of this researchthat means antibodies can’t penetrate the microgel shell. Research within the DBE group showed thatthe microgels in general are immunoprotective, but there seemed to be a small amount of antibodypenetration after a period of 30 days. This thesis aimed to determine how the immunoprotectivecharacter of the cell laden microgels develops over time. This immunoprotective character is very im-portant for experimentation in vivo and eventually for therapeutical purposes. If the microgels do notremain immunoprotective for a period of 30 days, it makes no sense to use them for transplantation.If they are, they could potentially be a way to transplant insulin producing cells into diabetic patients.
5.2 Immunoprotective character
Although the results of the immunofluorescence and FITC antibody incubation were not ideal, it couldbe seen that the antibody penetration into the 10% PEG-TA microgels was inhibited compared to the2.5% PEG-TA control, which is known to not be immunoprotective. With the immunofluorescencestaining I saw significantly less staining in the 10% PEG-TA microgels. The staining was also a lotless specific compared to the control. With the FITC antibody incubation I saw that the insides ofthe 10% PEG-TA microgels (ignoring the emission of the cells) emitted significantly less than thebackground. The 2.5% PEG-TA microgels emitted significantly more compared to the background,so compared to the control the 10% PEG-TA microgels were once again more immunoprotective.
The 10% PEG-TA microgels are known to be immunoprotective in vivo and in vitro and, in gen-eral, my research confirms this. There was some antibody penetration into the 10% PEG-TA microgelsbut this could be attributed to the stretching of the microgels due to aggregate growth. The effectof this stretching seems to be limited, however, since I could not find a significant increase over time,but the experiments would need to be repeated to conclude this.
5.3 Therapeutic potential
Experimentation within the DBE group showed that smaller molecules, such as BSA, can enter themicrogel with ease. As is shown in this thesis, larger molecules such as antibodies are severely in-hibited in doing so. This would mean that cells inside the microgels are protected from the immunesystem. At the same time smaller molecules such as oxygen, insulin or glucose can diffuse throughthe microgel with ease. Due to the small nature of the microgels (160µm) the cells inside benefitfrom quick diffusion of nutrients. The viability assessment confirms that cells inside the microgel cansurvive for a period of at least 30 days. The actin staining, along with the live/dead staining, confirmsthat the cells aggregate into dense spheroids over time. These kinds of 3D structure generally enhancecell functions[19]. Some cells were found to be dead inside the cell aggregates, but they did not seemto inhibit cellular growth and the aggregate was found to be mostly alive. The cores of the aggregatesstain alive in smaller aggregates, but it can’t be confirmed if the insides of the larger aggregates arenecrotic or not.
23
6 CONCLUSION
The small nature of these microgels also allow for easy transplantation into the body. No surgeryis required since the microgels can easily be injected into the body. The total volume of these micro-gels is also a lot smaller than an entire pancreas so they can be injected into any reasonable location.High vascularization around β-cells in the pancreas is associated with high cell proliferation and strongsecretory function[20]. β-cells mostly metabolize glucose almost exclusively via aerobic glycolysis, sothey are very dependent on oxygen. Good vascularization around the graft is therefore very importantfor the survivability of the transplanted microgels. Oxygen diffusion in the body rarely exceeds 200µmand is usually less than 100µm. This would mean that the microgels can be supplied with oxygenin their entirety[21]. However, there seems to be a large downside to good vascularization. Recentresearch has found that highly perfused microgels with islet cells were more prone to cell death andfibrosis due to the increased accessibility to cytokines and immune cells[22]. Therefore, the increasedperfusion might lead to earlier cell death and ultimately transplantation failure.
5.4 Future outlook
This thesis builds upon the research done by the DBE group about the encapsulation method used.It proves that the produced PEG-TA microgels inhibit the diffusion of antibodies and that cells cansurvive for long periods of time in vitro. The next step would be to assess the response againstthese microgels in vivo. It is recommended though to repeat this experiment to determine how theimmunoprotective character develops over time. It could also be useful to determine whether the coreof the cell aggregates remains viable or becomes necrotic.
These microgels might also benefit other areas of research. Cells were seen to quickly condenseinto aggregates within a few days. The microgels might therefore be an attractive method to producecell spheroids. They could also be used in tissue engineering as a scaffold. When packed togetherthese circular microgels leave empty spaces between them, which could be used for vascularization.
6 ConclusionIn conclusion, encapsulating cells in a 10% PEG-TA microgel might be a viable option to protect
cells from the immune system. Monodisperse microgels of about 160µm in diameter were successfullymade using single step enzymatic crosslinking in a microfluidic device.
The aim was to assess the immunoprotective character of these microgels over a period of 30days. The 10% PEG-TA microgels appeared to be immunoprotective for this period compared to thecontrol. However, there appeared to be small penetration of antibodies. This might be attributedto stretching of the microgels, but this could not be confirmed. The experiments would need to berepeated to get a definitive conclusion.
The microgels remained intact and the encapsulated cells remained viable for a period of at least30 days. The cells also aggregated into dense spheroids after a few days of culture. However, it isunknown if the core of the aggregates remained viable or become necrotic.
24
REFERENCES
References[1] M. Mobasseri, M. Shirmohammadi, T. Amiri, N. Vahed, H. Hosseini Fard, and M. Ghojazadeh,
“Prevalence and incidence of type 1 diabetes in the world: a systematic review and meta-analysis,” Health Promotion Perspectives, vol. 10, no. 2, pp. 98–115, Mar. 2020, issn: 2228-6497. doi: 10.34172/hpp.2020.18. [Online]. Available: /pmc/articles/PMC7146037/%20/pmc/articles/PMC7146037/?report=abstract%20https://www.ncbi.nlm.nih.gov/pmc/
articles/PMC7146037/%20http://hpp.tbzmed.ac.ir/Article/hpp-31920.
[2] M. A. Atkinson, G. S. Eisenbarth, and A. W. Michels, “Type 1 diabetes,” The Lancet, vol. 383,no. 9911, pp. 69–82, Jan. 2014, issn: 01406736. doi: 10.1016/S0140- 6736(13)60591- 7.[Online]. Available: https://linkinghub.elsevier.com/retrieve/pii/S0140673613605917.
[3] L. Szablewski, Role of immune system in type 1 diabetes mellitus pathogenesis, Sep. 2014. doi:10.1016/j.intimp.2014.06.033.
[4] G. Wilcox, “Insulin and Insulin,” The Clinical biochemist. Reviews, vol. 26, no. May, pp. 19–39,2005, issn: 0159-8090. [Online]. Available: http://www.ncbi.nlm.nih.gov/pubmed/16278749%20http://www.pubmedcentral.nih.gov/articlerender.fcgi?artid=PMC1204764%20http:
//www.ncbi.nlm.nih.gov/pubmed/16278749%0Ahttp://www.pubmedcentral.nih.gov/
articlerender.fcgi?artid=PMC1204764.
[5] I. Garzilli and S. Itzkovitz, “Design principles of the paradoxical feedback between pancreaticalpha and beta cells,” Scientific Reports, vol. 8, no. 1, Dec. 2018, issn: 20452322. doi: 10.1038/s41598-018-29084-4. [Online]. Available: /pmc/articles/PMC6048053/%20/pmc/articles/PMC6048053 / ?report = abstract % 20https : / / www . ncbi . nlm . nih . gov / pmc / articles /
PMC6048053/.
[6] P. Suri and T. Aurora, “Hyperglycemia,” in Observation Medicine: Principles and Protocols,Cambridge University Press, Mar. 2017, pp. 225–230, isbn: 9781139136365. doi: 10.1017/
9781139136365.043. [Online]. Available: https://www.ncbi.nlm.nih.gov/books/NBK430900/.
[7] A. Hess-Fischl and D. E. Smith-Marsh, Type 1 Diabetes Symptoms, Causes, Diagnosis and Treat-ments - Learn about the different types of insulin for type 1 diabetes and newer therapies to helpyou better manage your glucose better. 2020. [Online]. Available: https://www.endocrineweb.com/conditions/type-1-diabetes/type-1-diabetes-treatments.
[8] A. Espona-Noguera, J. Ciriza, A. Canibano-Hernandez, G. Orive, R. M. Hernandez, L. S. DelBurgo, and J. L. Pedraz, Review of advanced hydrogel-based cell encapsulation systems for insulindelivery in type 1 diabetes mellitus, Nov. 2019. doi: 10.3390/pharmaceutics11110597. [Online].Available: zh%20/pmc/articles/PMC6920807/?report=abstract%20https://www.ncbi.nlm.nih.gov/pmc/articles/PMC6920807/.
[9] A. Ashimova, S. Yegorov, B. Negmetzhanov, and G. Hortelano, Cell Encapsulation Within Al-ginate Microcapsules: Immunological Challenges and Outlook, Dec. 2019. doi: 10.3389/fbioe.2019.00380. [Online]. Available: www.frontiersin.org.
[10] P. De Vos, H. A. Lazarjani, D. Poncelet, and M. M. Faas, Polymers in cell encapsulation froman enveloped cell perspective, Apr. 2014. doi: 10.1016/j.addr.2013.11.005.
[11] T. Knobeloch, S. E. M. Abadi, J. Bruns, S. Petrova Zustiak, and G. Kwon, “Injectable polyethy-lene glycol hydrogel for islet encapsulation: an in vitro and in vivo characterization,” Biomed-ical Physics & Engineering Express, vol. 3, no. 3, p. 035 022, Jun. 2017, issn: 2057-1976. doi:10.1088/2057- 1976/aa742b. [Online]. Available: /pmc/articles/PMC5842952/%20/pmc/
articles / PMC5842952 / ?report = abstract % 20https : / / www . ncbi . nlm . nih . gov / pmc /
articles/PMC5842952/.
[12] B. van Loo, S. S. Salehi, S. Henke, A. Shamloo, T. Kamperman, M. Karperien, and J. Lei-jten, “Enzymatic outside-in cross-linking enables single-step microcapsule production for high-throughput three-dimensional cell microaggregate formation,” Materials Today Bio, vol. 6, 2020,issn: 25900064. doi: 10.1016/j.mtbio.2020.100047. [Online]. Available: https://doi.org/10.1016/j.mtbio.2020.100047.
25
REFERENCES
[13] T. Kamperman, B. Van Loo, M. Gurian, S. Henke, M. Karperien, and J. Leijten, “On-the-flyexchangeable microfluidic nozzles for facile production of various monodisperse micromaterials,”Lab on a Chip, vol. 19, no. 11, pp. 1977–1984, 2019, issn: 14730189. doi: 10.1039/c9lc00054b.
[14] T. Kamperman, S. Henke, B. Zoetebier, N. Ruiterkamp, R. Wang, B. Pouran, H. Weinans, M.Karperien, and J. Leijten, “Nanoemulsion-induced enzymatic crosslinking of tyramine-functionalizedpolymer droplets,” Journal of Materials Chemistry B, vol. 5, no. 25, pp. 4835–4844, Jun. 2017,issn: 2050750X. doi: 10.1039/c7tb00686a. [Online]. Available: https://pubs- rsc- org.
ezproxy2.utwente.nl/en/content/articlehtml/2017/tb/c7tb00686a%20https://pubs-
rsc-org.ezproxy2.utwente.nl/en/content/articlelanding/2017/tb/c7tb00686a.
[15] H. Ishihara, T. Asano, K. Tsukuda, H. Katagiri, K. Inukai, M. Anai, M. Kikuchi, Y. Yazaki,J. I. Miyazaki, and Y. Oka, “Pancreatic beta cell line MIN6 exhibits characteristics of glucosemetabolism and glucose-stimulated insulin secretion similar to those of normal islets,” Dia-betologia, vol. 36, no. 11, pp. 1139–1145, Nov. 1993, issn: 0012186X. doi: 10.1007/BF00401058.[Online]. Available: https://link-springer-com.ezproxy2.utwente.nl/article/10.1007/BF00401058.
[16] T. Okada, W. L. Chong, J. Hu, C. Hinault, M. D. Michael, J. Krutzfeldt, C. Yin, M. Holzen-berger, M. Stoffel, and R. N. Kulkarni, “Insulin receptors in β-cells are critical for islet compen-satory growth response to insulin resistance,” Proceedings of the National Academy of Sciencesof the United States of America, vol. 104, no. 21, pp. 8977–8982, May 2007, issn: 00278424.doi: 10.1073/pnas.0608703104. [Online]. Available: http://www.ncbi.nlm.nih.gov/
pubmed/17416680%20http://www.pubmedcentral.nih.gov/articlerender.fcgi?artid=
PMC1885613.
[17] Ethidium Homodimer-1 (EthD-1). [Online]. Available: https : / / www . thermofisher . com /
order/catalog/product/E1169#/E1169.
[18] L. Hammond, Measuring cell fluorescence using ImageJ — The Open Lab Book v1.0, 2014.[Online]. Available: https://theolb.readthedocs.io/en/latest/imaging/measuring-
cell-fluorescence-using-imagej.html.
[19] B. M. Baker and C. S. Chen, Deconstructing the third dimension-how 3D culture microen-vironments alter cellular cues, Jul. 2012. doi: 10 . 1242 / jcs . 079509. [Online]. Available:/pmc/articles/PMC3434846/%20/pmc/articles/PMC3434846/?report=abstract%20https:
//www.ncbi.nlm.nih.gov/pmc/articles/PMC3434846/.
[20] B. M. Henry, B. Skinningsrud, K. Saganiak, P. A. Pkala, J. A. Walocha, and K. A. Tomaszewski,Development of the human pancreas and its vasculature — An integrated review covering anatom-ical, embryological, histological, and molecular aspects, Jan. 2019. doi: 10.1016/j.aanat.2018.09.008.
[21] T. L. Place, F. E. Domann, and A. J. Case, Limitations of oxygen delivery to cells in culture:An underappreciated problem in basic and translational research, Dec. 2017. doi: 10.1016/j.freeradbiomed.2017.10.003. [Online]. Available: /pmc/articles/PMC5699948/%20/pmc/articles / PMC5699948 / ?report = abstract % 20https : / / www . ncbi . nlm . nih . gov / pmc /
articles/PMC5699948/.
[22] P. In’t Veld and E. Lammert, The dark side of islet vasculature, Jan. 2015. doi: 10.1007/
s00125-014-3418-2. [Online]. Available: https://pubmed.ncbi.nlm.nih.gov/25326240/.
26
Supplementary data
Supplementary data
Figure 11: An example of the FITC labeled IgG incubation performed by Nuno.
(a) 10% PEG-TA day 1 (b) 10% PEG-TA day 4 (c) 10% PEG-TA day 7
(d) 10% PEG-TA day 14 (e) 10% PEG-TA day 30 (f) 2.5% PEG-TA day 1
(g) 2.5% PEG-TA day 4 (h) 2.5% PEG-TA day 7 (i) 2.5% PEG-TA day 14
Figure 12: The used immunofluorescence images for the analysis. Green colour representsglucagon receptors, red colour (when visible) represents insulin markers and the blue colourrepresents cell nuclei.
27