
App 2B,Part 1,to TMI-1 PSAR, "Seismicity & Response Spectra ...
Upload
khangminh22Category
view
2download
0
Study and Data Acquisition Plan Induced Seismicity in Groningen Update Post-Winningsplan 2016

Study and Data Acquisition Plan Induced Seismicity in Groningen - Winningsplan 2016
1
© EP201604200072 Dit rapport is een weerslag van een voortdurend studie- en dataverzamelingsprogramma en bevat de stand der kennis van april 2016. Het copyright van dit rapport ligt bij de Nederlandse Aardolie Maatschappij B.V. Het copyright van de onderliggende studies berust bij de respectievelijke auteurs. Dit rapport of delen daaruit mogen alleen met een nadrukkelijke status-en bronvermelding worden overgenomen of gepubliceerd.

Study and Data Acquisition Plan Induced Seismicity in Groningen - Winningsplan 2016
2
Contents 1 Management Summary ......................................................................................................................... 5
Samenvatting ............................................................................................................................................. 5
Summary of this report ............................................................................................................................. 8
2 Introduction ......................................................................................................................................... 11
History of induced earthquakes in Groningen ........................................................................................ 11
Community concerns .............................................................................................................................. 13
Study and Data Acquisition Plan (2013 – 2016) ...................................................................................... 13
Hazard and Risk assessment for induced Seismicity in Groningen ......................................................... 15
Study and Data Acquisition Plan (Post Winningsplan 2016) ................................................................... 16
3 Data Acquisition .................................................................................................................................. 17
Production Volumes and Pressure .......................................................................................................... 18
Gravimetric survey .................................................................................................................................. 18
Subsidence and Compaction ................................................................................................................... 18
Monitoring Seismicity .............................................................................................................................. 23
Monitoring Network for Building Damage .............................................................................................. 34
4 Current assurance layers ( 2014 – 2016) ............................................................................................. 39
1. Internal NAM-assurance ...................................................................................................................... 39
2. Independent assurance requested by NAM........................................................................................ 39
3. Independent assurance, requested by Ministry of Economic Affairs ................................................. 40
4. Independent assurance by regulator Staatstoezicht op de Mijnen (SodM) ....................................... 42
5. Independent assurance requested by regulator (SodM) .................................................................... 43
6. Independent critics .............................................................................................................................. 43
7. Transparency ....................................................................................................................................... 43
5 Assurance expansion in Winningsplan 2016 ....................................................................................... 52
Effectiveness current assurance regime ................................................................................................. 52
Proposal for Assurance quality upgrade ................................................................................................. 52
6 Further Studies and Data Acquisition Projects – Groningen Reservoir Model ................................... 54
Objectives ................................................................................................................................................ 54
Static Reservoir Model ............................................................................................................................ 54
Calibration of the Dynamic Reservoir Model .......................................................................................... 58
Summary ................................................................................................................................................. 62
7 Further Studies and Data Acquisition Projects – Subsidence and Compaction .................................. 63

Study and Data Acquisition Plan Induced Seismicity in Groningen - Winningsplan 2016
3
Objectives ................................................................................................................................................ 63
Subsidence Data Acquisition ................................................................................................................... 63
Compaction Monitoring .......................................................................................................................... 65
Core Measurements and Constitutive Models for Compaction ............................................................. 65
Summary ................................................................................................................................................. 68
8 Further Studies and Data Acquisition Projects – Seismological Model and Geomechanics ............... 69
Seismic Data Gatering ............................................................................................................................. 69
Studies into Determination of Hypocentre and Magnitude ................................................................... 72
Core Measurements and Models for Rupture Processes ....................................................................... 75
In-situ Stress measurement .................................................................................................................... 78
Improvements and enhancements to the faulted 3D geomechanical model ........................................ 79
Geomechanical modelling ....................................................................................................................... 79
Alternative Seismological Models ........................................................................................................... 80
Assessment of hazard changes due to swing production ....................................................................... 84
Summary ................................................................................................................................................. 86
9 Further Studies and Data Acquisition Projects – Ground Motion ....................................................... 87
Measuring Ground Motion ...................................................................................................................... 87
Further development Ground Motion Prediction ................................................................................... 89
Spatial Correlation of Ground Motions ................................................................................................... 98
Wavefield Simulation-Based Event Characterization .............................................................................. 99
Soil Description and Behaviour ............................................................................................................... 99
Liquefaction Studies .............................................................................................................................. 103
Summary ............................................................................................................................................... 106
10 Further Studies and Data Acquisition Projects – Exposure of Buildings and People .................... 107
Exposure Database – Deterministic Typology Assignment ................................................................... 107
11 Further Studies and Data Acquisition Projects – Building Response ............................................ 109
Properties of Building Materials ............................................................................................................ 109
Experimental Tests of Structural and Non-Structural Elements of Buildings ....................................... 110
Modelling of structural components and systems ................................................................................ 111
Testing of structural components ......................................................................................................... 112
Testing of structural systems ................................................................................................................ 113
Monitoring of buildings in Groningen field area ................................................................................... 116
In-situ dynamic testing of structural systems ....................................................................................... 116

Study and Data Acquisition Plan Induced Seismicity in Groningen - Winningsplan 2016
4
Numerical Modelling of Structural and Non-Structural Elements of Buildings .................................... 118
Building Falling Objects ......................................................................................................................... 120
Summary ............................................................................................................................................... 121
12 Further Studies and Data Acquisition Projects – Hazard and Risk Assessment ............................ 122
Modifications to Monte Carlo Risk Engine ............................................................................................ 122
Control Optimisation for Earthquake Minimisation .............................................................................. 122
Proposal to compare the predictive performance of a range of seismic activity rate models and for the
development of methods for verification of seismic hazard and risk forecasts ................................... 124
Next Generation PSHA .......................................................................................................................... 126
Appendix A List of Abbreviations .......................................................................................................... 128
Appendix B References ......................................................................................................................... 131
Technical Reports “Onderzoekrapporten” ............................................................................................ 131
Appendix C Experts ............................................................................................................................... 133
Appendix D Universities and Knowledge Institutes .............................................................................. 136
Appendix E Recommendations from reviews of the “Hazard and Risk Assessment – Interim Update
November 2015”. ...................................................................................................................................... 137
Appendix F Progress note Groningen Scientific Advisory Committee, 1st December 2015 ................. 146

Study and Data Acquisition Plan Induced Seismicity in Groningen - Winningsplan 2016
5
1 Management Summary
Samenvatting Het eerste ‘Studie- en data-acquisitie plan’ rond door gaswinning geïnduceerde aardbevingen (in het Winningsplan voor het Groningen Gasveld ook wel aangeduid als het ‘Studieprogramma’) is opgesteld in 2012. Volgend op het Winningsplan 2013 is een vernieuwd studieprogramma opgesteld en begin 2014 gepubliceerd. De huidige, vervolgversie van het programma behoort bij het Winningsplan 2016.
Dit plan beschrijft de studies en dataverzameling die momenteel lopen en nog in het verschiet liggen om de continuë analyse van de risico’s rond geïnduceerde aardbevingen te blijven ondersteunen voor de komende 3 tot 5 jaar.
De hoofddoelen van het studieprogramma zijn de volgende:
1. Het verdiepen van de kennis over en inzicht in de effecten van de aardbevingsdreiging (‘hazard’) op
gebouwen en andere werken, inclusief de daaruit voortvloeiende veiligheidsrisico’s voor de regio. 2. Het uitvoeren van een volledige risico-analyse voor de regio, waarbij de onzekerheden consequent
inzichtelijk worden gemaakt en onderbouwd. 3. Het identificeren, evalueren en ontwikkelen van risicomitigerende maatregelen, onder meer via:
productie, bijvoorbeeld in de vorm van hoeveelheden en plaats van de winning binnen het veld
de optimalisatie van het bouwkundig versterken door: o De identificatie van gebouwen of gebouw-elementen die een veiligheidsrisico vormen o De vaststelling van doelmatige versterkingsopties
maatregelen geschikte voor de bredere industrie en infrastructuur Andere, belangrijke doelstellingen zijn: 4. Een transparante discussie over alternatieve en/of afwijkende wetenschappelijke inzichten en het
initiëren van aanvullende studies of dataverzameling om tot een gemeenschappelijk beeld en consensus te komen binnen de betrokken kennisinstituten en wetenschappelijke kringen.
5. Het meten van de daadwerkelijke compactie, bodemdaling en seimiciteit. 6. Het continue verbeteren van de kennis over en het begrip van de fysische mechanismen die leiden tot
geïnduceerde seismiciteit en de daaruit voortvloeiende dreiging. 7. Het verkleinen van de onzekerheden binnen de risico-analyse. 8. Het bijdragen aan de dreigingsanalyse gebruikt door de beheerders van de andere industriële
installaties en infrastructuur. De onderzoeksgebieden binnen dit plan beslaan in volgorde de volgende ‘oorzaak-gevolg’ keten: 1. De drukdaling in het gasveld (depletie) door de winning van gas 2. De krimp (compactie) van het gasvoerend gesteente als reactie op de drukdaling 3. Het veroorzaken (induceren) van aardbevingen over breuken door de compactie 4. De grondbewegingen die deze aardbevingen vervolgens te weeg brengen aan het aardoppervlak 5. Het meebewegen (de respons) van gebouwen op deze grondbeweging 6. De effecten op de bewoners in termen van schade en mogelijk bezwijken van gebouwen of
gebouwdelen

Study and Data Acquisition Plan Induced Seismicity in Groningen - Winningsplan 2016
6
Ook het Winningsplan bevat diverse paragrafen die de monitoring beschrijven. Om meer kennis te vergaren is het bestaande meetnet en instrumentarium om metingen te verrichten aanzienlijk uitgebreid. Om de compactie, de bodemdaling, de aardbevingen, grond- en gebouwbewegingen nauwkeuriger te kunnen meten:
zijn er 10 permanente GPS stations geïnstalleerd, waar door middel van satellietobservatie de daling van de bodem wordt gevolgd.
zijn er, volgens een vast raster boven het gasveld, circa 70 ondiepe putten aangelegd, met daarin geofoons en accelerometers die de aardbeving lokaliseren en de grondbeweging meten.
zijn op de locatie Zeerijp twee tijdelijke boorgaten met geofoons vervangen voor blijvende, diepe boorgaten met geofoons, waarmee de diepte en lokatie van aardbevingen nauwkeurig kunnen worden bepaald.
is een glasvezelnetwerk aangelegd waarmee de meetgegevens ‘realtime’ kunnen worden doorgegeven aan onder meer het KNMI en TNO.
worden periodiek gravitatiemetingen verricht, waarmee onder meer de grondwaterstanden in en rond het reservoir kunnen worden gevolgd.
is de aanleg van een aantal nieuwe putten tevens gebruikt om intensief metingen en onderzoek te doen naar het gesteente en bijvoorbeeld drukken in het gasveld.
is tijdens het boren van de put Zeerijp-3A (de eerder genoemde put voor geofoons) een kern geboord uit een aanzienlijke sectie uit het gas- en watervoerend gesteente van het Rotliegend en het Carboon, dit om nader onderzoek te doen naar het gesteente.
is de ondiepere ondergrond en bodemsamenstelling in de provincie gedetailleerd gekarteerd en zijn de grondeigenschappen nader in beeld gebracht door middel van een aanvullende meetcampagne.
zijn meer dan 300 accelerometers geplaatst aan de fundering van diverse gebouwen in de regio. De kwaliteit van elke studie die wordt uitgevoerd door of namens de NAM wordt bewaakt door zowel interne beoordelingen als diverse externe en onafhankelijke verificaties. Daarbij wordt een meerlaags kwaliteitsproces gehanteerd: 1. Interne kwaliteitscontrole 2. Onafhankelijke kwaliteitsbeoordeling door derden, op verzoek van de NAM 3. Onafhankelijke kwaliteitsbeoordeling, op verzoek van het Ministerie van Economische Zaken (EZ) 4. Kwaliteiscontrole door de toezichthouder, het Staatstoezicht op de Mijnen (SodM) 5. Onafhankelijke kwaliteitsbeoordeling door derden, op verzoek van SodM 6. Kwaliteitsbeoordeling door onafhankelijke onderzoeksinstituten en/of deskundigen Door het beschikbaar stellen van de onderzoeken, de onderligende (ruwe) data, de visie van bovengenoemde partijen die de kwaliteit bewaken en waar mogelijk Nederlandse vertalingen hiervan, wordt een zo hoog mogelijke transparantie nagestreefd. De NAM is daarenboven voorstander van een kwaliteitsproces conform het SSHAC level-3 proces dat wordt gebruikt voor de analyse van de seimische dreiging voor locaties waar grote projecten als nucleaire centrales en stuwdammen worden gerealiseerd. Dit proces wordt als ‘best practise’ gezien wanneer het gaat om de kwaliteitsbewaking rond complex technische vraagstukken. Het studieprogramma bechrijft aldus een pallet aan studies en onderliggende onderzoeksvragen. Onder meer de volgende voorstellen hebben daarin een plaats gekregen:

Study and Data Acquisition Plan Induced Seismicity in Groningen - Winningsplan 2016
7
Het onderzoek naar ‘sub-salt’ breuken
Het gedrag van breuken
Aanpassingen in het reservoirmodel voor het Groningen gasveld
Aanvullende dataverzameling rond bodemdaling
In-situ (in de ondergrond zelf) monitoring van compactie
Analyse van de boorkern op onder meer gesteente-eigenschappen
Modellering van fysische eigenschappen achter compactie
Ontwikkeling van flexibele monitoringssystemen voor seismiciteit
Bouw van een netwerk aan geofoons
Distributed Acoustic Sensing (DAS) door middel van sensoren via glasvezelkabels
Plaatsbepaling van het hyocentrum en kracht van aardbevingen
Modellering van breuken
In-situ spanningsmetingen
Ontwikkeling van alternatieve seismische modellen
Beoordeling van de effecten van sterk fluctuerende productie
Metingen van de grondbeweging en uitbouw van de database met meetgegevens
Verdieping van de kennis rond grondbeweging als gevolg van lokale bodemgesteldheid
Verfijning van de Ground Motion Prediction Equation (GMPE)
Ruimtelijke verdeling en samenhang van bodembewegingen
Onderzoek naar grondsoorten als zwelklei, veen en antropogene bodem in wierden
Analyse van verwekingseffecten (liquifactie)
Uitbreiding en verfijning van de gebouwendatabase
Onderzoek naar de eigenschappen van bouwmaterialen
Laboratorium testen van (niet-)constructieve elementen van gebouwen
Modellering van (niet-)constructieve bouwelementen
In-situ (ter plekke) testen van de weerstand van gebouwen
Beoordeling van potentieel vallende gebouwelementen en objecten
Verfijning van de ‘Monte Carlo’ risicomodellering
Beheersmaatregelen om de seismische risico’s te verkleinen
Vergelijk van de voorspelkracht van diverse seismologische modellen
Ontwikkeling van de volgende generatie probalistische risico-analyse voor seismiciteit (PSHA)

Study and Data Acquisition Plan Induced Seismicity in Groningen - Winningsplan 2016
8
Summary of this report
Background to this Report The first Study and Data Acquisition Plan for induced seismicity in Groningen was prepared in 2012. Following
Winningsplan 2013 an updated was issued early 2014. This current update of the Study and Data Acquisition Plan
accompanies Winningsplan 2016.
The report describes the studies and data acquisition activities undertaken and planned to support the assessment
of hazard and risk resulting from induced seismicity in Groningen for the next 3-5 years.
Conclusions The main objectives of the Study and Data Acquisition Plan are to:
1 Understand the impact of the earthquake hazard on buildings and other structures and the subsequent
impact on safety of the community;
2 Perform a fully integrated Hazard and Risk Assessment for the Groningen region, with all uncertainties
fully and consistently recognised and quantified;
3 Identify, evaluate and develop mitigation options to reduce safety risk:
Production measures, i.e. changes in the production from the field
An optimised Structural Safety Upgrading program:
o Identify buildings and/or building elements that pose a safety risk
o Establish optimal structural upgrading methodologies
Measures for industry and infrastructure. Other important objectives are to:
4 Discuss the merits of alternative scientific views, and initiate additional studies and/or data acquisition to
promote consensus amongst the knowledge institutes;
5 Monitor compaction, subsidence and seismicity;
6 Continuously improve our understanding of the physical mechanisms leading to induced seismicity and
the resulting hazard;
7 Reduce the uncertainty in the hazard and risk assessment.
8 Hazard assessment tailored for infra-structure and industry.
The research areas included in the Study and Data Acquisition Plan are: o Changing reservoir pressure (depletion) in response to gas production o Reservoir compaction in response to pressure depletion, o Generation of seismicity at faults (earthquakes) due to reservoir compaction, o Movement of the ground surface, due to earthquakes, o Response of buildings to the movement of the ground, o (Negative) impact on people in or near buildings, caused by damage or collapse of a building.
The main activities initiated to improve monitoring of compaction, subsidence and seismic activity in the field have been:
o 10 GPS stations, o 69 geophone wells and accelerometers, o 2 temporary monitoring wells with vertical geophone arrays, later replaced by, o 2 dedicated deep monitoring wells with vertical geophone arrays (Zeerijp-2 and Zeerijp-3A). o Real-time compaction monitoring fibre optic cable. o Gravimetric survey over full field. o Extensive wireline logging and pressure measurements in newly drilled wells. o Coring of a large section of the gas- and water-bearing part of the Rotliegend and Carboniferous
formations in Zeerijp-3A.

Study and Data Acquisition Plan Induced Seismicity in Groningen - Winningsplan 2016
9
o Detailed map of the shallow sub-surface and soils. Compilation of the map was followed by an extensive soil property measurement campaign.
o Installation of more than 300 accelerometers in the foundations of buildings.
Each research study carried out by or on behalf of NAM is subjected to both internal review and various types of external and fully independent reviews and verification. In this process, six layers of assurance were implemented:
1 Internal NAM-assurance; 2 Independent assurance requested by NAM; 3 Independent assurance, requested by Ministry of Economic Affairs; 4 Independent assurance by regulator SodM ; 5 Independent assurance, requested by regulator SodM , 6 Independent critics, 7 Transparency.
Data has been shared with reputable research institutes and universities to do their own research independently from NAM.
NAM proposes the introduction of an assurance process modelled after the SSHAC level-3 process used for seismic hazard assessment for the siting of large projects (e.g. nuclear facilities and hydro-electric dams). This is seen as the ’gold standard’ for technical oversights.
The document describes various studies addressing research questions. The following study proposals are included: o Investigations into sub-salt faulting, o Cenozoic fault activity, o Updates to the Groningen Reservoir Model, o Additional subsidence data acquisition, o In-situ Compaction monitoring, o Core measurements of compaction, o Compaction constitutive models, o Flexible Seismic Monitoring System, o Network of broadband sensor geophone wells, o DAS seismic monitoring, o Determination of hypo-centre and magnitude, o Core measurements and models for rupture processes, o In-situ stress measurements, o Development of alternative seismological models, o Assessment of hazard changes due to swing production, o Measurements of Ground Motion and expansion of the database, o Measurement of site (local soil) response, o Refinements to the Ground Motion Prediction methodology, o Spatial correlation of Ground Motions, o Wave-field Simulation-based Event Characterisation, o Investigation into Swelling Clays and Peat, o Investigation into anthropogenic soil (e.g. wierden), o Investigation into Liquefaction, o Expansion and refinement of the Exposure Database, o Properties of building materials, o Experimental tests of Structural and non-structural elements of buildings, o Modelling and testing of Structural Components of buildings and Systems, o In-situ dynamic testing of buildings, o Modelling and testing of non-Structural Components of buildings, o Assessment of Falling Objects, o Modifications to the Monte-Carlo Risk Engine,

Study and Data Acquisition Plan Induced Seismicity in Groningen - Winningsplan 2016
10
o Control Optimisation for Earthquake minimization, o Comparing predictive performance seismological models, o Next Generation PSHA

Study and Data Acquisition Plan Induced Seismicity in Groningen - Winningsplan 2016
11
2 Introduction
History of induced earthquakes in Groningen Since 1986, relatively small earthquakes have been recorded near producing gas fields in the provinces of Groningen, Drenthe and Noord-Holland and in northern Germany.
A multidisciplinary study on the subject of induced seismicity was initiated by the Ministry of Economic Affairs in the early 1990’s, and guided by an Advisory Committee (Begeleidingscommissie Onderzoek Aardbevingen, BOA). It was concluded that the observed earthquakes were indeed of non-tectonic origin and induced by reservoir depletion (i.e. gas production). The study was published in 1993 (Ref. xx). Following up on the conclusions, it was agreed between NAM and the Royal Dutch Meteorological Institute (KNMI) to install a shallow borehole seismometer network in the Groningen area. The network was designed to detect earthquakes, pinpoint their locations and quantify their magnitudes, and has been operational since 1995. Additional accelerometers were installed in areas with highest earthquake frequency.
1986 First induced earthquake observed in North-Netherlands (Assen M= 2.8)
Early ’90 Multidisciplinary Study (1993) concluded:
“Gezien de resultaten van het onderzoek naar de relatie tussen gaswinning en aardbevingen komt de commissie tot de slotsom dat onder bepaalde omstandigheden aardbevingen het gevolg zijn van gaswinning.”
“Given the results of the research into the relationship between gas production and earthquakes, the committee concludes that under certain circumstances earthquakes are caused by gas production.”
1995 Seismic network operational
1995 KNMI estimates a maximum magnitude for Groningen: Mmax= 3.3
1995 Agreement between NAM, Groningen and Drenthe on damage claim handling
1997 Roswinkel earthquake with M= 3.4
1998 KNMI adjusts estimate of maximum magnitude: Mmax= 3.8-4.0
2001 Establishment of Tcbb (Technische commissie bodembeweging)
2001 Alkmaar earthquakes with M= 3.5 and M= 3.2
2003 Technisch Platform Aardbevingen (TPA) established
2004 KNMI adjusts estimate of maximum magnitude: Mmax= 3.9
2004 First Probabilistic Seismic Hazard Analysis by TNO and KNMI
2006 Westeremden earthquake with M= 3.4
2009 Calibration study by TNO (Damage analysis)
2011 Deltares assesses the Building Damage in Loppersum and confirms Mmax= 3.9
2012 Huizinge earthquake with M= 3.6
2012 Launch of Study and Data Acquisition Plan Induced Seismicity Groningen
2013-16 Launch of several compensation schemes for local residents
2015 NAM transfers handling of damage claims and strengthening of houses to newly founded Centrum Veilig Wonen
2015 Dutch Safety Board issues report and recommendations
Figure 2.1 Timeline events before and after the earthquake of 16th
August 2012 in Huizinge
Figure 2.1 lists a number of key historical events associated with production-induced seismicity in the Netherlands.
The seismic monitoring network showed a gradual increase in seismic activity, particularly after 2003. Initially, this increase was considered to be a statistical variation within the uncertainty range of the measurements. NAM did

Study and Data Acquisition Plan Induced Seismicity in Groningen - Winningsplan 2016
12
not respond adequately to this increase in seismic activity. The 2006 earthquake near Westeremden in particular, with a magnitude M = 3.4, should in hindsight have triggered more curiosity and a more critical (re)assessment of the issue of induced earthquakes. A number of studies were initiated, such as the detailed mapping of all faults in the reservoir, the “Kalibratie-studie” by TNO and the assessment of building damage by Deltares. The main focus was on surveying damage and understanding the damage pattern, not on reassessing the geomechanical and seismological paradigm. The Dutch Safety Board (Onderzoeksraad voor Veiligheid, OVV) concluded in 2015:
“…….The parties involved in gas extraction for a long time felt no urgency to do research to reduce the uncertainties surrounding the gas extraction from the Groningen field. Until the warning from the regulator in 2013, knowledge development about the potential impact of gas extraction was performed fragmentarily. No integral and independent scientific research was carried out into the deep subsurface in Groningen and the effective mechanisms taking place at depth. Moreover, the parties did not have an open attitude towards critical voices questioning the correctness of assumptions. Those involved should, in the opinion of the council, have realized at an early stage that a large-scale and long-term intervention, such as the exploitation of the Groningen field, might carry unknown risks. Uncertainty and the reduction thereof should have been at the basis of all their actions.”
1
A renewed focus on, the issue of seismicity induced by gas production in Groningen started in 2012 and was triggered by three factors. First, the earthquake near Huizinge (16
th August 2012) with magnitude Mw=3.6 was felt
as more intense and with a longer duration than previous earthquakes in that area. Compared with previous earthquakes, significantly more building damage was reported as a result of this earthquake. Second, a general realization had started to materialize that over the past few years seismicity in the Groningen area had increased beyond statistical variation. Third, and most important, studies by SodM, KNMI and NAM concluded that the uncertainty associated with the earthquake hazard in the Groningen field was larger than previously thought. It was realized that the earthquakes could pose a potential safety risk.
After the Huizinge event, NAM wanted to provide a detailed seismic hazard and risk assessment. To that end, NAM set up an extensive accelerated research program, at a cost of approximately 100 mln € in the period 2014 to 2016. This research program has produced many important new insights in seismicity and seismic risk.
Data from the Groningen areas were scarce and often non-existent. Due to this paucity of data, up until now the hazard and risk assessment was largely based on analogies with tectonic earthquakes – and therefore inherently conservative. This conservative assessment of hazard and risk caused a high level of anxiety in the Groningen community, and a widespread sense of insecurity and feelings of unrest.
With the current study update, the study program has reached a point where for the first time the hazard and risk assessment is primarily based on measurements from the Groningen area. This is an important milestone.
1 The report by the OVV was written in Dutch. The Dutch text is: “…….de bij de gaswinning betrokken partijen lange tijd geen urgentie voelden
om onderzoek te doen dat de onzekerheden kon reduceren waarmee de gaswinning uit het Groningen veld omgeven was. Kennisontwikkeling over de mogelijke gevolgen van de gaswinning vond tot de waarschuwing van de toezichthouder in 2013 fragmentarisch plaats. Er was tot 2013 geen sprake van een integraal en onafhankelijk wetenschappelijk onderzoeksprogramma om de diepe ondergrond in Groningen en de daar werkzame mechanismen in kaart te brengen. Daarnaast hadden de betrokken partijen geen open houding tegenover kritische tegengeluiden die de juistheid van aannames ter discussie stelden. Betrokkenen hadden zich, naar het oordeel van de raad, al in een vroeg stadium moeten realiseren dat een grootschalige en meerjarige ingreep, zoals the exploitatie van het Groningen veld, onbekende risico’s met zich mee zou brengen. Onzekerheid en de reductie ervan hadden het uitgangspunt moeten zijn van hun handelen.”

Study and Data Acquisition Plan Induced Seismicity in Groningen - Winningsplan 2016
13
Figure 2..2 Cover of the book “Bevingen – aardbevingen in Groningen; Gevolgen – Ervaringen – Emoties” by Mike Tomale.
(Photo: Jenny de Groot).
Community concerns Before discussing the findings of the Study and Data Acquisition Plan in detail, it must be emphasized that the renewed interest in the issue of seismicity induced by gas production in Groningen is not just a technical issue. The earthquakes have left a deep imprint on the local population. For example, in his book “Bevingen”, Mike Tomale (Ref. xx) describes the community response to the earthquakes and in particular to the Huizinge earthquake of the 16
th August 2012. The people living in the Groningen field area have been confronted with an increasing intensity
of the effects of induced earthquakes.
The key challenge, therefore, is to define and execute an extensive action plan to mitigate the impact of production-induced seismicity. Responsible parties include NAM, the ministry of Economic Affairs, State Supervision of Mines (SodM) and the National Coordinator Groningen, in close cooperation with other stakeholders. To this end, the instruments currently in place for assessing and mitigating these effects – as set down in mining regulations, risk policies and, for example, building codes – are being extended and tailored to Groningen situation.
Study and Data Acquisition Plan (2013 – 2016) The NAM “Study and Data Acquisition Plan” describes the objectives and interdependencies of all study and research efforts into induced seismicity. The aim is to better understand how gas production at reservoir depth affects safety at the surface, and to test the effectiveness of mitigation measures. It was first shared with SodM and the Ministry of Economic Affairs in November 2012 and made public in January 2013. The first three years of intense study effort have resulted in many new insights. An example is the revised hazard and risk assessment issued in November 2015 that is now primarily based on measurements and validated by data from the Groningen area itself.
The program is reviewed every 6 months and adjusted when required, based on the new insights and newly acquired data. The most recent update was issued in March 2015. The plan serves to support decision- and policy-making.

Study and Data Acquisition Plan Induced Seismicity in Groningen - Winningsplan 2016
14
Objectives of the Studies and Data Acquisition The main objectives of the Study and Data Acquisition Plan are to:
1. Understand the impact of the earthquake hazard on buildings and other structures and the subsequent impact
on safety of the community;
2. Perform a fully integrated Hazard and Risk Assessment for the Groningen region, with all uncertainties fully
and consistently recognised and quantified;
3. Identify, evaluate and develop mitigation options to reduce safety risk:
Production measures, i.e. changes in the production from the field
An optimised Structural Safety Upgrading program:
o Identify buildings and/or building elements that pose a safety risk
o Establish optimal structural upgrading methodologies
Measures for industry and infrastructure.
Other important objectives are to:
4. Discuss the merits of alternative scientific views, and initiate additional studies and/or data acquisition to
promote consensus amongst the knowledge institutes;
5. Monitor compaction, subsidence and seismicity;
6. Continuously improve our understanding of the physical mechanisms leading to induced seismicity and the
resulting hazard;
7. Reduce the uncertainty in the hazard and risk assessment.
To achieve these objectives, NAM mobilized the aid of fourteen universities, knowledge institutes and laboratories and sought the assistance and advice from external experts for each relevant expertise area. The main institutes supporting the research are listed in Appendix D, while the most prominent experts (57 in total) and their roles are listed in Appendix C.
Scope of the Studies and Data Acquisition The research areas included in the Study and Data Acquisition Plan are:
Changing reservoir pressure (depletion) in response to gas production
Reservoir compaction in response to pressure depletion,
Generation of seismicity at faults (earthquakes) due to reservoir compaction,
Movement of the ground surface, due to earthquakes,
Response of buildings to the movement of the ground,
Negative impact on people in or near buildings, caused by damage or collapse of a building,
Hazard Assessment for infra-structure and industry.
By looking into all these areas, an integrated view will emerge of the possible consequences of gas production from the Groningen field. The impact is expressed in risk metrics, such as local individual risk, but also possible damage. This type of information is of critical importance to be able to take decisions on future gas production to take measures to mitigate the associated risks for people and buildings in the Groningen region. It must be noted however that risk metrics are estimates, which will change over time when more data becomes available.

Study and Data Acquisition Plan Induced Seismicity in Groningen - Winningsplan 2016
15
Figure 2.3 Causal chain from gas production to safety of people in or near a building.
The first part of this causal chain requires detailed knowledge of the deep geology of the gas reservoir. The second part requires knowledge of the buildings and presence of people in the Groningen area. Areas of required knowledge and expertise range from geology to civil engineering.
Hazard and Risk assessment for induced Seismicity in Groningen
Hazard and Risk Assessments by NAM Since 2012, the following Hazard and Risk Assessments have been issued by NAM:
Title Scope of the Study Date Issued
Winningsplan 2013 (Technical Addendum to the Winningsplan Groningen 2013; Subsidence, Induced Earthquakes and Seismic Hazard Analysis in the Groningen Field)
Fully probabilistic hazard assessment and scenario based risk assessment. (Primarily based on the analogy with tectonic earthquakes in southern Europe)
29th
November 2013
Hazard Assessment for the Eemskanaal area of the Groningen field
Fully probabilistic hazard assessment for south-western area of the Groningen field.
1st
November 2014
Hazard and Risk Assessment for Induced Seismicity Groningen, Study 1 Hazard Assessment
Fully probabilistic hazard assessment based on Groningen measurements of ground motion.
1st
May 2015 (Version 1)
Hazard and Risk Assessment for Induced Seismicity Groningen, Study 2 Risk Assessment
Fully probabilistic risk assessment; not calibrated with building experiments.
1st
May 2015
Hazard and Risk Assessment for Induced Seismicity in Groningen - Interim Update November 2015
Fully probabilistic hazard and risk assessment. (Hazard assessment incorporated site-response based on local soil conditions. Risk assessment is calibrated with building experiments and shake-table test for a terraced (URM) house.
7th
November 2015 (Version 2)

Study and Data Acquisition Plan Induced Seismicity in Groningen - Winningsplan 2016
16
Hazard Assessments by KNMI Since 2012, the following Hazard and Assessments have been issued by KNMI:
Title Date Issued
Report on the expected PGV and PGA values for induced earthquakes in the Groningen area
December 2013
Probabilistic Seismic Hazard Analysis Induced Earthquakes Groningen April 2014
Probabilistic Seismic Hazard Analysis for Induced Earthquakes in Groningen; Update 2015.
October 2015 (Version 1)
Study and Data Acquisition Plan (Post Winningsplan 2016) In a letter to the Minister of EZ dated 13
th January 2014, SodM advised that NAM should prepare a fully
probabilistic seismic risk analysis2 as soon as possible. Such a hazard and risk assessment was first published in
November 2015, following a period of intensive data acquisition and study. This is the first risk assessment that is fully based on data acquired in Groningen.
This, however, does not mark the end of the Study and Data Acquisition Program. The research program will continue in the future. Several studies initiated in 2014 are still in progress. An example is the study on the core taken in the Zeerijp-3A well. Other studies are extended to further attain the objectives of the “Study and Data Acquisition Plan” versions issued in 2012 and 2014. Also, several reviews (See Appendix F, G and H) of the “Hazard and Risk Assessment – Interim Update 2015” issued in November 2015 have recommended new studies and extension of the ongoing program.
This report “Study and Data Acquisition Plan for Induced Seismicity in Groningen – Update Post-Winningsplan 2016” details the next phase of study and data acquisition, and is vital input to the Winningsplan 2016. The plan will be coordinated by NAM, and executed in close collaboration with the large group of independent universities, knowledge institutes and academics. The role of these independent institutions continues to increase. The Plan incorporates the main technical recommendations from external sources. The main reviews have been attached to this report as appendices, while appendix E gives describes how these recommendations have been incorporated in the current report.
2 Brief aan de Minister of EZ betreffende “aanbieding advies “wijziging Winningsplan 2013”en “meet- en monitoringsplan”” van 13 januari 2013, sectie 3.4.6 Conclusies Bodembeweging: “NAM dient op zo kort mogelijke termijn een volledig probabilistische seismisch risicoanalyse uit te voeren.”.

Study and Data Acquisition Plan Induced Seismicity in Groningen - Winningsplan 2016
17
3 Data Acquisition
Seismicity in Groningen is scientifically exceptional in three important aspects. First, it is induced by the withdrawal of gas. Most of the seismicity taking place on earth is due to either tectonic processes and most anthropogenic seismicity is the result of injection of water or other fluids. Second, the Groningen area is overlain by thick layers of very soft deposits, which in turn overlie a very specific local profile of chalk above a high-velocity salt layer. The earthquakes originate in the sandstone reservoir below the salt. And third, the buildings in the Groningen area have been designed and constructed without consideration for the horizontal loads these buildings will experience during an earthquake. This means that the ground acceleration levels at which damage and certain structural consequences may be caused tend to be lower in Groningen than in typical tectonic regions.
These idiosyncratic conditions in the Groningen area require the hazard and risk assessment be based on local data specific for Groningen. This section describes the main Groningen-specific data acquisition projects and seismic monitoring operations. These Groningen data will provide input for multiple studies.
The main activities initiated to improve monitoring of compaction, subsidence and seismic activity in the field have been:
1. 10 GPS stations. Installed at NAM locations throughout the Groningen field to continuously monitor both the
vertical and the horizontal component of subsidence.
2. 69 geophone wells and accelerometers. Extension of (existing) passive seismic monitoring network, to
improve the resolution over the whole Groningen field,
3. 2 temporary and later replaced by 2 dedicated vertical geophone arrays. Installation over the reservoir
section in deep wells located in the Loppersum area, to improve the determination of earthquake hypocenters:
a. Temporary geophone arrays were placed at and around the reservoir interval (at 3 km depth) in two
deep observation wells in the Loppersum area (Zeerijp-1 and Stedum-1). These strings have been
operational from late 2013 to early 2016.
b. Plans have been made to place a another temporary geophone array in a deep observation well near
Harkstede (Harkstede-2A).
c. The temporary geophone arrays in the Loppersum area were replaced in 2015 by permanent seismic
monitoring arrays in two newly drilled wells (Zeerijp-2 and Zeerijp-3A) in this same area.
4. Real-time compaction monitoring fibre optic cable. Installation of a real-time compaction monitoring device
(fibre-optic cable) in the Zeerijp-3A well, measuring temperature and compaction along the well trajectory. The
same device will also be used for monitoring of micro-seismic events, when the next generation seismic
interrogation units become available.
5. Gravimetric survey. Acquisition over the full field area.
6. Extensive wireline logging and pressure measurements. In newly drilled wells, including acquisition of shear
and pressure wave velocity data over the full length of the well.
7. Coring. Coring of a large section of the gas- and water-bearing part of the Rotliegend and Carboniferous
formations in Zeerijp-3A.

Study and Data Acquisition Plan Induced Seismicity in Groningen - Winningsplan 2016
18
8. Detailed map of the shallow sub-surface and soils. Compilation of the map was followed by an extensive soil
property measurement campaign.
9. Installation of more than 300 accelerometers in the foundations of buildings.
The data acquired through this installed equipment and these campaigns form the basis of the current hazard and risk assessment and the further study work described in this study and data acquisition plan.
All acquired data are publicly available for additional analysis and are widely shared with academia around the world.
Production Volumes and Pressure During operation of the gas field, wellhead pressures and produced gas volumes are monitored and recorded continuously. In observations wells the reservoir pressure is measured regularly at the reservoir depth.
Gravimetric survey In September 2015 a new gravity survey was gathered on 92 locations over the Groningen field. The gravity survey was carried out by Quad Geometrics in consultation with TU Delft. At each location three measurements were taken for one hour each. Previously four gravity surveys have been taken in the Groningen field (1978, 1984, 1988 and 1996).
After correction for tides and local ground water levels the small changes in the local gravity (time lapse) can be used to evaluate the water influx into the depleted gas reservoir (currently ongoing). The survey will be repeated in 5 years time.
Subsidence and Compaction
Surveying techniques Current surveying techniques are:
- Spirit levelling - PS-InSAR (Satellite Radar Interferometry) - GPS (as part of GNSS: Global Navigation Satellite System)
Spirit Levelling This technique has been used for Groningen since 1964, with a recent repeat interval of 5 years. Surveys are executed according to regulations defined by RWS-DID as stated in ‘Productspecificaties Beheer NAP, Secundaire waterpassingen t.b.v. de bijhouding van het NAP, versie 1.1 van januari 2008’.
The equipment used includes certified, self registering, optical levelling instruments and barcode level staffs. Measurements are registered fully automatic in a registration and validation system defined by RWS-DID.
PS-InSAR Since 2010, deformation based on PS-InSAR technique is reported, in conjunction with a number of levelling trajectories for validation.
Deformation is estimated from phase differences between the acquisitions and persistent scatterers (Hanssen, 2001). The spatial resolution depends on the presence of natural reflectors, such as buildings. To obtain a precision comparable to levelling, error sources (like atmospheric disturbance, orbital inaccuracies) need to be estimated and removed. To support this, a time series of satellite images is required (>20-25 images) and ample resolution of scatterers. The estimated deformation velocity from InSAR observations is 0.5-2 mm/year (see Ketelaar, 2009).

Study and Data Acquisition Plan Induced Seismicity in Groningen - Winningsplan 2016
19
The big advantages of the InSAR technique are its high temporal resolution (> 10x per year) and the dense spatial resolution. No survey crew is required in the field, hence no disturbance of the area and no security risks. Moreover, the accuracy of PS-InSAR is comparable to levelling.
Global Positioning System Stations Global Positioning System (GPS) stations have been placed at 10 Groningen field facilities; Eemskanaal; Froombosch, ’t Zandt, Overschild, Tjuchem, Tankerpark Delfzijl, Zuiderveen, Stedum, Usquert and Zeerijp. A first GPS station was already placed on the Ten Post location in Q1 2013. The new stations are recording since 26
th
March 2014. GPS stations are continuously monitoring the horizontal and vertical components of subsidence of the ground surface. They are best placed on an existing building. Locations Stedum, Usquert and Zeerijp, do not have buildings. There, a three legged reinforced concrete construction was placed to anchor the GPS. Data is transferred from the GPS locations by 3G/4G modems.
Figure 3.1 Location of the GPS station in the Groningen field.

Study and Data Acquisition Plan Induced Seismicity in Groningen - Winningsplan 2016
20
Figure 3.2 Location of the GPS station attached to buildings in the Groningen field.
Figure 3.3 Location of the GPS station anchored on a tripod construction in the Groningen field.
Eemskanaal
Overschild
Froombosch
Zuiderveen
Tjuchem
Tankenpark Delfzijl
‘t Zandt
Stedum Zeerijp
Usquert
4G Modem
ThermostatHeater
GPS Reciever
Power supply
Main Power Switch
HeaterAntenna
4G Modem
Equipment cabinet
Foundation Foundation Top View

Study and Data Acquisition Plan Induced Seismicity in Groningen - Winningsplan 2016
21
Compaction in Observation Wells Gamma ray markers have been placed in several wells across the Groningen field, at regular depth intervals. Monitoring the (change in the) distance between markers over time gives insight into the compaction of the reservoir. The markers were originally installed in 11 wells across the Groningen field, six of which are still accessible for surveying, while three wells are logged regularly. These marker interval data have been recorded over several decades, and have always been reported as average reservoir strains.
Zeerijp-3 Fibre Optic In well Zeerijp-3 a fibre optic cable was run outside the casing and cemented in place with the casing. The cable allows various measurements along the well path:
1. DTS : Distributed Temperature Sensing,
2. DSS : Distributed Strain Sensing,
3. DAS : Distributed Acoustic Sensing.
A light signal is sent from surface through the glass fiber optic and back scattered waves (from natural scatterers or artificial reflectors) are received back. Changes in the reflected intensity are caused by changes in the optical path length and are very sensitive to both strain and temperature variations of the fiber. Measurements can be made almost simultaneously at all sections of the fiber. After installation the system clearly showed the temperature changes during the cementing operations and the subsequent setting of the cement.
More importantly for the earthquake research, the system can also detect reservoir compaction. The Real-Time Compaction Imager (RTCI) applies advanced fiber-sensing technology to monitor well integrity in real time without well intervention. A special fiber optic cable containing a large number of closely spaced (~ 1 cm) fiber Bragg-grating strain gauges is wrapped around a well tubular, and the strains at each discrete gauge along the fiber are simultaneously recorded.

Study and Data Acquisition Plan Induced Seismicity in Groningen - Winningsplan 2016
22
Figure 3.4 Very preliminary data; example of compaction measurements in Zeerijp-3 well.
Elongationn

Study and Data Acquisition Plan Induced Seismicity in Groningen - Winningsplan 2016
23
Monitoring Seismicity High resolution mapping of seismicity and lowering of the current detection and location magnitude threshold is required for a better geomechanical understanding of the earthquake hazard. The improved determination of the locations of the hypocenters of the earthquakes allows better tie-in with the structural model of the Groningen Field.
Extension passive Seismic Geophone Network KNMI The original configuration of the Groningen monitoring network has provided field-wide coverage since 1995 for the detection and location of all events with a magnitude larger or equal to 1.5 (M≥1.5 events). This North Netherlands network consisted of 14 borehole stations, 8 installed in 1995 and extended in 2010 with an additional 6 stations, plus 12 accelerometers. The network recorded a catalogue of 233 M≥1.5 events between January 1995 and December 2015 and is the primary basis for current earthquake hazard assessment within the field. The horizontal location uncertainties are typically about 0.5 km and the events are assumed to occur at a depth of 3km.
In 2013 a start was made with the extension of this monitoring network. This extended monitoring network has two key advantages over the original network; improved sensitivity and improved accuracy.
• More sensitive: a more reliable detection and location of more M<1.5 events within the field allows more robust statistical analysis of the relationship between the number of earthquakes and gas production.
• More accurate: earthquake locations with sufficient accuracy will help to reveal their relationship with mapped faults. Together with their depth distribution relative to the reservoir this will improve the understanding of the causal mechanism of these earthquakes.
To deliver the earthquake data necessary to realize these objectives, the performance criteria for the network were set:
• Detect 10 events for every M≥1.5 event. Starting from the assumption that the existing earthquake population has a b-value of 1, this means reducing the magnitude of completeness from the current M=1.5 to M=0.5.
• Locate all detected events with a standard horizontal error of less than 200 m and a standard vertical error of less than 500 m (the depth determination is expected to be very dependent on local geology; this criterion might therefore not be met everywhere in the field).
To improve the resolution over the entire Groningen field an extension of the (existing) passive seismic monitoring network was implemented with installation of additional seismometers and accelerometers spread in 6x6km grid with centre point, covering the entire Groningen Field. The network (Phase I) consists of 69 passive geophone stations including surface accelerometers. Each 200m deep borehole is equipped with 4 geophones at 50, 100, 150 and 200 meters depth and, one accelerometer at surface, together with the required electronics for data-transmission, pre-amplifiers and communication means.

Study and Data Acquisition Plan Induced Seismicity in Groningen - Winningsplan 2016
24
Figure 3.5 Extension of the shallow borehole geophone network with 69 locations. The locations indicated by A have a
stable data connection; B: have an instable data connection and C: no data connection. The data is stored at the
station location.
The final locations have been chosen in collaboration with KNMI considering local restrictions. Locations of the The locations have been chosen in collaboration with KNMI. Local restrictions related to the impact of noise emanating from for instance railroad, pipeline or traffic have been considered, together with proximity to electricity and data cables and landownership. These practical considerations have caused the grid to be slightly irregular. Densification of the grid has taken place in some areas to optimize areal or vertical event location accuracy, associated with the varying thickness of the Zechstein salt. Studies are in progress to determine more of these locations. Several additional stations (some 15) equipped with an accelerometer have been placed around the field.

Study and Data Acquisition Plan Induced Seismicity in Groningen - Winningsplan 2016
25
Figure 3.6 Accelerometer station only.
Operations to place the additional shallow borehole geophone network commenced in May 2014, with start of monitoring by the first new borehole stations in June and completion of the network in October 2014. The project was managed by engineering company Antea. The data is directly streamed to the KNMI offices in De Bilt. Upon completion of the network the ownership has been handed over to KNMI, who will manage and maintain the network.
Additionally, four boreholes equipped with strong motion sensors (low frequency geophones) are planned in order to record the signals for the very largest potential events without clipping and enable ongoing recalibration/updating of the ground motion attenuation relations associated with high range potential earthquakes. Technical design of these four stations in close collaboration with KNMI is near completion.

Study and Data Acquisition Plan Induced Seismicity in Groningen - Winningsplan 2016
26
Figure 3.7 Extension of the shallow borehole geophone network.
Compaction
(cm)

Study and Data Acquisition Plan Induced Seismicity in Groningen - Winningsplan 2016
27
Figure 3.8 Extension of the shallow borehole geophone network.
Subsurface vertical seismic arrays Downhole seismic monitoring allows monitoring at substantially reduced noise conditions thereby improving signal-to-noise ratio, magnitude detection threshold and precision of the hypocenter determination. Originally, the vertical location of earthquakes were assumed to be at a depth of 3 km. Implementation of a subsurface seismic array would potentially lead to increased accuracy in horizontal and vertical location of events.
Challenges in borehole seismology are a secure deployment of sensors, safe data transmission to surface, formation temperature and pressure and reservoir fluids. Moreover, drilling requires considerable preparation time. As downhole instruments need to operate at elevated pressure and temperature conditions, proper engineering is essential.
The two subsurface installed vertical arrays in the Loppersum area have sensors covering Zechstein down to Carboniferous. The sensors are designed for a target event magnitude range of M=-2.5 to M=+1 over the distance range 500m to 10 km, and a system minimum sampling frequency of 2KHz (0.5ms data).
Temporary vertical seismic arrays Two existing observations wells in the Loppersum area (Stedum-1 and Zeerijp-1) were selected to be modified into seismic observation wells, to implement subsurface measurements as soon as feasible. Both wells were drilled more than 35 years ago, and were not initially designed as seismic observation wells. To be able to record seismic data as soon as possible, vertical seismic arrays have been temporarily installed without performing a workover, whilst a more permanent seismic monitoring option was developed (see next section). Advantage of this solution

Study and Data Acquisition Plan Induced Seismicity in Groningen - Winningsplan 2016
28
was deployment at short notice. However, the disadvantage is that the vertical coverage is limited to the reservoir section only (below the tubing already installed in the well).
Based on the experience gained in Bergermeer (Taqa), a system was designed and installed in October 2013. Two arrays were installed with 8 and 11 stations respectively, and with 30m station spacing. The installation required killing of the well to avoid gas inflow, installation of additional pressure control equipment, and communication and data collection equipment. Objective is to have the equipment operational until the permanent monitoring wells are in place. Continuous monitoring started immediately after installation; and data was made available via a GSM connection to KNMI and Magnitude for further analysis.
The temporary geophone strings installed in the Stedum observation well started to record data in November and in the Zeerijp well in December 2013. Both the Stedum and the Zeerijp-1 geophone strings suffered from regular failures. Despite these failures very valuable data on the depth of the earthquakes in the Loppersum Area has been collected to date.
Figure 3.9 Deep Geophone well Stedum-1.
With the new seismic monitoring well fully operational, data acquisition from the Stedum-1 and Zeerijp-1 wells has been phased out. Both observation wells will return to their original duties; monitoring compaction, reservoir pressure and water influx into the reservoir. The Stedum well is completed with radio-active markers for in-situ compaction monitoring (one of three wells monitored regularly for compaction at reservoir level), while the Zeerijp-1 well is an important well for monitoring the aquifer influx from the Oldorp aquifer (pressure and TDT).
Plans have been prepared for installation of a temporary geophone array in the existing monitoring well Harkstede-2A, to add seismic monitoring capacity in the southwest of the Groningen field.

Study and Data Acquisition Plan Induced Seismicity in Groningen - Winningsplan 2016
29
Figure 3.10 Installation of the temporary deep geophone string in well Stedum-1. .

Study and Data Acquisition Plan Induced Seismicity in Groningen - Winningsplan 2016
30
Monitoring Well SDM-1
Phase 1: 09-10-2013 to 23-12-2013
Phase 2: 18-03-2014 to 24-05-2014
Phase 3: 19-06-2014 to 23-08-2014
Phase 4: 03-09-2014 to 07-01-2015
Phase 5: 23-01-2015 to 29-06-2015
Phase 6: 03-07-2015 to 02-12-2015
Phase 7: 24-12-2015 to now
Monitoring Well ZRP-1:
Phase 1: 21-11-2013 to 20-02-2014
Phase 2: 21-02-2014 to 26-05-2014
Phase 3: 02-06-2014 to 20-06-2014
Monitoring Well ZRP-3
Phase 1: 9-11-2015 to 12-02-2016
Table 3.1 Temporal coverage of the two temporary seismic observations wells in Stedum and Zeerijp. .
Permanent vertical seismic arrays For the installation of permanent vertical seismic arrays it was opted to drill two new dedicated observation wells. Dedicated new wells have several advantages over using existing wells:
1 From an operational standpoint, the temporary geophones in existing observation wells are complicated and require special safety precautions. Replacing geophone strings in new wells is inherently safer as these wells are not perforated.
2 The existing monitoring wells have a completion design that only allows installation of a geophone array with a limited aperture. The difficulties with the interpretation of the data acquired so far demonstrates the importance of a larger aperture of the geophone string, which can be achieved in the new wells.
3 Currently, geophones have been installed. These geophones have suffered from recurring failures time and again. The new wells provide the opportunity to install high quality geophones, which are expected to be more robust at prevailing high temperature conditions.

Study and Data Acquisition Plan Induced Seismicity in Groningen - Winningsplan 2016
31
Figure 3.12 Locations for the two permanent geophone wells in the Loppersum Area.
Without compromising the seismic monitoring objectives of these wells, additional data was acquired in these wells:
Both Wells:
o Density logging of the full well length (for calibration of the velocity model and determination of vertical
stress),
o Sonic logging of both shear and compressional waves over full well length (Shear and compressional data
have been taken at 360 degree phase to determine main stress directions and stress anisotropy),
o Formation evaluation logs like resistivity,
o Image logging over reservoir section for stress field direction,
o MDT pressure measurements have been collected.
Additional for the Zeerijp-3A Well:
o Core over the Rotliegend and Carboniferous reservoir for compaction measurements (in Univ. Utrecht,
Rijswijk and Houston) and fault (re-)activation studies (Univ. Utrecht),
o Formation water sample.
ZRP_B
ZRP_C

Study and Data Acquisition Plan Induced Seismicity in Groningen - Winningsplan 2016
32
ZRP-1
ZRP-2
ZRP-3A
Figure 3.13 Well trajectory of the two permanent geophone wells in the Loppersum Area.
The data acquired in these wells support several seismological, geophysical and geomechanical studies and experimental programs.

Study and Data Acquisition Plan Induced Seismicity in Groningen - Winningsplan 2016
33
Figure 3.14 Locations for the two permanent geophone wells in the Loppersum Area relative to the structural model.
Figure 3.15 Well design for the two permanent geophone wells in the Loppersum Area
SDM-1
ZRP-1
LRM
ZND
ZRP-2
ZRP-3A
2 km
Net hydrocarbon thickness (m)

Study and Data Acquisition Plan Induced Seismicity in Groningen - Winningsplan 2016
34
Monitoring Network for Building Damage Apart from the accelerometers at the 69 geophone stations, NAM has also installed accelerometers in the foundations of buildings in the Groningen area. Initially, close to 200 buildings were selected, Some 20 of which being public buildings such as town halls of municipalities. In the course of 2015, additional accelerometers have been placed by TNO and currently the total number of sensors installed exceeds 300.
Building Selection Through www.namplatform.nl owners could request to have a sensor installed in their building. A selection of buildings was made using the following criteria:
1. Area criteria to
a. Achieve a good coverage of the seismically active area.
b. High likelihood of measuring the highest accelerations based on the hazard map
c. Proximity to geophone stations
d. Distribution to cover different soil conditions
2. Building criteria:
a. Achieve a good coverage of the building typologies
b. Cover different foundations (piles versus no piles)
During the registration additional data on the buildings was collected, also on the status of the building.
Building Sensors The vibration measurement system consists of a tri-axial vibration sensor and a central unit. The central unit is for signal conditioning (sensor conditioning, filtering) and transfer of the data to the TNO remote data center. Based on detailed specifications, NAM has selected GeoSig as the supplier for the vibration measurement systems. Their system consists of a separate recorder and sensor (Figure 3.16) with the following specifications:
Recorder: GMSplus Measuring System
Sensor: AC-73 Force Balance Accelerometer

Study and Data Acquisition Plan Induced Seismicity in Groningen - Winningsplan 2016
35
Figure 3.16 Vibration monitoring system – recorder (left) and sensor (right)
Vibration is sampled continuously at 250Hz and stored in an internal buffer. When vibration exceeds a certain threshold level (set at velocity of 1 mm/s)
3 the Data Centre is notified by sending the time of triggering. At that time
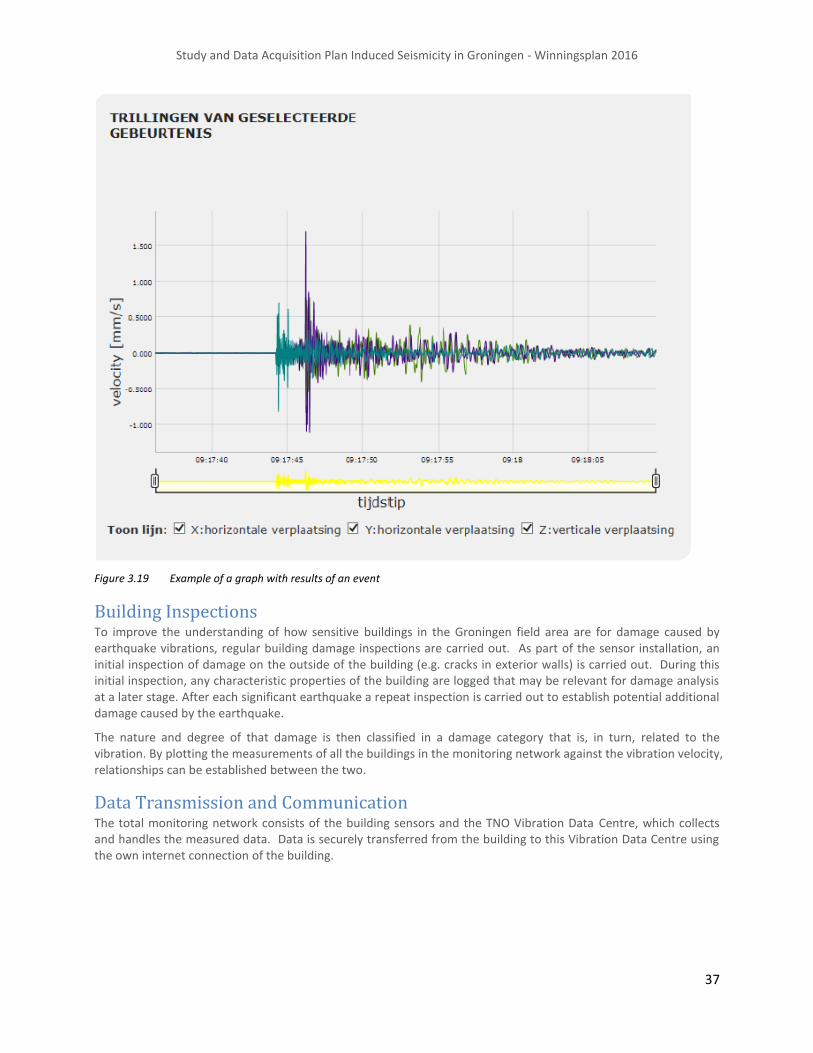
logging of the event starts with a pre-trigger duration of 10 seconds. After collecting data for 20 seconds (at 250 Hz) the time traces (one per channel) are instantaneously sent to the data centre (Fig. 3.17). In addition to the communication of measurements during the events, the vibration measurement system also sends a regular ‘heartbeat’ containing the peak vibration velocity and acceleration over the last minute. Examples of the heartbeat signal and a recording of a seismic events are shown in figures 3.18 and 3.19.
3 The trigger level of 1 mm/s is in the order of the strictest limits of the SBR directive (xx) for vibration damage. Other vibration sources like
traffic may cause such, or higher, levels. These levels tend not to occur often but when they do, they may be relevant.

Study and Data Acquisition Plan Induced Seismicity in Groningen - Winningsplan 2016
36
Figure 3.17 The sensors send their data event based when the vibration level exceeds a certain threshold and send a regular
(every minute) heartbeat signal with a maximum vibration.
Figure 3.18 Example of a graph with results of heartbeat measurement
Study and Data Acquisition Plan Induced Seismicity in Groningen - Winningsplan 2016
37
Figure 3.19 Example of a graph with results of an event
Building Inspections To improve the understanding of how sensitive buildings in the Groningen field area are for damage caused by earthquake vibrations, regular building damage inspections are carried out. As part of the sensor installation, an initial inspection of damage on the outside of the building (e.g. cracks in exterior walls) is carried out. During this initial inspection, any characteristic properties of the building are logged that may be relevant for damage analysis at a later stage. After each significant earthquake a repeat inspection is carried out to establish potential additional damage caused by the earthquake.
The nature and degree of that damage is then classified in a damage category that is, in turn, related to the vibration. By plotting the measurements of all the buildings in the monitoring network against the vibration velocity, relationships can be established between the two.
Data Transmission and Communication The total monitoring network consists of the building sensors and the TNO Vibration Data Centre, which collects and handles the measured data. Data is securely transferred from the building to this Vibration Data Centre using the own internet connection of the building.

Study and Data Acquisition Plan Induced Seismicity in Groningen - Winningsplan 2016
38
Figure 3.20 Measurements are securely transferred by making use of the household internet connection
At the Vibration Data Centre the data is analysed and sent through to NAM, where it is published at the website www.namplatform.nl. There are limitations to the level of detail at which the vibration data can be shared publicly, relating to the privacy of the house owners
Figure 3.21 Data transfer from vibration monitoring system to Vibration Data Center (VDC)

Study and Data Acquisition Plan Induced Seismicity in Groningen - Winningsplan 2016
39
4 Current assurance layers ( 2014 – 2016) Hazard and risk assessment is critically important to ensure that safety is within agreed norms set by the Meijdam Committee. It is therefore essential that the regulator, decision makers and the local community have confidence in the assessment of hazard and risk. This requires oversight. With proper oversight, stakeholders can be confident that the data and the derived models are technically sound and that any remaining uncertainty has been adequately captured.
Therefore, it was decided to subject each research study carried out by or on behalf of NAM to both internal review and various types of external and fully independent reviews and verification. In this process, six layers of assurance were implemented:
1. Internal NAM-assurance;
2. Independent assurance requested by NAM;
3. Independent assurance, requested by Ministry of Economic Affairs;
4. Independent assurance by regulator SodM ;
5. Independent assurance, requested by regulator SodM ,
6. Independent critics,
7. Transparency.
1. Internal NAM-assurance Internal technical assurance is carried out by internal experts from NAM, Shell and ExxonMobil in those areas where in-house knowledge is available, primarily geology, geophysics, geomechanics and petroleum engineering. The results are incorporated in the studies and study reports.
2. Independent assurance requested by NAM Independent review covering the complete work scope is carried out by independent external experts; that is, experts who are not aligned with NAM in any way. The internal assurance of research on geology, geophysics and petroleum engineering, is followed by external assurance carried out by the consultancy company SGS Horizon. SGS is the world's leading inspection, verification, testing and certification company active around the world in many industries. For more information on SGS visit the site http://www.sgs.co.uk/. Their conclusions will be shared at the onderzoeksrapporten page of the namplatform-site.
Dedicated assurance teams have been assigned for “Shallow Geological Model”, “Ground Motion Prediction” and “Building Fragility”. The experts in these assurance teams have an internationally recognized reputation in their respective field of expertise. The assurance team for “Shallow Geological Model” is shown in table 4.1.
External Expert Affiliation Main Expertise Area
Adriaan Janszen Exxonmobil Shallow Geological Model
Eric Meijles University Groningen Shallow Geological Model
Joep Storms TU Delft Shallow Geological Model
Tijn Berends University Groningen (student) Site Response and Shallow Geological Model
Table 4.1 The assurance team for “Shallow Geological Model”.

Study and Data Acquisition Plan Induced Seismicity in Groningen - Winningsplan 2016
40
The assurance team for “Ground Motion Prediction” is shown in table 4.2.
External Expert Affiliation Main Expertise Area
Gail Atkinson Western University, Ontario, Canada Ground Motion Prediction
Hilmar Bungum NORSAR, Norway Ground Motion Prediction and panel for the maximum magnitude of earthquakes
Fabrice Cotton GFZ Potsdam, Germany Ground Motion Prediction
John Douglas University of Strathclyde, UK Ground Motion Prediction
Jonathan Stewart UCLA, California, USA Ground Motion Prediction
Ivan Wong AECOM, Oakland, USA Ground Motion Prediction Member and panel for the maximum magnitude of earthquakes
Bob Youngs AMEC, Oakland, USA Ground Motion Prediction Member and panel for the maximum magnitude of earthquakes
Table 4.2 The assurance team for “Ground Motion Prediction”. Ivan Wong and Bob Youngs sit also in the panel for the
maximum magnitude of earthquakes.
The assurance team for “Building Fragility” is shown in table 4.3.
External Expert Affiliation Main Expertise Area
Jack Baker Stanford University, US Building Fragility
Paolo Franchin University of Rome “La Sapienza” Building Fragility
Michael Griffith University of Adelaide, Australia Building Fragility
Curt Haselton California State University, US Building Fragility
Jason Ingham University of Auckland Building Fragility
Nico Luco United States Geological Survey Building Fragility
Dimitrios Vamvatsikos NTUA, Greece Building Fragility
Table 4.3 The assurance team for “Building Fragility”.
These three dedicated assurance teams have been informed by the extensive technical documentation and in workshops. Their recommendations have been incorporated in the technical reports (section further work) and in this document. The seismological models supporting the hazard and risk assessment, which are highly mathematical in nature, have been reviewed by Prof. Ian Main (of Edinburgh University). Prof. Main has prepared review letters, which have been shared. See appendix J for a copy of Prof. Main’s most recent review letter.
The studies on building fragility have additionally been review by Ron O. Hamburger of the consultancy Gumpertz & Heger. Also this report is attached to this document (as appendix I).
3. Independent assurance, requested by Ministry of Economic Affairs The Minister of Economic Affairs has set up a Scientific Advisory Committee (SAC) to provide an additional layer of independent scientific assurance. The SAC is the successor of the initial TBO and TBB for Winningsplan 2013. The Groningen Scientific Advisory Committee (SAC) monitors and reviews the investigations executed out by NAM or its contractors as part of the development of the Groningen Winningsplan 2016. The role of the SAC is to ensure the quality, completeness and impartialness of these investigations.
The members of SAC are as follows:
Drs Lucia van Geuns (KNGMG), chair
Professor Rune Holt NTNU & SINTEF; Rock Mechanics
Dr Stefan Baisch QCON; Induced Seismicity
Dr Hein Haak Algemene Bestuursdienst; Risk management

Study and Data Acquisition Plan Induced Seismicity in Groningen - Winningsplan 2016
41
Professor Jan Dirk Jansen TU Delft; Subsurface Modelling and
Dr Iunio Iervolino University of Naples Federico II; Structural Engineering
Independent observers:
Dr Jaap Breunese, TNO-AGE
Dr Bernard Dost, KNMI
Dr Hans de Waal, SodM
The Scientific Advisory Committee stimulates the sharing of information between all parties to ensure that available knowledge and information is used to develop broadly shared views where possible. To enhance the efficiency of the process, SodM, TNO and KNMI have been granted the status of observers. The SAC monitors and reviews the (intermediate) results of the study and data acquisition program. The SAC also has the right to propose adjustments to the investigations. The SAC reports its findings and suggested adjustments to the Ministry of Economic Affairs. When the SAC and/or NAM observe important differences of opinion regarding content, progress or outcomes of the investigations, the SAC Chair will report this to the Ministry of Economic Affairs. The SAC will advise on action to be taken e.g. the involvement of an independent third party.
The Committee is supported by Expert groups. Depending on subject and required expertise, Expert group members have been appointed to discuss detailed definition, execution and technical progress of the various investigations (see Addendum). There is at least one member of the SAC participating in each Expert group. The Expert groups meets as and when required. Composition may vary over time. Members can participate in more than one Expert Group.
Additional members of the expert groups are:
Brecht Wassing, TNO
Raphael Steenbergen, TNO and NEN-NPR
Karin van Thienen-Visser, TNO-AGE
Hans Roest, SodM
Annemarie Muntendam-Bos, SodM
Ilse de Vent, SodM
Since its installation by the Minister of EZ, the Scientific Advisory Committee has organized three 2-day workshops, with NAM. In addition to these workshops, the SAC also organized 9 expert meetings. The SAC workshops with SAC members and expert team members were also attended by representatives of SodM, TNO-AGE and KNMI as observers. The SAC expert team meetings were attended by the SAC Committee, expert teams and observers of SodM, TNO-AGE and KNMI.

Study and Data Acquisition Plan Induced Seismicity in Groningen - Winningsplan 2016
42
Date Event
29th
& 30th
October 2014 2-day Workshop.
19th
March 2015 Expert Team Meeting on Subsurface / Geomechanics.
24th
March 2015 Expert Team Meeting on Seismological Model, Ground Motion Prediction and Seismic Hazard.
26th
March 2015 Expert Team Meeting on Building Fragility.
22nd
& 23rd
April 2015 2-day Workshop.
2nd
June 2015 Expert Team Meeting on Seismological Model.
17th
September 2015 Expert Team Meeting on Ground Motion Prediction.
24th
September 2015 Expert Team Meeting on Pressure Maintenance.
9th
October 2015 Expert Team Meeting on Building Fragility.
3rd
& 4th
November 2015 2-day Workshop.
1st
March 2016 Expert Team Meeting on Pressure Management.
3rd
March 2016 Expert Team Meeting on Ground Motion and Building Fragility.
Table 4.4 Workshops and expert meetings held between NAM and SAC with observers from SodM, TNO-AGE and KNMI in
2014, 2015 and 2016.
The SAC reported her review of the Hazard and Risk Assessment report of November 2015 together with findings and recommendations to the Ministry of Economic Affairs on the 1
st December 2015. This SAC report can be
downloaded using the following link (https://www.rijksoverheid.n/rijksoverheid/rapporten/progress-note-groningen-scientific-advisory-committee/progress-note-groningen-scientific-advisory-committee.pdf) and is also attached as Appendix F.
In its report, the SAC notes: “The SAC members are impressed by the quality of the work performed within the project, which is of high scientific level. NAM/Shell/contractor staff involved are genuinely aiming for a best possible hazard and risk quantification within the constraints of time and data available. The researchers involved are open-minded and willing to communicate and discuss the results of their work.” The SAC also offers a large number of valuable recommendations requiring further studies. These have been used to prepare the current “Continued Study and Data Acquisition Plan Induced Seismicity in Groningen for Post-Winningsplan 2016”. Appendix F gives an overview of all recommendations and an amenability, accounting and justification of the way these recommendations have been included in this plan.
4. Independent assurance by regulator Staatstoezicht op de Mijnen
(SodM) The mission of SodM is "Ensuring that the mining and transportation of gas is conducted in a socially responsible manner." As part of this role the studies of the NAM research program are reviewed by the supervisory body SodM and her advisors TNO-AGE and KNMI. Experts of these organisations are primarily informed by experts conducting these studies through the SAC workshops and expert meetings. Additional data is also shared. For instance NAM has shared the static and dynamic model of the Groningen gas reservoir with TNO-AGE.
SodM has requested at times additional studies from TNO-AGE, KNMI and CBS to verify the studies conducted as part of the NAM research program. The reports prepared by TNO-AGE can be downloaded from www.nlog.nl a website maintained by TNO or https://www.sodm.nl.

Study and Data Acquisition Plan Induced Seismicity in Groningen - Winningsplan 2016
43
5. Independent assurance requested by regulator (SodM) SodM has engaged international experts to provide technical advice and review the NAM report “Hazard and Risk Assessment – Interim Update November 2015). These were technical experts from the Swiss Seismological Survey (SED, Schweizerischer Erdbebendienst) and the U.S. Geological Survey (USGS).
Swiss Seismological Survey advice to SodM Additional to the assurance by TNO and KNMI, SodM also requested review of the hazard and risk assessment by the Swiss Seismological Survey (SED) at ETH Zurich, the official federal agency for monitoring earthquake activity in Switzerland and its neighboring countries and for assessing Switzerland’s seismic hazard. Stefan Wiemer of the SED prepared this review, which is attached as appendix G. In addition to recommendations for further technical work, Wiemer also makes recommendations to the organization of the studies and the assurance. Both are addressed in this update of the studies plan. The SED review is attached as appendix G and the accounting and justification of the way these recommendations have been included in this plan can be found in appendix E.
U.S. Geological Survey advice to SodM SodM also asked the U.S. Geological Survey (USGS) to review the 2015 hazard and risk assessment interim update. The USGS is the Federal agency with responsibility for recording and reporting earthquake activity nationwide in the USA. Their report is more critical than the previous reviews. Mainly based on a 2015 paper on ground motion prediction for Oklahoma, USGS argues that the high case used in the hazard assessment for Groningen is potentially unconservative and might therefore be too low. The USGS review is attached as appendix H and the accounting and justification of the way these recommendations have been included in this plan can be found in appendix E.
6. Independent critics Several independent observers have made critical comments on the hazard and risk assessment in the media or through blogs on the internet. An effort has been made to collect these comments, to address these and to incorporate valuable suggestion in this plan. Recommendations made to improve the study plan by prof. Sintubin of the Catholic University in Leuven (Belgium) made in his blog
https://earthlymattersblog.wordpress.com/category/earthquakes/induced-seismicity/
deserve special mention here. Technical recommendations by other critics like Drs. Peter van der Gaag have also as much as possible been addressed.
7. Transparency
Raw Data In section 3 of this report, the data acquired over the last three years have been presented. These raw data form the foundation of the study program carried out by NAM. To stimulate further research a by other independent parties, the raw data and relevant acquisition data have been made available to other researchers as well. Both basic raw data and finalized study reports are published in the public domain on www.namplatform.nl. The reports can be downloaded from:
http://feitenencijfers.namplatform.nl/onderzoeksrapporten/
Availability
- Namplatform
A large part of the relevant data for seismicity in Groningen is available on the web-site www.namplatform.nl. This includes:
Pressure data;
Gas production volumes;
Subsidence data;

Study and Data Acquisition Plan Induced Seismicity in Groningen - Winningsplan 2016
44
Earthquake locations both in (interactive) map view and in depth;
Building sensors;
Damage notifications and progress of the repair process.
Figure 6.1 Interactive map at www.namplatform.nl.

Study and Data Acquisition Plan Induced Seismicity in Groningen - Winningsplan 2016
45
Figure 6.2 Feiten en Cijfers page on www.namplatform.nl.

Study and Data Acquisition Plan Induced Seismicity in Groningen - Winningsplan 2016
46
- KNMI Data Portal
Another important source for data for induced seismicity in Groningen is www.knmi.nl, which contains acceleration data and geophone data for larger seismic events.
Figure 6.3 Example of data available on the website of the KNMI.
As of October 2015, KNMI offers three services that provide direct access to seismological data from the KNMI operated geophone and accelerometer network:
1. Seismological and acoustic data portal; an interface with event information and raw data from the seismological station,
2. Rapid Raw Strong Motion Data portal for The Netherlands. A specialist interface for scientists and engineers to raw acceleration data and derived peak ground accelerations (PGA),
3. FDSN web services.
Figure 6.4 Seismological and acoustic data portal; an interface with event information and raw data from the seismological
station.

Study and Data Acquisition Plan Induced Seismicity in Groningen - Winningsplan 2016
47
Figure 6.5 Example of data available on the website of the KNMI for the Harkstede earthquake of magnitude 1.5 on 26
January 2016.

Study and Data Acquisition Plan Induced Seismicity in Groningen - Winningsplan 2016
48
Figure 6.6 Example of data available on the website of the KNMI.
Figure 6.7 Example of data available on the website of the KNMI.

Study and Data Acquisition Plan Induced Seismicity in Groningen - Winningsplan 2016
49
Sharing raw data with external researchers The raw unprocessed subsidence and seismic data collected by NAM is made available on request to academic and non-academic researchers for analysis and study. These are often very large data sets which are too big to be downloaded from a website. Exchange of a hard disk is often the most practical apporach to share this data. To date the following large data sets have been shared:
Data volume shared Party data has been shared with
Time Comments
Seismological data from temporary deep geophone wells
Mr. John Lanting Schokkend Groningen, The Netherlands
May 2014
Seismological data from temporary deep geophone wells and VpVs velocity model
Gassnova Project, NORSAR, Norway
July 2014 Focus research: Locating hypo-centres of earthquakes.
VpVs velocity model and Geodetic Information.
Dr. Mike Fehler, Prof. Tom Herring and Prof. Brad Hager MIT (Massachusetts Institute of Technology), USA
August 2014
Focus research: (1) Analayis of historic seismic data and (2) Geomechanical and Geodetic investigation of seismic versus aseismic deformation.
VpVs velocity model and raw data deep geophones
Prof Gregory C. Beroza Stanford University, USA
August 2014
Focus research: Ambient noise interferometry to infer shear wave velocities
VpVs velocity model and raw data deep geophones
Dr. H. Paulssen, University Utrecht
December 2015
Focus research: Noise interferometry to infer changes in medium properties and microseismicity
Subsidence measurements by InSar
Prof. Bob White Cambridge University, UK
December 2015
Focus research: Locating hypo-centres of earthquakes.
Seismological data from temporary deep geophone wells (update with recent data)
Gassnova Project, NORSAR, Norway
January 2016
Focus research: Locating hypo-centres of earthquakes.
Clarification of data request in progress
University of Bristol
March 2016
Temperature Measurements DTS system in Zeerijp-3A.
Drs. Alexandros Daniilidis, Rijksuniversiteit Groningen
April 2016 Support research geothermal projects.
Table 4.5 Larger volume data sets have been exchanged with NGO’s, Academic institutes and knowledge institutes.
The raw has been provided with “no-strings-attached”. Progress reporting on these studies is strictly voluntary and NAM has no influence on the studies performed using the data sets.

Study and Data Acquisition Plan Induced Seismicity in Groningen - Winningsplan 2016
50
Figure 6.8 At 12th
May 2014, Local NGO “Schokkend Groningen” receives at the NAM offices the two hard disks with 10
Terabyte data from the two deep geophone wells for independent study. (Photo: John Lanting).
Study Reports
Availability of Study Reports
- Namplatform
The technical reports describing the study results in support of the hazard and risk assessment have been published on www.namplatform.nl on the page “onderzoeksrapporten”. This allows scrutiny by experts from other stakeholders including NGO’s.
The reports describe the progress made during the last three years. Both reports in support of the hazard assessment of the Winningsplan 2013 can be found here as the technical study reports supporting the half yearly updates published since then. The version 0 update refers to the hazard and risk update of November 2014, version 1 to the hazard and risk update of May 2015 and version 2 to the hazard and risk update of November 2015. Winningsplan 2016 will be largely based on this same version of the hazard and risk update.
A full list of all reports available on this site can be found in the section References.
- NLOG (TNO)
Reports prepared by TNO on induced seismicity, including studies undertaken by TNO and reviews by TNO of studies undertaken by NAM, can be found at www.nlog.nl, a website maintained by TNO.
Peer-reviewed and Conference papers Innovative parts of the research have also been published as peer-reviewed papers. These papers have been reviewed by competent independent anonymous experts working on behalf of the journal. The peer review process is employed by the journal to determine an academic paper's suitability for publication and maintain standards of quality. The review of these papers by peer scientists and academics improves performance and provides credibility.

Study and Data Acquisition Plan Induced Seismicity in Groningen - Winningsplan 2016
51
The following papers have been published:
Title Journal Peer-reviewed or Conference paper
A Monte Carlo method for probabilistic hazard
assessment of induced seismicity due to
conventional natural gas production.
Bulletin of the Seismological Society of
America
Peer-reviewed
A risk-mitigation approach to the management of
induced seismicity
Journal of Seismology Peer-reviewed
A seismological model for earthquakes induced by
fluid extraction from a subsurface reservoir.
Journal of Geophysical Research: Solid
Earth
Peer-reviewed
Liquefaction Mapping for Induced Seismicity in the
Groningen Gas Field.
6th International Conference on
Earthquake Geotechnical Engineering
Conference Paper
Developing an Application-Specific Ground-Motion
Model for Induced Seismicity.
Bulletin of the Seismological Society of
America
Peer-reviewed
Geomechanical Analysis to Evaluate Production-
Induced Fault Reactivation at Groningen Gas Field
SPE Annual Technical Conference and
Exhibition 2015
Conference Paper
Ray modelling for induced seismicity in piecewise
linear (Vo-k) models
Meeting on active and passive seismics in
laterally inhomogeneous media’, Jun 8-12,
2015, Prague, Czech Republic
Poster
In-Well Distributed Strain Sensing Society of Petroleum Engineers Conference Paper
(In preparation)
First Advance in Determining the regional site-
response for induced earthquakes in Groningen,
The Netherlands.
Recent Advances in Geotechnical
Earthquake Engineering and Soil Dynamics
Conference Paper
(In preparation)
Location results from a borehole microseismic
monitoring experiment in the Groningen gas
reservoir, Netherlands
6th EAGE workshop on Passive Seismic,
Muscat (Oman), 31 Jan Feb, 2016
Poster
Experimental Characterization of Calcium-Silicate
Brick Masonry for Seismic Assessment
16th
International Brick and Block Masonry
Conference.
Conference Paper
(In preparation)
Out-of-plane shaking table tests on URM cavity
walls
16th
International Brick and Block Masonry
Conference.
Conference Paper
(In preparation)
Number of Equivalent Stress Cycles for
Liquefaction Evaluations in Active Tectonic
and Stable Continental Regimes
Journal of Geotechnical and Geo-
environmental Engineering
Peer-review in
progress
A New Stress Reduction Coefficient Relationship
for Liquefaction Triggering Analyses
Journal of Geotechnical and Geo-
environmental Engineering
Peer-review in
progress
Table 4.6 List of peer-reviewed and conference papers describing studies executed as part of the research program led by
NAM. Conference papers have also been included. These papers have not been subjected to the external
assurance review process.
The peer review process can take several months to in some cases more than a year. Papers describing the scientific foundation of the Hazard and Risk Assessment of November 2015 are currently being prepared and reviewed. Because this process can take some time, reports describing the work in detail are already shared at www.namplatform.nl before peer review process. Also conference papers are prepared to share these results as soon as possible.

Study and Data Acquisition Plan Induced Seismicity in Groningen - Winningsplan 2016
52
5 Assurance expansion in Winningsplan 2016
Effectiveness current assurance regime For the studies contributing to Winningsplan 2016 a multi-layered assurance process was used. As explained before the assurance layers ranged from internal NAM assurance to assurance by independent experts on behalf of NAM and independent experts on behalf of the Ministry of Economic Affairs and Staatstoezicht op de Mijnen. However, these layers of assurance have been criticized by experts, the local community in Groningen and politicians.
Examples of articles questioning the integrity of these studies are:
Dagblad van het Noorden, 17th
November 2015, “PvdA: NAM is slager die zijn eigen vlees keurt” (http://www.dvhn.nl/groningen/PvdA-NAM-is-slager-die-zijn-eigen-vlees-keurt-21074038.html)
RTVNoord and NOS News broadcast, 25th
November 2015 “Gesjoemel met onderzoek naar gevolgen gaswinning” (http://www.rtvnoord.nl/nieuws/156471/Gesjoemel-met-onderzoeken-naar-gevolgen-gaswinning) and (http://nos.nl/artikel/2071270-gesjoemel-met-onderzoek-naar-gevolgen-gaswinning.html)
NOS News broadcast, 26th
December 2015 “Experts kraken onderzoek gaswinning” (http://nos.nl/artikel/2077249-experts-kraken-onderzoek-gaswinning.html)
These criticisms have negatively impacted the credibility and acceptance of the study results by the community, policy makers and decision makers
4. In this respect, the assurance process to date has not been sufficiently
successful in achieving the desired confidence with the regulator, decision makers and the local community in the assessment of hazard and risk.
Proposal for Assurance quality upgrade NAM proposes to continue to work with the current framework of 7 layers of assurance, but to strengthen the entire assurance grid by subjecting all future studies to a rigorous assurance based on application of the SSHAC (Senior Scientific Hazard Analysis Committee) Level 3 process. This is the ‘gold standard’ for oversight. This would cover all scientific studies into induced seismicity in Groningen.
The SSHAC process for multiple-expert assessment of hazards was developed by the US Nuclear Regulatory Commission (USNRC), US Department of Energy (DOE) and Electric Power Research Institute (EPRI). These institutions saw themselves confronted with two widely diverging seismic hazard studies for nuclear power plant sites in central and eastern United States. There were also very large divergences among the individual experts within each study. The SSHAC concluded that the problem resided not in technical details of the studies but in the lack of clear procedural guidelines for how to conduct such studies.
The original SSHAC guidelines were issued in 1997 as USNRC publication NUREG/CR-6372, in which procedures were laid out for conducting multiple-expert hazard assessments with clearly defined roles and responsibilities for all participants and with the common goal of capturing the full range of epistemic uncertainty. Four study levels were proposed with the complexity and effort increasing from Level 1 to Level 4 together with a corresponding increase in the likelihood of achieving regulatory assurance.
4 Voorbeeld: Tweede Kamer der Staten-Generaal, Vergaderjaar 2015–2016, 26 januari 2016, 33 529 Gaswinning, Nr. 230 MOTIE VAN HET LID SMALING:
constaterende dat de NAM op dit moment een opdrachtgevende en uitvoerende rol heeft bij het uitvoeren van onderzoek naar de risico’s van gaswinning;
overwegende dat dit onderzoek om begrijpelijke redenen door Groningers wordt gewantrouwd;
van mening dat het publieke belang van goed en onafhankelijk onderzoek naar de risico’s van gaswinning groot is;
verzoekt de regering om, onderzoek naar de gevolgen van gaswinning of ten behoeve van een winningsplan geheel onafhankelijk te beleggen, waarbij de NAM geen rol meer vervult,
en ook Nr. 220 MOTIE VAN DE LEDEN VAN VELDHOVEN EN JAN VOS

Study and Data Acquisition Plan Induced Seismicity in Groningen - Winningsplan 2016
53
The SSHAC Level 4 process was applied to the assessments of seismic and volcanic hazards at the Yucca Mountain radioactive waste repository in Nevada and in the PEGASOS project for seismic hazard assessment at nuclear power plant sites in Switzerland. A review after 15 years of experience in applying the SSHAC guidelines was documented in the following report “Implementation of the SSHAC Guidelines for Level 3 and 4 PSHAs—Experience Gained from Actual Applications, by Thomas C. Hanks, Norm A. Abrahamson, David M. Boore, Kevin J. Coppersmith, and Nichole E. Knepprath (U.S. Geological Survey Open-File Report 2009-1093)”, which can be downloaded using the following link to the website of the USGS:
http://pubs.usgs.gov/of/2009/1093/of2009-1093.pdf
A key conclusion from the review was that the Level 4 process has proved to be somewhat cumbersome and that detailed implementation guidelines were needed for Level 3 studies. This led to the issue of practical implementation guidelines by USNRC in 2012, which are available through this link:
http://www.nrc.gov/reading-rm/doc-collections/nuregs/staff/sr2117/
In these new guidelines, USNRC makes no distinction between Level 3 and 4 studies in terms of regulatory assurance and views both processes as equally valid approaches. The SSHAC Level 3 process has been successfully applied to many seismic hazard assessments for critical infrastructure, including:
Seismic source characterization for PSHA at all nuclear sites in central and eastern United States, CEUS-SSC (completed 2012)
Probabilistic seismic hazard analysis (PSHA) for hydroelectric dams in British Columbia, Canada (completed 2013)
PSHA for the DOE Hanford site in Washington State, USA (completed 2014)
PSHA studies for the Diablo Canyon (California) and Columbia Generating Station (Washington) nuclear power plants in response to USNRC 50.54(f) Fukushima response plan (completed 2014)
PSHA for the Thyspunt nuclear site in South Africa (completed 2013)
PSHA for all nuclear power plant sites in Spain (2016-2019)
In addition to providing regulatory assurance, the SSHAC process accommodates the assurance needs of both scientific and academic experts (a key feature of the process is broad participation from members of the relevant communities), local communities and decision-makers. The clearly structured process of a SSHAC Level 3 study, subject to continuous independent peer review of both technical details and procedural adherence, is transparent, open to observation, extensively documented and widely viewed as the gold standard for multi-expert assessment of hazard (and perfectly amenable to extension to risk assessment as well). The process should, together with other stakeholders (e.g., NCG) be adapted to local circumstance and demands while respecting the basis requirements for compliance with the specifications of a SSHAC Level 3 study.

Study and Data Acquisition Plan Induced Seismicity in Groningen - Winningsplan 2016
54
6 Further Studies and Data Acquisition Projects – Groningen Reservoir Model
Objectives The main research questions to be addressed in the studies for the Groningen Reservoir model are:
What faults are present in the reservoir rock, above and below the reservoir?
What are the lengths and throws of these faults?
What is the porosity distribution over the field area and in different reservoir layers?
What is the pressure distribution over the field and the adjacent aquifers?
How does gas production influence the reservoir pressure and what is the role of faults in the pressure
response?
The history match of the model of the Groningen reservoir addresses many of the dynamic issues. The current reservoir model is well calibrated with many pressure measurements and observed water rise collected in the production and observations wells. The proposal for further improvement of the calibration of the model mostly targets the areas away from these well locations.
Static Reservoir Model
Structural Model
Sub_salt faulting in the Groningen area In the last years the focus of the structural modelling work has been on the characterisation of faults in the reservoir section and the immediate underlying Carboniferous reservoir. A major activity has been to carry out a merger of all the available seismic data sets of the northern Netherlands, consisting of multiple surveys acquired over many years. The most recent reprocessing techniques available to NAM have been applied on this composite data set and the project was completed towards the end of 2015. An interpretation of the newly processed seismic cube only resulted in very minor adjustments of the Groningen (reservoir) fault model, confirming the quality of the fault model prepared in 2012.
Another result of the reprocessing was a much improved image of the Carboniferous interval. Preliminary work has shown the feasibility of a more detailed structural analysis of intra-Carboniferous faults on the new reprocessed dataset. The following work is proposed:
Detailed mapping of the Carboniferous-Rotliegend boundary (i.e. the Saalian Unconformity). Together with an update of the Top-Rotliegend horizon this will lead to an improved assessment of thickness variations in the Rotliegend interval.
Detailed mapping of Carboniferous faults and intra-Carboniferous reflectors. A new semi-automated fault tracking tool (AFT from GeoSigns) has been tested to allow for mapping of large numbers of faults in limited time. This will lead to a better understanding of the vertical extent of faults in the Carboniferous, and of the geometry and origin of sub-salt faulting in the Groningen area.
New 3D data acquisition feasibility study. Reprocessing the existing data from the 80’s showed the inherent limitations of the quality improvements that can be achieved when working with a dataset acquired using old acquisition techniques. Since then significant acquisition technology developments been introduced allow long offset wide azimuth denser grids by using wireless nodes and high channel numbers. A phased approach towards the potential execution of such survey should start with a feasibility study to investigate whether a new acquisition will result in highly improved imaging

Study and Data Acquisition Plan Induced Seismicity in Groningen - Winningsplan 2016
55
of deeper faults (into Carboniferous). The next step could be a local pilot seismic acquisition survey over an area where deeper faults are presumed.
Cenozoic fault activity in the Groningen area The fault systems off-setting the Rotliegend originate from a main phase of extension and rifting during the Jurassic, and related to the break-up of the Pangea supercontinent. A younger tectonic phase relates to the Alpine orogeny during the Late Cretaceous and Early Tertiary. This compressional regime has led to local re-activation and inversion of pre-existing Carboniferous and Jurassic faults. The Groningen area was only mildly affected by this tectonic phase. However, an associated effect of the changing stress regime over geological time has been the movement of large masses of Zechstein salt. This is thought to have taken place in multiple phases, and has affected thickness distribution and fault activity in the Post-Zechstein sequences.
In the context of induced seismicity in the Groningen area, it is important to know the degree of tectonic activity during the Quaternary. This will assess the possibility of reactivating shallow fault systems in response to changes in the stress field due to gas extraction from the deeper subsurface. The following work will be considered:
Mapping of faults penetrating the Quaternary section above the Groningen field and surrounding areas Establish the relationship, i.e. continuity, of faults below and above the Zechstein salt section Establish possible fault activity during the Cenozoic by detailed mapping of thickness trends within Cenozoic
stratigraphic intervals Review of previous studies and open literature on the above topics.
Investigate critical or trapped gas saturation in the Aquifer Below the gas water contacts of the Groningen field, a zone with critical/trapped gas saturation is present. This zone is of unknown origin, extent and distribution. It could possibly be explained by paleo contact movements or by gas staying behind during migration, or a combination of these. Understanding of this zone is important for the prediction of the pressure in the aquifers adjacent to the depleting reservoir.
Several investigations have found evidence for a layer with critical/trapped gas saturation below the gas-water contact:
1. In the seismic inversion study the geophysicists have to assume a gas saturation below the aquifer to obtain a model based match. Without the presence of gas, a clear contact would be visible in the seismic data. However such a contact is not visible.
2. A petrophysical review of reservoir properties observed the critical/trapped gas saturations below the gas-water contact in open hole logs taken in wells. The average gas saturations for the zone below the gas-water contact were calculated and displayed for the selected wells in Figure 6.1. This is not a local observation, gas below the contact can been seen through the whole field with varying thickness. For instance the logs of UHZ-1 clearly show a critical/trapped gas saturation whilst the proximal UHM-1 shows hardly any gas below the contact. An example of critical/trapped gas saturation below the gas water contact is displayed in Figure 6.2.
3. There are also indications for a critical/trapped gas saturation layer in the dynamic behavior of the field. a. Analysis of the reservoir pressure data indicates “slow gas”, which could also be explained by the
critical/trapped gas saturation which is initially immobile. When the pressure drops below a threshold value the saturation of gas increases enough due to expansion of the gas to become mobile, at this stage inflow of gas into the reservoir will happen.
b. The history matching shows that the aquifers surrounding Groningen should not deplete in pressure. A very low permeability or faults disconnecting the aquifers from the Groningen field will prevent a pressure drop. However, a critical/trapped gas saturation in the aquifer could also support pressure for this region of the field.
c. The match of the RFT pressures in well in UHZ-1 improves dramatically, when this critical/trapped gas layer is assumed (Figure 6.3). Other methods of improving this match were not successful, such as a decrease of the permeability.

Study and Data Acquisition Plan Induced Seismicity in Groningen - Winningsplan 2016
56
Figure 6.1 Average gas saturation below the gas water contact as determined by a preliminary review of the open hole logs

Study and Data Acquisition Plan Induced Seismicity in Groningen - Winningsplan 2016
57
Figure 6.2 Example of miniplot with the gas saturation below the gas water contact
Currently the history matched model does not take critical saturation gas below the gas-water contact into account. A more detailed knowledge of where the critical/trapped gas is located will be needed to test the impact in the entire field. A detailed microscopic pore-scale study would be needed to investigate critical/trapped gas saturation required for percolation and possible re-mobilization due to pressure depletion.
We will further investigate the critical/trapped gas saturation to improve the history match for the pressure under the gas-water contact and for the subsidence match. This requires a multi-disciplinary approach involving geosciences, petrophysics and reservoir engineering.
Figure 6.3 Comparison between two identical model with the exception of a model with 20% critical/trapped gas saturation
in the aquifer and no GBV multiplier on the Slochteren (left) and one without critical gas saturation in the aquifer
and with a GBV multiplier of 1.05 on the Slochteren (right).

Study and Data Acquisition Plan Induced Seismicity in Groningen - Winningsplan 2016
58
Petrographic analysis of Groningen core material A recent review of petrophysical properties obtained from Groningen core plug measurements has shown that, within the same porosity bin, permeabilities measured on plugs from the aquifer are lower than permeabilities from gas samples. This is a common phenomenon that has been observed in many other producing Rotliegend fields. It is usually attributed to a more intense diagenetic alteration in the water leg with associated higher amounts of fibrous illite. The same phenomenon has been suggested for the Groningen field, but has not been demonstrated unequivocally. A possible explanation may be sought in the fact that core material from the water leg is highly underrepresented compared to core from the gas leg.
The recently drilled Zeerijp-3A well offers an excellent opportunity to further investigate the subject, because it has retrieved Rotliegend core from above and below the gas-water contact. This petrographic study includes a full petrographical characterization of some 25 samples from the ZRP-3A core, equally distributed over the gas leg, the transition zone and the water leg. The petrographical characterization will be carried out by PanTerra Geoconsultants and includes thin section description and modal analysis, whole-rock and clay fraction XRD, and SEM analysis. The objective is to find petrographical evidence for a different diagenetic history above and below the contact.
In case of a positive result, the study can be extended by revisiting previous petrographic studies on Groningen core, and compare these with the ZRP-3A results. This may provide support for, and confidence in, assigning different porosity-permeability distributions above and below the contact. This in turn may lead to improved history matching and forecasting of dynamic properties in the Groningen field.
Calibration of the Dynamic Reservoir Model The dynamic reservoir model can be improved by calibration with additional data. Especially when the temporal or areal data coverage is low, additional data can be used to better constrain the model.
THP history matching Tubing head pressures converted to bottom hole pressures can be used as another quantifier in the history matching process. In recent years the density in SPG measurements over time has decreased significantly with respect to the 1960-1990 measurements (Figure 6.4). To complement the SPG data set it is possible to use additionally tubing head pressures. Tubing head pressure data is available since the completion of the Groningen Long Term project as of 2007. The correct conversion factor from static tubing head pressure to static bottom hole pressure and the associated uncertainty need to be established. It is not recommended to stop SPG measurements or further reduce the SPG data acquisition, since converted static tubing head pressures have a higher uncertainty.
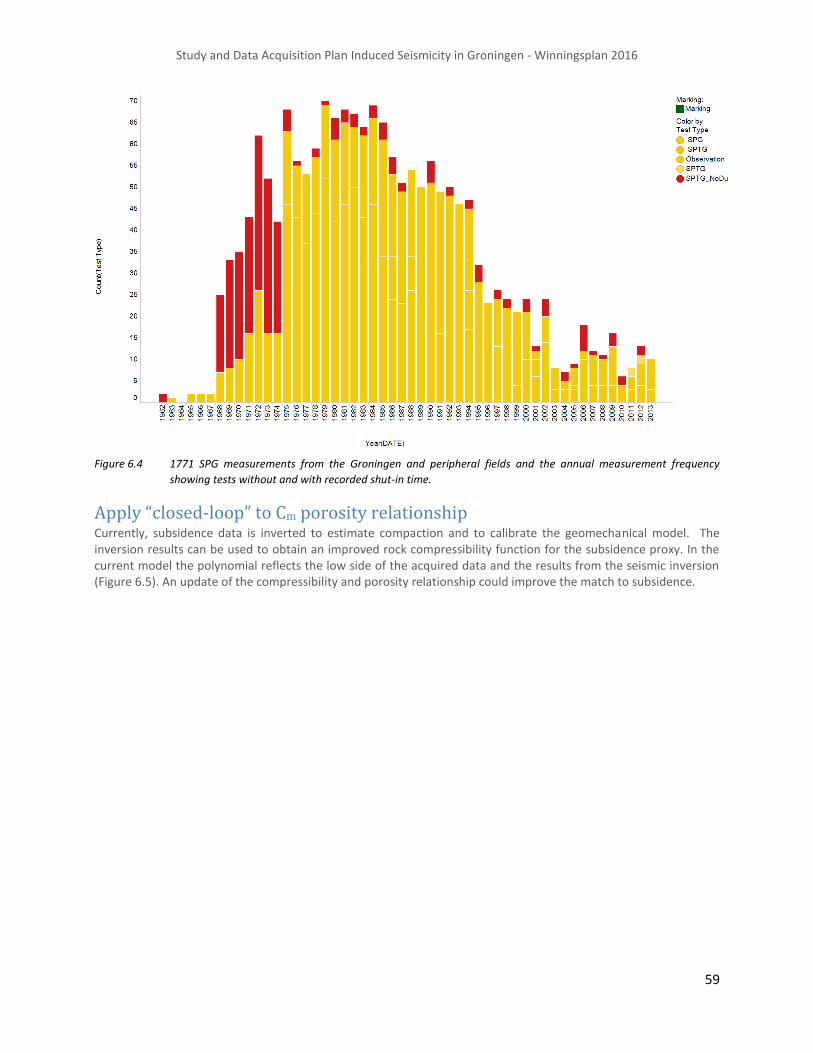
Study and Data Acquisition Plan Induced Seismicity in Groningen - Winningsplan 2016
59
Figure 6.4 1771 SPG measurements from the Groningen and peripheral fields and the annual measurement frequency
showing tests without and with recorded shut-in time.
Apply “closed-loop” to Cm porosity relationship Currently, subsidence data is inverted to estimate compaction and to calibrate the geomechanical model. The inversion results can be used to obtain an improved rock compressibility function for the subsidence proxy. In the current model the polynomial reflects the low side of the acquired data and the results from the seismic inversion (Figure 6.5). An update of the compressibility and porosity relationship could improve the match to subsidence.
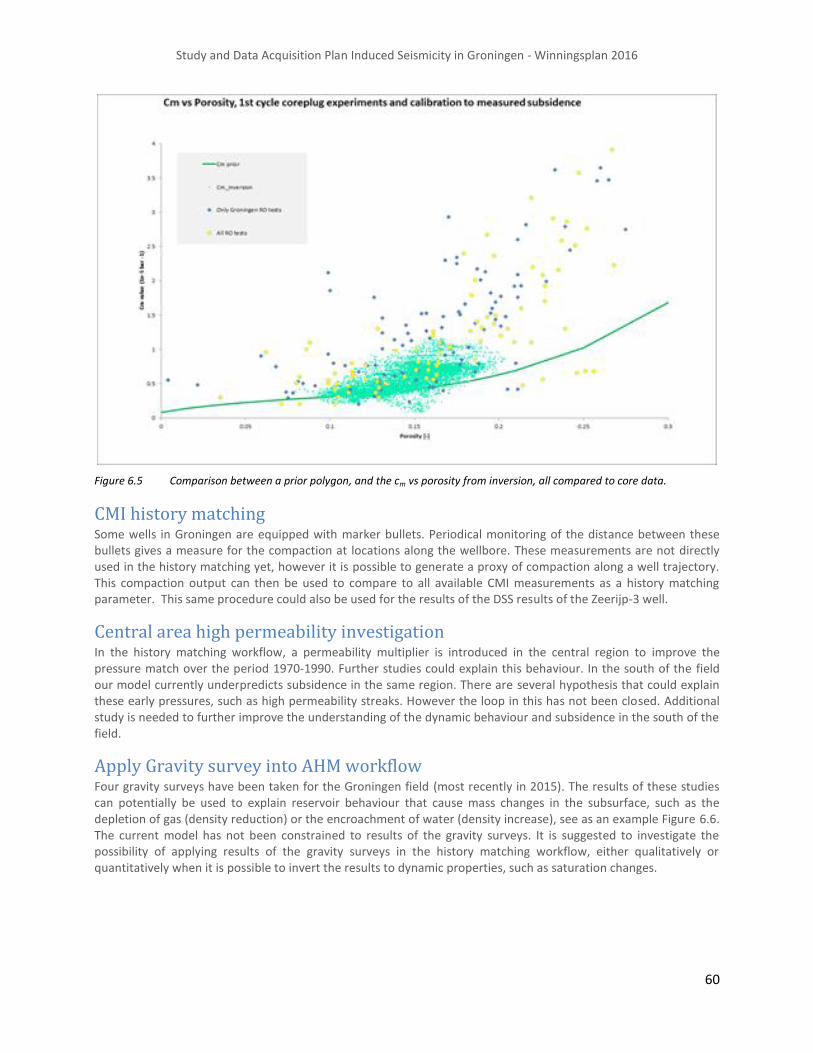
Study and Data Acquisition Plan Induced Seismicity in Groningen - Winningsplan 2016
60
Figure 6.5 Comparison between a prior polygon, and the cm vs porosity from inversion, all compared to core data.
CMI history matching Some wells in Groningen are equipped with marker bullets. Periodical monitoring of the distance between these bullets gives a measure for the compaction at locations along the wellbore. These measurements are not directly used in the history matching yet, however it is possible to generate a proxy of compaction along a well trajectory. This compaction output can then be used to compare to all available CMI measurements as a history matching parameter. This same procedure could also be used for the results of the DSS results of the Zeerijp-3 well.
Central area high permeability investigation In the history matching workflow, a permeability multiplier is introduced in the central region to improve the pressure match over the period 1970-1990. Further studies could explain this behaviour. In the south of the field our model currently underpredicts subsidence in the same region. There are several hypothesis that could explain these early pressures, such as high permeability streaks. However the loop in this has not been closed. Additional study is needed to further improve the understanding of the dynamic behaviour and subsidence in the south of the field.
Apply Gravity survey into AHM workflow Four gravity surveys have been taken for the Groningen field (most recently in 2015). The results of these studies can potentially be used to explain reservoir behaviour that cause mass changes in the subsurface, such as the depletion of gas (density reduction) or the encroachment of water (density increase), see as an example Figure 6.6. The current model has not been constrained to results of the gravity surveys. It is suggested to investigate the possibility of applying results of the gravity surveys in the history matching workflow, either qualitatively or quantitatively when it is possible to invert the results to dynamic properties, such as saturation changes.

Study and Data Acquisition Plan Induced Seismicity in Groningen - Winningsplan 2016
61
Figure 6.6 Gravity survey to be used in AHM.

Study and Data Acquisition Plan Induced Seismicity in Groningen - Winningsplan 2016
62
Summary The table below shows which studies make a contribution the research question:
Up
date Stru
ctural M
od
el
Investigate critical gas satu
ration
in th
e A
qu
ifer
Petro
graph
ic analysis o
f Gro
nin
gen co
re
material
Calib
ration
o
f th
e D
ynam
ic R
eservoir
Mo
del - TH
P h
istory m
atchin
g
Calib
ration
of th
e Dyn
amic R
eservo
ir
Mo
del - A
pp
ly “closed
-loo
p” to
Cm
po
rosity relatio
nsh
ip
Calib
ration
of th
e Dyn
amic R
eservo
ir
Mo
del - C
MI h
istory m
atchin
g
Calib
ration
of th
e Dyn
amic R
eservo
ir
Mo
del - C
entral area h
igh p
ermeab
ility
investigatio
n
Calib
ration
of th
e Dyn
amic R
eservo
ir
Mo
del - A
pp
ly Gravity su
rvey into
AH
M
wo
rkflow
What faults are present in the reservoir rock, above and below the reservoir?
What are the length and throw of these faults?
What is the porosity distribution over the field area and in different reservoir layers?
What is the pressure distribution over the field and the adjacent aquifers?
How does gas production influence the reservoir pressure and what is the role of faults in the pressure response?
Table 6.7 Research table linking the research questions to the study activities.

Study and Data Acquisition Plan Induced Seismicity in Groningen - Winningsplan 2016
63
7 Further Studies and Data Acquisition Projects – Subsidence and Compaction
Objectives The main research questions to be addressed in the studies of compaction and subsidence are:
What is the current sub-surface strain field and can we derive this strain field from subsidence observation
collected at surface?
What is the impact of reservoir pressure depletion and of the rate of depletion on reservoir rock compaction?
What are the processes leading to reservoir rock compaction and which fraction of the compaction is elastic?
Subsidence Data Acquisition Unambiguously determining the subsurface strain field from surface displacement measurements is a challenging inverse problem. It suffers from being generally 'underdetermined' and 'ill-conditioned', so that a unique solution cannot be established without additional constraints or other a-priori information. It is key therefore to collect data that can effectively constrain the range of possible solutions and reduce uncertainties. A viable way to significantly improve the surface displacement measurements to try and achieve this goal is to: 1. gather accurate horizontal as well as vertical displacement data at a suitably distributed set of points, best
achieved by GNSS (requires optimal horizontal as well as vertical antennae stabilization and careful monument location);
2. tying together of the various geodetic survey methods, this means having a number of set locations that are included in levelling, InSAR and GNSS measurements (provides robust constraint);
3. tying in of gravity survey measurements, this can be realized by taking repeated gravity measurements at the same set locations.
To constrain the uncertainties in the sub-surface strain more intensive geodetic monitoring and studies to provide time-lapse monitoring data, including processing and visualization of results will be carried out. The aim of these activities is to set up a robust geodetic network for future monitoring the response to the field production. Key objectives are: 1. Integrated 4D deformation monitoring with appropriate spatio-temporal density and detailed analyses on
horizontal movement 2. Continuation of the promising support to monitoring building damages by high resolution InSAR 3. Evaluation & comparison of the geodetic data from the different geodetic techniques 4. Better communication of monitoring results to the public
The geodetic work plan will be coupled to currently available geodetic data and will provide a long-term complementary monitoring solution.
Scope of work 1. Activity: Installation of another 30 GNSS receivers and maintenance. Purpose: Capture horizontal deformation at the edges of the fields to better constrain
geomechanical and other subsurface models. Involved parties: NAM Geomatics, NAM Geomechanics, GSNL Geomechanics, contractor(s) 2. Activity: Alternative GNSS processing with scientific software/EUREF Purpose: Mitigate biases induced by current processing approach. Involved parties: NAM Geomatics, NAM Geomechanics, GSNL Geomechanics, a research institute with
track record in high accuracy GNSS monitoring, EUREF

Study and Data Acquisition Plan Induced Seismicity in Groningen - Winningsplan 2016
64
3. Activity: Continuation of high resolution InSAR acquisition, processing and reporting for another three years. Focus on building monitoring. Continuous improvement of processing and value-adding analysis approaches.
Purpose: Support damage prevention and analysis. Documentation of building movements without individual intervention. Support of geomechanical modelling
Involved parties: NAM Geomatics, contractor 4. Activity: Installation of artificial targets (i.e. corner reflectors or Compact Active Transponders)
in co-location with all NAM GPS stations in Groningen. Purpose: Cross-validation of GNSS and InSAR measurements. Enhance spatial large-scale
accuracy of InSAR by supporting InSAR processing with GNSS. Involved parties: NAM Geomatics, contractors, external consult 5. Activity: Supplemental research on the stochastic model of geodetic techniques, including
levelling (quantification of autonomous benchmark movement in Groningen) and InSAR Purpose: More substantiated interpretation of InSAR uncertainties regarding discrimination
between subsidence signal and noise artefacts. This is a crucial input for geomechanical modelling as well as for visualisation and interpretation.
Involved parties: NAM Geomatics, TU Delft 6. Activity: Visualisation tools for subsidence measurements. This includes the functional
specification and implementation of integrated processing software for combined visualization of subsidence measured by the 3 different geodetic techniques (levelling, GPS and InSAR) as well as e.g. web-based visualisation tools.
Purpose: Standardized and combined visualisation of subsidence measurements. Communication of measurement results to the public. This is so far only possible for individual techniques with restrictions.
Involved parties: NAM Geomatics, TU Delft, contractor(s), EUREF, BARD, SCEC 7. Activity: Feasibility and benefits of measurement subsidence with tiltsensoren. Purpose Investigate whether measurements of ground surface (maaiveld) with tiltsensors can
provide (standalone or in combination with other measurements) additional insights into subsidence caused by gas production from the Groningen field.
Deliverables Extended GNSS network of 30 NAM stations + 1 third party station
Assumption-free GNSS processing results
High-resolution InSAR building monitoring
Combined GNSS+InSAR monitoring deliverables
Constrain uncertainties in geomechanical and subsurface modelling
Appropriate visualisation tools to support communication to the public
Feasibility report of benefits measuring subsidence with tiltsensoren.

Study and Data Acquisition Plan Induced Seismicity in Groningen - Winningsplan 2016
65
Compaction Monitoring
Compaction in Observation Wells Gamma ray markers have been placed in several wells across the Groningen field, at regular depth intervals. Monitoring the (change in the) distance between markers over time gives insight into the compaction of the reservoir. The markers were originally installed in 11 wells across the Groningen field, six of which are still accessible for surveying, while three wells are logged regularly. These marker interval data have been recorded over several decades, and have always been reported as average reservoir strains. Using new analysis methods, we aim to refine the determination of the strain to individual intervals, allowing for better correlation with well logs and rock properties.
Although new fibre optic technology has recently become available that can achieve far higher spatial and temporal resolution, these historic data are valuable as they cover different scales, both in time (data collected over several decades) and space (well data available from across the Groningen field). The scope of the GR marker data study consists of improving the analysis method and applying it to historic data. New surveys are planned in TBR-4 and ROT-1 for 2016, which will be analysed and compared to previous surveys.
DSS data Distributed Strain Sensing (DSS) data is currently coming in from the Zeerijp-3A well. The system acquires a strain measurement more or less real time every 2 cm along the fibre optic cable, and covers the reservoir as well as part of the Carboniferous below and the Ten Boer formation above the reservoir. Laboratory tests established that strains can be measured with an accuracy of 5 micro-strain. These data are now becoming available for interpretation, and will be studied for correlations to rock properties, and compaction rates determined as a function of local reservoir pressure.
Compaction Data Integration Reservoir compaction is monitored in the Groningen field through surveys of GR marker intervals in three wells scattered across the field (SDM-1, ROT-1 and TBR-4) and through DSS by the fibre optics installed in Zeerijp-3A. The data from the DSS, and the new analysis of the GR marker data makes correlation and integration with other well data possible on a finer scale than has been the case so far.
In the integration part of the study, we look for correlations between compaction and rock and fluid properties, with the aim to allow a better description of the reservoir strain following production. Wireline logs and core data are the main sources of rock properties, as well as pressure estimates from dynamic reservoir models and pressure data from nearby observation wells (e.g. ZRP-1 wellhead pressures). The compaction data will also be compared to the local total reservoir compaction calculations resulting from subsidence modelling studies.
Core Measurements and Constitutive Models for Compaction The program for experiments on the core taken in the Zeerijp-3 well is currently in progress. The reservoir section was cored in July 2015 and after a detailed inventorisation and scanning of the core, sections were chosen to perform the experiments on. The core plugs have been drilled from the core and distributed to the three laboratories in October and November. First results from these experiments are expected to be available mid-2016. Core experiments are conducted in three laboratories; University Utrecht (UU), Rijswijk and Houston.
Core Measurements and Constitutive Models for Compaction The existing project on the physical mechanisms and mechanics governing compaction of the Slochteren sandstone will continue until the end of 2018, while adjusting aims and strategy in the light of emerging results. Here we recap on the project in progress and propose some new (additional) work.
Current project and plans up to end 2018 Laboratory experiments on core samples performed so far have shown that, alongside poro‐elastic deformation, significant amounts of permanent, time‐dependent (creep) deformation contribute to compaction of the

Study and Data Acquisition Plan Induced Seismicity in Groningen - Winningsplan 2016
66
Slochteren Sandstone under in‐situ conditions. This is due to inelastic mechanisms including time‐dependent grain failure (likely involving a stress corrosion mechanism) coupled with inter-granular sliding and rearrangement. The data obtained so far suggest that these processes become especially important at porosities above 19‐20%, accounting for > 40% of measured sample deformation, due to compactional yield or creep. Microstructural studies on samples recovered from the Zeerijp‐3 well are in progress to determine if the same processes indeed operate during depletion as seen in the laboratory. First observations suggest this is the case. If verified, the results have important implications for delineating and modelling the behaviour of the high‐porosity portions of the Groningen gas field where inelastic deformation might play a key role in determining in‐situ stress state and seismic potential. Much more data are needed, though, to confirm both the experimental and microstructural findings to date and to underpin the development and validation of robust mechanism based constitutive models that can be applied in geomechanical codes modelling system behaviour.
The focus of the work accordingly remains as originally defined, that is: a. to identify and quantify the micro‐mechanical processes that operate in the Slochteren Sandstone during
depletion,
b. to develop constitutive laws that describe compaction by these mechanisms, including creep effects,
c. to determine the relative importance of elastically stored versus inelastically dissipated energy,
d. to upscale lab‐derived compaction/dissipation models obtained for modelling at the reservoir scale.
These aims will continue to be pursued using the wide range of triaxial testing, optical/electron microscopy and microphysical modelling approaches available to the lab teams, quantifying the deformation behaviour of the Slochteren Sandstone at true in‐situ conditions.
Though falling implicitly under the above aims, special attention will be paid to experiments that explore a range of stress paths and to developing constitutive models that apply for general stress‐strain boundary conditions. A further issue that will be explicitly addressed in the period April 2016 to April 2019, will be to seek constraints on the maximum possible compaction that might occur during continued (total) depletion of the Groningen field as a function of porosity, in‐situ conditions and time. This will be explored by conducting experiments at higher stresses and temperatures than encountered in the field to assess the worst case effects that can be expected. All of the proposed work is carried out in coordination with the Utrecht, Rijswijk and Houston teams to maximise complementarity and avoid unnecessary duplication.
New work on compaction proposed for 2017‐2019 Alongside the above plans, newly emerging technologies and modelling approaches offer additional possibilities that are considered as potential additions to the program in 2017‐2019.
1) Dynamic imaging of deformation processes in sandstone. Aside from advanced observations that we are presently able to make on micro-scale deformation mechanisms after experiments, better quantitative constraints are needed on the strain‐accumulating processes that occur during experiments, i.e. on stress‐strain relations at the grain contact scale. Such relationships are important not only for developing analytical mechanism‐based constitutive models but also in developing a new generation of discrete element models for exploring the role of strain localization and for investigating upscaling relations. To complement our existing strategy we therefore propose to pursue two additional experimental imaging activities: a) X‐ray Micro‐CT imaging of actively deforming samples. This is already possible at modest P‐T conditions
using x‐ray‐transparent materials to construct small scale deformation cells that enable deformation of mm‐scale samples. We consider to apply this technology, which we are actively involved in developing in a collaborative project with the rock physics lab and synchrotron centre at Grenoble, to image active sandstone deformation and to quantify how strain is accumulated and propagates as individual grains deform. Due to geographic proximity, it may be preferred to use the XCT capability at Delft University of Technology (Dr. A. Barnhoorn), though this would require the development of a micro-scale deformation loading device. Our aim will be to advance the technology to approach the point that the grain scale processes that occur during compaction of the Slochteren Sandstone can be studied during deformation by direct imaging.

Study and Data Acquisition Plan Induced Seismicity in Groningen - Winningsplan 2016
67
b) High frequency acoustic micro-tomography. One disadvantage of X‐ray (micro)‐CT technology is that scanning a complete sample can take considerable time. An alternative method of obtaining information on microstructural development during deformation experiments is being developed in the HPT laboratory for imaging internal structure development in simulated faults. This involves using high frequency (> 10 MHz) piezo‐transducers as active acoustic sources and performing waveform tomography which results in a 3D density map of the sample. In principle, this method can be executed every second or so and does not require the experimental apparatus to be X‐ray transparent. Alongside X‐ray CT, we propose to investigate the potential of this method for imaging sandstone deformation processes in near real time.
c) The in situ deformation process is simulated in the laboratory by subjecting a core sample to simulated depletion and then allowing the sample to creep for a specified duration. After this depletion it has been observed that there is an increase in the amount of grain cracking as well as grain rotation and grain sliding. Many of these analyses are performed by comparing a post-test sample to a pre-test sister plug from the same depth. Micro CT coupled with NMR measurements of pore size distributions can provide an ability to examine the same sample in the pre-and post-compaction deformation states. By combining these analyses with traditional twin plug comparisons of thin sections and MICP measurements of the pore throat sizes, an increased understanding of the compaction process can be obtained. With the NMR measurements it should be possible to determine if one type of pore volume is preferentially collapsing or if the deformation is uniformly distributed among pore sizes. MICP data will characterize any changes that occur in the pore throat distribution. With the micro-CT, 3D images of the grains and pore shapes will be obtained and this should provide an additional method to confirm the pore system deformation.
2) Advancing numerical modelling of sandstone deformation.
One of the most promising methods for modelling the deformation behaviour of sandstones, and especially for investigating the effects of varying grain size, porosity and localization phenomena is the discrete element method. This is presently limited by the fact that grain to grain interactions are described mostly by simple linear elastic, plastic yield or linear viscous interactions. To progress beyond this, we consider a new micromechanical approach to analyse the stress field within and at the contact between grains in sandstones, using a high‐resolution Finite Element method based on simplified, but realistic grain contact configurations seen in Slochteren Sandstone. Coupling this stress analysis with microphysical descriptions of grain‐scale deformation processes, such as subcritical crack growth or inter-granular slip, observed in our main experimental program and in the micro‐tomographic imaging experiments described above, this approach will provide new ‘grain contact interactions laws’, in the form of contact stress‐strain and stress‐strain rate formulations, which can be implemented into existing (particle‐based) Discrete Element Model codes by ourselves and others to provide a powerful new modelling tool for sandstone deformation.

Study and Data Acquisition Plan Induced Seismicity in Groningen - Winningsplan 2016
68
Summary The table below shows which studies make a contribution the research question:
Installatio
n o
f ano
ther 3
0 G
NSS re
ceivers
and
main
tenan
ce.
Altern
ative G
NSS
pro
cessin
g w
ith
scientific so
ftware/EU
REF
Co
ntin
uatio
n o
f high
resolu
tion
InSA
R
Installatio
n o
f artificial targets
Sup
plem
ental re
search o
n th
e stoch
astic
mo
del o
f geod
etic tech
niq
ues,
Visu
alisation
too
ls
Feasibility an
d b
enefits o
f me
asurem
ent
sub
siden
ce with
tiltsenso
ren
Co
mp
action
Mo
nito
ring - C
om
pactio
n in
O
bservatio
n W
ells
Co
mp
action
Mo
nito
ring - D
SS data
Co
mp
action
Mo
nito
ring - C
om
pactio
n
Data In
tegration
Co
re Measu
rem
ents an
d C
on
stitutive
Mo
dels fo
r Co
mp
action
What is the current sub-surface strain field and can we derive this from subsidence observation collected at surface? Integrated 4D deformation monitoring with appropriate spatio-temporal density and detailed analyses on horizontal movement.
What is the current sub-surface strain field and can we derive this from subsidence observation collected at surface? Evaluation & comparison of the geodetic data from the different geodetic techniques.
What is the current sub-surface strain field and can we derive this from subsidence observation collected at surface? Better communication of monitoring results to the public.
What is the impact of reservoir pressure depletion and the rate of depletion on reservoir rock compaction?
What are the processes leading to reservoir rock compaction and which fraction is elastic?
Table 7.1 Research table linking the research questions to the study activities.

Study and Data Acquisition Plan Induced Seismicity in Groningen - Winningsplan 2016
69
8 Further Studies and Data Acquisition Projects – Seismological Model and Geomechanics
The main research questions to be addressed in the studies of compaction and subsidence are:
What is the response of seismicity to changes in production rate?
What is the future spatial-temporal distribution of earthquake b-values?
What is the future character of spatial-temporal correlations between earthquakes?
What is the maximum possible magnitude?
What is the future development of the current exponential trend of increasing seismicity?
Are there alternative seismological models that perform better under prospective testing?
How does stress drop scale with earthquake magnitude?
Will soil liquefaction occur?
The geophone and accelerometer network installed over the Groningen field and the geophones placed in the deep seismic monitoring wells have collected a wealth of data and will continue to do so. Analysis of this data to better record small magnitude earthquakes, determine the hypocentres of the earthquakes and position the earthquake hypocentres on faults will continue in the coming years.
Seismic Data Gatering Despite this data coming in, additional seismic monitoring will be installed. These data acquisition activities will mainly address improved imaging of the sub-surface and for extraordinary soil / near surface circumstances. Three seismic data acquisition projects are planned:
Flexible Seismic Monitoring System
Network of broadband sensor geophone wells
DAS Seismic Monitoring
Flexible Seismic Monitoring System Stakeholders from various departments in NAM involved in minimizing earthquake damage identified a need for a flexible monitoring and data acquisition system of standalone 3C geophones/recorders, so called nodes. Such nodes do allow for efficient low impact data acquisition in various situations that only require temporary installation of geophones. Typical examples for the use of nodes are:
1 Determination of transfer functions for buildings (from ground motion to building movement),
2 GMPE calibration for specific sites such as Wierden and poor/new building sites,
3 Empirical research at bespoke designed buildings for earthquake resistance,
4 Calibration of accelerometer and geophone network and
5 Passive/active seismic data acquisition.
A NAM internal instrument pool and data acquisition service desk is currently set up and expected operational by mid-2016. Data will be managed and stored by the same service which will be embedded in the Geomatics department. The instrument pool will consist of different types of cableless, autonomous 3C geophone nodes for maximum flexibility, allowing measurement of several projects in parallel in buildings as well as in the field or in a combinations of these two. Additionally this will allow for quick response acquisition if and when required. For 2016-2017 the base program for the system will be based on Vs800 and Vs30 data acquisition (described here

Study and Data Acquisition Plan Induced Seismicity in Groningen - Winningsplan 2016
70
below under Measuring Ground Motion), which guarantees for continuity as well as for the necessary flexibility in case of “special short-term projects requirements”.
Figure 8.1 Example of a standalone 3C geophones/recorders, so called nodes.
Network of broadband sensor geophone wells In 2015 the KNMI seismic monitoring network above Groningen field has been extended with an additional 70 stations, each station equipped with four 3-component geophones installed at 200, 150, 100 and 50 meters depth and a surface accelerometer.
In addition to these monitoring stations, installation of 4 broadband sensors is foreseen. The 3 component geophones as used in the seismic monitoring stations have a sensitivity which is too limited in the low frequencies bandwidth for localizing accurately epicenter of heavier earthquakes. The university Utrecht has tested and developed methods to localize epicenter using limited number of broadband sensors. However in Utrecht these sensors are installed at surface, resulting in poor signal-to-noise relation, therefore it is proposed to have the broadband sensors installed in a 100 meter deep borehole.
Installation of broadband sensors in boreholes is common practice in US but has not been executed in Netherlands. Technical challenge is to fulfil the dry hole requirement as stated by the supplier. First test borehole is scheduled in 2016 with the objective to prove do-ability of realizing a dry 100 meter deep hole. When successful 3 additional boreholes are scheduled to be executed in 2017.
DAS Seismic Monitoring In the Zeerijp-3A well, a fibre optic cable with multiple strands is fitted. Currently DTS (temperature) and RTCM (compaction) are measured, but also DAS (distributed acoustic sensing) is possible. The well is fitted with an array of 15 3-Component geophones, covering the lower 560 m. of the borehole. The fibre optic cable however, runs all the way from TD to the top of the borehole, with a length of over 3800 m.
This offers us the possibility to measure seismic signals with a much bigger aperture then with the conventional geophone array, hence being able (in principle) to better locate the seismic sources. This principle is depicted in the figure below:

Study and Data Acquisition Plan Induced Seismicity in Groningen - Winningsplan 2016
71
Figure 8.2 The geophone array covers only the lower part of the well, while the DAS cable runs all the way to the top,
recording a much bigger part of the wave field. This is an example from a frac job by Shell Canada. It is also seen
that once we move away from the normal incidence case (where there are no P arrivals detected due to the DAS
fibre broad-side insensitivity) you start to see easily interpretable P arrivals.
The DAS system has some pro and cons compared to the conventional geophone arrays, which may play an important role in its successful deployment in Zeerijp-3A:
Pro: full well coverage, large seismic aperture, permanent fixture, long life time. Con: lower SNR, broadside insensitivity, one component only
Particularly the lower SNR (signal to noise ratio) of the system makes the currently available recording instruments (called ‘interrogator units’ or ‘lightboxes’) less suitable for micro-seismic applications. However, OptaSense (a QinetiQ company, in collaboration with Shell) has plans to bring a further improved version of their instrument (so called 5
th generation) to the market, which is designed to be used in the micro-seismic world. Zeerijp-3A well will be
an excellent opportunity to test this new hardware. Because of the experimental nature of the DAS cable deployment in Zeerijp-3A, we will be closely working together with the fiber optics and DAS specialists in Shell Rijswijk and Houston.
In the meantime, we will deploy an interrogator unit to simultaneously record the check shots for the downhole geophone array and the DAS cable. This will enable us to test the cable, and to calibrate it against the geophone depth positions and geophone responses. Five check shots are planned around the ZRP-2 and 3A wells, at 1250 m radial distance from the downhole geophone positions. These check shots will, in effect, act like a VSP (Vertical Seismic Profile) source for the DAS cable.

Study and Data Acquisition Plan Induced Seismicity in Groningen - Winningsplan 2016
72
Figure 8.3 Five checkshots for the downhole geophone arrays around the ZRP wells that will simultaneously act like a source
for the DAS VSP recordings.
Time frame of the planned work:
First half 2016: Install interrogator unit from contractor and perform checkshots
Mid 2016: interpret DAS signals and compare with geophone response
Late 2016: Install interrogator unit from OptaSense 5th
generation (when and if it becomes actually available) and test suitability for micro-seismics
2017: gain more experience in recording, processing and interpreting DAS microseismic data. In cooperation with PTU/PTI and SCAN set-up data management and processing workflows based on Paul Webster’s (SCAN) successful demonstration of DAS micro-seismic in the Marcellus-Appold case. Consideration must be given to the broadside insensitivity of DAS which will make Groningen reservoir level events more difficult to locate but may provide a useful additional depth discriminator when integrated with co-located geophone data.
Studies into Determination of Hypocentre and Magnitude Using the data from deep geophones and from the extended geophone/accelerometer network.
Deep geophone arrays Since October 2013, NAM is deploying two deep geophone arrays, at Stedum (SDM-1) and Zeerijp (ZRP-1). These arrays consist of 7 to 10 three component geophones that cover the reservoir section. Data is captured continuously, and stored on hard disks. To date (1 Feb 2016) during 790 measuring days, some 7.5 TB of raw data has been recorded.
From this raw dataset, identified microseismic events are extracted and send over to Magnitude’s (a BakerHughes/CGG company) office near Marseille for further analysis and storage. To date (1 Feb 2016) some 650 of these events were located by Magnitude, meaning their hypocentres have a x,y,z position assigned, as well as a magnitude (in the range -2.5 to +2.8). The vast majority of these events are located in, or just above or below the reservoir. This is depicted in figure 8.4

Study and Data Acquisition Plan Induced Seismicity in Groningen - Winningsplan 2016
73
Figure 8.4 Hypocentre locations of event catalogue, showing almost all events are located inside the reservoir.
The location workflow that Magnitude has derived is based on first arrival picks of P, S and converted waves in the seismograms. See the report on the website www.namplatform.nl. As all ray based and travel-time pick based methods, it suffers from erroneous picks when the waveforms are very complex and therefor difficult to interpret. Although the workflow is (semi) automated, it still requires manual inspection and ‘guidance’. As was shown in the report by Matt Pickering, who manually picked and located some 30 events from the catalogue, a good understanding of the waveforms and which phases to picks is essential. Guided by forward modelled full waveforms, he was able to correctly determine the proper first arrival times to use in the inversion for location. See his report on the www.namplatform.nl.
This led us to pursue a method whereby not only the first arrival times of the waveforms are used, but rather the whole waveform itself. This FWI (Full Waveform Inversion) method essentially matches a recorded waveform with a modelled one, drawn from a library filled with all possible modelled seismograms, calculated for all possible locations within a 3D cube around the geophones. Since we have detailed knowledge of the P wave and S wave velocities and the densities of the geological layers around the downhole positions of the geophones, we can create synthetic seismograms to fill our library. This is a one time, computer very intensive exercise, but once done, we only need to compare new real measured events against this database. In fact, this comparison is done by minimizing a misfit function with several (up to 4) terms, derived from attributes of the modelled and observed waveforms, which gives lower values as progressively better matching synthetics are found. This workflow was derived some time ago and tested on 7 events, see figure below:

Study and Data Acquisition Plan Induced Seismicity in Groningen - Winningsplan 2016
74
Figure 8.5 First results of FWI method to locate hypocentres and derive source mechanisms
Now the workflow is being productionized to be able to handle the whole 650 event catalogue, using the computing infrastructure of Shell Houston. For the data recorded by the two new deep geophone arrays at ZRP-2 and ZRP-3, we will use the workflow of Magnitude as a base case. We anticipate that the FWI workflow will produce improved results, also with source mechanism determined.
Time frame of the planned work:
April 2016: stop recording at temporary arrays at ZRP-1 and SDM-1 and switch to permanent arrays of ZRP-2
and ZRP-3
Mid 2016: adapt Magnitude workflow for hypocenter location to ZRP2/3
Late 2016: evaluate results of FWI workflow
Surface array The extended KNMI shallow borehole network (69 additional stations) has become on line in 2015. With the previous network (5 geophone arrays and 17 surface accelerometers) KNMI was able to detect and locate earthquakes with a magnitude of 1.5 with a 500 m lateral accuracy over the Groningen field. Because of the poor vertical resolution of the limited network, all located earthquakes were placed at 3,000 m depth, the average depth of the gas reservoir. With the extended network in place and with the availability of a detailed elastic velocity model over Groningen field, it is now possible to detect and locate earthquakes with a magnitude of 0.5 with a much higher accuracy, both lateral and, most importantly, vertical.
To make full use of the new network, KNMI is developing alternative location workflows, of which the first results look promising. Particularly the ability to determine the vertical position is most interesting. However, this is still work in progress. At NAM, Shell and ExxonMobil, new workflows are assessed based on arrival time picking and ray based inversion methods. The need for ongoing QC and selective in-house processing of the geophone data, particularly when reviewing new workflows, remains.
At Rijswijk and Houston, we are also engaging in FWI (Full Waveform Inversion) methods for event location, magnitude estimation and source mechanisms (moment tensor inversion). In line with what is described in the ‘deep geophones arrays’ section above, a library of forward modelled waveform is created, based on the elastic

Study and Data Acquisition Plan Induced Seismicity in Groningen - Winningsplan 2016
75
velocity model. Actual recorded earthquakes can then be compared to the modelled ones to determine their parameters (location, magnitude and source mechanism).
For the shallow borehole network, including the accelerometers, the understanding of the geology and the velocities (particularly for the S waves) of the near surface is important. Therefor more effort will be needed to delineate an accurate velocity model, from reservoir level all the way to the surface. The work that Deltares has done constructing a near surface velocity model for the GMPE work, together with available and new geophysical measurements can help achieving this goal.
Time frame of the planned work:
Near surface model update, with Deltares: Q3, 2016
Near surface S velocity model based on ambient noise interferometry, with Stanford: 2016-2018
Ray based travel-time methods review: Q3, 2016
FWI methods for location and moment tensor inversion, with MIT: 2016-2018
Core Measurements and Models for Rupture Processes As in the case for compaction, laboratory work on the rupturing process will continue its existing 4‐year project on fault (re)activation, dynamic friction and failure behaviour, which runs until the end of 2018. Here we recap the progress to date and some potential revisions and new objectives for the period 2017‐2019 are discussed.
Current project and progress to date The original aims of the laboratory work with respect to the rupture process are still valid and can be summarized as followed:
a) to develop mechanism‐based constitutive models describing the (re)activation and dynamic frictional behaviour of faults, based on experiments done at true in‐situ conditions on Groningen core material and including slip distance, slip rate and fault state effects.
b) to develop upscaling relationships to extend the fault strength models obtained at the laboratory scale to the 10m and 100‐1000m length scales that characterize numerical modelling mesh sizes.
c) to incorporate the models developed into (quasi)dynamic fault rupture simulator platforms, and to validate these simulators against laboratory‐scale rupture experiments on large, pre‐faulted samples.
d) to apply the validated rupture models/simulators to evaluate conditions favouring seismogenic fault activation and to model associated rupture and earthquake statistics at the reservoir scale.
Progress to date includes experimental determination of full, rate‐and‐state dependent (RSF) friction laws for simulated fault rocks derived from all of the main reservoir, overburden and (Carboniferous) underburden lithologies present in the Groningen field. These were determined under true in‐situ P‐T and pore‐fluid conditions at low fault slip (rupture nucleation) velocities. The results indicate the potential for unstable, velocity‐weakening slip and associated seismogenesis only in the basal Zechstein immediately above the reservoir, with other formations exhibiting stable velocity strengthening behaviour. Field studies of faults in UK analogues of the Groningen field have confirmed that slip is highly localized into persistently weak zones with thicknesses similar to those explored in the experiments. Dynamic rupture modelling at the reservoir scale performed using the Diana code has incorporated the first friction data from the lab experiments. This has shown that rupture is favoured near the top of the depleting reservoir and has explored the conditions under which seismogenic slip could propagate into the Carboniferous underburden. First steps towards experimental validation of rupture modelling has been undertaken using the large biaxial shear machine at the China Earthquake Administration (CEA) Laboratory in Beijing.
Plans up to end 2018 The original project aims will continue to be pursued in 2016‐2018. Specific attention will be paid to:
1) Experiments on:

Study and Data Acquisition Plan Induced Seismicity in Groningen - Winningsplan 2016
76
‐ the time dependent restrengthening and subsequent slip weakening behaviour of statically healed Groningen fault gouge compositions, and
‐ the dynamic frictional behaviour of mixed fault rocks (shear‐mixed gouge compositions)
2) Microphysical underpinning of the constitutive laws obtained to promote extrapolation to long healing times and low loading rates.
3) Development of upscaling relations for dynamic friction laws from the lab (cm) to the 1‐10‐100‐1000m scale. This work started in Feb 2016 and will focus until end 2018 on applying spatial homogenization theory and numerical methods, as well as other FEM, asperity length‐scale and fractal scaling methods, to explore how the multiscale compositional heterogeneity and geometric irregularity seen in natural faults determines dynamic frictional behaviour at mesh scales for geomechanical modelling. Upscaled friction models will be tested against 5‐100 cm sample scale experiments conducted in the large biaxial testing machine at CEA Beijing. Discussions are in progress to make use of m‐scale sample testing facilities available at the National Research Institute for Earth Science and Disaster Prevention (NIED) in Japan and potentially in the well‐testing lab at Shell Rijswijk. Details on newly emerging plans for this work are presented below.
4) On‐going (quasi)dynamic modelling of reservoir depletion, deformation, induced fault rupture and seismicity, incorporating the lab‐derived and up‐scaled dynamic friction models, and testing the rupture models used against large‐sample fault slip experiments conducted at the above‐mentioned labs.
Newly identified questions and aims Though implicitly covered in our original aims, a number of important questions presented itself during 2015, which are crucial to address explicitly in the period up to 2019.
Direct experimental simulation of induced seismic slip
Motivation
Geomechanical modelling of dynamic rupture at the reservoir scale, conducted at NAM, TNO and UU, has shown that rupture of normal faults offsetting the reservoir tends to occur near the top of the reservoir interval, for purely mechanical forcing reasons. However, rupture size, stress drop, seismic potential and potential for downward propagation into the Carboniferous underburden, are highly sensitive to the dynamic evolution of friction during the slip event. This has so far been simulated using relatively simple, linear slip‐weakening laws, tuned to friction data for the relevant Groningen lithologies ignoring slip rate dependence. While the rate dependent (RSF) friction data obtained in the UU experiments to date are fully relevant to low, slip nucleation velocities, they cannot be directly extrapolated to the m/s velocities that occur for milliseconds periods during induced seismic rupture, where slip mechanisms are likely to be different and where processes such as slip weakening due to microstructural evolution, frictional heating and thermal pressurization of pore fluid may influence fault strength in a complex dynamic manner. Numerical modelling of frictional heating during an induced seismic slip event performed at UU has shown that frictional heating will be insufficient to cause direct frictional melting or fault rock weakening effects. However, dynamic weakening due to thermal pressurization of pore fluid cannot be excluded. High velocity frictions experiments used to date to study natural, co-seismic rupture are not able to simulate the in‐situ P‐T and (fluid) chemistry conditions of induced earthquakes, nor can they attain the dramatic accelerations and decelerations required to simulate induced seismic slip displacements of the order of 1 cm and slip velocities of 1 m/s (≈ Mw 3.5 earthquake). In addition, no study thus far successfully links low velocity rate‐and‐state friction behaviour with the strong dynamic weakening observed at high velocity.
On this basis, the UU team concludes that while some insights into dynamic friction evolution during induced seismic slip can likely be gained from conventional high velocity friction experiments (performed in collaboration with colleagues at the earthquake dynamics labs at CEA and INGV Rome, for example) the only way to obtain reliable friction laws that can describe dynamic friction evolution during induced rupture reaching seismic velocities is to directly measure frictional evolution in lab experiments simulating realistic, induced seismic slip events – under true in situ conditions.

Study and Data Acquisition Plan Induced Seismicity in Groningen - Winningsplan 2016
77
Proposed experiments: Induced Earthquake Simulator
To achieve direct laboratory measurement of dynamic friction during simulated induced seismic events, the UU team proposes a novel methodology. We will perform fault shear experiments using a modified version of our standard direct‐shear set‐up located in a triaxial testing machine, capable of reproducing the in‐situ pressure, temperature and fluid chemistry conditions of the faults in the Groningen reservoir. In contrast to the traditional approach of applying a constant displacement rate to the loading piston to investigate friction, we will apply a (near) constant shear stress to the simulated fault until failure occurs, thus simulating in‐situ behavior. We will control the stress and available energy input into the system using calibrated spring elements with variable stiffness, placed in line with the loading axis. Upon failure of the loaded fault, slip motion will evolve naturally, reaching peak slip velocities that can approach seismic slip velocities with accelerations of larger than 10 g (~100 m/s2) and displacements up to 5 mm (cf. a Mw ~3 earthquake in terms of total displacement reached). During slip, the dynamic evolution of fault strength, slip rate and near‐sample temperature and pore pressure will be directly measured to develop the necessary dynamic friction laws. Preliminary work already done at UU has demonstrated that this is a feasible experimental technique provided that data acquisition is fast (we used 20 kHz in the preliminary work). Expected results include a measure of true dynamic friction for a short duration seismic event, including quantification of the earthquake energy budget. Results will be compared with numerical modelling work of multi‐mechanism, frictional evolution conducted in collaboration with Dr. Nora De Dontney from the Houston laboratory. In addition to exploring dynamic failure resulting from time dependent failure triggered by static loading, applied shear stress can potentially be varied linearly or in an oscillatory fashion to investigate the failure stress as a function of time as well as potential effects of stress changes induced by e.g. tidal loading.
In addition we propose as well to conduct high velocity measurements using a more traditional rotary shear device. With the core material made available from the Zeerijp-3A well, there is an opportunity to perform high velocity experiments using this technique on the range of lithologies: upper Slochteren sandstone, lower Slochteren sandstone, Ten Boer claystone, Carboniferous shale, and the Ameland heterolithic interval. These high velocity tests will complement the frictional studies that are being performed by the University of Utrecht at lower, nucleation velocities, on the same lithologies. Similar to the Utrecht studies, tests will likely be performed on a simulated gouge material but for high velocity testing, the analysis will be performed on a rotary shear apparatus and the gouge will be confined to the sample area by surrounding the sample with a Teflon sleeve.
New plans regarding upscaling Recent work by a group of Japanese scientists (Yamashita et al., Nature, 2015) at the National Research Institute for Earth Science and Disaster Prevention (NIED) in Tskuba has demonstrated that the frictional behaviour of faults depends on the size of the sample being sheared. Using a large‐scale biaxial apparatus capable of sliding metre‐size rock blocks over simulated fault surfaces, it was shown that the sliding friction decreases at work rates (i.e. energy input rate) one order of magnitude smaller than in cm‐scale experiments. It was inferred that this was the result of stress heterogeneities on the fault which are characterized by locally higher work rates. This observation provides important hints into potential solutions for the problem of spatial upscaling from laboratory data to the field scale. However, the experiments were done by sliding bare rock surfaces over each other, whereas most if not all faults contain fine‐grained gouge material.
As planned since the initiation of the UU programme, we propose to investigate the evolution of friction in experiments on realistic Groningen fault gouge material covering a wide range of sample scales, from the cm‐scale to the m‐scale, thus providing a basis to upscale lab data to describe friction at the geomechanical mesh scale (1‐10‐100‐1000 m scale). The equipment employed by the Japanese offers an important opportunity for sliding experiments on m‐scale samples that is presently being investigated via discussions with key collaborators in Japan. Possibilities to use the large scale well testing machines at Rijswijk are also being investigated. In the meantime, the UU team proposes to proceed with cm‐ scale experiments using the triaxial direct‐shear apparatus at the HPT laboratory, through the dm‐scale using the biaxial apparatus available at INGV in Rome, Italy (through collaboration with Dr. Collettini) and finally to the sub‐m scale using the biaxial apparatus at CEA in Beijing, China and potentially the biaxial apparatus in Japan. In addition to investigating gouge friction and effects of spatial variation in gouge composition, we aim to test how the roughness and nature of the wall rocks affect frictional behaviour, using a dedicated piston set designed to house different rock materials such as for instance the Slochteren sandstone.
Study and Data Acquisition Plan Induced Seismicity in Groningen - Winningsplan 2016
78
In-situ Stress measurement
Objective Determine the state of stress in the reservoir and in the Carboniferous. There will be variation throughout the field so multiple measurements will need to be made to capture the heterogeneity. This data can be used to better calibrate models to the current stress state of the field and to provide insight into the possibility of rupture out of the reservoir zone. The objective of the study is:
1 perform a feasibility study of new stress measurements in existing wells targeting RO and DC units and 2 in case of identified candidate wells, start executing a stress measurement campaign.
Description The information on principal stress values and directions is key to any geomechanical study. Several finite element models are built for the Groningen field with the aim to model stress based fault reactivation. With constraints these models can be used to derive new seismological models or to provide more insight in a possible maximum magnitude.
The geomechanical models assume in most cases a regional stress field where equilibrium between rock stress and gravity load is obtained via the elastic rock properties and the boundary conditions of the model. These models can help us to formulate hypothesis for stress evolution in and around the reservoir. E.g. numerical modeling results suggest that besides the low overall level of shear loading in the Carboniferous, there may be an additional reduction in loading of the fault at the top of the Carboniferous. This local reduction is the result of depletion around the geometry of pre-existing fault offset. This additional reduction in stress could act as an additional barrier to fault propagation into the Carboniferous. Confirmation of such a feature would require that a well be drilled sufficiently close to a fault, and that measurements be taken at a close enough spacing to resolve this signature (~every 10-15 meters). Also the observed stress variation in the model may be used to guide locations for stress measurement to capture the field heterogeneity.
In parallel an overview study by NAM (van Eijs, 2016) on available stress information in the Groningen field has been finished recently. The study provides stress information that can be used as calibration points for these models. The two main conclusions of this study are:
1. The amount of stress data in the Groningen field is very limited
2. The data that is available indicate that both stress values and directions are variable over the field
A larger variability of values and directions of the stress implies a more complex stress pattern that conflicts with the assumption of a simple regional stress field in the models.
To be able to verify this first indication of stress variability it is proposed to study the feasibility of a measurement campaign to obtain multiple values for the minimum principal stress at various locations in the field and in various stratigraphical units. Possible measurements (phase 2) require a rock strength test and will be executed in cased holes and are therefore dependent on existing perforations. These perforations will be used for the execution of rock-strength tests. Packers and/or plugs are required to constrain the zone that is being pressurized. The feasibility of new perforations will be investigated as well in phase 1. In phase 1 a ranking of well candidates is proposed based on indicators like location of the well, the availability of perforations, penetration length of the well into the Carboniferous, cement integrity, accessibility of the well etc.
The rock strength test will provide an estimate of the minimum principal stress value. This value is dependent on the depletion level and therefore the measurement of the pore pressure is a requirement as well for each test.
Deliverable Report on possible well candidates and corresponding possible stratigraphical units. Overview of existing perforations per well and opportunities for new perforations. Description of tools, plugs and packers for stress measurements. Estimate of the costs and delivering a proposal for phase II: execution of the stress measurements.

Study and Data Acquisition Plan Induced Seismicity in Groningen - Winningsplan 2016
79
Improvements and enhancements to the faulted 3D geomechanical
model
Objective To improve correlation between geomechanical model attributes and depletion associated seismicity by updating current 3D geomechanical models (global and sub-models with explicit faults) based on new field and laboratory data.
Description As part of the on-going Groningen study, new laboratory and field data will be collected. New laboratory data include – (i) variable friction, (ii) stress-strain behavior of reservoir rocks and constitutive models, and (iii) reservoir rock creep. New field measurements include – (i) in-situ stress state, and (ii) field InSAR ground displacements. It is likely that there will also be updates to the pressures within the reservoir due to revised rock properties as well as due to new production scenarios. Updating the current 3D geomechanical models (both global and sub-models) with new information, calibration with stress states measured after decades of production, will help to improve correlation between geomechanical model attributes and depletion induced seismicity.
Deliverable An updated 3D geomechanical model and appropriate output attributes to determine the relative impact of several production scenarios, and evaluate alternatives for optimizing production.
Geomechanical modelling
Static modelling In the period 2012-2015 a large effort by ExxonMobil on static geomechanical modelling resulted in a calibrated geomechanical model for the Groningen field. Several sub models that comprise areas within the Groningen field were defined that explicitly models the frictional behaviour of the faults where the geological offsets are honoured as well. As part of the on-going Groningen study, new laboratory and field data will be collected. New laboratory data include – (i) variable friction, (ii) stress-strain behavior of reservoir rocks and constitutive models, and (iii) reservoir rock creep as described in other parts of this data- and acquisition plan. New field measurements include – (i) in-situ stress state, and (ii) field InSAR ground displacements. It is likely that there will also be updates to the pressures within the reservoir due to revised rock properties as well as due to new production scenarios. Updating the current 3D geomechanical models (both global and sub-models) with new information, calibration with stress states measured after decades of production, will help to improve correlation between geomechanical model attributes and depletion induced seismicity.
Dynamic modelling There are a variety of modeling techniques applied by the earthquake community to examine earthquake rupture behavior. Geomechanical modelling of dynamic rupture at the reservoir scale so far has shown that rupture of normal faults offsetting the reservoir tends to occur near the top and base of the reservoir interval, for purely mechanical forcing reasons. However, rupture size, stress drop, seismic potential and potential for downward propagation into the Carboniferous underburden, are highly sensitive to the dynamic evolution of friction during the slip event. Models have limited contribution to the understanding of earthquakes if not calibrated to the data. First comparisons between 2D model and observed corner frequencies are promising. More specifically it is attempted to correlate simulated seismic slip area with moment tensor inversion results and corner frequency, and to relate simulated particle velocity and acceleration with the measured data in the down-hole geophone wells.
We consider in a next phase to extend the 2D models into the 3D domain. The existing 3D of ExxonMobil presents itself as an ideal candidate but the mesh requirements are very different for the quasi-static geomechanical model and the fully dynamic explicit model so it is not possible to simulate earthquakes in the existing sub-models. A structurally ‘realistic’ 3D fault mesh framework model (Loppersum area, containing 2 monitor wells) can be

Study and Data Acquisition Plan Induced Seismicity in Groningen - Winningsplan 2016
80
constructed that allows us to compare 3D-4D location of seismic event data collected from these down-hole gauges; modelled seismic events; and realistic geometry of geological faults and stratigraphic.
In parallel some assumptions that were incorporated in 2D models so far need to be further investigated in the 2D models before incorporating them in the 3D domain:
Assessment of the energy partitioning before, during and after seismic slip is only partly addressed so far. Further analysis should obtain insight into the partitioning of energy into compaction strain, fault slip, and kinetic (radiated wave) energy, and how it depends on subsurface parameters.
So far, reservoir and non-reservoir formations assumed linear elastic behaviour, while linear slip weakening behaviour has been assumed for the fault. It is suspected that other energy dissipation mechanisms can lead to different rupture mechanisms. Energy dissipated by plastic shear or creep in (reservoir) formations is not available as kinetic energy during the rupture process. Undrained behaviour of both shale and sandstone formations during a fast rupture process may locally reduce the effective stress and shear stress carrying capacity, thereby introducing a rate dependent response. Furthermore, part of the formation strain energy may be converted into frictional heat along the fault plane. These processes, and other, are suspected to influence the simulated dynamic slip response. The following physical processes are considered to be analysed in the next phase: Undrained formation behaviour during the rupture process, salt creep during depletion (and injection), formation plasticity, rate and state fault friction (or velocity dependence), heat generation during the rupture process and the impact of inelastic reservoir strain in the fault reactivation process.
Quasi dynamic modelling Quasi-dynamic earthquake simulators will augment the current analysis methods and allow for additional physics to be incorporated when addressing difficult technical problems.
Quasi-dynamic models allow for earthquake cycles to be simulated. These models generally implement a rate-and-state friction representation of the fault fictional behavior and do not explicitly capture the wave propagation though the off-fault material. To capture the wave propagation in a fully dynamic model, very small time-steps are required, so often these models are only used to capture the behavior of a single earthquake event. Quasi-dynamic models, on the other hand, treat the material as if it has an infinite wave speed and all stress changes that result from slip on one area of a fault are instantaneously transferred to all other portions of the fault. Small time-steps are used during the coseismic rupture propagation phase but much larger time-steps can be used to capture the deformation during the interseismic phase. This allows for fault healing and additional loading to occur between earthquake events.
Alternative Seismological Models As part of the studies into induced seismicity several seismological models have been developed. The strain-partitioning model was the basis for the hazard assessment in winningsplan 2013. This was later replaced by the activity rate model. Additionally, hazard models based on geomechanical modelling of large sections of the reservoir have been developed in parallel. This model was first presented in winningsplan 2013 and has been further developed since then.
In our studies NAM attempts to develop a diverse set of seismological models. Two models are currently in development:
Based on faulted 3D geomechanical model
Slider Block Model
Model based on Eshelby Inclusion

Study and Data Acquisition Plan Induced Seismicity in Groningen - Winningsplan 2016
81
Alternative seismological model based on faulted 3D geomechanical model
Objective Continue to develop and advance the fault based seismological model developed by EMURC. Additional statistical methods should be applied to determine which model provides the best fit to the observed seismicity and new approaches should be taken to determine the physical motivation for determining the form of the seismological model
Description A methodology has been developed to generate an earthquake activity model (seismological model) based on the results of a faulted, 3D geomechanical model. The current version of the activity model makes a correlation between a geomechanical quantity (fault slip or dissipated fault energy) and observed past seismicity. Different production scenarios result in varying amounts of additional fault slip or dissipated energy that should occur over the next 5 years. Using the correlation that was developed a forecast can be made for the expected number of earthquakes that may occur over the next 5 years.
The current version of the fault based seismological model considers multiple forms for the correlation between the geomechanical quantity and the observed number of earthquakes. Different orders of polynomials or exponential forms can be considered as well as the relative weighting of the yearly incremental change vs. the cumulative change. The log-likelihood value is used to assess the goodness-of-fit of one activity model versus another but additional metrics can be applied to determine which model provides a statistically better fit to the data. Currently, additional simplified metrics are in use but this needs to be broadened to help determine the best seismological model and therefore what should be used to forecast the hazard in the Probabilistic Seismic Hazard Assessment (PSHA) analysis.
In addition to determining which form of underlying activity model is best, these statistical methods can also determine the input geomechanical quantity that will provide the best fit to the observed seismicity. In the case of the 3D faulted geomechanical model, fault slip and dissipated fault energy have been considered, but additional quantities should also be considered and their goodness-of-fit assessed. Rather than a fault based quantity, compaction (or effective-strain-thickness) is currently used as the geomechanical quantity for the PSHA analysis. Fault based and compaction based metrics need to be compared to determine the best seismological model.
In addition to a statistical determination of the best seismological model, a physical understanding of why the earthquake activity should be of a certain form is crucial. Currently an exponential form is considered in the PSHA analysis and there are some theories to provide a physical explanation for why this form should be considered. However, there are additional methods to consider that may suggest that a different form for the underlying activity model should be considered. Continued effort is needed in this area of research to determine what the underlying physical mechanism is for the accelerating rate of seismicity that has been observed and if it will continue to accelerate in the future.
Deliverable A seismological model based on the faulted 3D geomechanical model and an assessment of the relative goodness-of-fit for various seismological models.
Slider-block systems as a simple physical model of Groningen seismicity There is an extensive literature on the statistical mechanics of failure, including the application of slider-block systems to natural seismicity. The key aspect of these systems is that the evolution of failure, such as seismicity, is primarily governed by property fluctuations and not average values. In its simplest form a slider block system is a rectilinear array of rigid blocks, resting on rigid plate, connected to nearest neighbouring blocks and a second parallel rigid plate by elastic springs (Fig. 8.6). An essential feature of this system is that the initial stresses, failure stresses or stress drops during motion at the base of each block are not all identical, but rather at least one of these properties is drawn from a distribution. As one plate is increasingly displaced relative to the other, shear tractions increase at the base of each block. Once this traction equals the frictional resistance for one block it slides to reduce its basal shear stress whilst transferring stress to its neighbours via the connecting springs. This may trigger additional blocks to slides and this process repeats until a new equilibrium state is established (Fig. 8.7).

Study and Data Acquisition Plan Induced Seismicity in Groningen - Winningsplan 2016
82
(a) (b)
Figure 8.6 Schematic illustration of a simple slider-block model of seismicity on a single fault; adapted from Rundle (2003).
(b) Example of simple physical rules that govern the evolution of a slider-block system.
For slider-block systems with a sufficiently large number of blocks the emergent phenomena possess many similarities to induced seismicity observed within the Groningen field, e.g.:
1. Earthquakes: Transient finite slip events 2. Event attributes: hypocenter, origin time, magnitude, rupture geometry 3. Power-law distribution of magnitudes 4. Maximum magnitude 5. Exponential-like increase in activity rates with displacement 6. Exponential-like increase in seismic moment rates with displacement 7. Recognizable b-values insensitive to initial conditions 8. Inverse power-law like decrease in b-values with displacement 9. Temporal aftershock triggering consistent with an inverse power-law 10. Spatial aftershock triggering consistent with an inverse power-law 11. Recognizable finite-rupture scaling with magnitude 12. Potential for slip triggering of basement faults
These statistical properties are reproducible despite the role of randomised sampling, but of course the exact location, timing and magnitude of each event differ from simulation to simulation. The particular statistical properties that emerge such as b-values, exponential trends and the maximum magnitude are critically sensitive to the choice of the ratio of spring constants (Kc/KL) which represents the force interaction length-scale, the stress drop, and the spread of strength variations about its mean value. However, appropriate choices of these parameters do yield simulated seismicity trends that resemble the same trends observed in the induced Groningen seismicity.

Study and Data Acquisition Plan Induced Seismicity in Groningen - Winningsplan 2016
83
Figure 8.7 Example results obtained from a simple slider-block system with a physical extent of 60 km by 600 m comprising
105 blocks each about 20 by 20 m in size. (a) Frequency-magnitude distribution of slip events as it evolves with
increasing relative displacement, x, of the plates with an upper bound influenced by the finite size of the system.
(b) The trend of decreasing b-values with increasing initial relative displacement of the plates, u, before reaching
some steady-state value. (c, d) The cumulative event numbers and the rate of event numbers show an
exponential-like increase with increasing relative displacement of the plates until reaching some steady-state.
(e, f) The total seismic moment and fraction of the total strain accommodated by slip (strain partitioning fraction)
show an initial exponential-like increase with increasing relative displacement of the plates.
The slider block model will later in 2016 be further developed and documented. The development of the slider-block model has started and will be further developed and documented.
Eshelby inclusion Model Segall and Fitzgerald (1998) suggested an induced seismicity mechanism, where that horizontal poroelastic stress changes are extensional and vertical stress changes are negligible. They analysed this production-induced seismicity model using the concept of an Eshelby inclusion (Eshelby, 1957; see Fig. 8.8). These models assume that pressure
(a) (b)
(c) (d)
(e) (f)

Study and Data Acquisition Plan Induced Seismicity in Groningen - Winningsplan 2016
84
change in the reservoir can be described by an ellipsoidal volume of constant pressure change, embedded in an elastic medium in which pressure is unchanged. Stress changes are uniform inside the inclusion.
Figure 8.8 Schematic of stress changes in and around a contracting reservoir in an Eshelby inclusion model. From Segall and
Fitzgerald (1998).
In cooperation with Jenny Suckale (Stanford University) and David Dempsey (The University of Auckland) a seismological model based on an Eshelby inclusion, later extended to more comprehensive model of stress tensor evolution, will be developed. Stress tensors that result from the model can be projected on the Groningen fault systems and tested for a Mohr-Coulomb strength criterium. In the proposed workflow the faults exhibit an heterogeneous shear stress profile. In combination with a triggering mechanism the rupturing process is mimicked. The analytical model allows for fast calculations and is therefore suitable for a stochastic approach and will in a later stage be calibrated with the event catalogue. Calibrated models can subsequently be used for further seismicity forecasts.
Assessment of hazard changes due to swing production
Objective Augment previous studies on the effects of swing production on the total aggregate seismicity as well as the changes in seismicity rate throughout the year. This will be achieved via additional modeling investigations and identifying spatio-temporal associations between gas production / production rate and seismic activity / activity rate.
Description There are various methods of investigation into the change in the total number of earthquakes observed as a result of swing production. If the same final stress state is reached, then the same stress should be released and the same number of earthquakes should occur. However, swing production may shift the occurrence of these earthquakes into the times of high depletion rate.
By incorporating additional physics into the methods of investigation, it is possible that swing production could have an effect on the total seismicity or a change in b-value. A thorough data-based investigation into the observations of earthquake occurrence will also allow for testing of these models and their validity.

Study and Data Acquisition Plan Induced Seismicity in Groningen - Winningsplan 2016
85
The objectives of this project are to:
1. Investigate not only daily and seasonal production variations but also large and sudden changes in the baseline
production rate. In particular, how do changes in the annual production target affect seismicity?
2. Extend the analysis using data-driven and/or physics-based models to analyze the impact of swing production
on the magnitudes of the seismic events.
3. Determine if there are there any “transient” effects on seismic activity rate that might be observable before the
new steady state seismicity is reached?
4. Determine what is necessary for statistical significance. How long must we wait before the observed seismicity
gives a statistically significant indication that such a change has actually occurred? Is the data sufficient to
determine a lag time between the change in production rates and the change in seismicity?
5. If possible, perform more fine-grained analyses to determine if there are local variations to the field-wide
associations between swing production and seismic activity. For example, it may be the case that certain parts
of the field are more sensitive to swing production than others.
6. Test model conclusions via a statistical analysis of historical production and seismicity data.
Deliverable A report detailing the new analysis.

Study and Data Acquisition Plan Induced Seismicity in Groningen - Winningsplan 2016
86
Summary The table below shows which studies make a contribution the research question:
Flexible Seism
ic Mo
nito
ring System
*
Netw
ork o
f Low
-Frequ
ency ge
op
ho
ne w
ells
DA
S Seism
ic Mo
nito
ring p
oro
sity relation
ship
Stud
ies into
Determ
inatio
n o
f Hyp
ocen
tre and
Magn
itud
e
Co
re Measu
rem
ents an
d M
od
els for R
up
ture
Pro
cesses
In-situ
Stress m
easure
men
t
Altern
ative seismo
logical m
od
el based
on
fau
lted 3
D geo
me
chan
ical mo
del
Imp
rovem
ents an
d en
han
cemen
ts to th
e fau
lted 3
D geo
me
chan
ical mo
del
Geo
mech
anical M
od
ellin
g
Assessm
ent o
f hazard
chan
ges d
ue to
swin
g
pro
du
ction
What is the response of seismicity to changes in production rate?
What is the future spatial-temporal distribution of earthquake b-values?
What is the future character of spatial-temporal correlations between earthquakes?
What is the maximum possible magnitude? (also addressed by Structural modelling)
What is the future development of the current exponential trend of increasing seismicity?
Are there alternative seismological models that perform better under prospective testing?
How does stress drop scale with earthquake magnitude?
Table 8.1 Research table linking the research questions to the study activities.
* The Flexible Seismic Monitoring System also aims to address some of the research question on Ground Motion.

Study and Data Acquisition Plan Induced Seismicity in Groningen - Winningsplan 2016
87
9 Further Studies and Data Acquisition Projects – Ground Motion
The main research questions to be addressed in the studies of compaction and subsidence are:
How does the non-linear near-surface response to earthquakes scale with magnitude?
What is the role of finite rupture geometries, including possible basement rupture?
What is the spatial correlation in the surface ground motion?
What is the local ground motion response on Wierden?
What is the local ground motion response near sloping surfaces (embankments and ditches)?
Measuring Ground Motion Measurement of ground motion has expanded considerable over the last years with:
Installation of accelerometers at all new geophone stations of the KNMI network and installation some
additional accelerometers periphery of the field,
Installation of accelerometers in some 300 buildings,
Installation of accelerometers at selected objects like NAM production locations.
In the previous section we described the plan for a Flexible Seismic Monitoring System. Also studies into ground motion will benefit from data collected by this system. In this section we introduce additional data gathering of projects for ground motion.
Using a Shear Wave Generator Until the late nineties the seismic data acquisition industry used heavy shear wave generators as a source for creating their S-waves. The so called pilot sweep of shear vibrators allows for the generation of controlled ground waves; amplitude and frequencies are programmable independently and a sweep can run from a few till tenth of seconds. In principle it is also possible to program an (earlier recorded) earthquake, however using a frequency below 2Hz will damage the machine. One of the last existing S-vibrators is parked in the south of France and specialists currently (spring 2016) verify on behalf of the owner if the condition of the main elements (such as base plate/controller/reaction mass) justify full restoration, before the unit can be tested for use in Groningen as active source in for testing in combination with the earlier mentioned Seismic Monitoring and Data Acquisition System.

Study and Data Acquisition Plan Induced Seismicity in Groningen - Winningsplan 2016
88
Figure 9.1 One of the last existing S-vibrators in the south of France. Currently investigation whether this vibrator can be
restored focus in Groningen are in progress.
In addition to the French S-vibrator a number of alternatives are available, e.g. large vibrators are used by the
University of Texas, Austin for their Network for Earthquake Engineering Simulation research program (NEES).
These vibrators can create P- or (wide band) high energy S-waves and are available for experimental (also non US)
research. In Germany a smaller sized shear wave vibrator is available at LIAG, das Leibniz-Institut für Angewandte
Geophysik. Under certain circumstances the smaller scale makes this machine more easy to deploy in the field than
the heavy ones. Also this unit is available for research projects. The applicability for Groningen of the here above
listed shear vibrators will be evaluated and compared before deciding which one(s) should be considered fit and
preferred for mobilization to the Groningen area.
Using shear-wave vibrators as seismic source is expected to be helpful during the parameterization campaign of the
Groningen subsurface despite of the fact that frequency range of these units is not fully coinciding with (expected)
earthquakes. (Earthquakes are not identical anyhow.) NAM plans nevertheless looking into possible ways for
improvement of S-wave generators if results show the need for that.
Measuring Ground Motion The current GMPE’s are partly based on shear-velocity profiles that were derived from field data acquired with active sources. The shear-wave velocities to the reference rock at 350 m (the base of the Upper North Sea formation) were derived from 3 sources:
1 Vs values assigned to vertical sections through the GEOTOP model,
2 Ground roll inversion results from the active data acquired in the area during the 80s and 90s,
3 An empirical relation between the existing P-wave model.
Recently, reference rock was to moved the to 800 m depth (the base of the North Sea Supergroup Formation), in order to capture the most important site response effects (such as resonances that may play a role in amplification), and below which there is limited lateral structural variability. It is desirable to directly capture the shear velocity profile down to the reference rock at 800 m depth. Active seismic sources (such as the S-vibrator) typically excite energy in the frequency range > ~ 2 Hz. As a result, the depth sensitivity of the active measurements is under certain geological circumstances sometimes limited to about 100 ~ 150 m. In that case passive seismic measurements are a good alternative. Surface waves excited by various natural mechanisms such as microseisms

Study and Data Acquisition Plan Induced Seismicity in Groningen - Winningsplan 2016
89
(not to be confused with microseismic) dominate seismic noise below 1 Hz. In the recent past data processing has been developed to extract shear wave velocities from ambient seismic noise. The low-frequency content of the seismic noise means that the surface waves are sensitive to greater depths than surface waves excited by active sources. In fact, there is potential for sensing shear wave velocities down to the reservoir level and below provided the array is wide enough. This, however, comes at the cost of resolution if the sampling is too sparse.
NAM currently designs an active and passive seismic acquisition campaign for about 70 locations and/or a grid of 8 - 12 lines, each of 10 km length, where possible near the KNMI boreholes, by using the long-term contracted flexible data acquisition system. The goal of these surveys is to determine Vs profiles over a depth range of 800 meters. Based on the results, the observed spatial variations, further infill may be required. A similar campaign will be set up for acquiring more detailed Vs data for the upper 30 to 100 meters. NAM’s plan is to acquire the first batch of 150 - 200 sites by end 2016, review the results and modify/extend the acquisition plan if and where required.
Instrumented Geophone Well –Geotechnical Test Site To better constrain the response of the shallow sub-surface a geophone well will be constructed with dense instrumentation. The well would be designed similar to the wells of the geophone network and be 200 - 400 m deep. Studies into the feasibility of drilling such a well will determined the depth of the well. The instrumentation of the well would include:
3C geophones will be placed at least every 10 meters,
Pressure sensors (hydrophones) with each geophone, effectively providing a 4 component geophone,
Optional fibre optic cable for strain, seismic and temperature measurements (DAS),
At surface an accelerometer and tilt meter will be placed.
The dense geophone string would allow assessment of the absorption of energy in the shallow subsurface and detailed comparison with simulations. In the immediate area around this well geotechnical experiments will be done and serve as an experimentation site where new techniques and improvements can be trialed.
On the test site a number of monitoring techniques should be validated and/or applied. In collaboration with Deltares experts from the USGS Earthquake Hazard Program will be consulted. In the USGS program several monitoring tools are used and reviewed which could also be relevant for the Groningen site.
Further development Ground Motion Prediction In this section activities to further development of the model for ground motion prediction will be addressed. Focus is on activities
Expansion of the ground-motion database With the expansion of the seismic monitoring network, any significant earthquake (M ≥ 2.5) is now likely to generate an appreciable number of recordings: in addition to the 18 permanent accelerograph stations, 70 newly-installed accelerographs (co-located with 200-m boreholes instrumented with geophones) are streaming data to KNMI. Since November 2015, an additional 10 recordings have been retrieved from three earlier earthquakes with magnitudes of ML 2.6, 2.8 and 3.0, and a further 44 recordings were obtained during the Hellum ML 3.1 earthquake that occurred to the south of the centre of the field on 30 September 2015; the resulting magnitude-distance distribution of the expanded database is shown in Figure 9.2.

Study and Data Acquisition Plan Induced Seismicity in Groningen - Winningsplan 2016
90
Figure 9.2 Magnitude-distance distribution resulting from combining the V2 database with more recent acquisitions
The impact of the expanded networks in terms of higher yields of recordings is well illustrated by the Hellum earthquake (Figure 9.3). Any earthquake of similar magnitude close to the centre of the field can be expected to yield similar numbers of recordings. While this undoubtedly provides considerable enrichment of the ground-motion database, it is also the case that to make optimal use of these recordings, VS measurements will ultimately be required at all of the recording locations.
Figure 9.3 Location of accelerograph stations (red triangles) that recorded the Hellum earthquake, the epicentre of which is
shown by the black star; station codes starting with B are part of the KNMI permanent network, those with G are
newly-installed instruments co-located with the 200 m geophone boreholes.

Study and Data Acquisition Plan Induced Seismicity in Groningen - Winningsplan 2016
91
There are also two other accelerograph networks in the field: those operated at NAM facilities for triggering safe shut-down and the instruments installed by TNO on behalf of NAM in private houses and public buildings throughout the region of the gas field. Work has now begun to explore the incorporation of the recordings from the latter network into the database. The issue that needs to be addressed, however, before these records can be used in the derivation of the next (V3) GMPE model is the degree to which they have been influenced by their unusual installation. Some of the instruments are attached directly to the floor of a building or even to the foundation beam but others are sufficiently removed from the ground to be potentially recording structural response.
Use of measured VS profiles at the recording stations Measurements of the VS profiles has been completed at the 18 permanent KNMI accelerogaph stations. Regrettably, it was not always possible to perform the measurements directly adjacent to the location of the instrument (Figure 9.4) but due attention was given to selecting test locations on the same geological formations as the station and, where possible, CPTs were performed at both the survey location and closer to the instrument to confirm the degree of similarity.
Figure 9.4 Location of seismic CPT and active and passive MASW arrays with respect to the BAPP accelerograph station (red
circle); the scale bar is 50 metres (de Kleine et al., 2015)
The work was carried out in two phases, the first focusing on three of the stations and using a wide range of measurement techniques, including PS suspension logging and cross-hole measurements. At these and all other locations, seismic CPT and both active and passive MASW measurements were performed. The results will be analysed and interpreted, and the final VS profiles will be made available in the near future.
The first step in the process will be to compare both the VS profile at each station and the range of possible profiles as inferred from the different measurements with the profiles developed. The transfer functions at the stations will then be re-calculated using the new profiles and these used to transform the surface FAS to the NU_B horizon,

Study and Data Acquisition Plan Induced Seismicity in Groningen - Winningsplan 2016
92
before repeating the inversions. The measured VS profiles will also be used to calculate linear site amplification functions at the station locations and these will be compared with the range of amplification factors assigned to the host zone of each recording station.
Use of borehole recordings The 70 new accelerographs being installed by NAM—and subsequently operated by KNMI—are all co-located with 200 metre deep boreholes installed with geophones at 50 m intervals. Although only weak motions have been recorded to date and notwithstanding the fact that the shallowest instrument below the surface accelerograph is at 50 metres, the recordings potentially offer a unique opportunity for exploring the validity of the amplification factors derived for the field. Exact agreement between the linear portion of the zonal amplification factor and the empirical amplification factors is not expected—not least because the deepest geophone is at 200 m whereas the reference rock horizon for the site amplification functions is at about 350 m—but they should lie within a certain confidence limit on the amplification factors.
There are several challenges, however, that might place limits on the value of this exercise. The geophones—which are 4.5 Hz instruments with pre-amplifiers to boost the low frequency response down to about 1 Hz—record velocity and therefore the time-series need to be differentiated to obtain accelerations, although with a sampling rate of 250 Hz this should be reliable. More significant is the high-gain set on the instruments which means that they are likely to clip under more intense motions. The installation of network of broadband sensor geophone wells will address this limitation.
New duration definition and consistent duration predictions The definition adopted for measuring the duration of the Groningen ground motions is the significant duration based on the accumulation of 5% to 75% of the total Arias intensity, DS5-75. This may not be the most suitable measure to capture the duration characteristics of the Groningen motions, for which reason alternative definitions might be explored. Several considerations need to be kept in mind, however, for an entirely consistent treatment of duration across all elements of the hazard and risk modelling:
The duration must be predictable, which was one of the motivations for choosing the DS5-75 definition since it
allowed use of existing predictive models.
A consistent duration prediction should be included in all stages of the work, including the signal durations
used in the stochastic simulations for response spectral ordinates. For the current simulations, the predictive
model of Boore & Thompson (2014) was used, which predicts a duration intended to be equivalent to the DS5-
75 definition and is defined as twice the duration DS20-80. The figure below compares these two duration
measures for the Groningen recordings.
The definition of duration adopted also needs to be appropriate to the characterisation of the fragility
functions.

Study and Data Acquisition Plan Induced Seismicity in Groningen - Winningsplan 2016
93
Figure 9.5 Correlations of duration definitions for individual components of recordings from earthquakes of magnitude ≥ 2.5
in the Groningen field
GMPE sensitivity analyses and potential refinements The current GMPE model provide coherent and reliable predictions of spectral accelerations and durations in the Groningen study area that serve the current needs of both the seismic hazard assessments and the risk estimations. Improvement and refinement of the GMPE model will be guided by the needs of the fragility development programme and the risk analyses, as well as by identification of those elements of the model for which refinements potentially offer the greatest benefits in terms of reduced uncertainties and more reliable predictions. The current ideas for enhancement and improvement of the current (V2) models are listed below under the headings of (1) parameters to be predicted, (2) the equations for the NU_B horizon, and (3) the site response model.
Ground-motion parameters Future model updates are also likely to provide more predictions of response spectral accelerations. One motivation for this is that horizontal accelerations are required at a greater number of short oscillator periods—in the ranger from 0.01 to 0.2 seconds—in order for the application of V/H ratios to lead to reliable vertical spectral shapes. The other target periods may be extended or modified to accommodate the most recent results from the structural modelling team and their insights regarding representative vibration periods of the Groningen building typologies.
The preliminary V/H ratio model will be re-visited. Although no trends in the V/H ratios from the Groningen data were observed with respect to magnitude or distance, explorations will be made for any consistent patterns at individual stations indicating possible site-effects. Additionally, the possible application of the implied V/H ratios from the emerging NGA-West2 GMPEs for vertical components of motion (e.g., Bozorgnia & Campbell, 2015) will also be explored for their potential application or adjustment to Groningen.
Another requirement that has been indicated for the fragility development is predictions of the response spectral accelerations at damping ratios other than 5% of critical. This need could be addressed in one of a number of ways, the most cumbersome being to derive suites of GMPEs—at the NU_B horizon but using the same site amplification factors—for spectral accelerations at multiple levels of damping; interpolations could be used for intermediate values. Alternatively, we could derive predictive equations for scaling factors to be applied to transform the 5%-damped ordinates to other levels. It is known that such factors are dependent on the duration of the motion (Bommer and Mendis, 2005) and this can be captured by predictions conditioned on duration directly (e.g., Stafford et al., 2008) or else on the parameters that in turn control duration, such as magnitude, distance and site classification (e.g., Akkar et al., 2014b).
Another ground-motion parameter for which predictions are now required is peak ground velocity, PGV, which has been requested by those conducting seismic stability analyses for dikes in the Groningen region. The current

Study and Data Acquisition Plan Induced Seismicity in Groningen - Winningsplan 2016
94
indication is that the PGV predictions will only be required at the NU_B reference rock horizon since detailed site-specific response calculations will be performed as part of those assessments.
GMPEs for motions at the NU_B horizon
GMPE Model and stress parameters
The figure below shows, for each response spectrum in the GMPE database—including the additional small-magnitude events—the residual misfit as a function of oscillator period using the NU_B stochastic simulation model in addition to the site-specific NU_B to surface amplification functions. The bias apparent in the GMPE is also apparent in these simulations and it is therefore concluded that the source of the bias lies at the simulation stage rather than, for example, the parametric form of the GMPE.
Figure 9.6 Residual misfit between the NU_B simulations plus NU_B to surface amplification and the full current (V2)
database (including additional small magnitude events and without selection for usable period). The same figure
is plotted using an enlarged scale in the right panel.
A question posed by this comparison is the source of the bias introduced in the V2 model. One source might lie in the simplicity of the model – with a single stress-parametre, Q, NU_B amplification function and κ0 (although this is the same as in the V1 model). In order to investigate this we use the record/event-specific stress-parametre and κ (comprising Q and κ0 effects) obtained from the original spectral inversions. We obtain—as we would expect—a significantly less biased model misfit. Including only the records from the V1 database, we see little bias at all and significantly reduced scatter.
Figure 9.7 Residual misfit between the simulations – modified to use stress parameter and κ directly inverted from the
corresponding FAS – and the full database.

Study and Data Acquisition Plan Induced Seismicity in Groningen - Winningsplan 2016
95
Figure 9.8 Residual misfit between the simulations – modified to use stress parameter and κ directly inverted from the
corresponding FAS – and the V1 database.
Using event specific stress-parameters does not help in the case of unknown source (i.e., the forward simulation problem). However, one issue might be that the events have a somewhat bi-modal distribution of stress-parameter. It is, for instance, notable that the majority of new events are low-magnitude, low stress-parameter. Although it has so far been avoided due to what was foreseen as unjustified complexity (given the few data points) future revisions may investigate using a magnitude dependent stress-parameter.
Full waveform simulations
There is also scope for improving the model through additional use of the full waveform simulations. Building on from the full waveform modelling (FWM) undertaken to inform the development of the geometrical spreading model, we aim to further investigate wave-propagation effects in Groningen. A systematic feature observed in the residual misfit of the GMPE to the recorded data is that at short periods (e.g., 0.01 – 0.2 s) a distance trend is still apparent. The residuals suggest that for short period motions the decay rate in the first few kilometres is faster than currently modelled (despite using the tri-linear model), and that relatively sharp changes in the rate of decay are observed at around 7 km. The fact that this only appears at short periods is contrary to usual models of geometrical spreading – which assume frequency independent effects. However, recent work using regional data has shown that the apparent geometrical spreading rate may be frequency dependent (Atkinson & Boore, 2014). Atkinson & Boore (2014) suggested that their observation may have been due to a trade off with an elastic attenuation function, which was calibrated at regional distances.
Initial testing using the 3D Groningen model has indicated, however, that even in elastic media the apparent rate of geometrical decay is strongly dependent on the analysis frequency (Figure 9.9). We plan to investigate this feature and—where possible—integrate it into the stochastic simulations and GMPE.
Figure 9.9 Geometric mean horizontal component FAS of simulated waveforms versus hypocentral distance at (a) 0.5 Hz, (b)
2 Hz and (c) 8 Hz. Binned mean values are indicated every 500m. Individual best-fit slopes are shown along with
1/R for reference.

Study and Data Acquisition Plan Induced Seismicity in Groningen - Winningsplan 2016
96
Uncertainty in stress drop estimates
There is also scope for the re-visiting the branches of the NU_B ground-motion model and their assigned weights, since the V2 model essentially retained the basic formulation of the V1 model. With the expanded ground-motion database now being used, including many more recordings from smaller events (M < 2.5), we consider it possible that the lower stress drop estimates may well be the result of the high kappa values at these soft soil sites masking the true corner frequencies. The lowest branch of the logic-tree may, therefore, be modified or even removed. The weights on the other branches would then need re-adjustment and this may be partly informed by comparisons with other models and/or other datasets, particularly those related to shallow induced seismicity. A difficulty, as was noted in the V1 model derivation (Bommer et al., 2015a), of using recordings of tectonic earthquakes to make such inferences is that adjustments need to be made not only for site conditions but also for focal depth, accounting for both the shorter travel path to the surface and the reduced stress drop expected for such shallow events. NGA-West models such as those of Campbell & Bozorgnia (2014), which include hypocentral depth as a scaling parameter for the effect of source embedment within the crust, may be useful in this regard.
Seismic Moments
Another issue that does need to still be address is the assumed equivalence of local and moment magnitudes in the Groningen field. While this is not a critical issue is some regards, as discussed in Section 2.1, because of the internal consistency of the hazard model in terms of the seismicity catalogue and the derivation of the GMPEs, it is the case that the extrapolation of the GMPEs to larger magnitudes using stochastic simulations is based on seismic moments. Therefore, it is important to ascertain not necessarily that the scales are equivalent—although this does have a theoretical basis over the magnitude range for which the extrapolations are being made (Deichmann, 2006)—but that the relationship between the two is linear. The adaptation of existing GMPEs for V/H spectral ratios and for duration, as well as the use of other to derive corrections to the within-event variability (Section 9.3), all do depend on the validity of the currently assumed equivalence.
Site response model The single most significant change in the evolution from the GMPE models in 2015 (from V1 to V2) was the development of the field zonation for non-linear site amplification factors for motions at the reference rock horizon. While its incorporation represents a major improvement to the ground-motion prediction model for induced earthquakes in Groningen, there is also significant scope for exploring further improvements and refinements. The many potential activities are presented herein simply as bullet points grouped under general topics.
Geological model:
Shallow part (Surface to NAP-50 m): final GeoTOP version (available late 2015) instead of beta version
Shallow part: better representation of wierden (dwelling mounds)
Shallow part: better representation of anthropogenic top layers of sand
Deeper part: include interpretation of 70 borehole logs to 200 m depth, e.g. for better definition of location and composition of geological systems such as Peelo channels
Integrate available geological models into one continuous 3D model
Map area’s with sensitive geology. VS model:
Use of measured VS and damping to approx. NAP-30 m at recording stations.
Determination of damping over the full depth range from surface to base of Lower North Sea Group.
Determine VS and damping profiles at dwelling mounds.
PS suspension logging (if adjusted method process to be successful), active MASW, SCPT at number of locations. This includes experimentation to improve the methodology for SCPT. Locations should be chosen near geophone (200m arrays)/accelerometer stations and selected locations based on local geology (layering; simple, peat and channels, etc.) and locations with TNO equipment.
New Groningen specific VS relations based on enlarged dataset of SCPTs and relation between SCPT and CPT from Groningen database. Introduce depth dependency in Groningen-specific Vs models.
Improvement of VS transition between GeoTOP and MEIDAS using improved geological model.
VS and damping information to 200 m depth at the 70 vertical array locations (fieldwork and interpretation of recorded earthquake signals needed)

Study and Data Acquisition Plan Induced Seismicity in Groningen - Winningsplan 2016
97
Introduce a Groningen-specific VS spatial correlation model (for vertical spatial correlation).
Uncertainties in VS in the look-up table may be too low. They are lower than the minimum recommended for sites with measurements per the SPID document.
Validate the MEIDAS model, wherever possible, with new data from the VS profiling at the recording stations.
Uncertainties in the MEIDAS velocities should be larger outside the region of coverage of the model
Uncertainty in VS below MEIDAS are based on errors in the measured VS at a single well. This is conceptually wrong, since what we want to capture is epistemic uncertainty for sites with no measurements, not potential measurement uncertainty at the few sites with measurements.
Shear degradation and damping curves:
Improved lookup table of geomechanical parameters OCR and Ip, based on database of laboratory measurements (to be built) or new laboratory measurements (to be measured).
Determination of shear degradation and damping curves for Groningen peats (to be measured in the laboratory).
Use Menq’s (2003) curves for sands. For this, we need better estimates of coefficient of uniformity (Cu) for the field.
Use equation from Cetin & Ozcan (2009) in place of Equation (7.14)
Interpret damping from geophone recordings in 200 m boreholes
Check effect of using vertical stress or mean effective stress for determination of the shear modulus degradation curves (NB: the presently available curves and expression are derived from test results on isotropically consolidated samples, so at samples where the vertical stress and the mean effective stress are the same)
Include in the look-up table additional information from the CPT profiles. This should include cone friction (fs) and soil behaviour type index(Ic). This information would be useful to guide the selection of parameters used to evaluate MRD curves (like PI).
Consider using a larger Dmin. Could base this on: a) vertical array data compiled recently (Stewart, personal communication), b) Q vs. VS correlations from the literature, c) kappa constraints from the records and from an estimates of kappa for NU_B, d) information from the vertical arrays.
Considering capping damping at values around 20 to 30%.
Consider alternative correlations for undrained strength for peats, including correlations that are not based on CPT but are simply based on normalized strengths.
Randomisations and Zonation
Sensitivity analysis for parameters that were fixed in V2: Darendeli curves, OCR, Ip, unit weight, VS for NAP-50 m.
Use median AF for each voxel stacks to re-draw the zonation map.
Explore automated zonation algorithms.
As a validation/verification exercise, we can compare the site amplification model parameters (f1, f2, f3) for each of the geologic/geotechnical zones in the study region with those of VS30-based global model like Stewart & Seyhan (2014). This will be useful to see if trends are consistent with what has been found elsewhere.
Evaluate if the very large strains observed in the site response runs to get AF for the zones are leading to unusual values of strains.
Consider randomization of the soil types within each voxel.
Re-evaluate AF when the predicted values are outside a 3 standard deviation band.
Computation of AF factors
Ignore the effect of very soft surface layers (as done for recording stations)
Kappa
Link the observed kappa0s at the recording stations to the zones where the recording stations are
located. This could just modify the AF functions for zones with recording stations
Sigma model
Single-
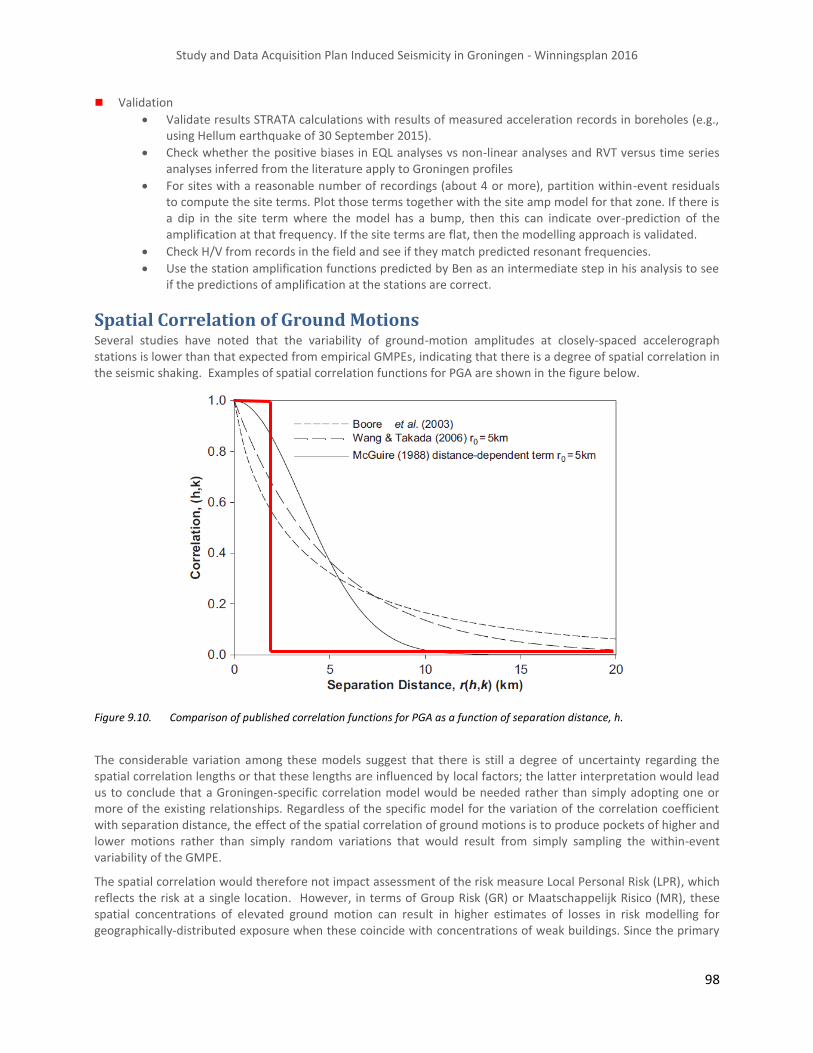
Study and Data Acquisition Plan Induced Seismicity in Groningen - Winningsplan 2016
98
Validation
Validate results STRATA calculations with results of measured acceleration records in boreholes (e.g., using Hellum earthquake of 30 September 2015).
Check whether the positive biases in EQL analyses vs non-linear analyses and RVT versus time series analyses inferred from the literature apply to Groningen profiles
For sites with a reasonable number of recordings (about 4 or more), partition within-event residuals to compute the site terms. Plot those terms together with the site amp model for that zone. If there is a dip in the site term where the model has a bump, then this can indicate over-prediction of the amplification at that frequency. If the site terms are flat, then the modelling approach is validated.
Check H/V from records in the field and see if they match predicted resonant frequencies.
Use the station amplification functions predicted by Ben as an intermediate step in his analysis to see if the predictions of amplification at the stations are correct.
Spatial Correlation of Ground Motions Several studies have noted that the variability of ground-motion amplitudes at closely-spaced accelerograph stations is lower than that expected from empirical GMPEs, indicating that there is a degree of spatial correlation in the seismic shaking. Examples of spatial correlation functions for PGA are shown in the figure below.
Figure 9.10. Comparison of published correlation functions for PGA as a function of separation distance, h.
The considerable variation among these models suggest that there is still a degree of uncertainty regarding the spatial correlation lengths or that these lengths are influenced by local factors; the latter interpretation would lead us to conclude that a Groningen-specific correlation model would be needed rather than simply adopting one or more of the existing relationships. Regardless of the specific model for the variation of the correlation coefficient with separation distance, the effect of the spatial correlation of ground motions is to produce pockets of higher and lower motions rather than simply random variations that would result from simply sampling the within-event variability of the GMPE.
The spatial correlation would therefore not impact assessment of the risk measure Local Personal Risk (LPR), which reflects the risk at a single location. However, in terms of Group Risk (GR) or Maatschappelijk Risico (MR), these spatial concentrations of elevated ground motion can result in higher estimates of losses in risk modelling for geographically-distributed exposure when these coincide with concentrations of weak buildings. Since the primary

Study and Data Acquisition Plan Induced Seismicity in Groningen - Winningsplan 2016
99
risk metric being considered for the Groningen field is LPR, the emphasis has been on the construction of the GMPE model to estimating this measure.
However, since there is also an interest in GR and MR estimates, it will need to be borne in mind that the absence of a spatial correlation model may potentially lead to some underestimation of this metric. Spatial correlation is currently modelled in a very approximate manner through the use of gridded calculations of hazard and risk on 3 x 3 km squares thus modelling a correlation distances of some 1.8 km. Further research based on the ground motion measurements from the densified geophone network and the TNO sensor network potentially augmented with dedicated measurements with the flexible seismic monitoring network will be undertaken to improve the assessment of MR.
Wavefield Simulation-Based Event Characterization
Objective Develop an internal 3D wave-equation-based (forward modeling, migration, inversion) event characterization approach for rapid, accurate event locations and source mechanism solutions. Use event characterization findings to improve the seismological model and ground motion prediction, and in turn, improve the accuracy of hazard and risk assessment.
Description Seismic records are the only direct data associated with actual subsurface rupture behavior. Used with surface and downhole array data, wave-equation methods potentially provide a means to better estimate rupture location, orientation, dimensions, stress drop, duration, and slip, while honoring the stratigraphic and structural complexities known to exist in the Groningen subsurface. Observations of source mechanisms and locations for more events would help constrain both the results and input parameters to geomechanical work, which may in turn improve the accuracy of seismological model—a major factor in hazard assessment. Accurate, rapid internal event location estimates would also provide the ability to assess the reliability of external party location estimates made using the publically-available surface array data.
Approaches to test could include:
3D event location using modified reverse-time migration methods and surface array data
Moment-tensor inversion using pre-computed moment tensor basis elements at each surface array station
Finite source (rupture) imaging or inversion
Deliverable Wave-equation based approach to 3D event characterization.
Soil Description and Behaviour
Peat For site response calculation soil density, shear wave velocity, shear modulus degradation curve and the material damping curve are required for each, relevant, soil layer. For the sand and clay layers sufficient information, regarding these parameters, is available. In the Groningen area peat layers are present as well. The thickness of the peat layers varies strongly and reaches locally a thickness of 3 m.
Little is known about the dynamic properties of peat. The data found in literature mainly involves tests on samples from the west coast of the United States and shows a wide range in the shear modulus reduction curve and damping curve. Peat is characterised as a strong heterogeneous material. Parameters like fibrosity, density and degree of humidification are important in classifying peat samples. It is to be expected that these classification parameters relate to engineering properties. However, little or no information on the classification parameters for

Study and Data Acquisition Plan Induced Seismicity in Groningen - Winningsplan 2016
100
the tested peat samples shared in the literature making it difficult to link the test data found in literature, with peat deposits in Groningen.
Therefore, a series of new laboratory tests needs to be conducted to obtain the required parameters for the Groningen peat.
For engineering purposes the fibrosity, density and degree of humidification are important parameters. These depend on water content and void ratio. Since dynamic parameters like shear wave velocity relate strongly to density, the heterogeneity in density of the Groningen peat should be considered. Density of peat is also influenced by the effective stress level. In the Groningen area some peat layers are positioned below a clay deposit. These peat layers will differ in density compared to shallower layers. In selecting the samples a distinction in degree of humidification and pre-loading needs to be made. Although it should be noted that highly humidified peat often occurs in thin layers, 0.1 – 0.2 m from which proper samples cannot be taken.
Because we would like to sample both, high and low humidified peat and pre-loaded and non-pre-loaded samples choosing of the sample locations should be done with care.
The laboratory testing programme should address the following parameters:
1. Density
2. Shear wave velocity
3. Shear modulus degradation curve
4. Damping curve
A test program has been agreed with Deltares and is now progressing. . Based upon the results from the test program the need and requirements for future research on peat will be determined. Because of the scaling issues with peat samples in situ testing will be considered.
The presence and properties of peat are important parameters when determining site response. The spatial distribution and thickness of peat is known to a certain degree however in some areas the data (borehole) density is limited, and part of the boreholes used are quite old. The latter is important because the thickness of peat over time can vary due to compaction and oxidation, hence the current estimation of the thickness of peat could be an overestimation. Therefore it might be necessary to map the distribution and thickness of peat in greater detail than currently available at selected sites.
Swelling Clays (Knip- and Zwelklei) Swelling clay or expansive clay is a type of clay or soil that is prone to large volume changes (swelling and shrinking) that are directly related to changes in water content. Soils with a high content of expansive minerals can swell during a wet season and form deep cracks in drier seasons or years. Soils with smectite clay minerals, including montmorillonite and bentonite, have the most dramatic shrink-swell capacity. The mineral make-up of this type of soil is responsible for the moisture retaining capabilities.
The changes in the volume of these clays has important consequences for the foundations of structures built on these clays. Mitigation of the effects of expansive clay on structures built in areas with expansive clays is a major challenge in geotechnical engineering. In areas of Groningen where swelling clays are present changes in the groundwater level can potentially stresses on the foundation of buildings and as a result cause or contribute to damage to these foundations.
Research in the impact of swelling clays in combination with seismicity will consists of the following phases:
1. Prepare a map of the distribution of clays with swelling potential (knipklei and potklei)
2. Analysis of the swelling clays (knipklei and potklei). Determine the composition and geotechnical parameters
of clay samples
3. Selection of the locations for monitoring (soil movement and swelling)
4. Prepare monitoring plan for three selected locations
5. Detailed survey of the selected locations and final rapport with evaluation, conclusions and recommendations

Study and Data Acquisition Plan Induced Seismicity in Groningen - Winningsplan 2016
101
This study should provide insight into the impact of ground water changes in combination with seismic movement
on buildings in the Groningen area.
Anthropogenic Soils;
Wierden - Recommended additional data acquisition for terp composition assessment
Aims
Previous research indicates the composition of terps is variable at the regional scale as well as within the individual terps themselves. Although we are confident that our current models provide a good first assessment of the lithology, the need to more detailed information on lithoclass variability at both scales is considered. In this section, we provide suggestions for improvements to the models, in order to get a better understanding of the spatial heterogeneities.
We consider to obtain micro seismicity profiles combined with hand soil coring on a representative number of terps. The aims of this exercise are twofold. Firstly, it will provide insight into the within-terp lithoclass variability. Secondly, the obtained data can assist us in extrapolating lithoclass classification to other terps.
Field data
Micro seismicity data should provide a detailed 2D spatial picture of the seismic properties of terp layers, as reflection is a representation of lithology and lithological boundaries. A representative sample of hand corings along the micro seismicity profiles provides descriptions of the actual lithology as well as depths of layer boundaries, and will be used to calibrate the micro seismicity data. When a good correlation between the seismic and lithological data can be established, it can be used to extrapolate the results to other locations. In addition, hand coring data will be used to test the terp composition models and will provide useful additional archaeological data.
If necessary, larger undisturbed samples for the testing of geophysical parameters under laboratory conditions can be obtained by mechanical coring at selected locations. Recent multidisciplinary research at Hogebeintum (Frl.) has shown the likely potential of this method.
Cone penetration testing (CPT) to accompany the coring might also be useful. The data will provide us with vertical small-scale lithoclass variation within the terp, including sharp or non-planar boundaries, relevant to the passage of earthquake waves. Similar to the seismic data, the CPT data need to be calibrated by hand or mechanical coring to establish relationships and correlations. Additionally, it may be worthwhile researching the accessibility to the possibly considerable reservoir of existing CPT data held by other commercial companies (e.g. Grontmij, Fugro, Wiertsema en Partners).
Location selection
We suggest to carefully select a representative sample of different terps based on expert knowledge and location, using the current terp database as a starting point. The use of built-up terps has the obvious advantage of a direct link with (potential) earthquake damage. However, they also have significant drawbacks, with the presence of subsurface infrastructure such as sewers potentially hampering measurements and coring location selection.
Furthermore, the selection should include locations in all three geographical regions identified in the report. The research has already shown that inter-terp variability can be very high, even between locations in the same region and of the same age. As an example, Ezinge and Englum, located approximately only 1.5 km from each other, show substantially different compositions, with the lower anthropogenic layers at Englum having a considerably higher manure content than at Ezinge. Simple extrapolation of the terp composition models, even with additional field data, to all locations with a similar age in an area thus seems impossible. A large sample size is recommended.
A preliminary selection is suggested to include, but not be limited to, the following locations:
Leens – Grote Houw (pilot area A): this location in the western area is not built-up, and used recently for investigations into erosion susceptibility. Coring has shown it to contain manure-rich layers, but not everywhere within the current extent of the terp;

Study and Data Acquisition Plan Induced Seismicity in Groningen - Winningsplan 2016
102
Middelstum (pilot area B): a relatively intact but completely built-up terp in the central area, with many pre-1920 houses. As houses prior to that date have shallow fundaments, they may be more vulnerable to terp composition than houses built later;
Helwerd: a terp without any buildings, just to the north of pilot area B; Rottum (pilot area B), as it appears that this terp is relatively vulnerable to earthquake damage, which may be
(partly) due to its lithological composition. We have indications that this terp has a particularly heavy clay composition.
Further recommendations
During our analysis, we have found that terp extent is currently based on mapping, carried out mainly in the 1960s to 1990s. Although this has provided useful information on the location at the regional scale (1:50.000 as part of the soil, geomorphological and the provincial terp spatial databases), we have shown that this provides us with insufficient detail to characterise the terp relief and therefore has consequences for the quality of the lithoclass establishment based on soil and geomorphology. We therefore recommend to update the available spatial terp database based on the currently available aerial photos and detailed LIDAR data (AHN2). It is advisable to closely cooperate with similar efforts in the Fryslân province to build upon experience there and to keep databases comparable.
It appears that the soil/atmosphere interface may play an important role in the behaviour of seismic waves. This may be particularly important for the (high number) partly excavated (‘quarried’) built-up terps as they often contain steep unstable slopes. A GIS-based analysis of LIDAR data may be used to obtain data on slopes and gradients. Unfortunately, the current, high resolution datasets (AHN2 and AHN3) may in fact be too detailed, and still contain too many data points representing above-surface structures (e.g. buildings) or vegetation, making automated analysis difficult. Moreover, it is as yet unclear if and how such analysis would deal with partially quarried terps or terps with buildings on plinths. More research into the used of LIDAR data in combination with filtering algorithms might prove useful in establishing slope and gradients in terps.
Conclusion
With this report, we are confident that we our current models provide a good first assessment of the lithology. However more detailed information on lithoclass variability at regional and terp scales should be considered. We therefore suggest to acquire a representative sample of micro seismic data calibrated by hand/mechanical coring and CPT data, where possible from readily available sources. A representative sample of terps needs to be selected carefully. In addition, our advice is to currently available high resolution aerial photo and LIDAR data to obtain a more detailed view on extent and relief the soil/atmosphere interface. The aim of this data acquisition program is to improve our knowledge of terp composition, necessary for future earthquake impact assessment in these man-made structures. Recommendation
Fieldwork at dwelling mounds to characterise the in terms of lithological composition, VS, damping and other parameters relevant for site response.
Embankments, banks and sloping surfaces Additional to the wierden there are sloping surfaces near ditches, trenches or drains. The impact of these on the ground movement, due to earthquakes may also be studied. The flexible seismic monitoring network and potentially tilt meters can be used to study lateral spreading. The data gathered will be compared to models of the ground movement near these sloping surfaces.
Some of the quarried dwelling mounds have steep sloping surfaces. They experience soil creep and the stability of the slopes is not guaranteed. These slopes should be investigated, the installation of tiltmeters and field measurements at these sites should be considered.
Embankments and banks can possibly generate a number of threats:
Directly due to the presence of water
Directly due to the possible collapse
Indirectly due to the “wave guide” effect

Study and Data Acquisition Plan Induced Seismicity in Groningen - Winningsplan 2016
103
These effects will be investigated and their significance quantified. This can be done by performing a series of (active and/or monitoring) experiments in the direct vicinity of these features and in areas with similar geology which do not have these structures. This should inform the decision on whether or not embankment and banks require further attention. If so, then determine which area of influence of these features.
Liquefaction Studies
Objective In the Groningen area widespread deposits of saturated sands are present. The possibility of earthquake-induced liquefaction therefore needs to be considered. Since the prime focus of the Hazard and Risk Model is on the estimation of casualties due to earthquake-induced damage in buildings, liquefaction has initially been given a lower priority since liquefaction-induced damage in buildings almost never leads to loss of life.
However, because of the high profile that has been given to this hazard (albeit without a strong technical basis) and also because of the potential impact on key infrastructure and lifelines—and in particular dikes—the development of a model for the assessment of liquefaction hazard commenced in 2014. The model for the assessment of the liquefaction hazard in the Groningen field is being developed by a joint collaboration between the Hazard & Risk Team and Deltares; this work is supported by expert guidance from Professor Russell Green of Virginia Tech.
The workflow for liquefaction assessment is shown in Figure 9.11. The ultimate objective of the model is to estimate, in a probabilistic framework, the possible ranges of vertical settlements and horizontal displacements that could result from liquefaction and excess pore water pressures, even if liquefaction is not triggered. However, current approaches to liquefaction hazard assessment are largely deterministic and not calibrated to the small-to-moderate earthquake magnitudes that will predominate in Groningen. Moreover, methods for estimating the resulting ground deformations are not very well developed and also require detailed information about the surface and subsurface conditions. Therefore, the development of an assessment model to provide probabilistic estimates of liquefaction-induced ground deformations that is calibrated both to the seismic hazard and the local geotechnical conditions in the Groningen field is a very major undertaking. The development of a model for estimating liquefaction-induced deformations is planned in stages, starting with the likelihood a liquefaction triggering. If the assessment of the potential for liquefaction triggering indicates that this is an unlikely outcome, further work will be tailored to size.

Study and Data Acquisition Plan Induced Seismicity in Groningen - Winningsplan 2016
104
Figure 9.11. Proposed workflow for the liquefaction hazard assessment in the Groningen field. The elements within the
dashed line constitute the core components of the approach to calculating whether or not liquefaction is likely to
trigger given the characteristics of the subsurface and the earthquake-induced ground shaking. The two other
boxes in the upper half of the figure simply place these calculations within the framework of the Monte Carlo-
based probabilistic hazard calculations. The lower part of the figure relates to the extension of the calculations
from the likelihood of liquefaction occurring to estimates of the resulting displacements and settlements of the
ground.
The objective and efforts are focused on developing a model for assessing the potential for liquefaction triggering in the field—indicated by the dashed line in Figure 9.11 — but executed within the frame of probabilistic calculations. This would be the results of this probabilistic assessment together with an initial evaluation of the potential impact of the liquefaction potential, possibly even including initial estimates—based on existing models—of resulting ground deformations.
Workflow The workflow uses as input the following information (indicated by the grey boxes in Figure 9.11): 1 the earthquake ground motion (GM) generated by a specific earthquake magnitude at a specified location, 2 subsurface information (e.g., CPT tip resistance, qc) derived from geotechnical site investigations, and 3 geometric site properties (e.g., slope) derived from a Digital Elevation Model (DEM).
The first component of the workflow evaluates the potential for liquefaction to be triggered by the ground shaking and estimates the severity of surficial liquefaction manifestations using the LPI, LSN, or LPIish framework. The

Study and Data Acquisition Plan Induced Seismicity in Groningen - Winningsplan 2016
105
second component evaluates the expected lateral displacement (LD), settlement (S), and excess pore pressure ratio (ru) given the potential for liquefaction to be triggered.
The liquefaction triggering analysis will utilise predominantly the stress-based approach to evaluate the potential for liquefaction, but the threshold strain concept will also be used as a screening tool, to include determining the maximum depth for which liquefaction needs to be considered.
The stress-based approach computes a factor of safety against liquefaction or a probability of liquefaction. The threshold strain concept states that if the induced shear strain at a given depth in a soil profile does not exceed a threshold value residual excess pore pressures will not be generated, and thus, liquefaction will not be induced regardless of the magnitude of the event or the duration of the motion. This is not to imply that liquefaction will be triggered if the induced shear strains exceed the threshold strain, but rather, that residual excess pore pressures will be generated, possibly triggering liquefaction. As a result, the threshold strain concept is too conservative to be used as a liquefaction triggering assessment procedure (in lieu of the stress-based procedure), but it is a reasonable approach to determine the maximum depth for which liquefaction needs to be considered, for example.
The liquefaction triggering analysis provides an assessment of the potential for liquefaction to occur at a site. If the liquefaction potential is low, no further analysis of liquefaction consequences is warranted. If the liquefaction potential is not low, an analysis of the liquefaction consequences is performed. Liquefaction consequences are quantified in terms of the potential lateral ground displacements (LD), vertical ground settlement (S), and excess pore water pressure ratio (ru).
Empirical approaches are available to predict lateral displacement and semi-empirical approaches are available to predict both lateral displacement. The empirical approaches for predicting lateral displacements involve regression relationships developed from field observations of displacement and these empirical relationships predict lateral displacements as a function of earthquake or ground motion parameters, geometric site parameters related to the slope or the presence of a free-face, and subsurface parameters. The semi-empirical approaches for predicting lateral displacements and post-liquefaction consolidation settlement use the results from the liquefaction triggering analysis along with estimates of the relative density (Dr) to compute the expected shear strain (for lateral displacement) and volumetric strain (for settlement) as a function of depth in the profile. These strains are integrated over depth to compute the associated lateral displacement or settlement, with some corrections required to account for the effects of the geometric site parameters on the lateral displacement. The stability of buildings, dikes, etc. at sites where the excess pore pressure ratio (ru) is predicted to exceed a specified threshold should be evaluated using conventional geotechnical bearing capacity and slope stability analyses, even though liquefaction may not be predicted to trigger at these sites.
A report detailing the liquefaction triggering analysis is expected to be finalised mid-2016, followed by incorporation of the triggering analysis in a probabilistic assessment for Groningen.

Study and Data Acquisition Plan Induced Seismicity in Groningen - Winningsplan 2016
106
Summary The table below shows which studies make a contribution the research question:
Measu
ring
Gro
un
d
Mo
tion
-
Usin
g a
Shear
Wave G
enerato
r
Measu
ring
Gro
un
d
Mo
tion
-
Measu
ring
Gro
un
d M
otio
n
Measu
ring
Gro
un
d
Mo
tion
-
Instru
men
ted
Geo
ph
on
e Well –G
eotech
nical Te
st Site
Measu
ring G
rou
nd
Mo
tion
- Flexible Seism
ic
Mo
nito
ring Syste
m
Furth
er develo
pm
ent G
rou
nd
Mo
tion
P
redictio
n
Wavefield
Simu
lation
-Based
Even
t
Ch
aracterization
Soil D
escrip
tion
and
Beh
aviou
r - Peat
Soil D
escrip
tion
and
Beh
aviou
r – A
nth
rop
ogen
ic Soils
Soil D
escrip
tion
and
Beh
aviou
r – Swellin
g
Clays
Soil D
escrip
tion
and
Beh
aviou
r – Slop
ing
Surface
s
Liqu
efaction
How does the non-linear near-surface response scale with magnitude?
What is the role of finite rupture geometries, including possible basement rupture?
What is the spatial correlation in the surface ground motion?
What is the local ground motion response on Anthropogenic Soils like Wierden?
What is the local ground motion response near sloping surfaces?
Will soil liquefaction occur?
Table 9.1 Research table linking the research questions to the study activities.

Study and Data Acquisition Plan Induced Seismicity in Groningen - Winningsplan 2016
107
10 Further Studies and Data Acquisition Projects – Exposure of Buildings and People
Exposure Database – Deterministic Typology Assignment The main objectives of the continued study plan are:
Where are buildings of different typology located in the Groningen area?
How many people present in or in the immediate vicinity of these buildings during night and day time?
Objective To assign unique typologies to each individual building in the centre of the earthquake area. There are 20.000 buildings inside the 0.2g KNMI contour. For certain areas outside this the HRA model indicates that specific typologies may also have an inside local personal risk above the acceptable norm of ILPR < 10
-5. It is also the
objective to determine the addresses for the buildings of these typologies, by using the image recognition techniques and inspection to search for these typologies in the specified areas outside the 0.2g KNMI contour.
Description The exposure database combines many data sources (BAG, AHN, Deltares top soil etc.) in combination with inference rules to assign typologies to individual buildings. This leads to a non-unique typology description for most buildings. The Hazard and Risk (HRA) model applies the assessed earthquake hazard to the buildings and the population in the exposure database to assess the earthquake risk. On a regional level this provides an accurate assessment of the risk and of the scope and size of the required structural upgrading effort. The HRA model also provides a regional risk map for each individual typology. The combination of risk per typology and estimated number of buildings to be upgraded is input into the strengthening effort led by the National Coordinator Groningen and described in his “Meerjarenplan”.
An exposure database with a unique typology assigned to each individual building, will help prioritizing the strengthening effort of buildings in the region and will guide the development of the Expert System to focus on the buildings and typologies and location that have the highest priority.
Deliverable The building data currently gathered in combination with newly gathered and processed building images will be used to assign specific typologies to individual buildings. In the process data inspected buildings and addresses will be used to assign properties to similar buildings. For example this could be assigning the same typology to a row of terraced houses, and assigning the same typology to terraced houses across the street or elsewhere in the region that look alike according to computer processing of building images and other meta data.
Existing data has been gathered through, 14000 Rapid Visual Screening (RVS), 800 Extended Visual Screening
(EVS) and 15000 Arcadis damage inspection records
CycloMedia or HORUS or both these companies can provide a service whereby images from the building stock
are used (or specifically gathered) and computer processed to determine properties of the building façade.
This can be used to determine similarities between buildings, window surfaces in the façade (% or m2), height,
aspect ratio, degree of tilt etc.
Specific deliverables:
An inventory of all “soft story” buildings (like shops on the ground-floor with walls removed and replaced with
columns, often there are apartments above these shops) in the earth quake area because of their anticipated
seismic vulnerability.

Study and Data Acquisition Plan Induced Seismicity in Groningen - Winningsplan 2016
108
An address list of terraced houses with unique typologies and assigned to groups in terms of similarity to
assist the expert system development.
External partners CycloMedia Image recording and processing with GIS accuracy, combining multiple data
sources
HORUS Image recording and processing, with advanced image recognition capabilities
ARUP Integration into the existing exposure database effort
Laura Fernandez Robles Phd. & Professor Nicolai Petkov (RUG)
Advisors in image recognition science
SIEP IM&IT Processing of inspection reports to harvest useful building information

Study and Data Acquisition Plan Induced Seismicity in Groningen - Winningsplan 2016
109
11 Further Studies and Data Acquisition Projects – Building Response
The main objectives of the continued study plan are:
To further increase and better focus the capability to predict response, damage and losses from both structural
and non-structural elements of buildings,
To develop associated fragility and vulnerability curves,
To formulate strengthening approaches and guidelines for assessment.
Properties of Building Materials In 2014-2015, an experimental campaign aimed at characterising the mechanical properties of the materials typically found in existing (masonry) building in the Groningen region involved the in-situ and laboratory testing of material samples from 13 buildings. Whilst the data collected from such tests constituted a fundamental input to the numerical modelling of buildings, the fact that it stemmed from a not-very-extensive sample of houses rendered it difficult to characterise such material mechanical properties in a robust and statistical manner, which in turn limited also the parametric studies on building response and the corresponding development of fragility functions.
It is well known that masonry is characterised by a significant sample-to-sample variability, hence a limited number of available samples does not allow one to understand if the high variability observed in the results is due to a high variation of the masonry material from one building to the other or if it is related to the intrinsic variability of the problem of testing masonry material. A larger number of samples will provide more information in this direction.
The extension of a materials characterisation experimental campaign will again need to involve both in-situ and laboratory testing, in particular for masonry structures. Indeed, the intrinsic variability related to testing masonry material is such that laboratory test are necessary to support the observations from in-situ test, and vice versa.
In terms of in-situ testing, both non-destructive and slightly destructive tests are considered. The latter are necessary for the investigation of the main mechanical parameters, whilst the former, despite not providing direct estimation of mechanical parameters, supply useful information on the homogeneity of the masonry quality and can be a useful tool in the interpretation of the results from slightly destructive tests, especially when in the presence of questionable results.
Figure 10.1 In-situ shove test setup (to assess bed-joint shear strength and unit-to-mortar friction)
For what concerns laboratory testing, priority will be given to Vertical Compression Tests and Shear Triplet Tests (carried out with a sampling rate higher than the previously employed 1Hz), which not only provide the most important mechanical properties, but also cater for a direct comparison with the results of in-situ testing.

Study and Data Acquisition Plan Induced Seismicity in Groningen - Winningsplan 2016
110
Figure 10.2 Laboratory flexural (left) and shear triplet (right) test setups
An updated version of the material properties abacus being currently used in the development of numerical models of the buildings in the Groningen region will be the main outcome of such extended test campaign.
In addition, the presence of experienced technicians and engineers in the test houses to undertake in-situ testing will be leveraged upon to gather further information on typical details and geometry of connections of structural elements in masonry structures, particularly wall-to-slab and wall-to-roof connections, which have been found to play a significant role in the seismic response, and thus fragility, of these buildings.
Experimental Tests of Structural and Non-Structural Elements of
Buildings The experimental activities undertaken in the period 2014-2015 focused primarily on experimental testing and numerical modelling of masonry building components and systems, which culminated in two full-scale shaking table tests on masonry buildings. These research activities have increased our knowledge of the response to horizontal loading of systems that had never been studied in the past. This allowed the refinement of fragility curves that in turn allowed more focused prediction of expected consequences and losses.
In the continued study plan, activities and testing of buildings will play an important role to improve the capability to reliably assess risk and develop effective reduction measures. This applied research will focus on three areas: (1) Unreinforced Masonry (URM) buildings, (2) Reinforced Concrete (RC) buildings, (3) Non-Structural Elements (NSE). In addition, in support of the formulation of the Structural Upgrading plan: Strengthening strategies may also be experimentally investigated.

Study and Data Acquisition Plan Induced Seismicity in Groningen - Winningsplan 2016
111
Figure 10.3 Examples of damage within buildings, due to the failure of non-structural elements. These examples are from
large tectonic earthquakes, but illustrate to possible damage patterns.
Two of the above applied research areas (1, masonry and 2, reinforced concrete) are a continuation of the research programmes initiated for Winningsplan 2016, whilst for the third (3, non-structural elements) a practical approach has been used, because of its lower correlation with the protection of human life - however, it is of importance in relation to economic losses. Finally, the fourth area (4, strengthening strategies) will be mainly studied using simulations, but is likely to eventually call for experimental verification.
Within this framework, for each one of the applied research areas 1, 2, 3 and, possibly and optionally, 4, the following activities are considered:
Modelling of structural components and systems, Testing of structural components, Testing of structural systems, In-situ dynamic testing of structural systems.
Modelling of structural components and systems
Unreinforced Masonry (URM) buildings The collected data and novel knowledge derived from the experimental results carried out to date has resulted in the development of more effective and reliable numerical models. Based on these developments, additional tests are planned and will be considered, as described in the subsequent sections.
This will require a continuous activity of test design, numerical prediction, result interpretation and upgrading of models. It is therefore currently not possible to describe in detail the precise content and focus of the work, but it is likely to mirror the activities carried for the two shake table tests undertaken for the Winningsplan 2016.
Reinforced concrete (RC) buildings The scope of the Winningsplan 2016 work for RC buildings was more focused on modelling and less on experimental testing. Based on the research carried out to date, it appears that the Dutch construction practice known as ‘tunnelgietbouw’ (tunnel-form construction) deserves special attention, both from a numerical and experimental point of view.

Study and Data Acquisition Plan Induced Seismicity in Groningen - Winningsplan 2016
112
Figure 10.4 Tunnelgietbouw construction (no columns or beams are present)
For this reason, additional modelling activities will commence in 2016. This will also include the design of some experimental tests on sub-assemblages and systems. This novel area of study will preliminary require a review of codes, guidelines, recommendations and specifications, with reference to material properties, design principles and analysis, fabrication techniques, connections details, and erection stages.
The modelling activity will concentrate on the following aspects:
Numerical predictions of the response of elements, sub-assemblages and systems, performing nonlinear static analyses, in order to: define the collapse mechanism of the connections, estimate the ductility and the dissipation capacity resources, evaluate the seismic performance. The focus will be on fracture mechanisms, crack simulation, hysteretic behaviour of the connections, confinement effects.
Design of sub-assemblages and systems to be tested. It is anticipated that a total of four tests on elements will be designed and dynamically tested. One larger specimen is considered to be tested on the main shaking table.
Prediction and post-diction numerical analyses of all testing specimens with the application of finite element three-dimensional models (brick or shell elements).
Depending on the outcomes of the above, different strengthening measures will also be modelled.
Non-structural elements (NSE) As part of the objective to understand better the response of non-structural elements, a number of numerical models will first be developed, to understand which elements should then be tested in the laboratory. A preliminary indication of the elements of potential interest and of the context where they could be more relevant is as follows:
For residential buildings (and in general): chimneys, parapets, doors/windows For hospitals: cabinets and biomedical equipment, elevators For schools: ceilings, plasterboard partitions
As before, the possibility of modelling strengthening measures will also be investigated.
Testing of structural components The numerical models described in the previous Section are required to design the testing campaign, but the results of the experimental activities are vice-versa needed to substantiate the modelling assumptions, verify their effectiveness and suggest corrections and tuning/calibration. This activity starts with comparisons between numerical and experimental results of components. Some potential component tests are outlined below.

Study and Data Acquisition Plan Induced Seismicity in Groningen - Winningsplan 2016
113
Figure 10.5 Static in-plane masonry wall setup (left) and cavity wall out-of-plane dynamic test failure (right)
Masonry Focus should ideally be on the connections between walls and slabs, walls and roofs, as well as between orthogonal walls, considering different possible configurations and materials (in particular the use of timber together with masonry), and, optionally, strengthening measures.
Reinforced Concrete Attention is proposed to be on the connections between walls and slabs in tunnel form construction, considering external L and T joints and internal + joints and taking into account the different situation of a casting continuity or interruption, and, optionally, strengthening measures.
Non-structural elements A decision on NSE to be tested will be based on the previous numerical and experimental evidence as well on the analyses of the most relevant cases according to in-situ observations. Examples of potentially relevant cases include: chimneys, parapets, doors, windows, cabinets, equipment, pipelines, elevators, ceilings, partitions.
Testing of structural systems Testing of full-scale buildings on an earthquake simulator (shake table) is a way of obtaining global seismic response information that is not obtainable from any other source; the two previous tests did provide precious and most useful information on the seismic capacity of the masonry houses in the Groningen region, allowing also the calibration of the numerical structural models employed in the derivation of the fragility functions.

Study and Data Acquisition Plan Induced Seismicity in Groningen - Winningsplan 2016
114
Figure 10.6 Full-scale terraced house unit tested on a shake-table
It is thus planned that further full-scale shake table tests (naturally, focussed on building typologies different from those considered in the two shake table tests undertaken for the Winningsplan 2016) will be considered to be carried out.
In 2015 a typical terraced masonry house was tested, whilst the start of 2016 saw the laboratory testing of a full-scale detached masonry house. Future tests may instead focus on masonry apartment buildings (perhaps of the “Portiek” type), and on a tunnel-construction building that will somehow condense, in a single test, the problems emerging from the numerical analyses and components tests on tunnel-form construction.

Study and Data Acquisition Plan Induced Seismicity in Groningen - Winningsplan 2016
115
Figure 10.7 Full-scale detached masonry house unit tested on a shake-table
The aforementioned shake table lab tests of full-scale buildings are undertaken in incremental fashion until the structure arrives at the point of imminent collapse, at which stage the testing is terminated – leading these full-scale houses to complete collapse in a lab would cause severe damage to the testing equipment. It would, however, be very informative to be able to undertake shake table tests of structural systems all the way to total collapse, given that the latter may, for some structures, occur at earthquake demand levels much higher than those corresponding to the point of imminent collapse.
Hence, and with the objective of more accurately calibrating the numerical structural models employed in the derivation of fragility functions, it is considered to collapse shake table tests of full-scale building sub-assemblages (smaller and lighter than a complete buildings, but still very informative) will be carried out, thus complementing the previously mentioned imminent collapse shake table tests on full buildings.

Study and Data Acquisition Plan Induced Seismicity in Groningen - Winningsplan 2016
116
Monitoring of buildings in Groningen field area TNO has installed accelerometers in the foundations of buildings in the Groningen field area (See also chapter 3). Initially some 200 buildings were selected. Some 20 of which were public buildings such as town halls of municipalities. In the course of 2015, additional accelerometers have been placed by TNO and currently the total number of sensors installed exceeds 300.
This accelerometer network is used to study the relationship between ground acceleration and building damage and the effectiveness of damage repairs. The network will be expanded further to cover more areas of the field, building typologies and soil conditions. Additionally, a feasibility study will be carried out investigate whether tiltmeters installed in some of the buildings at different floor levels can be used to establish the time damage has occurred and as consequence the cause of the damage.
Another promising route to monitor building damages is based on the acquisition, processing and reporting of high resolution InSAR, which is able to track building movements without individual intervention.
In-situ dynamic testing of structural systems Unreinforced masonry buildings may have been modified over time by homeowners, they may have been subject to degradation and subsidence, and they include additional components that could collapse, such as chimneys and parapets, which are not usually included in experimental tests. In order to gain a more accurate understanding of the actual capacity of these buildings to withstand earthquake action, it would thus be ideal if in-situ shake table testing of structural systems could be undertaken, with the following advantages:
The tests will be performed on real buildings in real conditions, with the only exception of soil-structure interaction. As such, the results will provide indications on the effects and impact of (i) non-structural elements, (ii) the actual state of maintenance and (iii) the real material properties.
As anticipated, the interaction between soil and foundation is not included, since a sliding layer will be introduced (see below). However, and though not included in the presently foreseen plan, the foundation and soil may be instrumented, allowing to infer data on their response and interaction.
Re-testing of the existing buildings after the implementation of local or global strengthening measures will be possible. This will allow an immediate evaluation of the effectiveness of different techniques. This applies either at a life safety performance level or at a damage control performance level.
It has to be underlined, though, that since the loading control will be poorer than in laboratory testing and the actual properties of materials and elements will not be necessarily known, these dynamic in-situ tests will not substitute lab shake table tests, but rather complement them. However, before the shake test in-situ material test of for instance masonry properties will be carried out, much like described in section “Properties of Building Materials”.
The test requires the construction of a new foundation system under the existing building, the uplifting of the structure, the insertion of some isolation devices, and the application of dynamic excitations to the building (see Figure below). This in turn requires the design and construction of an ad hoc developed mobile laboratory, endowed with all the equipment and instrumentation required for the tests, i.e.:
a. Power generator, UPS, Hydraulic pumping system, Accumulator racks, Refrigerators, Actuators with servo-valves, Electronics and controllers, Hydraulic piping, Electrical distribution
b. Cameras, Accelerometers, Data acquisition

Study and Data Acquisition Plan Induced Seismicity in Groningen - Winningsplan 2016
117
Figure 10.8 General approach: required activities and phases: sequence of activities required to uplift the building and place
the isolation system

Study and Data Acquisition Plan Induced Seismicity in Groningen - Winningsplan 2016
118
Figure 10.9 Example of an Italian masonry building jacked-up for introduction of isolators
Figure 10.10 Scheme for in-situ shaking of an actual building
This additional and innovative set of tests may constitute a very valuable complement to the aforementioned laboratory tests, thus allowing for a more complete calibration of the structural models and ensuing fragility functions. The program commences with a feasibility study phase after which the potential benefits of the test over the already planned research program will be reviewed. Concerns are: unknown material properties, unnoticed damage of the building during excavation, unclear interpretation of the test results.
Numerical Modelling of Structural and Non-Structural Elements of
Buildings The experimental campaign described above will provide extensive calibration data for numerical modelling of both structural and non-structural elements. In addition to the numerical models that will be developed to support the experimental testing activities, as described above, there will be a need to produce structural and non-structural models for the derivation of fragility and consequence functions for all of the Groningen building stock. Once these models have been calibrated and improved using all of the knowledge developed from the laboratory and in-situ testing campaign, it will be possible to add additional features of the buildings to the models, such as existing damage and settlement, based on observations of these features in the field.
The structural modelling activities undertaken for the Winningsplan 2016 will continue and additional nonlinear dynamic analyses of index buildings, covering all of the unreinforced masonry (URM) building typologies in the exposure model as well as reinforced concrete ‘tunnelgietbouw’ building typologies, will be carried out. Parametric

Study and Data Acquisition Plan Induced Seismicity in Groningen - Winningsplan 2016
119
studies will also be undertaken by varying the geometrical, connection and material properties (all of which will be informed by the aforementioned in-situ tests) of the index buildings, in order to model the building-to-building variability in the capacity of these structures. These parametric studies will also help identify the most important attributes within a building typology that would render a specific building more or less fragile. The latter is of particular use to the building strengthening activities, as it will provide guidance on how to identify, through inspection, the buildings within a typology that should be prioritised for structural upgrading.
Figure 10.11 Numerical structural model and nonlinear dynamic analysis of unreinforced masonry building typology
A parametric study on the out-of-plane response of non-structural elements of unreinforced masonry buildings (gable walls, façade walls, parapets and chimneys) will also be undertaken, with explicit modelling of the variation of the properties and input motion for these elements for each building typology. For example, gable walls at the roof of two-storey modern terraced buildings will have different geometrical properties and will be subjected to higher levels of ground motion amplification than gable walls of older one-storey detached buildings. By analytically modelling the non-structural elements, it will be possible to account for the expected differences in the nonlinear response. The results of these analyses will be compared with the empirical fragility and consequence functions for chimneys, parapets and gable walls that were developed for the Winningsplan 2016.
Figure 10.12 Geometrical property variation for parametric study of non-structural parapet, gable and façade walls
Once relationships between the intensity of ground shaking and the nonlinear response of structural and non-structural elements are developed, it will be necessary to identify limit states of displacement at which different levels of damage are expected (e.g. from light cracking to failure). The consequences of each damage state, in terms of debris both inside and outside of the building, will also need to be developed using both the results of numerical analyses and empirical evidence from past earthquakes. These results will be then used as input for the development of structural and non-structural fragility and consequence functions for the Groningen building stock, considering a number of different damage states.
33 Failure Mechanism for Ground Motion 1_14715_H1, 1.00G, X-dir (strong)
0 2 4 6 8
-1500
-1000
-500
0
500
1000
1500
-10
-5
0
5
10
15
20
0 2 4 6 8
SDOF Base Shear & SDOF Max Roof
Displacement vs Time X - dir (strong)
SDOF Dispalacement SDOF Base ShearT=4.50 s
-1500
-1000
-500
0
500
1000
1500
-10 -5 0 5 10 15 20
Base
Sh
ear
(kN
)
Max Roof Displacement (mm)
Hysteresis Loop Curves (0.60G)
SDOF Pre-Failure SDOF Post-Failure
32 Failure Mechanism for Ground Motion 3_14715_H1, 1.00G, X-dir (strong)
0 2 4 6 8
-1500
-1000
-500
0
500
1000
1500
-10
-5
0
5
10
15
20
0 2 4 6 8
SDOF Base Shear & SDOF Max Roof
Displacement vs Time X - dir (strong)
SDOF Dispalacement SDOF Base Shear
T=2.4 s
-1500
-1000
-500
0
500
1000
1500
-10 -5 0 5 10 15 20
Base
Shea
r (k
N)
Max Roof Displacement (mm)
SDOF Pre-Failure SDOF Post-Failure

Study and Data Acquisition Plan Induced Seismicity in Groningen - Winningsplan 2016
120
Figure 10.13 Structural fragility functions for different damage states
Building Falling Objects The first version of a Groningen area falling objects risk assessment was completed in 1Q 2016. This risk assessment has been developed separately from the main NAM hazard and risk assessment, and currently utilizes the October 2015 KNMI probabilistic seismic hazard analysis (PSHA), rather than the NAM PSHA. Further work is planned in 2016 to improve and better integrate the falling objects risk assessment, including the following:
The falling objects risk methodology will be integrated into the main NAM probabilistic hazard and risk
calculation process. As a result of this integration the NAM PSHA will be used for the falling object risk
calculations rather than the October 2015 KNMI PSHA.
The research carried out to date into the fragility of potential falling objects (based on a review of empirical
evidence) has focused on three of the most common types of masonry object found in the Groningen area –
chimneys, parapets and gables. Together these three object types represent ~70% of the total potential falling
objects identified in the Groningen area. In 2016, further selective research will be carried to improve the
fragility assessment for other important objects found in the Groningen region, such as balconies, canopies and
large areas of glass.
Improvements to the assessment of the exposure of people to falling object risk are planned, with a particular
focus on larger public buildings where the simple assumptions used in the current risk assessment may need to
be modified. Further research is also planned on the likelihood of people running outside of buildings during
earthquakes and being in the at-risk area if/when debris falls from above the door.
Further analysis of the strength of different roof types is planned to improve the consequence model for
objects with the potential to fall through roofs. It is recognized that some stronger roof types may offer a
degree of protection against falling objects, but this is not yet taken into account in the risk assessment.
The falling objects risk methodology will undergo further scientific / peer review in 2016 by parties including the Scientific Advisory Committee and selected academic institutions. These reviews may highlight additional opportunities for improvement which will be considered for inclusion in the work plan along with the areas described above.

Study and Data Acquisition Plan Induced Seismicity in Groningen - Winningsplan 2016
121
Summary The table below shows which studies make a contribution the research question:
Pro
perties o
f Bu
ildin
g Materials
Experim
ental
Tests
of
Structu
ral an
d
No
n-
Structu
ral Elemen
ts of B
uild
ings
Mo
dellin
g o
f stru
ctural
com
po
nen
ts an
d
system
s
Testin
g of stru
ctural co
mp
on
en
ts
Testin
g of stru
ctural syste
ms – Sh
ake table
testing
Mo
nito
ring o
f bu
ildin
gs in G
ron
ingen
–
Bu
ildin
g Senso
r sand
tilt mete
rs
Mo
nito
ring o
f bu
ildin
gs in G
ron
ingen
– HiR
es
InSA
R
In-situ
dyn
amic te
sting o
f structu
ral system
s
Nu
merical M
od
ellin
g of Stru
ctural an
d N
on
-
Structu
ral Elemen
ts of B
uild
ings
Bu
ildin
g Falling O
bjects
To further increase and better focus the capability to predict response, damage and losses from structural elements of buildings,
To further increase and better focus the capability to predict response, damage and losses from non-structural elements of buildings,
To develop associated fragility and vulnerability curves,
To formulate strengthening approaches and guidelines for assessment.
To identify damage due to eartquakes
Table 10.1 Research table linking the research questions to the study activities.
Study and Data Acquisition Plan Induced Seismicity in Groningen - Winningsplan 2016
122
12 Further Studies and Data Acquisition Projects – Hazard and Risk Assessment
Modifications to Monte Carlo Risk Engine In the Winningsplan 2016, the risk of fatalities from structural and non-structural elements was calculated separately and the Monte Carlo hazard and risk engine was only used to calculate inside local personal risk and inside group risk, due to structural failure alone. Moving forward, there will be a need to calculate the risk to people due to both structural and non-structural elements, both inside and outside of buildings, for a number of different risk metrics.
Given that non-structural elements are components of buildings, and are influenced by the response of the latter, the consequences of their failure should be considered together with the consequences of structural failure. Modifications to the Monte Carlo risk engine will thus be needed, and these changes will need to be made within a formal process of quality control and assurance of the code base. Concepts of agile software development, test-driven development (TDD) and open source software development, as used in the development of the Global Earthquake Model’s seismic hazard and risk engine (OpenQuake-engine, www.openquake.org), will be investigated for future development of the code.
Control Optimisation for Earthquake Minimisation The aim of the study is to investigate whether the seismic activity rate for the whole field or for certain areas can be minimized by a specific offtake split (producing more at some clusters and less at other clusters). This note describes the status of the current study on dynamic simulation support for low-risk field production scenarios to establish control strategies for the Groningen field that minimize the seismic activity rate. The link between the amount of reservoir compaction and the activity rate will be taken as a given in the context of this study, while the link between the activity rate and the human risk is not investigated in this specific study. Other studies by NAM and other parties investigate those topics. This might be included in a later phase of the project.
The intent of this study is to investigate whether it is possible to minimize a simplistic representation (a proxy) of seismic activity rate by redistributing offtake in a reservoir model of the Groningen field subject to the constraint of the total field offtake rate. Simulations aiming to minimising seismic activity are currently based on engineering judgement. Optimisation workflows in the realm of dynamic reservoir simulations could potentially provide a better basis for defining field production scenarios that reduce reservoir seismicity. Any alternative production scenario found by this study will require verification in the full probabilistic seismological calculation engine.
The purpose of minimising seismic activity through reservoir engineering optimisation requires three main steps:
Agreement on an activity rate proxy, signed off by geomechanical experts and NAM – currently under
discussion,
Optimization of this proxy by control optimization – the core work done in this study,
Validation of the optimal offtake strategies found with the proxy on the actual probabilistic hazard and risk
models – to be undertaken by the asset in collaboration with geomechanical experts.
Control framework – how does it fit? Given the uncertainties related to induced seismicity, one would need to adopt a closed-loop workflow methodology in order to reduce the seismic activity rate. This would enable one to build understanding of subsurface behaviour while controlling production rates in such a way that expected seismicity is minimised.

Study and Data Acquisition Plan Induced Seismicity in Groningen - Winningsplan 2016
123
Figure 12.1 Optimising earthquake activity rate (proxies) in a closed-loop fashion, in conjunction with the normal model
update loop (history matching). Adapted control strategies need to be verified in full probabilistic geomechanical
context. On the right hand side, we see the reason for this: dynamic simulations have a reasonable grip on
depletion and compaction, but the relation to tremor probability (“seismic activity rate”) already requires an
approximate approach defined by geomechanics. Final translation into human risk requires full probabilistic
seismological calculation.
This closed-loop approach, or batch wise open-loop, is depicted in Figure 12.1. The statistics from measured seismicity allow a simplistic relationship (or “proxy”) between seismicity and depletion to be updated. This proxy can be used in a dynamic reservoir simulation workflow that minimises this representation of seismic activity rate by changing the offtake distribution over the field. Proxies make this workflow manageable, but do make full geomechanical verification a requirement.
Project objectives and limitations The project described here aims to demonstrate feasibility of such a dynamic reservoir simulation workflow and the associated target for a reduction in (the proxy for) tremor frequency. The objective function being minimised in this study, is a volume-weighted, field wide averaged depletion rate (dp/dt). The non-linear relationship between absolute depletion and induced seismicity (activity rate) will be built into the weighting of the activity rate proxy over the entire field. The parameters to be tuned are the allocation factors that assign a fraction of the total field production to predefined regions in the field.
First results Preliminary simulation results, which can only be used to conclude that the dynamic simulation workflow for proxy minimisation appears to work, are shown in Figure 11.

Study and Data Acquisition Plan Induced Seismicity in Groningen - Winningsplan 2016
124
Figure 11.2 Preliminary results showing the control regions over which total production is split on the left and the resulting
production distribution on the right – the colours represent regions; the thick lines represent the production
scenario that results in reduced seismic-proxy value.
Next steps
Project specific From the perspective of the current project, the next steps can be defined as follows.
1. Agree on the proxy for the relationship between compaction and seismic activity rate, to be used in our
dynamic reservoir simulations. The material describing this proxy will be prepared by geomechanical experts
who will stay involved in this project,
2. Finalising (report-out) phase I: mid-2016,
3. Decide on the implications and (asset) usage of phase I results,
4. Decide on a potential phase II of this project, to be executed after second half 2016 and 2017.
Wider context Within the context of the Winningsplan and the Meet- en Regelprotocol, we can see the next steps as follows.
If results indicate that redistributing regional production rates could have a significant impact on tremor probabilities (Phase I), a verified, improved production scenario could be taken into account in the next update of the hazard and risk assessment and the control loop as defined in Figure 12.1 could support the Meet- en Regelprotocol. The definition and testing of scenarios suitable for the next update of the hazard and risk assessment would require close interaction between the Quantitative Reservoir Management (QRM) team and the Groningen asset team. The aim is to deliver by the end of this second project phase an optimisation workflow which is sufficiently defined and tested for the asset team to be able to include it in their simulation workflows and business processes.
Proposal to compare the predictive performance of a range of seismic
activity rate models and for the development of methods for verification
of seismic hazard and risk forecasts NAM produces probabilistic seismic hazard and risk forecasts for a number of scenarios for future gas production and building upgrading. The forecasts are based on a chain of models which each address a part of the causal chain of events from fault slip in the subsurface to an event (such as ground motion) at the surface. We propose to put in place a statistical framework which can be used to estimate a-priori and verify a-posteriori how skilful a forecast will be / was. A good overview of scientific, pragmatic and statistical methods for forecast verification is given in Jolliffe and Stephenson [2003] (and references therein). We believe that the methodology and scientific philosophy as described in Jolliffe and Stephenson [2003] can form the basis for the forecast verification strategy. The “skill” of

Study and Data Acquisition Plan Induced Seismicity in Groningen - Winningsplan 2016
125
a forecast here means its ability to accurately predict the future events of interest. Skill is usually scored relative to one or more “unskilful” or “reference” forecasts.
During the development of a forecasting system, it is common practice that a particular data set is used for both parameterisation and testing of models. This is for example the case for the models for seismic activity, which are both tested and assessed using the earthquake catalogue. It is well known that this practice will lead to an over-optimistic view of the performance of models, a phenomenon which is referred to as “artificial skill” (page 9 in Jolliffe and Stephenson [2003]). The best way to avoid such artificial inflation is to assess skill strictly on forecasts of events that have not yet occurred. This may be a solution for short-term forecasts depending on the rate at which observed events come in, since sufficient sample sizes are required for reliable verification or even to be able to detect a difference between skilful and unskilful forecasts. However, in practice, and certainly for medium- or long-term forecasts it will not be acceptable to wait too long to get feedback on the performance of models. Instead, improvements to models need to be made as new insights develop and whilst new events are coming in. The second best method to assess forecasting skill whilst reducing potential artificial skill is to partition the available data set into one or more test (used to parameterise and formulate models) and training data sets (used to score forecasting skill), and one particular strategy for doing this is commonly referred to as cross-validation in the statistical literature. Cross-validation refers to a procedure in which the data set is partitioned into k subsets, after which for each subset a forecasting skill score is evaluated based on predictions from models that were formulated and parameterised using the other k - 1 subsets. We recommend that first a strategy is devised for a-posteriori verification of the seismic hazard and risk forecasts. It will be necessary to:
1. Identify and unambiguously define the key predictants of interest and their type (e.g. probabilistic or not).
2. Define appropriate skill scores for each predictant. The skill scores will be used to assess the degree of
agreement between forecasts and observed outcomes.
3. Describe the administrative procedures to log forecasts and how (e.g. when and who) the verification will take
place.
It is possible that the verification scheme may have to be tailored to different users or stakeholders depending on their interests.
Second, as discussed above, there are also ways for a-priori assessment of forecast skill using cross-validation techniques to reduce potential inflation of perceived skill. Bearing in mind that the key predictants of interest still need to be defined, we propose to implement one practical example of forecast skill scoring for models that predict rates of occurrence of earthquakes. It is likely that over time several different models will be proposed for the spatio-temporal variability in the rate of occurrence of earthquakes in the Groningen gas field. In Jones et al. [2015] an outline is given of statistical methodology that can be used to compare, in a transparent and objective manner, the relative skill (predictive performance) of these models relative to some unskilful model. The unskilful model is based on a spatially homogeneous and time-invariant rate of occurrence.
Predictive performance in this context is defined as the ability of models to explain the variation in earthquake occurrence rates in combinations of epochs and regions in the Groningen gas field which have not been used to fit (parameterise) the models.
Outline of deliverables and time line The following activities are planned:
1. Describe a framework for verification of the seismic hazard & risk forecasts.
2. If item 1 above has been completed, consider continuing with: Use the statistical framework for comparison of
model predictive performance as outlined by Jones et al. [2015] to compare the skill score of a range of models
which predict the rates of occurrence of earthquakes in space and time. NAM management will decide which
models are to be included into the model comparison scheme. Examples of models that could be tested
against the unskilful model are:

Study and Data Acquisition Plan Induced Seismicity in Groningen - Winningsplan 2016
126
a. The model currently in use in the seismic hazard and risk work flow (Bourne and Oates [2014] or
further developments of this model)
b. Models that predict earthquake occurrence rates as a function of pore pressure depletion.
c. Etc.
3. If item 2 above has been completed, consider continuing with: Further develop the statistical methodology
outlined in Jones et al. [2015] to allow for dependence of the timing and location of events and over-dispersion
in the realised counts of events per unit of time and space. The skill score for evaluating the performance of
models will depend on a counting uncertainty model, and it will be necessary to have a choice of realistic
counting uncertainty models at least some of which reflect the possibility, or even likelihood, that events do
not occur independently of one another.
a. Implement the Epdemic Type Aftershock (ETAS) model for dependency of events in the model
comparison framework (see e.g. citeBOUR2014).
b. Implement an alternative model for dependence/clustering of events (overdipersion) with fewer
parameters compared to the ETAS model.
More specifically, the deliverables for each of the items above are:
1. A report describing a framework for a-posteriori and a-priori (using cross-validation techniques)
verification of the seismic hazard ad risk forecasts.
2. Use the statistical framework as outlined by Jones et al. [2015] to compare the skill score of a range of
models. The deliverables are:
a. A report describing the methodology in detail (based on the note by Jones et al. [2015]), as well
as the outcomes: the relative skill scores of the models.
b. Documented computing code for the model comparison framework.
3. Further develop the statistical methodology outlined in Jones et al. [2015] to allow for dependence of the
timing and location of events. The deliverables are:
a. A report describing the new methodology in detail.
b. Documented computing code for the new model comparison framework.
These new developments will build upon the results listed under point 2 above.
Since the model comparison scheme described in Jones et al. [2015] is already operational for a number of models, deliverable 2 could be achieved for a small number of models. The amount of time and effort required to implement a new model will be case specific, and depends on the complexity of the model and on how similar the model is to existing models which have been already implemented. For deliverable 3 the methodology of the existing comparison scheme needs to be extended and this deliverable therefore includes a significant research component.
Next Generation PSHA
Objective Probabilistic Seismic Hazard Assessment (PSHA) provides a framework to calculate the distribution of ground motion that may occur at a site, incorporating a wide range of uncertainties. This framework has been used for decades and is the starting point for most current earthquake hazard assessments globally. In recent years, new approaches have been proposed to address overly constrained assumptions and application failures. This study element will closely examine academic and national research institution progress in next generation hazard assessment and apply to Groningen where appropriate.
Description Three focus areas will be evaluated for application to Groningen:

Study and Data Acquisition Plan Induced Seismicity in Groningen - Winningsplan 2016
127
PSHA Validation: Validating PSHA is extremely challenging as it is dominated by large events with a long-
return period. However, recent work suggests some statistical measures that may be used to validate or
score a PSHA. The expected reduction in magnitude of completeness from the new surface monitoring
array will provide additional data that may allow improved statistical measures. Results might suggest
that the current PSHA is overly conservative.
Non-ergodic PSHA: Traditional PSHA is steady state and makes the ergodic assumption that the statistics
of a small number of well-recorded earthquakes are indicative of the distribution of ground motion at a
single site for multiple earthquakes over a long return period. Both of these assumptions are questionable
for induced seismicity. A non-ergodic version of PSHA has been used in applications.
Scenario Modeling Methods: Scenario analysis methods in a Bayesian framework have been proposed as
an alternative to PSHA. These methods relax PSHA assumptions but are generally more data driven. A
scenario-based approach has been found to outscore PSHA in Italy compared to observed seismicity.
Deliverable A study report will describe how the Groningen PSHA could be validated (if possible given limited data). Promising alternatives to the current PSHA will be evaluated for the unique circumstances at Groningen including proof-of-concept calculations for comparison with other approaches.
References 1. Playing against Nature: Integrating Science and Economics to Mitigate Natural Hazards in an Uncertain World,
Stein and Stein, American Geophysical Union, 2014. 2. A new probabilistic shift away from seismic hazard reality in Italy?, "Springer Proceedings in Physics”
International School on “Nonlinear Mathematical Physics and Natural Hazards” (Sofia, Bulgaria - 2013) A. Nekrasova , A. Peresan, V.G. Kossobokov, G.F. Panza
3. Anderson, J. G., & Brune, J. N. (1999). Probabilistic Seismic Hazard Analysis without the Ergodic Assumption.Seismological Research Letters, 70(1), 19-28.
4. Site Response Effects on Partially Ergodic PSHA G. A. Montalva, and A. Rodriguez-Marek, GeoRisk 2011 (ASCE).

Study and Data Acquisition Plan Induced Seismicity in Groningen - Winningsplan 2016
128
Appendix A List of Abbreviations
ALARP As Low As Reasonably Practicable
ARUP Engineering Company named after founder: Ove Arup
Bcm N.Bcm refers to a volume of a billion normal cubic meters. Normal means the volume is
measured at a standard temperature (0 degree C) and pressure (1 bar)
BOA Begeleidingscommissie Onderzoek Aardbevingen
CBS Centraal Bureau Statistiek
CEA China Earthquake Administration
CMI Compaction Monitoring Instrument
CPT Cone Penetration Test
DAS Distributed Acoustic Sensing
DS Damage State
DSS Distributed Strain Sensing
DTS Distributed Temperature Sensing
EBN Energy Beheer Nederland
EMS European Macroseismic Scale
EZ Ministerie van Economische Zaken
FDSN Federation of Digital Seismograph Networks
Frl Friesland
GBB Groninger Bodembeweging
GMPE Ground Motion Prediction Equations
GNSS Global Navigation Satellite System
GPS Global Positioning System
GR Group Risk
GWC Gas water contact
HRA Hazard and Risk Assessment
HRBE High Risk Building Element
ILPR Inside Local Personal Risk
I&M Ministerie van Infrastructuur en Milieu
InSAR Interferometric Synthetic Aperture Radar
KNGMG Koninklijk Nederlands Geologisch Mijnbouwkundig Genootschap
KNMI Koninklijk Nederlands Meteorologisch Institute
KU Leuven Katholieke Universiteit Leuven (Catholic University Leuven)
LIDAR Laser Imaging Detection And Ranging

Study and Data Acquisition Plan Induced Seismicity in Groningen - Winningsplan 2016
129
LPR Local Personal Risk
LNEC Laboratorio Nacional de Engenharia Civil (Lisbon)
M Earthquake Magnitude
MR Maatschappelijk Risico
MASW Multichannel Analysis of Surface Waves
MIT Massachusetts Institute of Technology
NAM Nederlandse Aardolie Maatschappij B.V.
NCG Nationaal Coordinator Groningen
NGO Non-governmental Organisation
NORSAR Norwegian Seismic Array (Norwegian independent, not-for-profit, research foundation within
the field of geo-science)
NTNU Norges teknisk-naturvitenskapelige universitet (Norwegian University of Science and
Technology in Trondheim)
OGP Onafhankelijk Geologen Platform
OIA Objectgebonden Individueel Aardbevingsrisico (Object related individual earthquake risk)
OIR Object-bound individual risk (same as OIA)
OVV Onderzoeksraad voor Veiligheid (Safety Board)
PGA Peak Ground Acceleration
PGV Peak Ground Velocity
PNL Pulsed Neutron log
QRM Quantitative Reservoir Management
RFT Repeat Formation Tester
RUG Rijksuniversiteit Groningen
SAC Scientific Advisory Committee
SED Schweizerischer Erdbebendienst (Swiss Seismological Survey)
SINTEF Stiftelsen for industriell og teknisk forskning (Foundation for Scientific and Industrial Research)
SodM Staatstoezicht op de Mijnen (also SSM State Supervision of Mines)
SPTG Static Pressure and Temperature Measurement
SSHAC Senior Seismic Hazard Analysis Committee
Tcbb Technische commissie bodembeweging
TK Tweede Kamer (Dutch equivalent of House of Commons)
TNO Nederlandse Organisatie voor Toegepast Natuurwetenschappelijk Onderzoek, Netherlands Organisation for Applied Scientific Research
TNO-AGE Nederlandse Organisatie voor Toegepast Natuurwetenschappelijk Onderzoek – Advies Groep
Economische Zaken
TU Delft Technische Universiteit Delft

Study and Data Acquisition Plan Induced Seismicity in Groningen - Winningsplan 2016
130
UU Universiteit Utrecht
URM Un-reinforced Masonry
USGS United States Geological Survey
USNRC United States Nuclear Regulatory Commission

Study and Data Acquisition Plan Induced Seismicity in Groningen - Winningsplan 2016
131
Appendix B References The following technical reports are available at the website www.namplatform.nl:
Technical Reports “Onderzoekrapporten” 1. Nederlandse Aardolie Maatschappij BV, Update of the Winningsplan Groningen 2013, 29
th November 2013.
2. Nederlandse Aardolie Maatschappij BV (Jan van Elk and Dirk Doornhof, eds), Technical Addendum to the Winningsplan
Groningen 2013; Subsidence, Induced Earthquakes and Seismic Hazard Analysis in the Groningen Field,
3. Nederlandse Aardolie Maatschappij BV (Jan van Elk and Dirk Doornhof, eds), Supplementary Information to the Technical
Addendum of the Winningsplan 2013.
4. Nederlandse Aardolie Maatschappij BV, Jan van Elk & Dirk Doornhof, Study and Data Acquisition Plan Induced Seismicity in
Groningen for the update of the Winningsplan 2016, December 2014, submitted in March 2015, EP 201503202325.
5. Bourne, S. J., S. J. Oates, J. van Elk, and D. Doornhof (2014), A seismological model for earthquakes induced by fluid
extraction from a subsurface reservoir, J. Geophys. Res. Solid Earth, 119, 8991–9015, doi:10.1002/2014JB011663.)
6. S.J. Bourne, S.J. Oates, J.J. Bommer, B. Dost, J. van Elk, D. Doornhof, A Monte Carlo method for probabilistic hazard
assessment of induced seismicity due to conventional gas production, Bulletin of the Seismological Society of America,
V.105, no. 3, June 2015 in press.
7. Nederlandse Aardolie Maatschappij BV, Risk Methodology; Back to the region, February 2015, (forwarded to the national
committee on earth quake related risks in April 2015) (EP 201504200668).
8. Stephen Bourne and Steve Oates, An activity rate model of induced seismicity within the Groningen Field, (Part 1), February
2015.
9. Matt Pickering, A re-estimate of the earthquake hypo-centre locations in the Groningen Gas Field, March 2015.
10. Regularised direct inversion to compaction in the Groningen reservoir using measurements from optical levelling
campaigns, S.M. Bierman, F. Kraaijeveld and S.J. Bourne, March 2015.
11. Development of Version 1 GMPEs for Response Spectral Accelerations and for Strong-Motion Durations, Julian J Bommer,
Peter J Stafford, Benjamin Edwards, Michail Ntinalexis, Bernard Dost and Dirk Kraaijpoel, March 2015.
12. Introduction to the Geology of Groningen, Erik Meijles, April 2015.
13. Geological schematisation of the shallow subsurface of Groningen (For site response to earthquakes for the Groningen gas
field), Deltares Pauline Kruiver and Ger de Lange.
14. URM Modelling and Analysis Cross Validation – Arup, EUCENTRE, TU Delft, Reference 229746_032.0_REP127_Rev.0.03
April 2015.
15. Analysis of deep compaction measurements in the Groningen field, Pepijn Kole, Dirk Doornhof and Antony Mossop, May
2015
16. An activity rate model of seismicity induced by reservoir compaction and fault reactivation in the Groningen gas field,
S.J.Bourne, S.J. Oates, June, 2015
17. Developing an Application-Specific Ground-Motion Model for Induced Seismicity, Julian J Bommer, Bernard Dost, Benjamin
Edwards, Peter J Stafford, Jan van Elk, Dirk Doornhof, and Michail Ntinalexis, Bulletin of the Seismological Society of
America, September 2015
18. Development of Version 2 GMPEs for Response Spectral Accelerations and Significant Durations for Induced Earthquakes in
the Groningen field, Julian Bommer et. Al, October 2015
19. Review of “An Activity rate model of seismicity induced by reservoir compaction and fault reactivation in the Groingen gas
fields”, Ian Main, September 2015
20. Induced seismicity in the Groningen field - statistical assessment of tremors along faults in a compacting reservoir, Rick
Wentinck, July 2015
21. Impact of various modelling options on the onset of fault slip and fault slip response using 2-dimensional Finite-Element
modelling, Peter van den Bogert, July 2015
22. Crowley H., Pinho R., Polidoro B., Stafford P. (2015) “Development of v2 fragility and consequence functions for the
Groningen Field,” October 2015.
23. Eucentre (2015a) “Protocol for shaking table test on full scale building,” Draft Rev. 2, July 2015.
24. Eucentre (2015b) “Experimental campaign on cavity walls systems representative of the Groningen building stock,” October
2015.

Study and Data Acquisition Plan Induced Seismicity in Groningen - Winningsplan 2016
132
25. Eucentre, P&P, TU-Delft, TU-Eindhoven (2015) “Material characterisation,” Draft Rev. 1.1, October 2015.
26. Mosayk (2014) “Report on software verification against experimental benchmark data,” Deliverable D1, October 2014.
27. Mosayk (2015a) “Report on structural modelling of non-URM buildings - v2 Risk Model Update,” Deliverable D2 update,
October 2015.
28. Mosayk (2015b) “Report on soil-structure interaction (SSI) impedance functions for SDOF systems,” Deliverable D3,
October 2015.

Study and Data Acquisition Plan Induced Seismicity in Groningen - Winningsplan 2016
133
Appendix C Experts Apart from scientist, engineers and researchers in NAM and the laboratories of Shell (Rijswijk) and Exxonmobil (Houston), NAM has also sought the advice of internationally recognised experts. Some of the experts collaborating in the research program on induced seismicity in Groningen, led by NAM, are listed below.
External Expert Affiliation Main Expertise Area
Damian Grant ARUP Building Fragility
Guido Magenes EUCentre Pavia Building Fragility
Rui Pinho University Pavia Building Fragility
Helen Crowley Independent Consultant, Pavia Building Fragility and Risk
Michelle Palmieri ARUP Building Fragility
Rinke Kluwer ARUP Building Fragility
Sinan Akkar Bogazici, University Istanbul Ground Motion Prediction
Ben Edwards University Liverpool Ground Motion Prediction
Michail Ntinalexis Independent Consultant, London Ground Motion Prediction
Barbara Polidoro Independent Consultant, London Ground Motion Prediction
Peter Stafford Imperial College London Ground Motion Prediction
Julian Bommer Independent Consultant, London Ground Motion Prediction and Site Response
Emily So Cambridge Architectural Research Ltd Injury model
Robin Spence Cambridge Architectural Research Ltd Injury model
Russell Green Virginia Tech, USA Liquefaction Model
Tony Taig TTAC Limited Risk
Loes Buijze University Utrecht Rock Physics / Core Experiments
Chris Spiers University Utrecht Rock Physics / Core Experiments
Bart Verberne University Utrecht Rock Physics / Core Experiments
Andre Niemeyer University Utrecht Rock Physics / Core Experiments
Matt Pickering Student; Leeds University Seismic Event Location
Marco de Kleine Deltares Site Response and Shallow Geological Model
Pauline Kruiver Deltares Site Response and Shallow Geological Model
Ger de Lange Deltares Site Response and Shallow Geological Model
Adrian Rodriguez -Marek Virginia Tech, USA Site Response Assessment
Mandy Korff Deltares Site Response, liquefaction and Shallow Geological Model
Piet Meijers Deltares Site Response, liquefaction and Shallow Geological Model
Table C.1 The most important expert collaborators.
The experts and academics on this list have worked for a considerable time on studies of this program.

Study and Data Acquisition Plan Induced Seismicity in Groningen - Winningsplan 2016
134
To independently review the studies and assure their results the following experts and academics have been asked to familiarize themselves with the studies and provide their feedback in assurance workshops or reports:
External Expert Affiliation Main Expertise Area
Adriaan Janszen Exxonmobil Shallow Geological Model
Eric Meijles University Groningen Shallow Geological Model
Joep Storms TU Delft Shallow Geological Model
Tijn Berends Student; University Groningen Site Response and Shallow Geological Model
Table C.2 The assurance team for “Shallow Geological Model”.
The assurance team for “Ground Motion Prediction” is shown in table x.
External Expert Affiliation Main Expertise Area
Gail Atkinson Western University, Ontario, Canada Ground Motion Prediction
Hilmar Bungum NORSAR, Norway Ground Motion Prediction and panel for the maximum magnitude of earthquakes
Fabrice Cotton GFZ Potsdam, Germany Ground Motion Prediction
John Douglas University of Strathclyde, UK Ground Motion Prediction
Jonathan Stewart UCLA, California, USA Ground Motion Prediction
Ivan Wong AECOM, Oakland, USA Ground Motion Prediction Member and panel for the maximum magnitude of earthquakes
Bob Youngs AMEC, Oakland, USA Ground Motion Prediction Member and panel for the maximum magnitude of earthquakes
Table C.3 The assurance team for “Ground Motion Prediction”. Ivan Wong and Bob Youngs sit also in the panel for the
maximum magnitude of earthquakes.
The assurance team for “Building Fragility” is shown in table x.
External Expert Affiliation Main Expertise Area
Jack Baker Stanford University, US Building Fragility
Paolo Franchin University of Rome “La Sapienza” Building Fragility
Michael Griffith University of Adelaide, Australia Building Fragility
Curt Haselton California State University, US Building Fragility
Jason Ingham University of Auckland Building Fragility
Nico Luco United States Geological Survey Building Fragility
Dimitrios Vamvatsikos NTUA, Greece Building Fragility
Table C.4 The assurance team for “Building Fragility”.
The assurance teams have been informed by the extensive technical documentation and in workshops. The recommendations of the assurance teams have been incorporated in the details technical reports (section further work) and in this document. Because of their highly mathematical nature, the seismological models supporting the hazard and risk assessment have been reviewed by Prof. Ian Main (of Edinburgh University). Prof. Main has prepared review letters, which have been shared. For the latest of these review letters see appendix J.
The studies on building fragility have additionally been review by Ron O. Hamburger of the consultancy Gumpertz & Heger. Also this report is attached to this report (as appendix I).

Study and Data Acquisition Plan Induced Seismicity in Groningen - Winningsplan 2016
135
In a workshop conducted following the guidelines for a SSHAC level 3 process, a panel of experts has been asked to evaluate the distribution of Mmax values for the Groningen area, based on the current knowledge and uncertainty.
This panel consisted of:
External Expert Affiliation Role
Kevin Coppersmith Geomatrix Consultants Inc. Chaiman SHACC Committee
Ivan Wong AECOM, Oakland, USA Ground Motion Prediction and Member SHACC Committee
Bob Youngs AMEC, Oakland, USA Ground Motion Prediction Member and SHACC Committee
Jon Ake US Nuclear Regulatory Commission Member SHACC Committee
Hilmar Bungun Norsar Norway Member SHACC Committee
Torsten Dahm GFZ Potsdam Member SHACC Committee
Art McGarr US Geological Survey Member SHACC Committee
Ian Main University Edinburgh Seismogenic Model / Statistics and Member SHACC Committee
Table C.5 The panel for the determination of Mmax distribution.
Additionally the following independent external experts presented to the expert panel:
External Expert Affiliation Role
Serge Shapiro Freie Universiteit Berlin Independent Advisor
Emily Brodsky University of California, Santa Cruz Independent Advisor
Jenny Suckale Stanford University, Department of Geophysics
Independent Advisor
Gilian Foulger Durham University, Department of Geophysics
Independent Advisor
Gert Zöller University of Potsdam Institute of Mathematics and Focus Area for Dynamics of Complex Systems
Independent Advisor
Table C.6 The experts presenting to the panel for the determination of Mmax distribution.

Study and Data Acquisition Plan Induced Seismicity in Groningen - Winningsplan 2016
136
Appendix D Universities and Knowledge Institutes The main partners in the research program into induces seismicity in Groningen are listed below:
Partner Expertise
Deltares Shallow geology of Groningen, soil properties and measurements of site response/liquefaction.
University Utrecht (UU) Measurements of rock compaction and rupture on core samples, understanding of physical processes determining compaction.
University Groningen (RUG)
Shallow geology of Groningen.
ARUP Modelling of building response to earthquakes, management of the program to measure strength of building materials.
Technical University Delft (TUD)
Measure strength of building materials and building elements.
Eucentre, Pavia, Italy Measure strength of building materials, building elements and shake table testing of full scale houses.
Mosayk Modelling of building response to earthquakes.
Magnitude (A Baker Hughes & CGG Company)
Seismic Monitoring (determination of location results deep geophones)
TNO Potential for earthquakes resulting from injection. Building sensor project.
Avalon Supplier of geophone equipment permanent seismic observations wells.
Baker-Hughes Supplier of geophone equipment temporary observation wells.
Antea Management of the extension of the geophone network.
Rossingh Drilling Drilling of the shallow wells for the extension of the geophone network.
China Earthquake Administration
Experiments for friction on moving fault surfaces and upscaling of small scale experiments. Research led by University of Utrecht.
Table D.1 The main partners in the research program into induces seismicity in Groningen.

Study and Data Acquisition Plan Induced Seismicity in Groningen - Winningsplan 2016
137
Appendix E Recommendations from reviews of the “Hazard and Risk Assessment – Interim Update November 2015”.
In the expectation letter from the Ministry of EZ in February 2016, the following expectation was shared; “NAM is expected on the basis of these review to update the "Study and data acquisition" and demonstrate how NAM has integrated these comments into the plan.”
5 The table below explicitly shows for each
recommendation in the reviews the corresponding action(s) in the Study and Data Acquisition Plan.
Figure A.1 Text on the Study and Data Acquisition Plan in the expectation letter.
5 Dutch text of the verwachtingen brief: Van NAM wordt verwacht dat op grond van dit commentaar het "Study and data-acquisition" wordt geactualiseerd en
dat NAM aangeeft op welke manier het commentaar in het plan is verwerkt.
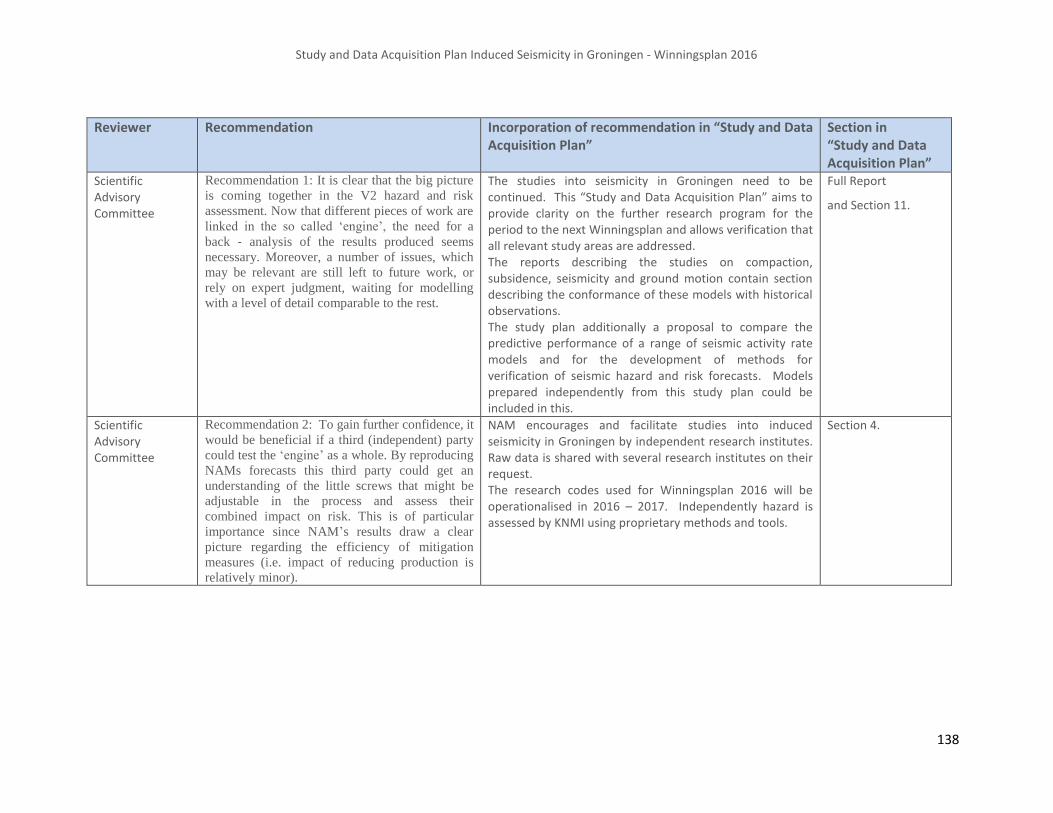
Study and Data Acquisition Plan Induced Seismicity in Groningen - Winningsplan 2016
138
Reviewer Recommendation Incorporation of recommendation in “Study and Data Acquisition Plan”
Section in “Study and Data Acquisition Plan”
Scientific Advisory Committee
Recommendation 1: It is clear that the big picture
is coming together in the V2 hazard and risk
assessment. Now that different pieces of work are
linked in the so called ‘engine’, the need for a
back ‐ analysis of the results produced seems
necessary. Moreover, a number of issues, which
may be relevant are still left to future work, or
rely on expert judgment, waiting for modelling
with a level of detail comparable to the rest.
The studies into seismicity in Groningen need to be continued. This “Study and Data Acquisition Plan” aims to provide clarity on the further research program for the period to the next Winningsplan and allows verification that all relevant study areas are addressed. The reports describing the studies on compaction, subsidence, seismicity and ground motion contain section describing the conformance of these models with historical observations. The study plan additionally a proposal to compare the predictive performance of a range of seismic activity rate models and for the development of methods for verification of seismic hazard and risk forecasts. Models prepared independently from this study plan could be included in this.
Full Report
and Section 11.
Scientific Advisory Committee
Recommendation 2: To gain further confidence, it
would be beneficial if a third (independent) party
could test the ‘engine’ as a whole. By reproducing
NAMs forecasts this third party could get an
understanding of the little screws that might be
adjustable in the process and assess their
combined impact on risk. This is of particular
importance since NAM’s results draw a clear
picture regarding the efficiency of mitigation
measures (i.e. impact of reducing production is
relatively minor).
NAM encourages and facilitate studies into induced seismicity in Groningen by independent research institutes. Raw data is shared with several research institutes on their request. The research codes used for Winningsplan 2016 will be operationalised in 2016 – 2017. Independently hazard is assessed by KNMI using proprietary methods and tools.
Section 4.

Study and Data Acquisition Plan Induced Seismicity in Groningen - Winningsplan 2016
139
Reviewer Recommendation Incorporation of recommendation in “Study and Data Acquisition Plan”
Section in “Study and Data Acquisition Plan”
Scientific Advisory Committee
Recommendation 3: We would like to see a more
detailed presentation of the current risk
assessment in the framework of NAM’s/Shell’s
internal HSE Management System. We advise to
seek contact with professionals with a systems
and control background in the process industry to
assist in developing the Meet-‐en-‐Regel
Protocol.
Suggestions for names: Dr. K.C. Goh (Shell),
Prof. Bjarne A. Foss (Norwegian University of
Science and Technology (NTNU)), Prof. B. Erik
Ydstie (Carnegie Mellon University, USA), Prof.
Wolfgang Marquardt (RWTH Aachen University,
Germany).
A proposal to work with professionals with a systems and control background in the process industry is included in this Study and Data Acquisition Plan.
Chapter 13; Further Studies and Data Acquisition Projects – Hazard and Risk Assessment, Groningen control optimisation for earthquake minimisation.
Swiss
Seismological
Survey
(Stefan Wiemer)
Recommendation 1: The overall approach
adopted by the operator to the assessment of the
risk posed by induced earthquakes in the
Groningen area is, in my opinion, fully
appropriate and almost without alternative. It
should be continued and extended in the future, in
an evolutionary sense.
The studies into seismicity in Groningen need to be continued. This “Study and Data Acquisition Plan” aims to provide clarity on the further research program and allows verification all relevant areas are addressed.
Full Report
Swiss
Seismological
Survey
(Stefan Wiemer)
Recommendation 2: The model in its current
development stage is in my assessment not yet
robust enough for drawing firm quantitative
conclusions about the absolute level of hazard and
risk, its spatial distribution and the effectiveness
of risk reduction strategies. However, it is
conceivable the model version 3.0 will have
evolved such that informed decisions on the
Winningplan 2016 are feasible.
The development of the Hazard and Risk Assessment for induce seismicity in Groningen is a continuing effort requiring fundamental research. This effort was planned for a period of 2.5 years from early 2014 to the submission of the winningsplan mid-2016 (Version 3). The Hazard and Risk Assessment of November 2015 (Version 2) was based on an intermediate update of the models. It provided the best available assessment at that time. However, continued studies to further improve the assessment are planned. This report contains the plan beyond Winningsplan 2016.
Full Report

Study and Data Acquisition Plan Induced Seismicity in Groningen - Winningsplan 2016
140
Reviewer Recommendation Incorporation of recommendation in “Study and Data Acquisition Plan”
Section in “Study and Data Acquisition Plan”
Swiss
Seismological
Survey
(Stefan Wiemer)
Recommendation 3: The process of risk
governance overall should be reflected on beyond
the technical aspects of risk assessment, in order
to maximize the wider legitimacy of the work. In
the current setup, the roles and interactions of
involved parties, but also the ownership of the
model overall, is in my view problematic.
We propose a wider involvement in the assurance of the studies supporting te Hazard and Risk Assessment modelled on the SSHAC Model. This allows involvement of local experts, the NCG, local NGO’s and the Groningen public. Roles and interactions between parties are clearly described in the SSHAC process. NAM has published the names of the experts involved in the studies and in the assurance of these studies.
Section 5.
Swiss
Seismological
Survey
(Stefan Wiemer)
Recommendation 4: The use and roles of external
experts should in the future be more formalized
and applied consistently across the various model
components. More expert feedback/elicitation
especially on the ‘sources’ model seems
appropriate.
The proposed SSHAC process uses formal roles clearly described in the documentation. NAM shares the names of all experts contributing to the research program and the assurance of the results of this program. For the SSHAC process to work, all parties involved should adhere to this principle.
Section 5.
Swiss
Seismological
Survey
(Stefan Wiemer)
Recommendation 5: The efforts related to
analyzing and interpreting the seismological data
should be prioritized and up-scaled substantially.
This may require in addition efforts of groups
outside of KNMI and NAM.
The seismological data is publicly available at the website of KNMI. Several independent research institutes have additionally requested the large seismic data sets from the deep seismic monitoring wells. In anticipation of the large volume of data becoming available after each earthquake both KNMI and NAM have enlarged the seismological team.
Section 6.

Study and Data Acquisition Plan Induced Seismicity in Groningen - Winningsplan 2016
141
Reviewer Recommendation Incorporation of recommendation in “Study and Data Acquisition Plan”
Section in “Study and Data Acquisition Plan”
Swiss
Seismological
Survey
(Stefan Wiemer)
Recommendation 6: The seismogenic source
model is in my assessment not diverse enough to
satisfy the usual PSHA requirement of capturing
the center, body and range of the informed
technical community. Additional efforts are
warranted to widen the model/uncertainty space.
Several seismogenic models have been built by different research teams; (1) strain-partitioning model, (2) activity rate model, (3) large geomechanical model and (4) slider-block model as part of the NAM led study effort. A additional (5) Eshelby inclusion model will be explored. Also in TNO a seismogenic model is under development. The SSHAC process will evaluate whether these models capture the center, body and range of the informed technical community.
Section 5 and 8.
Swiss
Seismological
Survey
(Stefan Wiemer)
Recommendation 7: The use and potential benefit
of integrating ensemble models should be further
explored and formalized.
This is fully supported. Several seismological models have been developed and are being developed. A methodology to compare the predictive performance of a range of seismic models and for the verification of seismic hazard and risk forecast is under development.
Section 9 for different seismological models Section 12 for comparison of seismological models.
Swiss
Seismological
Survey
(Stefan Wiemer)
Recommendation 8: Formalized, independently
conducted testing of the future performance of
seismicity forecast models should be considered
as a key ingredient to improve model building, an
element of model validation and an important
component to build up confidence in the
performance and reliability of the seismogenic
source model.
This fully supported. See above. Section 12 for comparison of seismological models.
Swiss
Seismological
Survey
(Stefan Wiemer)
Recommendation 9: Recognizing the importance
of the GMPE logic tree and its weight to the
overall hazard level, designing of the tree and
setting these weights must be achieved as
transparently and independently as feasible. The
benefits of structured expert elicitation should be
considered.
We believe that the GMPE development team must take responsibility and ownership for the logic-tree, including both the models and their associated branch weights. We fully acknowledge the onus on the team to document and demonstrate the technical bases for our choices. We would be very open to adopting formal and structured procedures for the ongoing work and its IPR. The implementation of a process based on SSHAC would ensure transparency.
Chapter 5

Study and Data Acquisition Plan Induced Seismicity in Groningen - Winningsplan 2016
142
Reviewer Recommendation Incorporation of recommendation in “Study and Data Acquisition Plan”
Section in “Study and Data Acquisition Plan”
Swiss
Seismological
Survey
(Stefan Wiemer)
Recommendation 10: The Mmax workshop is
likely to be focused on highly controversial topics
with widely varying opinions between exerts. It is
important to prepare the workshop well, also
considering if a more structured expert elicitation
is needed or useful.
The Mmax workshop took place from 8 to 10 March 2016. We fully agree the workshop should be organised well and we think it was. Representatives from a large number of organisations were invited to partake; SodM, KNMI, SAC, EBN and NCG.
Report on the Mmax workshop will be issued end-April 2016.
US Geological
Survey (USGS)
(Bill Ellsworth
and Art McGarr)
Recommendation 1: The revised seismic source
and activity model (Bourne and Oates, 2015a and
2015b) has been calibrated to existing data.
Assessing its performance prospectively should
be a high priority in the future, particularly if this
can be done for shorter time intervals than annual
forecasts. Perhaps this will be possible if the
improved seismic network reduces the magnitude
of completeness.
The dense seismic monitoring network is expected to contribute a large volume of seismic data allowing improved calibration of the seismological models. This will allow testing of the predictive capabilities of all seismological models. Methods will be developed to compare the predictive performance of seismological models.
Seismological Models Chapter 8.
Methodologies to compare
Chapter 12.
US Geological
Survey (USGS)
(Bill Ellsworth
and Art McGarr)
Recommendation 2: The exponential relation
between compaction and seismicity rate might
reflect increasing shear stress within the reservoir.
In this regard, it is surprising to us that apparently
little has been done to measure the orientation and
magnitude of the stress. This would seem to us to
be a key component of a comprehensive geo-
mechanically-based earthquake source model.
In the first 5 decades of the field lifetime, little was done on stress measurements. From the time onwards that induced seismicity became a serious issue, NAM used every opportunity to collect additional data on stress value and direction in new wells. A follow up is proposed to collect data in existing wells as documented in this study and acquisition plan. Any new information will be used as an input to the geomechanical models that are in place since 2013. An initiate to in situ determine orientation and magnitude of stress is included in this plan.
In situ stress measurement
Chapter 8

Study and Data Acquisition Plan Induced Seismicity in Groningen - Winningsplan 2016
143
Reviewer Recommendation Incorporation of recommendation in “Study and Data Acquisition Plan”
Section in “Study and Data Acquisition Plan”
US Geological
Survey (USGS)
(Bill Ellsworth
and Art McGarr)
Recommendation 3: Improved earthquake
detection and location may also provide critical
information needed to identify seismically-
activated faults and their relation to pre-existing
structures. This is vital work. Association of
seismicity with faults that extend downward into
the carboniferous would raise concerns in our
minds that rupture could extend below the
reservoir, substantially increasing the maximum
possible magnitudes of induced earthquakes.
In recent years NAM has invested in additional seismic monitoring. For instance, the geophone and accelerometer network has been expanded and deep seismic monitoring wells have been drilled. Additionally, the structural model of the faults in the Groningen field has been improved. Methods to better determine the hypocentre of earthquakes have been developed both as part of the NAM-led study effort and in KNMI. The study and Data Acquisition Plan contains a feasibility studies into options for further seismic data gathering to better image carboniferous faulting and studies to improve the hypocentre determination. Both these activities should allow for more precise location of the rupture on the faults.
Extension Geophone Network (Currently implemented) Chapter 3 and (Future Plans): Chapter 8.
Location determination: Chapter 8
Feasibility imaging Carboniferous: Chapter 6.
US Geological
Survey (USGS)
(Bill Ellsworth
and Art McGarr)
Recommendation 4: The development of ground
motion equations (GMPEs) for unobserved
earthquakes in the unusual setting of the
Groningen region incorporates an extensive suite
of geophysical and geotechnical measurements
into the development of both the reference rock
ground motions and the spatially detailed site
amplification functions. The resulting model is as
detailed as any that we are familiar with and
represents a significant step forward in
developing a comprehensive, geologically-based,
site-specific GMPE. Considerable attention is
paid throughout the development of the model to
uncertainty, ultimately needed in the PSHA to
capture the epistemic uncertainty in hazard. As
with any model of this complexity, there will be
an ongoing need to test its predictions against
prospective data, as they become available.
Future updates of the GMPE model are planned. This includes testing and incorporating the large volume of additional seismic data becoming available after each seismic event from the extension of the KNMI geophone network and the TNO building sensors.
Extension Geophone Network (Currently implemented) Chapter 3 and (Future Plans): Chapter 8.
Development GMPE: Chapter 9.

Study and Data Acquisition Plan Induced Seismicity in Groningen - Winningsplan 2016
144
Reviewer Recommendation Incorporation of recommendation in “Study and Data Acquisition Plan”
Section in “Study and Data Acquisition Plan”
US Geological
Survey (USGS)
(Bill Ellsworth
and Art McGarr)
Recommendation 5: The resulting reference
ground motions surprise us as being rather modest
for earthquakes with magnitudes in the range of
interest at short epi-central distances based on a
comparison with recorded geometric mean peak
ground acceleration (PGA) values with the recent
GMPE for induced earthquakes proposed by
Atkinson (2015) developed for earthquakes
induced in the central U.S..
We do not claim that induced earthquakes in the
central U.S. have the same source spectra as
earthquakes of comparable magnitude that might
someday occur in the Groningen field. But we can
find no valid reason for rejecting them out of
hand either. Consequently we caution that when
model epistemic uncertainty bounds are
inconsistent with data for earthquakes that are
nominally similar, but induced by other processes.
It is important to understand why the ground
motion models for the Groningen field are so
much lower than for their counterparts in the
central U.S.
Based on the advice SodM has instructed (see Expectation Letter and Technical Addendum to the Winnimgsplan 2016) the use of specific weights on the logic tree for the assessment of mean hazard. A short report will be prepared describing the results of the recent GMPE and contrasting these with the results of the Atkinson (2015) paper.
Development GMPE: Chapter 9.
US Geological
Survey (USGS)
(Bill Ellsworth
and Art McGarr)
Recommendation 6: The questions we have asked
about the new GMPEs suggests to us the need for
additional research to improve the model,
especially if it turns out that much larger
magnitude earthquakes may need to be taken into
consideration. If so, then it may be necessary to
employ state-of-the art methods for synthesizing
finite ruptures in place of point source models.
We fully support this recommendation and our plans for further studies into the GMPE include studies into wave field based Event Characterisation that will address finite ruptures.
Development GMPE: Chapter 9.

Study and Data Acquisition Plan Induced Seismicity in Groningen - Winningsplan 2016
145
Reviewer Recommendation Incorporation of recommendation in “Study and Data Acquisition Plan”
Section in “Study and Data Acquisition Plan”
US Geological
Survey (USGS)
(Bill Ellsworth
and Art McGarr)
Recommendation 7: Recent work shows that, at
least for one high quality data set, the 1980
spectral model of Boatwright fits the spectral
shape of the data significantly better than Brune’s
1970 model.
Boatwright’s model has a sharper corner than
Brune’s model and as a consequence radiates
more energy near the corner for the same seismic
moment and high-frequency acceleration
asymptote. At the corner, the amplitude is 1 .4
times that of the Brune model (actually sqrt(2)),
and the total radiated energy is greater by a factor
of about 3.25.
Earlier studies by Abercrombie found that both
models fit data equally well, although the data
was not of the same quality. So, at a minimum,
the Boatwright model should be considered as a
candidate for the source spectrum. By considering
only the Brune model, the GMPEs presented by
Bommer et al., may be underestimating the
ground motions.
In response to this comment, Ben Edwards repeated his inversions of the Groningen database (transformed to NU_B) using the Boatwright spectrum instead of the Brune spectrum and compared the misfit of the data to the models.
Note that in the inversion of FAS by KNMI (using Boatwright) and by Ben Edwards (using Brune) very similar results have been obtained and these produce very similar predictions in the forward simulations. As this work has already been completed and is currently being documented, it was not included into the new Study and Data Acquisition Plan.
This recommendation has been investigated and results will be documented in a report.

Study and Data Acquisition Plan Induced Seismicity in Groningen - Winningsplan 2016
146
Appendix F Progress note Groningen Scientific Advisory Committee, 1st December 2015
The Scientific Advisory Committee was installed by the Minister of Economic Affairs.
Their advice to the Minister based of the Hazard and Risk Assessment – Interim Update November 2015, was made public with kamerstuk 33529 - 214 Gaswinning; “Lijst van vragen en antwoorden over Gaswinning Groningen en meerjarenprogramma NCG”.
118 Wie is benaderd een second opinion te doen naar het door NAM uitgevoerde onderzoek van een verantwoord niveau, door middel van een winningsplafond en het versterkingsprogramma van de gebouwen? Wat zijn de uitkomsten van deze second opinion?
Door mij is in 2015 een wetenschappelijke begeleidingscommissie ingesteld met als taak de onderzoeken, die door de NAM worden uitgevoerd in het kader van de ontwikkeling van het Groningen Winningsplan 2016, te begeleiden en te reviewen. Tevens heb ik deze commissie gevraagd de kwaliteit, de volledigheid en de onafhankelijkheid van de resultaten van deze onderzoeken, te bewaken. De commissie bestaat uit nationale en internationale onafhankelijke experts. Een tussenrapportage van de commissie, zoals ik die in december heb ontvangen, is als bijlage bijgevoegd
1.
Both the kamerstuk and the progress note by the Groningen Scientific Advisory Committee can be downloaded using the following link:
http://www.tweedekamer.nl/kamerstukken/detail?id=2016Z00342&did=2016D00734
Copyright © 2022 FDOKUMEN