Joint Acquisition of Essar Steel
34
1 Joint Acquisition of Essar Steel TYO : 5401 OTC : NPSCY(ADR) Dec. 16 th , 2019
-
Upload
khangminh22 -
Category
Documents
-
view
6 -
download
0
Transcript of Joint Acquisition of Essar Steel
1
Joint Acquisitionof Essar Steel
TYO : 5401OTC : NPSCY(ADR)
Dec. 16th, 2019

2
© 2019 NIPPON STEEL CORPORATION All Rights Reserved.
1. Outline of Essar Steel Acquisition
3
© 2019 NIPPON STEEL CORPORATION All Rights Reserved.
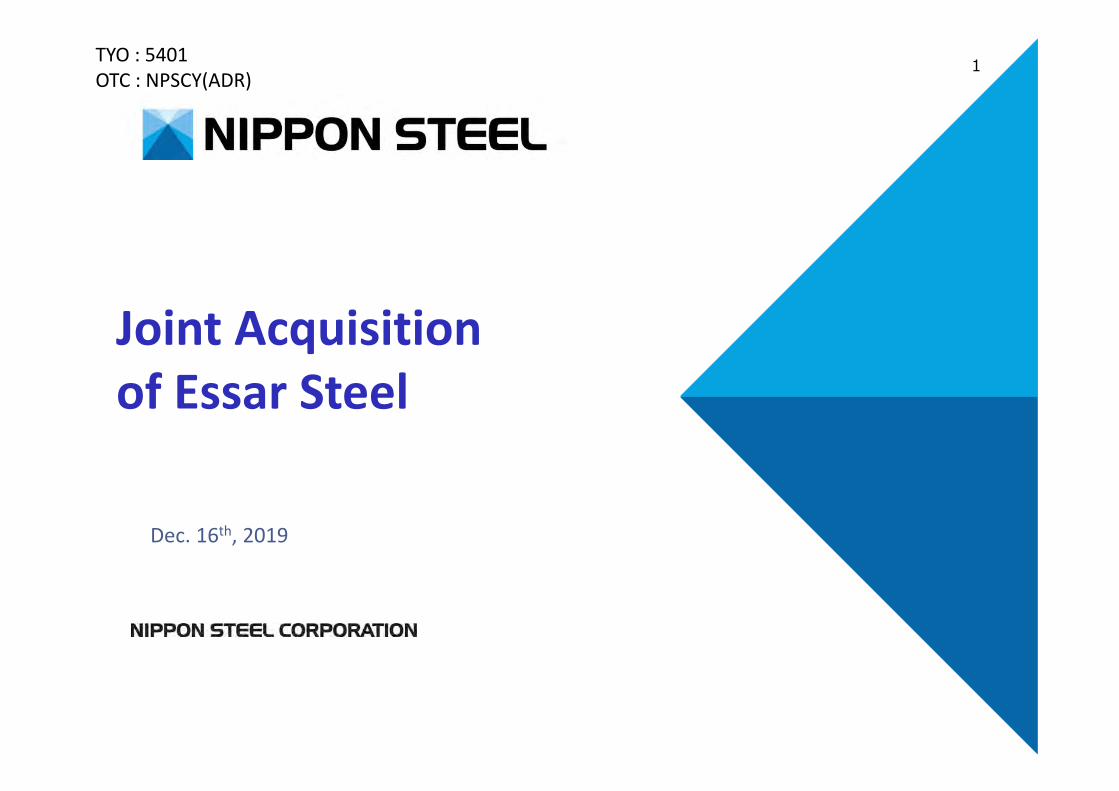
Hazira steel complex

4
© 2019 NIPPON STEEL CORPORATION All Rights Reserved.
Hazira steel complex

5
© 2019 NIPPON STEEL CORPORATION All Rights Reserved.
About Essar Steel
Hazira mill is located in Western India, where many steel buyers are located.
<1MMT1-3MMT3-8MMT>8MMT
VizagPelletization plant
(8MMT/Y)
ParadeepPelletization plant
(6MMT/Y)
KirandulBeneficiation
plant(8MMT/Y)
DabunaBeneficiation plant
(8MMT/Y)
Mumbai
Marine transportation
Delhi
Bhuj
Hazira
Indore
Chennai
Integrated steel mill in Western India; a focal area for investment and economic development
Self-sufficient pellet production in Eastern area Nationwide coverage of service centers in major cities
Establishment1976
Nominal capacity9.6 MMT/Y (crude steel)
Revenue (stand-alone)INR 260.3bn. (Fiscal 2017 ended on March 31, 2018)
Number of employees3,806 (as of March 31, 2018)
Business Scale Locations : Facilities are strategically located
Hazira(Gujarat)
Integrated steel mill
Integrated steel millDownstream facilityBeneficiation plantPipelinePelletization plant Service center
Pune(Maharashtra)
Downstream rerolling plant
Cold-rolling/CGL/Color coating
KolkataIndia’s steel consumption by region

6
© 2019 NIPPON STEEL CORPORATION All Rights Reserved.
Essar Steel : Facilities
* Single site basis
SinteringLine
Legends :(Year of start up)
<Capacity>
BeneficiationKirandul (‘13)Dabuna (‘14)<16MMT/Y>
PelletizationVizag (‘05/’06)Paradeep (‘14)
<14MMT/Y>
Plate mill(‘10) <1.5MMT/Y>
Hot-strip mill(‘95) <4MMT/Y>
Spiral pipe mill(‘96)
<0.3MMT/Y>
Pipeline
JCO pipe mill(‘09)
<0.3MMT/Y>Hot-dip galvanizingin Hazira (‘04/’05)
<0.5MMT/Y>
Pickling, cold-rollingin Hazira (‘04/’05)
<1.4MMT/Y> Color coatingin Pune (‘06)<0.4MMT/Y>
in Pune (‘96/’05)<0.5MMT/Y>
in Pune (‘96/’05)<0.7MMT/Y>
Crude steel production capacity
<9.6MMT/Y>
Hazira ; The 3rd largest* integrated steel mill in India
COREX (‘11/’12)Direct reduction by coal
<1.7MMT/Y>
MIDREX(‘90/’92/’04/’06/’10)Direct reduction by gas
<6.7MMT/Y>
Blast furnace(‘10)<1.7MMT/Y>
Electric arc furnace(‘96/’06/’10)<4.6MMT/Y>
CONARC(‘11) <5MMT/Y>
Thin-slab caster & Hot strip mill(‘11/’18) <3.6MMT/Y>
Eastern area Hazira
Pune

7
© 2019 NIPPON STEEL CORPORATION All Rights Reserved.
4%
48%
14%
12%
8%7%
2%Others
5%
Sales mix*
(INR219.6bn )
Essar Steel : Product Mix
Pellets1.5MMT/Y
Hot-rolled sheets3.1MMT/Y
Cold-rolled sheets0.8MMT/Y
Hot-dip-galvanized sheets
0.6MMT/Y
Color coated sheets0.3MMT/Y
Plates0.4MMT/Y
Tubes & pipes0.1MMT/Y
Fully diversified range of products, mainly flat steel products
* Composition of sales in fiscal year ended in Mar. 2017

8
© 2019 NIPPON STEEL CORPORATION All Rights Reserved.
Summary of the Joint Acquisition
Oct.23, 2017 Nippon Steel and ArcelorMittal respectively submittedEOI (Expression of Interest)
Feb. 12, 2018 First bidding by ArcelorMittalMar. 2, 2018 Nippon Steel and ArcelorMittal executed the
Joint Venture Formation AgreementApr. 2, 2018 Second bidding by ArcelorMittalOct. 25, 2018 The Committee of Creditors selected ArcelorMittal as
the successful applicantNov.15, 2019 The Indian Supreme Court approved the resolution
plan submitted by ArcelorMittalDec.16, 2019 Closing
Timeline
Nippon Steel and ArcelorMittal will jointly manage the JVArcelorMittal Nippon Steel India, working in an equal partnership.
Total cash injection
JV structure
INR 500bn. (approx. JPY 770bn.)
INR 420bn. (approx. JPY 650bn.)→ Repayment of Essar’s existing debts
INR 80bn. (approx. JPY 120bn.) → Cash injection of initial working capital
including capital expenditures
Both companies will nominate the same number of directors for the JV.
ArcelorMittal Nippon Steel India will be managed by both companies as equal partners.
Both companies consolidate ArcelorMittal Nippon Steel India as an equity method affiliate.
Outline of the JVName : ArcelorMittal Nippon Steel IndiaHead office : Hazira, GujaratCEO : Dilip Oommen
Equity method affiliate Equity method affiliate
<60%><40%><Investment ratio>
9
© 2019 NIPPON STEEL CORPORATION All Rights Reserved.
0
10
20
30
40
50
60
'14 '15 '16 '17 '18 '19
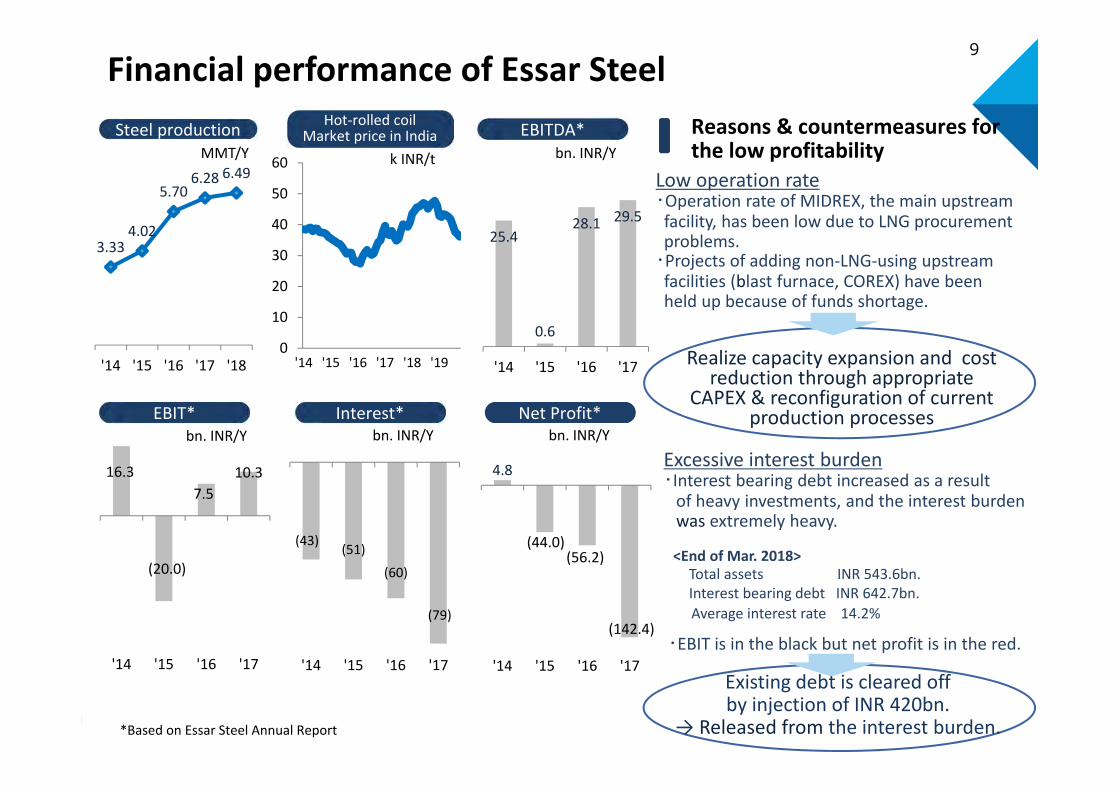
Financial performance of Essar Steel
25.4
0.6
28.1 29.5
'14 '15 '16 '17
16.3 7.5
10.3
'14 '15 '16 '17
EBIT*
EBITDA*
Interest* Net Profit*
Reasons & countermeasures forthe low profitability
Steel production Hot-rolled coilMarket price in India
Low operation rate・Operation rate of MIDREX, the main upstream facility, has been low due to LNG procurement problems.
・Projects of adding non-LNG-using upstream facilities (blast furnace, COREX) have been held up because of funds shortage.
(43) (51)(60)
(79)
'14 '15 '16 '17
4.8
'14 '15 '16 '17
3.33 4.02
5.70 6.28 6.49
'14 '15 '16 '17 '18
(44.0)(56.2)
(142.4)
Excessive interest burden・Interest bearing debt increased as a result
of heavy investments, and the interest burden was extremely heavy.
Realize capacity expansion and cost reduction through appropriate
CAPEX & reconfiguration of current production processes
<End of Mar. 2018>Total assets INR 543.6bn.Interest bearing debt INR 642.7bn.Average interest rate 14.2%
・EBIT is in the black but net profit is in the red.
(20.0)
Existing debt is cleared off by injection of INR 420bn.
→ Released from the interest burden.
MMT/Y
bn. INR/Ybn. INR/Ybn. INR/Y
k INR/t bn. INR/Y
*Based on Essar Steel Annual Report

10
© 2019 NIPPON STEEL CORPORATION All Rights Reserved.
Resolution Plan Realize capacity expansion and productivity
improvement through appropriate CAPEX
・Productivity improvement via completion of ongoing CAPEX projects
The ongoing CAPEX projects :coke oven, CSP (Compact Strip Production),Dabuna beneficiation plant, Paradeep pellet, environment investment, etc.
・Capacity expansion via CAPEX for upstream facilities (expansion of capacity to the full potential)
Expected future CAPEX projects:blast furnace, coke oven, and oxygen furnace
There is also a long-term aspiration to increase the steel production volume to 12〜15MMT/Y* through large scale CAPEX.
Examine further details of CAPEX considering business environment.
5.78.5
12
15
2016 Medium-termplan
Long-term aspiration
MMT/Y
Steel production volume
Potential capacity=8.5MMT/Y
6.5
2018
~~
*Considering the possibility of further expansion

11
© 2019 NIPPON STEEL CORPORATION All Rights Reserved.
Impacts on Nippon Steel’s Financial Statements
Debt payment: approx. JPY 310.0bn. (INR 500.0bn. X 40% = INR 200.0bn.)Equity : approx. JPY 103.0bn. (JPY 310.0bn. X 1/3)Inter-company loan: approx. JPY 207.0bn. (JPY 310.0bn. X 2/3)
Dec. 11 Payment completed
ArcelorMittal Nippon Steel India’s profit and losses generated in Jan. - Mar., 2020 will be counted in Nippon Steel’s FY2020.1Q (Apr. - Jun.) consolidated accounting as an equity method affiliate.
Cash flows
Balance sheet
Profit & loss
Investment / Loan to the JV appear in our consolidated B/S at the end of Dec. 2019Fund procurement: Public hybrid bonds*1 issued in Sep. 2019D/E ratio forecast (Mar. 2020): 0.8-0.9
0.65-0.75 (adjusted D/E*2)*1 50% of the funds is deemed as equity credit for the purpose of agencies’ rating.
*2 Equity credits of hybrid bonds and loans are taken into consideration.
The amount and accounting procedure of goodwill will be examined in the days ahead.
(estimated as of Nov.1, 2019)
12
© 2019 NIPPON STEEL CORPORATION All Rights Reserved.
2. The Benefits of Investment
13
© 2019 NIPPON STEEL CORPORATION All Rights Reserved.
590
132
100 158
0
200
400
600
'85 '90 '95 '00 '05 '10 '15 '20 '25 '30
Kg/YChina
(Cf. Japan 514)
ASEAN5Brazil
India
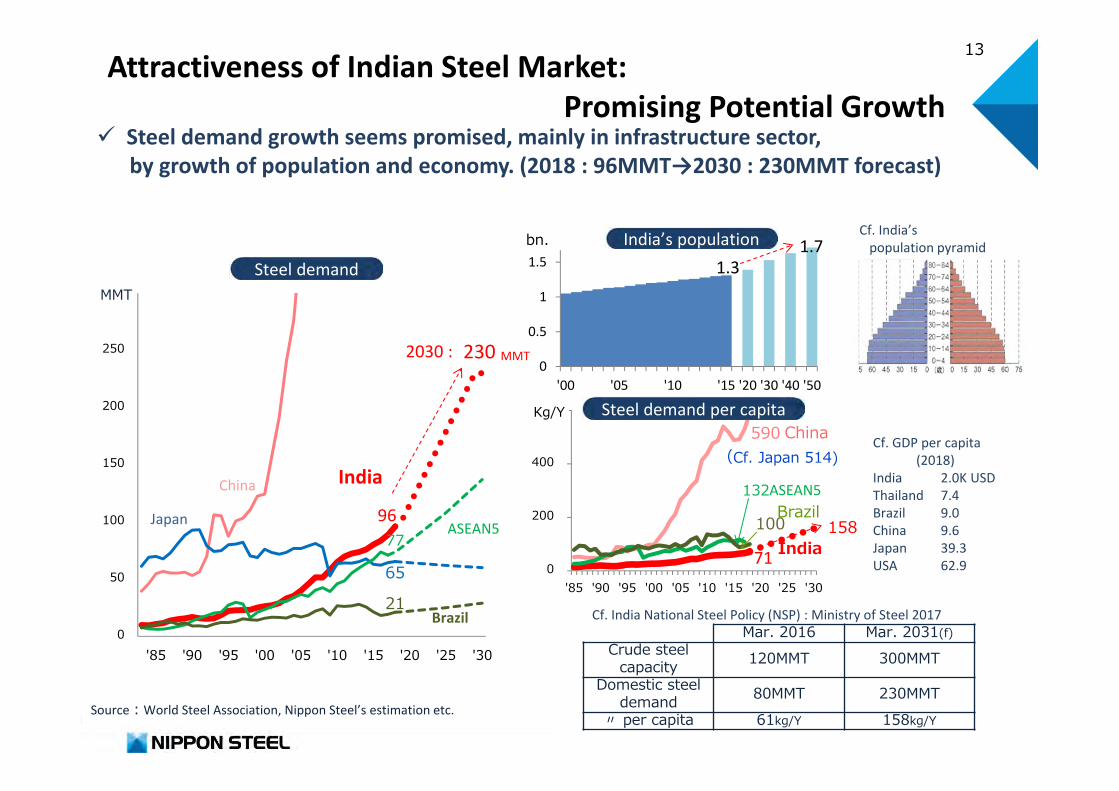
Attractiveness of Indian Steel Market: Promising Potential Growth
230
65
77
21 0
50
100
150
200
250
300
'85 '90 '95 '00 '05 '10 '15 '20 '25 '30
MMT
China
ASEAN5Japan
India
Brazil
Steel demand per capita
Steel demand
Mar. 2016 Mar. 2031(f)Crude steel
capacity 120MMT 300MMTDomestic steel
demand 80MMT 230MMT〃 per capita 61kg/Y 158kg/Y
1.3 1.7
0
0.5
1
1.5
'00 '05 '10 '15 '20 '30 '40 '50
bn. India’s population
Cf. India National Steel Policy (NSP) : Ministry of Steel 2017
Cf. GDP per capita(2018)
IndiaThailandBrazilChinaJapanUSA
Cf. India’s population pyramid
Steel demand growth seems promised, mainly in infrastructure sector,by growth of population and economy. (2018 : 96MMT→2030 : 230MMT forecast)
MMT 2030 :
2.0K USD7.49.09.639.362.9
Source︓World Steel Association, Nippon Steel’s estimation etc.
96
71
14
© 2019 NIPPON STEEL CORPORATION All Rights Reserved.
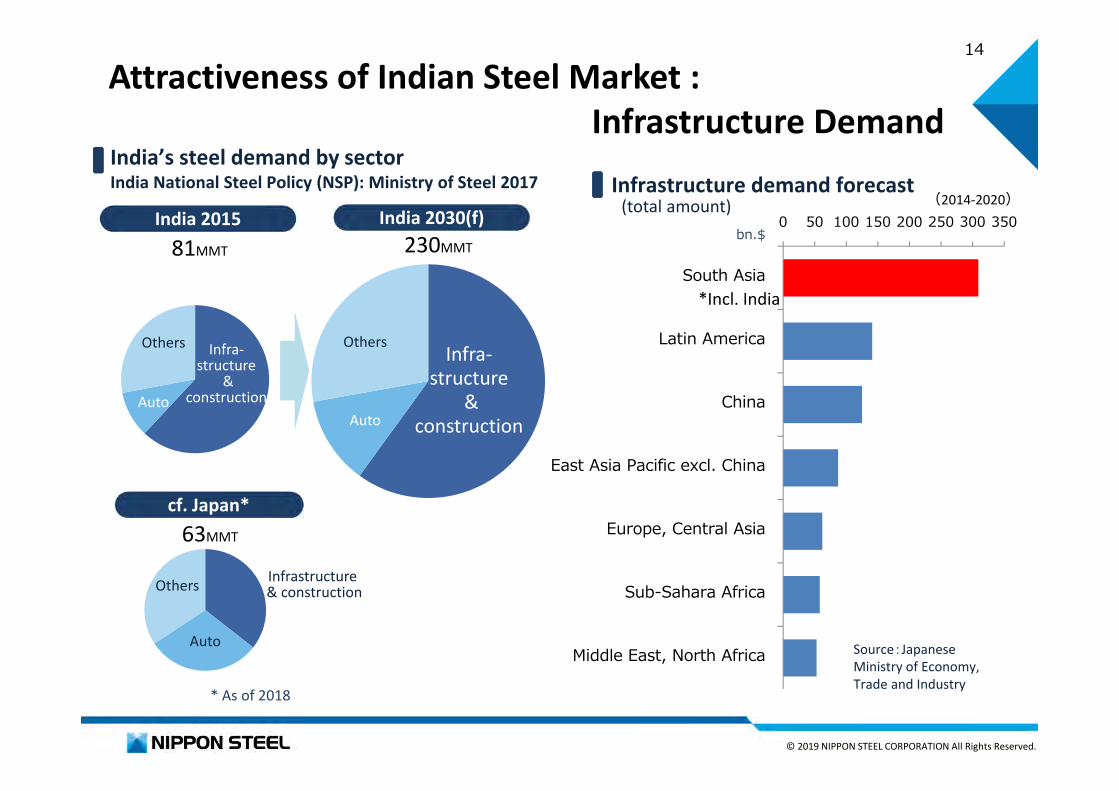
Attractiveness of Indian Steel Market :Infrastructure Demand
Others
Auto
India 2015 India 2030(f)
India’s steel demand by sectorIndia National Steel Policy (NSP): Ministry of Steel 2017
Others
0 50 100 150 200 250 300 350
South Asia
Latin America
China
East Asia Pacific excl. China
Europe, Central Asia
Sub-Sahara Africa
Middle East, North Africa
bn.$
(2014-2020)
Auto
Infrastructure demand forecast
cf. Japan*
81MMT 230MMT
Infra-structure
& construction
Infra-structure
& construction
63MMT
Infrastructure& construction
Auto
Others
Source:JapaneseMinistry of Economy,Trade and Industry
* As of 2018
*Incl. India
(total amount)
15
© 2019 NIPPON STEEL CORPORATION All Rights Reserved.
28 40
65
89 96
0
20
40
60
80
100
2000 2005 2010 2017 2018
Imports
Domesticproducts
MMT/Y
Domestic demand
10%
90%
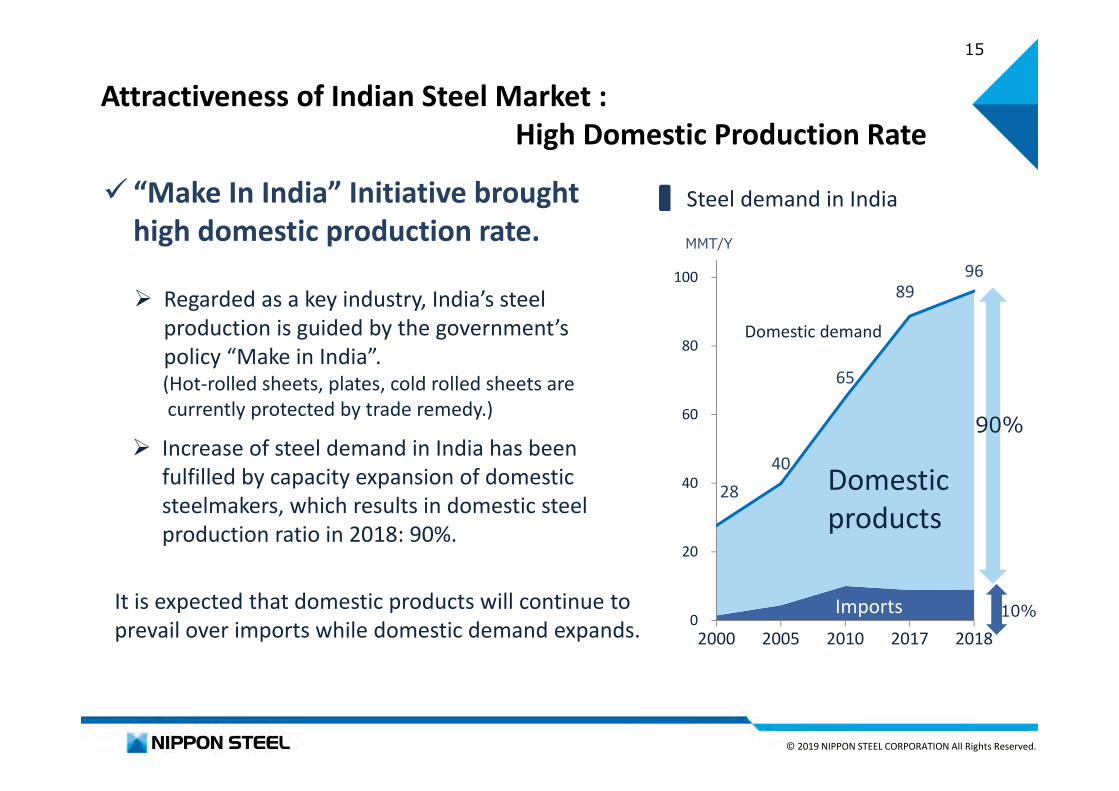
Steel demand in India
It is expected that domestic products will continue to prevail over imports while domestic demand expands.
Regarded as a key industry, India’s steel production is guided by the government’s policy “Make in India”.(Hot-rolled sheets, plates, cold rolled sheets are currently protected by trade remedy.)
Increase of steel demand in India has been fulfilled by capacity expansion of domestic steelmakers, which results in domestic steel production ratio in 2018: 90%.
“Make In India” Initiative brought high domestic production rate.
Attractiveness of Indian Steel Market : High Domestic Production Rate
16
© 2019 NIPPON STEEL CORPORATION All Rights Reserved.
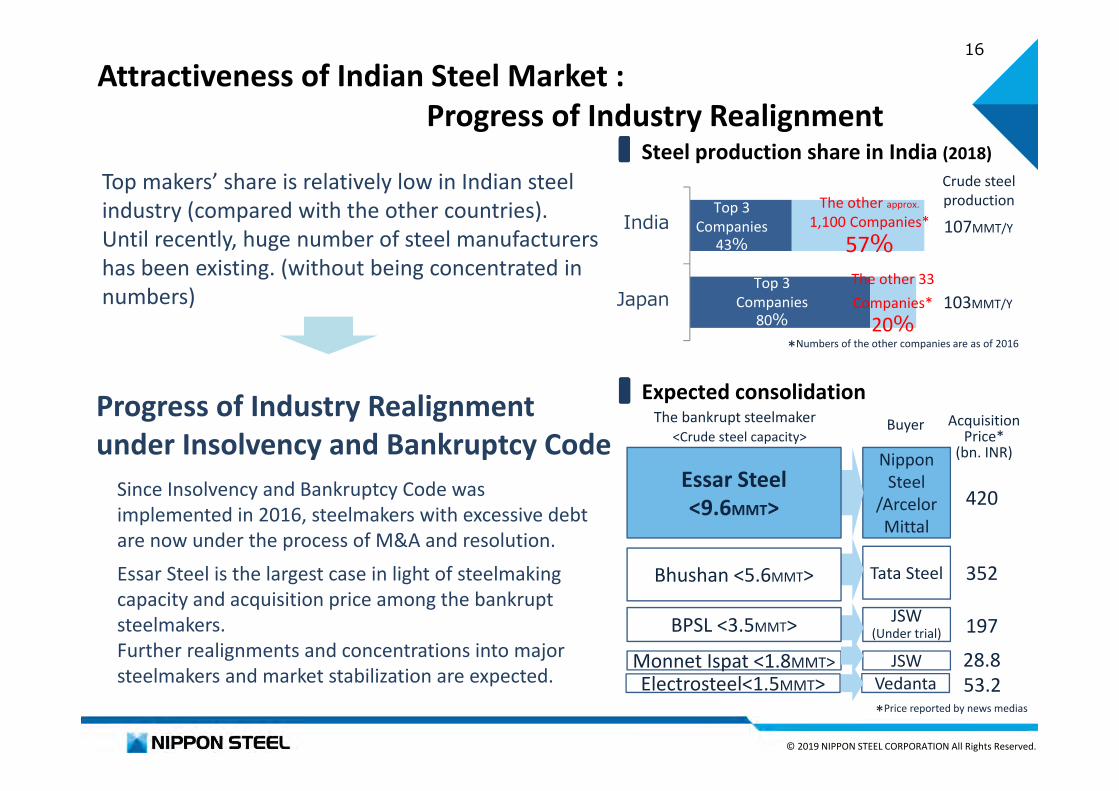
Attractiveness of Indian Steel Market :Progress of Industry Realignment
Steel production share in India (2018)
Progress of Industry Realignment under Insolvency and Bankruptcy Code
Since Insolvency and Bankruptcy Code was implemented in 2016, steelmakers with excessive debt are now under the process of M&A and resolution.Essar Steel is the largest case in light of steelmaking capacity and acquisition price among the bankrupt steelmakers.Further realignments and concentrations into major steelmakers and market stabilization are expected.
Expected consolidation
<Crude steel capacity>
Tata Steel
NipponSteel
/ArcelorMittal
JSW(Under trial)
JSW
Bhushan <5.6MMT>
Essar Steel<9.6MMT>
BPSL <3.5MMT>
Monnet Ispat <1.8MMT>
Buyer
VedantaElectrosteel<1.5MMT>
The bankrupt steelmaker
420
352
19728.853.2
AcquisitionPrice*
(bn. INR)
Japan
India
The other 33 Companies*
20%
The other approx.
1,100 Companies*57%
Top 3 Companies
43%
Top 3 Companies
80%
Crude steelproduction
107MMT/Y
103MMT/Y
Top makers’ share is relatively low in Indian steel industry (compared with the other countries).Until recently, huge number of steel manufacturers has been existing. (without being concentrated in numbers)
*Price reported by news medias
*Numbers of the other companies are as of 2016

17
© 2019 NIPPON STEEL CORPORATION All Rights Reserved.
Acquisition and utilization of sites for new steelworks is not easy in India.
(Some projects of new steelworks construction took long timeto get started or cancelled in the past)Cf. Indian company A︓Took 10 years to start its operation
Foreign company B︓Resulted in withdrawal from the newsteelworks project before starting construction
Major steel-makers in India have been generating relatively high profits.
0.82.3
1.2
3.0
72%
85%
0
1
2
3
4
Domesticdemand
CrudeSteel
Capacity
Domesticdemand
CrudeSteel
Capacity2016 2030
Domestic demand/Capacity*
Forecast of S&D balance(2017 India National Steel Policy)
In case steel production capacity expansion does not fully cover growing demand,supply-demand balance will be tightened.
Indian major steel-makers’ ROS(EBIT/net sales)
0%
10%
20%
30%Tata Steel
JSW
SAIL
* demand: product, capacity: crude steel ×90%
(Indian national steel policy expects certain level of supply and demand tightening. )
Attractiveness of Indian Steel Market : Supply and Demand

18
© 2019 NIPPON STEEL CORPORATION All Rights Reserved.
Advantage of Joint Acquisition of Essar SteelValue investment in acquiring an integrated steel mill
Brown field acquisition enables early return
Partnership with ArcelorMittal, Nippon Steel’s long-time business partner, which has abundant experience in business re-construction
No procedures for land acquisition or environmental permit requiredMinimal risks for construction and start-up of facilitiesAvailability of using existing human resources, sales networks and assets
The amount of investment per crude steel production capacity is relatively low.
0
50
100
150
200
A(India)
B(India)
C D
K JPY/t
Green field caseBrown field case
INR 500 bn./9.60MMT= INR 52 k/t = 730$/t = JPY 80 k/t
19
© 2019 NIPPON STEEL CORPORATION All Rights Reserved.
ConclusionAttractiveness of Indian Steel Market✓Promising Demand Growth Potential ✓High Domestic Production Ratio✓Progress of Steelmakers’ Realignment ✓Supply and Demand TighteningAdvantage of Joint Acquisition of Essar Steel
In order to capturepromised growth of steel demand in India,
Nippon Steel has acquired Essar Steel, taking advantage of an opportunity of the industrial restructuring
⇒ Enters Indian market and aims to expand production as an insider

20
© 2019 NIPPON STEEL CORPORATION All Rights Reserved.
Appendix(Our Global Strategy)

21
© 2019 NIPPON STEEL CORPORATION All Rights Reserved.
World’s Steelmaking Industry and Our Global Strategy– Becoming an Insider of Growing Markets
Source: World Steel Association, Nippon Steel estimate
0.8
1.0
1.41.5 1.6 1.7
0.0
0.5
1.0
1.5
2.0
2000 2005 2011 2016 2017 2018
Export
Domestic consumption
Steel ProductionBn. ton/Y
(Excl.semi-product)
World’s Steel Production by destination
Steel is a basic material for all industries. The demand growth in each area was covered by
imports in an early stage of economic development, then domestic steelmaking industry developed under national policy and covered domestic demand in later stage.
As a result, top-makers’ shares in world steel market are lower than those in other industries. (Each countryor area has its domestic steelmakers respectively.)
Steelmaking is a huge local industry.
Demand growth and further domestic production in emerging countries.
Production/Sales Sharesin Global Industries
35%
35%
12%
24%
43%
14%
42%
22%
73%
Semi-conductor
Automobile
Steelproduction(Crude steel)
(Units sold)
(Net sales)
Top 3 4-10th 11th and under
Being an insider is the key to capturing demand growth in emerging countries.
World’s steel demand expansion is driven by emergingcountries, and demands in emerging countries are highly fulfilled by their domestic production expansion.

22
© 2019 NIPPON STEEL CORPORATION All Rights Reserved.
Nippon Steel’s Global Strategy
On our view of the supply-demand trend in each area,
supported by worldwide customer networkNippon Steel promotes
the best suited business model in each area
Difficulty of export(Shift to domestic
production)
Market size &growth potential
Local customers’ demand
Japanese customers’local production
Difficulty of new entry to the market

23
© 2019 NIPPON STEEL CORPORATION All Rights Reserved.
Nippon Steel’s Global Strategy -ASEAN-
Establishedsupply network of Japanese quality
high-grade products in ASEAN countries.
Japanese customers’
local production
Slow movement for domestic production(enables semi-product
supply from Japan)
Steel production capacityIn ASEAN 5.5MMT/Y
AutoEnergy & Resources
Infrastructure
Home appliances, containers
Nippon Steel builds local production bases of downstream process, which control quality and distribution.Semi-products are supplied from Japan to the downstream mills in ASEAN countries.
24
© 2019 NIPPON STEEL CORPORATION All Rights Reserved.
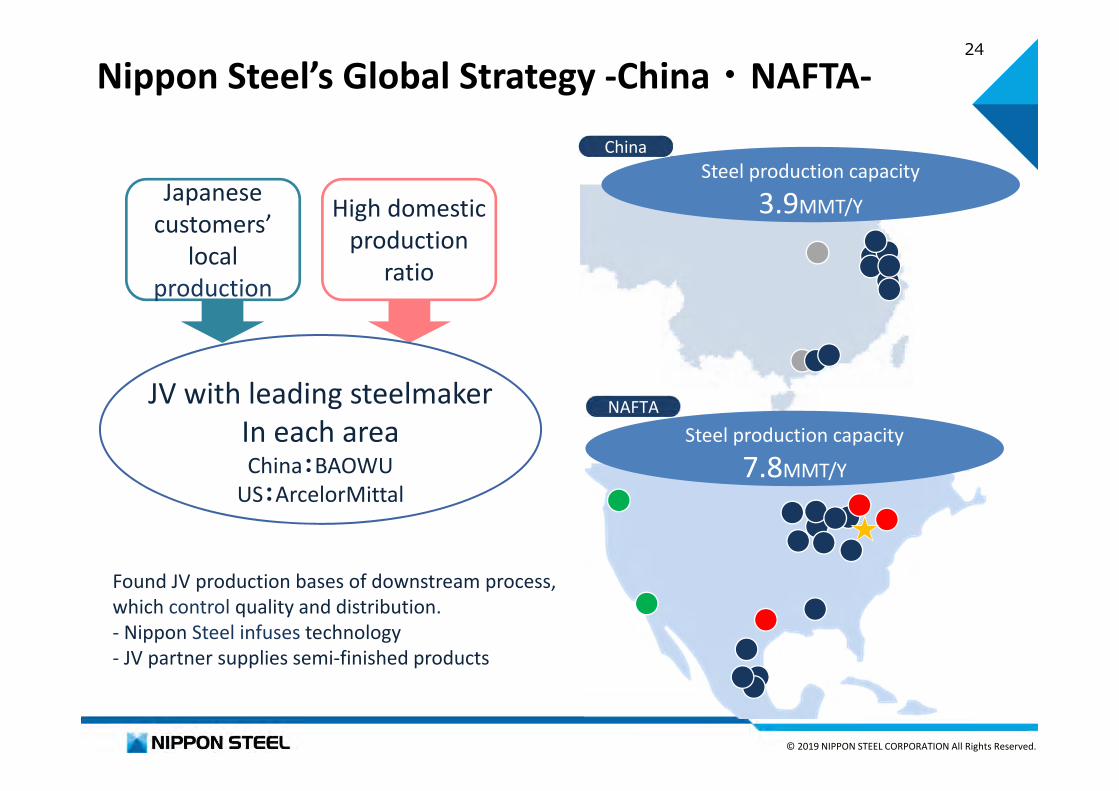
Nippon Steel’s Global Strategy -China・NAFTA-
Japanese customers’
local production
High domestic production
ratio
JV with leading steelmakerIn each area China:BAOWU
US:ArcelorMittal
Steel production capacity3.9MMT/Y
China
NAFTASteel production capacity
7.8MMT/Y
Found JV production bases of downstream process, which control quality and distribution.- Nippon Steel infuses technology- JV partner supplies semi-finished products
25
© 2019 NIPPON STEEL CORPORATION All Rights Reserved.
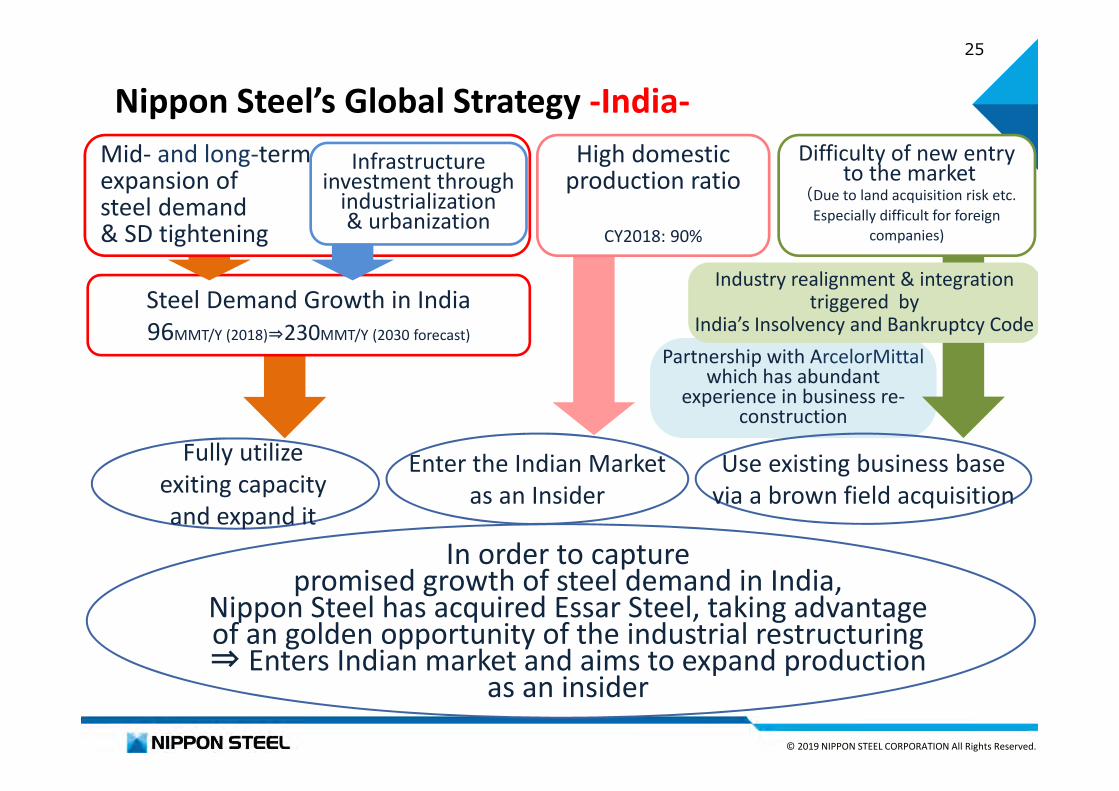
Partnership with ArcelorMittalwhich has abundant
experience in business re-construction
Fully utilizeexiting capacityand expand it
Steel Demand Growth in India96MMT/Y (2018)⇒230MMT/Y (2030 forecast)
In order to capturepromised growth of steel demand in India,
Nippon Steel has acquired Essar Steel, taking advantage of an golden opportunity of the industrial restructuring⇒ Enters Indian market and aims to expand production
as an insider
Nippon Steel’s Global Strategy -India-Mid- and long-termexpansion ofsteel demand& SD tightening
Infrastructure investment through
industrialization& urbanization
Use existing business basevia a brown field acquisition
Enter the Indian Marketas an Insider
High domestic production ratio
CY2018: 90%
Industry realignment & integrationtriggered by
India’s Insolvency and Bankruptcy Code
Difficulty of new entryto the market
(Due to land acquisition risk etc.Especially difficult for foreign
companies)
26
© 2019 NIPPON STEEL CORPORATION All Rights Reserved.
***
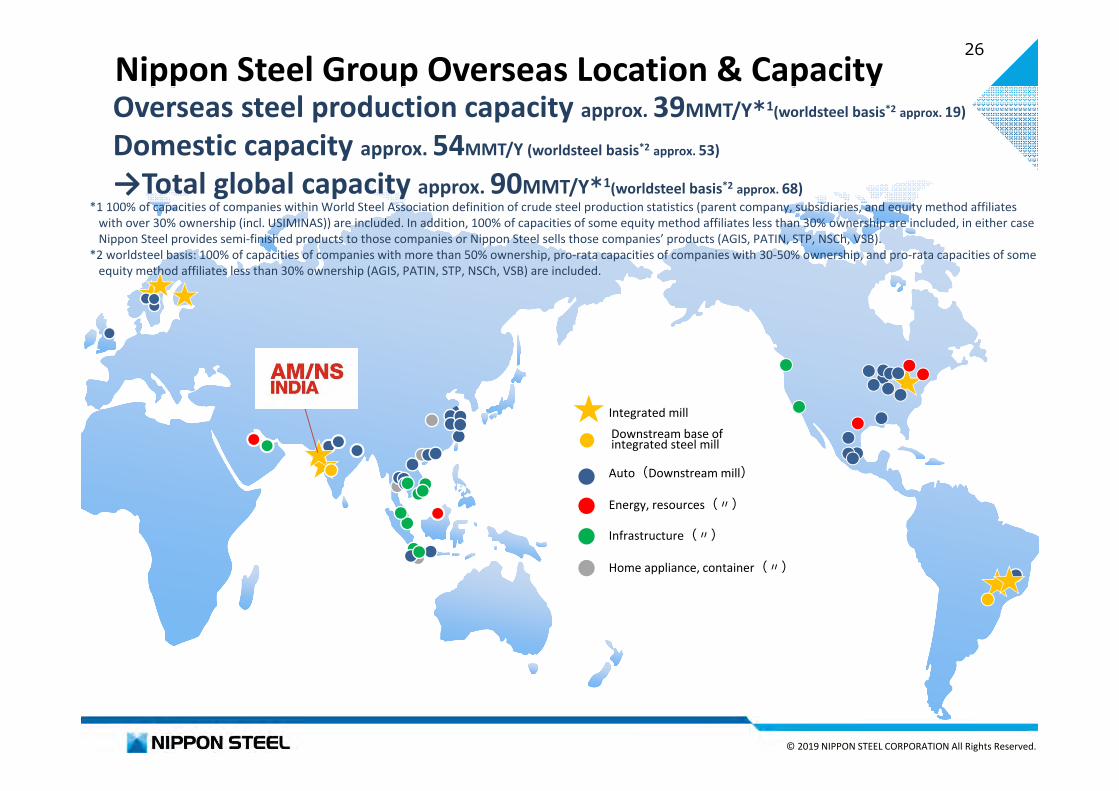
*1 100% of capacities of companies within World Steel Association definition of crude steel production statistics (parent company, subsidiaries, and equity method affiliateswith over 30% ownership (incl. USIMINAS)) are included. In addition, 100% of capacities of some equity method affiliates less than 30% ownership are included, in either caseNippon Steel provides semi-finished products to those companies or Nippon Steel sells those companies’ products (AGIS, PATIN, STP, NSCh, VSB).
*2 worldsteel basis: 100% of capacities of companies with more than 50% ownership, pro-rata capacities of companies with 30-50% ownership, and pro-rata capacities of some equity method affiliates less than 30% ownership (AGIS, PATIN, STP, NSCh, VSB) are included.
Nippon Steel Group Overseas Location & CapacityOverseas steel production capacity approx. 39MMT/Y*1(worldsteel basis*2 approx. 19)
Domestic capacity approx. 54MMT/Y (worldsteel basis*2 approx. 53)
→Total global capacity approx. 90MMT/Y*1(worldsteel basis*2 approx. 68)
Auto(Downstream mill)
Energy, resources(〃)
Infrastructure(〃)
Home appliance, container(〃)
Integrated millDownstream base of integrated steel mill
27
© 2019 NIPPON STEEL CORPORATION All Rights Reserved.
Appendix
28
© 2019 NIPPON STEEL CORPORATION All Rights Reserved.
Overseas
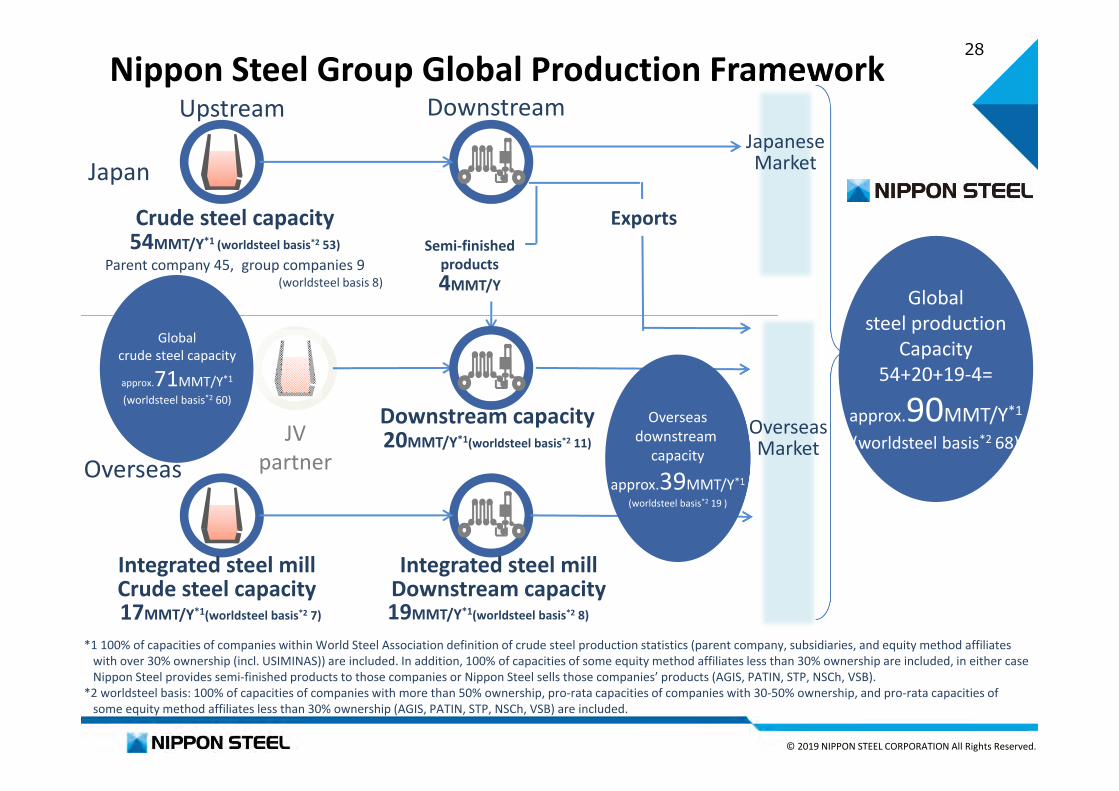
Nippon Steel Group Global Production Framework
Globalsteel production
Capacity54+20+19-4=
approx.90MMT/Y*1
(worldsteel basis*2 68)Overseas
downstream capacity
approx.39MMT/Y*1
(worldsteel basis*2 19 )
【 】
Globalcrude steel capacity
approx.71MMT/Y*1
(worldsteel basis*2 60)
Downstream
Japan
Upstream
JVpartner
Crude steel capacity54MMT/Y*1 (worldsteel basis*2 53)
Parent company 45, group companies 9(worldsteel basis 8)
Integrated steel millCrude steel capacity
Semi-finishedproducts4MMT/Y
Downstream capacity20MMT/Y*1(worldsteel basis*2 11)
Exports
Integrated steel millDownstream capacity
JapaneseMarket
OverseasMarket
17MMT/Y*1(worldsteel basis*2 7) 19MMT/Y*1(worldsteel basis*2 8)
*1 100% of capacities of companies within World Steel Association definition of crude steel production statistics (parent company, subsidiaries, and equity method affiliateswith over 30% ownership (incl. USIMINAS)) are included. In addition, 100% of capacities of some equity method affiliates less than 30% ownership are included, in either caseNippon Steel provides semi-finished products to those companies or Nippon Steel sells those companies’ products (AGIS, PATIN, STP, NSCh, VSB).
*2 worldsteel basis: 100% of capacities of companies with more than 50% ownership, pro-rata capacities of companies with 30-50% ownership, and pro-rata capacities of some equity method affiliates less than 30% ownership (AGIS, PATIN, STP, NSCh, VSB) are included.
29
© 2019 NIPPON STEEL CORPORATION All Rights Reserved.
*
IntegratedMill
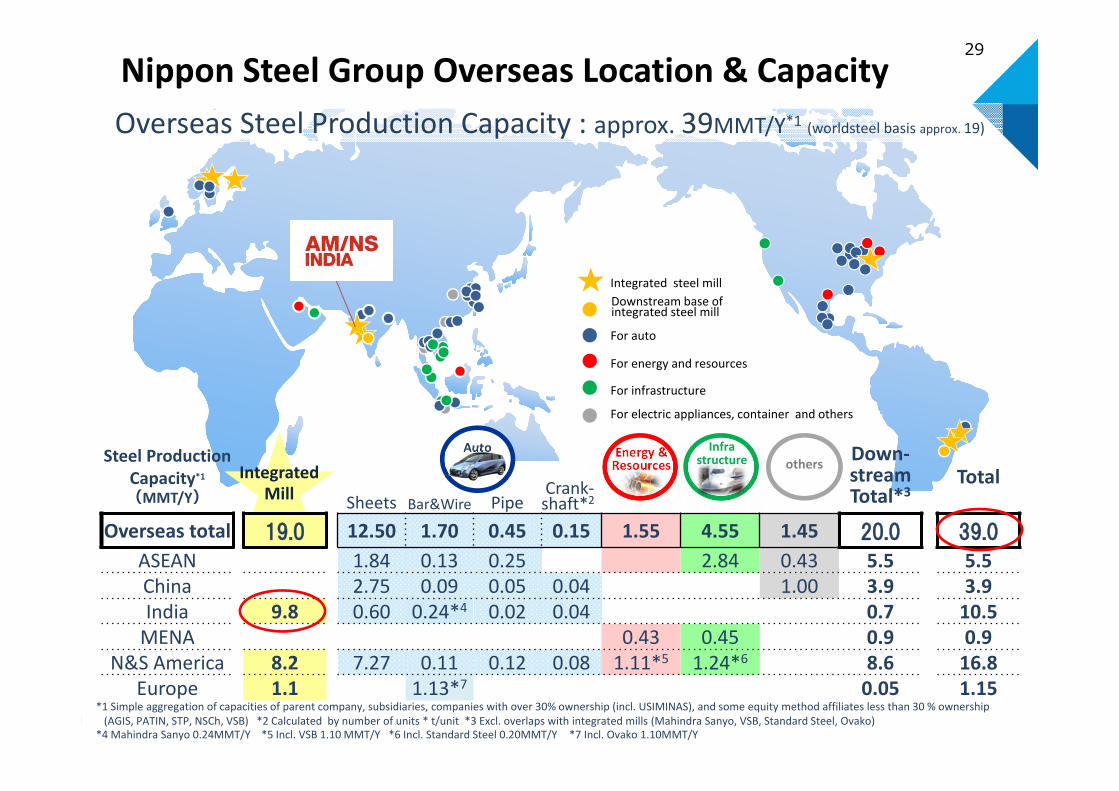
*1 Simple aggregation of capacities of parent company, subsidiaries, companies with over 30% ownership (incl. USIMINAS), and some equity method affiliates less than 30 % ownership(AGIS, PATIN, STP, NSCh, VSB) *2 Calculated by number of units * t/unit *3 Excl. overlaps with integrated mills (Mahindra Sanyo, VSB, Standard Steel, Ovako)
*4 Mahindra Sanyo 0.24MMT/Y *5 Incl. VSB 1.10 MMT/Y *6 Incl. Standard Steel 0.20MMT/Y *7 Incl. Ovako 1.10MMT/Y
For auto
For energy and resources
For infrastructure
For electric appliances, container and others
Integrated steel mill
Auto Energy &Resources others
Infrastructure
Overseas Steel Production Capacity : approx. 39MMT/Y*1 (worldsteel basis approx. 19)
Nippon Steel Group Overseas Location & Capacity
Steel Production Capacity*1
(MMT/Y)
Down-streamTotal*3
TotalSheets Bar&Wire Pipe
Crank-shaft*2
Overseas total 19.0 12.50 1.70 0.45 0.15 1.55 4.55 1.45 20.0 39.0
ASEAN 1.84 0.13 0.25 2.84 0.43 5.5 5.5China 2.75 0.09 0.05 0.04 1.00 3.9 3.9India 9.8 0.60 0.24*4 0.02 0.04 0.7 10.5
MENA 0.43 0.45 0.9 0.9N&S America 8.2 7.27 0.11 0.12 0.08 1.11*5 1.24*6 8.6 16.8
Europe 1.1 1.13*7 0.05 1.15
Downstream base of integrated steel mill

30
© 2019 NIPPON STEEL CORPORATION All Rights Reserved.
Nippon Steel Group Major Production Bases in ASEAN
Company Sector Products CapacityMMT/Y Investment ratio, partner
(1) 1963 NSPT Auto Pipe 0.16
(2) 1988 STP* Container Tinplate 0.27
(3) 1995 NS-SUS Auto Sheets 1.36
(4) 1997 NSSPT Auto Bar&Wire 0.10
(5) 1997 VNSP Auto Pipe 0.05
(6) 2005 INSP Auto Pipe 0.04
(7) 2006 N-EGALV Infra-structure Sheet 0.12
(8) 1982 LATINUSA Container Tinplate 0.16 Krakatau
(9) 2009 CSVC Infra-structure Sheets 1.20 CSC
(10) 2010 NPV Infra-structure Pipe 0.06
(11) 1974 TSW Auto Bar&Wire 0.02
(12) 2012 KNSS Auto Sheets 0.48 Krakatau
(13) 2013 NSBS Infra-structure Sheets 0.96 Bluescope
(14) 2015 VAM®BRN Energy Pipe Vallourec
(15) 2017 KOS Infra-structure Shapes 0.50 Krakatau
Steel ProductionCapacity in ASEAN
5.5MMT/Y
58%16%80%
59%60%
90%
76%
80%50%60%80%
35%
16%
30%
ASEAN
51%
1 3
14
15
13
13
8
2 4
5
6
7
9 10
1213
13
11
51%
60%
* Important base to which Nippon Steel provides semi-finished products therefore is added to Nippon Steel Group’s steel production capacity on worldsteel basis.

31
© 2019 NIPPON STEEL CORPORATION All Rights Reserved.
Nippon Steel Group Major Production Bases in ChinaCompany Sector Products Capacity
MMT Investment ratio, partner(1) 1994 PATIN* Container Tinplate 0.20(2) 2001 NSSP Auto Bar & Wire
(3) 2003 Huizhou Nippon Steel Forging Auto Crankshaft 2.10
M. Units
(4) 2003 NSPG Auto Pipe 0.02(5) 2004 BNA Auto Sheets 2.62 BAOWU(6) 2004 NSPW Auto Pipe 0.02(7) 2006 Suzuki Garphyttan Auto Bar & Wire 0.01(8) 2011 WINSteel Container Tinplate 0.80 BAOWU(9) 2013 NSCh* Auto Bar & Wire 0.04 Matsubishi Metal
(10) 2013 Nisshin Nantong High-Tech Sheet Auto Sheets 0.01
(11) 2014 ZNW Auto SpecialtySteel 0.12
66%50%71%
50%
55%
25%
25%
Steel ProductionCapacity in China
3.9MMT/Y
Company Country Sector Products CapacityMMT Investment ratio
(1) 1980 NPC Saudi Arabia Energy Pipe 0.45
(2) 2005 AGIS* UAE Infra-structure Sheets 0.45 20%
51%
China
Middle East
Steel ProductionCapacity in Middle East
0.9MMT/Y
89%
12
1
8
4 3
7 911
1056
2
60%
100%
90%
* Important bases to which Nippon Steel provides semi-finished products therefore their capacities are added to Nippon Steel Group‘s steel production capacity on worldsteel basis.

32
© 2019 NIPPON STEEL CORPORATION All Rights Reserved.
Nippon Steel Group Major Production Bases in NAFTA & EuropeCompany Sector Products Capacity
MMT Investment ratio, partner
(1) 1984 VAM USA Energy Pipe Vallourec
(2) 1984 Wheeling-Nisshin Infrastructure Sheets 0.60(3) 1989 NSPA Auto Pipe 0.08(4) 1987 I/N Tek Auto Sheets 1.54
ArcelorMittal(5) 1989 I/N Kote Auto Sheets 0.85(6) 1990 ICI Auto Crankshaft 4 m. units
(7) 1992 PEXCO Energy Pipe 0.01(8) 1996 IPF Auto Bar&Wire 0.04(9) 2005 NAT Auto Pipe 0.01
(10) 2008 NSI Auto Crankshaft(11) 2009 Suzuki Garphyttan Auto Bar&Wire 0.02(12) 2010 Tenigal Auto Sheets 0.40 Ternium
(13) 2011 Standard SteelIntegrated mill (Infra-structure)
Wheels 0.20
(14) 2012 MNSP Auto Pipe 0.02(15) 2013 NSBS Infrastructure Sheets 0.44 Bluescope
(16) 2014 AM/NS Calvert Auto Sheets 4.30 ArcelorMittal
(17) 2015 SMM Auto Bar&Wire(18) 2016 NSCI Auto Bar&Wire 0.03 Matsubishi Metal
100%80%
40%50%
80%
89%100%
60%
49%
65%
74%
50%
42%
34%
30%
50%
Steel ProductionCapacity in NAFTA
7.8MMT/Y
Steel ProductionCapacity in Europe
1.15MMT/Y
Company Sector Products CapacityMMT
(1) 2009 Suzuki Garphyttann Auto Bar&Wire 0.03
(2) 2014 KTS Wire Auto Bar&Wire 0.01
(3) 2018 OVAKO Integrated mill (Auto) Bar&Wire 1.10 100%
100%
NAFTA
EuropeInvestment
ratio
12
7
151
16
183
8
6
4,5 210
9
15
13
1
22
33 1
2
11
100%
91%
100%
2
14 1117

33
© 2019 NIPPON STEEL CORPORATION All Rights Reserved.
Nippon Steel Group Major Production Bases in India & South America
Company Sector Products CapacityMMT/Y
Investment ratio, partner
(1) 2010 SMAC Auto Crankshaft 2.2 m. Units
(2) 2010 NPI Auto Pipe 0.02
(3) 2012 JCAPCPL Auto Sheets 0.60 Tata Steel
(4) 2011 Mahindra Sanyo Integrated mill (Auto) Specialty Steel 0.24 Mahindra
& Mahindra
(5) 2019 ArcelorMittalNippon Steel India
Integrated mill
Sheets, Plates& Pipes 9.60 ArcelorMittal
99%
49%
40%
40%
51%
Steel ProductionCapacity in India
10.5MMT/Y
Company Sector Products CapacityMMT/Y Investment ratio, partner
(1) 1958 USIMINAS Integrated mill
Sheets,Plates 6.90 Ternium
(2) 2000 UNIGAL Auto Sheets 1.03 USIMINAS
(3) 2010 VSB*2 Integrated mill (Energy) Pipe 1.10 Vallourec15%
31%*1
Steel productsCapacity in South America
9.0MMT/Y
30%
India
South America
1
35
4
2
5
21
3
1
*1 Voting share*2 Nippon Steel sells VSB’s products, therefore VSB‘s capacity is added to Nippon Steel Group’s steel production capacity on worldsteel basis .

34
© 2019 NIPPON STEEL CORPORATION All Rights Reserved.
This presentation does not constitute an offer or invitation to subscribe for or purchase any securities and nothing contained herein shall form the basis of any contract or commitment whatsoever. This presentation is being furnished to you solely for your information and may not be reproduced or redistributed to any other person. No warranty is given as to the accuracy or completeness of the information contained herein. Investors and prospective investors in securities of any issuer mentioned herein are required to make their own independent investigation and appraisal of the business and financial condition of such company and the nature of the securities. Any decision to purchase securities in the context of a proposed offering, if any, should be made solely on the basis of information contained in an offering circular published in relation to such an offering. By participating in this presentation, you agree to be bound by the foregoing limitations. This presentation contains statements that constitute forward looking statements. These statements appear in a number of places in this presentation and include statements regarding the intent, belief or current expectations of Nippon Steel Corp. or its officers with respect to its financial condition and results of operations, including, without limitation, future loan loss provisions and financial support to certain borrowers. Such forward looking statements are not guarantees of future performance and involve risks and uncertainties, and actual results may differ from those in such forward looking statements as a result of various factors. The information contained in this presentation, is subject to change, including but not limited, to change of economic conditions, financial market conditions, and change of legislation / government directives.
Any statements in this document. other than those of historical facts, are forward-looking statements about future performance of Nippon Steel Corp. and its group companies, which are based on management’s assumptions and beliefs in light of information currently available, and involve risks and uncertainties. Actual results may differ materially from these forecasts.