Students' Perceptions of a Teacher Leader Master's Program
238
Western Kentucky University TopSCHOLAR® Dissertations Graduate School Spring 2016 Students' Perceptions of a Teacher Leader Master's Program Evgenia Mauzy [email protected] Follow this and additional works at: hp://digitalcommons.wku.edu/diss Part of the Educational Leadership Commons , and the Teacher Education and Professional Development Commons is Dissertation is brought to you for free and open access by TopSCHOLAR®. It has been accepted for inclusion in Dissertations by an authorized administrator of TopSCHOLAR®. For more information, please contact [email protected]. Recommended Citation Mauzy, Evgenia, "Students' Perceptions of a Teacher Leader Master's Program" (2016). Dissertations. Paper 104. hp://digitalcommons.wku.edu/diss/104
-
Upload
khangminh22 -
Category
Documents
-
view
4 -
download
0
Transcript of Students' Perceptions of a Teacher Leader Master's Program

Western Kentucky UniversityTopSCHOLAR®
Dissertations Graduate School
Spring 2016
Students' Perceptions of a Teacher Leader Master'sProgramEvgenia [email protected]
Follow this and additional works at: http://digitalcommons.wku.edu/diss
Part of the Educational Leadership Commons, and the Teacher Education and ProfessionalDevelopment Commons
This Dissertation is brought to you for free and open access by TopSCHOLAR®. It has been accepted for inclusion in Dissertations by an authorizedadministrator of TopSCHOLAR®. For more information, please contact [email protected].
Recommended CitationMauzy, Evgenia, "Students' Perceptions of a Teacher Leader Master's Program" (2016). Dissertations. Paper 104.http://digitalcommons.wku.edu/diss/104

STUDENTS’ PERCEPTIONS OF A TEACHER LEADER MASTER’S PROGRAM
A Dissertation
Presented to
The Faculty of the Educational Leadership Doctoral Program
Western Kentucky University
Bowling Green, Kentucky
In Partial Fulfillment
Of the Requirements for the Degree
Doctor of Education
By
Evgenia Mauzy
May 2016


I dedicate my dissertation to my family. I am grateful for my husband Lee Mauzy, who
believes in me. I am also grateful for my sons Bogdan and Stanislav Mauzy, who are a big
inspiration for me. I love you, Mom and Dad.
iv
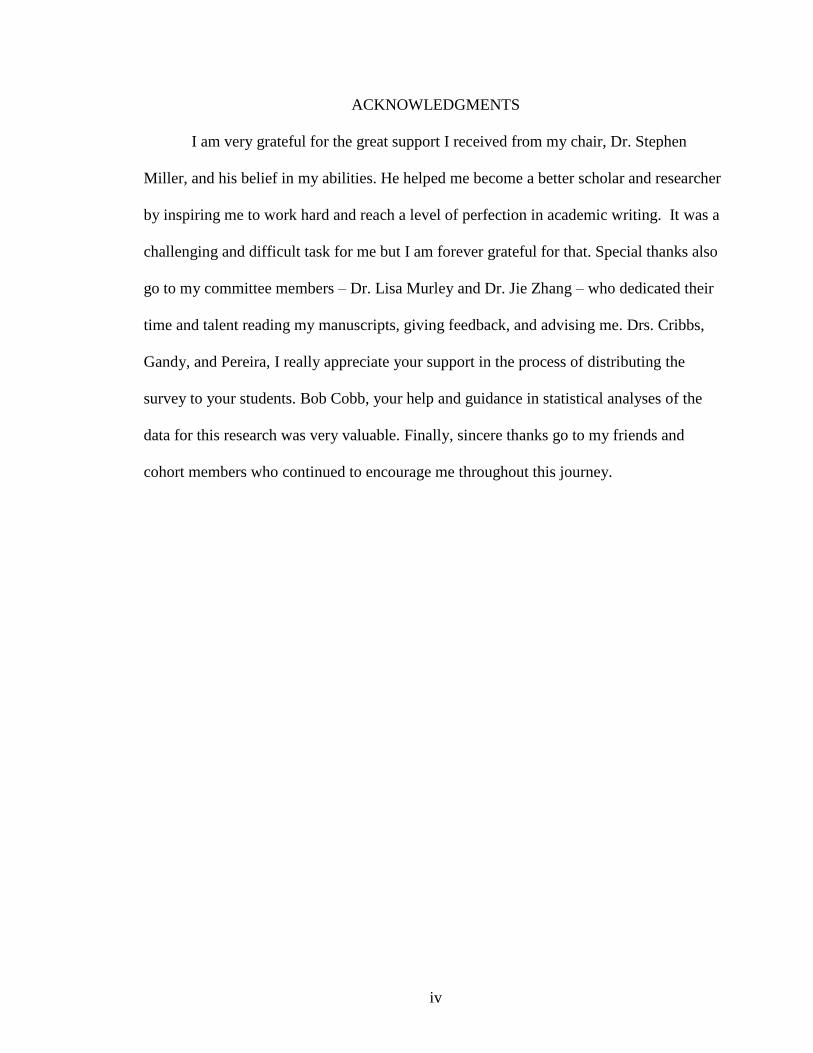
ACKNOWLEDGMENTS
I am very grateful for the great support I received from my chair, Dr. Stephen
Miller, and his belief in my abilities. He helped me become a better scholar and researcher
by inspiring me to work hard and reach a level of perfection in academic writing. It was a
challenging and difficult task for me but I am forever grateful for that. Special thanks also
go to my committee members – Dr. Lisa Murley and Dr. Jie Zhang – who dedicated their
time and talent reading my manuscripts, giving feedback, and advising me. Drs. Cribbs,
Gandy, and Pereira, I really appreciate your support in the process of distributing the
survey to your students. Bob Cobb, your help and guidance in statistical analyses of the
data for this research was very valuable. Finally, sincere thanks go to my friends and
cohort members who continued to encourage me throughout this journey.

v
CONTENTS
STATEMENT OF THE PROBLEM
Introduction ........................................................................................................................ 1 Teacher Preparation ........................................................................................................... 3 The Problem Defined ....................................................................................................... 11 Purpose of the Study ........................................................................................................ 15 Research Questions .......................................................................................................... 17 Significance of the Study ................................................................................................. 19
Limitations of the Study .................................................................................................. 21 Definitions of Key Terms ................................................................................................ 24
Summary .......................................................................................................................... 26
REVIEW OF THE LITERATURE
Introduction ...................................................................................................................... 28 Education Reforms .......................................................................................................... 30 Teacher Education ........................................................................................................... 36 Reform Perspectives ........................................................................................................ 37 Teacher Leadership .......................................................................................................... 46 Master’s Degree in Teacher Leadership .......................................................................... 52 Summary .......................................................................................................................... 67
METHODOLOGY
Introduction ...................................................................................................................... 69 Research Design .............................................................................................................. 70 Population and Sample .................................................................................................... 70 Research Questions .......................................................................................................... 71 Instrumentation ................................................................................................................ 72 Description of the Variables ......................................................................................... 72 Procedures ........................................................................................................................ 75 Missing Data .................................................................................................................... 77
Data Analysis ................................................................................................................... 78 Validity and Reliability .................................................................................................... 81
Ethical Considerations ..................................................................................................... 82 Summary .......................................................................................................................... 83
RESULTS
Introduction ...................................................................................................................... 86 Descriptive Statistics ........................................................................................................ 87

vi
Psychometric Analysis ..................................................................................................... 89
Research Questions ........................................................................................................ 103 Summary ........................................................................................................................ 135
DISCUSSION AND CONCLUSIONS
Introduction .................................................................................................................... 139 The Study in Brief .......................................................................................................... 140
Discussion ...................................................................................................................... 144 Recommendations .......................................................................................................... 156 Conclusions .................................................................................................................... 161
REFERENCES .............................................................................................................. 167
APPENDIX A ................................................................................................................ 180
APPENDIX B ................................................................................................................ 181
APPENDIX C ................................................................................................................ 182
APPENDIX D ................................................................................................................ 186
APPENDIX E ................................................................................................................ 188
APPENDIX F ................................................................................................................ 192
APPENDIX G ................................................................................................................ 210
APPENDIX H ................................................................................................................ 211
APPENDIX I ................................................................................................................. 213
CURRICULUM VITAE ................................................................................................ 224
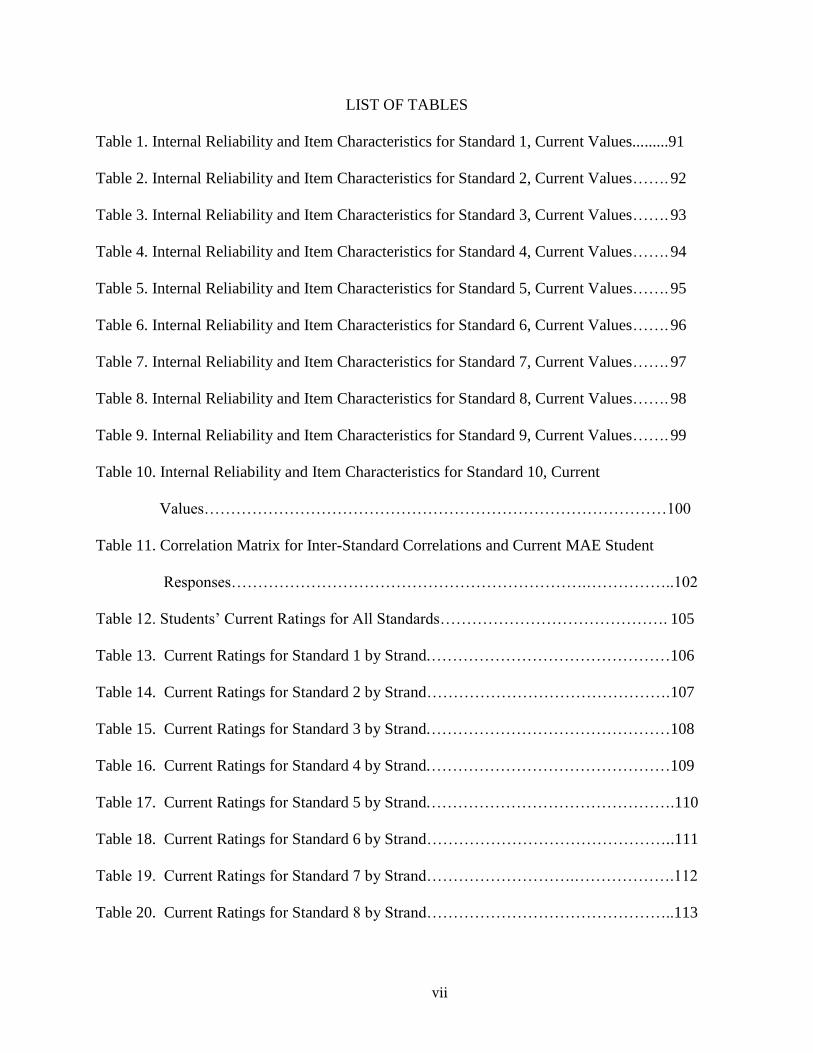
LIST OF TABLES
Table 1. Internal Reliability and Item Characteristics for Standard 1, Current Values.........91
Table 2. Internal Reliability and Item Characteristics for Standard 2, Current Values……. 92
Table 3. Internal Reliability and Item Characteristics for Standard 3, Current Values……. 93
Table 4. Internal Reliability and Item Characteristics for Standard 4, Current Values……. 94
Table 5. Internal Reliability and Item Characteristics for Standard 5, Current Values……. 95
Table 6. Internal Reliability and Item Characteristics for Standard 6, Current Values……. 96
Table 7. Internal Reliability and Item Characteristics for Standard 7, Current Values……. 97
Table 8. Internal Reliability and Item Characteristics for Standard 8, Current Values……. 98
Table 9. Internal Reliability and Item Characteristics for Standard 9, Current Values……. 99
Table 10. Internal Reliability and Item Characteristics for Standard 10, Current
Values……………………………………………………………………………100
Table 11. Correlation Matrix for Inter-Standard Correlations and Current MAE Student
Responses………………………………………………………….……………..102
Table 12. Students’ Current Ratings for All Standards……………………………………. 105
Table 13. Current Ratings for Standard 1 by Strand. ………………………………………106
Table 14. Current Ratings for Standard 2 by Strand………………………………………. 107
Table 15. Current Ratings for Standard 3 by Strand. ………………………………………108
Table 16. Current Ratings for Standard 4 by Strand. ………………………………………109
Table 17. Current Ratings for Standard 5 by Strand. ……………………………………….110
Table 18. Current Ratings for Standard 6 by Strand………………………………………. .111
Table 19. Current Ratings for Standard 7 by Strand……………………….……………….112
Table 20. Current Ratings for Standard 8 by Strand………………………………………..113
vii

Table 21. Current Ratings for Standard 8 by Strand…………………………………………114
Table 22. Current Ratings for Standard 10 by Strand………………………………………..115
Table 23. Differences in Student Level of Professional Preparation for Standard
1-10 from Beginning to Completing of Program..………………………….……….117
Table 24. Paired Sample t Tests Comparing Differences between Current and
Beginning Level of Professional Preparation for Standards 1-10…………………..118
Table 25. Differences in Student Level of Professional Preparation for Elementary
Education for Standards 1-10 from Beginning to Completion of Program…………119
Table 26. Differences in Student Level of Professional Preparation for Middle Grades
Education for Standards 1-10 from Beginning to Completion of Program…………120
Table 27. Differences in Student Level of Professional Preparation for Secondary
Education for Standards 1-10 from Beginning to Completion of Program…………121
Table 28. Differences in Student Level of Professional Preparation for Special
Education for Standards 1-10 from Beginning to Completion of Program…………122
Table 29. Paired Sample t Tests Comparing Differences between Current and
Beginning Level of Professional Preparation for the MAE in Elementary
Education for Standards 1-10……………………………………………..................123
Table 30. Paired Sample t Tests Comparing Differences between Current and
Beginning Level of Professional Preparation for the MAE in Middle
Grades Education for Standards 1-10..…….……………………………...………...124
Table 31. Paired Sample t Tests Comparing Differences between Current and
Beginning Level of Professional Preparation for the MAE in Secondary
viii

Education for Standards 1-10……………………………………………..................125
Table 32. Paired Sample t Tests Comparing Differences between Current and
Beginning Level of Professional Preparation for the MAE in Special
Education for Standards 1-10……………………………………….….....................126
Table 33. Gender Differences in Professional Preparation for Standards 1-10 at
Completion of Program……………………………………………………………...128
Table 34. Independent Samples t Test for Gender Comparing Professional
Preparation for Standards 1-10 at Completion of Program………………………....129
Table 35. Pearson Correlations for Age and Teaching Experience for Level of
Professional Preparation for Standards 1-10 at Completion of Program…………....131
Table 36. Descriptive Statistics and ANOVA Analyses for Grade Level (Elementary,
Middle, Secondary) by Level of Professional Preparation on Standards 1-10 at
Completion of Program……………………………………………………………..133
Table 37. Tukey’s Post Hoc Analysis for Differences across Grade Level for
Standard 8………………………………………………………….………………. 135
Table I-1. Internal Reliability and Item Characteristics for Standard 1,
Beginning Values……………………………………………………………………214
Table I-2. Internal Reliability and Item Characteristics for Standard 2,
Beginning Values…………………………………………………………..………..215
Table I-3. Internal Reliability and Item Characteristics for Standard 3,
Beginning Values……………………………………………………………………216
Table I-4. Internal Reliability and Item Characteristics for Standard 4,
Beginning Values……………………………………………………………………217
ix

Table I-5. Internal Reliability and Item Characteristics for Standard 5,
Beginning Values…………………………………………………………………..218
Table I-6. Internal Reliability and Item Characteristics for Standard 6,
Beginning Values…………………………………………………………………...219
Table I-7. Internal Reliability and Item Characteristics for Standard 7,
Beginning Values…………………………………………………………………....220
Table I-8. Internal Reliability and Item Characteristics for Standard 8,
Beginning Values……………………………………………………………………221
Table I-9. Internal Reliability and Item Characteristics for Standard 9,
Beginning Values……………………………………………………………………222
Table I-10. Internal Reliability and Item Characteristics for Standard 10,
Beginning Values…………………………………………………………………....223
x
STUDENTS’ PERCEPTIONS OF A TEACHER LEADER MASTERS’ PROGRAMS
Evgenia Mauzy December 2015 225 Pages
Directed by: Stephen K. Miller, Lisa D. Murley, and Jie Zhang
Educational Leadership Doctoral Program Western Kentucky University
Teacher leadership is one of the key components of school success. However,
teacher leader education has not been the focus of research. This quantitative study
explores the central research question: What are the perceptions of teachers completing the
Western Kentucky University Masters of Art in Education (MAE) Teacher Leader Program
regarding their level of professional preparation?
A Likert-type double matrix descriptive survey with correlational design covered
students’ perceptions of level of professional preparation on a 5-point scale at the beginning
and the end of the program for the ten MAE Program Standards. All data were gathered
from students in the MAE Teacher Leader Program via e-mail using Qualtrics software.
The population encompassed the first two cohorts to complete the program, 107 students;
the sample consisted of 46 students (43%) who responded to the survey with usable data.
Descriptive statistics and psychometric analyses (Cronbach’s alpha computed on the
respective sets of substandards for each Program Standard) were calculated. The research
questions examined (a) student perceptions of their professional preparation at the end of
the program, (b) differences from beginning to end of the program, and (c) relationships
between socio-demographic factors and students' current preparation for the standards.
Students reported that they are prepared to teach the 10 MAE Program Standards
after program completion with means ranging from 4.07 to 4.47 on the 5-point scale.
Students in the MAE in Elementary Education Programs and Middle Grades Education
xi
felt best prepared, while students in the MAE Special Education Programs showed the least
confidence in their professional preparation. There was a significant improvement in
students’ self-perception about their professional preparation from the beginning to the end
of the program for all students based on paired t tests. Similar mean comparisons on the
difference between beginning and current value on the 10 standard showed that the
improvements are significant for all strands except MAE in Special Education. Regarding
socio-demographic factors, age and teacher experience were significantly related to
students’ perceptions of their educational preparation for six and seven of the ten standards,
respectively. The study highlighted the program's strengths and provided insights toward
program improvement.
xii

1
CHAPTER I
STATEMENT OF THE PROBLEM
Introduction
Children are the future. By investing in their education, the nation prepares them for
success. On a large scale, schooling plays an important role in the political, social, and
economic development of the country. However, the U.S. school education system has
chronic problems with student achievement, retention, and college dropouts. A Nation at
Risk, the report issued by the Reagan administration (National Commission on Excellence in
Education, 1983) pointed out that American students fall behind their counterparts in other
countries. Since that time, U.S. policymakers have tried to address this critical issue.
Numerous attempts were made to improve the quality of education since the 1980s. The
goal of the reforms was to address the problems in education. In the past, the efforts were
concentrated on improving education by preparing students to pass multiple standardized
tests by memorizing the facts. The students were pushed into the compliance-based
educational accountability system. However, these attempts did not solve the problem with
student achievement.
More recently, educators have been working on developing critical thinking and real
life skills in students in order to help them improve their academic achievement and prepare
for successful careers upon school graduation. Children are naturally active; accordingly
classroom knowledge and skills have to be connected with real life experiences in order to
help students become adaptive learners. There is considerable evidence that teacher leaders
2
can be effective through their impact on students inside and outside the classrooms (Cohron,
2009). They help students become active citizens and patriots by serving as role models to
them. Teacher leaders also foster leadership qualities, as well as a sense of responsibility
and belonging in students (Henning, 2006).
Another trend in education is standardization. Since the American school population
is quite diverse, it is important to standardize both content and assessment. The
implementation of common core standards in schools was an important step in that
direction. The common core provides students across America with clearly defined
expectations and benchmarks, bringing unity to education. These tasks require teachers to
work in teams and become better leaders in schools and in the community. Teacher leaders
are assuming new roles as standardization requires them to collaborate on content mapping,
manage workloads, and build mutual trust. Teacher leaders increasingly serve as change
catalysts, inspiring and motivating others. Their role in developing a healthy professional
school climate is vital. Among other leadership activities, they demonstrate progressive
pedagogical practices to their coworkers, motivating others to become better professionals.
Teacher leaders also support and implement innovative programs, answering the national
call for reforms in education (Barth, 2001; Danielson, 2006).
The preparation of teacher leaders has been overlooked in the past. While numerous
researchers have documented the effectiveness of teacher leaders (see Beattie, 2002;
Cohron, 2009), there has been no systematic approach to the preparation of these
professionals. While teacher leaders are supposed to help their coworkers reach excellence
in teaching, they themselves did not typically have any professional preparation on
leadership skills and knowledge. These needs have not gone unnoticed by the educational
establishment. U.S. policymakers are working to close the gap on teacher leader education.

3
The role of the teacher as a leader and role model was reinforced by one of the latest
educational initiatives from the Obama administration, Our Teacher, Our Future (U.S.
Department of Education, 2011), designed to improve teacher professional preparation in
American colleges. Supporting a strong teaching force and school leadership is a top priority
for the Obama administration. Making improvements in teacher and leader effectiveness is
on the Administration’s education reform agenda.
America’s future depends on its teachers. That is why we are taking steps to prepare
teachers for their difficult responsibilities and encouraging them to stay in the
profession. That is why we are creating new pathways to teaching and new
incentives to bring teachers to schools where they are needed most. (U.S.
Department of Education, 2011, p. 1)
Teacher quality and the process of teacher education have become the center of the
new education reform. America needs teacher leaders in order to improve student
achievement, help other teachers acquire new knowledge and skills, and promote team
work. Colleges have responded to the call by modifying their professional preparation
programs for teachers.
Teacher Preparation
Teacher education became a focus of nation's attention in the past decade because of
the growing demand for quality of teacher preparation and the shortage in the teacher work
force.
Quantitatively, estimates are that the United States is facing nearly 200,000
teacher vacancies a year at a cost to the nation of $4.9 billion annually, owing to
high attrition rates among new teachers and the retirement of baby boomer
teachers, as well as increases in student numbers due to immigration, population

4
redistribution, and regional growth. (Levine, 2006, p. 11)
Among other problems, researchers found weakness with teachers’ professional
preparation programs, which fail to address the current trends in student diversity and
growth. “The students’ population changed economically, racially, geographically,
linguistically, and academically. Current teacher education programs are largely ill equipped
to prepare current and future teachers for these new realities” (Levine, 2006, p. 12). Teacher
education faces the task of redesign in order for future educators to be agents of change in
schools.
Traditional Teacher Education Programs
The goal of traditional teacher preparation is to provide future specialists with
necessary preparation and credentials for selected areas of teaching. Traditional teacher
preparation programs include core content education classes in a chosen area of
specialization, such as elementary, middle school, secondary, or special education; general
education classes in the arts and sciences; elective courses; and extensive field placements,
culminating in student teaching. Teacher leadership was not included in pedagogical
practices; rather, this facet of teaching was considered intuitive knowledge, which was
presumed to evolve during professional practice.
There are both undergraduate and graduate programs available for students. Upon
high school completion, prospective teachers may choose between community college,
public, or private university in order to earn an undergraduate degree. Community colleges
and public universities are partially funded by government and operate under state policies,
while non-public colleges are privately sponsored. Community colleges offer the associate
degree. The U.S. Department of Education (2013, para. 41) defines an associate degree as
“an award that normally requires at least 2 but less than 4 years of full-time equivalent

5
college work.” Typically, an associate degree is awarded to prospective teachers upon
completion of 60 credit hours of the approved coursework. The number of core content
courses usually equals the number of electives, but may vary by college. Electives should
serve the purpose of broadening students’ knowledge in the chosen major and are subject to
the advisor’s approval. Students with an associate degree must transfer to a four year college
or university to complete their bachelor’s degree and meet certification requirements (U.S.
Department of Education, 2013).
A bachelor’s degree requires around 120 credit hours, where 80 hours will include
core content classes and 40 credit hours will be electives, with 40 credit hours in upper
division courses. The following are common specializations in the bachelor’s degree for
prospective teachers. Prospective BS education students typically choose their specialization
with a major in General Science or in Mathematics. Full time students typically carry from
12-17 credit hours per semester, or approximately 30 a year (U.S. Department of Education,
2008, p. 2). According to the U.S. Department of Education (2013, para. 2), a bachelor’s
degree is
[a]n award (baccalaureate or equivalent degree, as determined by the Secretary, U.S.
Department of Education) that normally requires at least 4 but not more than 5 years
of full-time equivalent college-level work. This includes all bachelor's degrees
conferred in a 5-year cooperative (work-study) program. A cooperative plan
provides for alternate class attendance and employment in business, industry, or
government; thus, it allows students to combine actual work experience with their
college studies. [This also] includes bachelor's degrees in which the normal 4 years
of work are completed in 3 years.
Graduate Teacher Education Programs
6
Graduate degrees include master’s, specialist, and doctorate degrees. The
prerequisite to the graduate program in education is a bachelor's degree in a selected area of
teaching. The coursework consists of mandatory and elective courses. The curriculum
varies by college, but in general requires up to 30 credit hours of approved graduate core
content classes and from 10-20 credit hours in electives. The determination of the number of
hours is made by the program faculty, consistent with requirements from various
accreditation agencies. The number of hours required for a given student can vary
depending on prerequisites that may or may not have been taken during the bachelor's
program. The students have to meet program graduate requirements, which include
satisfactory grades, and in some programs, demonstrate that they have met certain field
experiences and exhibit appropriate dispositional traits. Most colleges do not accept C and D
grades toward fulfillment of the course program requirements, but count these grades in
students' grade point average (GPA) score. “A master’s degree program requires at least 33
credit hours and including a research thesis or project represents over 4,000 actual hours of
supervised and unsupervised (independent research) study” (U.S. Department of Education,
2008, para. 6). Specialist and doctoral degrees typically require a Master’s degree as a
prerequisite. Course requirements include core content classes and electives. The total
number of credit hours usually equals an additional 30 or 60 hours, respectively.
A doctor's degree that is conferred upon completion of a program providing the
knowledge and skills for the recognition, credential, or license [is] required for
professional practice. The degree is awarded after a period of study such that the
total time to the degree, including both pre-professional and professional
preparation, equals at least six full-time equivalent academic years. (U.S.
Department of Education, 2013, para. 2)

7
Particularly for the doctorate, other requirements include passing comprehensive and final
exams, completing a satisfactory dissertation project, and successful dissertation defense.
According to the U.S. Department of Education (2008), a “doctoral program can represent
8,000 or more actual hours of advanced study and research beyond the master’s degree”
(U.S. Department of Education, 2008, para. 6).
Accreditation for Teacher Education
Education in America is regulated by accrediting agencies. Southern Association of
Colleges and Schools (SACS) is the regional accreditation agency for colleges in the
southern states, which includes Alabama, Florida, Georgia, Kentucky, Louisiana,
Mississippi, North Carolina, South Carolina, Tennessee, Texas, Virginia, and some
international colleges and universities (Southern Association of Colleges and Schools, 2013,
p. 1). SACS is recognized on a federal level.
The U.S. Secretary of Education recognizes accreditation by SACS Commission on
Colleges in establishing the eligibility of higher education institutions to participate in
programs authorized under Title IV of the Higher Education Act, as amended, and other
federal programs. Through its periodic review of institutions of higher education, the
Commission assures the public that it is a reliable authority on the quality of education
provided by its member institutions. The federal statute includes mandates that the
Commission review an institution in accordance with criteria outlined in the federal
regulations developed by the U.S. Department of Education. As part of the review process,
institutions are required to document compliance with those criteria and the Commission is
obligated to consider such compliance when the institution is reviewed for initial
membership or continued accreditation (Southern Association of Colleges and Schools,
2013, p. 30).

8
SACS sets specific requirements for all graduate programs, including teacher
education: admission criteria, graduate curriculum, and instruction. Other
requirements include various student services, such as academic advising and outreach
programs. According to SACS criteria for college accreditation, American graduate
education consists of state approved coursework. For teacher education programs, all
students must complete PRAXIS exams as a requirement for obtaining teacher’s license
after program completion (Southern Association of Colleges and Schools, 2008, p. 32).
Colleges offering teaching degrees also use The National Council for Accreditation
of Teacher Education (NCATE) in order to make sure national standards for teaching are
met in their professional preparation programs. A performance-based system is used in
NCATE accreditation. The U.S. Department of Education and the Council for Higher
Education Accreditation recognize NCATE as a professional accrediting body for teacher
preparation. Teacher preparation programs receive accreditation according to NCATE
standards.
Graduate teacher preparation programs have been criticized in recent years by
researchers for inadequate teacher preparation. Plecki, Elfers, and Nakamura (2012) argue
that teacher preparation programs are lacking accountability and advocate for changes in
teacher preparation programs. The changes should address the following areas: establishing
benchmarks for prospective teacher candidates, creating teacher education programs for
effective teacher preparation, and providing instructional support and assistance with work
placement for graduates.
Teacher Leadership
Teacher leadership is an important component of school success. Recent educational
reforms put a renewed focus on teacher leader preparation in order to improve teacher

9
quality and enhance student learning. Researchers, such as Barth (2001) and Growther
(1997), found that teacher leadership improves teaching and learning practices in schools. In
the past, teacher leadership was seen as activities outside school, while recent trends show
that teacher leaders play an important role in collaboration with coworkers, school
administrators, and students’ parents (York-Barr & Duke, 2004). Teacher leaders provide
professional development, mentoring, and coaching to new teachers, which helps prevent
work burnout and increase teacher retention (Pankratz & Petrosko, 2000).
However, in the past decade teacher leadership has evolved to play a new role in the
public school system. Silva, Gimbert, and Nolan (2000) identified three phases in teacher
leadership development. The first phase was a managerial role of a teacher leader, when
teachers were focused on personal effectiveness. Teacher leaders work as the department
chairs, head teachers, and union representatives. The second phase characterizes teacher
leaders as instructional leaders where collaboration with others plays an important role.
They work as staff and curriculum developers. The third phase started in the 1990s. Teacher
leaders blend formal and informal leadership roles, influence others, and make
administrative leadership decisions, such as assisting in the hiring of new teachers, forming
committees, and participating in board meetings.
Colleges and universities have answered the national call for highly qualified
teachers by modifying their professional preparation programs for educators, including the
teacher leader component in their core content classes. In the process, they have revisited
the scope and meaning of graduate teacher education.
One recent educational reform, the Obama Administration Plan, Our Teachers, Our
Future, by the U.S. Department of Education (2011), also calls for redesigning teacher
educational programs. The goal of the initiative is to make colleges produce well prepared

10
specialists for the field of education. Inclusion of a teacher leader component in the
curriculum is increasingly recognized as a step toward excellence in education. Five states
(Alabama, Delaware, Kansas, Kentucky, and Ohio) developed standards for teacher
leadership in order to provide “guidance to state policymakers as they work to improve
education leadership preparation, licensure, evaluation, and professional development”
(Southern Association of Colleges and Schools, 2013, p. 1).
Graduate Teacher Education at Western Kentucky University
The mission of Western Kentucky University is to “prepare students to be
productive, engaged, and socially responsible citizen-leaders of a global society. It provides
research, service, and lifelong learning opportunities for its constituents. WKU is
responsible for stewarding a high quality of life for those within its reach” (Western
Kentucky University, 2012, para. 6). Consistent with these broader goals, the College of
Education and Behavioral Sciences (CEBS) of Western Kentucky University implemented a
new Master of Arts in Education (MAE) program in 2010. Students will receive their
master’s degree in a chosen specialty area as well as a leadership certification. The programs
were a response to numerous educational reforms and initiatives on the federal, state, and
local levels.
The graduate programs were created to prepare educational professionals with an
emphasis on teacher leadership. WKU aligned the new MAE Program professional
standards such that vision, mission, beliefs, dispositions, and practices were consistent with
the Kentucky Teacher Professional Standards and the requirements of the National Council
for Accreditation of Teachers (NCATE), as listed in the 2009 NCATE Institutional Report.
WKU’s Conceptual Framework represents beliefs and values, supported by research
literature, that are shared by all programs that prepare university students to enter
11
education professional fields. These fields include teachers in elementary, middle,
and high schools; library media specialists; principals and superintendents; school
counselors; school nurses; school psychologists; and, speech pathologists. All these
education professional preparation programs are considered by NCATE and
Kentucky’s Education Professional Standards Board to represent WKU’s
Professional Education Unit. (NCATE, 2009, p. 11)
The WKU Conceptual Framework “demonstrates how these professional education unit
beliefs, as well as WKU strategic planning goals and objectives, tie back to the Kentucky
Teacher Standards, the umbrella for all our programs” (NCATE, 2009, p. 14). These
standards specify the skills and critical performances that are to be attained by the
educational professionals who complete the MAE Teacher Leader Program.
The Problem Defined
The quality of schools of education has become a global concern due to the
development of technology and science, economic turmoil, and the forces of
internationalization. Future school graduates will have to be prepared for the higher
demands of the competitive job market and modern society.
As the economies of nations compete for strong positions within a competitive
global market place, many governments have become increasingly interested in the
performance of all aspects of their education systems. This trend, coupled with the
enormous expenditures that are devoted to education, has also precipitated
widespread public requests for higher levels of scrutiny concerning the quality of
education. (Anderson, 2005, p. ix)
Consistent with Anderson’s (2005) explanation, government initiatives have promoted
teacher leadership as a driving force of modern education reform. In the process teacher

12
leadership has become a key component of success in the 21st century education.
One of the most challenging problems in graduate education, however, is the lack of
professional preparation for teacher leaders. While society recognizes the growing need of
teacher leaders as agents of change in the era of school reforms, the issue on how to address
teacher leader education has not received sufficient attention. In the past, teacher leaders
evolved on an intuitive level and the scope of their expertise was limited to the classroom.
Colleges provided professional preparation for the teachers according to their chosen
specialization. The growing need for teacher leaders has helped colleges face the gap in
teachers’ education and include teacher leadership as a core content area in their curriculum.
This emerging trend needs future analysis and research (Manious, 2012).
Numerous studies have been done on the effects of teacher leadership. Researchers
(e.g., Alvarado, 1997; Barth, 2001; Brandt, 1995; and Growther, 1997) have examined the
roles of teacher leaders in professional learning communities. According to Growther,
teacher leadership is "an ethical stance that is based on views of both a better world and the
power of teaching to shape meaning systems. It manifests in actions that involve the wider
community in the long term. It reaches its potential in contexts where system and school
structures are facilitative and supportive" (Growther, 1997, p. 15).
Wynne (2001), Hinchey (1997), Hoerr (2005), and Cohron (2009) have all
examined the correlation between teacher leaders and students’ achievement. Wynne did not
find a direct correlation between teacher leadership and student achievement, but suggested
that teacher leaders are instrumental in creating the learning climate in professional learning
communities, which, in turn, will influence student learning outcomes. Cohron (2009, p. vii)
found that “interactions related to the student achievement construct [were] noted as a
significant predictor of student academic achievement as measured by the school Academic
13
Index of the Kentucky Core Content Test.”
Wynne (2001), Cohron (2009), and Gabriel (2005) studied different dimensions of
teacher leadership in their professional practices as well as barriers and challenges of teacher
leaders. The above mentioned researchers found a positive effect of teacher leadership on
educational practices. The barriers of developing teacher leader practices in schools include
increased workload on teachers combined with the absence of monetary rewards, which
leads to professional dissatisfaction, lack of interest in continuous professional development
of teacher leaders, teacher dropouts, and possible health and family issues, according to
Cohron. Another challenge of teacher leadership is teachers’ desire to avoid potential
tensions with their coworkers, and, as a result, not pursuing the teacher leader position.
Cohron’s study suggests implementing teacher leadership in schools at a higher level and
providing professional preparation for teacher leaders, so they will become effective
professional learning community members. “The final implication of this study pertains to
university teacher educational programs. In re-designing teacher educational programs,
multiple opportunities should be provided, from the pre-service through graduate level, for
candidates to develop knowledge and skills” (Cohron, 2009, p. 197). Despite Cohron’s plea,
the author has found limited research on the preparation of teacher leaders.
Manious (2012) examined what type of universities offer Teacher Leader Master
Programs and the curricula of these programs. The study provided information about the
colleges, such as students’ demographics, college geographical location, and the core
content and elective classes that are included in the teacher leader professional preparation
programs. Maniuos examined the creation and development of the Teacher Leader
professional preparation programs from 1980 until 2012, finding a trend of continuing
growth in the number of Teacher Leader Programs offered nationwide. According to

14
Manious, recent educational reforms promoting student achievement at schools have created
a need for teacher leaders and pushed colleges toward inclusion of Teacher Leader Master
Programs in their lists of program emphasis.
Professional learning communities in schools promote implementation of school
reforms, according to Cain and Caine (2000) and Darling-Hammond (2006), while teacher
leaders are the moving force for these communities. They inspire, motivate, and coach their
coworkers, students, and even the parents. Teacher leaders promote student achievement by
implementing best education practices. The role of the teacher leader is challenging, because
the additional workload and the lack of compensation for that role lead teacher leaders to
professional and emotional distress, teacher dropouts, and health issues, as Cohron (2009)
found in her study. Thus it is important that teacher leaders receive proper professional
training in order to balance the above issues.
Colleges have answered the call for teacher leader preparation and have started to
include additional areas of teacher leader certification or licensing in their educational
programs. However, this movement is only beginning. In 2012 Manious found through his
extensive research that out of 656 colleges in the United States, only 28 (4.2%) included a
teacher leadership component in the curriculum.
To the author’s knowledge, the research on teacher leadership education is even
more limited. The abundance of studies examine teacher leadership effects on teachers and
schools, but the importance of teacher leader education and research on this topic has largely
escaped the scope of researchers’ professional interest. Most researchers have used mixed
methods research, where they describe existing teacher leader programs using a qualitative
approach and analyze programmatic data using quantitative techniques. Researchers who
collect data from several colleges face the challenges of working with digital information:
15
some colleges do not update their websites and the data about their programs might contain
discrepancies, while other colleges constantly update their websites, so researchers do not
have the opportunity to study the history of the program (Maniuos, 2012).
To this date, Western Kentucky University (WKU) has not conducted a program
evaluation to examine their new MAE Teacher Leader Programs. Further, to the author’s
knowledge, current research has not provided information about the quality of Teacher
Leader Programs from students’ point of view. In related research, Maniuos (2012) used a
mixed method approach to describe various teacher leader master programs in American
colleges and universities. Thus more research is needed that evaluates the new teacher
leader educational programs in schools of education, particularly from the point of view of
students.
Purpose of the Study
This study brings together explicitly the issues just described in The Problem
Defined above. The role of the teacher leader has increased since the U.S. government
called for raising the quality of American school education. The initiative to implement
professional learning communities is on the rise in K-12 schools, and teacher leaders are the
driving force of this movement (Cain & Caine, 2000). Professional learning communities
enhance the sense of belonging to school culture and history, where teacher leaders provide
a systematic approach to learning and teaching, educate other teachers about updates in
different content areas, develop a culture of collaboration across content areas, and enhance
rigor and relevance in classrooms. Since the demand for teacher leaders has increased, the
quality of teacher leader preparation has become an essential issue in teacher education.
Despite this movement, as indicated above, research on teacher leader education programs is
minimal, program evaluations of these new initiatives are not yet common, and, to the
16
author’s knowledge, no studies on teacher leader education programs have been conducted
from the students’ perspectives.
Thus, this study is intended to examine students’ perspectives of the newly
implemented MAE Programs at WKU. Limited information is available about the students’
perceptions of the program due to the fact that the program’s inception was in 2010.
Therefore, the MAE Programs will benefit from learning students’ perceptions about the
programs and their perceived effectiveness. This information will provide insight into how
to prevent dissatisfaction with the program, pinpoint potentially problematic areas, and
identify areas for growth and strengths. The findings from this study will assist faculty at
WKU in the Program’s future development. Specifically, in addition to the educational
benefit, the study will also function as a partial program evaluation, with the evidence
providing some rationale for program effectiveness in a competitive educational market.
The instrument for this study is a survey, adapted from Javidi’s (2011) questionnaire
to fit the teacher standards of the Education Professional Standards Board (EPSB) which are
the same as the WKU MAE Program Standards. The demographics for the survey were
adapted from a grant project by Miller, Chon, Houchens, and Hunt (2013). A descriptive
survey with correlational design is used to evaluate MAE students’ responses toward their
levels of professional preparation at the beginning of the program and at the moment of the
survey completion. The procedures for the survey distribution were determined in
cooperation with Dr. Murley, the MAE Teacher Leader Program Representative. The
population of this study includes MAE Program students who have completed the program
since its inception in 2010 (two cohorts, Fall, 2013 and Spring, 2014). For this study, Cohort
1 is the group of students who graduated from the MAE Program in December, 2013;
Cohort 2 students completed the program in May, 2014. Participation in the survey is
17
strictly voluntary; responders to the survey become the sample. Quantitative descriptive
statistics, t tests, and correlations are used to analyze the data collected from the survey.
Thus, the central research question for this study is: What are the perceptions of teachers
completing the WKU MAE and Non-Degree Planned Fifth Year Teacher Leader Program
regarding their level of professional preparation?
Research Questions
This study is intended to investigate students’ perceptions of MAE Teacher Leader
Programs. The participants reflect on the process of their professional preparation according
to the MAE Program Standards. The standards are the key indicators of the MAE Program
quality and were established by WKU in accordance with NCATE and Kentucky
Educational Professional Standard Board (EPSB) regulations.
The subjects of the research are MAE Program students. Six independent variables
are clustered around two subgroups representing socio-demographic controls: Personal
Identity and Educational Identity. Subgroup 1 (Personal Identity) includes participants’
gender, race, and age. Subgroup 2 (Educational Identity) consists of grade level taught,
teaching experience, and content area. These six independent variables are hypothesized to
influence the dependent variables, which are represented by students’ perceptions of their
preparation to meet MAE program standards. The correlations between variables are
hypothesized in Figure 1. The model also indicates that there may be differences based on
which of the program strands the student chooses.

18
Figure 1. Relationships among socio-demographic factors, MAE Teacher Leader Strands,
and students’ professional preparation vis-à-vis the Kentucky Teacher Standards.
The goal of the study is to examine the quality of the MAE Programs in teacher
leadership at Western Kentucky University. The research questions follow:
From the perspective of students in the Western Kentucky University MAE Teacher
Leader Program regarding their level of professional preparation:
1. What are student perceptions at the end of the program:
a. For all students?
b. For students in each strand (MAE in Elementary Education, MAE in
Demographic
Controls
------------------------Personal Identity
Gender
Race/Ethnicity
Age
Educational Identity
Grade level taught
Teaching
experience
Content area
Program Strands
--------------------------
MAE in
Interdisciplinary
Early Education
MAE in Elementary
Education
MAE in Middle
Grades Education
MAE in Secondary
School Education
MAE in Special
Education
Professional Preparation Over 10 Kentucky Teacher Standards Differences in perception from beginning to end of program
_____Independent Variables__________
__________________
__________
_______
Dependent Variables
Professional Preparation Over 10 Kentucky Teacher Standards Differences in perception from beginning to end of program
Professional Preparation Over 10 Kentucky Teacher Standards Differences in perception from beginning to end of program
Professional Preparation Over 10 Kentucky Teacher Standards Differences in perception from beginning to end of program
Professional
Preparation over 10
Kentucky Advanced
Level Teacher
Standards
------------------------------
Perceptions at the end
of the program
Differences in
perception from
beginning to end of
program
Dependent Variables

19
Interdisciplinary Early Childhood Education MAE in Middle Grades
Education, MAE in Secondary Education, MAE in Special Education)?
2. To what extent do perceptions differ from the beginning to the end of the
program:
a. For all students?
b. For each strand?
3. How do personal identity and educational identity variables relate to
perceptions at the end of the program?
Significance of the Study
Teacher leadership is an emerging trend in schools for recent reforms in education
calling for change due to economic, political, and social transformations in society, as well
as technological advancements. The need for teacher leaders grows as teaching changes
from knowledge provider to community leader, administrator, classroom manager, and
mentor. In many respects, the teacher leader provides the liaison among students, their
parents, and school administrators. The research shows that teacher leaders contribute to
students’ achievement and retention rates (Silva et al., 2000), promote collaboration in
schools at all levels, and provide mentoring and professional development for staff, which,
in turn, serves as a teacher retention factor (Usdan et al., 2001). The meta-analyses of the
existing literature in teacher leadership show the importance of the modern teacher leader.
Most of the existing literature, however, concentrates on examining the new phenomenon of
teacher leadership, while little research has been done to analyze the preparation of teacher
leaders. In contrast, this study of a specific graduate teacher preparation program in teacher
leadership contributes to the general field in several ways.
First, WKU’s new MAE Programs brings preparation in education and leadership to
20
a new level, responding to the expectations of the Kentucky Education Professional
Standards Board (EPSB) and the needs of the wider society. No research has been
conducted in order to evaluate how well this program works. Assessing the program through
the expectations of college students as customers, knowledge consumers, and future teacher
leaders can provide important insights to the process of teacher leader preparation. WKU
may use the information about students’ perceptions of the leadership component of the
MAE Programs in order to improve program quality. Program graduates will benefit from
the overall process by receiving better preparation which will enhance their abilities as
teachers and leaders in both school and community.
Second, this study will add to the knowledge in the field of teacher leadership.
Previous research in this area tended to use qualitative research designs and gathered
information on existing teacher leadership practices, specifically as this phenomena plays
out in schools. In contrast, this study provides quantitative data on the program quality
related to teacher education programs in teacher leadership at the graduate level.
Third, the current study is based on Kentucky’s new teacher standards from EPSB.
Thus the study represents an assessment of graduates’ sense of preparedness for teaching
specifically on the very standards for which Kentucky teachers are held accountable. To the
author’s knowledge, no other study has utilized this approach.
Fourth, this study also examines graduate students’ perceptions of how much they
have improved or changed from the beginning of the MAE Teacher Leader Program to the
end, a perspective not commonly utilized.
Fifth, the population of the study will also differ from other studies. While previous
research has studied teacher leaders’ roles as providers of knowledge and educational
practices, this research will examine teachers as recipients of teacher leadership knowledge,
21
specifically as masters’ level students.
Sixth, the population consists of graduate students who are working professionals
and students at the same time. Much of research on teacher education has been conducted on
undergraduates. Further, undergraduate students were traditionally viewed by society as
high school graduates who were supported by parents. More recently, the college student
population has changed. Numerous studies show that the number of nontraditional college
students has increased in the past decade. According to Redd (2007), nontraditional students
do not enter college in the same year they graduate high school; rather, they have full time
or part time jobs and are financially independent. Redd projects that the number of
nontraditional college students will continue to rise due to economic problems, rising cost of
education, changes in job market, and high unemployment rates. Thus, it is likely that
several of these students in the WKU MAE in Teacher Leadership were older non-
traditional students when they attained their teaching certificates and began teaching. That
suggests that the students in this master’s program include both those traditional
undergraduate who are getting their masters at the beginning of their career as teachers (22-
25 age range) and non-traditional undergraduates who began their teaching career at a later
age (ages 26 up). Thus, this study will add to the knowledge of nontraditional students’
perceptions of the education graduate programs they attend.
Finally, the findings from the study may be used in the process of preparation for
SACS and NCATE reviews and visits. Since program standards are aligned with the
Kentucky Teacher Standards, the participants will also benefit by accessing their level of
professional preparation to teaching in Kentucky.
Limitations of the Study
The concept of teacher leader preparation is large and complex. Numerous studies
22
reflect disagreements on the definitions of teacher leadership, as well as several
contradictory theories on the concept of leadership as a whole. Trait theories define
leadership as a unique personal quality which allows leaders to influence others through
their unique personal characteristics (Steers, Porter, & Bigley, 1996). Situational leadership
studies the role of a specific context as a catalyst which allows leaders to demonstrate their
leadership potential (Hersey, 1985). Behavioral leadership concentrates on measurable acts
of the leader’s behavior (Burns, 1978). Transactional theory explains leadership as
interactions between leaders and followers (Burns, 1978). The theory of transformational
leadership defines leaders as individuals who are able to motivate others to sacrifice their
own desires to the good of larger organizational improvements (Bass, 1996; Burns, 1978).
To the author’s knowledge, there is a limited number of studies on the process of
teacher leader preparation. This study’s goal is to examine the process of teacher leader
preparation through the perceptions of graduate teacher-leader students. Each study dealing
with human perceptions has certain limitations since these responses are more subjective
than objective. Taken together, the above mentioned issues lead to some constraints in this
study on teacher leader preparation.
First, the survey relies on self-reported data, so the results might be skewed due to
subjectivity of the participants. Podsakoff and Organ (1986) reported that the limitations of
research with self-reported data are consistency, motive, and social desirability. Participants
of the study with self-reported data might maintain consistency of their answers based on
lay theories because self-reported questions require summary judgments. Participants also
might try to portray themselves positively in their answers in order to display socially
desirable qualities.
Second, non-response bias might occur because the students who choose not to

23
participate might have different perceptions than those who do participate. Javidi (2011)
noted that survey methods have become a popular tool in various business, marketing,
technological, and educational establishments. This general inundation of the public could
contribute to decreased interest by future participants to answer surveys, which could lead to
a smaller research sample.
This information overload causes individuals to develop ways for dealing with e-
mail, including the use of filtering software or the development of heuristics such as
deleting all unsolicited email without opening it. Additionally, the threat of viruses
delivered from unsolicited e-mail may discourage Internet users from reading
unsolicited e-mail. (Javidi, 2011, p. 120)
Third, the accuracy of the responses may be compromised if the participants
misunderstand the questions. While validity and reliability of the related survey instrument
from which the current was adapted was tested by Javidi (2011), and the adapted survey
instrument was tested by the panel of experts, some participants might experience personal
issues preventing them from understanding the survey questions. Such issues are beyond the
researcher’s control and could not be eliminated. Examples of such issues might include but
not be limited to personal and professional problems, health issues, or various family and
financial obligations.
Fourth, the population in the study consists of students who are enrolled in the WKU
Teacher Leader Master Program, beginning in 2010, the date of the program inception. The
students surveyed (the sample) are at the end of their coursework in TCHL 560, Action
Research for Teacher Leaders, and represent the first and the second cohorts to complete
program requirements. There are no prior graduates of the program. This limits the
generalizibility of the study because it concentrates on current MAE students and the

24
specific properties of the WKU Program. Data on the perceptions of graduates of the
program after teaching a year or more are unavailable at the time of study. Also, other
teacher leadership master’s programs may differ in the specifics of state policies,
demographic characteristics, type of university, and actual curriculum and philosophy of the
course of the study.
Fifth, the sample size was too small to analyze how the independent variables
Educational Identity represented by Grade Level Taught and Content Area relate to student
perceptions of their teaching practices.
Finally, this study examines changes in students’ perceptions of their level of
professional preparation from the beginning to the end of their program of study. However,
this research is not true longitudinal; rather, the survey utilizes a dual response set asking for
their sense of preparation as they completed their coursework. Both sets of perceptions are
collected at the conclusion of their course of study.
Definitions of Key Terms
The Education Professional Standards Board (EPSB) in Kentucky is “the state
agency that establishes standards and procedures” for teacher certification and “works
closely with local school districts in the hiring process to ensure a properly credentialed
educator in every professional position in Kentucky schools. EPSB also works with
Kentucky colleges and universities, out-of-state institutions, and national evaluation
agencies” (Kentucky Education Professional Standards Board, 2012, para. 3).
Leadership is a process by which leaders influence followers to work
synergistically toward a common goal in productive ways around organizational purposes
(York-Barr & Duke, 2004, p. 256).
Teacher leaders: teachers who assume various roles both formally and informally in

25
order to promote school and student success. They lead within their professional learning
communities by influencing others toward improving educational practices (Kantzenmeyer
& Moller, 1996, p. 5).
Kentucky Teacher Standards: the units, dimensions, or criteria for measuring teacher
effectiveness in the state, set in accordance with The Kentucky Education Professional
Standards Board requirements and SACS and NCATE regulations (Kentucky Education
Professional Standards Board Standards, 2012, p. 1).
The National Council for Accreditation of Teacher Education (NCATE) is a
professional organization which
[A]credits schools, colleges, and departments of education in U.S. colleges and
universities, as well as non-university entities that prepare educators for P-12
schools. The accreditation covers all educator preparation programs for the purpose
of preparing and developing professional educators for work in P-12 school settings,
including off-campus programs, distance learning programs, and alternate route
programs. (National Commission on Accreditation of Teachers, 2010, p. 1)
The Southern Association of Colleges and Schools Commission on Colleges (SACS)
“is the regional body for the accreditation of degree-granting higher education institutions in
the Southern states” (Southern Accreditation of Colleges and Schools, 2013, p. 1).
Teacher Leader Master’s Program: an educational program designed to provide
master’s level professional education for teachers in their selected area of certification
(WKU Teacher Leader Proposal, 2010a, p. 74).
Teacher Leader Masters Program Standards: the criteria, in standards format, for
“measuring candidate’s level of proficiency” adapted from the Kentucky Professional
Teacher Standards from EPSB in accordance with SACS and NCATE regulations (WKU

26
Teacher Leader Proposal, 2010a, p. 4).
Summary
This chapter began with an overview of the concept of teacher leadership and its role
in education in the last decade. Kantzenmeyer and Moller (2006) found that teacher leaders
improve educational practices in their learning communities. Teacher leaders have become
very important in education systems due to their “contribution to school reform or student
learning by influencing others to improve their professional practices, or by identifying and
contributing to a community of leaders” (Kantzenmeyer & Moller, 1996, p. 5). Current
educational reforms require excellence in education and call for highly qualified teachers.
However, the process of teacher preparation has been inadequate and ill equipped, according
to Levine (2006).
Traditional teacher preparation includes undergraduate and graduate degrees, which
include core content and elective classes. Researchers, such as Levine (2006) and Goldberg
(2001) pointed out that there are problems with teacher education, such as lack of practical
and leadership skills for beginning teachers. The process of teacher leader preparation has
undergone significant changes due to recent educational reforms and initiatives. Colleges
and universities have started to incorporate teacher leadership classes into their curriculum.
However, the research on teacher leader preparation is very limited.
Western Kentucky University has developed a new master’s program with teacher
leadership as its inclusion into the core courses. This study analyzes students’ perceptions of
their level of preparation toward the program standards. Students who were enrolled in the
Teacher Leader Master’s Program since 2010 who are completing the program and are
enrolled in the capstone class are asked to complete a survey about their perceptions of the
program. The survey questions are based on the Teacher Leader Master’s Program

27
Standards. The study provides information to all stakeholders about the Teacher Leader
Master’s Program quality from the students’ point of view, giving insight about program
strengths or areas of improvements.
There are certain limitations to this study, such as subjectivity (self-reported data),
non-response bias, and possible lack of interest in participation due to the over-abundance of
surveys in all aspects of human life, which may lead to a smaller survey sample. The chapter
includes definitions of key terms. The empirical research questions and the overall purpose
of the study are encompassed by the central research question: What are the perceptions of
teachers completing the WKU MAE Teacher Leader Program regarding their level of
professional preparation?

28
CHAPTER II
REVIEW OF THE LITERATURE
Introduction
This study analyzes the process of teacher leader preparation at a regional university
in Kentucky, focusing on student perceptions of the program with respect to the Teacher
Leader Masters Program Standards. Specifically the purpose of the study is to analyze the
students’ professional preparation with respect to the Western Kentucky University MAE
Program standards, which are identical to the Kentucky EPSB Advanced Teacher Standards
(Western Kentucky University, 2010a). There is limited research on professional
preparation for teachers’ educational leadership, and the WKU Program has not yet been
formally evaluated. The information from this study serves as a partial program evaluation
for the WKU MAE, and aids in the program’s future development, providing information to
the stakeholders on program effectiveness. The study also adds to the limited knowledge
base on educators’ preparation for teacher leadership.
To the author’s knowledge, research on teacher leaders has not previously been
conducted as program evaluation from the students’ perceptive. Answering the national call
for highly qualified teacher leaders, as indicated in one of the Obama administration’s
educational reforms, Our Future, Our Teachers (U.S. Department of Education, 2011),
WKU implemented new MAE Programs in the following areas: Elementary Education,
Middle Grades Education, Secondary Education, Interdisciplinary Early Childhood
Education, and Special Education. Students can also pursue a Non-Degree Planned Fifth

29
Year Program. Teacher leadership, as part of the core curriculum, was included in the above
mentioned MAE Programs. This quantitative research is a descriptive survey with
correlation design, adapted from a questionnaire by Javidi (2011) to fit the WKU MAE
Program Standards. The population for this study is MAE students in all five strands who
enrolled in the MAE Teacher Leader Program which began in winter, 2011. The population
consists of Cohorts 1 and 2, as these are the only students to have completed the course of
study at this point. Only students who maintained their sequence in the cohort are included.
All students are teachers who have a bachelors’ degree and are working on their master’s
degree or are pursuing a Non-Degree Planned Fifth Year Program. The sample includes
only the MAE students who volunteer to participate in this study. Upon the completion of
the survey, descriptive, comparative, and correlational analyses are conducted to answer the
research questions.
Several strategies were utilized to locate the research that comprises this chapter.
The wider strategy included searching the Western Kentucky University library,
Elizabethtown Community College library, Amazon, and EBSCO websites using the code
words teacher leaders, educational reforms, educational initiatives, student achievement,
leadership in education, issues in education, teacher leader master program, and teacher
leader professional preparation. Another approach was networking with the chair,
committee members, and WKU graduate students through face-to-face meetings, digital
communications, and various professional meetings, such as symposiums, presentations, and
conferences, where topics about teacher leadership and teacher professional preparation
were discussed. One key result yielded was a copy of the unpublished dissertation from
Cohron (2009). The author refined the search from other published dissertations consistent
with Cohron’s work, as well as obtaining hard and digital copies of research literature and

30
publications in accordance with the purpose of the study. The literature review examines the
development of teacher leadership, roles and functions of teacher leaders, teacher leader
education, and various educational reforms on the national and local level that led to the
creation of teacher leader master’s programs.
The remainder of this chapter covers the following topics: Educational Reforms,
Teacher Education, Teacher Leadership, and Master’s Degree in Teacher Leadership.
The review concludes with a Summary.
Educational Reforms
The goal of all educational reforms is to improve the quality of education. The focus
of recent educational reform is accountability. In the past, student achievement was the
primary measure of success in federal educational initiatives by the U.S. Department of
Education (1991, 2002), such as Goals 2000 and No Child Left Behind, respectively. More
recently, although the goal remains accountability for improved achievement, the focus has
shifted to academic standards and assessments, based on international benchmarks as a
strategy. This approach will “prepare all students for success in our global economy and
society” (Council of Chief State School Officers, 2010, p. 1).
The Common Core Standards provided teachers with the expectations for what
students should do to in each grade level. These standards were aligned with college and
career performance. This federal movement requires teachers nationwide to implement the
above mentioned standards. Team work and curriculum mapping are necessary tools in
order to create standards-based curriculum successfully. This is an important role for teacher
leaders, in which they can work as content, assessment, and curriculum specialists (York-
Barr & Duke, 2004), or as coaches, leaders, and facilitators (Katzenmeyer & Moller, 2001).
Such demands require highly qualified teachers. Related to that, the quality of teacher

31
preparation has also been included in the accountability concept at the federal level. “More
than ever before, it is imperative to have high-quality teachers. In today’s informational
economy, education has become the engine driving the future of the country and of our
children” (Levine, 2006, p. 11).
Accountability
Educational reforms set standards and demand results. In order to achieve excellence
in education, the issue of accountability has become increasingly important in modern
education. There are three types of accountability: “compliance with regulations, adherence
to professional norms, and results” (Anderson, 2005, p. 1). The goal of accountability is to
set benchmarks, measure students’ progress, and provide information when interventions
will be needed. Schools have always had accountability but the forms and goals have shifted
over time. Lately the push toward results in education (measured by student outcomes) from
American policymakers has led to numerous educational policy mandates. According to
Anderson (2005), in the past couple of decades, American education has made the shift to
accountability from being “based on compliance and professional norms to one based on
results” (p. 5). In the past, learning was based on “access and treatment” (Anderson, 2005, p.
5). Movement toward excellence in education has put the focus of accountability on learning
goals and student outcomes. A goal-oriented accountability system is based on content
standards and assessments. Within this larger movement of accountability, teachers have to
align educational strategies with content standards. Teachers are now serving as a driving
force to help direct schools as instructional leaders, mentors, and modelers of educational
strategies (York-Barr & Duke, 2004).
According to Miller and Moore (2006), accountability models contain the following
characteristics: “common high standards for all schools, statewide assessments, educators’

32
accountability for results, rewards for improving scores, sanctions for decline, with ultimate
takeover by the state for persistent failure” (p. 9). Miller and Moore found that the
accountability movement establishes close connections between schools and the business
community. Since accountability is based on learning outcomes, poor student performance
has come to be viewed as a result of inadequate teacher practices. This is a shift from the
logic of confidence model (Meyer & Rowan, 1977) in which achievement levels were
essentially attributed to the “quality” of the students (read affluent vs. at-risk) in different
schools (cf. Miller, 1992).
Miller and Moore (2006) found that accountability raises the issue of teacher
preparation. The Obama Administration has developed an initiative, Our Future, Our
Teachers, to redesign teacher education. “Supporting a strong teaching force and school
leadership is a top priority for the Obama administration. Making improvements in teacher
and leader effectiveness is one of four pillars of the Administration’s education reform
agenda” (U.S. Department of Education, 2011, p. 1). This endeavor calls for improvement in
educational preparation and brings accountability to teacher education. The plan defines
clear standards in educational preparation programs and holds states and universities
accountable for the process of teacher preparation and the quality of future teachers.
Colleges will be mandated to provide meaningful data about teacher education and its
outcomes, such as K-12 student academic success, retention rates, and qualitative data on
future teachers’ perceptions about their job readiness. Graduates and their principals will
receive surveys which they describe their work experiences. The movement toward
accountability in schools calls for accountability in teacher preparation programs.
Standards-Based Reforms
The educational initiative, A Nation at Risk, by the National Commission on

33
Excellence in Education (1983) highlighted problems in American education, particularly
students’ low achievement and inadequate high school curriculum. This report helped spur
the standards-based reform movement, the goal of which was to improve U.S. school
education. Other reforms, such as Goals 2000 (U.S. Department of Education, 1991),
America 2000 (U.S. Department of Education, 1994), and the No Child Left Behind act
(U.S. Department of Education, 2002), also focused on student outcomes and ways to
improve them.
The overarching purpose of standards-based reform was to establish unity in
education nationwide. Thus, U.S. students across the country would have the same
expectations and benchmarks in schools. The educational standards movement encompassed
two types: content standards and performance standards. Content standards are the
descriptors of what students should do, while performance standards measure the mastery of
students’ performance. Content standards help teachers set learning goals for students,
design assessments, and provide clear benchmarks for student evaluation.
Reeves (1996, p. 5) defined standards as fixed criteria that measure students’
proficiency. Marsh and Codding (1999) identified numerous benefits of standards-based
teacher practices. First, teachers, students, and their parents will have a clear and coherent
understanding of what students should be able to do in each grade level and be able to set
benchmarks for students. Second, the variety of assessments will enable teachers to have a
full picture of students’ knowledge and comprehension of the learning material, thus
allowing educators to adapt the pace of the instruction and pinpoint the areas where students
need interventions. Standards allow teachers to differentiate instruction in order to maximize
learning for each student. Third, the sustainability and the unity of the content across the
schools set by the standards will help students’ transition to other schools.

34
In order to achieve excellence in education, The Council of Chief State School
Officers (2010) developed a new initiative, The Common Core Standards. These Standards
focus on “core conceptual understanding and procedures starting in early grades, thus
enabling teachers to take the time needed to teach core concepts and procedures well and
give students the opportunity to master them” (Council of Chief State School Officers, 2010,
para. 2). Currently, 45 states, District of Columbia, Guam, U.S. Virgin Islands, and
American Samoa Islands have adopted the Standards. Common Core Standards are
implemented in English, Language Arts, and Mathematics for K-12 schools. They set
expectations on what students should know, understand, and be able to do according to their
grade level.
This federal initiative helps educators across the nation set learning goals and
provides teachers tools to help their students master the learning concepts. Students and
their parents will benefit from the standards implementation as they will have consistent
benchmarks and expectations in education from kindergarten through high school. The
standards are aligned with college requirements and work expectations, which will prepare
students for real life and allow them to compete on national and international levels in
education. The standards enable the learning community to work toward shared goals in
education.
There are several limitations of the Common Core Standards. First, “the standards do
not define the intervention methods or provide support materials” in case the students are
“well below or well above grade level expectations” (Council of Chief State School
Officers, 2010, para. 8). Second, the expectations or methods of support for special
education students or English as Second Language students are not defined in the standards.
Researchers have found that it is very important for teachers “to translate the

35
standards into actual classroom practice in terms of what and how they teach and how they
assess student mastery” (Association for Supervision and Curriculum Development, 2001, p.
1). In order to align the curriculum with the standards, share best teaching strategies, and
confirm the unity and congruency of the curriculum across the schools, educators
implemented curriculum mapping. The Association for Supervision and Curriculum
Development (2001) defines content mapping as “a process for recording what content and
skills are actually taught in a classroom, school, or district during a longer period of time”
(p. 1). The role of teacher leadership has increased concomitant with the implementation of
the Common Core Standards because educators must work together in departments on
aligning standards with curriculum mapping.
School Leadership
York-Barr and Duke (2004) define teacher leadership as “the process by which
teachers, individually or collectively, influence their colleagues, principals, and other
members of the school communities to improve teaching and learning practices with the aim
of increased student learning and achievement” (p. 287). The traditional model of school
leadership includes superintendent, principal, and other school administrators. New
leadership forms have emerged in the past decade in schools as the educational process has
become more complex in order to meet the challenges of the 21st century, such as diversity
in the school population and the ongoing economic crisis which has made resources for
schools ever more scarce. Researchers have noted new forms of school leadership:
instructional, democratic, transformational, participative, and strategic (Leithwood, Louis,
Anderson, & Wahlstorm, 2004, p. 4). Instructional leadership deals with pedagogical
practices; transformational and strategic leadership brings change to educational practices;
democratic and participative leadership involves the process of collaborative decision-
36
making (Leithwood et al., 2004). The role of teacher leaders has become more vital in
school success because principals need help in order to comply with the requirements of the
many complex school reforms (Barth, 2001).
Many researchers, such as Alverado (1997), Growther (1997), Dufour, Dufour, and
Eaker (2008), O'Hair and Reitzug (1997), Paulu and Winters (1998), and Gabriel (2005)
have studied the phenomena of teacher leadership. They define the following challenges for
a teacher leader: influencing school culture, building and maintaining a successful team,
equipping other teachers, and improving student achievement. The role of teacher leaders,
according to Gabriel (2005, p. 3) includes mentor, subject area leader, peer coach,
parliamentarian, vertical leader, back up leader, and leader who guides teams to their goals.
The research shows that these defined roles are critical in building teacher professional
learning communities which contribute to improved school culture and better student
outcomes.
Teacher Education
During the 2000s American education policymakers came to view school teacher
leaders as a key factor of success in implementing school reforms (Alvarado, 1997; Barth,
1991; Brandt, 1995; Growther, 1997; Darling-Hammond, 2003; Donaldson, 2001; Doyle,
2000; Fullan, 2001). Katzenmeyer and Moller (2001) define teacher leaders as “teachers
who lead within and beyond the classroom . . . identify with and contribute to a community
of teacher learners and leaders . . . and influence others towards improved educational
practice” (p. 5).
The need for teacher leaders is increasing as the schools have become more complex
due to the development of technology, globalization, and the increase in student populations.
“From 2008 through 2020, public elementary and secondary enrollment is projected to
37
increase to 53 million students. Undergraduate enrollment is expected to increase from 17.6
million students in 2009 to 20.0 million in 2020” (Aud, Hussar, & Kena, 2011, p. iii). The
Bureau of Labor Statistics (2012) expects the employment of kindergarten and elementary
school teachers to grow by 17 percent from 2010 to 2020. Growth is expected because of
both declines in student–teacher ratios and increases in school enrollment. Learning
communities need professionally prepared educational leaders
in order to meet these challenges.
Reform Perspectives
Numerous reforms in education call for changes in education. In 1983, the National
Commission on Excellence in Education published A Nation at Risk. This report started the
new educational standards-based reform by providing the data about the decline of
American school education. Hargreaves, Earl, More, and Manning (2001) and Henning
(2006) found that the standards movement influenced curriculum reform and school
improvement in order to develop a more rigorous curriculum. Lord and Miller (2000) and
Newmann and Wehlage (1995) found that restructuring reforms in 1990 attempted to
improve student outcomes by making changes in the organization of schooling. The school
reforms require that highly trained teachers are in place in order to educate U.S. students.
In 1990, American policymakers warned the nation about problems and presented
new policies for educators. The data presented in the federal initiatives A Nation at Risk by
the National Commission on Excellence in Education (1983) and No Child Left Behind by
the U.S. Department of Education (2002) demonstrated a decline in student achievement.
The America 2000 (U.S. Department of Education, 1994) and Goals 2000 (U.S. Department
of Education, 1991) initiatives pushed for academic achievement and led to the standards-
based movement. These reforms brought significant changes in the educational system.

38
“The initial premise of the standards reform movement was quickly transformed in some
states to a more systematic approach that covered teacher preparation, teacher evaluation,
school assessment, and student assessment” (Leithwood et al., 2004, p. 30).
The recent trend in education is the accountability movement. While a decade ago
policymakers concentrated their efforts on accountability in student achievement, recently
the focus of their attention has become the process of accountability in teacher preparation.
One of the main goals of the recent educational reforms is to improve teacher education.
Our Future, Our Teachers, proposed by the U.S. Department of Education (2011), calls for
changes in teacher preparation process. The teacher is an important component of school
success as teachers educate the future workforce of the country: the nation’s children. The
National Commission on Accreditation of Teachers (2010) developed an initiative to
redesign teacher preparation. The goal of the movement is to bring a new practice into
teacher education by including internships in schools in the teacher education process,
giving students a more hands-on approach to future job. The role of teacher as mentor and
leader will be enhanced through specially designed curricula with the inclusion of clinical
practice in teams. State and federal government will provide proper incentives for teachers
who will serve as mentors and leaders and work in high-need schools. Elmore (2000) found
that evenly distributed leadership in professional educational communities in the process of
school reforms is a key to success.
National Initiatives
The movements toward improving school education included several reforms on
federal, state, and local levels. The national initiatives include Goals 2000 by U.S.
Department of Education (1991), America 2000 (U.S. Department of Education, 1994), No
Child Left Behind (U.S. Department of Education, 2002), State Action for Educational
39
Leadership Projects (The Wallace Foundation, 2001), the Individuals with Disabilities
Education Improvement Act (2004), the Common Core Standards initiative (Council of
Chief State School Officers, 2010), and Our Future, Our Teachers (U.S. Department of
Education, 2011).
These programs were designed to help students reach their full academic potential.
In a knowledge-intensive enterprise like teaching and learning, there is no way to
perform these complex tasks without widely distributing the responsibility for
leadership (again, guidance and direction) among roles in the organization, and
without working hard at creating a common culture, or set of values, symbols, and
rituals. Distributed leadership, then, means multiple sources of guidance and
direction, following the contours of expertise in an organization, made coherent
through a common culture. (Elmore, 2000, p. 15)
The demand for teacher leaders grows because “with the changing role of the career
educator, professional preparation beyond the initial licensure phase presents some unique
concerns and issues. Educators need more than rigor and relevancy to equip them to move
student learning to higher levels” (Kentucky Education Professional Standards Board, 2007,
p. 1).
Conley and Muncey (1999), Lieberman (1994), and Urbanski and Nickolaou (1997)
found that teacher leaders make a successful impact on student achievement and that this
works on all schools levels. Taking the Lead: Investing in Early Childhood Leadership for
the 21st Century, an ecumenical report by Halfon, Hochstein, and Schulman (2002),
recommends research proven strategies on the quality of early children care and education
improvement by empowering teacher leaders. According to York-Barr and Duke (2004),
O’Hair and Reitzug (1997), Snell and Swanson (2000), Sanders and Rivers (1996), Sherrill
40
(1999), and Halfon et al., enhancing teacher leadership will improve teacher quality and
professional development as well as student learning, while teacher motivation and retention
will grow.
In 1991, the first Bush administration created the Goals 2000 initiative. The bill set
educational standards across the country. The purpose of the initiative was
[to] improve learning and teaching by providing a national framework for education
reform; to promote the research, consensus building, and systemic changes needed to
ensure equitable educational opportunities and high levels of educational
achievement for all American students. (U.S. Department of Education, 1991, p. 1)
This program was designed to make America a leader in secondary and post-secondary
education. The program created a framework for academic standards and provided funds to
the states in order to implement new standards. The program became a pivotal point in
redesigning academic standards in states.
The goal of America 2000: An Educational Strategy by the U.S. Department of
Education (1994) was to close the gap between secondary and post-secondary education,
since schools should be responsible for the quality of the education they provide. The
program also emphasized the role of technology in education.
The No Child Left Behind act by the U.S. Department of Education (2002)
concentrated on student achievement. This reform mandated school accountability
nationwide and set benchmarks in school education across U.S. schools. Minorities and
students with disabilities were the targeted population of this educational initiative.
Numerous efforts were put in place in order to improve their learning outcomes.
Urbansky and Eriksene (2000) noted the increasing role of the teacher unions as a
result of the teacher leadership movement. According to Urbansky and Eriksene, the teacher

41
union reform from 1997 caused unions to center their work on student achievement,
advancing school accountability programs, improving teacher professional development,
and teacher leadership. The researchers noted that for all the tangible gains of the teaching
profession such as decent salaries, employee benefit packages, and their success in lobbying
federally and locally for increased funding for education, teachers owe much to union
leadership.
An important step in the national teacher leader movement was the Teacher
Leadership Educational Initiative. This national program was designed by the Institute for
Educational Leadership (IEL, 2001) with concentration on teachers’ quality. Steelman,
Powell, and Carini (2000), the IEL researchers in their report, Redefining Teacher
Leadership Roles, found that the teacher is a vital part of the policy-framing and governing
process at school.
As the nation has redesigned education, the role of a teacher leader became more
important. In order to recognize and reward teacher leaders, The National Board for
Professional Teacher Standards (NBPTS) developed the set of standards and criteria for the
teachers to receive a Teacher Leader Certificate in 2009. The Core Propositions for
Accomplished Educational Leaders were created by NPBTS in 2009 as the program for the
educational leaders who seek the certification. This step demonstrates the importance of the
new role that teacher leaders play in education and has been recognized nationwide at the
board level.
American policymakers established standards in teacher preparation and the school
education process. The Council of Chief State Officers (2010) initiative allows U.S. schools
to adopt the Common Core State Standards. The Standards were designed to prepare
students for college and career by setting clear benchmarks. This process allows all

42
stakeholders to learn the school expectations in the common core curriculum on each grade
level.
The Obama Administration educational reform, Our Teachers, Our Future (U.S.
Department of Education, 2011), emphasizes the importance of teacher leadership in schools
and requires changes in teacher professional preparation by including “clinical practice” in
the college curriculum in the form of internships in schools under teacher leader-mentor
supervision (p. 13).
Numerous educational initiatives call for excellence in school education. U.S.
school educators work on preparing students to be college and career ready. In parallel,
American policymakers work on this task nationally and locally. State governments
typically support federal initiatives in improving school education.
Kentucky Initiatives
Kentucky created several programs in order to improve the academic standards in
schools. The Kentucky Educational Reform Act (KERA) was passed in 1990. It was a
response to the 1989 Kentucky Supreme Court ruling that Kentucky schools were both
inequitable and inefficient. As a result of KERA, Kentucky schools were restructured by
changing the state testing system, giving more freedom to schools in both funding and
curriculum design decisions, but also requiring schools to be accountable for improving
student outcomes, i.e., adding value to their baseline level (Miller, 1992).
The Kentucky Postsecondary Education Improvement Act by the Kentucky Senate
(1997) made an impact on the postsecondary education in Kentucky. It set several goals in
order to improve education, such as creating an integrated and strategically planned system
of postsecondary education with needs to be funded adequately to improve the quality of life
for Kentuckians to a level that is on or above national average. The Bill stated that the
43
planned investments in higher education will eventually enhance economic development of
the state by providing the highly qualified workforce that will provide additional revenue to
the state. The Bill emphasized the necessity of creating nationally recognized programs of
excellence for regional universities and the importance of the cooperation between schools
and universities in order to create such programs, thus closing the gap between school and
college preparation and improving students’ achievement.
Kentucky Senate Bill 1 by the Kentucky Senate (Kentucky Legislature, 2009, p. 10)
addressed the issue of Kentucky school graduates’ college and career readiness. The bill
focused on educational attainment and adult literacy. Kentucky state universities were
allocated funds in order to provide excellent education to their students. The bill mandated
the Kentucky Council on Postsecondary Education (CPE), the Kentucky Board of Education
(KBE), and the Kentucky Department of Education (KDE) to develop a unified strategy to
reduce college remediation rates of recent high school graduates by at least fifty percent
from the rates in 2010 by 2014, and to increase the college completion rates of students
enrolled in one or more remedial classes by three percent annually from 2009 to 2014. The
bill led to the implementation of several education initiatives impacting college readiness
and degree completion in Kentucky, such as
a) accelerated learning opportunities (focusing on the expansion of AP/IB access
and dual credit opportunities), b) Secondary Intervention Programs (focusing on the
development of transitional coursework), c) college and career readiness advising
(focusing on the full implementation of the Individual Learning Plan and
comprehensive advising programs), d) postsecondary college persistence and degree
completion (focusing on bridge programming, accelerated learning opportunities,
and student support and intervention systems). (Kentucky Legislature, 2009, section
44
22)
Teachers have to address these issues adequately and provide the needed
instructional support for struggling students as mandated by Senate Bill 1. It requires
additional teachers' professional development and training, which will be received in
modified teacher preparation programs. Senate Bill 1 also addressed the assessment and
accountability system for Kentucky schools. “It calls for a revision of standards to be based
on national and international benchmarks in order to increase the rigor and focus the content
of K-12 education” (Kentucky Legislature, 2009, para.1).
The Grade Level Curriculum Shifts by the Kentucky Department of Education
(2010) established new Kentucky Core Academic Standards. This document was a state
response to the Common Core Standards federal initiative (U.S. Department of Education,
2010). The state created new Kentucky Core Academic Standards in Science, Mathematics,
English, and History. Teachers have to implement the standards and align their lessons
accordingly. Kentucky teachers implement content mapping and pacing guides for these
educational practices. The role of the professional learning communities led by teacher
leaders increased in Kentucky schools as a result of the curriculum shift and the mandatory
unified pacing guides created for everyday instruction practices.
Fuller (2003) and McKeever (2003) found that educational change is technically
simple but socially complex, when it applies to the culture of teaching. The researchers
emphasized the importance of moving from external solutions in teaching practices to
internal solutions, where experienced teacher leaders will share their knowledge with others
and help create a new school climate. As teaching standards have been elevated, the demand
for teacher leaders has increased as a result of the greater complexity of recent curriculum
shifts in Kentucky. Thus colleges have had to address this demand by adding leadership

45
classes to their curriculum.
In 2001, The Wallace Foundation developed the State Action for Educational
Leadership Projects (SAELP I and SAELP II) in order to prepare leaders in education in
fifteen states, including Kentucky (Kentucky Education Professional Standards Board,
2007). The first project focused on preparation principals as school leaders, while the second
project concentrated on teacher leaders’ preparation. The Kentucky Education Professional
Standards Board (2007) appointed the Master’s Degree Redesign Committee to review and
redesign rank change and master’s degree programs; teacher leader development was the
focus of the new programs. The Committee set the guidelines for the revised Teacher Leader
Master’s programs, where the conceptual framework and program design were based upon
National Council for Accreditation of Teacher Education professional standards for colleges
(Kentucky Education Professional Standards Board, 2007).
The Master Degree Redesign Committee also emphasized that the programs require
strong collaboration between higher education, district administrators, and schools in the
process of implementing the revised program and teacher leader preparation. Western
Kentucky University (2010) designates Teacher Leader Masters Programs to be designed for
certified teachers who will excel in professional leadership roles in their communities. The
participating students will receive professional development in leadership, teaching
methodologies, research, areas of their specification, and technology. They will be awarded
with a professional master’s degree in their certification area upon successful completion of
the program. Kentucky is not alone in the endeavor; various universities set Teacher Leaders
Masters programs in accordance with their state Department of Education and their
educational professional standards requirements and policies. These programs typically lead
to an endorsement or certification in the Teacher Leadership area.

46
Finally, Kentucky added teacher leadership to the Kentucky Teaching Standards in
2003. The Education Professional Standards Board mandated that all Kentucky colleges
include teacher leadership in their core content classes by 2011. Thus, Kentucky initiatives
support federal reforms in order to improve school education, including the process of
teacher preparation.
Teacher Leadership
The teacher leader role evolved during the past decade as an answer to the nation’s
call for enhancing student learning and improving the learning environment (Brandt, 1992;
Katzenmeyer & Moller, 2001). Childs-Bowen, Moller, and Scrivner (2000) found that
teacher leaders cultivate change in schools, provide school administrators with much needed
support in school, outreach to the community, building school culture, and forming positive
images of their education establishment in the community (p. 28).
Teacher leaders contribute to various fields in school: they serve as mentors,
collaborators, facilitators, and curriculum and assessment experts (York-Barr & Duke, 2004;
Wagner, 2006). The capacity of serving various roles is very important for schools because
teacher leaders positively impact school culture, co-workers, and students (Growther, 1997,
p. 7).
The Changing Role of Teachers
The concept of teacher leadership is not new to the educational world. Reeves (2008)
sees the concept of a teacher and a leader as a whole, stating that teaching and leadership are
inseparable qualities. Drucker (2008, p. xxi) researched the teacher leader phenomena and
found that in the emerging postindustrial world, leadership will be dominated by knowledge
workers. Gabriel (2005) as well as Usdan, McCloud, and Modmostko (2001) noted that
schools in the past functioned in the autocratic style but with the growing emphasis on high
47
stakes testing and the advent of NCLB, many school leaders are seeking effective
organizational behavior by emphasizing leadership. The teacher role is redefined in order to
meet the challenges of newly implemented common core standards, address curriculum
mapping with pacing guides, and implement technology requirements.
Teachers as Leaders
Alvarado (1997), Coyle (1997), and Growther (1997) found that effective teacher
leadership involves parallel leadership instead of hierarchical control. Other researchers,
such as Killion (1996) and Stone and Cuper (2006), noted that modern schools need new
forms of relationship between school administrators and teachers. “Teachers are leaders
when they function in professional communities to affect student learning; contribute to
school improvement; inspire excellence in practice; and empower stakeholders to participate
in educational improvement” (Childs-Bowen, Moller, & Scrivner, 2000, p. 28). Teacher
leaders assume numerous roles and responsibilities. York-Barr and Duke (2004) describe
teacher leaders’ positions as formal and informal. Formal positions, such as department
head, mentor, curriculum specialist, are viewed as more traditional forms of teacher
leadership. Informal positions include peer coaching, facilitating teacher collaborative
practices, and modeling strategy. Teachers who assume informal leadership roles often work
as full-time classroom teachers. Thus, teacher leaders make significant impact on learning
practices in their professional communities.
Impact on culture. Wagner (2006, p. 41) defines school culture as “the shared
experiences both in school and out of school (traditions and celebrations) that create a sense
of community, family, and team membership.” Wagner noted that important components of
school culture, such as goals, vision, and mission of the organization, need to be shared by
all stakeholders. Beattie (2002) researched how teacher leaders promote the development of
48
shared values. The researcher found that teacher leaders serve as role models via openness,
transparency, and authenticity, which allow them to influence others and create teamwork.
However, Beattie found that drawbacks such as professional commitment include several
sacrifices from teacher leaders, such as work overload, lack of time, and potential health
problems due to increased stress levels.
School culture also involves “common agreement on curricular and instructional
components, as well as order and discipline, [which] are established through consensus.
Tangible support from leaders at the school and district levels is also present” (Wagner,
2006, p. 41). According to Barth (2001), York-Barr et al. (2004), and Fitzgerald and Gunter
(2008), teacher leaders play an important role in the above mentioned constructs of school
climate, serving as a mentor, instructional leader, and peer coach. Teacher leaders improve
collaboration between coworkers and enhance self-esteem in teachers and students by
nurturing “a culture of success” through sharing responsibilities and making informed
decisions as a professional learning community (Growther, Ferguson, & Hann, 2008, p. 3).
Another impact of teacher leaders on school culture is bringing a sense of stability
and trust to the working atmosphere. Barth (2001), Wagner (2006), and Anderson (2006) all
emphasized the importance of trust in school culture, vital for a healthy professional
relationship between all stakeholders.
Schools that are accomplishing the goal of all students achieving success are most
likely to have strong and stable teachers and administrators. Strength comes from factors
such as greater content knowledge and visionary instructional leadership. Stability, in terms
of commitment to the school over time, is needed to shape the school culture and climate.
Stability enables the development of relationships with parents and the community that are
anchored in mutual trust and focused upon students’ present and future needs (Anderson,

49
2006, p. 4). Thus, teacher leaders impact school climate by developing a sense of trust as
key stakeholders in the school culture. Trust creates a positive learning environment for
students and coworkers, improves academic achievement, and fosters better relationships
with parents.
Impact on students. According to Wynne (2001), Hinchey (1997), and Hoerr
(2005), the ultimate measure of the contributions of teacher leaders is their impact on
student academic performance. Lieberman (1994), Leithwood and Jantzi (1999), Conley and
Muncey (1999), Reeves (2008), Urbanski and Nickolaou (1997), Growther et al. (2008), and
Nye, Konstantopolous, and Hedges (2004) all found that teacher leaders make a positive
impact on overall school success during a time of school reform. Wynne (2001) noticed,
however, that although teacher leaders play important roles in student achievement, other
factors are necessary to bring about all reform goals, such as support of the school
administration and adequate funding.
Cain and Caine (2000), Usdan et al. (2001), and Hatch, White, and Faigenbaum
(2005) emphasized their support for transformational leadership, which evolved in schools
in the past decade. Goldberg (2001) found that the teacher leader movement is an important
part of a democratic process in schools. “Parallel leadership represents a more advanced
form of a democratic process than is to be found in the bureaucratically derived concepts of
leadership that have dominated schools in the past” (Goldberg, 2001, p. 757). Barth (2001),
Glikman, Gordon, and Ross-Gordon (2001), and Katzenmeyer and Moller (2001) also
support these findings, emphasizing that it will benefit the larger community when students
learn the importance of sustaining the democratic form of government.
Impact on co-workers. Growther et al. (2008) found that teacher leaders play an
important role in decentralization of the power at schools. Teacher leader practices include
50
parallel leadership in which teachers are involved in making decisions. According to this
research, shared decision making promotes teachers’ involvement in school life and fosters a
sense of belonging, reduces isolation, and leads to overall positive work experience in
teachers. Teacher efficacy plays an important role in overall job satisfaction, teacher
retention, and learning practices.
Teacher leaders promote teacher retention by coaching beginning teachers.
According to Ingersoll and Strong (2011), the lack of professional support is one of the main
reasons why one out of five new teachers leave within three years and almost 50 percent of
teachers leave within the first six years. Reeves (2008) and Ingersoll and Strong (2011) both
found that teachers who don’t receive mentoring and encouragement on an ongoing basis
are more likely to leave school. One of the teacher leader roles is mentoring coworkers,
which will give beginning teachers the support they need to do their job well and stay in the
profession.
Reeves (2008) stated that in the past decade teacher professional development
changed. He developed the new teacher leader framework, where action research by teacher
leaders and school administrators became the core component of professional development.
This practical application of teacher leaders’ knowledge and experience is extremely
important in the age of technology when schools are required to prepare students for the
worldwide competitive workforce in an environment in which science achievements create
the need for complex, high level skills.
Reeves (2008) found that a school leadership crisis is coming because about half of
school administrators will be eligible for retirement in the next five years. The problem will
be solved not by retention of prior administrative leadership practices, but by a new
approach that embraces leadership at every level. Muijs and Harris (2006) found that
51
parallel leadership will help school administrators address students’ needs and share the
increasing responsibilities of 21st century education.
Barriers
There are several barriers to teacher leadership development in schools. Muijs and
Harris (2006) and Fitzgerald and Gunter (2008) found that increased responsibilities and
workload prevent many teachers from practicing leadership. The increased demands of
standardized testing and curriculum mapping add to the overall workload and other teacher
responsibilities, such as club sponsorship, coaching, and supervising students during various
school-related events. The additional responsibilities associated with teacher leadership may
prevent current teachers from becoming teacher-leaders.
Another barrier to the development of teacher leadership is the lack of tangible
rewards for the extra workload of teacher leaders. Fitzgerald and Gunter (2008) found that
teacher leadership has become widespread at schools, but there is no salary increase for
teacher leaders. The question about proper compensation for the additional work of teacher
leaders requires thoughtful research and attention of American policymakers, but is beyond
the scope of this study. In that regard, Gabriel (2005) noticed that school leaders are semi-
balanced between having authority and being regular workers but have no formal power.
This opens a wide avenue for policymakers and future research in that area.
According to Barth (2001), Fitzgerald and Gunter (2008), and York-Barr et al.
(2004), relationships with coworkers might threaten teacher leader practices. Some
colleagues feel competition from teacher leaders, especially in a tightened job market and
hard economic conditions. Those tensions can damage healthy professional interactions, put
additional pressure on teacher leaders, and might even prevent them from taking teacher
leader roles.

52
Benefits
Teacher leaders provide numerous benefits to all stakeholders. Growther et al.
(2008) found during two decades of research that teacher leaders provide the following
positive outcomes for all stakeholders. Teacher leaders convey convictions about a better
world by articulating a positive future for all students and contributing to an image of
teaching as a profession that makes a difference (Growther et al., 2008, p. 3). Teacher
leaders also improve pedagogical practices by participating in shared decision-making and
professional development activities; providing liaisons between students, teachers, and
school administrators; establishing networks inside and outside school for educational
support; enhancing school culture by celebrating success; and fostering self-respect in
students and job satisfaction in coworkers (Growther et al., 2008, p. 3). The last, but not
least benefit of teacher leadership is improved student learning. Cohron (2009) conducted a
study on teacher leader interactions with teachers and the effect it makes on student
achievement. She found a positive correlation between student academic success and
teacher leadership.
Master’s Degree in Teacher Leadership
Keaster and Schlinker (2009) found that Teacher Leader Masters Programs offer
numerous benefits for participating teachers: (a) provide greater teachers’ understanding on
the process of schooling at all levels; (b) reduce teachers’ stress caused by unawareness of
the nature of school administrators job by understanding the process of decision making on
all school levels; (c) give teachers skills to deal with school issues which will promote their
independence in decision-making process; (d) enhance the role of teacher to teacher leader;
(e) enhance teachers’ knowledge; (f) make administrators’ job easier due to teachers’
understanding of the school decision-making process; and (g) make their organization more
53
effective and efficient (Keaster & Schlinker, 2009, p. 90).
Overview of Teacher Leader Programs
Since educational reforms and technology development require a new type of
teacher, the new teacher leader education program emerged nationally and locally, in
programs such as the Jacqueline B. Vaughn Graduate School for Teachers, Chicago, IL; the
Center for Educational Leadership, California State University, Hayward, CA; Teacher
Leadership, Wheelock College, Boston, MA; Teacher as Leader, University of Wisconsin-
Milwaukee; the Teacher Leader Program, Wright State University; and the Urban Teacher
Leadership MS at Georgia State University. Many universities spearheaded programs where
a teaching degree is combined with the certificate in the special area for teacher leaders.
The Usdan et al. (2001) research on the teacher leader phenomena shows that this
trend changes the process of teacher preparation. In response to teacher leader preparation,
universities and colleges in America broadened teacher training programs by blending
undergraduate and graduate programs, where students gain two degrees and/or certifications
in five years. Various programs were created by colleges in response to the need for
providing an adequate work force for modern schools: teacher internships, professional
development programs, certification programs, etc.
The growing competition between colleges, the need for teachers on the job market,
and the demand for a marketable degree created a trend in college programs: the teaching
degree with additional license or certification. Nationwide universities have started to
develop various programs for the modern teacher: a working professional who already holds
a degree and pursues additional certification or tries to upgrade his/her level of education.
Examples of such programs include The California Math/Science Teacher Corps Project at
California, The Project Promise in Colorado, The Delta Effective Leaders in Teaching in
54
Virginia, The Navaho Teacher Educational Program, and others (Usdan et al., 2001).
WKU’s MAE in Teacher Leadership
Western Kentucky University implemented the Teacher Leader Master (MAE)
Program in 2010. The framework for the program was based upon Danielson’s (2006)
research on teacher leadership. It includes teacher leaders’ collaboration and networking on
various levels within and beyond the school, with student learning as the main component of
the program. Lave and Wenger (1991) emphasize the importance of learning in the
professional community by being submerged in that community's values, history, beliefs,
and rules. The shared knowledge enhanced participants' educational success. This
partnership helps teacher leaders extend transformational leadership beyond their
professional educational settings. Teachers are partners with all stakeholders, including
students’ families, community stakeholders, and colleagues. The teacher leaders
communicate within the department and across the school to reach the community,
according to Danielson’s (2006) model. MAE Programs promote learning in professional
learning communities as the teachers continue to work and study at the same time.
The WKU Teacher Leader Program Proposal (2010) lists the following core
obligation “on which WKU MAE programs are conceived: teacher leadership is
collaborative and inclusive, teacher leadership is transformative, teacher leadership is
grounded in knowledge of learners and subject matter, teacher leadership is a professional
commitment” (p. 3). The Response to Intervention model (RTI), which is a part of the 2004
Individuals with Disabilities Education Improvement Act (IDEIA), is included in the
Teacher Leader Master Program Curriculum. The program concentrates on placing highly
qualified teachers in every classroom.
Western Kentucky University has developed a Teacher Leader Masters and Planned

55
Fifth-Year Program endorsed by the Kentucky Education Professional Standards Board,
leading to certification rank change. The importance of preparing teacher leaders is to
improve student achievement, teacher collaboration, and overall teaching practices. The
Teacher Leader Masters Program goal is designed to close the gap between teacher
preparation and teaching practice that directly impacts student learning. The Program
transitions teachers from the world of theoretical knowledge to the translation of real-world
classroom instruction. In order for students to learn at high levels, the teachers instructing
them must do the same. The MAE Program is the bridge between theory and practice that
provides the resources and support needed to raise beginning teachers’ professional skills to
high quality, accomplished teaching practices. The Program promotes daily collaboration
and team building, further development of teachers’ knowledge base, and refining the use of
curriculum maps and content pacing for classroom instruction.
Program description. The Program beliefs are based on research from Marzano
(2007), Sanders and Rivers (1996), Reeves (2004), the National Board of Professional
Teaching Standards (2002), and others. The list of the WKU Teacher Leader Masters
Program beliefs is located in Appendix A. The admission requirements include a GPA of
2.75 or above, being a graduate of a higher education institution, and a valid Kentucky
teacher certification.
The Teacher Leader Master’s Program is divided into two instructional levels. Level
1 provides pedagogy, leadership, and content applicable to all P-12 teachers working across
the wide gamut of developmental levels and content areas. Level 2 directs the candidate into
an individual program in content, pedagogy, and areas of professional growth concurrent
with the goals of each candidate. An action research project is required for completion of the
program. This focuses on classroom, school, or district issues. The delivery options for
56
classes include face-to-face meetings, online instruction through Blackboard and other web-
based classes, and small group meetings.
The Teacher Leader Master’s Program will move teachers toward acquiring
advanced levels of teacher proficiency in teaching and learning, partnering with families and
community stakeholders, and becoming leader/collaborators within their classroom, school,
and beyond. The fact that MAE participants will study in their learning communities
provides them hands-on experiences in leadership skills in their learning communities, both
in classrooms and with their coworkers. On a broader level, the Kentucky Department of
Education has a huge stake in the effectiveness of the Teacher Leader Masters Programs,
since the state is held accountable by No Child Left Behind and Kentucky has its own
Unbridled Learning accountability system (Kentucky Department of Education, 2010).
Program content and structure. The Teacher Leader Master’s Program
development was based on EPSB guidelines. Several meetings with P-12 teachers and focus
groups were conducted by WKU in order to establish the program. Local superintendents
will support the program since the program is designed for teachers who currently hold
Kentucky teacher certificates in order to move them to the master’s level, according to the
WKU Teacher Leaders Masters Program Graduate Program Documents (2010). The
conceptual framework includes WKU’s professional vision and mission: to prepare students
to be productive, engaged leaders in a global society and to provide service and lifelong
learning opportunities for its constituents (see Appendix B for WKU vision and mission).
The goals of the program are to impact students’ learning directly; to include a
professional educational core based on pedagogy, leadership, and content; to allow for
individualized programs of study; and to empower teachers to address authentic needs in
classroom management, differentiated instruction, and student learning (Evans & Powers,

57
2011, p. 2). The program has a set of standards in order to measure student’s proficiency
(see Appendix C for WKU MAE Standards).
The Western Kentucky University Teacher Leader Masters Program offers graduate
degrees in Elementary Education, Middle Grades Education, Secondary Education,
Interdisciplinary Early Childhood Education, and Special Education with a focus on
Learning and Behavioral Disorders or Moderate and Severe Disabilities. Upon completion
of the program the participants will be awarded a Master of Arts in Education degree. The
individual program requirements vary depending on the area of teaching of the participant.
Interdisciplinary Early Childhood Education. Interdisciplinary Early Childhood
Education is a program for prospective teachers who will work with the following age
groups: Birth through Kindergarten. The future graduates will work with children from birth
through five years in K-12 school system, public or private child care centers, and various
child programs, serving as liaisons between school administrators, children families, and
educational learning communities at large.
The Teacher Leader Masters Program in Interdisciplinary Early Childhood
Education for Teacher Leaders requires 36 credit hours, divided between Professional
Education (18 hours) and a Specialization (18 hours).
Elementary Education. The Teacher Leader Masters Program in Elementary
Education for teacher leaders requires 9-16 credit hours of Professional work and 15-21
hours of individual program. There are the following endorsements and areas of
specialization available: Elementary Education, Educational Administration, English as a
Second Language, Environmental Education, Gifted and Talented Endorsement,
Instructional Technology Endorsement, or Math Endorsement.
Middle Grades Education. The Teacher Leader Masters Program in Middle Grades

58
Education for Teacher Leaders requires 30-37 hours, where 9-16 hours will be in
Professional education, and 14-41 hours in Specialization, such as Exceptional Education,
Interdisciplinary Early Childhood Education, Library Media Education, or Literacy of
Psychology. Endorsements such as English as a Second Language, Gifted and Talented,
Environmental Education, or Instructional Computer Technology are also offered.
Secondary Education. The Teacher Leader Masters Program in Secondary
Education for Teacher leaders requires 30-37 hours. Students complete a major in one of the
following certification disciplines: Art, Biology, Chemistry, History, Music, Secondary
Education, or a minor in one of the following areas: Agriculture, Art, Biology, Business and
Marketing Education, Chemistry, Earth and Space Science, English, Family and Consumer
Science, French, German, Health, History, Technology Education, Math, Physical
Education, Physics, Secondary Education, and Spanish. The program also allows for
including an endorsement for the following areas: Gifted and Talented, English as a Second
Language, Environmental Education, and Instructional Computer Technology. The program
consists of 9-16 hours of Professional Education and 18 hours of Specialization.
Special Education. The Teacher Leader Masters Program in Special Education for
teacher leaders is available in two certification areas: Moderate and Severe Disabilities or
Learning and Behavioral Disorders. The program requires 30-37 credit hours with 16 hours
in Professional Education and 21 hours in Specialization. The Specialization is available in
the following areas: Special Education Curriculum, Special Education Behavior/Classroom
Management, Special Education Collaboration, Special Education Assistive Technology.
For students who chose Moderate and Severe Disabilities certification, the Autism Spectrum
Disorders Certificate is available and requires four Autism Spectrum Disorder Courses in
addition to the program of study.
59
Proficiency evaluations. The proficiency evaluations are offered for all programs as
an optional evaluation for MAE Program graduates when students can demonstrate
proficiency of course objectives and assessments. Students have to meet with the advisor
and determine the course they will choose to demonstrate proficiency prior to registering for
the chosen course. They must complete the online application in order to be permitted to
have proficiency evaluation prior to taking the proficiency evaluation.
The proficiency evaluation includes Test I and Test II for the following classes:
Instructional Strategies, Equitable Schools, Managing Learning Environment Assessment,
Fundamentals, Assessment II Standardized Testing, and Assessment III: Classroom Tests.
The student has to receive a passing grade of 90% on Test I, and after that he/she can take
Test II. The student has to receive a “pass” score on the Test II. The time limit for Test I is
two hours, and three hours for Test II. According to WKU MAE Program policies, the
student has to pass both tests in order to demonstrate proficiency. Both tests are scored by
the School of Teacher Education Graduate Faculty. According to Teacher Leader Program
Representative, Dr. Murley (personal communication, September 3, 2014), no students
passed Test I; therefore, no one qualified for Test II.
Theoretical Perspective
This study is based generally on transformational and constructivist theories
identifying the teacher leader role in education. Burns (1978) emphasized a transformational
role for teacher leaders, who “engage with others in such a way that leaders and followers
raise one another to higher levels of motivation and morality” (p. 20). He saw
transformational leadership as a process where leaders inspire followers, where both parties
are mutually involved in changing the working atmosphere for the better.
Leithwood and Janti (1999), Carr (1997), Hatch, White, and Faigenbaum (2005)
60
added to this theory the importance of shared decision-making, teacher empowerment, and
fostering school and community relationship, and teamwork.
Constructivist theory, developed by Piaget (1977), explains the mechanism of
learning through experimenting and reflecting. More recently, Brandt (1992), Hord (1997),
and Silva et al. (2000) added a new approach to constructivism in educational leadership by
developing the concept of collaborative practices and professional learning communities.
According to Canella and Reiff (1994) and Kroll and LaBosky (1996), the constructivist
approach changed the method of teaching from a didactic, memory-oriented transmission
model to an active engagement and problem solving model. The role of teacher leaders
became more vital in professional learning communities. Coyle (1997), McKeever (2003),
and Growther et al. (2008) found that teachers who are engaged in collaboration help
improve school culture, which is a very important component of a learning climate. Silin,
Mulford, and Zarins (2002) found that teacher leadership influences student engagement
with schools and affects the development of students.
More specifically, the WKU Teacher Leader Master’s Program is based on
Danielson’s (2006) framework for the teacher leadership concept, which is grounded in the
constructivist view of teaching and learning. The Conceptual Framework for the WKU
Teacher Leader Program was developed by using an alignment matrix, which included the
following components: NCATE standards, Kentucky Teacher Standards, and the WKU
Conceptual Framework. NCATE standards “establish the shared vision for a unit’s efforts in
preparing educators to work in P–12 schools” and “provide direction for programs, courses,
teaching, candidate performance, scholarship, service, and unit accountability” (NCATE,
2009, p. 1). These standards measure teacher preparation in the following areas: knowledge,
skills, and professional disposition; assessment system and unit evaluation; field experience

61
and clinical practice; diversity; faculty qualifications, performance, and development; unit
governance and resources. The Kentucky Teacher Standards measure teacher professional
preparation. Finally, the WKU Conceptual Framework is also framed within the university’s
vision, mission, and beliefs.
Current Research
In the past few decades teacher leadership has become an important part of school
education. There is extensive research on this phenomena and its effect on student
achievement. While many researchers noticed that there is a direct correlation between
implementing teacher leader practices and overall school success, Cohron (2009) analyzed
the particular effect teacher leaders have on student learning in Kentucky schools. Cohron
studied teacher leadership and its effects on students’ achievement as measured by the
Kentucky Core Content Test (KCCT). The researcher used Lambert’s (1998) framework in
order to construct the study. This framework consists of five elements which refer to the
interactions between teachers, students, teacher leaders, and school administrators and
student achievement. Student achievement is measured by various assessments and utilized
as benchmarks for interventions in order to help students succeed. The economic aspect of
teacher leadership in school was also shown in Cohron’s (2009) research by testing and
confirming the hypothesis of teachers’ leadership having a positive influence on the
improvement of student learning outcomes. Cohron found that some school districts
questioned the effectiveness of investments in teacher leaders during budget cuts and the
effectiveness of teacher leadership on student achievement
Cohron (2009) used a non-experimental study design and standard multiple
regression in order to analyze the data. Independent variables were derived from Lambert’s
(1998) framework and included activities in the following areas: leadership, use of
62
information in shared decisions, collaboration practice, innovation, and analyses of learning.
This researcher studied the specific behavior of the teacher leaders in the above mentioned
areas. Ethnicity and socioeconomic factors were also included as independent control
variables since these dimensions affect responses. Ethnicity was measured by the percentage
of African American students in the population, and socioeconomic status was measured by
the percentage of students on free and reduced lunch. KCCT test scores in Kentucky
elementary schools in 2008 were the dependent variable.
Cohron (2009) adapted Lambert’s (1998) Leadership Capacity Staff Survey. The
survey items clustered around five areas of teachers’ behaviors associated with leadership
practices. The answers ranged from 1 to 5, where 1 was associated with Not Observed and 5
with Can Teach Others. The survey was e-mailed to participants. A panel of experts
addressed the validity of the test instrument, and test/re-test procedure was used to confirm
reliability. The population consisted of 2526 Kentucky public elementary school teachers
from 83 schools in 23 districts in 2008-2009. The sample (N = 573) represented a 23%
return.
The findings also showed a moderate negative correlation between student
achievement and ethnicity (-0.280, p < .01) and socioeconomic status (-0.280, p < .01).
Findings also show positive correlation between student achievement and leadership
constructs: leadership work (.211, p < .01), shared decisions (.205, p < .01), collaboration
(.197, p < .01), and analysis of learning (.229, p < .01). The research showed that teacher
leadership is positively associated with student learning, although the correlations were
weak (a .2 correlation has an effect size of only .04). The factor that influenced student
achievement the most was analysis of learning (Cohron, 2009).
There were several limitations to Cohron’s (2009) study. The sample selection

63
included only elementary teachers in Kentucky, which limited generalizability of the study.
Also, such variables as improved student learning and effective classroom instruction could
not be measured directly. Response bias is obviously a possibility as well with only 23%
returning the survey.
There is limited research on teacher leader preparation. While studies show the
positive effect teacher leaders have on schools, the process of teacher preparation itself has
not often been the focus of researcher attention. The Mainous (2012) study of teacher leader
preparation programs provides analysis of Teacher Leader Master’s of Education Programs
and their effectiveness based on program goals and standards. Mixed methods research was
used. In order to analyze Teacher Leader Program goals and their alignment with Teacher
Leader standards, the researcher used a qualitative approach. Five schools were randomly
selected out of all institutions in the study, and an analysis of the content of syllabi was
performed. The goals and skills discovered in the leadership programs were compared with
Teacher Leader Model Standards from the Teacher Leader Exploratory Consortium.
Mainous used frequencies and percentages in order to find out what type of institutions offer
master’s programs in Teacher Leadership and what courses are included in them.
The population included colleges accredited by The National Council for
Accreditation in Teacher Education (NCATE) and consisted of 656 schools. Mainous
(2012) used The Carnegie Classification by the Carnegie Commission on Higher Education
(2010) as a framework for college classification. For the purpose of the study, the
geographic locations of colleges were also used. The framework came from the 2010
Census Division of the United States, where the country was divided into four regions:
Northeast, Midwest, South, and West. Each region has nine divisions. Frequencies of
college placements were calculated to find out the common trends in their locations. The

64
description of the Teacher Leader Master’s Programs included number of credit hours for
core and elective classes, the type of classes offered, and their method of delivery.
Frequencies also were calculated to determine what new themes were being developed in
teacher leader education.
Mainous (2012) found that only 28 (4.2%) of 656 NCATE schools have Teacher
Leader Master Programs. Out of these 28 schools, 27 were education-focused large or
medium sized four year schools, and one school with a low-enrollment profile of 1,000-
2,999 students was awarding Masters of Art in Education degrees only. Out of the above
mentioned 28 schools offering Teacher Leader Master Programs, 85.6% were located in the
Midwest or South.
Mainous (2012) found that this could be possibly influenced by the fact that this
region belongs to a five-state consortium which promotes teacher leadership. In particular,
Kentucky mandated the inclusion of Teacher leadership courses in all Master of Education
programs. Overall, 42.8% of the schools with teacher leader graduate programs were coded
as Master’s in Education, 39.2% as Master’s in Arts, and 17.7% as Master’s in Science. The
highest frequency (88.7%) had a total requirement of 30-36 hours. The maximum amount of
hours was 48, which may prevent potential students from getting a Teacher Leader degree
due to tuition cost and return on investments. Core content hours ranged from 12 to 48.
Elective hours vary by institution, but the highest frequency (35.7%) had zero electives,
which showed rigid course requirements scheduled by colleges for these Teacher Leadership
courses. For the delivery method, there was a range across on-campus classes (39.4%), a
combination of online and face-to-face classes (39.2%), and online classes (21.4%). The
core classes included school law (35.7%), research (17.8%), collaboration (4.8%),
community relations (2.0%), philosophy (2.0%), and advocacy (0.8%).
65
The fact that all information about colleges was found on college websites was one
of the research limitations for this study because online information could be inaccurate or
outdated. Another limitation was the small sample size which could limit the number of
themes discovered during the research provided by Mainous (2012) on teacher leader
preparation programs.
Javidi (2011) conducted a study at the University of North Carolina, Charlotte. The
objective of the study was to analyze student and graduate perceptions of the quality of the
university’s teacher preparation program according to the National Association for the
Education of Young Children (NAEYC). Javidi used NAYEC standards for the assessment
of the student perceptions. The goal of NAYEC is to improve professional preparation
practices for elementary school teachers. The organization developed five standards for
teacher preparation. Colleges, accredited by NAEYC, use these standards as a tool for
program assessment and improvement. The University of North Carolina received NAEYC
accreditation in 2007.
The research questions analyzed students’ perceptions toward their professional
preparation according to NAYEC standards and examined the benefits of the program and
the areas of the program that need improvement. Javidi (2011) used the survey method in
order to collect data from the students. The survey questions addressed students’
demographics (12 questions) and students’ perceptions of their level of preparation
according to the North Carolina Professional Teacher Standards (25 questions). Seven
questions were open-ended and addressed program strength and weaknesses. To test the
validity and the reliability of the survey, Javidi used a panel of experts to establish face
validity of the survey. Two faculty members examined the survey items clustered around
NAEYC standards. The experts independently determined that all survey items measured

66
NAEYC standards with 100% agreement. Content validity was established by examining
the elements of the NAEYC standards. The experts agreed that each survey item matches
the corresponding standard. A pilot study was conducted in 2010. The sample consisted of
15 students who agreed to participate. All were females. It took them between nine to fifteen
minutes to complete the survey. Out of 15 students, 14 agreed that the survey questions are
easy to understand, and one responded “neutral” to this question. Internal reliability was
measured as greater than 0.7 for Cronbach’s alpha, the accepted minimum for scale
reliability (Nunnally & Bernstein, 1994). Inter-item correlations for the survey questions
ranged from 0.48 to 0.90.
The surveys were e-mailed to graduated students. Each e-mail sent to a potential
participant had a web link to the survey to ensure that responses would be anonymous. The
researcher used Teleform, a website supported by the institution. The population consisted
of 938 students graduated in 2006 and 2007. The sample included 96 College of Education
graduates in 2006 and 2007 that completed the survey (10.2%). Javidi (2011) used a mixed
method approach. Student perceptions were analyzed using frequencies, means, and
percentages. Content analysis was employed for the open-ended questions about program
benefits and weaknesses.
The researcher found that students felt well prepared for the teaching job. The
strengths of the program were the areas of instruction planning and implementation. The
area where student preparation needed improvement was the education of diverse learners
which included students in special education, English as a Second Language, as well as
from low income families. Javidi (2011) found that graduates felt that they were prepared
for the teaching jobs.
The survey had several limitations. First, the college did not keep up with the

67
database of the graduates’ personal e-mails. The researcher used graduates’ college e-mails.
It was obvious that some graduates did not check their college emails after graduation, so
they ended up being non-responders. Another limitation was non-responder bias, related to
the very low response rate. The results of Javidi’s (2011) research might be used for
program improvement and for NAEYC re-accreditation.
Summary
Western Kentucky University, a leading American University in teacher preparation,
designed and implemented a new Teacher Leader Masters Program, which allows students
to receive a degree or an advanced rank if students are pursuing the Non-Degree Planned
Fifth Year Program in their teaching area as well as professional preparation in leadership.
This chapter researched national and local initiatives that led to the creation and
development of the MAE Programs at WKU. The goal of this research is to evaluate MAE
Programs at WKU by examining students’ perceptions of the program according to the
program standards which are the same as Kentucky’s EPSB Advanced Level Teacher
Standards. In summary, the creation of the MAE Program is a response to national and local
need for teacher leaders as a critical component of bringing excellence to American
education. However, the WKU MAE Program inception began in 2010, so further research
is needed to evaluate student perceptions of the effectiveness of the WKU MAE Program.
The research on teacher leadership shows that teacher leaders bring positive changes
to their communities and work as agents of change (Barth, 2001; Cain & Caine, 2000;
Darling-Hammond, 2006; Fullan, 2001; Growther, 1997). The existing literature reveals that
teacher leaders create nurturing school environment, promote positive school culture, and
drive school improvement. The need in teacher leaders as transformational agents of change
grows nationally because, on one hand, there is growth in the student population. On the

68
other hand, numerous educational initiatives require schools to bring extensive changes to
their practices.
Teacher leadership became a necessity in schools due to recent reforms oriented
around excellence of school education. “The reform movement put a spotlight on school
leadership, highlighted its importance for school success, made student achievement the
measure of school performance, and demanded accountability from leaders for results”
(Levine, 2005, p. 17). Reforms called for changes in schools, requiring teachers to put high
emphasis on student achievement.
In order to address these requirements, colleges and universities responded with
modified programs of teacher preparation. Leadership components were included in the
curriculum of teacher graduate programs nationwide. Teacher leadership is a tool of success
in schools. According to Burns’ (1978) transformational theory, transformational leadership
enables leaders to inspire and motivate their followers and improve the working climate in
their communities. Brandt (1992), Hord (1997), and Silva et al. (2000) researched the
constructivist approach to educational leadership wherein collaboration in professional
learning communities initiated by educators improves students’ learning outcomes.
Cohron’s (2009) study demonstrated the positive effect teacher leaders have on a learning
community.

69
CHAPTER III
METHODOLOGY
Introduction
Numerous studies have been conducted on the topic of teacher leadership in the past
decade. The research shows that teacher leaders serve as agents of change in schools.
Within every school there is a sleeping giant of teacher leadership, which can be a
strong catalyst for making change. By using the energy of teacher leaders as agents
of school change, the reform of public education will stand a better chance of
building momentum. (Katzenmeyer & Moller, 2001, p. 2)
However, the preparation of teacher leaders is just coming to policymakers’ attention.
A recent initiative of the Kentucky EPSB mandated the inclusion of leadership
courses in the Master’s of Art in Education (MAE) curriculum in Kentucky universities.
Given the very limited research done on the topic of the teacher leader preparation, the
purpose of this study is to examine students’ perceptions of the WKU MAE Program
students regarding the quality of their MAE Program, based on the MAE Program standards.
Utilizing survey methods, these perceptions serve as a partial program evaluation of the
WKU MAE Program.
Chapter III describes the methodology for the study and consists of the following
sections: Introduction, Research Design, Population and Sample, Research Questions,
Instrumentation, Description of the Variables, Procedures, Missing Data, Data
Analysis, Validity and Reliability, Ethical Considerations, and a Summary. Of note is
70
the distinctive instrument used in this research, a descriptive double matrix survey (students’
perceptions of their level of preparation for teaching for the beginning and end of the
program), based on the WKU Program standards, as adopted from the Kentucky EPSB
Advanced Level Teacher Standards, with demographic questions included.
Research Design
The purpose of this research is to evaluate the quality of the newly revised MAE
Programs in a comprehensive regional university in Kentucky. The study design is a
descriptive quantitative survey research utilizing comparison of pre-post data. In that regard,
the data also serve as a partial program evaluation of the WKU Teacher Leader Master
Programs. Beyond the descriptive results, the author explores relationships between socio-
demographic factors, the five program strands, and the 10 teacher standards.
Population and Sample
The population includes the first two cohorts of the MAE Program students from
2010, the year of the program’s inception. There are five different areas of the MAE
program specialization: Elementary School, Middle School, Secondary School,
Interdisciplinary Early Childhood Education, and Special Education. The students are
working professionals who already have a bachelor’s degree and teacher certification. All
participants are using the MAE Program to meet Kentucky’s requirements that all teachers
obtain a master’s degree or the 32 hour Non-Degree Planned Fifth Year Program. The
students come from various backgrounds, but the majority of them graduated from WKU,
according to Dr. Lisa Murley (personal communication, April, 3, 2014). The program
consists of online classes with the inclusion of optional face-to-face meetings during class
presentations. For the Specialization Component, students may choose between online and
regular face-to-face classes, but the frequency of each method of course delivery is based on
71
students’ class selection.
The opportunity to become a participant in the research is given to each MAE
student in both Cohort 1 and Cohort 2. Specifically, the population as defined here includes
only those cohort members who completed the program in sequence. Any students who fell
behind their cohort would not have been part of this study. The class selected for survey
participation was the final capstone class, with the approval of Dr. Lisa Murley, Program
Representative. Participation in the study was strictly voluntary. Thus, the sample consists
of MAE Cohort 1 and Cohort 2 members who completed the survey given to all students
completing the capstone class. (Students were not placed in a cohort per se, but became part
of these two groups through enrollment in the first or second semester of the program.)
Research Questions
For the readers’ convenience, the research questions are repeated from Chapter I.
From the perspective of students in the Western Kentucky University MAE Teacher
Leader Program regarding their level of professional preparation:
1. What are student perceptions at the end of the program:
a. For all students?
b. For students in each strand (MAE in Elementary Education, MAE in
Interdisciplinary Early Childhood Education MAE in Middle Grades
Education, MAE in Secondary Education, MAE in Special Education)?
2. To what extent do perceptions differ from the beginning to the end of the
program:
a. For all students?
b. For each strand?
3. How do personal identity and educational identity variables relate to

72
perceptions at the end of the program?
Instrumentation
The survey model utilizing program standards to check student perceptions about the
level of preparation toward their future teaching positions was adapted from Javidi’s (2011)
study of student perceptions of early childhood program quality according to the National
Association for the Education of Young Children. The permission to adapt that instrument
was received from Dr. Javidi via e-mail (see Appendix D).
The first part of the current survey has a set of demographic questions while the
second part explores student perceptions about the level of professional preparation at the
beginning and at the end of the MAE teacher leader program. The questions in the second
part of the survey clustered around the ten MAE Program Standards, which are the same as
the ten Advanced Level Kentucky Teacher Standards. Each standard has a set of three to
five sub-standards with yields a total of 45 sub-standards. The participants were offered a
choice of five Likert-type scale answers which included 1 = Very Unprepared (VU), 2 =
Unprepared (U), 3 = Medium Prepared (MP), 4 = Prepared (P), 5 = Very Prepared (VP)
where numbers from one through five were added at the top of the columns. The responses
were measured twice as a dual response matrix, at the beginning and end of the program (the
capstone TCHL 560 Action Research for Teacher Leaders Course). (See Appendix E for a
copy of the complete questionnaire, The MAE Teacher Leader Program: Survey of Student’
Perceptions. The survey includes an Informed Consent/Preamble, in lieu of individual
consent forms.) The survey is online using Qualtrics.
Description of the Variables
The independent variables from this study consisted of two types—socio-
demographic factors and the five MAE Program strands. The dependent variables are the

73
students’ perceptions regarding their professional preparation according to the MAE
Program Standards before they started the MAE Program and currently, at the end of the
program. The description of the variables is organized according to the logic model located
in Chapter I (Figure 1). Each variable was assigned an operational definition and variable
label code. All data are self-reported by students, a problem addressed in the Limitations
section of Chapter I. The data were coded to be consistent with the operational definitions
for research purposes and analysis.
Independent Variables
There are two types of independent variables—Demographic Controls and Program
Strands. These are addressed in turn.
Demographic Controls. Demographic factors have two subcategories—Personal
Identity and Educational Identity.
Personal Identity. This cluster represents characteristics commonly associated with
a person’s basic identity, in this study responders’ age, gender, and race. As such, these
factors are considered to influence students’ responses (Lynes, 2008, pp. 154-155). This
study serves as a partial program evaluation of the WKU MAE in teacher leadership. As far
as the author knows, program outcomes have not been examined for gender differences, age,
and ethnic backgrounds of the responders; accordingly the data should provide valuable
insight for program effectiveness and any recommendations for program improvements that
may be needed.
Gender (GEN). Javidi (2011), from which this study was modeled, did not include
gender. Instead, this study follows the Miller et al. (2013) demographics portion of their
revision of Kentucky’s Standards and Indictors for School Improvement; the nominal
variable is coded 0 = female, 1 = male.
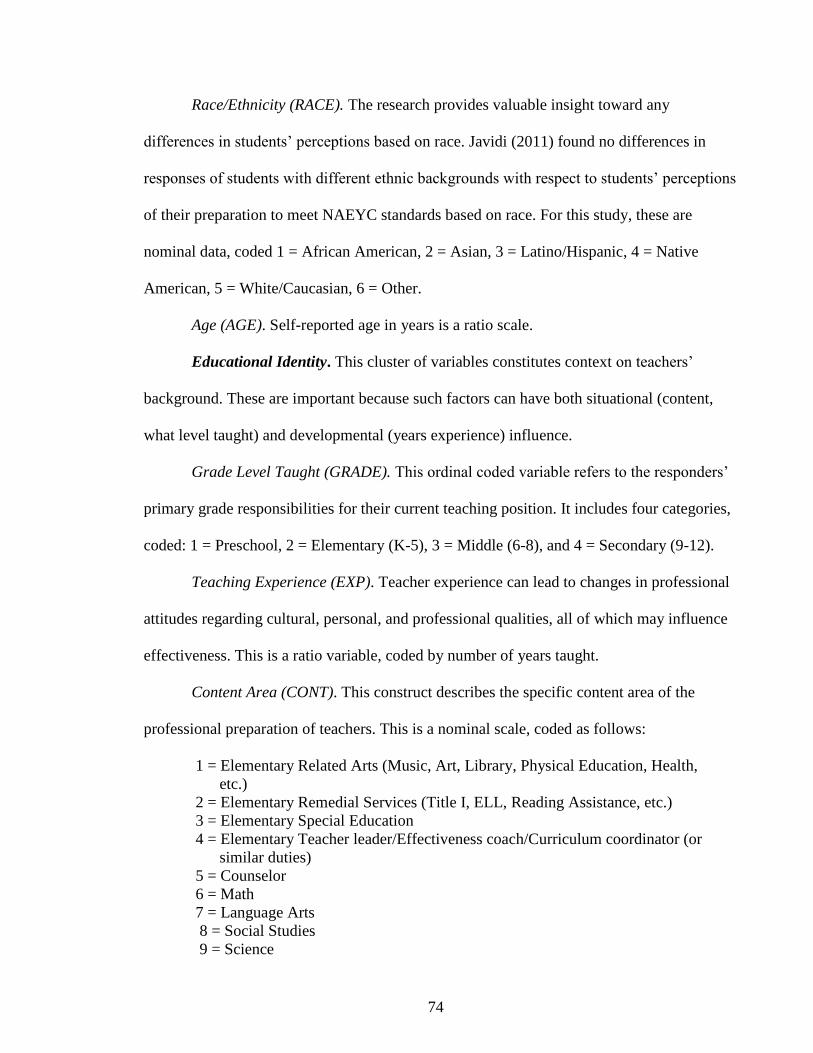
74
Race/Ethnicity (RACE). The research provides valuable insight toward any
differences in students’ perceptions based on race. Javidi (2011) found no differences in
responses of students with different ethnic backgrounds with respect to students’ perceptions
of their preparation to meet NAEYC standards based on race. For this study, these are
nominal data, coded 1 = African American, 2 = Asian, 3 = Latino/Hispanic, 4 = Native
American, 5 = White/Caucasian, 6 = Other.
Age (AGE). Self-reported age in years is a ratio scale.
Educational Identity. This cluster of variables constitutes context on teachers’
background. These are important because such factors can have both situational (content,
what level taught) and developmental (years experience) influence.
Grade Level Taught (GRADE). This ordinal coded variable refers to the responders’
primary grade responsibilities for their current teaching position. It includes four categories,
coded: 1 = Preschool, 2 = Elementary (K-5), 3 = Middle (6-8), and 4 = Secondary (9-12).
Teaching Experience (EXP). Teacher experience can lead to changes in professional
attitudes regarding cultural, personal, and professional qualities, all of which may influence
effectiveness. This is a ratio variable, coded by number of years taught.
Content Area (CONT). This construct describes the specific content area of the
professional preparation of teachers. This is a nominal scale, coded as follows:
1 = Elementary Related Arts (Music, Art, Library, Physical Education, Health,
etc.)
2 = Elementary Remedial Services (Title I, ELL, Reading Assistance, etc.)
3 = Elementary Special Education
4 = Elementary Teacher leader/Effectiveness coach/Curriculum coordinator (or
similar duties)
5 = Counselor
6 = Math
7 = Language Arts
8 = Social Studies
9 = Science
75
10 = Foreign Language
Program Track (TRACK). The second type of independent variables consists of
the different strands in the MAE Teacher Leader Program. There are five strands, coded
nominally as follows: 1 = MAE in Interdisciplinary Early Education, 2 = MAE in
Elementary Education, 3 = MAE in Middle Grades Education, 4 = MAE in Secondary
Education, 5 = MAE in Special Education.
Dependent Variables
The dependent variables represent students’ perceptions of their level of professional
preparation toward the MAE Program Standards, which are identical to the ten Advanced
Level Kentucky Teacher Standards. Each standard has from three to five sub-standards
(total of 45 sub-standards). Students’ perceptions are divided into two distinct time
dimensions reflecting a dual response matrix that measures their level of professional
preparation at the beginning of the program and currently, both on a 5-point Likert-type
scale where 1 = Very Unprepared (VU), 2 = Unprepared (U), 3 = Medium Prepared (MP),
4 = Prepared (P), 5 = Very Prepared (VP).
Procedures
Data collection procedures were discussed with Dr. Lisa Murley, the Teacher Leader
Program Representative, via e-mail. The study involved human subjects; therefore human
subjects’ clearance was required from the IRB prior to beginning the study. After WKU IRB
approval, sponsorship of the study was sought from Dr. Murley, who provided a letter to the
researcher. This letter was included in the survey in order to emphasize the importance of
the research to the university, encourage student participation in the survey, and foster WKU
students’ sense of belonging to their alma mater by taking account of their opinion through
program evaluation to be used for continuing improvement of the WKU educational

76
programs.
Upon IRB approval (see Appendix E), the author developed a procedure through
consultations with the dissertation chair, Dr. Miller, and Dr. Murley. To capture the end of
the program time frame, the survey was distributed in the capstone TCHL 560 Action
Research final classes for Cohort 1 and Cohort 2 in Fall, 2013 and Spring, 2014 semesters,
respectively. Three WKU professors Drs. Cribbs, Gandy, and Pereira were teaching these
classes. These instructors were actively involved in the discussion about developing the
methods and the dates for the data collection.
The professors in each capstone class (three in the December, 2013 Cohort and two
in April, 2014 Cohort) were given a link to the study via e-mail, which they sent to all their
students enrolled in their capstone TCHL 560 action research class. The e-mail, along with
the link to the survey, consisted of the letter of sponsorship from Dr. Murley, an explanation
of the use of Preamble/Informed Consent instead of a signed consent form for survey
research (see Appendix F), and the explanation of procedures (see Appendix F, Letter to
Potential Participants). The survey was created and disseminated to the students using
Qualtrics software, which provides anonymous responses by deleting students’ identifying
information.
Each student in Cohort 1 received this letter in December, 2013, and Cohort 2
students received this letter in April, 2014 near the time of their graduation from the MAE
program. The letter provided a link to Qualtrics where the students were invited to take the
survey via online. One week was given to the students to submit their responses. The
invitation to take the survey (including a link) was sent to the students twice more: after a
seven day period, and again three weeks from the date of the first survey distribution (see
Appendix G). Students who did not respond to any of these invitations were considered to

77
be non-responders and were excluded from the research if they did not reply within three
weeks after the third invitation.
Missing Data
Prior to any analysis, survey data have to be checked for obvious errors and missing
data. Particularly in working with samples of relatively small size, these decisions can be
important to the research. With respect to the validity and reliability of the data, the decision
rules about the surveys with missing data and their handling should be made prior to the
data collection.
If the data were congruent with the following parameters, the surveys were included
in the sample, while the inconsistent surveys were deleted, i.e., the cut mark for inclusion of
the surveys in the sample was considered: (a) 10% or less missing data of all items, (b) the
omission of an entire scale, or (c) the omission of more than two identifying categories of
demographic data.
Once this set of data was assembled, any missing data were handled based on
listwise deletion. For the ratio data, there were never more than three cases that were
affected by this strategy. Selected demographic variables with nominal or ordinal scale of
measurement had more missing values but any analyses for these data were of secondary
importance for the overall purpose of the study. The alternative to listwise deletion is the
substitution of some value for the missing data. But according to Schafer and Graham
(2002), both decisions show a bias. Eliminating the particular survey with missing data for a
specific statistical procedure shows systematic bias because these responders might be
different from other responders; however, entering a substitute value also carries some
unknown amount of bias. Further, the possibility of distortion of the dataset is greater when
the missing data substituted for are nominal or ordinal measures. Finally, the sample size

78
precluded more sophisticated techniques such as the imputation of missing values based on
regression weights. Thus given the small sample and the exploratory nature of this work, the
listwise deletion procedure is the most reasonable option.
Data Analysis
This study is a descriptive quantitative survey with additional correlational analysis,
representing MAE student perceptions of the level of professional preparation on the MAE
Program Standards (the Kentucky EPSB Advanced Level Teacher Standards). All data were
analyzed consistent with the logic model and research questions as depicted in Chapter I. As
shown in the logic model, the researcher examines relationships between two types of
independent variables (student demographic controls and the different program strands) and
the dependent variables (student perceptions of their level of professional preparation at the
end of the program and changes in the student perceptions from the beginning to the end of
the program). Data analysis included descriptive statistics, psychometric analysis, and
separate analysis for the research questions.
For descriptive statistics, frequency counts and percentages were calculated for
nominal data. Means, standards deviations, minimums, maximums, and range were
calculated for the continuous data. Psychometric analysis included the computation of
Cronbach’s alpha in order to establish internal scale reliability for each of the 10 MAE
Program Standards. RQ1 reflects the results of the psychometric analysis for the 10 program
standards. RQ2 required t test analysis. RQ3 examined the correlations between the
independent variables and student perceptions of the program standards.
The statistical computations are divided into three sections: Descriptive Statistics,
Psychometric Analysis, and the Research Questions. Specific procedures under each are
outlined below.
79
Descriptive Statistics
Descriptive statistics were calculated for both independent and dependent variables
in order to describe the distribution of data. The independent variables consist of
Demographic Controls and Program Strands. The plan of analysis for each variable depends
on the type of the variable and is described below.
Demographic Controls. These variables are divided into two subgroups: Personal
Identity and Educational Identity.
Personal Identity. This group of variables includes Gender and Race/Ethnicity (both
nominal variables) and Age (ratio measurement). Frequency counts and percentages were
computed for the nominal variables; for Age, mean, standard deviation, range, minimum,
and maximum were computed.
Educational Identity. This grouping has three variables: Grade Level Taught is an
ordinal variable; Teaching Experience is ratio; Content Area is nominal. Frequency counts
and percentages were calculated for the nominal and ordinal measures while mean, standard
deviation, range, minimum and maximum were computed for the ratio scale.
Program Strands. This category has five subgroups: MAE in Interdisciplinary
Early Education, MAE in Elementary Education, MAE in Middle Grades Education, MAE
in Secondary School Education, and MAE in Special Education. These variables are
nominal, so frequencies and percentages were computed.
Psychometric Analysis
Descriptive statistics for the dependent variables were calculated under this
psychometric analysis section, associated with the computation of Cronbach’s alpha internal
scale reliability.
Psychometric analysis for this study involves the calculation of Cronbach’s alpha for
80
internal scale reliability, a procedure which also helps establish partial validity of the survey.
The author adapted the original survey, created by Javidi (2011), to the needs of this
research. In particular, Javidi used the set of NAYEC standards to measure students’
perceptions of the program, while this study analyzes the WKU MAE Teacher Leader
Programs and by extension, the MAE Program Standards, which are equivalent to the
Advanced Level Kentucky Teacher Standards utilized in the survey. To the author’s
knowledge, neither KDE or the EPSB has conducted any validity analysis of these
standards. Thus this aspect of data analysis is important accordingly.
In particular, there are 10 MAE program standards, each with from three to five
indicators. For each of the 10 standards, the set of respective indicators were subjected to
Cronbach’s alpha. Tables reporting these calculations include the descriptive statistics for
each indicator (mean, standard deviation, minimum, maximum, and range) plus the alpha-
with-item-deleted value. The overall alpha is reported with the descriptives for the
composite set of indicators for each standard.
Finally, inter-standard correlations were computed. This provides an estimate of the
extent that the standards are independent of one another.
Research Questions
For Research Question 1, the mean, standard deviation, minimum, maximum, and
range were calculated for each substandard for each of the 10 program standards, based on
end of program (current) data. For RQ1.a, the overall mean for the entire sample was
calculated for each standard. That entailed calculating the composite mean for each standard
by summing the values for each substandard in each respective standard and then dividing
by the respective number of those indicators. That step, however, is dependent on the
psychometric examination of each standard. If Cronbach’ alpha is not adequate for a

81
specific standard, calculations are conducted on the individual indicators rather than
reporting the standard as a whole. For RQ1.b, the same procedure is followed only for the
sub-samples associated with each program strand.
Research Question 2 measured how students’ perceptions differ from the beginning
to the end of the program for all students and for each strand. The calculations conducted for
RQ1 are for students’ perceptions at the end of the program. For RQ2, those same
computations are repeated for the perceptions for the beginning of the program. Then, the
differences between beginning and current means were examined in order to see if there is a
change in students’ self-perceptions over the course of their professional preparation. Paired
sample t tests were calculated for this comparison of the beginning and current student
responses.
Research Question 3 addressed whether socio-demographic factors were related to
student perceptions of their level of preparation on the MAE Program Standards. The
analysis of data for RQ3 employed calculation of Pearson correlations, t tests, and
unbalanced ANOVA. Pearson correlation was calculated for variables with continuous data
(students’ age and teaching experience). Nominal data were examined by t tests to
determine if students responded differently depending on their gender. For the remaining
categorical measures, the unbalanced ANOVA test was computed, for Race/Ethnicity,
Grade Level Taught, and Content Area.
Validity and Reliability
Javidi’s (2011) study served as a model for this study. Javidi’s instrument measured
students’ perceptions of their professional preparation using NAYEC standards. In contrast,
this study measured students’ perceptions of the Western Kentucky University MAE in
Teacher Leadership Program standards, which are consistent with the Kentucky Teacher

82
Standards. Because the WKU program standards equate to Kentucky’s advanced teacher
standards, as developed by the Education Professional Standards Board, the current study
provides a yardstick for how well prepared these MAE graduates are with respect to the
standards that they will be held accountable for on the job. Javidi established his survey
instrument’s validity through review of the survey questions by a panel of experts who
examined face validity and content validity.
The pilot study conducted by Javidi in 2010 helped establish internal reliability for
his instrument, with overall Cronbach’s alpha of .960. In parallel, the current study provides
evidence for internal scale reliability through the use of Cronbach’s alpha (see
Psychometric Analysis, above), which also serves as rudimentary construct validity
(Nunnally & Bernstein, 1994). Because the WKU MAE Program utilizes the EPSB
Advanced Level Teacher Standards as the program standards, no content or face validity
check was needed.
Ethical Considerations
The study holds no known risks for participants. There are several procedures
included in the data collection in order to eliminate possible misconceptions. The
participants received a letter with a detailed explanation of the procedures. The participation
in the survey is completely voluntary, and the anonymity of the participants was provided by
Qualtrics software which precludes responses being linked to any individual. Thus, no
identification of personal information is possible from the survey data.
The benefits include the impact that the participants can make on the quality of the
MAE Programs by providing their feedback about their perceived professional preparation
over the program standards, i.e., the study serves as a partial evaluation of this new MAE
Teacher Leader Program. Also, the study may foster a sense of belonging to Western

83
Kentucky University by giving students the opportunity to have their voice heard and count.
The participation in the study is voluntary and carries no penalties for non-
participation. The Preamble/Informed Consent and letter of approval from the Western
Kentucky University IRB are attached at Appendices E and F.
Summary
Expectations for the quality of teacher preparation are on the rise. The growing need
for teacher leaders and recent changes in education policies on federal and state levels have
led to changes in the process of teacher preparation. One result is classes on teacher leaders
being included in the core content area in Kentucky, beginning in 2010. However, to the
author’s knowledge, no research has been done on the effectiveness of these classes.
This research examines students’ perspectives toward their professional preparation
according to the new Western Kentucky University MAE Teacher Leader Program
standards. The chapter provides information about the research methods used to evaluate the
MAE Programs from the students’ perspective according to the MAE Program standards,
which are identical to the Kentucky EPSB Advanced Level Teacher Standards.
The study includes two types of independent variables (demographic controls,
which include personal identity and professional identity; and five different program strands
from preschool to secondary levels). Both types of independent variables are hypothetical
influences on the dependent variables, which include students’ perceptions toward their
professional preparation according to MAE Program standards, both at the end of the
program and for any change in perceptions from the beginning to end of the program.
The survey instrument for the research was adapted from the existing literature per
the author’s permission for one time use in the study. Javidi (2011), the author of the
original survey instrument, tested the instrument validity and reliability through the
84
examination of content conducted by a panel of experts in addition to the use of Cronbach’s
coefficient alpha which also provides a rudimentary sense of validity (Nunnally &
Bernstein, 1994). For the current study, no content review was necessary because the
instrument utilizes the Kentucky EPSB Advanced Level Teacher Standards. However,
Cronbach’s alpha provides scale reliability for the respective sets of indicators at the end of
the program.
Qualtrics software was used for survey creation, distribution, and data collection.
The survey was distributed in the Fall, 2013 for Cohort 1 and Spring, 2014 for Cohort 2 in
their final capstone TCHL 560 class via e-mail with the assistance of three WKU professors
teaching this class. The letter to the potential participants included the explanation about the
survey, letter of sponsorship from the Teacher Leader Program Representative, Dr. Lisa
Murley, and the link to the survey. The Preamble/Informed Consent was included at the
beginning of the survey, which was sent three times: at the end of the class, and twice more
with a one-week interval. Students who did not respond to the survey within three weeks
after the third invitation were considered non-responders.
Data analysis included descriptive statistics, psychometric analysis, and separate
analysis for the research questions. For descriptive statistics, frequency counts and
percentages were calculated for nominal data. Means, standards deviations, minimums,
maximums, and range were calculated for the continuous data. Psychometric analysis
included the computation of Cronbach’s alpha in order to establish internal scale reliability
for each of the 10 MAE Program standards. RQ1 represents descriptive statistics for the
results of the psychometric analysis for the 10 program standards. RQ2 required paired
sample t tests. RQ3 examined the relationships between the independent variables and
students’ perceptions of the program standards, with calculations including Pearson
85
correlation, t tests, and unbalanced ANOVA.
There are no known risks for the participants. IRB approval from Western Kentucky
University was obtained prior to the collection of data. The study serves as a partial program
evaluation of the WKU MAE Teacher Leader Program, providing information toward the
new program’s strengths and highlighting areas needing improvements, if any.

86
CHAPTER IV
RESULTS
Introduction
The purpose of this study was twofold. First, the study examines the perceptions of
the WKU MAE Program students toward their level of professional preparation. Second, the
study serves as a partial program evaluation. Additionally, this research provides valuable
information for future development since the WKU MAE Teacher Leader Program was
begun in 2010 and no other assessment of students’ perceptions of these issues has been
conducted.
In order to address these goals and test the research questions, the researcher
collected MAE students’ responses through the survey created for this purpose, using
Javidi’s (2011) approach to using program standards as a measure of program effectiveness;
the model for the demographics section came from Miller et al. (2013). The survey was
distributed with the assistance of the WKU MAE professors teaching the program’s
capstone course in action research, using Qualtrics software. All data were self-reported.
The relationships between dependent and independent variables are depicted in
Figure 1 (Chapter I). The dependent variables are students’ perceptions toward their level of
professional preparation. A dual-response matrix asked for students’ perceptions at the
beginning and end of their studies.
Cronbach’s alpha was calculated as a measure of the internal reliability of the
survey; this also served as a rudimentary form of scale validity. Specifically, the set of

87
indicators for each of the 10 Program Standards were examined for their structure as a
“scale.” Paired t tests were used to determine if there was any difference between the
beginning and the current responses for RQ2. Pearson correlations, t tests, and unbalanced
ANOVA were used to answer RQ3, i.e., the extent of any relationships between the socio-
demographic controls and student responses. Descriptive statistics, such as frequencies,
percentages, means, standard deviation, range, minimum, and maximum were calculated to
determine the distribution of the different variables. The remaining sections of this chapter
provide the results and analysis of the research and cover Descriptive Statistics,
Psychometric Analyses, Research Questions, and a Summary.
Descriptive Statistics
For this section, descriptive statistics were calculated for the independent variables
including Personal Identity, Educational Identity, and the Program Strands. The results of
analysis are reported in the sections below. This population consisted of 107 students from
Cohort 1 and Cohort 2, who were enrolled and successfully completed the WKU MAE
Teacher Leader Program. Data were collected in the TCHL 560 capstone class on action
research during their last semester. For Cohort 1 the survey was distributed in December,
2013; for Cohort 2, distribution was in May, 2014. The final sample consisted of those 46
students (43%) who had complete surveys. Of the 57 who responded (53.3%), 11 were lost
because they failed to meet the criteria in the decision rules for missing data. Descriptive
statistics for the dependent variables (students’ perceptions of their level of educational
preparation on the WKU MAE Teacher Standards) are presented in the Psychometric
Analyses section below.
Independent Variables
The Independent Variables consist of the demographic controls with two subgroups
88
(Personal Identity and Educational Identity) and the Program Strands. This division is based
on the goals of the research to find out the factors influencing students’ level of professional
preparation and is consistent with similar research after which this study was modeled,
specifically Javidi (2011) for the study design and Miller et al. (2013) for the demographics.
According to Bloom (1980), control variables are typically unalterable personal markers,
while the dependent variables are the primary focus of the research, considered to be subject
to change depending on quality and circumstances. In this particular research, the goal is to
find out how well the students feel they are prepared to teach. The examination of the
demographic data permits correlations between student responses and their background and
can be utilized for implementing program adjustments if needed.
Personal Identity. These control variables include Gender (GEN), Race/Ethnicity
(RACE), and Age (AGE). These three variables were selected because these aspects of the
targeted population typically represent important indicators of students’ upbringing which
can influence their responses to school and life outcomes (Lynes, 2008, p. 154).
The data show that of the 46 respondents, n = 34 (73.9%) were females; n = 12
(26.2%) were male. Analysis of students’ ethnicity indicates that 3 (6.7)% were African
Americans, and 42 (93.3)% were White/Caucasian. Participants’ age varies from 26 to 56
with a mean and standard deviation of 31.39 and 6.35.
Educational Identity. The three factors in the block include Grade Level Taught
(GRADE), Teaching Experience (EXP), and Content Area (CONT).
Grade Level Taught has the following distribution: Elementary (K through 5) has a
frequency of 19 (41.3%), Middle School (grades 6 through 8) has 9 (19.6%), and High
School (grades 9-12) has 18 (39.1%).
Teaching Experience ranges from 1 to 15 years, with mean of 6.24 years and

89
standard deviation of 2.46.
Content Area: these data were combined into Preschool/Elementary School (n = 19)
and Middle/High School (n = 27) due to missing data for some categories. For
Preschool/Elementary the frequencies were Preschool (n = 8, 42.1%), Upper Elementary (n
= 6, 31.6%), Related Arts (n = 1, 5.3%), Special Education (n = 4, 21.1%).
The Middle/High School Teachers had content area frequencies as follows: Math (n
= 8, 29.6%), Language Arts (n = 3, 11.1%), Social Studies (n = 6, 22.2%), Science (n = 2,
7.4%), Related Arts (n = 3, 11.1%), Special Education (n = 4, 14.8%), Teacher Leader (n =
1, 3.7%).
Program Strands. These strands are the five areas of content emphasis in the WKU
MAE Teacher Leader Program. There was no participation in the Interdisciplinary Early
Childhood Education strand for the respondents who replied to the survey. Frequency counts
were as follows: MAE in Elementary Education (n = 14, 30.4%), MAE in Middle Grades
Education (n = 7, 15.2%), MAE in High School Education (n = 15, 32.6%), and MAE in
Special Education (n = 10, 21.7%).
Psychometric Analyses
There are ten WKU MAE Program Standards which are the same as the Kentucky
Advanced Level Teacher Standards as developed by the EPSB. There are 45 substandards
which describe teachers’ behaviors for these standards, representing teacher effectiveness.
To the author’s knowledge, KDE conducted no psychometric analysis for the EPSB
Kentucky Teacher Standards. In the current research, the sample is not large to support a
factor analysis, but Cronbach’s alpha was calculated for the substandards for each standard
to measure scale reliability. This also gives a rudimentary sense of validity for the standards,
which were assessed through student responses at the beginning of the program and

90
currently at completion of the program. The alpha-with-item-deleted value indicates the
reliability for the scale with that item deleted from the calculation (Nunnally & Bernstein,
1994). The data for each of the standards for the students’ current responses are exhibited in
tables 1-10 below.
For Standard 1 the data are illustrated in Table 1 where the first number in the
standard identifier refers to the number of the entire standard, i.e., Standard 1 in this
particular table; the second number refers to the sub standards for Standard 1; and the letter
c stands for currently, referring to the time for the students’ rating in the dual response
matrix, at the beginning of the program, b, or currently (see Appendix C for listing of all 10
standards and their respective substandards). For the readers’ convenience, Table 1 through
Table 10 are organized in the same pattern where each numbers refers to the appropriate
standard and substandard as well as the time of the ratings regarding program completion.
The tables also include descriptive statistics for each substandard; the Total row shows the
composite scale calculations, with the value in the - d column for that row representing the
overall alpha for that standard.
For Table 1, the overall Cronbach’s alpha is .88, a relatively strong scale reliability.
Item 1.4c has the highest alpha-when-deleted value of .88, but this is not higher than the
overall alpha. This suggests that all five substandards fit together as a single construct, so
that the standards can be combined as the unit of measurement rather than having to
consider each substandard separately.

91
Table 1
Internal Reliability and Item Characteristics for Standard 1, Current Values (N = 46)
_______________________________________________________________________
Standard M SD Minimum Maximum Range - da _______________________________________________________________________
1.1c 4.24 .67 2 5 3 .85
1.2c 4.22 .73 2 5 3 .84
1.3c 4.22 .73 2 5 3 .84
1.4c 3.91 .81 2 5 3 .88
1.5c 4.17 .61 2 5 3 .85
Totalb 4.15 .58 2 5 3 .88c
Note. Standards and substandards are listed in the document, WKU Program
Standards (Appendix C).
a - d = alpha with item deleted.
bValues for Total are based on separate substandards summed and divided by the
total N across all of the substandards for that standard.
cValue for - d for Total is Cronbach’s coefficient alpha for the entire scale.
For Standard 2 (Table 2), the overall coefficient alpha is .90, considered to be a very
strong scale reliability. Substandard 2.1 has the highest α - d value at .90, but again, none of
the values for alpha with item deleted are higher than the total scale alpha, so that all of the
items fit together as a single construct.
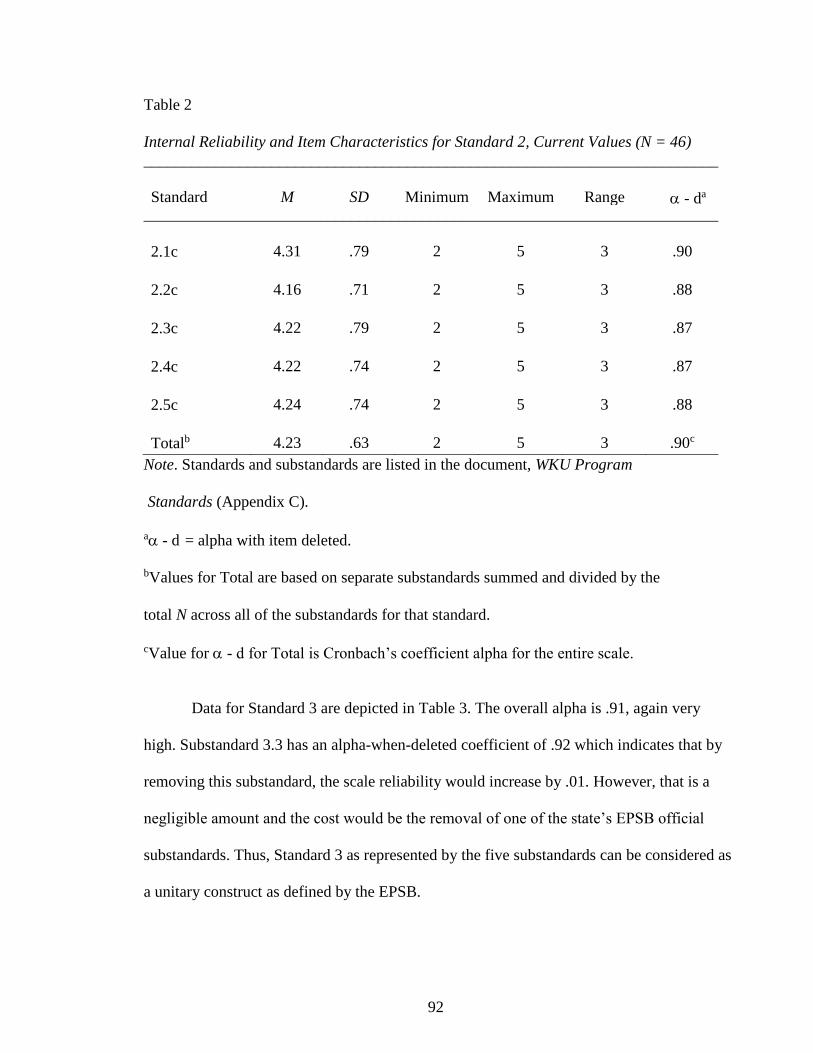
92
Table 2
Internal Reliability and Item Characteristics for Standard 2, Current Values (N = 46)
________________________________________________________________________
Standard M SD Minimum Maximum Range - da ________________________________________________________________________
2.1c 4.31 .79 2 5 3 .90
2.2c 4.16 .71 2 5 3 .88
2.3c 4.22 .79 2 5 3 .87
2.4c 4.22 .74 2 5 3 .87
2.5c 4.24 .74 2 5 3 .88
Totalb 4.23 .63 2 5 3 .90c
Note. Standards and substandards are listed in the document, WKU Program
Standards (Appendix C).
a - d = alpha with item deleted.
bValues for Total are based on separate substandards summed and divided by the
total N across all of the substandards for that standard.
cValue for - d for Total is Cronbach’s coefficient alpha for the entire scale.
Data for Standard 3 are depicted in Table 3. The overall alpha is .91, again very
high. Substandard 3.3 has an alpha-when-deleted coefficient of .92 which indicates that by
removing this substandard, the scale reliability would increase by .01. However, that is a
negligible amount and the cost would be the removal of one of the state’s EPSB official
substandards. Thus, Standard 3 as represented by the five substandards can be considered as
a unitary construct as defined by the EPSB.

93
Table 3
Internal Reliability and Item Characteristics for Standard 3, Current Values (N = 46)
________________________________________________________________________
Standard M SD Minimum Maximum Range - da ________________________________________________________________________
3.1c 4.26 .77 2 5 3 .91
3.2c 4.61 .68 2 5 3 .88
3.3c 4.20 .72 2 5 3 .92
3.4c 4.63 .64 2 5 3 .87
3.5c 4.63 .64 2 5 3 .88
Totalb 4.47 .60 2 5 3 .91c
Note. Standards and substandards are listed in the document, WKU Program
Standards (Appendix C).
a - d = alpha with item deleted.
bValues for Total are based on separate substandards summed and divided by the
total N across all of the substandards for that standard.
cValue for - d for Total is Cronbach’s coefficient alpha for the entire scale.
The Standard 4 data analysis is described below (Table 4), with a high scale
reliability of .90. This total scale overall is higher than any of the alpha-with-item-deleted
values, an indication that all of the substandards clearly measure a single standard.
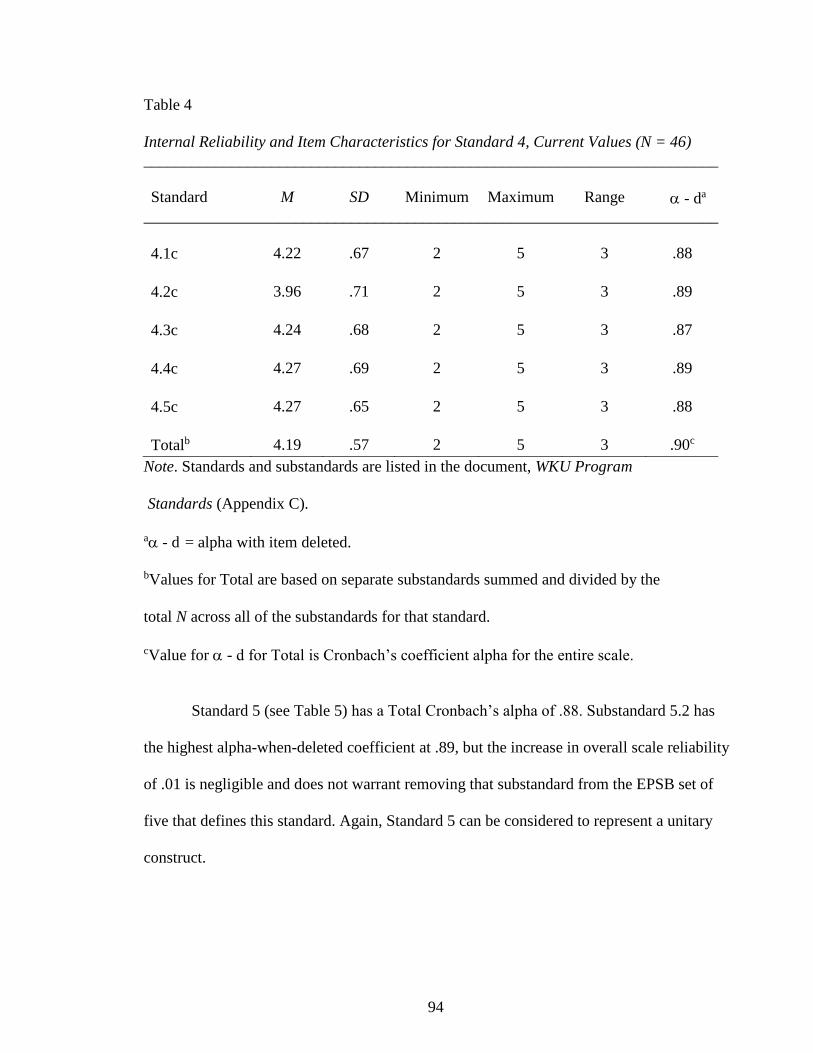
94
Table 4
Internal Reliability and Item Characteristics for Standard 4, Current Values (N = 46)
________________________________________________________________________
Standard M SD Minimum Maximum Range - da
________________________________________________________________________
4.1c 4.22 .67 2 5 3 .88
4.2c 3.96 .71 2 5 3 .89
4.3c 4.24 .68 2 5 3 .87
4.4c 4.27 .69 2 5 3 .89
4.5c 4.27 .65 2 5 3 .88
Totalb 4.19 .57 2 5 3 .90c
Note. Standards and substandards are listed in the document, WKU Program
Standards (Appendix C).
a - d = alpha with item deleted.
bValues for Total are based on separate substandards summed and divided by the
total N across all of the substandards for that standard.
cValue for - d for Total is Cronbach’s coefficient alpha for the entire scale.
Standard 5 (see Table 5) has a Total Cronbach’s alpha of .88. Substandard 5.2 has
the highest alpha-when-deleted coefficient at .89, but the increase in overall scale reliability
of .01 is negligible and does not warrant removing that substandard from the EPSB set of
five that defines this standard. Again, Standard 5 can be considered to represent a unitary
construct.

95
Table 5
Internal Reliability and Item Characteristics for Standard 5, Current Values (N = 46)
________________________________________________________________________
M SD Minimum Maximum Range - da
________________________________________________________________________
5.1c 3.93 .81 2 5 3 .84
5.2c 4.33 .71 2 5 3 .89
5.3c 3.96 .67 2 5 3 .82
5.4c 4.18 .78 2 5 3 .86
5.5c 3.93 .72 2 5 3 .85
Totalb 4.07 .61 2 5 3 .88c
Note. Standards and substandards are listed in the document, WKU Program
Standards (Appendix C).
a - d = alpha with item deleted.
bValues for Total are based on separate substandards summed and divided by the
total N across all of the substandards for that standard.
cValue for - d for Total is Cronbach’s coefficient alpha for the entire scale.
For Standard 6 (located in Table 6 below), the overall coefficient alpha is .93,
exceptionally strong for scale reliability. Substandards 6.4 and 6.5 have the highest alpha-
when-deleted coefficients at .93, but again, these are not higher than the Total alpha; thus
Standard 6 substandards as defined by the Kentucky EPSB represents a unitary standard.

96
Table 6
Internal Reliability and Item Characteristics for Standard 6, Current Values (N = 45)
________________________________________________________________________
Standard M SD Minimum Maximum Range - da
________________________________________________________________________
6.1c 4.31 .76 2 5 3 .90
6.2c 4.24 .83 2 5 3 .91
6.3c 4.18 .81 2 5 3 .92
6.4c 4.20 .92 1 5 4 .93
6.5c 4.38 .78 2 5 3 .93
Totalb 4.26 .73 2 5 3 .93c
Note. Standards and substandards are listed in the document, WKU Program
Standards (Appendix C).
a - d = alpha with item deleted.
bValues for Total are based on separate substandards summed and divided by the
total N across all of the substandards for that standard.
cValue for - d for Total is Cronbach’s coefficient alpha for the entire scale.
For Standard 7 (presented in Table 7) the Total alpha is .88. The highest alpha-when-
deleted value is also .88, for Substandard 7.3, so once again the state’s EPSB set of
substandards functions as a single scale.
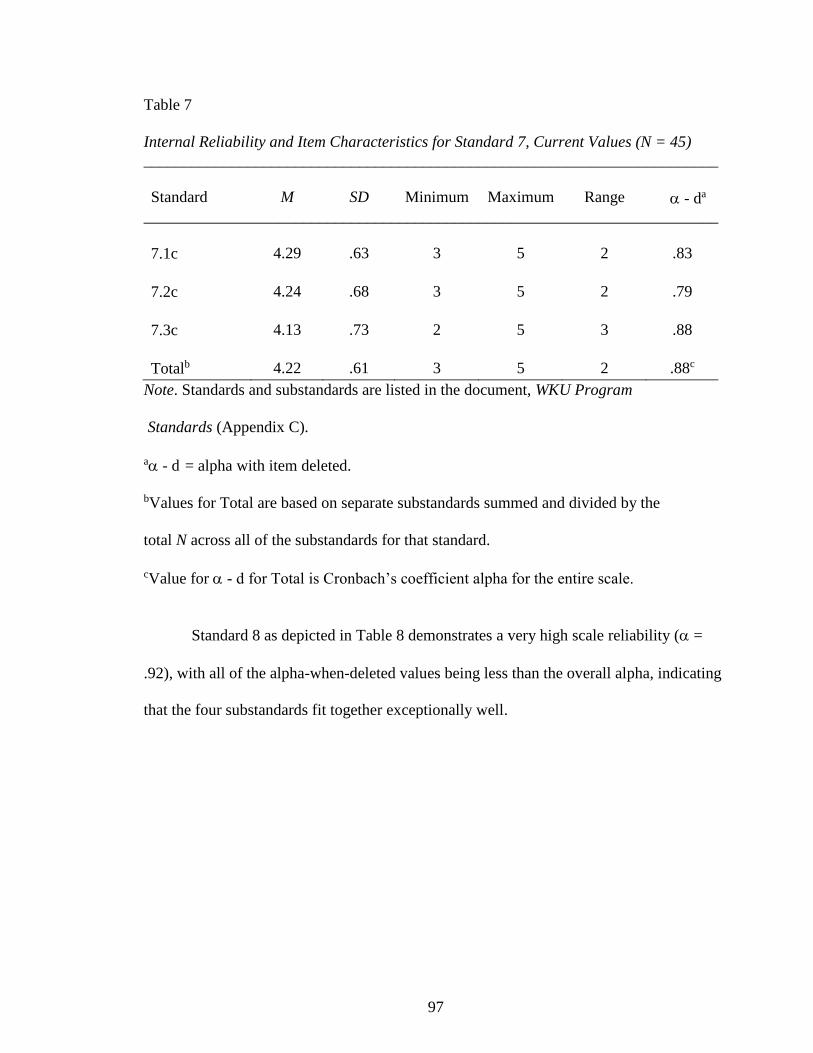
97
Table 7
Internal Reliability and Item Characteristics for Standard 7, Current Values (N = 45)
________________________________________________________________________
Standard M SD Minimum Maximum Range - da
________________________________________________________________________
7.1c 4.29 .63 3 5 2 .83
7.2c 4.24 .68 3 5 2 .79
7.3c 4.13 .73 2 5 3 .88
Totalb 4.22 .61 3 5 2 .88c
Note. Standards and substandards are listed in the document, WKU Program
Standards (Appendix C).
a - d = alpha with item deleted.
bValues for Total are based on separate substandards summed and divided by the
total N across all of the substandards for that standard.
cValue for - d for Total is Cronbach’s coefficient alpha for the entire scale.
Standard 8 as depicted in Table 8 demonstrates a very high scale reliability ( =
.92), with all of the alpha-when-deleted values being less than the overall alpha, indicating
that the four substandards fit together exceptionally well.

98
Table 8
Internal Reliability and Item Characteristics for Standard 8, Current Values (N = 45)
________________________________________________________________________
Standard M SD Minimum Maximum Range - da
________________________________________________________________________
8.1c 4.09 .68 3 5 2 .91
8.2c 4.07 .70 3 5 2 .91
8.3c 4.02 .83 2 5 3 .87
8.4c 4.09 .84 2 5 3 .87
Totalb 4.07 .67 3 5 2 .92c
Note. Standards and substandards are listed in the document, WKU Program
Standards (Appendix C).
a - d = alpha with item deleted.
bValues for Total are based on separate substandards summed and divided by the
total N across all of the substandards for that standard.
cValue for - d for Total is Cronbach’s coefficient alpha for the entire scale.
For Standard 9, the Total scale reliability is .91. All of the alpha-when-deleted values
(see Table 9) are lower than the overall alpha, indicating once again that the state’s EPSB
decision to represent Standard 9 with four substandards was valid psychometrically.
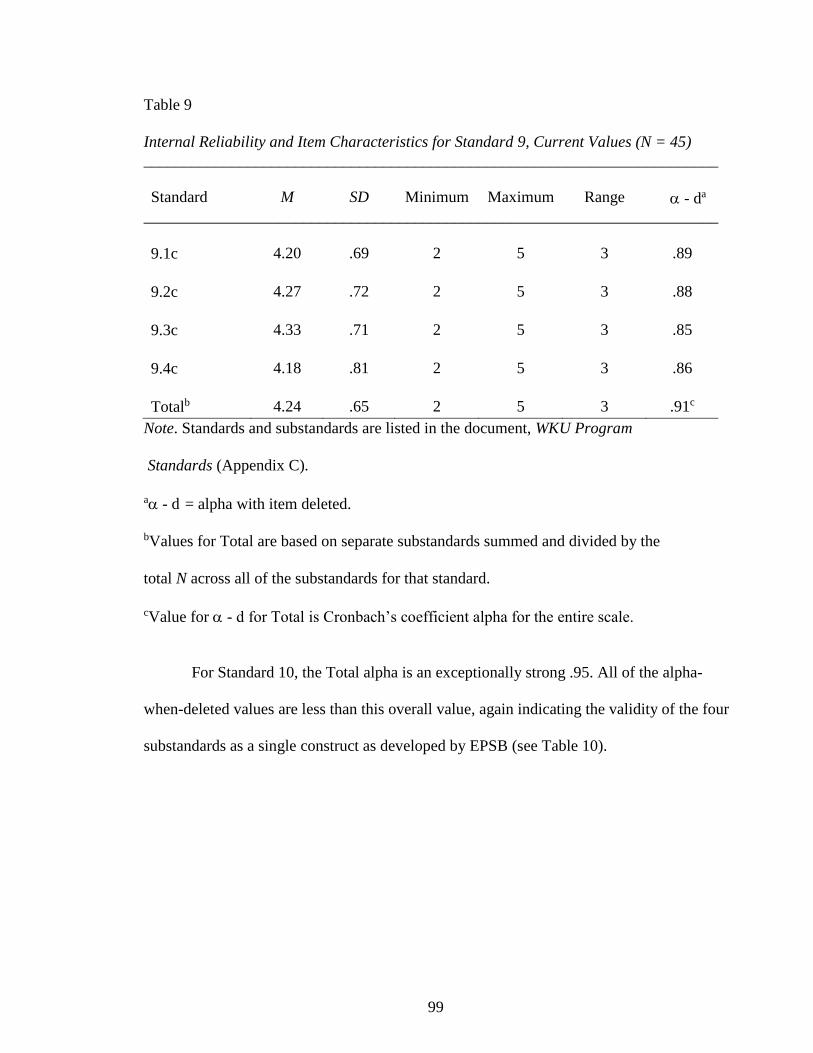
99
Table 9
Internal Reliability and Item Characteristics for Standard 9, Current Values (N = 45)
________________________________________________________________________
Standard M SD Minimum Maximum Range - da
________________________________________________________________________
9.1c 4.20 .69 2 5 3 .89
9.2c 4.27 .72 2 5 3 .88
9.3c 4.33 .71 2 5 3 .85
9.4c 4.18 .81 2 5 3 .86
Totalb 4.24 .65 2 5 3 .91c
Note. Standards and substandards are listed in the document, WKU Program
Standards (Appendix C).
a - d = alpha with item deleted.
bValues for Total are based on separate substandards summed and divided by the
total N across all of the substandards for that standard.
cValue for - d for Total is Cronbach’s coefficient alpha for the entire scale.
For Standard 10, the Total alpha is an exceptionally strong .95. All of the alpha-
when-deleted values are less than this overall value, again indicating the validity of the four
substandards as a single construct as developed by EPSB (see Table 10).

100
Table 10
Internal Reliability and Item Characteristics for Standard 10, Current Values (N = 45)
________________________________________________________________________
Standard M SD Minimum Maximum Range - da
________________________________________________________________________
10.1c 4.05 .81 1 5 4 .94
10.2c 4.11 .81 1 5 4 .93
10.3c 4.14 .85 1 5 4 .93
10.4c 4.11 .84 1 5 4 .94
Totalb 4.12 .78 1 5 4 .95c
Note. Standards and substandards are listed in the document, WKU Program
Standards (Appendix C).
a - d = alpha with item deleted.
bValues for Total are based on separate substandards summed and divided by the
total N across all of the substandards for that standard.
cValue for - d for Total is Cronbach’s coefficient alpha for the entire scale.
Cronbach’s Alpha at Beginning of Program
Tables 1-10 above represent psychometric evaluation based on students’ responses at
the end of the program (data marked with a c). Calculations were also performed for the b
data for beginning of the program. (These b and c data are not true longitudinal responses.
Students marked their sense of educational preparation on a dual-response matrix at the
Beginning of program and Currently at completion of the capstone course. However, both of
these perspectives were given when the survey was conducted at the end of their MAE
coursework.)
101
These computations for beginning data are represented in Tables I-1 through I-10 in
Appendix I. Those tables parallel Tables 1-10 in format. Results confirm that each of the
Advanced Level Kentucky Teacher Standards, as defined by EPSB, represent unity
constructs. That is, for each standard, the substandards (from 3-5, depending on which
standard) correlate highly with each other as one overall scale. In fact, the results for the
beginning data are slightly stronger in terms of overall Cronbach’s alpha than the parallel
data for the current data (see Tables I-1 to I-10). Specifically, the Total alpha for these
beginning data ranges from .88 for Standards 1 and 4 to alpha = .98 for Standard 10.
Inter-Standard Correlations
Overall, the respective sets of substandards for each of the 10 standards (both
beginning and current values) have high internal scale reliability, ranging from .88 to .95 for
current data and from .88 to .98 for the beginning data. All of these represent high scale
reliability. These same data indicate a rudimentary sense of scale validity (Nunnally et al.,
1994). However, there is another issue when examining the psychometric properties of
scales (in this instance, the 10 program standards). To what extent do the standards measure
content that is distinctive rather than overlapping, an aspect of internal criterion validity.
Inter-standard correlations provide this information. Ideally these associations range from
about .3 to .75 (lower than this suggests little correlation rather than an integrated set of
measures; higher values indicate that the standards are not distinctive and are measuring
similar content).
Table 11 presents the correlation matrix for the 10 Kentucky Advanced Teacher
Standards, based on current (end of program) data. The results show that all 10 standards
have generally strong correlation, ranging from .49 to .86. A few of these values are
somewhat higher than ideal, but because the standards were developed by EPSB and

102
represent the WKU MAE Teacher Leader Program, they are utilized in the remainder of the
study as is.
Table 11
Correlation Matrix for Inter-Standard Correlations and Current MAE Student Responses (N
= 45)
S1 S2 S3 S4 S5 S6 S7 S8 S9 S10
Standard 1 1.00a
Standard 2 0.86a 1.00a
Standard 3 0.79a .74a 1.00a
Standard 4 0.86a 0.82a 0.75a 1.00a
Standard 5 0.75 0.68 0.72 0.81 1.00
Standard 6 0.70 0.64 0.58 0.74 0.65 1.00
Standard 7 0.78 0.74 0.58 0.74 0.75 0.63 1.00
Standard 8 0.61 0.50 0.49 0.64 0.70 0.63 0.75 1.00
Standard 9 0.74 0.64 0.64 0.75 0.67 0.62 0.68 0.71 1.00
Standard10 0.76 0.70 0.69 0.83 0.77 0.70 0.76 0.69 0.75 1.00 ___________________________________________________________________________________________________________
p < .001 for all values.
aNumber of observations = 46.
Based on these results, all computations to answer the research questions can be
calculated on the overall (unitary) standards rather than examining the 45 separate
substandards that comprise these 10 Advanced Level Teacher Standards for the
Commonwealth of Kentucky. The findings will be discussed further in Chapter V.
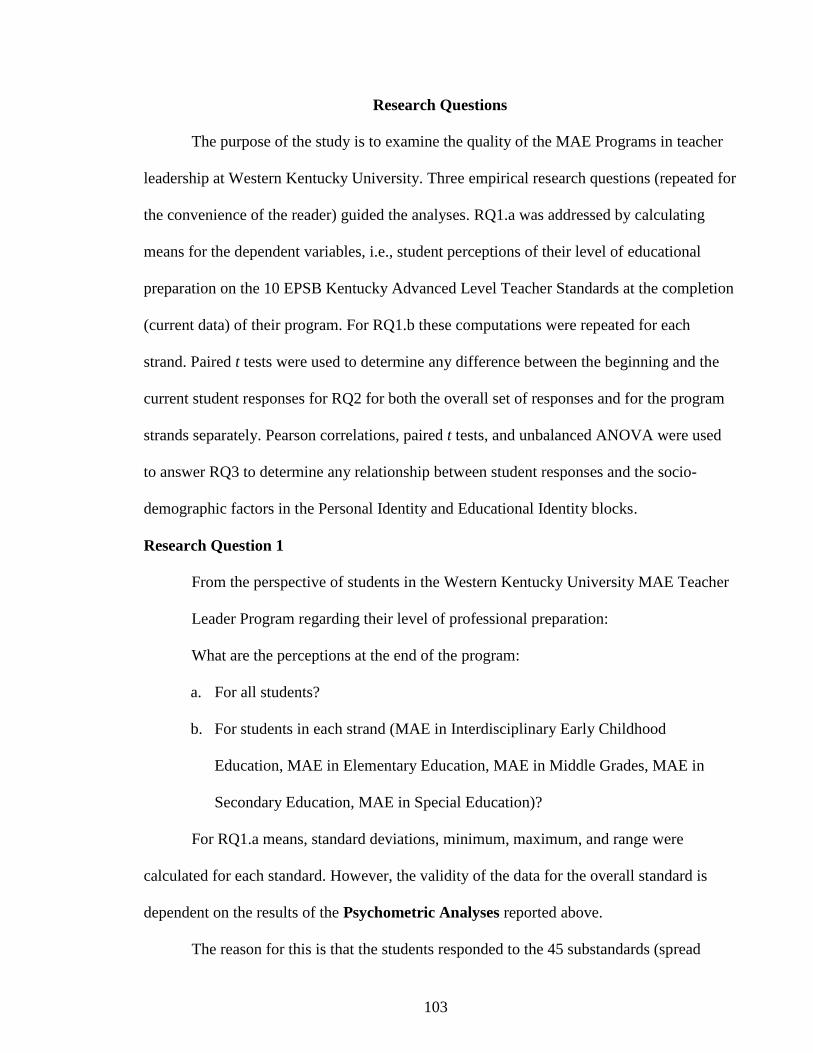
103
Research Questions
The purpose of the study is to examine the quality of the MAE Programs in teacher
leadership at Western Kentucky University. Three empirical research questions (repeated for
the convenience of the reader) guided the analyses. RQ1.a was addressed by calculating
means for the dependent variables, i.e., student perceptions of their level of educational
preparation on the 10 EPSB Kentucky Advanced Level Teacher Standards at the completion
(current data) of their program. For RQ1.b these computations were repeated for each
strand. Paired t tests were used to determine any difference between the beginning and the
current student responses for RQ2 for both the overall set of responses and for the program
strands separately. Pearson correlations, paired t tests, and unbalanced ANOVA were used
to answer RQ3 to determine any relationship between student responses and the socio-
demographic factors in the Personal Identity and Educational Identity blocks.
Research Question 1
From the perspective of students in the Western Kentucky University MAE Teacher
Leader Program regarding their level of professional preparation:
What are the perceptions at the end of the program:
a. For all students?
b. For students in each strand (MAE in Interdisciplinary Early Childhood
Education, MAE in Elementary Education, MAE in Middle Grades, MAE in
Secondary Education, MAE in Special Education)?
For RQ1.a means, standard deviations, minimum, maximum, and range were
calculated for each standard. However, the validity of the data for the overall standard is
dependent on the results of the Psychometric Analyses reported above.
The reason for this is that the students responded to the 45 substandards (spread

104
across the 10 EPSB Advanced Level Teacher Standards) rather than the standards as a
whole. Thus reporting results at the level of the standard requires evidence that the
respective set of substandards for each standard actually function as a single construct.
Results from the psychometric work (preceding section) did confirm that conclusion
(reported in Tables 1-10 for the current data at the conclusion of the MAE Program and in
Tables I-1 through I-10 in Appendix I for the beginning of the program). That is, the
Cronbach’s alpha values for the overall 10 standards were all very high, ranging from .88
for Standard 1and 7 to .95 for Standard 10. Thus the calculations for RQ1.a have already
been shown (the Total line for Tables 1-10).
Table 12 summarizes that prior work on the adequacy of the standards in terms of
scale reliability. The 5-point Likert-type scale reflected perceived level of educational
preparation from 1 = Very Unprepared to 5 = Very Prepared. The findings show that upon
completion the program, the teachers felt that they are prepared the best to teach Standard 3
with a mean at 4.47, while Standards 5 and 8 had the lowest mean at 4.07. Overall, the
respondents perceived themselves as slightly better than Prepared, as all 10 standards
received a mean of more than 4.0.

105
Table 12
Students’ Current Ratings for All Standards
________________________________________________________________________
Standard N M SD Minimum Maximum Range
________________________________________________________________________
1c 46 4.15 0.58 2 5 3
2c 46 4.23 0.63 2 5 3
3c 46 4.47 0.60 2 5 3
4c 46 4.19 0.57 2 5 3
5c 45 4.07 0.61 2 5 3
6c 45 4.26 0.73 2 5 3
7c 45 4.22 0.61 3 5 2
8c 45 4.07 0.67 3 5 2
9c 45 4.24 0.65 2 5 3
10c 45 4.12 0.78 1 5 4
Note. Standards and substandards are noted in the document, WKU Program Standards
(Appendix C).
For RQ1.b, the data reporting the perceptions of the students at the end of the
program for each strand are in tables 13-22. The strands in the tables are numbered from 2
through 5, where the number 2 refers to the MAE in Elementary Education, 3 = MAE in
Middle Grades Education, 4 = MAE in Secondary Education, and 5 = MAE in Special
Education. The WKU MAE in Teacher Leadership has a fifth strand, MAE in
Interdisciplinary Early Childhood Education, but there were no respondents, so this strand
was omitted in Tables 13-22.

106
For Standard 1 stating that “The teacher demonstrates a current and sufficient
academic knowledge of certified content areas to develop student knowledge and
performance in those areas” (Kentucky Education Professional Standards Board, 2012),
students in the MAE in Special Education felt the least prepared upon the completion of the
MAE Program (M = 3.94), while the MAE in Primary/Elementary and Middle Grades
students reported the most prepared (M = 4.31 and 4.29, respectively) (see Table 13).
Table 13
Current Ratings for Standard 1 by Strand
________________________________________________________________________
Strandsa N M SD Minimum Maximum Range
________________________________________________________________________
2 14 4.31 0.40 4 5 1
3 7 4.29 0.50 4 5 1
4 15 4.08 0.56 3 5 2
5 10 3.94 0.84 2 5 3
Totalb 46 4.15 0.58 2 5 3 aStrands are coded as 2 = MAE in Elementary Education, 3 = MAE in Middle Grades
Education, 4 = MAE in Secondary Education, and 5 = MAE in Special Education.
bTotal values are taken from Table 12.
For Standard 2 referring to “Designs/Plans: [Teacher] designs/plans instruction and
learning climates that develop student abilities to use communication skills, apply core
concepts, become self-sufficient individuals, become responsible team members, think and
solve problems, and integrate knowledge” (Kentucky Education Professional Standards
Board, 2012), the results are in Table 14. MAE in Elementary Education teachers reported

107
the highest preparation to teach with a mean of 4.36 while MAE in Special Education
teachers felt they were the least prepared (mean of 3.96).
Table 14
Current Ratings for Standard 2 by Strand
________________________________________________________________________
Strandsa N M SD Minimum Maximum Range
________________________________________________________________________
2 14 4.36 0.56 3 5 2
3 7 4.20 0.55 3 5 2
4 15 4.29 0.55 3 5 2
5 10 3.96 0.87 2 5 3
Totalb 46 4.23 0.63 2 5 3 aStrands are coded as 2 = MAE in Elementary Education, 3 = MAE in Middle Grades
Education, 4 = MAE in Secondary Education, and 5 = MAE in Special Education.
bTotal values are taken from Table 12.
MAE in Elementary Education teachers reported the highest level of preparation (M
= 4.71) for Standard 3 (Learning Climate: [Teacher] creates a learning climate that supports
the development of student abilities to use communication skills, apply core concepts,
become self-sufficient individuals, become responsible team members, think and solve
problems, and integrate knowledge”) (Kentucky Education Professional Standards Board,
2012). Again the MAE in Special Education teachers felt they were the least prepared
compared to other stands with a mean of 4.30. Referring back to Table 12, Standard 3 had
the highest overall rating among the 10 program standards (see Table 15).

108
Table 15
Current Ratings for Standard 3 by Strand
________________________________________________________________________
Strandsa N M SD Minimum Maximum Range
________________________________________________________________________
2 14 4.71 0.36 4 5 1
3 7 4.40 0.58 3 5 2
4 15 4.37 0.51 3 5 2
5 10 4.30 0.91 2 5 3
Totalb 46 4.47 0.60 2 5 3 aStrands are coded as 2 = MAE in Elementary Education, 3 = MAE in Middle Grades
Education, 4 = MAE in Secondary Education, and 5 = MAE in Special Education.
bTotal values are taken from Table 12.
Table 16 depicts the results for Standard 4, “[Teacher]
Introduces/implements/manages instruction that develops student abilities to use
communication skills, apply core concepts, become self-sufficient individuals, become
responsible team members, think and solve problems, and integrate knowledge” (Kentucky
Education Professional Standards Board, 2012). The results are split. Both the Elementary
Education and Middle Grades students reported higher means at 4.27 and 4.31, respectively,
while the MAE students in Secondary and in Special Education indicated lower levels of
preparation (M = 4.11 and 4.10, respectively).

109
Table 16
Current Ratings for Standard 4 by Strand
________________________________________________________________________
Strandsa N M SD Minimum Maximum Range
________________________________________________________________________
2 14 4.27 0.47 3 5 2
3 7 4.31 0.45 4 5 1
4 15 4.11 0.54 3 5 2
5 10 4.10 0.83 2 5 3
Totalb 46 4.19 0.57 2 5 3 aStrands are coded as 2 = MAE in Elementary Education, 3 = MAE in Middle Grades
Education, 4 = MAE in Secondary Education, and 5 = MAE in Special Education.
bTotal values are taken from Table 12.
Standard 5 refers to assessment: “[Teacher] assesses learning and communicates
results to students and others with respect to students abilities to use communication skills,
apply core concepts, become self-sufficient individuals, become responsible team members,
think and solve problems, and integrate knowledge” (Kentucky Education Professional
Standards Board, 2012). MAE Elementary Education students felt most qualified to teach
with a mean of 4.17. The Middle Grades and Secondary Education teachers reported the
least preparation with means of 4.00 and 3.97, respectively (Table 17).

110
Table 17
Current Ratings for Standard 5 by Strand
________________________________________________________________________
Strandsa N M SD Minimum Maximum Range
________________________________________________________________________
2 13 4.17 0.38 3 5 2
3 7 4.00 0.60 3 5 2
4 15 3.97 0.60 3 5 2
5 10 4.12 0.88 2 5 3
Totalb 45 4.07 0.61 2 5 3 aStrands are coded as 2 = MAE in Elementary Education, 3 = MAE in Middle Grades
Education, 4 = MAE in Secondary Education, and 5 = MAE in Special Education.
bTotal values are taken from Table 12.
Table 18 presents Standard 6 “Technology: [Teacher] uses technology to support
instruction; access and manipulate data; enhance professional growth and productivity;
communicate and collaborate with colleagues, parents, and the community; and conduct
research” (Kentucky Education Professional Standards Board, 2012). MAE in Middle
Grades Education teachers felt the most confident (M = 4.54), and MAE in Secondary
Education students felt the least prepared to teach to this standard (M = 4.01).
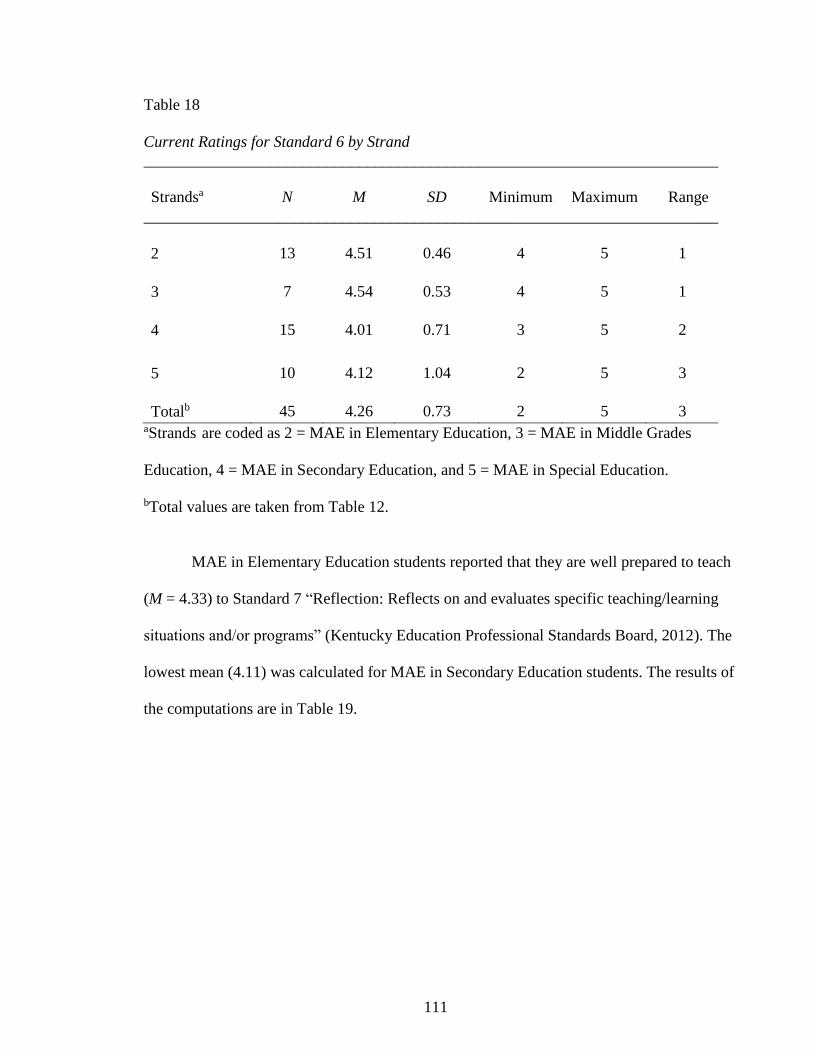
111
Table 18
Current Ratings for Standard 6 by Strand
________________________________________________________________________
Strandsa N M SD Minimum Maximum Range
________________________________________________________________________
2 13 4.51 0.46 4 5 1
3 7 4.54 0.53 4 5 1
4 15 4.01 0.71 3 5 2
5 10 4.12 1.04 2 5 3
Totalb 45 4.26 0.73 2 5 3 aStrands are coded as 2 = MAE in Elementary Education, 3 = MAE in Middle Grades
Education, 4 = MAE in Secondary Education, and 5 = MAE in Special Education.
bTotal values are taken from Table 12.
MAE in Elementary Education students reported that they are well prepared to teach
(M = 4.33) to Standard 7 “Reflection: Reflects on and evaluates specific teaching/learning
situations and/or programs” (Kentucky Education Professional Standards Board, 2012). The
lowest mean (4.11) was calculated for MAE in Secondary Education students. The results of
the computations are in Table 19.
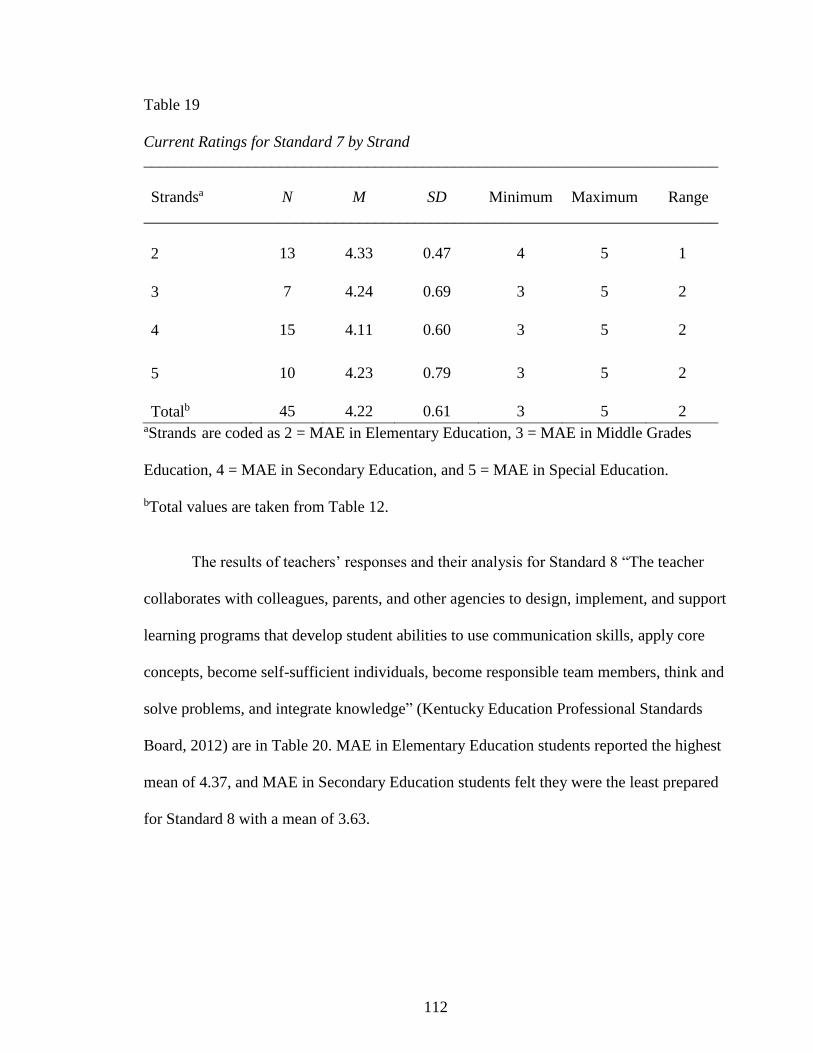
112
Table 19
Current Ratings for Standard 7 by Strand
________________________________________________________________________
Strandsa N M SD Minimum Maximum Range
________________________________________________________________________
2 13 4.33 0.47 4 5 1
3 7 4.24 0.69 3 5 2
4 15 4.11 0.60 3 5 2
5 10 4.23 0.79 3 5 2
Totalb 45 4.22 0.61 3 5 2 aStrands are coded as 2 = MAE in Elementary Education, 3 = MAE in Middle Grades
Education, 4 = MAE in Secondary Education, and 5 = MAE in Special Education.
bTotal values are taken from Table 12.
The results of teachers’ responses and their analysis for Standard 8 “The teacher
collaborates with colleagues, parents, and other agencies to design, implement, and support
learning programs that develop student abilities to use communication skills, apply core
concepts, become self-sufficient individuals, become responsible team members, think and
solve problems, and integrate knowledge” (Kentucky Education Professional Standards
Board, 2012) are in Table 20. MAE in Elementary Education students reported the highest
mean of 4.37, and MAE in Secondary Education students felt they were the least prepared
for Standard 8 with a mean of 3.63.

113
Table 20
Current Ratings for Standard 8 by Strand
________________________________________________________________________
Strandsa N M SD Minimum Maximum Range
________________________________________________________________________
2 13 4.37 0.56 3 5 2
3 7 4.25 0.50 4 5 1
4 15 3.63 0.65 3 5 2
5 10 4.20 0.69 3 5 2
Totalb 45 4.07 0.67 3 5 2 aStrands are coded as 2 = MAE in Elementary Education, 3 = MAE in Middle Grades
Education, 4 = MAE in Secondary Education, and 5 = MAE in Special Education.
bTotal values are taken from Table 12.
For Standard 9 “Professional Development: [Teacher] evaluates his/her overall
performance with respect to modeling and teaching Kentucky's learning goals, refines the
skills and processes necessary, and implements a professional development plan”
(Kentucky Education Professional Standards Board, 2012), MAE in Middle Grades
Education students had the highest mean of 4.61, while students from the MAE in Special
Education and Secondary Education had the lowest perceptions of their preparation (M =
4.05 and 4.08, respectively). Table 21 presents these computations.

114
Table 21
Current Ratings for Standard 9 by Strand
________________________________________________________________________
Strandsa N M SD Minimum Maximum Range
________________________________________________________________________
2 13 4.38 0.55 3 5 2
3 7 4.61 0.43 4 5 1
4 15 4.08 0.52 3 5 2
5 10 4.05 0.93 2 5 3
Totalb 45 4.24 0.65 2 5 3 aStrands are coded as 2 = MAE in Elementary Education, 3 = MAE in Middle Grades
Education, 4 = MAE in Secondary Education, and 5 = MAE in Special Education.
bTotal values are taken from Table 12.
For Standard 10 “Leadership: [Teacher] provides professional leadership within the
school, community, and education profession to improve student learning and well-being”
(Kentucky Education Professional Standards Board, 2012), the MAE in Elementary
Education students reported that they are well prepared for this standard with a mean of
4.40. The lowest mean (3.95) was calculated for the MAE in Secondary Education students.
See Table 22 for the computations.

115
Table 22
Current Ratings for Standard 10 by Strand
________________________________________________________________________
Strandsa N M SD Minimum Maximum Range
________________________________________________________________________
2 13 4.40 0.48 4 5 1
3 7 4.11 0.70 3 5 2
4 15 3.95 0.70 3 5 2
5 10 4.03 1.17 1 5 4
Totalb 45 4.12 0.78 1 5 4 aStrands are coded as 2 = MAE in Elementary Education, 3 = MAE in Middle Grades
Education, 4 = MAE in Secondary Education, and 5 = MAE in Special Education.
bTotal values are taken from Table 12.
Research Question 2
To what extent do perceptions differ from the beginning to the end of the program:
a. For all students?
b. For each strand (MAE in Elementary Education, MAE in Interdisciplinary Early
Childhood Education MAE in Middle Grades, MAE in Secondary Education,
MAE in Special Education)?
RQ2.a analyzes how students’ perceptions differ from the beginning to the end of the
program for all students; RQ2.b examines these values for each strand. Descriptive statistics
were calculated for each standard at the beginning and currently in order to answer RQ2 (for
both the entire sample and the separate strands). To address the differences between
beginning and current levels of students’ perceptions of their professional preparation,
116
paired sample t tests were calculated to compare beginning and end level responses. The
results for RQ2.a are depicted the Tables 23 for each standard. The numbers in the tables
refer to the standard number.
The results for Standards 1 through 10 are in Table 23. Mean values indicate
considerable improvement in student perceptions for each standard, ranging from M = .70
(for Standard 4) to M = .80 (Standards 2 and 7). Thus students demonstrated an
improvement in perceived professional preparation for each standard over the course of the
program. Since the psychometric analyses demonstrated that each of these standards can be
viewed as a single construct (for both beginning and current data), substandard values were
not examined for RQ2.

117
Table 23
Differences in Student Level of Professional Preparation for Standards 1-10 from Beginning
to Completing of Program
Current Current Beginning Beginning
Standard n Mean SD Mean SD Difference
1 46 4.15 .58 3.44 .67 .71
2 46 4.22 .63 3.42 .78 .80
3 46 4.47 .60 4.00 .69 .47
4 46 4.19 .57 3.48 .66 .70
5 45 4.07 .61 3.36 .77 .71
6 45 4.26 .73 3.55 .78 .72
7 45 4.22 .61 3.42 .93 .80
8 45 4.07 .67 3.28 .91 .78
9 45 4.24 .65 3.52 .82 .72
10 45 4.12 .78 3.38 .97 .74
Table 24 presents the comparison for Standards 1-10 between beginning (before the
program) and current (at the program completion) based on paired sample t tests. The t
values range from 4.40 (Standard 3) to 6.48 (Standard 1) with probability of t below 0.001
for all ten standards, highly significant. Overall, consistent improvement is observed for
each standard in students’ perceptions of their professional preparation.

118
Table 24
Paired Sample t Tests Comparing Differences between Current and Beginning Level of
Professional Preparation for Standards 1-10
Standard 95% Confidence
Comparison n Difference t p Lower Upper
1c-1b 46 .71 6.48 < .001 .49 .93
2c-2b 46 .80 6.02 < .001 .54 1.07
3c-3b 46 .47 4.40 < .001 .25 .68
4c-4b 46 .70 5.68 < .001 .45 .95
5c-5b 45 .71 5.90 < .001 .47 .95
6c-6b 45 .72 6.05 < .001 .48 .95
7c-7b 45 .80 5.84 < .001 .52 1.08
8c-8b 45 .78 6.08 < .001 .52 1.04
9c-9b 45 .72 5.60 < .001 .46 .98
10c-10b 45 .74 4.53 < .001 .41 1.07
For RQ2.b the calculations parallel those for RQ2.a, except done for each of the four
strands for which there are data. Tables 25-28 report these means for each standard for
beginning and end of the program for each strand, respectively. There are five strands in the
MAE program; however there were no responses for the MAE in Interdisciplinary Early
Education, as stated previously.
The MAE in Elementary Education student responses are presented in Table 25. The
differences in mean values across the ten standards range from .36 (Standard 3) to .92

119
(Standard 10).
Table 25
Differences in Student Level of Professional Preparation for Elementary Education for
Standards 1-10 from Beginning to Completion of Program
Current Current Beginning Beginning
Standard n Mean SD Mean SD Difference
1 14 4.31 .40 3.70 .47 .61
2 14 4.36 .56 3.54 .59 .81a
3 14 4.71 .36 4.36 .66 .36a
4 14 4.27 .47 3.46 .51 .81
5 13 4.17 .38 3.38 .63 .78
6 13 4.51 .46 3.92 .44 .58a
7 13 4.33 .47 3.49 .79 .85a
8 13 4.37 .56 3.58 .72 .79
9 13 4.38 .55 3.56 .74 .83a
10 13 4.40 .48 3.48 .87 .92
aDifference shown versus that for Current Mean minus Beginning Mean is due to rounding.
Table 26 shows the differences in student perceptions for Middle Grades Education.
The lowest mean difference (.69) is for Standard 3, while the highest is 1.24 for Standard 1.
These student perceptions demonstrate a steady improvement from beginning values to
current values across each standard.

120
Table 26
Differences in Student Level of Professional Preparation for Middle Grades Education for
Standards 1-10 from Beginning to Completion of Program
Current
Current Beginning Beginning
Standard n Mean SD Mean SD Difference
1 7 4.28 .50 3.05 .43 1.24a
2 7 4.20 .55 3.03 .39 1.17
3 7 4.40 .58 3.71 .62 .69
4 7 4.31 .44 3.20 .67 1.11
5 7 4.00 .60 3.03 .50 .97
6 7 4.54 .53 3.37 .53 1.17
7 7 4.24 .69 3.19 .63 1.05
8 7 4.25 .50 3.18 .62 1.07
9 7 4.61 .43 3.68 .73 .93
10 7 4.11 .71 3.00 .65 1.11
aDifference shown versus that for Current Mean minus Beginning Mean is due to rounding.
Data for the MAE in Secondary Education student perceptions toward differences in
their professional preparation are presented in Table 27. The mean values indicate that, once
again, there is improvement in student perceptions for all ten standards, i.e., a positive
difference between current and beginning values, with the lowest for Standard 3 (.53) and
the highest for Standard 2 (.84).
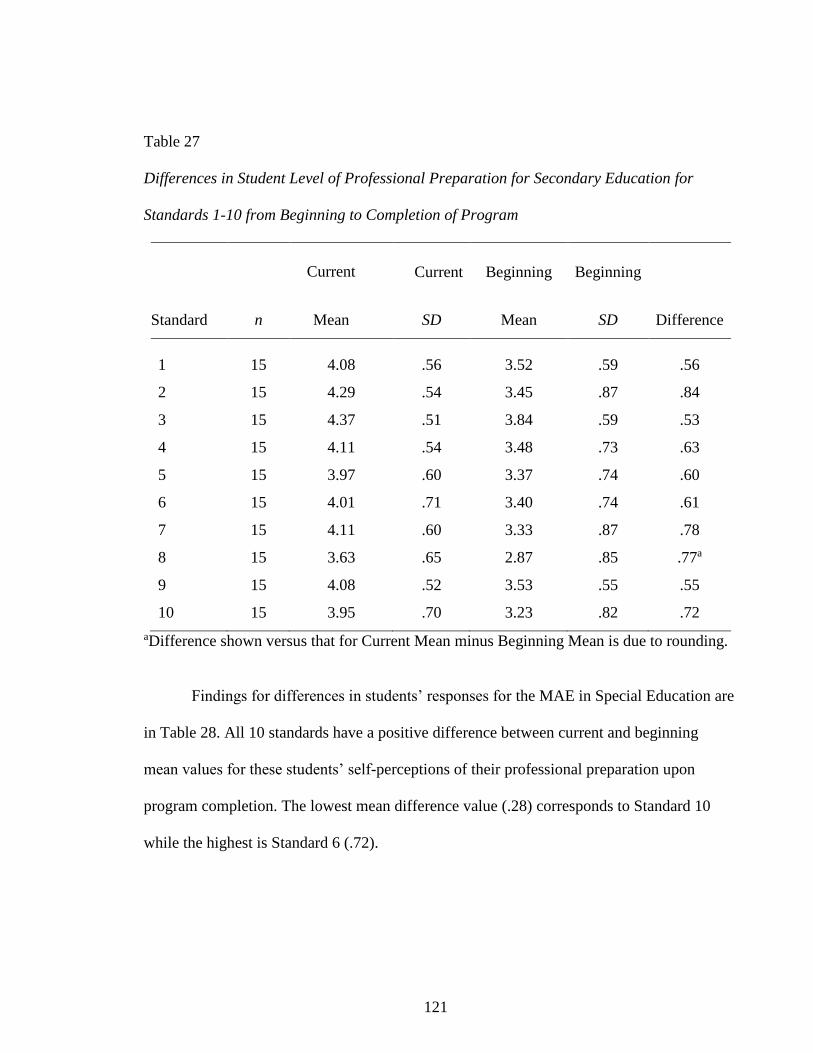
121
Table 27
Differences in Student Level of Professional Preparation for Secondary Education for
Standards 1-10 from Beginning to Completion of Program
Current Current Beginning Beginning
Standard n Mean SD Mean SD Difference
1 15 4.08 .56 3.52 .59 .56
2 15 4.29 .54 3.45 .87 .84
3 15 4.37 .51 3.84 .59 .53
4 15 4.11 .54 3.48 .73 .63
5 15 3.97 .60 3.37 .74 .60
6 15 4.01 .71 3.40 .74 .61
7 15 4.11 .60 3.33 .87 .78
8 15 3.63 .65 2.87 .85 .77a
9 15 4.08 .52 3.53 .55 .55
10 15 3.95 .70 3.23 .82 .72
aDifference shown versus that for Current Mean minus Beginning Mean is due to rounding.
Findings for differences in students’ responses for the MAE in Special Education are
in Table 28. All 10 standards have a positive difference between current and beginning
mean values for these students’ self-perceptions of their professional preparation upon
program completion. The lowest mean difference value (.28) corresponds to Standard 10
while the highest is Standard 6 (.72).
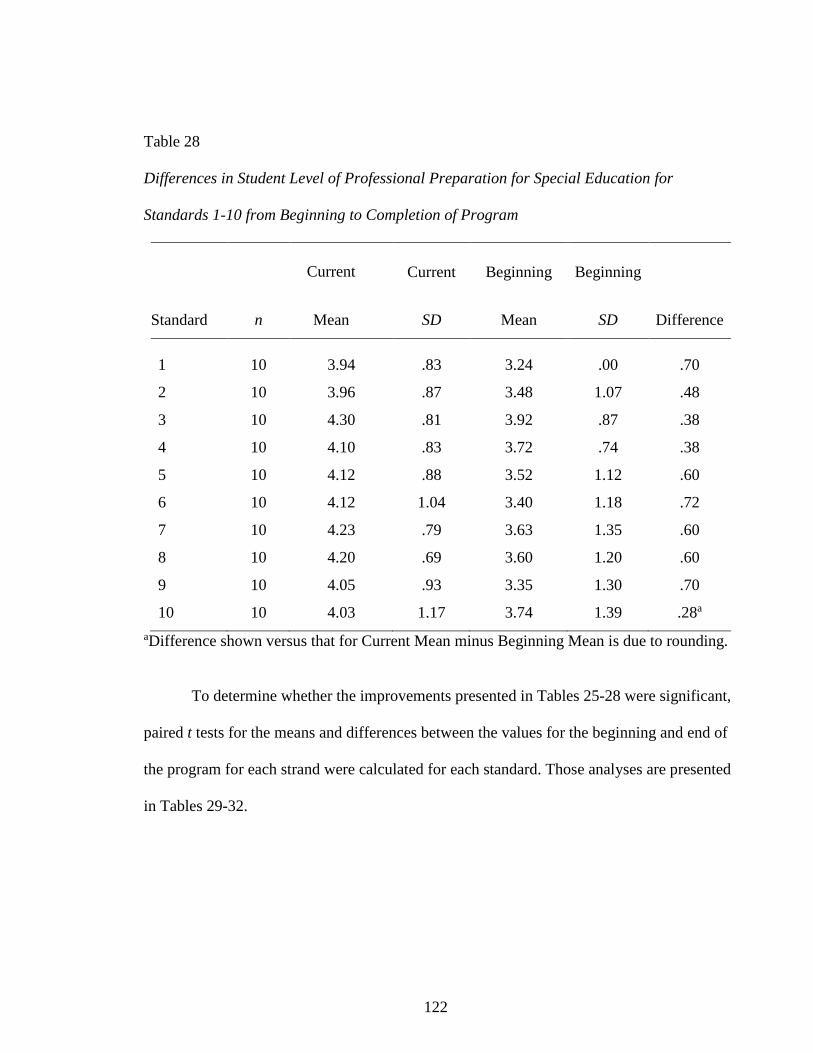
122
Table 28
Differences in Student Level of Professional Preparation for Special Education for
Standards 1-10 from Beginning to Completion of Program
Current Current Beginning Beginning
Standard n Mean SD Mean SD Difference
1 10 3.94 .83 3.24 .00 .70
2 10 3.96 .87 3.48 1.07 .48
3 10 4.30 .81 3.92 .87 .38
4 10 4.10 .83 3.72 .74 .38
5 10 4.12 .88 3.52 1.12 .60
6 10 4.12 1.04 3.40 1.18 .72
7 10 4.23 .79 3.63 1.35 .60
8 10 4.20 .69 3.60 1.20 .60
9 10 4.05 .93 3.35 1.30 .70
10 10 4.03 1.17 3.74 1.39 .28a
aDifference shown versus that for Current Mean minus Beginning Mean is due to rounding.
To determine whether the improvements presented in Tables 25-28 were significant,
paired t tests for the means and differences between the values for the beginning and end of
the program for each strand were calculated for each standard. Those analyses are presented
in Tables 29-32.

123
Table 29
Paired Sample t Tests Comparing Differences between Current and Beginning Level of
Professional Preparation for the MAE in Elementary Education for Standards 1-10
Standard 95% Confidence
Comparison n Difference t p Lower Upper
1c-1b 14 .61 5.06 < .001 .35 .88
2c-2b 14 .81 4.99 < .001 .46 1.17
3c-3b 14 .36 2.23 .044 .01 .70
4c-4b 14 .81 4.59 < .001 .43 1.20
5c-5b 13 .78 4.65 < .001 .42 1.15
6c-6b 13 .58 4.22 < .001 .28 .89
7c-7b 13 .85 3.39 .005 .30 1.39
8c-8b 13 .79 3.91 .002 .35 1.23
9c-9b 13 .83 4.49 < .001 .43 1.23
10c-10b 13 .92 4.20 .001 .44 1.40
For the MAE in Elemantary Education students, the data in Table 29 show
comparison of current (at the end of the program) and beginning (of the program) teacher
responses. Paired sample t test values range from 2.23 for Standard 3 to 5.06 for Standard 1.
The difference between beginning and current values shows improvement for all 10
standards with the probability of t significant for each of these standards.

124
Table 30
Paired Sample t Tests Comparing Differences between Current and Beginning Level of
Professional Preparation for the MAE in Middle Grades Education for Standards 1-10
Standard 95% Confidence
Comparison n Difference t p Lower Upper
1c-1b 7 1.24 5.41 .002 .68 1.79
2c-2b 7 1.17 4.64 .004 .55 1.79
3c-3b 7 .69 2.70 .036 .06 1.31
4c-4b 7 1.11 3.90 .008 .42 1.81
5c-5b 7 .97 3.59 .012 .31 1.63
6c-6b 7 1.17 4.79 .003 .57 1.77
7c-7b 7 1.05 3.79 .009 .37 1.72
8c-8b 7 1.07 3.67 .011 .36 1.79
9c-9b 7 .93 3.12 .021 .20 1.66
10c-10b 7 1.11 3.60 .011 .35 1.86
Table 30 shows differences between current and beginning student responses for the
MAE in Middle Grades Education. Students reported improvements for all standards, with t
values ranging from 2.70 (Standard 3) to 5.41 (Standard 1). The paired sample t tests are
significant for all 10 standards despite the low (n = 7) size of the subsample.

125
Table 31
Paired Sample t Tests Comparing Differences between Current and Beginning Level of
Professional Preparation for the MAE in Secondary Education for Standards 1-10
Standard 95% Confidence
Comparison n Difference t p Lower Upper
1c-1b 15 .56 3.42 .004 .21 .91
2c-2b 15 .84 3.69 .002 .35 1.33
3c-3b 15 .53 3.30 .005 .19 .88
4c-4b 15 .63 2.81 .014 .15 1.11
5c-5b 15 .60 2.99 .010 .17 1.03
6c-6b 15 .61 3.23 .006 .21 1.02
7c-7b 15 .78 3.02 .009 .23 1.33
8c-8b 15 .77 3.18 .007 .25 1.28
9c-9b 15 .55 2.98 .010 .15 .95
10c-10b 15 .72 3.49 .004 .28 1.16
Results for paired sample t tests for the MAE in Secondary Education students are
shown in Table 31. All students reported improvement for all standards, ranging from .53
for Standard 3 to .84 for Standard 2. All findings are significant as p values are below 0.05.
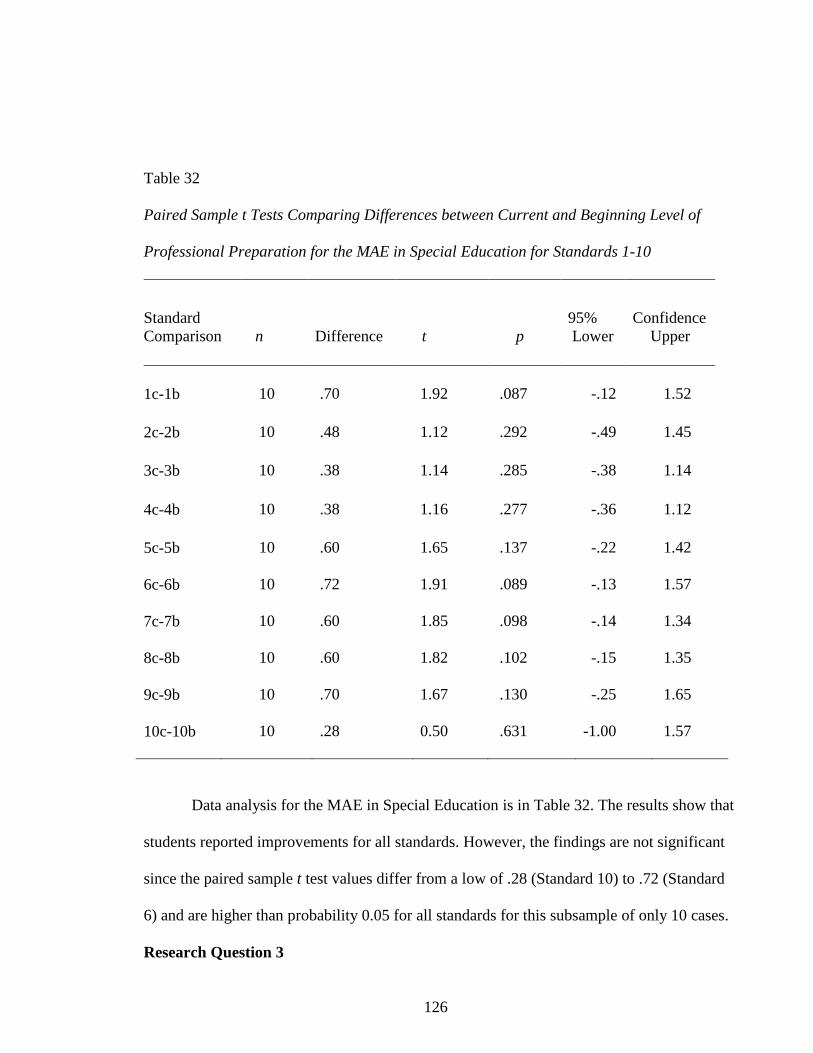
126
Table 32
Paired Sample t Tests Comparing Differences between Current and Beginning Level of
Professional Preparation for the MAE in Special Education for Standards 1-10
Standard 95% Confidence
Comparison n Difference t p Lower Upper
1c-1b 10 .70 1.92 .087 -.12 1.52
2c-2b 10 .48 1.12 .292 -.49 1.45
3c-3b 10 .38 1.14 .285 -.38 1.14
4c-4b 10 .38 1.16 .277 -.36 1.12
5c-5b 10 .60 1.65 .137 -.22 1.42
6c-6b 10 .72 1.91 .089 -.13 1.57
7c-7b 10 .60 1.85 .098 -.14 1.34
8c-8b 10 .60 1.82 .102 -.15 1.35
9c-9b 10 .70 1.67 .130 -.25 1.65
10c-10b 10 .28 0.50 .631 -1.00 1.57
Data analysis for the MAE in Special Education is in Table 32. The results show that
students reported improvements for all standards. However, the findings are not significant
since the paired sample t test values differ from a low of .28 (Standard 10) to .72 (Standard
6) and are higher than probability 0.05 for all standards for this subsample of only 10 cases.
Research Question 3

127
How do personal identity and educational identity variables relate to
perceptions at the end of the program?
The analysis of data for RQ3 employed calculation of Pearson correlations, t tests,
and unbalanced ANOVA. The data are organized consistent with Figure 1 (from Chapter I),
first for the Personal Identity block and then the Educational Identity block. These results
represent the relationship between the socio-demographic variables and student perceptions
of their level of educational preparation on the 10 MAE Program Standards at the end of
their coursework.
Personal Identity. The three Personal Identity variables are Gender, Race/Ethnicity,
and Age. For Gender, t tests were calculated on the current (end of program) data for males
and females for each of the 10 program strands.

128
Table 33
Gender Differences in Professional Preparation for Standards 1-10 at Completion of
Program
Female
Male
Standard n M SD
n M SD Difference
1 34 4.12 .61 12 4.23 .52 -.11
2 34 4.18 .67 12 4.35 .52 -.17
3 34 4.45 .66 12 4.50 .40 -.05
4 34 4.14 .60 12 4.33 .46 -.20a
5 33 4.03 .61 12 4.17 .61 -.14
6 33 4.33 .71 12 4.07 .79 .27a
7 33 4.17 .65 12 4.36 .50 -.19
8 33 4.05 .71 12 4.10 .57 -.05
9 33 4.22 .68 12 4.31 .54 -.09
10 33 4.11 .82 12 4.17 .65 -.06
aDifferences shown versus that for Female mean minus Male mean is due to rounding.
The results for differences in students’ perceptions for professional preparation by
gender are in Table 33. The differences in responses for all standards range from -0.05
(Standard 4 and 8) to 0.27 (Standard 6); these differences are negative for all Standards,
except Standard 6 (0.27), i.e., males reported higher level of professional preparation upon
program completion according to their self-perceptions for nine out of ten standards.

129
Table 34
Independent Samples t Tests for Gender Comparing Professional Preparation for Standards
1-10 at Completion of Program
Standard 95% Confidence
Comparison Difference t p Lower Upper
1F-1M -.11 -.56 .58 -.51 .29
2F-2M -.17 -.79 .44 -.60 .26
3F-3M -.05 -.23 .82 -.46 .36
4F-4M -.20 -1.03 .31 -.59 .19
5F-5M -.14 -.66 .51 -.55 .28
6F-6M .27 1.09 .28 -.23 .76
7F-7M -.19 -.92 .36 -.61 .23
8F-8M -.05 -.22 .82 -.51 .41
9F-9M -.09 -.42 .67 -.54 .35
1F-1M -.06 -.23 .82 -.59 .47
Note. F = Female; M = Male. Means and standard deviations for each standard are presented
in Table 33.
The null hypothesis states that F Mean – M Mean = 0.0. Data shown in Table 34
represent the independent samples t tests for differences between female and male
perceptions of their professional preparation for all 10 standards. Consistent with Table 33,
these t values are all negative except Standard 6, “Uses technology to support instruction;
access and manipulate data; enhance professional growth and productivity; communicate
and collaborate with colleagues, parents, and the community; and conduct research”
130
(Kentucky Education Professional Standards Board, 2012), i. e., males feel more prepared
for nine of 10 standards. However, p values are greater than 0.05 and the Confidence Levels
include 0.0 for all ten standards, so none of the findings are significant.
For race/ethnicity, the frequency counts were White = 42; African-American = 3;
missing data = 1. Accordingly, no calculations were done for differences in professional
preparation for this variable (insufficient variance).
Among the three Personal Identity variables, only Age is recorded as ratio
measurement. That analysis is included under the Educational Identity section below.
Educational Identity. The three Educational Identity variables are Grade Level,
Teaching Experience, and Content Area. For the Educational Identity block, only Teaching
Experience is ratio data. To examine whether Teacher Experience and Age (from the
Personal Identity block) are related to the students’ perceptions of their level of
professional preparation, Pearson correlations were computed. Those results are presented in
Table 35.
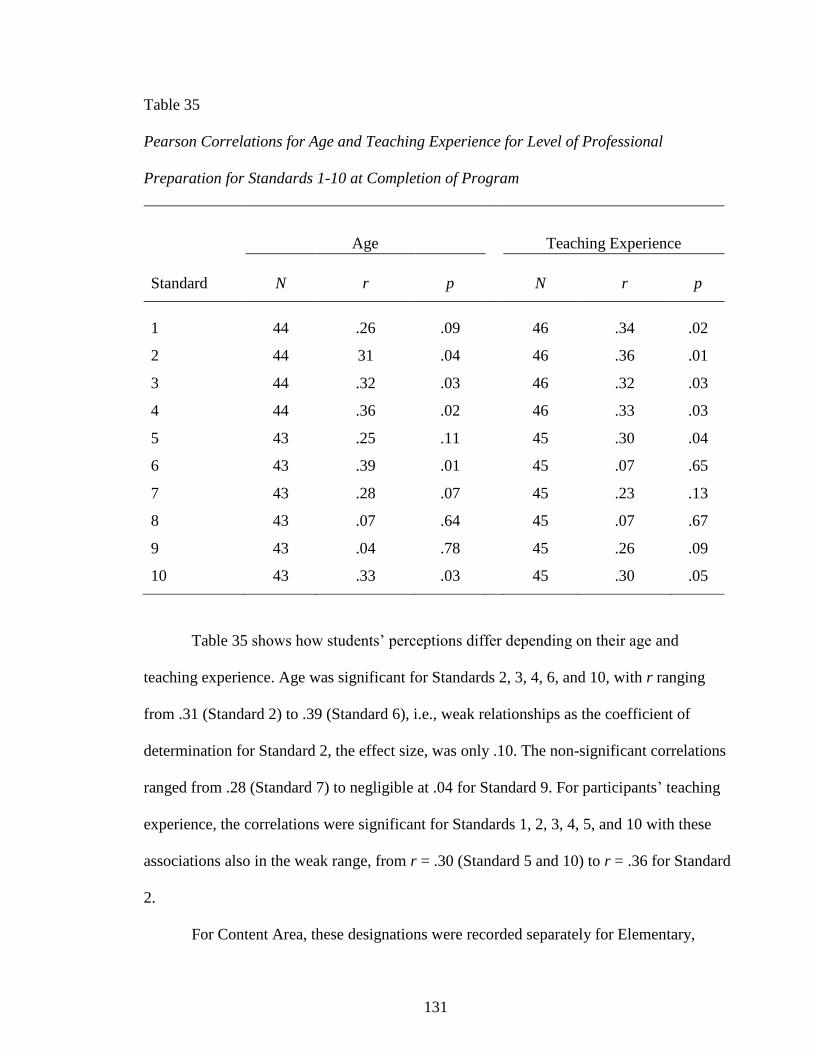
131
Table 35
Pearson Correlations for Age and Teaching Experience for Level of Professional
Preparation for Standards 1-10 at Completion of Program
Age
Teaching Experience
Standard N r p N r p
1 44 .26 .09 46 .34 .02
2 44 31 .04 46 .36 .01
3 44 .32 .03 46 .32 .03
4 44 .36 .02 46 .33 .03
5 43 .25 .11 45 .30 .04
6 43 .39 .01 45 .07 .65
7 43 .28 .07 45 .23 .13
8 43 .07 .64 45 .07 .67
9 43 .04 .78 45 .26 .09
10 43 .33 .03 45 .30 .05
Table 35 shows how students’ perceptions differ depending on their age and
teaching experience. Age was significant for Standards 2, 3, 4, 6, and 10, with r ranging
from .31 (Standard 2) to .39 (Standard 6), i.e., weak relationships as the coefficient of
determination for Standard 2, the effect size, was only .10. The non-significant correlations
ranged from .28 (Standard 7) to negligible at .04 for Standard 9. For participants’ teaching
experience, the correlations were significant for Standards 1, 2, 3, 4, 5, and 10 with these
associations also in the weak range, from r = .30 (Standard 5 and 10) to r = .36 for Standard
2.
For Content Area, these designations were recorded separately for Elementary,
132
Middle Grades, and High School Grade Levels. Within these three areas, the cell sizes for
the various content areas such as Math, Science, Language Arts, Special Education, etc.,
were too small to support ANOVA to determine if there were differences across these
content specializations and the perceived level of professional preparation for Standards 1-
10 at the end of the MAE Program. Therefore, it was not possible to do any analysis for
these data; consequently only Grade Level data are reported in this section.

133
Table 36
Descriptive Statistics and ANOVA Analyses for Grade Level (Elementary, Middle,
Secondary) by Level of Professional Preparation on Standards 1-10 at Completion of
Program
Elementary
Middle
High
Standard F n M SD
n M SD
n M SD
1 .84 19 4.16 .68 9 4.24 .42 18 4.10 .57
2 .91 19 4.20 .77 9 4.31 .35 18 4.21 .60
3 .36 19 4.54 .72 9 4.62 .34 18 4.31 .55
4 .88 19 4.19 .69 9 4.27 .39 18 4.14 .54
5 .59 18 4.09 .64 9 4.22 .45 18 3.97 .65
6 .66 18 4.27 .83 9 4.44 .53 18 4.17 .72
7 .63 18 4.24 .64 9 4.37 .48 18 4.13 .65
8 3.39* 18 4.26 .63 9 4.28 .44 18 3.76 .72
9 .96 18 4.28 .78 9 4.22 .54 18 4.22 .58
10 .64 18 4.22 .94 9 4.19 .45 18 3.99 .74
F* = 0.4; all other p 7.12.
Table 36 represents students’ perceptions of their professional preparation according
to their grade level at the completion of the program. The analysis shows that for all 10
standards, these students’ self-perceptions of their professional preparation upon program
completion is essentially positive for each grade level (all values above 4.0 on a 5-point
scale for elementary and middle, all but standards 8 and 10 above 4.0 for high school).
Overall, the lowest mean value (3.77) corresponds to Standard 8 for high school while the
highest mean (4.62) was calculated for Standard 3 at the middle school level.

134
The ANOVA analyses for Grade Level and student responses at the completion of
the program for all ten standards are also presented in Table 36. Only Standard 8,
“Collaborates with colleagues, parents, and other agencies to design, implement, and
support learning programs that develop student abilities to use communication skills, apply
core concepts, become self-sufficient individuals, become responsible team members, think
and solve problems, and integrate knowledge” (Kentucky Education Professional Standards
Board, 2012), has a significant F value (3.39) with p = .04. Means for Standard 8 (from
Table 36) indicate that the value for Secondary (3.76) is lower than Elementary (4.26) and
Middle School (4.28). The remaining mean values reported by grade levels in Table 36 are
not significantly different for the remaining Standards 1-7, 9-10.
Table 37
Tukey’s Post Hoc Analysis for Differences across Grade Level for Standard 8
_________________________________________________________________________
Mean 95% Confidence
Contrast Difference Lower Upper
E - M -.01 -.65 .62
E - S .50 -.02 1.02
M - S .51 -.12 1.15
Note. E = Elementary Level; M = Middle Grades Level; S = Secondary Level.
Tukey’s post hoc data for Grade Level differences for Standard 8 are presented in
Table 37. None of the three contrasts are significant as 0.0 is included in all three
Confidence Level ranges. This is an instance where the overall ANOVA equation is

135
significant (Table 36) but the separate contrasts do not reach significance, likely because of
the small sample size and the fact that Tukey’s test controls for family-wise error, despite
the Secondary School mean being visibly lower (less prepared for Standard 8) than
Elementary and Middle School. However, the E – S contrast comes very close to being
significant as the lower limit for that difference is only -.02 so that 0.0 is barely within this
confidence range.
Summary
The purpose of this quantitative study was to examine the perceptions of the MAE
students about their level of professional preparation. The data were collected through a
survey disseminated in Qualtrics via e-mails in students’ TCHL 560 final capstone class.
The perceptions were measured using the MAE Teacher Leader Program standards which
mirror the Kentucky Advanced EPSB Teaching Standards. The 10 standards have 45
indicators which were rated utilizing a double matrix, checking students’ perceptions at the
beginning and at the end of the program. The population for this study consisted of 107
students from Cohort 1 and Cohort 2 in the new program. Surveys that did not meet decision
rules for missing data (n = 11) were eliminated. This left a final sample of 46 students
(43%).
The researcher calculated descriptive statistics, such as frequencies, percentages,
means, maximums, minimums, range, and standard deviations. The dependent variables for
the study were Perceptions at the End of the Program and Differences in the Perceptions
from the Beginning to the End of the Program. The independent variables included the
Program Strands representing the five content areas (MAE in Interdisciplinary Early
Education, MAE in Elementary Education, MAE in Middle Grades Education, MAE in
Secondary School Education, and MAE in Special Education) and the demographic control
136
variables divided into two subgroups: Personal Identity (Gender, Race, Age) and
Educational Identity (Grade Level taught, Teaching Experience, and Content Area).
After computing the descriptive statistics, psychometric analyses were calculated to
check whether the specific statements of dispositions, values, beliefs, skills, and knowledge
representing each standard (from 3-5 statements or indicators) functioned as a unitary scale.
Because sample size precluded factor analysis, Cronbach’s alpha was performed. Results
indicated that each of the ten Standards functioned as a whole, with coefficient alpha
ranging from .88 to .98 for student perceptions at the beginning of the program and from .88
to .95 at the completion of the program. The 10 MAE Program Standards are identical to the
Kentucky Advanced EPSB Teaching Standards, so they represent the content deemed
important as developed by the Kentucky EPSB. Thus, it can be presumed that the internal
validity of the standards is high.
The analysis shows that students felt prepared to implement the MAE Program
Standards at the end of the program as mean student responses ranged from 4.07 (Standard
5) to 4.47 (Standard 3) across the standards. Breaking the overall data down from the
program strands – MAE content in Elementary, Middle School, Secondary, and Special
Education – revealed that across the 10 standards, the students in the Elementary and Middle
School strands generally felt more prepared to teach than did those in the secondary and
special education strands.
Examining growth in perceptions from beginning to end of program, t tests
demonstrated that these students overall indicated that they were better prepared
professionally for all 10 standards (significantly so) with t values ranging from 4.40
(Standard 3) to 6.48 (Standard 1). The analyses revealed a similarly positive increase in
perceived preparation across the 10 standards when broken down by program strand. For the

137
Elementary, Middle School, and Secondary strands, the perceived growth was positive and
significant for all 10 standards. However, for the Special Education strand, none of the
differences (albeit all positive) reached the level of significance.
Data for RQ3 indicate that the demographic controls (Personal Identity and
Educational Identity) are only somewhat related to the perceptions at the end of the
program. For Personal Identity, none of the differences for Gender are significant. There
was insufficient variance to calculate difference for Race/Ethnicity. Age was weakly but
significantly correlated with perceived level of professional preparation for half of the
standards (2, 3, 4, 6, and 10). For Educational Identity, it was not possible to calculate
whether Content Area Taught was related to student perceptions of professional preparation
to teach due to small cell sizes. The findings show that Teaching Experience is correlated
with six of the ten Standards (Standards 1, 2, 3, 4, 5, and 10). Finally, Grade Level Taught is
essentially unrelated to students’ perceptions of their level of professional preparation at the
end of the program as only one of the ten ANOVA calculations was significant (for
Standard 8) and the Tukey post hoc analysis revealed that none of the contrasts between
grades taught (elementary, middle, and high) were significant.
The central research question for this study is: What are the perceptions of teachers
completing the WKU MAE Teacher Leader Program regarding their level of professional
preparation? Overall, the findings show that teachers feel prepared to do their job upon
completion of the MAE Program (generally above 4.0 on a 5-point scale) according to the
WKU MAE program standards which are same as the Kentucky EPSB Advanced Teacher
Standards. Further, paired t tests showed a significant difference in their responses between
the beginning and completion of the program for each of the 10 standards. Thus the overall
analysis reveals student perceptions that are generally positive on preparation to teach and

138
significant improvement in that preparation over the course of the program.
139
CHAPTER V
DISCUSSION AND CONCLUSIONS
Introduction
American schools were in crisis, as the A Nation at Risk report (National
Commission on Excellence in Education, 1983) pointed out. As a result, numerous efforts
were made in order to improve the quality of education since the 1980s. The continuous
reforms addressed both schools of education and the process of teacher preparation on the
state and federal levels (Anderson, 2005). Recent efforts in schools of education emphasized
accountability and aligning curriculum. In Kentucky, the Department of Education (2010)
implemented curriculum reform across grade levels in order to improve student outcomes.
Quality of teachers also became an important issue in school improvement. As Miller et al.
(2003) noted, quality workers are the key to success in any organization.
Preparing better teachers also became the goal of the recent educational initiative
Our Future, Our Teachers (U.S. Department of Education, 2011). As a result of these
reforms, colleges and universities across the United States have been strengthening their
educational preparation programs. One of the steps in that direction was including teacher
leadership classes in their curricula. Researchers have found that teacher leaders improve the
quality of school education, mentor and coach colleagues, promote teacher retention, and
serve as agents of change in their learning communities (Danielson, 2006; Henning, 2006;
Stone et al., 2006). Teacher leader preparation has become one answer to the reforms
needed in response to the call for school improvement.

140
Despite the facts that many colleges included teacher leader programs in their
curriculum (Manious, 2012), to the author’s knowledge, no quantitative studies have been
done on teacher leader master’s programs. This study evaluates a teacher leader program
from the students’ perspective. The idea for the study came from Javidi’s (2011) work in
which early childhood program quality was evaluated by using program standards as a
measure of program quality. The study constitutes survey research with correlational design.
Students’ demographic background and program strands were the independent variables;
students’ perceptions of their level of preparation on the Kentucky EPSB Advanced Level
Teacher Standards were the dependent variables. The program inception was in 2010; thus
the population is limited to Cohort 1 and Cohort 2 for this new MAE degree. The data for
this study came from students’ self-reported survey responses. The central research question
for this study is: What are the perceptions of teachers completing the WKU MAE Teacher
Leader Program regarding their level of professional preparation?
The remainder of this chapter includes a brief overview of the study, discussion and
analysis of the findings, and recommendations. Finally, the author addresses conclusions
from this research.
The Study in Brief
Research demonstrates that teacher leaders bring positive changes to schools
(Alvarado, 1997; Brandt, 1995; Danielson, 2006; Evans & Powers, 2011). The goal of
numerous reforms and initiatives on federal and local level was to improve the quality of
school education. Effective teachers have positive impact on student achievement (Cohron,
2009).
Overview of the Literature
Numerous studies address the topic of teacher leadership, specifically the effects of

141
teacher leaders on school and student outcomes; however the process of teacher leader
preparation has not been the focus of empirical research. Educational reforms of the past
decade put an emphasis on accountability in education (Anderson, 2005). This movement
led to implementing Common Core standards as a measure of students’ achievement for
each grade level. With the continued struggle to improve the quality of schools,
policymakers in America have gradually focused more attention on preparing highly
qualified teachers in colleges. Numerous national and state initiatives addressed the process
of teacher preparation within the context of improving schools of education.
The complexity of modern education led to the changing role of teachers (Barth,
2001). The phenomena of teacher leadership became the focus of research because this type
of leadership brings positive changes to schools and helps in the implementation of
numerous reforms in school settings (Alvarado, 1997). Colleges have modified their
educational preparation programs by including teacher leadership in their core content
classes.
The remainder of Chapter II covers current research by Cohron (2009) and Javidi
(2011), studies on teacher leadership and program evaluation, respectively. The theoretical
perspective utilized as the framework for the study is based on Burns’ (1978)
transformational role of teacher leaders, the constructivist model of educational leadership
based on collaborative practices and professional learning communities (Hord, 1997; Silva
et al., 2000), and Danielson’s (2006) research on the teacher leader concept. More
expansively, the literature reviewed in Chapter II covers the topics of Educational Reforms,
Teacher Education, Teacher Leadership, and Masters’ Degree in Teacher Education. The
review concludes with a Summary.
The Study Design

142
This quantitative research study analyzed students’ responses to a survey about their
perceptions of their level of professional preparation, following MAE Program completion,
on the ten MAE Program Standards, which are also the Advanced Level Kentucky Teacher
Standards. Recent educational initiatives have emphasized the quality of teacher preparation
and improving student achievement. As a response to this call, colleges started to implement
new teacher preparation programs. While research shows the positive effect of teacher
leadership on school success, research on the quality of teacher leader preparation is limited.
This study is a partial program evaluation of a pioneer MAE Teacher Leader
Program at Western Kentucky University. The program was established in 2010 as an
answer to the national call for school improvement. There are five program strands: MAE in
Interdisciplinary Early Education, MAE in Elementary Education, MAE in Middle Grades
Education, MAE in Secondary Education, and MAE in Special Education. The population
includes students from Cohort 1 and Cohort 2 in their TCHL 560 action research class. They
were invited to take a survey via Qualtrics. The link to the survey and the sponsorship letter
from the Teacher Leader Program Representative, Dr. Lisa Murley, was sent to the students
by their professors Drs. Cribbs, Gandy, and Pereira. The sample consists of students who
completed the survey.
The data for this study came from the first two cohorts during their final capstone
class (N = 107). Cohort 1 students received the link to the survey and the letter in Fall, 2013
and Cohort 2 in the Spring, 2014, accordingly. Students who were enrolled in the program
but had not progressed to the final capstone class were excluded from the population. The
final sample consisted of 46 MAE students (43% of the population) who successfully
completed the program, voluntarily responded to the survey questions, and met the criteria
of the decision rules for missing data. There were 24 students from the Fall, 2013 class and

143
22 students from Spring, 2014 class, respectively. Surveys with missing data were excluded
from the sample consistent with decision rules adapted from Lynes’ (2008) study: the
amount of information missing from the surveys was 10% or less of all data, or the omission
of an entire scale, or the omission of demographic data. Each of the 45 indicators is scored
on a five-point Likert-type scale describing students’ perceptions toward their level of
professional preparation on each standard.
Research demonstrates that personal and professional identity impact a person’s
decisions (Lynes, 2008; Javidi, 2011; Miller et al., 2013). These categories were addressed
in the study as control variables affecting students’ perceptions. The independent variables
for this research were demographic factors and the five program strands. Demographic
factors were divided into two categories: Personal Identity and Professional Identity.
Personal Identity included Gender, Race, and Age. Educational Identity factors are Grade
Level Taught, Teaching Experience, and Content Area. The Program Strands include: MAE
in Interdisciplinary Early Childhood Education, MAE in Elementary Education, MAE in
Middle Grades Education, MAE in Secondary School Education, MAE in Special
Education. Descriptive statistics were reported for the Demographic Factors and five
program strands.
The dependent variables included two categories: MAE Teacher Leader student
perceptions at the end of the program and differences in perceptions from the beginning to
the end of the program. The perceptions of the students reflect their opinions toward the
level of their professional preparation according to the 10 Kentucky EPSB Advanced Level
Teacher Standards. The logic model for this study is depicted in Figure 1 (p. 18). The data
for the study were obtained from student surveys based on these teacher standards. The self-
report by students is one of the limitations to the study. This is a partial program evaluation

144
study of the new WKU MAE Program. However, to the author’s knowledge, no
psychometric analysis had been done by KDE for the ten EPSB Teacher standards and their
respective 45 indicators. In that regard, the study also serves as the first empirical validation
of these Kentucky standards for teacher quality.
For this study, the small sample size precluded factor analysis; instead, Cronbach’s
alpha was computed for scale reliability on the sets of indicators associated with each of the
10 standards. Crohbach’s alpha also functions as a rudimentary form of construct validity,
providing a measure of the extent that the indicators for their respective standards combine
into a single factor (see Nunnally & Bernstein, 1994).
In addition to the psychometric analysis, the research questions required
correlational analysis (or t tests and ANOVA for variables with nominal or ordinal scale of
measurement) to determine the extent of association among the demographic factors, the
five program strands, and students’ perceptions of their level of preparation on the 10
teacher standards at the end of the program (data collected during the capstone class on
action research). A second research question examined the extent of differences on students’
perceptions of their level of preparation from the beginning to the end of the program. These
differences were calculated and checked for significance utilizing t tests.
Prior to any data collection, this study was approved by the Institutional Review
Board at Western Kentucky University. The letter of approval is located in Appendix E.
Discussion
This section of Chapter V provides summary and analysis of the findings of this
research. The structure of this part of the dissertation follows the pattern of Chapter IV. It
starts with Descriptive Statistics and concludes with Psychometric Analysis and the
Research Questions.

145
Chapter II provided literature review on teacher leadership and how it affects various
stakeholders. While these topics represented the focus of the research interest, studies on
teacher leader professional preparation were limited. The author found only one study by
Manious (2012) examining college programs on teacher leader preparation. Thus, there is a
clear need to investigate teacher leader preparation programs. This study provides a research
and a partial evaluation of the WKU MAE Teacher Leader Program.
Descriptive Statistics
Descriptive statistics were reported for the independent variables: Demographic
Controls and Program Strands. Demographic Controls are Personal Identity (Gender, Race,
and Age) and Educational Identity (Grade Level Taught, Teaching Experience, and Content
Area). Data were self-reported by two groups of WKU MAE Program students graduating
in 2013 and 2014. The findings and analysis are presented in the section below.
Summary. Reports indicated that 73.9% of the students were females.
Race/Ethnicity data show that 6.7% were African Americans, and 93.3% were
White/Caucasian. The mean for these students was 31.4 years of age with a range from 26 to
56.
Regarding Educational Identity, analysis shows that Elementary (K through 5) and
High School (9-12) teachers represent the majority of the students with almost equal
numbers of 41.3% and 39.1%, respectively; Middle School (6 through 8 grades) comprises
only 19.6% of the sample. Students reported that their Teaching Experience is between 1
and 15 years with a mean of 6.24. For Content Area, Elementary School was represented by
Preschool (42.1%), Upper Elementary (31.6%), Related Arts (5.3%), and Special Education
(21.1%). For Middle/High School combined, teachers were distributed as Math (29.6%),
Language Arts (11.1%), Social Studies (22.2%), Science (7.4%), Related Arts (11.1%),
146
Special Education (14.8%), and Teacher Leader (3.7%).
Program Strand analysis shows the following distribution: no respondents were
enrolled in the MAE in Early Childhood Education; the MAE in Elementary Education had
30.4%; MAE in Middle Grades Education, 15.2%; MAE in High School Education, 32.6%,
and MAE in Special Education, 21.7%.
Analysis. Because there are essentially no prior empirical evaluations of the MAE
teacher leadership programs, these data represent information new to the field. The
descriptive findings are consistent with the population at WKU, a regional university in a
mid-southern rural area. These results could help program administrators pinpoint the
targeted group of prospective students for program enrollment and create adequate support
classes and counseling teams for minority populations. These data can be used as a starting
point for business analysis to predict market opportunities for program development and
cater to the needs of the specific student population based on their demographics. Analyzing
learning opportunities based on demographic data can help target underserved populations
and make the necessary adjustments in providing workshops and additional services
according to their needs.
Psychometric Analysis
For this study, factor analysis was precluded as psychometric evaluation due to small
sample size. Cronbach’s alpha was computed for the set of substandards (from 3-5 for each
of the ten standards) representing the skills that teachers need to perform effectively
according to the Kentucky Education Professional Standards Board. This computation
provides scale reliability and a rudimentary sense of the Standards’ construct validity. To
the author’s knowledge, no such analysis had been performed on any of these standards by
either Kentucky EPSB or by the KDE.

147
Summary. The Cronbach’s alpha computations range from 0.88 to 0.95 for the
current standards where Standards 1, 5 and 7 have the lowest reliability and Standard 10 has
the highest. For the beginning of the program, the results were similar, ranging from an
alpha of .88 for Standard 1 to .98 for Standard 10.
Analysis. These finding represent not only a validation of the program standards
utilized in the WKU MAE in Teaching Leadership, but even more importantly, the only
empirical evidence on the validity of the Advanced Teacher Standards that were developed
by the Kentucky Education Professional Standards Board and for which all teachers in the
state are held accountable.
There are several implications of these results. First, although the state holds
teachers responsible for the content of these standards, the failure of EPSB or KDE to
validate their content is a major shortcoming of the accountability process. These findings
provide a rudimentary evaluation that the Standards are both valid and reliable, particularly
in the context of the latest reform movement of standardization of education on national
level, i.e., that teacher’ skills and quality are focused on student achievement as a pivotal
point in education.
Second, these results also provide evidence that the program standards for the WKU
MAE in Teacher Leadership are valid.
Third, the data on the Standards’ validity and reliability can be used by future
researchers in this field. These analyses provide a starting point, but the small sample size
precluded a more rigorous statistical analysis. Thus, these results should encourage other
researchers to examine the entire ediface of teacher standards for overall quality, including
but not limited to construct validity and reliability. This statement holds not only for
Kentucky but for other states as well.

148
Finally, the pragmatic result of these findings is that the sets of from three to five
substandards in each standard represent unitary scales. Thus, educators can reasonably
examine what they are doing in light of the ten holistic standards, rather than having to
consider the 45 substandards individually had they not demonstrated adequate construct
validity.
Research Question 1
From the perspectives of students in the Western Kentucky University MAE Teacher
Leader Program regarding their level of professional preparation:
What are their perceptions at the end of the program:
a. For all students?
b. For students in each strand (MAE in Elementary Education, MAE in
Interdisciplinary Early Childhood Education MAE in Middle Grades, MAE in
Secondary Education, MAE in Special Education)?
Summary. Based on the psychometric results, each standard can be considered as a
whole; the Grand Means, standard deviations, minimum, maximum, and range were
calculated for each standard. Overall, according to the MAE Program Standards, teachers
felt prepared to teach at the completion of the program with means on the 5-point scale from
4.07 (Standards 5 and 8) to 4.47 (Standard 3).
The data analysis for professional preparation by strand revealed that there were no
respondents for the MAE in Interdisciplinary Early Childhood Education. Generally, the
overall results were positive regarding the perceptions of these students’ professional
preparation at the end of the program, but there was some variation by strand. The students
in the MAE in Elementary Education and MAE in Middle Grades Education had higher
perceptions of their level of professional preparation (approximately 4.3) while the MAE in
149
Secondary Education and MAE in Special Education strands reported lower preparation
(just above and below 4.0, respectively).
There was also some variation from standard to standard. The Elementary strand had
means ranging from 4.17 (for Standard 5) to 4.71 (for Standard 3). For Middle Grades the
means were from 4.0 (for Standard 5) to 4.61 (for Standard 9). In contrast, the means for the
Secondary Education strand (lower perceived preparation) ranged from 3.63 (for Standard
8) to 4.29 (for Standard 2). For Special Education the range was from 3.94 (for Standard 1)
to 4.30 (for Standard 3).
Analysis. The data can be used for holistic program evaluation as well as a guide for
specific program improvements needed as the study pinpoints the overall success of the
program but also highlights the different strands with the greatest need for additional
support as well as the particular standards on which students report different levels of
preparation. Both Secondary Education and Special Education students might need extra
help from the program administrators. The reasons why these program strands are
experiencing greater concern about their professional preparation is beyond the scope of this
study, but future program evaluations could address this understanding of the problem
(perhaps via qualitative interviews) and suggest corresponding program modifications. Such
qualitative data could examine both strand to strand differences and variations from one
standard to the next.
Research Question 2
To what extent do perceptions differ from the beginning to the end of the
program:
a. For all students?
b. For each strand (MAE in Elementary Education, MAE in Interdisciplinary Early
150
Childhood Education MAE in Middle Grades, MAE in Secondary Education,
MAE in Special Education)?
Summary for RQ2.a. The data analysis indicated that overall, these students
reported improvements for each standard from the beginning to the end of the program.
Mean differences upon program completion ranged from .70 (for Standard 4) to .80
(Standards 2 and 7) for nine of the 10 standards. Standard 3 had only a .47 increase but this
represented a ceiling effect as this was the only content area that reached 4.0 for beginning
level assessment and the 4.47 at completion was the highest of the 10 standards. Paired
sample t tests demonstrated that the improvements from the beginning to the end of the
program were significant at p less than .001 for all 10 standards.
Analysis for RQ2.a. Overall, these findings show that the Western Kentucky
University MAE in Teacher Leadership is functioning effectively. These data represent the
first empirical evidence available as program evaluation with respect to students’ sense of
professional confidence, specifically preparation to teach the content embedded in the WKU
Program Standards (the same as the EPSB Advanced Teacher Standards).
That same positive conclusion holds not only for students’ level of preparation at the
completion of the program, but also for their perceived level of improvement from the
beginning to the end of the program. That is a remarkable accomplishment, i.e., overall, the
change was both positive and statistically significant for each of the 10 standards.
These findings need to be shared with school faculties and principals, and students
encouraged to apply for the program. The findings constitute empirical evidence that the
WKU MAE in Teacher Leadership is effective and that students enrolled are growing
professionally. That level of validation of teacher education programs is all too rare.
Summary for RQ2.b. Student responses by strand (RQ2.b.) show that students
151
reported an improvement in professional preparation for each standard over the course of the
program. Differences in mean values on the 5-point scale from the beginning to the end of
the program were distributed in the following manner: for Elementary Education from .36
(Standard 3) to .92 (Standard 10); for Middle Grades from .69 (Standard 3) to 1.24
(Standard 1); for Secondary Education from .53 (Standard 3) to .84 (Standard 2); and for
Special Education from .28 (Standard 10) to .72 (Standard 6). There were no responses from
the students in the MAE in Interdisciplinary Early Education.
Paired sample t tests were also calculated for the degree of change for each standard
across all four strands. Those results revealed that these improvements were significant for
each of the 10 standards for the MAE in Elementary Education, the MAE in Middle Grades
Education, and the MAE in Secondary Education. However, none of the improvements for
the 10 standards were significant for the MAE in Special Education. Thus, while students in
all four strands reported improvement toward their professional preparation, the changes in
the MAE in Special Education means were lower (and not significant) compared to the
statistically significant improvements in the other three strands.
Analysis for RQ2.b. Similar evidence was compiled for each of the four program
strands. Analyzing these tendencies provides needed information on variation in outcomes
across the program levels.
First, students in the MAE in Elementary Education and MAE in Middle Grades
Education generally reported a higher level of professional preparation at the completion of
the program (around 4.3) than those in the MAE in Secondary Education and MAE in
Special Education strands (around 4.0). This was due to slightly lower levels of reported
preparation at the beginning of the program, but also smaller incremental improvement over
the course of the program.

152
Second, there were differences in perceived growth from the beginning to the end of
the MAE program. Specifically, as was the case for the overall analysis, students in each
separate strand reported improved sense of professional preparation for all 10 strands.
However, that growth was statistically significant for only three of the four program strands:
MAE in Elementary Education, MAE in Middle Grades Education, and MAE in Secondary
Education (for all 10 strands in all three areas).
In contrast, the improvement was not statistically significant, for any of the 10
standards, for the MAE in Special Education. This reflects smaller reported incremental
improvements but also less statistical power (n = 10 for the Special Education strand). Thus,
particular attention should be given to MAE in Special Education students, as they reported
both less confidence with their professional preparation and smaller incremental
improvements upon program completion. These findings do not reveal why this is the case
(again qualitative follow-up studies could address this). Possibilities include specific
workshops and professional practices under the guidance of veteran teachers that could help
the MAE in Special Education students feel familiar with the skills involved in mastering
these standards. Hands on approaches and blended class format (particularly with MAE in
Elementary Education students) might also benefit students in overcoming the obstacles and
reaching mastery in teaching.
These suggestions are only speculations, however. More information is clearly
needed for the Special Education strand. To a lesser extent, this also holds for the Secondary
Education strand (significant improvement over the course of the program but still lower
than the Elementary and Middle Grades groups). Because these data represent findings new
to the field, there is essentially no prior information to guide such specific program
improvements. This some conclusion also holds with respect to differences in students’

153
reported preparation for the content covered from one standard to the next.
Research Question 3
How do personal identity and educational identity variables relate to
perceptions at the end of the program?
Summary. According to Figure 1, the Personal Identity block consists of
participants’ Gender, Race/Ethnicity, and Age.
For Gender, differences in responses between males and females are negative, except
for Standard 6 (0.27), with mean differences ranging from -0.05 (Standards 4 and 8) to .27
(Standard 6), i.e., these findings show that males reported higher level of professional
preparation upon program completion. However, the p values for t tests to examine these
gender differences were above 0.05, so these findings were not significant.
For Race/Ethnicity, 42 of the respondents reported that they are White while 3 were
African Americans. One person did not respond to this question.
For Age, values for the computed correlations ranged from r = .31 (Standard 2) to r
= .39 (Standard 6) for Standards 2, 3, 4, 6, and 10 (significant correlations), showing that
there is a relationship between age and the level of professional preparation for the above
mentioned 50% of the standards. For three more (Standards 1, 5, and 7) Age was almost
significant. For Standard 8 and Standard 9, the correlation was essentially zero.
The Educational Identity block consists of Grade Level, Teaching Experience, and
Content Area. Content Area was reported separately for Elementary, Middle Grades, and
High School levels. To investigate further, these three areas were divided for the various
content areas such as Math, Science, Language Arts, Special Education, etc. However, these
sub-samples of content disciplines were too small to compute an ANOVA to determine
whether there were differences in perceived level of educational preparation on the WKU

154
Program Standards across those curriculum areas.
The continuous variable Teaching Experience was correlated significantly with level
of professional preparation for Standards 1, 2, 3, 4, 5, and 10 with r ranging between .30
(Standard 5 and 10) and .36 for Standard 2. Standard 9 was almost significant as well.
The students in the WKU MAE in Teacher Leadership are practicing professional
teachers. The Grade Level classification indicates the number of students teaching at
elementary, middle, or high school levels. The mean values for the perceived level of
professional preparation for the 10 program standards are positive and above 4.0 on a 5-
point scale for those elementary and middle school teachers; for high school level, only
Standard 8 falls substantially below the 4.0 level (Standards 5 and 10 are at 3.97 and 3.99,
respectively).
Across all three levels of teachers, Standard 8 (Collaboration) showed the lowest
mean value (3.76 for high school), and Standard 3 had the highest mean (4.62 at the middle
school level). ANOVA tests demonstrated that only Standard 8 had significantly different
values when comparing the level of professional preparation across the grade levels. The
value for Secondary (3.76) is lower than Elementary (4.26) and Middle School (4.28), but
based on Tukey’s post hoc examination for Grade Level differences for Standard 8, none of
the three contrasts are significant, possibly because of the small sample size (low power).
For the rest of the standards, the ANOVAs for mean values of educational preparation by
grade level of teaching are not significantly different.
Analysis. For the Personal Identity block, Gender, Race/Ethnicity, and Age were
included. The Educational Identity block contained Grade Level Taught, Teaching
Experience, and Content Area.
Briefly, these new results for the two blocks of socio-demographic variables are as
155
follows. For Personal Identity, males feel that they are better prepared than females for all
except Standard 6, but the results were not significant. No analysis was performed for
Race/Ethnicity, because of insufficient variance (White – 93.3%, African-American –
6.7%). For Age, older students indicated a weak but significant relationship to self-
perceptions of mastery of the MAE Program Standards (Standards 2, 3, 4, 6, and 10) while
three additional standards (1, 5, and 7) were almost significant. With respect to Educational
Identity, no analysis was performed for Content Area due to small cell sizes. Similar to the
finding that older teachers reported better preparation on these program standards, Teaching
Experience (more experience, better preparation) is correlated with six of the ten Standards
(Standards 1, 2, 3, 4, 5, and 10) and was almost significant for Standard 9. Finally, Grade
Level Taught is not significantly related to these teachers’ perceptions of their preparation
for any of the standards.
Summarizing these findings, for the Personal and Professional Identity blocks, only
age and teacher experience demonstrated significance for students’ confidence in their
professional preparation for any of the ten program standards. Additional research with a
larger sample needs to be done for analysis of possible relationships between students’
perceptions of professional preparation and other demographic factors as the small sample
size either did not allow data analysis or resulted in low statistical power.
Based on these current findings, younger and less experienced teachers are groups
that need to be provided with resources that will assist them in succeeding professionally.
Support from the MAE program staff could provide these students with much needed help.
Group work with more experienced teachers in class discussions and focused WKU
workshops could aid less experienced and younger teachers. Technology tools, such as
digital communication through professional web links and various websites where teachers

156
share lesson plans, professional advice, pacing guides, and samples of worksheets for
various grades could also help less experienced teachers to find the additional resources that
they need. WKU program staff could introduce such resources to teachers and train them in
how to use them. These strategies and the information available in these teacher resources
accessible on the internet could help these MAE students to become better professionals and
ultimately improve their own students’ learning outcomes.
Recommendations
This section of Chapter V is organized into two areas. The specific recommendations
are in the sections Policy and Practice and Future Research below.
Policy and Practice
The purpose of this section is to provide suggestions on program policy and practice
according to the research data. Although in general students reported improvement in each
area of professional preparation based on program standards, some findings pinpointed areas
of improvement for the program. Specifically, the research suggested areas where students
in these strands need additional support from WKU personnel, possibly in the form of
workshops on the skills indicated in the standards where students felt deficiency in
improvement. Face-to-face meetings and professional guidance could be organized and
provided by program administrators and faculty members, and students should be
encouraged to attend so they will receive professional preparation as needed.
First, the study shows that the WKU MAE program in Teacher Leadership improves
students’ teaching skills according to the students’ point of view. Thus, these program
results need to be disseminated and advertised for prospective students. The findings
demonstrate that teachers can master educational practices, fulfilling Kentucky EPSB
requirements for highly qualified teachers, while earning advanced degrees. For too long,
157
the perception has been that receiving a Master’s degree was because of state requirements
and the salary schedule increases. It is encouraging that this program provides consistent
evidence of significant improvement in teacher quality was well.
Second, students with certain demographic characteristics reported that they
experienced greater difficulties in mastering some of the MAE program standards (which
are the EPSB Advanced Teacher Standards). In particular, beginning and younger teachers
reported lower confidence in their teaching according to the program standards. For Age
(older teachers reported higher levels of preparation), perceptions of Standards 2, 3, 4, 6,
and 10 were significant and Standards 1, 5, and 7 were almost at that level. Only Standards
8 and 9 (Collaboration and Professional Development) were not related to Age. The data
were similar for Teaching Experience (Standards 1, 2, 3, 4, 5, and 10 significant and
Standards 7 and 9 almost significant). Only Standards 6 and 8 showed no relationship
between experience and perceived level of preparation at the end of the program. Therefore,
beginning teachers and younger teachers need extra support on the skills involved in these
standards, possibly in the form of consultation or advising for beginning teachers or blended
group work where veteran teacher students might coach the beginners. While students’
demographics are beyond program control, such groups should be targeted from the
beginning of their studies. Support in the form of workshops, consultations, and blended
face-to-face classes with veteran teachers modeling best educational strategies are
possibilities.
Third, although students overall reported considerable confidence in their level of
professional preparation at the end of the program (all 10 standards at or above a mean of
4.07 on a 5-point scale), there was some variation across the standards. In particular,
Standards 1, 5, 8, and 10 were lower (means ranging from 4.07 to 4.15), Standards 2, 4, 6, 7,

158
and 9, higher (means from 4.19 to 4.26) while Standard 3 (mean = 4.47) had the highest
level. Instructors with this knowledge can pay particular attention to these professional
quality indicators according to these findings. Possibly additional guided practices could
help students master all of these standards at similar high levels.
Finally, the students in the MAE in Special Education and MAE in Secondary
Education indicated lower levels of professional preparation. Even more troubling, the MAE
in Special Education strand findings indicated improvements in their teaching practices were
not significant upon program completion (the only strand for which this was true). Although
these quantitative data do not explain why this is the case, surveying students during the
educational process could provide more information on the areas where improvement is
needed (the current study was at the end of the program). Program administrators might add
classes or practices to the MAE in Special Education Program as corresponding content
modifications based on additional qualitative survey results. A professional meeting
organized and guided by program administrators where students from different program
strands can share their achievements and express concerns might also be helpful.
Future Research
The study investigated the WKU MAE in Teacher Leadership since its inception
until the current time. The research serves as a partial program evaluation, allowing WKU to
improve the quality of teacher education and make students’ voice heard, consistent with the
U.S. Department of Education (2011) initiative, Our Future, Our Teachers, which
emphasizes the quality of teacher education and the importance of teacher leaders in school
success. Several suggestions follow, focused on future research in the area of teacher
education in general and the investigation of this program (MAE in Teacher Leadership) in
particular.

159
First, additional research is needed as the current program will progress and
accumulate history. The population for this study consisted of only the first two cohorts to
graduate due to the fact that the program started in 2010. Thus the study should be replicated
for subsequent cohorts.
Second, master’s programs in teacher leadership need further investigations
generally as no studies have been done to assess the quality of these programs from the
students’ point of view. The survey instrument for this study, created in accordance to the
Kentucky EPSB Advanced Teacher Standards, could be used in colleges and universities
across Kentucky for a broader and more general program evaluation. The study can be
replicated state-wide for teacher leader programs and the results of such study can be
compared with the data from a single regional study. The trends emerged in respect to
students’ population could be used in program marketing as well as addressing the needs of
the specific groups of students. The comparison crosswalk of student self-reported
perceptions of their professional preparation by program strands can provide the insights
toward what was a low confidence of the MAE in Special Education group specific to a
regional university only. Similar research is needed for statewide data on how
content/pedagogy and professional affiliation by grade level can be related to students’
professional confidence. The survey instrument could also be modified to other states’
teaching standards and used in their program evaluations as well. These findings will allow
comparing teacher leader preparation programs across the country and providing necessary
adjustments toward program improvements as needed.
As of this writing (Fall, 2015), the author’s research model and instrument have been
selected for a statewide program evaluation of Kentucky EPSB-sanctioned master’s
programs in teacher leadership. That study is currently in progress.
160
Third, some particular findings need to be researched further as they have
implications of the program’s current weakness. In particular, Special Education and
Secondary Education teachers reported that their professional preparation is lower compared
to the Elementary and Middle Grades. As noted under Policy and Practice above, this is
even more problematic for the Special Education strand where improvements from the
beginning to end of the program were not significant (the only strand where that was the
case). Additional research on those particular stands, perhaps related to qualitative surveys
focused on why this was the case could increase understanding of the professional
implications related to program improvement.
Fourth, there were some variations in level of professional preparation across the 10
standards. Thus qualitative studies could aid in understanding the relationship between the
program’s current curricular emphasis and differential levels of success across the respective
content of the 10 standards.
Fifth, the small sample size restricts both the statistical procedures that could be
utilized and the power for those that were. A larger sample size would allow researchers to
address these deficiencies.
Sixth, the study was retrospective, i.e. students evaluated their perceptions at the end
of the program, giving their perceptions of their level of professional preparation on the 10
standards at the beginning and currently, at the end of the program. This issue was addressed
in detail in the Limitations section of Chapter I. For a true longitudinal study, future
researchers should collect data from students twice: at the beginning and again at the end of
the program.
Seventh, the psychometric evaluation of construct validity of the 10 strands was
restricted to the most rudimentary measure (Cronbach’s alpha) because of the small sample

161
size. With larger and more representative samples, a more thorough validation of the extent
that the substandards for each standard represent a unitary whole could be completed
(neither KDE nor the Kentucky EPSB has done this).
Eighth, this study was conducted at the graduate level. A similar format and
approach could be utilized to examine the quality of undergraduate programs in reaching the
standards for that level.
Finally, as Kentucky is implementing a new teacher evaluation system (the
Professional Growth and Evaluation System, PGES), there is a possibility that the EPSB
may change their teacher standards to be consistent with the new PGES system. These new
standards should be evaluated in a new study parallel to the current research as the statewide
teacher evaluation program evolves.
Conclusions
Teacher leadership has become a necessity in schools due to recent educational
reforms. “The reform movement put a spotlight on school leadership, highlighted its
importance for school success, made student achievement the measure of school
performance, and demanded accountability from leaders for results” (Levine, 2005, p. 17).
According to Burns (1978), transformational leadership enables leaders to inspire and
motivate their followers and improve the working climate in their communities. Brandt
(1992), Hord (1997), Silva et al. (2000) researched the constructivist approach to
educational leadership. They emphasized the importance of collaboration in professional
learning communities. Thus, teacher leadership is an important tool of success in schools.
Although researchers have found that teacher leadership is a foundation of reform
implementation, preparation for teacher leaders has just recently become the focus of the
nation’s policymakers. “The task before us is to redesign teacher education for a new era--to
162
produce a greater number of high-quality teachers with the skills and knowledge necessary
to raise student achievement to the highest in history level” (Levine, 2006, p. 12).
Numerous educational initiatives have raised the question of teacher leader
professional preparation. “Teacher education has taken on a special urgency because the
United States needs to raise both the quality and quantity of our teacher force” (Levine,
2006, p. 5). Answering the nation’s call for school improvement, colleges and universities
have implemented significant changes in their programs of education (Manious, 2012).
Research shows that teacher leaders bring positive changes to learning communities
(Cohron, 2009; Danielson, 2006; Elmore, 2000; Little & Miller, 2007). One of the steps
toward improving teacher preparation was including teacher leadership classes in the core
curriculum for future teachers of America (Manious, 2012).
Despite the recent emphasis on teacher leadership in colleges of education,
consistent with the calls for improvement in this area as noted above, there has been very
little actual research on these new teacher leader programs. Manious (2013) examined
teacher leader professional preparation programs across United States with a mixed methods
approach, but this study was macro in scope, i.e., to what extent are teacher leadership
programs being developed across the nation. To the author’s knowledge, the micro
equivalent, i.e., the actual effects of teacher leadership programs on teacher quality is
unknown because quantitative research on teacher leader preparation programs has not been
conducted.
The current study research addresses this deficit. The purpose of this study was to
examine the perceptions of the students in the Western Kentucky University MAE in
Teacher Leadership, i.e., the effects of the program on their level of professional
preparation. Because the WKU MAE in Teacher Leadership is a new program, this study

163
serves as a partial program evaluation of this local setting. But the analysis also represents
the first set of quantitative data on the effectiveness of teacher leadership programs
generally. In that regard, the study serves as a model for how other programs or even
statewide evaluations could be conducted. In fact, the author’s research model and
instrumentation are currently being utilized for a statewide evaluation of the master’s
programs in teacher leadership in Kentucky.
Building on the work of Javidi (2011), who did a similar assessment of early
childhood (NAYEC) Program Standards, this study examined students’ perceptions of their
level of professional preparation on the WKU MAE in Teacher Leadership program
standards. (These 10 standards are the same as the Kentucky Advanced Teacher Standards
that contain 45 substandards spread across the 10 standards, representing the knowledge and
competencies for which all Kentucky teachers are held accountable, by statute. The 10
standards and 45 substandards are listed in Appendix C.)
Students from the first two cohorts to finish the new WKU program were invited to
complete the survey at the end of their last semester (an action research class). The survey
included a demographic section containing two blocks: Personal Identity (gender, race, and
age) and Educational Identity (grade level taught, content area, and teaching experience)
and identification of which of the five program strands they were in (MAE in Early
Childhood Education, MAE in Elementary Education, MAE in Middle Grades Education,
MAE in Secondary Education, or MAE in Special Education). The main part of the survey
was a dual matrix of 5-point Likert-type responses from 1 = Very Unprepared to 5 = Very
Prepared. Specifically the dual response matrix asked for students’ level of professional
preparation at the beginning and at the end of the program, answered for each of the 45
substandards.

164
Results (detailed above in this Chapter) were organized around Descriptive
Statistics, Psychometric Analysis, and the three research questions. The 46 students with
usable surveys represented 43% of the population (those who completed the coursework for
the first two cohorts ending in Fall, 2013 and Spring, 2014 semesters). The background of
students in the program was consistent with students working on a master’s in education in a
regional university in a rural state: 74% female; 93% White; mean age of 31 years; 6 years
of teaching experience; a distribution across grade level of approximately 40, 20, 40 for
elementary, middle, and secondary, respectively; and content area spreading across the
curriculum generally consistent with the make-up of local schools. Among the survey
respondents, only four of the five program strands were represented; no students were
enrolled in the MAE in Early Childhood Education. The elementary, middle, secondary, and
special education strands comprised 30, 15, 33, and 22 percent, respectively.
Psychometric analysis validated scale reliability and a rudimentary construct validity
for each of 10 Standards and corresponding substandards by computing Cronbach’s alpha
(ranging from .88 to .95, very strong). To the author’s knowledge, neither the Kentucky
Education Professional Standards Board nor the Kentucky Department of Education had
conducted any such prior validity research on the Kentucky Advanced Teacher Standards
which are the same as the WKU MAE Program Standards.
The first research question asks: what is the perceived level of educational
preparation, overall, and for each program strand, at the end of the coursework for the 10
program standards. Overall, students reported that they feel well prepared to teach according
to the 10 WKU MAE Standards, with means between 4.07 (Standard 8) and 4.47 (Standard
3) on a 5-point Lykert-type scale at the end of the program. Some variation in perceived
educational preparation existed strand by strand as well as the differences noted across the

165
10 standards. The elementary and middle grades students reported overall means around 4.3
while the secondary and special education means were lower (around 4.0).
The second research question addressed changes in the level of perceived
educational preparation on the 10 standards from the beginning to the end of the program,
both overall and strand by strand. Here, the positive results from Research Question 1
(means for all 10 standards above 4 on a 5-point scale) are again repeated. Paired sample t
tests examining the differences in perceptions from beginning to end revealed improvements
from .71 to .80 on the 5-point scale for nine of the Standards. The remaining Standard 3 had
only a .47 increase, but this was due to a ceiling effect as this was the only content area
which reached 4.0 at the beginning of the program and was the highest of the 10 at the
program’s end. All of these overall improvements were statistically significant.
The study also examined changes from beginning to program completion for these
MAE in Teacher Leadership students by strand. All four levels reported improvement in all
10 standards. For Elementary, Middle Grades, and Secondary students, paired sample t tests
calculated on these changes revealed that the improvement was statistically significant for
all 10 standards. In contrast, the MAE in Special Education students also reported
improvement, but the changes were not significant.
Research Question 3 examined whether the demographic factors were related to
students’ perceived level of educational preparation on the 10 program standards. Only Age
and Teaching experience were significantly related (younger and inexperienced teachers
perceived lower educational preparation on approximately half of the 10 standards).
This study provides evidence that upon completion of the WKU MAE in Teacher
Leadership program, students perceived a high level of preparation according to the program
standards, i.e., the Kentucky EPSB Advanced Teacher Standards. The students also reported

166
statistically significant improvement (from beginning to the end of the program) in their
professional confidence to handle the content and engage the skills embedded in these 10
EPSB standards. This is a truly significant finding as seldom is there empirical evidence on
the effectiveness of a teacher educational program. In this case, the evidence comes directly
from the students’ own evaluation. Beyond the overall positive findings, the study also
highlights some particular program weakness, such as the need for additional support for
younger and less experienced teachers. As well, there were differences in quality across the
program strands. In particular, the secondary education and special education strands
reported lower perceived preparation than the elementary and middle grades strands and the
improvements made by the students in the Special Education strand were not significant
(improvements in the other strands were significant).
Thus, the overall success of this program in teacher preparation is remarkable even
as the data point to areas of future program improvement. The WKU MAE in Teacher
Leadership Program not only aims to bring excellence to education; it truly does so.
Ultimately the greatest benefit should be the considerable potential for a significant impact
on these working teachers’ own students’ learning.

167
REFERENCES
Alvarado, C. (1997). If leadership was everyone's domain. I’m taking the lead: Investing in
early childhood leadership for the 21st century. Boston, MA: Wheelock College.
Anderson, J. A. (2005). Accountability in education. Retrieved from
http://mt.educarchile.cl/mt/jjbrunner/archives/Anderson_web.pdf
Association for Supervision and Curriculum Development. (2001). Overview of curriculum
mapping. Retrieved from
http://faculty.njcu.edu/mmaye/EDLDPLAN/cm_overview.pdf
Aud, S., Hussar, W., & Kena, G. (2011). The condition of education 2011. Retrieved from
http://nces.ed.gov/pubs2011/2011033.pdf
Bass, B. (1990). From transactional to transformational leadership: Learning to share the
vision. Organizational Dynamics, 18, 19-36.
Beattie, M. (2002). Educational leadership: Modeling, mentoring, making and re-making a
learning community. European Journal of Teacher Education, 25, 199-221.
Barth, R. S. (2001). Teacher leadership. Phi Delta Kappan, 82, 443-449.
Bloom B. S. (1980). The new direction in educational research: Alterable variables. Phi
Delta Kappan, 61, 382-385.
Brandt, R. (1992). On building learning communities: A conversation with Hank Levin.
Educational Leadership, 50(1), 19-23.
Brandt, R. (1995). On restructuring schools: A conversation with Fred Newmann.
Educational Leadership, 53(3), 70-73.
168
Burns, J. M. (1978). Leadership. New York, NY: Harper and Row.
Bureau of Labor Statistics. (2012). Teacher employment rates. Retrieved from
www.bls.gov/news
Cain, G., & Caine, R. (2000). The learning community as a foundation for developing
teacher leaders. NASSP Bulletin, 84(616), 7-14.
Canella, G. S., & Reiff, J. C. (1994). Individual constructivist teacher education: Teachers as
empowered learners. Teacher Education Quarterly, 21(3), 27-38.
Carr, D. A. (1997). Collegial leaders: Teachers who want more than just a job. The Clearing
House, 70, 240-242.
Childs-Bowen, D., Moller, G., & Scriver, J. (2001). Principals: Leaders of leaders. NASSP
Bulletin, 84(616), 27-34.
Cohron, W. R. (2009). The effect of teacher leader interactions with teachers on student
achievement: A predictive study (Unpublished doctoral dissertation). Western
Kentucky University, Bowling Green, KY.
Conley, S., & Muncey, D. (1999) Teachers talk about teaming and leadership in their work.
Theory into Practice, 38, 46-55. Retrieved from
http://www.centerforcsri.org/index.php? Itemid=5&id=259&option=com_conten
t&task=view
Council of Chief State School Officers. (2008). Educational Leadership Policy Standards:
ISLLC. Retrieved from
http://www.ccsso.org/documents/2008/educational_leadership _policy _standards
_2008.pdf
Council of Chief State School Officers. (2010). Common Core Standards. National
Governors Association, Center for Best practices. Retrieved from

169
www.corestandards.org/the-standards
Coyle, M. (1997). Teacher leadership vs. school management: Flatten the hierarchies.
Clearing House, 70, 236-239.
Danielson, C. (2006). Teacher leadership that strengthens professional practice.
Alexandria, VA: ASCD.
Danielson, C. (2007). The many faces of leadership. Educational Leadership, 65(1), 26-29.
Retrieved from http://tinyurl.com/2q8edz
Darling-Hammond, L. (2006). Securing the right to learn: Policy and practice for powerful
teaching and learning. Educational Researcher, 35(7), 13-24.
Doyle, M. (2000, April). Making meaning of teacher leadership in the implementation of
standards-based mathematics curriculum. Paper presented at the annual meeting of
the American Educational Research Association, New Orleans, LA.
Donaldson, G. A. (2001).Cultivating leadership in schools: Connecting people, purpose and
practice. New York, NY: Teachers College Press.
Drucker, P. F. (2008). Management. New York, NY: Harper Collins.
Dufour, R., Dufour, R., & Eaker, R. (2008). Revisiting professional learning communities at
work: New insights for improving schools. Bloomington, IN: Solution Tree.
Ecumenical Child Care Network’s Report. (2002). Taking the lead: Investing in early
childhood leadership for the 21st century. Retrieved from
http://ericps.crc.uiuc.edu/ccdece/ccdece.html
Elmore, R. F. (2000). Building a new structure for school leadership. Washington, DC:
Albert Shanker Institute.
Evans, S., & Powers, S. (2011). MAE in Teacher Leadership. Closing the gap between
teacher preparation and teacher practice. Retrieved from

170
http://edtech.wku.edu/peu/teacher-leader/index.htm
Fitzgerald, T., & Gunter, H. (2008). Contesting the orthodoxy of teacher leadership.
International Journal of Leadership in Education, 11, 331-340.
Fullan, M. (2001). Leading in a culture of change. San Francisco, CA: Jossey-Bass.
Fuller, B. (2003). Education policy under cultural pluralism. Educational Researcher, 32(9),
15-24.
Gabriel, J. G. (2005). An ASCD study guide for how to thrive as a teacher leader.
Alexandria, VA: ASCD.
Glikman, C. D., Gordon, S. P., & Ross-Gordon, J. H. (2001). Supervision and instructional
leadership: A developmental approach. Needham Heights, MA: Pearson.
Goldberg, M. (2001). Leadership in education: Five commonalities, Phi Delta Kappan, 82,
757-761. Retrieved from www.pdkintl.org/kappan/016gol.html
Growther, F. (1997). The William Walker Oration 1996, Unsung heroes: The leaders in our
classrooms. Journal of Educational Administration, 35, 5-17.
Growther, F., Ferguson, M., & Hann, L. (2008). Developing teacher leaders: How teacher
leadership enhances school success. Thousand Oaks, CA: Corwin Press.
Halfon, N., Hochstein, M., & Shulman, E. (2002). Taking the lead: Intervention in early
childhood for the 21st Century Teacher Leader Initiative 2000. Retrieved from
http://www.healthychild.ucla.edu/Publications/Documents/21st%20Century%20Inve
stment%20Strategy%200800.pdf
Hargreaves, A., Earl, L., Moore, S., & Manning, S. (2001). Learning to change: Teaching
beyond subjects and standards. San Francisco, CA: Jossey-Bass.
Hatch, T., White, M., & Faigenbaum, D. (2005). Expertise, credibility, and influence: How
teachers can influence policy, advance research, and improve performance. Teachers
171
College Record, 107, 1004-1035.
Henning, J. E. (2006). Teacher leaders at work: Analyzing standardized achievement data to
improve instruction. Education, 126, 729-737.
Hersey, P. (1985). The situational leader. New York, NY: Warner Books.
Hinchey, P. (1997). Teacher leadership: Introduction. The Clearing House, 70, 233-235.
Hoerr, T. (2005). Art of school leadership. Alexandria, VA: ASCD.
Hord, S. M. (1997). Professional learning communities: Communities of continuous inquiry
and improvement. Retrieved from Southwest Educational Development Laboratory
(SEDL) http://www.sedl.org/pubs/change34/welcome.html
Hoyt, W. H. (2000). An evaluation of the Kentucky Education Reform Act 1990. Retrieved
from www.cber.uy/edu/downloads/education-reform.act.html
Individuals with Disabilities Education Improvement Act of 2004, Pub. L. No. 108-446,
118 Stat. 2647 (2004). [Amending 20 U.S.C. §§ 1400 et seq.].
January_UpdatedSummaryIDEA.sflb.ashx
Ingersoll, R., & Strong, M. (2011). The impact of induction and mentoring programs from
beginning teachers: A critical review of the research. Review of Education Research,
81, 201-233.
Javidi, F. N. (2011). Students’ perceptions of early childhood program quality according to
the National Association for the Education of Young Children (Doctoral dissertation,
The University of North Carolina, Charlotte). Retrieved from
http://gradworks.umi.com/34/57/3457896.html
Katzenmeyer, M., & Moller, G. (1996). Every teacher as a leader: Realizing the potential of
teacher leadership. San Francisco, CA: Jossey-Bass.
Katzenmeyer, M., & Moller, G. (2001). Awakening the sleeping giant: Leadership

172
development for teachers. Thousand Oaks, CA: Corwin Press.
Keaster, R., & Schlinker, W. (2009). What good are educational administration certification
programmes? International Journal of Leadership in Education, 12, 85-94.
Kentucky Department of Education. (2010). Grade level curriculum shift. Retrieved from
www.education/ky.gov/users/otl/standards/Grade%Level%20Curriculum
Kentucky Education Professional Standards Board. (2007). Teacher leader master’s and
planned fifth year programs. Retrieved from
http://www.kyepsb.net/documents/EduPrep/Teacher%20Leader%20Master's%20Pro
grams%20and%205th%20Year%20Programs%20for%20Rank%20II.pdf
Kentucky Education Professional Standards Board. (2012). Education Professional
Standards. Retrieved from
www.kyepsb.net/documents/EduPrep/Kentuckyteacherstandards.doc
Kentucky Education Professional Standards Board. (2013). Kentucky teaching certificates,
grade levels, specializations, and endorsements. Retrieved from
http://www.kyepsb.net/certification/certlist.asp
Kentucky Legislature. (2009). College and career readiness. Senate Bill 1. Frankfort, KY:
General Assembly, Commonwealth of Kentucky.
Kentucky Postsecondary Education Improvement Act. (1997). House Bill 1 as enacted
(97 SS HB1/EN). Frankfort, KY: General Assembly, Commonwealth of Kentucky.
Killion, J. P. (1996). Moving beyond the school: Teacher leaders in the district office.
Educational Administration Quarterly, 21, 75-80.
Kroll, L. R., & LaBosky, V. K. (1996). Practicing what we preach: Constructivism in a
teacher education program. Action in Teacher Education, 18(2), 63-72.
Lambert, L. (1998). Building leadership capacity in schools. Alexandria, VA: ASCD.
173
Lave, J., & Wenger, E. (1991). Situated learning: Legitimate peripheral participation. New
York, NY: Cambridge University Press.
Leithwood, K., Louis, K. S., Anderson, S., & Wahlstorm, J. (2004). How leadership
influences student learning (Report to The Wallace Foundation). Retrieved from
http://www.wallacefoundation.org/knowledge-center/school-leadership/key-
research/Documents/How-Leadership-Influences-Student-Learning.pdf
Leithwood, K., & Jantzi, D. (1999). The relative effects of principal and teacher sources of
leadership on student engagement with school. Educational Administration
Quarterly, 35, 679-706.
Levine, A. (2005). Educating school leaders. Retrieved from
www.edschools.org/pdf/Final313.pdf
Levine, A. (2006). Educating school teachers. Retrieved from
www.edschools.org/pdf/teachersadvance2.pdf
Lieberman, A. (1994). Teachers as leaders: Evolving roles. Washington, DC: National
Education Association.
Little, P. S., & Miller S. K. (2007). Hiring the best teachers? Rural values and person-
organization fit theory. Journal of School Leadership, 17, 118-158.
Lord, B., & Miller, B. (2000). Teacher Leadership: An appealing and inescapable force in
school reform. Boston, MA: Education Development Center. Retrieved from
www2ed.gov.inits
Lynes, J. R. (2008). The effects of social class, social capital, parenting style, and Ogbu’s
oppositional identity on black college placement scores (Doctoral dissertation).
University of Louisville, Louisville, KY.
Mainous, G. (2012). A descriptive analysis of the National Council for Accreditation of

174
Teacher Education Master’s in Teacher Leadership programs from 1980-present
(Doctoral dissertation). Retrieved from
http://search.proquest.com.libsrv.wku.edu/docview/1282365357/13CC593E150319B
1374/7?accountid=15150
Marsh, D., & Codding, J. (1999). The new American high school. Thousand Oaks,
CA: Corwin.
Marzano, R. R. (2007). The art and science of teaching. Alexandria, VA: Association for
Supervision and Curriculum Development.
Meyer, J. W., & Rowan, B. (1977). Institutional organizations: Formal structure as myth and
ceremony. American Journal of Sociology, 83, 340-63.
McKeever, B. (2003). Nine lessons of successful school leadership teams: Distilling a
decade of innovation. San Francisco, CA: West Ed.
Miller, S. K. (1992). Changing conceptions of “good schools”: Implications for reforming
urban education. Education and Urban Society, 25, 71-84.
Miller, S. K., Chon, K. H., Houchens, G. W., & Hunt, R. (2013). Standards and Indicators
Scholastic Review: A pilot study to test the validity of a new set of teacher scales
designed to measure Kentucky’s Standards and Indicators for School Improvement
(Unpublished manuscript). Western Kentucky University, Bowling Green, KY.
Miller, S. K., & Moore, B. D. (2006). Whither Race? Demographic and grade level
influences on reading assignment in a desegregated metropolitan district
(Unpublished manuscript). University of Louisville, Louisville, KY.
Muijs, D., & Harris, A. (2006). Teacher led school improvement: Teacher leadership in the
UK. Teaching and Teacher Education, 22, 961-972.
Murley, L. (2013, April 3). Re: A question about MAE program [Letter to Evgenia Mauzy].

175
Retrieved from https://outlook.office365.com/owa/?exsvurl=1&ll-
cc=1033&modurl=0&realm=hardin.kyschools.us&wa=wsignin1.0#path=/mail
National Board of Professional Teaching Standards. (2009). What teachers should know and
be able to do: The five core propositions of the National Board. Arlington, VA:
NBPTS National Office.
National Commission on Accreditation of Teachers. (2009). NCATE Institutional Report
based on academic year 2008-09. Retrieved from
http://www.wku.edu/cebs/peu/2011-visit/documents/misc-
docs/ncate_2009_ir_final.pdf
National Commission on Accreditation of Teachers. (2010). Through clinical practice: A
national strategy to prepare effective teachers. Retrieved from
http://www.ncate.org/LinkClick.aspx?fileticket=zzeiB1OoqPk%3D&tabid=715
National Commission on Excellence in Education. (1983). A nation at risk: The imperative
for educational reform. Washington, DC: U.S. Department of Education.
National Commission on Teaching and America’s Future. (1996). What matters the most?
Retrieved from http://www.eric.ed.gov/ERICWebPortal/search/detailmini.jsp? _nfpb
=true&_&ERICExtSearch_SearchValue_0=ED395931&ERICExtSearch_SearchTyp
e_0=no&accno=ED395931
Newmann, F. M., & Wehlage, G. G. (1995). Successful school restructuring. Madison, WI:
University of Wisconsin-Madison, School of Education, Center on Organization and
Restructuring of Schools.
Nunnally, J. C., & Bernstein, I. H. (1994). Psychometric theory. New York: McGraw-Hill.
Nye, B., Konstantopoulos, S., & Hedges, L.V. (2004). How large are teacher effects?
Educational Evaluation and Policy Analysis, 26, 237-257.
176
Nye, B., Konstantopoulos, S., & Hedges, L. V. (2004). How large are teacher effects?
Educational Evaluation and Policy Analysis, 26, 237-257.
O’Hair, M., & Reitzug, U. (1997). Teacher Leadership: In what ways? For what purposes?
Action in Teacher Education, 19(3), 65-76.
Pankratz, R. S., & Petrosko, J., M. (2000). All children can learn: Lessons from the
Kentucky reform experience. San Francisco, CA: Jossey-Bass.
Paulu, N., & Winters, K. (1998). Teachers leading the way: Voices from the National
Teacher Forum. Retrieved from ERIC database. (ED419778)
Piaget, J. (1977). The development of thought: Equilibration of cognitive structures. New
York, NY: Viking Press.
Planty, M., Hussar, W., Snyder, T., Provasnik, S., Kena, G., Dinkes, R., . . . Kemp, J.
(2008). The condition of education 2008 (NCES Publication No. 2008-031).
Washington, DC: U.S. Department of Education, National Center for Education
Statistics, Institute of Education Sciences.
Plecki, M. L., Elfers, A. M., & Nakamura, Y. (2012). Using evidence for teacher education
program improvement and accountability: An illustrative case of the role of value-
added measures. Journal of Teacher Education, 63, 318-334.
Podsakoff, P. M., & Organ, D. W. (1986). Self-reports in organizational research: Problems
and prospects. Journal of Management, 12, 531-544.
Redd, K. (2007). The rise of “older” graduate students (Report of Council of Graduate
Schools). Retrieved from www.cgsnet.org/portals/0/pdf/DataSources_2007_12.pdf
Reeves, D. B. (1996). Making standards work. Denver, CO: Center for Performance
Assessment.
Reeves, D. B. (2008). Reframing teacher leadership to improve your school. Alexandria,

177
VA: ASCD.
Sanders, W. L., & Rivers, J. C. (1996). Cumulative and residual effects of teachers on future
student academic achievement. Knoxville, TN: University of Tennessee, Value-
Added Research and Assessment Center.
Schafer, J. L., & Graham, J. W. (2002). Missing data: Our view of the state of the art.
Psychological Methods, 7, 147-177.
Sherrill, J. (1999). Preparing teachers for leadership roles in the 21st century. Theory into
Practice, 38, 56-61.
Silin, S., Mulford, B., & Zarins, S. (2002). Organizational learning and school change.
Educational Administration Quarterly, 38, 613-642.
Silva, D. Y., Gimbert, B., & Nolan, J. (2000). Sliding the doors: Locking and unlocking
possibilities for teacher leadership. Teachers College Record, 102, 779-804.
Snell, J., & Swanson, J. (2000). The essential knowledge and skills of teacher leaders: A
search for a conceptual framework. Washington, DC: Office of Educational
Research and Improvement.
Southern Accreditation of Colleges and Schools. (2013). Standards of accreditation.
Retrieved from http://www.ncate.org/Accreditation/tabid/100/Default.aspxcs org-
d=standards of accreditation
Steelman, L. C., Powell, B., & Carini, R. M. (2000). Do teacher unions hinder educational
performance? Lessons learned from state SAT and ACT scores. Harvard Education
Review, 70, 437-466.
Steers, R., Porter, L., & Bigley, G. (1996). Motivation and leadership at work. New
York: McGraw-Hill Companies, Inc.
Stone, R., & Cuper, P. H. (2006). Best practices for teacher leadership: What award-

178
winning teachers do for their professional learning communities. Thousand Oaks,
CA: Corwin Press.
Temperley, H. S. (2005). Distributed leadership: Developing theory from practice. Journal
of Curriculum Studies, 37, 395-420.
United Senate and House of Representatives of the United States of America in Congress.
(1994). America 2000: An educational strategy. Retrieved from
http://www2.ed.gov/legislation/ GOALS2000/TheAct/intro.html
Urbanski, A., & Nickolaou, M. (1997). Reflections on teachers as leaders. Educational
Policy, 11, 243–254.
Urbanski, A., & Eriksene, R. (2000). School reform, TURN and teacher compensation. Phi
Delta Kappan, 81, 367-370. Retrived from www.pdkintl.org/kappan
U.S. Department of Education. (1991). Goals 2000. Retrieved from
www2.ed.gov/legislation/goals2000/TheAct/index.html
U.S. Department of Education. (1994). America 2000: An educational strategy. Retrieved
from ERIC database. (ED 327985).
U.S. Department of Education. (2002). No Child Left Behind. Retrieved from
http://www2.ed.gov/nclb/landing.jhtml
U.S. Department of Education. (2008). USNEI: Structure of the U.S. education system.
Retrieved from http://www2.ed.gov/about/offices/list/ous/international/usnei/edlite-
index.html
U.S. Department of Education. (2011). Our future, our teachers. Retrieved from
http://www.ed.gov/sites/default/files/our-future-our-teachers-accesible.pdf
U.S. Department of Education. (2013). National Center for Educational Statistics. Retrieved
from http://nces.ed.gov/

179
Usdan, M., Mcloud, B., & Podmostko, M. (2001). Leadership for student learning:
Redefining the teachers as leaders. School leadership for 21st century. Retrieved
from www.iel.org
Wallace Foundation. (2001). The State Action for Education Leadership Project Program.
Retrieved from http://www.wallacefoundation.org/learn-about-
wallace/GrantsPrograms/our-initiatives/Past-Initiatives/Pages/Saelp-Program.aspx
Wagner, C. R. (2006, December). The school leader’s tool for assessing and improving
school culture. Principal Leadership, 7(4), 41-44. Retrieved from
http://www.tn.gov/education/cte/ad/rubric/doc/sch_culture_ triage.pdf
Western Kentucky University. (2010a). Teacher Leader Master’s Program proposal.
Retrieved from http://edtech.wku.edu/peu/teacher-leader/index.htm
Western Kentucky University. (2010b). WKU Teacher Leaders Master’s Programs.
Graduate program documents. Retrieved from
http://www.wku.edu/online/documents/maetl.pdf
Western Kentucky University. (2012). Western Kentucky University. Retrieved from
http://www.wku.edu/about/
Wynne, J. (2001). Teachers as leaders in education reform. Retrieved from ERIC database.
(ED 462376)
York-Barr, J., & Duke, K. (2004). What do we know about teacher leadership? Findings
from two decades of scholarship. Review of Educational Research, 74, 255-316.

180
APPENDIX A: WKU PROFESSIONAL UNITS BELIEFS
Belief 1: All children can learn at high levels.
Belief 2: All children have a right to a quality education that empowers them to meet high
expectations for learning as defined by a democratic society.
Belief 3: Diversity in our schools adds richness to the learning environment and provides
enhanced opportunities and possibilities for teaching and learning.
Belief 4: Highly effective education professionals require high levels of ability, rigorous
training, and on-going development of teaching/leadership skills that include reflective
decision-making.
Belief 5: Highly effective education professionals know, apply, and reflect on the
effectiveness of a variety of theories, models and strategies in order to produce maximum
learning for all students in all types of school contexts and cultures.
Belief 6: Highly effective education professionals interact with the home and/or community
of their students to facilitate teaching and learning.
Belief 7: Highly effective education professionals have strong content knowledge, sound
pedagogical knowledge and skills, and essential dispositions for facilitating learning and
functioning as team members in schools.
Belief 8: Highly effective education professionals utilize technology for teaching and
learning, assessment management, and research to the greatest extent possible.
Belief 9: Highly effective education professionals hold themselves accountable for their own
performance by collecting, analyzing, and reporting learning results and using this
information to improve performance and programs.
Belief 10: Highly effective education units develop and maintain assessment systems that
follow the continuous progress of candidates toward the achievement of high standards-
based performance expectations that are clearly defined and publicly communicated.

181
APPENDIX B: WKU MAE PROGRAMS VISION AND MISSION
Mission The professional education unit of Western Kentucky University recruits, prepares, and
supports school practitioners and education leaders who can facilitate the learning of all
children and empower them to achieve at high levels as they become life-long learners and
productive citizens in a global society.
Vision
The professional education unit aspires to become a nationally recognized community of
scholars who apply the best that theory, research, and experience can contribute to teaching
and learning and create new knowledge that makes teaching, learning, and the operation of
schools more efficient and effective.
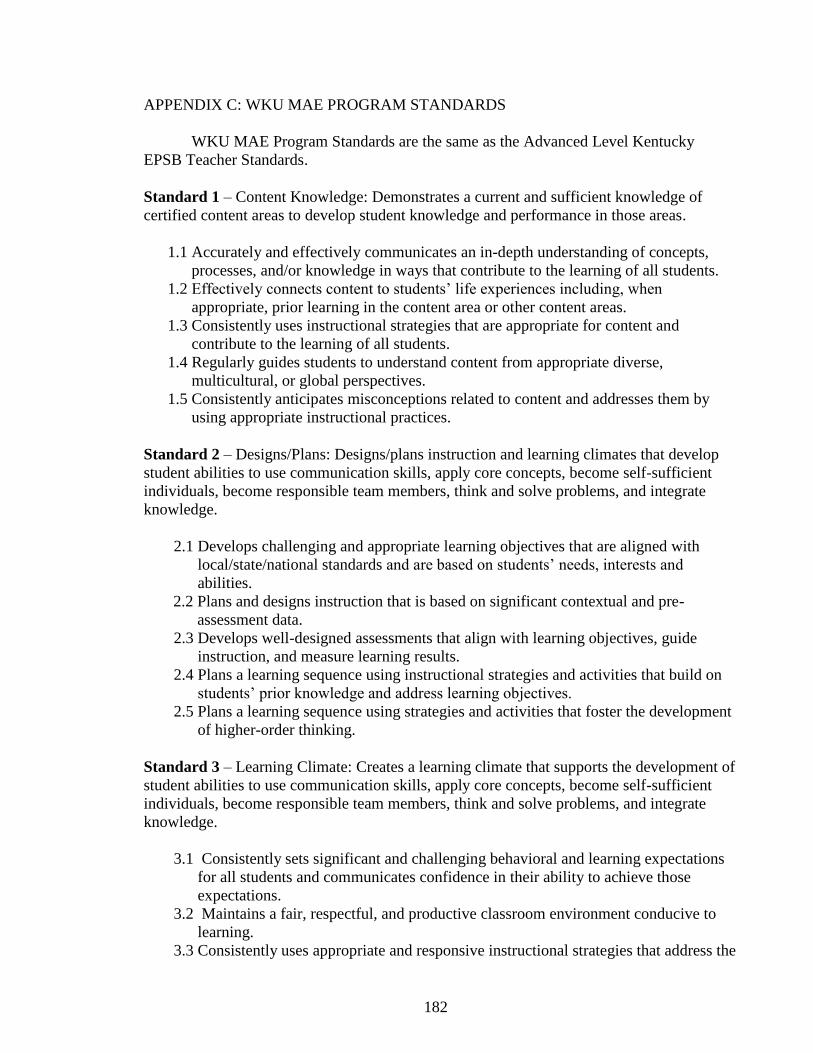
182
APPENDIX C: WKU MAE PROGRAM STANDARDS
WKU MAE Program Standards are the same as the Advanced Level Kentucky
EPSB Teacher Standards.
Standard 1 – Content Knowledge: Demonstrates a current and sufficient knowledge of
certified content areas to develop student knowledge and performance in those areas.
1.1 Accurately and effectively communicates an in-depth understanding of concepts,
processes, and/or knowledge in ways that contribute to the learning of all students.
1.2 Effectively connects content to students’ life experiences including, when
appropriate, prior learning in the content area or other content areas.
1.3 Consistently uses instructional strategies that are appropriate for content and
contribute to the learning of all students.
1.4 Regularly guides students to understand content from appropriate diverse,
multicultural, or global perspectives.
1.5 Consistently anticipates misconceptions related to content and addresses them by
using appropriate instructional practices.
Standard 2 – Designs/Plans: Designs/plans instruction and learning climates that develop
student abilities to use communication skills, apply core concepts, become self-sufficient
individuals, become responsible team members, think and solve problems, and integrate
knowledge.
2.1 Develops challenging and appropriate learning objectives that are aligned with
local/state/national standards and are based on students’ needs, interests and
abilities.
2.2 Plans and designs instruction that is based on significant contextual and pre-
assessment data.
2.3 Develops well-designed assessments that align with learning objectives, guide
instruction, and measure learning results.
2.4 Plans a learning sequence using instructional strategies and activities that build on
students’ prior knowledge and address learning objectives.
2.5 Plans a learning sequence using strategies and activities that foster the development
of higher-order thinking.
Standard 3 – Learning Climate: Creates a learning climate that supports the development of
student abilities to use communication skills, apply core concepts, become self-sufficient
individuals, become responsible team members, think and solve problems, and integrate
knowledge.
3.1 Consistently sets significant and challenging behavioral and learning expectations
for all students and communicates confidence in their ability to achieve those
expectations.
3.2 Maintains a fair, respectful, and productive classroom environment conducive to
learning.
3.3 Consistently uses appropriate and responsive instructional strategies that address the
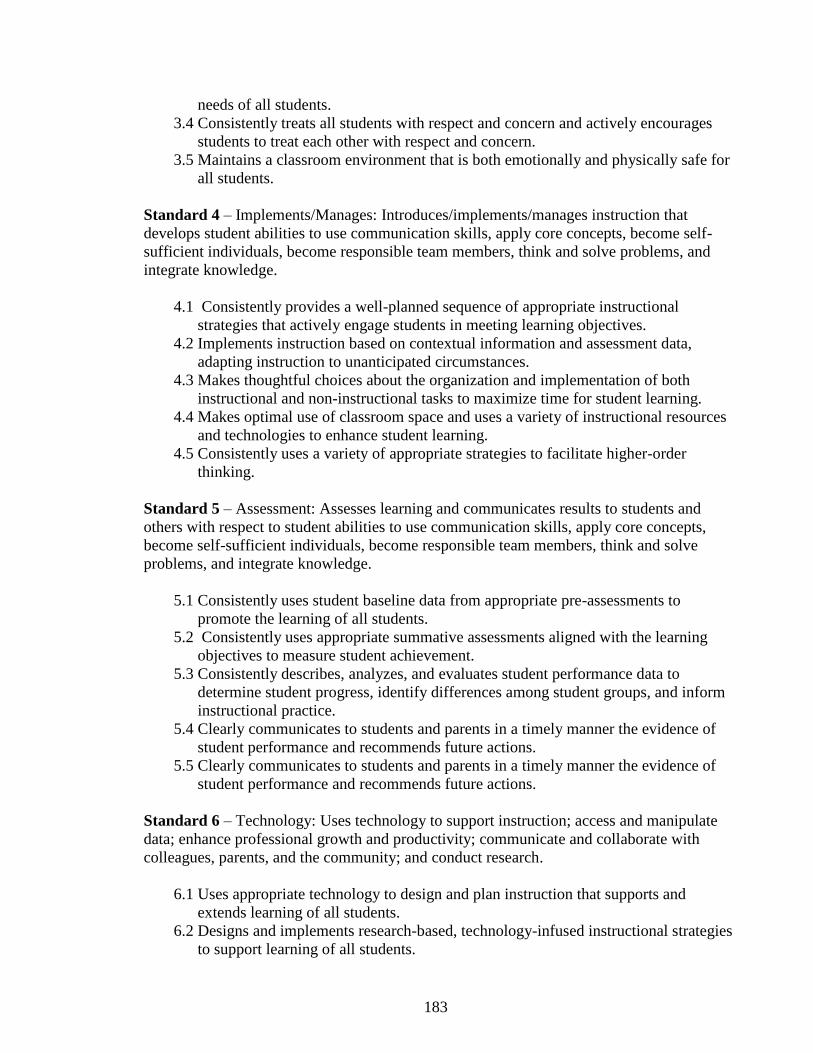
183
needs of all students.
3.4 Consistently treats all students with respect and concern and actively encourages
students to treat each other with respect and concern.
3.5 Maintains a classroom environment that is both emotionally and physically safe for
all students.
Standard 4 – Implements/Manages: Introduces/implements/manages instruction that
develops student abilities to use communication skills, apply core concepts, become self-
sufficient individuals, become responsible team members, think and solve problems, and
integrate knowledge.
4.1 Consistently provides a well-planned sequence of appropriate instructional
strategies that actively engage students in meeting learning objectives.
4.2 Implements instruction based on contextual information and assessment data,
adapting instruction to unanticipated circumstances.
4.3 Makes thoughtful choices about the organization and implementation of both
instructional and non-instructional tasks to maximize time for student learning.
4.4 Makes optimal use of classroom space and uses a variety of instructional resources
and technologies to enhance student learning.
4.5 Consistently uses a variety of appropriate strategies to facilitate higher-order
thinking.
Standard 5 – Assessment: Assesses learning and communicates results to students and
others with respect to student abilities to use communication skills, apply core concepts,
become self-sufficient individuals, become responsible team members, think and solve
problems, and integrate knowledge.
5.1 Consistently uses student baseline data from appropriate pre-assessments to
promote the learning of all students.
5.2 Consistently uses appropriate summative assessments aligned with the learning
objectives to measure student achievement.
5.3 Consistently describes, analyzes, and evaluates student performance data to
determine student progress, identify differences among student groups, and inform
instructional practice.
5.4 Clearly communicates to students and parents in a timely manner the evidence of
student performance and recommends future actions.
5.5 Clearly communicates to students and parents in a timely manner the evidence of
student performance and recommends future actions.
Standard 6 – Technology: Uses technology to support instruction; access and manipulate
data; enhance professional growth and productivity; communicate and collaborate with
colleagues, parents, and the community; and conduct research.
6.1 Uses appropriate technology to design and plan instruction that supports and
extends learning of all students.
6.2 Designs and implements research-based, technology-infused instructional strategies
to support learning of all students.

184
6.3 Provides varied and authentic opportunities for all students to use appropriate
technology to further their learning.
6.4 Uses technology to assess student learning, manage assessment data, and
communicate results to appropriate stakeholders.
6.5 Provides and maintains a safe, secure, and equitable classroom environment that
consistently promotes discerning and ethical use of technology.
Standard 7 – Reflection: Reflects on and evaluates specific teaching/learning situations
and/or programs.
7.1 Uses formative and summative performance data to determine the learning needs of
all students.
7.2 Uses performance data to conduct an in-depth analysis and evaluation of
instructional practices to inform future teaching.
7.3 Reflects on the evaluations of student learning and instructional practices to identify
and develop plans for professional growth.
Standard 8 – Collaboration: Collaborates with colleagues, parents, and other agencies to
design, implement, and support learning programs that develop student abilities to use
communication skills, apply core concepts, become self-sufficient individuals, become
responsible team members, think and solve problems, and integrate knowledge.
8.1 Describes an on-going process for identifying situations in which student learning
could be enhanced by collaboration.
8.2 Designs a plan that involves parents, colleagues, and others in a collaborative effort
to enhance student learning.
8.3 Explains how the collaboration to enhance student learning has been implemented.
8.4 Uses appropriate student performance data to describe, analyze, and evaluate the
impact of the collaborative activities on student learning and to identify next steps.
Standard 9 – Professional Development: Evaluates his/her overall performance with
respect to modeling and teaching Kentucky's learning goals, refines the skills and processes
necessary, and implements a professional development plan.
9.1 Thoroughly and accurately assesses current performance related to the Kentucky
Teacher Standards and any school/district professional development initiatives.
9.2 Reflects on data from multiple sources (i.e., self-assessment, student performance,
feedback from colleagues, school/district initiatives) and identifies priority areas for
growth.
9.3 Designs a clear, logical professional growth plan that addresses all priority areas.
9.4 Shows clear evidence of the impact of professional growth activities on
instructional effectiveness and student learning.
Standard 10 – Leadership: Provides professional leadership within the school, community,
and education profession to improve student learning and well-being.
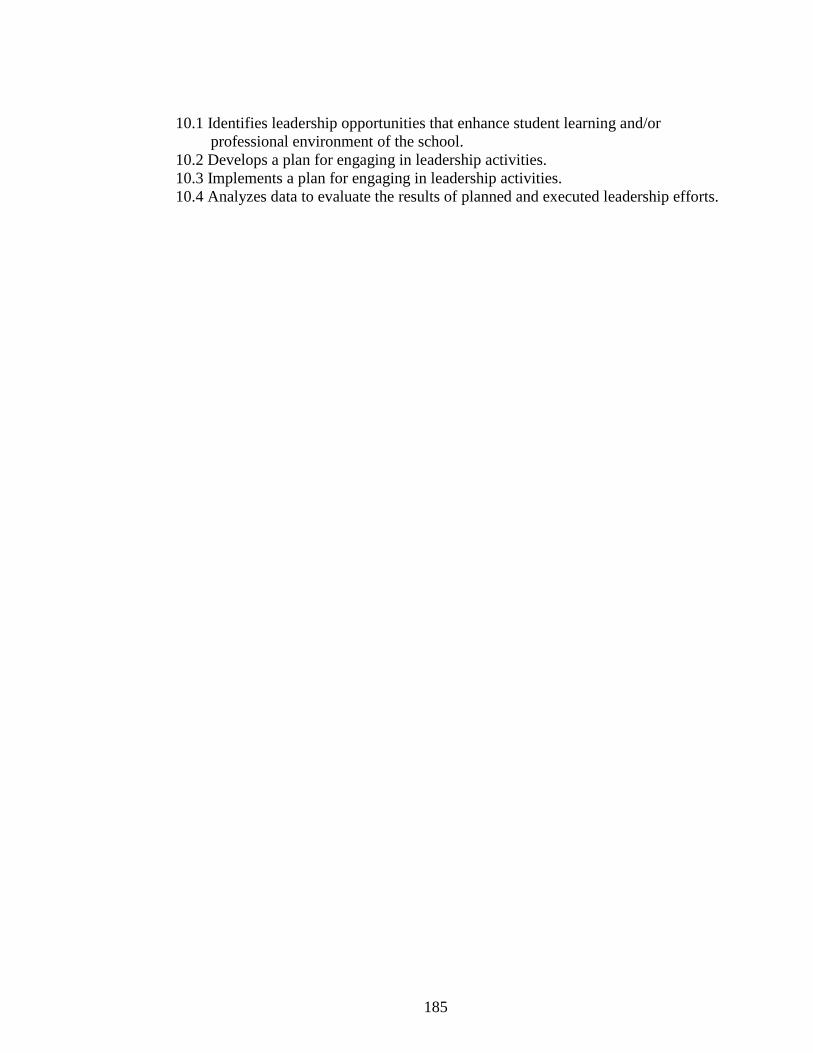
185
10.1 Identifies leadership opportunities that enhance student learning and/or
professional environment of the school.
10.2 Develops a plan for engaging in leadership activities.
10.3 Implements a plan for engaging in leadership activities.
10.4 Analyzes data to evaluate the results of planned and executed leadership efforts.

186
APPENDIX D: PERMISSION TO USE SURVEY INSTRUMENT
From: Mauzy, Evgenia [mailto:[email protected]]
Sent: Monday, April 29, 2013 9:40 AM
To: Farhad Javidi
Subject: RE: my dissertation and a survey instrument
Dr. Javidi,
Thank you very much for the permission. I will cc your letter to my chair, Dr. Ric Keaster,
to let him know that I obtained your permission. I will send you a copy of my dissertation
after the defence.
Jane Mauzy
From: Farhad Javidi [[email protected]]
Sent: Sunday, April 28, 2013 7:18 PM
To: Mauzy, Evgenia
Subject: RE: my dissertation and a survey instrument
Hi Evgenia,
You are welcome to use my instrument. I’d love to read your dissertation once it has been
approved.
Good luck and thank you.
Farhad
Dr. Farhad Javidi
Professor, Information Technologies
Chair, Student Welfare, College Senate
Central Piedmont Community College, IT Division
[email protected] | http://www.cpcc.edu/it
From: Mauzy, Evgenia [mailto:[email protected]]
Sent: Tuesday, April 09, 2013 11:02 AM
To: Farhad Javidi
Subject: my dissertation and a survey instrument
Dr. Javidi,
I am a Doctorate student at Western Kentucky University. I am currently working on my
dissertation. The title of the dissertation is STUDENTS’ PERCEPTIONS OF a TEACHER
LEADER MASTERS’ PROGRAM. My goal is to see how the students perceive a newly
implemented Master of Education Program.
During Literature review process I came across your dissertation STUDENTS’
PERCEPTIONS OF EARLY CHILDHOOD PROGRAM QUALITY ACCORDING TO THE
187
NATIONAL ASSOCIATION FOR THE EDUCATION OF YOUNG CHILDREN
STANDARDS.
The goal of your dissertation was two-folded: to develop the survey instrument for the
future educational use and to study the students' perceptions. I would like to use the survey
instrument you developed in 2011 since it matched the purpose of my research questions. I
will have to modify the survey instrument since I will use the Western Kentucky University
Masters of Education Program Standards. There are ten standards, and they match Kentucky
Education Professional Standard Board Standards. I attached the above mentioned standards
to this letter.
Thank you for your time.
Sincerely,
Evgenia Mauzy
WKU EDLD student
ESL teacher for Hardin County
188
APPENDIX E: WKU IRB BOARD APPROVAL
WKU IRB BOARD APPROVAL THE MAE TEACHER LEADER PROGRAM: SURVEY OF STUDENTS’
PERCEPTIONS Informed Consent/Preamble
Dear Student:
You are invited to participate in a dissertation research project by completing the following survey about
students' perceptions of the Master of Arts in Education (MAE) Teacher Leader program. This study is
being conducted by Evgenia Mauzy, English as a Second Language teacher at North Hardin High School
and a student in the Western Kentucky University Educational Leadership Doctoral Program. Dr. Stephen
Miller in the Department of Educational Administration, Leadership and Research is the faculty sponsor for
this study. The survey is being completed online (Qualtrics). Students have been given access through a link
to the survey provided through the Instructors for TCHL 560, Action Research. The purpose of this study is
to provide program evaluation data on the quality of the Teacher Leader Master's Program and pinpoint the
areas of concern if any. Specifically, the study examines students’ perceptions of differences in the level of
professional preparation on the 10 Kentucky Teacher Standards from the beginning to the end of the
program.
In this study, you will be asked to answer items on a questionnaire. Directions are provided at the beginning
of the survey. The survey should take approximately 20-30 minutes to complete. You may skip the questions
that make you uncomfortable. You may stop answering the survey questions at any time.
There are no foreseeable risks in answering the questions on this survey. The benefits of this study are providing feedback for program enhancements and improvement via program evaluation on the quality of the
MAE Teacher Leader program. There is no compensation for participation. Qualtrics allows for complete
anonymity of the data, although total confidentiality cannot be guaranteed if you were to provide responses
that could link back to your identity. However, your confidentiality will be protected to the extent permitted
by law. The data may be published; however your identity will not be disclosed.
Refusal to participate in this study will have no effect on any future services you may be entitled to from the
University. Anyone who agrees to participate in this study is free to withdraw from the study at any time with
no penalty. You understand also that it is not possible to identify all potential risks in an experimental
procedure, and you believe that reasonable safeguards have been taken to minimize both the known and
potential but unknown risks.
If you have any question or concerns, please contact the faculty sponsor Dr. Stephen Miller at 502-593-3595, the researcher Evgenia Mauzy at 270-312-6453 or the WKU Institutional Review Board at 270-745-2129.
Sincerely,
Evgenia Mauzy Stephen Miller, Ph.D.
Continuing to the next page and answering the survey questions implies your consent.
Please click next to continue and begin with the brief section on demographics.
189
THIS PROJECT HAS BEEN REVIEWED AND APPROVED BY
THE WESTERN KENTUCKY UNIVERSITY INSTITUTIONAL REVIEW BOARD Paul Mooney, Human Protections Administrator
TELEPHONE: (270) 745-2129
190
INSTITUTIONAL REVIEW BOARD
OFFICE OF RESEARCH INTEGRITY
DATE: December 3, 2013 TO: Evgenia Mauzy FROM: Western Kentucky University (WKU) IRB PROJECT TITLE: [426877-1] Dissertation: STUDENTS’ PERCEPTIONS OF A TEACHER LEADER MASTER’S PROGRAM REFERENCE #: IRB 14-213 SUBMISSION TYPE: New Project ACTION: APPROVED APPROVAL DATE: December 3, 2013 REVIEW TYPE: Exempt from Full Board Review
Thank you for your submission of New Project materials for this project. The Western
Kentucky University (WKU) IRB has APPROVED your submission. This approval is
based on an appropriate risk/benefit ratio and a project design wherein the risks have been
minimized. All research must be conducted in accordance with this approved submission.
This submission has received Exempt from Full Board Review based on the applicable
federal regulation.
Please remember that informed consent is a process beginning with a description of the
project and insurance of participant understanding followed by an implied consent form.
Informed consent must continue throughout the project via a dialogue between the
researcher and research participant. Federal regulations require each participant receive a
copy of the consent document.
Please note that any revision to previously approved materials must be approved by this
office prior to initiation. Please use the appropriate revision forms for this procedure.
All UNANTICIPATED PROBLEMS involving risks to subjects or others and SERIOUS
and UNEXPECTED adverse events must be reported promptly to this office. Please use
the appropriate reporting forms for this procedure. All FDA and sponsor reporting
requirements should also be followed.
All NON-COMPLIANCE issues or COMPLAINTS regarding this project must be
reported promptly to this office.
This project has been determined to be a Minimal Risk project.
Please note that all research records must be retained for a minimum of three years after
the completion of the project.
If you have any questions, please contact Paul Mooney at (270) 745-2129 or [email protected].
Please include your project title and reference number in all correspondence with this
committee.

191
This letter has been electronically signed in accordance with all applicable regulations, and
a copy is retained within Western Kentucky University (WKU) IRB's records.
Generated on IRBNet

192
APPENDIX F: SURVEY INSTRUMENT
Letter of Sponsorship for Evgenia Mauzy Dissertation Study
Dear Students in TCHL 560 Action Research for Teach Leaders Courses:
As Program Representative for the WKU MAE Teacher Leader Program, I am writing to
encourage you to participate in a dissertation research project conducted by Evgenia (Jane)
Mauzy, a student in the WKU Educational Leadership doctoral program. This letter
signifies sponsorship of this study because it will provide data for a partial program
evaluation of the revised WKU Teacher Leader Master’s program. Specifically, I have
collaborated with Ms. Mauzy and her doctoral committee to ensure that it will represent
feedback useful to the WKU College of Education and Behavioral Sciences.
Consistent with all research on human subjects, this study has been reviewed by the WKU
Institutional Review Board (IRB) to ensure compliance with all federal regulations. You
will note that the Preamble/Informed Consent says, among other information, that
participation is voluntary and that you may stop during any point in the survey.
While that is true (for this and all research on human subjects), I am asking you to
participate in this study because a high response rate (percentage completion) provides
better data for improving the quality of the current program. Like all new programs,
improvement to the MAE Teacher Leader Program is possible. Your perceptions about
your experience are crucial to that process.
The survey has two parts: (a) a brief section on socio-demographic background; and (b)
your sense of how much your level of professional preparation for teaching has improved
during your MAE study. This section asks for your perceptions about your preparation on a
dual response 5-point matrix (from very unprepared to very prepared), at the beginning of
the program and now at the end of the program). The statements for this dual response are
taken from the advanced level of the ten Kentucky Teacher Standards (a total of 45 sub-
standards are rated).
The survey is online using Qualtrics. You will be given a link to the study, provided in the
email that will be sent to each student enrolled in TCHL 560, the capstone course for the
MAE Teacher Leader Program. This software has the capability of complete anonymity.
When you click “submit” at the end of the survey, all identifying information is removed
and your data become simply a row of data (one row for each respondent) that adds to the
overall data collection.
It is impossible for the researcher or the professors to trace which student has submitted
that particular line of data.
Again, I encourage you to complete this survey. The data will help Ms. Mauzy complete
her dissertation, but more importantly from the perspective of a program representative for
the College, those data will facilitate the program faculty in planning and implementing
enhancements to the still newly revised MAE Teacher Leader Program. I realize that time

193
is precious, but your assistance with this survey will help ensure that future WKU Master’s
students receive the highest quality in their educational experiences.
Thank you in advance for your participation.
Sincerely,
Dr. Lisa Murley
Program Representative, WKU MAE Teacher Leader Program

194
Letter to Potential Participants
Survey Instrument
Dear Students,
My name is Evgenia Mauzy, a WKU doctoral student and researcher. I am inviting you to
participate in a study that is my dissertation, Students’ Perceptions of a Teacher
Leader Master’s Program . The study also serves as part of a program evaluation for the
College of Education and Behavioral Sciences at Western Kentucky University,
specifically the level of effectiveness of the new MAE Teacher leader program.
Your participation will help me complete my doctorate. But it will also provide valuable
diagnostic information to the CEBS that can be used for program improvement. You will
note that the Program Representative for the MAE Teacher Leader Program, Dr. Lisa
Murley, has written a letter of sponsorship for this study. Further, the College is
permitting me access to the Capstone class (TCHL 560, Action Research) for the program
so that all students who finish the MAE program can complete the attached survey.
The survey has two parts: a demographics section and a dual response 5-point Likert-type
matrix (from Very Unprepared to Very Prepared) comparing the student’s preparation at
the beginning of the program to the end of the program. In this second section you are
rating your level of professional preparation for teaching according to the MAE
professional standards, which are the same as the advanced level of the ten Kentucky
Teacher Standards. Participation in this survey is anonymous and voluntary. The survey
should take from no more than 20-30 minutes to complete.
There are no known risks or ethical issues associated with the survey. Much of the
information is this cover letter is repeated in the Preamble/Informed Consent that precedes
the survey itself, consistent with all research on human subjects.
Although your participation is voluntary, a high percentage return is important because
WKU will benefit from your responses: feedback about the quality of the program will
be used for program enhancements and improvement.
If you have any questions or concerns, you can contact the researcher, Evgenia Mauzy, at
270-312-6453, or my faculty adviser, Dr. Stephen Miller, at 502-593-3595. Thank you in
advance for your assistance.
Sincerely,
Jane Mauzy
WKU Doctoral Student

195
THE MAE TEACHER LEADER PROGRAM:
SURVEY OF STUDENTS’ PERCEPTIONS
Informed Consent/Preamble
Dear Student:
You are invited to participate in a dissertation research project by completing the following
survey about students' perceptions of the Master of Arts in Education (MAE) Teacher
Leader program. This study is being conducted by Evgenia Mauzy, English as a Second
Language teacher at North Hardin High School and a student in the Western
Kentucky University Educational Leadership Doctoral Program. Dr. Stephen Miller in the
Department of Educational Administration, Leadership and Research is the faculty sponsor
for this study. The survey is being completed online (Qualtrics). Students have been given
access through a link to the survey provided through the Instructors for TCHL 560, Action
Research.
The purpose of this study is to provide program evaluation data on the quality of the
Teacher Leader Master's Program and pinpoint the areas of concern if any. Specifically,
the study examines students’ perceptions of differences in the level of professional
preparation on the 10 Kentucky Teacher Standards from the beginning to the end of the
program.
In this study, you will be asked to answer items on a questionnaire. Directions are provided
at the beginning of the survey. The survey should take approximately 20-30 minutes to
complete. You may skip the questions that make you uncomfortable. You may stop
answering the survey questions at any time.
There are no foreseeable risks in answering the questions on this survey. The benefits of
this study are providing feedback for program enhancements and improvement via
program evaluation on the quality of the MAE Teacher Leader program. There is no
compensation for participation. Qualtrics allows for complete anonymity of the data,
although total confidentiality cannot be guaranteed. However, your confidentiality will be
protected to the extent permitted by law. The data may be published; however your identity
will not be disclosed.
Participation in this study is voluntary. You may choose not to participate at all. If you
decide not to be in this study or if stop taking part at any time during the survey, you will
not be punished or lose any benefits for which you may qualify.
If you have any question or concerns, please contact the faculty sponsor Dr. Stephen Miller
at 502-593-3595, the researcher Evgenia Mauzy at 270-312-6453 or the WKU Human
Subjects Review Board at 270-745-4652.
(Please continue to the next page)

196
Sincerely,
Evgenia Mauzy Stephen Miller, Ph.D.
Continuing to the next page and answering the survey questions implies your consent.
Please click next to continue and begin with the brief section on demographics.

197
Part 1
For these questions on demographic factors and program background, please CHECK the
appropriate answer:
1. My gender is
__a. Female
__b. Male
2. My race/ethnicity is
__a. African American
__b. Asian
__c. Latino/Hispanic
__d. Native American
__e. White/Caucasian
__f. Other
3. What is your age? ____
4. The MAE Teacher Leader program has five areas of Advanced Certification.
Please, CHECK the one that you are taking:
__MAE in Interdisciplinary Early Education
__MAE in Elementary Education
__MAE in Middle Grades Education
__MAE in Secondary Education
__MAE in Special Education
5. Please, CHECK your primary grade responsibilities for your current teaching
position
__Preschool

198
__Elementary (K-5)
__Middle (6-8)
__Secondary (9-12)
Note: For preschool and elementary teachers, answer Question 6. For middle or
high school teachers, answer Question 7.
6. For preschool or elementary teachers, my grade level/content area is (Please select
the option that most closely fits your circumstances)
__a. Preschool
__b. Primary K-3
__c. Upper Elementary 4-5
__d. Related Arts (Music, Art, Library, Physical Education, Health, etc.)
__e. Remedial Services (Title I, ELL, Reading Assistance, etc.)
__f. Special Education
__g. Teacher leader/Effectiveness coach/Curriculum coordinator (or similar duties)
__h. Counselor
7. For middle school or high school teachers, my primary content area is
__a. Math
__b. Language Arts
__c. Social Studies
__d. Science
__e. Foreign Language
__f. Related Arts (Music, Art, Library, Physical Education, Health, etc.)
__g. Remedial Services (Title I, ELL, Reading Assistance, etc.)
__h. Special Education

199
__i. Teacher leader/Effectiveness coach/Curriculum coordinator (or similar duties)
__j. Counselor
8. How many years have you taught?
0
1
2
3
4
5
other (list) _____
Please, continue to the next page
200
Part 2
This survey explores students’ perceptions regarding the quality of the MAE Teacher
Leader Program. The 10 Kentucky Teacher Standards, which are also the 10 MAE
program standards, are rated for level of preparation from very unprepared to very
prepared.
In the following sections please rate your level of professional preparation toward the 10
MAE program standards. Please mark your responses on the two dimensions that measure
your level of professional preparation: at the beginning of the program and currently.
The 5-point response scales for Part 2 are listed below. When you mark the items on the
Qualtrics online survey, you will fill in the circle that corresponds to the five levels of
response options for your level of professional preparation where being prepared is a
combination of dispositions, values, beliefs, skills, and knowledge.
Please mark the appropriate response for each standard using the scales below:
At the beginning of the program Currently
1 = Very Unprepared (VU) 1 = Very Unprepared (VU)
2 = Unprepared (U) 2 = Unprepared (U)
3 = Medium Prepared (MP) 3 = Medium Prepared (MP)
4 = Prepared (P) 4 = Prepared (P)
5 = Very Prepared (VP) 5 = Very Prepared (VP)
Thank you for your time!

201
Please mark the appropriate response to indicate your level of preparation with the following standards using this scale:
1 = Very Unprepared (VU)
2 = Unprepared (U)
3 = Medium Prepared (MP)
4 = Prepared (P)
5 = Very Prepared (VP)
Standard 1 – Content Knowledge: Demonstrates a current and
sufficient knowledge of certified content areas to develop student
knowledge
Level of preparation
At the beginning of the
program
Current
VU
1
U
2
MP
3
P
4
VP
5
VU
1
U
2
MP
3
P
4
VP
5
1.1 Accurately and effectively communicates an in-depth understanding of
concepts, processes, and/or knowledge in ways that contribute to the
learning of all students.
1 2 3 4 5 1 2 3 4 5
1.2 Effectively connects content to students’ life experiences including,
when appropriate, prior learning in the content area or other content
areas.
1 2 3 4 5 1 2 3 4 5
1.3 Consistently uses instructional strategies that are appropriate for
content and contribute to the learning of all students
1 2 3 4 5 1 2 3 4 5
1.4 Regularly guides students to understand content from appropriate
diverse, multicultural, or global perspectives.
1 2 3 4 5 1 2 3 4 5
1.5 Consistently anticipates misconceptions related to content and
addresses them by using appropriate instructional practices.
1 2 3 4 5 1 2 3 4 5

202
Please mark the appropriate response to indicate your level of preparation with the following standards using this scale:
1 = Very Unprepared (VU)
2 = Unprepared (U)
3 = Medium Prepared (MP)
4 = Prepared (P)
5 = Very Prepared (VP)
Standard 2 – Designs/Plans: Designs/plans instruction and learning
climates that develop student abilities to use communication skills, apply
core concepts, become self-sufficient individuals, become responsible
team members, think and solve problems, and integrate knowledge.
Level of preparation
At the beginning of the
program
Current
VU
1
U
2
MP
3
P
4
VP
5
VU
1
U
2
MP
3
P
4
VP
5
2.1 Develops challenging and appropriate learning objectives that are aligned
with local/state/national standards and are based on students’ needs,
interests and abilities.
1 2 3 4 5 1 2 3 4 5
2.2 Plans and designs instruction that is based on significant contextual and
pre-assessment data.
1 2 3 4 5 1 2 3 4 5
2.3 Develops well-designed assessments that align with learning objectives,
guide instruction, and measure learning results.
1 2 3 4 5 1 2 3 4 5
2.4 Plans a learning sequence using instructional strategies and activities that
build on students’ prior knowledge and address learning objectives.
1 2 3 4 5 1 2 3 4 5
2.5 Plans a learning sequence using strategies and activities that foster the
development of higher-order thinking.
1 2 3 4 5 1 2 3 4 5

203
Please mark the appropriate response to indicate your level of preparation with the following standards using this scale:
1 = Very Unprepared (VU)
2 = Unprepared (U)
3 = Medium Prepared (MP)
4 = Prepared (P)
5 = Very Prepared (VP)
Standard 4 – Implements/Manages: Introduces/implements/manages
instruction that develops student abilities to use communication skills, apply
core concepts, become self-sufficient individuals, become responsible team
members, think and solve problems, and integrate knowledge
Level of preparation
At the beginning of the
program
Current
VU
1
U
2
MP
3
P
4
VP
5
VU
1
U
2
MP
3
P
4
VP
5
4.1 Consistently provides a well-planned sequence of appropriate instructional
strategies that actively engage students in meeting learning objectives.
1 2 3 4 5 1 2 3 4 5
4.2 Implements instruction based on contextual information and assessment data,
adapting instruction to unanticipated circumstances.
1 2 3 4 5 1 2 3 4 5
4.3 Makes thoughtful choices about the organization and implementation of both
instructional and non-instructional tasks to maximize time for student learning.
1 2 3 4 5 1 2 3 4 5
4.4 Makes optimal use of classroom space and uses a variety of instructional
resources and technologies to enhance student learning.
1 2 3 4 5 1 2 3 4 5
4.5 Consistently uses a variety of appropriate strategies to facilitate higher-order
thinking.
1 2 3 4 5 1 2 3 4 5

204
Please mark the appropriate response to indicate your level of preparation with the following standards using this scale:
1 = Very Unprepared (VU)
2 = Unprepared (U)
3 = Medium Prepared (MP
4 = Prepared (P)
5 = Very Prepared (VP)
Standard 5 – Assessment: Assesses learning and communicates results to students
and others with respect to student abilities to use communication skills, apply core
concepts, become self-sufficient individuals, become responsible team members,
think and solve problems, and integrate knowledge.
Level of preparation
At the beginning of the
program
Current
VU
1
U
2
MP
3
P
4
VP
5
VU
1
U
2
MP
3
P
4
VP
5
5.1 Consistently uses student baseline data from appropriate pre-assessments to
promote the learning of all students.
1 2 3 4 5 1 2 3 4 5
5.2 Consistently uses appropriate summative assessments aligned with the learning
objectives to measure student achievement.
1 2 3 4 5 1 2 3 4 5
5.3 Consistently describes, analyzes, and evaluates student performance data to
determine student progress, identify differences among student groups, and inform
instructional practice.
1 2 3 4 5 1 2 3 4 5
5.4 Clearly communicates to students and parents in a timely manner the evidence of
student performance and recommends future actions.
1 2 3 4 5 1 2 3 4 5
5.5 Provides on-going opportunities for students to assess and reflect on their own
performance in order to identify strengths and areas for future learning.
1 2 3 4 5 1 2 3 4 5

205
Please mark the appropriate response to indicate your level of preparation with the following standards using this scale:
1 = Very Unprepared (VU)
2 = Unprepared (U)
3 = Medium Prepared (MP
4 = Prepared (P)
5 = Very Prepared (VP)
Standard 6 – Technology: Uses technology to support instruction; access
and manipulate data; enhance professional growth and productivity;
communicate and collaborate with colleagues, parents, and the
community; and conduct research.
Level of preparation
At the beginning of
the program
Current
VU
1
U
2
MP
3
P
4
VP
5
VU
1
U
2
MP
3
P
4
VP
5
6.1 Uses appropriate technology to design and plan instruction that supports
and extends learning of all students.
1 2 3 4 5 1 2 3 4 5
6.2 Designs and implements research-based, technology-infused instructional
strategies to support learning of all students.
1 2 3 4 5 1 2 3 4 5
6.3 Provides varied and authentic opportunities for all students to use
appropriate technology to further their learning.
1 2 3 4 5 1 2 3 4 5
6.4 Uses technology to assess student learning, manage assessment data, and
communicate results to appropriate stakeholders.
1 2 3 4 5 1 2 3 4 5
6.5 Provides and maintains a safe, secure, and equitable classroom
environment that consistently promotes discerning and ethical use of
technology.
1 2 3 4 5 1 2 3 4 5
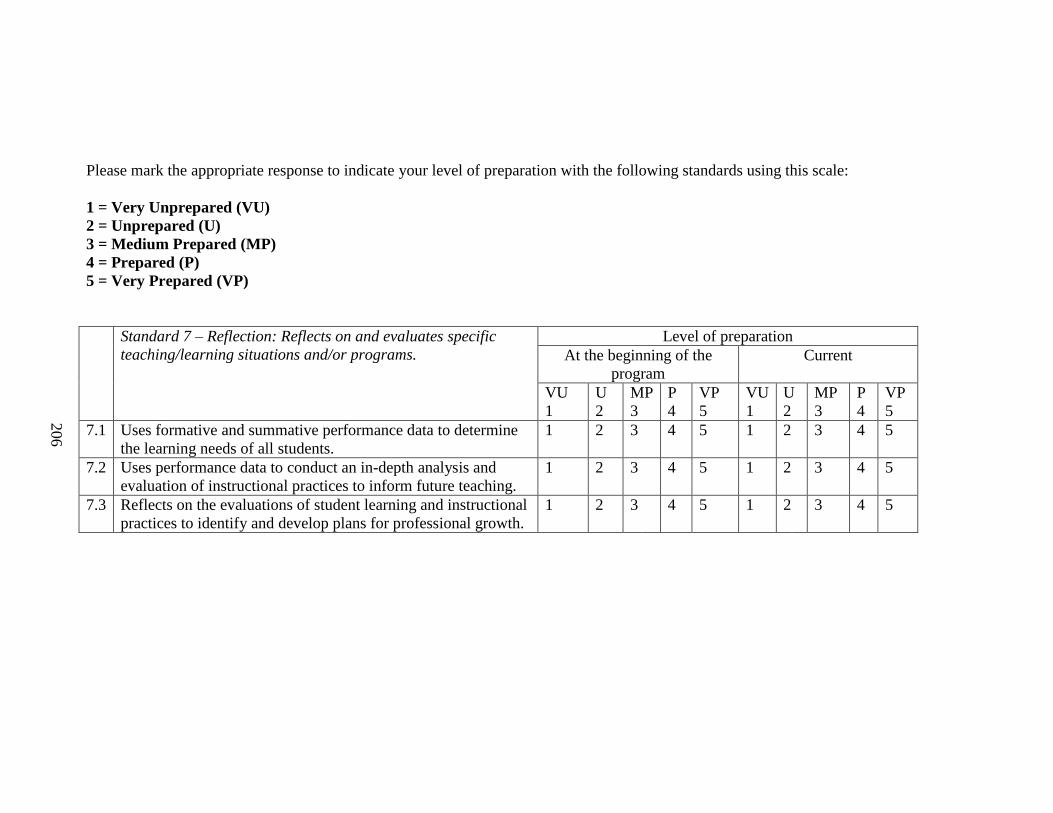
206
Please mark the appropriate response to indicate your level of preparation with the following standards using this scale:
1 = Very Unprepared (VU)
2 = Unprepared (U)
3 = Medium Prepared (MP)
4 = Prepared (P)
5 = Very Prepared (VP)
Standard 7 – Reflection: Reflects on and evaluates specific
teaching/learning situations and/or programs.
Level of preparation
At the beginning of the
program
Current
VU
1
U
2
MP
3
P
4
VP
5
VU
1
U
2
MP
3
P
4
VP
5
7.1 Uses formative and summative performance data to determine
the learning needs of all students.
1 2 3 4 5 1 2 3 4 5
7.2 Uses performance data to conduct an in-depth analysis and
evaluation of instructional practices to inform future teaching.
1 2 3 4 5 1 2 3 4 5
7.3 Reflects on the evaluations of student learning and instructional
practices to identify and develop plans for professional growth.
1 2 3 4 5 1 2 3 4 5
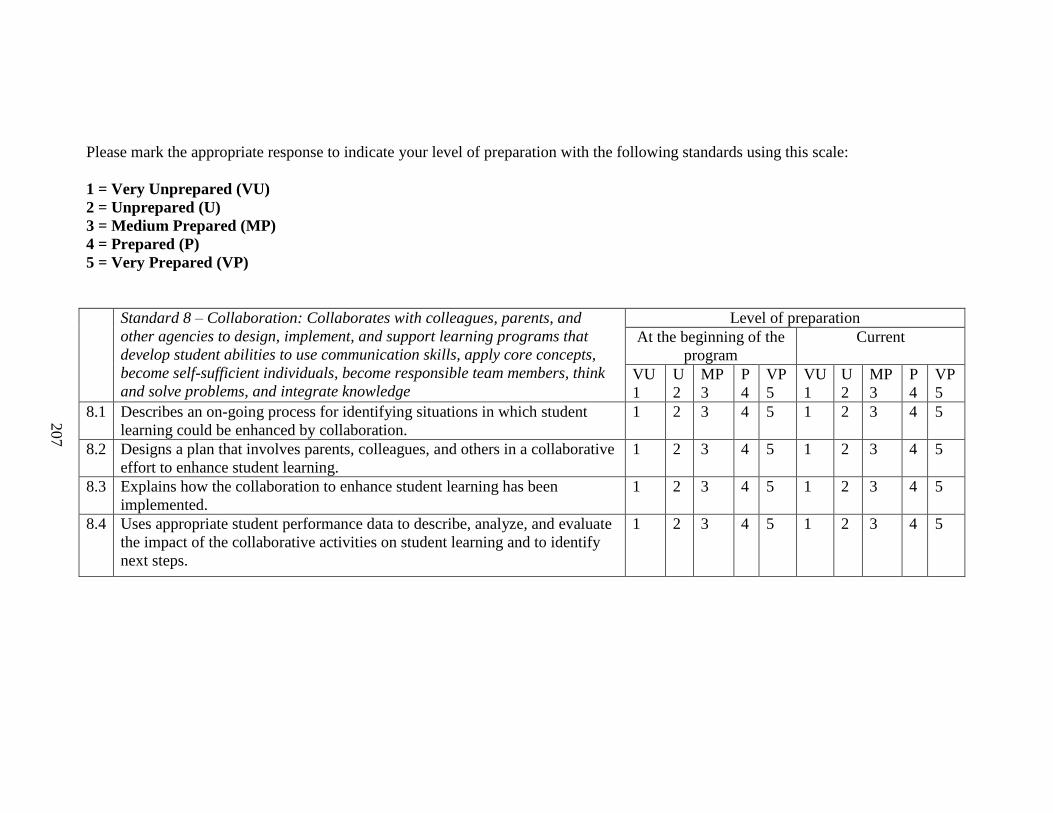
207
Please mark the appropriate response to indicate your level of preparation with the following standards using this scale:
1 = Very Unprepared (VU)
2 = Unprepared (U)
3 = Medium Prepared (MP)
4 = Prepared (P)
5 = Very Prepared (VP)
Standard 8 – Collaboration: Collaborates with colleagues, parents, and
other agencies to design, implement, and support learning programs that
develop student abilities to use communication skills, apply core concepts,
become self-sufficient individuals, become responsible team members, think
and solve problems, and integrate knowledge
Level of preparation
At the beginning of the
program
Current
VU
1
U
2
MP
3
P
4
VP
5
VU
1
U
2
MP
3
P
4
VP
5
8.1 Describes an on-going process for identifying situations in which student
learning could be enhanced by collaboration.
1 2 3 4 5 1 2 3 4 5
8.2 Designs a plan that involves parents, colleagues, and others in a collaborative
effort to enhance student learning.
1 2 3 4 5 1 2 3 4 5
8.3 Explains how the collaboration to enhance student learning has been
implemented.
1 2 3 4 5 1 2 3 4 5
8.4 Uses appropriate student performance data to describe, analyze, and evaluate
the impact of the collaborative activities on student learning and to identify
next steps.
1 2 3 4 5 1 2 3 4 5
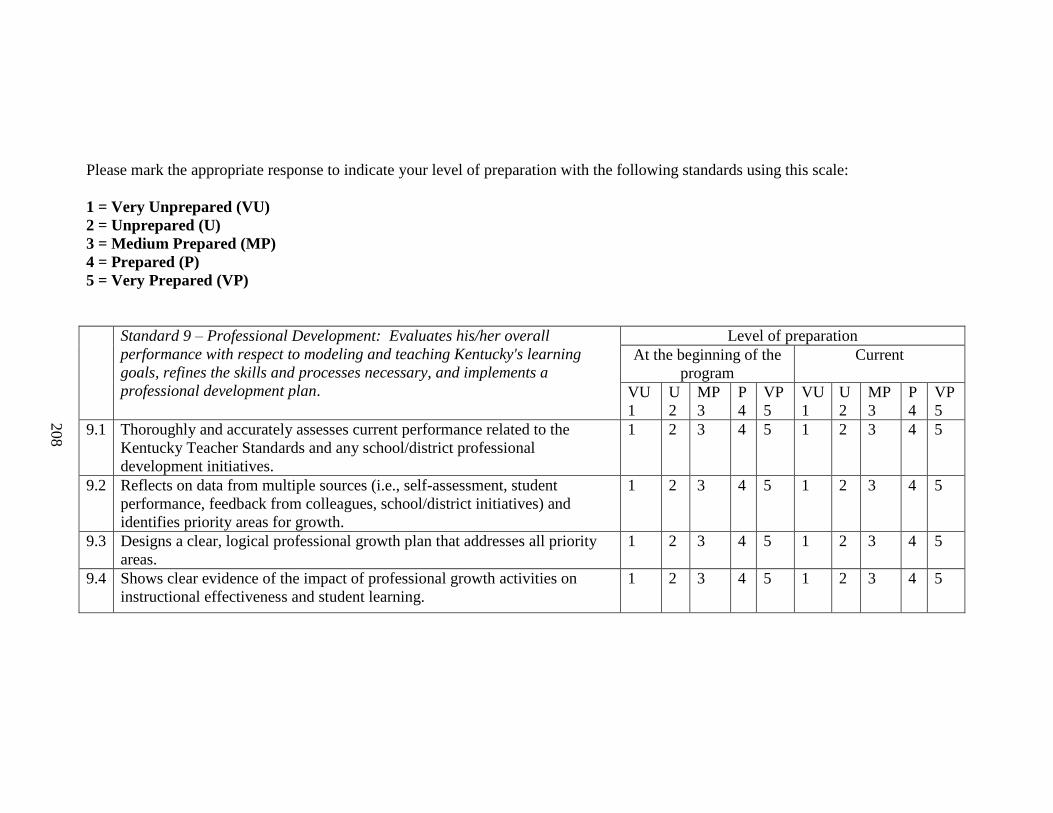
208
Please mark the appropriate response to indicate your level of preparation with the following standards using this scale:
1 = Very Unprepared (VU)
2 = Unprepared (U)
3 = Medium Prepared (MP)
4 = Prepared (P)
5 = Very Prepared (VP)
Standard 9 – Professional Development: Evaluates his/her overall
performance with respect to modeling and teaching Kentucky's learning
goals, refines the skills and processes necessary, and implements a
professional development plan.
Level of preparation
At the beginning of the
program
Current
VU
1
U
2
MP
3
P
4
VP
5
VU
1
U
2
MP
3
P
4
VP
5
9.1 Thoroughly and accurately assesses current performance related to the
Kentucky Teacher Standards and any school/district professional
development initiatives.
1 2 3 4 5 1 2 3 4 5
9.2 Reflects on data from multiple sources (i.e., self-assessment, student
performance, feedback from colleagues, school/district initiatives) and
identifies priority areas for growth.
1 2 3 4 5 1 2 3 4 5
9.3 Designs a clear, logical professional growth plan that addresses all priority
areas.
1 2 3 4 5 1 2 3 4 5
9.4 Shows clear evidence of the impact of professional growth activities on
instructional effectiveness and student learning.
1 2 3 4 5 1 2 3 4 5

209
Please mark the appropriate response to indicate your level of preparation with the following standards using this scale:
1 = Very Unprepared (VU)
2 = Unprepared (U)
3 = Medium Prepared (MP)
4 = Prepared (P)
5 = Very Prepared (VP)
Standard 10 – Leadership: Provides professional leadership within the
school, community, and education profession to improve student
learning and well-being.
Level of preparation
At the beginning of the
program
Current
VU
1
U
2
MP
3
P
4
VP
5
VU
1
U
2
MP
3
P
4
VP
5
10.1 Identifies leadership opportunities that enhance student learning and/or
professional environment of the school.
1 2 3 4 5 1 2 3 4 5
10.2 Develops a plan for engaging in leadership activities. 1 2 3 4 5 1 2 3 4 5
10.3 Implements a plan for engaging in leadership activities. 1 2 3 4 5 1 2 3 4 5
10.4 Analyzes data to evaluate the results of planned and executed leadership
efforts.
1 2 3 4 5 1 2 3 4 5

210
APPENDIX G: PROCEDURES: LETTERS OF COMMUNICATION WITH
PARTICIPATING PROFESSORS AND STUDENTS
Letter to TCHL 560 Class Students from the Dissertation Chair Dr. Miller
December 13, 2014
Students in my TCHL 560 class,
As noted previously, Evgenia (Jane) Mauzy, a doctoral student here at WKU, is doing her
dissertation on the level of preparation of MAE Teacher Leader graduates, at the beginning
and end of our program. All students in the Action Research capstone course are being
asked to participate because the data will also serve as a partial program evaluation of the
new MAE Teacher Leader course of study.
The research is being sponsored by WKU because the data will be used as feedback to help
improve our program.
Please participate.
Jane’s introductory letter, with the link to the survey, is copied below. Once you click on
the link, you will go to the survey, which begins with the letter of sponsorship from Dr.
Lisa Murley, Program Representative for the MAE in Teacher Leadership.
Thanks in advance for your participation with this study.
Dr. Steve Miller
December 13, 2013
Letter to Potential Participants
Dear Students:
My name is Evgenia Mauzy, a WKU doctoral student and researcher. I am inviting you to
participate in a study, Students’ Perceptions of a Teacher Leader Master’s Program. The
study will serve as: (a) part of a program evaluation for the College of Education and
Behavioral Sciences at Western Kentucky University, specifically the level of
effectiveness of the new MAE Teacher Leader Program, and (b) my doctoral dissertation.
The survey is online using Qualtrics. This letter contains a link to the study, provided to
each student enrolled in TCHL 560, Action Research, the capstone course for the MAE
Teacher Leader Program. The survey should take no more than 15-30 minutes to complete.
(Survey link inserted).
The Qualtrics survey includes a letter of sponsorship from Dr. Lisa Murley, Program
Representative for the MAE Teacher Leader Program, explaining details of the study
and encouraging you to participate.
Thank you in advance for your participation.
Sincerely,
Evgenia Mauzy
WKU Doctoral Student

211
APPENDIX H: REMINDER E – MAIL LETTERS TO PARTICIPANTS
December 13, 2013
Dr. Cribbs, Dr. Gandy, and Dr. Pereira,
Thank you very much for your support in my research project. I have attached a complete
letter—mine to the students combined with the draft Dr. Miller completed for you to send
to the students.
The anonymous link to the survey has been inserted into this complete letter. Please, send
this letter to your students as an email (NOT an attachment—they are less likely to open an
attachment).
Please email it to your students three times: (a) now, (b) one week later, and (c) two weeks
later. This letter encourages them to participate.
I spent an unforgettable four years of studies at WKU, and my research is my final step in
completing my dissertation. Thank you again for helping me achieve my dream and
receive a doctoral degree in education.
Jane Mauzy
EDLD Doctoral student
PS. Please don’t forget to add your name at the end of the letter Dr. Miller drafted for you
(immediately prior to my letter to the students that contains the link).
PPS. Please do NOT use the link in the email.
If you want to see the survey, go to
www.qualtrics.com
and log in.
Instead use the “Look and feel” option so that when you check the survey, you do not
accidentally add your response to the dataset as a student!
Attachement to the Letter
Students in my TCHL 560 class,
As noted previously, Evgenia (Jane) Mauzy, a doctoral student her at WKU, is doing her
dissertation on the level of preparation of MAE Teacher Leader graduates, at the beginning
and end of our program. All students in the Action Research capstone course are being
asked to participate because the data will also serve as a partial program evaluation of the
new MAE Teacher Leader course of study.
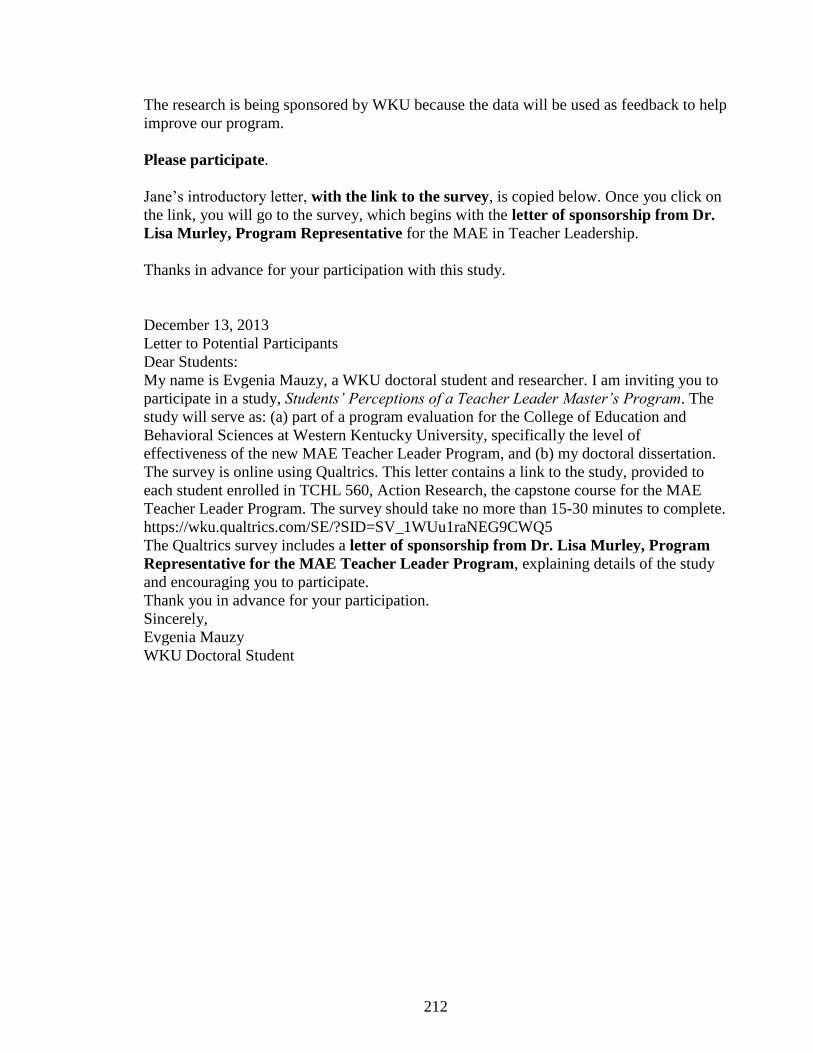
212
The research is being sponsored by WKU because the data will be used as feedback to help
improve our program.
Please participate.
Jane’s introductory letter, with the link to the survey, is copied below. Once you click on
the link, you will go to the survey, which begins with the letter of sponsorship from Dr.
Lisa Murley, Program Representative for the MAE in Teacher Leadership.
Thanks in advance for your participation with this study.
December 13, 2013
Letter to Potential Participants
Dear Students:
My name is Evgenia Mauzy, a WKU doctoral student and researcher. I am inviting you to
participate in a study, Students’ Perceptions of a Teacher Leader Master’s Program. The
study will serve as: (a) part of a program evaluation for the College of Education and
Behavioral Sciences at Western Kentucky University, specifically the level of
effectiveness of the new MAE Teacher Leader Program, and (b) my doctoral dissertation.
The survey is online using Qualtrics. This letter contains a link to the study, provided to
each student enrolled in TCHL 560, Action Research, the capstone course for the MAE
Teacher Leader Program. The survey should take no more than 15-30 minutes to complete.
https://wku.qualtrics.com/SE/?SID=SV_1WUu1raNEG9CWQ5
The Qualtrics survey includes a letter of sponsorship from Dr. Lisa Murley, Program
Representative for the MAE Teacher Leader Program, explaining details of the study
and encouraging you to participate.
Thank you in advance for your participation.
Sincerely,
Evgenia Mauzy
WKU Doctoral Student

213
APPENDIX I:
The data illustrated in Tables I-1 through I-10 represent internal reliability and item
characteristics for the beginning data on the WKU MAE Program. The survey data are
based on students’ perceptions of their educational preparation for the 10 Kentucky EBSP
Advanced Level Teacher Standards for the WKU MAE Teacher Leadership Program
degree. The letter b stands for beginning and refers to student data from the dual response
matrix (at the beginning of the program). The numbers in the first column indicate the
substandards (from 3-5 for the 10 different standards). The data for current perceptions (at
the end of the program) are given in Tables 1-10 in Chapter IV. The wording for the full
standard and specific substandards is located in Appendix C.

214
Table I-1
Internal Reliability and Item Characteristics for Standard 1, Beginning Values (N = 46)
________________________________________________________________________
Standard M SD Minimum Maximum Range - da
________________________________________________________________________
1.1b 3.58 .81 2 5 3 .85
1.2b 3.58 .92 1 5 4 .85
1.3b 3.53 .84 2 5 3 .82
1.4b 3.22 .77 2 5 3 .88
1.5b 3.38 .75 2 5 3 .85
Totalb 3.44 .67 1 5 4 .88c
Note. Standards and substandards are listed in the document, WKU Program
Standards (Appendix C).
a - d = alpha with item deleted.
bValues for Total are based on separate substandards summed and divided by the
total N across all of the substandards for that standard.
cValue for - d for Total is Cronbach’s coefficient alpha for the entire scale.

215
Table I-2
Internal Reliability and Item Characteristics for Standard 2, Beginning Values (N = 46)
________________________________________________________________________
Standard M SD Minimum Maximum Range - da
________________________________________________________________________
2.1b 3.54 .84 2 5 3 .93
2.2b 3.43 .93 2 5 3 .88
2.3b 3.26 .95 1 5 4 .88
2.4b 3.54 .96 2 5 3 .87
2.5b 3.33 .90 2 5 3 .87
Totalb 3.42 .78 1 5 4 .91c
Note. Standards and substandards are listed in the document, WKU Program
Standards (Appendix C).
a - d = alpha with item deleted.
bValues for Total are based on separate substandards summed and divided by the
total N across all of the substandards for that standard.
cValue for - d for Total is Cronbach’s coefficient alpha for the entire scale.

216
Table I-3
Internal Reliability and Item Characteristics for Standard 3, Beginning Values (N = 46)
________________________________________________________________________
Standard M SD Minimum Maximum Range - da
________________________________________________________________________
3.1b 3.78 .81 2 5 3 .89
3.2b 4.09 .94 2 5 3 .84
3.3b 3.70 .79 2 5 3 .92
3.4b 4.22 .73 2 5 3 .86
3.5b 4.20 .83 3 5 2 .85
Totalb 4.00 .69 2 5 3 .90c
Note. Standards and substandards are listed in the document, WKU Program
Standards (Appendix C).
a - d = alpha with item deleted.
bValues for Total are based on separate substandards summed and divided by the
total N across all of the substandards for that standard.
cValue for - d for Total is Cronbach’s coefficient alpha for the entire scale.
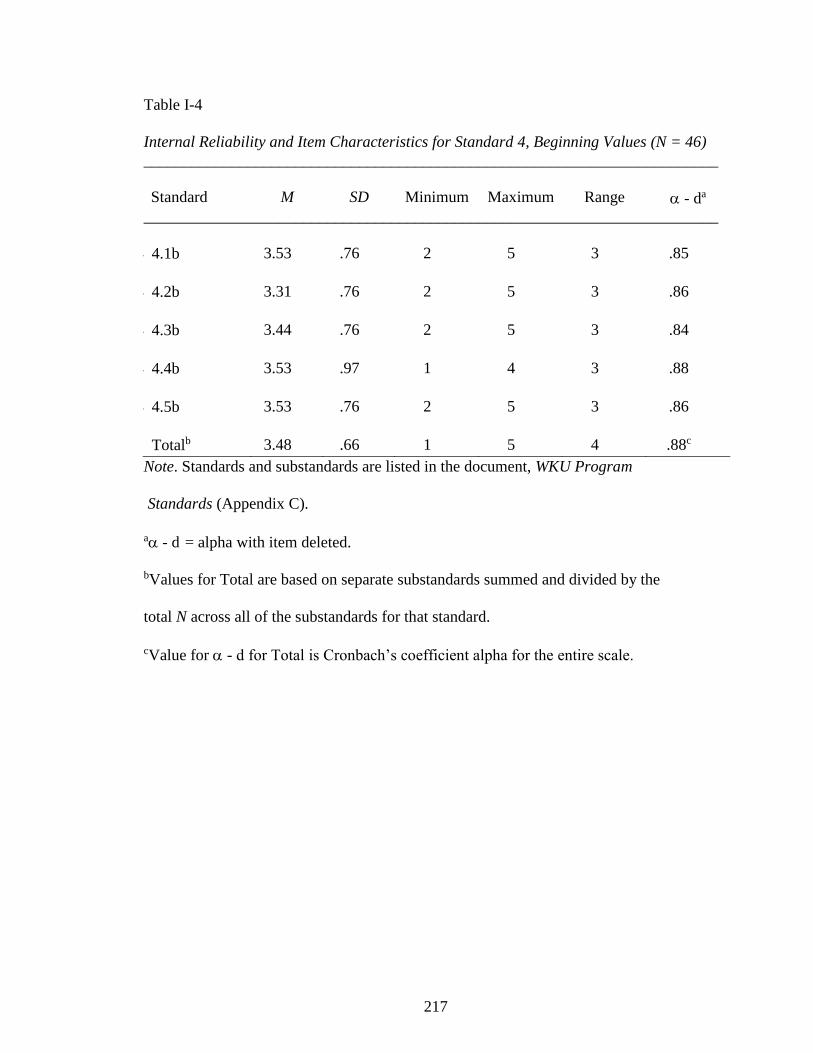
217
Table I-4
Internal Reliability and Item Characteristics for Standard 4, Beginning Values (N = 46)
________________________________________________________________________
Standard M SD Minimum Maximum Range - da
________________________________________________________________________
4 4.1b 3.53 .76 2 5 3 .85
4 4.2b 3.31 .76 2 5 3 .86
4 4.3b 3.44 .76 2 5 3 .84
4 4.4b 3.53 .97 1 4 3 .88
4 4.5b 3.53 .76 2 5 3 .86
Totalb 3.48 .66 1 5 4 .88c
Note. Standards and substandards are listed in the document, WKU Program
Standards (Appendix C).
a - d = alpha with item deleted.
bValues for Total are based on separate substandards summed and divided by the
total N across all of the substandards for that standard.
cValue for - d for Total is Cronbach’s coefficient alpha for the entire scale.
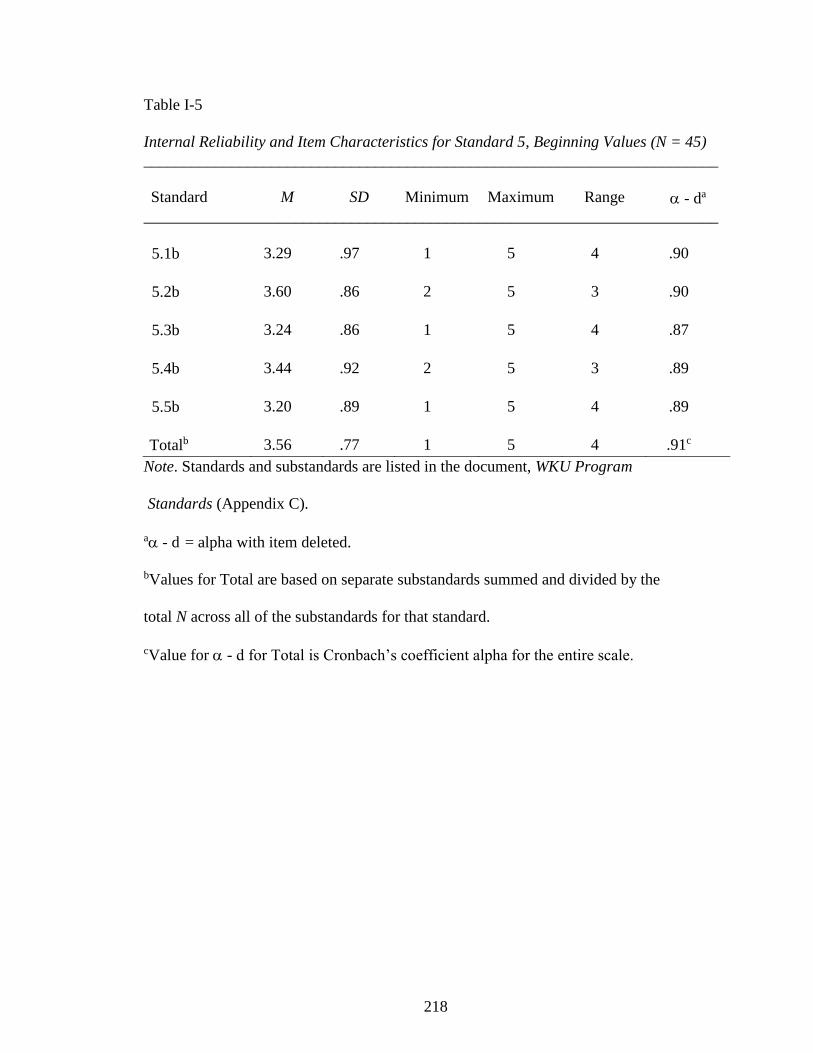
218
Table I-5
Internal Reliability and Item Characteristics for Standard 5, Beginning Values (N = 45)
________________________________________________________________________
Standard M SD Minimum Maximum Range - da
________________________________________________________________________
5. 5.1b 3.29 .97 1 5 4 .90
5. 5.2b 3.60 .86 2 5 3 .90
5. 5.3b 3.24 .86 1 5 4 .87
5. 5.4b 3.44 .92 2 5 3 .89
5. 5.5b 3.20 .89 1 5 4 .89
T Totalb 3.56 .77 1 5 4 .91c
Note. Standards and substandards are listed in the document, WKU Program
Standards (Appendix C).
a - d = alpha with item deleted.
bValues for Total are based on separate substandards summed and divided by the
total N across all of the substandards for that standard.
cValue for - d for Total is Cronbach’s coefficient alpha for the entire scale.

219
Table I-6
Internal Reliability and Item Characteristics for Standard 6, Beginning Values (N = 45)
________________________________________________________________________
Standard M SD Minimum Maximum Range - da
________________________________________________________________________
6.1b 3.57 .87 2 5 3 .87
6.2b 3.45 .90 2 5 3 .88
6.3b 3.34 .81 2 5 3 .88
6.4b 3.39 .92 2 5 3 .92
6.5b 3.82 .92 2 5 3 .90
Totalb 3.55 .78 2 5 3 .91c
Note. Standards and substandards are listed in the document, WKU Program
Standards (Appendix C).
a - d = alpha with item deleted.
bValues for Total are based on separate substandards summed and divided by the
total N across all of the substandards for that standard.
cValue for - d for Total is Cronbach’s coefficient alpha for the entire scale.

220
Table I-7
Internal Reliability and Item Characteristics for Standard 7, Beginning Values (N = 45)
________________________________________________________________________
Standard M SD Minimum Maximum Range - da
________________________________________________________________________
7 7.1b 3.56 .99 1 5 4 .94
7 7.2b 3.33 .95 1 5 4 .91
7 7.3b 3.38 .98 1 5 4 .92
Totalb 3.42 .93 1 5 4 .95c
Note. Standards and substandards are listed in the document, WKU Program
Standards (Appendix C).
a - d = alpha with item deleted.
bValues for Total are based on separate substandards summed and divided by the
total N across all of the substandards for that standard.
cValue for - d for Total is Cronbach’s coefficient alpha for the entire scale.

221
Table I-8
Internal Reliability and Item Characteristics for Standard 8, Beginning Values (N = 45)
________________________________________________________________________
Standard M SD Minimum Maximum Range - da
________________________________________________________________________
8.1b 3.36 .96 1 5 4 .94
8.2b 3.24 .91 1 5 4 .93
8.3b 3.22 1.00 1 5 4 .93
8.4b 3.31 1.04 1 5 4 .93
Totalb 3.28 .91 1 5 4 .95c
Note. Standards and substandards are listed in the document, WKU Program
Standards (Appendix C).
a - d = alpha with item deleted.
bValues for Total are based on separate substandards summed and divided by the
total N across all of the substandards for that standard.
cValue for - d for Total is Cronbach’s coefficient alpha for the entire scale.
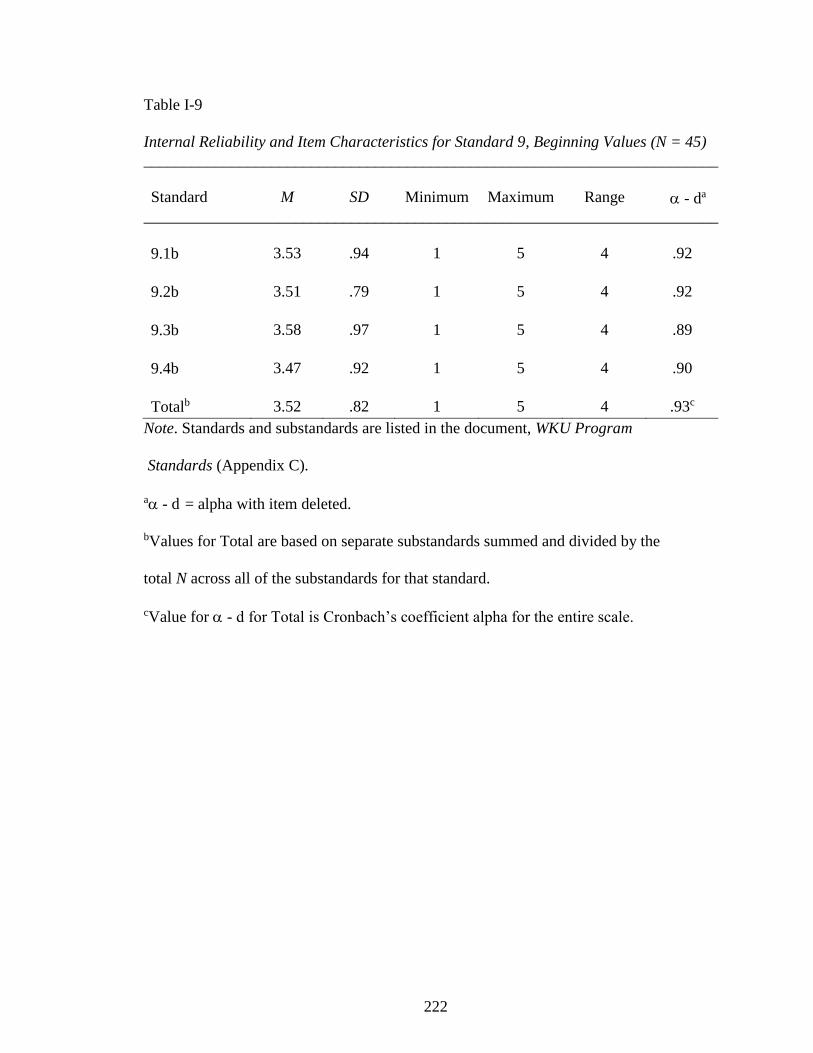
222
Table I-9
Internal Reliability and Item Characteristics for Standard 9, Beginning Values (N = 45)
________________________________________________________________________
Standard M SD Minimum Maximum Range - da
________________________________________________________________________
9.1b 3.53 .94 1 5 4 .92
9.2b 3.51 .79 1 5 4 .92
9.3b 3.58 .97 1 5 4 .89
9.4b 3.47 .92 1 5 4 .90
Totalb 3.52 .82 1 5 4 .93c
Note. Standards and substandards are listed in the document, WKU Program
Standards (Appendix C).
a - d = alpha with item deleted.
bValues for Total are based on separate substandards summed and divided by the
total N across all of the substandards for that standard.
cValue for - d for Total is Cronbach’s coefficient alpha for the entire scale.

223
Table I-10
Internal Reliability and Item Characteristics for Standard 10, Beginning Values (N = 45)
________________________________________________________________________
Standard M SD Minimum Maximum Range - da
________________________________________________________________________
10.1b 3.39 .95 1 5 4 .97
10.2b 3.39 .97 1 5 4 .97
10.3b 3.36 .99 1 5 4 .97
10.4b 3.27 1.04 1 5 4 .98
Totalb 3.38 .97 1 5 4 .98c
Note. Standards and substandards are listed in the document, WKU Program
Standards (Appendix C).
a - d = alpha with item deleted.
bValues for Total are based on separate substandards summed and divided by the
total N across all of the substandards for that standard.
cValue for - d for Total is Cronbach’s coefficient alpha for the entire scale.

224
CURRICULUM VITAE
Evgenia Mauzy
159 Crystal Court
Radcliff, KY, 40160
cell: 270-312-6453
e-mail: [email protected]
SUMMARY STATEMENT
Looking for a teaching or administrative position in education.
EDUCATION
Kremenchug Medical College, Kremenchug, Ukraine. Bachelor of Science Degree, RN.
1989
Kaliningrad State University, Kaliningrad, Russia. Master of Arts Degree with a major in
Education, Applied Linguistics, Russian Language and Literature, 2004
Western Kentucky University, Bowling Green, Kentucky. Educational Leadership,
Postsecondary Education, ABD, expected date of graduation 2014.
EMPLOYMENT HISTORY
2005-2006. North Hardin Health & Rehabilitation, Radcliff, KY- CNA.
599 Rogersville Rd
Radcliff, KY 40160, phone 270- 351-2999
2006-2006. Brown Street Alternative School, Vine Grove, KY-Instructional Assistant.
400 Brown Street, Vine Grove, KY 40175, phone 270-877-2100
2006-2007. Hardin County Schools, Elizabethtown, KY-Substitute Teacher.
65 W. A. Jenkins Rd Elizabethtown, KY 42701, phone 270-769-8800
2007-present time –Hardin County Schools, Elizabethtown, KY-ESL teacher.
65 W. A. Jenkins Rd Elizabethtown, KY 42701, phone 270-769-8800
2009-2010. Elizabethtown Nursing Home, Elizabethtown, KY-RN, Charge Nurse.
1101 Woodland Drive Elizabethtown, KY 42701, Phone 270-765-6106
LICENSES / CERTIFICATION
2006. Kentucky ESL Teacher License, K-12, all grades
2006. Kentucky Russian Language Teacher License, K-12, all grades
225
2009. Kentucky RN License
SKILLS / INTERESTS
Speak five languages: Russian—native language; Ukrainian—fluent, graduated high
school in Ukraine; English—fluent; Swedish and Polish—intermediate level.
Interests include reading, travelling, running, research in linguistics.