Structure formation of polyamide 6 from the glassy state by fast scanning chip calorimetry
10
Structure formation of polyamide 6 from the glassy state by fast scanning chip calorimetry Igor Kolesov a , Daniela Mileva a , René Androsch a, * , Christoph Schick b a Martin-Luther-University Halle-Wittenberg, Center of Engineering Sciences, D-06099 Halle/Saale, Germany b University of Rostock, Institute of Physics, D-18051 Rostock, Germany article info Article history: Received 1 July 2011 Received in revised form 2 September 2011 Accepted 6 September 2011 Available online 16 September 2011 Keywords: Polyamide 6 Crystallization Fast scanning chip calorimetry abstract Fast scanning chip calorimetry has been employed to explore the kinetics of structure formation of polyamide 6 from the glassy state. First, the condition to obtain fully amorphous polyamide 6 has been evaluated. It was found that ordering processes are only permitted on cooling the relaxed melt slower than about 150 K s 1 ; faster cooling was connected with complete vitrification of the supercooled liquid. Cold-ordering of fully amorphous, non-aged samples on continuous heating only takes place if the heating rate is lower than 500 K s 1 . Isothermal cold-ordering experiments of fully amorphous samples have been performed in a wide temperature range between 330 and 470 K, in order to obtain for the first time a complete relationship between half-time of cold-ordering/crystallization and temperature. The study was completed by an initial discussion of the temperature dependence of the mechanism of nucleation and of the effect of the crystal/mesophase polymorphism on the transition kinetics. Ó 2011 Elsevier Ltd. All rights reserved. 1. Introduction 1.1. General comments about polymer crystallization at high supercooling Crystallization of polymers commonly is restricted to the temperature range between the equilibrium melting temperature of crystals and the glass transition temperature of the amorphous phase [1,2]. The temperature dependence of the crystallization rate, typically, is described by the well-known TurnbulleFisher equation, taking into account a thermodynamic driving force for the phase transformation and the mobility of chain segments. In general, for a given nucleation scheme, the crystallization rate passes a maximum with increasing supercooling of the melt [1e3]. For experimental reasons, kinetic analyses of ordering processes mainly focused on the high-temperature flank, that is, on the temperature range of low supercooling of the melt. Study of the ordering kinetics at high supercooling, close to the glass transition temperature, is complicated since nucleation and crystallization must be avoided during the approach of the temperature of interest; it requires cooling the equilibrium-melt at a rate which is distinctly faster than the maximum rate of nucleation and crystallization. In fact, the cooling capacity of standard differential scanning calorimetry (DSC), as one of the most popular analysis tools to study the kinetics of polymer crystallization [4,5], often is insufficient to highly supercool the melt before onset of nucleation or ordering processes, or even to fully vitrify the material by cooling it below the glass transition temperature. Even specially designed DSC versions [6] or experimental setups [7] allow cooling at a rate of, at best, few hundred K min 1 . As an alternative, high super- cooling of the melt may be achieved by quenching, either directly to the temperature of interest, or even below the glass transition temperature to obtain a glass. In the latter case, crystallization may then initiated by subsequent heating the glass above its glass transition temperature; the liquidecrystal phase transition is in this case termed glass- or cold-crystallization, to indicate the specific path of reaching the transformation temperature. Note that the temperatureetime profile used to approach the target temperature is not trivial since it may affect the kinetics of the phase transformation. It is emphasized that this includes also the temperature and time of keeping the sample in the glassy state. Even at such low temperature there may be sufficient mobility of short chain segments to allow local ordering or formation of homogeneous nuclei, as has been suggested e.g. for polyethylene (PE) [8], or poly( 3 -caprolactone) (PCL) [9]. As far as we are aware, knowledge about the thermal stability of such nuclei is not avail- able, that is, it is not known whether these nuclei get destroyed or stabilize on approaching the temperature of cold-ordering by * Corresponding author. Tel.: þ49 3461 46 3762; fax: þ49 3461 46 3891. E-mail address: [email protected] (R. Androsch). Contents lists available at SciVerse ScienceDirect Polymer journal homepage: www.elsevier.com/locate/polymer 0032-3861/$ e see front matter Ó 2011 Elsevier Ltd. All rights reserved. doi:10.1016/j.polymer.2011.09.007 Polymer 52 (2011) 5156e5165
Transcript of Structure formation of polyamide 6 from the glassy state by fast scanning chip calorimetry
at SciVerse ScienceDirect
Polymer 52 (2011) 5156e5165
Contents lists available
Polymer
journal homepage: www.elsevier .com/locate/polymer
Structure formation of polyamide 6 from the glassy state by fast scanningchip calorimetry
Igor Kolesova, Daniela Milevaa, René Androscha,*, Christoph Schickb
aMartin-Luther-University Halle-Wittenberg, Center of Engineering Sciences, D-06099 Halle/Saale, GermanybUniversity of Rostock, Institute of Physics, D-18051 Rostock, Germany
a r t i c l e i n f o
Article history:Received 1 July 2011Received in revised form2 September 2011Accepted 6 September 2011Available online 16 September 2011
Keywords:Polyamide 6CrystallizationFast scanning chip calorimetry
* Corresponding author. Tel.: þ49 3461 46 3762; faE-mail address: [email protected] (R.
0032-3861/$ e see front matter � 2011 Elsevier Ltd.doi:10.1016/j.polymer.2011.09.007
a b s t r a c t
Fast scanning chip calorimetry has been employed to explore the kinetics of structure formation ofpolyamide 6 from the glassy state. First, the condition to obtain fully amorphous polyamide 6 has beenevaluated. It was found that ordering processes are only permitted on cooling the relaxed melt slowerthan about 150 K s�1; faster cooling was connected with complete vitrification of the supercooled liquid.Cold-ordering of fully amorphous, non-aged samples on continuous heating only takes place if theheating rate is lower than 500 K s�1. Isothermal cold-ordering experiments of fully amorphous sampleshave been performed in a wide temperature range between 330 and 470 K, in order to obtain for the firsttime a complete relationship between half-time of cold-ordering/crystallization and temperature. Thestudy was completed by an initial discussion of the temperature dependence of the mechanism ofnucleation and of the effect of the crystal/mesophase polymorphism on the transition kinetics.
� 2011 Elsevier Ltd. All rights reserved.
1. Introduction
1.1. General comments about polymer crystallization at highsupercooling
Crystallization of polymers commonly is restricted to thetemperature range between the equilibrium melting temperatureof crystals and the glass transition temperature of the amorphousphase [1,2]. The temperature dependence of the crystallization rate,typically, is described by thewell-knownTurnbulleFisher equation,taking into account a thermodynamic driving force for the phasetransformation and the mobility of chain segments. In general, fora given nucleation scheme, the crystallization rate passesa maximum with increasing supercooling of the melt [1e3]. Forexperimental reasons, kinetic analyses of ordering processesmainly focused on the high-temperature flank, that is, on thetemperature range of low supercooling of the melt. Study of theordering kinetics at high supercooling, close to the glass transitiontemperature, is complicated since nucleation and crystallizationmust be avoided during the approach of the temperature ofinterest; it requires cooling the equilibrium-melt at a rate which isdistinctly faster than the maximum rate of nucleation and
x: þ49 3461 46 3891.Androsch).
All rights reserved.
crystallization. In fact, the cooling capacity of standard differentialscanning calorimetry (DSC), as one of the most popular analysistools to study the kinetics of polymer crystallization [4,5], often isinsufficient to highly supercool the melt before onset of nucleationor ordering processes, or even to fully vitrify thematerial by coolingit below the glass transition temperature. Even specially designedDSC versions [6] or experimental setups [7] allow cooling at a rateof, at best, few hundred Kmin�1. As an alternative, high super-cooling of themelt may be achieved by quenching, either directly tothe temperature of interest, or even below the glass transitiontemperature to obtain a glass. In the latter case, crystallization maythen initiated by subsequent heating the glass above its glasstransition temperature; the liquidecrystal phase transition is inthis case termed glass- or cold-crystallization, to indicate thespecific path of reaching the transformation temperature. Note thatthe temperatureetime profile used to approach the targettemperature is not trivial since it may affect the kinetics of thephase transformation. It is emphasized that this includes also thetemperature and time of keeping the sample in the glassy state.Even at such low temperature there may be sufficient mobility ofshort chain segments to allow local ordering or formation ofhomogeneous nuclei, as has been suggested e.g. for polyethylene(PE) [8], or poly( 3-caprolactone) (PCL) [9]. As far as we are aware,knowledge about the thermal stability of such nuclei is not avail-able, that is, it is not known whether these nuclei get destroyed orstabilize on approaching the temperature of cold-ordering by

I. Kolesov et al. / Polymer 52 (2011) 5156e5165 5157
heating at a pre-defined rate. In the previous study on PCL it wasargued that homogeneous nuclei get destroyed on heating but stillleave a signature in the structure of the supercooled liquid,promoting crystallization.
In order to challenge structure formation of crystallizablepolymers at high supercooling, and to overcome the limitations ofstandard DSC, several research groups developed their ownrespective quenching devices [10e12], providing at least informa-tion about transition temperatures on non-linear but fast coolingup to rates of several hundred K s�1. Recently, special versions offast scanning chip calorimetry (FSC) have been developed forpolymer analysis which, if compared with home-made quenchingdevices, must be considered as state-of-the-art instrumentation forprecise calorimetric analysis of structure formation at extremeconditions [13,14]. It allows linear fast cooling and heating, exactcontrol of aging conditions and simultaneous recording of sample-heat-flow-rate data at high time-resolution. FSC has been usedalready to study structure formation of several crystallizablepolymers at large supercooling, including PCL [9], PE [13,15], pol-y(butylene terephthalate) (PBT) [16], or isotactic polypropylene(iPP) [17,18]. These studies not only provided quantitative kineticdata of ordering at high supercooling rather than also deliveredvaluable information about the temperature ranges of heteroge-neous and homogeneous nucleation, being effective at low andhigh supercooling, respectively. This technique, however, has notyet been applied to study systematically the crystallization ofpolyamide 6 (PA 6) at high supercooling. Initial work about thecrystallization behavior of bulk PA 6 at high supercooling, usingFSC, has been included in research about structure formation indispersed sub-micrometer droplets of PA 6 [19].
1.2. The a/g polymorphism of PA 6
PA 6 is a linear macromolecule which is able to crystallize indifferent structures as a function of the conditions of cooling therelaxed melt. Further, different crystal polymorphs have beendetected as a result of straining the melt before solidification or bycrystallization from aqueous solutions in presence of iodine. Acompact overview about the different polymorphic structures hasbeen provided by Roldan and Kaufman [20]. In the present work,focus is put on crystallization of the relaxed non-oriented melt.Crystallization at low supercooling, at temperatures higher thanabout 420 K, typically leads to formation of monoclinic a-crystals.The crystal structure has been identified by Holmes et al. [21] and ischaracterized by fully extended chain segments of CH2 and NH2groups and sheet-like hydrogen bonding, ultimately resulting instrong anisotropy of forces between the neighbored, parallelaligned chain segments. The a-structure is considered as thermo-dynamically most stable crystal form. The crystal density is1.23 g cm�3 [22], the specific heat of fusion is 230� 30 [22,23],233e267 [24], or 241 J g�1 [25], and the equilibrium meltingtemperature is 533 K [22e24]. Melt-crystallization at low super-cooling leads to formation of lamellae and spherulites [26e28].
Solidification of PA 6 at high supercooling results in formation ofa pseudo-hexagonal g-phase, which frequently also has beennamed b-form [29,30], or g*-form [24,25,31,32]. Importantly, thepseudo-hexagonal g-phase, which develops on melt-solidificationat high supercooling and being relevant in this work, must not beconfused with a further, identically named crystal polymorphwhich develops only by solution-crystallization/recrystallization inpresence of iodine [33,34]. The g-structure, which forms at highsupercooling, has been described as solid metastable mesophaseconsisting of small aggregates of parallel, conformationally disor-dered but straight chain segments; long-range only holds forparallelism and pseudo-hexagonal arrangement of chain axes.
Hydrogen bonding within the mesophase is almost completethough not restricted to a specific crystallographic direction as inthe monoclinic a-form [35,36]. The density and specific enthalpy ofisotropization of the mesophase of PA 6 are 1.15e1.16 g cm�3
[20,25], and 58� 5 J g�1, respectively [25]. The g-mesophaseconverts irreversibly into stable a-structure on slow heating orannealing at elevated temperature [32,36]. Reports about differ-ences of the morphology of the mesophase and the crystal phaseare rare. In particular, there are not available definite resultswhether the mesophase is of lamellar or nodular morphology. Itseems that ordering at high supercooling is connected withformation of spherulites too [26,37,38].
The exact conditions required for formation of a-crystals and ofmesophase on cooling the isotropic melt were quantitativelyevaluated by isothermal [39] and non-isothermal crystallizationexperiments [11,40e43]. It was found that isothermal solidificationat temperatures higher than 410e420 K predominantly resulted information of a-crystals, while mesophase formation was prevailingat lower temperatures [39]. The correlation between cooling rateand the polymorphism of nucleated and non-nucleated PA 6 wasanalyzed first by Piccarolo et al. using a special quenching devicewhich allowed ballistic cooling of films at rates between about 10�1
and 103 K s�1 [11,40,41]. It was found that a-crystals are completelyreplaced by mesophase if the cooling rate exceeds about 20 K s�1.Presence of a heterogeneous nucleating agent resulted in a slightincrease of the critical cooling rate for complete inhibition of a-crystal formation to 70 K s�1. Fully amorphous specimens wereobtained if the cooling rate exceeded about 200 K s�1. This resulthas been confirmed in a recent study highlighting advances in FSCinstrumentation on example of various case studies including PA 6[14]. While the seminal cooling experiments of Piccarolo et al.allowed correlation of the cooling rate with the X-ray structure,only recently this work has been completed by simultaneousmeasurement of transition temperatures during non-linear butpre-defined cooling at various rates up to about 200 K s�1 and ofthe specific X-ray structure formed [42]. Besides confirmation ofearlier work regarding critical cooling rates to enforce formation ofspecific polymorphs, or to obtain fully amorphous structure atambient temperature, it was found that there is a continuousdecrease of the phase-transition temperature with increasingcooling rate regardless whether the supercooled liquid transformedto crystals or mesophase.
1.3. Structure formation of PA 6 from the glassy state
Analysis of structure formation of fully amorphous PA 6 from theglassy state requires in a first step inhibition of crystallization,mesophase formation and formation of homogeneous nucleiduring cooling the relaxed melt below the glass transitiontemperature of 313 K [23]. The cooling rate necessary to avoid suchordering processes is of the order of few hundred K s�1
[11,14,40e42]. Cold-ordering/crystallization, typically, is observedon heating the glass to temperatures higher than the glass transi-tion temperature; however, in particular in case of PA 6, orderingprocesses have also been detected on aging quenched preparationsat ambient temperature, near or even below the glass transitiontemperature [24,43]. Importantly, cold-ordering on continuousheating into the temperature range of the equilibrium liquid onlyoccurs if the heating rate is lower than about 103 K s�1 [14]. Earlierstudies of cold-crystallization included evaluation of the effects oftemperature and time of cold-crystallization on the X-ray structure,in particular the relative amounts of a-crystals and mesophase[24,36,44], and isothermal analysis of the transition kinetics by DSC[45]. It was found that on continuous heating at low rate orderingprocesses start immediately on passing the glass transition
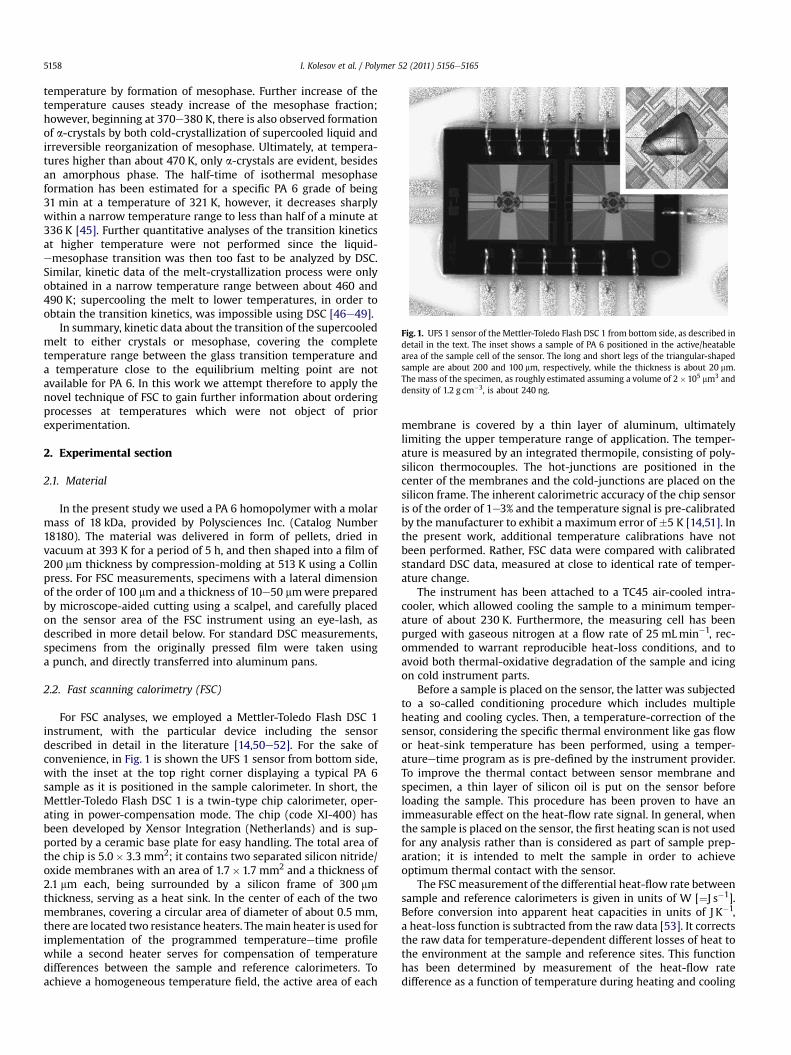
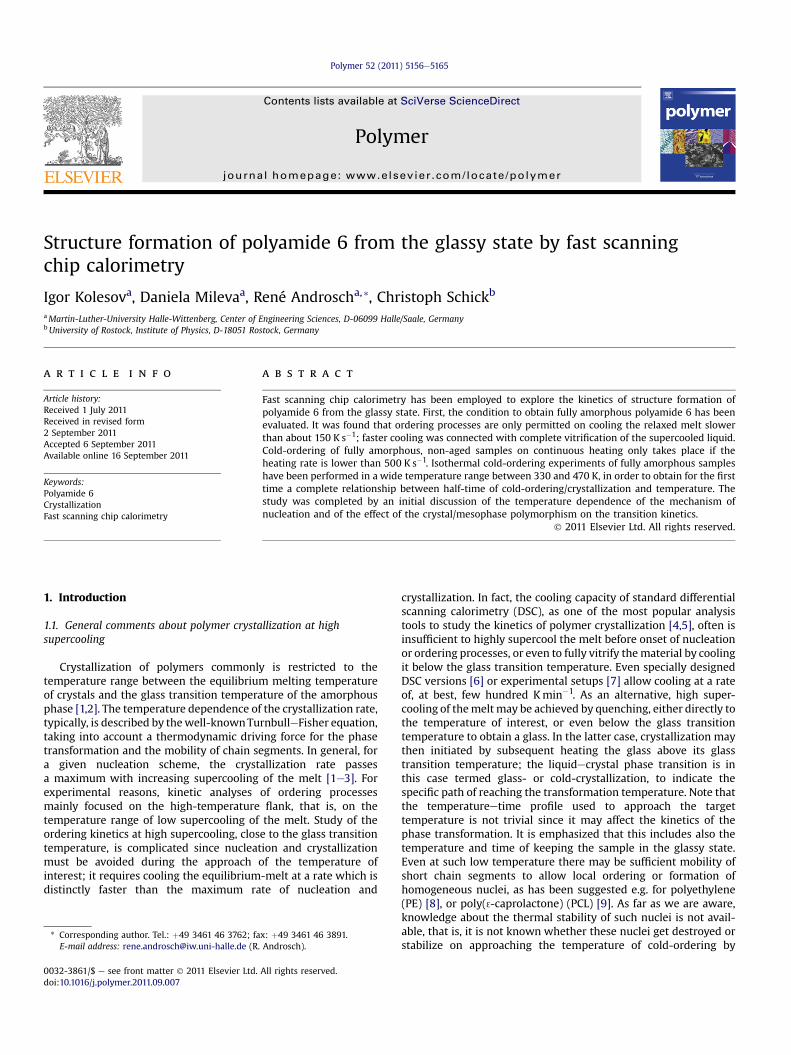
Fig. 1. UFS 1 sensor of the Mettler-Toledo Flash DSC 1 from bottom side, as described indetail in the text. The inset shows a sample of PA 6 positioned in the active/heatablearea of the sample cell of the sensor. The long and short legs of the triangular-shapedsample are about 200 and 100 mm, respectively, while the thickness is about 20 mm.The mass of the specimen, as roughly estimated assuming a volume of 2�105 mm3 anddensity of 1.2 g cm�3, is about 240 ng.
I. Kolesov et al. / Polymer 52 (2011) 5156e51655158
temperature by formation of mesophase. Further increase of thetemperature causes steady increase of the mesophase fraction;however, beginning at 370e380 K, there is also observed formationof a-crystals by both cold-crystallization of supercooled liquid andirreversible reorganization of mesophase. Ultimately, at tempera-tures higher than about 470 K, only a-crystals are evident, besidesan amorphous phase. The half-time of isothermal mesophaseformation has been estimated for a specific PA 6 grade of being31 min at a temperature of 321 K, however, it decreases sharplywithin a narrow temperature range to less than half of a minute at336 K [45]. Further quantitative analyses of the transition kineticsat higher temperature were not performed since the liquid-emesophase transition was then too fast to be analyzed by DSC.Similar, kinetic data of the melt-crystallization process were onlyobtained in a narrow temperature range between about 460 and490 K; supercooling the melt to lower temperatures, in order toobtain the transition kinetics, was impossible using DSC [46e49].
In summary, kinetic data about the transition of the supercooledmelt to either crystals or mesophase, covering the completetemperature range between the glass transition temperature anda temperature close to the equilibrium melting point are notavailable for PA 6. In this work we attempt therefore to apply thenovel technique of FSC to gain further information about orderingprocesses at temperatures which were not object of priorexperimentation.
2. Experimental section
2.1. Material
In the present study we used a PA 6 homopolymer with a molarmass of 18 kDa, provided by Polysciences Inc. (Catalog Number18180). The material was delivered in form of pellets, dried invacuum at 393 K for a period of 5 h, and then shaped into a film of200 mm thickness by compression-molding at 513 K using a Collinpress. For FSC measurements, specimens with a lateral dimensionof the order of 100 mm and a thickness of 10e50 mmwere preparedby microscope-aided cutting using a scalpel, and carefully placedon the sensor area of the FSC instrument using an eye-lash, asdescribed in more detail below. For standard DSC measurements,specimens from the originally pressed film were taken usinga punch, and directly transferred into aluminum pans.
2.2. Fast scanning calorimetry (FSC)
For FSC analyses, we employed a Mettler-Toledo Flash DSC 1instrument, with the particular device including the sensordescribed in detail in the literature [14,50e52]. For the sake ofconvenience, in Fig. 1 is shown the UFS 1 sensor from bottom side,with the inset at the top right corner displaying a typical PA 6sample as it is positioned in the sample calorimeter. In short, theMettler-Toledo Flash DSC 1 is a twin-type chip calorimeter, oper-ating in power-compensation mode. The chip (code XI-400) hasbeen developed by Xensor Integration (Netherlands) and is sup-ported by a ceramic base plate for easy handling. The total area ofthe chip is 5.0� 3.3 mm2; it contains two separated silicon nitride/oxide membranes with an area of 1.7�1.7 mm2 and a thickness of2.1 mm each, being surrounded by a silicon frame of 300 mmthickness, serving as a heat sink. In the center of each of the twomembranes, covering a circular area of diameter of about 0.5 mm,there are located two resistance heaters. Themain heater is used forimplementation of the programmed temperatureetime profilewhile a second heater serves for compensation of temperaturedifferences between the sample and reference calorimeters. Toachieve a homogeneous temperature field, the active area of each
membrane is covered by a thin layer of aluminum, ultimatelylimiting the upper temperature range of application. The temper-ature is measured by an integrated thermopile, consisting of poly-silicon thermocouples. The hot-junctions are positioned in thecenter of the membranes and the cold-junctions are placed on thesilicon frame. The inherent calorimetric accuracy of the chip sensoris of the order of 1e3% and the temperature signal is pre-calibratedby the manufacturer to exhibit a maximum error of �5 K [14,51]. Inthe present work, additional temperature calibrations have notbeen performed. Rather, FSC data were compared with calibratedstandard DSC data, measured at close to identical rate of temper-ature change.
The instrument has been attached to a TC45 air-cooled intra-cooler, which allowed cooling the sample to a minimum temper-ature of about 230 K. Furthermore, the measuring cell has beenpurged with gaseous nitrogen at a flow rate of 25 mLmin�1, rec-ommended to warrant reproducible heat-loss conditions, and toavoid both thermal-oxidative degradation of the sample and icingon cold instrument parts.
Before a sample is placed on the sensor, the latter was subjectedto a so-called conditioning procedure which includes multipleheating and cooling cycles. Then, a temperature-correction of thesensor, considering the specific thermal environment like gas flowor heat-sink temperature has been performed, using a temper-atureetime program as is pre-defined by the instrument provider.To improve the thermal contact between sensor membrane andspecimen, a thin layer of silicon oil is put on the sensor beforeloading the sample. This procedure has been proven to have animmeasurable effect on the heat-flow rate signal. In general, whenthe sample is placed on the sensor, the first heating scan is not usedfor any analysis rather than is considered as part of sample prep-aration; it is intended to melt the sample in order to achieveoptimum thermal contact with the sensor.
The FSCmeasurement of the differential heat-flow rate betweensample and reference calorimeters is given in units of W [¼J s�1].Before conversion into apparent heat capacities in units of J K�1,a heat-loss function is subtracted from the raw data [53]. It correctsthe raw data for temperature-dependent different losses of heat tothe environment at the sample and reference sites. This functionhas been determined by measurement of the heat-flow ratedifference as a function of temperature during heating and cooling
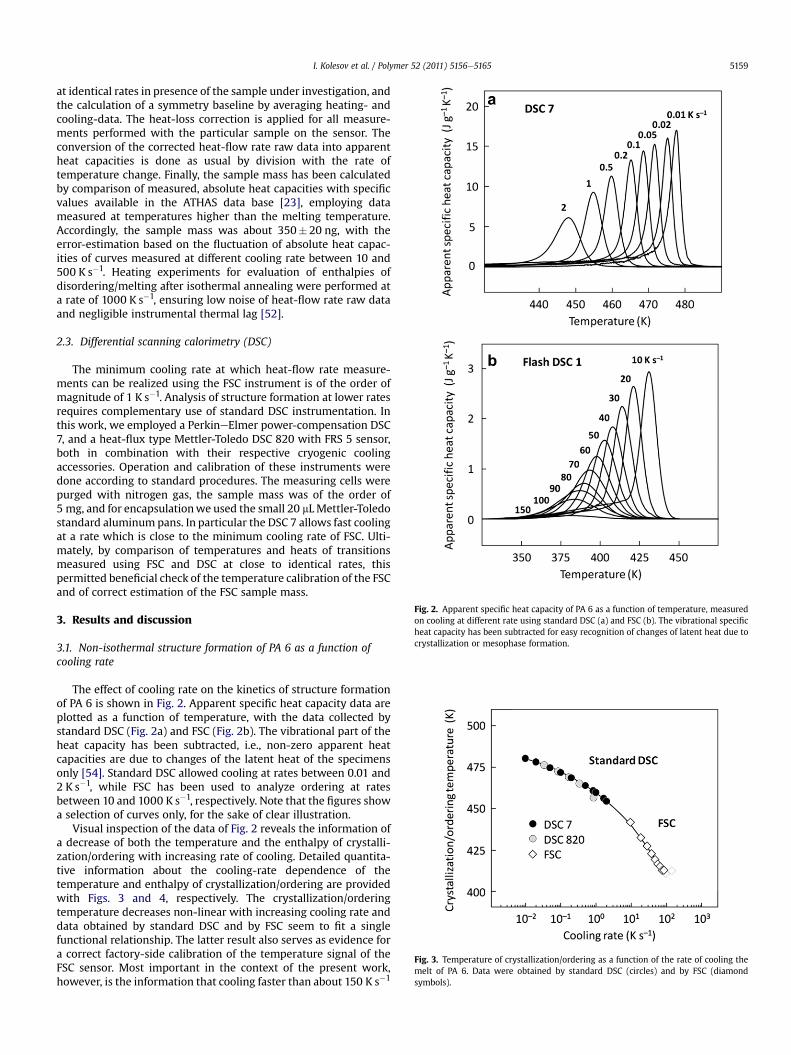
Fig. 2. Apparent specific heat capacity of PA 6 as a function of temperature, measuredon cooling at different rate using standard DSC (a) and FSC (b). The vibrational specificheat capacity has been subtracted for easy recognition of changes of latent heat due tocrystallization or mesophase formation.
Fig. 3. Temperature of crystallization/ordering as a function of the rate of cooling themelt of PA 6. Data were obtained by standard DSC (circles) and by FSC (diamondsymbols).
I. Kolesov et al. / Polymer 52 (2011) 5156e5165 5159
at identical rates in presence of the sample under investigation, andthe calculation of a symmetry baseline by averaging heating- andcooling-data. The heat-loss correction is applied for all measure-ments performed with the particular sample on the sensor. Theconversion of the corrected heat-flow rate raw data into apparentheat capacities is done as usual by division with the rate oftemperature change. Finally, the sample mass has been calculatedby comparison of measured, absolute heat capacities with specificvalues available in the ATHAS data base [23], employing datameasured at temperatures higher than the melting temperature.Accordingly, the sample mass was about 350� 20 ng, with theerror-estimation based on the fluctuation of absolute heat capac-ities of curves measured at different cooling rate between 10 and500 K s�1. Heating experiments for evaluation of enthalpies ofdisordering/melting after isothermal annealing were performed ata rate of 1000 K s�1, ensuring low noise of heat-flow rate raw dataand negligible instrumental thermal lag [52].
2.3. Differential scanning calorimetry (DSC)
The minimum cooling rate at which heat-flow rate measure-ments can be realized using the FSC instrument is of the order ofmagnitude of 1 K s�1. Analysis of structure formation at lower ratesrequires complementary use of standard DSC instrumentation. Inthis work, we employed a PerkineElmer power-compensation DSC7, and a heat-flux type Mettler-Toledo DSC 820 with FRS 5 sensor,both in combination with their respective cryogenic coolingaccessories. Operation and calibration of these instruments weredone according to standard procedures. The measuring cells werepurged with nitrogen gas, the sample mass was of the order of5 mg, and for encapsulationwe used the small 20 mLMettler-Toledostandard aluminum pans. In particular the DSC 7 allows fast coolingat a rate which is close to the minimum cooling rate of FSC. Ulti-mately, by comparison of temperatures and heats of transitionsmeasured using FSC and DSC at close to identical rates, thispermitted beneficial check of the temperature calibration of the FSCand of correct estimation of the FSC sample mass.
3. Results and discussion
3.1. Non-isothermal structure formation of PA 6 as a function ofcooling rate
The effect of cooling rate on the kinetics of structure formationof PA 6 is shown in Fig. 2. Apparent specific heat capacity data areplotted as a function of temperature, with the data collected bystandard DSC (Fig. 2a) and FSC (Fig. 2b). The vibrational part of theheat capacity has been subtracted, i.e., non-zero apparent heatcapacities are due to changes of the latent heat of the specimensonly [54]. Standard DSC allowed cooling at rates between 0.01 and2 K s�1, while FSC has been used to analyze ordering at ratesbetween 10 and 1000 K s�1, respectively. Note that the figures showa selection of curves only, for the sake of clear illustration.
Visual inspection of the data of Fig. 2 reveals the information ofa decrease of both the temperature and the enthalpy of crystalli-zation/ordering with increasing rate of cooling. Detailed quantita-tive information about the cooling-rate dependence of thetemperature and enthalpy of crystallization/ordering are providedwith Figs. 3 and 4, respectively. The crystallization/orderingtemperature decreases non-linear with increasing cooling rate anddata obtained by standard DSC and by FSC seem to fit a singlefunctional relationship. The latter result also serves as evidence fora correct factory-side calibration of the temperature signal of theFSC sensor. Most important in the context of the present work,however, is the information that cooling faster than about 150 K s�1
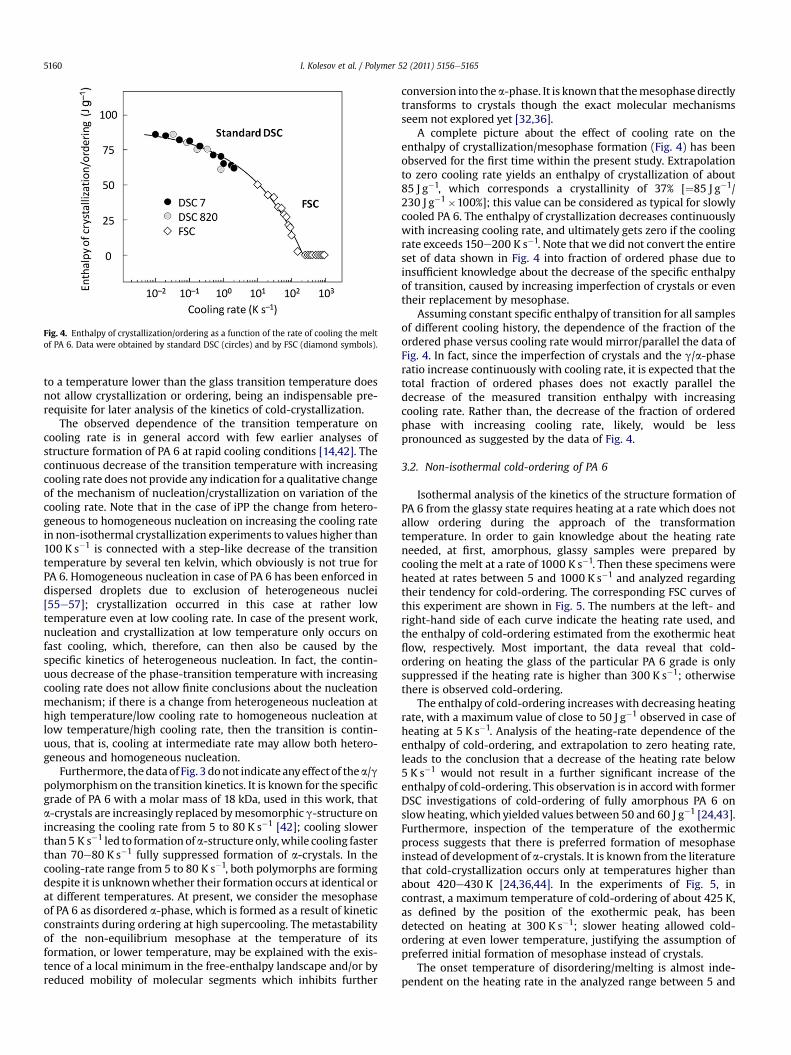
Fig. 4. Enthalpy of crystallization/ordering as a function of the rate of cooling the meltof PA 6. Data were obtained by standard DSC (circles) and by FSC (diamond symbols).
I. Kolesov et al. / Polymer 52 (2011) 5156e51655160
to a temperature lower than the glass transition temperature doesnot allow crystallization or ordering, being an indispensable pre-requisite for later analysis of the kinetics of cold-crystallization.
The observed dependence of the transition temperature oncooling rate is in general accord with few earlier analyses ofstructure formation of PA 6 at rapid cooling conditions [14,42]. Thecontinuous decrease of the transition temperature with increasingcooling rate does not provide any indication for a qualitative changeof the mechanism of nucleation/crystallization on variation of thecooling rate. Note that in the case of iPP the change from hetero-geneous to homogeneous nucleation on increasing the cooling ratein non-isothermal crystallization experiments to values higher than100 K s�1 is connected with a step-like decrease of the transitiontemperature by several ten kelvin, which obviously is not true forPA 6. Homogeneous nucleation in case of PA 6 has been enforced indispersed droplets due to exclusion of heterogeneous nuclei[55e57]; crystallization occurred in this case at rather lowtemperature even at low cooling rate. In case of the present work,nucleation and crystallization at low temperature only occurs onfast cooling, which, therefore, can then also be caused by thespecific kinetics of heterogeneous nucleation. In fact, the contin-uous decrease of the phase-transition temperature with increasingcooling rate does not allow finite conclusions about the nucleationmechanism; if there is a change from heterogeneous nucleation athigh temperature/low cooling rate to homogeneous nucleation atlow temperature/high cooling rate, then the transition is contin-uous, that is, cooling at intermediate rate may allow both hetero-geneous and homogeneous nucleation.
Furthermore, thedata of Fig. 3 donot indicate anyeffectof thea/gpolymorphism on the transition kinetics. It is known for the specificgrade of PA 6 with a molar mass of 18 kDa, used in this work, thata-crystals are increasingly replaced bymesomorphic g-structure onincreasing the cooling rate from 5 to 80 K s�1 [42]; cooling slowerthan5 K s�1 led to formation ofa-structureonly,while cooling fasterthan 70e80 K s�1 fully suppressed formation of a-crystals. In thecooling-rate range from 5 to 80 K s�1, both polymorphs are formingdespite it is unknownwhether their formation occurs at identical orat different temperatures. At present, we consider the mesophaseof PA 6 as disordered a-phase, which is formed as a result of kineticconstraints during ordering at high supercooling. The metastabilityof the non-equilibrium mesophase at the temperature of itsformation, or lower temperature, may be explained with the exis-tence of a local minimum in the free-enthalpy landscape and/or byreduced mobility of molecular segments which inhibits further
conversion into the a-phase. It is known that themesophase directlytransforms to crystals though the exact molecular mechanismsseem not explored yet [32,36].
A complete picture about the effect of cooling rate on theenthalpy of crystallization/mesophase formation (Fig. 4) has beenobserved for the first time within the present study. Extrapolationto zero cooling rate yields an enthalpy of crystallization of about85 J g�1, which corresponds a crystallinity of 37% [¼85 J g�1/230 J g�1�100%]; this value can be considered as typical for slowlycooled PA 6. The enthalpy of crystallization decreases continuouslywith increasing cooling rate, and ultimately gets zero if the coolingrate exceeds 150e200 K s�1. Note that we did not convert the entireset of data shown in Fig. 4 into fraction of ordered phase due toinsufficient knowledge about the decrease of the specific enthalpyof transition, caused by increasing imperfection of crystals or eventheir replacement by mesophase.
Assuming constant specific enthalpy of transition for all samplesof different cooling history, the dependence of the fraction of theordered phase versus cooling rate would mirror/parallel the data ofFig. 4. In fact, since the imperfection of crystals and the g/a-phaseratio increase continuously with cooling rate, it is expected that thetotal fraction of ordered phases does not exactly parallel thedecrease of the measured transition enthalpy with increasingcooling rate. Rather than, the decrease of the fraction of orderedphase with increasing cooling rate, likely, would be lesspronounced as suggested by the data of Fig. 4.
3.2. Non-isothermal cold-ordering of PA 6
Isothermal analysis of the kinetics of the structure formation ofPA 6 from the glassy state requires heating at a rate which does notallow ordering during the approach of the transformationtemperature. In order to gain knowledge about the heating rateneeded, at first, amorphous, glassy samples were prepared bycooling the melt at a rate of 1000 K s�1. Then these specimens wereheated at rates between 5 and 1000 K s�1 and analyzed regardingtheir tendency for cold-ordering. The corresponding FSC curves ofthis experiment are shown in Fig. 5. The numbers at the left- andright-hand side of each curve indicate the heating rate used, andthe enthalpy of cold-ordering estimated from the exothermic heatflow, respectively. Most important, the data reveal that cold-ordering on heating the glass of the particular PA 6 grade is onlysuppressed if the heating rate is higher than 300 K s�1; otherwisethere is observed cold-ordering.
The enthalpy of cold-ordering increases with decreasing heatingrate, with a maximum value of close to 50 J g�1 observed in case ofheating at 5 K s�1. Analysis of the heating-rate dependence of theenthalpy of cold-ordering, and extrapolation to zero heating rate,leads to the conclusion that a decrease of the heating rate below5 K s�1 would not result in a further significant increase of theenthalpy of cold-ordering. This observation is in accordwith formerDSC investigations of cold-ordering of fully amorphous PA 6 onslowheating, which yielded values between 50 and 60 J g�1 [24,43].Furthermore, inspection of the temperature of the exothermicprocess suggests that there is preferred formation of mesophaseinstead of development of a-crystals. It is known from the literaturethat cold-crystallization occurs only at temperatures higher thanabout 420e430 K [24,36,44]. In the experiments of Fig. 5, incontrast, a maximum temperature of cold-ordering of about 425 K,as defined by the position of the exothermic peak, has beendetected on heating at 300 K s�1; slower heating allowed cold-ordering at even lower temperature, justifying the assumption ofpreferred initial formation of mesophase instead of crystals.
The onset temperature of disordering/melting is almost inde-pendent on the heating rate in the analyzed range between 5 and
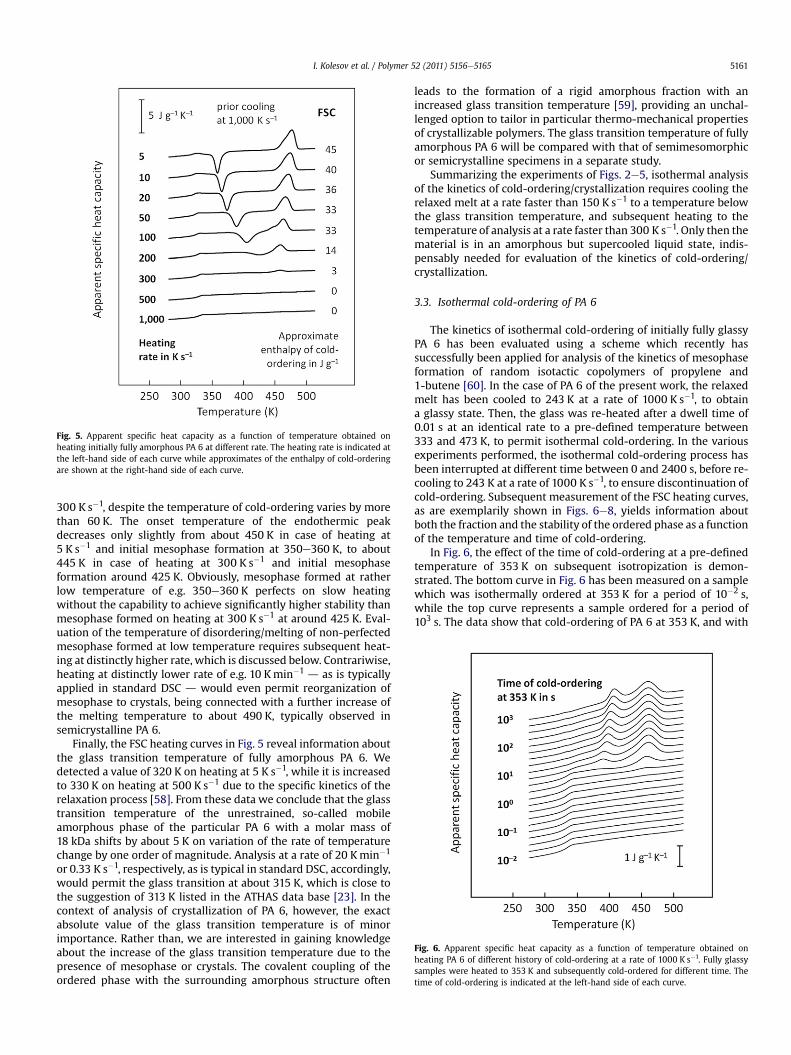
Fig. 6. Apparent specific heat capacity as a function of temperature obtained onheating PA 6 of different history of cold-ordering at a rate of 1000 K s�1. Fully glassysamples were heated to 353 K and subsequently cold-ordered for different time. Thetime of cold-ordering is indicated at the left-hand side of each curve.
Fig. 5. Apparent specific heat capacity as a function of temperature obtained onheating initially fully amorphous PA 6 at different rate. The heating rate is indicated atthe left-hand side of each curve while approximates of the enthalpy of cold-orderingare shown at the right-hand side of each curve.
I. Kolesov et al. / Polymer 52 (2011) 5156e5165 5161
300 K s�1, despite the temperature of cold-ordering varies by morethan 60 K. The onset temperature of the endothermic peakdecreases only slightly from about 450 K in case of heating at5 K s�1 and initial mesophase formation at 350e360 K, to about445 K in case of heating at 300 K s�1 and initial mesophaseformation around 425 K. Obviously, mesophase formed at ratherlow temperature of e.g. 350e360 K perfects on slow heatingwithout the capability to achieve significantly higher stability thanmesophase formed on heating at 300 K s�1 at around 425 K. Eval-uation of the temperature of disordering/melting of non-perfectedmesophase formed at low temperature requires subsequent heat-ing at distinctly higher rate, which is discussed below. Contrariwise,heating at distinctly lower rate of e.g. 10 Kmin�1 d as is typicallyapplied in standard DSC d would even permit reorganization ofmesophase to crystals, being connected with a further increase ofthe melting temperature to about 490 K, typically observed insemicrystalline PA 6.
Finally, the FSC heating curves in Fig. 5 reveal information aboutthe glass transition temperature of fully amorphous PA 6. Wedetected a value of 320 K on heating at 5 K s�1, while it is increasedto 330 K on heating at 500 K s�1 due to the specific kinetics of therelaxation process [58]. From these data we conclude that the glasstransition temperature of the unrestrained, so-called mobileamorphous phase of the particular PA 6 with a molar mass of18 kDa shifts by about 5 K on variation of the rate of temperaturechange by one order of magnitude. Analysis at a rate of 20 Kmin�1
or 0.33 K s�1, respectively, as is typical in standard DSC, accordingly,would permit the glass transition at about 315 K, which is close tothe suggestion of 313 K listed in the ATHAS data base [23]. In thecontext of analysis of crystallization of PA 6, however, the exactabsolute value of the glass transition temperature is of minorimportance. Rather than, we are interested in gaining knowledgeabout the increase of the glass transition temperature due to thepresence of mesophase or crystals. The covalent coupling of theordered phase with the surrounding amorphous structure often
leads to the formation of a rigid amorphous fraction with anincreased glass transition temperature [59], providing an unchal-lenged option to tailor in particular thermo-mechanical propertiesof crystallizable polymers. The glass transition temperature of fullyamorphous PA 6 will be compared with that of semimesomorphicor semicrystalline specimens in a separate study.
Summarizing the experiments of Figs. 2e5, isothermal analysisof the kinetics of cold-ordering/crystallization requires cooling therelaxed melt at a rate faster than 150 K s�1 to a temperature belowthe glass transition temperature, and subsequent heating to thetemperature of analysis at a rate faster than 300 K s�1. Only then thematerial is in an amorphous but supercooled liquid state, indis-pensably needed for evaluation of the kinetics of cold-ordering/crystallization.
3.3. Isothermal cold-ordering of PA 6
The kinetics of isothermal cold-ordering of initially fully glassyPA 6 has been evaluated using a scheme which recently hassuccessfully been applied for analysis of the kinetics of mesophaseformation of random isotactic copolymers of propylene and1-butene [60]. In the case of PA 6 of the present work, the relaxedmelt has been cooled to 243 K at a rate of 1000 K s�1, to obtaina glassy state. Then, the glass was re-heated after a dwell time of0.01 s at an identical rate to a pre-defined temperature between333 and 473 K, to permit isothermal cold-ordering. In the variousexperiments performed, the isothermal cold-ordering process hasbeen interrupted at different time between 0 and 2400 s, before re-cooling to 243 K at a rate of 1000 K s�1, to ensure discontinuation ofcold-ordering. Subsequent measurement of the FSC heating curves,as are exemplarily shown in Figs. 6e8, yields information aboutboth the fraction and the stability of the ordered phase as a functionof the temperature and time of cold-ordering.
In Fig. 6, the effect of the time of cold-ordering at a pre-definedtemperature of 353 K on subsequent isotropization is demon-strated. The bottom curve in Fig. 6 has been measured on a samplewhich was isothermally ordered at 353 K for a period of 10�2 s,while the top curve represents a sample ordered for a period of103 s. The data show that cold-ordering of PA 6 at 353 K, and with
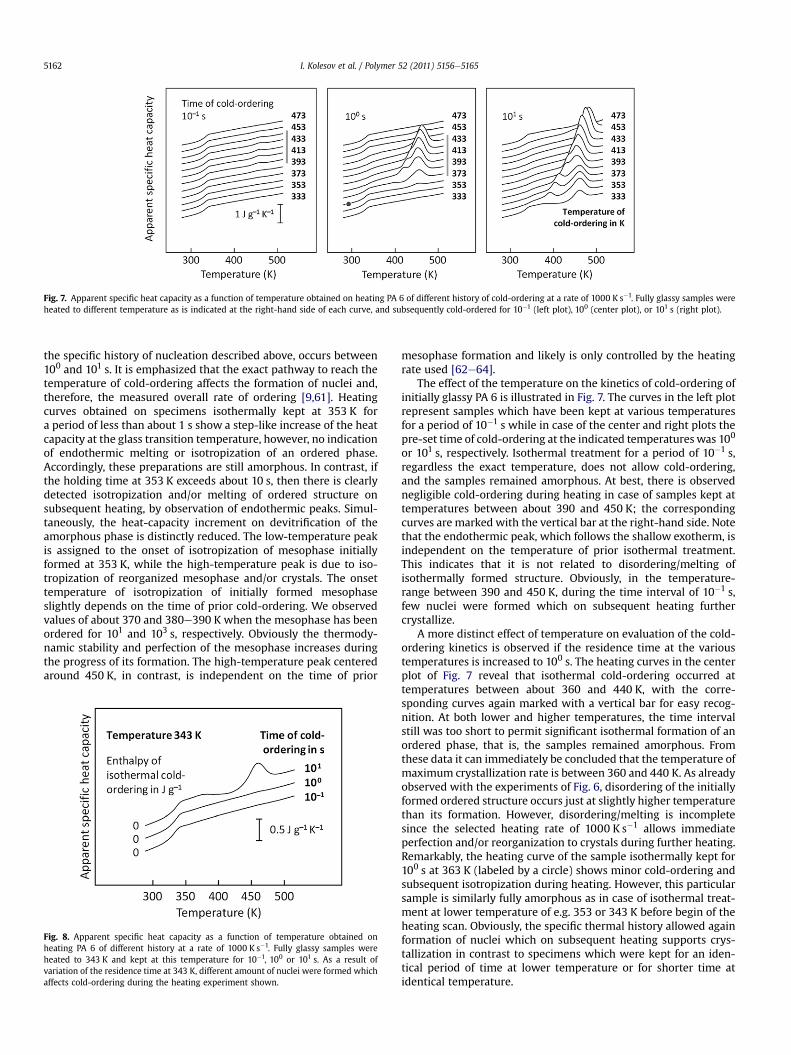
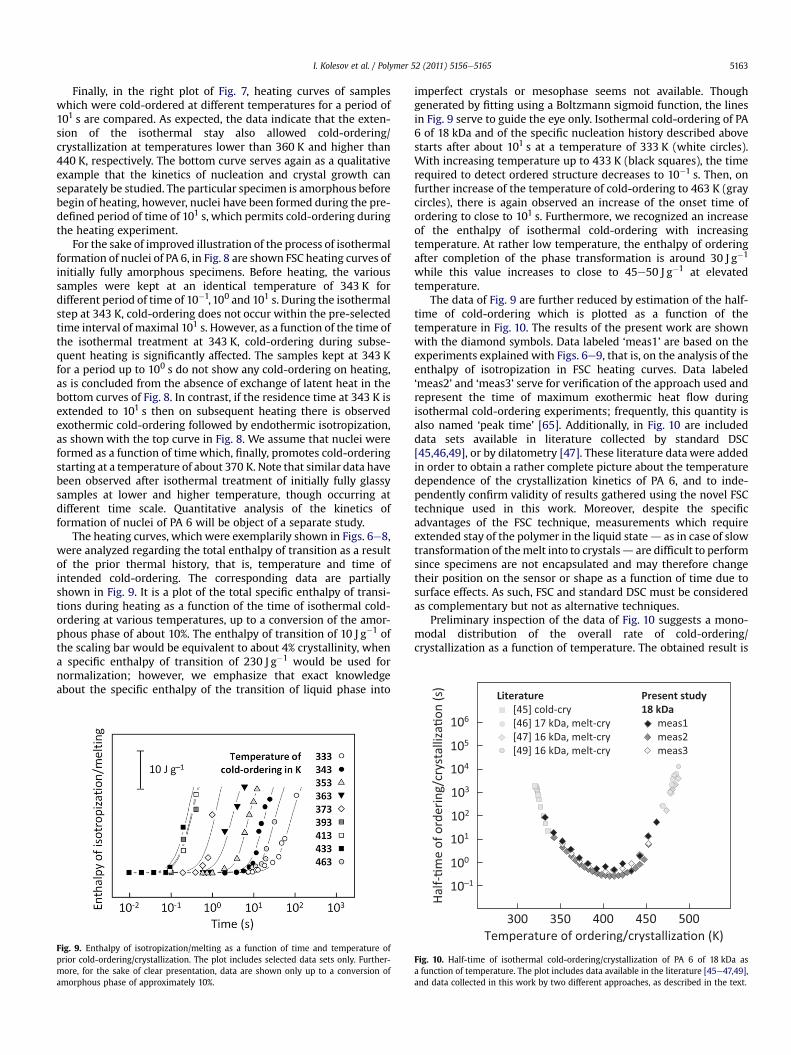
Fig. 7. Apparent specific heat capacity as a function of temperature obtained on heating PA 6 of different history of cold-ordering at a rate of 1000 K s�1. Fully glassy samples wereheated to different temperature as is indicated at the right-hand side of each curve, and subsequently cold-ordered for 10�1 (left plot), 100 (center plot), or 101 s (right plot).
I. Kolesov et al. / Polymer 52 (2011) 5156e51655162
the specific history of nucleation described above, occurs between100 and 101 s. It is emphasized that the exact pathway to reach thetemperature of cold-ordering affects the formation of nuclei and,therefore, the measured overall rate of ordering [9,61]. Heatingcurves obtained on specimens isothermally kept at 353 K fora period of less than about 1 s show a step-like increase of the heatcapacity at the glass transition temperature, however, no indicationof endothermic melting or isotropization of an ordered phase.Accordingly, these preparations are still amorphous. In contrast, ifthe holding time at 353 K exceeds about 10 s, then there is clearlydetected isotropization and/or melting of ordered structure onsubsequent heating, by observation of endothermic peaks. Simul-taneously, the heat-capacity increment on devitrification of theamorphous phase is distinctly reduced. The low-temperature peakis assigned to the onset of isotropization of mesophase initiallyformed at 353 K, while the high-temperature peak is due to iso-tropization of reorganized mesophase and/or crystals. The onsettemperature of isotropization of initially formed mesophaseslightly depends on the time of prior cold-ordering. We observedvalues of about 370 and 380e390 K when the mesophase has beenordered for 101 and 103 s, respectively. Obviously the thermody-namic stability and perfection of the mesophase increases duringthe progress of its formation. The high-temperature peak centeredaround 450 K, in contrast, is independent on the time of prior
Fig. 8. Apparent specific heat capacity as a function of temperature obtained onheating PA 6 of different history at a rate of 1000 K s�1. Fully glassy samples wereheated to 343 K and kept at this temperature for 10�1, 100 or 101 s. As a result ofvariation of the residence time at 343 K, different amount of nuclei were formed whichaffects cold-ordering during the heating experiment shown.
mesophase formation and likely is only controlled by the heatingrate used [62e64].
The effect of the temperature on the kinetics of cold-ordering ofinitially glassy PA 6 is illustrated in Fig. 7. The curves in the left plotrepresent samples which have been kept at various temperaturesfor a period of 10�1 s while in case of the center and right plots thepre-set time of cold-ordering at the indicated temperatureswas 100
or 101 s, respectively. Isothermal treatment for a period of 10�1 s,regardless the exact temperature, does not allow cold-ordering,and the samples remained amorphous. At best, there is observednegligible cold-ordering during heating in case of samples kept attemperatures between about 390 and 450 K; the correspondingcurves are marked with the vertical bar at the right-hand side. Notethat the endothermic peak, which follows the shallow exotherm, isindependent on the temperature of prior isothermal treatment.This indicates that it is not related to disordering/melting ofisothermally formed structure. Obviously, in the temperature-range between 390 and 450 K, during the time interval of 10�1 s,few nuclei were formed which on subsequent heating furthercrystallize.
A more distinct effect of temperature on evaluation of the cold-ordering kinetics is observed if the residence time at the varioustemperatures is increased to 100 s. The heating curves in the centerplot of Fig. 7 reveal that isothermal cold-ordering occurred attemperatures between about 360 and 440 K, with the corre-sponding curves again marked with a vertical bar for easy recog-nition. At both lower and higher temperatures, the time intervalstill was too short to permit significant isothermal formation of anordered phase, that is, the samples remained amorphous. Fromthese data it can immediately be concluded that the temperature ofmaximum crystallization rate is between 360 and 440 K. As alreadyobserved with the experiments of Fig. 6, disordering of the initiallyformed ordered structure occurs just at slightly higher temperaturethan its formation. However, disordering/melting is incompletesince the selected heating rate of 1000 K s�1 allows immediateperfection and/or reorganization to crystals during further heating.Remarkably, the heating curve of the sample isothermally kept for100 s at 363 K (labeled by a circle) shows minor cold-ordering andsubsequent isotropization during heating. However, this particularsample is similarly fully amorphous as in case of isothermal treat-ment at lower temperature of e.g. 353 or 343 K before begin of theheating scan. Obviously, the specific thermal history allowed againformation of nuclei which on subsequent heating supports crys-tallization in contrast to specimens which were kept for an iden-tical period of time at lower temperature or for shorter time atidentical temperature.
I. Kolesov et al. / Polymer 52 (2011) 5156e5165 5163
Finally, in the right plot of Fig. 7, heating curves of sampleswhich were cold-ordered at different temperatures for a period of101 s are compared. As expected, the data indicate that the exten-sion of the isothermal stay also allowed cold-ordering/crystallization at temperatures lower than 360 K and higher than440 K, respectively. The bottom curve serves again as a qualitativeexample that the kinetics of nucleation and crystal growth canseparately be studied. The particular specimen is amorphous beforebegin of heating, however, nuclei have been formed during the pre-defined period of time of 101 s, which permits cold-ordering duringthe heating experiment.
For the sake of improved illustration of the process of isothermalformation of nuclei of PA 6, in Fig. 8 are shown FSC heating curves ofinitially fully amorphous specimens. Before heating, the varioussamples were kept at an identical temperature of 343 K fordifferent period of time of 10�1,100 and 101 s. During the isothermalstep at 343 K, cold-ordering does not occur within the pre-selectedtime interval of maximal 101 s. However, as a function of the time ofthe isothermal treatment at 343 K, cold-ordering during subse-quent heating is significantly affected. The samples kept at 343 Kfor a period up to 100 s do not show any cold-ordering on heating,as is concluded from the absence of exchange of latent heat in thebottom curves of Fig. 8. In contrast, if the residence time at 343 K isextended to 101 s then on subsequent heating there is observedexothermic cold-ordering followed by endothermic isotropization,as shown with the top curve in Fig. 8. We assume that nuclei wereformed as a function of time which, finally, promotes cold-orderingstarting at a temperature of about 370 K. Note that similar data havebeen observed after isothermal treatment of initially fully glassysamples at lower and higher temperature, though occurring atdifferent time scale. Quantitative analysis of the kinetics offormation of nuclei of PA 6 will be object of a separate study.
The heating curves, which were exemplarily shown in Figs. 6e8,were analyzed regarding the total enthalpy of transition as a resultof the prior thermal history, that is, temperature and time ofintended cold-ordering. The corresponding data are partiallyshown in Fig. 9. It is a plot of the total specific enthalpy of transi-tions during heating as a function of the time of isothermal cold-ordering at various temperatures, up to a conversion of the amor-phous phase of about 10%. The enthalpy of transition of 10 J g�1 ofthe scaling bar would be equivalent to about 4% crystallinity, whena specific enthalpy of transition of 230 J g�1 would be used fornormalization; however, we emphasize that exact knowledgeabout the specific enthalpy of the transition of liquid phase into
Fig. 9. Enthalpy of isotropization/melting as a function of time and temperature ofprior cold-ordering/crystallization. The plot includes selected data sets only. Further-more, for the sake of clear presentation, data are shown only up to a conversion ofamorphous phase of approximately 10%.
imperfect crystals or mesophase seems not available. Thoughgenerated by fitting using a Boltzmann sigmoid function, the linesin Fig. 9 serve to guide the eye only. Isothermal cold-ordering of PA6 of 18 kDa and of the specific nucleation history described abovestarts after about 101 s at a temperature of 333 K (white circles).With increasing temperature up to 433 K (black squares), the timerequired to detect ordered structure decreases to 10�1 s. Then, onfurther increase of the temperature of cold-ordering to 463 K (graycircles), there is again observed an increase of the onset time ofordering to close to 101 s. Furthermore, we recognized an increaseof the enthalpy of isothermal cold-ordering with increasingtemperature. At rather low temperature, the enthalpy of orderingafter completion of the phase transformation is around 30 J g�1
while this value increases to close to 45e50 J g�1 at elevatedtemperature.
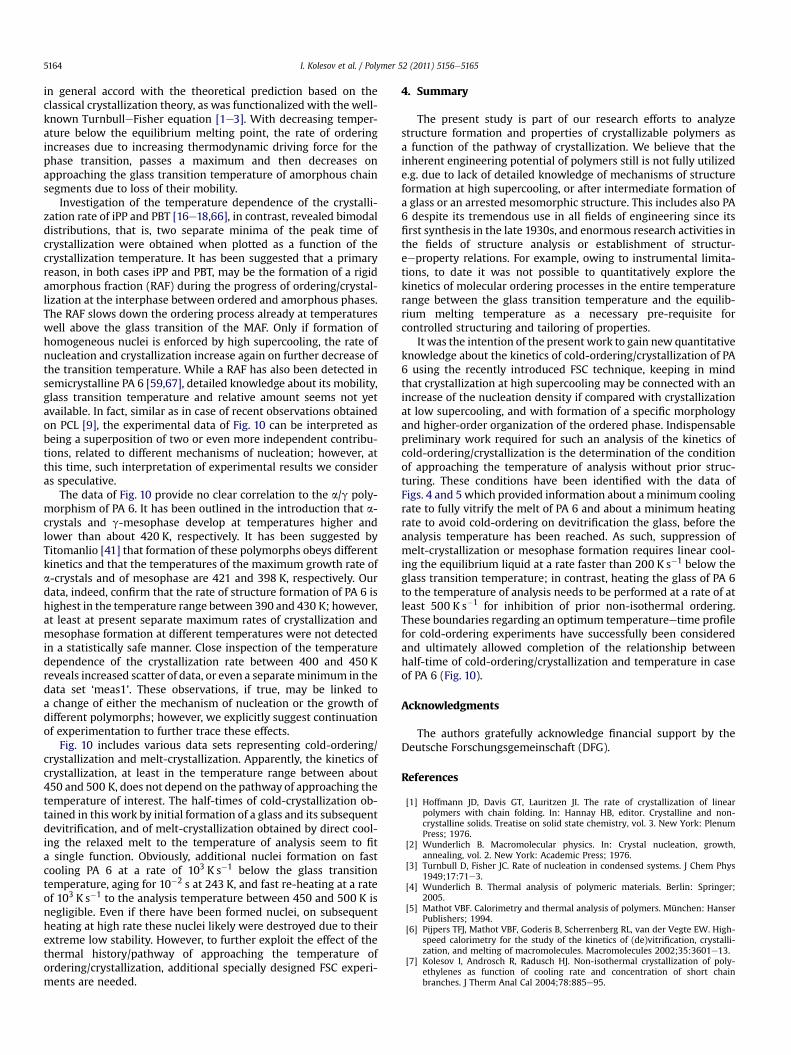
The data of Fig. 9 are further reduced by estimation of the half-time of cold-ordering which is plotted as a function of thetemperature in Fig. 10. The results of the present work are shownwith the diamond symbols. Data labeled ‘meas1’ are based on theexperiments explained with Figs. 6e9, that is, on the analysis of theenthalpy of isotropization in FSC heating curves. Data labeled‘meas2’ and ‘meas3’ serve for verification of the approach used andrepresent the time of maximum exothermic heat flow duringisothermal cold-ordering experiments; frequently, this quantity isalso named ‘peak time’ [65]. Additionally, in Fig. 10 are includeddata sets available in literature collected by standard DSC[45,46,49], or by dilatometry [47]. These literature data were addedin order to obtain a rather complete picture about the temperaturedependence of the crystallization kinetics of PA 6, and to inde-pendently confirm validity of results gathered using the novel FSCtechnique used in this work. Moreover, despite the specificadvantages of the FSC technique, measurements which requireextended stay of the polymer in the liquid stated as in case of slowtransformation of themelt into to crystalsd are difficult to performsince specimens are not encapsulated and may therefore changetheir position on the sensor or shape as a function of time due tosurface effects. As such, FSC and standard DSC must be consideredas complementary but not as alternative techniques.
Preliminary inspection of the data of Fig. 10 suggests a mono-modal distribution of the overall rate of cold-ordering/crystallization as a function of temperature. The obtained result is
Fig. 10. Half-time of isothermal cold-ordering/crystallization of PA 6 of 18 kDa asa function of temperature. The plot includes data available in the literature [45e47,49],and data collected in this work by two different approaches, as described in the text.
I. Kolesov et al. / Polymer 52 (2011) 5156e51655164
in general accord with the theoretical prediction based on theclassical crystallization theory, as was functionalized with the well-known TurnbulleFisher equation [1e3]. With decreasing temper-ature below the equilibrium melting point, the rate of orderingincreases due to increasing thermodynamic driving force for thephase transition, passes a maximum and then decreases onapproaching the glass transition temperature of amorphous chainsegments due to loss of their mobility.
Investigation of the temperature dependence of the crystalli-zation rate of iPP and PBT [16e18,66], in contrast, revealed bimodaldistributions, that is, two separate minima of the peak time ofcrystallization were obtained when plotted as a function of thecrystallization temperature. It has been suggested that a primaryreason, in both cases iPP and PBT, may be the formation of a rigidamorphous fraction (RAF) during the progress of ordering/crystal-lization at the interphase between ordered and amorphous phases.The RAF slows down the ordering process already at temperatureswell above the glass transition of the MAF. Only if formation ofhomogeneous nuclei is enforced by high supercooling, the rate ofnucleation and crystallization increase again on further decrease ofthe transition temperature. While a RAF has also been detected insemicrystalline PA 6 [59,67], detailed knowledge about its mobility,glass transition temperature and relative amount seems not yetavailable. In fact, similar as in case of recent observations obtainedon PCL [9], the experimental data of Fig. 10 can be interpreted asbeing a superposition of two or even more independent contribu-tions, related to different mechanisms of nucleation; however, atthis time, such interpretation of experimental results we consideras speculative.
The data of Fig. 10 provide no clear correlation to the a/g poly-morphism of PA 6. It has been outlined in the introduction that a-crystals and g-mesophase develop at temperatures higher andlower than about 420 K, respectively. It has been suggested byTitomanlio [41] that formation of these polymorphs obeys differentkinetics and that the temperatures of the maximum growth rate ofa-crystals and of mesophase are 421 and 398 K, respectively. Ourdata, indeed, confirm that the rate of structure formation of PA 6 ishighest in the temperature range between 390 and 430 K; however,at least at present separate maximum rates of crystallization andmesophase formation at different temperatures were not detectedin a statistically safe manner. Close inspection of the temperaturedependence of the crystallization rate between 400 and 450 Kreveals increased scatter of data, or even a separateminimum in thedata set ‘meas1’. These observations, if true, may be linked toa change of either the mechanism of nucleation or the growth ofdifferent polymorphs; however, we explicitly suggest continuationof experimentation to further trace these effects.
Fig. 10 includes various data sets representing cold-ordering/crystallization and melt-crystallization. Apparently, the kinetics ofcrystallization, at least in the temperature range between about450 and 500 K, does not depend on the pathway of approaching thetemperature of interest. The half-times of cold-crystallization ob-tained in this work by initial formation of a glass and its subsequentdevitrification, and of melt-crystallization obtained by direct cool-ing the relaxed melt to the temperature of analysis seem to fita single function. Obviously, additional nuclei formation on fastcooling PA 6 at a rate of 103 K s�1 below the glass transitiontemperature, aging for 10�2 s at 243 K, and fast re-heating at a rateof 103 K s�1 to the analysis temperature between 450 and 500 K isnegligible. Even if there have been formed nuclei, on subsequentheating at high rate these nuclei likely were destroyed due to theirextreme low stability. However, to further exploit the effect of thethermal history/pathway of approaching the temperature ofordering/crystallization, additional specially designed FSC experi-ments are needed.
4. Summary
The present study is part of our research efforts to analyzestructure formation and properties of crystallizable polymers asa function of the pathway of crystallization. We believe that theinherent engineering potential of polymers still is not fully utilizede.g. due to lack of detailed knowledge of mechanisms of structureformation at high supercooling, or after intermediate formation ofa glass or an arrested mesomorphic structure. This includes also PA6 despite its tremendous use in all fields of engineering since itsfirst synthesis in the late 1930s, and enormous research activities inthe fields of structure analysis or establishment of structur-eeproperty relations. For example, owing to instrumental limita-tions, to date it was not possible to quantitatively explore thekinetics of molecular ordering processes in the entire temperaturerange between the glass transition temperature and the equilib-rium melting temperature as a necessary pre-requisite forcontrolled structuring and tailoring of properties.
It was the intention of the present work to gain new quantitativeknowledge about the kinetics of cold-ordering/crystallization of PA6 using the recently introduced FSC technique, keeping in mindthat crystallization at high supercooling may be connected with anincrease of the nucleation density if compared with crystallizationat low supercooling, and with formation of a specific morphologyand higher-order organization of the ordered phase. Indispensablepreliminary work required for such an analysis of the kinetics ofcold-ordering/crystallization is the determination of the conditionof approaching the temperature of analysis without prior struc-turing. These conditions have been identified with the data ofFigs. 4 and 5 which provided information about a minimum coolingrate to fully vitrify the melt of PA 6 and about a minimum heatingrate to avoid cold-ordering on devitrification the glass, before theanalysis temperature has been reached. As such, suppression ofmelt-crystallization or mesophase formation requires linear cool-ing the equilibrium liquid at a rate faster than 200 K s�1 below theglass transition temperature; in contrast, heating the glass of PA 6to the temperature of analysis needs to be performed at a rate of atleast 500 K s�1 for inhibition of prior non-isothermal ordering.These boundaries regarding an optimum temperatureetime profilefor cold-ordering experiments have successfully been consideredand ultimately allowed completion of the relationship betweenhalf-time of cold-ordering/crystallization and temperature in caseof PA 6 (Fig. 10).
Acknowledgments
The authors gratefully acknowledge financial support by theDeutsche Forschungsgemeinschaft (DFG).
References
[1] Hoffmann JD, Davis GT, Lauritzen JI. The rate of crystallization of linearpolymers with chain folding. In: Hannay HB, editor. Crystalline and non-crystalline solids. Treatise on solid state chemistry, vol. 3. New York: PlenumPress; 1976.
[2] Wunderlich B. Macromolecular physics. In: Crystal nucleation, growth,annealing, vol. 2. New York: Academic Press; 1976.
[3] Turnbull D, Fisher JC. Rate of nucleation in condensed systems. J Chem Phys1949;17:71e3.
[4] Wunderlich B. Thermal analysis of polymeric materials. Berlin: Springer;2005.
[5] Mathot VBF. Calorimetry and thermal analysis of polymers. München: HanserPublishers; 1994.
[6] Pijpers TFJ, Mathot VBF, Goderis B, Scherrenberg RL, van der Vegte EW. High-speed calorimetry for the study of the kinetics of (de)vitrification, crystalli-zation, and melting of macromolecules. Macromolecules 2002;35:3601e13.
[7] Kolesov I, Androsch R, Radusch HJ. Non-isothermal crystallization of poly-ethylenes as function of cooling rate and concentration of short chainbranches. J Therm Anal Cal 2004;78:885e95.
I. Kolesov et al. / Polymer 52 (2011) 5156e5165 5165
[8] Lam R, Geil PH. Amorphous linear polyethylene: annealing effects. J MacromolSci Phys 1981;B20:37e58.
[9] Zhuravlev E, Schmelzer JWP, Wunderlich B, Schick C. Kinetics of nucleationand crystallization in poly( 3-caprolactone). Polymer 2011;52:1983e97.
[10] Ding Z, Spruiell JE. An experimental method for studying nonisothermalcrystallization of polymers at very high cooling rates. J Polym Sci, Polym Phys1996;34:2783e804.
[11] Brucato V, Piccarolo S, La Carruba V. An experimental methodology to studypolymer crystallization under processing conditions. The influence of highcooling rates. Chem Eng Sci 2002;57:4129e43.
[12] Cavallo D, Azzurri F, Floris R, Alfonso GC, Balzano L, Peters GW. Continuouscooling curves diagrams of propene/ethylene random copolymers. The role ofethylenecounits inmesophasedevelopment.Macromolecules2010;43:2890e6.
[13] Zhuravlev E, Schick C. Fast scanning power compensated differential scanningnano-calorimeter: 1. The device. Thermochim Acta 2010;505:1e13.
[14] Mathot V, Pyda M, Pijpers T, Vanden Poel G, van de Kerkhof E, vanHerwaarden S, et al. The flash DSC 1, a power compensation twin-type, chip-based fast scanning calorimeter (FSC): first findings on polymers. ThermochimActa 2011;522:36e45.
[15] Adamovsky SA, Minakov AA, Schick C. Scanning microcalorimetry at highcooling rate. Thermochim Acta 2003;403:55e63.
[16] Pyda M, Nowak-Pyda E, Heeg J, Huth H, Minakov AA, Di Lorenzo ML, et al.Melting and crystallization of poly(butylene terephthalate) by temperature-modulated and superfast calorimetry. J Polym Sci, Polym Phys 2006;44:1364e77.
[17] De Santis F, Adamovsky S, Titomanlio G, Schick C. Scanning nanocalorimetry athigh cooling rate of isotactic polypropylene. Macromolecules 2006;39:2562e7.
[18] Silvestre C, Cimmino S, Duraccio D, Schick C. Isothermal crystallization ofisotactic poly(propylene) studied by superfast calorimetry. Macromol RapidCommun 2007;28:875e81.
[19] Tol RT, Minakov AA, Adamovsky SA, Mathot VBF, Schick C. Metastability ofpolymer crystallites formed at low temperature studied by ultra fast calo-rimetry: polyamide 6 confined in sub-micrometer droplets vs. bulk PA6.Polymer 2006;47:2172e8.
[20] Roldan LG, Kaufman HS. Crystallization of nylon 6. J Polym Sci, Polym Lett1963;1:603e8.
[21] Holmes DR, Bunn CW, Smith DJ. The crystal structure of polycaproamide:nylon 6. J Polym Sci 1955;17:159e77.
[22] Wunderlich B. Macromolecular physics. In: Crystal melting, vol. 3. New York:Academic Press; 1980.
[23] Advanced Thermal Analysis System e ATHAS. Available in the internet at URL:http://athas.prz.rzeszow.pl.
[24] Illers KH, Haberkorn H. Schmelzverhalten, Struktur, und Kristallinität von 6-Polyamid. Makromol Chem 1971;142:31e67.
[25] Illers KH. Polymorphie, Kristallinität und Schmelzwärme von Poly( 3-capro-lactam). Makromol Chem 1978;179:497e507.
[26] Burnett BB, McDevit WF. Kinetics of spherulite growth in high polymers.J Appl Phys 1957;28:1101e5.
[27] Magill JH. Formation of spherulites in polyamides. IV. Eveneodd polyamidesand poly(u-aminocarboxylic acids). J Polym Sci, Polym Phys 1969;7:123e42.
[28] Galeski A, Argon AS, Cohen RE. Morphology of nylon 6 spherulites in bulk.Makromol Chem 1987;188:1195e204.
[29] Ziabicki A. Über die mesomorphe b-Form von Polycapronamid und ihreUmwandlung in die kristalline Form a. Kolloid-Zeitschrift 1959;167:132e41.
[30] Auriemma F, Petraccone V, Parravicini L, Corradini P. Mesomorphic form (b) ofnylon 6. Macromolecules 1997;30:7554e9.
[31] Simak P. Spektroskopische Untersuchungen der kristallinen Modifikationenvon Polyamid-6. Makromol Chem 1973;28:75e85.
[32] Fichera A, Malta V, Marega C, Zannetti R. Temperature dependence of thepolymorphous phases of nylon 6. Makromol Chem 1988;189:1561e7.
[33] Arimoto H. aeg Transition of nylon 6. J Polym Sci, Part A 1964;2:2283e95.[34] Murthy NS, Hatfield GR, Glans JH. X-ray diffraction and nuclear magnetic
resonance studies of nylon 6/I2/KI complexes and their transformation intothe g crystalline phase. Macromolecules 1990;23:1342e6.
[35] Auriemma F, De Rosa C, Corradini P. Solid mesophases in semicrystallinepolymers: structural analysis by diffraction techniques. Adv Polym Sci 2005;181:1e74.
[36] Androsch R, Stolp M, Radusch HJ. Crystallization of amorphous polyamidesfrom the glassy state. Acta Polymerica 1996;47:99e104.
[37] Inoue M. Nucleating effect on the kinetics of crystallization and the spheru-lites of nylon 6. J Polym Sci, Part A 1963;1:2013e20.
[38] Schaper A, Hirte R, Ruscher C, Hillebrand R, Walenta E. The electron micro-scope characterization of the fine structure of nylon 6: I. The supermolecularstructure in melt-cast, isotropic bulk material. Coll Polym Sci 1986;264:649e58.
[39] Kyotani M, Mitsuhashi S. Studies on crystalline forms of nylon 6. II. Crystal-lization from the melt. J Polym Sci, Part A-2 1972;10:1497e508.
[40] Brucato V, Crippa G, Piccarolo S, Titomanlio G. Crystallization of polymer meltsunder fast cooling. I. Nucleated polyamide 6. Polym Eng Sci 1991;31:1411e6.
[41] Brucato V, Piccarolo S, Titomanlio G. Crystallization kinetics in relation topolymer processing. Macromol Chem, Macromol Symp 1993;68:245e55.
[42] Cavallo D, Gardella L, Alfonso GC, Portale G, Balzano L, Androsch R. Effect ofcooling rate on the crystal/mesophase polymorphism of polyamide 6. ColloidPolym Sci 2011;289:1073e9.
[43] Hendus H, Illers KH, Simak P. Kristallisation von amorphem 6-Polyamid imGlasübergangsbereich. Kolloid-Zeitschr Zeitschr Polym 1969;235:1244e6.
[44] Kyotani M. Studies on crystalline forms of nylon 6. III. Crystallization from theglassy state. J Macromol Sci, Phys 1975;B11:509e25.
[45] Kozlowski W. Kinetics of crystallization of polyamide 6 from the glassy state.J Polym Sci, Part C 1972;38:47e59.
[46] Turska E, Gogolewski S. Study on crystallization of nylon-6 (polycapramide):Part 2. Effect of molecular weight on isothermal crystallization kinetics.Polymer 1971;12:629e41.
[47] Inoue M. Crystallization kinetics of polycapramide. J Polym Sci 1961;55:753e66.
[48] Wlochowicz A, Eder M. The effect of TiO2 on the kinetics of polyamide 6crystallization. Coll Polym Sci 1983;261:621e5.
[49] Fornes TD, Paul DR. Crystallization behavior of nylon 6 nanocomposites.Polymer 2003;44:3945e61.
[50] van Herwaarden S. Micro-sensor for analysis equipment: research and inno-vation. Proc Eng 2010;5:464e7.
[51] Iervolino E, van Herwaarden AW, van Herwaarden FG, van de Kerkhof E, vanGrinsven PPW, Leenaers ACHI, et al. Temperature calibration and electricalcharacterization of the differential scanning calorimeter chip UFS1 for theMettler-Toledo Flash DSC 1. Thermochim Acta 2011;522:53e9.
[52] van Herwaarden S, Iervolino E, van Herwaarden F, Wijffels T, Leenaers A,Mathot V. Design, performance and analysis of thermal lag of the UFS1 twin-calorimeter chip for fast scanning calorimetry using the Mettler-Toledo FlashDSC 1. Thermochim Acta 2011;522:46e52.
[53] Zhuravlev E, Schick C. Fast scanning power compensated differential scanningnano-calorimeter: 2. Heat capacity analysis. Thermochim Acta 2010;505:14e21.
[54] Androsch R, Wunderlich B. Scanning calorimetry. In: Matyjaszeswki K,Gnanou Y, Leibler L, editors. Macromolecular engineering. Precise synthesis,material properties, applications. Structureeproperty correlation and char-acterization techniques, vol. 3. Weinheim: Wiley; 2007.
[55] Tol RT, Mathot VBF, Reynaers H, Goderis B, Groeninckx G. Confined crystal-lization phenomena in immiscible polymer blends with dispersed micro-andnanometer sized PA6 droplets part 4: polymorphous structure and (meta)-stability of PA 6 crystals formed in different temperature regions. Polymer2005;46:2966e77.
[56] Salmerón Sánchez M, Mathot V, Vanden Poel G, Groeninckx G, Bruls W.Crystallization of polyamide confined in sub-micrometer droplets dispersedin a molten polyethylene matrix. J Polym Sci, Polym Phys 2006;44:815e25.
[57] Bose S, Bhattacharyya AR, Kodgire PV, Misra A. Fractionated crystallization inPA6/ABS blends: influence of a reactive compatibilizer and multiwall carbonnanotubes. Polymer 2007;48:356e62.
[58] Donth E. The glass transition, relaxation dynamics in liquids and disorderedmaterials. In: Springer series in materials science, vol. 48. New York: Springer;2001.
[59] Wunderlich B. Reversible crystallization and the rigideamorphous phase insemicrystalline macromolecules. Progr Polym Sci 2003;28:383e450.
[60] Mileva D, Androsch R, Zhuravlev E, Schick C, Wunderlich B. Formation andreorganization of the mesophase of random copolymers of propylene and 1-butene. Polymer 2011;52:1107e15.
[61] Mileva D, Zhuravlev E, Schick C, Androsch R. Effect of ageing the glass ofisotactic polypropylene on cold-crystallization/ordering. In: Proceedings ofthe NATAS annual conference on thermal analysis and applications, DesMoines (IA), August 7e10, 2011.
[62] Minakov AA, Mordvintsev DA, Schick C. Melting and reorganization ofpoly(ethylene terephthalate) on fast heating (1000 K/s). Polymer 2004;45:3755e63.
[63] Minakov AA, Mordvintsev DA, Tol R, Schick C. Melting and reorganization ofthe crystalline fraction and relaxation of the rigid amorphous fraction ofisotactic polystyrene on fast heating (30,000 K/min). Thermochim Acta 2006;442:25e30.
[64] Mileva D, Androsch R, Zhuravlev E, Schick C. Temperature of melting of themesophase of isotactic polypropylene. Macromolecules 2009;42:7275e8.
[65] Androsch R. Melt-crystallization, glass transition and morphology of a (R)-3-hydroxybutyrate pentamer. Eur Polym J 2007;43:93e108.
[66] Androsch R, Di Lorenzo ML, Schick C, Wunderlich B. Mesophases in poly-ethylene, polypropylene, and poly(1-butene). Polymer 2010;51:4639e62.
[67] Chen H, Cebe P. Investigation of the rigid amorphous fraction in nylon-6.J Therm Anal Cal 2007;89:417e25.