Structural Stability, Microbial Biomass and Community Composition of Sediments Affected by the...
13
ENVIRONMENTAL MICROBIOLOGY Structural Stability, Microbial Biomass and Community Composition of Sediments Affected by the Hydric Dynamics of an Urban Stormwater Infiltration Basin Dynamics of Physical and Microbial Characteristics of Stormwater Sediment Anne Laure Badin & Armelle Monier & Laurence Volatier & Roberto A. Geremia & Cécile Delolme & Jean-Philippe Bedell Received: 6 June 2010 / Accepted: 9 February 2011 # Springer Science+Business Media, LLC 2011 Abstract The sedimentary layer deposited at the surface of stormwater infiltration basins is highly organic and multi- contaminated. It undergoes considerable moisture content fluctuations due to the drying and inundation cycles (called hydric dynamics) of these basins. Little is known about the microflora of the sediments and its dynamics; hence, the purpose of this study is to describe the physicochemical and biological characteristics of the sediments at different hydric statuses of the infiltration basin. Sediments were sampled at five time points following rain events and dry periods. They were characterized by physical (aggregation), chemical (nutrients and heavy metals), and biological (total, bacterial and fungal biomasses, and genotypic fingerprints of total bacterial and fungal communities) parameters. Data were processed using statistical analyses which indicated that heavy metal (1,841 μg/g dry weight (DW)) and organic matter (11%) remained stable through time. By contrast, aggregation, nutrient content (NH 4 + , 53–717 μg/g DW), pH (6.9–7.4), and biological parameters were shown to vary with sediment water content and sediment biomass, and were higher consecutive to stormwater flows into the basin (up to 7 mg C/g DW) than during dry periods (0.6 mg C/g DW). Coinertia analysis revealed that the structure of the bacterial communities is driven by the hydric dynamics of the infiltration basin, although no such trend was found for fungal communities. Hydric dynamics more than rain events appear to be more relevant for explaining variations of aggregation, microbial biomass, and shift in the microbial community composition. We concluded that the hydric dynamics of stormwater infiltration basins greatly affects the structural stability of the sedimentary layer, the biomass of the microbial community living in it and its dynamics. The decrease in aggregation consecutive to rewetting probably enhances access to organic matter (OM), explaining the consecutive release of NH 4 + , the bloom of the microbial biomass, and the change in structure of the bacterial community. These results open new perspectives for basin management since the risk of OM and pollutant transfer to the aquifer is greatly affected by alternating dry and flood periods. Introduction In urban areas, impermeable surfaces prevent the infiltra- tion of storm waters, resulting in disturbances of the water cycle, notably the infiltration part of it. As a consequence and to minimize the risk of flooding, urban authorities organize the collection and processing of stormwater. A. L. Badin : L. Volatier : C. Delolme : J.-P. Bedell (*) Université de Lyon, Lyon 69003, France e-mail: [email protected] A. L. Badin : L. Volatier : C. Delolme : J.-P. Bedell ENTPE, Vaulx en Velin 69518, France A. L. Badin : L. Volatier : C. Delolme : J.-P. Bedell Laboratoire des Sciences de l’Environnement, Vaulx-en-Velin 69518, France A. Monier : R. A. Geremia Laboratoire d’Ecologie Alpine, CNRS UMR 5553, Université Joseph Fourier, Grenoble 38041, France Microb Ecol DOI 10.1007/s00248-011-9829-4
-
Upload
independent -
Category
Documents
-
view
2 -
download
0
Transcript of Structural Stability, Microbial Biomass and Community Composition of Sediments Affected by the...

ENVIRONMENTAL MICROBIOLOGY
Structural Stability, Microbial Biomass and CommunityComposition of Sediments Affected by the Hydric Dynamicsof an Urban Stormwater Infiltration BasinDynamics of Physical and Microbial Characteristics of Stormwater Sediment
Anne Laure Badin & Armelle Monier &
Laurence Volatier & Roberto A. Geremia &
Cécile Delolme & Jean-Philippe Bedell
Received: 6 June 2010 /Accepted: 9 February 2011# Springer Science+Business Media, LLC 2011
Abstract The sedimentary layer deposited at the surface ofstormwater infiltration basins is highly organic and multi-contaminated. It undergoes considerable moisture contentfluctuations due to the drying and inundation cycles (calledhydric dynamics) of these basins. Little is known about themicroflora of the sediments and its dynamics; hence, thepurpose of this study is to describe the physicochemical andbiological characteristics of the sediments at differenthydric statuses of the infiltration basin. Sediments weresampled at five time points following rain events and dryperiods. They were characterized by physical (aggregation),chemical (nutrients and heavy metals), and biological (total,bacterial and fungal biomasses, and genotypic fingerprintsof total bacterial and fungal communities) parameters. Datawere processed using statistical analyses which indicatedthat heavy metal (1,841 μg/g dry weight (DW)) and organicmatter (11%) remained stable through time. By contrast,
aggregation, nutrient content (NH4+, 53–717 μg/g DW), pH
(6.9–7.4), and biological parameters were shown to varywith sediment water content and sediment biomass, andwere higher consecutive to stormwater flows into the basin(up to 7 mg C/g DW) than during dry periods (0.6 mg C/gDW). Coinertia analysis revealed that the structure of thebacterial communities is driven by the hydric dynamics ofthe infiltration basin, although no such trend was found forfungal communities. Hydric dynamics more than rainevents appear to be more relevant for explaining variationsof aggregation, microbial biomass, and shift in themicrobial community composition. We concluded that thehydric dynamics of stormwater infiltration basins greatlyaffects the structural stability of the sedimentary layer, thebiomass of the microbial community living in it and itsdynamics. The decrease in aggregation consecutive torewetting probably enhances access to organic matter(OM), explaining the consecutive release of NH4
+, thebloom of the microbial biomass, and the change in structureof the bacterial community. These results open newperspectives for basin management since the risk of OMand pollutant transfer to the aquifer is greatly affected byalternating dry and flood periods.
Introduction
In urban areas, impermeable surfaces prevent the infiltra-tion of storm waters, resulting in disturbances of the watercycle, notably the infiltration part of it. As a consequenceand to minimize the risk of flooding, urban authoritiesorganize the collection and processing of stormwater.
A. L. Badin : L. Volatier : C. Delolme : J.-P. Bedell (*)Université de Lyon,Lyon 69003, Francee-mail: [email protected]
A. L. Badin : L. Volatier : C. Delolme : J.-P. BedellENTPE,Vaulx en Velin 69518, France
A. L. Badin : L. Volatier : C. Delolme : J.-P. BedellLaboratoire des Sciences de l’Environnement,Vaulx-en-Velin 69518, France
A. Monier :R. A. GeremiaLaboratoire d’Ecologie Alpine, CNRS UMR 5553,Université Joseph Fourier,Grenoble 38041, France
Microb EcolDOI 10.1007/s00248-011-9829-4

Rather than discharging stormwater into rivers, infiltratingwater via dedicated basins is used as an alternative meansof processing it. On the one hand, it has the advantage ofmimicking the natural water cycle and restocking ground-water. On the other hand, stormwater carries particles andassociated contaminants from urban surfaces to infiltrationsurfaces [7, 38]. Sediment accumulation can amount toseveral millimeters per year (1 to 3.5 mm according to LeCoustumer [36]). Thus, a highly organic and contaminatedsedimentary layer is deposited at the surface of theinfiltration basin, thereby jeopardizing groundwater quality.
Alternations of dry and flood conditions result from theoperation of the infiltration basin itself. On the one hand,during rain events, the surface of the basin can besubmerged under several meters of water while, on theother hand, the basin can be dry for weeks at a time. Thesuccession of these wet and dry periods can be very rapid.For instance, in the basin studied here, 83,000 m3 of watercan enter the basin in 38 h, representing a water column of1.9 m (calculations from parameters monitored continuous-ly). This column was infiltrated in less than 48 h. Also,drought periods can last as long as 6 weeks. These cyclesare expected to have impacts on the biotic and abioticcharacteristics of sediments and, for example, on thetransfer of organic matter (OM) to the underlying aquifer.The hydric dynamics of the infiltration basin result from acombination of pluviometry (volume and length of precip-itation time) and the time necessary for the water toinfiltrate, and of drying that can depend on clogging andair temperature.
Up to now, several studies have been dedicated to thephysicochemical characterization of the sediments resultingfrom stormwater infiltration [9, 12, 17, 23, 24, 48] and theirpotential leaching of contaminants [25, 34, 37, 43]. Resultsof these studies show that the heavy metal concentrationsin, and the OM content of, the sediment are fairly constant.Moreover, heavy metals have been shown to be retained forthe most part at the surface of the infiltration basin. Severalauthors [14, 40, 45] also investigated and demonstrated thepotential leaching of nutrients and dissolved organic carbonto groundwater. Since sediment microflora has beensuggested to be abundant and active [18, 44, 46], theleaching observed could result or be affected by sedimentmicroorganisms [18, 44, 46]. Thus, microflora must betaken into account to assess the evolution of the sedimen-tary layer of the stormwater infiltration basin.
To our knowledge, despite the importance of hydricdynamics in this system, the dynamics of the sedimentarylayer linked to the use of the infiltration basin has not beeninvestigated. Moreover, in a porous medium, water is notonly necessary for the development of microorganisms, butit is also the determining factor for many meaningfulprocesses including nutrient diffusion, redox potential, OM
solubilization and microorganism mobility. Consequently,the hypothesis put forward in this work is that sedimentwater content drives the overall biophysicochemical evolu-tion of sediments.
Methods
To validate the stated hypothesis, we conducted a fieldstudy on the sediments of a well-characterized infiltrationbasin at different hydrological statuses. Sediments from aninfiltration basin located in east Lyon (France) weresampled at five dates after flooding and during droughtperiods. The physical (structural stability), chemical (con-centrations of N nutrients, heavy metals, and C and OMcontent), and biological (biomasses and genotypic diversi-ties) characteristics of the samples were determined.Statistical and multivariate analyses were used to underlinethe major trends revealed by the data.
Site Description and Sampling
Sediments were sampled in an urban stormwater infiltrationbasin described previously [58]. Five samples of roughly1 kg of sediment each were sampled from the sedimentarylayer (top 5 cm) on 10 May 2006, 10 April 2007, 31 July2007, 11 September 2007 and 10 December 2007 (aspreviously described in Badin et al. [4]). They wererandomly collected from the same 2-m2 area and werealways performed in the absence of a water column. Thesamples were neither dried nor sieved before characteriza-tion in order to preserve their millimetric structure andallow aggregation determination.
The rainfall values of the 7 days before sampling werecollected from two neighboring meteorological stations,and the sum of the rainfall values of the 3 days prior tosampling defines the parameter rain72.
Physicochemical Analyses
The measurements were performed in triplicate for eachsample, leading to 15 measurements per sampling dateexcept for total organic carbon (TOC), analyzed using threesamples per sampling date (one of them in triplicate). Thereagents used were pure or ultrapure quality.
Moisture contents were measured as per the NF X31-102standard [2]. OM content was evaluated by measuring losson ignition: weight loss of dry sediments at 550°C for 2 h.pH was measured as per the NF X31-103 standard [1].TOCwas measured in 50 mg of dried sample using a 5000AShimadzu analyzer. The detection limits were 5.5 mg/g DW.
Extractions of NH4+, NO3
−, and NO2− were performed
according to Mathieu and Pieltain [39]. Briefly, 10 g dry
A. L. Badin et al.

weight (DW) equivalent of sediment was mixed for 1 hwith 100 mL of KCl 2 M. Extracts were stored at −20°Cand measurements were all performed at once (less bias).NO3
− and NO2− were measured together, as previously
described [39]. Briefly, NO3− was first reduced to NO2
−,then their reaction with N-(1-naphtyle)-ethylenediaminedichlohydrate gave a colored complex that was measuredby spectrophotometry at 540 nm using KNO3 as thestandard. NH4
+ was assumed to be the major ninhydrinereactive compound; it was measured at 570 nm inaccordance with the method used by Amato and Ladd [3].The standard was performed with NH4Cl.
Aqua regia mineralization of samples (100 mg) andmeasurement of pseudo total Cu, Pb, Zn, Cd, Ni, and Cr bythe Polarized Zeeman Atomic Absorption Spectrophotom-eter (Hitachi Z8200) were performed as described pre-vioulsy [44]. Detection limits were 0.1 ppb for Cd, 0.1 ppmfor Zn, and 1 ppb for Cu, Cr, Pb, and Ni.
As aggregates are commonly considered to be the unitsof structure in soil or structured materials, their proportionwas measured as an indicator of structural stability.Proportions of stable aggregates in the sediment sampleswere determined according to the method describedpreviously [6]. Briefly, in a given volume of sediment, theproportion of aggregates was considered to be equal to thedifference between the proportion of >160 μm particlesbefore sonication and the proportion of >160 μm particlesafter sonication (in the diffractometer sampler, 50–60 Hz,1 min). The grain size volumic proportions were measuredby laser diffractometry (Malvern Mastersizer 2000 G).
Biomass Measures
Soil microbial biomass was quantified on the basis ofninhydrin-reactive N determined by the fumigation extrac-tion method [3]. The standard was performed with leucineand NH4Cl. For the estimation of biomass-C, ninhydrin-Nresults were multiplied using a conversion factor of 22, asobtained in the calibration experiment performed byJoergensen [31]. We previously checked the possibility ofusing this factor by measuring the C content in several KClextracts. Three measurements were performed per subsam-ple, so we had 15 measurements per sampling date.
The bacteria were numbered by direct counting using4′,6-diamidino-2-phenylindole (DAPI) staining and epi-fluorescence microscopy [33, 49]. For each sampling, the5 subsamples were stored in plastic bags at 4°C in the darkand counted within the 3 days following sampling. Roughly10 g equivalent DW of stormwater sediments were blendedfor 90 s with 50 mL sterile NaCl 0.8% and sonicated for2 min. The suspension was diluted to allow valid counts.Formaldehyde (9 mg/mL), a solution of glutaraldehydebuffered at pH 7.2 (0.4 mg/mL) and DAPI stain (0.002 mg/
mL) were made to react with the suspension for 20 min inthe dark. The suspensions were filtered through black0.22 μm filters (Millipore isopore GTPB). Bacteria coloredblue by fluorescing DAPI (excited at 365 nm) were countedusing an epifluorescent microscope on ten grids per filter.Three filters were acquired per subsample. Only onemeasurement was performed per subsample, so fivemeasurements were obtained per sampling date.
Fungal biomass of the subsamples taken on 10 May2006 was quantified by measuring ergosterol content [20,42]. Ergosterol was extracted by 30 min sonication of 1 g ofsediment suspended in 80 mL bidistillated ethanol. Theextracts were concentrated following filtration (0.45 μm),which was performed again (0.45 μm) prior to analysisquantified by Liquid Chromatography (Agilent 1100) andMass Spectrometry. The mobile phase used under isocraticconditions was methanol: water (97:3). Detection wasperformed by using atmospheric pressure chemical ioniza-tion. Quantification was done in selective ion monitoringmode using the characteristic fragment ion at m/z 279. Thestandard was performed with ergosterol (HPLC grade,Sigma Aldrich). The ergosterol content was equal to 6.0±3.0 μg/g sediment DW.
Genotypic Diversity of Bacterial and Fungal Communities(PCR-CE-SSCP Profiling)
DNA extractions were performed with the Power SoilTMExtraction Kit (Mo Bio Laboratories, Ozyme, St Quentin enYvelines, France) using 250 mg of fresh weight stormwatersediment per sample as per the manufacturer’s instructions.Three extractions per subsample were performed on thebulk sediment, i.e., 15 per sampling date.
The phylogenetic structure of bacterial and fungal commu-nities was assessed using single strand conformation poly-morphisms (SSCP) as previously described [29, 60, 61]. InSSCP, the amplified DNA is denatured and diluted topreclude hybridization of the complementary strains. Thesingle strand will adopt a secondary conformation dependingon its sequence; the different conformers are then separatedby capillary electrophoresis and fluorescence was detected.Briefly, fungal diversity was assessed by amplification of theITS1 region using the primers ITS5 (5 ′-GGAGTAAAAGTCGTAACAAGG-3′) and HEX-ITS2 (5′-GCTGCGTTCTTCATCGATGC-3′). For bacterial diversity,the V3 region of ssu was amplified using the primers W49(5′-ACGGTCCAGACTCCTACGGG-3′) and FAM-W104(5′-GTGCCAGCAGCCGCGGTAA-3′). Two independentPCR reactions were performed as previously described (30,61, and 62). The SSCP was performed on an ABI prism 3130Genetic analyzer (Applied Biosystems), using a 36-cm lengthcapillary as described previously (30) and using Genescan-400HD ROX (Applied Biosystems) as internal standard.
Evolution of Microbial Composition of Infiltration Basins Surfaces in Relation to Hydric Characteristics
Multivariate and Statistical Analyses
Data analysis was performed with the free software R [57].Hierarchical analyses of variances (ANOVA) were per-formed: the upper factor considered was the sampling date(5), and the lower factor was the subsamplings (5). Thenormality of residues (Shapiro Wilk test) and homoscedas-ticity (Levene test) assumptions were checked. To completethese assumptions, bacteria counts were log transformed.Since an ANOVA had revealed significant differencesbetween samplings, an a posteriori Tukey’s test (Tukey’sHSD test) was performed in order to discriminate sam-plings. The significance level was α=0.05.
Exploratory multivariate analyses were performed withthe ADE-4 software, a package for R [22]. Correlationsof quantitative variables were highlighted by principalcomponent analysis (PCA) on centered and normalizeddata. SSCP profiles were compared by correspondenceanalyses (CoA). This is a discriminative analysis thatordinates rows by columns and columns by rows; it isusually performed on contingency tables to visualize thedistribution of species in various habitats and, conversely,habitat use by the species [50]. Here, it allowed thevisualization of phylotypes (in equivalent base pair (bp))in relation to the subsamples and subsamples in relation tophylotypes.
The coinertia analysis explores the common structureof two tables sharing the same statistical units in order tostudy their relationship (details in Dodelec and Chessel[21]). Here, the first table contains the sediment physico-chemical characteristics while the second contains thebacterial SSCP profiles. They were analyzed previouslyusing PCA and CoA, respectively. For certain parameters,we had only five values (bacterial number), thus in orderto obtain tables with coherent coordinates (i.e., the samenumber of individuals), only five SSCP profiles persampling dates were retained for the coupling analysis(one per subsample). The coinertia analysis displays themaximum covariance between the two new sets ofcoordinates. The costructure between the two matriceswas checked using the RV coefficient [0–1]. Thismeasures the global similarity between the datasets. Thecloser it is to 1 the greater the global similarity betweenthe two datasets.
Results
To assess the effect of the hydrological status on theinfiltration basin sediments, sampling was performed at fivedifferent dates, two during “a rainy period” and threeduring “a drought period” (of around 2 weeks). We used thecumulative pluviometry (over 72 h) of the infiltration basin
catchment area before sampling as an indicator of the recenthistory of the stormwater infiltration basin (Table 1) thoughthis factor is not sufficient to explain the moisture of thesediment. On the one hand, regarding their moisturecontent, sediments could be classed in three groupsaccording to moisture content: moist (May and December),dry (July and September) and intermediate (April). On theother hand, sediments could be classed into three differentgroups according to the depth of precipitation calculatedfollowing a 72-h period: rainy (May and December),slightly rainy (July) and dry (April and September).However, when considering the temporal dynamics of therainfall (Fig. 1) the profile for December shows rainfallsdistributed over many days while in May, one major rainfalloccurred before sampling. Thus three groups can beconstituted in terms of rainfall: December, May, and Apriland July and September.
Physicochemical Characterization
In order to assess structural stability, the proportion ofstable 160–1,000-μm aggregates was measured. Regardingtheir structural stability (Table 1), the sediments wereclassed into three significantly different groups: lowstability (May), intermediate stability (April and Decem-ber), and good stability (July and September) that do notoverlap with the pluviometry groups.
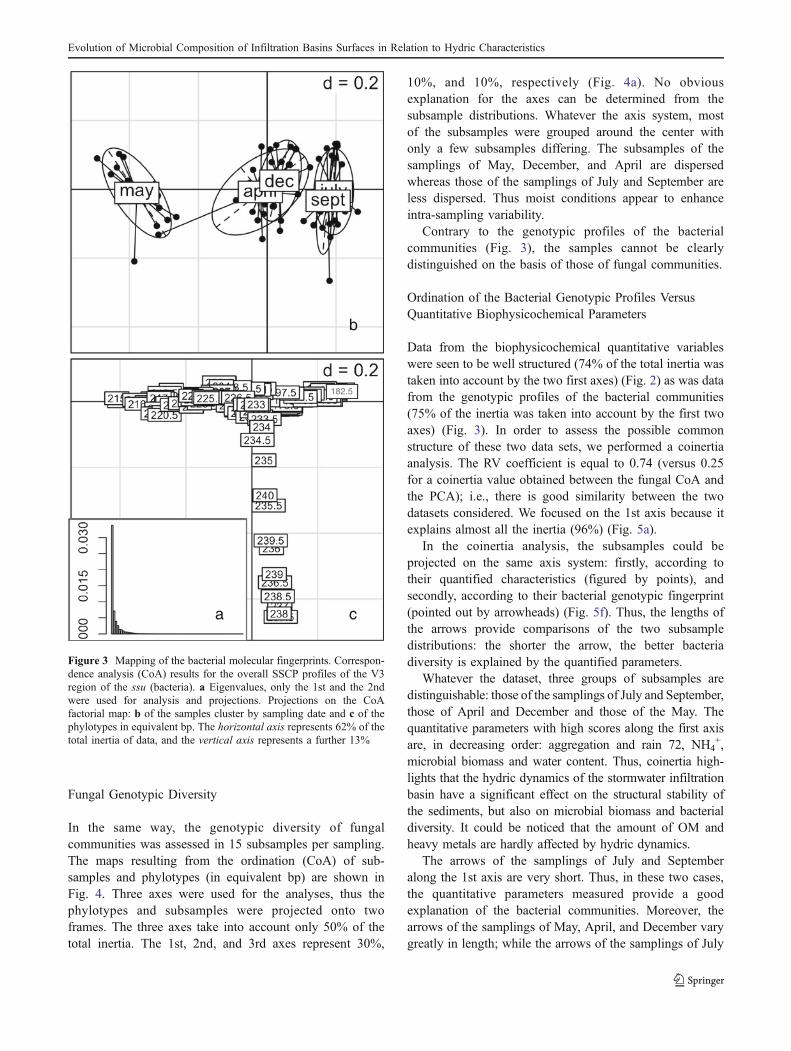
Raw physicochemical results, correlations between var-iables and subsample distribution revealed by the PCA areshown in Table 1 and Fig. 2. The two axes chosen for thePCA plot represent 74% of the total inertia of the data (the1st=57% while the 2nd=17%) (Fig. 2).
The 1st axis of the PCA is supported by thedescribed parameters previously: moisture content, plu-viometry, and aggregation. The two former parametersare highly positively correlated to each other, whereasboth are negatively correlated to aggregation. Thus itcan be said that structural stability is enhanced whiledrying.
Regarding OM, loss on ignition ranges from 10% to14% of sediment dry weight while TOC values range from4.0% to 5.6%. OM participates only partially in the overallinertia (along the second axis), and it is independent ofmoisture content. pH values range from 6.9 to 7.4 and pH ispositively correlated with water content: pH was seen todecrease while drying (this was further developed in Badinet al. [6]).
As expected, the sediments analyzed displayed highlevels of heavy metals. Concentrations of Zn were thehighest ranging from 1,094 to 1,254 μg/g DW sediment.The concentrations of Pb ranged from 255 to 378 μg/gDW, those of Cu from 120 to 215 μg/g DW, those ofNi from 81 to 144 μg/g DW, those of Cr from 78 to
A. L. Badin et al.

96 μg/g DW, and finally those of Cd from 9.6 to15.0 μg/g DW. As proportions of each heavy metal inrelation to the overall others were quite constant, onlytheir sum is reported for each sampling and integratedin the PCA (Fig. 2). No difference between samplingswas underlined by the ANOVA of the sum of heavymetals.
On the contrary, concentrations of nitrogen nutrients(NH4
+, NO3−, and NO2
−) were significantly differentbetween samples (Table 1). NH4
+ was the major nitrogenionic species: its concentrations ranged from 53 to717 μg/g DW of sediment. NO3
− and NO2− concentra-
tions ranged from 0.5 to 8.6 μg/g DW of sediment.Ammonia concentrations of the samples of May weresignificantly higher than the others. In conclusion, drying
Figure 1 History of rainfalls of the week preceding the fivesamplings. Mean of data from the two closest meteorological stations(Bron and Chassieu). Adapted from ref. [4]. The arrow indicates thesampling
Tab
le1
Phy
sicochem
ical
andbiolog
ical
quantitativedata
ofsedimentfrom
stormwater
infiltrationbasin(D
jR,Lyo
n,France)
Phy
sicochem
ical
characteristics
Biologicalcharacteristics
Rain72
hbefore
sampling
(inmm)
Moisture
content(in
%TW)*
OM
(%of
DW*
%of
stable
aggregates*
pH**
*Ammon
ium
(inμgperg
DW
sediment*
Nitrates
andnitrites
(inμgpergDW
sediment*
TOC(Total
Organic
Carbo
n)(inmgper
gof
DW
sediment)
Σheavymetals
(Zn,
Pb,
Cu,
Cr,
Ni,Cd;
inμgperg
DW
sediment)
Bacteria
numberX
10+9**
*
Biomass
(inμgof
N/g
DW
sediment*
10May
0617
.239
±7(a)
10±2(a)
41±13
(a)
7.3±0.1(a)
717±36
8(a)
1.6±0.8(a)
40.2±12
.81,93
4±18
835
.4±9.5(a)
301.0±91
.8(a)
10April07
014
±7(c)
10±3(a)
73±8(b)
7.3±0.1(a)
81±8(b)
8.6±3.6(b)
53.1±1.1
1,98
5±33
88.3±4.3(b)
68.4±16
.3(b)
31July
070.9
5±3(b)
11±2(a)
86±3(c)
6.9±0.1(b)
53±9(b)
3.5±3.1(a)
44.0±11.7
1,73
8±19
212
.4±1.6(b)
28.3±9.7(c)
11Sept07
05±1(b)
12±2(a)
89±2(c)
7.1±0.1(b)
88±15
(b)
0.5±0.3(a)
52.0±3.1
1,82
7±119
12.7±2.5(b)
32.7±8.5(c)
10Dec
076.6
36±4(a)
14±4(b)
75±3(b)
7.4±0.1(a)
81±18
(b)
2.7±1.4(a)
56.2±2.5
1,72
2±113
37.4±3.5(a)
165.0±75
.5(d)
For
each
parameter,samplings
sharingthesameletterwereno
tshow
nto
besign
ificantly
differentaccordingto
theapo
sterioriTuk
ey’stest
DW
dryweigh
t,TW
totalweigh
t
*p<0.00
1,levelsof
sign
ificance
oftheANOVA
Evolution of Microbial Composition of Infiltration Basins Surfaces in Relation to Hydric Characteristics

increases aggregation, and reduces pH and concentrationof NH4
+. On the contrary, OM and heavy metals are notaffected.
Biomass in the Sampled Sediments
The overall microbial, bacterial and fungal biomasses ofsediments were quantified respectively by the fumigation/extraction method, and bacteria counts using epifluorescentmicroscopy and ergosterol quantification. The fungal bio-mass was evaluated only in the samples from the Maysampling. Mean ergosterol content was 6±3 μg/g DW ofsediment and this would correspond to 0.5 to 1.5 mg of drybiomass per g of dry sediment using conversion factorsproposed by Montgomery et al. [42] and Djajakirana et al.[20].
Microbial biomass values of sediment from the fivesamplings ranging from 28.3 to 301 μg of N/g of DWsediments reacting with ninhydrine (Table 1), i.e., 618 to6,622 μg of C/g of DW [31, 32]. Biomasses were shown todiffer significantly between all the samplings except for theJuly and September samplings. They are ordered as follows:May 06>Dec 07>Apr 07>Jul 07–Sept 07. The bacterialcounts in the sediments from the five samplings rangingfrom 8.7×10+9 to 37.4×10+9 bacteria/g DW of sediment.Significant differences are underlined and samplings aregrouped and ordered as follows: May 06–Dec 07>Apr 07>Jul 07–Sept 07.
On the correlation circle (Fig. 2), the biomass andbacteria counts are correlated with moisture content (posi-tively) and aggregation (negatively), but are quite indepen-dent of OM and heavy metal contents. In conclusion,
microbial biomass is affected by variations of moisturecontent and aggregation.
Bacterial Genotypic Diversity
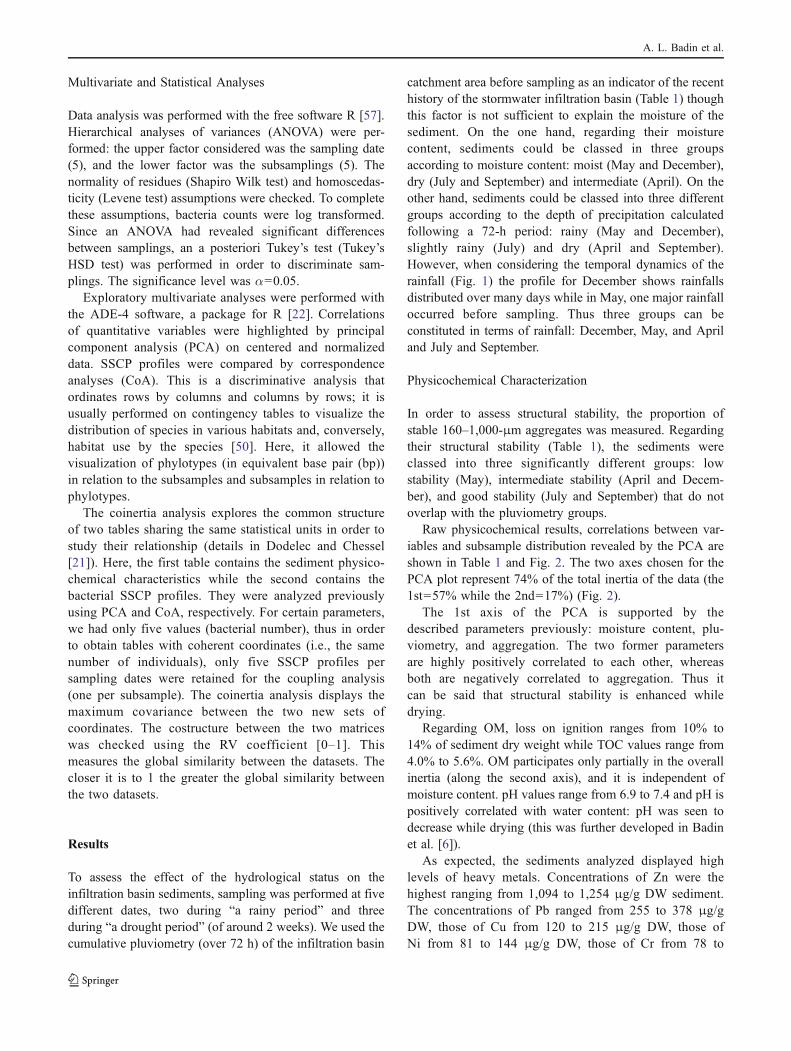
The genotypic diversity of bacterial communities wasassessed in 15 subsamples per sampling. The mapsresulting from the ordination (CoA) of subsamples andphylotypes (in equivalent bp) are shown on Fig. 3. Both thephylotypes and subsamples were projected on the sameaxes. The two axes in the figure take into account 75% ofthe total inertia while the 1st and the 2nd axes represent62% and 13%, respectively (Fig. 3a). The 1st axis under-lines bacterial community variability between samplings(inter-sampling variability), whereas the 2nd axis under-lines the variability between subsamples (intra-samplingvariability). Along the 1st axis, three groups of subsamplescan be distinguished (Fig. 3b): the group of subsamplesfrom the sampling of May 2006 that is far from the others,the group of subsamples from the samplings of April andDecember 2007, and the group of subsamples from thesamplings of July and September 2007. The phylotypes238, 215, and 182.5 equivalent bp appear to play a majorrole in the distinction between subsamples (Fig. 3c).
Thus genotypic profiles of bacterial communities allowgrouping samplings in the same way as structural stabilitydoes: low stability (May 06), intermediate stability (Apriland December 07), and good stability (July and September07). The co-inertia analysis allowed taking the comparisonfurther regarding the ordination of bacterial SSCP profilesand the variations of quantitative biophysicochemicalparameters (see below).
Figure 2 Correlations of the quantitative biophysico-chemicalparameters of the sediment. Results of the principal componentanalysis: a eigenvalues; b correlation (circle), arrows stand forvariables; c projections of the samples located by names. Ellipsesare group samples per sampling date. The horizontal axis is the 1staxis, which represents 57% of the total inertia of data; the vertical axis
is the 2nd axis, which represents a further 17%. Aggregationproportions of stable aggregates. Biom biomass content, HM heavymetal content (sum of Zn, Pb, Cu, Cr, Ni, and Cd contents), NBactbacterial counts, NH4 ammonium content, LoI loss on ignition=organic matter; pH; rain72 rainfall values of the 3 days prior tosampling, H2O moisture content
A. L. Badin et al.
Fungal Genotypic Diversity
In the same way, the genotypic diversity of fungalcommunities was assessed in 15 subsamples per sampling.The maps resulting from the ordination (CoA) of sub-samples and phylotypes (in equivalent bp) are shown inFig. 4. Three axes were used for the analyses, thus thephylotypes and subsamples were projected onto twoframes. The three axes take into account only 50% of thetotal inertia. The 1st, 2nd, and 3rd axes represent 30%,
10%, and 10%, respectively (Fig. 4a). No obviousexplanation for the axes can be determined from thesubsample distributions. Whatever the axis system, mostof the subsamples were grouped around the center withonly a few subsamples differing. The subsamples of thesamplings of May, December, and April are dispersedwhereas those of the samplings of July and September areless dispersed. Thus moist conditions appear to enhanceintra-sampling variability.
Contrary to the genotypic profiles of the bacterialcommunities (Fig. 3), the samples cannot be clearlydistinguished on the basis of those of fungal communities.
Ordination of the Bacterial Genotypic Profiles VersusQuantitative Biophysicochemical Parameters
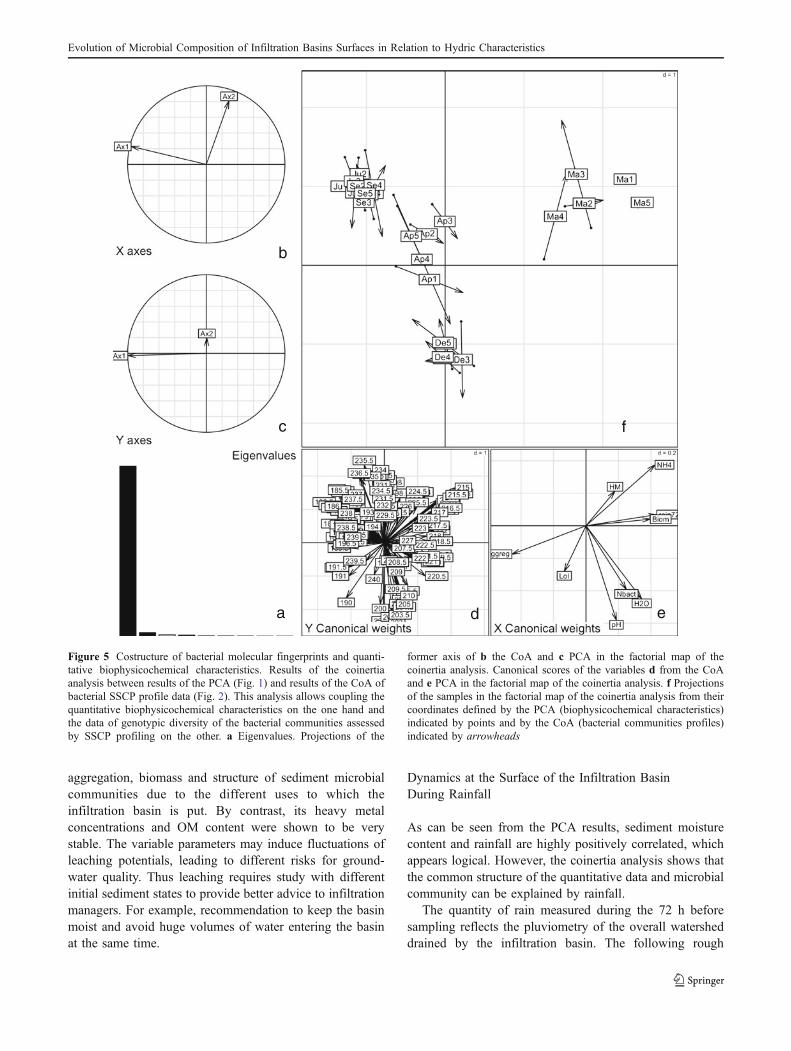
Data from the biophysicochemical quantitative variableswere seen to be well structured (74% of the total inertia wastaken into account by the two first axes) (Fig. 2) as was datafrom the genotypic profiles of the bacterial communities(75% of the inertia was taken into account by the first twoaxes) (Fig. 3). In order to assess the possible commonstructure of these two data sets, we performed a coinertiaanalysis. The RV coefficient is equal to 0.74 (versus 0.25for a coinertia value obtained between the fungal CoA andthe PCA); i.e., there is good similarity between the twodatasets considered. We focused on the 1st axis because itexplains almost all the inertia (96%) (Fig. 5a).
In the coinertia analysis, the subsamples could beprojected on the same axis system: firstly, according totheir quantified characteristics (figured by points), andsecondly, according to their bacterial genotypic fingerprint(pointed out by arrowheads) (Fig. 5f). Thus, the lengths ofthe arrows provide comparisons of the two subsampledistributions: the shorter the arrow, the better bacteriadiversity is explained by the quantified parameters.
Whatever the dataset, three groups of subsamples aredistinguishable: those of the samplings of July and September,those of April and December and those of the May. Thequantitative parameters with high scores along the first axisare, in decreasing order: aggregation and rain 72, NH4
+,microbial biomass and water content. Thus, coinertia high-lights that the hydric dynamics of the stormwater infiltrationbasin have a significant effect on the structural stability ofthe sediments, but also on microbial biomass and bacterialdiversity. It could be noticed that the amount of OM andheavy metals are hardly affected by hydric dynamics.
The arrows of the samplings of July and Septemberalong the 1st axis are very short. Thus, in these two cases,the quantitative parameters measured provide a goodexplanation of the bacterial communities. Moreover, thearrows of the samplings of May, April, and December varygreatly in length; while the arrows of the samplings of July
b
a c
182.5
Figure 3 Mapping of the bacterial molecular fingerprints. Correspon-dence analysis (CoA) results for the overall SSCP profiles of the V3region of the ssu (bacteria). a Eigenvalues, only the 1st and the 2ndwere used for analysis and projections. Projections on the CoAfactorial map: b of the samples cluster by sampling date and c of thephylotypes in equivalent bp. The horizontal axis represents 62% of thetotal inertia of data, and the vertical axis represents a further 13%
Evolution of Microbial Composition of Infiltration Basins Surfaces in Relation to Hydric Characteristics

and September are similar in length (Fig. 5f). For instance,subsamples Ap4 and Ap2 are very similar regarding theirbiophysicochemical characteristics but differ regarding theirbacterial communities. Interestingly, the moistest sedi-ments, which seem to have more heterogeneous niches(like more or less water content, available air, etc.), mayexplain the variability of bacterial communities.
Discussion
This study deals with sediments from infiltration basin andattempt to characterize microbial communities living in. Inan ecological point of view, infiltration basin could reallybe an interesting model because frequent and huge
disturbances affect this rich but contaminated environment.Indeed, at each rain event, the surface of the basin isflooded by 1 to 2 m of water that infiltrates slowly within10 to 20 h. The major role of the hydric regime of aninfiltration basin on a set of sediment characteristics washighlighted. The set of parameters used (physical, chemical,and biological) has never been applied to the study of suchurban materials before. We aim at assessing the meaningfulparameters driving microbial communities composition,thus, our methodology does not help to characterize theevolution of the microbial compartment with time. Wefocused on the number of variables measured on manyreplicates (15 for the majority of parameters measured)rather than studying a high number of samples with fewervariables. This study underlines the modifications of
b
c
e
d
a
Figure 4 Mapping of the fungal molecular fingerprints. Correspon-dence analysis (CoA) results for the overall SSCP profiles of the ITS1region of the ribosomal ARN genes (fungi). a Eigenvalues, only the1st, 2nd, and 3rd were used for analysis and projections. Projectionson the CoA factorial map: b and e of the samples cluster by sampling
date: b 1st and 2nd axes and e 1st and 3rd axes; c and d of thephylotypes in equivalent bp: c 1st and 2nd axes and d 1st and 3rdaxes. The horizontal axis (1st axis) represents 30% of the total inertiaof data, and the vertical axes represent a further: b, e 10% and c, d10%
A. L. Badin et al.
aggregation, biomass and structure of sediment microbialcommunities due to the different uses to which theinfiltration basin is put. By contrast, its heavy metalconcentrations and OM content were shown to be verystable. The variable parameters may induce fluctuations ofleaching potentials, leading to different risks for ground-water quality. Thus leaching requires study with differentinitial sediment states to provide better advice to infiltrationmanagers. For example, recommendation to keep the basinmoist and avoid huge volumes of water entering the basinat the same time.
Dynamics at the Surface of the Infiltration BasinDuring Rainfall
As can be seen from the PCA results, sediment moisturecontent and rainfall are highly positively correlated, whichappears logical. However, the coinertia analysis shows thatthe common structure of the quantitative data and microbialcommunity can be explained by rainfall.
The quantity of rain measured during the 72 h beforesampling reflects the pluviometry of the overall watersheddrained by the infiltration basin. The following rough
a
b
c f
ed
Figure 5 Costructure of bacterial molecular fingerprints and quanti-tative biophysicochemical characteristics. Results of the coinertiaanalysis between results of the PCA (Fig. 1) and results of the CoA ofbacterial SSCP profile data (Fig. 2). This analysis allows coupling thequantitative biophysicochemical characteristics on the one hand andthe data of genotypic diversity of the bacterial communities assessedby SSCP profiling on the other. a Eigenvalues. Projections of the
former axis of b the CoA and c PCA in the factorial map of thecoinertia analysis. Canonical scores of the variables d from the CoAand e PCA in the factorial map of the coinertia analysis. f Projectionsof the samples in the factorial map of the coinertia analysis from theircoordinates defined by the PCA (biophysicochemical characteristics)indicated by points and by the CoA (bacterial communities profiles)indicated by arrowheads
Evolution of Microbial Composition of Infiltration Basins Surfaces in Relation to Hydric Characteristics

calculation clearly illustrates the type of disturbancecapable of changing the sedimentary surface layer of thebasin. Considering a run-off coefficient of 70–75% [58], aprecipitation depth of 10 mm on the watershed is equivalentto 1,300 m3 of stormwater entering the basin to beinfiltrated. Thus the height of the infiltrating water at thesurface of the basin is about 1.30 m. It is thus conceivablethat the sedimentary layer could be highly disturbed andthat all or part of it is returned to suspension. Thishypothesis was supported by the low stability of aggrega-tion of the sediment sampled on 10th May 2006 comparedwith the better stability of sediments sampled on 10thDecember 2007. Indeed the moisture contents of bothsediments are relatively equal, but the rainfall records overthe few days before sampling were different (Fig. 1).Before the December sampling, several rainy events hadoccurred, whereas before the May sampling, only oneimportant event had occurred. This means that thedisturbance of the sediment resulting from the water layermay be higher in May than in December, possibly explain-ing the lower stability of sediment from the May sampling.
Dynamics and Composition of Microbial Biomass
In spite of the high concentrations of heavy metals and otherpollutants, the sediments from the stormwater infiltrationbasin constitute niches inhabited by numerous microorgan-isms. This study also shows that the microbial biomass ofstormwater sediment is high and dominated by bacteria.Moreover, it highlighted that biomass fluctuations result fromsediment moisture changes and that disturbances resultingfrom rewetting events greatly enhance microbial biomass.
The sediment microbial biomass ranges from 600 to7,000 μg C/g DW sediment. Soil microbial biomassesusually ranged from 50 to 500 μg C/g DW soil [10, 53].However, they could reach several thousand micrograms ofC per gram of DW soil in organic layers, such as litter [11],or when fertilized with OM [8, 55, 56]. The high biomassin the sedimentary layer of the stormwater infiltration basincan be explained by substantial supplies of nutrients andlabile OM [46].
This study showed large fluctuations in biomasses (tenfold).Such fluctuations have already been observed [13, 16, 19] insoil ecosystems. For instance, Devi and Yadava [19] reportedhigh seasonal variations of biomass contents in a mixed-oakforest of northeast India (from ∼100 to 1,400 μg C/g DW).They highlighted that biomass fluctuations are driven byseasonal changes of moisture content of soil resulting fromdifferential rainfall. Our study further highlights the majorinfluence of soil moisture content on microbial biomass.
It was already known that the history of moisture contentis even more important than moisture content itself:rewetting of a soil results in a flush of respiration [26, 30,
41, 47, 55]. Substrate availability may be the reason for thisflush of respiration and the increase of biomass. Rewettingcould activate dormant cells (suggested by Iovieno andBaath [30]) and enhance substrate availability by releasingeither previously protected soil organic matter in slackingaggregates, or molecules from the osmotic lysis of micro-organisms (cell lysis or active osmoregulation) [27, 30, 59].The flush of activities and bacterial growth after a rewettingevent last about 2 days [15, 30], after which it reverts to thelevels of constantly moist soil. These patterns were alsoobserved here. We measured significantly different bio-masses in two samples of equivalent moisture content butwith different hydric dynamic histories (May 06 vs.December 07). The highest biomass observed was mea-sured in sediments sampled 3 days after a considerablerewetting event (May) (Fig. 6). We have previously shownan increase of leachable dissolved and particular organiccarbon in the same sample [30], which reflects the loweraggregate stability found here. We assume that OMaccessibility is increased by lower aggregate stability, thuspromoting microbial development. This hypothesis issupported by the fact that the samples from Decemberexhibit higher stability and lower biomass for a similarwater content. However, the May sample also exhibits anearly tenfold increase in NH4
+ content. The origin of thisincrease may be an external inflow, concomitant todisaggregation or biomass degradation. Whatever the case,the increase of NH4
+ may benefit biomass development.TOC content of sediments was evaluated to be 40 mg C/g
DW while biomass was from 0.6 to 7 mg C/g DW. Assumingthe mean C content of a bacterial cell to be 28.5 [54] to 270 fgC/cell [52], bacterial biomass would be equal to 0.24 to10 mg C/g DW. The fungal biomass of the sampling of May2006 ranged from 0.5 to 1.5 mg C/g. Thus, even if thebiomass values are high, most of the C content of sedimentconstitutes non-living OM: the Cbiomass/TOC ratio rangedfrom 0.02 to 0.18. By comparison, Bragato et al. [10]reported a ratio from 0.8 to 1.2 for a farming soil fertilizedwith wastewater sludge. Our low ratios could be explainedby the specific composition of OM mainly composed ofpetroleum by-products leached from roads [5, 23, 24].
Factors Influencing Microbial Community Diversity
Multivariate analyses allow visualizing groups of samplesand highlighting the more influential parameters. However,characterization of more samples would be necessary inorder to describe the phenomena concerned in more detail.
As not all microorganisms cope with water-inducedstresses ion the same way, we assumed that the sedimentmicrobial community structure would be affected by changesof moisture content resulting from infiltration basin use. Ourresults validate this hypothesis for bacteria: on the one hand,
A. L. Badin et al.

communities from dry sediments (July and September 07)were shown to be different from communities from moistersediments (May 06 and April and December 07); on the otherhand, the communities from freshly disturbed sediment (May06) were different from the others.
Thus three major bacterial communities were observed:one developing in dry conditions, one developing in moistconditions and one that may be composed of goodcompetitors when rewetted. Identification of bacteria wouldbe very instructive and is now underway.
Fungal biomass is known to be less sensitive to drying[52]. This could explain why it appears to be less driven bymoisture content. Other explanations for the seeming lackof structure of the data for fungi are given below.
The differential dispersion of the replicates from the dry(well grouped) and the wet (dispersed) samplings in theCoA suggests the influence of sediment moisture content.Around 50% of the porosity of the sediments sampled inMay and December was filled with water whereas only 4%to 5% of the porosity of the sediments sampled in July andSeptember1 was filled. It is conceivable that the homoge-neity of the physicochemical conditions is better in drysediment than in moist but unsaturated sediment. Theheterogeneity of niches caused by the latter would allowmore diverse communities to grow.
Fungal Versus Bacterial Distributions at the Scale Studied
The lack of structure of fungal communities assessed bySSCP could result from differences of biomass betweenbacteria and fungi as well as their spatial distribution. Thesampling strategy and the sample size defined reflect thesedifferences; both defined the scale studied [28]. In thisstudy, we chose to sample five subsamples on a 2-m2 areaby date and perform three DNA extractions per subsample.The DNA extractions were performed on 250 mg. Themultivariate analyses on fungal and bacterial communityfingerprints highlighted differences between the spatialdistribution of bacteria and fungi. The structure of bacterialdata was clearly shown, whereas the structure of fungal datawas not. It appears that the homogeneity of bacteria couldbe determined from this sample size, whereas this was notthe case for fungi, as previously suggested by Ranjard et al.[51]. Size and spatial distribution of microorganisms couldexplain these differences.
This study has numerous perspectives. Firstly, in order toassess the risk of stormwater infiltration on groundwaterquality, it would be necessary to investigate leachingfluctuations with different initial sediment conditions.
Secondly, since the sedimentary layer is subjected to veryconsiderable disturbances, it could be a powerful model forstudying the evolution and succession of the microbialcommunities and their driving parameters.
Conclusions
Sediment from the stormwater infiltration basin undergoeshighly disturbing dry and wet cycles. Our study aimed atdescribing the sediment of the infiltration basin subjected todifferent hydric dynamics to underline stable and unstablecharacteristics.
The availability of physical, chemical and biologicalparameters and the use of multivariate analyses alloweddetecting the more influential parameters. Heavy metal andOM content did not change in contrasting hydric situations.On the contrary, moisture content, aggregation, pH,biomass, N nutrients, and microbial community structurewere affected by water fluctuations. The effect of moisturecontent history was also underlined by multivariate analy-ses. Indeed, a highly disturbing rewetting event was shownto result in weakening aggregates, increasing biomass,shifting bacterial communities and flushing ammonia. Thisstudy is a preliminary one that helped us to see that hydricconditions are determining physical parameters for themicrobial compartment characteristics in urban sediments.Further studies would then be carried out on morenumerous samples and/or laboratory experiments to deepenthe effect of wet/dry cycles on microbial compartmentcharacteristics in such urban sediment.
It now appears that the event scale is the mostappropriate for monitoring modifications of sedimentstructure and the succession of microbial communities.Moreover, our approach and results open new perspectivesfor basin management since the risk of transfer (OM orpollutants) towards the aquifer is greatly affected by dry/flood alternance. One recommendation for infiltrationmanagers could be to keep basins moist and avoid hugevolumes of water entering them at the same time.
Acknowledgments The work presented was funded in part by theECOPLUIE project backed by the PRECODD research program (2005)(no. ANR: ANR-05-ECOT-006-07, no. ADEME: 0594C-0089) and theMinistère de l’Ecologie, de l’Energie, du Développement durable et del’Aménagement du territoire-Direction de la recherche et de l’innovation(Convention no. 07 DST S 002). It was also carried out in the frameworkof the regional observatory on urban hydrology (OTHU) with thecollaboration of the “Greater Lyon” urban community.
References
1. AFNOR (1988) Détermination du pH dans l’eau. NF X 31–103.In: Détermination du pH dans l’eau. NF X 31–103. Paris. p 11
1 Calculations were performed with structural data acquired on thesesediments, a bulk density of 0.635±0.205 g/cm3 was used (Lassabatere2010 [35])
Evolution of Microbial Composition of Infiltration Basins Surfaces in Relation to Hydric Characteristics

2. AFNOR (1994) Qualité du sol—Détermination de la teneurpondérale en matière sèche et en eau. NF X 31–102. Paris. p 12
3. Amato M, Ladd JN (1988) Assay for microbial biomass based onninhydrin-reactive nitrogen in extracts of fumigated soils. SoilBiol Biochem 20:107–114
4. Badin A-L, Bedell JP, Delolme C (2009) The effect of watercontent on aggregation and contaminant leaching: the study ofurban sediments. J Soils Sediments 9:653–663
5. Badin A-L, Faure P, Bedell J-P, Delolme C (2008) Distribution oforganic pollutants and natural organic matter in urban storm watersediments as a function of grain size. Sci Total Environ 403:178–187
6. Badin A-L, Méderel G, Béchet B, Borschneck D, Delolme C(2009) Detecting evidence of the role of organic matter in theaggregation of urban stormwater sediment deposits by using grainsize analyses with laser diffractometry. Geoderma 153:163–171
7. Barraud S, Gibert J, Winiarski T, Bertrand Krajewski JL (2002)Implementation of a monitoring system to measure impact ofstormwater runoff infiltration. Water Sci Technol 45(3):203–210
8. Bastida F, Kandeler E, Moreno JL, Ros M, Garcia C, HernandezT (2008) Application of fresh and composted organic wastesmodifies structure, size and activity of soil microbial communityunder semiarid climate. Appl Soil Ecol 40:318–329
9. Bedell J-P, Neto M, Delolme C, Ghidini M, Winiarski T, PerrodinY (2004) Study if physico-chemical and microbiological param-eters of a soil in restored stormwater infiltration basin in the Lyonarea. 5th NOVATECH, Lyon, France. vol 2. pp 1469–1476.
10. Bragato G, Leita L, Figliolia A, De Nobili M (1998) Effects ofsewage sludge pre-treatment on microbial biomass and biovail-ability of heavy metals. Soil Tillage Res 46:129–134
11. Chen TH, Chiu CY, Tian G (2005) Seasonal dynamics of soilmicrobial biomass in coastal sand dune forest. Pedobiologia49:645–653
12. Clozel B, Ruban V, Durand C, Conil P (2006) Origin and mobilityof heavy metals in contaminated sediments from retention andinfiltration ponds. Appl Geochem 21:1781–1798
13. Compton JE, Watrud LS, Porteous LA, DeGrood S (2004)Response of soil microbial biomass and community compositionto chronic nitrogen additions at Harvard forest. For Ecol Manage196:143–158
14. Datry T, Malard F, Gibert J (2004) Dynamics of soluted anddissolved oxygen in shallow urban groundwater below a storm-water infiltration basin. Sci Total Environ 329:215–229
15. De Nobili M, Contin M, Brookes PC (2006) Microbial biomassdynamics in recently air-dried and rewetted soils compared toothers stored air-dry for up to 103 years. Soil Biol Biochem38:2871–2881
16. Debosz K, Rasmussen PH, Pedersen AR (1999) Temporalvariations in microbial biomass C and cellulolytic enzyme activityin arable soils: effects of organic matter input. Appl Soil Ecol13:209–218
17. Dechesne M, Barraud S, Bardin J-P (2004) Spatial distribution ofpollution in an urban stormwater infiltration basin. J ContamHydrol 72:189–205
18. Delolme C, Bedell JP, Winiarski T, Larmet H, Neto M, Muris M,Perrodin Y (2005) The soil microbial compartment submitted tothe infiltration of stormwater: description and role in the heavymetals transfer. Houille Blanche 3:33–38
19. Devi NB, Yadava PS (2006) Seasonal dynamics in soil microbialbiomass C, N and P in a mixed-oak forest ecosystem of Manipur,North-east India. Appl Soil Ecol 31:220–227
20. Djajakirana G, Joergensen RG, Meyer B (1996) Ergosterol andmicrobial biomass relationship in soil. Biol Fertil Soils 22:299–304
21. Dodelec S, Chessel D (1994) Co-inertia analysis: an alternativemethod for studying species-environment relationships. FreshwBiol 31:277–293
22. Dray S, Dufour AB, Chessel D (2007) The ade4 package-II: two-table and K-table methods. R News 7:47–52
23. Durand C, Ruban V, Amblès A (2005) Characterisation ofcomplex organic matter present in contaminated sediments fromwater retention ponds. J Anal Appl Pyrol 73:17–28
24. Durand C, Ruban V, Ambles A, Oudot J (2004) Characterizationof the organic matter of sludge: determination of lipids, hydro-carbons and PAHs from road retention/infiltration ponds inFrance. Environ Pollut 132:375–384
25. Durin B (2006) Transfert et transport collïdal de polluantsmétalliques. Université de Nantes, Nantes. p. 376
26. Fierer N, Schimel JP (2002) Effects of drying-rewetting frequencyon soil carbon and nitrogen transformations. Soil Biol Biochem34:777–787
27. Fierer N, Schimel JP, Holden PA (2003) Influence of drying-rewetting frequency on soil bacterial community structure. MicrobEcol 45:63–71
28. Franklin RB, Mills AL (2007) Introduction. In: Franklin RB,Mills AL (eds) The spatial distribution of microbes in theenvironment. Springer, Dordrecht, p 333
29. Gury J, Zinger L, Gielly L, Taberlet P, Geremia RA (2008)Exonuclease activity of proofreading DNA polymerases is at theorigin of artifacts in molecular profiling studies. Electrophoresis29:2437–2444
30. Iovieno P, Baath E (2008) Effect of drying and rewetting onbacterial growth rates in soil. FEMS Microbiol Ecol 65:400–407
31. Joergensen RG (1996) Quantification of the microbial biomass bydetermining ninhydrin-reactive N. Soil Biol Biochem 28:301–306
32. Joergensen RG, Brookes PC (2005) Quantification of soilmicrobial biomass by fumigation-extraction. Manual of SoilAnalysis—Monitoring and Assessing Soil Bioremediation SoilBiology 5:283–297
33. Kepner JRL, Pratt JR (1994) Use of fluorochromes for directenumeration of total bacteria in environmental samples: past andpresent. Microbiol Rev 58:603–615
34. Larmet H, Delolme C, Bedell J-P (2007) Bacteria and heavymetals concomitant transfer in an infiltration basin: columns studyunder realistic hydrodynamical conditions, vol. 2. GRAIE, Lyon.pp 615–622.
35. Lassabatere L, Angulo-Jaramillo R, Goutaland D, Letellier L, GaudetJ-P, Winiarski T, Delolme C (2010) Effect of the settlement ofsediments on water infiltration in two urban infiltration basins.Geoderma. doi:10.1016/j.geoderma.2010.02.031
36. Le Coustumer S-M (2008) Colmatage et rétention des élémentstraces métalliques dans les systèmes d’infiltration des eauxpluviales. INSA, Lyon. p. 427
37. Lee PK, Baillif P, Touray JC (1997) Geochemical behaviour andrelative mobility of metals (Mn, Cd, Zn and Pb) in recentsediments of a retention pond along the A-71 motorway inSologne, France. Environ Geol 32:142–152
38. Legret M, Pagotto C (1999) Evaluation of pollutant loadings inthe runoff waters from a major rural highway. Sci Total Environ235:143–150
39. Mathieu C, Pieltain F (2003) Analyse chimique des sols:Méthodes choisies. Lavoisier, Paris
40. Mermillod-Blondin F, Nogaro G, Vallier F, Gibert J (2008)Laboratory study highlights the key influences of stormwatersediment thickness and bioturbation by tubificid worms ondynamics of nutrients and pollutants in stormwater retentionsystems. Chemosphere 72:213–223
A. L. Badin et al.

41. Miller AE, Schimel JP, Meixner T, Sickman JO, Melack JM(2005) Episodic rewetting enhances carbon and nitrogen releasefrom chaparral soils. Soil Biol Biochem 37:2195–2204
42. Montgomery HJ, Monreal CM, Young JC, Seifert KA (2000)Determination of soil fungal biomass from soil ergosterolanalyses. Soil Biol Biochem 32:1207–1217
43. Murakami M, Nakajima F, Furumai H (2008) The sorption ofheavy metal species by sediments in soakaways receiving urbanroad runoff. Chemosphere 70:2099–2109
44. Neto M, Ohannessian A, Delolme C, Bedell JP (2007) Towards anoptimized protocol for measuring global dehydrogenase activity instorm-water sediments. J Soils Sediments 7:101–110
45. Nogaro G, Mermillod-Blondin F, Montuelle B, Boisson J-C,Bedell J-P, Ohannessian A, Volat B, Gibert J (2007) Influence of astormwater sediment deposit on microbial and biogeochemicalprocesses in infiltration porous media. Sci Total Environ 377:334–348
46. Nogaro G, Mermillod-Blondin F, Montuelle B, Boisson J-C,Lafont M, Volat B, Gibert J (2007) Do tubificid worms influenceorganic matter processing and fate of pollutants in stormwatersediments deposited at the surface of infiltration systems?Chemosphere 70:315–328
47. Pesaro M, Nicollier G, Zeyer J, Widmer F (2004) Impact of soildrying-rewetting stress on microbial communities and activitiesand on degradation of two crop protection products. Appl EnvironMicrobiol 70:2577–2587
48. Pétavy F, Ruban V, Conil P (2009) Treatment of stormwatersediments: efficiency of an attrition scrubber—laboratory andpilot-scale studies. Chem Eng J 145:475–482
49. Porter KG, Feig YS (1980) The use of DAPI for identifying andcounting aquatic microflora. Limnol Oceanogr 25:943–948
50. Ramette A (2007) Multivariate analyses in microbial ecology.FEMS Microbiol Ecol 62:142–160
51. Ranjard L, Lejon DPH, Mougel C, Schehrer L, Merdinoglu D,Chaussod R (2003) Sampling strategy in molecular microbialecology: influence of soil sample size on DNA fingerprinting
analysis of fungal and bacterial communities. Environ Microbiol5:1111–1120
52. Reynolds KA, Pepper IL (2000) Microorganisms in the environ-ment. In: Maier RM, Pepper IL, Gerba CP (eds) Environmentalmicrobiology. Academic, San Diego, pp 19–27
53. Rost U, Joergensen RG, Chander K (2001) Effects of Zn enrichedsewage sludge on microbial activities and biomass in soil. SoilBiol Biochem 33:633–638
54. Sherr EB, Sherr BF, Longneker K (2006) Distribution of bacterialabundance and cell-specific nucleic acid content in the NortheastPacific Ocean. Deep Sea Res I 53:713–725
55. Schimel JP, Gulledge JM, Clein-Curley JS, Lindstrom JE,Braddock JF (1999) Moisture effects on microbial activity andcommunity structure in decomposing birch litter in the Alaskantaiga. Soil Biol Biochem 31:831–838
56. Selivanovskaya SY, Latypova VZ (2006) Effects of compostedsewage sludge on microbial biomass, activity and pine seedlingsin nursery forest. Waste Manage 26:1253–1258
57. Team RDC (2008) R: a language and environment for statisticalcomputing. R Foundation for Statistical Computing, Vienna
58. Winiarski T, Bedell JP, Delolme C, Perrodin Y (2006) The impactof stormwater on a soil profile in an infiltration basin. Hydrogeol J14:1244–1251
59. Wood JM, Bremer E, Csonka LN, Kraemer R, Poolman B, Vander Heide T, Smith LT (2001) Osmosensing and osmoregulatorycompatible solute accumulation by bacteria. Comp BiochemPhysiol Mol Integr Physiol 130:437–460
60. Zinger L, Gury J, Alibeu O, Rioux D, Gielly L, Sage L,Pompanon F, Geremia RA (2008) CE-SSCP and CE-FLA, simpleand high-throughput alternatives for fungal diversity studies. JMicrobiol Methods 72:42–53
61. Zinger L, Gury J, Giraud F, Krivobok S, Gielly L, Taberlet P,Geremia RA (2007) Improvements of polymerase chain reaction andcapillary electrophoresis single-strand conformation polymorphismmethods in microbial ecology: toward a high-throughput method formicrobial diversity studies in soil. Microb Ecol 54:203–216
Evolution of Microbial Composition of Infiltration Basins Surfaces in Relation to Hydric Characteristics