TN -103 INFILTRATION STUDIES IN INDIA NATIONAL INSTITUTE ...
71
TN -103 INFILTRATION STUDIES IN INDIA (S6 T ba% r%a o ' 31‘ and id war1 91 NATIONAL INSTITUTE OF HYDROLOGY JAL VIGYAN BHAWAN ROORKEE - 247 667 U.P. INDIA 1993-94
-
Upload
khangminh22 -
Category
Documents
-
view
0 -
download
0
Transcript of TN -103 INFILTRATION STUDIES IN INDIA NATIONAL INSTITUTE ...
TN -103
INFILTRATION STUDIES IN INDIA
(S6Tba%
r%ao ' 31‘
and id war191
NATIONAL INSTITUTE OF HYDROLOGY JAL VIGYAN BHAWAN
ROORKEE - 247 667 U.P. INDIA
1993-94

PREFACE
Infiltration is an important process in the hydrologic cycle.
The understanding of infiltration process and the knowledge of
infiltration rates of soils is essential to develop an integrated
crop, soil and water management plan. The fact that infiltration
process marks the transition from fast moving surface water to
slow moving ground water emphasizes its importance in hydrologic
investigations.
With the objective of producing thematic maps of infiltration
characteristics of soils of India, the National Institute of
Hydrology, Roorkee has started the compilation of infiltration
data available from all over the country. This report is the
first step in this direction. It is expected that this
compilation will be helpful in planning further experiments on
different soils throughout the country.
This report is based on the field studies conducted by the
Regional Centres of the Institute at Jammu and Belgaum and also
on the results of field studies obtained from other organisations
such as State Ground Water Departments, All India Land Use Survey
and Planning, National Bureau of Soil Survey & Land Use Planning
etc. This report has been prepared by Dr. Rajiv Sinha, Scientist
'B' and Dr. Sudhir Kumar, Scientist 'C' under the guidance of
Dr. K.K.S. Bhatia, Scientist 'F' and Sri B.P. Roy, Scientist 'E'
& Head, Hydrological Investigation Division. Sri Rajan Vatsa, SRA
and Sri Rm.P. Nachiappan, SRA helped at various stages of
preparation of this report.
(S.M. SETH)
DIRECTOR

CONTENTS
ABSTRACT
1.0 INTRODUCTION
2.0 INFILTRATION - DEFINITIONS AND CONCEPTS 2
2.1 Infiltration and hydrology 2
2.2 Factors affecting infiltration 4
2.2.1 Effect of soil properties 5
2.2.2 Effect of soil moisture 6
2.2.3 Effect of landuse 6 2.2.4 Effect of rainfall 7 2.2.5 Effect of soil surface slope 8 2.2.6 Effect of climate 8
3.0 INFILTRATION ESTIMATION AND MEASUREMENT TECHNIQUES
3.1 Empirical relations for estimation of infiltration
8
rate 9
3.2 Infiltrometers 10
3.2.1 Single ring infiltrometers 10
3.2.2 Double ring infiltrometers 11
3.3 Recent developments in infiltrometers in India 11
3.3.1 Microprocessor based ring infiltrometers 11 3.3.2 Portable rainfall simulator 12
4.0 INFILTRATION STUDIES IN DIFFERENT STATES OF INDIA 12
4.1 Andhra Pradesh 13
4.2 Bihar 14
4.3 Delhi 14
4.4 Gujarat 15
4.5 Jammu and Kashmir 18
4.6 Karnataka 20
4.7 Madhya Pradesh 29
4.8 Maharashtra 31
4.9 Punjab 31
4.10 Rajasthan 35
4.11 Tamilnadu 40
4.12 Uttar Pradesh 42
4.13 West Bengal 54
5.0 CONCLUDING REMARKS 58
6.0 REFERENCES 60

Figure
Figure
1
2
LIST OF FIGURES
A typical infiltration curve.
Double cylinder infiltrometer.
Index map of Jammu showing test sites of infiltration
3
3
tests. 19
Figure 3 Map of Budigre basin, Karnataka. 22
Typical infiltration capacity curves for Budigre
basin. 22
Figure 4 Map of the Pavanje basin, Karnataka. 26
Typical infiltration curves for the Pavanje basin. 26
Statistical parameters of infiltration tests. 26
Figure 5 Map of the Kasur Nallah, Punjab 32
Infiltration curves for the Kasur Nallah. 32
Figure 6 Map of the Luni basin, Rajasthan. 37
Figure 7 Map showing infiltration test sites along the
Hindon river, Saharanpur, U.P. 44
Figure 8 Infiltration curves for the Kanhar Catchment,
Mirzapur, U.P. 50
Graph of infiltration rates vs. elapsed time for
Kanhar catchment, Mirzapur, U.P. 50
Figure 9 Infiltration curves for different landuses in Doon
valley, U.P. 55
Figure 10 Infiltration curves for the test conducted in the Deptt.
of Engg. Campus, ITT, Kharagpur. West Bengal 67

LIST OF TABLES
Table 4.1.1 Infiltration data for Andhra Pradesh. 13
Table 4.2.1 Infiltration data for Bihar. 14
Table 4.3.1 Infiltration data for Delhi. 14
Table 4.4.1 Infiltration data for Gujarat state. 15
Table 4.5.1 Infiltration rates for soils in Jammu region. 18
Table 4.6.1 Infiltration data for Karnataka. 20
Table 4.6.2 Infiltration test data for Budigre basin, Karnataka-21
Table 4.6.3 Infiltration data for Pavanje basin, Karnataka. 24
Table 4.6.4 Infiltration test data for Malaprabha basin,
Karnataka. 25
Table 4.6.5 Infiltration test data for Ghataprabha basin,
Karnataka. 28
Table 4.6.6 Infiltration data based on test conducted by DAu.29
Table 4.7.1 Infiltration data for Madhya Pradesh. 30
Table 4.8.1 Infiltration data for Maharashtra. 31
Table 4.9.1 Infiltration data for Kasur Nallah, Punjab. 31
Table 4.9.2 Infiltration rates for soils of Punjab. 33
Table 4.10.1 Infiltration data for Western Rajasthan. 35
Table 4.10.2 Infiltration characteristics in Upper Luni basin,
Rajasthan. 36
Table 4.10.3 Infiltration characteristics in Guhiya watershed,
Rajasthan. 38
Table 4.10.4 Landuse and infiltration characteristisc, Guhiya
watershed, Rajasthan. 39
Table 4.11.1 Amount of infiltration on cultivated land during
successive time intervals- wet run (Ootacamund). 42
Table 4.11.2 Values of initial infiltration rate-dry run,
Ootacamund, Tamilnadu. 42
Table 4.12.1 Infiltration data from U.P. 43
Table 4.12.2 Infiltration test data along the Hindon river,
Saharanpur, U.P. 43
Table 4.12.3 Infiltration data from U.P. 45
Table 4.12.4 Infiltration rates for various landuses in Bhaintan

watershed, Tehri Garhwal, U.P. 47
fable 4.12.5 Soil characteristisc and Infiltration data, Kanhar
catchment, Mirzapur. 49
Table 4.12.6 Infiltration rates in Doon valley, U.P. 52
Table 4.13.1 Infiltration data for Purulia district, west Benga1.64
Table 4.13.2 Infiltration test data from Deptt. of Agr. Engg.
campus, ITT Khargpur, West Bengal. 58

ABSTRACT
For optimum and sustainable use of soil, water and land
resources, soil infiltration studies are of vital importance.
Important hydrological parameters such as surface runoff, soil
moisture, evaporation, ground water recharge etc. are influenced
by infiltration properties of soils and therefore these studies
are important to improve irrigation projects efficiency and
drainage design of any particular area.
Infiltration studies in India have been done by a variety of
organisations such as State Ground Water Departments, All India
Land Use Survey and Planning, National Bureau of Soil Survey &
Land Use Planning, National Institute of Hydrology (NIH), Roorkee
and its regional centres. But all these studies have been
extremely scattered and no compiled document on infiltration
properties of soils of the country exist. The main objective of
this report is to first produce a compilation of all the existing
data on infiltration rates of soils of different states and then
to point out the gaps in these studies so that further studies in
this field may be planned. The present report first deals with
the basic concepts of infiltration and measurement techniques for
infiltration rates including recent development in
instrumentation for the same. Then, the existing data on
infiltration rates of soils have been presented state wise and
broad interpretation from these data have been made.

1.0 INTRODUCTION
Infiltration is an important component of the hydrologic
cycle and is defined as the process of entry of water through the
soil surface. Generally, infiltration has a high initial rate
that diminishes during continued rainfall to a nearly constant
lower rate. Earlier, the term infiltration was used to denote the
difference between rainfall and runoff in small areas. The rate
at which water enters into the soil at a given moment is known as
the "infiltration rate".
Keeping in view the importance of infiltration process in the
hydrologic cycle, the National Institute of Hydrology has taken
up the task of producing an infiltration map of India similar to
the landuse, soil type, rainfall, and evapotranspiration maps.
For this, the infiltration data from all over the country is
proposed to be collected through field experiments. As a first
step, it was decided to compile the data/ information already
available with various agencies/ organisations and to identify
the existing gaps before starting the experiments on different
soils throughout the country. The task of compiling complete
information relating to infiltration is very difficult. The
correspondence and visits were made to various organisations
involved in the infiltration studies and the information obtained
has been presented in the report. Undoubtedly, the complete
data/information could not be compiled. Even then, this report
presents an useful documentation of the status of infiltration
studies in India, in particular, and the state of art of the
infiltration technology, in general. The report will prove to be
a handy document for the scientists and researchers working in
the area of land, water and vegetation management.
1
2.0 INFILTRATION : DEFINITION AND CONCEPTS
Quantitatively, infiltration rate is defined as the volume of
water passing into the soil per unit area per unit time
(Fig.1a)and has the dimension of velocity (LIT). This rate
depends on number of factors viz. physico- chemical properties of
the soil, vegetation and landuse pattern, rainfall intensity and
duration, and surface slope. Under special circumstances wherein
the rainfall exceeds the ability of the soil to absorb water,
infiltration proceeds at a maximal rate which is called soil's
"infiltration capacity" (Horton, 1940). This term is not an apt
choice as pointed out by Richards (1952), since it implies an
extensive aspect rather than an intensive aspect as is more
appropriate to a flux. More recently, Hille1(1971)has coined the
term "infiltrability" to designate the infiltration flux
resulting when water at atmospheric pressure is made freely
available at the soil surface. This single word replacement
avoids the extensity-intensity contradiction in the term
infiltration capacity and allows the use of the term infiltration
rate in the ordinary literal sense to represent the surface flux
under any set of circumstances.
2.1. Infiltration and hydrology
Infiltration rate is of great interest to the hydrologist as
it influences many of the hydrological parameters, such as,
surface runoff, soil moisture, evaporation and
evapotranspiration, ground water recharge and spring flow rates.
It is also of interest to the agriculturists and
conservationists/ environmentalists. The knowledge of
infiltration properties can help agriculturists in adopting
proper irrigation methods and irrigation schedule. The
conservationists/ environmentalists can derive the information on
soil erosion (as runoff depends on infiltration) and in turn the
sedimentation rate in reservoirs using the infiltration data.
2

POINTER GAUGE
Fig.1(a)- Typical Infiltration Curve.
DOUBLE CYLLNDER INFILTROMETRE
0
10
30 P VERNIER SCALE
IRON STAND
OUTER STEELL CYLLNDER
INNER STEEL SYLL NDER
NATURAL SOIL SURFACE
Fig .1(b)Equipment Measuring. Inf iltration Rate
3

Infiltration is one of the most important processes
responsible for modifying precipitation and converting it to
runoff and additions to soil moisture storage. The infiltration
process and other hydrological processes are inter-related
through a common dependence on soil moisture conditions. Thus,
simulation of any hydrological system can not be achieved without
taking into account the infiltration process.
Infiltration studies are mainly addressed to variety of
applications for managing water resources. The design of methods
for flood mitigation and erosion control are often based on
estimates of peak discharge derived from predictions of
infiltration rate. Water conservation procedures require
computation of cumulative infiltration to produce estimates of
runoff yield. Similarly, in exploiting water resources for plant
growth from rainfall or irrigation, an assessment of cumulative
infiltration becomes necessary for calculation of an optimal
level of productivity. This assessment embodies efficient water
use and maintains an acceptable level of erosion control.
2.2. Factors affecting infiltration
Once the importance of infiltration process has been
established, it is useful to go into the details of vLrious
factors which affect the infiltration. Some of the most common
factors affecting infiltration are as follows :
Soil properties (including structure, grain size and its
distribution, porosity and c.mpactness)
Soil moisture
(iii)Landuse characteristics
(iv) Rainfall (amount and duration)
(v)//Soil surface slope , and
(vi) Climate 4
The following sections deal with these aspects in detail.
1. Effect of sozL properties
Musgrave and Horton (1964) have shown that infiltration
characteristics are affected by the grain size distribution in
the soil. In sands, the grains are relatively stable, while soils
with appreciable amounts of clay may provide large pores but
swells appreciably upon wetting. During a storm, sands may slowly
rearrange themselves into a more dense mix than before. In silts
and clays, the soil aggregates break due to the impact of
raindrops, causing the clay and silt particles to flow and
penetrate the existing pores, thus clogging them and greatly
reducing infiltration.
Rauzi and Fly (1968) found that the unfavorable surface soil
conditions markedly reduce water intake rates. They found that
compact or blocky clay sub soils have low intake rates. Clay
soils with good structure have an intake rate 3-4 times more than
that of the dense clay soils with poor structure. Therefore,the
degree of surface soil compactness is a major factor affecting
infiltration rate, Agrawal et al (1974) studied the soils in the
Hisser region, India and observed that as the sand content
decreased and silt plus clay content increased, infiltration rate
decreased. However, the Hissar sandy loam soils had lower
infiltration than the Saffidon loam soils due to unstable
structure.
Many experiments have shown that size and distribution of
pores are greatly influenced by the organic matter content which
controls the stability of soil aggregates in water. The addition
or removal of organic matter therefore changes the prevailing
permeability.
5

2. 2. 2. Ef fect of 5si floLs ure,
Horton (1940) studied the maximum and minimum infiltration
rates of a soil and concluded that the maximum infiltration rate
for a given soil occurs at the beginning of the rain. Horton
further indicated that the infiltration rate decreases rapidly
because of changes in the surface soil structure and increase in
soil moisture, and then, gradually approaches to a somewhat
stable minimum value. Powell and Beasley (1967) reasoned that
when the soil is dry an initially high infiltration rate is
primarily the result of the filling of the pore spaces larger
than the capillary size. Once these pores are filled, the
infiltration is due to the advance of water by capillary
potential.
Green (1962) also concluded that surface sealing diminishes
the effect of antecedent moisture on infiltration because the
hydraulic conductivity of immediate soil surface controls water
flow into the soil and surface sealing does not allow suction
gradients to control the rate of infiltration.
2. 3. c Landuse
Musgrave and Horton (1964) established that vegetation is one
of the most significant factors affecting infiltration of water.
Vegetation protects the soil surface from rainfall impact.
Massive plant root systems, such as grass, keeps the soil
unconsolidated and porous. The organic matter from crops promotes
a crumb structure and improves permeability. Forest litter, crop
residues and other humus material protect the soil surface.
The density of herbaceous vegetation is closely related to
infiltration. Packer(1951) for instance found that the percent of
the soil covered by living or dead plant remains was closely
related to runoff, and therefore, to infiltration. Fibrous-rooted
6

vegetation, such as wheat grass, has been found to be much more
effective in controlling runoff than tap-rooted annual weeds
(Lull 1964).
The great influence of vegetation cover on infiltration is
further evidenced by the fact that bare-soil infiltration
capacity can be increased 3 to 7.5 times with good permanent
forest or grass cover, but little or no increase results with
poor row crops (Jens and McPherson, 1964).
2. E. 4. Effect of Rain/ at
Linsley et al (1949) have reported that rainfall intensity
has little effect on the rate of infiltration when it exceeds the
capacity rate. This agrees with the findings of Schreiber and
Kineaid (1967), but disagrees with those of Fletcher (1960).
Willis (1965) has found that the infiltration rate of a bare soil
was reduced by an increase in Kinetic Energy of rainfall which is
the function of the velocity of impact of raindrops and of the
rainfall intensity. Local experiments on the variation of
infiltration capacity with rainfall intensity showed predominant
variation for bare soil, as noted by Horner and Jens (1942), and
a lesser amount of variation for sodded areas.
Duley and Kelly (1939) found that when the rate of water
input was sufficient to give runoff, a fairly definite amount of
water entered the soil and any excess of this intake appeared in
the runoff. He observed that the rapid reduction in the rate of
intake by cultivated soil, as rainfall continuously fell on the
soil surface, was accompanied by the formation of a thin, compact
layer at the soil surface, and that the water was able to pass
this layer very slowly. He postulated that this thin, compact
surface layer was apparently the result of severe structural
disturbance due in part to the beating effects of the rain-drops,
and in part, to an assorting action, as water flowed on the soil
7

surface, fitting fine particles around the larger once to form a
relatively impervious seal.
Effect of SoCL La-E./ace Stop..
Ouley and Kelley (1939) tested soils on different slopes and
noted that there was a tendency for the amount of water intake to
decrease slightly with increase in slope. The greatest intake was
found on gentle slopes.
22.6. Effect of c?. mate
Apart from rainfall, the most important climatic effect on
infiltration is due to freezing effects. Frozen ground affects
infiltration. If frozen when very dry, some soils are fluffed up
and frost is discontinuous, as in the honey comb and stalactite
types. A soil under this condition may be as permeable as, or
even more permeable than, frost-free soil. On the other hand, if
the soil is frozen while saturated, concrete frost often results
in the form of a very dense, nearly impermeable layer often
results. Trimble (1958) found that in the North East infiltration
was zero on concrete frost in the open and forest area, but was
not affected where soil was transversed by large holes in which
water had not frozen.
3.0.INFILTRATION ESTIMATION AND MEASUREMENT TECHNIQUES
The estimation of infiltration rates is required for the
calculation of runoff for design purposes and also for assessing
the effect of land use changes. The three step sequence, i.e.
surface entry, transmission and exhaustion of storage presents
difficulties in the measurement of infiltration. For the most
part, hydrologists determine the rate and amount of infiltration
in-soak and attempt to correlate this with various combinations
of soil, vegetation and antecedent soil moisture. There are two
8
general approaches to determine the infiltration capacity of a
soil cover and soil moisture complex. One of these is the
analysis of hydrographs of runoff from natural rainfall on plots
and watersheds. The other is the use of infiltrometers with
artificial application of water to enclosed sample areas.
3.1. Empirical relations for estimation of infiltration rate
Many empirical and physical relationships
developed to express infiltration/recharge as a
amount of clay in the soil or amount of the total
water infiltrated into the soil. The empirical
models have been developed by applying the
have been
function of
quantity of
equations or
principles
governing soil water movement for simplified boundary or
initial conditions. These models generally correlate
infiltration as measured by one of the methods to some
property or properties of the soil vegetative system. This
involves evaluation of constant or parameters for a specific
geographical location. The physically based models on the
other hand are more complicated and use the theory of continuity
of mass and soil water movement with certain simpltfied
assumptions. They normally employ numerical methods for the
solution of governing differential equations and are extremely
valuable in analysing the effect of various factors on the
infiltration process. The use of a particular equation or
model depends on the intended purpose and the accuracy
desired.
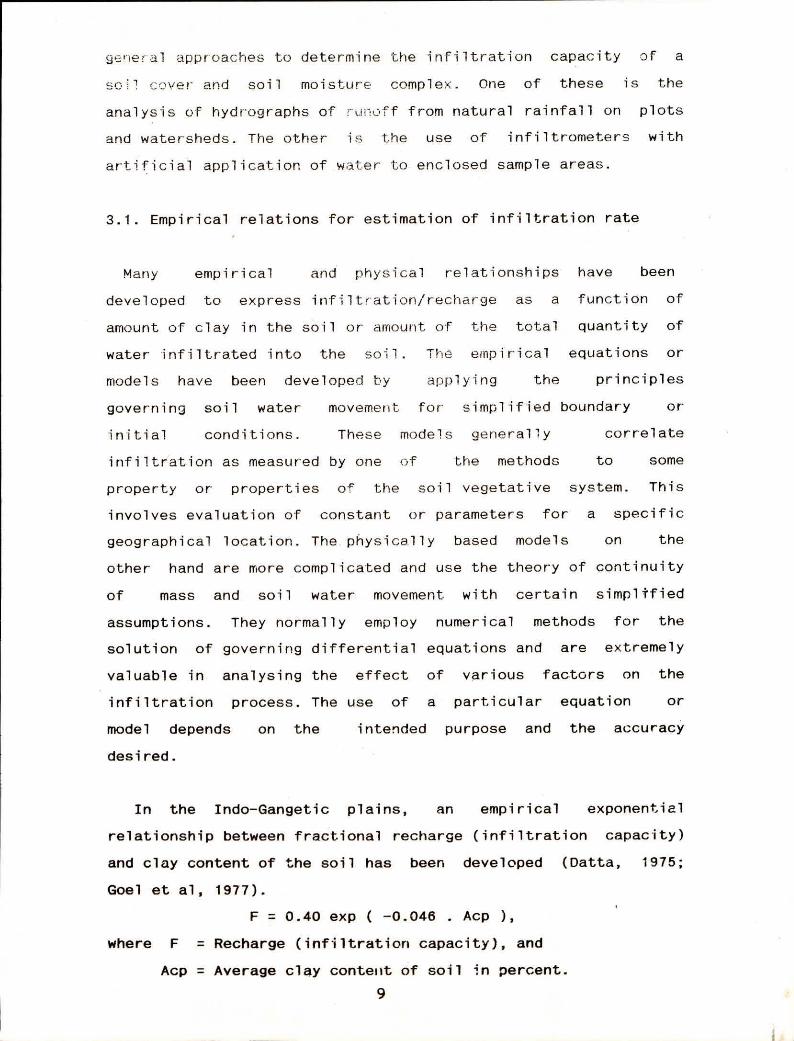
In the Indo-Gangetic plains, an empirical exponential
relationship between fractional recharge (infiltration capacity)
and clay content of the soil has been developed (Datta, 1975;
Goel et al, 1977).
F = 0.40 exp ( -0.046 . Acp ),
where F = Recharge (infiltration capacity), and
Acp = Average clay content of soil in percent.
9

Two more empirical formulae are used in the Indo Gangetic
plains, commonly known as the Amritsar Formula and the Chaturvedi
formula for recharge. The Amritsar formula has been developed for
Upper Indus basin (in Punjab), whereas the Chaturvedi formula is
for Upper Yamuna basin.
Amritsar formula : Re = 3.9(p-40.6)1/2 (Sehgal, 1973)
Chaturvedi formula Re = 3.5(p-38)2/3 (Chaturvedi, 1946)
where, Re = Estimated groundwater recharge in cm.
p = Precipitation + supplemental irrigation in cm.
3.2. Infiltrometers
Infiltrometers are the simplest and the most convenient
equipment to measure infiltration rate for soils which involves
artificial application of water to enclosed areas. Infiltrometers
can be classified into two general groups :
Rainfall Simulators, with the water applied in the form
and at the rate comparable with natural rainfall, and
Flooding type, with the water applied in a thin sheet upon
an enclosed area and usually in a manner to obtain a constant
head.
In India only flooding type infiltrometers are used, which
may vary in size, quantity of water required, and measuring
device for water level changes. Among the two types of flooding
infiltrometers, mainly double ring infiltrometers are used, but
sometimes single ring infiltrometers are also used.
3.2.1. Sinete Rine. infiltrometer
It consists of a metal cylinder which is driven into the soil
to a short distance (nearly 15 cm). The measurement of
infiltration is done by observing the rate of fall in water
surface through a graduated column, or by adding water manually
10

at selected time intervals to maintain a particular level.
Refinements to the technique involve the introduction of an outer
ring as a buffer and devices for monitoring a constant head of
supply
3.2.2. Double rine IAfiLtrometer
The most common type consists of two shallow concentric rings
of sheet metal (Fig.lb), usually ranging from 22.5 to 90 cm
diameter. They are placed with their lower edges a few cms below
the ground surface and with the upper portion projecting above
(as shown in Fig.lb). Water is now applied in both compartments
'a' and 'b' and is always kept at same level in both. The
function of the outer ring is to prevent the water within inner
space from spreading over a larger area after penetrating below
the bottom of the ring. From the rate at which water is added to
the inner ring in order to maintain a constant level, the
infiltration rate and its variation with time are determined. A
plot of infiltration rate in cm/hr vs time is shown in Fig.la.
3.3. Recent Developments in Infiltrometers in India
There have been significant technological developments in the
infiltrometers in India with a view to automatize the operation
and thus to minimise the errors in the field. However, presently
they are in resting stage.
3.3.1. Microprocessor-based Riag Infatrometer
The National Institute of Hydrology, Roorkee has developed a
Microprocessor based Ring Infiltrometer which is a double ring
(flooding type) infiltrometer with an electronic recording
device, developed by National Institute of Hydrology, Roorkee. In
this infiltrometer, a 8085 microprocessor has been used in the
memory module to store the infiltration rate data automatically
11
at a pre-determined time step. This portable device can record
upto 1000 values. A special constant head device based on
Marriot's arrangement has also been developed to maintain a
constant head in the rings. The main advantage of this type of
infiltrometer is its easy operation. Once the equipment is
installed in the field, no skilled personnel is required for
taking the readings during the infiltration test. Human errors
are minimised to a great extent by this automation of the
infiltrometer. The data stored in the microprocessor can be
retrieved directly on to a personal computer and can be analysed
easily.
25. 2.. 2. FortflhLA RthrtfaL 2.;?:fro_iLator InfiLtrometer
Bhardwaj and Singh (1992) have developed a portable rainfall
simulator infiltrometer at the Indian Institute of Technology,
Kharagpur. The design of this rainfall simulator infiltrometer
is based on the existing designs of Adam et al. (1957) and
Tricker (1979) and it incorporates some modifications to improve
field performance and portability. The portable rainfall
simulator infiltrometer consists of the following principal
components (i) Drop forming mechanism, (ii) Water reservoir,
(iii) Pressure head regulator, (iv) Wind shield and stand, and
(v) Infiltration cylinder and runoff collector. Though a number
of rainfall simulator infiltrometers are available, the main
advantage of this new infiltrometer is its portability (weighs
about 15 kg).
4.0. INFILTRATION STUDIES IN DIFFERENT STATES OF INDIA
India is a vast country with a total geographical area of 329
million hectare. As per the available information infiltration
studies have been carried out in few states and that too at few
places. The present status of infiltration data available for
different states is present next.
12

4.1 .Andhra Pradesh
The infiltration tests were carried out by All India soil and
land use survey organisation for 75 soil ser1es. Data available
for Andhra Pradesh are reproduced in Table 4.1.1.
Table 4.1.1 : Infiltration data for Andhra Pradesh
District Taluk Village Soil series Infilt. rate
(cm/hr)
Adilabad Mudhol Nirmal Mahagaon Basar 5.4
Medak Sangareddy BudaPalli Debbavagu 2.0
Adilabad Mudhal Nirmal Mahagaon Ekgaon 1.8
Guntur Palnad Sirigiripadu Loyapalli 8.7
Medak Zahcerabad PeddachelMada Mamdapur 8.2
Adilabad Mudhol Nirmal Pardi Masalga 1.3
Adilabad Mudhol Nirmal Mahagaon Mogli 1.9
Adilabad Mudhol Nirmal Mahagaon Mudhol 1.0
Adilabad Mudhol Nirmal Mahagaon Nimba 2.9
Guntur Pal nad Sirigiripadu Pal ii 10.9
Adilabad Mudhol Nirmal Mahagaon Pardi 1.3
Medak Zaheerabad Pipalpalli Pipalpalli 3.8
Guntur Pal mad Sirigiripadu Srigiri 1.7
Adilabad Mudhol Nirmal Mahagaon Tanur 1.8
Adilabad Mudhpol Nirmal Kotalgaon Timmapur 0.8
Adilabad Mudhol Nirmal Hald Yelwi 4.2
An interesting observation from Table 4.1.1 is that whereas
the highest infiltration rates of 10.9 cm/hr and 8.7 cm/hr are
recorded in the Guntur district at Sirigiripadu village for Palli
and Loyapalli soil series respectively, the same locality also
records one of the lowest value (1.7 cm/hr) for Sirigiri soil
series. Although no data is available about the soil type at
13

these localities, this large variations may be related to the
grain size distribution at different test sites.
4.2. Bihar
The data on Infiltration for the Bihar state extracted from
the Publication of All India Soil and Land Use Survey
"Infiltration Studies in 75 Soil Series is presented below:
Table 4.2.1 : Infiltration data for Bihar
District Village Soil series Infilt. rate (cm/hr)
Santhal Pargana Belkupi Hatiapathar 4.2
Santhal Pargana Bahiata Jarmundi 0.8
Santhal Pargana Lachnipur Lachnipur 12.0
Santhal Pargana Singlibad Pubaro 6.8
4.3. Delhi
The infiltration studies carried out by All India soil and
land use organization are presented below:
Table 4.3.1 : Infiltration data for Delhi
District Taluk Village Soil series Infilt. rate (cm/hr)
Delhi Mehrauli block Bijwasan Asola 1.8
Delhi Mehrauli block Bijwasan Bijwasan 2.2
Delhi Mehrauli block Bijwasan Khanpur 5.8
Delhi Mehrauli block Rajokari Maidangarhi 4.8
Delhi Mehrauli block Malawan Malwan 0.8
Delhi Mehrauli block Bharthal Naib Sarai 2.8
Delhi Mehrauli block Rangpuri Shoorpur 1.1
14
All the data in the Table 4.3.1 come from the Mehrauli block
from different soil series leading to a large variation in
infiltration rates. The highest and lowest infiltration rates are
5.8 cm/hr and 0.8 cm/hr respectively.
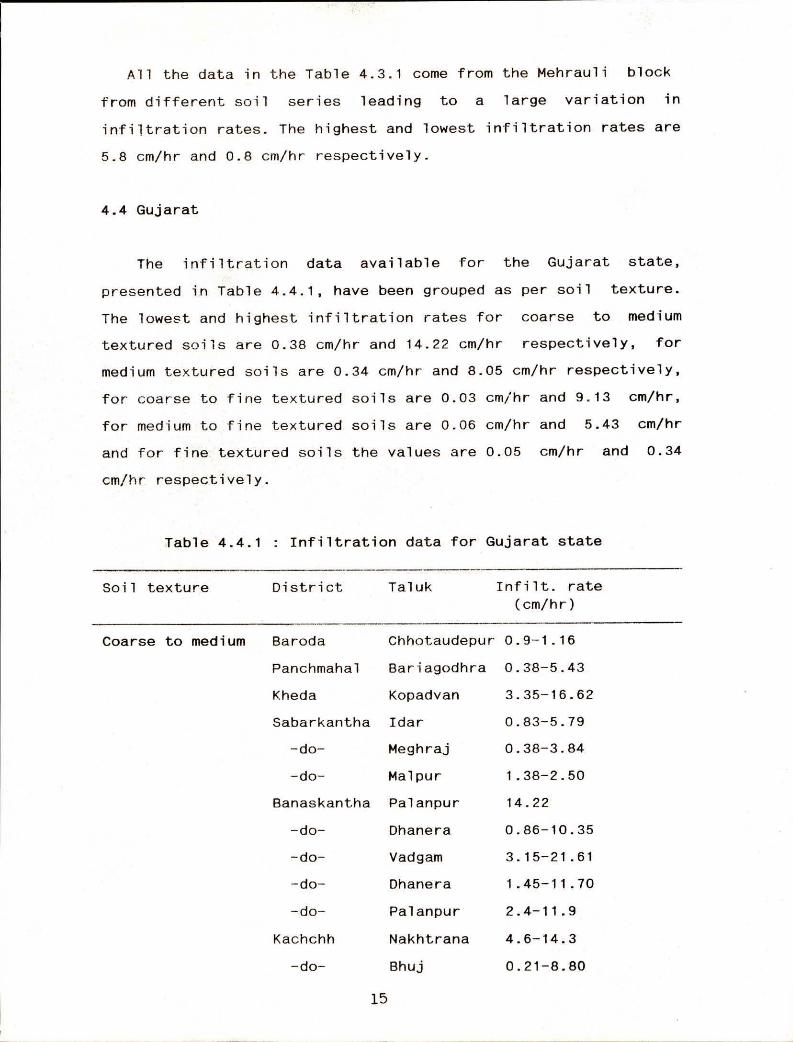
4.4 Gujarat
The infiltration data available for the Gujarat state,
presented in Table 4.4.1, have been grouped as per soil texture.
The lowest and highest infiltration rates for coarse to medium
textured soils are 0.38 cm/hr and 14.22 cm/hr respectively, for
medium textured soils are 0.34 cm/hr and 8.05 cm/hr respectively,
for coarse to fine textured soils are 0.03 cm/hr and 9.13 cm/hr,
for medium to fine textured soils are 0.06 cm/hr and 5.43 cm/hr
and for fine textured soils the values are 0.05 cm/hr and 0.34
cm/hr respectively.
Table 4.4.1 : Infiltration data for Gujarat state
Soil texture District Taluk Infilt. rate (cm/hr)
Coarse to medium Baroda Chhotaudepur 0.9-1.16
Panchmahal Bariagodhra 0.38-5.43
Kheda Kopadvan 3.35-16.62
Sabarkantha Idar 0.83-5.79
-do- Meghraj 0.38-3.84
-do- Malpur 1.38-2.50
Banaskantha Palanpur 14.22
-do- Dhanera 0.86-10.35
-do- Vadgam 3.15-21.61
-do- Dhanera 1.45-11.70
-do- Palanpur 2.4-11.9
Kachchh Nakhtrana 4.6-14.3
-do- Bhuj 0.21-8.80
15
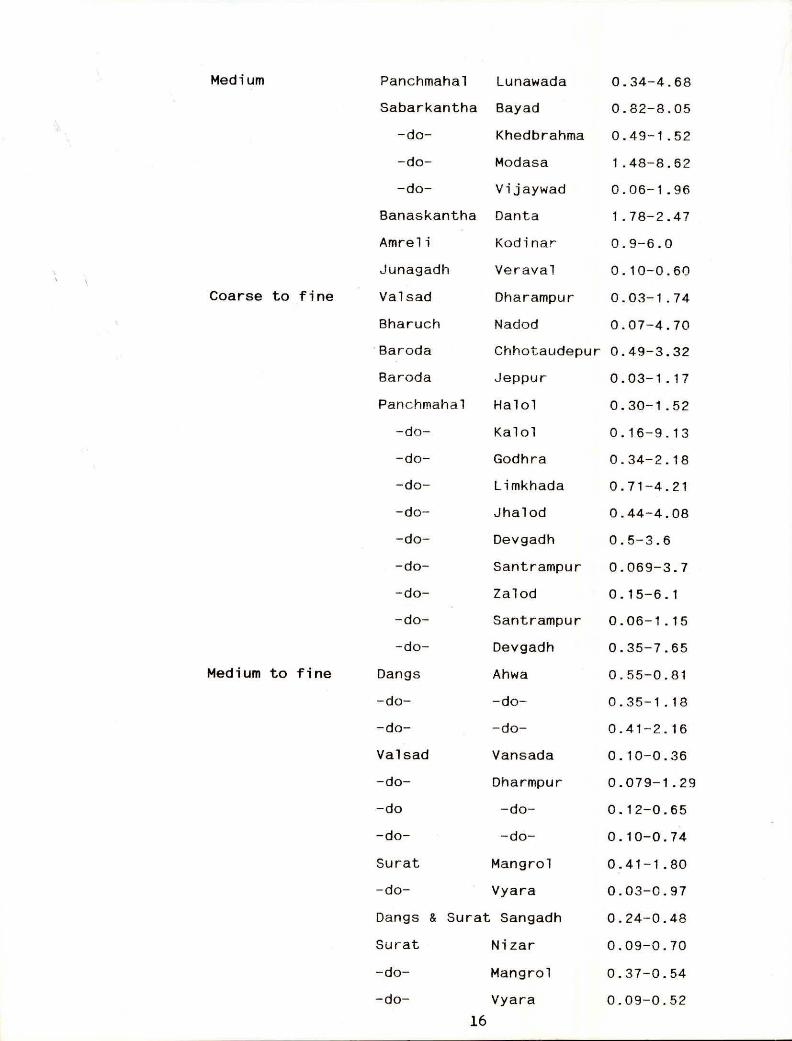
Medium Panchmahal Lunawada 0.34-4.68
Sabarkantha Bayad 0.82-8.05
-do- Khedbrahma 0.49-1.52
-do- Modasa 1.48-8.62
-do- Vijaywad 0.06-1.96
Banaskantha Danta 1.78-2.47
Amreli Kodinar 0.9-6.0
Junagadh Veraval 0.10-0.60
Coarse to fine Valsad Dharampur 0.03-1.74
Bharuch Nadod 0.07-4.70
Baroda Chhotaudepur 0.49-3.32
Baroda Jeppur 0.03-1.17
Panchmahal Halol 0.30-1.52
-do- Kalol 0.16-9.13
-do- Godhra 0.34-2.18
-do- Limkhada 0.71-4.21
-do- Jhalod 0.44-4.08
-do- Devgadh 0.5-3.6
-do- Santrampur 0.069-3.7
-do- Zalod 0.15-6.1
-do- Santrampur 0.06-1.15
-do- Devgadh 0.35-7.65
Medium to fine Dangs Ahwa 0.55-0.81
-do- -do- 0.35-1.18
-do- -do- 0.41-2.16
Valsad Vansada 0.10-0.36
-do- Dharmpur 0.079-1.29
-do -do- 0.12-0.65
-do- -do- 0.10-0.74
Surat Mangrol 0.41-1.80
-do- Vyara 0.03-0.97
Dangs & Surat Sangadh 0.24-0.48
Surat Nizar 0.09-0.70
-do- Mangrol 0.37-0.54
-do- Vyara 0.09-0.52 16

Fine
Bharauch
-do-
do-
do-
Baroda
Baroda
Panchmahah
Kheda
Ahmedabad
-do-
Sabarkantha
-do-
Banaskantha Rajkot
Rajokot
Rajkot
Rajkot
Rajkot
Bhavnagar
do-
do-
-do-
Jamnagar
Jamnagar
Junagadh
do-
Junagadh
Rajkot
Dangs
Jamnagar
Rajkot
Rajkot
Valsad
Surat
do-
do-
Saghra
Dediapada
-do-
-do-
Naswadi
Chhotaundepur
Devagadh
Thasara
Ahmedabad
-do-
Himatnagar
Bhiloda
Danta Rajkot
Padadhari
Morbi
Padadhari
Upleta
Ghoga
-do-
Savarkundala
Palitana
Lalpura
Bhanvad
Una
Junagadh
Bhesan
Paddhari
Ahwa
Jodia
Paddhari
Khambhali
Vansda
Mangrol
Mandvi
Mangrol 17
0.06-0.79
0.15-1.22
0.07-0.52
0.076-0.11
0.086-0.52
0.24-1.51
1.13-3.85
0.09-0.79
0.02-4.38
0.10-5.45
0.32-8.16
0.024-4.11
0.29-4.31 0.14-0.36
0.08-2.68
0.45-4.30
0.07-0.64
0.18-4.52
0.06-1.9
0.20-0.38
0.39-2.54
0.32-1.85
0.4-4.4
0.21-6.97
0.06-4.55
0.08-1.35
0.16-0.92
0.12-0.28
0.12-0.34
0.02-0.11
0.09-0.22
0.12-0.56
0.07-0.17
0.20-0.67
0.05-0.12
0.22-0.34
Baroda Chhotaudepur 0.08-0.12
Ahmedabad Dhandhuka 0.097
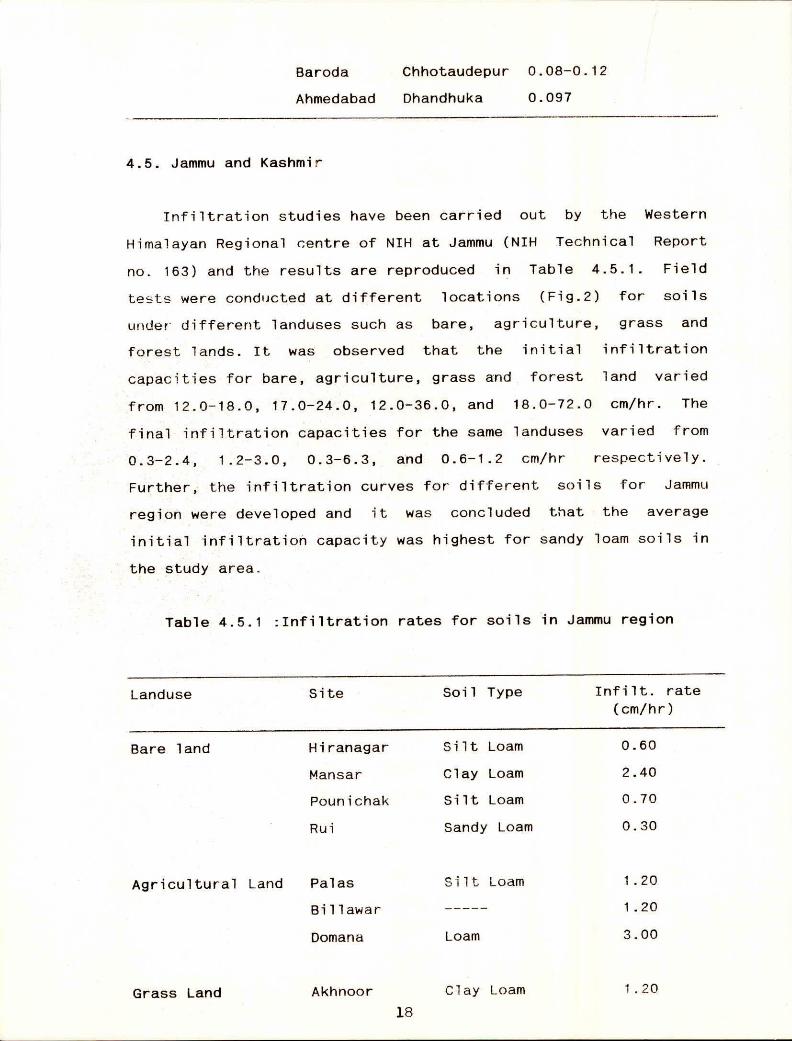
4.5. Jammu and Kashmir
Infiltration studies have been carried out by the Western
Himalayan Regional centre of NIH at Jammu (NIH Technical Report
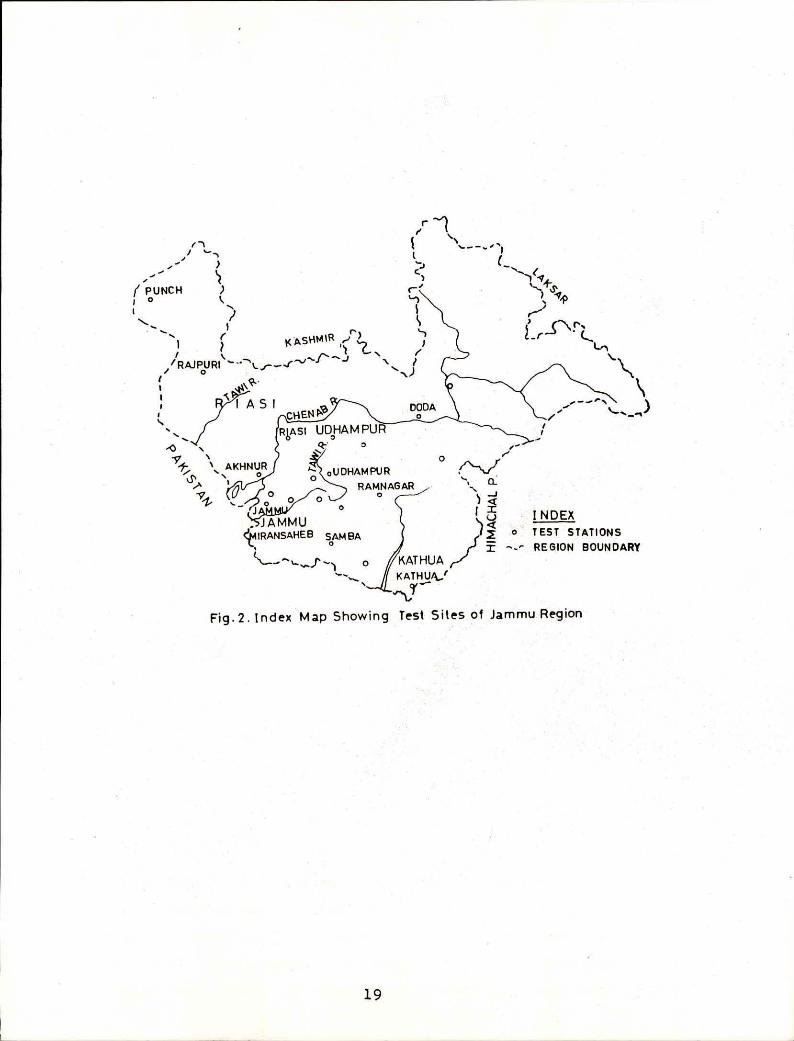
no. 163) and the results are reproduced in Table 4.5.1. Field
tests were conducted at different locations (Fig.2) for soils
under different landuses such as bare, agriculture, grass and
forest lands. It was observed that the initial infiltration
capacities for bare, agriculture, grass and forest land varied
from 12.0-18.0, 17.0-24.0, 12.0-36.0, and 18.0-72.0 cm/hr. The
final infiltration capacities for the same landuses varied from
0.3-2.4, 1.2-3.0, 0.3-6.3, and 0.6-1.2 cm/hr respectively.
Further, the infiltration curves for different soils for Jammu
region were developed and it was concluded that the average
initial infiltration capacity was highest for sandy loam soils in
the study area.
Table 4.5.1 :Infiltration rates for soils in Jammu region
Landuse Site Soil Type Infilt. rate
(cm/hr)
Bare land Hiranagar Silt Loam 0.60
Mansar Clay Loam 2.40
Pounichak Silt Loam 0.70
Rui Sandy Loam 0.30
Agricultural Land Palas Silt Loam 1.20
Billawar 1.20
Domana Loam 3.00
Grass Land Akhnoor Clay Loam 1.20
18
er -1
) 9 . 4> /
I .-' 1 ‘-_, , -• )
... il ...
( PUNCH )
I k
) i o
\ ..
,
/ /RA.IPoURI *--ThLi---4-1(LAtk"11r--1.1) 1 /
1 1 "i ‘7-• N ( 1 / \
r '-..) I t I AS I DODA t. ... RtC:SEi N :VA M PU
0
-fa . .5-. 0 9 N AKHNUR d' ‘
G LIOHAMPUR A I RAMNAG AR t
'fr
_ r • N
%.
11:
? 4 u INDEX TEST STATIONS REGION BOUNDARY
. JAMMU etlIRANSAHEB SAM BA
-`••••-.P o KATHUA K ATM
Fig.2. Index Map Showing Test Sites of Jammu Region
19

Birpur
Jandrah
Kathua
Loam
Clay Loam
Sandy Loam
0.30
0.90
0.60
Miraliya Clay Loam 6.30
Miransaheb Clay Loam 0.70
Ramnagar Clay Loam 0.70
Surinsar Clay Loam 3.v0
Nagrota Silt Loam 5.00
Forest Land Palas Silt Loam 0.70
Kud Loam 1.20
Manthal Loam 0.60
4.6. Karnataka
The Infiltration studies carried out by All India Soil and
Land use Survey organization are presented in Table 4.6.1.
Table 4.6.1 : Infiltration data for Karnataka
District Taluk Village Soil series Infilt. rate (cm/hr)
Bidar Bidar Almapur Basanthpur 12.00
Bidar Aurad Jamgi Chimkod 7.3
Bidar Bidar Almapur Gadgi 8.5
Bidar Aurad Wadgaon Kundagol 2.2
Bidar Bidar Almapur Malegaon 12.8
Bidar Bidar Almapur Nandgaon 6.0
Bidar Aurad Sorhally Sorhally 2.8
Bidar Aurad Kowtha Sulttanpur 1.8
Rao and Karanth (1988) have carried out studies on
infiltration characteristics in the Budigere basin. The map of
the basin along with infiltration test sites are shown in Fig.3a.
The experiments were carried out in stream beds, tank beds,
cultivated areas, and uncultivated areas to study the relative 20
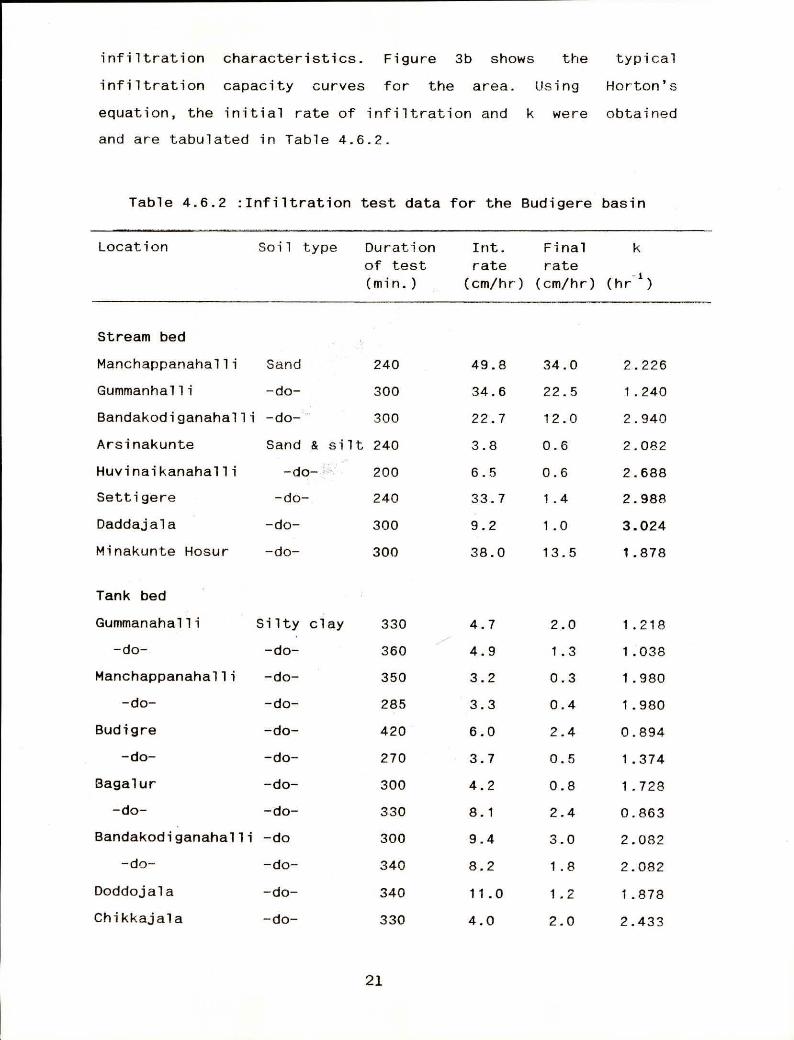
infiltration characteristics. Figure 3b shows the typical
infiltration capacity curves for the area. Using Horton's
equation, the initial rate of infiltration and k were obtained
and are tabulated in Table 4.6.2.
Table 4.6.2 :Infiltration test data for the Budigere basin
Location Soil type Duration of test (min.)
Int. rate
(cm/hr)
Final rate
(cm/hr) (hr -1)
Stream bed
Manchappanahalli Sand 240 49.8 34.0 2.226
Gummanhalli -do- 300 34.6 22.5 1.240
Bandakodiganahalli -do- 300 22.7 12.0 2.940
Arsinakunte Sand & silt 240 3.8 0.6 2.082
Huvinaikanahalli -do- 200 6.5 0.6 2.688
Settigere -do- 240 33.7 1.4 2.988
Daddajala -do- 300 9.2 1.0 3.024
Minakunte Hosur -do- 300 38.0 13.5 1.878
Tank bed
Gummanahalli Silty clay 330 4.7 2.0 1.218
-do- -do- 360 4.9 1.3 1.038
Manchappanahalli -do- 350 3.2 0.3 1.980
-do- -do- 285 3.3 0.4 1.980
Budigre -do- 420 6.0 2.4 0.894
-do- -do- 270 3.7 0.5 1.374
Bagalur -do- 300 4.2 0.8 1.728
-do- -do- 330 8.1 2.4 0.863
Bandakodiganahalli -do 300 9.4 3.0 2.082
-do- -do- 340 8.2 1.8 2.082
Doddojala -do- 340 11.0 1.2 1.878
Chikkajala -do- 330 4.0 2.0 2.433
21

• . • •
FIG.3a :MAP OF BUDIGERE BASIN SHOWING INFILTRATION TEST SITE
STREAM BED x CULTIVATED LAND A UNCULTIVATED LAND
TANK BED 60
50
40 0 0 0
0 30
20
10
0 • 0 40 00 120 160 200 240 2E0
TIME IN MINUTES
FIG.3b:TYPICAL INFILTRATION CAPACITY CURVES
22

Cultivated fields
Manchanappanahalli Red loam 300 18.3 3.2 1.782
+ silt
Begur do 240 9.1 0.6 1.470
Marenahalli do 300 18.1 8.0 1.218
Chokkanahalli do 320 39.5 13.0 0.852
Japalatti do 360 24.3 10.0 1.746
Doddajala do 280 85.0 25.0 2.'30
Satanur do 360 20.3 6.0 1.56
Gummanahalli do 332 28.1 18.0 0.558
Bandakodiganahalli do 330 8.5 4.8 2.510
Bainhalli do 300 6.6 3.0 5.374
Gadenahalli do 300 4.6 2.4 3.892
Yertigenehalli do 300 5.9 1.8 4.512
Narayanapura do 300 5.3 1.2 2.433
Vidyenepur Loam,silt+ 300 20.0 7.5 4.828
sand
Misiginahalli Red loam 240 7.1 3.0 2.337
+ silt
Uncultivated land
Chowappanahalli silty 300
loam
Bagalur do 300
Budigere do 360
Sibgahalli do 240
14.2 5.8 1.434
9.2 3.6 1.158
5.3 1.6 2.916
7.1 3.0 2.337
Ranganna et al (1991) conducted infiltration tests using
Double Ring Infiltrometer in the Pavanje River Basin of Dakshina
Kannada District, Karnataka. Figure 4a shows the Pavanje river
basin with infiltration test sites. Table 4.6.3 summarizes the
infiltration data and the representative infiltration curves are
shown in Fig.4b. Using Horton's equation (Horton, 1933), initial
23

and final rate of infiltration were computed (Table 4.6.3). In
general, the infiltration rates exceeded 2.5 cm/hr. The large
variability in the infiltration rate was attri buted to soil type,
moisture content and underlying lithology.
Table 4.6.3 : Infiltration data for Pavanje basin, Karnataka
Location Soil type Duration Int.infil Fin.infil. of test rate rate
(min.) (cm/hr) (cm/hr)
KERC campus Laterite 180 16.08 6.80
KERC campus Laterite 155 20.16 2.80
KERC campus Laterite 225 18.00 4.16
KERC campus Laterite 266 24.00 7.28
KERC campus Laterite 325 18.00 4.50
Haleyangadi Loamy sand 240 18.96 1.76
Chelairu Padavu Laterite 180 15.84 3.76
Tokuru Kemral Laterite 195 21.84 3.12
Tokuru Laterite 135 06.00 2.23
Bajpe Laterite 225 22.00 4.80
Permude Sandy soil 270 64.80 19.28
Kompadavu Laterite 195 17.52 6.64
Hi jar Laterite 210 12.00 2.80
Niddodi Laterite 195 15.84 2.00
Katil Laterite 225 14.50 1.60
Chitrapu Sandy soil 300 54.48 20.80
Yekkar Laterite 180 17.81 3.20
Bellairu Sandy clay 120 11.76 3.24
Surinje Sandy clay - 28.19 5.83
Mennabettu Clay soil - 3.35 0.57
It is observed from Table 4.6.3 that the infiltration rates
are the highest in sandy soils (20.8 cm/hr, Chitrapu station) 24

followed by 19.28 cm/hr at Permude station. But the infiltration
rates do not have any apparent relationship with topography.
Statistical analysis was also carried out to know the relations
between each infiltration test. The mean, median, and range
values for f-, and k in respect of all 20 tests are
graphically represented in Fig.4c.
The NIH Regional Centre at Selgaum has conducted infiltration
tests in the Malaprapha and Ghataprapha sub-basin and the data
are reproduced in Tables 4.6.4 and 4.6.5.
Table 4.6.4 : Infiltration Test Data for Malaprabha Sub-Basin
Site Taluk Soil Type Infil. rate (cm/hr)
Kankumbi Khanapur Laterite mixed Forest, 5.86
Jamboti Khanapur Lateritic forest soil 3.63
Khanapur Khanapur Granitic Clayey Sandy 2.06
Avradi Bailahongal Black Cotton Soil 5.80
Savatgi -do- Red Sandy Soil 4.80
Bubarkatti -do- Silty clay 1.50
Gudikatti -do- Red Sandy Soil 5.40
Narendra Dharwar Red Laterite Soil 2.80
Gumgol Navalgund Black Cotton Soil 1.20
Shirkol -do- -do- 1.20
Bhadrapura -do- -do- 1.20
Kondikoppa -do- -do- 3.90
Kadadi Gadag -do- 0.90
Ron Ron -do- 1.90
Jakkali Ron -do- 2.80
Itagi Ron -do- 2.70
Gajendragarh Ron Clayey Loam 1.20
Timmapur Badami Black Clay Loam 3.20
Agsarkoppa -do- Black Cotton Soil 1.40
25

—INFILTRATION RATE --CUMULATIVE INFIL-
TRATION RATE
,, •-•-•--ree ........ PAVA NJ E
PLACE KATIL
f0 fc 80 BO 80
70 70 70
60 60 60 50 50 50
40 40 40
30 30 30
20 20 20
10 to 10 I 10 I i I 10 20 30 40 50 60 70 5 10 15 20
0 25
RANGE RANGE
Fig4(c Histograms Showing fo , fc and
PE
RC
EN
TA
GE
-
-
—1 in 0.025 0.05 0.075 0.10 0125
RANGE
741451 0 us MULKY RIVER 74.1501 le 3...
13' 149.1, V 0 BAY
05 2 NGAL 4 7' 841 4( 11-
1741551
FtAINGAUGING STATION 13
. RIVER GAUGING Si.
x INFILTRATION TESTS 05 CONDUCTED
4 t
13 4 00' 00'
0 1 2 3 4 5 6 7 Bkm 661m1m1m1m1mbilsol BASIN AREA•201 Sq.km.
/7045' 74150' 74155' 76100e
Fig.1431Pavanje River Basin Showing Infiltration Test Sites
Z 50 0 3o it- < 1 0 cr
z 0 40 80 120 160 200 240 1-- 0 TIME ( Minutes) -J
4 INFILTRATION - ...7°° tz7- _ fr- 70
1X 60 -----CUMULATIVE ....ea.- 600 el.- -.1 5 INFILTRATION ...---c- 500 W
RATE..-• -"IASIN PAVANJE in, ...? . e PLACE KATIL -- IZE Z 30 300 — r
0 40 60 120 160 TIME (Minutes)
Fig.41131 Infiltration Curve
20 Ip 200 10 100
0
26

Kankankoppa
Murdi
Nandikeshwar
Kelur
Badami
Asoga
-do-
-do-
Hungund
-do-
Badami
Khanapur
Mixed Clayey Loam
Clayey Loam
Mixed Clayey Loam
Mixed Sandy Loam
Red Sandy Loam
Heavy Loam
0.80
1.60
1.40
23.10
9.60
3.00
Jartoti -do- Medium Loam 2.40
Kankumbi -do- Sandy Loam 3.00
Kankumbi -do- -do- 5.10
Jamboti -do- Medium Loam 3.30
Bamanavadi belgaum Heavy Loam 0.90
Santbastvadi -do- Clay 1.20
Uchod cross Khanapur Clay 2.40
Kusmoli -do- Heavy Loam 3.60
Gangoli -do- Light Loam 3.30
Gunji -do- Heavy Loam 1.50
Manturgi -do- Medium loam 1.20
It is observed from Table 4.6.4 that mixed sandy loam records
very high infiltration rate of 23.10 cm/hr. The lowest
infiltration rates (0.90 - 1.50 cm/hr) are recorded by Black
Cotton soils/silty clay soils except at Avradi site where Black
Cotton soil records an infiltration rate oF 5.80 cm/hr. Different
grades of loamy soils record moderate infiltration rates ranging
from 1.40-9.60 cm/hr.
In the Ghataprabha basin (Table 4.6.5), the highest
infiltration rate of 17.0 cm/hr is recorded in red sandy loam and
the lowest of 0.60 cm/hr is in red clayey loam.
27

Table 4.6.5 : Infiltration Test Data for Ghataprabha Sub-Basin
Site Taluk District Soil Type Infil. rate (cm/hr)
Kaitnal Gokak Belgaum Red Sandy Loam 2.50
Kolvi -do- -do- -do- 1.00
Mamdapur -do- -do- -do- 17.00
Maldinni -do- -do- Mixed Sandy Loam 2.50
Mudalgi -do- -do- -do- 4.00
Saidapur Jamakhandi -do- Red Clayey Loam 0.90
Lokapur Mudhol -do- -do- 0.60
Gaddam Ken i Bagalkot -do- Mixed Soil 1.80
Bagalkot Bagalkot -do- -do- 1.60
Daddi Sankeshwar -do- Heavy Loam 0.90
Daddi -do- -do- Medium Loam 2.10
Waghroli Gadinglaj Kolapur Heavy Loam 3.30
Watangi -do- -do- Medium Loam 3.60
Chandgad Chandgarh -do- Light Loam 8.40
Gudavali -do- -do- -do- 4.80
Nagvey -do- -do- Heavy Loam 13.20
Turkevadi -do- -do- Medium Loam 2.40
Turkevadi -do- -do- -do- 7.20
Halkarni -do- -do- -do- 10.20
Shirgaon -do- -do- Heavy Loam 1.80
Kovad -do- -do- Medium Loam 16.50
Kovad -do- -do- -do- 2.10
28

Table 4.6.6 summarizes the infiltration data for a few more
sites in Dharwar, Raichur, Bijapur, and Gulberga district of
Karnataka conducted by DAU, Dharwar. The infiltration rate values
Table 4.6.6 : Infiltration data based on the tests conducted by DAU.
Location Taluk District Soil Type Infil.rate
(cm/hr)
Devihosur Haven i Dharwar Chlorite Schist 1.20
Dharwar Dharwar Dharwar Shale 2.00
Raichur Raichur Raichur Granite Gneiss 0.30
Bijapur Bijapur Bijapur Deccan Trap 0.90
Kajjidoni Bagalkot Bijapur Limestone 4.00
Yediapur Shorapur Gulbarga Granite Gneiss 1.70
Mudhbal Shahapur do Limestone 1.30
Arabgunji Jewargi do Basalt 0.80
Hansurya do do do 0.20
Hungund Hungund Bijapur Mixed Sandy Loam 8.00
presented in Table 4.6.6 generally represent a rather low
infiltration ranging from 0.20-4.0 cm/hr with the only one high
value of 8.0 cm/hr at Hungund site.
4.7. Madhya Pradesh
the All India soil and land use survey carried out
Infiltration studies for 75 soil series covering River Valley
Projects. The areas covered under M.P. alongwith site location,
soil series & infiltration rate are presented in Table 4.6.1.
29
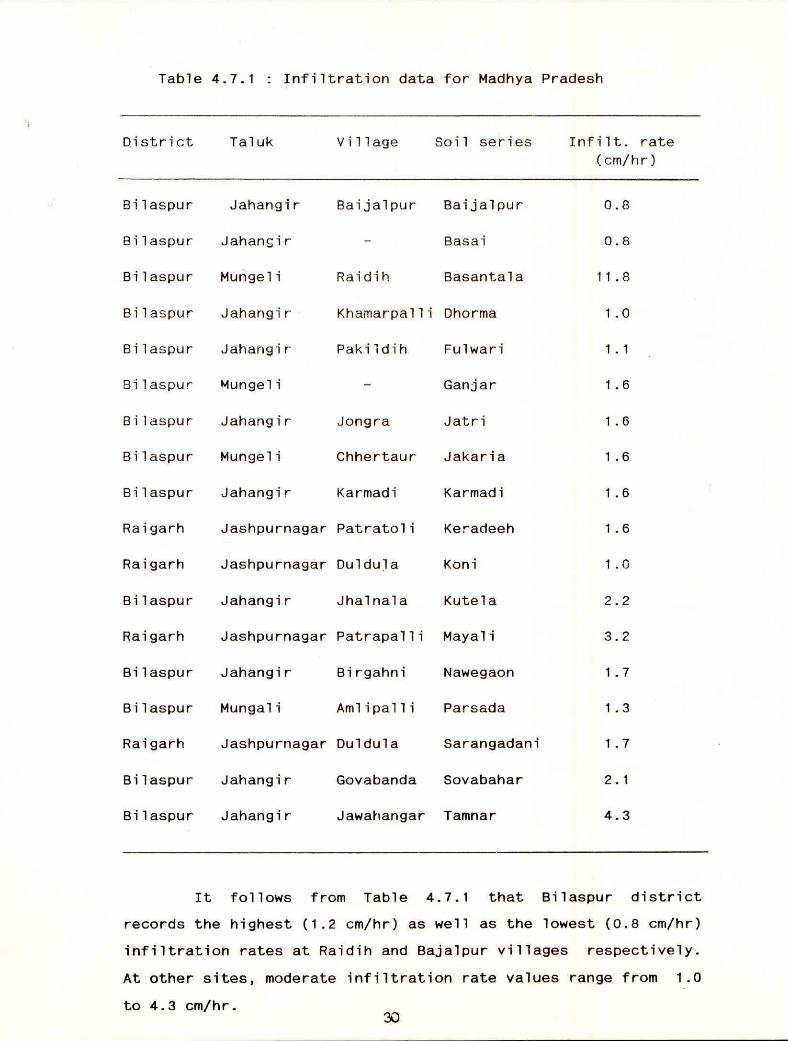
Table 4.7.1 : Infiltration data for Madhya Pradesh
District Taluk Village Soil series Infilt. rate
(cm/hr)
Bilaspur Jahangir Baijalpur Baijalpur 0.8
Bilaspur Jahangir Basai 0.8
Bilaspur Mungeli Raidih Basantala 11.8
Bilaspur Jahangir Khamarpalli Dhorma 1.0
Bilaspur Jahangir Pakildih Fulwari 1.1
Bilaspur Mungeli Ganjar 1.6
Bilaspur Jahangir Jongra Jatri 1.6
Bilaspur Mungeli Chhertaur Jakaria 1.6
Bilaspur Jahangir Karmadi Karmadi 1.6
Rai garh Jashpurnagar Patratoli Keradeeh 1.6
Rai garb Jashpurnagar Duldula Koni 1.0
Bilaspur Jahangir Jhalnala Kutela 2.2
Rai garb Jashpurnagar Patrapalli Mayali 3.2
Bilaspur Jahangir Birgahni Nawegaon 1.7
Bilaspur Mungali Amlipalli Parsada 1.3
Rai garh Jashpurnagar Duldula Sarangadani 1.7
Bilaspur Jahangir Govabanda Sovabahar 2.1
Bilaspur Jahangir Jawahangar Tamnar 4.3
It follows from Table 4.7.1 that Bilaspur district
records the highest (1.2 cm/hr) as well as the lowest (0.8 cm/hr)
infiltration rates at Raidih and Bajalpur villages respectively.
At other sites, moderate infiltration rate values range from 1.0
to 4.3 cm/hr. 30

Dhulia Sindkheda
Dhulia Sindkheda
Sholapur Barsi Osmanabad
Sholapur Barsi Osmanabad
Sholapur Osmanabad
Dhulia Sindkheda
Chhertanr
Alkalkosh
Chincholi
Kari
Vedgaon
Vani
Jatwada
Mandana
Pangri
Ramling
Tambola
Ukai
2.0
2.0
1.4
1.9
0.8
1.4
4.8. Maharashtra
Data pertaining to Maharashtra from the report on
Infiltration Studies in 75 Soil Series published by the All India
Soil and Land Survey are presented in Table 4.8.1. From the very
Table 4.3.1 : Infiltration data for Maharashtra
District Taluk Village Soil series Infilt. rate (cm/hr)
limited data for Maharashtra, a rather low infiltration, ranging
from 0.8 cm/hr to 2.0 cm/hr is reflected.
4.9. Punjab
Infiltration studies were carried out by Singh et al using
cylinder infiltrometer at 6 selected sites on different soils on
Kasur Nallah(drainage system) in the Amritsar & Gurdaspur
districts of Punjab as shown in Fig.5a. The infiltration data
have been summarized in Tables 4.9.1 and 4.9.2.
Table 4.9.1: Infiltration data for soils of Kasur Nallah.
Location Soil texture Initial rate Final rate
Acm/hr) (cm/hr)
Dhariwal Sandy loam 2.32 0.32
Batala -do- 5.24 0.28
Shahzada -do- 0.70 0.20 31

0 60 120 180 240 3D0 360 420 480 TIME (MIN;
.)
iSHIKHINWIND
INFILTRATION TEST SITE
SCALE MILES
FIG.5a:MAP OF KASUR NALLAH ( DRAIN)
Nt TARN TARA
REFERENCE omits-colon Rate —0— 0— Cumulative Infiltration
Rate
• DRAIN NASUR NALLAH SITE MLitt-MIND
•
•
1
1
0
•
20
10
FIG. 5b: INFILTRATION CURVES 32

Manawala -do- 3.16 0.18
Tarn Taran Loamy sand 3.86 0.78
Bhikniwind -do- 16.32 2.04
From the Table 4.9.1, it is observed that infiltration rates
are higher in Loamy-Sand soil than the sandy-loam soil. But the
infiltration rates do not have any apparent relationship with
topography. High value of basic infiltration is due to large
porosity. Representative infiltration rate curves of Bhikhiwind
site of this drain have been plotted as shown in Fig.5b.
Further studies were carried out in Ferozpur, Faridkot,
Gurdaspur, Amritsar, Kapurthala , Patiala, and Sangurpur
districts. The infiltration rates at different places were
determined through the infiltrometer test conducted in the field
for sodic and alkaline soils (Table 4.9.2).
Table 4.9.2: Infiltration rates for soils of Punjab.
District Block clay content
(%)
Av.Infilt. rate
(cm/hr)
Light textured saline and water logged soils
Ferozpur Ghalli Khurd 10.7 1.45
-do- Guru Har Shahai 11.96 0.60
-do- Jallalabad 23.02 0.28
-do- Fazilka 10.27 2.07
Faridkot Faridkot 10.47 1.03
-do- Muktsar 11.37 1.94
Medium to heavy alkaline soils
Gurdaspur Dera Baba Nanak 25.00 0.16
Amritsar Ajnala 20.48 0.48
33

-do- Majitha 21.68 0.44
Kapurthala Bhulath 19.69 0.17
-do- Sultanpur Dodhi 22.87 0.27
Patiala Sirihind 20.91 0.35
-do- Patiala 25.75 0.22
-do- Nabha 17.35 0.07
-do- Samana 25.07 0.19
Sangrur Bhawanigarh 21.45 0.21
The major findings of the work are as follows :
Light textured saline and water-logged soils have
moderate infiltration rate and is varying from about 1 cm/day to
2 cm/day. Such conditions exist in Ghalli Khurd, Guru Har Sahai,
Jallalabad, Fazilka, Faridkot and Muktsar blocks of the Ferozpur
and Faridkot districts of the Punjab State (Table 4.9.2).
Soils with medium to heavy texture are alkaline in nature
with predominance of carbonates and bicarbonates and infiltration
rate is low in such cases. Such conditions exist in Kalanaur,
Ramdass, Bulath, Sultan Pur Lodhi, Sirhind, Nabha, Samana and
Bhawanigarh blocks of Gurdaspur, Amritsar, Kapurthala, Patiala
and Sangrur Districts of the Punjab State (Table 4.9.2).
In Gandiwind block which forms part of the command area
of the extensive irrigation system of the Bari Doab near Amritsar
in the Punjab State, infiltration rates of 0.39 cm/hour for Loamy
soil, 0.75 cm/hour for cultivated sandy loam soil and 0.23
cm/hour for deteriorated sandy loam soil have been recorded.
In general, it was concluded that low infiltration rate may
be due to the hard compacted soil found on the surface. Deep
ploughing of the soil resulted in increase in the basic
infiltration rate of the soil. The infiltration rate of the
ploughed land was found to be 5.5 cm/day. 34

4.10. Rajasthan
Joshi et al (1982) have investigated the infiltration
characteristics of Arid Zone soils of western Rajasthan.
Infiltration studies were carried out in 14 different locations
comprising of a variety of soil types e.g. deep, coarse textured
aeolian sand, medium textured, moderately deep alluvial soils and
shallow soils underlained by rocky and gravelly strata. The
results of the infiltration tests are presented in Table 4.10.1.
Table 4.10.1: Infiltration data for western Rajasthan
Location Soil series Soil texture Infit. rate (cm/hr)
(a) Medium to moderately fine textured soils
Baorikhurd Mathania s 7.2
Balarava -do- s 10.8
Balarava Borabas ls to scl 8.4
Kankani -do- sl to cl 10.8
Dajjar -do- sl to cl 6.0
Kankani Bhavi 1 to cl 2.4
(b) Coarse to moderately coarse textured soils
Agolai Chirai lfs to sl 7.1
Rampura Dune fs to is 18.0
Khari-Bhavad -do- fs to ls 6.6
Basanilaccha Chirai Is 12.0
Basanilaccha Chirai ls 18.0
(c) Shallow soils
Rampura Jajiwal sl 12.2
Balarava Plateou fs to ls 3.6
Kankani -do- sl to gl 0.8
( -zandylizam,z L -; andvc LcvLo arn,c_ -c Lav1cam,lz -loam y z and.
-f t n seancl,91-g r ave Ily tour/J.-loam .11s -lo arny and)
35

It is clear from Table 4.10.1. that the infiltration rate
decreases from 18-6 cm/hr for very deep sandy soils and 10.8-1.25
cm/hr for deep medium textured soils to 1.2 to 0.8 cm/hr for
shallow soils. Higher content of coarse sand in soils of Mathania
series (Balrava and Baron i Khurd) and Dune series (Rampura) were
associated with high infiltration rate, whereas Chirai soils of
Agolai containing more of fine sand was associated with
relatively low infiltration rate.. Similarly, shallow soils
underlain by concretionary zone showed higher infiltration rate
than those underlain by the rock.
Shankarnarayan and Kar (1983) carried .out infiltration tests
at 117 sites of different landuse, soil type and geomorphic
units in the Upper Luni basin, Rajasthan (Fig.6). Out of these,
64 tests were carried out in agricultural lands (mostly sandy
soils), 12 in heavy soils in wheat fields (present fallow), 32 in
open scrub lands (Grazing lands) and 4 in dune complex (duny
sand). In all the four catchment of the upper Luni Basin (Bandi,
Guhiya, Luni, and Jojri), the infiltration rate varied with soil
depth, soil texture, initial soil moisture, and surface cover.
Table 4.10.2 indicates that the average one hour infiltration in
coarse, medium and moderately fine soils varies from 12.62 to
22.99, 7.45 to 12.65 and 3.50 to 7.90 cm/hr respectively.
TABLE 4.10.2: Infiltration characteristics in Upper Luni Basin
.Catchment Soil Soil Soil Soil moisture One hr infilt group texture depth Average Range Average Range
(cm) (X) (X) (cm) (cm)
Bandi s-1 Coarse >100 4.37 2.11-6.91 15.95 4.39-38.15
s1-1 Medium 40-100 5.38 2.28-7.29 12.65 2.24-29.40
scl-sicl Mod.fine 45-100 5.35 2.22-9.60 5.10 1.30-13.02
Guhiya s-is Coarse 20-100 2.03 1.46-2.58 14.57 7.07-22.40
s1-1 Medium 40-100 4.08 2.04-6.66 7.45 3.57-14.38
scl-sicl Mod.fine 30-95 6.14 3.96-8.83 3.50 3.43-10.00
Luni s-is Coarse 40-100 3.02 0.38-8.31 22.99 3.78-67.00
36

FIG
.6 T
HE
LU
NI B
AS
IN -
NO
RT
HW
ES
T IN
DIA

s1-1 Medium 40-100 5.06 1.22-18.19 12.15 1.22-34.95
scl Mod.fine 40-100 6.10 4.45-8.10 7.90 3.71-14.60
Jojri s-is Coarse 40-100 6.10 4.45-8.107 12.62 4.97-32.32
s1-1 Medium 30-100 7.47 3.71-13.47 10.82 2.36-26.47
std -stav - Loam, sl -sandy
S-rd. IS-1..D.arrly
Shankarnarayan (1982) carried out detailed studies in the
Guhiya watershed in the Upper Luni basin and established a clear
influence of soil texture on the infiltration characteristics and
showed that the infiltration process is much more accelerated in
coarse soils than in fine and medium soils. Thirty seven sites in
various soil groups viz, coarse, medium and moderately fine soils
were selected for carrying out infiltration tests. One hour
infiltration test yielded infiltration rates of 3.43 - 10 cm/hr
for sandy clay loam to silty clay loam soils, 3.57 - 14.38 cm/hr
for sandy loam to loamy soils and 7.07 - 22.4 cm/hr for sandy to
loamy sand soils (see Table 4.10.3). Soil thickness ranges from
30-100 cm except at 8 locations where depth is greater than 1 m.
The initial soil moisture in upper 0-20 cm of soil, which mainly
influences infiltration process, ranges from 1.5 to 6.7 percent.
Table 4.10.3: Infiltration characteristics in the Guhiya watershed
Soil Soil texture Soil depth 1hr infiltration (cm) group (cm) Range Total
scl-sicl Mod.fine 30-95 3.43-10.00 3.50
s1-1 Medium 40-100 3.57-14.38 7.45
s-is Coarse 20-100 7.07-22.40 14.57
scl.--sandy day Loam, si,d-silty day Loam, sl,-sandy Loam, L-toam,
s-sand, Ls-Loamy sand)
Table 4.10.4. shows the variation in infiltration rate with
respect to landuse and soil type. Infiltration rate varies from
3.6 cm/hr for agricultural land with loamy soil to 22.4 cm/hr for
agricultural land with loamy sand soil. 38
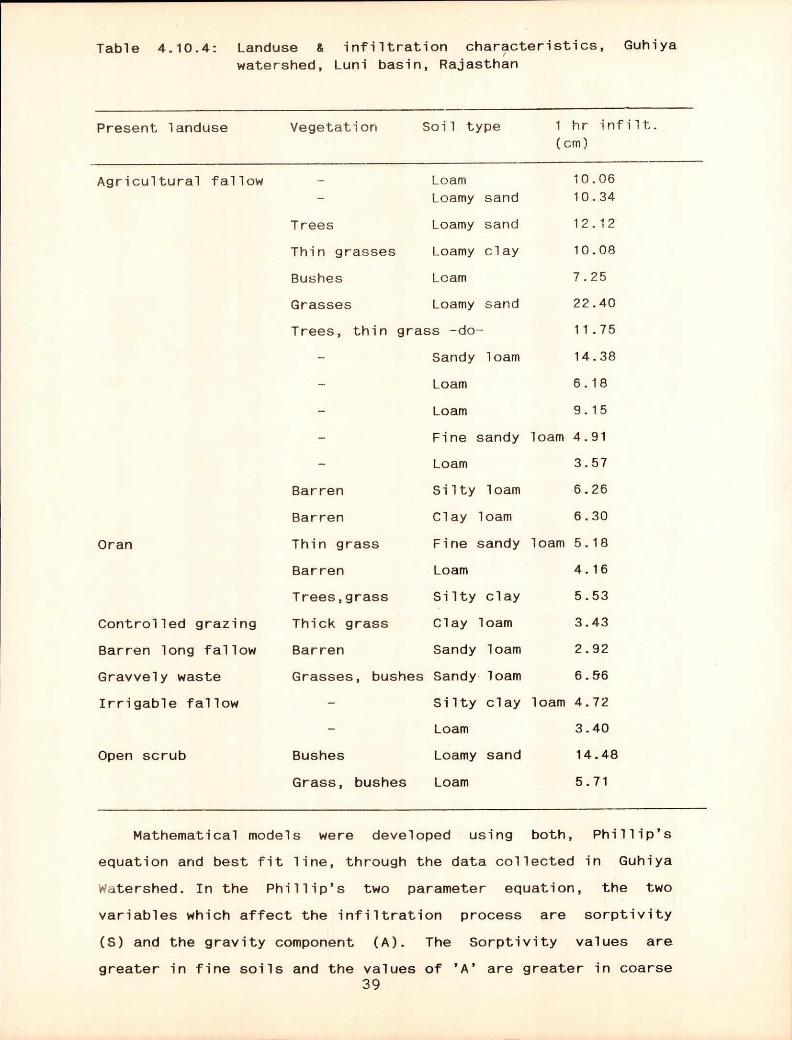
Table 4.10.4: Landuse & infiltration characteristics, Guhiya watershed, Luni basin, Rajasthan
Present landuse Vegetation Soil type 1 hr infilt. (cm)
Agricultural fallow - Loam 10.06 - Loamy sand 10.34
Trees Loamy sand 12.12
Thin grasses Loamy clay 10.08
Bushes Loam 7.25
Grasses Loamy sand 22.40
Trees, thin grass -do- 11.75
- Sandy loam 14.38
- Loam 6.18
- Loam 9.15
- Fine sandy loam 4.91
- Loam 3.57
Barren Silty loam 6.26
Barren Clay loam 6.30
Oran Thin grass Fine sandy loam 5.18
Barren Loam 4.16
Trees,grass Silty clay 5.53
Controlled grazing Thick grass Clay loam 3.43
Barren long fallow Barren Sandy loam 2.92
Gravvely waste Grasses, bushes Sandy loam 6.56
Irrigable fallow - Silty clay loam 4.72
- Loam 3.40
Open scrub Bushes Loamy sand 14.48
Grass, bushes Loam 5.71
Mathematical models were developed using both, Phillip's
equation and best fit line, through the data collected in Guhiya
Vutershed. In the Phillip's two parameter equation, the two
variables which affect the infiltration process are sorptivity
(8) and the gravity component (A). The Sorptivity values are
greater in fine soils and the values of 'A' are greater in coarse 39

soils where the soil pores are greater the Phillip's equation can
be put in the form of:
I = St + At,
where I = the cumulative infiltration in time 'b'
S = Sorptivity (infiltration due to capillarity)
A = Infiltration due to gravity
The infiltration rates of the soils of Guhiya watershed of
Upper Luni Basin observed in the field are close to the
calculated value from Phillip's equation. The average
infiltration rate for moderately fine soils is about 6.7 cm/hr
whereas the average Ifs° value derived by Phillip's equation is
about 5.7 cm/hr. The value derived by best fit method is 3.5 cm
which is very low. In coarse soils, both the models give values
close to the actual value obtained from field tests.
4.11. Tamilnadu
Infiltration studies on different soils under various
landuses were conducted at Ootacamund, Tamil Nadu (Rege and
Srinivasan, 1959). The soil having a miscellaneous type of
vegetation (Shola) had a mass infiltration of 12.5 cm for a
period of 3 hours while for that under broom (Cytisus scoparius)
had 11.25 cm for the same period. The infiltration data for the
above two vegetative covers indicate that the quantity and rates
of infiltration are very high during the first 15 minutes of
observation. The higher total intake of water by the soil under
the miscellaneous vegetation (Shola) is probably due to the
lighter nature of the soil existing there. However, the soils
under both these surface covers have exhibited better intake than
those under other conditions namely, grass, and cultivated land.
Further it is seen that of all types of landuses, excepting
miscellaneous vegetation (Shola), the rate of infiltration is the
greatest under cultivated condition during the initial stage of
15 minutes, 5.6 cm and 1.25 Gm during the subsequent 165 minutes.
40

Regarding the grassland, the intake was the poorest during the I
st 15 minutes (hardly 2.5 cm) but during the subsequent period of
165 minutes, the infiltration was nearly 3.75 cm which was much
higher than the obtained in the cultivated land (i.e.1.25 cm for
the same period). The initial low intake may be attributed to the
compaction of soil caused by indiscriminate and excessive grazing
by cattle and sheep over a long period. It is, however, clearly
indicted that the soil under broom(Cytisus scoparius) has shown
greater rate of water intake (3.75 cm per hour). Though it is a
firmer soil, the aggregates have been developed well due to the
constant addition of leaf litter of the protected .growth of
perennial broom which is a leguminous plant.
Further infiltration studies were conducted on cultivated land
at the Soil Conservation Research Centre, Ootacamund (Shrinivas,
Poornachandran and Thomas, 1967). The soils of the area are
lateritic in origin and have developed from gneissic rock. They
are clay to clay loam in texture with porosity upto 57 per cent.
The soils are non-erodible with dispersion ratio of less than 7
and are deep to very deep. Bench terraces were formed about 10
years prior to the start of infiltration studies. Two sets of
tests were made (a) dry test at the existing soil moisture level;
(b) wet test about 24 hours after wetting. The readings were
taken at 5, 10, 15, 30, 45, 60,120,150 and 180 minutes.The
cumulative infiltratibn were computed for each time interval. The
initial rate of water intake in the soil was quite rapid and
after about 60 minutes the rate became constant. The amounts of
infiltration during successive time intervals under wet run are
shown in Table 4.11.1.
41

Table 4./1.1: Amount of infiltration (cm) on cultivated land during
successive time intervals (min.) - wet run (Ootacamund)
Month 0-5 5-10 10-15 15-30 30-45 45-60 60-90 .C; 90 120 150 Tot.
-120 -150 -1130 0-180
March 0.8 0.8 0.7 2.1 2.1 2.1 4.4 4.4 3.8 3.5 24.7
April 0.2 0.2 0.2 0.6 0.6 0.6 1.2 1.2 1.1 1.1 7.1
May 0.6 0.5 0.4 1.2 1.2 1.1 2.2 2.1 2.1 2.1 13.2
June 0.3 0.5 0.3 0.9 0.9 0.9 1.8 1.8 1.8 1.8 10.E
July 0.1 0.1 0.3 0.3 0.3 0.6 0.6 0.6 0.6 0.6 3.S
August 2.3 1.9 1.8 5.2 5.0 5.0 9.0 8.4 7.5 7.5 53.E
Table 4.11.1 shows that water continued to infilter into the
soil even after prolonged period, which is the main reason for
less runoff. Table 4.11.2 gives the initial infiltration rate and
the initial soil moisture percentage under dry run.
Table 4.11.2: Values of initial infiltration rate (cm/hr)
Under dry run, Ootacamund
Month Initial soil Moisture Initial infiltration rate
(%) (cm/hr)
March 14.2 18.0
April 23.5 12.0
May 22.0 14.0
June 38.9 3.6
August 25.0 51.6
4.12. Uttar Pradesh
In Uttar Pradesh infiltration studies have been carried out at
few places. The All India Soil and Land Use survey, New delhi has
conducted infiltration tests in river valley projects for soil 42

conservation (All India Soil & Land Use Survey, 1981). These
tests have been carried out in Ram Ganga catchment, mainly in the
districts of Almora and Paurigarhwal (Table 4.12.1)
Table 4.12.1: Infiltration data from U.P.(Ref:75 Soil series)
District Taluk Village Soil series Infil.rate (cm/hr)
Almora-
Paurigarhwal
Almora
Almora
Paurigarhwal
Paurigarhwal-
Almora
Etah
Almora
Etah
Paurigarhwal
Rani khet
Ranikhet
Landsdown
Landsdown
Etah
Rani khet
Etah
Landsdown
Bhikiasain
Bhikiasain
Chinwali
Dhumakot
Bhikiasain
Sakit
Sangalia
Amgadhera
Bhikiasain
Chinwali
Dhumakot
Kasi Nagle
Manhat
Sakit
Sirohi
10.9
5.4
4.7
2.8
3.6
8.6
1.3
5.5
Ranikhet Adalikhal Adalikhal 9.8
Ground Water Investigation organisation (T.M. No. 46/87, 1987)
has carried out infiltration tests along the Hindon river in the
district Saharanpur (Fig. 7 and Table 4.12.2).
Table 4.12.2: Infiltration test data along the Hindon river,
Saharanpur
Site no. Soil type Infiltration rate (cm/hr)
51 Sand 16.8
18 Sand 8.4
19 Sand 13.2
21 Sand 43.8
23 Sand 10.2
25 Sand 60.0
43

GAGAL HER
18
21A 2413 00 042
KHAJURI AKBARPUR
wog
50
017
.27A
.278
039
15
25A \N4 •
025B
037
NORTHERN RLY. DAL IAKH ERA RS
INDEX VILLAGE lb ROAD 111•61all
RAILWAY LINE RIVER INFILTRATION TEST SITE •
Fig. 7 - Index Map Showing Infiltration Test Sites Under Hindon
River Project Area Distt. Saharanpur
44

27
18A
21A
Sand
Sandy loam
Sand
51.9
7.2
12
23A Silt loam 5.4
27A - 19.2
18B Loamy sand 2.7
21B Loamy sand 8.2
258 Loam 22.5
9 Silt 2.4
12 Silt loam 7.8
14 Silt loam 0.3
15 Loamy sand 1.08
17 Loam 7.8
28 Silt 3.6
31 Silt 4.2
34 Silt loam 2.61
37 Silt loam 6.6
40 Silt 0.6
42 Silt 4.8
The Ground Water Department, Govt. of U.P. has carried out
some infiltration tests in different parts of U.P. and the
results are presented in the Table 4.12.3.
Table 4.12.3 Infiltration data from U.P.(Ground Water Deppt, UP)
District Block Village Soil
Type
Infit.rate
(cm/hr)
Varanasi Cholapur Babhanpura Silt loam 6.150
Varanasi Cholapur Danaganj Silt loam 1.41
Bareilly Alampur Bhampura Silt loam
to sand
3.84
Bareilly Alampur- Panwara Silt loam 2.86
Zafrabad
Bareilly Alampur- Balliya Silt loam 0.963
45

Zafrabad
Bareilly Alampur- Pathra 7.65
Zafrabad
Agra Fatehabad Bilauni 0.86
Farrukhabad Kannauj Akbarpur 0.90
Lucknow Chinhat Simra 0.40
Lucknow Chinhat Vijaipur 0.58-1.24
Lucknow Chinhat Kanchanpur 2.8
All grab Akarabad Dhubiya 1.16
Aligrah Akarabad Kalianpur 0.65
Aligrah Akarabad Nagala Sartaj 0.63
Aligrah Akarabad Vijaygarh 0.38
Sul tanpur Bhadar Sansarpur 0.72
Sul tanpur Bhadar Piparpur 1.98
Sul tanpur Bhadar Kalyanpur 0.72
Sul tanpur Bhadar Ghoraha 2.10
Hardoi Sandi la Mahsona 0.54
Hardoi Sandi la Lamsera 3.24
Hardoi Sandi la Tilai khurd 0.90
Hardoi Bahendar Raise 1.20
Hardoi Kachhona Malhupur 0.60
Hardoi Kachhona Sunni 1.30
Hardoi Kachhona Kakuhi 0.84
Infiltration investigation of the soils of the Bhaintan
watershed in Tehri-Garwal has been carried out by Mohan and Gupta
(1983). The results are presented in Table 4.12.4 along with
description of sites.
46
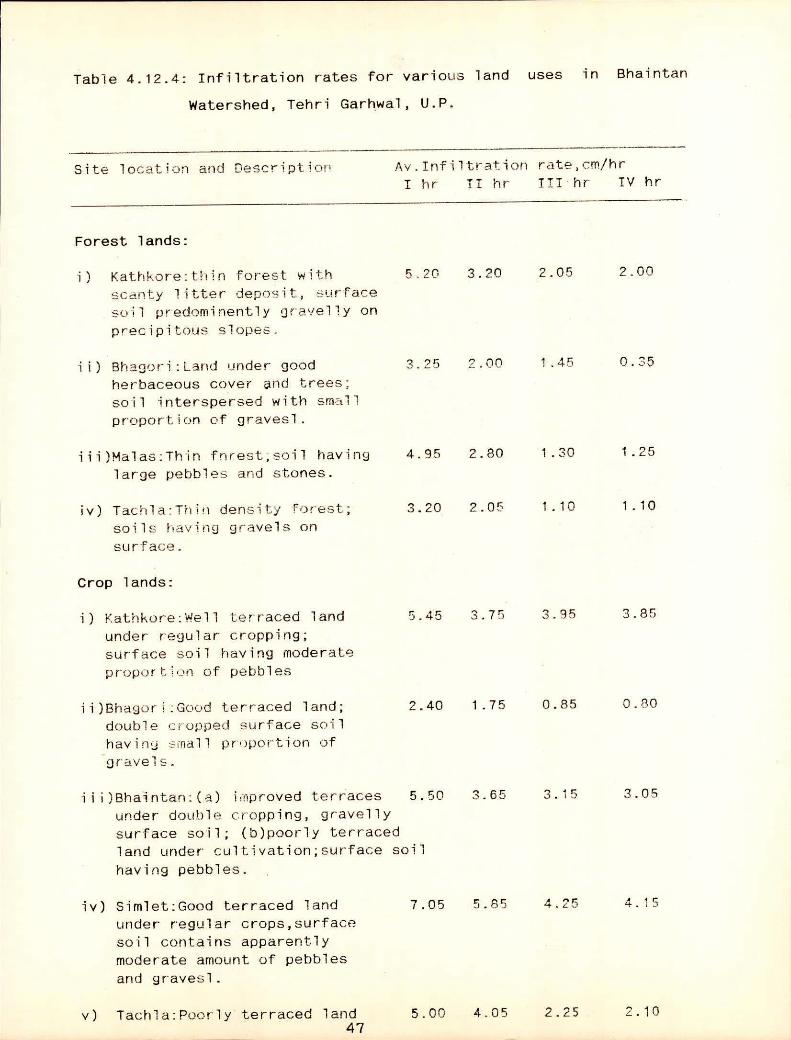
Table 4.12.4: Infiltration rates for various land uses in Bhaintan
Watershed, Tehri Garhwal, U.P.
Site location and Description Av.Infiltration rate,cm/hr
I hr II hr III'hr IV hr
Forest lands:
Kathkore:thin forest with scanty litter deposit, surface
soil predominently gravelly on
precipitous slopes.
Bhagori:Land under good herbaceous cover and trees;
soil interspersed with small proportion of gravesl.
iii)Malas:Thin fnrest;soil having
large pebbles and stones.
iv) Tachla:Thin density forest; soils having gravels on
surface.
5.20
3.25
4.95
3.20
3.20
2.00
2.80
2.05
2.05
1.45
1.30
1.10
2.00
0.35
1.25
1.10
Crop lands:
i) Kathkore:Well terraced land
under regular cropping; surface soil having moderate proportion of pebbles
ii)Bhagori:Good terraced land; double cropped surface soil
having small proportion of
gravels.
iii)Bhaintan:(a) improved terraces
under double cropping, gravelly
surface soil; (b)poorly terraced
5.45
2.40
5.50
3.75
1.75
3.65
3.95
0.85
3.15
3.85
0.80
3.05
land under cultivation;surface soil
having pebbles.
Simlet:Good terraced land under regular crops,surface soil contains apparently moderate amount of pebbles
and gravesl.
Tachla:Poorly terraced land
7.05
5.00
r riC J.0J
4.05
4.25
2.25
4.15
2.10 47

under monocropping;pebbles low in surface soil.
Horticultural lands:
Kathkore:Land with irrecrilar slopes;surface soil extremely gravelly.
Matas.Land with thin grass cover and excess of pebbles.
iii)Simlet:Land on irregular slopes and guly banks. Pebbles in excess in surface soil.
Grasslands:
4.95
4.30
3.70
3.80
3.55
2.20
2.25
2.05
1.20
1.25
1.95
1.05
i) Malas:Land under moderate cover of miscellaneous
4.25 3.40 2.25 2.15
grasses; bouldriness in surface soil.
It is evident from the values that at Kathkore the forest land
shows moderate values of Infiltration rates i.e.5.20, 3.20, 2.05
and 2.00 cm/hr for I, II, III is apparently more than the
Infiltration rate values for Malas, Bhagori and Tachla. These
observations suggest that higher infiltration rates at Kathkore
are probably due to preponderance of Pebbles, gravels and rock
fragments on the surface soil which make it more porous and
permeable to water. Bhardwaj et al (1974) have also noted that
soils of Kathkore series are moderate to very gravelly, medium
textured.
Prasad and Ali (1989) carried out studies on
characteristics of some soils of Kanhar catchment
district using double ring infiltrometer. The basic
was determined by multiplying the average intake
minutes of elapsed time by factor 0.6. Table 4.12.5
Infiltration
in Mirzapur
infiltration
rate at 60
presents soil
characteriEtics and infiltration data for some soils of Kanhar
catchment.
48

Table 4.12.5 : Soil characteristics & infiltration data, Kanhar catchment, Mirzapur.
Soil series Effective Present Texture Structure Basic depth landuse (a.Surface;b.subsurface) infil.rate (cm) (cm/hr)
Baralota(BL) V.deep Double a.ci., a.Sb 0.69 (150) cropped b.sci., to c b.Sb to Ab
Edala'(ED) V.deep -do- a.l. -do- 3.36 (130) b.cl, to c
Gangawar(GR) V.deep -do- -do- -do- 0.48 (140)
Hurlong(HR) V.deep Single a.ct. -do- 1.95 (135) cropped b.cL
Matang(MG) Mod.deep -do- a.si, -do- 7.51 (50)
Sarma(SR) V.deep Double a.sc/.. -do- 6.0 (102) cropped b.scL to CL
Sukhra(SK) Mod.deep Single as -do- 16.65
Figure Ba explains the cumulative infiltration curves with
elapsed time for different soils of the catchment as per Tabje
4.12.5. Figure 8b gives the curves of infiltration rates for
different soils with elapsed time. All of the analysis for Kanhar
catchment was carried out using the following empirical
Kastikov's equations:
Y = at ...(i) and
Y = at + b ...(ii)
where t o and
Y = accumulated infiltration in time t
t = elapsed time or infiltration opportunity time in
minutes, a, and b are the characteristics of the soils and are
constants.
The values of a, x and b constants in the above equation are 49

SIC
MG
SR
E0
HR
m
90
155
80
5
70
65
60
55
50
45
40
35
30
25
20
15
10
5
INF
ILT
RAT
ION
RAT
E ( Cm
11-
1)
ED HR BL --46R
20 40 60 80 100 120 140 160 160 200 220 240
ELAPSED TIME (MINUTES)
(b) INFILTRATION RATE AS A FUNCTION OF TIME
'CU
MU
LA
TIV
E IN
FIL
TR
AT
ION
(Cm
)
20 40 60 60 100 120 140160 180200 200 220
ELAPSED TIME (MINUTES)
(a) CUMULATIVE INFILTRATION CURVES
Fig. B. Infiltration Curve for Kanhar Catchment , Mirzapur U.P.
50

calculated for the soils of the catchment and the infiltration
prediction equations for all the series are given as under:
Baratola : (Y - 0.165) = -0.955 + 0.559 logt
Edala : (Y 0.411) = -0.465 + 655 logt
Gangawar : (Y + 0.323) = -0.539 + 0.342 logt
Huralong : (Y + 0.452) = -0.152 + 0.408 logt
Matnag : (Y - 0.887) = -268 + 0.770 logt
Sarma : (Y + 0.116) = -0.329 + 0.753 logt
Sukhara : (Y + 0.574) = 0.0758 + 0.770 logt
Infiltration measurements using cylinder infiltrometers were
done in the watershed of river Asan, a tributary of river Yamuna,
covering most of the western portion of Doon Valley. Suitable
transects were chosen for the cultivated and forest lands on the
Himalayan and the Siwalik uplands, as well as in the bottom lands
of the valley sites. The mean readings of these six units of
cylinder infiltrometers represented the average infiltration rate
of the site (Table 4.12.6). The tests were run under almost a
constant head of 5 cm (2 inches) maintained by simple float
device. If any vegetation was found, it was cut and similarly the
undecomposed litter within the cylinder was removed. The water
intake rates were noted from a graduated reservoir feeding the
cylinder at 5,10,15,30,60,120 and 180 minutes. From the
cumulative value of water intake for each hour and cross section
area of the cylinder, the rate of infiltration was estimated. One
of the six cylinders with the soil core, after the field test,
was lifted and examined in the laboratory. The profile details
for each site were also taken.
51

Table 4.12.6: Infiltration rates in Doon valley, U.P.
Site Soil cover Elevation Infiltration rates (cm/hr) above MSL 1st hr 2nd hr. 3rd hr (meter)
Group I : Cultivated valley area
Dhulkot Under Maize crop 533 surface soils with no pebbles or stones
Sahaspur Ploughed fallow with 478 few stones or pebbles
Lakhanwala Harvested rice field 465 with some stones/pebbles
Tapkeshwar Ploughed field with 610 few stones or pebbles
Babugarh Fodder sorghum harvested 461 & no pebbles/stones
Bhurpur Ploughed field with 541 no stones or pebbles
Average
Group II : Cultivated Himalayan Upland area
Sinola Ploughed land with 983 few stones or pebbles
Kidarwala Ploughed with some 533 pebbles/stones
Bakhtahar- Ploughed with some 679 pur pebbles/stones
Donga Ploughed with some 816 pebbles/stones
Rudarpur Ploughed with some 587 pebbles/stones
Khalagaon Rice harvested, soil 1042 puddled, compact
Average
4.00 2.75 2.80
3.55 1.95 1.80
2.70 1.90 1.80
4.50 2.25 2.30
7.30 4.55 4.35
3.75 0.85 0.85
3.70 1.94 1.91
7.90 4.20 4.30
7.50 4.40 4.50
7.10 6.65 4.55
9.50 5.10 5.05
9.60 5.10 4.75
2.05 0.75 0.90
8.32 4.69 4.69
52

Group IV: Forest area on Siwalik side slopes
Karwapani Fireline
Sal forest with v.little 685 leaf litter, compact
Group III : Forest area in Himalayan upland (Foothills slopes)
Bidhauli Sal forest with good leaf litter
Horawala Sal forest with v.little leaf litter, combact
Mabari Sal forest with little leaf litter, compact
Chandaur Sal forest with little leaf litter
Dhulkot Sal forest with good leaf litter
Average
Karwapani Sal forest compact R.F. eroded soil
Sabhawala Misc, forest with compact soil
Average
838 8.95 5.90 5.85
671 3.65 2.00 2.20
567 4.55 2.45 2.50
533 4.85 3.78 3.83
533 7.35 6.00 6.00
5.87 3.78 3.83
5.35 2.30 2.30
610 2.80 1.15 2.30
3.70 2.70 2.75
499 4.15 2.00 1.95
4.00 2.04 2.09
Sabhawala Sal forest, compact soil 640 Fireline with little leaf litter
The average infiltration values in the above table for
different groups clearly indicate that the soils on the slopes of
Himalayan foothills have moderate rates when under cultivation
(Group II); the infiltration rates gets appreciably reduced under
forest cover (Group III). The soil profiles studied with their
shallow depths preponderant with pebbles and rock fragments
suggest high potential infiltration values. This is all the more
so when top shallow mantle is disturbed by ploughing, thus giving
high values under cultivation as in Group II; When undisturbed as
under forest with trampling a surface sealing is anticipated
giving comparatively reduced rates as found for Group III. The 53

cultivated land in the valley in Group I gave moderate
infiltration rates. The forest land on Siwalik slopes of the
Valley under group IV gave slightly higher values than Group I
but the different is not appreciable. The forest area on Siwaliks
is without good leaf litter and is heavily grazed which may
explain its reduced infiltration rates. The potential
infiltration values are expected to be higher.
The infiltration curves in Fig. 4 show that the I st hour
high value rapidly decreases in 2nd hour and becomes steady in
3rd hour onward in all the groups irrespective of the cover and
, other site factors or profile characters. Actual infiltration
rates for each group of curves remain different. In general, the
field observations show that Himalayan slopes, either cultivated
or under forest give considerably higher infiltration values than
the cultivated Valley or the Siwalik slopes under sal forests.
The 3rd hour infiltration values for the Himalayan slopes of the
Valley are observed to be almost double of those for the
cultivated Valley as well as the Siwalik slopes under forest.
4.13. West Bengal
The All India Soil and Land Use Survey conducted Infiltration
studies for 75 soil series covering River Valley Projects related
data are presented below:
Table 4.10.5 Infiltration data for West Bengal
District Taluk Village Soil series Infit.rate
(cm/hr)
Purulia Arsha, Hensla Hensla 9.3
Baghundi
Balrampur
Purulia -do- Kanchanpur Kanchanpur 1.1
Purulia -do- Salaidahar Kultanr 6.1
54
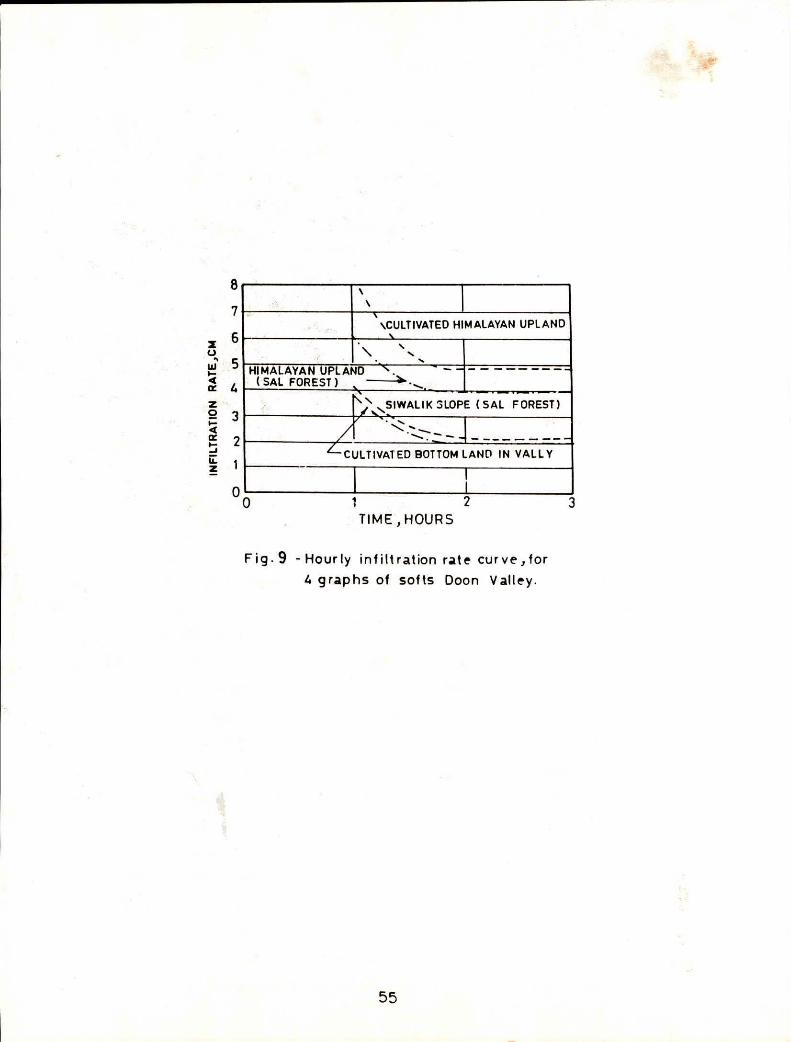
7
6
5
4
3
2
1 INF
ILTR
ATIO
N RAT
E, C
M
\
\
1 \
‘ \CULTIVATED HIMALAYAN UPLAND
\ .,. N , •
HIMALAYAN UPLAND ( SAL FOREST)
-- - "---"1"....... \
\ \ . „SIWALIK SLOPE ( SAL FOREST) /1
----- - - _ _
CULTIVATED BOTTOM LAND IN VALLY
I I
1 2 TIME ,HOURS
Fig.9 -Hourly infiltration rate curve,for
4 graphs of softs Doon Valley.
55
Purulia -do- Palpal Palpal 2.0
Purulia -do- Teyasi Salaidhar 2.1
Purulia -do- Arsha Sirkabad 8.5
All the values from the West Bengal state are from Purulia
district. The highest value of 9.3 cm/hr is recorded from Hensla
village whereas the lowest value of 1.1 cm/hr is recorded from
Kanchanpur village.
Bhardwaj and Singh (1992) conducted field tests in the IIT
Kharagpur campus with rainfall simulator infiltrometer on grassed
land, bare fallow land and cultivated land to determine
infiltration, runoff and soil erosion, under two rainfall
intensities of 100 mm/h and 200 mm/h. The soil studied was
lateritic with a specific gravity of 2.65. To compare the
infiltration results with those from the traditional
flooding-type method double-ring infiltrometer, parallel
measurements are made at adjacent locations.
The mean values of infiltration of soil measured by rainfall
simulator infiltrometer and flooding-type double-ring
infiltrometer are presented (Figs.10a and lob). The summarized
infiltration data is presented in Table 4.10.2. The infiltration
rate is high for the initial 5 minutes and reduces gradually
after each interval of 5 minutes with decreasing rate. This is
true for all three cover conditions irrespective of the rainfall
intensity and the method of measurement employed. Grassed and
cultivated lands, under both rainfall intensities, have higher
average infiltration rates than that of bare fallow land. This
may be due to the fact that grass grown on the soil makes it more
porous because of its root growth and increases the organic
contents, facilitating the movement of water into the soil. The
cultivated land, due to regular ploughing, is also more porous
when compared to bare land which has been lying fallow for many
years. Moreover, the bait soil having more fine soil particles
56

20-c
0
Intensity 200 mm hr 120
-- 100
80
a 60
.0
20
0
40
100 Intensity =100 mm/ hr
E
12
• 40-
10 20 30 Elapsed time (min)
-0- GRASS -RSI - BARE-RSI -*-CULTIV- RSI
(a) -0- GRASS-RI -)c- BARE-RI CULTIV RI
10 20 Elapsed time (ruin)
0 GRASS RSI -+-BARE RSlCULTiV RSI -X- BARE RI CULTIV RI
30
GRASS RI
40
(b) FIG.10 INFILTRATION CURVES FOR KHARAGPUR
AREA WEST BENGAL
57

lying loose on the sucface, gets easily mixed with water in case
of rainfall simulator measurements, because of raindrop of
raindrop impact, which makes it muddy, thereby sealing down the
pores of the soil, reducing its infiltration rate.
Table 4.10.2 : Infiltration data from Deptt. of Engg. Campus, II), Kharagpur. West Bengal
Land use Basic Infiltration Rate (cm/hr)
Intensity 100 mm/hr Intensity 200 mm/hr
RI PSI RI PSI
Grassland 1.8 0.6 2.3 0.6
Bareland 1.0 0.4 1.9 0.4
Cultivated 2.0 0.8 2.3 0.6
CONCLUDING REMARKS
The data presented in this report for different states of
India are very scanty. Therefore, it has not been possible to
produce any thematic map of the infiltration characteristics of
soils of different states. Further, the data format is extremely
variable and sometimes the details of additional physical
characteristics of soils are not available without which it is
difficult to draw inferences about spatial variations in
infiltration characteristi s. More infiltration tests must be
carried out by the concerned organisations in the respective
states and along with the infiltration data, information about
the grain size distribution, soil carbonate distribution, landuse
(soil cover) etc. should also be collected. Only then, the
infiltration data will form an important input to the hydrologic
modelling to derive information about the runoff potential of the
area.
In conclusion, the following points are stressed :
58

There is an urgent need for conducting infiltration tests at
different locations in each state. As this would be an
stupendous task, the involvement of state governments would
be necessary.
Infiltration data should be collected and recorded in
standard format.
The automatic infiltration measuring equipment shall be
developed and widely tested expeditiously.
A clear cut role of use of infiltration results for
hydrologic modelling be defined.
The data on infiltrometer for each state shall be compiled in
the form of books.
59

REFERENCES
All India Soil and Land Use Survey, 1981, Infiltration Studies of 75 Soil Series, Ministry of Agriculture, Govt. of India, New Delhi.
Bayer, L.D. 1933. Soil Erosion in Missouri, Missouri Agriculture Exp. Sta. Bull.(349) Page 266.
Bhardwaj, A., and Singh, R., 1992, Development of a portable rainfall simulator infiltrometer for infiltration, runoff and erosion studies, Agriculture Water Management, 22, pp.235-248.
Boers, T.M., Van Deurzen, F.J.M.P., Eppink, L.A.A.J. Ruytenberg, R.E. 1992. Comparison of Infiltration Rates Measured with an Infiltrometer, Rainulator and a Permeameter for Erosion Research in S.E.Nigeria. Soil Technology, Vol.5, pp. 13-26.
Booltink, H.W.G, Bouma, J. and Gimenez, D. 1991. Suction Crust Infiltrometer for Measuring Hydraulic Conductivity of Unsaturated Soil near Saturation. Soil Science Society of America Journal. Vol. 55, pp.566-568.
Chaturvedi, P.S., 1946, Tech. Memo Nos. 17 and 18, IRI, Roorkee.
Datta, P.S., 1975, Ph.D. Thesis, I.I.T., Kanpur (unpublished).
Diebold, C.H. 1951 Soil layers causing run-off from hard land wheat fields in Colarado and New Mexico. Journal of Soil and Water Conservation, 6, pp.202-209.
Dixion, R.M. 1975. Design and Use of Close Top Infiltrometers, Proc. Soil Science Society of America Volume 39, No.4.
Duley, F.L.and Kelley, L.L. 1939. Effect of Soil Type, and Surface Conditions on Intake of Water. University of Nebraska Agri. Exp. Sta. Res. Bull. No. 112. Page 1-16.
Fletcher, J.E. 1960. Some Aspects of Plant Growth on Infiltration in the South West. AAAS. South Western and Rocky Mountain division, Alpine Texas.
Fletcher.J.E. 1949. Some properties of water solutions that ' influence infiltration. Trans American Geophys Union (30),
pp.548-554
Goel, P.S., Datta, P.S. and Tanwar, B.S., Nordic Hydrology, No. 8, 0'13.211-224.
60

Green, R.E. 1962. Infiltration of Water into Soils as
Influenced by Antecedent Moisture.Ph.D. Dissertation. Iowa
State University, Iowa.
Holtan, H.N. 1945. Time Condensation in Hydrograph Analysis.Trans. American Geophys Union, 26, pp.407-413.
Horner, W.W. and Lloyd, C.L. 1940. Infiltration Capacities as determined from a Study of an Eighteen Month record
at Edwards-Ville, Illinois. Trans American Geophys Union, 21, pp.522-541.
Horner, W.W. and Jens, S.W. (1942)
Horton, K. and Ankery, M.D. 1988. Design for an Automated Tension Infiltrometer. Soil science Society of America Journal, Vol. 52, No.3, pp.
Horton, R.E. 1935. Surface Runoff Phenomena Horton Hydrological Laboratory Paper No. 101.
Horton, R.E. 1940. An approach toward a physical interpretation of infiltration capacity. Proc. Soil Science
Society of America, 5, pp.693-711,
Horton, R.E., 1933, The rate of infiltration in the Hydrologic cycle, Trans. American Geophys. Union, 14, pp.446-460.
Jens, S.W. and Mcpherson, M.B. 1964. Hydrology of Urban Areas, A Handbook of Applied Hydrology (ed. V.T.Chow), Sec.20, McGraw Hill book co. New York. NY.
Joshi, D.C., Choudhri, J.S., and Sharma, V.C.1982. Infiltration characteristics of arid zone soils. Indian Jour. of Soil Conservation, vol.10, no.1, pp.25-28.
Kostiakov, A.N. 1932. On the Dynamics of the Coefficient of Water Percolation in Soils and on the Necessity for Studying it from a Dynamic Point of View for Purposes of Amelioration.
Lewis, M.R. and Powers, W.L. 1938. A study of factors affecting infiltration. Proc. Soil Science Society of America, 3, pp.334-339.
Linsley, R.K., Kohlar, M.A. and Paulhus, J.L.H. 1949. Applied Hydrology. McGraw Hill book co. New York. N.Y., pp.689.
Lull, H.W. 1964. Ecological and Silvicultural Aspects, A HandBook of Applied Hydrology.(ed. by V.T.Chow), Sec.6, McGraw Hill book co. New York, NY.
Matula, S. and Dirsken, C. 1989. Automated Regulating and 61

Recording System for Ring Infiltrometers, Soil Science Society of America Journal, Vol.53,_pp.299-305.
Musgrave, G.W.and Horton, H.N. 1964. Infiltration. Handbook of Applied Hydrology (ed. by V.T.Chow). Sec.12. McGraw Hill book company; New York. NY.
Packer, P.E. 1951. An Approach to Watershed Protection Criteria. Journal of Forestry 49(9). Page 639-644.
Parlange, J.Y. 1971. Theory of Water Movement in Soils, 2, One Dimensional Infiltration, Soil Science, 111, pp. 170-174.
Philip, J.R. 1957. Numerical Solution of Equations of the Diffusion Type with Diffusion Concentration Dependent,II,
Australian Journal of Physics.
Philip, J.R. 1957a. Numerical Solutions of Equations of the Diffusion Type with Diffusivity Concentration Dependent, IT, Australian Journal of Physics, 10, pp.29-42.
Philip, J.R. 1973. Theory of Infiltration Advances in
Hydroscience ( ed. V.T.Chow), Vol.5, Academic press, New-York, N.Y. Page. 215-296.
Philip, J.R. 1973. On Solving the
Equation, 1, The Flux Concentration Science, 116, pp.328-335.
Powell, G.M. and Beasley, R.P. 1967. Effect of infiltration rates. University of Missouri. Res. Bull. 922. Page 47.
Saturated Flow Relation, Soil
erosion on water Agri. Exp. Sta.
Ranganna, G., Lokesh, K.N., Gajendragad, M.R., Chandrakantha, G., Harshendra, K., Ars, A.K., and Kori, M.M. 1991. Studies on infiltration characteristics in soils of Pavanje river basin of DakshinaKannada district (Karnataka state). Hydrology Journal of IAH, vol.XIV, no.1, pp.33-40.
Rauzi, F. and Fly, C.L. 1968.Water Intake on Mid-Continental
Range lands as Influenced by Soil and Plant Cover, USDA Tech.
Bull. No. 1390. Page 58.
Richards, L.A. 1952. Report of the sub-committee on
permeability and infiltration, committee on technology.
Proc. Soil Science SoCiety of America, 16(1), pp.85-88.
Saxena, R.K. 1992. Evolution of Soil Auto Infiltrometer.
Journal of Water resources Society, Vol.12.No.1&2,
pp. 63-65.
Schrt05 vedlebindongelatLinca
liisli104967.Regression Models
from short duration 62

Convective stri ms, Water resources research, 3 (2),
pp.389-395.
Sehgal, S.R., 1973, CBIP Annual Research Session, May Issue.
Self Dispensing Infiltrometer, pp. 59. Hydrological
Investigations, Soil and Water Conservation Research.
ShankarnaraYan, K.A.(ed) 1982. Natural and human resources appraisal for integrated development of Guhiya watershed, Upper Luni basin Central Arid Zone Research Institute, Jodhpur Technical Report.
ShankarnaraYan, K.A. and Kar, A. 1983. Upper Luni basin: an integrated analysis of natural and Human resources for development planning. Central Arid Zone Research Institute, Jodhpur Technical
Report.
Sharda, V.N.and Singh, S.R. 1992, Infiltration and Ground Water Recharge. Water Science Education Series, No.3.
Sharp, A.L.and Hortan, H.N. 1940. A Graphical Method of Analysis
of Sprinkled Plot Hydrographs, Trans. American Geophys
Union, 21, pp.558-570.
Sharp, A.L.and Hortan, H.N. 1942. Extension of Graphic Method of Analysis Sprinkled Plot Hydrographs to the Analysis of
Hydrographs of Control Plots and Small Homogeneous
Watersheds. Trans. American Geophys Union, 23, pp.578-593.
Trimble, G.R.1958. How Type of Forest Effects Infiltration, Journal of Soil and Water Conservation, 13, pp.81-82.
Willis, W.S. 1965.Use of rainfall Simulator in a laboratory
Study of Infiltration Rates of Bare Soils.
63

Reporting Group
DIRECTOR : DR. S. M. SETH
TECHNICAL COORDINATOR : DR. K. K. S. HHATIA. SC F
DIVISIONAL HEAD : SH. B. P. ROY. SC. 'E
STUDY GROUP : DR. RAJIV SIh4HA SC. B
DR. SUDHIR KUMAR. SC. C
ASSISTANCE : SH. RAJAN VATSA. SRA
: SH. RM. NACHIPPAN , SRA