Strong Weak and Metastable Liquids Structural and Dynamical Aspects of the Liquid State
11
il ELSEVIER Physica A 263 (1999) 378-388 PllY$1CA/ Strong Weak and Metastable Liquids Structural and Dynamical Aspects of the Liquid State G. A. Vliegenthart, J. F. M. Lodge and H. N. W. Lekkerkerker Van 't Hoff Laboratory for Physical and Colloid Chemistry Debye Research Institute, Utrecht University, Padualaan 8, 3584 CH Utrecht, The Netherlands Abstract Structural and dynamical properties of a model liquid system were studied as a function of the range of the interaction using computer simulations. We observed the usual strong dependency of the global phase diagram on the range of attraction. In systems with long range attractive interactions the structure of the liquid state down to the triple point is determined by the short range repulsive forces. For short ranged attractive interactions however the attraction has a noticeable effect. Although the gas-liquid transition becomes metastable as the attractive range becomes shorter, the change in dynamics in these systems when passing the hidden binodal is gradual rather then abrupt. 1 Introduction In the past century the influence of attractive and repulsive interactions on phase tran- sitions has been widely studied and it is now generally accepted that for condensation attractive forces are necessary while for crystallization hard core repulsion is sufficient [1]. In recent years the emphasis has shifted to the role of the range of the attractive inter- action in phase transitions. It appears that the characteristic quantity which determines the global features of the phase diagram is the ratio range attraction~range repulsion. The role of the interaction range in phase behaviour was extensively studied in the field of colloid physics [2-4]. Colloids are suitable for manipulating the interaction range and thus for studying its role in phase transitions. A commonly used approach is adding non-adsorbing polymer to a colloidal dispersion which leads to an effective attractive interaction [5 7]. Consider a mixture of hard spherical colloidal particles and polymer coils which are freely interpenetrable in a good solvent. Each colloidal particle is surrounded by a shell of thickness roughly Rg (Rg is the radius of gyration of the polymer) which is not accessible for the center of the polymer coils. Such a shell represents an excluded volume for the polymer and in a mixture the total free volume available for the polymer coils depends on the overlap of excluded volumes of different colloidal particles. Overlap of excluded volumes will lead to an increase of the available volume for polymers and 0378-4371/99/$ - see front matter © 1999 Elsevier Science B.V. All rights reserved. PII: S0378-4371 (98)00515-9
-
Upload
independent -
Category
Documents
-
view
2 -
download
0
Transcript of Strong Weak and Metastable Liquids Structural and Dynamical Aspects of the Liquid State

il ELSEVIER Physica A 263 (1999) 378-388
PllY$1CA/
Strong Weak and Metastable Liquids Structural and Dynamical Aspects of the Liquid
State
G. A. Vliegenthart, J. F. M. Lodge and H. N. W. Lekkerkerker
Van 't Hoff Laboratory for Physical and Colloid Chemistry Debye Research Institute, Utrecht University, Padualaan 8,
3584 CH Utrecht, The Netherlands
A b s t r a c t
Structural and dynamical properties of a model liquid system were studied as a function of the range of the interaction using computer simulations. We observed the usual strong dependency of the global phase diagram on the range of attraction. In systems with long range attractive interactions the structure of the liquid state down to the triple point is determined by the short range repulsive forces. For short ranged attractive interactions however the attraction has a noticeable effect. Although the gas-liquid transition becomes metastable as the attractive range becomes shorter, the change in dynamics in these systems when passing the hidden binodal is gradual rather then abrupt.
1 I n t r o d u c t i o n
In the past century the influence of attractive and repulsive interactions on phase tran- sitions has been widely studied and it is now generally accepted that for condensation attractive forces are necessary while for crystallization hard core repulsion is sufficient [1]. In recent years the emphasis has shifted to the role of the range of the attractive inter- action in phase transitions. It appears that the characteristic quantity which determines the global features of the phase diagram is the ratio range attraction~range repulsion.
The role of the interaction range in phase behaviour was extensively studied in the field of colloid physics [2-4]. Colloids are suitable for manipulating the interaction range and thus for studying its role in phase transitions. A commonly used approach is adding non-adsorbing polymer to a colloidal dispersion which leads to an effective attractive interaction [5 7]. Consider a mixture of hard spherical colloidal particles and polymer coils which are freely interpenetrable in a good solvent. Each colloidal particle is surrounded by a shell of thickness roughly Rg (Rg is the radius of gyration of the polymer) which is not accessible for the center of the polymer coils. Such a shell represents an excluded volume for the polymer and in a mixture the total free volume available for the polymer coils depends on the overlap of excluded volumes of different colloidal particles. Overlap of excluded volumes will lead to an increase of the available volume for polymers and
0378-4371/99/$ - see front matter © 1999 Elsevier Science B.V. All rights reserved. PII: S0378-4371 (98)00515-9

H. Lekkerkerker et al. / Physica A 263 (1999) 378-388 379
therefore for an increase in entropy, which lowers the free energy and subsequently leads to an attractive interaction. The range of this effective attraction can be varied by changing the ratio of the polymer radius to the colloid radius. A first order perturbation theory to calculate phase diagrams for these systems was developed by Gast et al. [8] and later extended by Lekkerkerker et al. [9] to take polymer partitioning between the coexisting phases into account. The key parameter in these theories which determines the global features of the phase diagram is the ratio of the size of the polymer to the size of the colloid, q = 2 x Rg/a. Here a is the diameter of the colloidal particle. Experiments [2 4] on the phase behaviour of colloid-polymer mixtures for different values for q have confirmed the theoretical predictions. For large enough values of q (> 0.3, long range attraction) Ilett et al. [3] observe a three phase coexistence of colloidal liquid, crystal and gas bounded by three two phase regions of gas-liquid, gas-crystal and liquid-crystal, while for low q values (< 0.3, short range attraction) addition of polymer only expands the phase diagram for pure colloidal system. In the latter systems the gas-liquid binodal lies below the fluid-solid binodal and hence the gas-liquid transition has become metastable.
The possible metastability of the gas-liquid transition in molecular systems was for the first time suspected in the case of C60 which has a fairly large size compared to its attractive interaction range. Computer simulations on the phase behavionr of C60 [10] using a model potential proposed by Girifalco [11] indicate that this system has no stable liquid phase. On the other hand a combined integral equation and molecular dynanlics approach by Chang et al. [12] led to the conclusion that there is a small stable liquid region. Recent theoretical work [13-16] has not resolved this issue. Also experimentally this case has not been settled yet [17].
The first report of metastable liquid-liquid transitions in solutions of globular proteins dates back 20 years [18] and many similar observations have been made since [19-26]. Recently it was realized that the explanation for the metastability in these protein systems probably lies again in the fact that the interaction range is small compared to the protein size [19,27-31].
Both in colloidal dispersions as well as in protein solutions optimum crystallization [32 34] takes place in the gap between the fluid-solid and the hidden gas-liquid boundary while amorphous precipitation [35] or transient gelation [36] takes place below the metastable gas-liquid boundary. It is tempting therefore to impute this difference to the influence of the hidden gas-liquid boundary. The alleged role of the hidden binodal in phase transitions is a subject which has gained a lot of attention. Ten Wolde and Frenkel [37] performed simulations of the nucleation free energy barrier. They found that this barrier has a minimum value just above the metastable critical point. A possibly related and remarkable observation was done by and George and Wilson [35] who found that in the very same region of optimum crystallization, the second virial coefficient for at least a number of proteins has a remarkably constant value.
Although it is now recognized that the region between the fluid-solid binodal and the hidden gas-liquid line in the phase diagram is important for successful crystallization of proteins and colloids, the reason for this is still not entirely clear. Therefore we have performed calculations on phase behaviour, structure and dynamics as a function of the range of attraction.
380 H. Lekkerkerker et al. / Physica A 263 (1999) 378-388
;>
2
1.6
1.2
0.8
0.4
0
-0.4
-0.8
-1.2 0 . 8
v(n = 8) - - v ( . = n )
. . . . V(n = 12) V(n == tS)
1 1 . 2 1 . 4 1 . 6 1 . 8 2 2 . 2 2 . 4
r / ~
Fig. 1. The potential energy as function of the distance between the particles.
2 S t u d y i n g P h a s e B e h a v i o u r in Computero
We have studied the phase behaviour, structure and dynamical properties of systems whith a Lennard-Jones 2n-n potential given by eqn.1,
V ( r ) 4e [(ra-) ~n (ra-) n ] -- - ( 1 )
This is a simple one-parameter model for tuning the interaction range. Increasing n leads to a shorter ranged potential. Phase diagrams of this system were calculated by Hasegawa and Ohno[16] using an density functional approach. The precise results of such calculations strongly depend on the approximations made and therefore we used simulation methods to calculate the phase diagrams.
Our calculations are focussed on four values of n. First, n = 6 which is long ranged and the classical model for simple liquids [38,39]. This potential has been extensively studied and therefore is suitable to validate the methods used. The other potentials studied are the n = 11 and n = 12 which are medium to short ranged and n = 18 which is very short ranged. In Fig. 1 we give the potential energy as function of the interparticle distance.
Calculation of the phase diagram was done using the Gibbs Ensemble method developed by Panagiotopoulos [40] for the gas-liquid branch and the Kofke [41] or Clausius Clapeyron integration method for the fluid-solid branches, simulations for each of calculated (by
NVT Monte Carlo simulations [42] were performed to calculate static structure factors of the triple liquids. The structure factors were obtained by both direct Fourier transfor- mation of the density-density correlation function [44] and by Fourier transformation of the pair correlation function [42]. The algorithms were tested on the Hard Sphere system and the Lennard Jones 12-6 system for which accurate values are available in literature [38,39,43].
For the shortest ranged potential, n = 18 Brownian Dynamics simulations [45] were performed on systems varying from 864 to 4096 particles. These systems were used to observe the possible dynamical manifestation of the hidden binodal. Therefore the pair

H. Lekkerkerker et al. / Physica A 263 (1999) 378-388 381
A
2
1.8
1.6
1.4
1.2
1
0 . 8
0 . 6
0 .4
B
i
o o + + +
++ o o + +++
+ + o o + ¢ ~ o o
i ~+g g .............. ~-~---
0.9
0.8
0.7
0.6
0.5
0.4
o o
o o
o o
2 ° o
2 o
""0"~ . . . . . ~ . . . . ~ . . . . . . . . 1 - -
0 0.2 0.4 0.6 0.8 1 1.2 0.2 0.4 0.6 0.8 1 1.2
3 po go '~
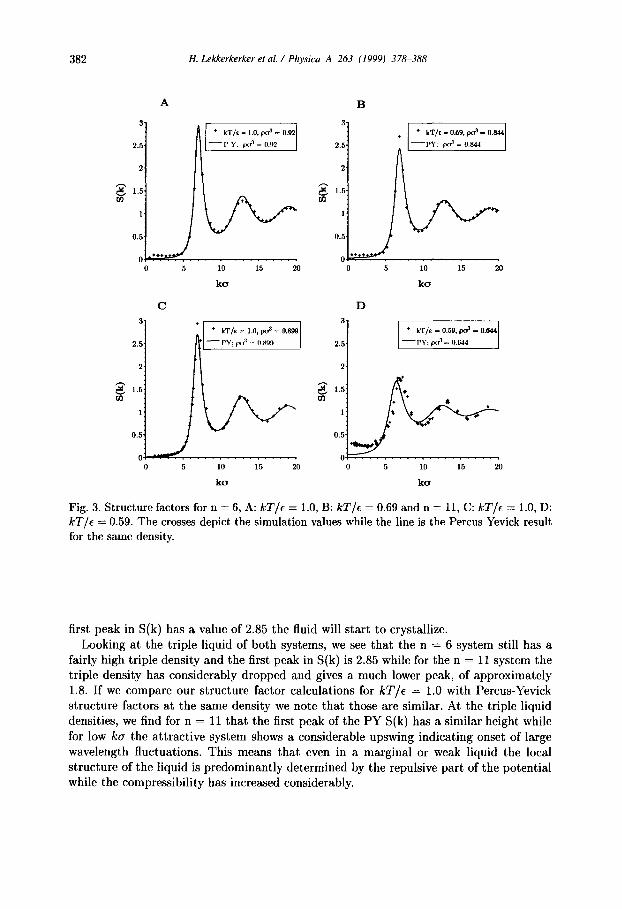
Fig. 2. Phase diagrams for n : 6 (A) and n = 11 (B). For n : 6 the critical temperature is 1.316 and the critical density is 0.316. For n = 11 the critical temperature is 0.60 and the critical density is 0.42.
correlation function, s t ructure factor, self diffusion coefficient, and the (:luster proper- ties were followed in t ime after quenching the system from kT/e : 2.0 to the desired temperature .
Quenching of the system took place in a single t ime step by resett ing the tempera ture for the Brownian force displacement, giving an essentially instantaneous quench. For each simulation, the procedure was repeated at least 7 t imes from stat is t ical ly independent equilibrium states. The average of these 7 quench responses was taken for the purpose of presentation. The simulations were carried out for approximately 1.3 × 10⁶ timesteps, each of durat ion 5.0 × 10 -5 a2/Do giving a total simulation length of about 65 reduced t ime units.
3 Resu l t s and Di scuss ion
3.1 Strong and Weak liquids
The phase diagrams of the systems with n = 6 and 11 were calculated using the methods indicated in the previous section. In Fig.2 these phase diagrams are presented. We find good agreement with the results obtained by Hasegawa and Ohno [16]. A decrease in the range of a t t rac t ive interaction leads to a lower critical tempera ture and a higher critical density. The tr iple liquid shifts to lower density while the triple tempera ture decreases as well.
Considering the s tructure of the liquid coexisting with the solid by the liquid's structure factor as given in Fig.3 we see the following. For the n = 6 system as well as for the n -- 11 system at high temperature , kT/e = 1.0 (crosses in Fig.3) the first peak of the structure factor has a value of about 2.85 which is in agreement with the Hansen-Verlet freezing criterion [39,43]. This states tha t whenever a fluid phase reaches a density such tha t the

H. Lekkerkerker et al. / Physica A 263 (1999) 378-388 383
A 1
B 1
0.9
0.8
0.7
0.6
0.5
0.4
o o+
g
o o
o o
o o
o o
: o o
o o B ° +
+ + •
0 0.2 0.4 0.6 0.8 1 1.2
po 3
0.9
0.8
0.7
0.6
0.5
0.4
o
o o I
o i
. f , : " i + 0 0.2 0.4
g
Q o
Q o
o o° § g 8 o
o
~ . . . . 0.6 0.8 1 1.2 1.4
p o a
Fig. 4. Phase diagrams for n = 12 (A) and n = 18 (B). For n = 12 the critical temperature is 0.56 and the critical density is 0.43. For n = 18 the critical temperature is 0.43 and the critical density is 0.43.
3.2 Metastable liquids
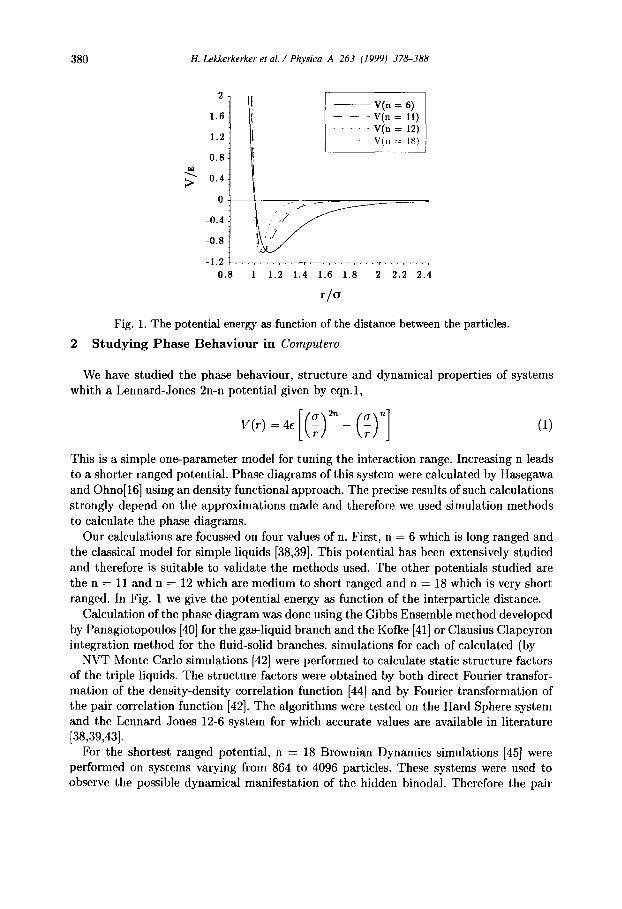
If we now further increase n to 12 and 18 the range of the a t t rac t ion is further decreased. The phase diagrams for n -- 12 and n = 18 are given in Fig.4 which again are in good agreement with the results of Hasegawa and Ohno [16]. Indeed, as expected, the critical t empera ture drops further and now sinks below the fluid-solid coexistence line. For n = 12 the gap is rather narrow while for n = 18 it is fairly wide. The freezing tempera ture at the critical density lies about 20% above the critical temperature . Considering the fluid phase we again calculated the structure factors (Fig.5) for the liquid coexisting with the solid. Now the calculations are done at kT/e = 1.0 and at the fluid-solid binodal above the metas table critical point. The structure factors at high tempera ture follow again the predicted PY hard sphere behaviour whereas the first peak for the fluids above the crit ical point decreases and critical fluctuations develop as is seen for low ka values. This means tha t the a t t ract ive interactions now have a large influence (increasing the local density) on the local s tructure and at the same t ime give rise to long wavelength fluctuations.
Moussaid et al. [46] have performed light scat ter ing experiments on colloid-polymer mixtures varying the range of interaction. They have considered systems with q -- 0.57, 0.38 and 0.24 with triple liquid volume fractions of respectively 0.444, 0.404 and 0.333. The height of the first peak in S(k) dropped from 2.85 to 2.0 while an upswing in S(k) at low k~r was found for decreasing q. Qual i ta t ive comparison between their experiments and our calculations show the same trends while our system with n = 11, compared to their system with q -- 0.24, which have about the same triple liquid density (ptcr a -- 0.64) shows a somewhat lower peak (1.8 versus 2.0).
The n -- 18 system was further s tudied using Brownian Dynamics at the critical density p~r 3 -- 0.43 down to a range of temperatures from just above the fluid-solid binodal to well beneath the gas- liquid binodal. Following a quench we observe a short t ime period

384 H. Lekkerkerker et al. / Physica A 263 (1999) 378-388
3
2 .5
2
1.5
{D
A
1
0 .5
÷ kT/~ = 1.0, po 3 = 0.891
- - P Y : pcv ~ = 0.89 J
O: ~ * ÷ ~ * ~ . . . . . . . 5 10 15 20
ko
B
2. L - - P Y : p,¢ = 0.42 l
+
1.5t " ,
0 5 10 15 20
ko
C 3 q
÷ kT/e = 1.0, po 3 = 0.891 i
2.5 - - P Y ; [x~ a = 0.89 |
2
1.5
1
0 .5
_ _ . . ~ 0 , - . . . . . . . .
5 10 15 20
ko
3
2 .5
2
~" 1.5
0.5
D
I ° k T / ¢ = 0 . 5 5 , p o 3 = 0 . 4 3 I
- - P Y : 1~3:; = 0.43 ]
÷ ~ °$.
5 I0 15 20
k o
Fig. 5. Structure factors for n = 12, A: k T / e = 1.0, B: k T / e = 0.56 and n = 18, C: k T / e = 1.0, D: k T / e = 0.55. T h e crosses give the s imulat ion results whi le the l ine is the Percus Yevick result for the same density.
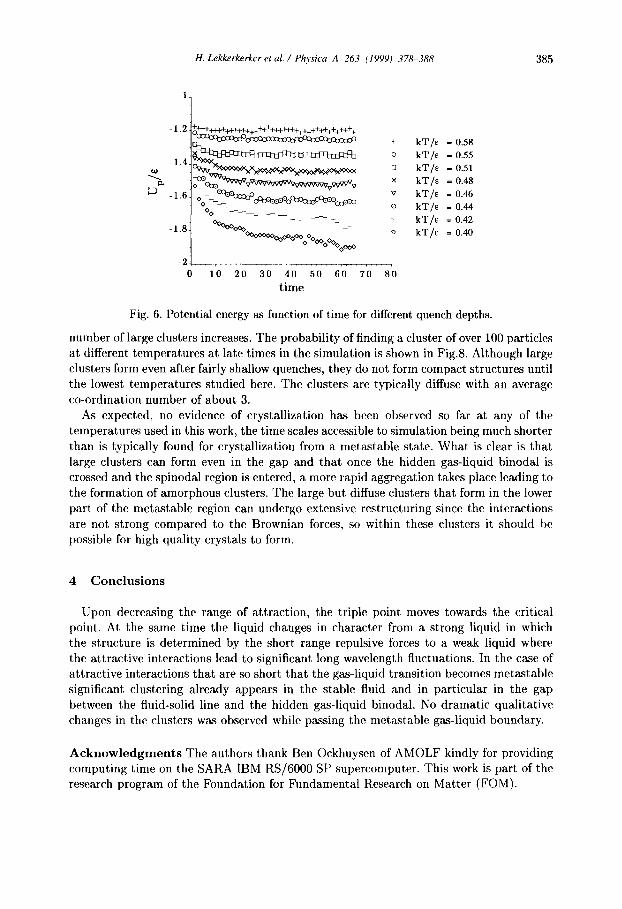
in which rapid clustering occurs, followed by a long period where there is little change observable in the systems. The rate of clustering increases as the quench is deeper. This is clearly shown by the evolution of interaction energy which shows the increasing association of particles with time (Fig.6). However, the change with temperature is gradual and continuous throughout the temperature range. Already in the one-phase region, as the fluid-solid binodal is approached, a certain amount of particle association occurs. The resulting density fluctuations can be seen from the upswing in S(k) at low ka Fig.TA (S(k) is taken at late times) The fluctuations increase as the temperature decreases in a fairly continuous manner (Fig.7B-F).
In order to determine the characteristics of the clusters, the cluster size distributions and the co-ordination number distributions were calculated. Since Lennard Jones type potentials are continuous, an arbitrary 'bonding length' must be specified. The value 1.045, which is the distance at which the strength of attraction is 99 % of the potential well, was chosen so that only very strongly interacting particles are included in a cluster. The number of small clusters decreased continuously as the temperature decreased, while the
H. Lekkerkerker et al. / Physica A 263 (1999) 378-388 385
't 1"4 + kT/e =0.58
o kT/e = 0.55 • = o . 5 1
1o_<~o~ V W v V v ~ v w v v V v × kT/e = 0.48
~ - 1"!1 O O- - ~ C ~ : ~ P d : ~ : : ~ : X : ~ ~ C O : ~ : kT/e = 0"46 o °o % -_~_ - ~ - kT# = 0.44 ooooooo ° ~ - ~ - _ _ _ - kT/l~ = 0.42
- 1. ooo00ooooo%ooo% q o kT/e = 0.40 0 00000
0 10 20 30 40 50 60 70 80 time
Fig. 6. Potential energy as function of time for different quench depths.
number of large clusters increases. The probability of finding a cluster of over 100 particles at different temperatures at late times in the simulation is shown in Fig.8. Although large clusters form even after fairly shallow quenches, they do not form compact structures until the lowest temperatures studied here. The clusters are typically diffuse with an average co-ordination number of about 3.
As expected, no evidence of crystallization has been observed so far at any of the temperatures used in this work, the time scales accessible to simulation being much shorter than is typically found for crystallization from a metastable state. What is clear is that large clusters can form even in the gap and that once the hidden gas-liquid binodal is crossed and the spinodal region is entered, a more rapid aggregation takes place leading to the formation of amorphous clusters. The large but diffuse clusters that form in the lower part of the metastable region can undergo extensive restructuring since the interactions are not strong compared to the Brownian forces, so within these clusters it should he possible for high quality crystals to form.
4 Conclusions
Upon decreasing the range of attraction, the triple point moves towards the critical point. At the same time the liquid changes in character from a strong liquid in which the structure is determined by the short range repulsive forces to a weak liquid where the attractive interactions lead to significant long wavelength fluctuations. In the case of attractive interactions that are so short that the gas-liquid transition becomes metastable significant clustering already appears in the stable fluid and in particular in the gap between the fluid-solid line and the hidden gas-liquid binodal. No dramatic qualitative changes in the clusters was observed while passing the metastable gas-liquid boundary.
Acknowledgment s The authors thank Ben Ockhuysen of AMOLF kindly for providing computing time on the SARA IBM RS/6000 SP supercomputer. This work is part of the research program of the Foundation for Fundamental Research on Matter (FOM).

386 tt. Lekkerkerker et al. / Physica A 263 (1999) 378-388
A 5"
4:
÷ kT/e = 0.58]
t ~
11
B 5"
4:
2
(1 5 10 15 20 ko
C ] 4
3
2 ~. ÷ 2
11 ~ . ~ ÷ ~ ~ , ~ . ~ . . ~ . ~ * ~ 1
1)/ . . . . . . . 0 (1 5 10 15 20
k o
E 5"
* kT/£=0.42]
2
' * ~ O ¢
{)
* kT/e-0.55]
÷
(] 5 10 15 20
k o D
÷
%v.,~ 4"
5 10 15 20 ko
F
~ : [ • kT/~ = 0.,,,]
4 : +
2:
• .s
0 5 10 15 20 0 5 10 15 20 ko k o
Fig. 7. Structure factor at late times at A: kT/e = 0.58, B: kT/e = 0.55, C: kT/e = 0.51, D: kT/e = 0.45, E: kT/e = 0.42, F: kT/e = 0.40, A and B are respectively in the one phase region and on the fluid-solid binodal, C and D in the gap between fluid-solid and hidden gas-liquid binodal and E and F below the metastable gas-liquid line.

H. Lekkerkerker et aL / Physica A 263 (1999) 378-388 387
0.0014
0.0012
0.001 0
/~ 0.0008 o
~ 0.0006
~u 0.0004
0.0002
+
+ +
+
¢
+
+
0.35 0.4 0.45 0.5 0.55 0.6
k T / e
Fig. 8. Probability of clusters with more then 100 particles versus the temperature
R e f e r e n c e s
[1] B. Widom, Science 157 (1967) 375. [2] P.N. Pusey, W.C.K. Poon, S.M. Ilett, P. Bartlett, J. Phys. Condensed Matter 6 (1994) A29. [3] S.M. Ilett, A. Orrock, W.C.K. Pooh, P.N. Pusey, Phys. Rev. E bf 51 (1995) 1344. [4] F. Leal Calderon, J. Bibette, J. Biais, Europhys. Lett. 23 (1993) 653. [5] S. Asakura, F. Oosawa, J. Chem. Phys. 22 (1954) 1255. [6] S. Asakura, F. Oosawa, J. Pol. Sci. 33 (1958) 183. [7] A. Vrij, Pure Appl. Chem. 48 (1976) 471. [8] A.P. Gast, C.K. Hall, W.B. Russel, J. Colloid Interface Sci. 96 (1983) 251. [9] H.N.W. Lekkerkerker, W.C.K. Poon, P.N. Pusey, A. Stroobants, P. Warren, Europhys. Lett.
20 (1992) 559 [10] M. Hagen, E.J. Meijer, G.C.A.M. Mooij, D. Frenkel, H.N.W. Lekkerkerker, Nature 365
(1993) 425. [11] L.A. Girifalco, J. Phys. Chem. 96 (1992) 858. [12] A. Chang, M.L. Klein, C. Caccamo, Phys. Rev. Lett. 71 (1993) 1200. [13] L. Mederos, G. Navacu(~s, Phys. Rev. B 50 (1994) 1301. [14] C. Caccamo, Phys. Rev. B 51 (1995) 3897. [15] M. Hasegawa, K. Ohno, Phys. Rev. E 54 (1996) 3928. [16] M. H~segawa, K. Ohno, J. Phys. Condensed Matter 9 (1997) 3361. [17] M.S. Dresselhaus, G. Dresselhaus, P.C. Eklund, Science of Fullerenes and Carbon Nanotubes
Academic Press, San Diego, (1996), Chapter 7 [18] C. Ishimoto, T. Tanaka, Phys. Rev. Lett. 39 (1977) 474. [19] G.D.J. Phillies, Phys. Rev. Lett. 55 (1985) 1341. [20] V.G. Taratuta, A. Holschbach, G.T. Thurston, D. Blankschtein, G.B. Benedek, J. Phys.
Chem. 94 (1990) 2140. [21] M.L. Broide, T.M. Tominic, M.D. Saxowsky, Phys. Rev. E 53 (1996) 6325. [22] J.A. Thomson, P. Sehurtenberger, G.M. Thurston, G.B. Benedek, Proc. Natl. Acad. Sci.
USA 84 (1987) 7079.

388 H. Lekkerkerker et al. / Physica A 263 (1999) 378-388
[23] P. Schurtenberger, R.A. Chamberlin, G.M. Thurston, J.A. Thomson, G.B. Benedek, Phys. Rev. Lett. 63 (1989) 2064.
[24] M.L. Broide, C.R. Berland, J. Pande, O.O. Ogun, G.B. Benedek, Proc. Natl. Acad. Sci. USA 88 (1991) 5660.
[25] C.R.Berland, G.M. Thurston, M. Kondo, M. Broide, J.Pande, O.O. Ogun, G.B. Benedek, Proc. Natl. Aead. Sci. USA 89 (1992) 1214.
[26] M. Muschol, F. Rosenberger, J. Chem. Phys. 107 (1997) 1953. [27] D. Rosenbaum, P.C. Zamora, C.F. Zukoski, Phys. Rev. Lett. 76 (1996,) 150. [28] A. Lomakin, N. Asherie, G.B. Benedek, J. Chem. Phys. 104 (1996) 1646. [29] N. Asherie, A. Lomakin, G.B. Benedek, Phys. Rev. Lett. 77 (1996) 4832. [30] M. Malfois, F. Bonnet6, L. Belloni, A. Tardieu, J. Chem. Phys. 105 (1996) 3290. [31] W.C.K Pooh, Phys. Rev. E 55 (1997) 3762. [32] C. Smits, J.S. Van Duijneveldt, J.K.G. Dhont, H.N.W. Lekkerkerker, W. Briels, Phase
Transitions 21 (1990) 157. [33] C. Smits, B. Van der Most, J.K.G Dhont, H.N.W. Lekkerkerker, Adv. Coll. Interface Sci.
42 (1992) 33. [34] P.N. Pusey, A.D. Pirie, W.C.K. Poon, Physiea A 201 (1993) 322. [35] A.George, W.W.Wilson, Acta Cryst. D50 (1994) 361. [36] W.C.K. Poon, A.D. Pirie, P.N. Pusey, Faraday. Discuss. 101 (1995) 65. [37] P.R. Ten Wolde, D. l~enke], Science 277 (1997) 1975. [38] L. Verlet, Phys. Rev. 163 (1968) 201. [39] J.P. Hansen, L.Verlet, Phys. Rev. 184 (1969) 151. [40] A.Z.Panagiotopoulos, Mol. Phys. 61 (1987) 813. [41] D. A. Kofke, J. Chem. Phys. 98 (1993) 4149 [42] M.P. Allen, D.J. Tildesley, Computer Simulation of Liquids, Clarendon, Oxford, 1987 [43] J.P. Hansen, D. Schiff, Mol. Phys. 25 (1973) 1281. [44] D. Frenkel, R.J. Vos, C.G. de Kruif, A. Vrij, J.Chem. Phys. 84 (1986) 4625. [45] P. J. Mitchell, D. M. Heyes, J. R. Melrose, J. Chem. Soc. Faraday Trans., 91 (1995) 1975. [46] A. Moussaid, W.C.K. Pooh, P.N. Pusey, M.F. Soliva submitted to Phys. Rev. Lett.