Striving for Business Excellence in Belarus - DiVA Portal
103
Striving for Business Excellence in Belarus − Tendencies of quality management in IT industry Authors: Sergej Arefjev Liudmila Strucheuskaya Tutor: Dr. Bertil Hultén Directors of research: Dr. Philippe Daudi Dr. Bertil Hultén Mr. Mikael Lundgren Programme: Master’s Programme in Leadership and Management in International Context Date: 2006-05-18 Baltic Business School, University of Kalmar. Sweden
-
Upload
khangminh22 -
Category
Documents
-
view
7 -
download
0
Transcript of Striving for Business Excellence in Belarus - DiVA Portal

Striving for Business Excellence in Belarus
− Tendencies of quality management in IT industry
Authors: Sergej Arefjev Liudmila Strucheuskaya
Tutor: Dr. Bertil Hultén
Directors of research: Dr. Philippe Daudi Dr. Bertil Hultén Mr. Mikael Lundgren
Programme: Master’s Programme in Leadership and Management in International Context
Date: 2006-05-18
Baltic Business School, University of Kalmar. Sweden

ACKNOWLEDGMENTS
During the writing of this thesis, there were several outstanding personalities who contributed largely to
the development of this work. We would like to express our sincere appreciation to Dr. Bertil Hultén
for his assistance and support in developing this thesis and to Dr. Philippe Daudi and Mikael Lundgren
for their excellent feedbacks during our struggle for excellence in this paper. And all our thankfulness
we would like to express to Daiva Balcuinaite, who was always opened to any kind of support and
whose useful advices that were taken into high consideration.
The most valuable person who connected us to the mysterious and tempting world of IT Alexey Novik
deserves our highest appraisal and we would like to thank him for his patience, editing the questionnaire
and lots of interesting comments to the present research. To all respondents, who devoted their pre-
cious time to filling in the questionnaires, as well as to our dear opponents, we would like to show our
gratitude as well.
We would like also to thank our parents and relatives, as without their moral support completing this
long journey to quality management could not be possible.
ii

ABSTRACT
Nonetheless IT sector is considered as highly competitive Belarus is listed in the top five, while also be-
ing in the transitional stage. Thus, this thesis examined the tendencies of the quality management in Bel-
arus IT industry. TQM, commonly used control system – ISO, and Business Excellence Models – Mal-
colm Baldrige National Quality Award (MNBQA) and European Foundation for Quality Management
(EFQM) were used as the basis for our research. The main premise for the research is that it is not nec-
essary to excel in all concepts of TQM, where ISO was used as the primary step towards total quality.
Hence it was deduced that quality in the collected sample differs among the concepts. Even though the
main concept of customer satisfaction is acknowledged, the human factor is still undervalued. This
might also be the flaw hinged by ISO. However, further research could be done, covering bigger sample
and observing the shift of these tendencies.
Key words: Total Quality Management (TQM), Interantional Organisation for Standardisation (ISO),
Business Excellence Model (BEM), IT, Belarus, transitional economy, tendencies, Leadership, Strategy,
Human Resources, Culture, Infrastructure
iii

TABLE OF CONTENTS
1. INTRODUCTION.........................................................................................................................................................1 1.1 BACKGROUND .................................................................................................................................................................1 1.2 THE PROBLEM OF QUALITY ..............................................................................................................................................1 1.3 THE PROBLEM IN THEORY AND PRACTICE........................................................................................................................2 1.4 THE SIGNIFICANCE OF THE PROBLEM ..............................................................................................................................4 1.5 RESEARCH QUESTION ......................................................................................................................................................4 1.6 AIM OF THE THESIS ..........................................................................................................................................................5 1.7 LIMITATIONS ...................................................................................................................................................................6 1.8 RESEARCH STRATEGY ......................................................................................................................................................6
1.8.1 Quantitative and qualitative research ...........................................................................................................................6 1.8.2 Data sources...........................................................................................................................................................7
1.9 RESEARCH DESIGN ..........................................................................................................................................................7 1.10 RESEARCH METHODS .....................................................................................................................................................8
1.10.1 Sampling ...........................................................................................................................................................10 1.11 QUALITY OF THE RESEARCH ........................................................................................................................................11
1.11.1 Reliability and generalisability ................................................................................................................................11 1.11.2 Validity and credibility.........................................................................................................................................11
1.12 THE RESEARCH PROCESS ..............................................................................................................................................12 1.13 THE OUTLINE OF THE THESIS.......................................................................................................................................13 2. FRAME OF REFERENCE ........................................................................................................................................14 2.1 INTRODUCTION .............................................................................................................................................................14 2.2 QUALITY........................................................................................................................................................................14 2.3 FROM Q TO TQM ..........................................................................................................................................................15 2.4 TQM GURUS AND THEIR MAIN CONTRIBUTING IDEAS....................................................................................................17
2.4.1 Dr. W. Edwards Deming.......................................................................................................................................17 2.4.2 Kaoru Ishikawa ....................................................................................................................................................17 2.4.3 Joseph M. Juran....................................................................................................................................................18 2.4.4 Philip Crosby .......................................................................................................................................................19
2.5 TQM ACCORDING TO OTHER RESEARCHES....................................................................................................................20 2.5.1 Quality definition in connection to TQM ....................................................................................................................20 2.5.2 TQM and Strategy................................................................................................................................................20 2.5.4 TQM and Leadership............................................................................................................................................22 2.5.5 TQM and management of HR ................................................................................................................................22 2.5.6 TQM and Learning ..............................................................................................................................................24 2.5.7 Supporting system (Resources and infrastructure) ..........................................................................................................25 2.5.8 General conclusions ................................................................................................................................................25
2.6 FROM TQM TO INTERNATIONAL STANDARD AND EXCELLENCE MODELS ....................................................................27 2.6.1 International Organization for Standardization (ISO)..................................................................................................27 2.6.2 Malcolm Baldrige National Quality Award (MBNQA)..............................................................................................29 2.6.3 European Foundation for Quality Management (EFQM) ............................................................................................31 2.6.4 Summary of discussions on the models ........................................................................................................................34
2.7 GENERAL CONCLUSIONS OF THE LITERATURE REVIEW: PRESENTATION OF A RESEARCH MODEL ..................................39 2.7.1 Bridging for further chapters.....................................................................................................................................41
3. RESULTS......................................................................................................................................................................42 3.1 INTRODUCTION .............................................................................................................................................................42 3.2 INDUSTRY OVERVIEW ....................................................................................................................................................42 3.3 GENERAL INFORMATION...............................................................................................................................................43
3.3.1 Company information.............................................................................................................................................43 3.3.2 Personal Informaton...............................................................................................................................................45
3.4 LEADERSHIP ..................................................................................................................................................................46 3.4.1 Commitment to quality ...........................................................................................................................................46
iv

3.4.2 Change agent ........................................................................................................................................................47 3.4.3 Unity of purpose....................................................................................................................................................47 3.4.4 Communication.....................................................................................................................................................48 3.4.5 Empowerment.......................................................................................................................................................50
3.5 STRATEGY .....................................................................................................................................................................50 3.5.1 Priorities of the company .........................................................................................................................................51 3.5.2 Company’s most important factors.............................................................................................................................52
3.6 CULTURE .......................................................................................................................................................................55 3.7 HUMAN RESOURCES .......................................................................................................................................................56
3.7.1 Participation in trainings ........................................................................................................................................56 3.7.2 Training as an instrument for improving operations ......................................................................................................57 3.7.3 Training as a source of frustration .............................................................................................................................58 3.7.4 Training as an instrument for transfer of company values ...............................................................................................58 3.7.5 Training as an enabler for meeting customer needs.........................................................................................................59 3.7.6 Motivation ...........................................................................................................................................................60 3.7.7 Involvement ..........................................................................................................................................................61
3.8 INFRASTRUCTURE ..........................................................................................................................................................62 3.8.1 Network of partners and suppliers ............................................................................................................................62 3.8.2 Technical environment ............................................................................................................................................63 3.8.3 Informational systems .............................................................................................................................................64
4. ANALYSIS ....................................................................................................................................................................65 4.1 INTRODUCTION .............................................................................................................................................................65 4.2 GENERAL INFORMATION ...............................................................................................................................................65 4.2 LEADERSHIP ..................................................................................................................................................................66
4.2.1 Commitment to quality ...........................................................................................................................................66 4.2.2 Change agent ........................................................................................................................................................67 4.2.3 Unity of purpose....................................................................................................................................................68 4.2.4 Communication.....................................................................................................................................................69 4.2.5 Empowerment.......................................................................................................................................................70
4.3 STRATEGY .....................................................................................................................................................................71 4.3.1 Priorities in the company .........................................................................................................................................71 4.3.2 Important factors in a company.................................................................................................................................72
4.4 CULTURE .......................................................................................................................................................................73 4.5 HUMAN RESOURCES .......................................................................................................................................................74
4.5.1 Training ..............................................................................................................................................................74 4.5.2 Motivation ...........................................................................................................................................................78 4.5.3 Involvement ..........................................................................................................................................................78
4.6 INFRASTRUCTURE ..........................................................................................................................................................79 5. CONCLUSIONS ..........................................................................................................................................................81 5.1 INTRODUCTION .............................................................................................................................................................81 5.2 ANSWERING THE RESEARCH QUESTION .........................................................................................................................81 5.3 THEORETICAL IMPLICATIONS ........................................................................................................................................83 5.4 PRACTICAL IMPLICATIONS..............................................................................................................................................84 5.5 THE METHODOLOGY .....................................................................................................................................................84 5.6 FUTURE RESEARCH ........................................................................................................................................................85 REFERENCES ................................................................................................................................................................86 APPENDIX 1: QUESTIONNAIRE ...............................................................................................................................93
v
TABLE OF FIGURES
FIGURE 2.1: THE EFQM EXCELLENCE MODEL.................................................................................................................................. 32 FIGURE 2.2: OVERLAP OF DIFFERENT SELF-ASSESSMENT MODELS................................................................................................... 35 FIGURE 2.3: RESEARCH MODEL ............................................................................................................................................................. 40
TABLE OF TABLES
TABLE 2.1: JURAN’S QUALITY TRILOGY................................................................................................................................................. 19 TABLE 2.2: KEY COMPONENTS OF PROCESS MANAGEMENT: A CONCEPTUAL FRAMEWORK ......................................................... 38
TABLE OF GRAPHS
GRAPH 3.1 PARTICIPATING RESPONDENTS BY NAMES OF COMPANIES .................................................................................44 GRAPH 3.2 NUMBER OF EMPLOYEES AMONG RESPONDED COMPANIES ...............................................................................44 GRAPH 3.3 PRESENCE OF ISO IN THE COMPANY .................................................................................................................44 GRAPH 3.4 PARTICIPATING RESPONDENTS’ STATUS IN THE COMPANY .................................................................................46 GRAPH 3.5 RESPONDENTS’ TIME SPENT IN THE CURRENT COMPANY ...................................................................................46 GRAPH 3.6 DIRECT MANAGERS’ COMMITMENT TO QUALITY ................................................................................................46 GRAPH 3.7 RESPONDENTS’ COMMITMENT TOWARDS THE CHANGE .....................................................................................47 GRAPH 3.8 RESPONDENTS’ AWARENESS OF COMPANY AIMS ................................................................................................48 GRAPH 3.9 RESPONDENTS UNDERSTANDING OF HOW HIS/HER WORK CONTRIBUTES THE COMPANY AIMS. ........................48 GRAPH 3.10 SOURCES OF INFORMATION AS INDICATED BY THE RESPONDENTS...................................................................49 GRAPH 3.11 RESPONDENTS’ ATTITUDE OF BEING WELL INFORMED ....................................................................................49 GRAPH 3.12 LEVEL OF FREEDOM EMPLOYEES HAVE IN ACCOMPLISHING THEIR WORK .......................................................50 GRAPH 3.13 ACTUAL PRIORITIES OF THE COMPANY AMONG THE RESPONDENTS.................................................................51 GRAPH 3.14 COMPANIES’ MOST IMPORTANT FACTORS .........................................................................................................53 GRAPH 3.15 THE IMPORTANCE OF FACTORS IN DESCRIBING THE QUALITY..........................................................................55 GRAPH 3.16 LEVEL OF PARTICIPATION IN TRAINING AMONG THE RESPONDENTS FOR THE PAST YEAR ...............................57 GRAPH 3.17 RESPONDENTS’ ABILITY TO DO JOB BETTER AFTER TRAINING..........................................................................57 GRAPH 3.18 RESPONDENTS’ FEELING OF FRUSTRATION WITH THE WORK PROCEDURES AFTER TRAINING ..........................58 GRAPH 3.19 RESPONDENTS’ HIGHER LEVEL OF AWARENESS ABOUT WHAT IS ATTEMPTED TO ACHIEVE AFTER TRAINING ...59 GRAPH 3.20 RESPONDENTS’ ABILITY TO BETTER MEET CUSTOMER NEEDS AFTER TRAINING ...............................................59 GRAPH 3.21 RESPONDENTS’ HIGHER LEVEL OF MOTIVATION .............................................................................................60 GRAPH 3.22 RESPONDENTS’ ATTITUDE TOWARDS SATISFACTION WITH THE SOCIAL BENEFITS ............................................61 GRAPH 3.23 RESPONDENTS’ ATTITUDE TOWARDS COMPANY’S CONCERN WITH PERSONAL PROBLEMS IN THE WORK...........61
vi

GRAPH 3.24 RESPONDENTS’ ATTITUDE TOWARDS COMPANY’S CONCERN WITH PROBLEMS IN WORK ...................................62 GRAPH 3.25 RESPONDENTS’ ATTITUDE TO EFFICIENCY OF NETWORK OF PARTNERS AND SUPPLIERS IN ACHIEVING
COMPANY GOALS.................................................................................................................................................................63 GRAPH 3.26 RESPONDENTS’ ATTITUDE TOWARDS HIGH EQUIPMENT LEVEL IN THE ORGANISATION...................................64 GRAPH 3.27 RESPONDENTS’ ATTITUDE TOWARDS THE SUFFICIENT LEVEL OF INFORMATION IN DECISION MAKING............64 GRAPH 4.1 PERCENTAGE OF ISO IMPLEMENTED COMPANIES AND NUMBER OF EMPLOYEES IN THE COMPANY...................65 GRAPH 4.2 RELATION OF MANAGERS’ COMMITMENT TO ISO PRESENCE IN THE COMPANY .................................................66 GRAPH 4.3 RELATION BETWEEN PRESENCE OF ISO AND LEVEL OF COMMITMENT TO CHANGE ..........................................67 GRAPH 4.4 RELATION BETWEEN COMMITMENT TO CHANGE AND MANAGERS’ COMMITMENT TO QUALITY .........................67 GRAPH 4.5 RELATION BETWEEN ISO PRESENCE AND QUESTIONS ON UNITY OF PURPOSE ..................................................68 GRAPH 4.6 EFFECTIVENESS OF SOURCES OF INFORMATION AMONG RESPONDENTS ............................................................69 GRAPH 4.7 DENSITY OF USE OF INFORMATION SOURCES IN THE COMPANIES WITH AND WITHOUT ISO ..............................69 GRAPH 4.8 RELATION BETWEEN LEVEL OF EMPOWERMENT AND PRESENCE OF ISO IN THE COMPANY...............................70 GRAPH 4.9 PARTICIPATION IN TRAININGS ...........................................................................................................................74 GRAPH 4.10 AVERAGE WORK EXPERIENCE OF THE TRAINEE ..............................................................................................74 GRAPH 4.11 COMPANY SIZE AND TRAINING ........................................................................................................................75 GRAPH 4.12 ABILITY TO IMPROVE OPERATIONS AND QUALITY MANAGEMENT SYSTEM .......................................................76 GRAPH 4.13 AFTER – TRAINING FRUSTRATION AND QUALITY MANAGEMENT SYSTEM .........................................................76 GRAPH 4.14 GOALS UNDERSTANDING AND QUALITY MANAGEMENT SYSTEM .....................................................................77 GRAPH 4.15 CUSTOMER ORIENTATION AND QUALITY MANAGEMENT SYSTEM.....................................................................77 GRAPH 4.16 GENERAL MOTIVATION AND QUALITY MANAGEMENT.....................................................................................78 GRAPH 4.17 SOCIAL BENEFITS AND QUALITY MANAGEMENT SYSTEM..................................................................................78 GRAPH 4.18 ANY PERSONAL PROBLEMS AT WORK ARE ALWAYS TAKEN INTO CONSIDERATION ...........................................79 GRAPH 4.19 THERE IS ALWAYS SOMEONE TO DISCUSS ANY PROBLEMS I HAVE WITH MY WORK ............................................79 GRAPH 4.20 NETWORK OF PARTNERS .................................................................................................................................80 GRAPH 4.21 TECHNICAL ENVIRONMENT .............................................................................................................................80 GRAPH 4.22 INFORMATIONAL SYSTEM ................................................................................................................................80
vii

1. INTRODUCTION
1.1 Background
In the first half of 1980s the level of managers realized the influence of quality on a company’s and its
future development. All this combined with stiffening rivalry from Japan and shifting quality require-
ments of customers increased the interest in quality issues among top executives. Since then, the con-
cept of quality has expanded into service organizations. It had become clear that service organizations
also should be managed systematically and must embrace the whole organization rather than only front
office personnel (Sandholm, 2000).
Starting from the mid 1980s a number of institutions were established to promote quality campaigns at
national level. Results of this are Malcolm Baldrige National Quality Award (MBNQA) and European
Foundation for Quality Awards. Their models have gained a significant recognition in U.S. and EU.
However, the quality in the countries with transitional economy is still questioned. More challenge is
faced in service sector, within the IT industry.
1.2 The problem of quality
The initial purpose of quality management is to reduce costs and improve customer satisfaction. This is
closely related with the Porter’s view of competitive advantage of a superior cost structure or ability to
differentiate products that add value for customers. In other words, improved product quality reduce
amount of rework, these savings can help lower firm's costs and by producing products that better sat-
isfy the needs of customers, there is the possibility for differentiation (Reed et al., 2000).
As the international competitive hostility increases, companies tend to enhance their quality systems in
terms of both infrastructure and core practices (Zhao, 2004). Quality management (QM) has become
one of the most widely accepted philosophies in organisations, and one of the most popular research
fields (Hardjono and Marrewijk, 2001).
Today, every company to some extent realizes the importance of implementing quality strategies. The
results of this are higher revenues, greater market share and company’s welfare in the long run (Kunst,
and Lemmink, 1992). Some managers, such as those at GE and Stanley Engineered Components, ob-
1

serve a real link between the management of quality and competitive advantage of the company (Au and
Choi, 1999). In GE's 1997 annual report, it was explained that their quality initiative, adopted in 1995
improved the firm's operating margin from 10% to more than 15% (Reed et al., 2000). According to
Bob Galvin’s claim, Motorola's former chairman, the gross national product of the USA could go up by
some 0.5 - 1% per year if there was a national policy on quality (Au and Choi, 1999).
Nevertheless, the meaning can be sometimes misinterpreted and blindly relied on the latest trend
(Sandholm, 2000). It was pointed out in the Economist (1992) that three-fourths of U.S. and British
companies used some type of quality management programme, but the expected result often was not
achieved (Reed et al., 2000).
Hence, the true weight of quality implementation is underrated, partly, because it is difficult to measure.
According to Harmon et al. report (2006), implementing a measurement system is a difficult but impor-
tant first step towards improving the productivity of services. However, still quality is a very abstract
meaning and the relevance of those factors affecting one company might be different for another.
Moreover, performance indicators used to monitor quality can be very confrontational (Geraedts et al.,
2001). According to one of the Fortune 1000 companies, 76% of companies in the list implemented
TQM programme (Stashevsky and Elizur, 2000).
1.3 The problem in theory and practice
In due course of developing understanding of quality and its definition, a lot of theories appeared as a
result of distinctive practices. The most enduring philosophy of quality theory is Total Quality Manage-
ment (TQM). Even though it has undergone the number of changes and offshoots, it is still the mostly
used philosophy and is not another management fad that is able of delivering competitive advantage
(Bellis-Jones et al., 1989).
The TQM originally appeared from statistical process control that Deming, one of the founders of
TQM theory, put as the basis for his work. Deming emphasised the importance of customers and con-
tinuous improvement. Other major gurus of TQM are Juran, Crosby and Ishikawa. Crosby put forward
the human factor when discussing TQM. Juran’s main contribution was the concept of managerial
breakthrough. This concept relied on the fact of leadership and manager’s ability to embrace change
(Armstrong and Stephens, 2005). Ishikawa also emphasised important role of leadership and top man-
2

agement commitment to quality. However, his idea of quality goes beyond improving product quality to
services after the original purchase.
TQM is seen to be a critical management philosophy for laying foundations of competitiveness for
firms. However in due time it has evolved into business excellence, as a result of a need to confront the
internationalisation of the economy and a hostile and turbulent environment in which competitiveness
requires more and more management to satisfy over changing customer needs (Camison, 1996).
The consequence of this trend is emergence of Business Excellence models (BEM): MNBQA model in
U.S and EFQM model in EU that gained considerable attention from enterprises. These models were
introduced as an attempt to measure quality and give general guide for companies that endeavour at ex-
celling in quality matters. The main focus of these models is leadership commitment through strategic
planning and drive of the whole organisation to improve processes and eventually achieve customer sat-
isfaction and higher business results.
The role IT plays in most organisations in practice results in a long term investments and risks as well.
Not to mention the fact of reliance and trust on the third parties (when outsourcing) in achieving com-
panies goals (Moran, 2005). According to Kanakamedala et al. (2006) new IT solutions and a more
competitive environment made it more expensive to serve customers. Nevertheless, serving them well
and cost-effectively has never been more vital. Therefore, being closer to customers and assisting them
in their endeavours will help to achieve better quality of service and overcoming the difficulties raised.
On the other hand, the importance of IT has increased due to the disruption in the flow of critical data
because of the internationalisation of suppliers (Pande et. al., 2006).
Standardisation has played a significant role in planned economy, where quality was neglected. The re-
sult of this was a hidden inflation (an effect of worsened quality that masked higher costs to ensure zero
inflation). Three generations of such policy were embedded in the culture and could not be changed
over night (Inglehart, 1990). Therefore, the biggest challenge in these countries is to realise the impor-
tance of customer satisfaction and commitment of all organisation to continuous improvement. Support
and motivation from top management are also important factors in these countries.
This has been said, it is obvious that for companies willing to compete in international arena it is neces-
sary to develop the skills that not comply with local needs and create competitive advantage that is sus-
tainable in a long term. However with the challenges faced in Eastern companies it can be difficult to
3

achieve. On the other hand Zhao et al. (2004) and Lemak and Reed (2000) present evidence that it is
not necessary for a company to do well in all aspects of quality management in order to succeed. There-
fore, it is interesting to observe what aspects of quality management are relevant for transitional econo-
mies and what level of quality is sufficient to ensure effective and efficient performance.
1.4 The significance of the problem
The beginning of outsourcing era makes an impulse for IT industry in Belarus. Among the positive fac-
tors of IT sector development were high educational level of employees and former Soviet past. Belarus
was considered as a computer lab in the whole Soviet Union, and it took its advantage in network op-
erations, application development, security, web site development/ management, architecture, data cen-
tre operations, application management and customer support. The activity of IT outsourcing has been
increasing year after year, and though Belarus hardly can compete with India, it goes right after them
and Russia and Eastern Europe as a whole. Thus, Belarus takes 4th place in the outsourcing destina-
tions. The researchers underline that among the success factors the most important is ongoing man-
agement, and the nearness of business is quite crucial (the location of Belarus right in the centre gives
advantages in time for travelling).
The selection criteria show that the most important are specific skills, then goes reputation/references
and only after these two goes the price. Taking into consideration this fact, it could be easily proved that
reputation or references are the form of companies’ image or customer feedback, and they are based
mostly on the quality of product or service. As it has been mentioned above, the ongoing management
stands on the first place of success factors, and this can be connected to the quality as well (as there is
an intention of study quality management system based on the model, not the phenomena of quality
itself). In the sphere of major challenges identified on the first place managing process/ relationship,
which is interrelated with ongoing management as a success factor. The both sides of the one medal –
quality management covers them all. (Trestle Group Research Report, 2004)
1.5 Research question
Based on the above discussion the following research question was raised:
How do companies manage quality in a country with a transitional economy?
4

Particularly, the thesis analysed the following questions to be able to answer the main research question:
• What is the significance and role of leadership in achieving quality?
• What is the effect of strategy in adopting quality?
• How are employees committed to quality?
• What is the focus and role of a quality policy in firms?
• What is the role of infrastructure in supporting quality level that companies pursue?
• What is the level of quality in companies operating within a transitional economy?
1.6 Aim of the thesis
The aim of the thesis is to find out how do companies manage quality in the transitional economy of
Belarus, what level of quality they are able to reach, and is it sufficient
Thus, it will first assess and discuss the different factors influencing quality within the organization. As a
result, the research model will be build to reflect the company and theory on Total Quality Management
(TQM). Hence, the research will deduce on developed quality system from the collected sample and will
highlight the best quality management practices. The attempt will be taken to identify the best practices
with regards to managing quality in IT industry in Belarus.
The collected sample reflects more than several companies, of different size, operating in IT sector in
Belarus. The sample will also reflect companies with and without quality management systems (ISO).
Thus, it will be observed whether the ISO implementation has any effect on a company perception of
quality. The accuracy of claim that ISO gives a good basis for the further implementation of the TQM
model (EFQM or Baldrige) will be also tested.
It will be also identified whether the suggested research model gives a good framework for assessment
or it is too general and needs additional concepts for justified conclusions.
All in all, the endeavour in this research will facilitate the general understanding of authors in IT indus-
try operations within the field of quality management.
5

1.7 Limitations
It is necessary if not obligatory to draw some limitations specific to this research. The limitations are
mostly based on the three main factors: time, country and industry.
The time limitation is associated with the period of research. In the other words, the time of gathering
information from questionnaires will take approximately two and a half weeks: from 19 of April to 5 of
May. However the purpose of the research is not associated with the time rather the sample to be col-
lected. Therefore, the data collection had been stopped when the sufficient number of answered ques-
tionnaires was received (49 received responses).
The research will be also conducted in a single country – Belarus, within IT industry. The questionnaire
will be distributed only among people working in IT companies, regardless of the personnel position,
i.e. from top level managers to front level employees.
1.8 Research strategy
In this section the methodology used to collect data will be discussed and then the process of the re-
search will be briefly presented. This involves the three stages of decision-making. The first is whether
the research is quantitative or qualitative, second, the actual design of the study, and third, how evidence
is to be collected. The limits of time and available resources as well as the character of the research
question will be taken into consideration (Brewerton and Millward, 2001). The methodology will be
concluded with validity and reliability of the research and the brief presentation of the research proce-
dure.
1.8.1 Quantitative and qualitative research
Even though the quantitative research is perceived as the more respectful, it is also known that a quali-
tative research can give a greater depth and understanding on the topic. This is due to the common be-
lief where science is related to numbers and precision. Also the qualitative research takes much longer
and requires a greater clarity of goals and can not be analysed using the computer programmes (Berg,
2004).
6

“Quality refers to what, how when, and where of a thing – its essence and ambience. Qualitative re-
search, thus, refers to the meanings, concepts, definitions, characteristics, metaphors, symbols, and de-
scriptions of things” (Berg, 2004, p. 3).
Due to the nature of the topic – quality management – it would be more appropriate to conduct a quali-
tative research. However, this would not give more justification to the already ambiguous concept of
quality. Therefore this research will strive at measuring the quality upon the concepts derived from the
literature review, presented in the research model. This is also more appropriate according to TQM lit-
erature, where management by facts is vital. Thus, we believe that quantitative study will provide
enough facts to make necessary deductions.
1.8.2 Data sources
There are two types of data sources: primary and secondary. Primary data is considered to be a better
source of internal validity, because the researcher collects this data specifically to suit the research and
the field to be studied (Thietart, 2001).
“Because it is formalized and published, secondary data often comes to be attributed with an exagger-
ated status of ‘truth’” (Thietart, 2001, p. 74). However, the objectivity of secondary information is usu-
ally taken at a face value; its reliability should be considered with regards to the published source.
Thietart (2001) suggests that primary and secondary data can complement each other at all stages of the
research. If primary data is incomplete, it can be supplemented with secondary data for better under-
standing or to evaluate the information collected. In the same way the secondary information can be
backed up with primary to give more weigh to information ready at hand.
In our research the information was collected using both sources. The primary data was obtained from
questionnaires. The secondary information was collected from the articles and other scientific publica-
tions to form an overview of the IT industry in Belarus.
1.9 Research design
According to Brewerton and Millward (2001) the design of a research pertains to the strategy used to
collect empirical data, to analyse the findings and draw conclusions. “A design is a way of arranging the
7

environment in which a survey takes place. The environment which consists of the individuals or
groups of people, places, activities, or objects that are to be surveyed” (Fink, 2003:2, p.31). The design
must fit the research question and the type of evidence that it is necessary to obtain (Brewerton and
Millward, 2001).
Fink (2003:1) suggests two designs of survey based studies: experimental and descriptive. Experimental
design is characterised in terms of comparison of two or more group, where one is an experimental and
another is a control (or comparison) group. Descriptive or observational design “produces information
on groups and phenomena that already exist. No new groups are created” (Fink, 2003:2, p. 33). Descrip-
tive research design is mostly appropriate for this type of research. This is due to the fact that the group
under observation constitutes a sample from IT industry in Belarus and the result will show its quality
development level.
Further the descriptive research can be divided into cross-sectional designs, cohort designs and case-
control designs. Cross-sectional designs give a description of one or many groups at one point in a time,
while a cohort study observes the group of people that have something in common and remain so dur-
ing the extended period of time. Cohort designs are also prospective and provide data about changes in
specific population. Case-control designs are retrospective (go back in time) and explain why the current
phenomena exists. This involves investigation of two groups where one is under phenomena (Fink,
2003:2).
Due to the fact that this research investigates the level of quality in a sample from IT industry in Belarus
at one point in a time the cross-sectional design is most appropriate to apply. The other designs are not
suitable because the time does not have anything to do with our research question.
1.10 Research methods
The following section concerns research methods and discusses them in depth. The research method as
mentioned before is a survey. “Surveys are systems for collecting information from or about people to
describe, compare, or explain their knowledge, attitudes, and behaviour” (Fink, 2003:1, p 1).
Gerald and Whicker (1998) divide surveys into two different types: “interviews (face to face interviews
or phone interviews) and self administered surveys (normally sent through mail)” (Gerald and Whicker,
8

1998, p. 104). The four types of survey instruments are outlined in Fink (2003:2). These are self admin-
istered questionnaires, interviews, structured record reviews, and structured observations.
The objective of our survey is to determine the level of quality of organisation. Quality is a combination
of the important factors (see research model) determining company’s level of excellence. Thus, self ad-
ministered questionnaires are considered to be most appropriate. This is due to the purpose of the re-
search to measure the level of quality and inability to conduct interviews.
Questionnaire development procedure can be described according to six steps of presented in Gerald
and Whicker (1998, p. 88):
1. Statement of purpose. In the first step the problem and purpose of the research were defined.
This has evolved from the numerous literature reviews on the topic of Quality and Total
Quality Management (TQM).
2. Define relevant variables. After an extensive literature review, the important concepts of Quality
were highlighted and put together to represent the model of this research.
3. Develop questions. Once the research model was developed and approved by the supervisor, the
necessary questions were asked to collect the necessary information for analysis. The ques-
tions were structured to measure the attitudes on a scale of five: completely agree, agree, un-
certain, disagree and completely disagree. As was suggested by Fink (2003:2) uncertainty was
used to denote either respondent’s low knowledge or hesitation on a topic.
4. Construct questionnaire. The questionnaire was constructed following the suggestions from
Fisher (2004) and Fink (2003:1). The questionnaire then was constructed, i.e. the introduction
was written and questions were structured in a logical way.
• The questions were structured as short as possible in order to avoid vagueness.
• They were designed to look attractive and formal. The questions were highlighted and the
spaces were left in between. The BBS logo was also put on the first page of the question-
naire to give a sense of significance and formality.
9

• The questionnaire was divided into the parts to reflect the subject of the group of ques-
tions. The parts were named after the concepts of our research model.
• The questions were put in order of significance and difficulty, easy questions first and hard
ones last.
5. Pretest questionnaire. To avoid any mistakes and inconsistencies, the questionnaire was submitted
to the supervisors for pretest and final confirmation before sending it to the respondents.
Once the questionnaire was approved, it was translated to Russian language. This is because
the country of the surveyed company is Belarus where Russian is widely known and accepted
language. After translation, the questionnaire was once again pretested this time by sending to
our colleagues from programme and acquaintances in IT sector. After final correction, the
questionnaire was put into Microsoft Word programme (to be able to fill it with the help of
computer) and sent to the respondents.
6. Administer, code, and report. After receiving the answers from respondents, the information was
put in an appropriate programme for data systemisation – “Sphinx”. The programme pro-
duced graphs and other statistical data that was used as a basis for chapter 3 – empirical data.
This was then used to analyse and answer the research question.
1.10.1 Sampling
As defined by Fink (2003:2) sample is a portion of a larger group (population) and is used to define ten-
dencies of this group.
Inclusive criteria for the respondents is concerned with the country respondent works – Belarus, the
industry company operates - IT and have access to the internet. Due to the inclusive criteria discussed
above, the nonprobability sampling will be used as it is not guaranteed that all eligible units will be in-
cluded in the sample. Therefore, the so called snowball sampling (Fink, 2003:2, p. 41) will be applied, i.e.
the questionnaire will be sent to the people working in the IT companies in Belarus and these are ex-
pected to forward the questionnaire to their colleagues.
10

The number of received responses or the sample of the research is 49 people. Thus, due to a low repre-
sentative level of the sample our thesis will avoid any generalisations and will instead emphasise tenden-
cies of the sample collected.
1.11 Quality of the research
Four concepts can describe the quality of the research. Among them there are reliability, generalisability,
validity and credibility. Basically, validity is defined as an accurateness of the results, reliability as the
ability of the results to be repeated, generalisability – the ability to have a meaning beyond the data set
and credibility as a soundness of data. These key elements of the assessment are crucial during and after
data analysis. (Maylor, Blackmon, 2005)
1.11.1 Reliability and generalisability
With this study we hope that we enter the new world – a world of investigations in the area of quality
management in Belarus IT industry. The research which has been done could be assessed as a beginning
of the big adventure to the nuances of quality management understanding. It could be reliable in terms
of the start for new researchers limited by time, but we agree that more detailed specification and meth-
ods of quantitative research could lead to the higher level of reliability. Also in terms of generalisability
our research can be compared to the probation of the soil on containing some geological material, and
the evidence that there is something can be assured by further deeper and more thorough research.
1.11.2 Validity and credibility
Speaking about validity of the research, we think that tendencies which we have captured haven’t been
affected by other influence from the outside. As both of the researchers don’t have any experience in
working in IT company, it gave more fresh and objective view on the problem and the out coming re-
sults from the questionnaire. We don’t claim that the results which we have got are highly rigorous, but
we hope that we avoided shallow impressionistic overview of the problem by trying to look on the
problem from different perspectives. More over, the presence of two researches that can check the
analysis after each other can protect it from the one-side findings. The credibility of the research can be
proven by the outcome which have been received after the analysis of data.
11

The actual problem of the research could be sample size which doesn’t allow generalizing the outcomes,
but at least we hope that it makes possible to draw some tendencies in the process of quality manage-
ment in IT industry in Belarus.
1.12 The research process
In this part we will briefly present our research procedure which was structured upon the spiralling re-
search approach suggested by Berg (2004). In this approach one begins with an idea, and then gathers
theoretical information, after the idea is reconsidered and refined. Then, the possible design was consid-
ered; once the design of the research is developed theoretical assumptions and even original or refined
idea are re-examined. “Thus, with every two steps forward, you take a step or two backward before pro-
ceeding any forward” (Berg, 2004, p. 19).
However, the general procedure of the research can be seen as: Ideas Literature review Design
Data Collection and Organisation Analysis and Findings Dissemination (Berg, 2004, p. 20). Here,
the research idea should flow into a potential research question that may continue to change as the re-
search process unfolds.
First, the idea of the research - Quality management in geographically dispersed services - was presented
and the feedback was received. Then, when reviewing the literature the research idea was refined and
constituted a more general topic - Quality management: Striving for Business Excellence.
Consequently, the research design was selected to reflect the level of accessible information. Because
conducting research within one company was not possible the questionnaire was agreed to be most suf-
ficient for collecting primary data and answering the research question. Further, the questionnaires were
developed (see section 2.5 for how it was developed and Appendix 1 for the example) and sent to the
people1 working in IT industry using the internal mailing service. The research questions and the pur-
pose of the research were again revised.
Our subsequent activities involved data collection by receiving answers on an email address that was
created specifically for this research. After having received 49 responses the data collection was stopped.
Then the information was systemised using “Sphinx” programme and analysed. The final part of the
research involves an appropriate reporting and presentation of the findings with the help of graphs and 1 The acquaintances were used to fill the questionnaires and spread it among their colleagues.
12

other statistical methods. The purpose of this was to make the data collected easy to analyse, representa-
tive and clear for a reader.
1.13 The outline of the thesis
The outline of the thesis followed a standard structure, but some chapters (introduction and methodol-
ogy) were merged to create a balance between the chapters.
The outline of the thesis starts from introduction where the problem of quality in general with some
examples in theory and practice are presented, thus leading to the significance of the problem. A logical
result of this is a purposeful research question formed along with the aim of the thesis. The thesis was
also delimited within the time, country and industry aspects.
As a result of the merger discussed previously, the research strategy (or methodology) part followed,
where the research design, data collection sources and methods were defined and discussed. This part
concluded with validity and reliability of the research followed by description of the research process.
Further, the most relevant literature review will be presented in chapter 2. This part was mostly based
on TQM literature as the most widely used quality philosophy in our days. The review of the literature
represents the evolution of thought on quality. It starts with general idea of quality and its different per-
ceptions. Then, the ideas and different outcomes of various researchers are presented preceded by total
quality gurus. The thought develops further into business excellence with presentation of major models
of Europe (European foundation for Quality Management) and U.S. (Malcolm Baldrige National Qual-
ity Award). Thus the literature develops from quality to total quality to business excellence.
The result of this is an own developed research model used to develop the questionnaire (see Appendix
1) and collect empirical data presented in chapter 3. Thereafter, the research model was also used to
present the empirical data, structure the overall analysis (chapter 4) and draw up the conclusions (chap-
ter 5). The final part also included suggestions for further research and practical implications.
13

2. FRAME OF REFERENCE
2.1 Introduction
In this part the most relevant literature review will be presented and the different opinions will be dis-
cussed. This will help to highlight the important concepts to be included in the research model that will
follow as a conclusion of the literature review. The section will be constructed in the following way.
First, the discussion on quality and its evolution will be presented. Then, the TQM main contributors
and their main ideas will be presented. Afterwards, the main TQM researches will be summarised in a
discussion on the major outlined TQM concepts. Then the main standards and Business Excellence
Models (BEM) will follow. It will start from presenting ISO 9000 as the most widely used. Then the
Baldrige and European Quality models will be illustrated. This section will end up with a summary on
the main discussions and presentation of the research model deduced from the overall literature review.
2.2 Quality
First when talking about quality management a lot of questions arise what does it really mean. There-
fore, the quality concept should be discussed and defined. In this part we will present the debate on the
sense of quality and attempt to define it.
Despite the fact that quality is a part of every organisation’s strategy it is still an ambiguous concept.
Even though a number of authors have contributed with both classifications and definitions of the qual-
ity there is still substantial confusion about the application of quality. It seems that these concepts are
used just because they are in fashion. However it seems that the use of this concept is justified and is
one of the most important factors for gaining competitive advantage (Hansen, 2001, p.204).
Among people and some managers quality is usually perceived as something expensive, luxurious and
error-free (Edvardsson and Gustafsson, 1999).
A lot of authors define quality as simply meeting customer requirements (Hansen, 2001). The propo-
nent of this idea is Grönroos (1991) state that the perceived service quality is influenced by corporate
image that is formed by the technical and functional qualities.
14

Sandholm (2000, p. 12), referring to International Standard for quality vocabulary, defines quality as
“the ability of a set of inherent characteristics of a product, system or process to fulfil requirement for
customers and other interested parties”.
The modern perspective is taken with the focus on the corporate social responsibility where quality is
welfare of society while taking care of the core business (Hardjono and van Marrewijk, 2001).
Hansen (2001) summarising the literature on quality suggests five concepts: quality as consumer’s per-
ception, adaptation to expectations, quality as a value and adaptation to technical specifications. The
former two concepts are based on the customer’s criteria, while the latter two reflect producer’s criteria
more. The fifth element – business excellence - is suggested to meet the highest standards and therefore
is the most abstract. It may include all criteria without specifically referring to any of them. Thus, it can
constitute a general goal for the business.
Therefore, the above discussion “quality seems to mean that some people may judge certain things to be
better than others” (Hansen, 2001, p. 209) which is based on vague factors, such as perceptions, expec-
tations and experience of the parties involved (Brown et al., 1991) and therefore depends on the context
and purpose of the organisation.
2.3 From Q to TQM
Here, the authors will narrow down the concept of quality to Total Quality Management (TQM) and
will attempt to justify its selection. Also the different branches of TQM thought will be mentioned to
explain the further structure of the literature review on TQM.
To insert the concept of quality, i.e. a system of values cultural fabric and transform its members' ways
of perceiving, thinking and acting, requires a certain method (Camison, 1996). Edvardsson and
Gustafsson (1999) compare the choice of existing concepts with ordering a food in a restaurant. There
are a lot of concepts and different contributing authors within each of them. This is due to the different
methods developed as a result of varying organisational culture and its competitive strategy. As a result,
Samson and Terziovski (1999) literature review identified over a thousand articles on TQM philosophy
and its methods.
15

The fundamental concepts of quality management are TQM, Six-Sigma, ISO 9000, etc. For the past two
decades there is an increasing interest in total quality and its application through out the organizations.
The TQM perspective was found in Japanese organizations and somewhere is even called the Japanese
Quality.
Authors Reed et al. (2000) and Stashevsky and Elizur (2000) present a literature review and the research
based results that there is a number of empirical studies supporting the relationship between the TQM
and improved organisational performance, competitive advantage and sustainability.
Referring to ISO 8402, TQM is a “Management approach of an organisation focused on quality, based
on the participation of all its members and aiming at long term success through customer satisfaction
and benefits to all members of the organisation and to society” (Edvardsson and Gustafsson 1999, p.
113).
By Edvardsson and Gustafsson (1999) it is described as a “quality Nirvana” as a state in which a com-
pany has control over all processes that satisfy the needs of stakeholders and customers and at the same
time working for continuous improvement. Quality Nirvana, that can not be achieved but can be re-
warding in its attempt if it is done in “the right way”.
However, TQM practices are hardly adopted in western organizations, or will necessitate an organiza-
tional revolution (Kunst and Lemmink, 1992). Nevertheless, there is a series of broad theories, based on
a relevant number of successful practices. The most known Total quality gurus are those of Crosby,
Deming, Juran and Ishikawa.
Also, worth mentioning different approaches that come out from the different quality prizes which en-
courage the implementation of total quality in companies. The first award, established in 1951 in Japan,
was called Deming (after Dr. Edwards Deming). After more than three decades, in 1987, the Malcolm
Baldrige award was created in the USA. This initiative was followed in Europe in 1991, when the Euro-
pean Foundation for Quality Management (EFQM), created the European Quality Award in order to
improve the quality and reliability of products and services. These and other practices and theories will
be presented further and will constitute the literature review on TQM.
16

2.4 TQM gurus and their main contributing ideas
In order to understand the theory it is necessary to refer to the basis. Thus, hereunder the main gurus of
TQM: Deming, Juran, Ishikawa and Crosby - and their main contributing ideas will be presented and
discussed. This is necessary to understand what are the main schools of TQM and in what direction
they were developing.
2.4.1 Dr. W. Edwards Deming
"It is not enough to do your best; you must know what to do, and then do your best."(Deming, 2006)
He was invited to Japan at the end of World War II by Japanese industrial leaders to turn Japanese in-
dustry from producing imitations to producing innovative quality products. Deming's biggest contribu-
tion is laid in his famous 14 Points that serve as course of action for management. These tend to result
in a more efficient workplace, higher profits, and increased productivity may grow (Deming, 2005).
The Deming’s 14 points, originally highlighted in his work “Out of the crisis” are: construct the pur-
pose, adopt the new philosophy, cease dependence on mass inspection, end lowest tender contracts,
improve every process, institute training on the job, institute leadership, drive out fear, break down bar-
riers, eliminate exhortations, eliminate arbitrary numerical targets, permit pride of workmanship, en-
courage education, top management commitment and action (Deming, 2005).
The above discussion can be summarised by Anderson et al. (1994) who postulates that Deming’s qual-
ity starts from leadership to create a cooperative and learning organization to assist the adoption of
process management practices. Thus, this would result in sustained employee fulfilment and continuous
improvement and ultimately in customer satisfaction and organizational survival.
2.4.2 Kaoru Ishikawa
“Quality can go one step further” (Ishikawa, 2006)
Ishikawa wanted to change the way managers think of their work. He was opposing with managers atti-
tude of only improving a product's quality, stating that quality improvement can always go one step further.
His idea of total quality calls for continuous customer service or service even after receiving the prod-
17

uct. This service would extend through all the company and all levels of management, and even to the
everyday lives of those involved. This idea is expressed in his famous cause and effect diagram he em-
phasised the problem analysis through assigned teams (of all levels and departments) and in depth scru-
tiny of every aspect of the problem (Ishikawa, 2006).
Ishikawa believed in the importance top level management and specifically their support and leadership.
He strongly believed that any quality programme without the strong commitment of top executives to
drive the whole organisation would fail. Another area of that Ishikawa emphasized quality improvement
throughout a product's life cycle. He felt that standards should be constantly evaluated and changed to
achieve customer satisfaction. Thus, he called all managers to base their decisions from the ultimate goal
of satisfying customers. Ishikawa (2006) also expanded Deming’s model of Plan-Do-Check-Act into the
following six:
• Determine goals and targets.
• Determine methods of reaching goals.
• Engage in education and training.
• Implement work.
• Check the effects of implementation.
• Take appropriate action.
2.4.3 Joseph M. Juran
"Commitment is the daily triumph of integrity over scepticism." (Juran, 2006)
Joseph M. Juran made many contributions to the field of quality management throughout his research
career (Armstrong and Stephens, 2005). He contributed a lot in changing the Japanese philosophy on
quality management and shaping their economy into the industrial leader it is today. Juran was the first
to include the human aspect of Total Quality Management (Juran, 2006).
His main contributing ideas are summarised in the table below.
18

Table 2.1: Juran’s Quality trilogy
Quality Planning • Identify who are the customers.
• Determine the needs of those customers.
• Translate those needs into our language.
• Develop a product that can respond to those needs.
• Optimise the product features so as to meet our needs and cus-
tomer needs.
Quality Improve-
ment • Develop a process which is able to produce the product.
• Optimise the process.
Quality Control • Prove that the process can produce the product under operat-
ing conditions with minimal inspection.
• Transfer the process to Operations.
Source: Juran, 2006
2.4.4 Philip Crosby
"Do it right the first time." (Crosby, 2006)
While Deming and Juran were the great brains of the quality revolution Phil Crosby excelled in finding
an appropriate terminology for quality. His main contribution is laid in “Quality without tears” and
“Quality is Free” (Crosby, 2006). He introduced the popular idea - cost of poor quality – saying that it
costs a lot more to correct afterwards rather than do them right the first time.
His main focus is on zero defects, however meaning that zero defects is not something that is found on
the assembly line. This underlines the management as responsible for creating an appropriate atmos-
phere for employees to follow and perform better. The benefits for companies that pursue this idea, is a
dramatic decrease in resources used and time spent producing goods that consumers do not want
(Crosby, 2006).
Crosby defined quality as specifications set forth by management that conform to customer needs
rather than some level of goodness or elegance. He has derived the four absolutes of Quality Manage-
ment (Crosby, 2006) presented below:
19

1. Quality is defined as conformance to requirements, not as “goodness or elegance”.
2. The system for causing quality is prevention, not appraisal.
3. The performance standard must be Zero Defects.
4. The measurement of quality is the Price of Non-conformance, not indices.
2.5 TQM according to other researches
Having presented the main thoughts of the TQM philosophy, we can go further to present the different
ideas and results of the developed TQM thought. This part will be divided to highlight the different
concepts of TQM that were emphasised or deduced to have a great impact on TQM implementation in
the company. First, the quality definition in connection to TQM will be presented. Further, TQM defi-
nition, its concepts and techniques will be presented and discussed. This will follow with discussion of
different scholars on TQM concepts that we outlined during the literature review. These are strategy,
leadership, management of human resources, innovation, learning, supporting system. In the end the
general conclusions will summarise the discussion on those concepts.
2.5.1 Quality definition in connection to TQM
Referring to the topic of our research – quality management – we found necessary to define quality in
terms of TQM. This will help to understand the concept of quality as it is described by different schol-
ars of TQM.
Customer perception is the factor on which quality of the product or service depends, and customer
input to manufacturing product in this case is vital. Thus level of customer satisfaction can be managed
by better understanding of customer needs. (Chong and Rundus, 2004).
Quality has no more physical definition, and quality management can not perceived as management of
production process. It is multidimensional construct and strategic resource, which is a component of
firm’s dynamic capability. (Perdomo-Ortiz et al., 2005).
2.5.2 TQM and Strategy
Some of the researchers claim that quality should be included into strategy and thus become important
on the strategic level. This action could make an impulse into developing the whole quality system
20

(Zhaoa et al., 2004). TQM provides a combined structure of background and direction for resources
improvement as a variety of good management practices. In this case TQM provides the whole range of
competitive advantages to the company: cost or differentiations based, and as a result it produces barri-
ers for imitation. But competitive advantage depends on the firm strategy, firm orientation and envi-
ronment and executive commitment.
Many companies with TQM transferred their attempts from tool and techniques of TQM to integration
with organizational culture. Quite often lack of organizational culture leads barriers in co-operation,
joint action and problem solving. (Reed et al., 2000).
Before achieving TQM it is better to define organization culture, as introducing TQM changes frames
of references and shared postulates, which organization itself gained through the environment. As the
influence of these changes is quite high on employees, their beliefs and values, companies, which want
to introduce TQM before try to identify their own organizational culture. (Irani et al., 2004).
“TQM is a philosophy that organisations can use to improve their performance but, often there is an
overemphasis on its tools and techniques, which may take precedence over the need to create a culture
that is open to change. The following measures are essential to obtaining cultural change:
• the organisations policies, procedures and processes must emphasise quality;
• everyone in the organisation must have a clear understanding of the importance of quality in
achieving their business objectives;
• people at all levels must be aware of the requirements and needs of the customer;
• the structure of the organisation should allow for continuous improvement;
• there should be integration of internal and external customer requirements in the business
plan; use of customer-based measures of performance is important;
• there is a need to develop strong communication lines;
• customer commitment should be fostered; and
• emphasis on customer-oriented values and beliefs must be supported by top management.”
(Irani et al., 2004, p. 645)
Corporate culture with continues improvement and TQM improves companies abilities, and especially
for innovation (Irani, et al., 2004).
21

2.5.4 TQM and Leadership
Since the inception of the TQM movement, quality leadership by top management has been supported
by many researchers. To achieve total quality, top managers must clarify quality goals, treat quality as a
strategic issue, set quality as a priority, allocate adequate resources to quality improvement efforts, and
evaluate employees based on their quality performance (Jun et al., 2005). They can also lead by example,
providing training and education, and supporting the team can flourish (Reed et al., 2000). Obviously,
top management leadership and employee empowerment are the most important components of TQM
because of its connection to customer satisfaction. There is a positive correlation between top manage-
ment leadership, employee empowerment, job satisfaction, and customer satisfaction. Employee em-
powerment and improved levels of job satisfaction are facilitated by top management leadership and
commitment to the TQM goal of customer satisfaction by creating an organizational climate that em-
phasizes total quality and customer satisfaction (Ugboro and Obeng, 2000).
The role of CEO in the introduction or acceptance of new values and principles as business fundaments
in the forthcoming transformation process is very crucial, because in order to integrate new values, he
has to go through the process himself first. Otherwise he will not be able to lead his company into the
transformation process, even without being a charismatic and visionary leader (Hardjono and Mar-
rewijk, 2001).
The main mistakes which top management can do are showing little interest in undertaking quality im-
provement thus ignoring their fundamental role to inspire and guide in the necessary cultural change
towards total quality as a main method for continuous company improvement. If they have no com-
mitment, they can not recognize efforts and achievements of individuals and groups have no provision
of necessary resources, little participation with customers and suppliers in improvement projects, and
their almost non-existent involvement in promoting quality in their environment becomes evident
(Reed et al., 2000).
2.5.5 TQM and management of HR
From the HR point of view TQM is a management philosophy that is meant to authorize employees of
the organization, as well as reduce their frustration and fear to change in order to promote long-
continues improvement. These principles base on the fact it is cheaper to prevent than to correct. (Au
and Choi, 1999).
22

HR-related TQM practices could be identified as infrastructure practices which works like supportive
environment for the core quality management practices. TQM key attributes include employee training,
employee empowerment and employee involvement. They are important for organization, as they help
to use full human potential, reach business goals and accomplish actions plans. (Jun et al., 2005). Train-
ing, reward systems, teamwork, leadership are considered as more important factors for providing qual-
ity in service by employees. (Lemak and Reed, 2000).
The employee participation in decision-making program (PDM) as mutual influence of supervisors and
subordinates in organizations could be the major factors affecting employee improvement efforts. A
comprehensive survey of Fortune 1000 companies revealed that applying TQM together with PDM had
a strong relationship with organizational performance. PDM is the most important component of the
TQM process that affects improvement efforts and individual performance, because its influence on
participation in PDM is higher that that of Quality Management (Stashevski and Elizur, 2000).
There is empirical evidence that employees consider PDM as the major motive for participating in
TQM. On the other hand, doubts have been raised concerning the practicality of combining TQM and
PDM (Stashevski and Elizur,2000).
The common problems which faces HR managers while evaluation HR performance in TQM frames
are laying all responsibility on the worker for an error, though the result of it could be system and apply-
ing control measure over employee.
The literature contains few references to empirical studies on performance evaluation in the context of
quality management. Moreover, the number of theoretical articles is not impressive. Although the ma-
jority of these articles confirm the disadvantages of HR performance evaluation practices in a TQM
context, some of them argue that performance evaluation and quality management precepts are not
compatible. For instance, performance evaluation function is criticised and support Deming’s view in
1986 that TQM and HR performance evaluation are incompatible.
Further investigation may be necessary in order to bridge the gap between current performance evalua-
tion and a TQM-based HR performance evaluation, and identify those criteria and measures of em-
ployee performance that could benefit both organisations and employees. Among the main criteria of
Quality focused HR Performance Evaluation are helping employee improve their performance, cus-
tomer focus, active involvement of employees into modification of current system, collective responsi-
23

bility for quality, focus on behaviour/process to performance evaluation, judgement by absolute stan-
dards and managerial responsibility for system performance (Soltani et al., 2003).
2.5.6 TQM and Learning
Rosabeth Moss Kanter claims that “total quality” and “continues improvement” became one of the hot-
test themes in encouraging incremental innovation. They can assist to any business in striving for higher
standards with making little steps towards superior performance. Organizational learning and adaptation
is crucial right now because the pressure on business is increasing (Moss Kanter, 1989).
TQM can be linked with the organic or learning approach (Prajogo and Sohal, 2004). There are two
ways of applying TQM concepts named Total Quality Control which is related to conformance, and
Total Quality Learning in terms of innovation.
Learning is a process of continues improvement as “TQM, JIT and TPM have similar fundamental
goals of continuous improvement and waste reduction” (Cua et al., 2001, p.675). It is important to use
measurement system in the organizations with continues improvement with the high speed, as by this
process managers could get to know what is going well and what is needed to be improved. When TQM
is introduced to the company, these measurements can become self assessment techniques.
The role of self assessment in the organization is getting more attention in strategy as well as in planning
process. The potential of this process also makes organizations to look for areas of improvement. In
order not to reduce the effects of the self-assessment process it is necessary to link it with business cy-
cles of strategic planning, human recourses, budget and other, because otherwise it will never everyday
activity of the company. Due to the interviews held with the practitioners, they estimated that the suc-
cess lies in the using results of self-assessment in further strategies.
The criteria for successful self-assessment process include the following: support from the staff, includ-
ing self-assessment into business planning, support of performance monitoring, actions of pervious self-
assessment, not letting increasing workload on employees and etc. The process of self-assessment
makes easier to communicate for companies which employ it and prepare them for the future competi-
tion. (Ritchie and Dale, 2000).
24

2.5.7 Supporting system (Resources and infrastructure)
Normann (1991) claims technology and physical aid can fulfil a key function creating the desired human
behaviour. Taking as an example the service, the dependence of it on specific action or tools can ensure
quality, as well as productivity raise can ensure employee motivation for improving their jobs. Techno-
logical environment could produce advantages in costs or differentiation, and information system pro-
vides data for quick and effective solutions in order to reach continues improvement.(Camison, 1996).
Under a total quality approach (resource management), the hotel, for example, should focus its material
resources on the improvement of its infrastructure for quality. “Instead, there is a minimum effort at
maintenance and modernization of installations which, together with many hotels being old, leads to
obsolete and poorly maintained hotel plant requiring high investment to fulfil both technical norms set
by current legislation and market requirements” (Camison, 1996, p. 194). In general, equipment and
physical tools and premises can all be employed to facilitate and create any of the different types of cli-
ent participation, and at strategic level, physical aids can certainly contribute to the strategic positioning
of the company. The used equipment can standardize production and quality (Camison, 1996).
Quality of products or services is connected to suppliers, and in order to get the control over quality it
means that to influence these companies. Cutting costs and improving quality leads to outsourcing, and
“to ensure quality while buying from outside firms call for redefinition of the vendor relationship”
(Moss Kanter, 1989, p. 128).
2.5.8 General conclusions
According to Chong and Rundus (2004, p. 155), “the use of TQM practices has a synergistic impact on
organizational performance.” It was also found TQM reduces manufacturing process variance, elimi-
nates reworks and improves quality performance. Moreover, “there is considerable anecdotal evidence
on the extent to which TQM initiatives enhance the potential for firms to improve their performance”
(Chong and Rundus, 2004, p. 156).
Despite this, some researchers claim that “the disappointing results of TQM practices may be attributed
to inadequate resources, negligence in making complimentary investments in organizational structure
and human resources, and inadequate appreciation of system dynamics” (Chong and Rundus, 2004, p.
156). The authors claim that the adoption of TQM practices and market competition improve organiza-
25

tional performance. The main contributors to the TQM theory all stress the importance of TQM prac-
tices of customer satisfaction and better product design to gain a competitive advantage. The poor per-
formances of many new TQM initiatives are due, partly, to too much reliance on management account-
ing systems that fail to provide relevant information. (Chong and Rundus, 2004).
Proponents of TQM argue that the widespread adoption of TQM, fuelled by same industry benchmark-
ing and the institutionalization of numerous quality awards, could be regarded as evidence of the validity
of institutional theory. Thus, organizations implementing TQM are perceived as managing their opera-
tions in a similar fashion and commonly benefit from the implementation of TQM (Jun et al., 2005).
Recently, however, the lack of homogenous success with TQM among firms has led researchers to cast
doubt on the universal applicability of TQM. Some researchers believe that a firm’s success with TQM
is contingent upon the fit among the firm’s structure, strategy, and environmental conditions. In fact,
whether the TQM framework is universal or contingent still remains a controversial issue (Jun et al.,
2005)
There are two main purposes like content (A) and four main activities as process (B) of quality man-
agement, which are crucial for successful strategy implementation.
(A) The authors agree that customer has its central role in quality definition and quality itself satisfies
the customer and improve company’s competition. Also waste cost and rework should be reduced. As a
result, customer satisfaction improvement and cost reduction are the most points which can affect
strategy in terms of TQM.
(B) In the management of the process there are four areas of agreement like leadership and commit-
ment, training and education, teamwork and corporate culture. For functioning TQM long term com-
mitment of top level management is important as well as quality concept education and techniques for
employees and managers. The role of communication in the process of TQM is quite important and
organizational culture affects on quality commitment, production and practices.
In summary all these parts must be seen as the whole, not as the separate ones of TQM. Thus, the
whole system makes difficult to imitate and gives sustainable advantage for the companies. (Reed et al.,
2000)
26

2.6 From TQM to International standard and Excellence Models
While adoption of TQM has received a wide acceptance among leading firms, Ritchie and Dale (2000)
state that TQM has received a negative response over the past few years. This fact is mostly due to a
misconception of the method as a whole. Among managers it is perceived to be too technical or control
oriented. Therefore, only certain aspects of TQM are adopted producing a diluted version of TQM.
Zhao et al. (2004) explains that it is not necessary for the organisation to do well in all areas of quality
management in order to achieve a good performance. Edvardsson and Gustafsson (1999) call this shift
from Management of Quality to Quality of Management also known as Business Excellence.
Study of the companies show that business excellence is perceived as a measure of “how good we are”
and the system by which business moves forward. In their study of business excellence model Ritchie
and Dale (2000) also find that it was seen as delivering the needs of stakeholders and internal customers,
and at the same time meeting set goals and objectives in the long-term. Business excellence was consid-
ered to deal with the key strategic issues of developing quality framework in order to provide excellent
customer service.
Below, the three widely used models – ISO, EFQM and MBNQA - of Business Excellence will be
shown and discussed.
2.6.1 International Organization for Standardization (ISO)
According to Geraedts et al. (2001) ISO 9000 standard has three main characteristics:
1. The principle focus is on the process of service delivery itself, not on the outcome.
2. Working processes and resources are identified and regularly measured, using performance
indicators.
3. “The system has to be verifiable by means of documents such as a quality handbook, proce-
dures describing the most important working processes, standard operating proce-
dures/instructions, and the measurement of performance indicators” (Geraedts et al., 2001,
p. 217). These documents have to be updated formalized and distributed according to the
standard documentation. Employees are constantly informed about the improved proce-
dure.
27

The benefits of ISO 9000 system are associated with more transparent processes within the organiza-
tion that enable controlled changes. The processes are audited by both internal and external auditors. It
also creates certain procedures and protocols that are continuously maintained. It is also quite suitable
for continuous improvement actions by means of performance indicators (Geraedts et al., 2001).
On the other hand, the biggest disadvantage of this system is that performance indicators, used in ISO
9000, can be quite controversial tool for monitoring quality (Geraedts et al., 2001).
Concepts of ISO model
Below, the main concepts of ISO will be presented referring to the Quality Management Principles
(2001) based on the ISO 9000 standards.
Customer focus is the first concept of ISO model, which claims that organizations depend on their
customers and thus they should understand customer needs. If they do, they can benefit from increased
revenue and market share, effectiveness in use of resources to enhancing customer satisfaction and in-
creased customer loyalty.
The second concept is leadership which aims to establish unity of purpose and direction of the organi-
zation. With the help of this concept people will people will understand and be motivated towards the
organization's goals and objectives. The activities are evaluated, aligned and implemented in a unified
way and miscommunication between levels of an organization will be minimized.
The third concept is involvement of people, as people are the essence of and organization and their
full involvement enables to be used for the organization’s benefit. With introduction of this concept the
organization gains motivated, committed, responsible and involved people, whose innovation and crea-
tivity is furthering the organization’s objectives.
The fourth concept is process approach, which claims that a desired result is achieved more efficiently
when activities and related resources are managed as a process. It brings lower costs and shorter cycle
times through effective use of resources, improved consistent results and focused and prioritized im-
provement opportunities.
28

The fifth concept is system approach to management which identifies, understands and manages in-
terrelated processes as a system contributes to the organization's effectiveness and efficiency in achiev-
ing its objectives. The key benefits of it are integration and alignment of the processes that will best
achieve the desired results, ability to focus effort on the key processes and providing confidence to in-
terested parties as to the consistency, effectiveness and efficiency of the organization.
The concept of continual improvement of the organization's overall performance should be a perma-
nent objective of the organization. The main positive sides of it are performance advantage through im-
proved organizational capabilities, alignment of improvement activities at all levels to an organization's
strategic intent and flexibility to react quickly to opportunities.
The concept of factual approach to decision making is based on the analysis of data and informa-
tion. In applying this concept several chances are showing up such as informed decisions, an increased
ability to demonstrate the effectiveness of past decisions through reference to factual records and in-
creased ability to review, challenge and change opinions and decisions.
The last concept is mutually beneficial supplier relationships which enhances the ability of both an
organization and its suppliers to create value. The benefits of it are the following: increased ability to
create value for parties, flexibility and speed of joint responses to changing market or customer needs
and expectations and optimization of costs and resources.
2.6.2 Malcolm Baldrige National Quality Award (MBNQA)
The Baldrige Award is presented annually by the President of the United States to organizations that
demonstrate quality and performance excellence. The MBNQA was designed to raise awareness of qual-
ity management and recognize U.S. companies that have implemented successful quality-management
systems. Three awards are given annually in each of five categories: manufacturing, service company,
small business, education, healthcare.
Zhao et al. (2004) in his theoretical review states that MBNQA is used in a number of TQM studies as a
mean to measure quality practices and performance. The validity of the MBNQA model has been tested
by many scholars.
29

The criteria of the MBNQA demonstrates the branch of TQM practices embodied in six criteria: lead-
ership, strategy and planning, customer focus, information and analysis, people management, and proc-
ess management (Prajogo and Sohal, 2004). The detailed description of each category can be found in
Samson and Terziovski (1999).
Juran in his last international appearance in 1996 in India summarised the best practices of Baldrige
Award and emphasised the great work by CEO’s: “the CEO personally took charge, they provided a lot
of training at senior levels and throughout the organization, they used accelerated continuous improve-
ment, they opened up the business plan to include quality goals, they set up measures to assess progress
toward those goals, they made provision for participation by the workforce, and they provided a great
deal of recognition”(Juran, 1996).
Concepts of Baldrige model
Baldrige 7 criteria for performance excellence - leadership, strategic planning, customer and market fo-
cus, measurement, analysis and knowledge management, human resource focus, process management
and organizational performance result (Samson and Terziovski, 1999, p. 396)- will be further discussed :
• Leadership - primary attention is on how the senior leaders set and imply clear values and
potential for high performance that attend to the needs of all stakeholders. It also includes or-
ganisation’s duty to the public and its practices of good citizenship.
• Strategic planning - how the organization establishes and implement strategic directions that
address action planning and deployment of plans. This issue stresses customer-driven quality
and operational performance excellence that need to be integrated into the planning process.
• Customer and market focus - examines how organization builds current and emerging cus-
tomer requirements and expectations. This information is then supports marketing, business
development, and planning. In a competitive environment, many factors shape customer pref-
erence and loyalty, hence it necessary to continuously listen and learn and integrate the utilised
learning with business strategy.
• Information and analysis, and knowledge management – This part addresses organisa-
tion’s ability to select, manage, and effectively utilize non-financial and financial information
30

(i.e. knowledge management) in support of its processes, planning and management of per-
formance.
• Human resource focus – the meaning behind this is organization’s capacity to empower and
involve its workforce. This also refers to development and use of their full potential, aligned
with organisation’s objectives.
• Process management - How the organization designs, manages and improves its key proc-
esses. This involves customer-focused design, product and service delivery, support, and sup-
plier and partnering processes among all work units.
• Business/organizational performance results – organization’s performance results and
improvement in terms of customer satisfaction, product and service performance, financial
and marketplace performance, human resource results, supplier and partner results, opera-
tional performance and performance level relative to the competitors.
2.6.3 European Foundation for Quality Management (EFQM)
EFQM – model appeared as a result of fourteen well-known CEO’s of the companies such as Renault,
Fiat, Philips, British Telecom, KLM and Ciba Geigy with a general purpose of stimulating the quality in
European business (Hardjono and van Marrewijk, 2001). This concept is reflected in a structured man-
agement system, and is now being used by tens of thousands of organizations across Europe and be-
yond.
The EFQM Excellence Model is based on a nine broad concepts used to assess organisational excel-
lence progress. It recognizes that there are many ways towards sustainable excellence and strives to
show that excellence is not a theory - it relates to the tangible achievement of an organization in what
and how it does, the results it achieves and the confidence that these results will be sustained in the fu-
ture. Its principle idea is that excellent performance in, customers, people and society is achieved
through leadership driving policy and strategy that drives people, processes, partnerships and resources
(Sandholm, 2000).
Camison (1996) describes EFQM as management system that emphasizes leadership for achieving qual-
ity, policy and strategy formulation for followers, employing and developing the appropriate personnel
31

and resources and guiding the design of all the processes in the organisation towards attaining excel-
lence in results: customer satisfaction, personnel satisfaction, a positive social impact and key economic
results in achieving competitive advantage.
The model is divided into “Enablers” and “Results” to distinguish two categories of criteria where the
former is concerned with how the organization undertakes key activities, the latter concerned with the
results being achieved. The arrows in the model emphasize innovation and learning that help to im-
prove enablers which thus lead to better results. The nine criteria of the model are used for assessing the
progress towards excellence and are given the separate definition (Sandholm, 2000).
At the heart of the EFQM model is the RADAR logic (abbreviation for Results, Approach, Deploy-
ment, Assessment and Review). The Approach, Deployment, Assessment and Review elements are
used when evaluating Enabler criteria and the element of Results is used when assessing Results criteria.
Figure 2.1: The EFQM Excellence Model
Source: Sandholm, 2000, p.42
The criteria of the above presented EFQM model will be further described (EFQM: Introducing Excel-
lence, 2003):
• Leadership - Excellent Leaders develop and facilitate the achievement of the mission and vi-
sion. They develop organisational values and systems required for sustainable success and im-
plement these via their actions and behaviours. During periods of change they retain a con-
32

stancy of purpose. Where required, such leaders are able to change the direction of the organi-
sation and inspire others to follow.
• Policy and Strategy - Excellent Organisations implement their mission and vision by devel-
oping a stakeholder focused strategy that takes account of the market and sector in which it
operates. Policies, plans, objectives, and processes are developed and deployed to deliver the
strategy.
• People - Excellent organisations manage, develop and release the full potential of their people
at an individual, team-based and organisational level. They promote fairness and equality and
involve and empower their people. They care for, communicate, reward and recognise, in a
way that motivates staff and builds commitment to using their skills and knowledge for the
benefit of the organisation
• Partnerships and Resources - Excellent organisations plan and manage external partner-
ships, suppliers and internal resources in order to support policy and strategy and the effective
operation of processes. During planning and whilst managing partnerships and resources they
balance the current and future needs of the organisation, the community and the environment.
• Processes - Excellent organisations design, manage and improve processes in order to fully
satisfy, and generate increasing value for, customers and other stakeholders.
• Customer, People, Society and Key Performance Results Excellent organisations com-
prehensively measure and achieve outstanding results with respect to their customers, people
and society, policy and strategy.
Concepts of the EFQM model
The model is linked with certain concepts which are referred to behaviours, activities or initiatives based
on Total Quality Management. These concepts are (EFQM: Introducing Excellence, 2003): results ori-
entation, customer focus, leadership & constancy of purpose, management by processes & facts, people
deployment and involvement, continuous learning, improvement & innovation, partnership develop-
ment and corporate social responsibility – presented and discussed below (EFQM: Introducing Excel-
lence, 2003):
33

The concept of Results Orientation is put in practice by measuring and anticipating the needs and ex-
pectations of company’s present and future stakeholders, monitoring their experiences and perceptions,
and monitoring and reviewing the performance of other organizations.
Customer Focus is creating sustainable customer value by addressing customer’s present and future
needs and expectations.
Excellence is achieved through visionary and inspirational Leadership, linked with Constancy of Pur-
pose. The latter refers to values, ethics, culture and an organizational structure that provides a unique
identity and attractiveness to stakeholders. Leaders on their part constantly drive and inspire everyone
towards excellence.
Base for Management by Processes and Facts consists of a set of interdependent and interrelated
systems, processes and facts. Decisions are based on reliable information derived from current and pos-
sible future performance, process, stakeholder needs.
It is also observed how organization identifies and understands the competencies needed for its present
and future processes. The meaning behind this is maximizing the contribution of People through their
Development and Involvement.
Excellence is challenging therefore it necessitates change through Continuous Learning to create In-
novation and Improvement opportunities.
Partnership Development are based upon clearly identified mutual benefit and are important in order
to deliver enhanced value to the stakeholders through utilised core competencies and. These partner-
ships may include customers, society, suppliers and even competitors.
The concept of Corporate Social Responsibility means deployment of a highly ethical approach by
being transparent and accountable to ones stakeholders for the performance.
2.6.4 Summary of discussions on the models
As was previously stated these are the most commonly used models in their respective regions and
their validity is proved in a number of researches. Since the mid 90’s the topic of quality awards and
34

self-assessment received a considerable attention in literature and among researchers. Irrespective of
company’s area of operations, services or manufacturing the same framework is being used (Sand-
holm, 2000).
In their observation in Medical Centre in Utrecht, The Netherlands, Geraedts (2001) found that after
EFQM is a very good tool after establishing ISO 9000. They state that after using the ISO for two
three years, they reached the limits of the benefits of ISO. The EFQM model was found as a com-
plementary to the ISO. The EFQM model helps to enlarge organisation’s viewpoint on quality man-
agement and to take an objective look at the results it achieves. However the ISO system even being
a solid base for TQM will stay to provide control to all critical processes.
But at least there is an overlap between EFQM and ISO, and this could be easily seen from the Fig-
ure 2.2, where overlap between accreditation, visitation, EFQM and ISO models is shown. Due to
this figure, EFQM is large and has strategic, generic and outcome aspects of quality management.
Taking the example of health care, the group of experts found out these overlaps, as the focus of
ISO is mainly to processes. The experts show their opinion in the fact that high mature organization
can introduce EFQM, although the companies beginners in this process can shape their strategy and
approach through quality management. Thus EFQM is not competing with other models, but gives
broader perspectives to the organizations. (Nabitz and Klazinga, 1999)
Figure 2.2: Overlap of different self-assessment models
EFQM
ISO Accreditation
Visitation
Source: Nabitz and Klazinga, 1999, p. 70
Stashevsky and Elizur (2000) claim that while for some organisations ISO standards may be a good
way to demonstrate that their processes are under control for others attaining ISO is essential to sur-
vive. They also point out that while ISO and TQM both focus on quality ISO lacks the two basic
principles of TQM - employee participation in decision making and continuous improvement.
35

EFQM create awareness about TQM power and demonstrate benefits of its application among man-
agers. During the past decades the growth of TQM confirms many successes across Europe.(Nabitz
and Klazinga, 1999)
The EFQM must answer the following questions for itself, but these should have been considered be-
fore stripping out “quality” and “TQM” from the model’s criteria and replacing them with “excellence”:
In the EFQM guidelines (EFQM: Introducing Excellence, 2003),”excellence” is defined as outstanding
practice in managing the organization and achieving results, all based on a set of eight fundamental con-
cepts. These fundamental concepts of excellence are results orientation, customer focus, leadership and
constancy of purpose, management by processes and facts, people development and involvement, con-
tinuous learning, innovation and improvement, partnership development, and public responsibility.
There is no firm grounding on which the “principles of excellence” (Dale et al., 2000) have been devel-
oped. The basis on which the word “excellence” is used in different works includes some of the follow-
ing challenges for senior management teams (Dale et al., 2000):
• a bias for action;
• getting closer to the customer;
• entrepreneurship and innovation;
• people-based productivity;
• management commitment through hands-on involvement;
• business focus;
• streamlined processes and operations;
• team-based work environment which is driven by shared values
• process-based culture.
Thus, the EFQM model was largely based on the concept of total quality management (TQM) as
both a holistic philosophy and an improvement on other TQM-based models, such as the Malcolm
Baldrige National Quality Award (MBNQA). In 1999, the EFQM revised the model and, among
other things, made a noticeable switch in language from TQM to organizational excellence. Nabitz et
al. (1999) noted that the word “quality” does not appear in either the sub-criteria or the areas to ad-
dress on the revised model.
36

When examining the history of TQM, it was noted that TQM was founded on a historical mechanis-
tic tool and technique basis but gradually developed a social/people/soft skill focus. It was also iden-
tified that the development of these broader areas has been more of an attached rather than being
the root cause of TQM development. This implies a shift in focus from “management of quality” to
“quality of management” (Edvardsson and Gustafsson, 1999). This development in itself was a
problem for many organisations since a major challenge was to broaden ownership of TQM from
the quality department, its historical owners, to everyone within the organization.
A study of TQM change attitudes (Adebanjo, 2001) found that it was often difficult to convince the
likes of sales and production managers (and directors) that they should hold some responsibility for
"total quality management”. Part of the resistance was because they saw issues concerning "quality"
as the sole responsibility of the quality department. Moreover, having the overall agreements on the
core elements of TQM, there was no overall approach. Some of the managers wanted to adopt Dem-
ing or Corsby approaches, or other “gurus”. The large amount of different consultants did not help
the situation as they were presenting their own approaches to TQM.
On the question why TQM was not successful in some cases there are several answers. One of them
is mistakes in communication, training, infrastructure, teams and projects, involvement, problem solv-
ing, and measurement. Another one is management failure of basic perception of TQM. (Adebanjo,
2001)
It is unclear where the drive came to change from quality and TQM excellence. It could be originated
from the European Foundation for Quality Management (EFQM) and certain management consultan-
cies. The EFQM acted in response to the perceived tarnished image of TQM, whilst the consultancies
sought to address the diminishing demand and increasing competition for their services. In response to
the “fallen star” image the EFQM, in its excellence model, has progressively stripped out the references
to TQM and quality. In the 1999 version of the model, the members of the steering group responsible
for the development of the revised model appear to be proud of this. Describing the move from quality
management to organizational excellence, Nabitz et al. (1999) point out that “the world “quality” does
not appear in either the sub-criteria or the areas to address” and “in the new model, the switch form
total quality management to organizational excellence is a fact.” This development has, in turn, been
followed by national quality bodies such as the British “Quality Foundation (BQF)” (Dale et al., 2000).
37

There are also some experience based studies that gave some suggestions concerning these models
(Hardjono and van Marrewijk, 2001). Although there are some differences between these models, they
have a number of common concepts as well (Ritchie and Dale, 2000).
Biazzo and Bernardi (2003) summarized and compared the concepts of EFQM and ISO to Baldrige
(MBNQA) as a reference model. The results are presented in table 2.2.
Table 2.2: Key components of process management: a conceptual framework
MBNQA EFQM ISO 9000
Visionary leadership Principle developed in the
same way
Principle developed in the same way
Customer-driven excellence Principle developed in the
same way
Principle developed in the same way
Organisational and per-
sonal learning
Principle developed in the
same way
Principle developed partially in the same
way (focus on continuous improvement of
company performance
Valuing employees and
partners
Principle developed in the
same way
Principle developed partially in the same
way (focus on both personnel and supplier
involvement)
Agility Principle not developed Principle not developed
Focus on the future Principle not developed Principle not developed
Managing for innovation Principle given less emphasis Principle not developed
Managing by facts Principle developed in a
similar way, but with more
emphasis on processes
Principle developed in a similar way, but
with more emphasis on processes and on
their interconnections
Public responsibility and
citizenship
Principle developed in the
same way
Principle developed in the same way
Source: Biazzo and Bernardi, 2003. p.159
Therefore, from the above table it can be seen that the EFQM and MBNQA are almost the same ex-
cept that EFQM does not have a well developed concepts on agility and future focus. Also it can be
seen that ISO really gives a good basis for further establishing Excellence models as it has a well devel-
oped leadership and customer focus.
38

2.7 General Conclusions of the literature review: presentation of a research model
In this part, the concepts from the previous discussions will be highlighted and integrated into the re-
search model presented below. This research model is helpful in structuring the research and answering
the research question.
The literature review on quality reveals a lot of concepts and needless to say that their accent is differ-
ent. As was previously discussed this is a result of the various context within which these theories have
arisen. However, among these and other models on quality, general ideas could be identified within the
framework of TQM philosophy. The most important concepts will be further presented.
The first concept that is clearly identified by all authors and even different models is the role of leader-
ship in achieving total quality. Leadership, as recognised by all major researchers, is the first and the
most important factor driving organisation towards TQM (Reed et al, 2000 and Kaynak, 2003). Thus, it
was included in our research model (see figure 2.3) as a first and major concept. This includes top and
middle level managers’ commitment and ability to commit others towards excellence. They have to set
and incorporate the value of quality in a strategic direction into the organisational culture and be able to
undergo a number of changes through organisational learning and personal development. This concept
is focused on commitment of top level managers, unity of organisation moving towards single purpose,
ability to manage environment and encourage organizational change, and empowerment and use of
shop-floor ideas for business improvement (Samson and Terziovski, 1999).
The second viable concept of TQM that was observed by most of the authors is a view of TQM as a
strategy on a business level. To make quality more visible and top management commitment viable it
should be incorporated with a strategy (Zhaoa et al., 2004). It will further move organisation towards
meeting stakeholders’ needs and thus producing competitive advantage and sustainability. Therefore,
strategy was chosen as the second concept, subsequent to leadership (see figure 2.3). Specifically the
company’s core values and success factors will be analysed.
Even though the cultural concept, is incorporated into strategy in EFQM model, we have decided to
distinguish it like in MBNQA as a source of organisational policies, believes and norms. Therefore we
included culture as a result of implemented strategy that influences people perception of quality (Irani et
al., 2004).
39

The fourth concept that was viable through out the literature review is the human factor. People are
the most important in the organisation and hence require appropriate care. Even though it was stated by
some of the authors that leaders are responsible for the appropriate environment we distinguish it as a
separate point. The meaning behind this is to observe the created surroundings for the employees to
grow and prosper in the organisation (Soltani et al., 2003). Thus, we decided to include this concept in
our research model after strategy. This can be explained as an extent to which organisation’s managers
emphasise human factor in their strategic objectives. The specific topics for observation are training,
motivation (Lemak and Reed, 2000) and participation in decision making or involvement (Stashevski
and Elizur, 2000).
Having observed the four fundamental concepts in the organisation devoted to quality there is one
more important factor that is vital in every organisation and would complete our research model – sup-
porting system. Even though it was not explicitly mentioned by all authors it has its place in the
EFQM model. In this concept we enclose organisation’s ability to provide the necessary infrastructure,
network and database for successful performance. This also includes organization’s knowledge man-
agement and ability to support its key performance with necessary information (Camison, 1996). This
concept is specifically observed from developed network of partners and suppliers, technical environ-
ment of the workplace and informational system supporting it.
Figure 2.3: Research Model
• Training • Motivation • Involvement
HUMAN RESOURCES
• Quality policy CULTURESTRATEGY
• Network of partners and suppliers
• Technical environment• Informational system
• Company’s priorities
• Success fac-tors
• Managers’ commitment to quality
• Manager as a change agent
• Aim formation • Empowerment • Communication
INFRASTRUCTURE LE
AD
ER
SHIP
Source: Own model
40

The last three concepts of the model – human resources, culture and infrastructure might be similar or
inclusive. To distinguish these concepts we will refer to the sub-questions of the research (see chapter
1.5). The concept of human resources will observe how companies commit their employees in terms of
training, motivation and involvement. The concept of culture will show the perception of quality by
people and its significance. The concept of infrastructure will estimate the environment that supports
employees in accomplishing their daily work. This concept will examine the value of developed network
of partners and suppliers, the efficiency of technical environment and informational systems.
2.7.1 Bridging for further chapters
In the following chapters the research model will be used as a general structure. However, the empirical
data will start with short IT industry description in Belarus and general information about the sample
that participated in the survey. Then, the empirical data will be presented with reference to the structure
outlined in our research model and the data collected from received questionnaires. Thereafter, the
analysis will be presented, where again the research model will form a structure of analysis. The theo-
retical framework outlined in this chapter will be used along with the empirical data to infer on the ten-
dencies from the collected sample. The tendencies will be after summarised in conclusions (chapter 5).
41

3. RESULTS
3.1 Introduction
In the following section the empirical data collected for the analysis will be presented and summarised.
The research model2 (see figure 2.3, p.46) was used as a basis for developing the questionnaire (see ap-
pendix 1) and thus collecting the primary data. Therefore, the link between the questions asked in the
questionnaire and the different concepts of the research model have to be discussed. Also, the ques-
tionnaire included the general information about the companies respondents work in.
First the short industry overview will be presented to familiarise the reader with the issue. Then, the
general information on respondent’s companies will be first presented. Thereafter, we will follow the
structure of the concepts outlined in the research model, starting from leadership followed by strategy,
human resources and culture, and finalising with infrastructure. The arguments for asking the specific
questions will be first presented, and then the information collected will be reviewed and discussed.
3.2 Industry overview
Belarus has the largest and most established European IT outsourcing companies to the east of Ger-
many. Fifth largest IT outsourcers are 10 years old, which is an age well above average for a private
business in Belarus. Two main players, IBA Group and EPAM Systems encounter 1500 and 1200 em-
ployees (Radkevitch, 2006).
EPAM and IBA are on the first two positions of the "Top 5 to Watch in Central and Eastern Europe"
section of the "Offshore 100," a list of the world's leading IT. A few other local outsourcers such as
Sam-Solutions, Belhard, and ScienceSoft employ 150-400 IT staff. Headquartered in Princeton, New
Jersey, where it has over 50 employees, EPAM is the winner of Technology Fast 500 award in 2002,
2003 and 2004, while its development centre in Minsk became the first CMMI 4 certified company in
Europe (Radkevitch, 2006).
2 Research model was developed as a result of the extensive review of the literature and studies of different theories and models on quality management and TQM the summary of which is presented in the 3rd section.
42

IBA earned its CMMI 4 certification just two weeks after EPAM. In 1999, IBM withdrew as share-
holder of IBA but remained its main customer and strategic partner. Currently, about 600 out of IBA's
850 software engineers in its Minsk office work on projects for IBM. Smaller companies cannot get
CMMI certifications although they can be proud of their high growth. ScienceSoft, founded in 1989,
has increased its revenue by 34 percent and its staff by 27 percent to 180 employees in 2004, according
to its owner Dr. Val Tsourikov (Radkevitch, 2006).
A typical Belarusian IT service provider is a small dedicated team of less than 100 employees. Belarus IT
companies introduce and adapt applications and develop the solutions, in the volume 75.9% and 72.4%,
respectively. 48.3% of all companies provide IT-consulting and engineering. Encoding and testing ser-
vices are provided by 44% of all companies provide, while 37.9% maintain and service technically.
Software licenses are sold by only 13.8% of all companies (Radkevitch, 2006).
The map of the customers for Belarusian IT looks like following: U.S., 55.9%, Central Europe, 47%,
Northern Europe, 29%, and Eastern Europe, 29.5%.Software development, marketing, promotion of
products and opening representative offices are considered by Belarusian programmers as their main
priorities. 79% of the total quantity of the companies count on their own funds while shaping their de-
velopment strategies, and in promotion their products they rely on foreign partners, their own efforts
and least on foreign investors (Radkevitch, 2006).
3.3 General Information
When analysing the tendencies from broadly defined group (IT industry in Belarus), one need to find
out about the companies respondents are working in. This was necessary to spot the inclination from
the wide variety of respondents and companies participating in the research. The general company in-
formation includes the name of the company, its size and presence of any quality programmes/systems.
The personal information included the position in the company and time worked in the company.
3.3.1 Company information
The first question of the questionnaire asked for the name of the company respondent is working in.
This was necessary to ensure the variety of the responses to see the tendencies in more than one or two
companies.
43

The overall number of collected responses comprised wide variety of different companies. From 49 re-
sponses there were 28 different companies. The major number of responses was obtained from “Bel-
soft” company – 9 people or 18%. The second number of responses was from “EPAM” – 2 people or
4%. Both companies are the major players in the IT industry in Belarus. The other companies which did
not constitute more than 1 response equals to 26 people or 54% of all respondents, while 12 (24%)
people preferred not to indicate their company. The results can be seen below in the graph 3.1.
• Name of the company • Number of employees
9; 18%
2; 4%
12; 24%
26; 54%
BelsoftEPAMOtherNot Stated
9; 18%
14; 29%18; 37%
8; 16%
Less than 50from 51 to 250from 251 to 500more than 501
Graph 3.1 Participating respondents by names
of companies
Graph 3.2 Number of employees among responded
companies
The results of the second question on the number of employees working in the company can be seen
above in the graph 3.2. The answers were categorised from small number of employees – less than 50,
to middle number of 51 to 250 and from 251 to 500. The number of people working in a company that
would be higher than 501 people was considered as large company.
• Are there any quality management systems like ISO in your company?
26; 53%21; 43%
2; 4%
YesNoOther
Graph 3.3 Presence of ISO in the company
44

The results indicate that third of all respondents (18 people or 37%) are working in the companies with
less than 251 to 500 people. 29% of all respondents, i.e. 14 people work in companies with 51 to 250
employees, while 8 people (16%) work in big companies with more than 501 employees.
Almost the same number of answers (9 people or 18%) was received from companies with less than 50
employees. Therefore, it can be said the major part, 32 people (around 66%) of the research sample,
constitute middle level companies, i.e. from 51 to 500 employees.
The third question gives information on the percentage of companies among respondents that have any
quality management system, like ISO. The given answers are yes, no, other and uncertain. The results
(showed in graph 3.3) point to the fact that major number of responses were from the companies that
either implemented or not the ISO with 26 people (53%) for yes and 21 person (43%) for no. Another
2 people (4%) either had another system of bug tracking3 or were developing control tools themselves.
Hence, the sample of collected answers is almost equally divided among the companies with and with-
out ISO.
3.3.2 Personal Informaton
The personal information addresses the variety of respondents in terms of their time worked in the
company and the position in the company’s hierarchy. The given answers of the question on position in
the company were: senior/middle management, junior management/supervisory and other (graph 3.4).
The above graph 3.4 illustrates that more than a half of all respondents (27 people or 55%) were junior
managers or supervisors. Senior and middle level managers constituted 27% or 13 respondents, and 9
people or 18% were others. Thus, it can be claimed that more than 40 respondents or 85% of all num-
ber of responses were from managers.
Among the collected responses it was noticed that third of all people (16 respondents or 33%) worked
less than six months (see graph 3.5 above). The second biggest group of 14 people (29%) work between
one and three years, while groups of six months to one year and more than 3 years represent 9 people
(18%) and 10 people (20%) respectively.
3 Bug tracking system is “designed especially to manage problems (software bugs) with computer programs” (Wikipe-dia, 2006).
45

• Position in the company
13; 27%
27; 55%
9; 18%
Senior/Middlemanagement
Juniormanagement/supervisoryOther
Graph 3.4 Participating respondents’ status in
the company
• Time spent in the current company
16; 33%
9; 18%
14; 29%
10; 20%
Less than 6 months
6 months up to 1year1 year up to 3 years
3 years or more
Graph 3.5 Respondents’ time spent in the current
company
3.4 Leadership
In this section the results of the questions under the concept of leadership will be summarised and illus-
trated with the help of graphs. Also, the reason for asking the specific questions will be discussed. The
structure of this part will follow the main sub-concepts outlined in the research model. These are: man-
agers’ commitment to quality, manager as a change agent, aim formation, empowerment and communi-
cation.
3.4.1 Commitment to quality
As was outlined in the literature of all authors, leadership has a significant role in pursuing quality. Be-
cause managers are the major executive force in any organisation, their commitment to quality shoulbe
observed in the first place. The question was structured on a scale of five: completely agree, agree, un-
certain, disagree and completely disagree. The results of the question can be seen in the graph 3.6
• My direct manager is fully committed to achieving high level of quality
10; 20%
28; 58%
9; 18%
2; 4% 0; 0%
Completely agree
Agree
Uncertain
Disagree
Completelydisagree
Graph 3.6 Direct managers’ commitment to quality
46

The graph indicates that in 38 cases (almost 80%) direct managers are strongly committed to the quality.
This can be seen from a summation of answers of strongly agree (10 respondents or 20%) and agree (23
respondents 57,1%). Other 9 respondents (18,4%) of respondents were not sure about this, while only 2
people (4,1%) disagreed with this claim. Therefore, results demonstrate that respondents’ believe in
their managers’ commitment to quality.
3.4.2 Change agent
The main reason for asking this question can be linked to the quality driven continuous improvement.
Continuous improvement presumes self assessment and necessary action to be taken afterwards. There-
fore, managers have to be able to commit an organisation towards needed changes. The question was
structured on a scale of five: completely agree, agree, uncertain, disagree and completely disagree – and
the results are illustrated below (graph 3.7).
• I feel a huge commitment towards the changes in the organisation
4; 8%
24; 49%
19; 39%
2; 4%
0; 0%
Completely agree
Agree
Uncertain
Disagree
Completelydisagree
Graph 3.7 Respondents’ commitment towards the change
The graph 3.7 below points out that more than half of respondents (28 people) either agree (24 respon-
dents or 49%) or completely agree (4 respondents or 8%) with the fact that they are fully committed to
changes. However, it also can be clearly seen that 19 people (39%) are uncertain about their devotion to
quality. The minority of respondents that disagree constituted only 4% or 2 people.
3.4.3 Unity of purpose
This question was important to find out whether the managers formed aims are understood by all em-
ployees and could lead everyone towards one goal. In terms of quality it is a crucial moment as it unifies
all the employees and encourages to a better accomplishment of their work. For this the two questions
47

were asked, first, whether the person knows his aim and the second, whether the person knows how his
work contributes to achievement of this aim.
• I know and clearly understand the aims of my com-
pany
• I know and clearly understand how my work contrib-
utes to achievement of company’s goals
13; 27%
32; 65%
3; 6%
1; 2% 0; 0%Completely agree
Agree
Uncertain
Disagree
Completelydisagree
20; 41%
25; 51%
4; 8%
0; 0%
0; 0% CompletelyagreeAgree
Uncertain
Disagree
Completelydisagree
Graph 3.8 Respondents’ awareness of company
aims
Graph 3.9 Respondents understanding of how
his/her work contributes the company aims.
This will help us to distinguish the deviation between the knowledge of aims and understanding of how
one’s work contributes towards achieving company’s goals. The results were summarised using pie chart
(graph 3.8 and 3.9), given the answers from completely disagree to completely agree on a five.
In the two graphs above 40 respondents (more than 90%) understand and know the aims of their com-
pany and how their work contributes to their achievement. Only about 4 people (8%) are either uncer-
tain or disagree with this claim. In general, respondents tend to increase their attitude when talking
about the contribution of their work in to company’s goals. It can be seen as (13 respondents) 27% of
those that completely agree with awareness of company’s goals increase up to 41% (20 respondents)
when talking about how their work contributes to these aims.
3.4.4 Communication
Information about the changes in the organisation has to reach all the necessary people. This is because
being informed means being a part of the organisation you are working in. Therefore, dissemination of
appropriate amount of information using the right channels plays a significant role within an organisa-
tion.
48

For this reason, the two questions were asked to find out the channels of information flow and to what
extent respondents feel informed. The possible sources of information were: data base, rumours, direct
manager, organisational letters and others. Respondents’ attitude was measured on a scale of five from
completely agree to completely disagree. The results are shown below in graph 3.10 and 3.11
• I find out about the processes, decisions and changes in the
organisation mostly from
• I always feel informed about the events, processes or
changes within the organisation
4; 8%
13; 27%
14; 29%
2; 4%
16; 32%
Data base
Rumors
Direct Manager
OrganisationallettersOthers
5; 10%
28; 57%
13; 27%
3; 6%0; 0%
Completely agree
Agree
Uncertain
Disagree
Completelydisagree
Graph 3.10 Sources of information as indicated by
the respondents
Graph 3.11 Respondents’ attitude of being well
informed
From the above graph 3.10 it can be observed that most of the information about the different events,
processes and changes are coming from rumours (as indicated by 16 people or 32%). However, the
number of answers stating that information is coming from organisational letters and direct managers
differs only by 2-3 people in average with 14 (29%) and 13 (27%) people respectively. The database is
used the least in disseminating the information – 4 respondents or 8%. 2 (4%) answers indicated other
sources of information like from a principal (executive) or system of quality management.
The graph 3.11 indicates that more than a half of respondents (28 or 57%) felt that they are informed
with the happenings within the organisation, while the quarter (13 respondents or 27%) were not certain
about that. Only 5 respondents (10%) completely agreed and the rest 3 (6%) disagreed with this claim.
Thus, it can be said that rumours, direct manager and organisational letters are very important and ef-
fective means of disseminating information, depending on the situation or its relative importance.
49

3.4.5 Empowerment
This is an important part of leadership described in many other literature it is also important in quality
to distinguish it with enforcement. Empowerment positively affects employee commitment to accom-
plish the assigned work and his/her personal development. The question was structured to reflect re-
spondents’ attitudes on a scale of five from complete agreement to complete disagreement with a
statement. The summary of results can be seen below in graph 3.12.
• I have a full capacity to try out my ideas
7; 14%
22; 45%
13; 27%
5; 10%
2; 4% Completely agree
Agree
Uncertain
Disagree
Completelydisagree
Graph 3.12 Level of freedom employees have in accomplishing their work
The above graph 3.12 demonstrates that 29 respondents (almost 60%) agree (22 people or 45%) or
completely agree (7 people or 14%) with the statement that they are fully empowered to try out their
ideas. About a quarter of respondents (13 people or 27%) were uncertain and 14% (7 respondents) ei-
ther disagreed (5 people or 10%) or completely disagreed (2 people or 4%) with the statement.
3.5 Strategy
Commitment of leadership is usually reflected in strategic response and inclusion of quality as a part of
organisational strategy. Thus, it is important to see to what extent the organisation realises importance
and real meaning of quality when developing competitive advantage. The questions asked were divided
into two parts to address the actual priorities of the organisation (or competitive advantage) and the fac-
tors that lead company towards achieving this competitive advantage. Both parts were structured to
measure the attitudes on a scale of five: completely agree, agree, uncertain, disagree and completely dis-
agree.
50

3.5.1 Priorities of the company
The actual priorities of the company explain what company is trying to achieve. The results will indicate
the area of quality that companies are trying to excel in and, thus, will help to find out the tendencies
relative to the collected responses. For this, the question included options that were scaled into five
from completely agree to completely disagree.
The options given were picked up from Irons (1994) research questionnaire developed to build a theo-
retical framework for the service companies. The options are divided into three parts of strategies:
profit-driven (making high profit, keeping costs down) to customer-driven (keeping customers satisfied,
getting repeat business from old customers) to employee driven (getting a high volume of work, having
a keen workforce, providing good job prospects for employees) and other. The results are summarised
below in a bar chart (graph 3.13) and followed with description of every concept separately.
Nearly all respondents agree with the first policy in the graph 3.13 below - making high profits – as 47
respondents (96%) either agree or completely agree with this fact.
The second concept of keeping low costs does not receive much confidence rather than general agree-
ment on the issue (25 respondents or 51%). This is also seen from uncertainty of 11 people (22%) and
disagreement by 4 people (8%) upon the issue.
• What do you think are the actual priorities of the company?
0369
12151821242730
Makinghigh profit
Keepingcosts down
Keepingcustomerssatisfied
Gettingrepeat
businessfrom oldcustomers
Getting ahigh
volume ofwork
Having akeen
workforce
Providinggood jobprospects
foremployees
Completely agreeAgree
Uncertain
DisagreeCompletely disagree
Graph 3.13 Actual priorities of the company among the respondents
51

The third idea of keeping customers satisfied was perceived with the same confidence as the first one,
with overall number of 33 (88%) agreements and complete agreements. Only 6 people (12%) were un-
certain about that.
A very strong agreement among 42 (86%) respondents with 29 (59%) for completely agree was received
for the fourth concept - getting repeat business from old customers. Uncertainty as in a previous case
constituted a small number of respondents – 5 people (10%).
The attitudes upon the fifth concept of getting a high volume of work are divided in two. The 18 agreed
(a 37% of respondents) are followed with almost the same number of uncertainty – 17 people (35%).
Almost the same picture can be seen in the sixth concept – having a keen workforce. Pretty high level
of agreement (22 people or 45%) is followed by third (16 people or 33%) of uncertain answers. Not to
mention the fact that in both cases the disagreement rose to 10% or 5 respondents for each.
Despite the 16 respondnets (33%) that agreed with the last issue - providing good job prospects for
employees – the opinions are mostly related with uncertainty (19 people or 39%) and disagreement (8
people or 16%). The other important factors outlined by the respondents were company expansion,
high quality of order accomplishment and creation of better working environment.
3.5.2 Company’s most important factors
After revealing the priorities of a company, the further, deeper investigation is conducted to depict the
most important factors. This will help to find out the way in which companies are trying to achieve the
previously stated priorities.
The results are summarised below in graph 3.14. The question was structured to measure the attitudes
for the given options that were taken from Irons (1994). The listed options in the questionnaire were:
low prices, achievement of sales targets, technical excellence, high quality service, strong leadership,
highly motivated stuff, stable workforce, work according to rigorous standards, being friendly and ap-
proachable to customers, having a well trained stuff, treating customers as individuals, guarantee of a
good service and other. The attitude measures were structured on a scale of five: very important, impor-
tant, uncertain, not important and not important at all.
52

• What do you think the company sees as the most important factors?
0
3
6
9
12
15
18
21
24
27
30
Our
pric
es a
re lo
w
We
achi
eve
our s
ales
targ
ets
We
are
tech
nica
lly e
xcel
lent
We
prov
ide
a hi
gh q
ualit
y se
rvic
e
We
have
a st
rong
lead
ersh
ip
Our
staf
f is h
ighl
y m
otiv
ated
Our
wor
kfor
ce is
stab
le
We
wor
k to
rigo
rous
stan
dard
s
We
are
frien
dly
and
appr
oach
able
Our
staf
f is v
ery
wel
l tra
ined
We
valu
e ou
r cus
tom
ers a
s ind
ivid
uals
We
guar
ante
e a
good
serv
ice
Very important
Important
Uncertain
Not important
Not important at all
Graph 3.14 Companies’ most important factors
The above graph 3.14 illustrates the importance of different factors in the companies as indicated by the
respondents. The first concept of low pricing indicates relevant disagreement as the level of uncertainty
and disagreement reach the highest point of 18 (37%) and 17 (35%) people respectively. This is fol-
lowed by the quarter (12 people or 25%) of answers that agreed with the issue.
The much higher agreement can be seen in the second factor – achievement of sales targets, where the
number of cases agreed reaches 37 answers (76%) with 16 people (43%) that completely agreed. The
uncertainty reaches one fifth – 10 (20%) of all answers.
Technical excellence, the third concept, is similar to previous one with 80% (or 39 answers) of overall
agreement, where 23 (47%) of respondents agreed with the subject. Uncertainty here reaches somewhat
14% or 7 responses.
Provision of a very high quality service, fourth factor, received a very high confidence level of agree-
ment – 43 answers or 88%, where 29 (59%) of answers were agreements. Uncertainty level does not
even reach the tenth of all the responses 4 answers or 8%.
53

The subject of strong leadership also received a high conformity level and embraces 38 responses (78%)
(with 25 answers or 51% of agreement), while the level of uncertainty comprised modest 14% (7 peo-
ple).
More than half of the respondents (26 people or 53%) agreed with the sixth aspect of highly motivated
stuff within the organisation. Although, almost third (14 people or 29%) of the answers were uncertain
about this matter. However, a higher level of resistance was also observed with 6% of disagreement and
4% of complete disagreement.
Almost the same results can be observed in the seventh statement of the question – stable workforce.
There level of agreement reach 26 of all answer (53%) and 12 answers (24%) were uncertain about the
statement.
Rather high level of resistance among the respondents was obtained on the next, eighth issue of work-
ing upon the rigorous standards, where 18 (37%) were uncertain and 12 (24%) disagreed with the issue.
Nevertheless, almost third of answers – 15 respondents (31%) agreed with the statement.
More than half of respondents – 28 respondents (57%) agreed with the statement that their company is
friendly and approachable (the ninth factor). At the same time almost third of respondents (14 people
or 29%) showed uncertainty on this matter.
The tenth aspect shows high but not very strong level of agreement (27 people or 55%) among respon-
dents concerning the highly educated staff and only humble level of uncertainty (8 people or 16%) and
disagreement (4 people or 8%).
The total number of agreements concerning the eleventh aspect of individual customer treatment
reaches 35 answers (72%) with 20 people having agreed on the matter, although the quarter of respon-
dents either were uncertain (10 answers or 20%) or disagreed (4 people or 8%) with this issue.
The last, listed option about good service guarantees, comprise a fairly high level of agreement – 38 an-
swers (78%), where both numbers of completely agreed and agreed respondent were 19 people or 39%.
The results followed by a modest uncertainty level (9 people or 18%).
One of the respondents also indicated image as being a very important factor.
54

3.6 Culture
Culture in this regard covers organisational policies, norms and values, thus it is considered as a part of
the strategy and its influence. However, the question focuses on quality within the organisation, or what
does quality stands for in an organisation. This will help then to identify the meaning of quality among
the responded organisations. The options for the question provided were taken from Irons (1994), and
were scaled to measure attitudes from very important, important to uncertain, not important and not
important at all. The results are summarised (graph 3.15) and discussed below.
In the first set of columns (graph 3.15 from the left), 39 (79%) of respondents stated that maintaining
high quality standards is important in 29 cases (59%) or very important in 10 cases (20%). Although,
somewhat 8 people (16%) hesitated about this and 2 (4%) disagreed.
• How important you think each statement is in describing what quality means in your job?
03
69
1215
182124
2730
Alwaysmaintain
highstandards
Do what isnecessaryto keep
customershappy
Encouragemore
customersto use ourservices
Give ourcustomersconfidencein what we
do
Meet thestandards
of ourindustry
Avoidmaking
mistakes
Monitor allour
procedures
Make surethat I feelcommittedto my work
Very importantImportantUncertainNot importantNot important at all
Graph 3.15 The importance of factors in describing the quality
The results on the second perception of quality as keeping customers satisfied were quite confident with
19 answers (39%) for both important and very important. Almost the same level of uncertainty and dis-
agreement is observed in this situation accounting for 9 (18%) and 2 (4%) answers respectively. Similar
picture can be seen in the next, third set of columns where quality is encouraging more customers to use
55

service – 22 people (45%) stated this to be very important and 19 people (39%) as important. While the
level of uncertainty decreased to 14%, 2% have seen this matter as not important at all.
A very high importance level can be observed in the fourth aspect – give our customers confidence in
what we do, where nearly all respondents (46 which accounts for 94%) stated as being very important
(25 respondents or 51%) or important (21 respondents or 43%). Uncertainty level covers modest 6%
with only 3 respondents. Even though 23 (47%) respondents feel that meeting the “industry standards”
is important and 13 (27%) even think that it is very important, a quarter of respondents (12) were uncer-
tain about this fact.
Avoid making mistakes when talking about quality (sixth factor), was perceived as important by 26 re-
spondents (53%) and very important by 12 (24%). However, 6 respondents (12%) were not sure about
that and 5 respondents (10%) saw it as not important.
Quality as monitoring all the procedures, the sixth aspect, was perceived as important by 22 respondents
(45%) and very important by 13 respondents (27%). This is followed by 11 people (22%) that were not
certain about this claim, while 3 persons (6%) saw it as of low importance.
The last, seventh factor – make sure that I feel committed to my work received a very high level of un-
certainty (20 respondents or 41%) followed by a slightly lower level of 18 people (37%) that marked it
as important. Also, 6 respondents (12%) marked the subject as being not important to their work.
3.7 Human resources
In the section of Human Resources the role and influence of training will be proved, as well as the level
of motivation and involvement among employees. These three points are the most crucial in defining
HR of the company in terms of the presented research model. They can outline the tendencies of weak
and strong sides of the whole HR system in IT companies.
3.7.1 Participation in trainings
Education, knowledge transfer, learning organizations – it is all connected to people, as personnel or
employees. In terms of Quality management, training is one of the parts of continuous improvement,
for which stand many of the theories in TQM. The results which we have got show that only less then a
56

half of respondents (21 people or 43%) took part in trainings during the last year, and more than the
half did not (28 or 57%).
• During the last year I participated in trainings
Graph 3.16 Level of participation in training among the respondents for the past year
3.7.2 Training as an instrument for improving operations
In the next questions we tried to figure out what impact the training has made on the people’s daily op-
erations. In fact, the first question supporting the idea of continues improvement has been asked. The
answers were scaled in to 5. 3 respondents or 14% completely agreed on the statement, that they be-
came able to do their job better, 14 people or 67% relatively agreed, while 4 people or 19% stayed un-
certain about this. Among all the results there were no negative answers to this question.
• I was able to do my job better
Graph 3.17 Respondents’ ability to do job better after training
21 (43%)
28 (57%)
yes no
3 (14%)
14 (67%)
4 (19%) 0% 0% CompleteagreementRelative agreement
Uncertain
RelativedisagreementCompletedisagreement
57

3.7.3 Training as a source of frustration
The masses of information, new ways of doing things can confuse and frustrate employees. In order to
measure the level of frustration, we asked this question. The results are striking: 2 people or about 10 %
relatively agrees with this question, 6 people or 29 % are uncertain and 11 or 51 % relatively disagree
and 2 or 10% completely disagree.
• I felt more frustrated by our work procedures
Graph 3.18 Respondents’ feeling of frustration with the work procedures after training
3.7.4 Training as an instrument for transfer of company values
For any company it is important how an employee understands the goals, objectives and values of the
company. In some way training can serve as a method of informing people about the internal culture of
the company and involving into achieving goals and cherishing values. Our interest in this question was
to measure how the firms in IT sector manage to do this transfer and if they succeed or fail. The results
show that more then a half 11 people out of 21 or 52% relatively agree that they understood more
clearly the goals of the company, 7 people or 33% remain uncertain, while 2 people or 10% and 1 per-
son or 5 % accordingly relatively and completely disagree.
0%2 (10%) 2 (10%)
6 (29%)
11 (51%)
Complete agreement
Relative agreement
Uncertain
Relative disagreement
Complete disagreement
58

• I understood more clearly what we are trying to achieve as a business
Graph 3.19 Respondents’ higher level of awareness about what is attempted to achieve after training
3.7.5 Training as an enabler for meeting customer needs
Customer orientation is one of the main points in Quality Management, in every model of Business Ex-
cellence it has been mentioned that customer is the central part of any model. By this question we out-
line how effective the trainings are to satisfy the customer as the user of the service product. 3 or 14%
of respondents completely agree and more than half of respondents or 12 people (58%) relatively
agreed on the issue, that it has been effective, 28% or 6 people remain uncertain and there is no dis-
agreement at all.
• I felt more able to meet the needs of our customer
Graph 3.20 Respondents’ ability to better meet customer needs after training
0%
11 (52%) 7 (33%)
2 (10%) 1 (5%)
CompleteagreementRelative agreement
Uncertain
Rela-tive disagreementCompletedisagreement
3 (14%)
12 (58%)
6 (28%) 0% 0% Complete
agreementRelative agreement
Uncertain
RelativedisagreementCompletedisagreement
59

3.7.6 Motivation
Motivation is the moving part of any human activity, that’s why we thought that it is necessary to see
the level of motivation among our respondents. On the question about general motivation we have got
1 person or 2 % of complete agreement, 28 people or 57% of relative agreement, 14 people or 29% un-
certain, 5 people or 10% relative disagreement and 1 person or 2% of complete disagreement.
• I feel highly motivated to do my job properly
Graph 3.21 Respondents’ higher level of motivation
In this section we also asked the question about social benefits which are considered to be the part of
motivation. The current situation in Belarus is that social benefits have just started to be introduced as
an additional benefit and not by the high level of uncertain responses 23 out of 49 people, or 47%, we
can see that not so many companies use it as an instrument of motivation. 2 respondents or 4% are
completely satisfied with their social benefits, 14 people or 29 % relatively while 6 (12%) and 4 (8%) are
not satisfied relatively and completely.
One respondent outlined that training increased the efficiency of work by several times and the results
were higher the costs of training.
1 (2%)
28 (57%) 14 (29%)
5 (10%) 1 (2%)
CompleteagreementRelative agreement
Uncertain
RelativedisagreementCompletedisagreement
60

• The social benefits, which company provides me, fully satisfy me
Graph 3.22 Respondents’ attitude towards satisfaction with the social benefits
3.7.7 Involvement
For the term involvement we would like to use the term support as a synonym. We wanted to try out
how the practice of physiological support is spread out in IT companies in Belarus. For any employee in
order to feel comfortable and safe at working place colleagues’ or managers’ understanding of personal
problems is needed. 6 (12%) of respondent’s show that they completely agree that their personal prob-
lems are taken into consideration, 23 or 47% relatively agree, 12 people or 25% are uncertain and 6
(12%) and 2 (4%) are relatively or completely disagree accordingly.
• Any personal problems at work are always taken into consideration
Graph 3.23 Respondents’ attitude towards company’s concern with personal problems in the work
2 (4%)
14 (29%)
23 (47%)
6 (12%)
4 (8%)CompleteagreementRelative agreement
Uncertain
RelativedisagreementCompletedisagreement
6 (12%)
23 (47%)
12 (25%)
6 (12%) 2 (4%)
CompleteagreementRelative agreement
Uncertain
RelativedisagreementCompletedisagreement
61

While analyzing the next question a bit different results are shown, though the questions are quite close
to each other. 14 respondents or 26% complete agree on fact, that there is always someone to discuss
any problems which a person has with his/her work, 25 people or 51% relatively agree, 8 or 16% are
uncertain and only 2 people or 4% relatively disagree.
• There is always someone to discuss any problems I have with my work
Graph 3.24 Respondents’ attitude towards company’s concern with problems in work
3.8 Infrastructure
In this part infrastructure will be analyzed as a technically supported system with its own network of
partners and suppliers and information technologies. Infrastructure is the most material part of our
model, which can be at least estimated by outsiders, but in these questions we measure the attitudes of
the respondents to these three components.
3.8.1 Network of partners and suppliers
Partners and suppliers as company’s stakeholders are even not less important than the customers. By
making partnerships and establishing good relationship with suppliers the company obtains not only
financial, but also “reputation” benefits. Having serious partner like Microsoft a company can
strengthen its positions on the market and by that increase its market share.
14 (29%)
25 (51%)
8 (16%)
2 (4%)
0% CompleteagreementRelative agreement
Uncertain
RelativedisagreementCompletedisagreement
62

6 or 12% of respondents completely agree on the fact that they are satisfied with their network of part-
ners and suppliers, 26 people or 53% relatively agree, 13 people or 27% are uncertain, while 4 people or
8% relatively disagree.
• I feel that our network of partners and suppliers fully contribute to the achievement of our organization and ac-
complishment of my work.
4 (8%) 0%Complete
Graph 3.25 Respondents’ attitude to efficiency of network of partners and suppliers in achieving com-
pany goals
3.8.2 Technical environment
The expectations and requirements to the working place of the employee in IT industry are high: pro-
gramming or web-design is made on the newest computers with using the highest equipment. So in this
question we try to find out the attitude of the employees to their working places and working instru-
ments.
19 respondents or 39% of them are completely satisfied with their working environment, 22 of them or
45 % are relatively satisfied and 2 people or 4% are uncertain and 6 of them or 12% are relatively unsat-
isfied.
6 (12%)agreement
Relative agreement13 (27%)
Uncertain
Relativedisagreement
26 (53%) Completedisagreement
63
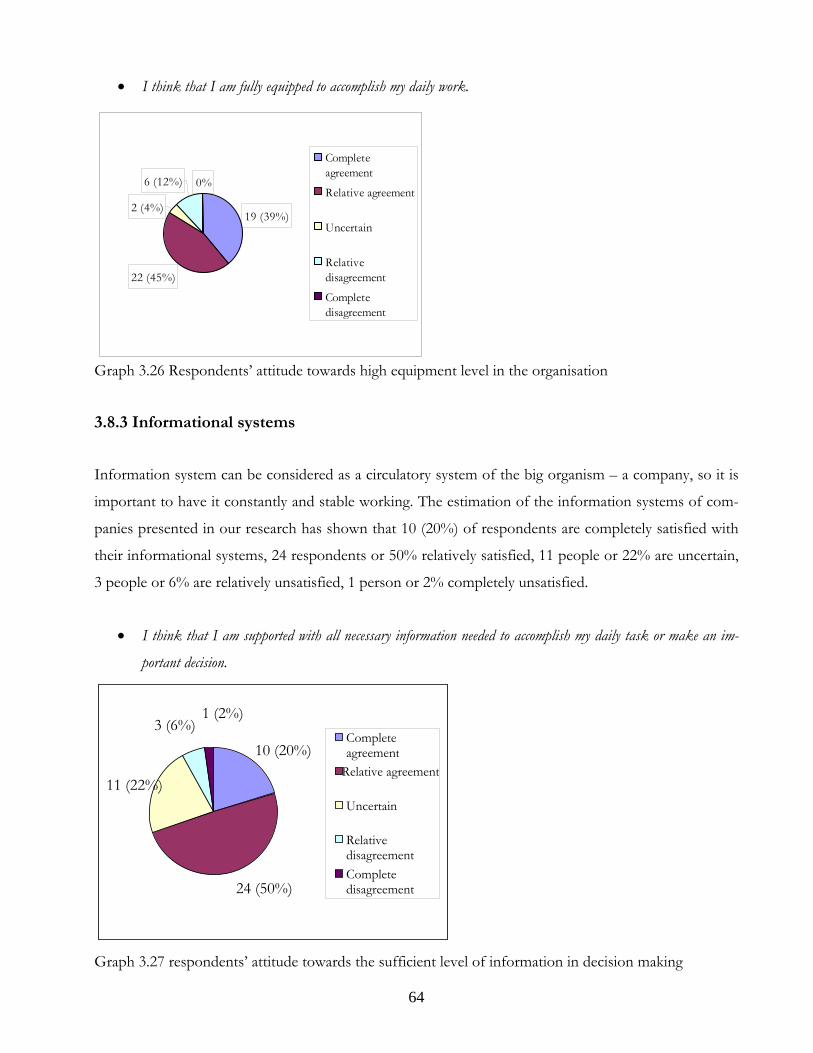
• I think that I am fully equipped to accomplish my daily work.
0%6 (12%)
2 (4%)
22 (45%)
19 (39%)
Completeagreement
Relative agreement
Uncertain
Relativedisagreement
Completedisagreement
Graph 3.26 Respondents’ attitude towards high equipment level in the organisation
3.8.3 Informational systems
Information system can be considered as a circulatory system of the big organism – a company, so it is
important to have it constantly and stable working. The estimation of the information systems of com-
panies presented in our research has shown that 10 (20%) of respondents are completely satisfied with
their informational systems, 24 respondents or 50% relatively satisfied, 11 people or 22% are uncertain,
3 people or 6% are relatively unsatisfied, 1 person or 2% completely unsatisfied.
• I think that I am supported with all necessary information needed to accomplish my daily task or make an im-
portant decision.
1 (2%)3 (6%)
Complete
Graph 3.27 respondents’ attitude towards the sufficient level of information in decision making
10 (20%) agreementRelative agreement
11 (22%)Uncertain
RelativedisagreementComplete
24 (50%) disagreement
64

4. ANALYSIS
4.1 Introduction
In this part of thesis, the analysis will be presented. We strived at creating discussions, where possible,
between the findings (4th chapter) and theoretical framework outlined in the 3rd chapter. The findings
will be obtained from correlations of different conceptual questions (on leadership, strategy, HR, culture
and infrastructure) with the ones of general information. Thus, the structure of the analysis will follow
the research model concepts: leadership, strategy, HR, culture and infrastructure. This will be preceded
by revealing some tendencies in general information. The discussions will be then summarised sepa-
rately, after every concept, to form the basis for the subsequent section - conclusions.
4.2 General information
In this section the general tendencies will be highlighted by correlating the general company informa-
tion, i.e. number of employees and the existence of ISO in the company. This will show whether im-
plementation of ISO depends on the size of the company.
5
10 9
2
4
49
4
0
3
6
9
12
15
18
Less than 50 from 51 to250
from 251 to500
more than501
Without ISO
With ISO
Graph 4.1 Percentage of ISO implemented companies and number of employees in the company
As can be seen from the graph 4.1 above, the ratio of companies with implemented ISO is not lower
than 50% in all cases (except where the sample is only 6). Therefore, it can be inferred that the major
sample of companies in this research have implemented ISO. What is more, presence of ISO in the
company does not have any influence in our collected sample as there is no correlation between the size
of the company and the level of ISO implementation.
65

4.2 Leadership
Here, all the sub-concepts of leadership (managers’ commitment to quality, change agent, unity of pur-
pose, communication and empowerment) will be analysed using the empirical information. Also, the
different correlations will be presented and then discussed along with theoretical framework, where
possible. Mostly presence of ISO in the company will be used for correlation to show the difference of
factors in the company with and without management system.
4.2.1 Commitment to quality
The results indicate that major part of respondents generally agreed on their managers being committed
to quality. All the major literature on TQM (especially TQM gurus), ISO and Business Excellence
(EFQM and Baldridge) described commitment of managers - the primary indicator of quality driven
organisation (Chin et al., 2002).
However, there were also 11 of the respondents (18% and 4%, see graph 4.6) who were uncertain or
even disagreed with this matter. Therefore, we found it interesting to observe the relation of ISO and
level of commitment among the managers by correlating the graphs 3.6 and 3.3.
6 4
17
10
3
5
2
0
0
0
0369
121518212427
With ISO Without
Completely disagree
Disagree
Uncertain
Agree
Completely agree
Graph 4.2 Relation of managers’ commitment to ISO presence in the company
In the graph 4.2 one can see the relation between management commitment to quality and presence of
ISO in the company. The results show pretty strong relation between commitment of managers to qual-
ity to ISO in organisation as only 12% of respondents are uncertain against 24% uncertain and 10% dis-
66

agreement in the companies without ISO. Thus, we can infer and support the claim from the literature
that ISO positively affects managers’ commitment to quality.
4.2.2 Change agent
Being committed to quality is not enough. Ability to commit every one to quality is the critical leader-
ship factor. This primarily means commit everyone to the necessary changes and improvements as out-
lined by the TQM literature (Hardjono and Marrewijk, 2001).
The primary results indicate that half of the respondents agree with this, although 38% are hesitant
about this fact. Hence, we will try to distinguish this by correlating the two alternatives of commitment
to change with existence of ISO in a firm and managers’ commitment to quality (see graph 4.3 and 4.4).
2 2
1310
10
8
1
1
0
0
0
5
10
15
20
25
30
Completely disagree
Disagree
Uncertain
Agree
Completely agree
1 1
5
14
43
13
2
0 0
22
0
2
4
6
8
10
12
14
16
Completelyagree
Agree Uncertain
CompletelyagreeAgree
Uncertain
Disagree
Graph 4.3 Relation between presence of ISO and
level of commitment to change
Graph 4.4 Relation between commitment to
change and managers’ commitment to quality
Generally, from the above graph 4.3 we can not conclude on any tendencies as the results are almost
equal. Therefore, we will try to find the correlation between the commitment of managers to quality and
employees eagerness to change (see graph 4.4 above).
As can be seen in the linear graph 4.4 the level of employee enthusiasm to change (axis X) decreases as
managers’ commitment to quality decreases (lines on the graph). In other words, this can support the
claim of Reed et al. (2000) - managers that are more committed to quality have employees who are more
committed to change.
67

Thus, it can be said that implementation of ISO will not make people more ready to change; rather
managers’ commitment to quality is the one to show and explain the significance of change. This can be
found in Deming’s 14 principles, as a sequence goes: institute leadership and then drive out fear (for
change).
4.2.3 Unity of purpose
As explained by Jun et al. (2005) to be able to commit everyone to change and improvement of quality
managers have to unite the organisation and direct everything towards one goal. This goal has to reach
the whole organisation, be acknowledged and clearly understood by every one.
The results of the questionnaire show reverse logic as the amount of people who fully understand com-
pany’s goals (27%) is smaller than the percentage of people who fully understand how their work con-
tributes to their achievement – 41% (see graph 4.8 and 4.9. This could be the fact of human exaggera-
tion of their own work beyond company’s goals, which basically means that this difference (some 7
people or 14%) either do not understand the company aims or have a wrong perception of it.
We will also try to distinguish the companies with and without ISO to find out where the 14% discrep-
ancy belongs to (see graph 4.5).
0
2
4
6
8
10
12
14
16
18
With ISO(Knowledge)
With ISO(Contribution)
Without(Knowledge)
Without(Contribution)
Completely agree
Agree
Uncertain
Disagree
Graph 4.5 Relation between ISO presence and questions on unity of purpose
The tendency in the graph above does not reveal the source of moving 14% found previously. Even
though in both situations it is obvious that people tend to agree more with their understanding on how
their work contributes to company’s goals. Thus, it can be stated that people are keen to overstress the
importance of their work irrelevant of ISO existence in the company.
68
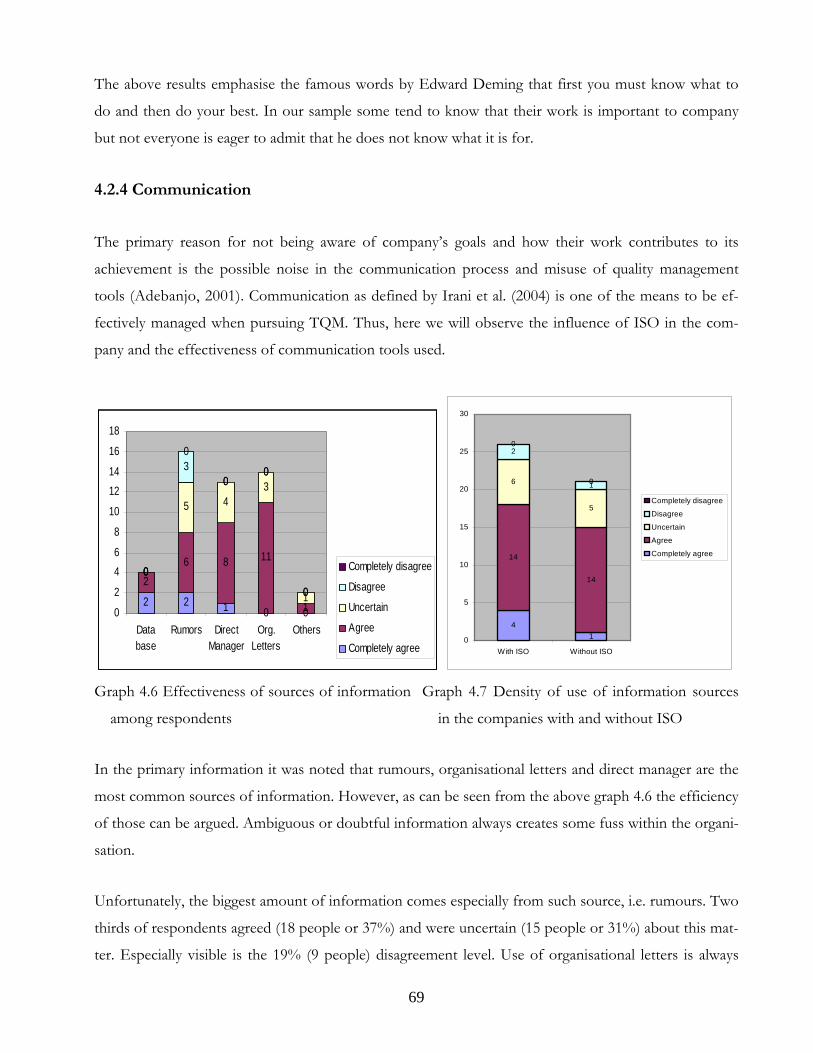
The above results emphasise the famous words by Edward Deming that first you must know what to
do and then do your best. In our sample some tend to know that their work is important to company
but not everyone is eager to admit that he does not know what it is for.
4.2.4 Communication
The primary reason for not being aware of company’s goals and how their work contributes to its
achievement is the possible noise in the communication process and misuse of quality management
tools (Adebanjo, 2001). Communication as defined by Irani et al. (2004) is one of the means to be ef-
fectively managed when pursuing TQM. Thus, here we will observe the influence of ISO in the com-
pany and the effectiveness of communication tools used.
2 2 1 0 0
26 8 11
1
0
5 43
1
0
30
0
0
0
0
00
0
0
2
46
8
10
1214
16
18
Database
Rumors DirectManager
Org.Letters
Others
Completely disagree
Disagree
Uncertain
Agree
Completely agree
41
14
14
6
5
2
1
0
0
0
5
10
15
20
25
30
With ISO Without ISO
Completely disagree
Disagree
Uncertain
Agree
Completely agree
Graph 4.6 Effectiveness of sources of information
among respondents
Graph 4.7 Density of use of information sources
in the companies with and without ISO
In the primary information it was noted that rumours, organisational letters and direct manager are the
most common sources of information. However, as can be seen from the above graph 4.6 the efficiency
of those can be argued. Ambiguous or doubtful information always creates some fuss within the organi-
sation.
Unfortunately, the biggest amount of information comes especially from such source, i.e. rumours. Two
thirds of respondents agreed (18 people or 37%) and were uncertain (15 people or 31%) about this mat-
ter. Especially visible is the 19% (9 people) disagreement level. Use of organisational letters is always
69

convenient just for informing employees on general matters. Thus, organisational letters are generally
agreed to be efficient (39 answers or 79%), while managers’ role in disseminating information is not
very strong. Quite surprising is the direct managers’ role, where respondents generally agreed (30 re-
spondents or 61%) about its efficiency, but third (15 people 31%) were not certain.
In the graph 4.7 the relation of use of different information sources in the companies with and without
ISO is observed. The role of rumours increases to almost half in organisations without ISO, while in the
organisations with ISO this constitutes only 11 people (23%). This is mostly due to the data bases used
in ISO companies and increased role of managers as outlined in the fundamental concepts of ISO.
Thus, it can be said that the flow of information is mostly subject of data bases and the direct manager.
The absence of ISO in the organisation leads to prevailing role of rumours. This is closely related to the
effect of ISO as it focuses on factual approach on decision making and involvement of employees. In
TQM this concept is defined as fact-based management (Chin et al., 2002). Nevertheless, the efficiency
of managers in disseminating information is also not very certain and could be improved. Organisa-
tional letters are generally sufficient to inform employees.
4.2.5 Empowerment
As was discussed before one of the important roles of leadership is empowerment (Ugboro and Obeng,
2000).
4 3
129
7
6
3
2
0
1
0
5
10
15
20
25
30
With ISO Without ISO
Completely disagreeDisagreeUncertainAgreeCompletely agree
Graph 4.8 Relation between level of empowerment and presence of ISO in the company
As can be seen from the graph 4.8 above, the relation there is no dependence between the level of em-
powerment and ISO system in the company. This is due to the relevantly the same percentage of atti-
tudes in both sides of the graph.
70

Therefore, it can be inferred that the ISO system, as a system of management control over the proc-
esses, does not encourage managers for bigger empowerment. This goes apart with Chin et al., 2002
claim, but does not contradicts it as empowerment is not the result of ISO presence in the company.
According to Ugboro and Obeng (2000) empowerment in connection with improved job satisfaction
and leadership commitment creates a positive effect on quality. As was previously found, management
commitment is influenced by ISO, but is not the source for employee enthusiasm for change. The job
satisfaction or motivation level will be observed in subsequent chapters.
4.3 Strategy
In this part the strategic priorities and the most important factors will be analysed. First, the general
tendencies will be highlighted and then the correlation with ISO existence in the company will be ob-
served. Thus, we will conclude on the tendencies of strategic focus of companies in the observed sam-
ple.
4.3.1 Priorities in the company
The most important priorities among the responses (that completely agree) are getting repeat business
from old customers, keeping customers satisfied and making high profits. These values constitute 29
(59%), 27 (54%) and 21 (43%) respectively (see graph 3.13). This goes along with the general concept of
TQM, i.e. the customer satisfaction as a primary focus (Cua et al., 2001 and Geraedts et al., 2001). Get-
ting repeat business is the part that is especially important for service companies and clearly emphasised
by Grönroos (1991). According to the latter only customer satisfaction and getting repeat business from
old customers will ensure making high profits and company sustainability.
Highly recognised, though with less confidence, were keeping costs down (25 answers or 51%), keeping
customers satisfied and having a keen workforce having with an equal amount of 22 answers (45%)
each. A bit less – (20 people) 41% considered making high profits as important. These results justify the
major idea by Edward Crosby that quality is free, hence leads to lower costs. However the workforce is
still considered as relevantly important which does not support the claim of human resources in TQM
as one of the most important factors, but not so emphasised in ISO (Biazzo and Bernardi, 2003).
Relatively high uncertainty, around third of all respondents, expressed in providing a good job prospects
for employees (19 respondents or 39%) getting a high volume of work (17 respondents or 35%) and
71

having a keen workforce (16 answers or 33%). In the same order, these values hold the biggest percent-
age of negative answers of 8 (16%) and 5 (10%) each for latter. Also, noticeable relevantly high number
of responses of disagreement for keeping costs down – 4 people or (8%).
This can be explained due to the fact that ISO is focused more on the processes, performance and in-
volvement of workforce, while training is to bigger extent considered in TQM and Business Excellence
Models of MBNQA and EFQM.
4.3.2 Important factors in a company
Here, different factors reveal some interesting tendencies among the collected sample that are further
analysed.
Even though there is no really strong agreement on the specific issue at the first sight as the biggest per-
centage of complete agreement covered a third of all respondents. These are guarantee of a good ser-
vice, technical excellence, achieving sales targets and individual treatment of customers accounting for
(19) 39%, (16) 33%, (16) 33% and (15) 31% respondents respectively (see graph 3.14).
All of these factors can be explained by referring to TQM concepts and models and come out mostly as
a result of quality oriented company. Chin et. al. (2002) in this concern defines TQM as a strategic link
between profitability, business objectives and improvement efforts. Quality as a good service guarantee,
emphasised by Perdomo-Ortiz et al. (2005), goes beyond quality of the product, i.e. as a multidimen-
sional construct of a company. Needless to say, customer focus and special treatment is emphasised in
service sector as a primary objective and thus has to be considered Geraedts et al. (2001). Technical ex-
cellence can be explained as the result of the effort accomplished after numerous improvement endeav-
ours. The achievement of these will lead to the results that were marked by respondents as achieving
target sales.
Guarantee of a good service has to be verified, although the results on the graph provide more modest
results. This according to Grönroos (1991) creates a gap between what is being communicated and what
is being accomplished, thus leading to customer low satisfaction. Therefore, the service guarantees
should be moderated to match the level of service provided.
72

Quite high level of uncertainty and disagreement can be observed in such factors as low prices and
working upon the rigorous standards. Working upon rigorous standards is contrary to the ISO and
TQM literature where the standards are the result of continuous improvement and development
through involvement of employees. Thus, the standards evolve as a result of organisational synergy
Chong and Rundus (2004).
Thus it can be said, that the important factors emphasised by all of the organisations are mostly concen-
trated on the quality, i.e. customer satisfaction and their individual treatment. The emphasis is also put
on the improvement efforts and results to be achieved. The focus on workforce should be increased if
properly following the TQM guides because it will eventually improve the provision of quality.
4.4 Culture
In the section analysing companies’ culture it will be also referred to the common graph presented in
the empirical evidence part.
In the cultural concept the strong agreement prevail on the issues of customer satisfaction and to a
lesser extent to industry matters, avoiding mistakes and keeping with high standards. The former one
include keeping customers satisfied, giving customers confidence and encouraging customers to use
services can be define the culture among the respondents as customer driven.
However, not least important factors as avoiding making mistakes and maintaining high standards can
explain a low commitment of employees to quality. In other words, respondents’ focus seems to be
blindly directed towards customers. This to some authors is narrowing view of the company and lowers
innovation and creativity. This can be also explained by the fact that the feeling of commitment towards
one work is not very welcomed as can be seen from the results from the graph 3.15 (the very right set
of columns).
To summarise, it seems that the collected sample of respondents is blindly focused on customers, while
other things like meeting industry standards and avoiding mistakes is important to a lesser extent.
Mostly cautious is the fact of low personal commitment towards work. Even in ISO commitment and
involvement of all employees is vital in good process control. This might lead to a narrow mindedness
and low level of learning and innovation. However, this can be partly rejected due to the low impor-
tance of working according rigorous standards.
73

4.5 Human resources
In this part of analysis the empirical data on human resources will be analysed and discussed following
the same structure: training, motivation and involvement.
4.5.1 Training
The interdependence which can be seen between the quantity of the employees who attend trainings
and those who didn’t and installed quality management system in the companies is quite provoking. By
the results 42 % from the “advanced” organizations have been trained, while in others almost 48%. The
tendency which we can see can be explained by different hypotheses: interdependance
1) Organization of the work and internal training on the working place in the “advanced” companies is
more effective and less time consuming than the “out of the company” trainings.
2) As it has been said in the industry overview, the average company in IT industry in Belarus has less
than 100 employees, and as it is appeared by our research, these companies mostly don’t have any
quality management systems. The average worker is a graduate, whose working place is mostly the
first one. As we can see the second largest groups of the trainees are “freshers”, 50% of them have
attended trainings. Larger companies attract more mature employees, whose working experience is
more than 1 year.
Graph 4.9 Participation in trainings Graph 4.10 Average work experience of the trainee
3) The other explanation why small companies train their employees more is that they want to be more
flexible in the changing environment, and one of the factors of flexibility could be educated person-
Yes
11 (42% )
15 (57%)
No
10 (47% )
12 (52% )
Other1 (100%)
yes no
0
26
Less than 6months
8 (50% )
8 (50% )
6 months upto 1 year
2 (22%)
7 (78% )
1 year up to3 years
4(29%)
10 (71%)
3 years or more
7 (70%)
3 (30%)
yes no
0
16
74

nel. While looking on the relationship between training participation and size, we can notice, that ac-
tually quite a lot people attended trainings in the middle-sized companies, which can be called as a
companies on the way to adopt any quality management system.
4) Moreover, looking at the graph 3.14, we can find one more explanation, why there is not so “popu-
lar” to train people, when they are already in the company: people consider themselves and their
colleagues as well trained. Thinking about IT industry, we can come up to the conclusion, that it is
an area the education, as a basis, is quite important, and this basic knowledge people obtain in the
universities. That is why we have a hypothesis, that the trainings are not so wide spread among IT
companies employees.
18
Graph 4.11 Company size and training
In comparing the answers of trained respondents, both from “advanced” and ordinary organizations it
appears that summing up complete and relative agreement there is quite equal quantity of people who
agrees from the both sides. The only moment is that level of uncertainty of “advanced” companies’ em-
ployees is higher than the others. Thus, the answers show the tendency that there is no high interrela-
tion between quality management systems and improving ability after training. From the one point of
view it can be explained that this question was taken into consideration as a personal one, without tak-
ing into account existing systems and environment, which in one way can assist in completing the work,
and in the other – prevent it.
Less then 50
4 (44%)
5 (56%)
from 51 to250
5 (36%)
9 (64%)
from 251 to500
9 (50%)
9 (50% )
more than501
5 (62%)
3 (38%) 0
yes no
75

• I was able to do my job better
01 (25%)
0 0
7 (50%)2 (67%)
Graph 4.12 Ability to improve operations and quality management system
Describing the level of frustration, which employees can feel after completing the training, by the results
of cross-analysis, we can notice that they are quite the same, but in the section of complete disagree-
ment, there are representatives of “advanced” companies. That gives us a hint that probably the organi-
zation of the work decreases frustration, or even removes it. And it is interesting moment that among
the whole 10% marked that they agree with this statement and 33% remained uncertain. The next ques-
tion which could be asked for would be how effective and suitable the education was.
• I felt more frustrated by our work procedures
Graph 4.13 After – training frustration and quality management system
In order to achieve a goal, it is necessary to set up it and understand it. We measured up this in the Bela-
rusian IT companies and tried to find out relations between it and presence of quality management sys-
tems. As a whole, 52 % of respondents showed relative agreement, and only 10 % and 5% accordingly
showed their disagreement. But by division the respondents as representatives of companies with ISO
answered the same as the employees of other companies. The only difference is in the disagreement sec-
1 (33%) 7 (50%)3 (75%)
000 000CompleteRelative
n
CompleteRelativeagreement Uncertaindisagreement disagreementagreeme t
Yes No Other
0
000
1 (50%) 3 (50%)5 (46%)
2 (100%)
1 (50%) 3 (50%) 6 (54) 0 000
UncertainRelative agreement
Relative disagreementComplete disagreementComplete agreement
No Yes Other
76

tion: those, who don’t experience any management systems, relatively disagreed with the statement,
while in complete disagreement there is a representative of “advanced” company.
• I understood more clearly what we are trying to achieve as a business
g quality manage ent system
While discussing the section concerning general understanding of company’s customer, we finally can
• I felt more able to meet the needs of our customer
uality manageme t system
Graph 4.14 Goals under
0
1 (100
0
5 (46%)3 (43%
2 (100%)
0
Complete agree
Relative agreemen
00 0 0 0
)%)
6 (54%) 4 (57%)
0
Uncertaint Relative disagreement
disagreementment Complete
standin and m
find out the difference: the tendency shows that representatives of ISO companies became more cus-
tomers oriented by completing the training. 70% and 60% of complete and relative agreement comes
out from them. That can explain the fact that companies which install the quality management systems
start to pay more attention to the customer and thus increase educational programs in this area.
Graph 4.15 Customer orie
Yes No Other
ntation and q n
2 (67%) 7 (68%)2 (33%)
0 0
1 (33%) 5 (42%)4 (67%)
0 00 0
Complete ag
Relative agreement ive disagreement
disagreement
0 0 0
Uncertain
Relat
reement Complete
Yes No Other
77

4.5.2 Motivation
Our research in this area clearly can be explained by the fact that in case of financial motivation, the
high wages of the western colleagues are seductive for employees. In order to keep the price of the
product as an attractive one, the companies provide social packages and options to organizing sports
activities for their personnel. That is why there is no difference in the answers for general motivation,
while in the question of social benefits we can evidentially see that the companies with ISO pay more
attention to non-financial motivation than those without.
• I feel highly motivated to do my job properly • The social benefits, which company provides me, fully satisfy me
Graph 4.16 General motivation and quality man-
agement
Graph 4.17 Social benefits and quality manage-
ment system
4.5.3 Involvement
Analyzing the involvement, and in particularity, the personal problems at work, we can find out the ten-
dency of the employees confidence of ISO companies, as about 20% completely agreed with the state-
ment, but comparing the overall quantity of those who agreed it appears around 60% in both sides.
Quite surprisingly can be seen 7% of complete disagreement, but if we sum up it, we can get the same
amount of those who don’t agree by roughly 14% from the both sides.
In the area of discussing problems at work the wages are more on the ISO companies side: 42% com-
pletely agree with the statement, and 30% relatively agree, while on the other side there are 9 % of com-
Yes
15 (57%)
8 (31%)
2 (8% )1 (4% )
No 1 (5% )
12 (57% )
5(24%)
3(14%)
Other1 (50% )
1 (50% )
Complete agreement Relative agreementUncertain Relative disagreementComplete disagreement
0
26
Yes1 (4)%
9 (35% )
12(46% )
3 (11% )
1(4% )
No1 (5% )
5 (24% )
9 (43% )
3 (14% )
3 (14% )
Other
1 (100%)
Complete agreement Relative agreement
Uncertain Relative disagreement
Complete disagreement
0
26
78

pletely agree and 75 % of relatively agreement. And again we can see around 7% of relatively disagree-
ing in ISO companies.
Graph 4.18 Any personal problems at work are
always taken into consideration
Graph 4.19 There is always someone to discuss
any problems I have with my work
4.6 Infrastructure
In the field of infrastructure it is obviously seen that the companies who have ISO can enjoy more satis-
faction from the employees’ side. The reasons why there is such a difference are the following:
1) Companies, which introduced ISO or other quality management systems, are seemed to be
more reliable for the partners and suppliers. As an example, many of them demand ISO as one
of the points by assessing which the company can get partnership certificate.
2) Technical environment and informational systems make more possibilities in maintaining stan-
dards of quality, thus it is not surprising that the attention to its issues is so high.
Yes 5 (19% )
10 (39% )
7 (27%
2 (8% ) 2 (8% )
No
13 (62% )
5 (24% ) 3 (14% )
Other 1 (50% ) 1 (50%)
Complete agreement Relative agreement Uncertain Relative disagreement
Complete disagreement
0
26
Yes
11 (42% )
8 (30% )
5 (19%)
2 (8%)
No
2 (10% )
16 (76% )
3 (14% )
Other 1 (50%) 1 (50%)
Complete agreement Relative agreement Uncertain Relative disagreement
Complete disagreement
0
26
79

Graph 4.20 Network of partners Graph 4.21 Technical environment
Graph 4.22 Informational system
Yes
7 (27% )
14 (54%)
4 (15%)
1 (4%)
No 3 (14%)
9 (43% )
6 (29%)
3 (14% )
Other1 (50%)
1 (50%)
Complete agreement Relative agreementUncertain Relative disagreementComplete disagreement
0
26
Yes 5 (19% )
16 (62% )
5 (19% )
No1 (5% )
9 (43% )
7 (33%)
4 (19%)
Other1 (50% )
1 (50%)
Complete agreement Relative agreement
Uncertain Relative disagreement
Complete disagreement
0
26
Yes
13 (50%)
9 (35%)
1 (4% )3 (12% )
No
6 (29%)
12 (57% )
3 (14% )
Other1 (50%)
1 (50%)
Complete agreement Relative agreementUncertain Relative disagreementComplete disagreement
0
26
80

5. CONCLUSIONS
5.1 Introduction
In the following chapter we are going to present our analysis based conclusions. Here, we first present
the findings as regarded to the research question and its main sub-questions to show completeness of
our purposeful research. Then, we will present our deductions divided into theoretical and practical im-
plications. This will be followed by rethinking our research methodology and concluding on what could
have been done better. After, we will finalise our conclusions chapter with suggestions for a further re-
search.
5.2 Answering the research question
How do companies manage quality in a country with a transitional economy?
Particularly, the thesis analysed the following questions in support for the main research question:
What is the significance and role of leadership in achieving quality?
ISO implementation has a positive impact on managers’ commitment to quality.
ISO presence in the company does not affect employee commitment to change, rather, managers’
commitment to quality results in a more change enthusiastic employees.
ISO presence and therefore managers’ commitment does not create more empowerment. The same
empowerment level in companies with and without ISO is based on the financial motivation. This is a
flow of ISO which does not put a lot emphasis on workforce.
Respondents’ are generally tend to overstate the value of their position, due to the fact that they know
how their work contributes to company’s goals but are not similarly sure about awareness of these
goals. This leads to the fact that the goals might not be explicitly stated and communicated in the whole
organisation.
81

It was also found that ISO presence in the company positively affects company’s means of communica-
tion. The level of rumours is used to a lesser extent due to the necessary data base and higher role of
direct managers.
What is the effect of strategy in adopting quality?
Generally, the common principles of customer satisfaction are widely accepted. There is also an empha-
sis on improvement efforts and results to be achieved. However there is a low focus on the human re-
sources and having a keen workforce, which is contradictory to guarantee and provision of an appropri-
ate service.
How are employees committed to quality?
In general, there is no interdependence between training and ISO companies. More over, only in terms
of customer orientation, the difference between companies with ISO and without it can be traced. In
general, the tendency for educating people is stronger in the small companies, which don’t have ISO.
General motivation doesn’t differ in the companies as well, as they want to keep the costs down and the
wages are not competitive comparing to the other countries. But in the companies which have ISO we
can see the practice of improving this situation with introduction of other means of motivation – so
called social benefits, which are not present in the companies without ISO.
Due to involvement in the companies with ISO, the confidence among respondents was higher, but
overall results of general satisfaction and dissatisfaction can be similar for both groups of the compa-
nies.
What is the focus and role of a quality policy in firms?
It was found out that the employee perception of the quality is narrowly focused on customer satisfac-
tion. Other factors like meeting industry standards or avoiding mistakes or level of personal commit-
ment to work, which are highly considered under ISO, are realised to a lesser extent. This can lead to
narrow-mindedness of employees that diminish learning and innovative abilities necessary for problem
solving. Nevertheless, it is moderated by the fact of low importance of working according to rigorous
standards
82

What is the role of infrastructure in supporting quality level that companies pursue?
In the section of infrastructure there is a big difference between “advanced” and other companies: the
importance of excellent technical equipment is not questionable in the ISO companies, and the respon-
dents outlined that.
What is the level of quality in companies operating within a transitional economy?
From the above conclusions on each of the questions it can be deduced that not all the concepts are
developed equally. Specifically, human resources are not considered to a full extent and are even lower
than set under ISO standards.
5.3 Theoretical implications
As was previously found out the human resources factor is not considered to full extent. While another
issue is whether the human factor should be regarded to a higher extent?! According to Lemak and
Reed (2000) it is not necessary to be advanced in all areas of TQM. Up to now, it can be seen that Bela-
rus is doing quite well internationally when it comes to IT.
The establishment of ISO does not influence personal motivation, like commitment, leadership or em-
powerment. Rather, it works as a tool for establishing different control tools over processes and infor-
mation flow. The employee commitment to quality is mostly influenced by such factors as leadership
and job satisfaction or motivation.
Thus, it can be said that our disposition of leadership concept in the beginning of the graph was correct
because the actions of the top managers influences the whole organization and drives it towards total
quality.
Therefore, it can be concluded in support of Geraedts (2001) claim that ISO should be considered as a
transitional point towards total quality and not the ultimate source of competitiveness. This is important
due to the upcoming threats of smoothing political influence in the country that will lead to a better
market conditions for international rivals and open market.
83

In a whole our thesis once more time shows the significance of leadership when striving for total quality
and the importance of human resources when implementing this idea. Our results also contribute to the
quite new area of investigation of studying quality management practices in transitional or developing
economies. Thus, concluding that the general rules of TQM inferred from developed countries are also
applicable to our sample from transitional economy - Belarus.
5.4 Practical implications
Belarus strategic focus on IT that has its roots back in soviet times combined with a highly educated
workforce gives companies an international competitive advantage. While other ideas of market econ-
omy have been acknowledged, the results show that the main motivator for people is still financial fac-
tor, which is insufficient. A low financial motivator, if not learned from neighbouring Baltic countries,
might lead to a brain drain.
A high level of recognition of customer satisfaction is rather precautious, as it might lead to low level of
learning and innovation. However, this fact is moderated with the low importance of working upon the
rigorous standards.
Due to its underestimated value of highly educated human resources, they might experience the brain
drain as soon as the market economy changes its political power influence.
Hence, in a long run companies should consider either increasing salaries, or substituting it with other
non-financial benefits.
Despite a good level of leadership, companies also have to consider the human resources that have been
ignored. On the one hand this might not be the mistake of leaders as the ISO system does not look at
the concept of human resources to a full potential. On the other hand, as the result show, leaders are
the ones who drive ISO not the other way around.
5.5 The methodology
As our research model was purely based on the TQM literature review, we think it would be also more
appropriate for others to consider the industry or country related factors. Also we thought that infra-
structure related factors were observed to a lesser extent and could be examined deeper.
84

Authors also might consider dividing “agree” option into several. This is because a high level of general
agreement among all the issues was observed.
5.6 Future research
Even though our topic of quality management underpins a lot of principles to be found in other fields,
we tried to stay within the barriers of quality. Although the other authors, like R. M. Kanter were used
as a source of inspiration and addition to a richer discussion that led to, as we think, to a better deduc-
tions.
When reading our thesis one might find numerous issues for further research as every concept outlined
in our research model could be a separate research. Nonetheless, we would like to outline the ones that
concern our whole paper and the topics that would complete the current research.
First of all, we think it is necessary to conduct such a research periodically to spot the changes and
trends among the tendencies. Therefore, a research might cover a bigger sample that could be more rep-
resentative and infer with generalisations of the IT industry in Belarus. A further research could be also
conducted to reveal tendencies in other developing economies and compare them with those in Belarus.
85

REFERENCES
Adebanjo, D., (2001), TQM and Business Excellence: Is there really a conflict?, MCB University Press,
Measuring Business Excellence 5.3, p. 37 – 40
Anderson, J., C., Rungtusanatham, M., and Schroeder, R., G., (1994), A theory of quality management
underlying the Deming management method, Academy of Management Review, 19 (3), p. 472–509.
Armstrong, M., and Stephens, T., (2005), A hand book of Management and Leadership: a guide to managing for
results, Great Britain: Scotprint
Au G., and Choi I., (1999), Facilitating implementation of total quality management through informa-
tion technology, Elsevier Science B.V., Information & Management 36, p. 287-299
Bellis-Jones, R., and Hand, M., (1989), Are total quality management programmes a fact or a manage-
ment fad?, Management Accounting 67(5), p. 36-37
Benavent, F., B., (2006), TQM Application Through Self-Assessment and Learning: Some Experiences
from Two EQA Applicants, American Society for Quality, Quality Management Journal, Vol. 13, No. 1, pp.
7-25
Berg, B., L., (2004), Qualitative research methods for the social sciences, 5th ed., Pearson: Boston
Biazzo, S., and Bernardi, G., (2003), Process management practices and quality systems standards: risk
and opportunities of the new ISO 9000 certification, Emerald Ltd.: Business process Management Journal, Vol.
9, No. 2, p. 149 - 169
Brown, S., W., Gummesson, E., Edvardsson, E., and Gustavsson, B., (1991), Service quality: Multidiscipli-
nary and Multinational perspective, Lexington books: New York
Normann, R., (1991), Service Management: Strategy and Leadership in Service Business, 2nd edition, John Wiley
& Sons: Chichester, England
86

Brewerton, P., M., and Millward, L., (2001), Organizational Research Methods: A Guide for Students and Re-
searchers, London, GBR: Sage Publications Ltd,
Camison, C., (1996), Total quality management in hospitality: an application of the EFQM model, El-
sevier Science Ltd: Tourism Management, Vol. 17, No. 3, p. 191-201
Chin, K., S., Rao Tummala, V., M., and Chan K., M., (2002), Quality management practices based on
seven core elements in Hong Kong manufacturing industries, Elsevier Science Ltd.: Technovation 22, p. 213–
230
Chong, V., K., and Rundus, M., J., (2004), Total quality management, market competition and organiza-
tional performance, Elsevier Ltd.: The British Accounting Review 36, p. 155–172
Crosby, P., (2006), Philip Crosby: The Fun Uncle of the Quality Revolution, SkyMark: Management Thought
Leaders, http://www.skymark.com/resources/leaders/crosby.asp, (last accessed: 2006-03-23)
Cua, K., O., McKone, K., E., and Schroeder, R., G., (2001), Relationships between implementation of
TQM, JIT, and TPM and manufacturing performance, Elsevier Science B.V.: Journal of Operations Manage-
ment 19, p. 675–694
Dale, B.,G., Zairi, M., Van der Wiele, A., and Williams, A.,R.,T., (2000), Qualty is dead in Europe - Long
Live Excellence True or False? MCB University Press. Measuring Business Excellence 4.3., p. 4 -10
Danny Samson, D., and Terziovski, M., (1999), The relationship between total quality management
practices and operational performance, Elsevier Science B.V.: Journal of Operations Management 17, p. 393–
409
Deming, W., E., (2005), Who is Dr. W. Edwards Deming?, Leadership Institute Inc.,
http://www.lii.net/deming.html, (last accessed: 24 of March 2006)
Deming, W., E., (2006), W. Edwards Deming quotes, ThinkExist quotations,
http://en.thinkexist.com/quotes/w._edwards_deming/ (lassed accessed: 30 of May 2006)
Edvardsson, B., and Gustafsson, A., (1999), Nordic School of quality management, Lund: Studentlitteratur
87

EFQM: Introducing Excellence, (2003), The European Foundation for Quality Management,
http://www.efqm.org/uploads/introducing_english.pdf, (last accessed: 2006-03-20)
Fink, A., (2003:1), How to design survey studies, The survey kit – 2nd ed., Sage Publications: Thousand Oaks
Fink, A., (2003:2), The Survey handbook, The survey kit – 2nd ed., Sage Publications: Thousand Oaks
Fisher, C., (2004), Researching and Writing a Dissertation for Business Students, Pearson Education Ltd.: Har-
low, England
Geraedts, H., P., A., Montenarie R., van Rijk P., P., (2001), The benefits of total quality management,
Elsevier Science Ltd.: Computerized Medical Imaging and Graphics 25, p. 217 – 220
Gerald, M., J., and Whicker, L., M., (1998), Handbook of Research Methods in Public Administration, New
York, NY, USA: Marcel Dekker Incorporated.
Grugulis, I., and Wilkinson, A., (2002), Managing Culture at British Airways: Hype, Hope and Reality
Elsevier Science Ltd.: Long Range Planning 35, p. 179-194
Grönroos, C., (1991), Strategic Management and Marketing in the Service Sector, Lund, Studentlitteratur, Swe-
den
Hansen, H., (2001), Quality in the Marketplace: A Theoretical and Empirical Investigation, Elsevier Sci-
ence Ltd.: European Management Journal Vol. 19, No. 2, p. 203–211,
Hardjono, T., W., and van Marrewijk, M., (2001), The Social Dimensions of Business Excellence, El-
sevier Science Inc.: Corporate Environmental Strategy, Vol. 8, No. 3, p. 223 – 233
Harmon, E., Hensel, S., C., and Lukes, T., E., (2006 Number 1), Measuring performance in services, McKinsey
quarterly, http://www.mckinseyquarterly.com/article_abstract.aspx?ar=1730&L2=1&L3=24 (last ac-
cessed: 2006-04-26)
Harvey, J., (1998), Service quality: a tutorial, Elsevier Science B.V.: Journal of Operations Management 16, p.
583–597
88

Inglehart, R., (1990), Culture Shift in Advanced Industrial Societies, Princeton: New Yersey, U.S.
Irani, Z., Beskese, A., and Love, P., E., D., (2004), Total quality management and corporate culture:
constructs of organisational excellence, Elsevier Ltd.: Technovation 24, p. 643–650
Irons, K., (1994), Managing Service companies: Strategies for success, Addison Wesley: Harlow, England
Ishikawa, K., (2006), Kaoru Ishikawa: One Step Further, Skymark: Management Thought Leaders,
http://www.skymark.com/resources/leaders/ishikawa.asp, (last accessed: 2006-03-24)
Jun, M., Cai, S., and Shin, H., (2005), TQM practice in Maquiladora: Antecedents of employee satisfac-
tion and loyalty, Elsevier B.V.: Journal of Operations Management
Jung, J., Y., and Wang Y., J., (2006), Relationship between total quality management (TQM) and con-
tinuous improvement of international project management (CIIPM), Elsevier: Technovation, p. 1-7
Juran, J., M., (1996), J M Juran on Quality, satellite seminar: India October 10 1996, Qimpro Consultants Pvt
Ltd, http://www.qimpro.com/Juran/Juran-In-India.asp (last accessed: 2006-05-15)
Juran J., M., (2006), Joseph M. Juran, SkyMark: Management Thought Leaders,
http://www.skymark.com/resources/leaders/juran.asp, (last accessed: 24-03-2006)
Kanakamedala, K., Krishnakanthan, V., and Mark., D., (2006 February), CIO spending in 2006, McKinsey
quarterly, http://www.mckinseyquarterly.com/article_page.aspx?ar=1745&L2=13&L3=13, (last ac-
cessed: 2006-04-22)
Kanter, R., M., (1989), When giants learn to dance: Mastering the challenges of strategy, management and carriers in
the 1990’s, International Thomson Business Press
Kaynak, H., (2003), The relationship between total quality management practices and their effects on
firm performance, Elsevier Science B.V.: Journal of Operations Management 21, p. 405–435
Kunst, P., and Lemmink, J., (1992), Quality Management in Services, Van Gorcum, Assen/Maastricht
89

Lemak, D., J., and Reed, R., (2000), An application of Thompson's typology to TQM in service firms,
Elsevier Science Inc.: Journal of Quality Management 5, p. 67-83
Maylor, H., and Blackmon, K., (2005), Researching Business and Management, Pacgrave McMillan (p. 363)
Moran, P., (august 2005), IT Governance is an integral part of Corporate Governance and it’s time to put it on the
agenda, Ernst and young Report, http://www.ey.com/global/content.nsf/Ireland/Finance_Dublin_-
_Aug_05_-_Pat_Moran, (last accessed: 2006-04-22)
Moreno-Luzón, M., D., and Peris. F., J., (1998), Strategic approaches, organizational design and quality
management – Integration in a fit and contingency model, International Journal of Quality Science, No. 4,
328-347
Nabitz, U., W., and Klazinga N., S., (1999), EFQM approach and the Dutch Quality Award, International
Journal of Health and Care 12/2, p.65-70
Normann, R., (1991), Service management: Strategy and leadership in service business, 2nd ed., Chichester (UK):
John Wiley and Sons
Pande, A., Raman, R., and Srivatsan, V., (March 2006), Recapturing your supply chain data, Web exclusive,
http://www.mckinseyquarterly.com/article_page.aspx?ar=1749&L2=1, (last accessed: 2006-04-22)
Perdomo-Ortiz, J., Gonzalez-Benito, J., and Galende J., (2005), Total quality management as a forerun-
ner of business, Elsevier Ltd.: Technovation
Prajogo, D., I., and Sohal A., S., (2001), TQM and innovation: a literature review and research frame-
work, Elsevier Science Ltd.: Technovation 21, p. 539–558
Prajogo, D., I., and Sohal, A., S., (2004), The multidimensionality of TQM practices in determining
quality and innovation performance — an empirical examination, Elsevier Ltd.: Technovation 24, p. 443–
453
90

Prajogo, D., I., and Sohal, A., S., (2006), The relationship between organization strategy, Total Quality
Management (TQM), and organization performance––the mediating role of TQM, Elsevier B.V.: Euro-
pean Journal of Operational Research 168, p. 35–50
Quality Management Principles, (2001), International Organisation for Standardisation
http://www.iso.org/iso/en/iso9000-14000/understand/qmp.html, online verision, (last accessed:
2006-04-20)
Radkevitch, U., (2006), Belarus Attempts to Become the Eastern European Bangalore, http://www.e-
belarus.org/article/outsourcing.html, (last accessed 16-05-2006)
Rahman, S., and Bullock, P., (2005), Soft TQM, hard TQM, and organisational performance relation-
ships: an empirical investigation, Elsevier Ltd.: Omega 33, p. 73 – 83
Reed, R., Lemak, D., J., and Mero, N., P., (2000), Total quality management and sustainable competitive
advantage, Elsevier Science Inc.: Journal of Quality Management 5, p. 5 - 26
Ritchie, L., and Dale B., G., (2000), Self-assessment using the business excellence model: A study of
practice and process, Elsevier Science B.V.: Int. J. Production Economics 66, p. 241 – 254
Rungtusanatham, M., Forza, C., Filippini, R., and Anderson, J., C., (1998), A replication study of a the-
ory of quality management underlying the Deming management method: insights from an Italian con-
text, Elsevier Science B.V.: Journal of Operations Management 17, p. 77–95
Rungtusanatham, M., Forza, C., Koka, B., R., Salvador, F., and Nie, W., (2005), TQM across multiple
countries: Convergence Hypothesis versus National Specificity arguments, Journal of Operations Manage-
ment 23, p. 43–63
Samson, D., and Terziovski, M., (1999), The relationship between total quality management practices
and operational performance, Elsevier Science B.V.: Journal of Operations Management 17, p. 393–409
Sandholm, L., (2000), Total Quality Management, Lund, Studentlitteratur, Sweden
91

Schedler, K., and Felix, J., (2000), Quality in public management: the customer perspective, Elsevier Sci-
ence Inc. International Public Management Journal 3, p. 125–143
Soltani, E., Van der Meer, R., Gennard, J., and Williams, T., (2003), A TQM Approach to HR Perform-
ance Evaluation Criteria, Elsevier Science Ltd.: European Management Journal Vol. 21, No. 3, p. 323–337
Sousa, R., and Voss, C., A., (2002), Quality Management re-visited: a reflective review and agenda for
future research, Elsevier Science B. V.: Journal of operations management 20, p. 91 – 109
Stashevsky, S., and Elizur, D., (2000), The effect of quality management and participation in decision-
making on individual performance, Elsevier Science Inc.: Journal of Quality Management 5, p. 53-65
Tari, J., J., and Sabater, S., (2004), Quality tools and techniques: Are they necessary for Quality manage-
ment?, Elsevier B.V.: Int. J. Production Economics 92, p. 267–280
Thietart, R.-A., (2001), Doing Management Research: A Comprehensive Guide, London, GBR: Sage Publica-
tions, Incorporated
Trestle Group Research Report, (2004), Outsourcing Survey Results, http://www.epam.com/contactus-
request-download-list.aspx?id=418710 (last accessed: 08-05-2006)
Ugboro, I., O., and Obeng, K., (2000), Top management leadership, employee empowerment, job satis-
faction, and customer satisfaction in TQM organizations: an empirical study, Elsevier Science Inc.: Journal of
Quality Management 5, p. 247-272
Wikipedia (2006), The free encyclopaedia, http://en.wikipedia.org/wiki/Bugtracker, (last accessed: 2006-05-
10)
Zhao X., Yeung, A., C., L., and Lee, T., S., (2004), Quality management and organizational context in
selected service industries of China, Elsevier B.V.: Journal of Operations Management 22, p. 575–587
92

APPENDIX 1: QUESTIONNAIRE
The purpose of the research is to find out the level of quality development in the single defined enter-prise in IT industry in Belarus. Also, it will look for differences and similarities of applying quality man-agement techniques and those specified in the literature. We guarantee a total privacy and insure that the results will be used only in a systemised way and not a single questionnaire or name will be revealed. The results of the questionnaire might be used for suggestions on further improvement of organisa-tional performance and daily operations. We also give you a chance to win the souvenirs from the Baltic Business School in Kalmar (Sweden), where the research is taking place. The winners will be picked up using lottery method. Hence, we kindly ask for sincere answers and are thankful for devoting your precious time for carefully completing this questionnaire as it will help us to write a master’s thesis!
93

94

95

96