The Belarus-Azerbaijan Stability Connection
27
Belarus-Azerbaijan Connection of Stability . Andre Willers 29 May 2014 Synopsis : An unlikely pair of Hero anti-dominoes . Discussion : 1.The present Western involvement in the Ukraine is driven by that old Domino argument used in the Vietnam intervention . See appendix AA . 2. The Belarus-Azerbaijan Connection neatly short-circuits any domino effect . My compliments to whoever conceived it . A neat bit of work . The Connection keeps both stable in energy-market trades , as well as enforcing stability on some of their more wonky neighbours . Eg Belarus won’t take too kindly to its energy pipeline from Odessa being interrupted , neither would Azerbaijan . 3. The probability of domino-destabilization is then small . 4.Western clumsy attempts at stabilization can be scaled down . 5.Energy and money are the drivers .
-
Upload
miskatonic-university -
Category
Documents
-
view
5 -
download
0
Transcript of The Belarus-Azerbaijan Stability Connection
Belarus-Azerbaijan Connection of Stability .Andre Willers
29 May 2014
Synopsis :
An unlikely pair of Hero anti-dominoes .
Discussion :
1.The present Western involvement in the Ukraine is driven by that old Domino argument used in the Vietnam intervention . See appendix AA .
2. The Belarus-Azerbaijan Connection neatly short-circuits any domino effect .
My compliments to whoever conceived it . A neat bit of work .
The Connection keeps both stable in energy-market trades , as well as enforcing stability on some of their more wonky neighbours .
Eg Belarus won’t take too kindly to its energy pipeline from Odessa being interrupted , neither would Azerbaijan .
3. The probability of domino-destabilization is then small .
4.Western clumsy attempts at stabilization can be scaled down .
5.Energy and money are the drivers .
See http://en.wikipedia.org/wiki/Azerbaijan%E2%80%93Belarus_relations
“Relations between Azerbaijan and Belarus are at very high level that Belarussian president Alexander Lukashenko describes Azerbaijan as a "saver" of independence and sovereignty of Belarus”
“Azerbaijan is also helping Belarus to acquire alternative oil sources. Minsk recently began importing oil from Venezuela but direct shipments to landlocked Belarus are difficult. Baku thus agreed to swap schemes by which Minsk gains access to Azerbaijani oil in exchange for Venezuelan oil. By mid-July, the Mozyr refinery in Belarus is scheduled to start processing significant volumes of oil from Azerbaijan on a regular basis. Test shipments of Azerbaijani oil have been ongoing since February throughUkraine’s Odessa-Brody pipeline and the Brody-Mozyr section of the Druzhbapipeline.[10]”
6.Belarus is playing a balancing act between Nato and Russia .
See http://rt.com/news/belarus-russia-warplanes-nato-418/
See http://belarusdigest.com/story/will-nuclear-weapons-return-belarus-17389
“Only Ukraine made irresolute attempts to hold nukes for itself, but finally, joined in with Belarus and Kazakhstan who solemnly gave up nuclear arms that, in reality, they never effectively possessed.”
7.Azerbaijan has its own little balancing act .
A small , oil rich state with lots of wolves around , eyeing it hungrily .
Which is why it wants to run with the big wolf pack (Nato) .
See http://nuclear-news.net/2013/07/04/armenia-should-have-nuclear-weapons-to-combat-azerbaijan-smerch-missiles/

8. They all are nominally nuclear-weapons free , but strong suspicions linger about old USSR nukes that slipped
through the cracks .
9.As you can see from Appendix AA , the distortions by stupidity and greed in the Western Economic Systems have
rendered them vulnerable to Domino-Unzipping as what happened to the old USSR .
10 . The next day (for the West , that would be Fri , 5 Jun 2014) , you sit looking around , wondering what hit
you . Without even firing a shot .
Oh ! The embarrassment !
Bismarck would have loved it !
andre
xxxxxxxxxx
Appendix AA
http://andreswhy.blogspot.com/2014/05/belarus-and-european-instability.html
Friday, May 16, 2014
Belarus and European Instability .Belarus and European Instability .
Andre Willers16 May 2014Synopsis :Another patchwork state becoming unglued due to insufficient reserves . The next domino after Ukraine . Then others will follow , as the EU unravels . Endemic warfare ensues .

Discussion :1.GINI :http://www.quandl.com/demography/gini-index-by-countryBelarus : 26.48 (2011)Ukraine : 25.62 (2010) See Appendix AA for a discussion of what this means .Basically , the State has insufficient reserves to counteract centripetal forces , especially if under hostile attack . 2.Belarus has a diverse ethnic and language make-up .See http://en.wikipedia.org/wiki/BelarusAnd it borders on Russia , Ukraine and Lithuania .It has a state military (mostly conscripts) and a private sector with insufficient reserves to motivate and maintain itself leads to instability , regardless of the ideology .It didn’t work for the USSR , and the same result will follow for Belarus after the Ukraine has fallen apart . 3. Other nearby countries at risk because of insufficient reserves (low GINI)3.1 Slovakia (26) , Czech (25) , Serbia (27) , Bulgaria (28) 3.2 At risk countries with reserves that are so spread out they cannot be mobilized quickly . Vulnerable to a political blitzkrieg .Germany (28) , Denmark (24) , Finland (26) , Sweden (25) , Norway (25) . 3.3 Countries at risk because of regional GINI differences .(a)Belgium : see Appendix BB . One half of the country is paying for the otherhalf .If there is even a slight hiccup in EU subsidies to Brussels , Belgium will fly apart . (b) Venice : The same story . The Venetians have already voted to secede from Italy . Seehttp://en.wikipedia.org/wiki/Venetian_independence_referendum,_2014 .Italy might fall apart completely into it’s natural form of city-states . (c) The rest all have risks . Seehttp://en.wikipedia.org/wiki/List_of_active_separatist_movements_in_EuropeUK is already happening . Spain seems to be at high risk . (d) Germany collapsing into a number of small states (like before Bismarck) is unfortunately quite likely if the EU falls apart .Note the “Ossie” – “Wessie” divide . The GINI’s of the two regions are quite different .See http://www.diw.de/documents/publikationen/73/diw_01.c.43930.de/dp540.pdfThe German state looks rather fragile .

The old GDR GINI ~ 22 compared to Germany’s ~ 28 .This is a huge difference . The whole amalgamation process seems to have stalled in the mid 1990’s , leaving a lot of bitterness .See the Conclusion in the URL . 4.Endemic Warfare .The result would be a large number of small , very homogenous states that are extremely xenophobic .Something like Medieval Europe . Note that “Warfare as the Game of Kings” was an integral part of the system .It purged the system of those pesky adventurous spirits .Until Napoleon spoiled it all . (Why he is known as The Great Disturber)
One can then expect a resurgence of organized religion , especially Roman Catholicism with its proven track record of mind control (confessional , etc)The Internet would be under strict secular and religious control , except for pockets of skunk-works where anything goes as long as it is to the advantage of the State .Religious fascism with ghettoes of freedom to produce the technology to perpetuate the State .This has happened before .Think Universities in Medieval Europe.The system under stress will be very inclined to follow the path of least resistance as in the previous instance . 5.The Singularity .Technological singularities would be more likely in such an environment . The argument is similar to the West’s development of technology from small , quarrelling states circa 1400 – 1800 .I Diversity is more important than optimization . 6. The fragmentation of states is then a necessary (and logical ) tautologicalstep to Singularity . I can see some interesting times for all . Why bother with incarnating on earth just to be bored ? 7. For starters , calculate the GINI of Heaven . 8.The economics of souls will stretch your mind . Christian free forgiveness of sins is the Quantitive Easing for souls .

Isn’t Soul Economics fun ? Andre XxxxxxxxxxxxxxxxxxxxxxxAppendix AAhttp://andreswhy.blogspot.com/2014/03/gini-and-rubble-of-empire.html
Sunday, March 16, 2014
GINI and the rubble of EmpireGINI and the Rubble of Empire .
Andre Willers .16 Mar 2014“Grasping all , they lose all” AWSynopsis :What we see as the glory of Rome is really just the rubble of the rich, built on the backs of poor farmers and laborers .And things are worse today .
Discussion:1.GINI measures unequal income . It measures desperation in hunger and medicine .The Gini coefficient is a number between 0 and 1, where 0 corresponds with perfect equality (where everyone has the same income) and 1 corresponds with perfect inequality (where one person has all the income—and everyone else has zero income).Easy to remember : No 1 has it all .The rest have nothing except what is doled out in the Camps .2.Not even the Roman Empire had as high Gini ratio’s as present so-called democracies .Seehttp://www.photius.com/rankings/economy/distribution_of_family_income_gini_index_2014_0.htmlXxA short summary of the most important countries .Where would you like to live if you were (a) rich . Or (b) at the bottom .This differential drives Revolution and Migration .
RSA Gini= 0.63China Gini = 47.4USA Gini = 0.45Russia Gini = 0.417UK Gini = 40Japan Gini= 0.376India Gini = 0.368Germany Gini= 0.27

xxxRoman Empire (150 AD) : Gini = 0.42
This basically means that a Roman slave in 150 AD had a fairer deal than a salary slave in most of the present Western world .Note the exception of Germany .
See Appendix A for Roman Empire Gini . 3. Reserve considerations .See Appendix C on how to calculate optimal reserves ab-initio .Reserve arguments can be used .The society should build up reserves . This is usually held in individual hands (your savings) , but it shows up in Gini statistics as lowering the ratio .The Optimal GINI would then be in the band 0.28 – 0.33 – 0.38 , with the sweet spot at 0.33 .
4.Some corollaries :If GINI smaller than 0.28 , instability ensues . Insufficient reserves. Usually collapse . Cities deserted as the good citizens just walk away .( See http://andreswhy.blogspot.com/2014/01/evanescence-of-cities.html ) .Or the collapse of the USSR . See http://www.roiw.org/1993/23.pdfThe 1989 Gini of USSR = 0.275 . It shouldn’t have led to collapse , but they were in an arms-race with USA . Insufficient reserves .The system went into shock and collapsed .
If GINI bigger than 0.38 , instability ensues . Too much reserves in too few hands . Usually revolution .See Arab Spring , Syria , Occupy Wall st , etc etc .Or any peasant rebellion in history , a-la-France or Russia .
5.Where are we now 2014 ?Every country with a Gini bigger than 0.38 and social media access is a revolution waiting to happen .Countries with Gini smaller than 0.28 have to be propped up . According to this argument , Germany appears strong now , but might need aid in the near future . Can this be correct ? Remember verreine . Huge reserves are locked up in the verreine . But how is classified in the Gini calculation ?
6.What does this mean ?Big , top-heavy states will continue to break apart .Ukraine now , UK (Scotland) later this year .

A big Empire like the USA is showing distinct signs of strain . The tail is attempting to wag the dog . Be interesting to see who is the last man standingin the ruins .“Better dead than red” used to be the motto . But can get enthusiastic about Donkeys and Elephants ?
7 RSA ?The same story . Another artificial mini-empire tacked together by the British. The extremely high Gini will force a break-up of the provinces . The usual civil war will ensue as the vultures pick the carcass apart .See Appendix D on Neo-Vikings .I would have hoped that they go off-planet , but they are too stupid and poor to do that .https://www.blogger.com/blogger.g?blogID=16105240#editor/target=post;postID=632898708944473552;onPublishedMenu=posts;onClosedMenu=posts;postNum=28;src=postname
8. What an exciting future .Greed and stupidity finally does for the human race .
“Grasping all , they lose all”RegardsAndre
xxxxxxxxxxxxxxxxxxxxxxxxxxxxxxxxxxxxxxxxxAppendix Ahttp://www.stumbleupon.com/su/2d53lE/:Ix!ztvvU:fhbrmqFE/persquaremile.com/2011/12/16/income-inequality-in-the-roman-empire/Over the last 30 years, wealth in the United States has been steadily concentrating in the upper economic echelons. Whereas the top 1 percentused to control a little over 30 percent of the wealth, they now control 40 percent. It’s a trend that was for decades brushed under therug but is now on the tops of minds and at the tips of tongues.Since too much inequality can foment revolt and instability, the CIA regularly updates statistics on income distribution for countries around the world, including the U.S. Between 1997 and 2007, inequality in the U.S. grew by almost 10 percent, making it more unequal than Russia, infamous for its powerful oligarchs. The U.S. is not faring well historically, either. Even the Roman Empire, a society built on conquest and slave labor, had a more equitable income distribution.To determine the size of the Roman economy and the distribution of income, historians Walter Schiedel and Steven Friesen pored over papyri

ledgers, previous scholarly estimates, imperial edicts, and Biblical passages. Their target was the state of the economy when the empire wasat its population zenith, around 150 C.E. Schiedel and Friesen estimatethat the top 1 percent of Roman society controlled 16 percent of the wealth, less than half of what America’s top 1 percent control.To arrive at that number, they broke down Roman society into its established and implicit classes. Deriving income for the majority of plebeians required estimating the amount of wheat they might have consumed. From there, they could backtrack to daily wages based on wheat costs (most plebs did not have much, if any, discretionary income). Next they estimated the incomes of the “respectable” and “middling” sectors by multiplying the wages of the bottom class by a coefficient derived from a review of the literature. The few “respectable” and “middling” Romans enjoyed comfortable, but not lavish, lifestyles.Above the plebs were perched the elite Roman orders. These well-definedclasses played important roles in politics and commerce. The ruling patricians sat at the top, though their numbers were likely too few to consider. Below them were the senators. Their numbers are well known—there were 600 in 150 C.E.—but estimating their wealth was difficult. Like most politicians today, they were wealthy—to become a senator, a man had to be worth at least 1 million sesterces (a Roman coin, abbreviated HS). In reality, most possessed even greater fortunes. Schiedel and Friesen estimate the average senator was worth over HS5 million and drew annual incomes of more than HS300,000.After the senators came the equestrians. Originally the Roman army’s cavalry, they evolved into a commercial class after senators were banned from business deals in 218 B.C. An equestrian’s holdings were worth on average about HS600,000, and he earned an average of HS40,000 per year. The decuriones, or city councilmen, occupied the step below theequestrians. They earning about HS9,000 per year and held assets of around HS150,000. Other miscellaneous wealthy people drew incomes and held fortunes of about the same amount as the decuriones.In total, Schiedel and Friesen figure the elite orders and other wealthy made up about 1.5 percent of the 70 million inhabitants the

empire claimed at its peak. Together, they controlled around 20 percentof the wealth.These numbers paint a picture of two Romes, one of respectable, if not fabulous, wealth and the other of meager wages, enough to survive day-to-day but not enough to prosper. The wealthy were also largely concentrated in the cities. It’s not unlike the U.S. today. Indeed, based on a widely used measure of income inequality, the Gini coefficient, imperial Rome was slightly more equal than the U.S.The CIA, World Bank, and other institutions track the Gini coefficientsof modern nations. It’s a unitless number, which can make it somewhat tricky to understand. I find visualizing it helps. Take a look at the following graph.
To calculate the Gini coefficient, you divide the orange area (A) by the sum of the orange and blue areas (A + B). The more unequal the income distribution, the larger the orange area. The Gini coefficient scales from 0 to 1, where 0 means each portion of the population gathers an equal amount of income and 1 means a single person collects everything. Schiedel and Friesen calculated a Gini coefficient of 0.42–0.44 for Rome. By comparison, the Gini coefficient in the U.S. in 2007 was 0.45.Schiedel and Friesen aren’t passing judgement on the ancient Romans, nor are they on modern day Americans. Theirs is an academic study, one used to further scholarship on one of the great ancient civilizations. But buried at the end, they make a point that’s difficult to parse, yetprovocative. They point out that the majority of extant Roman ruins resulted from the economic activities of the top 10 percent. “Yet the
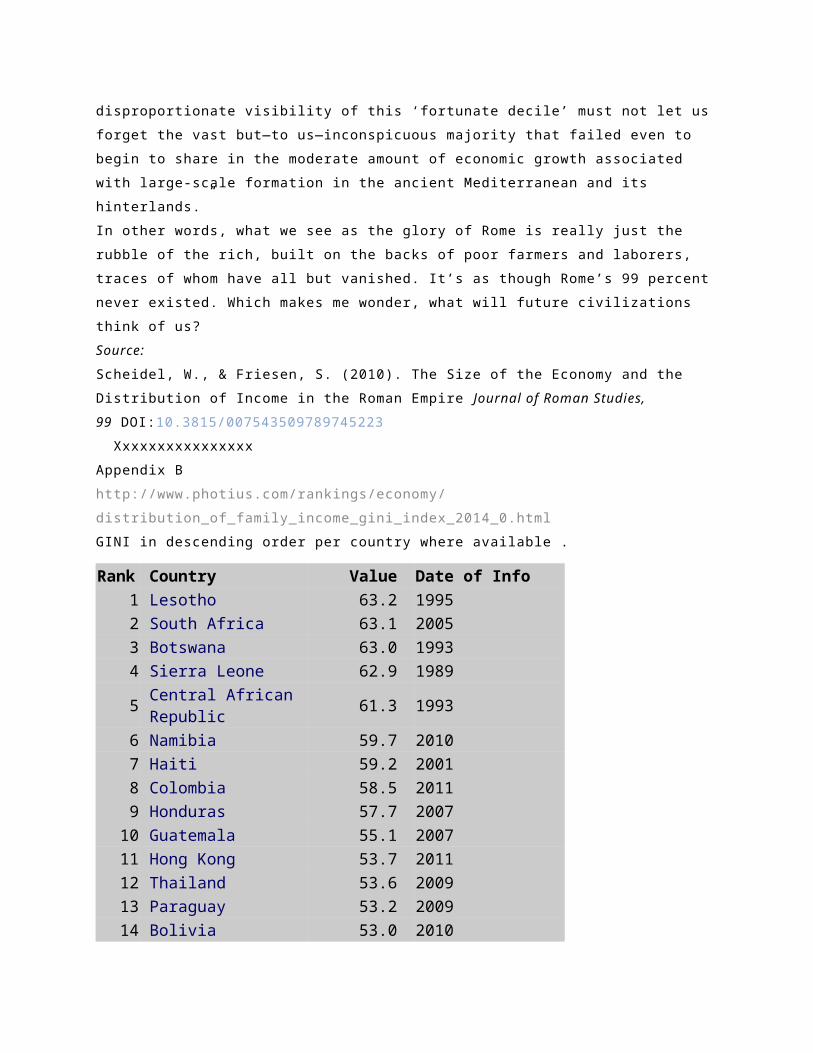
disproportionate visibility of this ‘fortunate decile’ must not let us forget the vast but—to us—inconspicuous majority that failed even to begin to share in the moderate amount of economic growth associated with large-scale formation in the ancient Mediterranean and its hinterlands.”In other words, what we see as the glory of Rome is really just the rubble of the rich, built on the backs of poor farmers and laborers, traces of whom have all but vanished. It’s as though Rome’s 99 percent never existed. Which makes me wonder, what will future civilizations think of us?Source:Scheidel, W., & Friesen, S. (2010). The Size of the Economy and the Distribution of Income in the Roman Empire Journal of Roman Studies, 99 DOI:10.3815/007543509789745223 XxxxxxxxxxxxxxxxAppendix Bhttp://www.photius.com/rankings/economy/distribution_of_family_income_gini_index_2014_0.htmlGINI in descending order per country where available .
Rank Country Value Date of Info1.Lesotho 63.2 19952.South Africa 63.1 20053.Botswana 63.0 19934.Sierra Leone 62.9 1989
5.Central African Republic 61.3 1993
6.Namibia 59.7 20107.Haiti 59.2 20018.Colombia 58.5 20119.Honduras 57.7 2007
10.Guatemala 55.1 200711.Hong Kong 53.7 201112.Thailand 53.6 200913.Paraguay 53.2 200914.Bolivia 53.0 2010

15.Chile 52.1 200916.Panama 51.9 2010 est.17.Brazil 51.9 201218.Papua New Guinea 50.9 199619.Zambia 50.8 200420.Swaziland 50.4 200121.Costa Rica 50.3 200922.Gambia, The 50.2 199823.Zimbabwe 50.1 200624.Sri Lanka 49.0 201025.Mexico 48.3 200826.Singapore 47.8 201227.Ecuador 47.7 Dec 201228.Madagascar 47.5 200129.China 47.4 2012
30.Dominican Republic 47.2 2010 est.
31.El Salvador 46.9 200732.Rwanda 46.8 200033.Malaysia 46.2 200934.Peru 46.0 201035.Georgia 46.0 201136.Argentina 45.8 200937.Mozambique 45.6 200838.Jamaica 45.5 200439.Uruguay 45.3 201040.Bulgaria 45.3 200741.United States 45.0 200742.Philippines 44.8 200943.Cameroon 44.6 200144.Guyana 44.6 200745.Iran 44.5 200646.Uganda 44.3 200947.Nigeria 43.7 200348.Macedonia 43.2 200949.Kenya 42.5 2008 est.

50.Burundi 42.4 199851.Korea, South 41.9 201152.Russia 41.7 201153.Cote d'Ivoire 41.5 200854.Senegal 41.3 200155.Morocco 40.9 2007 est.56.Turkmenistan 40.8 199857.Nicaragua 40.5 201058.Turkey 40.2 201059.Mali 40.1 200160.Tunisia 40.0 2005 est.61.United Kingdom 40.0 FY08/0962.Jordan 39.7 200763.Burkina Faso 39.5 200764.Ghana 39.4 2005-0665.Guinea 39.4 200766.Israel 39.2 200867.Venezuela 39.0 201168.Malawi 39.0 200469.Mauritania 39.0 200070.Mauritius 39.0 2006 est.71.Portugal 38.5 200772.Moldova 38.0 200873.Cambodia 37.9 2008 est.74.Yemen 37.7 200575.Tanzania 37.6 200776.Vietnam 37.6 200877.Japan 37.6 200878.Uzbekistan 36.8 200379.Indonesia 36.8 200980.India 36.8 200481.Laos 36.7 200882.Mongolia 36.5 200883.Benin 36.5 200384.New Zealand 36.2 199785.Bosnia and 36.2 2007

Herzegovina86.Lithuania 35.5 200987.Algeria 35.3 199588.Latvia 35.2 201089.Albania 34.5 200890.Egypt 34.4 200191.Taiwan 34.2 201192.Poland 34.1 200993.Niger 34.0 200794.Ireland 33.9 201095.Azerbaijan 33.7 200896.Kyrgyzstan 33.4 200797.Romania 33.2 201198.Bangladesh 33.2 200599.Greece 33.0 2005100.Nepal 32.8 2010101.France 32.7 2008102.Tajikistan 32.6 2006103.Canada 32.1 2005104.Spain 32.0 2005105.Croatia 32.0 2010106.Timor-Leste 31.9 2007 est.107.Italy 31.9 2011108.Estonia 31.3 2010109.Czech Republic 31.0 2009110.Netherlands 30.9 2007111.Armenia 30.9 2008112.European Union 30.7 2011 est.113.Pakistan 30.6 FY07/08114.Australia 30.3 2008115.Kosovo 30.0 FY05/06116.Ethiopia 30.0 2000117.Switzerland 29.6 2010118.Cyprus 29.0 2005119.Kazakhstan 28.9 2011120.Serbia 28.2 2008

121.Ukraine 28.2 2009122.Iceland 28.0 2006123.Belgium 28.0 2005124.Malta 27.4 2011125.Belarus 27.2 2008126.Germany 27.0 2006127.Finland 26.8 2008128.Austria 26.3 2007129.Slovakia 26.0 2005130.Luxembourg 26.0 2005131.Norway 25.0 2008132.Denmark 24.8 2011 est.133.Hungary 24.7 2009134.Montenegro 24.3 2010135.Slovenia 23.8 2011136.Sweden 23.0 2005137.Saudi Arabia NA NA
Xxxxxxxxxxxxxxxxxxxxxxxxxxxxxx
Appendix CCalculation of optimal reserveshttp://andreswhy.blogspot.com/2008/04/infinite-probes2.html
Wednesday, April 30, 2008
Infinite Probes2Infinite Probes 2Andre Willers30 April 2008
http://andreswhy.blogspot.com/ “Infinite Probes’
From discussing this with various recipients , there seems to be a need for a simpler explanation . I thought I had explained it in the simplest fashion possible . The subject matter is inherently complex .
But , here goes .
How much must you save ?If you save too little , a random fluctuation can wipe you out .If you save too much , you lose opportunity costs . If you are in

competition , this loss can be enough to lose the competition (ie you die)
Intuitively , you can realize there is an optimum level of saving .
Methods exist of calculating this optimum in very specific instances (ie portfolios of shares ,eg Kelly criteria , or tactics in war eg MiniMax ) .
The General CaseWe need to hold a Reserve in case Something goes wrong . But we do not know what thing goes wrong .
Infinite Probes tries to answer the general case . What is really , really surprising is that a answer is possible .
The Infinite bit comes from using the mathematical expansion of the Definitionof Eulers Constant e = ( 1 + 1/2! + 1/ 3! + … 1/n! + …)Where n!= n*(n-1)*(n-2)*(n-3)*…*(1)
This approaches a constant , widely used in mathematics and physics .(e = 2.718…) .
All we need is a system that can be subdivided indefinitely (to infinity) .
First , we divide by 1Then 2Then 3Then 4
And so forth till infinity .
What is important is not that we do know what these divisions are , only that they are possible . We also do not know which one element goes wrong .
The other critical insight is that it is the relation between elements that isimportant . (Permutations) (The failure of an element in total isolation cannot affect the whole system by definition .)
We can count the number of relationships where there is failure of one element.It is n! , where n is number of divisions where only one failure .
Multiple failures are handled by summing :
Our Reserve(R ) is divided by n to infinity and summed .
TotReserve= R*( 1 + 1/2! + 1/ 3! + … 1/n! + …)TotReserve= R * e
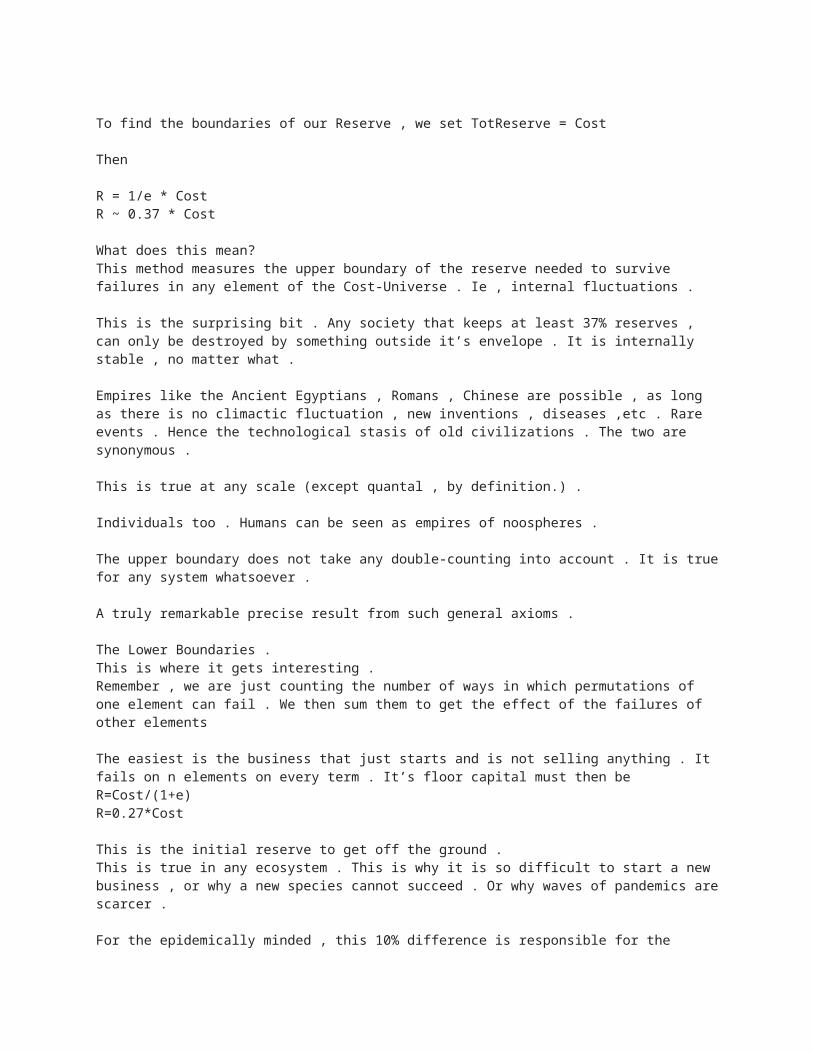
To find the boundaries of our Reserve , we set TotReserve = Cost
Then
R = 1/e * CostR ~ 0.37 * Cost
What does this mean?This method measures the upper boundary of the reserve needed to survive failures in any element of the Cost-Universe . Ie , internal fluctuations .
This is the surprising bit . Any society that keeps at least 37% reserves , can only be destroyed by something outside it’s envelope . It is internally stable , no matter what .
Empires like the Ancient Egyptians , Romans , Chinese are possible , as long as there is no climactic fluctuation , new inventions , diseases ,etc . Rare events . Hence the technological stasis of old civilizations . The two are synonymous .
This is true at any scale (except quantal , by definition.) .
Individuals too . Humans can be seen as empires of noospheres .
The upper boundary does not take any double-counting into account . It is truefor any system whatsoever .
A truly remarkable precise result from such general axioms .
The Lower Boundaries .This is where it gets interesting .Remember , we are just counting the number of ways in which permutations of one element can fail . We then sum them to get the effect of the failures of other elements
The easiest is the business that just starts and is not selling anything . It fails on n elements on every term . It’s floor capital must then beR=Cost/(1+e)R=0.27*Cost
This is the initial reserve to get off the ground .This is true in any ecosystem . This is why it is so difficult to start a new business , or why a new species cannot succeed . Or why waves of pandemics arescarcer .
For the epidemically minded , this 10% difference is responsible for the

demise of the Black Death ( smallpox outcompeted bubonic plaque variants for the CR5 access site.Ironically , the reason why we have only a limited HIV plague is the high competition for this site , probably some flu vectors . As one would expect , the incidence of HIV then becomes inversely proportional toconnectivity (ie flights) .
A cessation of airplane flights will then lead to a flare-up of diseases like these .Not exactly what anybody has in mind . )
When we find that we really need the spread of infectious vectors to stay healthy , then we know we have really screwed ourselves .
These are the two main boundaries .The literature is full of other limits the series can approach . Keep a clear head on what the physical significance is .
FatI cannot leave the subject without the thing closest to human hearts : appearance .Fat and fitness .Sadly , the present fad for leanness is just that . The period of superfluous food is coming to an end .Rich individuals can afford to be lean because the reserves are in the monetary wealth Women have to bear children individually , so they cannot store the needed reserves externally . Hence their fat storage is close to thetheoretical optimum even in Western societies (33%) . In other societies the percentage is about 37-40% .
Human males have been bred (Mk III humans) for muscle and little fat (8% in a superbly fit male) . He does not have reserves to withstand even garrison duty(even little diseases will lay him low .) Note the frequent references to diseases laying whole armies low .
Note what is left out : the camp-followers . They survived The women and babyfat children . Every army seeded the invaded area with women and children .
The bred soldier has to eat a high-carb food frequently : not meat or fat , his body cannot store it . This is the definition of a wheat-eating legionary .
Ho ! Ho! Ho!The Atkinson diet .No wonder it does not make sense in evolutionary terms .Mesomorphic humans have been bred not to transform expensive proteins and fatsinto bodymass .

The soldier-class were kept on a carbohydrate leash , which could only be supplied by farming .
The Smell of Horses .
Horses exude pheromones that promote body-leanness in humans . This has an obvious advantage to horses . Horses are breeding jockeys .
The time-span is enough : at least 8 000 years . (400 generations)
Because pregnant women cannot ride horses , there was a selection pressure to breed horses who have a pheromone that block female dominance pheromones , especially since females have to weigh more because of fat-reserve considerations .
Outside a farming environment , horses will sculpt their riders as much as theriders are sculpting them .
Small Mongolian ponies , small Mongolians .
This is why alpha-males like horses and horse-dominated societies were able toconquer and keep matriarchies .
Note the effect of the pheromones on women riders . Androgeny .On males it becomes extreme blockage of oestrogen . It seems like a surge of male hormones , but it is just an imbalance . (If too much male hormones , themen just kill their horses )
This is why the auto-mobile had such a big sociological effect . No horses , so the men became more effeminate .
Want to be Lean and Mean ?Sniff Horse sweat pheromone .Perfumiers take note .
Dogs
The other leg of the human-horse-dog triumvirate .Dogs accept female pack-leaders and have evolutionary reasons for blocking horse inhibitions of human female pheromones .
While the males are away , the females look after and rely on the dogs .(The reason why Mongols ride from yurt to yurt: they are too scared of the dogs.)

With dogs around , the male testosterone activity is ameliorated . This is a well known effect , especially if horses are around .
Hence the female love of lap-dogs . They are actually quite ferocious , and exude large amounts of pheromones that soothes the savage male breast .
Your attention is drawn to the Pekinese lapdog , which has had a disproportionately large effect on human history .
If this sounds convoluted , it is because this is exactly how this type of bio-system operates : by inhibitions of inhibitions of inhibitions ,etc .
Andre
Xxxxxxxxxxxxxxxxxxxxxxxxxxxxxxxxxxxxxxxxxxxxxxx
Appendix DNeo-Vikingshttps://www.blogger.com/blogger.g?blogID=16105240#editor/target=post;postID=632898708944473552;onPublishedMenu=posts;onClosedMenu=posts;postNum=28;src=postname
Andre Willers8 Feb 2014Synopsis:Raid-or-Trade is coming back in fashion as social orders collapses .
Discussion :1.Climate shifts cause social disruptions .
2.This causes degradation in defence capabibilties .
3.Opportunistic raiders take advantage .
4.Past :4.1Sea Peopleshttp://en.wikipedia.org/wiki/Sea_Peoplesor

http://andreswhy.blogspot.com/2009/10/ansari-gens.html
4.2 VikingsEssentially , climate change weakened civilized defensivesystems and also forced barbarians to go a-Viking .http://www.ees.lanl.gov/geodynamics/Wohletz/Krakatau_6th_Century.pdf“Modern history has its origins in the tumultuous 6th and7th centuries. During this period agricultural failures and the emergence of theplague contributed to: (1) the demise of ancient super cities, old Persia, Indonesian civilizations, the Nasca culture of South America,and southern Arabian civilizations; (2) the schism of theRoman Empire with the conception of many nation states and the re-birth ofa united China; and (3) the origin and spread of Islam while Arian Christianity disappeared. In his book, Catastrophe An Investigationinto the Origins of the Modern World, author David Keys explores history and archaeology to link all of these human upheavals toclimate destabilization brought on by a natural catastrophe, with strong evidence from tree-ring and ice-core data that it occurred in535 AD. With no supporting evidence for an impact-relatedevent, I worked with Keys to narrow down the possibilities for a volcaniceruption that could affect both hemispheres and bring about several decades of disrupted climate patterns, mostnotably colder anddrier weather in Europe and Asia, where descriptions of months with diminished sun light, persistent cold, and anomalous summersnow falls are recorded in 6th-century written accounts.”

4.3 Formosanshttp://australianmuseum.net.au/BlogPost/Science/Our-Global-Neighbours-Pacific-culture-ancestry-in-Formosa
Something similar happened (from genetic evidence) in Formosa to trigger the population of the Pacific Islands .Other cultural traits often point to Taiwan as the strong link in spreading Australasian-speaking people and their traditions through Southeast Asia and the Pacific.Indeed Australasian people migrated via extraordinary maritime journeys as faras Madagascar in the west, Easter Island in the east, Hawaii in the north and New Zealand in the south. These migrants propagated their cultural traditions,often modified to suit local conditions and preferences.- See more at: http://australianmuseum.net.au/BlogPost/Science/Our-Global-Neighbours-Pacific-culture-ancestry-in-Formosa#sthash.gm3tTliE.dpuf
5.Future :5.1 States lose the control of armed force .This has already happened . Private security (essentiallyprivate armies ) ( cf Condottierry) offers services to wealthy individuals whishing to escape .
5.2 The traditional route to escape these troubles is by sea . But with newish technology , you need a fleet . Single ships simply won’t hack it .
5.3 Postulated Scenario :Social order in RSA collapses .The region is wealthy . It has a large shipbuilding industry . Also large private security companies.Armed to the teeth , with very sophisticated logistics .People flee via ships . They have to survive . They arm .They can only survive in large groups with heavy arms .

Funding then has to be done via Viking-type raid-settlement-trade .
Do not worry about the primitive Somali pirates .South African pirates fleets will be much worse , although a bit more professional .
I did not expect this .But should have .Oh Well .Andrexxxxxxxxxxxxxxxxxxxxxxxxxxx Appendix BBhttp://www.zerohedge.com/news/2014-05-15/guest-post-why-belgium-can-never-work
Guest Post: Why Belgium Can Never Work
Submitted by Tyler Durden on 05/15/2014 19:46 -0400
The political situation in Belgium - as Europe heads into elections - could well be the writing on the wall for every European country.
Submitted by 'Sudden Debt' as first appearing in Belgian Beurs,
Economists and politicians love to juggle with figures for the trees so you can not see the forest.
Economics is not always easy, but we have noticed that you can do it with an island of 100 people to make it understandable.
Let's call this island "RAINBOWLAND" .
Overall, it looks like this:
Of the 100 residents, 28 were working in the private sector . They go fishing , build houses , canoes , ...
Of the remaining 72 people , 40 are working for the government .
They provide education , security, secret service and justice .
But they also set rules for the workers . They determine import quotas for fishing , ensuring that everyonepays taxes and they invent new rules which everyone must adhere.

There are still 15 people who have no work. They receive an unemployment allowance .
The remaining 17 residents are children , pensioners and long-term sick. They receive money or children , pensions and sickness benefits.As people who work in the private sector in Rainbowland they are the only onesthat effectively produce something , they pay the taxes they pay the others with.
You can say that people who work for the government work to support the production, but in practice it is often the opposite.
Thanks to all kinds of rules and laws, workers must spend more time to comply with these rules, thus production slows.
Of course you do not have to be a genius to realize that a country such as " Rainbowland" can not survive in reality.
It is impossible to operate when only slightly more than a quarter of the population ensures overall welfare.
However there is a "country " in the world who gets it done. And that "land " is ... Wallonia in Belgium!
Of the 3.56 million inhabitants, there are only 1 million to work in the private sector . This corresponds to 28 % of the total population . (Or 28 people on an island of 100 inhabitants . )
The rest works for the government (40 % ) , unemployed ( 15 % ) or too young, too old or too sick to work ( 17 % ) .
Why is Wallonia successful in this as the only "country" in the world ?
Because they can count on the solidarity of the Flemings .
Since as many as 2.25 million people in Flanders in the private, throughout this region creates a lot of wealth .
The government has decided that workers should cede to Wallonia. An ( increasing ) share of that prosperity in Flanders In solidarity .
However, this solidarity with each new government seems to be increasing. The univercity of Leuven recently figured it transfers 16 billion euro .
That's 16 billion euro annually moved from Flanders to Wallonia .
But such figures do not, of course say a lot .
Let's make it comprehensible again .
I just told you that there are 2.25 million people in Flanders in private and that they pay with their production for those who do not produce .

16,000,000,000 divided by 2,250,000 euros " workers in the private " = 7.111 euro
Anyone with a job in the private pays 7,111 euros in taxes that go directly toWallonia annually. That is just under 600 euros per month!
And it does not stop there.
Because this diligent worker not only pays for the Walloons . He also pays forits own government and solidarity with other Flemings .
What is the cost of this for a resident of Belgium ?
Well , all governments together spend 208.5 billion from last year .
That is what the government costs annually . And that amount is increasing year after year by the way. Ten years ago, for example, the expenditure amounted to "only" 143 billion.
So now we spend 65 billion per year more than we did 10 years ago !
Anyway, we were talking about the cost of government...208.5 billion in spending .
We have to share again by the number of workers in the private sector . In Flanders , Wallonia and Brussels together is that about 3.57 million people.
That gives ... 58,305 euros per year.
Take your calculator not hesitate to it to check the numbers. I also needed torecalculate that figure to believe these numbers several times
58,305 per year ... that's 4,858 euros per month .
Every working person in the private sector should therefore pay 4,858 euros per month in taxes to cover government spending.
And if you have the misfortune to live in Flanders, it becomes even more . Which is 4,858 euros with an average and as you know the Fleming pay a extra of 600 euros to Wallonia.
To finance the government they obviously need to increasing taxes
The government spending is now 55 % .
That means that 55 cents of every euro earned in Belgium, goes to the government .
However, more money for the government , also means less money for the population.
Less money to invest and consume .
In a country where the people have less and less money , the economy has obviously difficulties to grow.
Ok , we know that since the 2008 crisis and that is a convenient excuse to explain why there is no growth in Belgium .
We then conveniently forget that the economy in the previous period (2000-2006) also barely grew. The growth in this period was a meager 1.6% annualized.
If we look at it over a wider period , the figures are only sadder . The Belgian economy between 2000 and 2014, grew only 1.3 % on an annual basis .
The growing government stifles the economy.
However Flemings realize that all too well, remove the Walloon parties who seek a large government yet again!
A logical evolution since this language group has a direct interest in big government .
Nearly 3/4ths of the population who need government because of his or her income . You can hardly expect enthusiasm for smaller government from this quarter.
The Fleming wants , but sees his voice always evaporate in a left-wing government .
You just can not get around the socialists in Wallonia , so the socialists automatically form the basis for a federal government . Always.
And with the socialists in the government you automatically get a left policies increasing government .
The conclusion , for me at least , is that Wallonia and Flanders are two areaswith a totally different idea about the role of government .
If one side says "white", you can hear the other side say " black " .
I'm not just talking about economic issues .
Also, on migration and justice , there is a lot of disagreement.
You need two parts of the country that rarely agree with each other to work together?
Is it so crazy to aim for a model in which each party in his part of the country's has to organise their own funding?
Because it seems to me the only way Belgium can continue to operate long term is to have separate accounts because as of now, one side keeps buying shoes with the joint account while the other side has to pay the rent with what’s left.

Xxxxxxxxxxxxxxxxxxxxxxxxx