Improving efficiency of pro-poor public health service through ICTs in India: a report
Upload
independentCategory
view
2download
0
5
Elvin N. Afandi is affiliated with the Center for Economic Reforms, Baku, Azerbaijan. Gabor Pellenyi is affiliated with CEG European Center, Budapest, Hungary.
Problems of Economic Transition, vol. 50, no. 6, October 2007, pp. 5–31.© 2007 M.E. Sharpe, Inc. All rights reserved.ISSN 1061–1991/2007 $9.50 + 0.00.DOI 10.2753/PET1061-1991500601
ELVIN N. AFANDI AND GABOR PELLENYI
Evidence of Pro-Poor Growth in Azerbaijan
ABSTRACT: This article uses macro data to analyze the impact of macroeconomic growth on poverty reduction in Azerbaijan, and then to study the effect of sectoral status on the risk of being poor. Our results suggest a small correlation between economic growth and poverty reduction in Azerbaijan. The effect of employment on poverty reduction differs across economic sectors. Evidence of an insignificant relationship between economic growth and new jobs is also provided.
The relationship between economic growth and poverty is of great interest not only to social scientists but also to policymakers, who seek to ensure that economic growth increases living standards and reduces poverty. Much of the discussion revolves around the concept of pro-poor growth—growth that benefits the poor. The relationship between growth and poverty is not straightforward, as world experience shows. The correlation between economic growth and poverty in postsocialist countries has been negative: growth led to poverty reduction. However, in many market economies, particularly in developing transition countries, economic growth

6 PROBLEMS OF ECONOMIC TRANSITION
and increasing poverty have been observed simultaneously.1 As economists in transition countries have stressed, economic and social efficiency can be observed at the same time in any market economy; however, the existence of unemployment can destroy this harmony and increase poverty (Qutman et al., 2002). This phenomenon was labeled “immiserizing” growth by Kakwani and Pernia (2000). The authors argue that economic growth can increase the poverty rate if inequality increases so much that the beneficial impact of growth is more than offset by the adverse impact of ris-ing inequality.
In this article, we analyze the effects of growth on poverty in Azerbaijan. This is the first such study on Azerbaijan, and one of the first such analyses within the member countries of the Commonwealth of Independent States (CIS). The effect of growth on poverty is broken down into three factors: growth in average income levels, the sensitivity of poverty to income growth, and changes in the distribution of income. Our analysis reveals that, although economic growth was significant in the past decade, poverty did not decrease in a satisfactory manner. This is because of the low growth of elasticity of poverty with respect to economic growth (0.5 percent, compared with 2–3 percent experienced in other developing countries), and because most of Azerbaijan’s income growth has been enjoyed by the comparatively wealthier segment of the population. Use cross-sectional data from household surveys shows that being involved in agriculture increases the probability of being poor, while employment in other sectors decreases the risk of poverty by various magnitudes. We argue that this can be explained partly by low agricultural productivity, and partly by the low share of salaries in household incomes.
The socioeconomic background of Azerbaijan
From the first years of independence, all formerly countries of the Soviet bloc, including Azerbaijan, have encountered problems of recession and macroeconomic instability. That is why the main objective of all past reforms and policy programs in almost all
OCTOBER 2007 7
post-Soviet countries has been macroeconomic stabilization.However, feeble and superficial efforts during the first stage of
economic reforms had a very negative impact upon Azerbaijan’s economic performance. Gross domestic product (GDP) declined by 13–20 percent annually from 1991 to 1995; real household and wages incomes decreased by 3.6 and 8.2 times, respectively; unemployment resulted form the recession. The recession was accompanied by hyperinflation (inflation peaked at 1,763.5 percent in 1994). All of this led to significant increases in poverty rates. Thus, the poverty rate, the share of the total population living below the poverty line, grew in Azerbaijan from 33 percent in 1989 to 68.1 percent in 1995 (Falkingham, 2005).
Beginning in the mid-1990s, more sustainable economic policies and reforms restrained inflation (since 1996 inflation did not exceed 2.3 percent in Azerbaijan and climbed to 6.7 percent only in 2004), eliminated deficit financing by the National Bank, and reduced the budget deficit to 1.2 percent of GDP within a very short time. As a result of these changes, a country with a paralyzed economy has achieved a certain macroeconomic stability, and progressed toward dynamic economic growth as of 1996. GDP growth reached 1.3 percent in 1996, 5.8 percent in 1997, and averaged 10 percent during 1998–2004. In 2005, GDP growth was 26.4 percent, making Azerbaijan the world leader in growth. However, despite all of these achievements, poverty is still a crucial issue. According to official data, the poverty rate was about 40.2 percent in 2004 and dropped to 29 percent by 2005. The Azerbaijani government acknowledged the gravity of the poverty issue, and endorsed a program called “Poverty Reduction and Economic Development in the Azerbaijan Republic” for 2003–5.2
This confluence of positive economic and negative social outcomes raises the question of whether there is evidence of pro-poor growth in Azerbaijan. Why do poverty rates remain high? Is the effect of economic growth on poverty rates significant in Azerbaijan? We assume that as the Azerbaijan Republic is intensively integrated into the world economy, then world trends in the correlation between economic growth and poverty should

8 PROBLEMS OF ECONOMIC TRANSITION
be present in this country as well. But up to now local (country) experience concerning this issue is not available. All of the above-mentioned issues indicate the topicality and practical importance of this research.
Methodology
In the past few years, the term “pro-poor growth” has become per-vasive in discussions of development policy. However, this concept has been interpreted differently by various researchers. According to Kakwani and Pernia (2000), growth is pro-poor if the accom-panying change in income distribution by itself reduces poverty. Kraay (2004) argues that this definition is rather restrictive, since it implies that, for example, China’s very rapid growth and dramatic poverty reduction during the 1980s and 1990s was not pro-poor because the poor gained relatively less than the nonpoor. According to his view, a broader and more intuitive definition is that growth is pro-poor if the poverty measure of interest falls. According to another, broader definition, growth is said to be pro-poor “when it is labor absorbing and accompanied by policies and programs that mitigate inequalities and facilitate income and employment generation for the poor, particularly women and other traditionally excluded groups” (Asian Development Bank [ADB], 1999). In this article, the term “pro-poor growth” is understood as defined by the ADB (1999) and Kraay (2004).
In the literature, the effects of economic growth on poverty are generally investigated using one of two methods. The first approach is a point estimation of the elasticity of poverty to growth, which provides a measure of the impact of growth on monetary indicators of poverty. The second approach is the estimation of the impact of growth on such nonmonetary welfare indicators of as life expectancy, infant mortality, and educational achievement. The first approach is used in this article because it is simpler and data are more readily available. Poverty is defined by the absolute poverty headcount index, that is, the proportion of the population below a particular poverty line as derived from household survey data.

OCTOBER 2007 9
Admittedly, there are some disadvantages of this measure. One of them is related to the calculation of the poverty threshold. Some emerging economies that use this headcount index calculate the poverty level quite low for political reasons. In this way, they can report lower poverty rates, to the benefit of the incumbent government. Also, almost all countries that use the headcount index measure have their own methods of calculating living standards, which can differ widely. The methodology endorsed by the World Bank also differs from the methodologies of individual countries. Therefore, it is usually not possible or meaningful to compare the headcount indicators of various countries. The main advantage of the headcount index for us is its simplicity. This approach is often more reliable in transition countries because, unlike relative poverty measures, it puts more emphasis on the large share of population under the poverty line (Progress Report, 2005).
According to broader definitions of the term “pro-poor growth” (ADB, 1999 and Kraay, 2004), standard poverty-decomposition techniques can be applied to identify three potential “sources” of pro-poor growth: (1) the high rate of average income growth; (2) the high sensitivity of poverty to average income growth; and (3) the poverty-reducing pattern of growth in relative incomes. In order to identify the significance of the first source of pro-poor growth, we simply track average income growth. The second source of pro-poor growth is analyzed by estimating the growth sensitivity of poverty. Various approaches are available; some are based on the Gini coefficient while others refrain from this measure. The Gini coefficient was omitted from our analysis due to a lack of data. Therefore, our proposed growth-poverty time series model is
log(Pt) = µ + γ log(Wt) + νt (1)
where Wt is per capita income (or per capita GDP) in period t; Pt is poverty measure in period t; and γ is the gross elasticity of poverty reduction to growth. Growth in relative incomes, the third main source of pro-poor growth, is being analyzed by tracking the trend of growth on the income of the first quintile for certain years, and then comparing this trend with the GDP growth trend.

10 PROBLEMS OF ECONOMIC TRANSITION
In our view, estimating the effects of sectoral employment on poverty will shed more light on the nature of pro-poor growth. For this purpose a binary response (probit) model was used. This model estimates the probability of poverty conditional on individual characteristics (in our case, being employed in a certain sector). Let variable Y denote individual poor/nonpoor status (if the ith individual is poor, then Yi = 1, or else Yi = 0). Pi is the probability of being poor for ith period (1 – Pi) is the probability of not being poor; this probability is conditional on individual characteristics (vector Xi). The probit model takes the form
Pi = Prob(Yi = 1|Xi) = F (Xiβ) (2)
where F is the cumulative distribution function of the standard normal distribution. Estimating the probit model is straightforward even though the model is nonlinear and no closed-form expression exists for function F.
The dependent variable of poor/nonpoor status is created based upon the poverty line defined by the Azerbaijani government for 2004. The independent variables determining the probability of individuals being poor/nonpoor are mainly dummy variables such as gender (= 1 if individual is male, 0 if female), education (= 1 if individual has higher education, 0 otherwise), age, sector of employment (= 1 if individual is involved in a certain sector, 0 otherwise). Our interest is directed at the partial effects of the sectoral employment variables; all other variables are introduced as controls for endogeneity. For example, education is supposed to correlate negatively with poverty, but the average education level across sectors is not equal; therefore, omitting this variable would bias our estimates.3
The study of the effects of economic growth on job creation and labor market development is also important in the broader investigation of pro-poor growth. The employment elasticity of output growth is usually measured as the proportionate change in employment divided by the proportionate change in GDP during a given period (see, e.g., Huong, Tuan, and Minh, 2003). However, employment elasticity data should be interpreted with caution. An

OCTOBER 2007 11
elasticity greater than unity implies declining labor productivity, and an elasticity of less than unity means that employment expansion is taking place alongside an increase in productivity. But the distance of the elasticity index from 1 should not be large if we consider economic growth a key factor for employment growth.
Data
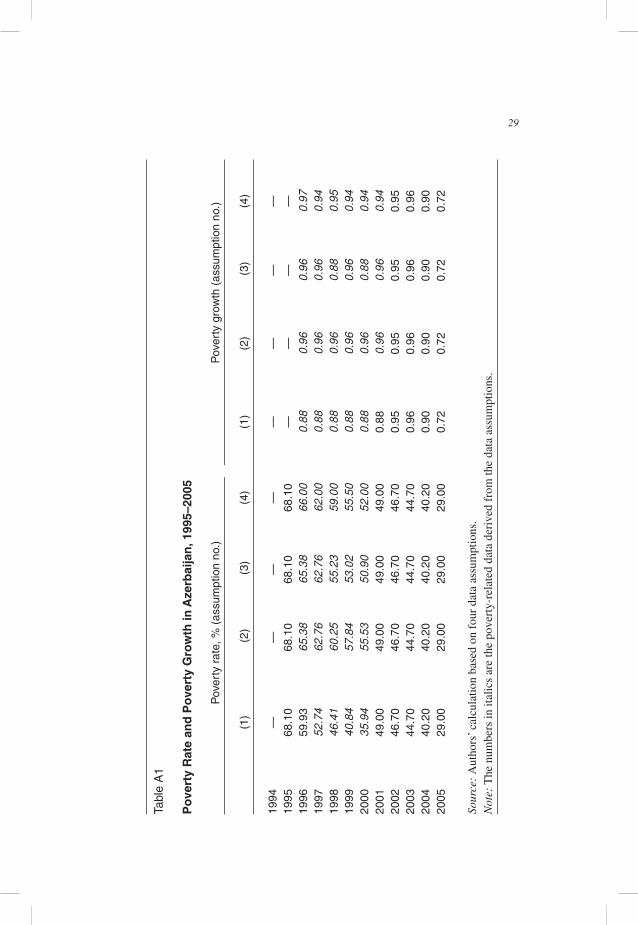
Our data were collected from various sources, including the national statistical office as well as international organizations (World Bank, International Labor Organization, etc.). For estimating the growth elasticity of poverty, the main concern was to obtain sufficient data on poverty rates. It is not possible to get a long time series of reliable statistics concerning poverty rates in Azerbaijan: the State Statistical Committee of the Republic of Azerbaijan began calculating poverty rates only in 2001. For previous years, only a World Bank statistic is available for 1995. We have used alternative assumptions to fill in missing observations for 1996–2000.
Data Assumption 1. The average rate of poverty reduction between 1996 and 2000 is the same as between 2001 and 2005 (12 percent).
Data Assumption 2. The average rate of poverty reduction between 1996 and 2000 is the same as the minimum annual rate between 2001 and 2005 (4 percent).
Data Assumption 3. The poverty reduction rate was taken as 12 percent in the years when the growth rate of GDP was more than 10 percent (in 1998 and 2000); otherwise, a rate of 4 percent was assumed.
Data Assumption 4. The average reduction rate of poverty for 1996–2000 follows a simple linear trend.4
Our study widely utilized cross-sectional data from two household surveys. These provided data for our probit model analyzing the impact of sectoral status on the risk of poverty. The Annual Household Budget Survey (AHBS) of the State Statistical Committee is an annual, cross-sectional survey collecting information about
12 PROBLEMS OF ECONOMIC TRANSITION
demographics, housing, education, health, economic activities, and consumption and expenditure of households. It employs three-stage probability sampling with preliminary stratification by regions and by urban and rural areas. As a rule, each quarter about 2,000 new households participate in the survey, meaning that the total sample contains about 8,000 households per year. Important for the analysis of income poverty and inequality, the survey contains a diary in which daily income and consumption are recorded by participants. In our analysis, we use the 2004 data set, containing records of 33,643 individuals in 8,425 households. The data are weighted to make the survey representative for the overall population of Azerbaijan.
The second survey, conducted by the Caucasus Research Resource Centers (CRRC), is collected within the CRRC Data Initiative Program,5 sponsored by a number of international organi-zations. The program seeks to gather comparable annual data on household economic behavior and social attitudes across the South Caucasus. The questionnaires focus on general characteristics of the household, demography, education, migration, health, political activity, social institutions, crime, and economic behavior. The initiative began in 2004 with surveys in the capital cities of the South Caucasus: Baku, Yerevan, and Tbilisi. In 2005, as a preliminary step, one region of each country was added to the survey in addition to the capital cities. The present study uses data from the 2004 survey.
Estimations of the growth elasticity of poverty
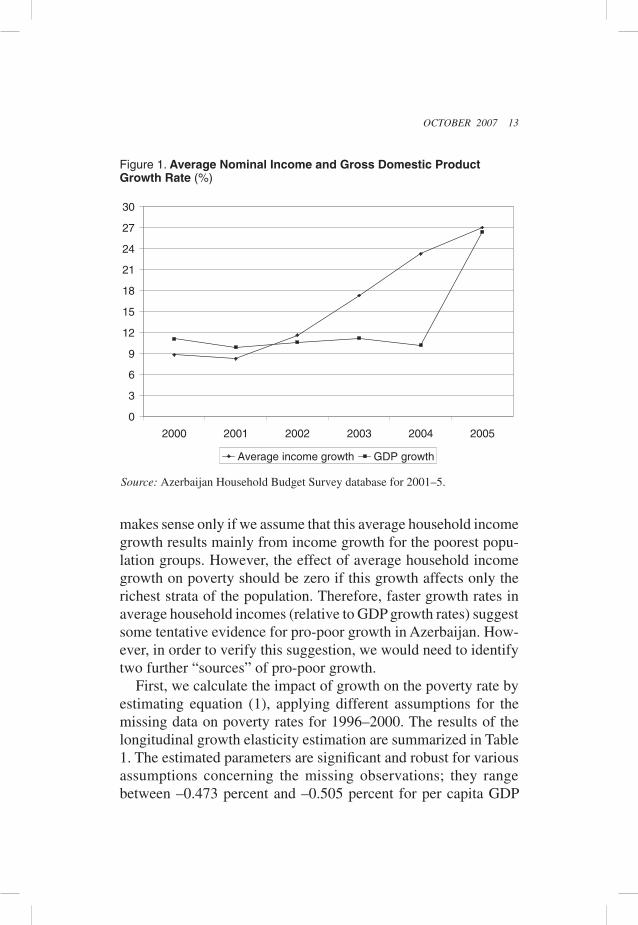
The impact of the first of the main “sources” of pro-poor growth, changes in average nominal household incomes, is illustrated in Figure 1. The figure supports the argument that as of 2002 the trend in household income growth is significantly higher than GDP growth in Azerbaijan. The gap between two types of growth was very large in 2004. But in the last year (2005) the growth rates for household incomes and GDP were almost identical. In general, it may be argued that the effect on pro-poor growth of growth in average household incomes is significant. However, this argument
OCTOBER 2007 13
makes sense only if we assume that this average household income growth results mainly from income growth for the poorest popu-lation groups. However, the effect of average household income growth on poverty should be zero if this growth affects only the richest strata of the population. Therefore, faster growth rates in average household incomes (relative to GDP growth rates) suggest some tentative evidence for pro-poor growth in Azerbaijan. How-ever, in order to verify this suggestion, we would need to identify two further “sources” of pro-poor growth.
First, we calculate the impact of growth on the poverty rate by estimating equation (1), applying different assumptions for the missing data on poverty rates for 1996–2000. The results of the longitudinal growth elasticity estimation are summarized in Table 1. The estimated parameters are significant and robust for various assumptions concerning the missing observations; they range between –0.473 percent and –0.505 percent for per capita GDP
Figure 1. Average Nominal Income and Gross Domestic Product Growth Rate (%)
Source: Azerbaijan Household Budget Survey database for 2001–5.
0
3
6
9
12
15
18
21
24
27
30
2000 2001 2002 2003 2004 2005
Average income growth GDP growth

14 PROBLEMS OF ECONOMIC TRANSITION
Tabl
e 1
Eco
no
mic
Gro
wth
an
d P
ove
rty—
Tim
e-S
erie
s M
od
els
Dep
ende
nt v
aria
ble
Log(
PR
1)
Log(
PR
1)
Log(
PR
2)
Log(
PR
3)
Log(
PR
3)
Log(
PR
4)
Exp
lana
tory
var
iabl
e Lo
g(G
DP
PC
) Lo
g(M
IPC
) Lo
g(G
DP
PC
) Lo
g(G
DP
PC
) Lo
g(M
IPC
) Lo
g(G
DP
PC
)C
oeffi
cien
t (S
.E.)
–0
.473
(0.
031)
* –0
.488
(0.
023)
* –0
.505
(0.
041)
* –0
.486
(0.
040)
* –0
.485
(0.
053)
* –0
.499
(0.
036)
*R
2 0.
962
0.98
1 0.
944
0.94
3 0.
901
0.95
4
Not
e: N
umbe
r of
obs
erva
tions
: 11
(199
5–20
05).
*Sig
nific
ant a
t the
1 p
erce
nt le
vel.
OCTOBER 2007 15
and –0.488 percent and –0.499 percent for household incomes. For example, according to the first data assumption, the growth sensitivity of the poverty rate is –0.47 percent. Thus, a 1 percent increase in real GDP, all other things equal, will lead to a 0.47 percent (and not percentage points) decrease in poverty rate. Under the same data assumption, the impact of a 1 percent growth on average household incomes is a 0.488 percent reduction in poverty rate.
When interpreting the results, it should be kept in mind that the available time series are short and missing data were supplied based on the data assumptions. Still, our tentative argument is that in Azerbaijan a 1 percent increase in GDP per capita causes approximately a 0.5 percent reduction in the poverty rate. This growth elasticity of poverty is very low compared with the experiences of other countries. For instance, in a sample of developing countries, the growth elasticity of poverty was around 3 on average (Ravallion and Chen, 1997). In another analysis of developing countries, this figure was around 2–3 (Wodon, 2000). Our evidence of low growth elasticity in Azerbaijan counters the hypothesis that average income growth has helped in poverty reduction.
The last principal source of pro-poor growth is reductions in income inequalities. In order to explore the effects of reductions in inequalities, we simply compare the growth rates for average household incomes, and for household incomes of the first (lowest) quintile for 2002–4.6 Not only was the growth rate in average household incomes higher than that of the first quintile’s income: this gap even increased, to the detriment of the first quintile (see Figure 2). In other words, although average household incomes grew quite rapidly, a relative decline was observed in the first quintile’s income. This suggests that economic growth during the past decade in Azerbaijan cannot be called pro-poor but, rather, pro-rich.
Sectoral status and poverty
We also investigated the effects of sectoral employment on poverty. While we do not estimate sectoral growth elasticities directly, we can draw stronger inferences from the richer (but solely cross-sectional)

16 PROBLEMS OF ECONOMIC TRANSITION
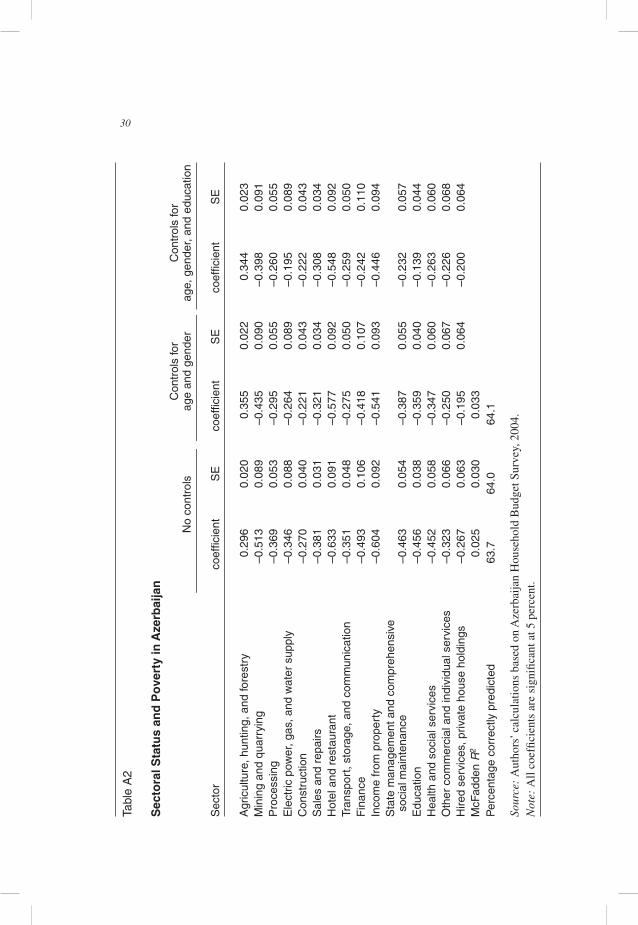
database of the Azerbaijan Household Budget Survey. In our study, the risk of poverty is estimated using sectoral status variables in a probit model. Since employment is endogenous we control for age, gender, and education.
The results are summarized in the Appendix, Table A2. Our estimates are robust to specification in the sense that probit, logit, and linear probability models all yield estimates with the same signs and significance levels. Comparing the three specifications, it is evident that initial estimates were significantly biased and the introduction of the control variables is appropriate. Since we cannot interpret the estimated coefficients of the probit model directly, the marginal effects for all variables (sectors) must be calculated in order to make an appropriate interpretation.7 These marginal effects are shown in Table 2, for forty-year-old educated and uneducated males.
Our results show that the impact of involvement in various sectors
Figure 2. Average Income and First Quintile Income Growth Rate (%)
Source: Authors’ calculations based on the Azerbaijan Household Budget Survey database.
0
2
4
6
8
10
12
14
16
18
20
22
24
2002 2003 2004
Average income growth First quintile income growth

OCTOBER 2007 17
on poverty risk is quite different. There is a single sector, agriculture, whose impact on poverty is negative—that is, employment in agriculture implies a greater risk of poverty. According to the model’s results, the chance for a person to be poor is almost 12 percent higher if he/she works in agriculture. There are several potential explanations for this phenomenon. The first is related
Table 2
Marginal Effects of Sectoral Involvement on Poverty
Controls for age, gender and education
Controls male, for age age forty, male, No and not age forty, Variables controls gender educated educated
Gender — –0.0135 — —Agriculture, hunting, and forestry 0.1108 0.1326 0.1290 0.1067
Mining and quarrying –0.1920 –0.1625 –0.1493 –0.1235Processing –0.1381 –0.1103 –0.0976 –0.0807Electric power, gas, and water supply –0.1296 –0.0986 –0.0732 –0.0605
Construction –0.1012 –0.0825 –0.0833 –0.0689Sales and repairs –0.1424 –0.1199 –0.1154 –0.0955Hotel and restaurant –0.2367 –0.2158 –0.2056 –0.1701Transport, storage, and communication –0.1311 –0.1026 –0.0971 –0.0803
Finance –0.1846 –0.1564 –0.0908 –0.0751Income from property –0.2258 –0.2021 –0.1671 –0.1382State management and comprehensive social maintenance –0.1734 –0.1445 –0.0870 –0.0720
Education –0.1706 –0.1341 –0.0521 –0.0431Health and social services –0.1689 –0.1296 –0.0985 –0.0815Other commercial and individual services –0.1208 –0.0936 –0.0846 –0.0700
Hired services, private house holdings –0.0998 –0.0729 –0.0751 –0.0621
Source: Authors’ calculations based on Appendix Table 2.

18 PROBLEMS OF ECONOMIC TRANSITION
to the labor legislation (General Employment Office, 2002) in Azerbaijan, according to which citizens who own land cannot be considered unemployed. Another cause is the prevalence of in-kind forms of income, particularly in rural areas. Food consumption makes up more than 65 percent of the rural population’s total consumption expenditures, and more than 50 percent of the food consumed by the rural population is home-produced (World Bank, 2005). Another reason is the hidden income of the population, which it is not possible to observe in AHBS data.8 Taking unobserved incomes into account would reduce poverty risk.
Furthermore, we think that low agricultural productivity is another cause of the low effect of agricultural employment on poverty reduction. Although some research finds the relative productivity in agriculture in essential distributional change measures (Kraay, 2004), we argue that the low level of relative labor productivity in the agricultural sector (see more detailed information in Appendix, Table A4) is one of the main reasons for the low pro-poor growth effect of this sector. That is, low labor productivity in this sector does not allow high salaries and this problem leads to high employment instead of high salaries or vice versa. Moreover, one of the main reasons for the low level of productivity observed in the agricultural sector of Azerbaijan could be symptoms of the “Dutch disease” from the labor market point of view (Corden, 1985). That is, the observed decline in a non-oil tradable sector such as agriculture (according to the latest official data, there was a decline in agriculture for nine months of 2006) is a symptom of gigantic oil revenues, which makes the oil sector as well as nontradable sectors more attractive than agriculture.
Table 2 provides suggests that, aside from agriculture, engagement in all other sectors has a positive impact on poverty. Sectors or income sources such as hotels and restaurants, or income from property or the mining and quarrying sector, have higher average positive effects on poverty risk than do others. Thus, a person’s probability of not being poor is correspondingly 23.7, 22.6, and 19.2 percent higher in these sectors. Furthermore, sectors such as finance, state management, education, and health and social

OCTOBER 2007 19
services have a greater than 16 percent positive effect on poverty (18.56, 17.3, 17.1, and 16.9 percent, respectively). Construction, transport, processing, and other sectors have lower positive impacts on poverty.
According to Table 2, education has a small positive effect on poverty: in the case of forty-year-old males, being educated reduces the risk of poverty by only one to three percentage points in various sectors. This surprising result can be explained by two factors. First, the sectoral employment variables may catch most educational effects since the average education levels in individual sectors differ (i.e., there could be multicollinearity in the data). Second, our education variable only catches differences between having or not having higher education. However, it is very likely that the effect of education on poverty is nonlinear: initially every additional year in school should reduce the risk of poverty significantly. But as the educational level increases, the income level also rises (thus, the chance of poverty decreases); therefore, every extra year of education will contribute less to poverty reduction.
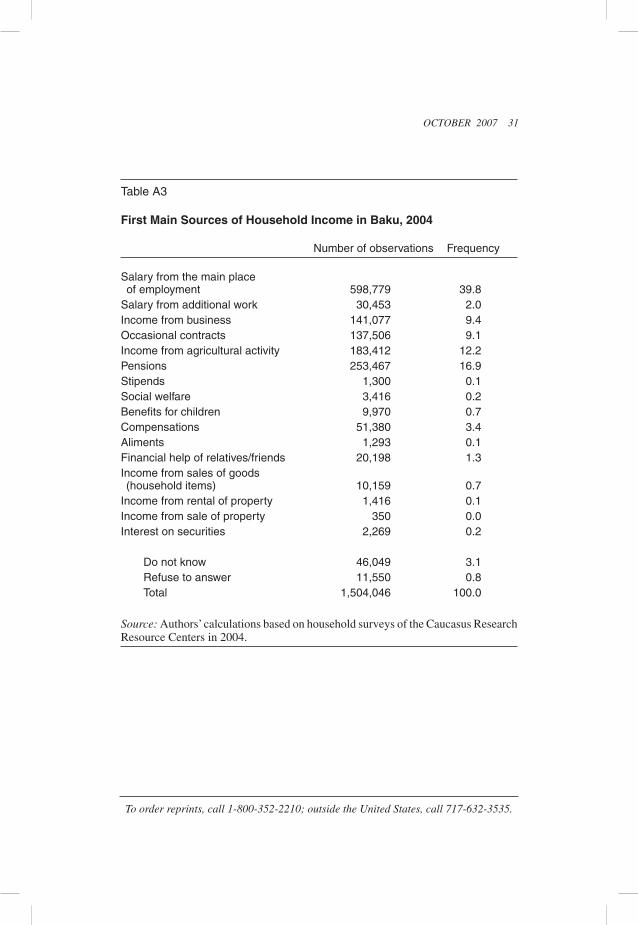
We argue that the impact of sectoral status on poverty in Azerbaijan is directly related to wage and salary levels in these sectors. In 2005, wages and salaries made up approximately 20 percent of average household incomes (Azerbaijan in Figures, 2006). This suggests that the effect of wage/salary incomes on the poverty rate is small. Furthermore, according to International Labor Organization (ILO) figures, in the CIS (of which Azerbaijan is a member), the largest group of employees belongs to the wealthy strata (ILO, 2006). Therefore, the impact of economic growth on poverty in the CIS in general, and in Azerbaijan in particular, is lowest as compared with other regions. The share of poorest employees in total employees was about 2.6 percent in 2005 in CIS countries. Even countries in sub-Saharan Africa report a stronger impact of economic growth on poverty, because of workers’ social structure (56.3 percent of workers belong to the poorest fraction of the sub-Saharan African population). The situation is slightly different in Baku, where wages comprise 40 percent of household incomes (see Appendix Table A3). Besides wages, pensions (16.9
20 PROBLEMS OF ECONOMIC TRANSITION
percent), incomes from agricultural activities (12.2 percent), and from business (9.4 percent) also play a large role in household incomes. The fact that more than 25 percent of the total population lives in Baku suggests that wages play an important role in total household incomes.9 We therefore investigate the impact of sectoral status on household incomes.
The agricultural sector played a dominant role in total employment in the Annual Household Budget Survey for 2004 (see Table 3), accounting for about 37 percent. The second largest employer was the sales and repair sector (13.8 percent). As shown in the table, other important sectors are education (9 percent), construction (8 percent), transport, storage, and communication (5.7 percent), and processing (4.7 percent).
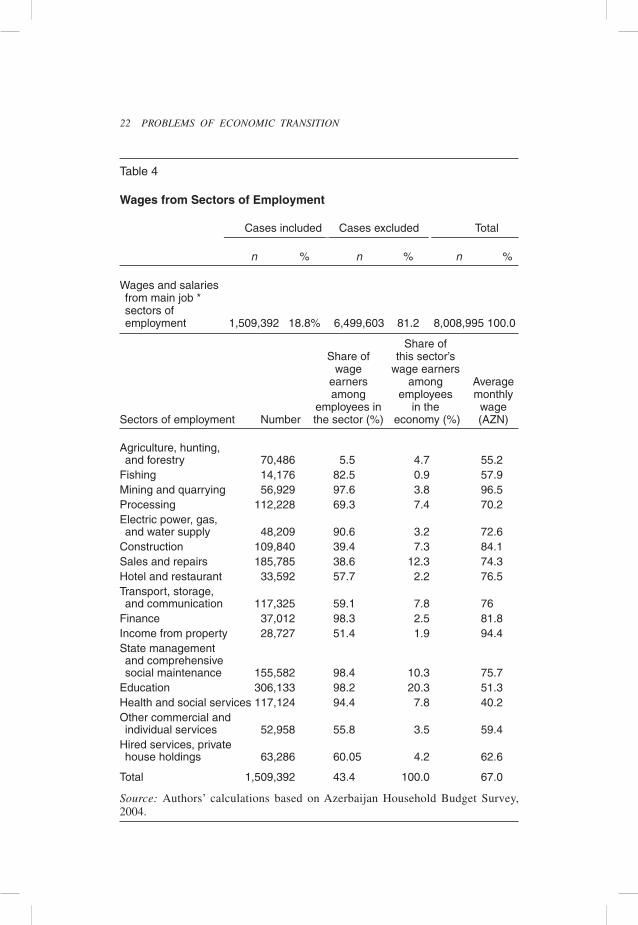
Large differences between sectoral employment and wage levels are apparent. As Table 4 illustrates, only 43.4 percent of total employees earn wage income. This disparity is clearest in agriculture, where only 5.5 percent of employees receive wage incomes. Furthermore, the share of this sector’s salaried employees in total salaried employees is about 4.7 percent. Moreover, average monthly wages in this sector are the third lowest, after the education, health, and social sectors. This is another reason for the negative effect of engagement in agriculture on the risk of poverty. Sales, repair, and construction are other dominant sectors of employment. Interestingly, 38.6 and 39.4 percent of workers earn wages in these two sectors; but their share in total wage earners is correspondingly 12.3 and 7.3 percent. This indicates that these are not labor-intensive sectors.
The data in Table 4 suggest that there are certain sectors in which wages are quite significant. For more than 90 percent of employees who work in (1) state management; (2) health and social services; (3) education; (4) finance; (5) electric power, gas, and water supply; and (6) the mining and quarrying sector, wages are the most important income source. However, the education, state management, health, and social service sectors only accounted for 20.3, 10.3, and 7.8 percent, respectively, of the total number of workers for whom wages were their main income source. The main problem in these sectors were the very low monthly salaries

OCTOBER 2007 21
(particularly in education and health, AZN51.3 and AZN40.2 or US$52 and US$41, respectively).10 We think that this challenge is similar for almost all transition countries, and will take several years to improve.
As mentioned above, for most of the employees working in the mining and quarrying sector and finance, wages are the most
Table 3
Sectors of Employment
Frequency Frequency Number of among among valid observations total (%) answers (%)
Agriculture, hunting, and forestry 1,280,015 16.0 36.8
Fishing 17,172 0.2 0.5Mining and quarrying 58,310 0.7 1.7Processing 16,1946 2.0 4.7Electric power, gas, and water supply 53,200 0.7 1.5
Construction 27,8576 3.5 8.0Sales and repairs 481,045 6.0 13.8Hotel and restaurant 58,231 0.7 1.7Transport, storage, and communication 198,509 2.5 5.7
Finance 37,652 0.5 1.1Income from property 55,844 0.7 1.6State management and comprehensive social maintenance 158,157 2.0 4.6
Education 311,596 3.9 9.0Health and social services 124,017 1.5 3.6Other commercial and individual services 94,882 1.2 2.7
Hired services, private house holdings 105,387 1.3 3.0
Total 3,474,538 43.4 100.0People who did not respond 4,534,457 56.6 —
Total 8,008,995 100.0
Source: Authors’ calculations based on the Azerbaijan Household Budget Survey, 2004.
22 PROBLEMS OF ECONOMIC TRANSITION
Table 4
Wages from Sectors of Employment
Cases included Cases excluded Total
n % n % n %
Wages and salaries from main job * sectors of employment 1,509,392 18.8% 6,499,603 81.2 8,008,995 100.0
Share of Share of this sector’s wage wage earners earners among Average among employees monthly employees in in the wage Sectors of employment Number the sector (%) economy (%) (AZN)
Agriculture, hunting, and forestry 70,486 5.5 4.7 55.2
Fishing 14,176 82.5 0.9 57.9Mining and quarrying 56,929 97.6 3.8 96.5Processing 112,228 69.3 7.4 70.2Electric power, gas, and water supply 48,209 90.6 3.2 72.6
Construction 109,840 39.4 7.3 84.1Sales and repairs 185,785 38.6 12.3 74.3Hotel and restaurant 33,592 57.7 2.2 76.5Transport, storage, and communication 117,325 59.1 7.8 76
Finance 37,012 98.3 2.5 81.8Income from property 28,727 51.4 1.9 94.4State management and comprehensive social maintenance 155,582 98.4 10.3 75.7
Education 306,133 98.2 20.3 51.3Health and social services 117,124 94.4 7.8 40.2Other commercial and individual services 52,958 55.8 3.5 59.4
Hired services, private house holdings 63,286 60.05 4.2 62.6
Total 1,509,392 43.4 100.0 67.0
Source: Authors’ calculations based on Azerbaijan Household Budget Survey, 2004.

OCTOBER 2007 23
important income source (97.6 and 98.3 percent, respectively). However, only 6.2 (3.8 and 2.5 percent, respectively) of total employees work in these sectors. This factor also accounts for the weak nature of pro-poor growth in Azerbaijan.
The key to poverty reduction in Azerbaijan, as in many other transition economies, could be sustainable employment growth, as the positive relationship between economic growth and job creation is not very significant.
As the data in Table 5 show, the average employment elasticity in Azerbaijan is only one third of the world level, and there are some sectors—wholesale and retail trade, the mining and quarrying sector, and manufacturing—in which this elasticity is even lower. However, the fact that services sectors such as education, health and social services, and transport have a dominant role in job creation suggests that we could improve the impact of economic growth on overall employment by developing these sectors. This has also been demonstrated in world practice: economic growth is more likely to create new jobs in countries with higher shares of services in total employment. For instance, in Western Europe and
Table 5
Employment Elasticity in Certain Sectors Average in 2001 2002 2003 2004 2001–2004
Education 0.222 0.547 1.053 0.176 0.500Health and social services 0.234 1.122 0.028 0.170 0.388Transport, storage, and communication 1.056 0.094 0.054 0.096 0.325
Construction 1.009 0.016 0.019 0.026 0.268Agriculture 0.088 0.158 0.179 0.124 0.137Average in the country 0.041 0.068 0.113 0.289 0.128Wholesale and retail trade 0.137 0.112 0.089 0.069 0.102Mining and quarrying 0.051 0.090 0.081 0.049 0.068Manufacturing 0.031 0.028 0.027 0.069 0.039
Source: Authors’ calculations based on the official database of the State Statistical Committee.
24 PROBLEMS OF ECONOMIC TRANSITION
North America, service sectors have experienced the most robust growth—both in terms of value added and employment. Between 1991 and 2003, for every percentage point of growth in the sector, employment increased by 0.57 percent in North America and by 0.62 percent in Western Europe.11 However, in recent years the relationship between economic growth and employment growth has weakened; growth is not automatically translating into new jobs. According to ILO data, the rates of world economic growth and new jobs were 5.1 and 1.7 percent, respectively, in 2004. On the other hand, the ILO biennial study found that for every percentage point of additional GDP growth, total global employment grew by only 0.30 percentage points between 1999 and 2003, a drop from 0.38 percentage points between 1995 and 1999 (International Labor Office, 2006; IDA and IMF, 2005). According to the ILO report, this phenomenon is one of the main barriers to pro-poor growth in the world.
In order to clearly understand the weaknesses of pro-poor growth in Azerbaijan, we should also observe the sectoral structure of economic growth. As Table 6 shows, the largest shares in GDP belong to the mining and quarrying sector, agriculture, and construction. As mentioned above, along with agriculture, employees in these two sectors have a small share in total employment (1.7 percent and 8 percent, respectively). Furthermore, most of these employees are not salaried. A person working in agriculture also has a higher risk of being poor. Thus, the sectors that have grown the most contribute little to new jobs and poverty reduction, while other, higher-wage sectors that play crucial roles in job creation have smaller shares of total GDP.
Conclusions
This article suggests that the effect of economic growth on poverty reduction is not significant in Azerbaijan. The effects of growth in GDP and average household incomes are almost the same: the growth elasticity of poverty is only 0.5 percent (much lower than in other developing countries); while the GDP growth elasticity of

OCTOBER 2007 25
Tabl
e 6
Sh
are
of
Mai
n S
ecto
rs’ C
on
trib
uti
on
to
Gro
ss D
om
esti
c P
rod
uct
an
d G
row
th R
ate
of
Th
ese
Sec
tors
20
01
2002
20
03
2004
sh
are
grow
th
shar
e gr
owth
sh
are
grow
th
shar
e gr
owth
Agr
icul
ture
15
.8
111.
1 14
.2
106.
4 13
.1
105.
6 12
.1
108.
1M
inin
g an
d qu
arry
ing
28.6
12
0.8
27.5
11
1.1
29.8
11
2.4
30.5
12
0.3
Man
ufac
turin
g 4.
1 13
1.8
5.8
136
.9
9.3
137
9.2
115.
4C
onst
ruct
ion
6.2
101
10.8
17
0 12
.1
151.
9 13
.5
141.
2S
ales
and
pai
d se
rvic
es
7.9
107.
7 7.
5 10
8.3
7.9
111.
3 8.
0 11
4.7
Tran
spor
t and
com
mun
icat
ion
10.9
95
9.
8 11
0.8
9.5
119.
5 9.
5 11
1.2
Edu
catio
n 4.
9 10
4.5
4.4
101.
9 3.
5 94
.7
3.2
105.
7H
ealth
and
soc
ial s
ervi
ces
1.8
104.
3 1.
5 90
.6
1.7
136.
4 1.
5 10
5.9
Sour
ce:
Aut
hors
’ cal
cula
tions
bas
ed o
n th
e of
ficia
l dat
abas
e of
Sta
te S
tatis
tical
Com
mitt
ee.

26 PROBLEMS OF ECONOMIC TRANSITION
poverty is much higher than the growth elasticity for income of the poorest quintile. The effect of wages on total household incomes is not high either. Thus, attempts to solve the poverty problem in the country by increasing wages are potentially problematic.
While the impact of sectoral status on poverty reduction differs by sector, such sectors or sources of income as hotels and restaurants, income from property, and the mining and quarrying sector have a stronger positive effect on poverty reduction than others. Thus, the probability of a person not being poor is 23.7 percent, 22.6 percent, and 19.2 percent, respectively, higher in the mentioned sectors. Only the agricultural sector plays a negative role in poverty reduction: a person is almost 12 percent more likely to be poor if he/she works in agriculture. The effects of wages on total household incomes are higher in Baku city (the capital of Azerbaijan) than in the whole country. There is a large difference between sectors of employment and wages earned in these sectors. Only 43.4 percent of total employees earn wage incomes. This tendency is particularly pronounced strongly in agriculture: only 5.5 percent of agricultural employees receive income in the form of wages; and the share of this sector’s salaried employees in total salaried employees is about 4.7 percent. Disparities are also apparent in wage structures in the sale and repairs, and construction sectors: whereas 38.6 percent and 39.4 percent of employees respectively in these two sectors receive salaries, wage earners in these sectors comprise only 12.3 percent and 7.3 percent, respectively, of total salaried employment. By contrast, more than 90 percent of workers in the following sectors earn their incomes mainly as salary: (a) state management; (b) health and social services; (c) education; (d) finance; (e) electric power, gas, and water supply; and (f) the mining and quarrying sector. However, in education, state management, and health and social services, employees’ shares in total salaried employees are 20.3 percent, 10.3 percent, and 7.8 percent. Whereas most of those who work in the mining and quarrying sector and finance earn their income in salary form (97.6 percent and 98.3 percent, respectively), total employment in these two sectors is not significant: only 6.2 (3.8 percent and 2.5 percent, respectively) of total employees work in these sectors.

OCTOBER 2007 27
Likewise, although the main GDP shares belong to the mining and quarrying, agriculture, and construction sectors, employees in the mining and quarrying and construction sectors have a small share in total employment (1.7 percent and 8 percent, respectively).
Sectors that play a crucial role in job creation as well as in wage incomes do not have a significant share in total GDP. Thus, it can be argued that, because of the dominant share and high growth in the contribution of the oil sector (manufacturing industry) to total GDP, on the one hand, and this sector’s small share of employment on the other, macroeconomic growth has no significant effect on new jobs.
Based on the employment elasticity index, the education, health and social services, and transport sectors play a dominant role in job creation. Economic growth could therefore acquire a more pro-poor character if these sectors were further developed.
Notes
1. For the example of Indonesia, see Bourguignon (2004).2. Today the government of Azerbaijan is preparing a new strategy called
“Poverty Reduction and Sustainable Development” for 2006–15.3. Our model is similar to a standard wage equation, but instead of estimat-
ing wages, we estimate whether income levels reach a threshold (the poverty level). We chose this approach mainly because nonsalaried forms of income (e.g., payments in kind, transfers, etc.) are important for a large portion of the population.
4. See the outcomes of all four assumptions in Appendix Table A1.5. See www.crrc.az/index.php/en/41/28/.6. This approach has been applied in Vietnam by Huong, Tuan, and Minh
(2003).7. This method is readily available in most econometric textbooks. See, for
example, Wooldridge (2002).8. This reason should be same for almost all sectors.9. According to unofficial information, some portion of the population who
are registered in various regions of the country do not live there because of unem-ployment problems. Most of them unofficially live in the capital or in neighboring countries, particularly in Russia. This fact strengthens our argument.
10. Based on the exchange rate for 2004 of US$1 = AZN0.98 (National Ac-counts of Azerbaijan, 2005).
11. For further information see www.ilo.org/public/english/bureau/inf/pr/2005/ 48.htm.
28 PROBLEMS OF ECONOMIC TRANSITION
References
Asian Development Bank (ADB). 1999. “Fighting Poverty in Asia and the Pacific: the Poverty Reduction Strategy.” Manila.
Azerbaijan in Figures. 2006. Statistical issue, State Statistical Committee of the Republic of Azerbaijan, Official Publication.
Bourguignon, F. 2004. “The Poverty-Growth-Inequality Triangle.” Paper presented at the Conference on Poverty, Inequality, and Growth, Agence Française de Développement/EU Development Network, Paris.
Corden, M. 1985. Protection, Growth and Trade: Essays in International Eco-nomics. Oxford: Blackwell.
Falkingham, J. 2005. “The End of the Rollercoaster? Growth, Inequality and Poverty in Central Asia and the Caucasus.” Social Policy & Administration, vol. 39, no. 4, pp. 340–60.
General Employment Office. 2002. The Collection of Normative Documents on Employment. Baku: Azerbaijan National Encyclopedia.
Huong, P.; B. Tuan; and D. Minh. 2003. “Employment Poverty Linkages and Policies for Pro-Poor Growth in Vietnam.” Recovery and Reconstruction Department, International Labour Office, Geneva.
International Development Association (IDA) and International Monetary Fund (IMF). 2005. Joint Staff Advisory Note on the State Program on Pov-erty Reduction and Economic Development in the Republic of Azerbaijan.
International Labor Office. 2006. Global Employment Trends, BRIEF.Kakwani, N., and E. Pernia. 2000. “What Is Pro-Poor Growth?” Asian Devel-
opment Review, vol. 18, no. 1.Kraay, A. 2004. “When Is Growth Pro-Poor? Cross-Country Evidence.” IMF
working paper WP/04/47.National Accounts of Azerbaijan, 1995–2004. 2005. Statistical issue, State
Statistical Committee of the Republic of Azerbaijan, Official Publication.Qutman, G.; O. Digilina; B. Starostin; and N. Chukin. 2002. Economic Growth
and Poverty Problems in the Region. Moscow: Dashkov (in Russian).Ravallion, M., and S. Chen. 1997. “What Can New Survey Data Tell Us About
Recent Changes in Distribution and Poverty?” World Bank Economic Review, vol. 11, no. 2, pp. 357–82.
United Nations Development Programme. 2005. “Azerbaijan’s State Program on Poverty Reduction and Economic Development.” Progress Report.
Wodon, Q. 2000. “Poverty and Policy in Latin America and the Caribbean.” World Bank Technical Paper 467. Washington, DC.
Wooldridge, J. 2002. Econometric Analysis of Cross-Section and Panel Data. Cambridge, MA: MIT Press.
World Bank. 2005. “Study of Agricultural Markets in Azerbaijan.” Final report. Baku, Azerbaijan.
Appendix follows.
OCTOBER 2007 29
Tabl
e A
1
Po
vert
y R
ate
and
Po
vert
y G
row
th in
Aze
rbai
jan
, 199
5–20
05
P
over
ty r
ate,
% (
assu
mpt
ion
no.)
P
over
ty g
row
th (
assu
mpt
ion
no.)
(1
) (
2)
(3)
(4
) (1
) (2
) (
3)
(4)
1994
—
—
—
—
—
—
—
—
1995
68
.10
68.1
0 68
.10
68.1
0 —
—
—
—
1996
59
.93
65.3
8 65
.38
66.0
0 0.
88
0.96
0.
96
0.97
1997
52
.74
62.7
6 62
.76
62.0
0 0.
88
0.96
0.
96
0.94
1998
46
.41
60.2
5 55
.23
59.0
0 0.
88
0.96
0.
88
0.95
1999
40
.84
57.8
4 53
.02
55.5
0 0.
88
0.96
0.
96
0.94
2000
35
.94
55.5
3 50
.90
52.0
0 0.
88
0.96
0.
88
0.94
2001
49
.00
49.0
0 49
.00
49.0
0 0.
88
0.96
0.
96
0.94
2002
46
.70
46.7
0 46
.70
46.7
0 0.
95
0.95
0.
95
0.95
2003
44
.70
44.7
0 44
.70
44.7
0 0.
96
0.96
0.
96
0.96
2004
40
.20
40.2
0 40
.20
40.2
0 0.
90
0.90
0.
90
0.90
2005
29
.00
29.0
0 29
.00
29.0
0 0.
72
0.72
0.
72
0.72
Sour
ce:
Aut
hors
’ cal
cula
tion
base
d on
fou
r da
ta a
ssum
ptio
ns.
Not
e: T
he n
umbe
rs in
ital
ics
are
the
pove
rty-
rela
ted
data
der
ived
fro
m th
e da
ta a
ssum
ptio
ns.
30 PROBLEMS OF ECONOMIC TRANSITIONTa
ble
A2
Sec
tora
l Sta
tus
and
Po
vert
y in
Aze
rbai
jan
Con
trol
s fo
r C
ontr
ols
for
N
o co
ntro
ls
age
and
gend
er
age,
gen
der,
and
educ
atio
n
Sec
tor
co
effic
ient
S
E
coef
ficie
nt
SE
co
effic
ient
S
E
Agr
icul
ture
, hun
ting,
and
fore
stry
0.
296
0.02
0 0.
355
0.02
2 0.
344
0.02
3M
inin
g an
d qu
arry
ing
–0.5
13
0.08
9 –0
.435
0.
090
–0.3
98
0.09
1P
roce
ssin
g –0
.369
0.
053
–0.2
95
0.05
5 –0
.260
0.
055
Ele
ctric
pow
er, g
as, a
nd w
ater
sup
ply
–0.3
46
0.08
8 –0
.264
0.
089
–0.1
95
0.08
9C
onst
ruct
ion
–0.2
70
0.04
0 –0
.221
0.
043
–0.2
22
0.04
3S
ales
and
rep
airs
–0
.381
0.
031
–0.3
21
0.03
4 –0
.308
0.
034
Hot
el a
nd r
esta
uran
t –0
.633
0.
091
–0.5
77
0.09
2 –0
.548
0.
092
Tran
spor
t, st
orag
e, a
nd c
omm
unic
atio
n –0
.351
0.
048
–0.2
75
0.05
0 –0
.259
0.
050
Fin
ance
–0
.493
0.
106
–0.4
18
0.10
7 –0
.242
0.
110
Inco
me
from
pro
pert
y –0
.604
0.
092
–0.5
41
0.09
3 –0
.446
0.
094
Sta
te m
anag
emen
t and
com
preh
ensi
ve
soci
al m
aint
enan
ce
–0.4
63
0.05
4 –0
.387
0.
055
–0.2
32
0.05
7E
duca
tion
–0.4
56
0.03
8 –0
.359
0.
040
–0.1
39
0.04
4H
ealth
and
soc
ial s
ervi
ces
–0.4
52
0.05
8 –0
.347
0.
060
–0.2
63
0.06
0O
ther
com
mer
cial
and
indi
vidu
al s
ervi
ces
–0.3
23
0.06
6 –0
.250
0.
067
–0.2
26
0.06
8H
ired
serv
ices
, priv
ate
hous
e ho
ldin
gs
–0.2
67
0.06
3 –0
.195
0.
064
–0.2
00
0.06
4M
cFad
den
R2
0.02
5 0.
030
0.03
3
P
erce
ntag
e co
rrec
tly p
redi
cted
63
.7
64.0
64
.1
Sour
ce:
Aut
hors
’ cal
cula
tions
bas
ed o
n A
zerb
aija
n H
ouse
hold
Bud
get S
urve
y, 2
004.
Not
e: A
ll co
effic
ient
s ar
e si
gnifi
cant
at 5
per
cent
.
OCTOBER 2007 31
Table A3
First Main Sources of Household Income in Baku, 2004
Number of observations Frequency
Salary from the main place of employment 598,779 39.8Salary from additional work 30,453 2.0Income from business 141,077 9.4Occasional contracts 137,506 9.1Income from agricultural activity 183,412 12.2Pensions 253,467 16.9Stipends 1,300 0.1Social welfare 3,416 0.2Benefits for children 9,970 0.7Compensations 51,380 3.4Aliments 1,293 0.1Financial help of relatives/friends 20,198 1.3Income from sales of goods (household items) 10,159 0.7
Income from rental of property 1,416 0.1Income from sale of property 350 0.0Interest on securities 2,269 0.2 Do not know 46,049 3.1 Refuse to answer 11,550 0.8 Total 1,504,046 100.0
Source: Authors’ calculations based on household surveys of the Caucasus Research Resource Centers in 2004.
To order reprints, call 1-800-352-2210; outside the United States, call 717-632-3535.
Copyright © 2022 FDOKUMEN