Promoting Excellence in Preparation and Excellence in Practice
294
Volume XXX, Number 1. Winter 2004 Promoting Excellence in Preparation and Excellence in Practice A refereed publication of The International Honor Society for Professions in Technology
-
Upload
khangminh22 -
Category
Documents
-
view
0 -
download
0
Transcript of Promoting Excellence in Preparation and Excellence in Practice
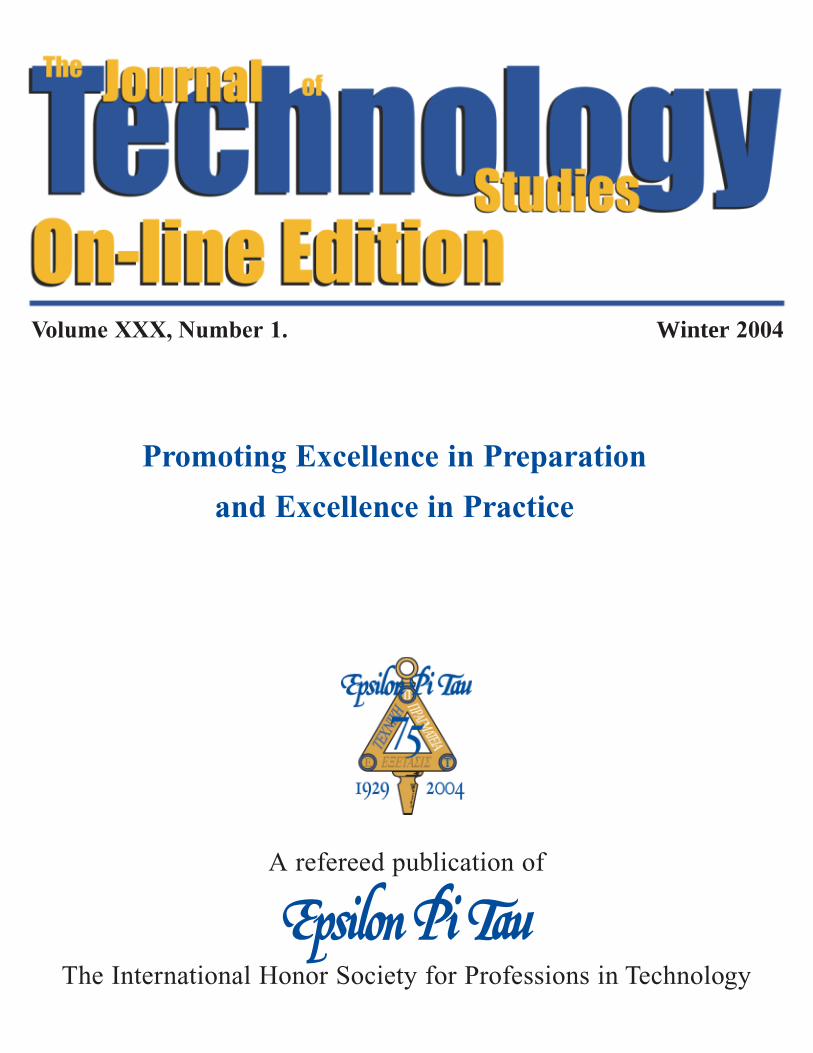
Volume XXX, Number 1. Winter 2004
Promoting Excellence in Preparation
and Excellence in Practice
A refereed publication of
The International Honor Society for Professions in Technology
PublisherJerry Streichler
EditorDennis Cheek
Board of Editors
E. Stephanie AtkinsonUniversity of SunderlandSchool of EducationHammerton Hall, Gray Rd.Sunderland, U.K. [email protected]
Wan-Lee ChengDepartment of Design and IndustrySan Francisco State University1600 Holloway Ave.San Francisco, CA 94132415.338.2211fax: [email protected]
David DevierUniversity of CincinnatiClermont College4200 Clermont College DriveBatavia, OH 45103513.732.5209fax: [email protected]
Michael J. DyrenfurthDepartment of Industrial TechnologyPurdue University1410 Knoy Hall, Room 461West Lafayette, IN 47907-1410765.496.1203fax: [email protected]
Marie KraskaEducational Foundations, Leadership,and TechnologyAuburn University4036 Haley CenterAuburn University, AL 36849-5221334.844.4460fax: [email protected]
Linda Rae Markert200 Poucher HallState University of New Yorkat OswegoOswego, NY [email protected]
Howard E. MiddletonSchool of Vocational Technologyand Arts EducationFaculty of EducationGriffith UniversityNathan 4111 QueenslandAustralia61.7.3875.5724fax: [email protected]
Sam C. ObiDepartment of TechnologySan Jose State UniversityOne Washington SquareSan Jose, CA 95192-0061408.924.3218fax: [email protected]
Christopher J. Shelley CMfgEW. L. Gore & Associates705 Guido Dr.Middletown, DE [email protected]
Xeushu SongDepartment of TechnologyNorthern Illinois UniversityDekalb, IL 60115-2854815.753.1349fax: [email protected]
David Devier(representing the Board of Directors)
Staff for this IssueEditorialConsultantsNancy HooseSeth A. Streichler
Office ManagerSusan Pickens
Art & LayoutKnape Designs
The Journal of Technology Studies (JTS) (ISSN 1071-6048) is the flagship, peer-reviewed journal of Epsilon Pi Tau, Inc, a nonprofit, academic and professional honorsociety. Headquarters and editorial offices are located at the Technology Building,Bowling Green State University, Bowling Green, OH 43403-0305. Use this address [email protected] for subscription matters or purchases.
Copyright 2004 by Epsilon Pi Tau, Inc.
The opinions expressed by the journal’s authors are not necessarily those of the Boardof Directors, staff, or members of Epsilon Pi Tau.
Two print issues per year are mailed to all members of the society and to academic andgeneral libraries around the globe. Issues that are published on-line only, the aforemen-tioned printed issues, and past issues are available free online at scholar.lib.vt.edu/ejour-nals/JTS.
The journal is currently indexed in: Current Index to Journals of Education (USA);International Bibliography of the Social Sciences (IBSS) (UK); and the InternationalVocational Education and Training and Research Database at http://www.ncver.edu.au(Australia).
Separate articles or complete issues are also available in a variety of media forms from:
ProQuest Information and Learning Co., P.O. Box 1346, Ann Arbor, MI 48106-1346
Or EBSCO Publishing, 10 Estes Street, Ipswich, Massachusetts, 01938-0682, USA
The JTS welcomes original manuscripts from scholars worldwide focused on the depthand breadth of technology as practiced and understood past, present, and future. EpsilonPi Tau, as perhaps the most comprehensive honor society among the technology profes-sions, seeks to provide up-to-date and insightful information to its increasingly diversemembership as well as the broader public. Authors need not be members of the societyin order to submit manuscripts for consideration. Contributions from both academicsand practitioners are equally welcome.
A general guide to the breadth of topics of potential interest to our readers can be gainedby consideration of the 17 subclasses within “Technology” of the classification schemeof the Library of Congress, USA <lcweb.loc.gov/catdir/cpso/lcco/lcco_t.pdf>. Thisincludes engineering and allied disciplines, informatics in its many manifestations,industrial technology, and education in and about technology.
Authors are strongly urged to consult the journal’s “Guidelines for Authors,” included inthis publication, or available at the society’s website or provided upon request. It providesadditional details on the breadth and nature of topics of interest, the journal’s scholarlywriting standards, submission guidelines, and review and publication processes.
Printed in the United States of America by Kennedy Printing Company, Findlay Ohio.
Board of Directors
Region 1 (The nations of Europe, theEastern Provinces of Canada, and theNortheastern United States)Dr. Marvin SarapinDepartment of TechnologyKean UniversityUnion, NJ 07083908.737.3500fax: [email protected]
Region 2 (The nations of Africa, theCaribbean Islands, and theSoutheastern United States)Robert E. WenigDepartment of Mathematics, Science, &Technology EducationBox 7801North Carolina State UniversityRaleigh, NC 27695-7801919.515.1742fax: [email protected]
Region 3 ( All members-at-large, theCanadian Province of Ontario, and theNorth Central United States)David DevierUniversity of Cincinnati, Clermont College4200 Clermont College DriveBatavia, OH 45103513.732.5209fax: [email protected]
Region 4 (The nations of Central andSouth America, the Northern Territoryand Central Provinces of Canada, andthe Central United States)Kennard G. LarsonDept. of Industrial TechnologyUniversity of Nebraska at Kearney905 West 25th StreetKearney, NE 68849308.865.8504fax: [email protected]
Region 5 (Australia, the island nationsof the Pacific and Indian Oceans, thenations of Asia, the Yukon Territoryand Western Provinces of Canada, andthe Western United States)James EdwardsDepartment of Design & IndustrySan Francisco State University1600 Holloway AvenueSan Francisco, CA 94132415.338.7896fax: [email protected]
Associate Executive Director for Information and CommunicationDr. Dennis CheekJohn Templeton Foundation5 Radnor Corp. Ctr., Suite 100Radnor, PA 19087610.687.8942fax: [email protected]
Associate Executive Director forCommunity and Technical CollegesJerry C. OlsonTechnology BuildingBowling Green State UniversityBowling Green, Ohio 43403419.372.0378fax: [email protected]
Associate Executive Director forInternational AffairsMichael DyrenfurthSchool of TechnologyPurdue UniversityRoom 461, Knoy HallWest Lafayette, IN 47907-1410765.496.1203fax: [email protected]
Executive DirectorJerry StreichlerTechnology BuildingBowling Green State UniversityBowling Green, Ohio 43403419.372.2425fax: [email protected]
A refereed publication of The International Honor Society for Professions in Technology.
The Journal of Technology Studies

1
ARTICLES
2 Standards: Mathematicsand Science Compared ToTechnological LiteracyBy Franzie L. Loepp
10 A Model for Unified Scienceand TechnologyBy Roy Q. Beven and Robert A. Raudebaugh
16 Technology EducationVersus Liberal Arts Education?By Oscar Plaza
19 Defining the Role ofTechnology Education by Its Heart and Its HeritageBy Mark S. Snyder
27 Quality-Based Cooperative Technical Teacher TrainingBy László Kadocsa andImre Kopp•ny
32 Outcomes Assessment:A Pilot StudyBy Bill Drake and Douglas Walcerz
39 Electronic Course Delivery in Higher Education:Promise and ChallengeBy John W. Sinn
46 Factors Influencing Participation in TechnologyEducation Graduate StudiesBy George E. Rogers and Phillip L. Cardon
53 Thinking About Technology Effects on Higher EducationBy Mohammed F. Fahmy
59 Leadership Knowledge and Skill: An Enabler for Successas a Technology EducationTeacher-LeaderBy Robert E. Wenig
Table of ContentsVolume XXX, Number 1, Spring/Summer 2004
Standards for Technological Literacy:
Content for the Study of Technology was
released in April 2000 by the International
Technology Education Association (ITEA,
2000). This was the first attempt by the ITEA to
set forth comprehensive specifications regarding
what students should know and be able to do
within each of four grade bands from kinder-
garten through 12th grade. The purpose of this
article is to compare the technological literacy
standards with those that have been developed
for preK–2 in mathematics (National Council of
Teachers of Mathematics [NCTM], 2000) and
K–12 in science (National Research Council
[NRC], 1996).
Developmental Process In some ways the development of standards
in the three disciplines was similar. The main
reason is that other disciplines appear to have
used components of the developmental process
used by the NCTM. All three disciplines relied
heavily on working groups to develop draft stan-
dards. They sought input from teachers, teacher
educators, and professionals in their respective
disciplines. Drafts of the documents were
reviewed by large numbers of practitioners, and
their input was used to make revisions (Dugger,
2001). By its very nature the developmental
process became somewhat political. For exam-
ple, Dr. John Dossey1 said that while the major-
ity of the leaders in the discipline favored a
stronger emphasis on content in statistics, prob-
ability, and discrete mathematics, others feared
inclusion of new content would detract from
traditional mathematics. In the development of
science standards, leaders in the subdisciplines
of biology, chemistry, physics, and geology were
not convinced that a single set of standards
could possibly give their area of study adequate
coverage.2 In technology, persons from the dis-
cipline tended to want a long list (200+) of
rather specific standards, whereas the advisory
committee, made up of professionals from other
disciplines, particularly science and engineering,
strongly advised a shorter, more manageable
number.3 Nevertheless, each discipline’s profes-
sional organization did publish a set of stan-
dards. Short descriptions of the processes used
to develop content standards are provided below.
Technology EducationThe development of the standards for tech-
nological literacy actually began in 1994 when
the Technology for All Americans Project
(TfAAP) funded by the National Science
Foundation and NASA began to develop a
Rationale and Structure for the Study of
Technology (TfAAP, 1996). Based on this
document, additional funding was received to
write standards for technology education. A
“standards team” made up of three groups (one
for grades K–2 and 3–5; one for 6–8; and one
for 9–12) was formed to write content standards.
The standards team was mostly made up of tech-
nology education teachers plus a few administra-
tors and teacher educators. These groups met
periodically from 1996 through 1999, writing six
drafts of the standards. The TfAAP staff refined
each draft and conducted many regional reviews
along with electronic reviews. A special advisory
group consisting of leaders in technology educa-
tion, engineering, mathematics, and science
reviewed draft documents and provided valuable
feedback. The NRC’s standards review commit-
tee, the National Academy of Engineering spe-
cial review committee, a National Academy of
Engineering focus group, The National
Commission for Technology for Education and
elementary, middle, and high school field test
sites, and hundreds of technology education
teachers reviewed drafts of the document. A pro-
fessional writer was hired to write the finished
document that was published. See Table 1 for a
listing of the Standards for Technological
Literacy (ITEA, 2000). The leaders of the
TfAAP are to be commended for managing this
complex process (ITEA, 2000).
MathematicsIn 1986, the board of directors of the
NCTM established the commission on standards
Th
e J
ou
rna
l o
f Te
ch
no
log
y S
tud
ies
Articles Standards: Mathematics and ScienceCompared To Technological LiteracyBy Franzie L. Loepp
2

Th
e J
ou
rna
l of Te
ch
no
log
y Stu
die
s
for school mathematics to improve the quality
of school mathematics. As a result of the com-
mission’s efforts, standards were drafted during
the summer of 1987 and revised during the
summer of 1988. Four working groups appoint-
ed by the president of NCTM outlined the draft
documents. Each group represented mathemat-
ics educators, including classroom teachers,
supervisors, educational researchers, teacher
educators, and university mathematicians. All
work was authorized and reviewed by the
commission. In 1989 the Curriculum and
Evaluation Standards for School Mathematics
was published and widely disseminated
(NCTM, 1989).
Three years after the standards were
published, leaders in NCTM noted that many in
their profession thought their identification of
content in mathematics was too progressive so
they appointed the commission of the future of
the standards in 1995 to monitor and review the
1989 standards. By spring 1997, a Standards
2000 writing group and a Standards 2000 elec-
tronic format group were appointed, each
consisting of teachers, teacher educators,
administrators, researchers, and mathemati-
cians. Their primary work was carried out in
sessions during the summers of 1997 through
1999. The background information for these
sessions was obtained or supported by such
groups as Eisenhower National Clearinghouse,
the NRC, the National Science Foundation, and
NCTM’s research advisory committee. Over
the course of the development of Standards
2000, 14 association review groups were
formed to provide sustained advice and infor-
mation regarding K–12 mathematics consistent
with their organization’s perspective. In
October 1998, a draft version of the standards
was available in print and electronic forms for
review. Twenty-five people from a wide range
of backgrounds were commissioned to carefully
review the draft from their individual perspec-
tive. Comprehensive reviews were conducted by
more than 650 individuals and more than 70
groups. Nearly 30,000 copies of the draft were
provided to interested persons, and thousands
accessed the electronic copy. These data were
synthesized and provided to a writing group
which produced the final document that was
disseminated as Principles and Standards for
School Mathematics in April 2000 (NCTM,
2000). See Table 2 for a listing of the content
standards for mathematics.
ScienceThe success of standards in mathematics as
well as Project 2061, sponsored by the
American Association for the Advancement of
Science (AAAS, 1993), caused leaders in
science education to initiate the development of
national science education standards. The
National Science Teachers Association (NSTA)
board requested the NRC to coordinate this
important task. The U.S. Department of
Education and the National Science Foundation
provided major funding for this effort. An
oversight group, National Committee on
Science Education Standards and Assessment
(NCSESA), was established. A chairperson was
selected and a chair’s advisory committee was
3
Table 1. Standards for Technological Literacy
Nature of Technology1. The characteristics and scope of technology2. The core concepts of technology3. The relationships among technologies and the
connections between technology and other fields.Technology and Society
4. The cultural, social, economic, and political effects of technology
5. The effects of technology on the environment6. The role of society in the development and
use of technology7. The influence of technology on history
Design8. The attributes of design9. Engineering design
10.The role of trouble-shooting, research and develop-ment, invention and innovation, and experimentation and problem solving
Abilities for a Technological World11. Apply the design process12. Use and maintain technological products and systems
The Designed World14. Medical technologies15. Agricultural and related bio-technologies16. Energy and power technologies17. Information and communication technologies18. Transportation technologies19. Manufacturing technologies20. Construction technologies
Source: ITEA, 2000, pp. 211-214.

Th
e J
ou
rna
l o
f Te
ch
no
log
y S
tud
ies
formed with representation from at least eight
professional organizations. This group helped to
identify and recruit staff and volunteers for the
committees and three working groups (content,
teaching, and assessment). Over an 18-month
period, input on standards was received from a
large number of teachers, scientists, science
educators, and other interested parties. Many
presentations were made to foster discussion on
standards within the discipline. Then a predraft
of science content, teaching, professional devel-
opment, program, and system standards were
written and critiqued by selected focus groups.
The suggestions received were collated and ana-
lyzed, revisions were made, and a document was
prepared for public release and review.
Approximately 18,000 individuals and 250
groups reviewed this edition. The comments
received were again collated, analyzed, and used
to prepare the final publication of the National
Science Education Standards (NRC, 1996).
Table 3 includes the science content standards.
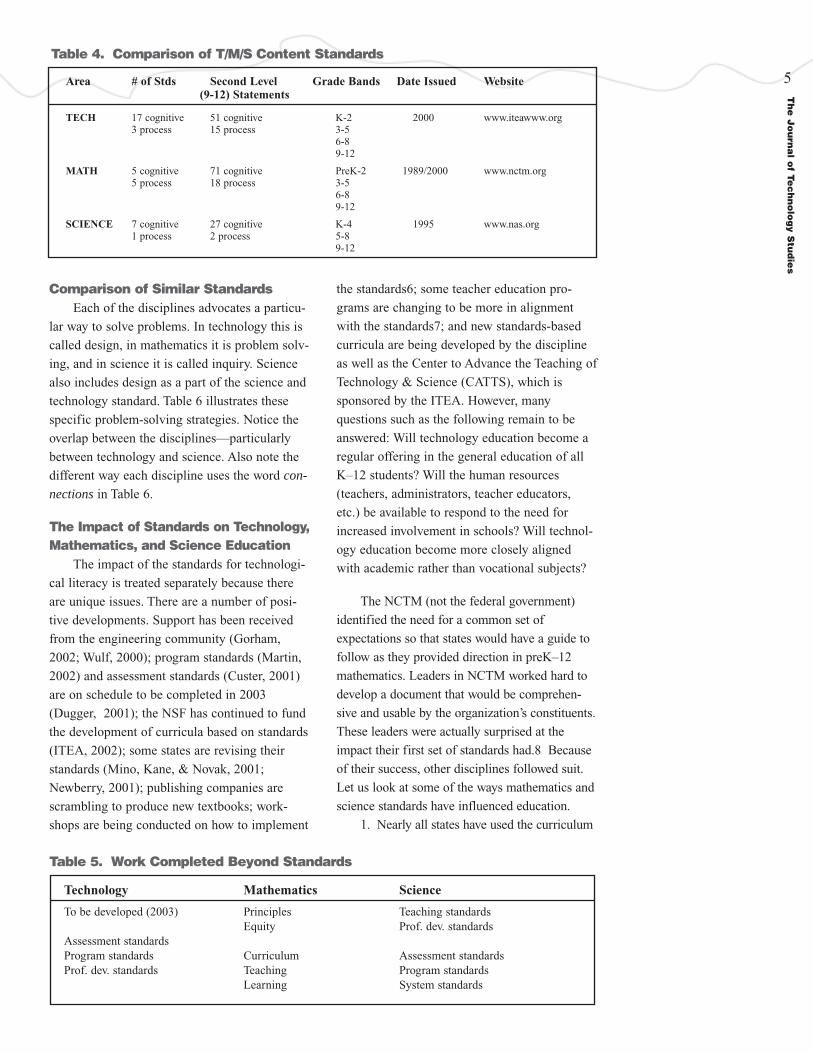
Cognitive andProcess Standards in T/M/S
In comparing the technology/
mathematics/science (T/M/S) content standards, it
is interesting to note that science has the fewest
with 8, mathematics has 10, and technology has
20. All three disciplines include within their desig-
nation of “content standards” standards that are
clearly process oriented. Mathematics has the most
process-oriented standards with 5; technology, 3;
and science, 1+. The process standards in mathe-
matics are problem solving, reasoning and proof,
communication, connections, and representation;
in technology they are apply the design process,
use and maintain products and systems, and assess
the impact of products and systems; and in science
the primary process standard is science as inquiry,
but science and technology has a process element
as well. Of special interest is the fact that a disci-
pline such as technology education that has tradi-
tionally been highly process oriented only devel-
oped three process standards. It can be argued that
if these three processes are used in all seven con-
texts presented in “The Designed World” section,
they actually will have high priority in the design
of curricula.
Table 4 also shows the number of second-
level statements (technology refers to them as
benchmarks) in each set of standards, the grade
bands in each set, the date the standards were
issued, and the Web site where more informa-
tion can be obtained. With several mouse clicks
one can access the entire standards documents
in mathematics and science. This makes accessi-
bility quick and affordable.
SourceEach of the disciplines has strategies or
standards that are designed to complement or
help implement their standards. Along with con-
tent standards, science has developed teaching,
professional development, assessment, program,
and system standards. Mathematics has “princi-
ples” within their standards document to set
forth the basic precepts that are fundamental to a
high-quality mathematics program. The TfAAP
has plans to develop assessment, program, and
professional development standards by 2003. All
three disciplines have implementation workshops
or “institutes” to help teachers in the field learn
to use the standards. Table 5 indicates topics
included in the mathematics and science stan-
dards. Similar topics are under development for
the technological literacy standards.
4
Table 2. Mathematics Standards
1. Number and operations2. Algebra3. Geometry4. Measurement5. Data analysis and probability6. Problem-solving7. Reasoning and proof8. Communication9. Connections10. Representation
Source: NCTM, 2000, pp. ix–xiii.
Table 3. Science Standards
1. Unifying concepts and processes2. Science as inquiry3. Physical science4. Life science5. Earth and space science6. Science and technology7. Science in personal and social perspectives8. History and nature science
Source: NRC, 1996, pp. 13–15.
Th
e J
ou
rna
l of Te
ch
no
log
y Stu
die
s
Comparison of Similar StandardsEach of the disciplines advocates a particu-
lar way to solve problems. In technology this is
called design, in mathematics it is problem solv-
ing, and in science it is called inquiry. Science
also includes design as a part of the science and
technology standard. Table 6 illustrates these
specific problem-solving strategies. Notice the
overlap between the disciplines—particularly
between technology and science. Also note the
different way each discipline uses the word con-
nections in Table 6.
The Impact of Standards on Technology,Mathematics, and Science Education
The impact of the standards for technologi-
cal literacy is treated separately because there
are unique issues. There are a number of posi-
tive developments. Support has been received
from the engineering community (Gorham,
2002; Wulf, 2000); program standards (Martin,
2002) and assessment standards (Custer, 2001)
are on schedule to be completed in 2003
(Dugger, 2001); the NSF has continued to fund
the development of curricula based on standards
(ITEA, 2002); some states are revising their
standards (Mino, Kane, & Novak, 2001;
Newberry, 2001); publishing companies are
scrambling to produce new textbooks; work-
shops are being conducted on how to implement
the standards6; some teacher education pro-
grams are changing to be more in alignment
with the standards7; and new standards-based
curricula are being developed by the discipline
as well as the Center to Advance the Teaching of
Technology & Science (CATTS), which is
sponsored by the ITEA. However, many
questions such as the following remain to be
answered: Will technology education become a
regular offering in the general education of all
K–12 students? Will the human resources
(teachers, administrators, teacher educators,
etc.) be available to respond to the need for
increased involvement in schools? Will technol-
ogy education become more closely aligned
with academic rather than vocational subjects?
The NCTM (not the federal government)
identified the need for a common set of
expectations so that states would have a guide to
follow as they provided direction in preK–12
mathematics. Leaders in NCTM worked hard to
develop a document that would be comprehen-
sive and usable by the organization’s constituents.
These leaders were actually surprised at the
impact their first set of standards had.8 Because
of their success, other disciplines followed suit.
Let us look at some of the ways mathematics and
science standards have influenced education.
1. Nearly all states have used the curriculum
5
Table 4. Comparison of T/M/S Content Standards
Area # of Stds Second Level Grade Bands Date Issued Website(9-12) Statements
TECH 17 cognitive 51 cognitive K-2 2000 www.iteawww.org3 process 15 process 3-5
6-89-12
MATH 5 cognitive 71 cognitive PreK-2 1989/2000 www.nctm.org5 process 18 process 3-5
6-89-12
SCIENCE 7 cognitive 27 cognitive K-4 1995 www.nas.org1 process 2 process 5-8
9-12
Table 5. Work Completed Beyond Standards
Technology Mathematics Science
To be developed (2003) Principles Teaching standardsEquity Prof. dev. standards
Assessment standardsProgram standards Curriculum Assessment standardsProf. dev. standards Teaching Program standards
Learning System standards

Th
e J
ou
rna
l o
f Te
ch
no
log
y S
tud
ies
National Council for the Accreditation
of Teacher Education (NCATE) stan-
dards for accreditation are also congru-
ent with these standards.
5. Manufacturers and vendors have
designed, packaged, and marketed stan-
dards-based materials to support teach-
ing and learning in math and science.
6. State and national leaders use the
standards to lobby for more resources.
7. The state and national tests now purport
to be based on mathematics and science
standards. Now that there is common
understanding as to what students
should know and be able to do, the
development and use of standardized
tests has become more prevalent.
8. Both sets of standards advocate a new
kind of pedagogy—one that is based on
research in the areas of teaching and
learning, cognitive science, and the func-
tion of the brain. This new pedagogy is
6
Technology
Apply the design process• Clearly identify design problem• Identify criteria and constraints • Refine the design• Evaluate the design• Develop a product or system• Reevaluate solution
The relationships among technologies and the connectionsbetween technology and other fields
• Technology transfer• Innovation and invention• Knowledge protection and patents• Technological knowledge and
advances of science and mathematicsand vise-versa (ITEA, 2000)
Mathematics
Problem solving• Build new mathematical knowledge• Solve problems that arise in
mathematics and in other contexts• Apply and adapt a variety of appro-
priate strategies to solve problems• Monitor and reflect on the process of
mathematical problem-solving
Connections• Recognize and use connections
among mathematical ideas• Understand how mathematical ideas
interconnect and build on one anotherto produce a coherent whole
• Recognize and apply mathematics incontexts outside of mathematics(NCTM, 2000)
Science
Science as inquiry• Identify questions and concepts that
guide scientific investigations• Design and conduct scientific investi-
gations• Use technology and mathematics to
improve investigations and communications
• Formulate and revise scientific expla-nations and models using logic andevidence
• Recognize and analyze alternativeexplanations and models
• Communicate and defend a scientific argument
Science and technology• Define a problem or design an oppor-
tunity• Propose designs and choose between
alternative solutions• Implement a proposed solution• Evaluate the solution and its
consequences• Communicate the problem, process,
and solutions
Science in personal and social perspectives
• Personal and community health• Population growth• Natural resources• Environmental quality• Natural and human induced hazards• Science and technology in local,
national, and global challenges(NRC, 1996)
Table 6. Comparison of Similar Standards (9-12 BAND)
and evaluation standards for school math-
ematics (NCTM, 1989) and national sci-
ence education standards (NRC, 1996)
when developing their own goals or
frameworks for math and science for their
state. One notable exception is in
California where the science standards are
more knowledge than process oriented.
2. Significant funding (National Science
Foundation, Eisenhower, U. S.
Department of Education, Science
Literacy, etc.) for the development of
mathematics and science curricula as
well as for professional development has
focused on the implementation of
mathematics and science standards.
3. Nearly all textbooks in mathematics and
science claim to be “standards-based.”
4. Nearly all teacher education programs
have changed to be in alignment with
the standards. Discipline-specific

Th
e J
ou
rna
l of Te
ch
no
log
y Stu
die
s
referred to as “constructivism” and
places emphasis on allowing students to
use prior knowledge to new understand-
ings through hands-on, authentic experi-
ences. A careful review of Tables 7 and 8
will help the reader understand the shift
in pedagogy from one that is knowledge-
based (memorization) to one that
engages students in science and mathe-
matics for the purpose of building under-
standing.
9. The new pedagogy has made it
necessary for teachers and administra-
tors to engage in extensive
professional development activities.
10.The new pedagogy has also made it
necessary to make substantial improve-
ments in facilities.
Personal Experience with StandardsAs the director of the integrated mathe-
matics, science, and technology middle school
curriculum development project for the past 10
years, this author has had extensive experience
in the use of T/M/S standards. Clearly, stan-
dards are not curriculum, but they are extreme-
ly useful for those who develop curriculum
because (a) they provide the scope of content
to be included, (b) they give an indication as to
what students should know and be able to do
for each grade band, (c) they indicate the top-
ics to be included in each grade band, (d) they
offer some guidance as to how much priority
or time should be devoted to a given topic, and
(e) they provide valuable input into the devel-
opment of student assessments.
Of the three sets of standards, the mathe-
matics standards have been the most useful for
those who develop curricula. Each standard
tends to be of equal importance, although some
standards have higher priority in some grade
bands. When one considers the preK–12 bands
together, each standard tends to be of equal
importance. Each standard is broken into
approximately 70 developmentally appropriate
subtopics, so it is very clear what students
should know and be able to do as they reach the
end of a grade band.
Science standards are less user-friendly
because they are written in more general terms.
In some cases this makes the determination of
whether a learner has achieved a standard left
to subjective judgment. When a standard has
multiple components, the student may have
achieved one aspect of the standard very well
but another aspect less well. Then it is left to
the curriculum developer or teacher to decide
if more time needs to be spent on the achieve-
ment of the standard. Experience with aligning
an integrated mathematics, science, and tech-
nology curriculum for at least 20 state frame-
works reveals that national standards have
influenced their state frameworks. However, in
some states the national standards in both
mathematics and science are broken down one
more level to give more specificity and, thus,
clarity as to what content children are expected
to master by a given grade level.
The technology standards have definitely
expanded the cognitive content to be mastered
within the discipline. We have found that most
of this added content can be integrated into the
application of the three process standards. One
problem with the technology standards is that
they are inconsistent as to their scope. In other
words, some are rather specific and can be
mastered in a short amount of time and others
are so comprehensive that it could take many
class periods to accomplish. Also, the conceptu-
al development of each of the standards from
K–12 is in need of improvement. The author has
used the standards for technological literacy
(ITEA, 2000) on a daily basis since they were
released, and he is most appreciative of the
direction they provide. However, he would
advocate taking a page from the mathematics
educators who began to make plans for the
revision of their standards three years after they
were first released.
SummarySince the mathematics standards published in
1989 had such a positive impact on the
teaching and learning of mathematics, most
academic disciplines have developed their own set
of standards. In this era of accountability in
preK–12 education, content standards play a cen-
tral role. They define what students should know
and be able to do. More and more they are used to
develop standardized tests for specific grade lev-
els. This is causing instruction and assessment to
be squarely focused on standards, especially in the
required subject areas. Although technology
7

Th
e J
ou
rna
l o
f Te
ch
no
log
y S
tud
ies
education is only required in 14 states (Newberry,
2001), the discipline is fortunate to have content
standards and the resources to develop profession-
al development, assessment, and program stan-
dards. Together these standards have the potential
to make a positive impact on the technological lit-
eracy of future generations (Bybee, 2002).
Dr. Franzie L. Loepp recently retired from the
Department of Technology at Illinois State University
where he served as the Director of the Integrated
Mathematics, Science, and Technology (IMAST)
Project from 1992-2003. He is a member of the
Gamma Theta Chapter of Epsilon Pi Tau and Loepp
received his Distinguished Service Citation in 2000.
8
FEDERAL SYSTEMLess Emphasis On• Financial support for developing new curriculum materials not
aligned with the Standards• Support by federal agencies for professional development activities
that affect only a few teachers• Agencies working independently on various components of science
education• Support for activities and programs that are unrelated to Standards-
based reform• Federal efforts that are independent of state and local levels• Short-term projects
More Emphasis On• Financial support for developing new curriculum materials aligned
with the Standards• Support for professional development activities that are aligned
with the Standards and promote system-wide changes• Coordination among agencies responsible for science education• Support for activities and programs that successfully implement the
Standards at state and district levels• Coordination of reform efforts at federal, state, and local levels• Long-term commitment of resources to improving science education
Table 7. Changing Emphases in Science Education
STATE SYSTEMLess Emphasis On• Independent initiatives to reform components of
science education• Funds to improve curriculum and instruction based on the
Standards• Frameworks, textbooks, and materials based on activities only mar-
ginally related to the Standards• Assessments aligned with the traditional content of
science education• Current approaches to teacher education• Teacher certification based on formal, historically-based requirements
More Emphasis On• Partnerships and coordination of reform efforts• Funds for workshops and programs having little connection to the
Standards• Frameworks, textbooks, and materials adoption criteria aligned with
national and state standards• Assessments aligned with the Standards and the expanded view of
science content• University/college reform of teacher education to include science-
specific pedagogy aligned with the Standards• Teacher certification that is based on understanding and
abilities in science and science teachingDISTRICT SYSTEMLess Emphasis On• Technical, short-term, in-service workshops• Policies related to Standards-based reform• Purchase of textbooks based on traditional topics• Standardized tests and assessments unrelated to Standards-based
program and practices• Administration determining what will be involved in
improving science education• Authority at upper levels of educational system• School board ignorance of science education program• Local union contracts that ignore changes in curriculum, instruc-
tion, and assessment• Knowing scientific facts and information• Studying subject matter disciplines (physical, life, earth
science) for their own sake• Separating science knowledge and science process• Covering many science topics• Implementing inquiry as a set of processes
More Emphasis On• Ongoing professional development to support teachers• Policies designed to support change called for in the Standards• Purchase or adoption of curriculum aligned with the Standards and
on a conceptual approach to science teaching, including support forhands-on science materials
• Assessments aligned with the Standards• Teacher leadership in improvement of science education• Authority for decisions at level of implementation• School board support of improvements aligned with the Standards• Local union contracts that support improvements indicated by the
Standards• Understanding scientific concepts and developing abilities of
inquiry• Learning subject matter disciplines in the context of inquiry, tech-
nology, science in personal and social perspectives, and history andnature of science
• Integrating all aspects of science content• Studying a few fundamental science concepts• Implementing inquiry as instructional strategies, abilities, and ideas
to be learned
Less Emphasis On• Activities that demonstrate and verify science content• Investigations confined to one class period• Process skills out of context• Emphasis on individual process skills such as observation or inference• Getting an answer• Science as exploration and experiment• Providing answers to questions about science content• Individuals and groups of students analyzing and synthesizing data
without defending a conclusion• Doing few investigations in order to leave time to cover large
amounts of content• Concluding inquiries with the result of the experiment• Management of materials and equipment• Private communication of student ideas and conclusions to teacher
More Emphasis On• Activities that investigate and analyze science questions• Investigations over extended periods of time• Process skills in context• Using multiple process skills-manipulation, cognitive, procedural• Using evidence and strategies for developing or revising an explanation• Science as argument and explanation• Communication science explanations• Groups of students often analyzing and synthesizing data after
defending conclusions• Doing more investigations in order to develop understanding, abili-
ty, values of inquiry and knowledge of science content• Applying the results of experiments to scientific arguments and
explanations• Management of ideas and information• Public communication of student ideas and work to classmates
CHANGING EMPHASES TO
PROMOTE INQUIRY
Source: National Science Education Standards, 1996, p. 113.

Th
e J
ou
rna
l of Te
ch
no
log
y Stu
die
s
9
ReferencesAmerican Association for the Advancement of Science. (1993). Project 2061: Benchmarks for science
literacy. Washington, DC: Author.
Bybee, R. (2002). Technology education standards: Power, peril, and promise. In J. M. Ritz, W. E. Dugger, Jr., & E. N. Israel (Eds.), Standards for technological literacy: The role of teachereducation (pp. 1-10). New York: Glencoe McGraw-Hill.
Custer, R. (2001). Assessment standards for technological literacy. The Technology Teacher,61(2), 25-28.
Dugger, W. E., Jr. (2000). Standards for technological literacy: Content for the study of technology. The Technology Teacher, 59(5), 8-13
Dugger, W. E., Jr. (2001). Phase III Technology for All Americans Project: Creating assessment, professional development, and program standards for technological literacy. The TechnologyTeacher, 60(4), 27-31.
Gorham, D. (2002). Engineering and standards for technological literacy. The Technology Teacher,61(7), 29-34.
International Technology Education Association. (2000). Standards for technological literacy: Content for the study of technology. Reston VA: Author.
International Technology Education Association. (2002). Innovation-Invention-Inquiry Project begins.The Technology Teacher, 61(7), 5.
Martin, G. (2002). Program standards for technological literacy. The Technology Teacher, 61(5) 27-29.
Mino, M., Kane, G., & Novak, D. (2001). Implementing the standards: A state solution to a nationalimperative. The Technology Teacher, 60(7), 30-32.
National Council of Teachers of Mathematics. (1989). Curriculum and evaluation standards for school mathematics. Reston, VA: Author.
National Council of Teachers of Mathematics. (2000). Principles and standards for school mathematics. Reston, VA: Author.
National Research Council. (1996). National science education standards. Washington, DC: National Academy Press.
Table 8. Summary of Changes in Content and Emphases in 9-12 Mathematics
Topics To Receive Increased Attention
Algebra• The use of real-world problems to motivate and apply theory• The use of computer utilities to develop conceptual understanding• Computer-based methods such as successive approximations
and graphing utilities for solving equations and inequalities• The structure of number systems• Matrices and their applications
Geometry• Integration across topics at all grade levels• Coordinate and transformation approaches• The development of short sequences of theorems• Deductive arguments expressed orally and in sentence
or paragraph form• Computer-based explorations of 2-D and 3-D figures• Three-dimensional geometry• Real-world applications and modeling
Trigonometry• The use of appropriate scientific calculators• Realistic applications and modeling• Connections among the right triangle rations, trigonometric
functions, and circular functions• The use of graphing utilities for solving equations and inequalities
Functions• Integration across topics at all grade levels• The connections among a problem situation, its model as a
function in symbolic form, and the graph of that function• Function equations expressed in standardized form as checks on
the reasonableness of graphs produced by graphing utilities• Functions that are constructed as models of real-world problems
Topics to Receive Decreased Attention
Algebra• Word problems by type, such as coin, digit, and work• The simplification of radical expressions• The use of factoring to solve equations and to simplify rational
expressions• Operations with rational expressions• Paper-and-pencil graphing of equations by point plotting• Logarithm calculations using tables and interpolation• The solution of systems of equations using determinants• Conic sections
Geometry• Euclidean geometry as a complete axiomatic system• Proofs of incidence and between ness theorems• Geometry from a synthetic viewpoint• Two-column proofs• Inscribed and circumscribed polygons• Theorems for circles involving segment ratios• Analytic geometry as a separate course
Trigonometry• The verification of complex identities• Numerical applications of sum, difference, double-angle, and
half-angle identities• Calculations using tables and interpolation• Paper-and-pencil solutions of trigonometric equations
Functions• Paper-and-pencil evaluation• The graphing of functions by hand using tables of values• Formulas given as models of real-world problems• The expression of function equations in standardized form in
order to graph them• Treatment as a separate course
Statistics Add to programProbability Add to programDiscrete Mathematics Add to program Source: NCTM, 1989, pp. 126-127.

Th
e J
ou
rna
l o
f Te
ch
no
log
y S
tud
ies
10
Newberry P. (2001). Technology education in the U.S.: A status report. The Technology Teacher,61(1), 8-12.
Technology for All Americans Project. (1996). Technology for all Americans: A rationale and structure for the study of technology. Reston, VA: International Technology Education Association.
Wulf, W. (2000). The standards for technological literacy: A national academies perspective. The Technology Teacher, 59(6), 10-12.
A Model for Unified Science and TechnologyBy Roy Q. Beven and Robert A. Raudebaugh
The ProblemScientific concepts and processes are best
developed in the context of technological
problem solving. However, even some of the best
secondary science curricula are weak in technol-
ogy education and visa versa. A goal of
technology and science education is to integrate
student learning of science and technology. This
is evident in the theme and papers of the 1996
Jerusalem International Science and Technology
Conference and the efforts of the National
Science Foundation, the American Association
for the Advancement of Science (Project 2061,
1990), the National Research Council (National
Science Education Standards, 1995), and The
International Technology Education Association
(Standards for Technological Literacy, 2000).
Science and TechnologyHumans first used technology in a very intu-
itive way. Prehistoric evidence indicates that peo-
ple learned to use the materials at hand, mostly
stones and tree branches, to fashion
simple tools to aid in gathering food and provid-
ing security. Discoveries of copper, bronze, and
iron were mostly accidental, and their use in tools
and weapons mostly intuitive. During the
Renaissance, craft guilds were formed and the
skills and knowledge of technology became more
formalized, but it was still developed
primarily through trial and error by highly
creative and intuitive individuals. As societal
needs grew and the demands on technology grew
more sophisticated, links to the scientific commu-
nity were forged, giving rise to formal engineer-
ing. According to Shamos (1995), “the more
complex forms of technology, which could pros-
per only through painstaking design,
eventually gave rise to the formal disciplines of
engineering, whose main objective is to reduce
the purely empirical content of technology, to
make it, in effect, more ‘scientific’ ” (p. 70).
This link has also been recognized inProject 2061: Science for All Americans(American Association for the Advancement ofScience [AAAS], 1990) as evidenced by the following statement: “But just as important asaccumulated practical knowledge is, the contribu-tion to technology that comes from understandingthe principles that underlie how things behave-that is from scientific understanding” (p. 26).
Shamos (1995) also recognized the mix ofscience and technology as an interdependentrelationship in which technology uses the toolsof science, which by extending human capabilityallows us to harness or modify nature to ourneeds. Project 2061 (AAAS, 1990) describedthis relationship as one in which
scientists see patterns in phenomena as mak-
ing the world understandable; engineers also
see them as making the world manipulable.
Scientists seek to show that theories fit the
data; mathematicians seek to show logical
proof of abstract connections; engineers seek
to demonstrate that designs work. (p. 27)
This relationship is again described in the
Technology for All Americans (International

Th
e J
ou
rna
l of Te
ch
no
log
y Stu
die
s
Technology Education Association [ITEA],
1996) document.
Science is a study of the natural world, and
technology extends people’s abilities to
modify that world. Science and technology
are different, yet symbiotic. Technology is
much more than applied science and sci-
ence is quite different from applied technol-
ogy. When people use technology to alter
the natural world, they make an impact on
science. Science is dependent upon tech-
nology to develop, test, experiment, verify,
and apply many of its natural laws, theories,
and principles. Likewise, technology is
dependent upon science for its understand-
ing of how the natural world is structured
and how it functions. (p. 28)
Teaching Science and TechnologyToday, probably as a result of the concerted
drive during the past few decades to introduce
technology education into the schools, science
and technology are often considered one and the
same. The problem with this is that most of
what society experiences are the end products of
scientific inquiry, namely those produced by
technology, and almost all so-called science-
based societal issues are actually based in
technology rather than in science.
Hence painting both with the same broad
brush is a disservice not only to the science
and technology communities, but also to
society, which must understand that
technology is fundamentally a social
activity and that the social and economic
forces which prompt technologists to
modify nature are very different from those
that motivate scientists to seek ways of
understanding. (Shamos, 1996, pp. 68)
Obviously one cannot deal effectively with
the nature of science solely in the abstract; it must
be placed in the context of science itself, both for
example and emphasis. According to Shamos
(1995), educators now know that given a choice
between stressing science or technology for the
general student, the better choice is technology.
But this poses a problem in respect to certain top-
ics because technology is not the best exemplar of
many of these, while science is. It is easy to
focus a curriculum on technology alone, but such
a program would not convey an awareness of how
science works, which should be science educa-
tion’s main objective. Hence, both science and
technology must have their own roles in the pro-
posed curriculum, with the former used mainly to
depict science process but with the actual content
leaning heavily on technology.
This is more easily said than done because
it brings us full circle to the question of how to
present science to the general student in a mean-
ingful fashion, something we have not managed
to do well in the past. “The obvious answer, we
believe, is to begin with technology, with prob-
lems that evoke familiar images of one’s
common experiences, and use these to work
back to the underlying science needed to deal
with such questions as scientific truth, laws and
theories” (Shamos, 1995, p. 224-225).
To help guide students toward the kind of
scientific awareness that Shamos (1995)
believed to be the appropriate objective of general
education in science, science education must
sharply change the emphasis of conventional
curricula from science content to the process of
science, continually stressing technology.
11
Figure 1. Format for Learning and Curriculum Design
Technological Design Process
Present Design Portfolio
Define the Problem
Scientifically GatherInformation
Explore Ideas
Construct Prototype ScientificallyTest & Evaluate
Develop the Design
Redesign

Th
e J
ou
rna
l o
f Te
ch
no
log
y S
tud
ies
One Proposed SolutionThe relationship between science and tech-
nology is so close that any presentation of science
without developing an understanding of technolo-
gy would portray an inaccurate picture of science
(National Academy of Sciences [NAS], 1996.
The key to a unified approach for science and
technology lies in the use of the Technological
Design Process as the format for learning and
curriculum (see Figure 1). The model presented
here represents a unified science and technology
curriculum with a transportation theme for the
middle grades. Students are engaged in the
design-build process involving familiar concept
vehicles and research of pertinent information in
a scientific manner. Thus, students build the
middle school science ideas associated with these
vehicles while developing an understanding of the
design process and building technical skills.
Curriculum DesignThe curriculum model in Figure 2, which
the authors have titled “Move with Science and
Technology,” is composed of a unifying project
and four related units of study. Students are
hooked into the notion of vehicle design with a
quick, fun paper-car activity. They are then
given the overall design challenge: design and
build a human/hybrid-powered vehicle that
addresses safety and environmental and trans-
portation problems for the future. To help them
in this unifying project, they will be guided
through four instructional units of study.
Each unit challenges teams of students to
design and build concept vehicles. The result of
each design process is written up in individual
design portfolios and presented by the team to
the class. These vehicles are somewhat familiar
middle school technology projects: a mousetrap
car, CO2 car, space-frame vehicle, and an elec-
trically powered vehicle. These units build hier-
archical science and technology process skills
and make a complete science and technology
curriculum, especially when tied together with
the unifying project. The four units can be used
as stand-alone units, but the unifying project
adds greatly to the real-world authenticity of the
curriculum.
Throughout the curriculum, students return
to the unifying project—safe human/hybrid-
powered vehicles. As they move through this
design process, they employ the ideas and skills
developed in the units. The prototype of their
human/hybrid-powered vehicle should be, but
does not necessarily have to be, a working pro-
totype. The overall assessment of this and the
smaller projects is based upon their documenta-
tion of the design process, not how well their
project actually works.
Conceptual DevelopmentThis unified science and technology model
is guided by the National Science Education
Standards mandate to supplement middle-level
science coursework with “activities that are
meant to meet a human need, solve a human
12
Figure 2. Move with science and technology curricular design
Safe Human/HybridPowered Vehicle
Challenge
Idea-Do ActivitySafe Paper Cars
Student InquiryStudents discover answers to theirquestions while designing and
building other vehicles andcarrying out sci-tech activities.
Lab Reference BookStudents’ repository of concepts,
skills, and thoughts in scienceand technology written whileexperiencing unit projects and
activities
Present &Disseminate
ScientificProcess
MousetrapCars
Motion SpatialSkills
CO2
Cars
Forces MaterialProperties
Space-Frame
Vehicles
Energy Proto-typing
Electric Vehicles
ScienceStrand
TechnologyStrand
UnitProjects
Design,Build
&Perform
Develop adesign
portfolio for a safe
human/hybridpowered
vehicle of thefuture that
incorporatesideas and
skills learnedin the units
DesignProcess

Th
e J
ou
rna
l of Te
ch
no
log
y Stu
die
s
problem, or develop a product” (NAS, 1996, p.
161). Current trends in technology education
include providing middle-level students with
activities that allow them to develop “real tech-
nological products, systems, and environments”
(ITEA, 1996, p. 38) and the recognition that
“some technological problem are best solved
through [scientific] experimentation” (ITEA,
2000, p. 110).
The human/hybrid-powered vehicle is the
central challenge that ties together the four
smaller design-build units of this curriculum.
These four units build the necessary ideas,
knowledge, and skills required to design and
build a human/hybrid-powered vehicle.
An additional goal of this curriculum is the
understanding of the risks associated with vehi-
cles and how to reduce those risks. Students
learn that “science cannot answer all questions
and technology cannot solve all human problems
or meet all human needs” (AAAS, 1990, p.
169). This curriculum recognizes that middle-
level students can “begin to develop the ability
to assess the impacts of [technological products
and systems] on individuals, society, and the
environment” (ITEA, 1996, p. 38). Thus, the
activities are designed to allow students to learn
the what, how, and why of human safety associ-
ated with vehicles.
From the first activity, paper cars, students
recognize the need to have an energy source that
results in a force forward on their vehicle in
order to cause the vehicle to move in the desired
direction. The relationship between energy,
force, and motion is a common theme in each of
the design-build activities. The goal is to “pro-
vide concrete experiences on which a more
comprehensive understanding of force can be
based” (NAS, 1996, p. 149). Specifically, stu-
dents are asked to describe the motion, identify
the forces causing it and the energy source in
each of the design-build activities, and develop
the ability to do this through well-connected sci-
ence and technology instructional activities.
These activities help students develop the con-
cept of energy because they may “have some of
the same views of energy as they do of force—
that it is associated with animate objects and is
linked to motion” (NAS, 1996, p. 154). In addi-
tion, students are repeatedly asked to describe
energy transfers because middle level students
“improve their understanding of energy by expe-
riencing many kinds of energy transfer” (NAS,
1996, p. 154).
Another theme of Move with Science and
Technology is establishing the meaning and use
of scientific inquiry. All the instructional activi-
ties “engage students in identifying and shaping
an understanding of the question under inquiry”
(NAS, 1996, p. 144). The use of a centering
design-build activity provides relevant and
meaningful context so that students “know what
the question is asking, what background knowl-
edge is being used to frame the question, and
what they will have to do to answer the ques-
tion” (NAS, 1996, p. 144).
Unit DesignEach unit challenges teams of students to
design and build a vehicle, create a design port-
folio, and present their design to the class. As
described above, these vehicles are somewhat
familiar middle school technology projects: a
mousetrap car, CO2 car, space—frame (crash
test) vehicle, and an electrically powered vehicle.
These units build hierarchical science and tech-
nology process skills. Each unit has eight
instructional activities, including four in science
and four in technology, all centered upon scien-
tific research and the design process for these
concept vehicles. The instructional activities
associated with the scientifically gathering
information and scientifically testing and evalu-
ation phases are exemplary science investiga-
tions in which a controlled experiment is
13
InstructionalActivities
Design Process Paper
Note-book
Design Portfolioand Presentation
Figure 4. Suggested unit assessment

Th
e J
ou
rna
l o
f Te
ch
no
log
y S
tud
ies
self-evident. Instructional activities associated
with define the problem phase help students
write design briefs while learning about criteria
and constraints. Activities associated with
exploring ideas and developing the design lead
students through an exemplary sketching and
technical drawing process described in an exten-
sive supplemental piece.
In the units, the unification of science and
technology is so seamless that students are
focused upon a design process involving scien-
tific inquiry and not, unless queried, aware of
which activity is science and which is technology.
At the completion of each unit, students are
asked to write an expository paper documenting
their design process. Students are then asked to
14
Figure 3. Unit summaries with activities and their association to the design process.
Define the ProblemActivity 1: Writing
Design Briefs
Sci. Gather InfoActivity 2 & 5: Measuring
Force & Lever Arm
Explore IdeasActivity 4: TestingWheels & Axles
Construct PrototypeActivity 7: Constructing
Prototypes
Sci. Test & EvaluateActivity 8: Measuring
Motion
Develop the DesignActivity 6: Sketching
Designs
RedesignActivity 3: Writing aDesign Process Paper
Sci. Gather InfoActivity 2, 3, & 4: Mass,
Motion and Forces
Construct PrototypeActivity 6: Prototype
Development
Sci. Test & EvaluateActivity 8: Time &
Speed
Develop the DesignActivity 5: Design
Documentation
RedesignActivity 7:
Performance Testing
Move with Science and Technology Units
Define the ProblemActivity 1: Criteria &
Constraints
Explore IdeasActivity 5: Design
Development
Mousetrap Car ChallengeDesign Process
CO2 Car ChallengeDesign Process
Define the ProblemActivity 1: Design
Challenge & Safety
Sci. Gather InfoActivity 2 & 3: Force PAth
Diagrams I & II
Explore IdeasActivity 4: Design
Documentation
Construct PrototypeActivity 5: Force Path
Analysis
Sci. Test & EvaluateActivity 6: Energy as Work
Act. 7: Energy Trans.
Develop the DesignActivity 4: Design
Documentation
RedesignActivity 8: Destructive
Testing
Sci. Gather InfoActivity 3: Electrical Forces
& Energy
Construct PrototypeActivity 6: System
Controls
Sci. Test & EvaluateActivity 5 & 7: Electr. &Humans, Electr. Signals
Develop the DesignActivity 4: Technical
Drawing
RedesignActivity 8: Human
Interface
Define the ProblemDesign Challenge
Explore IdeasActivity 2: System
Input & Output
Space-Frame Vehicle ChallengeDesign Process
Electrically Powered VehiclesDesign Process
Present Design Portfolio Present Design Portfolio
Present Design Portfolio Present Design Portfolio

Th
e J
ou
rna
l of Te
ch
no
log
y Stu
die
s
create a personal showcase portfolio composed
of this technical paper and all the activities and
notes of this unit as artifacts. To bring closure
to each unit, student teams are invited to present
their composite design portfolio to the class,
including their vehicle and other artifacts of
their design process. Figure 3 shows each unit,
the eight activities, and how these activities are
associated with phases of the design process.
AssessmentStudent achievement in this model can be
assessed, as prescribed in the curriculum, as a
balance between students’ performance in
instructional activities, writing in their design
process papers and notebooks, and their compiled
portfolios and presentation. This balance,
shown in Figure 4, indicates suggested weights
of each of the artifacts. As students move
through the four units and on to the unifying
project, more and more weight can be put on the
portfolio and its presentation.
The authors have developed, tested, and
published the curriculum “Move with Science
and Technology” as described in this article.
Currently, the National Science Teachers
Association (NSTA) Press, through a coopera-
tive agreement with the National Highway
Traffic Safety Administration, is publishing
three of the units shown in Figure 3 in a cur-
riculum guide called Fender Bender Physics.
This curriculum guide includes student pages
designed for reproduction as in-class materials
and an associated teacher’s guide that helps with
the delivery of each unit and activity. Fender
Bender Physics also contains a supplemental
materials section that is written in grade-level,
relevant terms intended for the instructor and/or
students. Fender Bender Physics is currently
available for on-line purchase at the NSTA
Website, http://www.nsta.org.
Roy Q. Beven is currently the Science
Assessment Manager for the state of Washington.
Robert A. Raudebaugh is a Professor in the
Engineering Technology Department at Western
Washington University, Bellingham. He is a
member of Delta Field Chapter of Epsilon Pi Tau.
15
References
American Association for the Advancement of Science. (1990). Science for all Americans.New York: Oxford University Press.
International Technology Education Association. (1996). Technology for all Americans:A rationale and structure for the study of technology. Reston, VA: Author.
International Technology Education Association. (2000). Standards for Technological Literacy.Reston, VA: ITEA
National Academy of Science. (1996). National science education standards. Washington, DC: National Academy Press.
Shamos, M. H. (1995). The myth of scientific literacy. New Brunswick, NJ: Rutgers University Press

This work analyzes the positioning of
technology education within the tradition of
classical liberal arts education. I propose ideas
for mutual enrichment of classical liberal arts
disciplines alongside technology education.
It is my contention that technology educa-
tion is general education for a technological
world. Indeed, there is a correlation between the
purpose of critical thinking of general education
and being surrounded by artifacts. Yet, thinking
and making are inseparable. Both actions inform
each other.1 The design and problem-solving
activities that are at the core of technology edu-
cation do provide an excellent setting for devel-
oping qualities such as work habits, decision-
making skills, effective use of resources, skills to
interact positively with others, and ability to
locate, evaluate, and act upon information of all
kinds.1 All these skills are transferable not only
to the workplace, but to the making of a compe-
tent and humanistic person as well.2 More and
more all work activities, including traditional
professions, are becoming service related
depending upon complex technological systems.3
To understand and manage those systems
requires a great deal of technology education.4
The contribution of services was put at the bot-
tom during the industrial era. Now, service deliv-
ery promises the most intellectually challenging
and technically difficult tasks of the future.5
An Inquiry In Common GroundMy proposition is to create a common
ground on which to build an educational
approach that eliminates the sharp cleavage
between liberal arts education and technology
education.
Worldview Models
My starting point is the concept that all
academic disciplines have a worldview in mind.
No matter how small the focus of their lenses,
they see the whole world through those lenses.
But, we cannot identify “betterness” looking at
an academic discipline through the lens of
another. Then, my proposition is to accept the
idea that each discipline carries a worldview
that deserves the same academic respect. This
respect will be tested when confronting an issue.
The day we think that all issues must be thought
of in conjunction with colleagues from different
fields, we will be really serious about other
worldviews.
Principles
The practice of any discipline implies the
guidance of certain principles. Each of us knows
that the set of principles we follow is useful to
the progress of our discipline. We know other
disciplines have their own principles and that
probably they are useful to their endeavors.
Usually, we do not give attention to the princi-
ples of others. However, principles shape the
soul of a practitioner. If we are serious about
common ground, we should start by attempting
to understand the principles of other disciplines.
Technology education cultivates an intellec-
tual domain; therefore, it has developed princi-
ples. It has a body of knowledge about how peo-
ple create, produce, use, and assess human-
made artifacts. It has a mode of inquiry that
focuses on the practices of invention, innova-
tion, and design. Technology is as ancient as
civilization (Dorn & McClellan, 1999; Pacey,
1990), and this historical asset means that tech-
nology studies are foundational to any thorough
educational process.
Education as a Continuum
Given equally valued worldviews and prin-
ciples, we could see the educational process and
system as a continuum. Education as a continu-
um does not move from one discipline to anoth-
er (such as from one discrete point to another),
but instead observers in this continuum would
search for different perspectives. Liberal arts
and technology education would not be different
compartments, but they would have different
perspectives on addressing the same reality.
In a continuum model of education, we
would address any issue simultaneously from
Th
e J
ou
rna
l o
f Te
ch
no
log
y S
tud
ies
Technology Education Versus Liberal Arts Education?By Oscar Plaza
16

Th
e J
ou
rna
l of Te
ch
no
log
y Stu
die
s
the liberal arts and technology education points
of view. Practitioners in both fields would
engage each other not only for the sake of
knowing and understanding the other, but for
accomplishing their own aims. We should learn
that we cannot address what we must by just
getting more involved in our own worldview.
Education as a continuum is not symbiosis or
syncretism. Technology education and liberal arts
maintain their own identities but they realize that
they cannot educate the educand of the future on
their own. Liberal arts would learn that tools not
only enhance human physical abilities, but also
shape human comprehension abilities.
Technology education would learn that liberal arts
is not only about reflecting reality, but also about
seeing reality. Education as a continuum is not
about joint efforts but about intellectual honesty.
Instructional Models
Assuming a common ground for liberal arts
education and technology education, we can
think about common instructional models.
These models should not share a common back-
ground because we try to work together. Instead,
we should reach the point at which we use a
common instructional background model due to
the needs of our own field.
Building Up An EducationalModel for the FutureThe Promise of High-Tech
It was said that television was going to
change schools, even displace the teacher.
Teachers are still here, competing with televi-
sion shows for student attention, but still here.
Therefore, there is reason for skepticism about
the high-tech threat to the teacher. Precisely
because of high-tech, I think there are reasons
for more teachers, yet another kind of teacher.
The dilemma is that nobody knows exactly how
this "new" teacher will look.
Information-technologies development is
the key to the high-tech impact on education.
Traditionally, the teacher was the authoritative
sole conveyor of reliable information; not any-
more. However, information is not knowledge
and certainly not wisdom at all. The handling,
managing, and rumination of information is
becoming the big challenge of the educational
process. To "navigate" with the student through-
out this ocean of information is becoming the
job of the teacher.
Master/Mentor/Facilitator
The role and model of the teacher of the
future are highly debated, and it will take time
to reach certain consensus. Meanwhile, I pro-
pose the master/mentor/facilitator model. I think
the idea combines the best of the traditional and
of the "new." The master conveys the tradition
of the teacher as the knowledge/wisdom author-
ity. The mentor brings the idea of the light-
house, of someone always there for encourage-
ment and guidance. And, who is going to navi-
gate with the student in the new high-tech
school? We need the facilitator. Yet, the teacher
will still be the commissioner of an academic
discipline whether traditional or not. The teacher
will still convey the meaning and excitement of
a subject matter.
Multicurricula
The multicurricula idea is a curriculum
with many entries. There would be as many cur-
ricula as students. No matter the entry, students
would have the chance to grasp the core of
traditional and new disciplines and end with a
specialization on his or her own.
Meanwhile, I see two approaches to the
integration of liberal arts and technology
education curricula. One approach calls for
technology education courses tailored as part of
the general education curriculum.1 There are
courses with certain tradition that follow this
pattern, such as Technology and Society,
Technology and Culture, and Technology and
Civilization. There are also new courses that
more specifically address the issues of integra-
tion and technology education as part of the
liberal arts curriculum.6 These new course
developments call for the straight integration of
technology education into the liberal arts
curriculum.7
A second approach, which I propose,
attempts a more integrative manner. The idea is
to make technology education a component of
integrative core courses curricula. Integrative
core courses are developed around an integrative
topic to which many disciplines, therefore teachers,
17

Th
e J
ou
rna
l o
f Te
ch
no
log
y S
tud
ies
contribute. I believe that there is no topic about
nature, humanity, or metaphysics to which tech-
nology education is alien. Furthermore, technol-
ogy education should come with its own topics
for integrative core course development.
Integrative core courses are difficult to
develop. They are more than just a lecture series
course developed around a common topic deliv-
ered by instructors from different disciplines.
They are a group of instructors from different
disciplines addressing together a common topic.
I think that the solving/problem model of tech-
nology serves well this purpose because it
requires a group of people with different back-
grounds to tackle an issue together.
Integrative core courses are more adequate to
the multicurricula idea. The issue is not about
renegotiation of educational resources allocation,
especially time curriculum, or sharing of resources
among the different disciplines. The issue is cur-
ricula and course structures that address the new
environment of the educational process.8
While some may see the entire world as astage, Jones (1997) sees the entire world as aclassroom and every "one room hut" as anaccess point in the age of information. The
global culture is progressing at a speed that putsthe educational model for the future outside thebounds of any grand design. Nevertheless, thisis not a justification for giving up or for busi-ness as usual. Education will go through funda-mental changes, whether we like it or not,because the outside reality will demand areplacement of the industrial era school modelwe have now. Nonetheless, I believe that teacherexperiences provide extremely valuable advicefor change, as the following quotation shows:
I am reminded of a new technology teacherwho began her first teaching job in a classroomthat had no equipment for the first two months.In those first two months, however, her studentswere guided through problem-solving activities,technology-awareness games, simple experi-ments, and even philosophical discussions abouttechnology. Once the equipment arrived, shefound herself teaching primarily about how touse the equipment, and her students spent moretime sanding than thinking. In looking back, sheremarked that she did more technology educa-tion in those first two months than she did inthe rest of the school year. (Flowers, 1998, p. 8)
Dr. Oscar Plaza is an Instructor of
Economics and Applied Technology at the South
Texas Community College, McAllen.
18
References
Dorn, H., & McClellan, J. E., III (1999). Science and technology in world history: An introduction. Baltimore, MD: The Johns Hopkins University Press.
Flowers, J. (1998, December/January). Teaching the historical perspective – Should we or shouldn't we? Technology Teacher, pp. 7-9.
Glyer, D., & Week, D. L. (Eds.). (1998). The liberal arts in higher education: Challenging assumptions,exploring possibilities. Lanham, MD: University Press of America.
Heidegger, M. (1977). The question concerning technology and other essays. New York: Harpers.
Jones, G. R. (1997). Cyberschools: An education renaissance. Englewood, CO: Jones Digital Century.
National Academy on Engineering and National Research Council. (2002). Technically speaking: Why all Americans need to know more about technology. Washington, DC: National AcademyPress.
Pacey, A.(1990). Technology in world civilization. Cambridge, MA: The MIT Press.
Pitt, J. C. (2000). Thinking about technology: Foundations of the philosophy of technology. New York: Seven Bridges Press.
Postman, N. (1995). The end of education: Redefining the value of school. New York: Knopf.
Rifkin, J. (1996). The end of work: The decline of the global labor force and the dawn of the post-market era. New York: Putnam's Sons.

Th
e J
ou
rna
l of Te
ch
no
log
y Stu
die
s
19
The Committee on Technological Literacy
(CTL), a group guided by the National
Academies of Science and Engineering, the
Institute of Medicine, and the National Research
Council, recently concluded that “it is in the
best interest of all Americans to understand
more about technology” (Pearson & Young,
2002, p. 103). According to A. Thomas Young,
the chair of the CTL, “the committee hopes
technological literacy will be put ‘on the map’
and the way will be cleared for a meaningful
movement toward technological literacy in the
United States” (Pearson & Young, 2002, p. viii).
The CTL recommended that governmental
agencies set education policy to “encourage the
integration of technology content into K-12
standards, curricula, instructional materials,
[etc.]” (Pearson & Young, 2002, p. 103). If this
does, in fact, occur, then technology education
offers a clear solution towards helping the
committee realize its aims.
This article was written from the perspec-
tive that technology is a discipline of its own
that is best taught through a variety of methods
that necessarily include experiential learning.
By definition, technological literacy is, and has
always been, at the very heart of technology
education. In fact, the phrase technological
literacy is not new to this field—it has been in
use since 1947. Although science and technolo-
gy are closely linked, they are not the same;
learning about science is not the same as
learning about technology. Technology
education has evolved from a discipline that
mostly taught psychomotor skills to one that
now emphasizes more cognitive as well as affec-
tive learning principles. Nonetheless, a hands-
on, problem-solving instructional method is the
heritage that endures as one of the best ways to
Footnotes1 For philosophical developments of this idea, see Heidegger (1977) and Pitt (2000).2 For a detailed analysis of contemporary competency, see "Career Development and Workforce
Preparation: Educational Policy Versus School Practice," The Career Development Quarterly,September 1996, pp. 20-37.
3 For a discussion of liberal arts education, see "Initiating the Conversation" and "The ClassicalLiberal Arts Tradition" (Glyer & Week, 1998).
4 See, for example, Pitt's (2000) definition of technology as "humanity at work."5 See recent report by National Academy of Engineering and National Research Council (2002).6 Rifkin (1996) analyzes the impact of technological changes on the workforce.7 A good example is the effort of the University of Wisconsin-Stout. "Technology Is Required as
University General Education," Leonard F. Sterry, paper delivered at the Annual ITEA Conference,March 23-25, 1997, Tampa, FL.
8 Examples of this kind of effort include Technology as Liberal Education: A Model Course, ITEATask Force on Technology Education as Liberal Education, 1993; and Exploring Technology,Leonard F. Sterry and Robert W. Hendricks, T&E Publications, 1997.
9 For another discussion on integration, see “Integrating Liberal Arts and Professional Education,”Christopher Flannig (Glyer, 1998).
10 See, Postman (1995) for a discussion of the new educational environment.
Defining the Role of Technology Education by Its Heart and Its HeritageBy Mark S. Snyder

Th
e J
ou
rna
l o
f Te
ch
no
log
y S
tud
ies
help students learn about and fully understand
technology.
Of the Heart There are numerous definitions for the term
technology. Etymologically, it is an adaptation
of the Greek word tecnologia, which meant a
“systematic treatment of grammar,” and was
formed from the root tecnh, meaning “art” or
“craft.” Therefore, in the sense most closely
related to its origin, the expression is used to
signify “technical nomenclature.”
The Compact Edition of the Oxford English
Dictionary (1971) identified a different use for
the word, first applied around 1615. This defini-
tion of technology is perhaps the most general:
“a discourse or treatise on an art or arts; the sci-
entific study of the practical or industrial arts”
(p. 3248). In this sense, technology is consid-
ered a body of knowledge, just as sociology is
considered a field of study. DeVore (1980)
posited that technology is indeed a discipline,
which he defined as “the study of the creation
and utilization of adaptive systems including
tools, machines, materials, techniques, and tech-
nical means and the relation of the behavior of
these elements and systems to human beings,
society, and the civilization process” (p. 4).
Webster’s New World Dictionary of the
American Language offers similar versions, as
well as the following: “The system by which a
society provides its members with those things
needed or desired” (Guralnik, 1980, p. 1460).
DeVore (1980) also recognized that technology
exists as systems “ranging from tools, and their
use, to the social impact and influence of tools,
technics and products on the lives of particular
individuals and groups” (p. 4).
Specific artifacts developed by human
beings for the advancement of material culture
can also be thought of as technologies. The CTL
stated: “Technology comprises the entire system
of people and organizations, knowledge,
processes, and devices that go into creating and
operating technological artifacts, as well as the
artifacts themselves” (Pearson & Young, 2002,
p. 13). Johnson (1989) wrote, “Technology is
best described as a process, but it is more com-
monly known by its products and their effects
on society” (p. 1). This observation is tenable
and seems appropriate as an explanation for the
prevalent modern perception of the term.
Technology is also used at times to mean “a
method, process, etc. for handling a specific
technical problem” (Guralnik, 1980, p. 1460).
However, in this case, the term technique seems
more appropriate. Technique refers to the meth-
ods of procedure, or way of using basic skills, in
carrying out a technical or mechanical operation.
The term technics describes the basic skills
necessary for the utilization of techniques.
DeVore (1980) defined technics as “specific tech-
nical skills associated with a particular technolog-
ical act or behavior” (p. 3). In 1989, Chant wrote:
The proposed technics/technology distinc-
tion has yet to find its way into much
academic, let alone popular, discourse, even
though it offers a way of tidying up some of
the present confusion, and perhaps further a
way of relating that confusion to the central
historical relations of this volume. For if
technics is identified with products and
processes, this leaves technology as a form
of knowledge. (p. 45)
Chant’s (1989) application of the term
technics is convenient, and yet it seems an over-
simplification to contrast technics and technolo-
gy. Admittedly, technology may be considered a
form of knowledge, as when defined as the
study of practical or industrial arts. However,
technology is also an active discipline that
requires a familiarity with technics and their
application through techniques. Essentially,
technics can be distinguished as a separate but
integral element within the realm of technology.
Language may, unfortunately, introduce an
obstacle to the clear understanding of this dis-
tinction. The book Man and Technics: A
Contribution to a Philosophy of Life was an
early study of technology by Spengler
(1932/1960). In the translation from German, by
Atkinson, the word technics was employed to
describe Spengler’s philosophical view of tech-
nology. The author was interpreted to say:
Technics is the tactics of living, it is the
inner form of which the procedure of con-
20

Th
e J
ou
rna
l of Te
ch
no
log
y Stu
die
s
flict—the conflict that is identical with Life
itself—is the outward expression…Technics
is not to be understood in terms of the
implement. What matters is not how one
fashions things, but what one does with
them…. Always it is a matter of purposive
activity, never of things. (pp. 10-11)
Ellul’s (1954/1964) The Technological
Society was originally published in 1954 under
the French title La Technique ou Lenjeu du
Siècle. In the translator’s introduction,
Wilkinson interpreted this phrase literally to
mean “Technology: The Stake of the Century.”
Wilkinson continued by stating: “Technique, the
reader discovers more or less quickly, must be
distinguished from the several techniques which
are its elements. It is more even than the organ-
ized ensemble of all individual techniques
which have been used to secure any end
whatsoever” (Ellul, 1954/1964, p. x).
The French have since attempted to distin-
guish between technics and technology. Daumas
(1970/1976) wrote, however, “in French the word
technologie has no absolute meaning…. It will
nevertheless remain true that the equivalent
English word, technology, embraces both the
French words technique and technologie” (p. 93).
In this discussion regarding the word
technology and its related terms, it seems appro-
priate to offer one more passage that contains
the critical elements necessary to accurately
define technology: “Technology is a body of
knowledge and the systematic application of
resources to produce outcomes in response to
human needs and wants” (Savage & Sterry,
1990, p. 2). This seems to be a tangible defini-
tion that is concise yet complete.
Mind Over Matter?The terms pure science and applied science
have often been used as references to science
and technology, respectively. Buchanan (1976)
wrote the following:
Attempts to sharpen the definition with
derivative terms such as “pure science” and
“applied science” have tended only to
convert imprecision into confusion.
However, it can be agreed that there is a
distinction between science and technology
in present-day practice, coinciding in
general with fairly discrete professional
groups. (p. 76)
Price (1975) dedicated an entire chapter of
his book Science Since Babylon to “The
Difference Between Science and Technology”
(pp. 117-135), and Chant (1989) summarized
Price’s philosophical view of this concern when
he wrote: “Technology is not applied science,
but rather science and technology are parallel
structures in a symbiotic, weakly interacting
relationship” (p. 76).
The juxtaposition of science and technology
is an issue that has been discussed for centuries.
As a result, a great deal of confusion has tran-
spired regarding the distinction between the
terms. Daumas (1970/1976) wrote, “Weighing
these words science and technology against one
another in a rather scholastic manner each histo-
rian strives either to assimilate one to the other
or on the contrary to oppose them in pretty
muddled antitheses” (p. 93). Science and tech-
nology have often incorrectly been used inter-
changeably, and fairly strong opinions have
developed regarding the perception of these
concepts as separate entities. Lisensky, Pfnister,
and Sweet (1985) wrote:
In discussions of technology, one finds the
terms science and technology used in com-
bination, as if the one cannot be considered
without the other. Historically, however,
technology developed without reference to
science. The social process that is technolo-
gy arose empirically, either by accident or
as a matter of common experience. (p. 8)
The science/technology dichotomy can be
perceived in a variety of ways. Ellul (1954/1964)
thought technology was “auton- omous” and that
“science had become an instrument of tech-
niques” (p. 10). In his book John Dewey’s
Pragmatic Technology, Hickman (1990) con-
tended that Dewey viewed science as a “type of
technology” (p. 11). Chant (1989) described
what has been referred to as the linear sequential
model of technological innovation, stating,
“Science is on this account an independent vari-
able, developing largely by way of its own
internal intellectual dynamic; technology is a
21

Th
e J
ou
rna
l o
f Te
ch
no
log
y S
tud
ies
dependent variable, pushed by scientific discov-
ery and/or pulled by public and private need”
(p. 42). Lisensky et al. (1985) promoted the view
“that science is detached, concerned about
knowledge for its own sake, while technology is
more directly involved in the social process and
is concerned about the solution of problems and
application of knowledge to that solution” (p. 9).
Johnson (1989) provided a sensible illustration
of the relationship between science and technol-
ogy in the following passage:
Technology is also a technical process. It is
different from science, whose role is
understanding. Technology’s role is doing,
making, and implementing things. The
principles of science, whether discovered or
not, underlie technology. The results and
actions of technology are subject to the laws
of nature, even though technology has often
preceded or even spawned the discovery of
the science on which it is based. (p. 1)
Although the previous statement is a rather
broad generalization, and contradictory points of
view have been exemplified, this author accepts
the premise of science and technology as sepa-
rate, yet interactive and dependent, entities.
Heritage: The Instruction of TechnicsFrom a historical perspective, the nomen-
clature surrounding this field can become a
hindrance since a wide variety of labels have
been applied to systems for the instruction of
technics throughout the past. Apprenticeship
was the earliest such organized system and has
lasted for millennia. Since the advent of civil
control over education, mechanical schools,
polytechnics, schools of industry, mechanics
institutes, lyceums, manual labor academies,
technical institutes, workingmen’s schools,
manual training schools, sloyd schools, public
school manual and industrial arts, and vocation-
al schools have all been systems established
essentially for the instruction of technics.
In 1918, Crawshaw and Varnum described
in their book Standards in Manual Arts, Drawing
and Design the following point of view:
Manual training as the term is used in this
bulletin refers to the method by which
industrial work is developed under school
control. It signifies a plan by which hand,
tool and machine work is made educative
through a series of progressively develop-
mental problems.
Manual arts as herein used indicates the
content of the several subjects which are
included in a division of the school dealing
with industrial work.
Industrial education as used herein refers to
the study of all or a branch of industry (a
manual art) by means of the most approved
pedagogical and industrial methods. It
includes both information about and prac-
tice in industry. (p. 5)
The term industrial education has contin-
ued to be used as a broad heading that has more
recently included all forms of technical educa-
tion that, as a group, derived their content from
industry, whether their focus was vocational or
general education. Manual training gradually
evolved into manual arts, which, in turn, influ-
enced the development of other forms of indus-
trial education. There is no doubt that these
areas of instruction contributed to the develop-
ment of yet another system of instruction
referred to as industrial arts. In 1934, Collicott
and Skinner wrote:
Industrial Arts has had its greatest develop-
ment on secondary school levels. Here it has
passed through two somewhat well-defined
periods of professional growth and is now in
the midst of a third. The first was “manual
training,” where the emphasis was on hand
skill, chiefly in woodworking. The second
was “manual arts,” where the emphasis
while still on skill, was extended to include
the making of both useful and well-
designed articles. The third is now
“Industrial Arts,” where the intent is to
include all of the old that was good, but to
broaden out from the limitation of an
emphasis upon manual skill alone to an
enriched conception where more of the
child’s interests and environment, and cer-
tainly many of the other school subjects, are
involved. (State Committee on Coordination
and Development, 1934, p. 5)
22

Th
e J
ou
rna
l of Te
ch
no
log
y Stu
die
s
A similar passage by Bennett (1937) has
often been cited to clear up confusion regarding
the three terms used above to describe the
slightly different approaches to technical
instruction that chronologically overlapped dur-
ing the early 20th century. It reads: “In the term
industrial arts, the ‘industrial’ is emphasized;
while in manual arts, the ‘arts’ is historically the
distinctive word and, in the term manual train-
ing, ‘manual’ is the important word” (p. 455).
Although there were subtle differences between
these three methods, they all represented a form
of instruction that used “hands-on” methods of
learning technology-based content as part of a
broad educational experience rather than job-
specific training.
The emphasis of all these programs was on
“learning by doing,” but the focus of the content
was always based in, or on, technology. Techn-
ology education evolved from, but is not limited
to, this strong tradition of hands-on learning.
The Inception ofTechnology Education
In April 1947, a new interpretation of
industrial arts, referred to initially as the “The
New Industrial Arts Curriculum,” was imparted
by Warner, Gary, Gerbracht, Gilbert, Lisack,
Kleintjes, and Phillips. Warner introduced this
new plan at the fourth session of the eighth
annual American Industrial Arts Association
(AIAA) convention held in Columbus, Ohio.
For Warner, it was the next logical step in the
advancement of his philosophy and practices.
Warner and his protégés defined industrial arts
as follows:
Functionally, industrial arts as a general and
fundamental school subject in a free society
is concerned with providing experiences that
will help persons of all ages and both sexes
to profit by the technology, because all are
involved as consumers, many as producers,
and there are countless recreational oppor-
tunities for all. (Warner et al., 1965, p. 41)
Curtis wrote a review of Warner’s conference
presentation that was printed in the June 1947
issue of The Industrial Arts Teacher. He com-
mented, “The presentation by Dr. Warner, and the
interpretations that followed, completely rede-
fined the position of industrial arts in general
education in the public school, and solicited both
re-evaluation of the present program and consid-
eration of the implementation of the new” (p. 1).
Olson (1963) said of this effort, “It was too
far ahead of the times to gain general accept-
ance, but like all advance thinking it has had its
impact on the profession” (p. 15). Warner, him-
self, had a slightly different feeling about the
acceptance of the project as evidenced by the
following which he wrote retrospectively:
The result, as herein reported, was featured
at the AIAA Convention of 1947 which I
revived in Columbus, Ohio, following
World War II, and where we were fearful of
the outcome until the discussions which fol-
lowed, when our findings were not only
accepted, but praised on all sides. (Warner
et al., 1965, p. 5)
Eventually, “The New Industrial Arts
Curriculum” became known as A Curriculum to
Reflect Technology, with content that was
“derived via a socio-economic analysis of the
technology and not by job or trade analysis as of
old . . .” (Warner et al., 1965, p. 41). It included
six subject matter classifications: power,
transportation, manufacturing, construction,
communication, and management. Latimer
(1981) summarized:
For the most part, it remained a proposal,
probably because Warner did not have the
funds to promote and enhance it nationally.
The plan was probably too far ahead of its
time . . . .
Even though the curriculum was never
totally implemented, today there are many
elements of The Curriculum to Reflect
Technology present in educational systems
throughout the United States. (p. 48)
Gordon O. Wilber, the ninth president of the
American Industrial Arts Association (AIAA),
was another effective industrial arts educator
with timely insight. He referred to the influence
of technology in his book Industrial Arts in
General Education when he defined industrial
arts as “those phases of general education which
deal with industry—its organization, materials,
23
Th
e J
ou
rna
l o
f Te
ch
no
log
y S
tud
ies
occupations, processes, and products—and with
the problems resulting from the industrial and
technological nature of society” (Wilber, 1948,
p. 2). Wilber also expressed the conviction that
education was critical to the development of
technology by stating: “If society did nothing
more than transmit its culture there would be no
progress or improvement. Education has the fur-
ther objective, therefore, to provide for extending
and improving the way of life” (p. 6). This could
be accomplished, he believed, through instruc-
tion that challenged the critical thinking skills
of students.
In 1951, Meyer, an associate professor of
industrial arts and vocational education at the
University of Florida, Gainesville, asked of his
peers, “Industrial Arts—What Next?” Meyer
knew that “every boy and girl, regardless of
present interest or future occupation, is forced
to an acquaintanceship with the products of
technology” (p. 15). As a result he felt that
“work with materials and toward a grasp of
technology needs to be a part of the experience
of every boy and girl” (p. 15).
Technological Literacy—The Aim ofTechnology Education
In 1948, Williams, who was a professor of
education at the University of Florida as well as
the vice president of the AIAA, declared that
“Industrial Arts Faces a New Era.” In an article
by that title for The Industrial Arts Teacher,
Williams wrote the following:
For a time the true educational concept of
industrial arts was lost, and its position was
relegated to a secondary place in the scheme
of general education. Now, under the pres-
sure of a complex technological society the
narrow view of the manual arts concept is
fast giving way to a more comprehensive
and flexible interpretation of industrial arts
or technology. That a crucial need exists for
technological literacy is apparent. (p. 1)
In suggesting one course of action, Meyer
(1951) recognized that “as teachers of industrial
arts, a field yet young in education, we have
groped for truth and sought our role in leading
youth toward a real and functioning technological
literacy” (p. 16). Meyer continued by stating:
Our problem is not that of substituting
something new for something old. It is not
to discard the classics in the interest of the
technics—for this will destroy both. Our
task is to provide the cultural matrix of the
arts, the sciences, and the humanities so
that the equally cultural technologies can
find their rightful place and make their vast
and vital contribution. (p. 16)
The phrase technological literacy has since
been employed unrelentingly by technology
educators, which is appropriate since the devel-
opment of technological literacy has been iden-
tified as a major goal of the discipline. In 1968,
DeVore wrote:
In today’s world, when there is a greater
need than ever before for technological lit-
eracy, we discover the contemporary status
of the industrial arts to be one of confusion
and perhaps indecision, with a few notable
exceptions. Teachers in the profession, how-
ever, are becoming increasingly aware that
the confusion is the result of our heritage,
and indecision the result of inadequate
perspective. (p. 1)
In the 1983 Professional Improvement Plan
of the America Industrial Arts Society, the
transition from industrial arts to technology edu-
cation was described as “a national concern,”
“a mission for education,” and “a stimulus for a
new curriculum with new goals directed toward
technological literacy” (Starkweather, 1983,
p. 8). The plan itself identified three major goals:
I. Pursue the ideal form of industrial
arts/technology education to ensure
technological literacy of all people.
II. Profit from personnel development
exercises developing and nurturing
programs that apply technology to
societal problems.
III. Exchange ideas and practices within
and outside the profession to foster a
positive, consistent view of industrial
arts/technology education. (AIAA,
1983, p. 4)
According to the goals listed, the leaders of
24

Th
e J
ou
rna
l of Te
ch
no
log
y Stu
die
s
industrial arts education planned to improve the
technological literacy of all people through
innovative new programs that would involve
more of the cognitive and affective content of
technology and apply it to solve problems.
There was also a successful movement under-
way to change the name of industrial arts to
technology education.
In 1986, Loepp identified the need to
increase the technological literacy of our
citizenry as “an educational challenge.” He
described six characteristics that a technologi-
cally literate person should exhibit: the ability to
recognize and use the appropriate technology in
given situations; anticipate undesirable out-
comes of the use of technologies; identify
alternate courses of action if the technology
fails; understand basic mechanical, thermal,
fluidic, and electronic principles utilized by
technologies; gather and interpret data, or
information; and use basic tools, materials, and
processes of technology.
An individual who displays such capaci-
ties has not only managed to develop
fundamental psychomotor skills but also the
cognition of many academic disciplines.
Values are also important when making deci-
sions regarding the appropriateness and
outcomes of the utilization of technologies.
Hopefully, in the future, such judgments will
be made from well-educated perspectives.
Technology education aims to provide learners
with the opportunity to develop such capabili-
ties as described above, and therefore
contribute to the growth of society.
ConclusionThe CTL has recognized a need that tech-
nology educators first identified nearly 50 years
ago: Americans need to understand technology
and become technologically literate. As the pro-
fession has evolved, it has become evident that
technology is and has always been the very
heart of what we teach.
The CTL also has distinguished a “capability”
dimension of technological literacy that justifies
the need for psychomotor learning by stating:
Someone who is knowledgeable about the
history of technology and about basic tech-
nological principles but who has no hands-
on capabilities with even the most common
technologies cannot be as technologically
literate as someone who has those capabili-
ties. (Pearson & Young, 2002, p. 22)
Technology education has taught about
technology, through hands-on experiences, for a
long time; most believe that to be the strongest
aspect of its heritage. Another of the CTL’s
conclusions is that education for technological
literacy requires a multidisciplinary approach
and suggests that technological literacy could be
a “thematic unifier for many subjects now
taught separately in American schools” (Pearson
& Young, 2002, p. 23). Custer (2002), a technol-
ogy teacher educator and member of the
committee stated: “This should not be interpret-
ed in any way as a devaluing of technology
education. Rather, the committee clearly came
to view technological literacy expansively, as a
critical matter of national importance that inher-
ently spans academic disciplines” (p. 6).
American schools are being evaluated con-
stantly and criticized for the quality of education
that they provide. Although the majority of
graduates do not pursue a postsecondary liberal
arts education, almost every American student is
prepared as if this were the expectation. The
majority of curricula in our schools is based on
knowledge we have established over centuries to
be “truth.” While learning these truths is neces-
sary, understanding how these truths have been
applied to our society through technology is also
valuable. Maybe there are better ways for students
to learn these truths—or to learn them better.
Perhaps, the field which has been continu-
ously evolving into technology education
has always been an essential educational
enterprise that links classical knowledge to
our culture. If this is true then a broad
interdisciplinary approach involving tech-
nology education should be considered a
natural outcome of general educational
practice. (Snyder, 2000, p. 36)
Technology education has evolved to a point
where it is uniquely positioned for meeting the
aims of the CTL. The CTL itself stated:
25

Th
e J
ou
rna
l o
f Te
ch
no
log
y S
tud
ies
“Technology educators are playing an increas-
ingly important role in the development and
delivery of technology-related content to stu-
dents in K-12 classrooms, and technology teach-
ers represent an important resource for attempts
to boost U.S. technological literacy” (Pearson &
Young, 2002, p. 80). Herein lies an opportunity
for technology education to clearly define its
role in the American education system. Its
strength is its emphasis on the development of
students’ capabilities through design and prob-
lem-solving activities, but it must find its place
among a broad interdisciplinary approach and
address issues related to how students think
about, and act on, technology-related issues.
Technology education engenders the academic
ideal of developing students who can think, and
live, independently. Technology education also
prepares students to apply knowledge and intro-
duces new ideas and practices that enable indi-
viduals to perpetuate the advancement and
development of a strong, safe, well-educated,
and technologically literate society.
Dr. Mark Snyder is an associate professor
in the Graphic Communications Department at
Clemson University in Clemson, SC. He is a
member of the Beta Chi Chapter of Epsilon Pi Tau.
26
References
American Industrial Arts Association. (1983). Professional improvement plan. Reston, VA: Author.
Bennett, C. A. (1937). History of manual and industrial education 1870-1917. Peoria, IL: The Manual Arts Press.
Buchanan, R. A. (1976). The Promethean revolution: Science, technology and history. In A.R.Hall & N. A. F. Smith (Eds.), History of technology (pp. 73-83). London: Mansell.
Chant, C. (1989). Science and technology: Problems of interpretation. In C. Chant (Ed.),
Science, technology, and everyday life 1870-1950 (pp. 40-58). New York: Routledge.
The compact edition of the Oxford English dictionary. (1971). New York: The Oxford University Press.
Crawshaw, F. D., & Varnum, W. H. (1918). Standards in manual arts, drawing, and design. Madison: The University of Wisconsin.
Curtis, D. K. (1947, June). The new industrial arts curriculum. The Industrial Arts Teacher, pp. 1-3.
Custer, R. (2002, November 1). Unpublished conference proceedings from the Mississippi Valley Conference, St. Louis, MO.
Daumas, M. (1976). The history of technology: Its aims, its limits, its methods. In A. R. Hall
& N. Smith (Eds. & Trans.), History of technology: First annual volume, 1976 (pp. 45-71).London: Mansell. (Reprinted from Revue d’Histoire des Sciences, 1970, 22)
DeVore, P. W. (1968). Structure and content: Foundations for curriculum development. Washington,DC: American Industrial Arts Association.
DeVore, P. W. (1980). Technology: An introduction. Worcester, MA: Davis Publications.
Ellul, J. (1964). The technological society (J. Wilkinson, Trans.). New York: Vintage Books. (Original work published 1954)
Guralnik, D. B. (Ed.). (1980). Webster’s new world dictionary of the English language. New York: Simon & Schuster.
Hickman, L. A. (1990). John Dewey’s pragmatic technology. Indianapolis: Indiana University Press.
Johnson, J. R. (1989). A Project 2061 panel report: Technology. Washington, DC: American Association for the Advancement of Science.
Latimer, T. G. (1981). William E. Warner: His philosophy and influence on industrial arts. In D. R.
Herschbach (Ed.), Industrial arts: A historical perspective (pp. 43-50). Reston, VA: American
Industrial Arts Association.
Lisensky, R. P., Pfnister, A. O., & Sweet, S. D. (1985). The new liberal learning: Technology and the liberal arts. Washington, DC: The Council of Independent Colleges.
Loepp, F. L. (1986). Technological literacy: An educational challenge. In M. Sanders (Ed.), Technology Education Symposium VIII Proceedings (pp. 37-40). Blacksburg, VA: VirginiaPolytechnic Institute & State University.

Th
e J
ou
rna
l of Te
ch
no
log
y Stu
die
s
27
Meyer, H. K. (1951, June). Industrial arts–What next? The Industrial Arts Teacher, pp. 15-17.
Olson, D. W. (1963). Industrial arts and technology. Englewood Cliffs, NJ: Prentice-Hall.
Pearson, G., & Young, A. (Eds.). (2002). Technically speaking: Why all Americans need toknow more about technology. Washington, DC: National Academy Press.
Price, D. J. de Solla. (1975). Science since Babylon. New Haven, CT: Yale University Press.
Savage, E. N., & Sterry, L. (1990). A conceptual framework for technology education. Reston, VA: International Technology Education Association.
Snyder, M. (2000). Broadening the interdisciplinary approach of technology education.
Journal of Industrial Teacher Education, 37(4), 24-38.
Spengler, O. (1960). Man and technics (C. F. Atkinson, Trans.). New York: Knopf. (Original work published 1932)
Starkweather, K. N. (1983, May-June). AIAA: Pioneering leadership in industrial arts/technologyeducation. Man/Society/Technology, p. 8.
State Committee on Coordination and Development. (1934). A prospectus for industrial arts in Ohio.
Columbus: Author.
Warner, W. E., Gary, J. E., Gerbracht, C. J., Gilbert, H. G., Lisack, J. P., Kleintjes, P. L., & Phillips, K. (1965). A curriculum to reflect technology. Columbus, OH: Epsilon Pi Tau. (Reprint)
Wilber, G. O. (1948). Industrial arts in general education. Scranton, PA: International Textbook.
Williams, W. R. (1948, February). Industrial arts faces a new era. The Industrial Arts Teacher, pp. 1-3.
Quality-Based Cooperative Technical Teacher TrainingBy László Kadocsa and Imre Kopp•ny
Hungarian higher education is in transition
from the stage of elite training to that of mass
education. At the same time, according to moni-
toring surveys, the output efficiency level of
secondary school students has decreased. These
aspects, combined with the narrowing resource
base due to the worsening demographic
conditions, call for the renewal of global higher
education and particularly technical teacher
training. The authors are hoping for a break-
through in the following items: quality-based
approach in training and the organization,
learning-centered philosophy instead of teacher-
centered philosophy, new types of study materials
and evaluation strategies, modular and
credit-based curricula, and cooperative training.
Cooperative TechnicalTeacher Training
Technical teacher education at polytechnics
in Hungary has the specialty, and the advantage,
of parallel engineering and teacher training at
the same time. This type of dual course work
aims at preparing students for two alternative
professions: engineer or technical teacher at
vocational secondary schools. About three
quarters of the total training hours concern
engineering subjects, and one quarter of those
center on pedagogical subjects. At Dunaujvaros
Polytechnic (DP) there is a possibility for
students to learn some engineering and peda-
gogical subjects in English or in German as
well. More than half of the graduates work for
industrial companies as an engineer. Graduates
who have studied professional subjects in

Th
e J
ou
rna
l o
f Te
ch
no
log
y S
tud
ies
mechanical engineering or in information
technology in foreign languages at DP are very
popular, particularly at multinational firms in
Hungary. Cooperative features of the training
create a strong link between DP and industrial
companies or other enterprises in the practical
professional training of the students and
between DP and vocational secondary schools
in pilot teaching projects run by the students.
At the end of the sixth semester, every
student spends a month at an industrial place-
ment as an engineer assistant. In the seventh
semester, there is a complex engineering project
ended by a written final work and closing exam.
This final work is related to the solution of a
real industrial problem and is guided by an
industrial expert and a supervisor of the
academic staff.
Students complete a pilot teaching project
in the eighth semester. The project consists of
observation and trial teaching, one-month teach-
ing practice in a vocational secondary school,
and a teaching presentation. These activities are
guided by a senior secondary school instructor
and a supervisor of the academic staff. In the
curriculum development of the technical teacher
training program, theoretical and methodologi-
cal aspects as follows were taken into account.
Challenge For Higher EducationGlobal tendencies in higher education are:
• Changing from elite training to mass
education.
• Establishing common features in the
national higher education systems.
• Strengthening integration and
organizational restructuring.
• Gaining a multilevel character or
diversification of the training.
• Enforcing institutional autonomies:
constraint of the requirement of cost
efficiency, development of the intercon-
nection of higher education and research
with the industry, change of paradigm in
the strategy and methods of teaching and
learning, improvement in quality, devel-
opment of quality assurance systems, etc.
Hungarian higher education needs to follow
the international tendencies of development and
to adapt some of its important elements
(Altbach, 1991). At the same time, in the course
of changes, we cannot forget to take into
account our national cultural heritage and fea-
tures to preserve the actual values existing in
our higher education.
As for quantitative development, Hungarian
higher education has taken a considerable step
towards catching up in the end of the 1990s,
shown by the doubling of the number of
students. Today, 40% of the generation aged
between 18 and 23 years, or more than half of
the youths leaving secondary school, will enter
higher education.
Research studies have shown that the effi-
ciency of students leaving secondary school
decreased in our country—mostly in those
fields that have an outstanding importance from
the point of view of the success of studies in
higher education. For instance, primary and
secondary schools today prepare their students
to a less extent for complex text interpretation
exercises (diagrams, tables, instructions of use,
etc.), and the output of youths in the field of
mathematics and natural sciences is essentially
worse than one or two decades before. There is
a natural demand in public education to stop
this decay of the output level of students and a
call for its improvement. However, in itself, this
cannot create a solution, as higher education
must also enhance the smooth adaptation of stu-
dents into higher level studies.
Increasing numbers of students combined
with a narrowing resource base due to the
worsening demographic conditions, the worsen-
ing output level of students in public education,
and their uncertain career image, urge higher
education that was previously arranged for
elite training and that has been operating
multiple selection mechanisms to undergo
radical changes.
We are convinced that within the frame-
work of mass-level higher education, for the
sake of maintenance and even improving of
quality, it is necessary to transform and renew
the vertical structure of the training, as well as
the whole technology of teaching and learning.
28
Th
e J
ou
rna
l of Te
ch
no
log
y Stu
die
s
Change Of Paradigm In TheMethodology Of Technology Education
Undergoing rapid changes, there is a
demanding need for a new view and paradigm
in higher education, which should be student-
centered, learner-centered. For this reason, high-
er education has to change its learning pro-
grams. The content, methods, and the practice
and means of delivery (teaching and learning)
of education should be based upon new partner-
ships between students and teachers. These new
methods of teaching should go together with
new types of teaching-learning materials. These
new methods must also be connected with the
new types of assessment and evaluation, which
will enhance the development of not only the
memory but also understanding and realizing
capacity, as well as creativity and the capacity
of doing practical work. The technology-based
learning environment and the information and
communication technologies as well as the
application of open and distant education meth-
ods require the reformulation of the content,
forms, and full practice of education. These new
methods of teaching should go together with
new types of teaching-learning materials.
Change Of ConceptThe renewal of training should include con-
cept and role changes, both from the part of
teachers and students, as well as the renewal of
contents and the creation of a study environ-
ment. This change of view from the side of
teachers requires the creation of a learning,
guiding, helping attitude, which can be recog-
nized as the main managing force of the learn-
ing process. The active cognitive activity of the
students should more and more be emphasized,
which, at the same time, also requires the under-
taking of a greater responsibility for their own
learning activity.
During the renewal of the study material, a
balance should be achieved between the wide
basis that assures the convertibility of knowl-
edge and the users' ("market") demands that are
formulated more and more markedly. Within the
transformation of the study environment, the
expansion in space and time of the scenes of
teaching and learning is well observable (van
den Berg, 1996). The individual sites, or those
that are suitable for small-group learning, play a
significant role in and outside of educational
institutions: at media centers, resource centers,
computer rooms, libraries, research places,
homes, working placements, etc.
The main characteristics of the methodological,
didactical changes are:
• The conveying of knowledge is trans-
formed into a cognitive (knowledge-
gaining) process.
• Learning to learn plays a decisive role in
this process.
• The process has a student-centered
character.
• The teacher loses his or her central role.
• The teacher assists the students in the
organization of their learning activity.
• The teacher creates the conditions of learn-
ing, shows the direction, and gives counsel.
• The teacher explains to the student the
essential interrelations, the methods of
work, and the rules.
• The teacher evaluates the results.
These, altogether, can result in the
achievement of a new type of relationship
between teacher and student, the basic change
of the structure and contents of training, and
the character of teaching and learning.
Development Of HigherEducation Curricula
We identify the curriculum as a process
plan, a program, that is a thoughtful system of
teaching and learning goals, requirements, con-
tents, organizational-methodological-instrumental
solutions, evaluations, and conditions. The
structure of the curriculum determines the prior-
ities that, at the present date, show more and
more a student-centered or learning-centered
tendency. In the development of the university
and college curricula, the following tendencies
can be observed:
1. The credit system becomes general:
The credit serves for the measurement
of the time for teaching, or for the
measurement of the amount of the total
student work necessary for the acquisi-
tion of the given subject or module. The
great advantage of the credit system lies
in its flexibility, which makes possible
the satisfaction of the need for free
29

Th
e J
ou
rna
l o
f Te
ch
no
log
y S
tud
ies
choice ("determining of the own way of
life"), the permeability between the
areas of study and the training stages,
the reciprocal acknowledgment of the
part-trainings and part-studies, the con-
tinuing of studies without time losses,
the possibility of conferring an interna-
tional status to the studies (European
Commission, 1998).
2. The dynamic development of the mod-
ular curriculum structure (Badley &
Marshall, 1995; Burkhart, 1996): The
precondition of the optimal functioning
of the credit system is modularization,
which means the creation of study
units, courses, and modules, as well as
using them as elements in further build-
ing. The module, the unit element of the
training (teaching and learning process)
that is the basis of the planning and
development of the curriculum,
includes all the study work (lectures,
practical classes, individual learning,
assessment and evaluation, school prac-
tice, etc.) necessary for the processing
and acquisition of a coherent part of the
study material (subject or subjects). In
fact, the modular curriculum system
represents the basis of the credit sys-
tem. The credit-based modular systems
carry in themselves the joint advantages
of the credit and modular systems.
3. Flexibility: The modules can elastically
adapt to the many-faceted student com-
munity, to the rapid development of the
sciences, and to the ever-changing
needs of the labor market.
4. Motivation: The success assured by eli-
gibility, the opportunity of forming an
individual path of life, and the effective
learning guidance can considerably
increase the inner motivation of stu-
dents, the appearance of a positive
attitude, and responsibility towards
learning.
5. Wide availability: With modularization
it is possible, on one hand, for pre-
paredness of candidates and the require-
ments of the study programs to meet.
On the other hand, in the measure of the
individualization of training and the
elaboratedness of the learning guidance
procedure and resource systems, it
decreases the number of necessary
contact hours and increases the ratio of
individual learning.
6. Adaptivity of curricula: The module as a
unit element (e.g., the standard module
comprises a workload of 90 hours of total
learning) can, in principle, be inserted
anywhere in the curriculum, or can be
changed, transformed, upgraded, etc.
7. Enhancement of credit accumulation
and transfer: Modularized courses are
characterized by the fact that the credit
is allocated to the module, and the suc-
cessful accomplishment of a certain
module means the acquisition of the
allocated credit points (e.g., if one mod-
ule = 90 hours total learning workload
and 1 credit = 30 hours total learning
workload then 1 module = 3 credit
points). Thus, the credit accumulation is
achieved through the accomplishment
of the modules, while possibility of the
transfer (transferability, accountability)
supposes modules with identical (to
min. 75%) content among training pro-
grams, degree courses, and institutions.
8. Cost efficiency: As a result of wide
availability, the cost efficiency is
improving, but the elasticity has its own
price. Cost efficiency can be improved
if we apply "common" modules in dif-
ferent study programs.
9. Promotion of the concept of lifelong
learning: The knowledge acquired in
different training forms, places, and
time, as well as the accountability of
the practical placement, "requires" the
modular and credit-based curricular
form because this ensures the superpos-
ing of knowledge.
10. Open or distant education: Distant
education is the "traditional" training
30

Th
e J
ou
rna
l of Te
ch
no
log
y Stu
die
s
form built on modules in the shape of
learning packages, which include most
of the functions of learning guidance
taken over from the teacher, with the
assurance of consultation possibilities.
11. Spreading of information and commu-
nication technologies: They promote
the re-thinking, re-formulation of the
teaching materials and forms of deliv-
ery (teaching and learning) connected
in most cases with distant education
and/or modularization.
12. Enhancement of pedagogical innova-
tion: Modularization, the development
of learning guidance procedures and
modern teaching materials, has repre-
sented the basis of the pedagogical
renewal in higher education throughout
the world, which can lead to the
achievement of the change of concept
and role (change of paradigm).
Active, independent student work is in the
center of the process. From among the condi-
tions of the effective achievement of the inde-
pendent student learning activity, we can point
out the following:
• Necessity of the development of learning
abilities.
• Elaboration of a system of individual and
group study problem solving (literature
processing, exercises, projects, etc.).
• Decreasing to reasonable levels the fixed
weekly number of hours ("contact
hours").
• Working-out of a procedure and device
systems for guided learning (learning guid-
ance, additional learning materials, etc.).
• Upgrading of the assessment and self-
assessment systems.
• Creation of a modern learning environ-
ment (computerized infrastructure,
library, laboratories, tutorial system, etc.).
Quality Thinking In EducationA focus of institutional strategic manage-
ment in higher education includes the demands
of the stakeholders: students, staff, employers of
graduates, government, and society (Bonstingl,
1997). This new way of thinking of quality in
Hungarian higher and public education is char-
acterized by some new programs:
• Hungarian Accreditation Committee
organizes the evaluation of training pro-
grams and institutions in higher education
(started in the mid 1990s).
• COMENIUS 2000 Quality Improvement
Program aims at the implementation of
the principles and practice of TQM in
public education (started in 2000).
Preparation for these tasks is built in the train-
ing of technical teachers at DP. The quality devel-
opment process was supported, among others, by
a three-year TEMPUS-JEP project (1996-99).
The project has essentially achieved its
objectives:
• The introduction of quality thinking into
strategic management.
• The addition of one or more quality sub-
jects in all of the main study areas at DP.
• The development of a new special course,
Quality Control, consisting of 12 quality
modules in the 3.5 year Technical
Manager degree program.
• The development of a quality system at
DP as well; the project helped to estab-
lish the Quality Assurance Office at DP.
SummaryThe experiences of the modular and credit-
based curriculum and cooperative training
developed and introduced at DP have convinc-
ingly proved that, within the conditions of mass
education, it is suitable for preserving the quality
and, in the case of elaboration of learning
guidance methodologies, for improving it. We
believe that this pilot program of model value
can offer useful experiences for the develop-
ment of Hungarian higher education.
Meanwhile, the Dunaujvaros and interna-
tional experiences have also called attention to
the fact that the introduction of the modulariza-
tion and of the credit system is not merely the
question of decision, but it is a thoroughly
prepared activity that requires a definitely con-
trolled development work lasting many years.
The new type of study materials (learning
31

Th
e J
ou
rna
l o
f Te
ch
no
log
y S
tud
ies
guide, course textbooks/workbooks, self-evalua-
tion/assessment tests, exercises, electronical
study materials, open and distant learning mate-
rials, etc.), the alternative approach to the
effective teaching-learning methods, the upgrad-
ing of the assessment and evaluation strategies,
and the learning-centered, student-centered
thinking itself require from the teachers the
development of new skills instead of the
customary traditional teaching activity. This can-
not be efficient without a total quality improve-
ment circle of the teaching-learning process.
Dr. László Kadocsa is a Professor and Vice-Rector at the College of Dunaújváros, Hungary
Dr. Imre Kopp•ny is an associate professorand head of the Institute of MechanicalEngineering at the College of Dunaújváros,Hungary
32
References
Altbach, G. P. (1991, Spring). Patterns in higher education development: Towards the year 2000.Review of Higher Education, (14), 190-203.
Badley, G., & Marshall, S. (1995). 53 questions and answers about modules and semesters.
Bristol, United Kingdom: Technical and Educational Services.
Bonstingl, J. J. (1997). Schools of quality: The application of total quality management at schools.Nyíregyháza, Hungary: SCHOOL Bt.
Burkhart, S. (1996). Vocational training in Europe: Towards a modular form? (Discussion paper).Thessaloniki, Greece: European Center for the Development of Vocational Training. European Commision. (1998, March 31). European credit transfer system: ECTS users’s guide. Retrieved from http://europa.eu.int/comm/education/socrates/guide.en.dor
van den Berg, M. (1996). Working on a new learning environment. Eindhoven, The Netherlands: Pedagogisch Technische Hogeschool Nederland.
Web-Based Continuous OutcomesAssessment: A Pilot Study
Outcomes assessment and continuous
improvement are essential elements of educa-
tional programs. Emphasis on assessment is
based primarily upon the requirements of
accrediting agencies, but also on the perceived
value of assessment in satisfying the demands
for accountability in an increasingly competitive
environment. Educational research has shown
that measurement of educational outcomes can
be used to inform an institution about educa-
tional goals that are being satisfied and those
that are not. This information can motivate and
direct efforts to improve curricula.
In practice, the measurement of educational
outcomes is challenging and can be expensive.
Results are often ambiguous or statistically
unsound. The positive impact of continuous
improvement on the curriculum is difficult to
prove (Allen, Noel, & Rienzi, 2000). Despite
the difficulties and expense, accrediting groups
and other agencies have mandated outcome
assessment and continuous improvement. Of
special note are new criteria by the
Accreditation Board for Engineering and
Technology (ABET). The new criteria rely
Outcomes Assessment: A Pilot StudyBy Bill Drake and Douglas Walcerz

Th
e J
ou
rna
l of Te
ch
no
log
y Stu
die
s
extensively on outcome assessment for accredi-
tation, and there is a need for efficient and
effective assessment processes to satisfy these
requirements. These same outcomes are also
applicable to many other programs, including
those accredited by the National Association for
Industrial Technology (NAIT), North Central
Association of Colleges and Schools (NCA),
and other accrediting groups. This article
describes a pilot study of the implementation of
a Web-based (TrueOutcomes©) assessment
process in a technology program and examines
the effectiveness of the process in terms of stu-
dent and faculty buy-in and whether the process
produces useful data and reports for accredita-
tion and continuous improvement.
We qualitatively measured the following:
• Difficulty of learning the assessment
process for instructors and students.
• Quality of the descriptions of educational
experiences submitted by students.
• Ability of students to categorize their expe-
riences according to educational outcomes.
• Usefulness and appropriateness of the
assessment process and reports.
We quantitatively measured the level of
participation of those students who participated.
TrueOutcomes (formerly EnableOA) is a
Web-based, software-driven outcomes assessment
process that was designed to be consistent with
the nine Principles of Good Practice for Assessing
Student Learning, an online publication by the
American Association for Higher Education
(AAHE, n.d.), and the Program Evaluation
Standards developed by The Joint Committee on
Standards for Educational Evaluation (1994).
The TrueOutcomes process (Walcerz,
1999a, 1999b) collects both descriptions of
educational experiences that instructors intend
for their students and descriptions of educational
experiences that students perceive they have
received from their instructional experiences.
Instructors prepare the former and students
develop the latter. Every outcome description is
associated with one or more of the educational
outcomes developed by the instructor. Students
are encouraged to attach electronic copies of
their actual work (e.g., reports, PowerPoint
presentations, CAD files, spreadsheets,
programs, digital pictures of design projects,
etc.) to support their descriptions. The outcome
descriptions submitted by instructors are used to
generate a matrix of coursework vs. educational
outcomes that can be used in curriculum planning
and evaluation. The descriptions that are submit-
ted by students serve two primary purposes:
1. Students develop and maintain a person-
al electronic portfolio that serves as an
extended resume and can be used for
professional advancement. The useful-
ness of this extended electronic resume
is the primary motivation for students to
participate in the assessment process.
2. The descriptions are aggregated for a
specific course or set of courses to see if
students perceive and report the instruc-
tor’s intended educational outcomes.
The Department of Industrial Management
at Southwest Missouri State University (SMSU)
offers a baccalaureate degree in industrial man-
agement (IM) with concentrations in construc-
tion and manufacturing management. The IM
program enrolls about 300 students. The fall
2000 pilot study was conducted in two courses:
Fundamentals of Engineering Drafting (TEC
110) and Industrial Safety (TEC 250). In the
spring 2001, courses in Statics and Materials
Testing were also piloted.
TEC 110 is a typical freshman-level draft-
ing course in which CAD skills, sketching
skills, and orthographic and isometric drawing
techniques are practiced. TEC 250 is a sopho-
more-level course that meets one evening each
week for three hours and is populated mainly by
young adults with full-time jobs. The course
emphasizes management of occupational safety
programs.
Three accrediting agencies were associated
with this study. Two directly impact SMSU and
the third was included because of its impact on
the development and application of the soft-
ware.
Those agencies and their impact are briefly
described here.
33

Th
e J
ou
rna
l o
f Te
ch
no
log
y S
tud
ies
NAIT accredits the SMSU industrial
technology program and has the following
requirements with respect to assessment that are
taken from the industrial technology accredita-
tion handbook:
Assessment Plan and Integration: An
assessment plan shall be comprised of, but
not limited to, the following for each pro-
gram: (1) program mission statement, (2)
the desired program outcomes/student com-
petencies, (3) evidence that the program
incorporates these outcomes/student com-
petencies, (4) the assessment measures used
to evaluate
student mastery of the student competen-
cies stated, (5) compilation of the results of
the assessment measures, and (6) evidence
that these results are used to improve the
program. (NAIT, 2000, §§ 5.16 & 6.16)
NCA accredits SMSU as an institution and
defines five criteria for accreditation and pat-
terns of evidence to demonstrate the criteria.
Statements relating to assessment are:
Criterion 3: The institution is accomplish-
ing its educational and other purposes.
In determining appropriate patterns of
evidence for this criterion, the Commission
considers evidence such as:
. . . assessment of appropriate student
academic achievement in all its programs,
documenting: proficiency in skills and
competencies essential for all college-edu-
cated adults; mastery of the level of knowl-
edge appropriate to the degree granted;
control by the institution's faculty of evalu-
ation of student learning and granting of
academic credit.
Criterion 4: The institution can continue to
accomplish its purposes and strengthen its
educational effectiveness. In determining
appropriate patterns of evidence for this cri-
terion, the Commission considers evidence
such as:
. . . structured assessment processes that are
continuous, that involve a variety of institu-
tional constituencies, and that provide
meaningful and useful information to the
planning processes as well as to students,
faculty, and administration. (NCA, 2000, p. 9)
ABET has the following requirements with
respect to assessment taken from criteria for
accrediting engineering technology:
Programs must have written goals that, as
a minimum, focus on the student body served,
employer expectations, resource allocation, and
other factors affecting the program. Programs
are required to have plans for continuous
improvement and evidence that the results are
applied to further development and improve-
ment of the program. Each program is required
to demonstrate achievements through various
methods including student outcomes assess-
ment and employer feedback. Typical evidence
may consist of student portfolios including
project work and activity based learning;
results of integrated curricula experiences;
nationally-normed subject content examina-
tions; recent graduate surveys that demonstrate
graduate satisfaction with employment includ-
ing career development activities, mobility
opportunities, and appropriate job title; and
employer surveys that demonstrate satisfaction
with recent graduates. Programs also must
demonstrate that their graduates are readily
accepted into the workforce and are prepared
for continuing education. (ABET, 2000,
Criteria 1 & 6)
ABET developed and has introduced the
following objectives as a part of Engineering
Technology Criteria 2000 (ET2K). We believe
that these objectives are compatible with the
NAIT accreditation requirements. Since these
outcomes were already developed and ready for
use, they were adopted for this pilot study. The
ABET objectives for graduates are:
1. Demonstrate an appropriate mastery of
the knowledge, techniques, skills, and
modern tools of their disciplines.
2. Apply current knowledge and adapt to
emerging applications of mathematics,
science, engineering, and technology.
3. Conduct, analyze, and interpret experi-
ments and apply experimental results to
improve processes.
34

Th
e J
ou
rna
l of Te
ch
no
log
y Stu
die
s
4. Apply creativity in the design of sys-
tems, components, or processes appro-
priate to program objectives.
5. Function effectively on teams.
6. Identify, analyze, and solve technical
problems.
7. Communicate effectively.
8. Recognize the need for and possess the
ability to pursue lifelong learning.
9. Understand professional, ethical, and
social responsibilities.
10. Recognize contemporary professional,
societal, and global issues and are
aware of and respect diversity.
11. Have a commitment to quality, timeli-
ness, and continuous
improvement.(ABET,2002)
In addition to NAIT and NCA, the state
legislature, the State Coordinating Board for
Higher Education, and the university adminis-
tration all encourage verifiable assessment.
Implementation Outcomes Assessment Solutions (formerly
Enable Technologies), an application service
provider, established an application Web site for
SMSU on their Web server. Therefore, the insti-
tution did not need to buy hardware or software.
Outcomes Assessment Solutions was provided
with a spreadsheet containing the names of the
courses, the instructor, and rosters of students
participating in the pilot study. They then
imported this information into the software to
establish accounts for all the involved students
and the instructor. The 11 pre-existing educa-
tional outcomes defined by ABET ET2K were
also entered into the software.
Instructor intentions were composed for the
fall courses, in consultation with Dr. Walcerz,
the service provider representative. In the spring
course, intentions were added independently by
the instructor. The objectives intended for the
students taking the courses were compared with
the previously listed ABET-TAC standards. This
exercise was found to be helpful in better defining
course objectives. This process exposed intended
outcomes that had not been well formulated and
also revealed that course content was much
broader in scope than was initially perceived.
Examples include:
• Intended outcome: Students will learn to
utilize computer aided design (CAD)
software. This matches Outcome 1:
“Demonstrate an appropriate mastery of
the knowledge, techniques, skills, and
modern tools of their disciplines.”
• Intended outcome: Students will develop
sketching skills, which addresses this
same standard.
• Intended outcome: Students will work in
small groups to check each other’s
drawings before final submission. This
matches Outcome 5: “Function effectively
in teams.”
The lack of submissions for last outcome
emphasized that specific instruction in team
building is needed for teamwork to be an outcome.
TEC 250, the industrial safety course,
addressed different standards. In one instance
we were able to take advantage of the global
safety officer for General Electric fractional
horsepower motor plants, who had just returned
from a visit to a new manufacturing plant in
India. We learned from her that their method for
transferring concrete is significantly different
than the concrete pumps we now find so famil-
iar in the United States. In India women were
engaged to transfer concrete by climbing lad-
ders carrying the concrete, balanced in baskets,
on their heads. This unintended consequence
addressed the ET2K Outcome 8: “Recognize
contemporary professional, societal, and global
issues and are aware of and respect diversity.”
Working in groups to develop reports and
requiring many brief written reaction papers
addresses Outcome 7, “Communicate effective-
ly,” as well as Outcome 5, “Function effectively
on teams.” Communication with Blackboard
software and associated e-mail techniques is
another example accomplishing Outcome 1,
“Mastering modern tools of their disciplines.”
The process of working through course
objectives and comparing them to the outcomes
yielded a much better appreciation of how the
objectives fit into the overall scheme of devel-
oping, to use the campus vernacular, “an edu-
35

Th
e J
ou
rna
l o
f Te
ch
no
log
y S
tud
ies
cated person.” The process of formulating these
objectives and associating them with the ET2K
standards initially took about one hour for each
course. This involved reviewing the course
syllabus and text(s) to identify what reasonable
outcome objectives might be, creating instructor
intended outcomes (word processing software
recommended), and copying outcomes into the
TrueOutcomes software.
Collecting Student DataWe presented the assessment software to
students in two different ways. Because the TEC
110 class is a combination lab/lecture format,
we were able to present the software to students
as a laboratory exercise. After the first major
test, the students were provided a set of instruc-
tions that directed them through help menus in
the TrueOutcomes software. The students
reported that these instructions were easy to
follow and, after reading the introductory mate-
rial, proceeded to make entries. Later analysis
revealed that they were not all successful in
making entries.
The same instructions used for TEC 110
were distributed to the TEC 250 class via e-mail
and the Internet using Blackboard software. Later
discussion with an informal sampling of students
indicated that the TrueOutcomes “Help” process
was easy to follow. However, analysis with the
software indicated that only a little over 50% of
the students successfully submitted entries.
Speculation is that some students had failed to
complete the submission process by missing a
common last step . . . clicking the Submit Button.
Student Participation in theAssessment Process
A total of 37 students participated in the
fall assessment process in two courses.
Seventeen students submitted from one to three
experiences to their electronic portfolios. In the
software a color bar chart, Student Responses,
provides data on student participation and indi-
cates the percentage of students submitting
experiences as well as the number submitted. In
general, about one third of the students did not
participate at all; one half submitted a single
experience, and one sixth submitted multiple
experiences. The apparent lack of participation
may have been related to not clicking on the
Submit Button as entries were made. This theo-
ry is reinforced by the observation that the TEC
110 students who were observed in a lab
exercise had lower overall participation than
the TEC 250 class.
Quality Analysis of Student NarrativesIn order to participate in the assessment
process, students had to compose narrative
statements of their classroom experiences,
focusing on concrete descriptions of what they
had done rather than conclusions about what
they had learned. This cognitive engagement in
the evaluation process is one of the most valu-
able attributes of this assessment system. A total
of 26 narratives were submitted in the fall and
analyzed for quality. Good narratives were
written in first person, described the student’s
work in good detail, and dealt with a single
experience or a group of thematically related
experiences. An example:
. . . a trip to the . . . plant and I got to
observe first hand . . . safety and health pro-
cedures on the job. . . . this trip it gave me
a[n] understanding on what should be done
in order to keep the company you work for
safe, and this is what this class is all about
understanding what it takes to keep the com-
pany you work for safe, so you don't have
lost work days, have to pay workerman's
[sic]comp, hire a replacement . . . and pay
for overtime to catch up for the absents [sic]
of a[n] employee. You need to have an
understanding of safety and health, on the
job, or it could cost the company a lot of
money in hidden costs. With the tour . . . I
saw a company with good safety procedures,
in the employee's working environments . . .
Moderate narratives were written in first
person, did not have enough detail, and
sometimes included a collection of unrelated
experiences. For example:
Recently we took a tour of a local manufac-
ture[r]. I thought the trip was a good idea
and very informative. I It [sic] was well
worth the time to do so. It would be great if
more such trips were possible.
Poor narratives were either too short (e.g., a
36
Th
e J
ou
rna
l of Te
ch
no
log
y Stu
die
s
single 3-word phrase) or talked about what the
student learned instead of what he or she did.
Example:
I feel that TEC 250 is a valuable course and
all industrial technology majors should take
it or something close to it. Safety should be
a huge part in the industry, however it is not
always a main priority. I think all managers
should be trained in the safety arena.
An analysis of the students’ narratives
revealed 11 good quality narratives, 10 moder-
ate narratives, and 4 poor narratives. The
quality analysis of student narratives showed a
substantial variation in quality between courses:
TEC 250 had nearly 70% good quality narra-
tives, while the TEC 110 class had nearly 70%
medium to poor narratives. TEC 250 had more
nontraditional students; therefore, student
maturity would be expected to influence
narrative quality. The software also provides a
graphical display of the quality analysis.
For every experience students submitted,
they selected the educational outcome that
reflected their individual narrative. Our analysis
showed that a majority of students selected too
many outcomes; in other words, students
selected outcomes such as “an ability to func-
tion on teams” when their narrative contained
no mention of teamwork at all. A graphic show-
ing Response Appropriateness is also provided.
We found nearly 70% selected extraneous
outcomes. Clearly more training in the use of
the system is indicated. We believe this is con-
sistent with the customary “mark sense” course
evaluations where no active thought processes
might be engaged. The cognitive engagement
potential made available with this system could
clearly provide some benefit in assessment.
The TrueOutcomes software automatically
generates assessment reports based on the
descriptions of experiences that students and
instructors submit. A bar-chart presentation is
available showing the percentage of students
submitting experiences related to each of the 11
outcomes and the number of experiences related
to that outcome. According to the data analysis,
the percentage of students who perceived and
reported at least one significant educational
experience demonstrating “an ability to commu-
nicate effectively,” “an ability to function on
teams,” “an understanding of professional, ethi-
cal, and social responsibility,” and “an ability to
identify, analyze, and solve technical problems”
was 53%, 42%, 42%, and 37%, respectively. If
we only consider the students who participated
in the assessment process, the percentages are
77%, 62%, 62%, and 54%, respectively. If the
quality of the student narratives was moderate
or good and the students were able to select
appropriate outcomes, then it is patently clear
evidence that TEC 250 is developing those four
outcomes to a substantial degree and other
outcomes to a lesser degree.
The software also allows an instructor to
“drill into” any of the outcomes to read the stu-
dent narratives, review the selected outcomes,
view attached documents, and thus to check the
validity of the data. As discussed previously,
the quality of narratives in TEC 250 was quite
good, but the selection of outcomes often
included more than the narrative justified.
However, the raw evidence, the student narra-
tives and attached documentation, is available to
the instructor for assessment purposes.
A standard matrix of technology courses vs.
the outcomes they are designed to develop is
also available. Across the top of the matrix are
the 11 educational outcomes. Down the first
column are listed all of the technology courses
offered. The cells of the matrix are either blank,
which means that the instructor does not intend
to develop the associated outcome in that
course, or else a 100%, which means that all of
the students in the associated course have an
instructor intending to develop the associated
outcome. TrueOutcomes uses percentages
instead of the more common “Xs” because
some courses are not uniform across all sections
and instructors. For example, one section may
have an instructor who uses project teams, thus
developing teamwork, while another section of
the same course may have an instructor who
does not. If there are 60 students in the former
section and 40 in the latter, TrueOutcomes will
report 60% in the cell associated with teamwork
and that course.
When comparing experiences submitted by
37

Th
e J
ou
rna
l o
f Te
ch
no
log
y S
tud
ies
students with experiences intended by the
instructor, it was clear that the instructor’s
intentions were fulfilled with respect to the
outcomes relating to teamwork, communication,
and professional responsibility. The instructor’s
intentions were partially fulfilled with respect to
outcomes relating to knowledge and tools, and
commitment to quality. The intended outcomes
of global issues and lifelong learning were not
being well met. It is interesting to see that a
large percentage of students reported developing
problem solving, when this was not an intended
outcome of the course. This initial analysis
must be tempered by the knowledge that most
students selected extraneous outcomes, so
“drilling into” the reported experiences will be
necessary to verify the results until students
become more familiar with the process.
The ability to see what was happening as
the term progresses is most intriguing. This
“real time” access to student perceptions allows
adjustments with current students as opposed to
the standard end of term evaluation. This is
preferable to having input that can only be
applied to the next group of students. The fact
that students have to be cognitively involved
with this process also provides much better
insight into evaluations.
ConclusionsThe software and process were straightfor-
ward to learn and use for both the instructor and
students. Student participation and the quality
of student submissions were acceptable but not
as good as desired. Analytical reports provide
meaningful feedback and can be used to docu-
ment the continuous improvement process for
accreditation purposes. The process does not
require an excessive time commitment on the
part of the instructor. Students can access the
software at their convenience in addition to the
creation of a portfolio of personal achievements
that may be of value in future endeavors.
The effort required to set up the
TrueOutcomes program is balanced by the pro-
vision of in-depth insight into the educational
process. That insight, into the way that activities
engage students and address outcomes, provides
new opportunity by emphasizing areas where
improvements can be made.
William H. Drake is an associate professor
of industrial management at Southwest Missouri
State University. He is a Member-at-large of
Epsilon Pi Tau.
Douglas Walcerz is an associate professor
of mechanical engineering at York College of
Pennsylvania.
38
References
Accreditation Board for Engineering and Technology ,Technology Accreditation Commission. (2000).Criteria for accrediting engineering technology programs. Retrieved April 2002 fromhttp://www.abet.org/downloads/2000-01_Engineering_Technology_Criteria.pdf (No longer available from this Web Site; http://www.abet.org/criteria.html shows current TAC criteria.)
Allen, M. J., Noel, R. C., & Rienzi, B. M. (Eds.). (2000). PACT outcomes assessment handbook.Bakersfield: California State University, Program Assessment Consultation Team.
American Association for Higher Education. (April, 2002). Principles of good practice for assessingstudent learning. Retrieved April 2002 from http://www.aahe.org/assessment/principl.htm
The Joint Committee on Standards for Educational Evaluation. (1994). The program evaluation standards. Thousand Oaks, CA: Sage.
National Association of Industrial Technology. (2000). Industrial technology accreditation handbook.Retrieved April 2002 from http://www.nait.org/accred/accreditationhandbook.html#1
North Central Association of Colleges and Schools. (2000). The criteria for accreditation. Retrieved April 2002 from http://www.ncacihe.org/overview/2001HLCOverview.pdf
Walcerz, D. B. (1999a). EnableOA: A software-driven outcomes assessment process consistent with the principles of good practice for assessing student learning. Paper presented at the AmericanSociety for Engineering Education Mid-Atlantic Conference. Retrieved April 2002 fromhttp:www.trueoutcomes.com/ASEE%20Monmouth.pdf

Th
e J
ou
rna
l of Te
ch
no
log
y Stu
die
s
39
Walcerz, D. B. (1999b). A new, time-efficient, high quality outcomes assessment process. Paper presented at the American Society for Engineering Education North Central Conference.Retrieved April 2002 from http://www.trueoutcomes.com/ASEE-Erie%204.9.99.pdf
Electronic Course Delivery in Higher Education:Promise and ChallengeBy John W. Sinn
Philosophical, political, quality, learning,
and instructional challenges are being encoun-
tered as higher education institutions respond to
pressures and enticements of the World Wide
Web and the Internet. My involvement with
electronic instruction, almost from the infancy
of that process, provides a basis for my views
on these challenges. I discuss these under four
headings: In Higher Education, Teachers and
Learners, Gifts of Electronic Instruction—A
Review, and Ensuring Quality.
In Higher EducationInstitutional policy, systems, and infrastruc-
ture developed over the years to support
ongoing programs must change. Not only must
traditional efforts be continued, but electronic
instruction should be facilitated, governed, and
integrated. In doing so, most ongoing activities
exemplified by staff meetings, registration,
bursar billings, or the bookstore will need to be
changed as will virtually every activity of
institutional life.
As the reach of instruction is extended
outside the university walls, standards, systems,
and policies will not only become linked via
electronic means but will accommodate new
modes of delivery. The university may also find
that in order to deliver its instruction beyond its
walls, it must understand and work within state,
national, and even international laws. New
issues of ownership and copyright and security
of courses will require more and different sorts
of attention and expertise in the new environ-
ment (Perley & Tanguay, 1999).
State Governing or Coordinating Boards
As with individual institutions, the state
legislators and public higher education govern-
ing or controlling boards must consider their
policies and attitudes of support or nonsupport
for credit and courses offered out of state and
the country by constituent universities. Such
developments have implications for partnerships
between institutions that are distant from one
another, which may require state and possibly
national government approval.
Many states support their higher education
system on some sort of formula system that
results in a subsidy to institutions. Electronic
instruction introduces issues that need to be
carefully and thoroughly investigated, under-
stood, and planned for. There may be a danger
in applying a formula used for traditional
instruction to support electronic instruction.
The flexibility of electronic instruction goes
beyond consideration of changes within existing
institutions. For example, implications for
course loads, up or down, and how to address
these in the electronic environment, along with
many other questions about the role of faculty,
must be assessed in various models. State gov-
erning agencies must give heed to the notion
that new types of institutions and even entirely
new state or proprietary university systems may
be on the horizon. These may be based on para-
digm shifts influenced by electronic instruction
and yield, for example, creative ventures such as
transfer credits among two- and four-year insti-
tutions, as well as high schools. Since electronic
Th
e J
ou
rna
l o
f Te
ch
no
log
y S
tud
ies
delivery “levels the playing field,” in a
geographic sense, playing in each other’s “back
yard,” consortial arrangements among different
institutions across regional, state, and even
national boundaries become physically possible.
One example of such an arrangement is the
Indiana State University Technology
Management Ph.D. Consortium. Involving
several universities in various states, the
consortium is primarily electronically delivered
to focus on several specializations, including the
quality systems specialization which the author
has been engaged with (Sinn, 2002b).
The Individual University or CollegePrimarily residential campuses must
become concerned with electronic courses, and
their institutional mission should address non-
traditional electronic delivery issues. The
advent of electronic courses delivered anywhere
poses serious questions about how to deal with
and enable youth to mature and develop the
social and intellectual skills that the undergradu-
ate colleges have been providing. Thus, goals of
institutions must continue to focus on attracting
the best and brightest faculty and students, but
also enable them to engage via electronic or tra-
ditional methods. The two approaches should
not be considered exclusive of one another. On
the other hand, blending them into a cohesive,
effective university experience may not be a
trivial matter. One approach for this is offered
in learning communities for our future, both
physical and electronic in nature.
Capital Resources
Another consequence of the electronic rev-
olution is determining the flow of resources to
affect the best use of bricks and mortar and the
electronic infrastructure. Questions about
whether buildings and, perhaps more important,
the types of buildings that will be needed to
support instruction in the future must be
addressed.
In this regard, infrastructure shifts must be
better anticipated, and future planning must
enable rapid implementation and a speed-up of
project implementation in order to accommo-
date the changes that will continue to happen
quickly in electronic communications. Thus,
institutional planners must acknowledge that
technology for electronic delivery will increas-
ingly drive the process. Daniel (1997) noted
this situation when he said:
We are engaged in a battle. The world’s uni-
versities are in a crisis, assailed by challenges
of access, cost, and flexibility. The United
States has the world’s strongest university
system, and the world looks to it for leader-
ship. Yet your system is wedded to teaching
technologies that make it difficult for you to
successfully respond to the crisis. (p. 17)
Daniel advocated a technology strategy to
provide access and flexibility, but at the same
time assure integrity in systems.
Hardware/Software
Hardware and software must be in place
and configured to seamlessly enroll students in
and start up an entire course via the Web. This
process should be enabled from any location,
without need to be on campus and without
major intervention or inconvenience to student
or faculty. Because of the importance of
supporting courses, institutions need to ensure
that servers for that purpose are separate from
servers devoted to other administrative and
e-mail uses. Doing so recognizes the “bread
and butter” nature and appropriate stature of
electronic teaching and learning.
Innovative models must be developed that
offer faculty incentives to seek out and use new
hardware and software delivery systems.
Costs, convenience, conformity, and allowance
for future change of hard and software must be
balanced in light of higher education’s limited
resources. Economies may be realized in shifts
from bricks and mortar to virtual systems and
merging traditional institutions and functions to
reduce duplication. Other economies may be
realized in leasing laptop systems rather than
outright purchase and maintaining traditional
labs with desktop technology. Costs of provid-
ing current desktop technologies per user must
be determined and desktop setups reduced,
enabling funds to be rolled over toward laptops.
Doing this successfully will add flexibility
inherent in laptops over the time and place-cen-
tered desktops (Waggoner, Sinn, Kennedy,
Zargari, Corbett, 1997).
40

Th
e J
ou
rna
l of Te
ch
no
log
y Stu
die
s
Teachers and LearnersChanges that may be observed in the uni-
versity are primarily found in redefined roles in
teaching and learning. These are reflected in
changes in the “presence” of faculty that may
occur through real physical presence or through
a virtual or electronic presence. Students may
become more self-reliant and autonomous,
acquire knowledge differently, and be account-
able in different ways. Course flexibility and
configuration changes occur, and means of stu-
dent, faculty, and course assessment become
different.
Redefined Roles—Faculty as Instructors
Physical presence no longer means a pro-
fessor standing in front of students to lecture or
conduct other traditional classroom activities.
The professor’s electronic presence is defined
and accomplished by the use of various media
such as digital documents, chats or video, or
camera projection with audio.
Traditional teaching requires a physical
presence and direct emotional involvement,
whereas electronic delivery provides a detach-
ment in discreet ways. Lectures, exams, struc-
tured meetings in one location, and other meth-
ods are basic traditions that we have come to
accept as the “way things are to be done.” We
are reminded that in a number of instances the
traditional lecture was suggested as being one of
the worst methods, despite the reality that most
of us have relied heavily on this approach.
Electronic courses demand structure.
Although planning and structure have been
expected for teaching of traditional courses, it is
possible to do a traditional lecture ill prepared
and meandering, and even sometimes appear to
be well prepared. Electronic instruction
demands articulated and integrated preparation.
The instructor’s presence is in fact the electronic
configuration, and it is possible that in such
courses the instructor will be able to work at
home or in an office rather than in a classroom
populated with students, each at his or her desk.
Thus the instructor’s role becomes redefined.
Faculty must organize and facilitate highly struc-
tured and orchestrated systems. They must
rethink the entire teaching and learning processes.
Focus moves from the teacher as a lecturer at the
center of attention to that of a facilitator and
course designer, almost entirely focused on elec-
tronically delivered content and process.
Everything must be digitized or accessible
via the Web, and what was done verbally and
physically now must be formatted for students
to download or interact with in some structured
electronic manner. The goal is to have every-
thing navigable in a fairly seamless and articu-
lated manner by disciplined, computer literate
learners. This is not a simple matter, and it may
be resisted by faculty who dislike writing or
who may not wish to carefully think through the
design or redesign of a course.
Redefined Roles—Students asAutonomous Learners
Students become knowledge navigators,
independently engaged, knowing when and how
to “pick up the ball and run with it.” Traditions
such as skipping classes, whiling away hours
trivially, or using courses as social entrees do not
apply in the electronic venue where students
must navigate well-designed courses. Rather,
they must be highly disciplined, focused, and
goal oriented, able to work independently and in
sometimes ambiguous and nebulous ways.
Persons having difficulty working independently,
or having a low tolerance for reading carefully
and following structured, comprehensive instruc-
tions, may have difficulty in this intellectual
environment. Properly designed electronic cours-
es may cause those who really do not wish to be
engaged intellectually to indicate dissatisfaction
with the electronic environment, perhaps due to
not being “spoon fed” as they may have been in
the traditional classroom. On the other hand,
highly motivated, computer literate learners can
readily excel in the electronic environment.
Knowledge Acquisition
In Web courses, information and experience
as content and process can be posted to provide
a portfolio record of progress. Chat transcripts
can be recorded and posted, along with conver-
sations in e-mail. Disciplined growth of knowl-
edge actually unfolds in courses, with powerful
opportunities to assess teaching and learning,
seamlessly documented as portfolios. As
students do their work, it becomes streamed
41

Th
e J
ou
rna
l o
f Te
ch
no
log
y S
tud
ies
together, step-by-step, to clearly show how the
thought and intellectual process is formulated.
While some may be uncomfortable with how
“raw” this is, it cannot be denied that this “elec-
tronic dialogue” is the bottom line on when and
how knowledge is grown.
Accountability and Assessment ofStudents, Faculty, and Courses
Traditional accountability systems are less
applicable because students do not expect to
take “pop quizzes.” Attendance taking is auto-
mated, and information is manipulated rapidly.
Postings can be lost, and savvy computer users
may be capable of “borrowing” materials not
meant for them; thus, plagiarizing is a possibili-
ty. These can be defended against, as in
traditional teaching, if the electronic course and
systems of delivery are well thought out and
changed periodically to correspond to learners’
needs and to technologies of delivery.
Examinations and tests are dramatically differ-
ent from the traditional classroom setting as is
the entire system of accountability and assess-
ment of the learner and the course. Nontra-
ditional forms of documentation for assessment
will become increasingly called upon for
accountability of teams and individuals in
courses as we diminish traditional forms of test
taking based on traditional physical presence.
For example, a team of students focused on a
project may compile a portfolio of responses to
address a technical problem at an industrial
firm. The portfolio can document their progress,
replacing traditional examinations.
Electronic courses can be rigorous, well
designed, and structured. Robust team projects,
with reality-based professional requirements,
are very achievable in Web-based systems, per-
haps even better configured in this way than in
traditional courses. Engaging persons external
to the academy can be achieved with use of a
password. This enables projects and work
where the world truly “becomes the lab.”
Quality is readily measurable due primarily to
the highly documented nature of the course in
portfolio ways addressed and accessible as pre-
sented above. Further underpinnings and illus-
trations of innovative quality applications in
nontraditional lab environments were provided
by Olson and Sinn (1999) and Shipman and
Sinn (1997). It is suggested that the assessment
of courses and instructional quality must
become increasingly tied to the “deliverables”
produced by students, illustrative of the capacity
of the faculty to facilitate and empower emerg-
ing student talents, regardless of level, but par-
ticularly at the university. This also serves as an
excellent illustration to demonstrate that the role
of faculty, students, and the entire university is
changing as a function of electronic design and
delivery of courses.
Gifts of Electronic Instruction—A Review
Electronic delivery brings substantial flexi-
bility and agility to courses that are virtually
impossible in other instructional means. No
longer do individuals need to be on campus or
at the same location. People can be “hooked
up” at home, work, virtually anywhere. Class
meetings are more flexible in time, space, and
location, but if included in a course, electronic
chats require a common time and “room loca-
tion” analogous to traditional time and place of
traditional courses. All individuals involved will
need properly configured computer systems,
with laptops providing the greatest flexibility
and agility. Classrooms and their buildings as
we know them will decreasingly be required,
which will cause serious challenges to institu-
tional planners and administrators. Just as
business and industry work innovatively, profes-
sional and general university preparation will be
increasingly electronic, responding to customer
demands for flexible, rapid-moving information.
Electronic delivery may actually enhance
teaching and learning, and perhaps the basic cri-
teria for electronic instruction should be how it
will improve instructional effectiveness. With
electronic instruction and learning, (a) teachers
and learners should be better organized and
more efficient; (b) teachers and learners should
be more dynamic, flexible, and agile; and (c)
quality assessment should be enhanced and evi-
denced more readily. The overall positive effects
of electronic delivery may have a significant
influence on the evolution of the discipline of
technology (Sinn, 1998a).
Systems to connect and encourage research
initiatives for “growing knowledge” electroni-
42
Th
e J
ou
rna
l of Te
ch
no
log
y Stu
die
s
cally with our broader communities and cus-
tomers as part of the academy must be explored.
We must better analyze and identify learning
attributes assumed prevalent in various levels
and types of learners, relationship of maturity,
and so on. If we can better understand learners’
attributes or behaviors (Sinn 1997, 1998b) and
electronic systems’ attributes, perhaps we can
better match the two with resultant improve-
ment. Faculty and students may wish to be able
to select courses and approaches to instruction
as they discern what best suits their attributes
and behaviors, disallowing those they may wish
to avoid. All should be involved, required to
experience change, gaining preparation electron-
ically for the future, perhaps transparent, like
any other instructional approach (Sinn, 2000).
Ensuring QualityAssessment and evaluation are important as
we determine value added or detracted by tech-
nology. Technology can provide opportunities to
evaluate and assess traditional and electronic
courses and systems. If infrastructure is in place,
coursework built as portfolios can be communi-
cated for accreditation, course evaluation by stu-
dents and faculty, comparisons of electronic and
traditional (same) courses, among others. It is
possible to accredit, assess, and evaluate from a
distance, rather than being on campus, if all are
properly configured. As one important example,
library resources provide significant institutional
questions. Assuring that students have access to
quality information beyond (but including) the
Internet is key. Facilitating traditional print infor-
mation available on campus for distance con-
stituents fairly and equitably, engaging students
and faculty in evaluating and using information
from all sources, is the challenge.
Quality SystemsThe existence of a quality system assures
quality in electronic delivery. This necessitates a
paradigm shift of significant proportions,
beyond accreditation and assessment. But, if
done properly, the quality system can address
essential accreditation and assessment issues,
and help build a robust environment for elec-
tronic delivery. A viable quality system will
recognize the importance of faculty advising,
student organization professional involvement,
advisory committees, portfolios, alumni sur-
veys, cooperative education experiences, senior
projects, and other internal and external mecha-
nisms for assuring quality curriculum, all
electronically (Sinn, 2002a).
Do we understand the European Union’s
role in the International Standards Organization
(ISO) global drive for quality standards? What
promise do the ISO quality drive (Lamprect,
1992) globally, the Baldridge National Quality
Award in America (National Institute of
Standards and Technology, 2000), and other tra-
ditional quality issues such as Deming princi-
ples hold? A university-wide quality system can
be the basis from which accreditation and
assessment are conducted, all based on emerg-
ing standards and guidelines within the ISO
context (American Society for Quality, 2000).
The challenge may be to practice the Deming
principle of placing responsibility for quality at
the lowest level possible—in our environment
faculty—to provide mechanisms for assessment
and accreditation. As a quality system, this is a
major paradigm shift that must occur organiza-
tionally in order to be competitive in the future.
Quality systems must be at the curriculum and
course level to achieve goals inherent in assess-
ment and accreditation. Faculty must mesh
directly with point of contact connected to our
key customer, the student, in the quality system.
Recent winners of the first Baldridge awards
given in education underscore the depth and
importance of the development of quality sys-
tems in education at all levels (Daniels, 2002).
Electronic accreditation is being developed
by the Council for Higher Education
Accreditation (CHEA) with the Western
Governors University (WGU), designed to be
used and tested at various institutions. Standards
may be the same for all institutions, electronic
and traditional, and they must be applied uni-
formly to all (CHEA, 1999). Additional insights
were offered by Crow (1999) in an article in the
Chronicle of Higher Education. While we may
be vague on what the portfolio can do for the
overall process, understanding quality suggests
a very clear documentation role. Electronic
portfolio documentation, driven curricularly by
faculty, coupled with data collection, is a key
mechanism required for quality, particularly for
accreditation and assessment.
43

Th
e J
ou
rna
l o
f Te
ch
no
log
y S
tud
ies
The FutureThe primary recommendation is to pursue
ongoing development of infrastructure and qual-
ity electronic delivery of courses.
Fundamentally about change, the question is
how to equip faculty, students, and staff to work
electronically in a high quality manner. We must
collectively re-think policy and standards for
global quality systems and standards based on
ISO and Baldridge quality criteria, as related to
electronic delivery of courses. We must also
acknowledge that this can greatly benefit our
students, particularly by focusing on broad total
quality systems institutionally, and link assess-
ment, portfolios, and actual course evaluation
and improvement through this quality system.
As a fundamental principle of quality, it is
critical that we maintain courses similar to cur-
rent departmental functions, placing ultimate
responsibility for quality where it has always
been, and should be, with faculty. This must
occur simultaneously while the traditional
department and faculty role will change dramati-
cally, along with all that the university is about
in the context of process, becoming increasingly
electronic as well. Amidst all of the changes, the
easy reaction of some may be to seize control
of courses from faculty when, in fact, the tech-
nology and systems can and must facilitate
empowerment.
In all that we do we must strive to improve
hardware and software systems, relative to tradi-
tional systems, particularly courses and basic
services. Technology improperly used can facili-
tate the addage “garbage in-garbage out,” but it
also offers many opportunities for improvement
if we choose to develop infrastructure carefully
and in detailed ways. This ought not be viewed
as a trivial or simple task of implementation
only, but must be carefully matched alongside
faculty perceptions of what is critical to
enhanced delivery of teaching and learning, par-
ticularly in a process context.
We must better anticipate and plan for
change relating to electronic delivery. If we
make substantial changes in one area, we will
see implications for other areas of our work and
environment, and better strategic planning link-
ing all aspects of our work and environment
must be accounted for. As the customer base
gradually shifts from being physical and present
to electronic and virtual, the need for enhanced
planning systems will be increasingly critical.
This must begin with changes in how states per-
ceive their role in the educational process, and
consortial connections in broader infrastructure,
globally, to take better advantage of collective
resources and “best practices” at the local level.
As part of the change process, we must
intentionally build increasingly robust models to
optimize all that we are about via technologies
of course delivery, relating how we work, grow-
ing human capital and knowledge, ongoing
improvement systems to solve technical prob-
lems, and embracing classrooms well beyond
traditional brick and mortar precepts and tradi-
tions. This must also include designing, struc-
turing, and administering objective tests and
experiments, as assessments, of both electronic
and traditional teaching and learning scenarios
to assist all in better understanding where and
how to use all systems for best advantage.
Finally, changes should be done to improve
all that we do, not simply for the sake of
change. The immediate electronic delivery
opportunities that beckon must be pursued, but
only with careful and prudent consideration.
This challenges us to objectively use our knowl-
edge and experience to assess potential electron-
ic delivery changes as positive and value
adding. Change must occur, based on substan-
tive evidence evolutionarily pointing toward
improvements. Conventional wisdom suggests
that electronic delivery, while not applicable to
all we do, must be pursued for our future, but
primarily based on evidence of improvement.
Dr. John W. Sinn is a Professor in the
Department of Visual Communication and
Technology Education at Bowling Green State
University. He is a member of Alpha Gamma
Chapter of Epsilon Pi Tau and received his
Distinguished Service citation in 2002.
44

Th
e J
ou
rna
l of Te
ch
no
log
y Stu
die
s
45
References
American Society for Quality. (2000). Draft standard: Guidelines for education (BSR/ASQ-Z1.11-2000). Milwaukee, WI: Author.
Council on Higher Education for Accreditation. (1999). CHEA update number 2: Distance learningin higher education. Washington, DC: Author.
Crow, S. (1999, October 29). Virtual universities can meet high standards. Chronicle of HigherEducation, 66, B5-B6.
Daniel, J. (1997). Why universities need technology strategies. Change. 83, 11-17.
Daniels, S. (2002). First to the top. Quality Progress, 35(5), 41-53.
Lamprecht, J. (1992). ISO 9000: Preparing for registration. Milwaukee, WI: American Society forQuality Press.
National Institute of Standards and Technology. (2000). National quality program. Retrieved April2001 from http://www.baldridge.org
Olson, D., & Sinn, J. (1999). Update on applied quality science at BGSU, student-based researchfor technology transfer: Critical element for technologists. Journal of Industrial Technology, 15(4). Retrieved March 2001 from http://www.nait.org
Perley, J., & Tanguay, D. M. (1999 October 29). Accrediting on-line institutions diminishes highereducation. Chronicle of Higher Education, 66, B4-B5.
Shipman, M., & Sinn, J. (1997). Technology transfer, CQMA, and the future. Journal of IndustrialTechnology, 13(1), 40-45.
Sinn, J. (1997). Universal performance behaviors: What ought to be the technologist’s toolkit? Journal of Technology Studies, 23(2), 58-60.
Sinn, J. (1998a). Content to achieve industrial technologist performance behaviors. Journal of Technology Studies, 24(1), 38-41.
Sinn, J. (1998b). Discipline, research, future conversations with friends: Can we move quickly todetermine core knowledge? Journal of Industrial Technology, 14(4), 11-14.
Sinn, J. (2000). Proposal for taking the profession to the next level: Assessing core knowledgethrough online methods. Journal of Industrial Technology, 17(1). Retrieved April 2001 fromhttp://www.nait.org
Sinn, J. (2002a). Education and the future of quality. Quality Progress, 35(7), 69-73.
Sinn, J. (2002b). A quality major. Quality Progress, 35(10), 24-29.
Waggoner, T. C., Sinn, J., Kennedy, E., Zargari, A., & Corbett, R. (1997). Automating a liberal education technology course: Preliminary foundation for redesign. Journal of Industrial Technology,13(1), 35-39.

Higher education has initiated a variety of
educational reforms in an attempt to improve
the effectiveness of teacher education over the
last two decades. A major focus of the reform
movement has been professionalization of
schools that prepare educators. Metcalf-Turner
and Fischetti (1996) indicated that traditional
university approaches to teacher education were
inadequate primarily because of disengagement
between theory and practice. The need for
context-rich educational experiences in teacher
preparation is important in all teacher education,
but is imperative in the field of technology edu-
cation. Technology education demands a
co-mingling of theory and principles with
practice. Morris, Armstrong, and Price (1997)
stated that the present teacher education system
fails to equip preservice teachers for the
realities of the classrooms they will enter. The
challenge for technology teacher educators is to
embrace reform initiatives that bridge pedagogy
by encouraging the profession’s best teachers to
enter the teacher education faculty ranks, thus
keeping technology teacher education theory
current with classroom practice.
A key component of this educational
reform is technology teacher education faculty
versed in both practice and theory. To assist in
facilitating these changes, Brown (2002) noted
that 64% of the technology teacher education
programs surveyed indicated that they would
increase their faculty by one or more positions
over the next five years. However, Brown also
indicated that the field would be short an aver-
age of 25 qualified faculty candidates per year
and that these positions could go unfilled.
Without qualified technology teacher education
faculty, it will be very difficult for these educa-
tion reform efforts to succeed.
Graduate-level technology teacher educa-
tion has not kept pace with the need for quali-
fied faculty. The number of individuals pursu-
ing graduate studies in technology education,
focusing on teacher education, is at its lowest
level in five decades (Bell, 2001; Buffer, 1979;
Erekson & McAlister, 1988). According to
Brown (2002), the technology teacher education
profession is in short supply of qualified faculty.
Hill (2003) further noted that a shrinking pool
of faculty is compromising leadership for the
profession. Based on these trends, Volk (1997)
predicted that “the demise of technology teacher
preparation programs will occur around the year
2005” (p. 69).
Statement of the ProblemSince 1975, there has been a steady
decrease in the number of technology teacher
education graduates (Volk, 1997). This decrease
has been compounded by a significant increase
in the number of technology education teachers
needed across the nation (Weston, 1997). A
survey of technology education leaders rated
insufficient quantities of technology education
teachers and the elimination of technology
teacher education programs at the university
level as two of the most critical issues facing the
profession (Wicklein, 1993).
Volk (1997) noted that one factor in the
decline of university technology teacher educa-
tion programs has been the lack of graduate-level
prepared faculty to serve as technology teacher
education professors. Buffer (1979) found that
between 1955 and 1977 over 2,500 individuals
received a doctoral degree with emphasis in
industrial education, the predecessor of technolo-
gy education. A survey of the Industrial Teacher
Education Directory (Dennis, 1995, 1996; Bell,
1997, 1998, 1999, 2000) noted there were only
127 technology education doctoral degrees
awarded between 1994 and 1999. Buffer (1979)
further noted that there were 2,507 master’s
degrees awarded during the 1976-1977 academic
year. This number pales in comparison to the
6,700 master’s degrees awarded in 1938 (Buffer,
1979). Furthermore, an examination of the
Industrial Teacher Education Directory indicated
that only 209 master’s degrees in technology edu-
cation were earned in 1999.
Th
e J
ou
rna
l o
f Te
ch
no
log
y S
tud
ies
46Factors Influencing Participation in Technology Education Graduate StudiesBy George E. Rogers and Phillip L. Cardon

Th
e J
ou
rna
l of Te
ch
no
log
y Stu
die
s
Currently, there is a lack of information as
to the causes in the decline in technology
educators pursuing an advanced degree.
Without increasing the number of graduate
degrees in technology teacher education, the
baccalaureate degree major of technology edu-
cation may vanish and, consequently, technology
education courses will no longer be provided to
the nation’s middle school and high school stu-
dents. This research was an attempt to address
one of the major problems facing the technolo-
gy education profession: the lack of graduate
prepared teacher education faculty.
Significance of the ProblemAccording to the International Technology
Education Association (2000), technology edu-
cation teachers prepare the nation’s middle
school and high school students with core tech-
nological knowledge and skills. Secondary
technology education is a hands-on program of
study that provides an opportunity for students
to learn about communication, construction,
design, manufacturing, power-energy, and trans-
portation. Technological literacy benefits stu-
dents from all fields, but especially those who
choose technical careers, such as engineering,
architecture, industrial design, manufacturing,
and construction. Theoretically, a shortage of
secondary technology education teachers could
have an impact on the quality and quantity of
students entering university engineering and
technology programs.
The number of technology teacher educa-
tion graduates from the nation’s universities has
reached a critical stage. As Volk (1997) noted,
“if we do not address the issues, soon we will be
going … going … gone” (p. 70). Volk further
stated that “the corresponding decrease in doc-
toral degrees granted and diminished new pro-
fessional opportunities in technology education
teacher preparation programs does not afford
the incentive or opportunity for new ideas to be
promoted” (p. 69).
Purpose of the StudyThe purpose of this research was to identify
the factors that influence enrollment in technolo-
gy teacher education graduate programs, both
doctoral and master’s levels. This study exam-
ined both positive factors, those that influence
technology education teachers to enroll in gradu-
ate education, and negative factors, barriers that
deter teachers from entering either a doctoral or
master’s degree program. The following research
questions were developed for examination:
1. What factors do graduate education pro-
gram graduates identify as providing the
greatest positive influence for their
enrollment into a graduate program?
2. What factors do technology education
teachers indicate would provide the
greatest incentive to enroll in a graduate
education program?
3. What factors do graduate education pro-
gram graduates identify that provided
the strongest barriers to their enrollment
in a graduate program?
4. What factors do technology education
teachers identify as providing the
strongest barriers to their enrollment in
a graduate education program?
MethodologyThis study utilized a modified Delphi tech-
nique as noted by Paige, Dugger, and Wolansky
(1996) and Wicklien (1993) to identify and ana-
lyze what factors led individuals to enter both
doctoral programs and master’s degree programs
focusing on technology teacher education.
Additionally, the factors that deter individuals
from entering doctoral and master’s degree pro-
grams were identified.
Population
Two pairs of Delphi panels were established:
one pair for examination of the doctoral pro-
grams and the other pair of panels to study the
master’s degree programs. The first doctoral
group consisted of recent doctoral graduates
(1994 -1999) whose degrees were in technology
education focusing on teacher education as indi-
cated in the Industrial Teacher Education
Directory (Dennis, 1995, 1996; Bell, 1997,
1998, 1999). The directory noted that 127 doc-
toral degrees were granted during this five-year
timeframe. Institutions that had graduated five
or more doctorates during the five-year time
span were contacted and asked to provide the
names and address of their technology education
doctoral graduates. This resulted in a population
of 15 doctoral graduates whose location could be
47

Th
e J
ou
rna
l o
f Te
ch
no
log
y S
tud
ies
identified. These 15 individuals comprised the
population for one panel of this modified Delphi
study. From this population, nine doctoral grad-
uates agreed to serve on the Delphi panel.
The second doctoral panel consisted of prac-
ticing technology education teachers. Technology
education directors from six states were asked to
identify five technology education teachers who
currently hold a master’s degree and whom the
director would categorize as “an outstanding can-
didate for doctoral studies.” This second doctoral
population consisted of 30 technology education
teachers having earned a master’s degree and
identified by their state director as a leader in the
profession. From this population, 16 teachers
agreed to serve on the Delphi panel.
The first master’s degree panel consisted of
technology education teachers who had earned a
master’s degree from 1994 through 1999. This
panel was randomly drawn from an identified
population of 209 technology education teachers
who had earned a master’s degree. From this
sample, 19 teachers agreed to serve on the
Delphi panel. The second master’s degree panel
consisted of 18 teachers without an advanced
degree and who agreed to serve on the Delphi
panel. These pre-master’s program teachers
were selected from a population of technology
education teachers identified by state technolo-
gy education directors.
Procedure
The first round of this modified Delphi
study consisted of an open-ended survey mailed
to all participants, doctoral graduates, master’s
degree graduates, and both sets of technology
education teachers. Doctoral and master’s
degree graduates were asked to identify the fac-
tors that positively influenced their decision to
enter and complete a graduate education pro-
gram and to list those barriers that they were
able to overcome in order to earn an advanced
degree. The two non-advance degree panels
were asked to list the factors that would posi-
tively influence them to enter either a doctoral
program or a master’s degree program. These
two pairs of panels were also asked to identify
the barriers that have deterred them from enter-
ing either a doctoral program or a master’s
degree program.
First round responses were then categorized
into similar factor groupings for the second
round review. Each panel’s listings, doctoral
graduates, master’s degree graduates, and both
sets of non-advance degree technology educa-
tion teachers, were grouped into 10 common
factors for both positive influences and barriers.
Each Delphi panel was then mailed a set of sec-
ond round instruments on which the participants
were asked to rank-order the 10 factors from 1
(greatest) to 10 (weakest). Each participant
received two ranking surveys, one noting posi-
tive influences and the other instrument listing
barriers. The findings from the study’s second
round of responses were then compiled for a
third Delphi round. Top rank-ordered items
were selected to be used as the factors listed in
the study’s final round.
During the third and final Delphi round,
participants were asked to rate each positive
influence and each barrier on a 1 to 5 Likert-
type scale (1 = weak influence, 3 = absence of
influence, and 5 = very strong influence).
FindingsMaster’s degree graduates rated their per-
sonal goal and desire as the top influence for
pursuing a graduate degree (M = 4.74, SD =
0.56; see Table 1), whereas technology educa-
tion teachers without a master’s degree rated
their personal goal and desire at a lower level
(M = 4.00, SD = 1.14). Doctoral graduates also
rated their personal goals and desire as the top
positive influence in enrolling and completing a
doctoral program in technology education (M =
4.63, SD = 0.70; see Table 2). Technology edu-
cation teachers from the doctoral Delphi panel
who had completed a master’s degree also noted
that their personal goals and desire would pro-
vide them the most positive influence for enter-
ing a doctoral program (M = 4.63, SD = 0.78).
The university’s geographical location was
indicated as a positive influence by both mas-
ter’s degree graduates (M= 4.37, SD = 0.68) and
their cohort of technology education teachers
(M = 4.28, SD = 1.02). The positive influence
of the university’s location was also noted by the
teachers with a master’s degree from the doctor-
al panel (M = 4.25, SD = 1.09). However, the
positive influence of geographical location was
48

Th
e J
ou
rna
l of Te
ch
no
log
y Stu
die
s
not shared by doctoral graduates (M = 2.38, SD
= 1.58). The difference in doctoral panel mem-
bers with regard to the university’s geographical
location was also noted in the barriers section
by the master’s degree Delphi panelists (see
Table 3). The pre-master’s teachers rated the
university’s location as a significant barrier to
enrolling in a master’s degree program when
compared to their master’s degree graduate
counterparts (M = 3.50, SD = 1.58; M = 2.16,
SD = 1.30, respectively).
Doctoral graduates rated the doctoral pro-
gram’s quality and reputation along with its fac-
ulty’s quality and reputation as positive influ-
ences (M = 4.00, SD = 0.71; M = 4.00, SD =
0.87). Technology education teachers, from the
doctoral panel, rated the quality and reputation
of the program and faculty lower (M = 3.63, SD
= 0.70; M = 3.56, SD = 1.06). Technology edu-
cation teachers without a master’s degree rated
the quality and reputation of the university as
their strongest positive influence (M = 4.56, SD
= 0.51), whereas the master’s degree graduates
from this panel rated that item lower (M = 3.84,
SD = 1.01).
Both groups from the doctoral Delphi panel
indicated that time commitment was a substan-
tial barrier that hindered their enrollment into a
doctoral program (M = 4.00, SD = 1.12; M =
4.38, SD = 0.86; see Table 4). Both groups of
technology education teachers from the master’s
degree panel also ranked time commitment as a
barrier (M = 3.58, SD = 1.35; M = 3.28, SD =
1.32). Program residency requirements and a
lack of quality programs did not appear to pro-
vide barriers to either pair of panels.
49
Master’s Graduates Pre-Master’s Teachers
(n = 19) (n = 18)
Factor M SD M SD
Personal goal/desire 4.74 0.56 4.00 1.14
University’s geographical location 4.37 0.68 4.28 1.02
Pay increase 4.05 1.27 4.22 0.73
Quality and reputation of university 3.84 1.01 4.56 0.51
Financial support/assistantships 2.26 1.59 3.17 1.65
Table 1. Positive Influences for Enrolling in a Master’s Program
Doctoral Graduates Non-Doctoral Teachers
(n = 9) (n = 16)
Factor M SD M SD
Personal goal/desire 4.63 0.70 4.63 0.78
Financial support/assistantships 4.13 0.93 4.44 0.70
Quality and reputation of university 4.00 0.71 3.63 0.70
Quality and reputation of the faculty 4.00 0.87 3.56 1.06
Support of advisor/faculty 4.00 0.87 3.81 0.73
Support of family 4.00 1.22 4.38 0.60
Direct communication with advisor 3.88 1.05 3.81 0.81
Flexibility of the program 3.25 0.97 4.50 0.71
Interest in research 3.13 1.62 3.13 0.99
Credit for prior coursework 2.63 1.58 4.63 0.70
Short residency period 2.38 0.99 4.50 0.71
University’s geographic location 2.38 1.58 4.25 1.09
Distance education offerings 1.63 0.99 4.25 1.20
Table 2. Positive Influences for Enrolling in a Doctoral Program
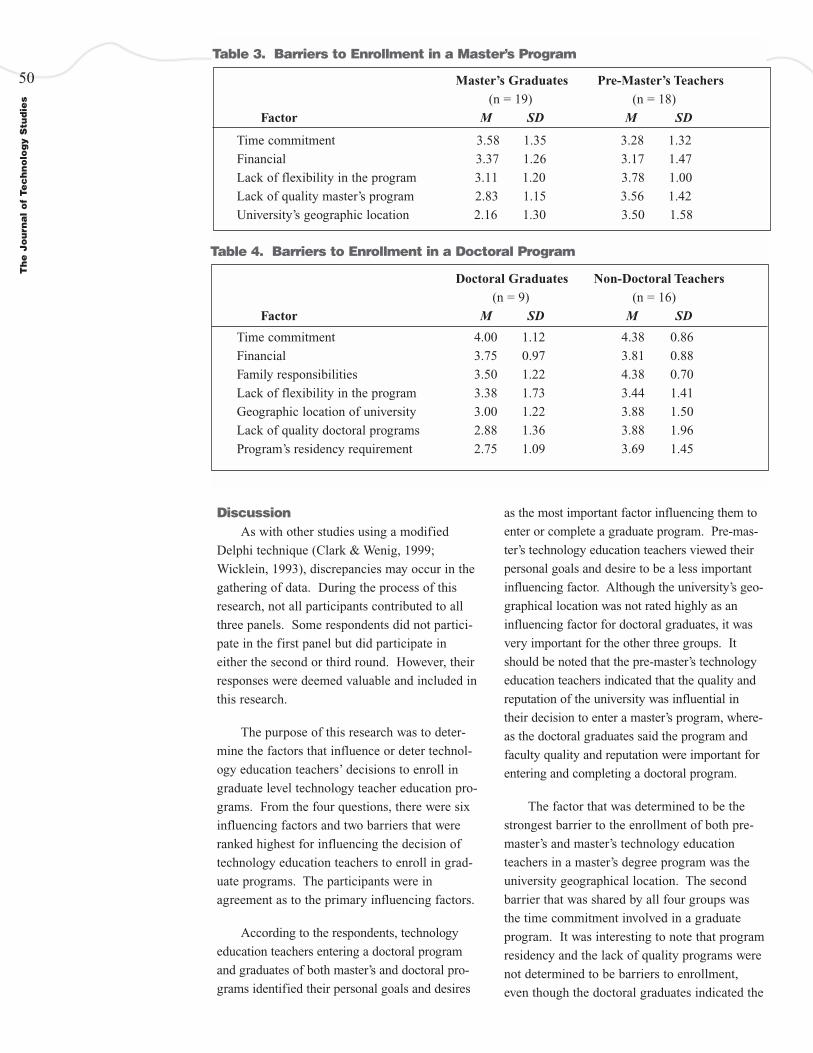
Th
e J
ou
rna
l o
f Te
ch
no
log
y S
tud
ies
DiscussionAs with other studies using a modified
Delphi technique (Clark & Wenig, 1999;
Wicklein, 1993), discrepancies may occur in the
gathering of data. During the process of this
research, not all participants contributed to all
three panels. Some respondents did not partici-
pate in the first panel but did participate in
either the second or third round. However, their
responses were deemed valuable and included in
this research.
The purpose of this research was to deter-
mine the factors that influence or deter technol-
ogy education teachers’ decisions to enroll in
graduate level technology teacher education pro-
grams. From the four questions, there were six
influencing factors and two barriers that were
ranked highest for influencing the decision of
technology education teachers to enroll in grad-
uate programs. The participants were in
agreement as to the primary influencing factors.
According to the respondents, technology
education teachers entering a doctoral program
and graduates of both master’s and doctoral pro-
grams identified their personal goals and desires
as the most important factor influencing them to
enter or complete a graduate program. Pre-mas-
ter’s technology education teachers viewed their
personal goals and desire to be a less important
influencing factor. Although the university’s geo-
graphical location was not rated highly as an
influencing factor for doctoral graduates, it was
very important for the other three groups. It
should be noted that the pre-master’s technology
education teachers indicated that the quality and
reputation of the university was influential in
their decision to enter a master’s program, where-
as the doctoral graduates said the program and
faculty quality and reputation were important for
entering and completing a doctoral program.
The factor that was determined to be the
strongest barrier to the enrollment of both pre-
master’s and master’s technology education
teachers in a master’s degree program was the
university geographical location. The second
barrier that was shared by all four groups was
the time commitment involved in a graduate
program. It was interesting to note that program
residency and the lack of quality programs were
not determined to be barriers to enrollment,
even though the doctoral graduates indicated the
50 Master’s Graduates Pre-Master’s Teachers
(n = 19) (n = 18)
Factor M SD M SD
Time commitment 3.58 1.35 3.28 1.32
Financial 3.37 1.26 3.17 1.47
Lack of flexibility in the program 3.11 1.20 3.78 1.00
Lack of quality master’s program 2.83 1.15 3.56 1.42
University’s geographic location 2.16 1.30 3.50 1.58
Doctoral Graduates Non-Doctoral Teachers
(n = 9) (n = 16)
Factor M SD M SD
Time commitment 4.00 1.12 4.38 0.86
Financial 3.75 0.97 3.81 0.88
Family responsibilities 3.50 1.22 4.38 0.70
Lack of flexibility in the program 3.38 1.73 3.44 1.41
Geographic location of university 3.00 1.22 3.88 1.50
Lack of quality doctoral programs 2.88 1.36 3.88 1.96
Program’s residency requirement 2.75 1.09 3.69 1.45
Table 3. Barriers to Enrollment in a Master’s Program
Table 4. Barriers to Enrollment in a Doctoral Program

Th
e J
ou
rna
l of Te
ch
no
log
y Stu
die
s
program quality to be an important influencing
factor in their decision to enroll.
Other factors influencing enrollment in
technology teacher education graduate programs
were also noted but were not as significant as
those previously discussed. One factor indicated
to influence pre-master’s technology education
teachers to enroll in a master’s program was pay
increase. Two factors that were determined to
influence non-doctoral technology education
teachers to enroll in a doctoral program includ-
ed flexibility of the program and credit for prior
course work.
There were several barriers to enrollment
that did not have consensus from more than two
groups but were significant. The pre-master’s
technology education teachers indicated that the
lack of flexibility and lack of quality in master’s
programs were barriers to enrollment. Both doc-
toral panels indicated that family responsibilities
and financial commitments were key barriers to
their enrollment in a doctoral program.
In summary, it appears that several influ-
encing factors and barriers are shared among
several groups. The influencing factors include
personal goals and desires and the university’s
geographical location. The barriers include the
university geographical location and time com-
mitment. While some of these factors are diffi-
cult to adjust, such as the university’s geograph-
ic location, other factors such as personal goals
and desires, time commitment, and program and
faculty quality are flexible.
RecommendationsThe information gained from this research is
provided as a foundation for future research and
program development. Through periodic evalua-
tion of influencing factors and barriers to tech-
nology education teacher enrollment in graduate
programs, the technology education field can
make the necessary changes to improve program
quality and increase enrollment.
Based on the information from this
research, we recommend the following to gradu-
ate program coordinators:
1. Promote the quality of the university, the
program, and its faculty. This can be
performed by integrating the Standards
for Technological Literacy: Content for
the Study of Technology (International
Technology Education Association,
2000) into the program and encouraging
faculty to become active in local, state,
and national technology education
organizations and conferences. Include
information about the quality of the pro-
gram in brochures and advertisements.
2. Capitalize on the technology education
teacher’s personal goals and desires to
recruit qualified individuals into gradu-
ate education programs. When recruiting
or interviewing, discuss the goals and
desires of the teacher and indicate how
your technology education graduate pro-
gram can help the teacher fulfill those
goals and desires.
3. Promote the location of the university
and the cultural aspects of the communi-
ty. Let the technology education teacher
know that the program and university
are in a great location for families,
schools, spouse employment, etc.
4. Inform technology education teachers
that time commitment is a requirement
of graduate education and that there will
be benefits to obtaining a graduate
degree.
The following are recommendations for
further study:
1. Periodic studies should be conducted to
determine consistencies and changes to
the influences and barriers indicated by
technology education teachers regarding
their enrollment in technology education
graduate programs.
2. Research should be conducted to deter-
mine the factors that make a successful
technology teacher education graduate
program.
As noted by Paige et al. (1996),
doctoral-granting institutions must provide
the leadership. This leadership must come
in the form of providing programs that
have a research focus directed toward con-
tributing to the body of knowledge and
51
Th
e J
ou
rna
l o
f Te
ch
no
log
y S
tud
ies
that are aimed at developing and providing
future leaders with the background and
experiences that are needed to move the
profession forward into the 21st century.
(p. 20)
If the universities do not increase their pro-
duction of advanced degrees in technology edu-
cation focusing on teacher education, Volk’s
(1997) doomsday prediction will be reality.
George E. Rogers is an associate professor
in the Department of Industrial Technology at
Purdue University. He is a member of Gamma
Rho Chapter of Epsilon Pi Tau.
Phillip L. Cardon is an assistant professor in
the Department of Business and Technology
Education at Eastern Michigan University. He is
a member of Alpha Chapter of Epsilon Pi Tau.
52
References
Bell, T. (1997-2001). Industrial teacher education directory. South Holland, IL: Goodhart-Wilcox.
Brown, D. (2002). Supply and demand analysis of industrial teacher education faculty. Journal of Industrial Teacher Education, 40(1), 60-73.
Buffer, J. J. (1979). Graduate education in industrial arts. In G. E. Martin (Ed.), Industrial artseducation retrospect, prospect (American Council on Industrial Arts Teacher Education: 28thYearbook). Bloomington, IL: McKnight.
Clark, A. C., & Wenig, R. E. (1999). Identification of quality characteristics for technologyeducation programs: A North Carolina case study. Journal of Technology Education, 11(1), 18-26.
Dennis, E. A. (1995-1996). Industrial teacher education directory. South Holland, IL:Goodhart-Wilcox.
Erekson, T. L., & McAlister, B. K. (1988). Supply and demand for university technology faculty:1986-87 position vacancy and search results analysis (Research in Technology Education Series-Report #2. (ERIC Documentation Reproduction Service No. ED312459)
Hill, R. B. (2003). Does NAITTE have a future? A third generation decision. Journal of IndustrialTeacher Education, 40(2), 86-91.
International Technology Education Association. (2000). Standards for technological literacy:Content for the study of technology. Reston, VA: Author.
Metcalf-Turner, P., & Fischetti, J. (1996). Professional development schools: Persisting questionsand lessons learned. Journal of Teacher Education, 47(4), 292-299.
Morris, J., Armstrong, D., & Price, M. A. (1997). Teacher educators for today's diverse learners: A model for the preparation of interprofessional clinical faculty. Action in Teacher Education,19(1), 55-63.
Paige, W. D., Dugger, J. C., & Wolansky, W. D. (1996). Essential components of doctoral programfor industrial technology education. Journal of Technology Studies, 22(2), 15-20.
Weston, S. (1997). Teacher shortage: Supply and demand. The Technology Teacher, 57(1), 6-9.
Wicklien, R. C. (1993). Identifying crucial issues and problems in technology education using amodified-Delphi technique. Journal of Technology Education, 5(1), 54-71.
Volk, K. S. (1997). Going, going, gone? Recent trends in technology teacher education programs. Journal of Technology Education, 8(2), 67-71.

Th
e J
ou
rna
l of Te
ch
no
log
y Stu
die
s
53
Technology today extends over many fields
and is very complicated in nature. Learning to
“do” technology is an important way to under-
stand and to learn what technology really
means. In academia, this implies a needed
change in our teaching methods and the design
of new applied teaching methods to explain the
processes resulting in the development of tech-
nology in the “real” world. Explanations of
such processes are sought and are taught in new
lab/classroom instructional settings that enhance
the teaching of problem-solving skills. In a
recent publication of the International
Technology Education Association (ITEA,
2002), it was cited that “recent research on
learning finds that many students learn best in
experiential ways by doing, rather than only by
seeing or hearing” (p. 5).
It is no wonder that in recent years a new
wave of “experiential learning” has flooded aca-
demia. At the national level many universities,
particularly publicly supported institutions, were
required to develop and implement experiential
learning methods across all of their disciplines
and in their curricula. To encourage such prac-
tices, funds were made available from several
state and federal sources. The resources allocat-
ed for this new methodology were, as usual,
meager and not enough to achieve the stated
goals. Some colleges, in pursuit of such funds,
established what they called experiential learn-
ing classrooms as their main application of such
newly encouraged teaching methods just to con-
tinue to benefit from the newly allocated funds.
Continuous funding of these new experiential
learning efforts to establish the infrastructure
and to acquire needed equipment and hardware
was, as usual, not adequately allocated or pro-
vided for, resulting in a long and laborious
process in implementing such worthy efforts in
academia. Students today not only need to learn
how to do technology, they also need to learn
how to live in today’s world, which has become
one that is buzzing with information and misin-
formation. Students need to know how to col-
lect, sift through, and organize the information
made available to them to augment and assess
their own learning process. Ehrmann (1999)
emphasized the value of technology by stating
that “technology (in the broadest sense of that
term) is providing a foundation for the reorgani-
zation of higher learning” (p. 42).
Technology and ChangeTo fully realize how technology and change
are related, I will first define change and then
discuss some factors such as need for change,
importance of change, and resources needed to
implement change in this section.
First what does change mean? The 1940 edi-
tion of the Winston Dictionary lists some of the
definitions of the word change as: “to alter as, to
change one’s habit; to vary; to undergo alteration;
to pass from one place to another.” A more
recent 1997 Merriam-Webster Dictionary cites
some of the definitions of change as: “to make or
become different, alter; to replace with another;
...etc; (n) the act, process, or result of changing;
etc,” which is almost the same as that cited in the
1940 edition of the Winston Dictionary above.
Need for Change
Should we implement every new technolog-
ical discovery in all professional fields once we
know about it? Obviously the answer is no, we
should not, at least until we understand the ram-
ifications of such implementation. Next, what
should we look for before even thinking of
changing our established ways or procedures?
Common sense necessitates that we should
study the new technological phenomenon,
decide whether it relates to our existing prac-
tices, and then study the possibility of its imple-
mentation. In other words, we must be sure that
we understand the new technology and whether
it would be a better fit of what we already have
or not. Moreover, would it really benefit the
organization if it is implemented? Or, at least
be aware of the downside of its applications,
especially if the new technology has not been
studied and understood well enough yet.
Thinking About Technology Effects onHigher EducationBy Mohammed F. Fahmy

Th
e J
ou
rna
l o
f Te
ch
no
log
y S
tud
ies
Importance of Change
Once the new process, or technological
phenomenon, has been carefully studied, we
need to identify the areas and personnel that it
will have direct impact on when fully imple-
mented. Next, we need to convince those
involved that the sought-after change will bring
positive results both to the individual and gener-
al levels. In other words, explain why the
organization will be in better shape and list the
benefits, which will be brought about as a result
of implementing this new technology or change.
People can only be “champions of the cause” if
they understand the consequences of its imple-
mentation on their personal lives and the organi-
zation as a whole.
Resources
Allocation of resources to bring about and
to implement the new technology or practices is
a very important and essential factor if any
change is to be instituted. Such resources are
needed for (a) feasibility and pilot studies; (b)
training, re-training, or hiring of new trained
personnel; (c) building the infrastructure (i.e.,
acquiring the new equipment or hardware need-
ed for the full implementation of the new
processes); and (d) continued assessment of the
implementation of the process.
This factor (allocation of resources) could
be viewed as the most important one in the
process of change. Two sectors of our economy
that might be viewed as the most successful in
implementing new technologies because of
readily available resources are industry and the
military.
The military branch of the government,
which may be viewed as the boldest in the
implementation of new technologies, has proven
to be at the forefront of technology applications.
Its hierarchal structure and leadership struc-
ture—coupled with the generous resources
made available for its development and annual
operational cost, and other such factors as clear
vision, willingness to try, ability to recognize
value, impact on the success of mission, etc.—
are believed to be the direct reasons as to why
the military is way ahead of civilian organiza-
tions in the implementation of new technolo-
gies. The nature of the military as well as the
fact that the mere survival of its members
depends vastly on the new applications man-
dates that it must be at the cutting edge of tech-
nology use and implementation.
On the other hand, many industries have
realized that their own success and survival in a
globally competitive arena depends greatly on
their ability to implement new, relevant tech-
nologies to stay ahead of their competition, not
only nationally, but also at the global level.
Unlike the military, the industrial sector—even
though it is willing to apply new technologies—
is not as bold. There are other factors that pri-
vate industry has to consider. At the forefront
of such factors is the margin of profit. There has
to be a very delicate balance between what the
private sector is willing to spend on new tech-
nology applications and the margin of profit it
has identified for itself to stay competitive.
Another factor in the implementation of new
technologies is the fear of the ramifications if
the technology has not been fully understood
yet. In the private sector, such failures may
bring losses as a result of lawsuits and compen-
sations for a failed product.
A third sector that may be involved in tech-
nology applications and the changes they bring
about is the public sector, whose funding
depends mainly on allocated funds by public
institutions (e.g., local government, etc.). Public
educational institutions fall under this category.
Usually the progress such institutions achieve in
the arena of technological applications and the
changes they bring about is very slow compared
to the other two sectors discussed above. The
key factor here, again, is simply resources.
Public academic institutions are, for the most
part, governed by the resources made available
to them more so than their ingenuity and will-
ingness to implement new technologies. In their
quest to apply new technologies needed for their
ultimate survival and to stay competitive, public
institutions are always compensated by meager
allocations of funds controlled by their govern-
ing bodies. Such funds are often not enough to
cover the needed changes. Many of these insti-
tutions, however, have stayed very close, if not
at the cutting edge, by seeking external funds
from a variety of sources such as other more
fortunate government agencies (e.g., the mili-
54

Th
e J
ou
rna
l of Te
ch
no
log
y Stu
die
s
tary, the National Science Foundation, the
Department of Energy, etc.), industrial partner-
ships, or private foundations. The degree of
success in finding external organizations willing
to fund such efforts in higher education depends
on many factors, including:
• Classification of the academic institution
(land grant, research, comprehensive,
etc.).
• Reputation of institution (public relations
and marketing, previous dealings).
• Infrastructure of institution.
• Influence of institution on local or
national government (pork monies
allocations).
• Willingness of faculty and their ability to
market their ideas and to make a convinc-
ing case for the funding organization to
buy into their vision.
Recent Changes in AcademeEhrmann (1999) described the three main
revolutions that have taken place in education.
The major transformation (or the first revolu-
tion) took place 2,500 years ago when the “oral
exchange” between teachers and students was
augmented by reading and writing. In his char-
acterization, Ehrmann stated that “the rigidities
of memorization were replaced by the even-
stiffer rigidity of the written word and, later, the
printed page” (p. 44). The second revolution,
according to Ehrmann, started when students
and teachers shared the same facilities (libraries,
laboratories, etc.), which was the beginning of
the educational community and campus life.
This brought financial resources, not previously
available, which caused the creation of a very
complex environment (instructors, administra-
tors, technicians, staff, students, publishers,
etc.). The third revolution identified by
Ehrmann is the one “made possible by comput-
ing, video, and telecommunication” (p. 42). One
can safely term this third revolution as the tech-
nology revolution, which has brought about
more learners and an inevitable change in the
way higher education delivers its services. Even
though this change is certain, its character “is
not yet clear” (p. 46) according to Ehrmann.
The Future of AcademeWhat does the future hold for academe has
been the recent topic of many researchers and
academicians. While there is not one single
model that identifies clearly how all the
researchers see the future of academe, there is a
common vision of many of the anticipated ele-
ments of change. In the sections below, some of
such elements are shared and discussed.
Technology and the Classroom Carlson (2000) cited the issue of integrating
technology with instruction as the single most
important issue facing higher education. Other
factors, which were identified in the same study
as of less priority, were replacing outdated hard-
ware or software, providing user support, pro-
viding online distance education, and integrat-
ing e-commerce into college and university Web
sites and all other institutional services. While
only 10% of college courses used electronic
mail as a tool for instruction in 1994, Carlson
cited that over 60% of courses in 2000 used this
tool. According to him, 7% of courses had Web
sites in 1994, whereas in 2000 the number was
more than 30%. The report by the National
Commission on the Cost of Higher Education
(1998) concurred with these findings and noted
that institutions were faced with the need to pro-
vide new equipment and infrastructure to
accommodate this type of offerings. To meet
the cost of such technology implementation, the
report stated that institutions mandated comput-
er/instructional technology fees ranging from
$55 to $140 per student, hence passing some of
such costs on to the students and their families.
It is strongly believed that this trend will contin-
ue in the future to enable higher education insti-
tutions to update their classrooms and laboratories
with the needed contemporary infrastructure
required to deliver instruction to their students
whether on campus or at a distance over newly
established networks.
Other Technology ApplicationsAccording to Carlson (2000), academe is
still lagging behind society at large in the appli-
cation of some technology trends such as person-
al digital assistance devices (e.g., Palm Pilot) that
campuses have not been able to integrate into
their campus networks. E-commerce services is
another area that shows academe far behind the
private sector in application and use. Only 18.8%
of the institutions surveyed, according to Carlson,
55

Th
e J
ou
rna
l o
f Te
ch
no
log
y S
tud
ies
have set up e-commerce services (e.g., to pay
tuition with credit cards) on their Web sites. The
majority of colleges (80%) still do not see e-com-
merce applications as a service that should be
allowed on campus Web sites. Like e-com-
merce, there are new e-learning companies such
as Quisic 2000 (chronicle.quisic.com), which
advertises that it believes that asking the right
questions and learning new ways to answer them
is essential. Further, the company claims to offer
e-learning solutions for business education to
help students and faculty achieve important
goals. CollegeNet (www.corp.collegenet.com),
another new e-company, has announced that its
services are designed “to turn your school’s
homepage into an engine for web commerce as
streamlining commerce with the new generation.”
Furthermore, Pelline (1997) and Kyrnin (2002)
described a new technology, the “push technolo-
gy,” made available by the commercial Internet
providers, as a phenomenon that is inevitable.
Push technology describes efforts to make local
information available to all users linked to the
institution’s network, hence pushing information
to users rather than waiting for them to seek it.
This way, push technology becomes a tool for
educators to deliver instruction over a wider
network.
As can be seen from the foregoing discus-
sion, higher education institutions will be faced
with more demands to cope with the fast-
changing technologies and will be required to
implement changes to accommodate such appli-
cations in order to deliver services in a manner
that satisfies their clientele and to stay competi-
tive at the same time.
Academe and the Information SocietyEducators and society perceive the industri-
al revolution in general as a major reason for the
shaping of our societies today. Many profes-
sionals and intellectuals believe a new revolu-
tion started recently, namely, the
information/communication revolution, which
will shape our future. This revolution in the
exchange of information has been mainly
caused by the great and rapid advances in tech-
nology. Levine (2000) identified new technolo-
gies as the major forces that have the power to
change our university and college systems and
the way they deliver their services as we know it
now. Other forces cited in his article were shift-
ing demographics, the entrance of commercial
organizations into higher education, the chang-
ing relationships between colleges and the fed-
eral and state governments, and the move from
an industrial to an information society. He fur-
ther listed nine major changes in higher educa-
tion as inevitable changes that should not be
ignored:
1. The creation of numerous and diverse
“higher-education providers” that are
global and more technologically
advanced institutions. Such institutions
will change the current practices and
will necessitate a much faster response
to an international student body, due to
their ability to deliver instruction global-
ly, if they are to stay successful and
competitive.
2. The three types of higher education
providers will be either brick universi-
ties (i.e., the traditional residential
campus as we know it now), click
universities currently known as virtual
universities, or brick and click universi-
ties, which is a combination of both
types that he predicts to be the most suc-
cessful and competitive ones in the
future. Gregory C. Farrington, president
of Lehigh University, stated, “residential
colleges might band together to share
courses using the Internet” (as cited in
Young, 2000,1) to provide their students
with highly specialized courses and
hence cutting their cost of delivery.
Ehrmann (1999) added to these shared
efforts among universities online
libraries so that physical and virtual
campuses complement one another and
provide more services to their “cus-
tomers” at a much lower cost. As a
result, new entities in higher education,
consortia, partnerships, etc., will
emerge.
3. More individualized higher education in
which students set the educational agen-
da due to their diverse backgrounds. In
this case, institutions will react to cus-
tomer needs rather than setting the edu-
cational agenda as they traditionally
have done. Education will be provided
56

Th
e J
ou
rna
l of Te
ch
no
log
y Stu
die
s
wherever and whenever students decide
to receive it: at home, in the office, in
the car, or on campus. This will simply
be achievable because of the new emerg-
ing technologies.
4. A shift of focus of higher education
from teaching to learning. In other
words, instead of a certain number of
credits to measure student achievements,
a competency-based education in which
student outcomes are measured and
assessed will be used.
5. The current triangle of teaching-scholar-
ship-service that describes the activities
of most of today’s universities will
become predominantly focused on
teaching as dictated by for-profit and
other new providers in higher education.
6. The creation of a new rock-star profes-
sor in which the name of the professor,
not that of the institution, will be the
most important in bringing in business
for the university. In other words, pro-
fessors will become increasingly more
independent of colleges and universities.
Young (2000) cited a new book that pre-
dicts that institutions will market lec-
tures of their superstar professors and
place them on a World Wide Web site,
replacing outdated traditional lecture
delivery.
7. Degrees will be replaced by a transcript
in which students’ competencies delin-
eate the level of their skills and knowl-
edge. Students no longer have to reside
on any specific campus to obtain a
degree; rather, they can move around
and accumulate more recognized skills
and competencies.
8. Educational portfolios, or “educational
passports,” will have to be created and
maintained to identify students’ achieve-
ments wherever and whenever they were
gained.
9. Public and private support will be
directed to students rather than to
educational institutions.
Whether we agree that the future holds
some or all of the above listed changes, many
recent articles have listed many such changes in
the future of academe. Young (2000) cited a
new book whose authors concluded that both
technology and market forces can “improve uni-
versity teaching, streamline offerings, and bring
education to more students than ever” (p. 1).
Faculty Security and the TenureProcess
Another recent shift in higher education
and university practices involves the process of
tenure. Wilson (1998) discussed the issue of
tenure and its future. He argued that colleges
that have abolished the tenure process and now
hire new faculty on an “annual contract” basis
are increasing in numbers. He further stated
that there are currently 40 institutions in the
United States hiring professors on contract
appointments, hence increasing the percentage
of such institutions from 19% in 1979 to 28% in
1998. Even though such news is not readily
announced, the phenomenon of hiring more
adjunct professors has risen from 22% in 1970
to a new high of 42% and has attracted the
attention of many educators. According to
Wilson, this new trend will result in professors
hired on contract to be either focused on teach-
ing or research, but not both. He further
explained that new titles of such professors will
commonly be known as lecturers, research sci-
entists, instructors, or clinical faculty and that
they will not be considered voting faculty on
many campuses. Changes in the tenure process
have been long anticipated by many in academe.
An overhaul of that process in the next few
years will not surprise many at all.
Impact of Technology/Change onOther Areas of Academe
The impact of technology and the resulting
changes on nonacademics of higher education is
cited by Ault, Hainline, and Abunawass (1999).
Areas and personnel affected by technology in
academe include:
• Staff and the way they provide their
services.
• Academic offices.
• Training of personnel and technicians
and quality of performance.
• Bargaining and the changes in the
workplace.
• Ability of institutions to “market”
themselves.
57

Th
e J
ou
rna
l o
f Te
ch
no
log
y S
tud
ies
Such areas that are impacted by the
technological changes will, undoubtedly, need a
process of re-evaluation so we can get the best
services to the students who are, after all,
impacted by all the services provided by or
depending on the above listed areas.
ConclusionTechnology and technological applications
are, indeed, a continuous process that dates way
back in our human history. Every time a new
technology comes around, a process of change
accompanies its implementation. Higher educa-
tion, like any other sector in our society, is
affected by technology applications and always
races to institute the necessary changes to
implement it. As a matter of fact, many of the
new technological applications were discovered
and developed into prototypes, which were test-
ed and modified on many campuses. However,
the full implementation, which needed resources
beyond academe’s reach, was always a long and
laborious process.
If higher education and academe are to
improve the rate of change that technological
applications bring, they need to find new ways
to fund such efforts. Educational institutions
started to seek partnerships with industry, gov-
ernment, and the private sector as means of pro-
viding part or most of the costs associated with
the implementation of such new technologies.
It is believed that it is through such partnerships
that the process of change will be accelerated
better than it is today.
Dr. Mohammed F. Fahmy is a professor in
the Department of Industrial Technology at the
University of Northern Iowa. He is a member
of Pi Chapter of Epsilon Pi Tau.
58
ReferencesAult, K. P., Hainline, F. C., & Abunawass, A. M. (1999). Emerging issues in collective bargaining:
Technological expectations for support staff. Universities 21. Retrieved (October, 2000) from http://www.upi4100.org/univ21/AultHainline.html
Carlson, S. (2000, October 27). Campus survey finds that adding technology to teaching is a topissue. The Chronicle of Higher Education, p A46.
Ehrmann, S. C. (1999, September). Technology’s grand challenges in academe. Bulletin of theAmerican Association of University Professors, pp. 42-46.
International Technology Education Association. (2000), Standards for technological literacy:Content for the study of technology. RetrievedOctober 2000 from URL: ,http://www.iteawww.org.
Levine, A. E. (2000, October 27) The future of colleges: 9 inevitable changes. The Chronicle ofHigher Education, pp. B10-B11.
The National Commission on the Cost of Higher Education (1998, January). Straight talk aboutcollege costs and prices. The Chronicle of Higher Education. Retrieved October 2000 from http://chronicle.com/data/focus.dir/data.dir/0121.98/costreport.htm
Young, J. R. (2000, October). New book from EDUCAUSE talks up technology’s value to academe. Retrieved October 2000 from www.apa.org/ed/educause.html
Wilson, R. (1998, June 12). Contracts replace the tenure track for growing number of professors. The Chronicle of Higher Education, pp. A12-A14.

Th
e J
ou
rna
l of Te
ch
no
log
y Stu
die
s
59
IntroductionWhile our technological society has rapidly
moved into the digital-information age leadership
has emerged as even more distinctive and essen-
tial for success (Reich, 2000). Experience teaches
us that leadership can be exercised through noble
uplifting pursuits or driven by corrupting repres-
sive power. Leadership when positive creates a
stimulating environment that builds a thriving
organization but, when negative, it fosters a woe-
fully oppressive and debilitation atmosphere
which chokes performance. Historically,
Americans love Washington, Jefferson, and
Lincoln, but despised Hitler types who are auto-
cratic tyrants. Research tells us that leaders are
not born but emerge through a complex sociolog-
ical process to satisfy some demanding need or
want (Clark and Clark, 1996).
We are all familiar with the story of Winston
Churchill, who during World War I was charged
with poor military decisions ending in extensive
lost of life. For nearly twenty years fame was
derailed and influence ceased. Churchill referred
to this time in his life as the wilderness years.
Fortunately for England, Churchill took the
advice of Benjamin Disraeli, who said, “The
secret of success in life is for a man to be ready
for his time when it comes.” Certainly, it was
Churchill time when he was elected Prime
Minister of England in 1939 at the beginning of
WW II. He more then anyone else rallied the
English people through inspiring speeches and
endless work to achieve eventual victory. Today,
England, and others, consider Churchill, the
greatest Englishman who ever lived. Similarly,
great teachers rise to the challenge by becoming
successful classroom leader through a combina-
tion of ever increasing knowledge and elevating
experiences (Walling, 1994)
PurposeThe purpose of this article is to share the
value of leadership knowledge and skill for
enhancing the survival and performance of
teachers and leaders.
Leadership and Performance
When performance of an individual, organi-
zation, or event is discussed leadership becomes
the dominant subject. Recently a cartoon
appeared in the Wall Street Journal where two
men were having a heated discussion about
leadership. Finally, one turned to the other and
said, “Yes, we need leadership, but also we need
someone to tell us what to do.” Most people
have difficulty attempting to understand or
appropriately use leadership (Peters, 1992 and
Drucker, 1993). They see it as hazy, confusing,
or a distant abstraction.
Nevertheless, most people can comprehend
the behaviors of great leaders and teachers when
they can personally relate to their actions. Let me
illustrate. Recently I visited an art museum dis-
playing works of some of the worlds most
famous artists. There were paintings by Monet,
Picasso, van Gogh, Renoir and many others on
display. The paintings I enjoyed the most were
those that gave a clear depiction of something I
am familiar with, such as a serene lake, a gather-
ing of flowers, or people easily recognized as
humans. There were other paintings on display
that portrayed distorted figures, and blurred
shapes and colors that defy description. Certainly,
these too, are valued works of art that were care-
fully selected to represent the variety of creative
expression, but the distant abstraction left me
with a feeling of emptiness or even confusion.
Similarly, the omnipotence or great secret of
highly effective leaders and teachers is achieved
when they cut confusion and haziness to relate
and build understanding. An example of trans-
forming from a hazy-confusing leaderless envi-
ronment to a clearly functioning leadership
process can be found in the small book, The
Leaders Compass (2003) by Ruggero and Hailey.
This is a must read by the beginning leader.
Clark and Clark, (1997) state, that with
effective leadership any organization can
increase its performance by at least 20-25 per-
cent. Further, educational literature suggests that
Leadership Knowledge and Skill: An Enabler forSuccess as a Technology Education Teacher-LeaderBy Robert E. Wenig

Th
e J
ou
rna
l o
f Te
ch
no
log
y S
tud
ies
an effective teacher-leader can also raise the
learning level of his/her students by 15-25 per-
cent. Accordingly, the relationship between gift-
ed teachers and gifted leaders is very similar as
Williams (2001) found in her dissertation that
compared award winning local school technolo-
gy teachers and their use of effective leadership
practices. Hasting, (1991) agreed in her article,
Teachers as Leaders” saying, “teachers as lead-
ers model the way or influencing their students
to follow” (p.24.).
Leadership Defined
Bennis and Nanus, (1985), stated in their
award winning book, Leaders, “Decades of aca-
demic analysis have givens more than 350 defi-
nitions of leadership”(p. 4). Even today, the
quest continues to specifically define just what
is leadership. One stirring and profound defini-
tion of leadership that is well accepted by noted
experts is Burns’ (1978) “transformational lead-
ership” which is described in his classic and
award winning book, Leadership. He defined a
transformational leader as one who creates a
vigorous and magnetic environment in which
the leader and his/her followers raise each other
to higher and higher levels of motivation and
morality.
It happens when a leader can harness and
focus an organizational member’s energy into a
collective force resulting in a powerful empow-
ering process that transforms both the individual
and organization to higher and higher levels of
performance. The best leadership thinking
today (Covey, 1992; Kanter, 2001; Kotter,
1996; Reich, 2001; Senge et. al, 1999) about
how to gain the highest level of organizational
performance continues to include a leader who
successfully uses transformational leadership.
Again, transformational leader-teacher creates
an environment that releases human potential
then reinforces it by giving recognition and the
opportunities for continuous personal growth
(Walling, 1994; & Wenig, 1995).
Finally, after years of concerned involve-
ment in leadership theory and application, I
believe that it is more important to define lead-
ership by what it “does” rather than by what it
“is”. At first glace, what a transformational
leader does seems so simple, yet it possess that
overwhelming powerful human propellant called
“hope”. Accordingly, top leaders and teachers
are a “merchant of hope” those who elevate the
meaning and aspiration of others to form an
organization under pinned by hope. Hope can be
germinated by leaders-teachers who propel oth-
ers-students to rise to higher and higher levels
of success. Leadership then, when practiced at
its positive best, produces hope, that propels
individuals and organizations that transform
dreams into visions and visions into actions - -
“a vision community” (Barker, 1994). The
leader-teacher who applies the powerful spirit
and tenor of “hope”, establishes transformation-
al leadership in the classroom/boardroom, the
magical key ingredient to gaining a dynamic
and fruitful future for all involved. Debbie
Kennedy, (June, 1991) perhaps expresses the
significance of hope in the following poem tilted,
“Our Dreams In Action”:
Dreams give us hope.
Hope ignites passion.
Passion leads us to envision success.
Recognition of opportunities inspires far-
reaching possibilities
Far-reaching possibilities help us enlist sup-
port from others.
Support from others keeps us focused and
committed.
Focus and commitment foster action.
Action results in progress.
Progress leads to achievement.
Achievement inspires dreams.
Dreams give us hope.
Perhaps Warren Bennis (2003 & 2003) ship
expert, stated it best about hope when he stated,
leadership involves creating larger visions and
engaging people’s imagination in pursuit of
them.
Leadership Knowledge for SurvivalRip Van Winkle went to sleep for twenty
years. When he awakened, the American land-
scape had changed dramatically, and his bones
creaked with age. The world around him was no
longer one he understood or in which he could
function well. Will history someday see that
60

Th
e J
ou
rna
l of Te
ch
no
log
y Stu
die
s
classic story as a parable for leadership in
American public and private organizations?
George Santayana, the noted anthropologist,
once observed that in our changing world we no
longer salute our ancestors but bid them
farewell. The world constantly searches for new
knowledge and wisdom to answer very complex
problems with simplicity. Let me illustrate.
There is old parable about the grasshopper that
decided to consult the hoary consultant of the
animal kingdom, the owl, about a personal
problem. The problems concerned the fact that
the grasshopper suffered each winter from
severe pains due to the savage temperature.
After a number of these painful winters, in
which all of the grasshopper’s known remedies
were of no avail, he presented his case to the
venerable and wise owl. The owl, after patiently
listening to the grasshopper’s misery, so the
story goes prescribed a simple solution. Simply
turn your self into a cricket, and hibernate dur-
ing the winter.” The grasshopper jumped joy-
ously away, profusely thanking the owl for his
wise advice. Later, however, after discovering
that this important knowledge could not be
transformed into action, the grasshopper
returned to the owl and asked how he could per-
form this metamorphosis. The owl replied rather
curtly, “Look, I gave you the principle, it’s up to
you to work out the details!”
All parables, supposedly, contain a moral,
and the moral here is that even if knowledge is
provided survival is linked to actually perform-
ing the metamorphous. Again, transformational
leadership elevates performance of individuals
from the boardroom to the classroom.
Leadership knowledge is paramount to change
(Kotter, 1996), and change is the key to organi-
zational survival (Senge, 1999).
The present-day “S” Curve (see Figure 1)
evolved in the early part of the twenty-century
from the work of Russian economist Nikolai
Kondratieff and was popularized in America by
Joseph Schumpeter in 1939. It represents the
typical life cycle of an organization that last
beyond infancy. Through dynamic and creative
leadership, the opportunity for an organization
to experience explosive growth is possible.
However, over time things change; competition
increases, cost rises, new technology suddenly
appears, economic down-turn occurs, product
demand falls, management falters, or whatever
happens to trigger decline eventually ending in
failure. When reviewing super successful sur-
viving organizations (e.g., Ford, IBM, Johnson
and Johnson, and 3 M) one finds a core ideolo-
gy of visionary leadership one that that has a
passion for learning to stay competitive.
Accordingly, organizations that are built to last
(Collins & Porras, 1997) feverously keep
61
Figure 1. The “S” Curve: The Life Cycle of An Organization.
Infancy
Explosion
Crisis
Decline

Th
e J
ou
rna
l o
f Te
ch
no
log
y S
tud
ies
informed (knowledgeable) about the future
which enables them to constantly plan and exe-
cute critical intervention strategies (see Figure
2) at key times to avoid stagnation and decline
to propel continuous rebirth and growth.
There is a significant example of not stay-
ing competitive (realizing the “S” Curve) as
found in American public schools. The word
competition was foreign to the public education-
al system. Many thought that no outside force
could or would attempt to provide K-12 educa-
tion. Over time, public schools failed to imple-
ment key intervention strategies to meet their
greatest challenge parent dissatisfaction with
public school performance. Certainly, lack of
parent confidence has triggered the advent of
home schooling, charter schools, vouchers, and
yes, even private businesses schooling children.
All are pursuing a replacement to the traditional
public school system.
Research has consistently said that the dif-
ference between model and poorly run schools
is the ”Whoever be chief among you let him be
your servant principal’s leadership performance
(Clark and Clark, 1997). It is obvious that TED
can significantly benefit from possessing lead-
ership knowledge and skills because the future
belongs to the informed (Collins & Porras, 1997
& Peters, 1994). In time of drastic change, the
learners inherit the future. The learned find
them equipped to live in a world that no longer
exists (Reich, 2001 & Senge et. al., 1999).
Finally, Servant-Teacher-Leader
Historically, the Bible reveals through end-
less stories examples of individual servant lead-
ership, especially those in the New Testament.
In 1966, Queen Elizabeth II, the present Queen
of England, placed a large carved plaque in
Westminster Abby which stated, “Whoever be
chief among you let him be your servant.” “The
term servant-leadership was first coined in the
United States in a 1977 essay by Robert K.
Greenleaf entitled, The Servant First Leader
(Spears, 1995 P.2) Question. If the leader’s over-
whelming desire is to serve when or how does
the leader lead? Leading and Serving seems
rather contradictory, or is it? Another perplexing
question, does a leader lead first by serving or
serving first then lead? To answer these ques-
tions, Greenleaf wrote:
“Servant-leader begins with the natural
feeling that one wants to serve, to serve
first. Then conscious choice brings one to
aspire to lead. The difference manifests
itself in the care taken by the servant—first
to make sure that other people’s highest-pri-
ority needs are being served. The best test
is: Do those served grow as persons; do
they, while being served, become healthier,
wiser, freer, more autonomous, more likely
themselves to become servants? …At the
core, servant-leadership is a long-term,
transformational approach to life and
work…a way of being that has the potential
to create positive change throughout our
society” (Spears 1995, p.4).
Greenleaf went on to say, “When I started
to write on the servant-leader theme, I was try-
ing to communicate a basis of [hope]—not just
for students but for everybody” (Spears, 1995
p.21). Hope or servant-leadership, then, pro-
vides a most powerful pronouncement again for
the operational behavior followed by the best
teachers and leaders.
Historically, we have some understanding
of where the idea of servant came from, but
what triggered Greenleaf at add servant to
leader or leadership? Greenleaf (1984) stated
that he conceptualizes and coined the term ser-
vant-leadership after Eventually; he comes to
realize that it was his servant, Leo, who held
him and his group together. After many years of
wondering, the director finds Leo again, who as
it turns out, is the head of the spiritual commu-
nity that the director was seeking all along.
Reading on it becomes more and more clear that
the director is actually Hesse, himself, an auto-
biographical character. After Hesse (A Nobel
Prize for Literature in 1946) was initiated in the
spiritual order Leo and Hesse are talking and
they are holding a small transparent sculpture of
two figures joined together. One is Leo and
other is Hesse who realized that his image was
in the process of adding and flowing into Leo’s
nourishment and strengthening. Reading the
story about Hermann Hesse’s (1956-2003)
Journal to the East. The story is about a party
of seekers searching for enlightenment in the
62

Th
e J
ou
rna
l of Te
ch
no
log
y Stu
die
s
form of a particular secret spiritual order. Leo, a
servant, attends to their needs and does menial
chores. Throughout the journey, the group is
sustained by Leo’s “spirit and his song.” Leo
eventually disappears. The party gets completely
lost and gives up on the search. The party direc-
tor carries on but suffers immense emotional
and physical stress.
Peter Senge (1995), after reading the
Journey to the East, “I knew that this man
[Greenleaf) understood something, something
we have lost in our modern transactional socie-
ty, where ‘what’s in it for me’ is the assumed
bedrock of all actions.” To make it very clear,
servant-teacher-leader grand design focuses on
serving others by adding and flowing together to
achieve one image using nourishment and
strength. Robert Frost said, “All great things are
done for their sake.” Senge adds, to think that
this reorientation of spirit might be a foundation
for true leadership stunned me.
The significance of the servant-leadership
concept has led to the establishment of the
Robert K. Greenleaf Center for Servant-
Leadership. Further, the 1995 publication,
Reflections on Leadership also includes the
writings of Greenleaf with companion reflec-
tions about Greenleaf works. The importance of
the Greenleaf’s was given further credence in
the “Indianapolis Business Journal” which stat-
ed, “Servant leadership has emerged as one of
the dominant philosophies being discussed in
the world today (Spears, L. C, Reflections on
Leadership 1995).
SummaryHistory has shown us that leadership can
either be positive or negative. When positive
and of the highest quality it can enhance per-
formance, whether in the classroom or board-
room, remarkably by 20-25%. The master
teacher who seems to draw us out has thrilled us
all. These same high qualities are also found in
top leaders. The teacher-leader makes a differ-
ence—a big difference for they model the way to
influence our lives. Through an examination of
the literature and research, the author attempts to
discover what makes leadership such a powerful
force. The first research question dealt with how
to gain and inspire support. The challenges and
possible opportunities facing TED are also dis-
cussed.. Second question reviewed the research
on effective TED teaching. The findings indicat-
ed that innovative teachers are professionally
involved in their associations, have greater
school support, use different instructional meth-
ods and are very creative.
The third research question provided infor-
mation on how TED could apply the dynamics
of leadership to sell its benefits. These process-
es include: developing communication power,
applying various leadership development mod-
els, bringing about effective change, using
visioning technology to set the course, and the
need of research to apply the teacher-leader
model for developing Technology Education for
American youth.
Dr. Robert E. Weing is an associate profes-
sor in the Department of Mathematics, Science,
and Technology Education at North Carolina
State University. He is Trustee of Alpha Pi
Chapter of Epsilon Pi Tau, and received his
Distinguished Service Citation in 1995.
63
References
Barker, J. A. (1994). The power of vision. (Video Tape) Burnsville, MN: Charthouse International
Learning Corporation.
Bennis, W. (2003). On becoming a leader (Revised). Perseus.
Bennis, W, & Goldsmith, J. (2003). Learning to lead. New York: Basic Books.
Bennis, W. G. , & Nanus, B. (1985). Leaders: strategies for taking charge. New York: Harper & Row.
Burns, 3. M. (1978). Leadership. New York: Harper & Row Campbell, D. (1984). If I’m in charge here why is everybody laughing. Greensboro, NC: Center of Creative Leadership.
Clark, K. E. , & Clark, M. B. (1997) Choosing to lead. Greensboro, N C: Leadership Press Limited.

Th
e J
ou
rna
l o
f Te
ch
no
log
y S
tud
ies
64
Clark & M. B. Clark (Eds.), Measures of Leadership. West Orange, NJ: Leadership Library ofAmerica.
Covey, S. R. (1992) Principle centered leadership. Simon & Schuster.
Drucker, P. F. (1993). The post capitalist society. New York: Harper & Row
Greenleaf, R. K. (1977). Servant leadership . New York: Paulist Press.
Hasting,S. C. (1991). Teachers as leaders. Learnig 2001 Carlson Learning Company Journal.Vol.2, No.3.
Hesse, H. (1956-2003) The journey to the east. New York: Picador.
Kanter, R. M. (2001). Evolve: succeeding in the digital culture of tomorrow. Harvard BusinessReview Press.
Kennedy, D. (June, 1991). Our dreams in action. Burnsville, MN: Charthouse International LearningCorporation.
Kotter, J. P. (1996). Leading change. Boston: Harvard Businesa School.
Peters, T. (1992). Liberation management. New York: Alfred A. Knopf.
Peter, T. (1994). The Tom Peters seminar: Crazy time call for crazy organizations. New York:Vintage Books.
Spears, L. C. (1995). Reflections on Leadership. John Wiley & Sons.
Reich, R. B. (2000). The future of success. Random House.
Ruggero, E., & Hailey, D. F. (2003). The leaders compass. King of Prussia, PA: Academy Leadership.
Senge, S. M. (1999). The dance of change. Doubleday.
Walling, D. (Ed.). (1994). Teachers as leaders. Bloomington: Phi Delta Kappa.
Wenig, R. E. (1995) Technology education leadership. In G. Eugene Martin (Ed), Foundationsof technology education, 44th Yearbook of the Council on Technology Education. Peoria, Ill:Glenco Division, Macmillan/McGraw-Hill.
Williams, R. (2001) An analysis of award winning local school technology education teachers andtheir use of effective leadership practices. Raleigh, NC: An unpublished dissertation, NorthCarolina State University.

Volume XXX, Number 2 Spring 2004
Promoting Excellence in Preparation
and Excellence in Practice
A refereed publication of
The International Honor Society for Professions in Technology

PublisherJerry Streichler
EditorDennis Cheek
Board of Editors
E. Stephanie AtkinsonUniversity of SunderlandSchool of EducationHammerton Hall, Gray Rd.Sunderland, U.K. [email protected]
Wan-Lee ChengDepartment of Design and IndustrySan Francisco State University1600 Holloway Ave.San Francisco, CA 94132415.338.2211fax: [email protected]
David DevierUniversity of CincinnatiClermont College4200 Clermont College DriveBatavia, OH 45103513.732.5209fax: [email protected]
Michael J. DyrenfurthDepartment of Industrial TechnologyPurdue University1410 Knoy Hall, Room 461West Lafayette, IN 47907-1410765.496.1203fax: [email protected]
Marie KraskaEducational Foundations, Leadership,and TechnologyAuburn University4036 Haley CenterAuburn University, AL 36849-5221334.844.4460fax: [email protected]
Linda Rae Markert200 Poucher HallState University of New Yorkat OswegoOswego, NY [email protected]
Howard E. MiddletonSchool of Vocational Technologyand Arts EducationFaculty of EducationGriffith UniversityNathan 4111 QueenslandAustralia61.7.3875.5724fax: [email protected]
Sam C. ObiDepartment of TechnologySan Jose State UniversityOne Washington SquareSan Jose, CA 95192-0061408.924.3218fax: [email protected]
Christopher J. Shelley CMfgEW. L. Gore & Associates705 Guido Dr.Middletown, DE [email protected]
Xeushu SongDepartment of TechnologyNorthern Illinois UniversityDekalb, IL 60115-2854815.753.1349fax: [email protected]
David Devier(representing the Board of Directors)
Staff for this IssueEditorialConsultantsNancy HooseSeth A. Streichler
Office ManagerSusan Pickens
Art & LayoutKnape Designs
The Journal of Technology Studies (JTS) (ISSN 1071-6048) is the flagship, peer-reviewed journal of Epsilon Pi Tau, Inc, a nonprofit, academic and professional honorsociety. Headquarters and editorial offices are located at the Technology Building,Bowling Green State University, Bowling Green, OH 43403-0305. Use this address [email protected] for subscription matters or purchases.
Copyright 2004 by Epsilon Pi Tau, Inc.
The opinions expressed by the journal’s authors are not necessarily those of the Boardof Directors, staff, or members of Epsilon Pi Tau.
Two print issues per year are mailed to all members of the society and to academic andgeneral libraries around the globe. Issues that are published on-line only, the aforemen-tioned printed issues, and past issues are available free online at scholar.lib.vt.edu/ejour-nals/JTS.
The journal is currently indexed in: Current Index to Journals of Education (USA);International Bibliography of the Social Sciences (IBSS) (UK); and the InternationalVocational Education and Training and Research Database at http://www.ncver.edu.au(Australia).
Separate articles or complete issues are also available in a variety of media forms from:
ProQuest Information and Learning Co., P.O. Box 1346, Ann Arbor, MI 48106-1346
Or EBSCO Publishing, 10 Estes Street, Ipswich, Massachusetts, 01938-0682, USA
The JTS welcomes original manuscripts from scholars worldwide focused on the depthand breadth of technology as practiced and understood past, present, and future. EpsilonPi Tau, as perhaps the most comprehensive honor society among the technology profes-sions, seeks to provide up-to-date and insightful information to its increasingly diversemembership as well as the broader public. Authors need not be members of the societyin order to submit manuscripts for consideration. Contributions from both academicsand practitioners are equally welcome.
A general guide to the breadth of topics of potential interest to our readers can be gainedby consideration of the 17 subclasses within “Technology” of the classification schemeof the Library of Congress, USA <lcweb.loc.gov/catdir/cpso/lcco/lcco_t.pdf>. Thisincludes engineering and allied disciplines, informatics in its many manifestations,industrial technology, and education in and about technology.
Authors are strongly urged to consult the journal’s “Guidelines for Authors,” included inthis publication, or available at the society’s website or provided upon request. It providesadditional details on the breadth and nature of topics of interest, the journal’s scholarlywriting standards, submission guidelines, and review and publication processes.
Printed in the United States of America by Kennedy Printing Company, Findlay Ohio.
Board of Directors
Region 1 (The nations of Europe, theEastern Provinces of Canada, and theNortheastern United States)Dr. Marvin SarapinDepartment of TechnologyKean UniversityUnion, NJ 07083908.737.3500fax: [email protected]
Region 2 (The nations of Africa, theCaribbean Islands, and theSoutheastern United States)Robert E. WenigDepartment of Mathematics, Science, &Technology EducationBox 7801North Carolina State UniversityRaleigh, NC 27695-7801919.515.1742fax: [email protected]
Region 3 ( All members-at-large, theCanadian Province of Ontario, and theNorth Central United States)David DevierUniversity of Cincinnati, Clermont College4200 Clermont College DriveBatavia, OH 45103513.732.5209fax: [email protected]
Region 4 (The nations of Central andSouth America, the Northern Territoryand Central Provinces of Canada, andthe Central United States)Kennard G. LarsonDept. of Industrial TechnologyUniversity of Nebraska at Kearney905 West 25th StreetKearney, NE 68849308.865.8504fax: [email protected]
Region 5 (Australia, the island nationsof the Pacific and Indian Oceans, thenations of Asia, the Yukon Territoryand Western Provinces of Canada, andthe Western United States)James EdwardsDepartment of Design & IndustrySan Francisco State University1600 Holloway AvenueSan Francisco, CA 94132415.338.7896fax: [email protected]
Associate Executive Director for Information and CommunicationDr. Dennis CheekJohn Templeton Foundation5 Radnor Corp. Ctr., Suite 100Radnor, PA 19087610.687.8942fax: [email protected]
Associate Executive Director forCommunity and Technical CollegesJerry C. OlsonTechnology BuildingBowling Green State UniversityBowling Green, Ohio 43403419.372.0378fax: [email protected]
Associate Executive Director forInternational AffairsMichael DyrenfurthSchool of TechnologyPurdue UniversityRoom 461, Knoy HallWest Lafayette, IN 47907-1410765.496.1203fax: [email protected]
Executive DirectorJerry StreichlerTechnology BuildingBowling Green State UniversityBowling Green, Ohio 43403419.372.2425fax: [email protected]
A refereed publication of The International Honor Society for Professions in Technology.
The Journal of Technology Studies

Th
e J
ou
rna
l of Te
ch
no
log
y Stu
die
s
65
ARTICLES
66 Learning and Growing:Integrating TechnologyUndergraduates Into theDevelopment of anIndustrial Case StudyKathryne Newton and Edie Schmidt
70 Using Multimedia to Teacha Class on Technologyand SocietyPatricia Ryaby Backer
79 An Evaluation ofInternet-Based CADCollaboration ToolsShana Shiang-Fong Smith
86 A Model to Integrate OnlineTeaching and LearningTools Into the ClassroomKlaus Schmidt
93 Digital Intelligence Fosteredby TechnologyNan B. Adams
98 An In-Process SurfaceRoughness RecognitionSystem in End MillingOperations Lieh-Dai Yang and Joseph C. Chen
104 Silicon Valley’s ProcessingNeeds Versus San JoseState University’sManufacturing SystemsProcessing Component:Implications for IndustrialTechnologySamuel C. Obi
107 Creative and CollaborativeProblem Solving inTechnology Education: ACase Study in PrimarySchool Teacher EducationJari Lavonen, Ossi Autio, and Veijo Meisalo
116 The Effect of Problem-SolvingInstruction on Children’sCreativity and Self-efficacy inthe Teaching of the PracticalArts SubjectNamyong Chung and Gyoung-sug Ro
123 Energy Technology:A Cross-CurricularApproach in JapanSadato Yamazaki, Cyril King, Mika Shinde,
Osamu Ohiwa, and Sohichiro Hirai
Table of ContentsVolume XXX, Number 2, Spring/Summer 2004
A national industrial distribution associa-
tion approached us to develop a case study for
its association members. The national associa-
tion assumed responsibility for identifying edu-
cational needs of upper level, mid level, and
lower level personnel in the industry. In the pre-
vious year, a case study had been developed to
educate upper level managers in the strategic
nature of distribution in their industry. The
association found that upper level management
had a great learning experience and wanted
lower level workers to have the same opportuni-
ty to refine and enhance their knowledge on
making inventory and warehousing decisions.
The project objective was to develop a case
study that would be used in a weekend work-
shop to educate operations and customer service
personnel involved in making logistics-related
decisions. The mid level operations and
customer service personnel were to attend a
two-day workshop to learn basic terminology,
analyze the case study, and refine their current
knowledge surrounding their job duties.
This article describes the process of develop-
ing a case study for a national trade association
and integrating learning opportunities for under-
graduate technology students at Purdue University.
The needs assessment phase of this project
became an Inventory and Warehouse Management
course project. The educational goal for the week-
end industrial workshop, based on the case study,
was to accomplish the following:
• Be valuable for companies with $5 mil-
lion to $400 million in sales.
• Address the environment where
employees typically handle 3,000 to
8,000 stock-keeping units.
• Teach the attendees in a highly participa-
tive setting.
• Incorporate small group activities.
The educational materials to be developed
for the weekend workshop were a new case
study, workbook, supporting reading materials,
PowerPoint presentation, glossary of common
terms, and an evaluation instrument.
The topic areas to be covered in the case
study and the weekend workshop were:
• Inventory management and control.
• Product backorder and returned goods.
• Facility selection and layout.
• New product introduction.
• Order fulfillment routines.
• Selection of transportation modes.
• Multiple branch issues.
• New technology adoption.
• Human resource management.
• Key productivity measures.
• International issues.
Background onEducational Component
One of the first steps in the case study
development (to be described more completely
under the methodology section) was to
research the needs of the trade association
members. The students accomplished this by
developing and analyzing results of a survey
administered to the industrial distribution trade
association members regarding their logistics
and operational educational needs. This task
proved a valuable opportunity to integrate the
project with a scheduled junior-level class at
Purdue University in the School of Technology.
The School of Technology (and the Industrial
Technology Department) prides itself on teach-
ing students applied concepts via hands-on
learning, experiential exercises. Just as impor-
tant is the need to address what Savage (2001)
called “the challenge of dealing with the
‘Moving Target’ of Technology” (p. 9). Faculty
must be committed to providing opportunities
for relevant content in “learner contemporary”
concepts and providing challenging coursework
for students. What better chance to teach the
concepts and topic areas identified earlier than
having the Inventory and Warehouse
Management students apply what they learn
in the class to this project? The course content
covered all topic areas necessary for the case
study workshop, which made the case study
development a great learning and teaching
opportunity.
Th
e J
ou
rna
l o
f Te
ch
no
log
y S
tud
ies
Articles Learning & Growing: Integrating Technology Undergraduatesinto the Development of an Industrial Case StudyKathryne Newton and Edie Schmidt
66

Th
e J
ou
rna
l of Te
ch
no
log
y Stu
die
s
Faculty and students have evolved to the
point where they value learning through interac-
tive assignments. The objective of this project
was to enhance students’ learning through
increasing knowledge in the following three areas:
(a) systems knowledge; (b) topical areas such as
inventory management, facility layout, product
backorders, and other topical areas identified ear-
lier for companies hiring industrial technology
students; and c) reflectivity, which involves com-
paring one’s thinking to experts and peers.
If students are to develop systems under-
standing, then they must engage in all aspects
of the system, which includes elements, rela-
tionships among elements, operations that
describe how the elements interact, and pat-
terns or rules that govern the preceding rela-
tionships and operations (Lesh & Kelly, 2000).
For example, topics in the Inventory and
Warehouse Management class include new
product introduction, order fulfillment, selec-
tion of transportation modes, new technology
adoption, and so on. Each topic listed above
is in itself a subsystem. These subsystems
comprise the industrial distribution and manu-
facturing system.
Each topic must be understood along with
the relationships to other topics and the rules
and patterns that govern the complex industrial
organization. By mapping out the needs of
industrial distributors in several topic areas, stu-
dents are able to attain systems knowledge of
distribution topics.
The Society of Manufacturing Engineers
(1999) worked with industry and colleges and
universities to analyze the skills and knowledge
necessary for college graduates to become
effective workers in the manufacturing industry.
The study identified 15 competency gaps
including:
• Problem-solving abilities.
• Fundamental topic knowledge such as
manufacturing systems, logistics, and
product/process design.
This project gave students an opportunity
to delve deeper into these topics by applying
course topics and learning additional informa-
tion about distributors’ problems and issues.
Another learning objective of coursework is
the ability to think reflectively, where reflective
thinking involves actively monitoring, evaluat-
ing, and modifying one’s thinking and compar-
ing it to both expert models and peers (Lin,
Hmelo, Kinzer, & Secules, 1999). This project
gave students a chance to compare their beliefs
about current issues in warehouse and inventory
with distributor beliefs on the same issues.
MethodologyCase studies are valuable learning tools
because the case study describes a real situation
for learners. According to Smith and Ragan
(1999), case studies are similar to simulations in
that they present a realistic situation and require
learners to respond as if they were responsible
for solving the problem. “Case studies also
require learners to select and manipulate multi-
ple principles in order to solve problems”
(Smith & Ragan, 1999, p. 145). In order to
make this case study “real” to the inventory and
warehouse personnel, the case study materials
were developed using these four main steps:
1. Research the needs of the trade associa-
tion members, with undergraduate
Purdue students assisting faculty.
2. Establish an overall model for the case
study.
3. Evaluate the case study first draft
with assistance of association board
members.
4. Finalize the case study and develop the
supporting educational materials.
Step 1: Research the Needs of theTrade Association Members
The students had an opportunity to apply
what they learned in class by developing a
survey instrument to be administered to trade
association industrial distribution members.
The students were assigned a semester-long
group project, with four students per group.
The 1. Develop a list of questions for three
topic areas from the suggested list above
(inventory management and control,
productivity, etc.).
2. Contact two distributors and document
the results of their responses.
3. Generate a written report.
4. Present recommendations and sugges-
tions to the class.
67

Th
e J
ou
rna
l o
f Te
ch
no
log
y S
tud
ies
Each student group was asked to pick three
topic areas from the list of topic areas to be cov-
ered in the case study. The students developed a
list of questions to ask distributor personnel
related to the topic area. The questions captured
the information needed for the study. In order
to validate the questions, the students individu-
ally assessed the questions and responded to the
question to determine the types of responses to
expect. Then, as a student group, the questions
and responses were analyzed. Were the answers
valuable? Were responses inconsistent? (i.e.,
Did one person respond completely differently
from another person?), or Was the question
unclear? Problem areas for each of the ques-
tions were then identified. The student groups
then finalized questions with tables of responses
expected from the distributors.
Example for topic area: Backorders and
Returned Goods
Question: What is your policy for handling
product backorders?
Answer 1: The backorders are filled as
early as possible.
Answer 2: What is a backorder?
Answer 3: Backorders are filled before
new orders are filled.
The students determined that different
respondents might see each question uniquely
different, so identifying some specific problems
with the questions was necessary. Continuing
on with this example, the students identified
these problem areas for the backorder and
returned goods topic area:
1. What is meant by backorders?
2. Is the prioritization of backorders
the key?
3. The term policy is ambiguous.
The problem areas then forced the members
of the student group to reevaluate their objective
in asking the question and develop a more com-
plete question. In this case the student group
determined the following question would capture
the essence of the information they were seeking:
When your company has an order that can-
not be filled immediately from on-hand invento-
ry, how do you make sure the customer gets its
order?
The output from each student group was a
survey customized for three topic areas. The
trade association then gave the students a list of
distributors to contact, and the students began
the process of contacting the distributors via
email and fax.
The student groups were responsible for
contacting three to five distributors each and
documenting the distributor responses by
organizing the data in tables and charts.
These results clearly identified key issues
and problem areas for the distributors’ case
study and also statistics for most common
responses and unusual responses. Another
benefit from the results was the discovery of
special jargon and terminology used in the
industry. The students collected data from
over 40 distributors, with at least four distrib-
utor respondents per topic area. For each
topic area, the students aggregated the differ-
ences and similarities of responses. These
similarities and differences in operating pro-
cedure were highlighted by size of company,
product type, number of stockkeeping units,
and location. This information gave an even
clearer picture of the audience for the week-
end workshop.
The data collection process was not over
yet, however. We then visited distributor ware-
houses in the industry to further validate the
survey results. On-site visits with different-
sized distributors were particularly valuable for
verification of the issues from the distributor
survey responses. Although the distributors
were in the same industry, each was unique in
how it conducted business, the knowledge level
of warehouse personnel, and terminology used
by each employee. Lastly, these site visits con-
firmed that the workshop would have to be
conducted at a level consistent with the typical
warehouse and inventory personnel education
and experience level. Given the varied back-
grounds of the personnel, the workshop was
developed using adult learning principles.
Characteristics of adult learners are (a) their
experience is a foundation for learning but
each adult learner is unique in his/her needs
because of age, ability, work experience, and
cultural background, and (b) adult learners
expect class time to be well spent and help
68

Th
e J
ou
rna
l of Te
ch
no
log
y Stu
die
s
them immediately apply their knowledge to
their daily lives (Wisma, 2001).
Step 2: Establish an Overall Modelof the Case Study
The data collection site visit phase identi-
fied key competencies and areas for improve-
ment for distributors in the industry. The six-
page case study incorporated the human ele-
ment with main characters the inventory and
warehouse personnel would relate to, as well as
key problems likely to be experienced in each
company. The case was a scenario depicting
problems that a “traditional” warehouse supervi-
sor faced when the company was acquired by a
much larger “world-class” parent company. The
case described many operational issues that had
to be corrected in order to meet the new stan-
dards for warehouse operations, including
quantitative measures that provided for the basis
of analysis and problem-solving exercises by
participants.
Step 3: Evaluation
The six-page “Brees Floor Covering Case”
and initial workshop objectives were forwarded
to the industrial distribution association officers
for feedback. Comments and suggestions were
incorporated into the case study document.
Step 4: Finalize the Case Study
The workshop educational materials were
finalized, including the case study, instructor’s
manual, supplemental readings, glossary of
common terms, and supporting multimedia
materials. The in-class activities and workshop
schedule were developed using the following
adult learning principles (Wisma, 2001):
Adults need to know why they need to
learn something.
• Adults need to learn by experimentation.
• Adults approach learning as problem
solving.
• Adults learn best when the topic is of
immediate value.
• Adults view learning as an active process
in the construction of meaning.
FindingsWriting a case study proved to be a great
opportunity for us in several areas. We were
able to update our working knowledge of a spe-
cific industry. The teaching of undergraduate
technology students was enhanced through a
sharing of responsibilities with the students. An
active learning environment linked with the real
world was realized through this hands-on proj-
ect. An end goal for the workshop was to moti-
vate inventory and warehouse management per-
sonnel to learn more about their industry and
new techniques in their field. This case will
also be valuable as a learning aid in future ware-
house and inventory management classes.
We challenge educators, graduates, stu-
dents, industrial representatives, and others
interested in technology education to engage in
educational projects of this nature. Pick an
operational area or industry to research and
develop a case study. The benefits and chal-
lenges are many—a journey not to be missed!
Dr. Kathryne Newton is an Associate
Professor in the Department of Industrial
Technology at Purdue University. She is a
member of the Gamma Rho Chapter of Epsilon
Pi Tau.
Dr. Edie Schmidt is an Assistant Professor
in the Department of Industrial Technology at
Purdue University. She is a member of the
Gamma Rho Chapter of Epsilon Pi Tau.
69
References
Lesh, A. E., & Kelly, R. A. (2000). Handbook of research design in mathematics and science
education. Mahwah, NJ: Erlbaum.Lin, X., Hmelo, C., Kinzer, C. K., & Secules, T. J. (1999). Designing technology to support reflection.
Educational Technology: Research & Development, 47(3), 43-62.Smith, P. L., & Ragan, T. J. (1999). Instructional design (2nd ed.). Upper Saddle River, NJ:
Prentice-Hall.Savage, E. (2001). Technology curriculum organizers that could make a difference. The Journal of
Technology Studies, 27(2), 4-10.

Th
e J
ou
rna
l o
f Te
ch
no
log
y S
tud
ies
70
Society of Manufacturing Engineers. (1999). Manufacturing education plan: 1999 criticalcompetency gaps. Dearborn, MI: SME and SME Education Foundation.
Wisma, M. (2001). Train the trainer manual. Unpublished master’s thesis, Purdue University,Lafayette, IN.
Using Multimedia to Teach a Class on Technologyand SocietyPatricia Ryaby Backer
There has been considerable discussion in
general educational publications about the value
of instructional technology, in particular multi-
media- or Web-based instruction. Much of the
published work thus far has described various
features of multimedia systems in an anecdotal
manner rather than focusing on an evaluation of
multimedia and its use in the university setting
(Windschitl, 1998). In all of the discussion on
multimedia, the nature of multimedia and learn-
ing using multimedia are interlinked. That is,
most authors attribute positive pedagogical
implications to multimedia merely because of
its nature or structure (Campos, Salcedo, &
Rossel, 1996; Fontana, 1993). This perspective
combines two aspects of learning, what is
learned and how it is learned, into one entity.
This pedagogical perspective has some founda-
tion in the literature (Bayne & Land, 2000;
Fenley, 1998; Plowman, 1996; Wild & Quinn,
1998). There have been long-standing claims
that students learn faster and retain more infor-
mation the more they are involved in the learn-
ing process (Liu & Hsiao, 2001; Royer & Royer,
2002). Therefore, the more students interact,
the more they will learn. From a theoretical
perspective, Hamilton (1990) saw the curricu-
lum as a process that should not separate what
is learned from how it is learned. This duality
is the fundamental identity of multimedia.
By its nature, multimedia-based learning is
more complex than traditional lecture instruc-
tion. According to Mandl (1998), there are a
number of factors to consider in designing a
model for complex learning. First, there must be
appropriate support for complex learning, for
example, the development of a multimedia
structure by a teacher or peer. Second, there is
the need to prepare students for a new learning
environment. One major problem with innova-
tive teaching methodologies is that there is a
lack of fit between the innovative instruction
and the evaluative measures (i.e., tests and
examinations). The multimedia and evaluation
methods should complement each other and
enhance the overall learning environment.
Because of the unique nature of multime-
dia, problems exist with the delivery of instruc-
tion. Jonassen (1991) described three major
problems that occur in multimedia: navigation
(users get lost in the document), difficulty in
integrating the presented information into per-
sonal knowledge structures, and cognitive over-
load. Also, he stated that a learner’s interactions
within a multimedia environment are not pre-
dictable and are less deterministic than other
modes of instruction. Other researchers (Babu,
Suni, & Rasmussen, 1998; Cordell, 1991) have
found that a student’s learning style affects
achievement on multimedia-based learning.
Divergers (using Kolb’s learning style prefer-
ence) were found to improve more on posttest

Th
e J
ou
rna
l of Te
ch
no
log
y Stu
die
s
ment may propose a course for any area of GE.
The course involved in this multimedia develop-
ment process was approved as an advanced GE
course in the earth and environment area until
spring 2000. In fall 2000, after a revision of the
university GE program, the course was approved
in another advanced GE area (culture, civiliza-
tion, and global understanding) where it remains
an approved course today.
Before any multimedia development work
was done, a faculty panel revised the course syl-
labus. Originally, there were eight units in the
course. During the discussions of the course by
the faculty, there was a general consensus that
there was too much course content. So, the con-
tent of the course was revised to reduce the
number of units to six. After the course syllabus
and content were determined, the development
work began on the multimedia modules.
The first decision in the multimedia devel-
opment process was the choice of authoring
environment; the package chosen was
Authorware for Windows. In addition, other
planning decisions included discussions with the
university’s central computing facilities related
to the use of e-mail by students and the most
effective way to manage the e-mail interactions
among students and with the faculty coordinator
and also determining the best way to include
videotaped materials: on videotapes,
videodisks, or as a part of the multimedia envi-
ronment using CD-ROMs.
The primary outcome of this project was
self-paced modules on CD-ROMs that allowed
students to explore the topics presented in this
class on their own, while being able to corre-
spond with other students and faculty by e-mail.
Two units were chosen for multimedia develop-
ment: Unit 1. The Nature of Science and
Technology, and Unit 2. Technology and Work.
The primary instruction for these modules was
by a multimedia-based document that provided
an organizational structure for the course. In
addition, textbooks, readings, and videotapes
were required by the class.
Each unit in the course was developed as a
series of files using Authorware, with each unit
having an introductory section (file) followed by
71
measures than those who have other learning
styles. This could lead one to state that the suc-
cessful use of hypermedia requires nonlinear
thinking on the part of the user—this type of
thinking may not be successful for all users.
It is crucial to understand the social aspects
of teaching and learning with multimedia.
Multimedia and Web-based courses create a dif-
ferent educational environment than is seen in a
traditional classroom. Students bring their cul-
tural backgrounds, university expectations, and
personal computer experiences into all their
learning environments, including the multime-
dia experience. In class, however, the instructor
can adapt to students more easily than in an
online environment. In an online environment,
the face-to-face interaction is diminished or lost,
making it more difficult for the faculty member
to interpret the nonverbal cues from the stu-
dents. This course is taught at San José State
University (SJSU), which has an extremely
diverse student body. Since learning can not be
separated from the learners’ historical and cul-
tural backgrounds (O’Loughlin, 1992), this level
of diversity provides additional challenges to the
use of multimedia in a course.
Design and Development of theMultimedia Modules
As designer of this project, I applied for a
SJSU Improvement of Instruction grant and was
awarded one for the 1994 calendar year. The
course chosen for this project was Technology
and Civilization, a general education science-
technology-society (STS) course. This course is
required for industrial technology majors in the
College of Engineering as well as being a popu-
lar advanced general education (GE) course for
other majors at SJSU.
The GE program at SJSU (1998) is different
from many in the United States. Instead of speci-
fying a specific series of courses as part of the
GE of each student, SJSU has five core GE
areas (skills, science, humanities and arts, social
sciences, and human understanding and develop-
ment). In addition, every SJSU student must take
advanced GE courses in four areas: earth and
environment; self, society, and equality in the
U.S.; culture, civilization, and global understand-
ing; and written communication. Any depart-

Th
e J
ou
rna
l o
f Te
ch
no
log
y S
tud
ies
four to eight sections (files) in each unit. At the
end of each section, students were required to
complete a class activity and submit the activity
to their professor by e-mail. The individual files
were linked by hypertext commands so that the
student would not have to run the individual
files separately. The multimedia was converted
to an executable version for student use. The
multimedia modules included graphics, video
clips, and animations that were related to the
text presented in each section. The media for
each section was chosen to build upon the text
and was positioned on the same screen.
According to researchers (Mayer, 1989; Mayer
& Sims, 1994), verbal information and pictorial
information are more effective if they are pre-
sented nearby rather than on different screens.
The design and development phase of this
multimedia course spanned seven years, from
June 1994 to May 2001. During this seven-year
period, I generated five distinct versions of the
multimedia modules. At each stage of the
development process, the modules were evaluat-
ed by all the faculty teaching the course as well
as by students in the course. The significant
changes and the evaluation for each version are
discussed in the sections below.
Version 1The first version of Units 1 and 2 was used
in fall 1994 and spring 1995 lecture courses as
presentation modules although the entire hyper-
media course was not finished. The multimedia
modules were structured using a modified hier-
archical hypermedia. The most significant dif-
ferences between Unit 1 and Unit 2 at this time
relate to their navigational structures. Unit 1,
designed first, was predominately linear
although some of the sections contained a menu
screen. As compared to Unit 1, Unit 2 was less
linear in structure and the information was
grouped into chunks with page numbers in
each chunk.
Selected students and faculty teaching the
course evaluated the modules in order to further
refine these multimedia documents. In initial
field tests with several students, many students
reported problems with navigating (getting lost
in the document) through the modules. This,
according to Jonassen (1991), is one of the three
major problems that occur in multimedia. Other
feedback was obtained from instructional
designers at an international conference in 1996
when I presented the development and design of
the first version of these multimedia modules.
Version 2After gathering several semesters of data on
Version 1 of the multimedia documents for Units
1 and 2, Version 2 of the multimedia was created
in 1999. Version 2 was a minor revision that
focused on the addition of enhancements includ-
ing a pull-down menu to allow students to end
each section in the middle and to return later to
where they had left off, a change in font from
serif to sanserif to increase readability, and addi-
tion of a student log-in subroutine to allow track-
ing of student pathways through the multimedia.
During the summer session 1999, Version 2
was field tested in one section of the class with
14 students. The students were randomly
assigned to two groups: Group 1 completed the
multimedia module on Unit 1 (The Nature of
Science and Technology) and Group 2 complet-
ed the multimedia module on Unit 2
(Technology and Work). The summer session
was organized into a one-week class with eight
hours of class each day. Day 1 of the class was
devoted to Unit 1 and Day 2 of the class was
devoted to Unit 2. On their randomly assigned
multimedia day, the students were sent to a
computer laboratory where each student was
assigned a computer and given a CD-ROM.
Instead of attending class, they stayed in the
computer laboratory and completed the multi-
media. In lieu of their “regular” classwork, they
completed the online class activities at the end
of each section of the multimedia and submitted
these to their instructor.
On the first day of class, the students were
given a demographic student profile that asked
their age, experience and time spent daily on a
computer, and major. Also, the students were
given two computer attitude questionnaires. The
first was an open-ended survey with three ques-
tions designed to find out how they defined
computers and their love-hate relationship with
computers. This survey was developed by Morse
and Daiute (1992) and was field tested by this
researcher (Backer & Yabu, 1994) in a previous
72

Th
e J
ou
rna
l of Te
ch
no
log
y Stu
die
s
study. The second survey was a revised version
of Oetting’s (Martin, 1998) Computer Anxiety
Scale (COMPAS). These two computer surveys
were given to control for any variability in the
computer anxiety and/or attitudes of the two
treatment groups.
In addition to the computer anxiety/atti-
tudes surveys, all the students were given
pretests for both Units 1 and 2 before either
class instruction or multimedia instruction
began. On the last day of class, the students
were given the posttests for both units. The
pretest and posttest for Unit 1 (The Nature of
Science and Technology) had eight questions
that were selected by faculty teaching the course
as representative of the information covered in
the unit. The pretest and posttest for Unit 2
(Technology and Work) had 11 questions also
selected by faculty.
Students in the two treatment groups had an
equivalent mean age (27 years) and similar
amounts of time reported as spent on computers
each day (3.09 hours/day for Group 1 versus
2.95 hours/day for Group 2). In addition, both
groups showed a wide range of computer anxi-
ety on the COMPAS; however, the mean com-
puter anxiety score for each group was equiva-
lent (M = 108 for Group 1 versus M = 107 for
Group 2). In performance, the two treatment
groups appeared to be distinctly different. Based
upon the ANOVA for Unit 1, there was no dif-
ference in student performance when comparing
the multimedia-based instruction with the tradi-
tional classroom instruction. The students taking
the multimedia-based instruction for Unit 1, in
fact, did worse on the posttest than those stu-
dents in the traditional classroom. However,
since the students in Group 1 had consistently
worse overall performance than students in
Group 2, this result is inconclusive. The results
from Unit 2 were different than those of Unit 1.
The results showed that both groups had signifi-
cantly higher scores on the posttest than on the
pretest. An ANOVA comparing the pre- and
posttest scores showed an F value of 39.84 (p <
.001). As for Unit 1, Group 2 (the students tak-
ing the multimedia for Unit 2) performed better
on the posttest than did Group 1 although the
difference was much less (M = 7.7 for Group 1;
M = 8.4 for Group 2).
Overall, the multimedia for Unit 2 led to
higher student achievement than either the “reg-
ular” classroom instruction or the multimedia
for Unit 1. The qualitative evaluation of the
multimedia modules was examined to see if
there were any commonalities that indicated
why the Unit 2 multimedia was more successful.
Ten of the 14 students completed a qualitative
evaluation of the multimedia modules. All 10
students liked the multimedia modules for the
class. As one student stated, “I liked the video
interactions, they allowed me to comprehend the
material better.” Another student noted, “I found
the multimedia portion of this class to be very
impressive. I really enjoyed the freedom and
convenience of the CD ROM. The content
allowed me to gain specific knowledge on spe-
cific subjects that I would not have otherwise
known about.” Overall, the students taking the
Unit 1 multimedia found they had a harder time
navigating through the material. Since Version 2
of the Unit 1 multimedia presented the material
in a linear fashion, the students did not know
where they were in the course of the lesson.
Also, they noted that it was difficult for them to
review previous material. The students who took
the Unit 2 multimedia complained about the
amount of material in each section.
Version 3Overall, there appeared to be several issues
related to the multimedia modules. Both the Unit
1 and Unit 2 feedback from Version 2 related to
two multimedia design issues: navigation and
narrative structure. To increase student control of
the learning environment, controls were added to
all video clips in both Unit 1 and Unit 2 that
allowed students to pause, play, and stop videos.
Also, each section in Unit 1 and Unit 2 included
a class activity at the end so that the students
could achieve closure on each topic.
It was evident from the qualitative and stu-
dent outcomes that the navigational structure of
Unit 2 was better than that of Unit 1. However, a
problem still existed with the narrative structure.
Because the information was not presented in a
clear, organized manner, the students’ learning
was adversely affected. As Laurillard (1998)
pointed out in her research, “learners working on
interactive media with no clear narrative struc-
ture display learning behaviour [sic] that is gen-
73
Th
e J
ou
rna
l o
f Te
ch
no
log
y S
tud
ies
erally unfocused and inconclusive” (p. 231). The
chunking of information is interlinked with the
narrative structure of multimedia. Because the
teacher-storyteller is remote from the student-lis-
tener, the design of the multimedia and the
chunking of its content need to be more robust.
At this time, it was decided to complete a
structural change of Unit 2 to address both the
issues of chunking and narrative structure
before making any substantive revisions to Unit
1. The three sections of Unit 2 were reorganized
completely and divided into eight parts: The
Industrial Revolution, Industrialization of
Society in the 19th Century, Workplace of 1900,
Scientific Management, The Development of
the Assembly Line, Consumerism in the West,
Nature of Work Today, and How Does
Technology Affect the Workplace? The content
in each section was revised so that the students
could reread a section without restarting from
the beginning. This reorganization provided a
better narrative structure and, at the same time,
increased learner control. As Steinberg (1989)
found, increasing learner control can make the
learning experience more motivating as well as
increase student learning.
Version 3 was used in the winter 2001 class
as a replacement for the in-class instruction. On
the first day of class, the students were given
the multimedia CD-ROMs for both units and
were asked to complete them at home or in one
of the department’s computer labs. Each week-
day during the winter term, students would e-
mail the appropriate class activities to their
instructor. A review of the class activities sub-
mitted by the students indicated that they
learned the subject matter for both units. After
the multimedia modules were finished, the stu-
dents returned to the classroom. Since all the
students in the class used the multimedia mod-
ules, their performance was compared with a
previous winter 1999 class (taught entirely in a
“traditional” mode). The winter 2001 class (M =
84), on average, achieved higher grades on the
final exam than did the winter 1999 class (M =
78), but the results were not significant. Results
from the qualitative evaluation showed no more
complaints about navigation or the amount of
content in each section for Unit 2 and indicated
that the students viewed the experience in a pos-
itive light. Overall, the students preferred the
navigational design of Unit 2 to that of Unit 1.
Overwhelmingly, the comments were positive
about the multimedia modules. There was one
significant student suggestion for this version of
the multimedia. The students wanted the ability
to print out the text easily. (Since this multime-
dia was constructed using Authorware, students
could not “cut and paste” the text on the screen
as they were accustomed to doing on the Web.)
Versions 4 and 5Version 4 was the last major revision of
these multimedia modules. The work for this
revision centered on Unit 1. Based upon the
feedback from Version 3, Unit 1 was completely
redesigned to follow the “look and feel” and
structure of Unit 2. The new Unit 1 was less lin-
ear and the information was grouped into
chunks with page numbers in each chunk. The
existing six parts for Unit 1 were re-divided into
seven sections: the old section What Is Science
and Technology? was divided into two sections:
What Is Science? and What Is Technology?
Also, all the video clips for both units were
recaptured at higher resolution and converted to
QuickTime format in Unit 1. I added a new
pull-down menu with an option to view the text
in each section as a text file. (This was done to
address students’ complaint that they could not
easily print the text.) Also, the class activities
were revised and a few links to Web sites were
added. All the movies in both units were
changed to allow student use of a standard
Quicktime control bar. The multimedia was
ported to the Macintosh platform so that stu-
dents could use either a Windows or MAC com-
puter to view the material.
Beginning in the fall 2000 semester, all
instructors in all sections began to use the multi-
media modules in their classes. Most of the
instructors used the multimedia as self-paced
learning while other instructors used the
modules as a supplement to in-class discussion
sessions. Since all of the instructors used the
modules, there was a greater amount of feedback
from both the instructors and the students. This
dissemination created additional challenges for
the instructor and author (who also served as the
course coordinator). As Zirkle and Ourand (1999)
found, teaching a course through multiple deliv-
74

Th
e J
ou
rna
l of Te
ch
no
log
y Stu
die
s
ery formats, in this case multimedia as well as
lecture, requires new expertise on the part of fac-
ulty. During the fall 2000 semester, there were
several technical issues that needed to be
resolved with various faculty. As faculty experi-
ence with the multimedia increased each semes-
ter, there were fewer problems and less faculty
anxiety about using these modules as an integral
part of their class.
The last revision of the multimedia mod-
ules, Version 5, was minor and focused on
updating and revising the content in several sec-
tions. For four semesters, all the faculty current-
ly teaching this course have used the multimedia
in their classes. Now, these multimedia modules
are required for all sections of this course. There
are plans to update the content in each multime-
dia every two years.
A Worthwhile EffortThe development process of multimedia
modules for a GE course at SJSU was very long
and complex. In fact, the development cycle of
these multimedia modules spanned seven years
and five separate revisions. When first proposed
in 1994, the process was envisioned as a one-
year project. However, there were many twists
and turns along the way. Because of the nature
of multimedia, there is the expectation that
changes in multimedia material will happen fre-
quently. These changes, whether small or large,
can be very time consuming. For example, the
relatively small change to add a pull-down menu
to allow students to print the text (made in
Version 4) took six weeks because of the num-
ber and size of the multimedia files.
75
VERSION MAJOR CHANGES
Version 1November 1994
Six parts: (a) What Is Science and Technology? (b) What Is Scientific andTechnological Literacy? (c) The Scientific Method, (d) Attitudes Toward Technology, (e)Technology Dependence and Technology Traps, and (f) Impact of Technology onSociety.Each part predominately linear, some contain a menu screen. All sections loop backto the menu screen. Limited student control over videos. Files named numerically.Each part contains a cumulating class activity.
Version 2August 1999
Minor revision. Same basic structure as Version 1. Added navigation pull-downmenus. Changed fonts to sanserif. Added student login to track information. Filesgiven more descriptive names.
Version 3November 2000
Redesigned color scheme and fonts. Added controls to all videos; controls allowstudents to pause, play, and stop videos. Redesigned class activities.
Version 4June 2000
Seven parts: What is Science and Technology? was divided into two sections: WhatIs Science? and What Is Technology?Completely redesigned the structure to follow the “look” and structure of Unit 2.Less linear, information is grouped into larger chunks with page numbers in eachchunk. Added a new pull-down menu with option to view the text in each sectionas a text file. Revised the class activities and added a few links to Web sites.Revised colors and fonts so that entire unit has a consistent color scheme.Recaptured all video clips at higher resolution and converted to QuickTime format.Changed all movie clips from movie icon to QuickTime media with control bar.
Version 5May 2001
Minor revision. Same basic structure as Version 4. Revised content of several sections.
Summaries of ChangesUnit 1. The Nature of Science and Technology

Th
e J
ou
rna
l o
f Te
ch
no
log
y S
tud
ies
The original development of the first version
of the multimedia modules took longer than had
been estimated. Also, there was a significant time
gap between the publication of Versions 1 and 2.
This delay can be attributed to several factors—
fatigue with multimedia being the primary one.
This factor is infrequently mentioned in the litera-
ture. It takes an extraordinary amount of time to
develop fully functional multimedia modules.
Another cause for the time delay between versions
was a university restructuring of the GE pro-
gram—this multimedia project was put on hold
until the class was recertified for GE. A consistent
time constraint existed throughout the life of this
project. I also work at a teaching institution where
the course load is typically four different classes
each semester (12 units). This heavy teaching load
reduced the amount of time available to work on
the multimedia modules during the academic year.
Technical problems constantly occur in mul-
timedia development. And, it seems that often
the solution to one technical problem leads to a
new one. The story of the video clips in this
multimedia project highlight this sort of techni-
cal problem. Originally, most of the video clips
were captured at 120 X 160 screen resolution in
1994–1995 at 10–15 fps. Then, they were com-
pressed using Digital Video Producer or Adobe
Premiere to Microsoft AVI format using
Cinepak, Intel Indeo, or Microsoft Video 1 com-
pression. The quality of the video for the time
(1994–1995) was fine; but in 1999 I decided that
the videos needed to be recaptured at a higher
resolution and frame rate. Also, since 1999 there
has been an increase in the number of students
using the MAC platform; therefore, all the new
76
VERSION MAJOR CHANGES
Version 1November 1994
Three parts: (a) History of Technology and Work, (b) Nature of Work in the 20thCentury, and (c) How Does Technology Affect the Workplace? Each part contains a menu screen. All sections loop back to the menu screen.Less linear, information is grouped into larger chunks with page numbers in eachchunk. Navigation pull-down menus. Added student log-in to track information.Files named numerically. Each part contains a cumulating class activity.
Version 2August 1999
Minor revision. Divided into four parts. The History of Technology and Work sectionwas split into two files: The Industrial Revolution and Industrialization of Society.Same overall content structure as Version 1. Added student log-in to track informa-tion. Files given more descriptive names.
Version 3November 2000
Reorganized completely and divided into eight parts: The Industrial Revolution,Industrialization of Society in the 19th Century, Workplace of 1900, ScientificManagement, The Development of the Assembly Line, Consumerism in the West,Nature of Work Today, and How Does Technology Affect the Workplace?Added Previous Section and Next Section buttons to all content chunks (allowsstudents to reread a section without restarting from the beginning). Added morecontent to the sections. Added controls to all videos; controls allow students topause, play, and stop videos. Changed font. Redesigned class activities. Addedadditional video clips. Recaptured all video clips at higher resolution and convert-ed to QuickTime format.
Version 4June 2000
Minor revision. Added a new pull-down menu with option to view the text in eachsection as a text file. Revised the class activities and added a few links to Websites. Revised colors and fonts so that entire unit has a consistent color scheme.Changed all movie clips from movie icon to QuickTime media with control bar.
Version 5May 2001
Minor revision. Revised content in two sections: Nature of Work Today and HowDoes Technology Affect the Workplace?
Unit 2. Technology and Work

Th
e J
ou
rna
l of Te
ch
no
log
y Stu
die
s
recaptured videos had to be converted into
Quicktime format so that the video clips could
be viewed on both platforms. At the same time,
the version of Authorware changed. Version 1 of
this multimedia was authored using Authorware
2 while Version 5 was authored using
Authorware 5. A new technical problem
occurred with Version 4 of the multimedia. On
certain Windows platforms (Windows NT, for
example), the Quicktime videos would not run.
Eventually, this technical problem was resolved
by changing the programming in Authorware
from a movie icon to a media type. Because of
the financial constraints at SJSU, I was forced to
allocate time to many programming issues. This
time reduced the amount of time available for
academic research and development projects.
Since the first version of the multimedia
was published, there has been more research
that has indicated the importance of good inter-
face design in the context of learning (Maddux,
Johnson, & Willis, 1997; Shneiderman, 1997).
Brown (2000) called visual and design princi-
ples the forgotten partner in multimedia and
Web development. As I learned the hard way
through the student feedback to Versions 1 and
2, bad design and organization increases confu-
sion in learners and causes them to “get lost.”
Most developers of multimedia assume that
media-rich technologies help students form a
deeper understanding of the material (Bayne &
Land, 2000). The qualitative and quantitative
evaluations I have conducted over the past few
years show that this is almost always the case
(Backer, 1995, 2000). The multimedia is “self-
paced” and “empowering,” to quote two of the
students surveyed, but it also behaves in unex-
pected ways. Students bring their existing
worldviews and perspectives to their learning
experience, and a multimedia learning environ-
ment does not give them the cues they are
accustomed to from their professors. This is one
reason that this course is a hybrid course rather
than a multimedia-only course. A hybrid course
balances multimedia instructions with discus-
sion sessions with students. This structure
allows the students to interact with each other
and the instructor about the content and solves
many problems inherent in self-paced instruc-
tion including high dropout rate, student lack of
focus, and difficulty in integrating the presented
information into personal knowledge structures.
Most of the existing research shows that
there is no significant difference in student
achievement using multimedia as compared to
“traditional instruction” (see Russell, 2000, for
a review). Therefore, the debate should change
to focus on increased access to education. Self-
paced multimedia and Web-based courses give
more access to more learners. The use of these
CD-based modules has allowed students to have
more flexibility in completing their GE require-
ments. In addition, it has allowed the depart-
ment to serve a larger number of students with
less faculty leading to higher FTEs and SFR.
This is only one of two advanced GE courses in
the College of Engineering at SJSU; therefore,
this method of providing instruction provides
more options and more flexibility to students in
the completion of their GE requirements.
Beyond the effect on the curriculum at
SJSU, this mode of delivery provides an oppor-
tunity for all STS courses. In this course, these
multimedia modules seek to explain the nature
and history of technology by using technology.
The direct purpose is to provide in-depth course
content for all instructors of this course.
Indirectly, these modules give students the expe-
rience of using advanced technologies to learn
about the nature of technology. Although the
dichotomy is not directly stated in the multime-
dia materials, most students comment on the
indirect messages about technology and their
additional experiences, in this course, with tech-
nology as a learning medium.
As more universities consider adding STS
courses to their curriculum, the delivery of these
courses through multimedia can add depth to the
story they are telling about the relation of tech-
nology to society. By using the Web and multi-
media, student experiences can be enhanced and
students can get a richer, more complex view of
technology and its effects on our world.
Dr. Patricia Ryaby Backer is the chair of
the Department of Aviation and Technology in
the College of Engineering at San Jose State
University. She is a member of Rho Chapter of
Epsilon Pi Tau.
77

Th
e J
ou
rna
l o
f Te
ch
no
log
y S
tud
ies
78
References
Babu, S., Suni, I. I., & Rasmussen, D. H. (1998). Development of a CD-ROM in thin filmtechnologies: Design, usability assessment and challenges. Journal of Engineering Education(Supplement), 583-589.
Backer, P. R. (1995). Technology and civilization: A multimedia course. In T. Sechrest, M. Thomas,& N. Estes (Eds.), Proceedings of the ICTE 1995 conference (Vol.2, pp. 566-568). Arlington, TX:International Conference on Technology and Education.
Backer, P. R. (1996). General education through multimedia: A course on technology & civilization.Paper presented at ED-MEDIA/ED-TELECOM 96, Boston.
Backer, P. R. (2000). Effectiveness of a multimedia general education course. In 2000 ASEE annual conference & exposition proceedings. Retrieved May 15, 2003, from the American Society forEngineering Education Website: http://www.asee.org/conferences/search/20184.pdf
Backer, P. R., & Yabu, J. (1994). Computer anxiety of industrial technology students. Journal of Industrial Technology, 10(3), 5-9.
Bayne, S., & Land, R. (2000). Learning in the labyrinth: Hypertext and the changing roles of instructor and learner in higher education. In J. Bourdeau & R. Heller (Eds.), Proceedings of ED-MEDIA2000 (pp. 65-70). Charlotteville, VA: Association for the Advancement of Computing inEducation.
Brown, I. (2000). The forgotten partner: The role of visual, graphic and design principles in educationalmultimedia course instruction. In J. Bourdeau & R. Heller (Eds.), Proceedings of ED-MEDIA2000 (pp. 123-126). Charlotteville, VA: Association for the Advancement of Computing inEducation.
Campos, D. D., Salcedo, P. L., & Rossel, P. F. (1996). HCID: An experience in collaborative work anddistance education. In P. Carlson & F. Makedon (Eds.), Proceedings of Ed-TELECOM 9: Worldconference of educational telecommunications (pp. 56-61). Charlotteville, VA: Association for theAdvancement of Computing in Education.
Cordell, B. J. (1991). A study of learning styles and computer-assisted instruction. Computers in Education, 15(1), 175-183.
Fenley, S. (1998, November). Navigational patterns in interactive multimedia and their effect on learning. Paper presented at the WebNet 98 world conference of the WWW, Internet, and Intranet proceed-ings, Orlando, FL. (ERIC Document No. ED 427 701)
Fontana, L. A. (1993, January). Multimedia: A gateway to higher-order thinking skills. Paper presented at the convention of the Association for Educational Communications and Technology, NewOrleans, LA. (ERIC Document No. ED 362 165)
Hamilton, D. (1990). Learning more about education: An unfinished curriculum. New York: Open University.
Jonassen, D. H. (1991). Hypertext as instructional design. Educational Technology, Research, andDevelopment, 39(1), 83-92.
Laurillard, D. (1998). Multimedia and the learner’s experience of narrative. Computers & Education,31(2), 229-242.
Liu, M., & Hsiao, Y. (2001, June). Middle school students as multimedia designers: A project-based learning approach. Paper presented at the National Educational Computing conference, Chicago.(ERIC Document No. ED 462 936)
Maddux, C. D., Johnson, D. L., & Willis, J. W. (1997). Educational computing: Learning with tomorrow’stechnologies (2nd ed.). Needham Heights, MA: Allyn & Bacon.
Mandl, H. (1998). Consideration for complex learning. Panel: Scaffolding constructivism in thelearning of complex knowledge: International perspectives on the design, use and evaluation ofadvanced technological learning environments. In T. Ottmann & I. Tomek (Eds.), Proceedings ofED-MEDIA/ED-TELECOM 98 (pp. 2112-2113). Charlottesville, VA: Association for theAdvancement of Computing in Education.
Martin, B. (1998, September). Computer anxiety levels of Virginia cooperation extension field personnel.Dissertation Abstracts International, A59(03), 792. (AAT 9825660)

Th
e J
ou
rna
l of Te
ch
no
log
y Stu
die
s
79
Mayer, R. E. (1989). Systematic thinking fostered by illustrations in scientific text. Journal of Educational Psychology, 81(2), 240-246.
Mayer, R. E., & Sims, V. K. (1994). For whom is a picture worth a thousand words? Extensions of a dual-coding theory of multimedia learning. Journal of Educational Psychology, 86(3), 389-401.
Morse, F. K., & Daiute, C. (1992). I like computers versus I Likert computers: Rethinking methodsfor assessing the gender gap in computing. Paper presented at the annual meeting of theAmerican Educational Research Association, San Francisco.
O’Loughlin, M. (1992). Rethinking science education: Beyond Piagetian constructivism toward asociocultural model of teaching and learning. Journal of Research in Science Teaching, 29(8),791-820.
Plowman, L. (1996). Narrative, linearity, and interactivity: Making sense of interactive multimedia.British Journal of Educational Technology, 27(2), 92-105.
Royer, R., & Royer, J. (2002). Developing understanding with multimedia. Learning and Leadingwith Technology, 29(7), 40-45.
Russell, T. L. (2000). The no significant difference phenomena. Retrieved May 15, 2003, fromhttp://nt.media.hku.hk/no_sig_diff/phenom1.html
San José State University. (1998, Spring). General education program guidelines. Retrieved May 15,2003, from http://www.sjsu.edu/ugs/ge/geguidelines.html
Shneiderman, B. (1997). Designing the user interface: Strategies for effective human-computer interaction(3rd ed.). Menlo Park, CA: Addison-Wesley.
Steinberg, E. (1989). Cognition and learner control: A literature review, 1977-88. Journal ofComputer-Based Instruction, 16(4), 117-121.
Wild, M., & Quinn, C. (1998). Implications of educational theory for the design of instructionalmultimedia. British Journal of Educational Technology, 29(1), 73-82.
Windschitl, M. (1998, January-February). The WWW and classroom research: What path shouldwe take? Educational Researcher, pp. 28-32.
Zirkle, C., & Ourand, D. B. (1999, October). Teaching a course through multiple delivery systems: Some lessons learned. Paper presented at the Indiana Postsecondary Education conference,Muncie, IN. (ERIC Document No. ED 435 800)
An Evaluation of Internet-Based CADCollaboration ToolsShana Shiang-Fong Smith
During product design, over 80% of engi-
neering changes are needed because designed
parts cannot be manufactured or assembled
(Stevens, 2001). Most of the design errors are
due to lack of communication between the design
team and manufacturing experts. To reduce com-
munication problems and, thereby, increase prod-
uct quality and reduce production costs, industry
has turned to concurrent and collaborative engi-
neering methods (Prasad, 1996). However, in
today’s global market, designers and manufactur-
ers are often geographically separated. Thus,
designers, manufacturers, and suppliers need
powerful communication tools so they can
exchange design information effectively (Jones,
Schwemin, Dorneich, & Dunmire, 2000).
The objectives of collaborative design
include optimizing the mechanical function of a
product, minimizing production or assembly
costs, and ensuring that the product can be easi-
ly and economically operated and maintained.
Effective collaboration tools can help resolve
product design conflicts early in the design
stage. As a result, product development, lead-
time, and manufacturing cost can be greatly
reduced. Thus, companies that use collaborative
design tools realize many benefits. For example,
by using a collaborative design tool to create its
LBP-1210 laser printer, Canon was able to
reduce design iterations, total cost, and lead-
time (www.cocreate.com). Hewlett-Packard
found that using a collaborative design tool
helped immediately reduce overseas travel costs.
Overall, using a collaborative design tool helped
HP achieve a 135% return on investment (ROI)
after one month and 240% after three months
(www.cocreate.com).
Modern design teams often use CAD/CAM
(computer aided design and computer aided
manufacturing) tools to help facilitate their
design process, from conceptual design stage to
final production. Different companies or design
partners may use different CAD/CAM tools.
Since most existing CAD/CAM applications
were designed to work in an isolated environ-
ment, inconsistent file formats often cause prob-
lems during information exchange.
Due to the now widespread use of the
Internet, most companies now require CAD
tools that support distributed collaborative
design on the Internet (Lavana, Brglez, Reese,
Konduri, & Chandrakasan, 2000). Such CAD
tools should enable designers to share product
models, as well as related data, from geographi-
cally distant locations (Shyamsundar & Gadh,
2001). However, integrated collaborative design
capability over the Internet has not fully
matured. For example, Potter (1997a) found that
security and authentication are still major con-
cerns when transferring CAD files over the
Internet. Designers or companies need to protect
intellectual property (Fornaro & Sanna, 2000).
This article determines the Internet-based
collaborative design capabilities available in
modern CAD tools, outlines the major problems
that still need to be addressed (e.g., version con-
trol, data translation and repair, and security and
legitimacy issues), and recommends directions
for future research.
Collaborative DesignAccording to Wang, Shen, Xie,
Neelamkavil, & Pardasani (2001), if a product is
designed through the collective and joint efforts
of many designers, the design process used can
be called collaborative design. The collaborative
design process might include all design activi-
ties from concept creation through product defi-
nition, detailed design, manufacturing, assem-
bly, maintenance, and even product retirement.
Furthermore, some companies may enhance the
collaborative design process by involving their
customers, suppliers, and partners, over the
Internet, throughout the product development
and delivery process (Waltham, 2000).
Due to the often distributed nature of mod-
ern, Internet-based collaborative design process-
es, many different CAD tools may be used by a
collaborative design team. When design teams
use different CAD tools, problems often arise
because different CAD tools still use different
native file formats. For example, Autodesk
Inventor generates part files in .ipt file format,
and Pro/E generates part files in .prt file format.
If design team members must share data stored
in both file formats, a problem in model consis-
tency might exist. Data communication prob-
lems due to using the Internet as a communica-
tion channel may also exist.
Therefore, collaborative CAD tools need a
common, secure communication framework and
protocol so that CAD files can be transferred
safely and accurately. To meet the need, many
CAD tools have recently added at least some of
the following collaborative design capabilities:
(a) real-time communication, (b) support for
various CAD formats, (c) tools for publishing
2D/3D CAD designs on the Web, and (d) tools
for manipulating CAD models outside the origi-
nal CAD program.
Real-Time Communication
The Internet is probably the most conven-
ient medium available for sharing CAD files in
real time. CAD program vendors have begun to
Th
e J
ou
rna
l o
f Te
ch
no
log
y S
tud
ies
80

Th
e J
ou
rna
l of Te
ch
no
log
y Stu
die
s
use the existing power of the Internet and many
existing Internet-based communication tools to
improve the collaborative capabilities of their
CAD programs. For example, to help designers
share design data and models over the Internet,
CAD vendors have begun to incorporate
Internet-based conferencing and real-time 3-D
model viewing tools directly into their products
(Shyamsundar & Gadh, 2001). Autodesk inte-
grates Windows NetMeeting into the latest ver-
sion of Inventor. NetMeeting includes chat,
whiteboard, program sharing, file transfer,
remote desktop sharing, security, and video and
audio conferencing. Thus, Autodesk Inventor
users have online real-time communication
capability available within the Inventor design
environment. Table 1 provides a summary of
collaborative functions available in Windows
NetMeeting (Microsoft, 2001).
Toc20151059Windows NetMeeting remote
desktop sharing allows a remote user to run a
CAD program, which has been installed on a
local computer, over the Internet. With remote
desktop sharing, the remote user can use the
local CAD program, running on the local
machine, without having to install a copy of the
CAD program at his or her remote site. As a
result, the remote user can participate in a col-
laborative design session while at the same time
reducing CAD program investment costs.
Support for Various CAD Formats
To share CAD files, collaborative design
teams often must transfer CAD data from one
CAD tool to another over the Internet. To deal
with the issue, collaborative designers can store
design files in a neutral file format. For exam-
ple, if Company A in the U.S. uses AutoDesk
Inventor while Company B in Japan uses Pro/E,
with current versions of Inventor and Pro/E,
Company B could not read an Inventor .ipt file
sent via the Internet by Company A. However,
for successful collaborative design, Company A
could save its CAD files in STEP (or another
neutral file format) and then transfer the result-
ing STEP files to Company B via the Internet.
Most modern CAD tools currently support sev-
eral design file formats to improve their com-
patibility with other CAD tools. SolidWorks, for
example, supports IGES, DWG, VRML, STL,
VDA, SAT, DXF, and STEP file formats.
Tools for Publishing and Viewing
2D/3D CAD Designs on the Web
Distributed design teams need tools that
address critical communication issues that are
not addressed in stand-alone CAD tools. Often,
for distributed design teams, customers, suppli-
ers, vendors, and development partners who do
not have CAD tools or CAD-tool expertise need
to view and evaluate developing designs. To
solve the problem, CAD vendors have begun to
develop tools for publishing designs on the Web.
For example, Parametric Technology
Corporation () now offers a stand-alone tool
called ProductView, which allows customers
and other distributed design team members to
preview designs on the Web, thus reducing
product design and modification time and cost.
Tools for Manipulating CAD Models
Outside the Original CAD System
Some CAD vendors offer stand-alone tools
that provide more than just viewing capability.
With tools for manipulating CAD models out-
side the original CAD environment, collabora-
tive design team members without CAD tools or
CAD-tool expertise can quickly and efficiently
review design models. Manipulation tools allow
81
Table 1. Summary of Collaborative Functions in Windows NetMeeting.
FUNCTION KEY FEATURES
ChatWhiteboardProgram sharingRemote desktop sharingFile transferSecurityVideo and audio conferencing
Conducting multi-user real-time conversations using textCommunicating in real time using graphicsSharing programs during a conferenceOperating a computer from a remote locationSending files in background mode during a NetMeeting conferenceUsing security measures to protect privacyCommunicating on the Internet using video and audio
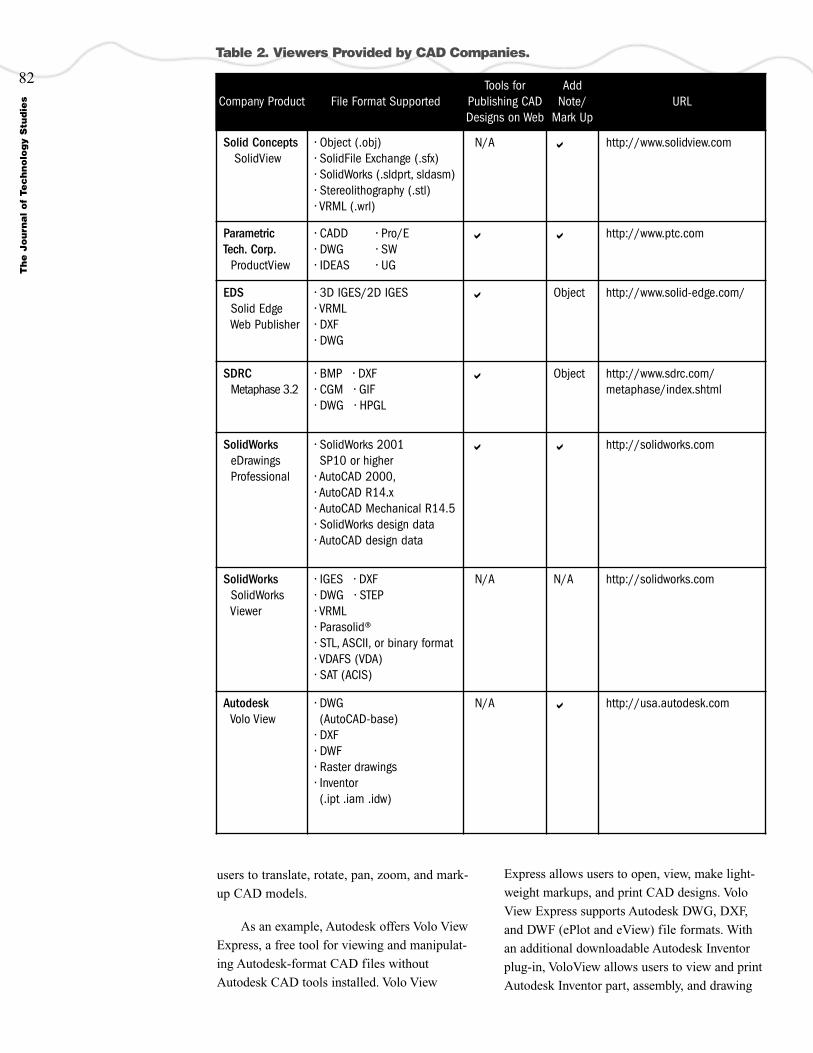
Th
e J
ou
rna
l o
f Te
ch
no
log
y S
tud
ies
users to translate, rotate, pan, zoom, and mark-
up CAD models.
As an example, Autodesk offers Volo View
Express, a free tool for viewing and manipulat-
ing Autodesk-format CAD files without
Autodesk CAD tools installed. Volo View
Express allows users to open, view, make light-
weight markups, and print CAD designs. Volo
View Express supports Autodesk DWG, DXF,
and DWF (ePlot and eView) file formats. With
an additional downloadable Autodesk Inventor
plug-in, VoloView allows users to view and print
Autodesk Inventor part, assembly, and drawing
82
Company Product File Format SupportedTools for
Publishing CADDesigns on Web
AddNote/
Mark UpURL
Solid ConceptsSolidView
• Object (.obj)• SolidFile Exchange (.sfx)• SolidWorks (.sldprt, sldasm)• Stereolithography (.stl)• VRML (.wrl)
N/A a http://www.solidview.com
ParametricTech. Corp.
ProductView
• CADD • Pro/E• DWG • SW• IDEAS • UG
a a http://www.ptc.com
EDS Solid Edge Web Publisher
• 3D IGES/2D IGES• VRML• DXF• DWG
a Object http://www.solid-edge.com/
SDRCMetaphase 3.2
• BMP • DXF• CGM • GIF• DWG • HPGL
a Object http://www.sdrc.com/metaphase/index.shtml
SolidWorks eDrawings Professional
• SolidWorks 2001SP10 or higher
• AutoCAD 2000,• AutoCAD R14.x• AutoCAD Mechanical R14.5• SolidWorks design data• AutoCAD design data
a a http://solidworks.com
SolidWorks SolidWorks Viewer
• IGES • DXF • DWG • STEP • VRML• Parasolid®• STL, ASCII, or binary format • VDAFS (VDA)• SAT (ACIS)
N/A N/A http://solidworks.com
AutodeskVolo View
• DWG (AutoCAD-base)
• DXF• DWF• Raster drawings• Inventor(.ipt .iam .idw)
N/A a http://usa.autodesk.com
Table 2. Viewers Provided by CAD Companies.

Th
e J
ou
rna
l of Te
ch
no
log
y Stu
die
s
files without Inventor installed. Table 2 presents
a list of tools offered by major CAD vendors for
viewing and manipulating CAD files and the
corresponding supported file formats.
Some third-party companies also provide
CAD tools for viewing and modifying different
types of CAD files online. For example,
OneSpace Designer (from Cocreate Corp.,
www.cocreate.com) and IX SPeeD Suite (from
ImpactXfot, www.impactxoft.com) allow users
to load, view, inspect, and modify different
types of CAD files during concurrent and
collaborative design projects.
Issues in Collaborative DesignUpdate Issues
While working on a project, collaborative
designers frequently make changes to parts that
are being accessed at the same time by others
working on the same project. One of the biggest
problems with many Internet-based collabora-
tion tools is that they do not have built-in multi-
user version control capability. As a result, users
can mistakenly use an older version of a file,
rather than the latest version. Drawings may be
sent out and considered final when they actually
are not. Therefore, efficient collaborative design
tools must support inconsistency prevention and
detection (Despres, Piloty, & Schellin, 1993).
Many existing single-user CAD tools allow
the user to set model version numbers to help
track any design changes made during the prod-
uct development process. Each time a model’s
content is modified and saved in a working file,
the tool assigns a new version number to the
working file. A new version of the model is cre-
ated each time the file is saved. Usually, the
CAD tool, after the number of saved versions
reaches a maximum limit (for example, 10 in
AutoDesk Inventor), discards the oldest version
of the model whenever a new version is saved.
The user can then open, view, and modify any
saved version of the model.
To allow multiple users to access the same
files, AutoDesk added a multi-user option to
Inventor. Users must select the multi-user option
before starting work on a collaborative project.
With the multi-user option selected, all members
of a group can access the same project files.
AutoDesk Inventor also enables safeguards
when several users are editing the same files.
After a user activates the file reservation
system and warning functions inside AutoDesk
Inventor, Inventor automatically reserves any
new files the user creates for that user. If anoth-
er person attempts to edit a reserved file, a
warning message alerts the person for whom the
file is reserved.
Data Translation and Repair Issues
In a collaborative design environment, team
members might use different design software
when working on a model. A major problem
with using various heterogeneous CAD pro-
grams is lack of interoperability between the
systems (NIST). Data translation issues cause
many concerns (Potter, 1997b). For example, a
designer could receive three parts from three
different design team members in three different
file formats, e.g., an Inventor (.ipt), a Pro/E
(.prt), and a STEP (.stp) file. To combine the
three parts into a single design, the designer
would need to translate all the files into a for-
mat supported by his or her CAD tool and then
import the parts into his or her CAD tool.
The design team could eliminate both the
problem due to mismatched file formats and the
time required for data translation by saving and
transferring CAD part designs in a neutral file
format (e.g., STEP or IGES). However, saving
and transferring CAD files in neutral file format
does not remove problems with internal data
consistency.
Since different CAD tools often use differ-
ent internal accuracy levels, a target system may
not be able to recognize an imported model as a
solid body after data conversion. Errors such as
cracks, degeneracy, duplication, holes, and over-
laps usually occur in the models when users
import them from other CAD tools (Barequet &
Kumar, 1997). Upgrading a low-resolution solid
model into a high-resolution solid model can be
a difficult problem. Often, users need an expen-
sive repair and healing tool to make the model
usable (Farrell, 1999). In addition, state-of-the-
art healing tools often cannot successfully repair
imported CAD models.
83

Th
e J
ou
rna
l o
f Te
ch
no
log
y S
tud
ies
A 1999 study by RTI International
(http://www/rti.org) estimated that imperfect
interoperability imposes costs of at least $1 bil-
lion per year on the U.S. automotive supply
chain alone; other industries face similar diffi-
culties.
Internet Security and Legitimacy Issues
With the explosive growth in Internet use,
network security has become an inevitable con-
cern for a growing number of organizations (Yu
& Le, 2000). Since CAD files often serve as
legal documents, cautious CAD users may not
be willing to use any tools that create a risk of
exposing their designs to outsiders (Hauck &
Knol, 1998). Users often express concerns about
having their files stolen during transmission
(Farrell, 2000), and many people are not totally
comfortable when sending information across
the Internet. Users often believe that if a file is
sent over the Internet, someone might steal or
modify the file. Indeed, some surveys already
indicate that many companies are not willing to
use the Internet to transfer their CAD data
(Potter, 1997a). Thus, in the future, collaborative
CAD tools must offer more capabilities for
securing files and encrypting models.
Speed Issues
Speed is another issue facing Internet-based
CAD researchers and developers. Today’s fast
Internet connections allow almost immediate
response for low-density data. However, CAD
data generally contains a large amount of infor-
mation in every file. As a result, current collab-
orative CAD tool users need to, but currently
cannot, see design animations in real time.
Without even higher-speed Internet connections,
collaborative CAD users might find their mod-
eling experiences very frustrating. Therefore, in
order to manipulate CAD models in real time,
more advanced communication hardware and
software are required.
Conclusion
Growing Internet use has led to Internet-
based collaboration functions in major CAD
packages. With currently available capabilities,
users can exchange and share CAD files in real
time using Internet-based conferencing utilities.
Furthermore, some major CAD vendors now
offer tools for publishing 2D/3D CAD designs
on the Web and for viewing and manipulating
CAD models outside the original CAD pro-
gram. With CAD model Web publishing, view-
ing, and manipulating tools, collaborative
design team members can communicate effec-
tively, even from different geographical loca-
tions, without purchasing or installing separate
copies of the CAD tool(s) used. Most major
CAD tools now offer support for saving and
importing CAD files in several different file
formats (in particular, neutral file formats such
as STEP and IGES), which is a critical feature
for collaborative design. With neutral file for-
mat capability, collaborative CAD file exchange
over the Internet is becoming easier.
Remaining problems facing collaborative
CAD tool researchers and developers include
technical difficulties related to data translation
and file security. Data translation often leaves
cracks, degeneracy, duplications, holes, and
overlaps in models. Security issues on the
Internet leave many companies concerned that
their designs might be lost, stolen, or modified
when transferred over the Internet.
Improved Internet-based collaborative CAD
tools can enhance communication in the
CAD/CAM industry. As a result, collaborative
CAD tools can also reduce product development
and manufacturing costs. As Internet use
becomes more widespread, Internet and comput-
er networking capabilities will continue to
improve. However, capabilities in collaborative
tools for CAD/CAM design need to improve as
well. A review of current collaborative CAD
capabilities shows that although some capabili-
ties exist, further research and development is
needed, particularly in the areas of data repair,
data integrity, and data security.
Dr. Shana Shiang-Fong Smith is an
Assistant Professor in the Department of
Industrial Education and Technology at Iowa
State University.
84
Th
e J
ou
rna
l of Te
ch
no
log
y Stu
die
s
85
References
Barequet, G., & Kumar, S. (1997). Repairing CAD models. Visualization '97, Proceedings, pp. 363–370. Retrieved July 15, 2002, from IEEE Xplore database.
Despres, B., Piloty, R., & Schellin, U. (1993). An approach to CAD database support of designconsistency control. Design Automation Conference, with EURO-VHDL '93. Proceedings EURO-DAC '93, pp. 326–331.
Farrell, R. (1999, October/November). Review of CADfix geometry healing & repair software.Plastics Product Review Magazine. Retrieved August 19, 2002, from
http://www.dexcenter.com/article-cad-model-repair.html
Farrell, R. (2000, June). Healing data over the Internet. Retrieved August 19, 2002, from http://www.dexcenter.com/article-healing-data-over-the-internet.html
Fornaro, C., & Sanna, A. (2000, October). Public key watermarking for authentication of CSG models. Computer-Aided Design, 32, 727-735.
Hauck, S., & Knol, S. (1998). Data security for Web-based CAD. Proceedings from Design Automation Conference, pp. 788–793.
Jones, P. M., Schwemin, S. D., Dorneich, M., & Dunmire, C. (2000). CLINT: A prototype logistics collaboratory. Systems, Man, and Cybernetics, 2000 IEEE International Conference, 2,1047–1050.
Lavana, H., Brglez, F., Reese, R., Konduri, G., & Chandrakasan, A. (2000). OpenDesign: Anopen user-configurable project environment for collaborative design and execution on theInternet. Proceedings of International Conference on Computer Design, pp. 567–570.
Microsoft. (2001). Using remote desktop—Set up your computer for remote desktop. RetrievedApril 15, 2002, from http:// www.microsoft.com
Potter, C. (1997a, November). Web-enabled engineering: Engineers and CAD vendors speak candidlyon the topic of engineering and the Web. Computer Graphics World. Retrieved March 12, 2002,from http://cgw.pennnet.com/Articles/Article_Display.cfm?Section=Archives&Subsection=Display&ARTICLE_ID=49465&KEYWORD=Q%26A%3A%20Web%2Denabled%20engineering
Potter, C. (1997b). Web-enabled engineering: Step-by-step, special report. Computer Graphics World.Retrieved March 12, 2002, from http://cgw.pennnet.com/Articles/Article_Display.cfm?Section=Archives&Subsection=Display&ARTICLE_ID=49464&KEYWORD=Web%20enabled%20engineering
Prasad, B. (1996). Concurrent engineering fundamentals: Integrated product and process organization.Upper Saddle River, NJ: Prentice Hall.
Shyamsundar, N., & Gadh, R. (2001, October). Internet-based collaborative product design withassembly features and virtual design spaces. Computer-Aided Design, 33, 637-651.
Stevens, T. (2001). Technologies of the year—IX SPeeD for simultaneous product development.Industry Week. Retrieved July 9, 2003, from http://www.industryweek.com/CurrentArticles/Asp/articles.asp?ArticleId=1164
Waltham, M. (2000, October). PTC and Accenture join forces to provide CPC solution. Retrieved March 2, 2002, from http://www.ptc.com/company/news/press/releases/20001016KLATencor.htm
Wang, L., Shen, W., Xie, H., Neelamkavil, J., & Pardasani, A. (2001). Collaborative conceptual design—State of the art and future trends. Computer-Aided Design, 34, 981-996.
Yu, J. H., & Le, T. K. (2000, November ). Internet and network security. Journal of Industrial Technology, 17(1). Retrieved March 22, 2002, from http://www.nait.org/

With the evolution of the World Wide Web,
online teaching and learning has gained a
tremendous amount of popularity. New Web
teaching and learning tools are created at a fast
pace to help better address the multitude of
teaching and learning styles. Liu and
Thompson (1999) found that faculty members
are more likely to use a wider variety of educa-
tional technologies when exposed to online
teaching and learning tools and thus teach to a
broader array of learning styles. The increasing
diversity of learning strategies is a growing
challenge for teachers. One way to address this
challenge is to incorporate online learning tools
into the traditional classroom. Such a combina-
tion may benefit both students and teachers if
those tools provide quality teaching and learn-
ing opportunities and outcomes. However, little
research exists on how learning environments
can be created that successfully combine online
teaching and learning with traditional classroom
environments to enhance student learning.
This article introduces a model that
addresses how an effective combination of
online and traditional classroom teaching can be
obtained. The article shows how learning out-
comes and preferences as well as the awareness
of student characteristics and student feedback
such as the perception of classroom environ-
ment can be used to enhance the quality of a
combined learning environment.
Students’ perceptions of the classroom envi-
ronment are indicators of successful learning.
Cheung (1998) stated that student feedback is
essential for improving the academic quality of
online learning. Sherry, Fulford, and Zhang
(1998) discussed the positive relationships
between students’ satisfaction with instruction
and their subsequent success in a course.
Fitzelle and Trochim (1996) found that enjoy-
ment and control of pace were significant factors
in student success with online instruction. It fol-
lows that assessing students’ perceptions of their
preferred instructional environment is an integral
role in developing instruction that motivates stu-
dents to achieve desired learning outcomes.
When considering the replacement of one
teaching method or tool with another, it should
be assured that the quality of the learning expe-
rience is not diminished. It is important to not
simply accommodate students’ preferred learn-
ing styles, but also to expand on students’ learn-
ing strategies by exposing them to other viable
and interesting ways of learning. The combina-
tion of online learning with traditional class-
room instruction could diversify teaching and
learning alike, and as a bonus enhance techno-
logical literacy of both the faculty and students.
Literature identifies various models of
combining online learning with traditional
classroom learning and assessing the quality of
such combinations (Eberling, 2000; Grasha &
Yangarber-Hicks, 2000; Simon, 2000; Spoon &
Schell, 1998). In general, students participat-
ing in entire classes online have demonstrated
no significant differences in learning when
compared to students taking classes in tradi-
tional classroom settings (Benbunan-Fich &
Hiltz, 1999; Johnson, Aragon, Shaik, & Palma-
Rivas, 2001; LaRose, Gregg, & Eastin, 1998;
Swan & Jackman, 2000). Wheeler and Jarboe
(2001) added that a combination of online and
traditional classroom instruction has become
the most popular way to use Internet teaching
and learning tools. LaRose et al. (1998) dis-
cussed the potential of online learning to
enhance individual student learning.
Furthermore, Ester (1994-95), Goldberg (1997),
and Wheeler and Jarboe (2001) found that stu-
dents with access to both traditional lectures
and an online environment faired better aca-
demically than students instructed either entire-
ly in the traditional classroom or entirely via
the Internet. Sanders and Mirrison-Shetlar
(2001) found that including Web-based compo-
nents in an otherwise traditional college level
biology course increased student learning and
enhanced problem-solving skills.
Th
e J
ou
rna
l o
f Te
ch
no
log
y S
tud
ies
A Model to Integrate Online Teaching and LearningTools Into the ClassroomKlaus Schmidt
86

Th
e J
ou
rna
l of Te
ch
no
log
y Stu
die
s
The model presented in Figure 1 suggests
five considerations that may be useful when cre-
ating a quality mix of online and traditional
classroom teaching and learning. The steps
Examine Teaching Style, Assess Preferred
Learning Styles, and Study Teaching Tools can
occur simultaneously or in any order. It is rec-
ommended that the instructor fully understands
and completes the first three steps prior to mov-
ing on to Select and Try Tools and then Reflect,
Implement, Reflect, and Revise. The entire
process is ongoing and iterative. Each step is
explained in more detail on the following pages.
Step 1: Examine Your Teaching StyleAssessing the preferred personal teaching
style is one of the first steps a teacher should
take prior to selecting and implementing online
teaching and learning tools. Understanding
one’s personal teaching style can help to deter-
mine which traditional course components can
be best enhanced with online teaching and
learning technology and which tools will most
comfortably match the teacher’s personal teach-
ing style. Preferred teaching style may be iden-
tified through careful personal reflection or
through use of any of a number of available
instruction/teaching styles inventories. Two
common instruments designed to assess teach-
ing styles are the Canfield Instructional Styles
Inventory (ISI) and Grasha’s 5 Teaching Styles
Inventory. The ISI categorizes teaching styles
along two basic dyads: social or independent,
and conceptual or applied. For example, if the
identified teaching style is social, a teacher
wishing to incorporate online instructional com-
ponents might consider which available online
tools could effectively replace or supplement
traditional social instructional techniques such
as group discussion and team activities. Online
chat rooms or discussion tools designed to cre-
ate a social learning environment and a sense of
community between teacher and students might
be helpful. Conversely, if after consideration it
is determined that the existing online tools do
not meet these particular needs, the teacher
might refrain from using online chat rooms or
discussion tools to supplement classroom teach-
ing in this instance.
Grasha’s 5 Teaching Styles Inventory
describes teaching styles within five major cate-
gories: facilitator, formal authority, expert, per-
sonal model, and delegator. If a teaching style is
predominantly the role of a facilitator, the teacher
should identify tools that help to support the
facilitator role1. On the other hand, if the teach-
ing style is identified as expert, the teacher might
include video or audio enhanced presentations
and lectures.
With respect to identifying the teaching
style, this model does not give preference to any
particular teaching style or teaching styles assess-
ment tool. The teacher is free to choose whichev-
er approach he or she is comfortable with. It
might even be helpful to choose multiple instru-
ments or approaches as each addresses different
87
Figure 1. Model for incorporating online teaching tools.

Th
e J
ou
rna
l o
f Te
ch
no
log
y S
tud
ies
elements of teaching styles. Nevertheless, being
aware of teaching styles alone does not guarantee
that student learning takes place. In order to
facilitate student learning, a teacher also needs to
consider and be aware of his or her students’ pre-
ferred learning styles.
Step 2: Assess Your Students’Preferred Learning Styles
Understanding how students learn is imper-
ative. This is especially true when considering
the incorporation of a greater variety of teach-
ing tools, as is the case when combining online
and traditional classroom teaching. Several
studies (Ayersman & Reed, 1995-96; Ester,
1994-95; Ross, Drysdale, & Schultz, 2001) have
found relationships between learning styles and
student perceptions of and/or learning successes
with online instructional components. In a
study designed to decrease the levels of stu-
dents’ computer anxiety, the highest level of
computer anxiety was demonstrated by students
identified as divergers and the lowest levels
were demonstrated by students identified as
convergers using the Kolb Learning Styles
Indicator (Ayersman & Reed, 1995-96).
Literature discusses a wide array of instru-
ments to assess learning styles (Crowe, 2000;
Dunn & Griggs, 2000; Miller, 2001). Four
commonly used instruments are the Myers-
Briggs Type Indicator (MBTI), the Kolb
Learning Style Indicator, the Canfield Learning
Styles Instrument (LSI), and the Dunn, Dunn,
and Price Productivity Environmental
Preference Survey (PEP). While the MBTI
focuses on the four dimensions of extroversion
versus introversion, sensing versus intuition,
thinking versus feeling, and judging versus per-
ceptive, the Kolb Learning Style Indicator col-
lects student information on four scales includ-
ing preference for concrete experiencing,
abstract conceptualization, reflective observa-
tion, and active experimentation. The Canfield
LSI places learning styles into categories such
as social, independent, applied, and conceptual.
The PEP profiles student learning preferences
in such learning related factors as noise and
light levels, temperature, motivation, persist-
ence, structure, authority, senses, time of day,
etc. However, it might not always be necessary
to formally assess students’ learning styles.
Information about students’ preferred learning
styles may be collected informally through dis-
cussions with students or observations of stu-
dents in the classroom.
Once a teacher has identified his or her
teaching style and is able to identify students’
learning styles, an appropriate mix of online and
traditional teaching and learning tools may be
identified. For example, if the LSI is used and
students identify themselves as social learners,
it will be beneficial to incorporate online and
traditional teaching and learning tools such as
online chat rooms or discussion tools. If the
social learning style cannot be adequately met
using only online tools for a particular course,
the instructor might decide to emphasize the
social learning style more heavily using tradi-
tional classroom tools or a combination of tradi-
tional and online tools. If a teacher’s teaching
style is learner centered but the students prefer
the teacher centered environment, students may
obtain lower learning outcomes due to a mis-
match of teaching and learning styles. In such a
scenario, the teacher could identify and apply or
supplement learner-centered instruction with
tools that enhance a teacher-centered learning
style. This approach would not only widen stu-
dents’ learning strategies but also a teacher’s
portfolio of teaching techniques. Matching the
teaching style with the learning style of students
may not solve all issues related to learning in
the college environment, but it could help to
identify Internet technologies for a better inte-
gration of traditional and online teaching and
learning tools and thus address a wider variety
of learning styles.
Step 3: Study Online and TraditionalTeaching and Learning Tools
A good command of both online and tradi-
tional teaching and learning tools is important for
the development of a successful combination of
those tools. The following section focuses on
online teaching and learning tools and on how
these tools can be incorporated into the classroom.
A broad array of online teaching and learn-
ing tools are available. Almost all aspects of
classroom teaching can be enhanced or
replaced with online technology in some con-
texts. To obtain a broader overview of enhanc-
88

Th
e J
ou
rna
l of Te
ch
no
log
y Stu
die
s
ing the classroom with Web technology, the
classroom environment can be categorized into
four components: administration, assessment,
content delivery, and community (Schmidt,
2002b). Various online tools exist to help in
these components. Appropriate selection of
online tools will depend not only on the
instructional content but also on the quality of
the available tools and the level of technical
ability of teacher and students. For example, if
both teacher and students have mastered a spe-
cific content delivery tool, it can be beneficial
to deliver content online rather than in the
classroom. Similarly, if the teacher has found
ways to meaningfully incorporate synchronous
communication tools (such as chat), students
might also benefit from the added community
component. The following discussion of each
component will demonstrate how Web tools
could be incorporated to meet certain aspects of
a course to enhance student learning.
The administrative component is the foun-
dation for the organization of a course and
allows a teacher to spend more class time inter-
acting creatively with students rather than on
mundane activities. For example, activities such
as turning in or returning graded assignments
during class time can be replaced with Internet
technology. The time “gained” during class can
then be used for other higher order thinking and
learning activities. The assessment component
addresses student performance. Using online
assessment tools such as online quizzes to pro-
vide instant feedback and repeated testing
opportunities for practicing purposes may help
students learn the subject matter more thorough-
ly. This method also leads to more class time
for student-student and student-teacher interac-
tion (Schmidt, 2002b). Sanders and Morrison-
Shetlar (2001) found that students were com-
fortable tracking quizzes and tests online and
liked having online access to their individual
grades to assess how well they were doing in the
coursework.
The content delivery component focuses on
the communication of course content and learn-
ing activities. Research shows that a significant
amount of learning can take place outside the
traditional classroom if students have access to
and are motivated to study the material at their
own pace. Ryan, Hodson Carlton, and Ali
(1998) found that students enjoy using the
Internet for the structured presentation of course
material and prefer traditional class time to be
used for informal interaction and the develop-
ment of advanced thinking skills.
The community component addresses
development of a community of learners, the
sense of community among students and
between teachers and students. Online teaching
and learning tools can help to create a commu-
nity of learners that is no longer limited to just
one teacher and his or her students in the class-
room. Depending on teaching and learning
styles, a community (including experts and
experienced practitioners) from outside the
classroom can be introduced to the classroom
and benefit both the teacher and the learners.
Numerous academic and educational online
communities can be accessed and included in
the learning process2. It takes careful planning
to help students deal effectively with the many
challenges of online interaction and community
building. Sanders and Morrison-Shetlar (2001)
reported that students had mixed perceptions
about the value of being required to access and
participate in chat rooms and bulletin boards as
the primary community components of classes.
Students generally preferred asynchronous tools
to synchronous tools.
Once the first three steps are completed, the
challenge is to balance the identified preferred
learning and teaching styles against the advan-
tages and disadvantages of available online
instructional technology. This should be viewed
as a problem-solving challenge with many
potentially correct solutions.
Step 4: Select Online Teachingand Learning Tools
Considering the adoption of online instruc-
tional delivery methods may present opportuni-
ties to achieve learning objectives beyond the
basic acquisition of content knowledge and/or
skills such as enhancing students’ levels of com-
puter literacy. However, unless very carefully
designed and implemented, different forms of
instructional tools may favor students with some
learning styles and technical expertise at the
expense of others. Ross et al. (2001) found that
89

Th
e J
ou
rna
l o
f Te
ch
no
log
y S
tud
ies
sequential learners studying computer applica-
tions using some computer-based instructional
tools performed significantly better in acquisi-
tion of both skills and knowledge than did stu-
dents identified as random learners. Students
identified as abstract sequential in learning style
performed significantly better in this study than
students with any other style. Students in this
study who failed the courses or withdrew were
overwhelmingly identified as abstract random in
style. Similarly, in another study Ross and
Schulz (1999) reported that there was signifi-
cant interaction between learning styles and
learning outcomes. In this study students iden-
tified as abstract sequential averaged an 18%
gain in learning, students identified as concrete
sequential and concrete random averaged a 10%
learning gain, while students identified as
abstract random averaged a 10% decrease in
learning. When exploring the relationships
between learning styles and learning outcomes
in a course instructed using computer-based
instructional tools, Davidson and Savenye
(1992) identified positive significant correla-
tions between learning outcomes and abstract
sequential learning styles and negative signifi-
cant correlations between learning outcomes
and abstract random learning styles.
Khalili and Shashaani (1994) found in their
meta-analysis of computer applications for
instruction that different types of computer-
based instructional tools have different effects
on students’ learning outcomes. Carefully
selected and/or designed online delivery meth-
ods may enhance learning outcomes in general
but also students’ levels of computer literacy
and sense of efficacy when using computers as
learning tools. In an age of burgeoning adop-
tion of e-mail, e-meetings, and e-teams in the
workplace, these expanded computer-based
experiences may help to better emulate the new
workplace. Additionally, if content is delivered
in parallel forms both through traditional means
and through using online tools such that stu-
dents have the opportunities to learn in their
preferred modes, some students may become
more aware of their own cognitive processes and
begin to expand the range of learning environ-
ments that they will happily work in.
The two primary indicators of the quality of
instructional tools implemented into the class-
room are students’ perception of the learning
environment and students’ learning outcomes.
Using student feedback and the results from
analyses of the learning outcomes enables a
teacher to make decisions on what online learn-
ing activities best contribute to student learning
and what framework best addresses pedagogical
and technological issues. In addition, the stu-
dent feedback helps to decide which online
components are less liked and do not result in a
positive learning experience.
One tool to help assess the effectiveness of
the online tools and the quality of the combined
learning environments is classroom action
research. Classroom action research helps a
teacher to try out new online tools, implement
those that are successful, and gather student
feedback, reflect, and revise to further improve
and develop the course (Schmidt, 2002a).
Step 5: Reflect, Implement, Reflect, and Revise
Because this model suggests an iterative
and continuous process, it will be imperative to
continuously reflect, implement, further reflect
on the outcomes of the implementation, and
revise again the mix of online and traditional
teaching and learning tools. Due to the chang-
ing nature of the online environment, only a
dynamic approach to teaching and learning will
maximize success.
Students’ learning style preferences impact
upon the quality of their attitude toward a par-
ticular instructional tool, but an instructor’s con-
sciousness of the importance of learning style
preferences may help him or her to adapt tools
for teaching that address the learning needs of
students with multiple learning style prefer-
ences. Ross et al. (2001) recommended that one
important alternative consideration when
designing online instructional tools is to teach
students to use strategies that will succeed in
learning situations that do not favor their pre-
ferred learning style.
ConclusionsAs mentioned previously, the model sug-
gested in this article is iterative in nature. It is
not intended to be a linear process leading to
90

Th
e J
ou
rna
l of Te
ch
no
log
y Stu
die
s
selection of the best combination of instruction-
al methods because the best combination of
methods is constantly in flux. This model is
rather intended to encourage continuous experi-
mentation with both new and traditional instruc-
tional tools and methods to achieve ongoing
improvement based on trial assessment and
reflection of outcomes. The goal here is to
attempt to improve student learning while also
promoting enhanced student satisfaction levels
with the learning experiences and environment.
Because this model is dynamic, it is expect-
ed that teachers will need to be open to continu-
ous change. Students’ learning styles may vary
widely from student to student, new online
teaching and learning tools will continue to be
developed, and an increased awareness of one’s
teaching style will lead to modifications within
the composition of online tools and classroom
interaction. Only by considering these variables
can a teacher continue to address students’
changing learning needs in a creative, flexible,
and dynamic teaching and learning environment.
Finding the right combination of online and
traditional teaching and learning tools to meet
the broad array of learning styles remains one of
the greatest challenges in today’s teaching envi-
ronment. Considering teaching and learning
styles when incorporating online teaching and
learning tools can help a teacher to better
address student learning needs. Student learn-
ing is strongly impacted by the teacher’s ability
to communicate the subject matter. Creating a
successful learning environment therefore heavi-
ly depends on the creativity of the teacher. It
will be important to decide which course com-
ponents can be enhanced most effectively via
the Internet and which can be done more effec-
tively in the traditional classroom. Only a con-
tinuous assessment of learning and teaching
styles and Internet tools will help to appropri-
ately address these issues and best meet student
learning needs. We believe that in a world
where lifelong learning is essential for students’
long-term success, only students who experi-
ence learning in positive learning environments
are likely to continue their journeys toward
becoming successful lifelong learners.
Dr. Klaus Schmidt is an assistant professor
in the Department of Technology at Illinois State
University.
91
References
Ayersman, D. J., & Reed, W. M. (1995-96). Effects of learning styles: Programming and genderon computer anxiety. Journal of Research on Computing in Education, 28(2), 148-160.
Benbunan-Fich, R., & Hiltz, S. R. (1999). Educational application of CMCS: Solving case studiesthrough asynchronous learning networks. Journal of Computer Mediated Communication, 4(2).Retrieved July 11, 2002, from http://www.ascusc.org/jcmc/vol4/issue3/benbunan-fich.html
Cheung, D. (1998). Developing a student evaluation instrument for distance teaching. DistanceEducation 19(1), 23-41.
Crowe, R. (2000). Know your student’s learning style: The missing link in the lecture. (ERICDocument Reproduction Service No. ED445728)
Davidson, G. V., & Savenye, W. C. (1992). How do learning styles relate to performance in a computerapplications course? Journal of Research on Computing in Education, 24(3), 348-357.
Dunn, R., & Griggs, S. (Eds.). (2000). Practical approaches to using learning styles in higher education.Westport, CT: Greenwood.
Eberling, D. (2000). Adapting your teaching to any learning style. Phi Delta Kappan, 82(3), 247-248.
Ester, D. P. (1994-95). CAL, lecture, and student learning style: The differential effects of instructionalmethod. Journal of Research on Computing in Education, 27(2), 129-140.
Fitzelle, G. T., & Trochim, W. M. K. (1996). Survey evaluation of Web site instructional technology:Does it increase student learning? Retrieved May 9, 2002, fromhttp://trochim.human.cornell.edu/webeval/webques/webques,htm
Goldberg, M. (1997, June). WebCT and first year computer science: Student reaction to and use of aWeb-based resource in first year computer science. Paper presented at the ITiCSE conference onintegrating technology into computer science education, Upsalla University, Upsalla, Sweden.
Grasha, A., & Yangarber-Hicks, N. (2000). Integrating teaching styles and learning styles with

Th
e J
ou
rna
l o
f Te
ch
no
log
y S
tud
ies
instructional technology. College Teaching, 48(1), 2-10.
Johnson, S. D., Aragon, S. R., Shaik, N., & Palma-Rivas, N. (2001). Comparative analysis of onlinevs. face-to-face instruction. Retrieved August 1, 2002, from http://www.hre.uiuc.edu/online/comparison.pdf
Khalili, A., & Shashaani, L. (1994). The effectiveness of computer applications: A meta-analysis.Journal of Research on Computing in Education, 27(1), 48-61.
LaRose, R. L., Gregg, J., & Eastin, M. (1998). Audiographic telecourses for the Web: An experiment.Journal of Computer Mediated Communication, 4(2). Retrieved July 11, 2002, fromhttp://www.ascusc.org/jcmc/vol4/issue2/larose.html
Liu, Y., & Thompson, D. (1999). Teaching the same course via distance and traditional education:A case study. Commerce, TX: Texas A & M University.
Miller, P. (2001). Learning styles: The multimedia of the mind (Research report). (ERIC DocumentReproduction Service No. ED 451140)
Ross, J. L., Drysdale, M. T. B., & Schulz, R. A. (2001). Cognitive learning styles and academicperformance in two postsecondary computer application courses. Journal of Research onComputing in Education, 33(4), 400-412.
Ross, J., & Schulz, R. (1999). Can computer-aided instruction accommodate all learners equally?British Journal of Educational Technology, 30(1), 5-24.
Ryan, M., Hodson Carlton, K., & Ali, N. (1998). Evaluation of traditional classroom teachingmethods versus course delivery via the World Wide Web. Journal of Nursing Education, 38(6),272-277.
Sanders, D. W., & Morrison-Shetlar, A. I. (2001). Student attitudes toward Web-enhanced instructionin an introductory biology course. Journal of Research in Computing in Education, 33(3), 251-262 .
Schmidt, K. (2002a). Classroom action research: A case study to assess students’ perceptions andlearning outcomes of classroom teaching versus on-line teaching. Journal of Industrial TeacherEducation, 40(1), 45-59.
Schmidt, K. (2002b). The Web-enhanced classroom. Journal of Industrial Technology, 18(2).Retrieved August 1, 2002, from http://www.nait.org
Sherry, A., Fulford, C., & Zhang, S. (1998). Assessing distance learners’ satisfaction with instruction:A quantitative and a qualitative measure. The American Journal of Distance Education, 12(3), 4-25.
Simon, S. (2000). The relationship of learning style and training method to end-user computersatisfaction and computer use: A structural equation model. Information Technology, Learning, &Performance Journal, 18(1), 41-59.
Spoon, J., & Schell, J. (1998). Aligning student learning styles with instructor teaching styles. Journal of Industrial Teacher Education, 35(2), 41-56.
Swan, M. K., & Jackman, D. H. (2000). Comparing the success of students enrolled in distanceeducation courses vs. face-to-face classrooms. The Journal of Technology Studies, 26(1), 58-63.
Wheeler, B., & Jarboe, G. (2001). New poll shows faculty prefer Web-enhanced courses to eitherclassroom-only or distance-only courses: Student learning maximized with Web-enhanced class-room instruction; online-only rivals classroom-only instruction. Retrieved May 9, 2002, fromhttp://www.webct.com/service/ViewContent?contentID=3522772
Notes1 The Grasha 5 Teaching Styles Inventory can be accessed online at
http://fcrc.indstate.edu/tstyles3.html. 2 Visit http://www.webct.com/wyw or http://www.akiva.com/solutions/community.cfm
92

Th
e J
ou
rna
l of Te
ch
no
log
y Stu
die
s
93
Through interaction with digital technolo-
gies for work, play, and communication, our
pattern for intellectual development is being
altered. The multiple intelligences theoretical
framework developed by Gardner (1983) is easi-
ly employed to provide evidence that yet another
intelligence, digital intelligence, has emerged.
In our postmodern pluralistic global culture, the
multiple intelligences theory has enjoyed suc-
cess and has impacted teaching practice. By
acknowledging the existence of a new digital
intelligence and all of the implications this
acknowledgement may create for education and
communication, we increase our ability to
develop effective strategies to accommodate this
new intellectual style.
Gardner (1999) encountered evidence that
did not easily fit in his original model of multi-
ple intelligences and he supposes more intelli-
gence categories to accommodate his observa-
tions. Gardner submitted two additional distinct
intelligences: moral intelligence and spiritual
intelligence. He also pondered that besides
these two new vessels for containment even
more information has emerged that surrounds
the intellectual virtuosos he described as “sym-
bol analysts” and “masters of change.” Could
these observed but unclassified characteristics
be the indication of an emerging intelligence
that is being fostered by human interaction with
digital technologies?
Knowledge, Ways of Knowing,and Intelligence
Information is a fluid that often takes on no
form until a pattern is discovered that appears to
take into consideration that many possibilities
for assemblage exist, but settles on the most
accommodating. As with most strong models
and theories, the multiple intelligences theory
has defined rules for organization of informa-
tion that will accommodate new evidence in
such a way that will further extend the organiza-
tion and therefore substantiate existing under-
standing and work to create new knowledge.
To facilitate a discussion of intelligence, one
must posses an understanding of the relationship
between knowledge, modes of knowing, and
intelligence. While each has a distinct defini-
tion, all exist in an interactive relationship.
KnowledgeKnowledge can very broadly be defined as
what we know or believe to exist. Many con-
ceptions of the organization of knowledge exist.
“The task of demarcating kinds of knowledge is
not unlike that of demarcating different territo-
ries on a map. As there are different kinds of
maps of territory, so there are different kinds of
maps of knowledge” (Schrag, 1992, p. 268).
Machlup (1980), in the first volume of his pro-
posed eight volume set entitled Knowledge: Its
Creation, Distribution, and Economic
Significance, created a classification for the
types of knowledge by grouping what we are
able to know into discrete categories such as
mundane knowledge, scientific knowledge,
humanistic knowledge, social-science knowl-
edge, and artistic knowledge. A discussion of
the many knowledge classification systems is
beyond the scope of this article. Machlup’s
classification is mentioned to illustrate one con-
ception of knowledge as “what we know.”
Ways of KnowingThe modes of knowing or ways of knowing
endeavor to describe the human process of inter-
nalizing knowledge. Eisner (1985), in his pref-
ace to Learning and Teaching the Ways of
Knowing, described his editing assumptions:
Since contexts change, the capacities of
mind themselves alter. The roads to knowledge
are many. Knowledge is not defined by any sin-
gle system of thought, but is diverse. What peo-
ple know is expressed in the cultural resources
present in all cultures. (p. 3)
Included as topics in this collection of
modes of knowing are aesthetic, scientific,
interpersonal, narrative, formal, practical, and
spiritual ways of knowing.
The question of what knowledge is most
worthy of knowing and by which mode of
Digital Intelligence Fostered by TechnologyNan B. Adams
Th
e J
ou
rna
l o
f Te
ch
no
log
y S
tud
ies
knowing this knowledge is to be internalized is
often cultural but is ultimately a personal deci-
sion. Knowledge and the ways of knowing
work together to create intelligence.
IntelligenceIntelligence, as defined by Gardner (1993),
is “the ability to solve problems, or fashion
products, that are valued in one or more cultural
or community settings” (p. 7). More simply
put, it is the ability of individuals to use knowl-
edge in a personal way to successfully interact
with their environment. Gardner’s definition of
intelligence differs somewhat from the widely
held notion that intelligence is a direct measure
of knowledge. Intelligence becomes a measure
of enculturation, combining knowledge and the
ways of knowing with the ability to interact
effectively in a cultural or community setting.
Multiple Intelligences TheoryIn his original multiple intelligences classi-
fication system, Gardner (1993) defined the cri-
teria for distinction of intelligence classes. He
stated, “Each intelligence must have an identifi-
able core operation or set of operations. As a
neurally based computational system, each intel-
ligence is activated or ‘triggered’ by certain
kinds of internally or externally presented infor-
mation” (p. 16). An additional criterion was
described that “an intelligence must also be sus-
ceptible to encoding in a symbol system—a cul-
turally contrived systems of meaning, which cap-
tures and conveys important forms of informa-
tion” (p. 16). Gardner contended that intelli-
gence takes on seven domains or modes of oper-
ation. He likened intelligence to talent and out-
lined the following seven domains in which tal-
ent or intelligence functions: musical, bodily-
kinesthetic, verbal-linguistic, interpersonal,
intrapersonal, spatial, and logical-mathematical.
Gardner contended that these seven intelligences
reflect the way the nervous system has evolved
over the millennia to yield certain discrete kinds
of intelligence. He claimed that it is irrelevant
whether intelligence is either inborn or learned.
Digital Intelligence — The Argumentfor an Additional Intelligence
No one contends that any of the original
seven intelligences or the two new intelligences
used for Gardner’s (1983) theoretical framework
are invalid; it is merely observed that yet anoth-
er intelligence has emerged. A different intelli-
gence, resulting from human interaction with
digital computers, exists.
Classification systems are constructed
around the developer’s beliefs of what knowl-
edge is worthy of transmission. Gardner (1983)
may not have held digital knowledge in the same
esteem as other knowledge structures when cre-
ating his framework. As with all strong models,
he did allow for the development of other intelli-
gences. In the epilogue of Multiple
Intelligences: Theory in Practice, Gardner
(1993) foresaw “the mental landscape [of the
future] might be reconfigured in light of accu-
mulated knowledge. I have every reason to
believe that the map would be drawn in a some-
what different way” (p. 250). Possibly the future
is not as distant as the year 2013 that Gardner
chose for prediction. In 1965, it was estimated
that knowledge doubled every five years. By the
year 2003, it is predicted that knowledge will
double every two months. Gardner may have
figured time on the 1965 scale.
Gardner’s (1993) own definition of intelli-
gence as “the ability to solve problems or fash-
ion products that are of consequence in a par-
ticular cultural setting or community” (p. 15)
sets criteria allowing for the emergence of a
digital intelligence. Our society is increasingly
becoming McLuhan’s (1964) “global village.”
Digital technologies have truly become an
extension of man and the external neural net-
work McLuhan described is under construction.
This new intelligence is a response to the cul-
tural change brought about by digital technolo-
gies and takes into account the skills and talents
possessed by the “symbol analysts” and “mas-
ters of change” recently recognized in
Gardner’s (1999) latest book. Through the
development and infusion of digital technology,
communication methods are rapidly expanding
and taking on new forms. These technological
advancements have allowed fluency across all
cultures and at the same time have rapidly
increased our ability for information gathering,
storage, and retrieval. A new intelligence has
begun to emerge—one that allows us to effec-
tively fashion products that are of consequence
in this new cultural and community setting.
94

Th
e J
ou
rna
l of Te
ch
no
log
y Stu
die
s
Artists often describe their ability to create
art as if the information or knowledge about
their particular art exists in a multidimensional
state in their environment. Their talent lies in
their ability to decode this information and
transfer it into a medium that others can more
easily appreciate. This is the artists’ own
description of the talent or intelligence that
Gardner (1983) termed musical intelligence.
We have developed this type of phenomenon
with information of all descriptions. We have
moved it into multidimensional digital space.
Information is no longer arranged in linear fash-
ion but is now object oriented and often clus-
tered. Because of the new functions provided
through digital technologies, information/knowl-
edge may be personally arranged and
rearranged. It could be said that those with the
ability to understand and interact with this digi-
tal information to arrange, manipulate, and dis-
play it according to their perceptions possess yet
another intelligence—an intelligence made up
of components of the other intelligences, just as
musical or spatial intelligence is described by
Gardner to exist. As Gardner (1999) described,
there exist individual virtuosos with the charac-
teristics of symbol analyst and master of
change. Those possessing this talent could be
termed digitally intelligent.
Continuing with Gardner’s (1993) criteria
of universality and symbol encoding system to
define the existence of a discrete intelligence,
there is little question of the universality of digi-
tal media across cultures. The development of
computer icons used for communication within
a digital environment satisfies the criterion of
encoding in a symbol system. When using
Gardner’s own criterion for intelligence classifi-
cation, digital intelligence logically exists.
Postman (1992) wrote of “the surrender
of culture to technology.” Slouka (1995)
told with caustic humor of his initiation into
cyberspace: “What I discovered, obscured
by the ‘noise’ of the Internet, was arguably
the biggest subculture in recorded history, a
virtual electronic nation” (p. 43). Papert
(1993) described how computers
changed the fabric of my own work.
What struck me most forcibly [about
computers] was that certain problems
that had been abstract and hard to
grasp became concrete and transparent,
and certain projects that had seemed
interesting but too complex to
undertake became manageable. (p. 13)
These references are being made about the
ability to fashion products in the form of infor-
mation/communication that are of consequence
in a digital culture or community.
Current literature has found a link between
the multiple intelligences theory and technology.
Articles outlining the uses of technology to
address multimodal learning are increasing in
popularity. These articles often describe the
flexibility of digital technologies and prescribe
specific uses of digital media to facilitate devel-
opment of each of Gardner’s (1993) seven cur-
rently described intelligences. Gardner
described how learning to program a computer
might involve multiple intelligences:
Logical-mathematical intelligence
seems central, because programming
depends upon the deployment of strict
procedures to solve a problem or attain
a goal in a finite number of steps.
Linguistic intelligence is also relevant,
at least as long as manual and comput-
er languages make use of ordinary lan-
guage...an individual with a strong
musical bent might best be introduced
to programming by attempting to pro-
gram a simple musical piece (or master
a program that composes). An individ-
ual with strong spatial abilities might
be initiated through some form of
computer graphics—and might be
aided in the task of programming
through the use of a flowchart or some
other spatial diagram. Personal intelli-
gences can play important roles. The
extensive planning of steps and goals
carried out by the individual engaged
in programming relies on intrapersonal
forms of thinking, even as the coopera-
tion needed for carrying a complex
task or for learning new computational
skills may rely on an individual’s abili-
ty to work with a team. Kinesthetic
intelligence may play a role in working
95
Th
e J
ou
rna
l o
f Te
ch
no
log
y S
tud
ies
with the computer itself, by facilitating
skill at the terminal. (p. 390)
Gardner’s description of the interaction of
all of the seven intelligences with technology
could lead one to conclude that digital intelli-
gence has evolved as a meta-intelligence—one
that is composed of many of the constituent
intelligences.
A change in world culture caused by digital
technology is occurring. Changes in communi-
cation style, life style, economic practice, and
the way we think have been caused by digital
technology. Our “ability to solve problems or
fashion products that are of consequence in a
particular cultural setting or community”
(Gardner, 1993, p. 15) is directly related to our
ability to interact with this emerging digital
environment.
Turkle (1995) wrote:
The computer offers us both new model
of mind and a new medium on which to
project our ideas and fantasies...a nas-
cent culture of simulation is affecting
our ideas about mind, body, self and
machine. (pp. 9-10)
The lessons of computing today have
little to do with calculation and rules;
instead they concern simulation, navi-
gation, and interaction….The computer
culture’s center of gravity has shifted
decisively to people who do not think
of themselves as programmers. (p. 19)
We are moving from a modernist cul-
ture of calculation toward a postmod-
ernist culture of simulation.…
Mainstream computer researchers no
longer aspire to program intelligence
into computers but expect intelligence
to emerge from the interactions of
small subprograms. If these emergent
simulations are “opaque,” this is not
necessarily a problem...our brains are
opaque to us, but this has never pre-
vented them from functioning perfectly
well as minds. (pp. 19-20)
Healy (1990) contended changing
lifestyles may be altering children’s brains in
subtle but critical ways and spoke of the devel-
opment of a new intellectual style. When dis-
cussing digital technology, she wrote that “sub-
tle shifts in what the human brain is required to
do will eventually cause it to modify itself for
new uses” (p. 332). Her concern with this
topic caused her to inquire of Dr. Jerome
Bruner his opinion of changing brains in a
technological age. His reply:
The only thing I can say with some
degree of certainty is that the evolution
of human brain function has changed
principally in response to the linkage
between human beings and different
tool systems. It would seem as if tech-
nology and its development leads to a
new basis of selection...surely there
must be a variety of changes in progress
that resulted from writing systems, even
though writing systems were introduced
only a short time ago as far as we reck-
on evolutionary time. And now, of
course, we have computers and video
systems, and how long before the selec-
tion pattern changes as a result of
these? (Healy, 1990, p. 334)
McLuhan (1964) told us “the medium is the
massage/message” (p. 2), meaning our intelli-
gences are shaped by the communication media
we employ. Negroponte (1995) believed that
our digital acumen has evolved to a point where
“the medium is not the message in a digital
world. It is an embodiment of it. A message
might have several embodiments automatically
derivable from the same data” (p. 71). He con-
tended that our accessibility to knowledge in the
form of information is becoming seemingly lim-
itless, and with this accessibility comes the abil-
ity for us to interpret that knowledge in
whichever way our intelligences need it to be
interpreted.
A digital intelligence is emerging. It has
rooted itself in our conceptions of knowledge
and has become integrated into our ways of
knowing. Intellectual skills have begun to
depend upon our ability to interact in a digital
environment. It is true that technology is a tool,
but these digital tools have changed world cul-
ture. “An artifact pushed far enough tends to
96

Th
e J
ou
rna
l of Te
ch
no
log
y Stu
die
s
reincorporate the user” (McLuhan & Powers,
1989, p. 3). Considerable uncertainty surrounds
the impact that possession of this emerging digi-
tal intelligence will have on the future structure
of our society. Such things as individual self-
concept, teaching and learning practices, and
organizational authority are but a few of the
areas that have begun to feel the impact. The
recognition and incorporation of this new intel-
ligence as a category in the multiple intelli-
gences theory would serve to widen the inquiry
into responsive teaching and learning.
Dr. Nan B. Adams is an assistant professor
in the Department of Educational Leadership
and Technology at Southeastern Louisiana
University.
97
References
Eisner, E. (Ed.). (1985). Learning and teaching the ways of knowing. Chicago: University of Chicago Press.
Gardner, H. (1983). Frames of mind: The theory of multiple intelligences. New York: Basic Books.
Gardner, H. (1993). Multiple intelligences: The theory in practice. New York: Basic Books.
Gardner, H. (1999). Intelligence reframed: Multiple intelligences for the 21st century. New York: Basic Books.
Healy, J. (1990). Endangered minds: Why children don’t think and what we can do about it.New York: Touchstone.
Machlup, F. (1980). Knowledge: Its creation, distribution, and economic significance, Volume I: Types of knowledge. Princeton, NJ: Princeton University Press.
McLuhan, M. (1964). Understanding media: The extensions of man. New York: McGraw-Hill.
McLuhan, M., & Powers, B. R. (1989). The global village: Transformations in world life and mediain the 21st century. New York: Oxford University Press.
Negroponte, N. (1995). Being digital. New York: Vintage Press.
Papert, S. (1993). The children’s machine: Rethinking school in the age of the computer. New York: Basic Books.
Postman, N. (1992). Technopoly: The surrender of culture to technology. New York: Vintage Books.
Schrag, F. (1992). Conceptions of knowledge. In P. W. Jackson (Ed.), Handbook of research on curriculum (pp. 268-301). New York: Macmillan.
Slouka, M. (1995). War of the worlds: Cyberspace and the high-tech assault on reality. New York: Basic Books.
Turkle, S. (1995). Life on the screen: Identity in the age of the Internet. New York: Simon & Schuster.

Computer numerical control (CNC)
machines have been very successful in increas-
ing productivity, repeatability, and accuracy of
parts, reducing production and labor costs, and
lowering operator skill in manufacturing indus-
try (Degarmo, Black, & Kohser, 1999). In order
to assure machined part quality, the operator tra-
ditionally inspects the machined parts by stop-
ping the machine, cleaning the workpiece, and
removing the workpiece from the machine table.
Then, the inspection instruments are able to
measure quality characteristics, such as surface
roughness, inspected by a stylus profilometer. It
is very time and cost consuming to conduct a
quality inspection of machined parts in this
manner. If there were an in-process inspection
technique that could be used to measure quality
characteristics of machined parts in a real-time
manner without stopping the machine and
removing the workpiece, productivity could be
increased and time and money could be saved.
To develop an in-process quality control
system, a sensor technique and a decision-mak-
ing algorithm need to be applied during machin-
ing operations. Several sensor techniques have
been used in the in-process prediction of quality
characteristics in machining operations. For
example, an accelerometer sensor was used to
monitor the vibration of milling operations to
develop an on-line surface roughness measuring
technique in end milling operations (Chen &
Lou, 1999; Jang, Choi, Kim, & Hsiao, 1996).
An ultrasonic sensor was used to develop an in-
process measurement of ultrasonic beams from
surface roughness in milling operations (Coker
& Shin, 1996). An acoustic emission sensor was
used to monitor transient stress waves to esti-
mate surface roughness in grinding (Susic &
Grabec, 1995). A dynamometer sensor can be
used to generate cutting forces in machining;
however, the effects of surface roughness caused
by cutting forces have not been taken into con-
sideration in past research. Lee and Lin (2000)
indicated that cutting forces have the most sig-
nificant impact on the quality of machined parts
in end milling operations. Therefore, cutting
force is to be included in developing cutting
parameters affecting a surface roughness
recognition system in end milling operations.
After a sensor has been selected to monitor
machining operations, a proper decision-making
algorithm needs to be developed to establish a
recognition system by using the data collected
from the sensor. Many decision-making algo-
rithms have been developed throughout the past
decade. For example, fuzzy logic, neural net-
work, and neural fuzzy systems have been
applied in the in-process surface roughness
recognition (IPSRR) system (Chen & Savage,
2001; Coker & Shin, 1996; Chen & Lou, 1999,
2000; Susic & Grabec, 1995; Tsai, Chen, &
Lou, 1999). Recently, a statistical approach has
been effectively used for prediction, process
optimization, and process control in manufac-
turing areas (Montgomery, 1997). For example,
Fuh and Wu (1995) and Chen and Lou (1999)
proposed a statistical model for surface quality
prediction in end milling operations.
In this research, a multiple linear regression
(MLR)-based IPSRR system using a dynamome-
ter was applied to predict surface roughness using
cutting force, spindle speed, feed rate, and depth of
cut as input parameters in end milling operations.
What We DidAn MLR-IPSRR system was developed and
implemented in two steps:
1. The magnitude of the cutting force in the
end milling operation that had the highest
correlation for predicting surface rough-
ness of the finished parts was identified.
2. The MLR-IPSRR system, including the
above-mentioned cutting force and cutting
parameters, was developed and tested.
ProcedureFigure 1 illustrates the experimental setup
consisting of the hardware and software used to
accomplish the two steps.
Th
e J
ou
rna
l o
f Te
ch
no
log
y S
tud
ies
An In-Process Surface Roughness RecognitionSystem in End Milling Operations Lieh-Dai Yang and Joseph C. Chen
98

Th
e J
ou
rna
l of Te
ch
no
log
y Stu
die
s
The hardware included:
• A Fadal vertical CNC milling machine
with multiple tool changing and a 15 HP
spindle.
• A Kistler 9257B type dynamometer sen-
sor, which provided dynamic measure-
ment of the three orthogonal components
of a force signal (Fx, Fy, and Fz).
• A Micro Switch 922 series 3-wire DC
proximity sensor, used to collect the
signal for counting the rotations of the
spindle as the tool was cutting.
• A power supplier, used to amplify the
signals from the proximity and the
dynamometer sensors. This amplified
signal was then sent to the A/D board.
• An omega CIO-DAS-1602/12 A/D
converter, used to convert both the
dynamometer and proximity sensor data
from analog to digital signals.
• A P5 133 personal computer, which was
connected to collect data from the A/D
converter output via an I/O interface.
• A 6061 aluminum workpiece with dimen-
sions of 1.00" x 1 .00" x 1.00", which was
cut in the end milling operations.
In order to control end milling operations
and analyze the spindle revolution and cutting
force signals, the following software was
required: (a) Basic CNC codes, which were
applied to conduct cutting operations, and (b)
A/D converter software, which was used to con-
vert data (proximity and cutting forces) from
analog signals to digital values. Using the
hardware and software setups, tests of cut were
performed. Figure 2 shows the data obtained
from this experimental run using spindle speed
(S = 2500 rpm), feed rate (F = 8 ipm), and
depth of cut (D = 0.08 in.).
The Cutting Forces AnalysisFrom Figure 2, the cutting force data were
collected from the dynamometer sensor; these
three forces (Fx, Fy, and Fz) cannot individually
represent the actual force affecting surface rough-
99
Figure 1. Experimental setup for the proposed MLR-IPSRR system.
Figure 2. Proximity and cutting force digital data using cutting conditionS = 2500 rpm, F = 8 ipm, and D = 0.08 in.

Th
e J
ou
rna
l o
f Te
ch
no
log
y S
tud
ies
ness. Four cutting force magnitudes
( r_xy, r_xy_peak, z, and r_xyz) were consid-
ered as possible candidates for an input factor for
the MLR-IPSRR system. They are defined as:
1. Average resultant force of the x and y
directions per revolution ( r_xy).
By using the following equation, one could
find the individual resultant force (Fr_xy) from
the x and y directions as shown in Figure 3.
(1)
where i is the data point in one revolution.
Then, the average resultant force in
one revolution ( r_xy) could be
given as:
, (2)
where i = 1, 2, . . . m and m is the total data
points in one revolution.
2. Average resultant peak force ( r_xy_peak).
By using the data shown in Figure 3, one
could also identify the peak force (Fr_xy_peak) from
the average resultant forces of the x and y direc-
tions ( r_xy) in the cut period of each tooth.
Then, the average resultant peak force in each
revolution ( r_xy_peak) could be given as:
, (3)
where i = 1, 2,. . . r and r is the number of cut-
ting tool teeth. In this study, r = 4.
3. Average z direction cutting force per
revolution ( z).
The third type of force analyzed in this
study was the average cutting force in the z
direction per revolution ( z) and could be
given as:
, (4)
where i = 1, 2, . . . m and m is the total data
points in one revolution.
4. Average resultant force of x, y, and z
directions per revolution ( r_xyz).
The researcher also wanted to analyze the
average resultant force of the x, y, and z direc-
tions in one revolution ( r_xyz). The force is
given as:
, (5)
where i is the data point in one revolution.
Then, the average resultant force in one
revolution ( r_xyz) could be given as:
, (6)
where i = 1, 2, 3. . . m and m is the total data
points in one revolution.
After the above-mentioned cutting forces
were formed, we examined the correlation coef-
ficient between these cutting forces and surface
roughness. Equation 7 was used to compute the
100
Figure 3. Individual resultant cutting force Fr_xy and four peak forcesin one revolution at cutting condition of F = 20 ipm, S = 2000 rpm, D = 0.08 in.
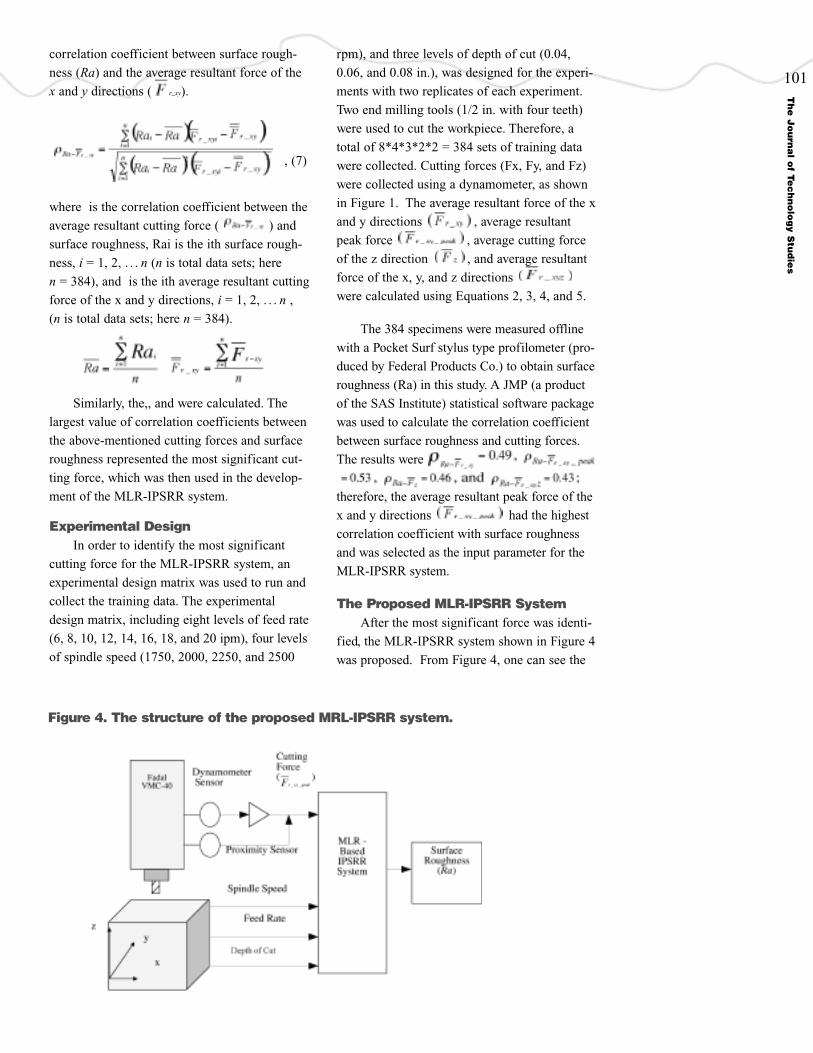
Th
e J
ou
rna
l of Te
ch
no
log
y Stu
die
s
correlation coefficient between surface rough-
ness (Ra) and the average resultant force of the
x and y directions ( r_xy).
, (7)
where is the correlation coefficient between the
average resultant cutting force ( ) and
surface roughness, Rai is the ith surface rough-
ness, i = 1, 2, . . . n (n is total data sets; here
n = 384), and is the ith average resultant cutting
force of the x and y directions, i = 1, 2, . . . n ,
(n is total data sets; here n = 384).
Similarly, the,, and were calculated. The
largest value of correlation coefficients between
the above-mentioned cutting forces and surface
roughness represented the most significant cut-
ting force, which was then used in the develop-
ment of the MLR-IPSRR system.
Experimental DesignIn order to identify the most significant
cutting force for the MLR-IPSRR system, an
experimental design matrix was used to run and
collect the training data. The experimental
design matrix, including eight levels of feed rate
(6, 8, 10, 12, 14, 16, 18, and 20 ipm), four levels
of spindle speed (1750, 2000, 2250, and 2500
rpm), and three levels of depth of cut (0.04,
0.06, and 0.08 in.), was designed for the experi-
ments with two replicates of each experiment.
Two end milling tools (1/2 in. with four teeth)
were used to cut the workpiece. Therefore, a
total of 8*4*3*2*2 = 384 sets of training data
were collected. Cutting forces (Fx, Fy, and Fz)
were collected using a dynamometer, as shown
in Figure 1. The average resultant force of the x
and y directions , average resultant
peak force , average cutting force
of the z direction , and average resultant
force of the x, y, and z directions
were calculated using Equations 2, 3, 4, and 5.
The 384 specimens were measured offline
with a Pocket Surf stylus type profilometer (pro-
duced by Federal Products Co.) to obtain surface
roughness (Ra) in this study. A JMP (a product
of the SAS Institute) statistical software package
was used to calculate the correlation coefficient
between surface roughness and cutting forces.
The results were
therefore, the average resultant peak force of the
x and y directions had the highest
correlation coefficient with surface roughness
and was selected as the input parameter for the
MLR-IPSRR system.
The Proposed MLR-IPSRR System After the most significant force was identi-
fied, the MLR-IPSRR system shown in Figure 4
was proposed. From Figure 4, one can see the
101
Figure 4. The structure of the proposed MRL-IPSRR system.

Th
e J
ou
rna
l o
f Te
ch
no
log
y S
tud
ies
input parameters (average resultant peak force
[ ], spindle speed [S], feed rate [F],
and depth of cut [D]) and the output parameter
(surface roughness [Ra]) used to generate the
MLR-IPSRR system. The proposed MLR-
IPSRR system is given as:
where are coefficients of the regression model,
Rai is the surface roughness, Fi is the feed rate,
Si is the spindle speed, Di is the depth of cut,
is the average resultant peak force of
the x and y directions, and εi ~ N(0, σ2), where
i is the number of data sets. To obtain data for
the development of a multiple regression predic-
tion model, a total of 384 experimental runs
have taken place using the cutting combination
indicted in the experimental design section.
Therefore, in this study, i = 1, 2, 3,°K384.
Analysis and Results of the SystemAfter utilizing the JMP software package,
the results of the surface roughness MLR model
were generated as follows:
Ra (predicted) = 57.066-0.024*S + 4.142*F -
0.001*(S - 2125)*(F-13) + 491.056*D +
0.630*(S - 2125)*(D - 0.06) + 41.820*(F -
13)*(D - 0.06) - 0.351* -0.0007*
(S - 2125)*( - 75.787) + 0.015*
(F - 13)*( - 75.787) - 0.326*
(D - 0.06)*( - 5.787) + 0.099*
(S - 2125)*(F - 13)*(D - 0.06) - 0.0001*(S -
2125)*(F - 13)*( - 75.787) + 0.01*
(S - 2125)*(D - 0.06)*( - 5.787) +
0.722*(F - 13)*(D - 0.06)* ( - 75.787)
-0.0016*(S - 2125)*(F - 13)*(D - 0.06)*
(- 75.787)
The effect of tests showed that the feed rate,
spindle speed, average resultant peak force, and
depth of cut influenced the surface roughness
significantly since the p values of each main
effect (feed rate, spindle speed, average resultant
peak force, and depth of cut) were less than a =
0.01 significant level). That is, the surface
roughness was mainly determined by the feed
rate, spindle speed, average resultant peak force,
and depth of cut in end milling operations. The
MLR model was also significant with the p
value less than a = 0.01. Therefore, the MLR
model can be effectively used in this research.
Once the MLR model had been established,
the MLR recognition model was tested using 20
sets of cutting conditions that were different
from the cutting conditions of experimental
designs. The MLR-IPSRR model was imple-
mented in the prediction of the surface rough-
ness while the machining process was taking
place. The results of the predicted surface
roughness (RaiMR) were compared with the fin-
ished parts (Rai-m) that were measured by using
a Pocket Surf portable surface roughness gauge.
Then, the individual precision _iMLR of each
experimental run (i) was evaluated based on the
following equations.
(8)
(9)
where ΦiMLR is the precision of ith testing run,
and Φ– MLR is the average precision of the 20 test-
ing data, i = 1. . .20.
The results showed that the capability of the
surface roughness prediction was about 86% for
the testing experimental data in this study.
Therefore, one can see that the surface rough-
ness (Ra) can be predicted effectively by the
above-mentioned MLR-IPSRR system.
What We LearnedThe purpose of this study was to analyze
cutting forces to find out the most significant
cutting force magnitude that affected surface
roughness and to evaluate whether a MLR
approach for surface roughness recognition could
be used for prediction in the IPSRR system. Our
main conclusions are summarized as follows:
• The average resultant peak force ( )
was identified to be the most significant force
to affect surface roughness in this study.
102

Th
e J
ou
rna
l of Te
ch
no
log
y Stu
die
s
• Spindle speed, feed rate, average peak cutting
force, and depth of cut are significant in
affecting surface roughness in end milling
operations and the determination of the
coefficient is R2 of 0.62 in the MLR model.
• The MLR-IPSRR system is approximately
86% accurate in predicting surface roughness
while the machining process is taking place.
This research assumed that the CNC
milling machine was effective and stable to
conduct all experiments under each cutting con-
dition using an HSS end mill to cut 6061 alu-
minum material. We believe that the proposed
IPSRR system could eventually be implemented
in the new age of CNC machines. This would
be more likely if additional research and testing
could be done such as (a) including different
tool material, tool radius, workpiece material,
and lubricants in the system and (b) using dif-
ferent methodologies, such as fuzzy logic,
neural networks, and fuzzy nets, to provide the
IPSRR system with a learning capability. With
this capability, the system could be adopted to
different machines produced from different
CNC manufacturers.
Dr. Lieh-Dai (John) Yang is an associate
professor in the Department of Industrial
Management at Nan-Kai College, Nantou,
Taiwan.
Dr. Joseph Chen is a professor in the
Department of Industrial Education and
Technology at Iowa State University. He is a
member of Alpha Xi Chapter of Epsilon Pi Tau.
103
References
Chen, J. C., & Lou, M. S. (2000). Fuzzy-nets based approach to using an accelerometer for an in-processsurface roughness prediction system in milling operations. International Journal of ComputerIntegrated Manufacturing, 13(4), 358-368.
Chen, J. C., & Lou, S-J. (1999). Statistical and fuzzy-logic approaches in on-line surface roughnessrecognition system for end-milling operations. International Journal of Flexible Automation andIntegrated Manufacturing, 6(1&2), 53-78.
Chen, J. C., & Savage, M. (2001). A fuzzy-net-based multiple in-process surface roughness recognitionsystem in milling operations. International Journal of Advanced Manufacturing Technology, 17, 670-676.
Coker, S. A., & Shin, Y. C. (1996). In-process control of surface roughness due to tool wear using a newultrasonic system. International Journal of Machine Tools & Manufacture, 36(3), 411-422.
Degarmo, E. P., Black, J. T., & Kohser, R. A. (1999). Material processes in manufacturing. Upper SaddleRiver, NJ: Prentice Hall.
Fuh, K-H., & Wu, C-F. (1995). A proposed statistical model for surface quality prediction in end-millingof Al alloy. International Journal of Machine Tools & Manufacture, 35(8), 1187-1200.
Jang, D-Y., Choi, Y-G., Kim, H-G., & Hsiao, A. (1996). Study of the correlation between surfaceroughness and cutting vibrations to develop an on-line roughness measuring technique in hardturning. International Journal of Machine Tools & Manufacture, 36(4), 453-464.
Lee, T. S., & Lin, Y. J. (2000). A 3D predictive cutting force model for end milling of parts havingsculptured surfaces. International Journal of Advanced Manufacturing Technology, 16, 773-783.
Montgomery, D. C. (1997). Design and analysis of experiments. New York:Wiley.
Susic, E., & Grabec, I. (1995). Application of a neural network to the estimation of surface roughnessfrom AE signals generated by friction process. International Journal of Machine Tools &Manufacture, 35(8), 1077-1086.
Tsai, Y., Chen, J. C., & Lou, S. (1999). An in-process surface recognition system based on neuralnetworks in end milling cutting operations. International Journal of Machine Tools & Manufacture,39, 583-605.

Background and RationaleManufacturing professionals within universi-
ties tend to view manufacturing systems from a
global perspective. This perspective tends to
assume that manufacturing processes are
employed equally in every manufacturing
enterprise, irrespective of the geography and the
needs of the people in those diverse regions. But
in reality local and societal needs influence the
manufacturing processes employed by a region’s
manufacturers. To design better and more useful
curricula that meet local needs, manufacturing
systems professors and administrators need to
understand the nature and magnitude of this issue.
Material processing is a major component
of manufacturing systems (Seymour, 1995). All
manufacturing programs emphasize material
processing as a major component of their cur-
ricula. However, manufacturing processing
needs in one geographical locality are often dif-
ferent from the needs in others. For example,
while manufacturing companies in the mid-
western and western United States may share
commonalties in some processes, the differing
needs of the two populations can result in com-
panies of one locality emphasizing one or more
processes more than the other, and vice versa.
When such a situation exists, it is the responsi-
bility of manufacturing educators and adminis-
trators to determine what changes are needed in
their curricula to reflect local needs and what
the local industry is doing. In other words, man-
ufacturing processes employed by companies in
a location are reflections of what manufacturing
students in that location need to learn. This is
important because most of their graduates get
employed by companies located in that region.
Addressing these regional differences in manu-
facturing process utilization constitutes the
rationale for this study
To investigate how this applies to the manu-
facturing systems curriculum at San Jose State
University (SJSU), a case study was undertaken
in the spring of 2002. The results are contained
in this article, which examines the processing
needs of manufacturers in the Silicon Valley of
Northern California and compares the findings
with the contents of SJSU’s manufacturing sys-
tems program.
ProcedureThis study was undertaken in two phases.
The first phase determined which manufactur-
ing processes generated more activities in the
Silicon Valley of Northern California, as evi-
denced by the frequency of their use in the com-
mercial advertising by the region’s job shop
manufacturers. An underlying assumption was
that the frequency of use in a major advertising
publication was an indication of the need and
popularity of a process. To accomplish this, a
special group of manufacturers was selected as
the main population. This group included all the
commercial and professional job shop manufac-
turers who participated in the 2001 and 2002
Job Shop Shows at the Santa Clara Convention
Center. This annual, three-day business-oriented
event is billed by its sponsors as the Southwest’s
largest contract manufacturing event ever. It
attracts hundreds of manufacturing-related com-
panies each year. These companies advertised
numerous manufacturing processes as services
that they provided, ranging from rubber forming
to stamping and machining. The companies,
together with their services, are published in the
Job Shop Technology magazine, a quarterly
publication serving manufacturers in the Silicon
Valley (Short, 2001, 2002). These advertised
processes were identified, sorted, and collated to
determine their frequencies to help identify the
advertised manufacturing processes that gener-
ated more or less activities among the job shops
in the Silicon Valley region.
A total of 42 processes, together with their
respective frequency scores for 2001 and 2002,
were so identified. They included: brazing
(4, 4); chemical etching (1, 3); coating (3, 4);
deep drawing (3, 3); die casting (8, 9); die cutting
(1, 4); EDM (7, 11); electroforming (2, 3); elec-
Th
e J
ou
rna
l o
f Te
ch
no
log
y S
tud
ies
Silicon Valley’s Processing Needs Versus San JoseState University’s Manufacturing Systems ProcessingComponent: Implications for Industrial TechnologySamuel C. Obi
104
Th
e J
ou
rna
l of Te
ch
no
log
y Stu
die
s
tron beam welding (1, 1); extrusion (12, 10);
finishing (3, 8); grinding (3, 5); heat treating
(2, 3); hydroforming (2, 1); injection molding
(7, 13); investment casting (3, 1); laser
cutting/drilling (5, 9); laser etching (2, 1); laser
marking (4, 5); laser welding (2, 3); machining
(42, 44); mold design (6, 1); molding (0, 2);
perforating (1, 1); photochemical machining
(3, 9); plating (4, 6); powder coating (2, 2);
punching (1, 2); roll forming (0, 1); rubber
molding (9, 8); sand casting (0, 1); sheet metal
fabrication (6, 3); sheet metal forming (1, 5);
springs (10, 11); stamping (18, 22); thermo-
forming (2, 2); thread rolling (0, 1); tooling
design/fabrication (2, 5); tube bending (1, 1);
water jet cutting (3, 3); welding (2, 9); and
wire forming (9, 5). Processes that received a
score of 5 or higher were given more attention
in this study
The second phase of the study determined
the degree to which SJSU’s related manufactur-
ing systems processing courses addressed these
advertised processes. The premise here is that
whatever is practiced by the manufacturing
companies (which is an indication of what the
society needs) is, to some degree, a reflection of
what should be taught (Obi, 1991). To accom-
plish this, SJSU’s manufacturing systems’ key
material processing courses were identified.
They included: Tech 20 (Computer-Aided
Design); Tech 046 (Introduction to Machining
Processes); Tech 103 (Industrial Materials);
Tech 104 (Manufacturing: Planning and
Processes); Tech 142 (Product Prototyping and
Manufacturing); Tech 143 (Polymers and
Composites Fabrication Technology); and Tech
144 (Computer-Aided Manufacturing). The
courses were then matched with their related
processes according to their respective contents.
This helps in visualizing processes that received
coverage and those that did not, a picture that
would help professors and administrators to
make appropriate corrections if need be.
Findings and DiscussionsThe study revealed several observations:
(a) one process received too much coverage,
(b) some processes were covered adequately,
(c) some processes received too little coverage,
(d) some processes were not covered at all in the
program, and (e) some processes were not
advertised but were taught in the program.
These processes and comments essentially con-
stitute the findings from this study and are dis-
cussed in the following paragraphs.
It is encouraging to note that only one
process (sand casting) appeared to be receiving
too much coverage in the manufacturing sys-
tems concentration at SJSU. Perhaps this was
because manufacturers now increasingly employ
other casting processes. In fact, some casting
processes such as die casting and shell mold
casting have actually gained more popularity
and use in recent years than other more tradi-
tional techniques such as sand casting.
Fortunately, only one course (Tech 142) has a
significant sand casting content. Perhaps,
SJSU’s manufacturing systems professors
should switch to an alternative casting process
to reflect current trends and help address this
problem. If this happens to be the case, then
consideration must be given to such factors as
cost of die casting equipment, ease of mainte-
nance, space availability, and so forth.
It was also encouraging that the study indi-
cated adequate coverage of 25 (or about 60%)
of the 42 processes advertised, including braz-
ing, chemical etching, coating, deep drawing,
die cutting, EDM, electron beam welding, fin-
ishing, grinding, heat treating, injection mold-
ing, investment casting, laser welding, machining,
mold design, molding, perforating, punching,
roll forming, sheet metal fabrication, sheet
metal forming, thread rolling, tooling
design/fabrication, water jet cutting, and weld-
ing. However, students received significant
practical experience performing grinding,
injection molding, machining, sheet metal fabri-
cation, and tooling design/fabrication in courses
containing those processes. But lectures, videos,
and field trip activities alone provided enough
learning experience for students in courses con-
taining processes that received low advertising
frequencies, since they are not considered to be
high-demand processes.
On the other hand, the study indicated that
eight processes received little coverage in
SJSU’s manufacturing systems program: die
casting, extrusion, laser cutting/drilling, photo-
chemical machining, plating, rubber molding,
105

Th
e J
ou
rna
l o
f Te
ch
no
log
y S
tud
ies
stamping, and wire forming. Little coverage
here means that these processes are covered
only in classroom lectures, which does not
match the high frequency scores received by the
processes. Although the lectures often include
videos and field trips, the actual performance of
the process by students (a critical component of
technology education) is missing. The absence
of this applied component in a manufacturing
systems program renders its graduates ill pre-
pared to perform effectively when they enter the
workforce. These graduates are expected to
supervise working people and processes. A good
familiarity with the processes that they will
supervise will help equip them with the critical
knowledge and skill needed in today’s industrial
environment.
Correcting this problem could require sig-
nificant investment in equipment, space, and
training, something SJSU’s administrators are
not willing to do because of their limited budg-
et. But this is a problem that SJSU’s manufac-
turing professors have to deal with in order to
help meet those challenges and improve their
manufacturing systems program. Therefore,
some creative approach may have to be
employed to address the problem. One possible
idea is to help students complete their intern-
ships in companies where those processes are
performed so they can learn those skills.
Another idea may be to recommend that manu-
facturing systems students take courses contain-
ing those processes in a junior college and then
transfer them to SJSU.
Of the eight processes that received no cov-
erage at all in the program, namely, electroform-
ing, hydroforming, perforating, plating, powder
coating, spring forming, tube bending, and wire
forming, only plating, spring forming, and wire
forming are of major concern to the program
because the rest did not receive as high scores
as these three did. The processes that received
lower scores can be included in lectures. But to
implement plating, spring forming, and wire
forming will again require significant invest-
ment in equipment, space, and training.
Therefore, a possible solution here will be the
industrial internship and junior college credit
transfer ideas already discussed above.
The case of missing processes is the last
observation to be mentioned here. These are
processes that were not advertised by the partic-
ipating companies but are taught in the pro-
gram. Slush casting and open die forging, for
example, were not advertised by the companies
but are discussed in lectures at SJSU’s manufac-
turing systems program. Such a situation may
be due to a number of reasons, such as the case
with a government contractor on specialized
processes, a small business that cannot afford to
participate in the show, a business whose
process may not be needed locally, or simply a
business that usually gets enough customers and
does not care or want to participate in the job
shop show. SJSU’s professors and others in such
a situation should use their judgment in config-
uring their curriculum to match companies’
needs, especially if those same companies are
also area employers.
It should also be mentioned that the view
taken in this study represents only manufactur-
ing-related entities that actually advertised their
services in the job show. One should not inter-
pret this group to represent all manufacturing
companies in the Silicon Valley. Therefore, any
major decisions made by SJSU’s manufacturing
systems professors and administrators from the
results of this study should be made after other
factors are considered. Such factors might
include the robustness of the program, currency
of the curriculum, enrollment trends in the pro-
gram, and the general opinions about the pro-
gram content as expressed by stakeholders such
as students, parents, industry personnel, and
other educators, especially community college
instructors.
Implications for Manufacturing andIndustrial Technology Programs
This case study was an attempt to deter-
mine the processing needs of Silicon Valley’s
manufacturers and compare them with the man-
ufacturing systems processing component at
SJSU. It also shows how the findings could be
employed to reconfigure the curriculum to
reflect local needs.
As has been demonstrated in the foregoing
discussions, this kind of study helps educators
and administrators to visualize the content mat-
106

Th
e J
ou
rna
l of Te
ch
no
log
y Stu
die
s
ter of their programs more precisely and then
determine whether they are meeting their
intended goals and objectives. In other words, it
acts as a tune-up whenever educators are in
doubt about what they should be teaching. It
also acts as a check and balance for a program.
Since curriculum development is the core func-
tion of education, ensuring that essential and
appropriate materials are covered in a program
is critically important if manufacturing systems
graduates are to be competently knowledgeable
when they enter the workforce. This practice
more directly affects the students and graduates
of the region where the programs are located.
Designing program content to reflect the indus-
trial tasks of the area will certainly be a plus for
the graduates and the manufacturing organiza-
tions that hire them when they graduate.
Also, this practice essentially makes the
programs more functional in the communities
that they serve. Students in such programs will
more easily relate to the manufacturing jobs
advertised in their locality when they see one.
And program educators and job providers will
tend to be working together toward a common
goal, since they can now see their commonality
more easily. The result is that the manufacturing
programs in the region will be more robust and
the graduates more educated.
Finally, this study is recommended for all
manufacturing programs, not only to help visu-
alize how different localities and economies
influence the manufacturing processes of their
respective locations but also to ensure that the
needs of students and employers in such regions
are being met. It potentially can result in
stronger manufacturing systems programs that
will be in business for many years to come.
Dr. Sam C. Obi is an associate professor in
the Department of Aviation and Technology at
San Jose State University. He is a member of
Rho Chapter of Epsilon Pi Tau.
107
References
Obi, S. C. (1991). Manufacturing for quality: Implications for industrial technology. Journal of Industrial Technology, 7(4), 18-21.
Seymour, R. D. (1995). Manufacturing technology education. In Foundations of technology education:1995 (44th CTTE yearbook). Glencoe, NY: Council on Technology Teacher Education.
Short, M. (Ed.). (2001, October). Outsourcing solutions for product manufacturers. Job ShopTechnology (Western ed.), 16(4), 1-103.
Short, M. (Ed.). (2002, January). Outsourcing solutions for product manufacturers. Job Shop Technology (Western Ed.), 17(1), 1-87.
Creative and Collaborative Problem Solving inTechnology Education: A Case Study in Primary SchoolTeacher EducationJari Lavonen, Ossi Autio, and Veijo Meisalo
Many public and private institutions believe
that there is a growing need for employees who
are able to think creatively and solve a wide
range of problems (Grabinger, 1996). On the
other hand, several researchers have maintained
that many of the skills and competencies needed
in working life are seldom obtained at school
(e.g., Resnick, 1986). Therefore, competency-

Th
e J
ou
rna
l o
f Te
ch
no
log
y S
tud
ies
based or performance-based approaches to
teacher education have been recommended in
order to give students a broader perspective and
to equip them to teach technology (Custer,
1994; Sinn, 1996; Whitty & Willmott, 1991). In
particular, it has been argued that creative prob-
lem solving is an integral part of technology
education, in contrast to an instruction-follow-
ing method of technology education, reproduc-
ing artifacts, and teacher-dominated work (De
Luca, 1993; Sellwood, 1991; Williams &
Williams, 1997). Wu, Custer, and Dyrenfurth
(1996) suggested even more forcefully that (cre-
ative) problem solving should be a core content
area and method of teaching technology. These
approaches particularly seem to fit technology-
oriented modules in teacher education.
In this article, the Creative Technology
Education Project (CTEP) is presented, and
phases of problem-solving processes in which
the participating primary school student teach-
ers generate alternatives and evaluate ideas are
analyzed. The aims of this project were to intro-
duce technology education goals and contents to
these students, as well as to offer tools for learn-
ing and teaching technology, and to facilitate
personal growth. One purpose of the project was
to encourage the students to become familiar
with technology and problem-solving processes
and to develop especially creative skills and
abilities (e.g., ideation and the evaluation of
ideas). For those purposes, a model was intro-
duced, named the Overall Mapping of a
Problem Situation (OMPS). This model helps
students in ideation (the generation of alterna-
tive solutions) and evaluation of ideas when
working on project teams. This model was prac-
ticed with concrete technology education proj-
ects. Thus, the project focus was on collabora-
tive problem solving, with special emphasis on
ideation and the positive evaluation of ideas.
Creative and CollaborativeProblem Solving
Different ways to emphasize creative prob-
lem solving in small groups have been suggest-
ed (e.g., Dooley, 1997; Grabinger, 1996; Hill,
1999). A common feature of these approaches is
to place students in the midst of a realistic, ill-
defined, complex, and meaningful problem with
no obvious or correct solution. Students work in
teams, collaborate, and act as professionals,
confronting problems as they occur – with no
absolute boundaries. Although they get insuffi-
cient information, the students must settle on
the best possible solution by a given date. This
type of multistaged process is characteristic of
effective and creative problem solving. These
stages may include (a) formulating the problem,
(b) recognition of facts related to the problem,
(c) goal setting, (d) ideation or generating alter-
natives, (e) the evaluation of ideas, (f) choosing
the solution and, (g) testing and evaluating (De
Luca, 1993; Fisher, 1990; Welch & Lim, 2000).
The process is nonlinear and follows no particu-
lar rules because rational approaches miss the
entire point of creative problem solving.
In accordance with Hennessy and Murphy
(1999), the term collaboration is used in this
article to describe social interaction within a
group or a team, when students actively talk and
share their cognitive resources, working together
to produce a single outcome. They are also sup-
posed to establish joint goals and referents,
making joint decisions, solving emerging prob-
lems, constructing and modifying solutions, and
evaluating the outcomes through dialogue and
action. Collaboration requires students to active-
ly communicate (e.g., negotiate or debate) and
work together (e.g., set goals, plan, generate
alternatives) with the aim of producing a single
outcome (e.g., an object, a computer program,
or a technological process/system). The students
must then evaluate their outcome through dia-
logue and action (Hennessy & Murphy, 1999).
When problem solving is creative, the ideas
or products produced during the problem-solv-
ing process are both original and appropriate
(Fisher, 1990). For these purposes, various idea-
generation techniques or ideation models are
valuable (Smith, 1998). The number of alterna-
tive solutions is important because the best way
to come up with good ideas is to have plenty of
choice (Parker, 1991). Consequently, the out-
come of creative problem-solving activities
depends largely on the creative processes and
ideation techniques that have been learned and
applied. Furthermore, there are factors of atti-
tude (interest, motivation, and confidence), cog-
nitive ability (knowledge, memory, and think-
ing-skill), and experience (familiarity with con-
108
Th
e J
ou
rna
l of Te
ch
no
log
y Stu
die
s
tent, context, and strategies) that influence prob-
lem-solving processes (Fisher, 1990). For exam-
ple, nonjudgmental positive feedback and the
acceptance of all ideas, even absurd or impracti-
cal ones, are important in all creative group
processes for generating significant alternatives
(Higgins, 1994). There should be room for free
ideation sessions. Evaluative critiques should
only take place afterwards.
Numerous models for curriculum changes
in technology education, as well as for introduc-
ing creative problem-solving processes, are
available nowadays in both technology educa-
tion literature and school textbooks (Johnsey,
1995). Nevertheless, there still appears to be an
overemphasis on passive learning and the old
traditions of craft learning (Kimbell, 1997).
Moreover, some renewed curriculum models
lead easily to a situation in which the construc-
tion phase immediately follows the planning
phase, without enough time for conceptualiza-
tion, ideation, and the evaluation of ideas
(Alamäki, 2000; Elmer & Davies, 2000). An
especially important aspect of technology edu-
cation and teacher education is providing the
opportunity to get away from routine activities
and low-level thinking so that students can find
fresh new ideas and approaches, for example, by
utilizing group dynamics or special creative
methods (Smith, 1998).
There is an obvious need for young tech-
nology teachers to act as agents for change.
Moreover, it is obvious as well that more
research and development effort should be
directed towards introducing creative problem-
solving approaches in technology education
(Gilbert & Boulter, 2000; Lee, 1996).
Instruction and teaching models experienced
during primary school teacher education often
serve as learning models for students. The plan
of the CTEP, described in more detail below,
was based on the assumption that collaborative
and creative problem solving would be valuable
for developing a premium technology education
study module for primary school teacher educa-
tion. The purpose of the study presented in this
article was to discover how students perceive
the creative process and to what extent they
learn creative skills, especially those that
involve generating alternative ideas and the self-
evaluation of these alternatives.
The following questions guided this study:
1. What are the key factors in creative prob-
lem-solving processes from the point of
view of primary school student teachers?
2. Have students learned creative skills during
their enrollment in the CTEP?
The CTEPThe practical goal of the CTEP was to
introduce student teachers to the OMPS method
and to help them to become familiar with prob-
lem-solving processes, ideation techniques, and
evaluation of ideas.
Of the 118 participating students, 80% were
female and were on average 24 years old.
According to the collected background informa-
tion, 77% of the students had little or no previ-
ous knowledge or experience regarding the
contents and methods of technology education.
Less than 10% of them, however, disagreed with
statements indicating high motivation and
responsibility in their work, as well as success
in planning and collaboration during the CTEP.
Only about 15% of the participating students
thought that the CTEP was of little significance
to the primary school teaching profession or
that the CTEP offers little that is applicable to
their profession. It can be concluded, therefore,
that the students’ attitudes to the project were
largely positive and that they agreed with the
project goals.
At the beginning of the CTEP, the students
attended four hours of lectures and demonstra-
tions about creative problem solving. The ses-
sions covered different idea generation tech-
niques, such as brainstorming and analogous
thinking. In addition, the students became famil-
iar with the theme through WWW pages
(Lavonen & Meisalo, 2001) that presented prob-
lem-solving models and a couple of idea-gener-
ating techniques, such as the OMPS (Sellwood,
1991). Different (e.g., creative, social, and per-
sonal) abilities and skills needed in creative
problem solving, as well as ways to establish a
creative and open atmosphere, were discussed.
After the above-mentioned sessions, a four-hour
workshop was organized in which the students
worked in small groups. In these workshops,
109

Th
e J
ou
rna
l o
f Te
ch
no
log
y S
tud
ies
students became familiar with the OMPS
method by using it to plan a bridge or tower to
be constructed out of newspapers.
During the planning phase of the project
(four to eight hours), the groups of 3 to 4 stu-
dents worked in 24 collaborative teams accord-
ing to the basic principles of the OMPS method
and generated a map of the creative process (see
Figure 1). First, the students had to find, formu-
late, and specify the problem (How could some-
thing be done differently?) and recognize the
facts (agreed by the team) and opinions related
to the problem. Next, the teams set the problem
or team assignments in a cogent phrase, such as:
How can an interesting electric toy be con-
structed differently? or How can a game be
designed differently? In addition, the students
had to set the goals and visions (ideal perform-
ance). Then, the students had to create suitable
approaches for solving the problem and to gen-
erate problem-solving alternatives. Every alter-
native idea was subsequently backed up by pre-
senting at least three reasons for its adoption.
Nonjudgmental positive feedback and the
acceptance of all ideas, even absurd or impracti-
cal ones, were held as important rules during all
group processes that generated creative alterna-
tives (Higgins, 1994). During the planning
phase, the teams identified, on average, 3.8 (SD
= 1.30) facts and expressed 2.1 (SD = 1.6) opin-
ions related to the problem. The teams set, on
average, 2.7 (SD = 1.0) goals and created 1.9
(SD = 1.2) visions. They generated, on average,
3.4 (SD = 0.59) problem-solving approaches
and 7.3 (SD = 2.4) ideas as to how to solve the
problem. In the subsequent maps, there were
13.6 (SD = 7.7) positive evaluations of the pre-
sented ideas and 3.9 (SD = 3.4) constructive
“how” questions. Some teams presented their
ideas in figures.
During the creative process, it was also pos-
sible to ask constructive questions about the
idea or to combine, redefine, and piggyback
ideas. After generating dozens of ideas, students
chose the most appropriate solution by compar-
ing the positive feedback and constructive ques-
tions that related to each idea. Typically, the
final solution was a combination of several orig-
inal ideas. During the ideation phase, the stu-
dents were encouraged to follow the creative
rules and to utilize idea generation techniques
while working in collaborative groups. After
110
Figure 1. An example of a planning process expressed by a map constructedduring the creative phase. In this phase, the primary school student teachersutilized the OMPS-method.

Th
e J
ou
rna
l of Te
ch
no
log
y Stu
die
s
selecting the final ideas, students then planned
out how they would construct the structure or
perform the process.
After generating alternatives, evaluating
them, and designing and planning the project,
the students created something new in their
design solution process utilizing paperboard,
wood, metal, and/or plastic and the appropriate
tools. The teams spent approximately 12 hours
in the workshop and worked according to their
previously agreed plans. It was intended that the
students should be creative in their teams and
that they would modify their preliminary plans
during the practical work period. Finally, each
team presented their innovations to the other
groups and evaluated both the innovations and
the entire process, first by themselves and then
with the others. The construction and evaluating
phases are not included in this article.
Implementation of the StudyThis research can be described, in accor-
dance with Stenhouse (1985), as exploratory
evaluation research, in which data were gathered
to evaluate the CTEP described above. It is a
typical case study in which different approaches
to data gathering is used, including gathering
data in numerical form. Moreover, the study
also has features of developmental research,
which Richey and Nelson (1996) defined as a
systematic study of designing, developing, and
evaluating instructional programs, processes,
and products that must meet the criteria of inter-
nal consistency and effectiveness.
For evaluating the creative problem-solving
processes, a questionnaire consisting of 23
items was utilized, thereby yielding self-evalua-
tive data concerning the students’ success as
regards the conceptualization and evaluation of
ideas, as well as on their success with creative
problem solving. The items were formulated on
the basis of theoretical ideas about features of
creative problem-solving processes presented in
the theoretical framework of this article. For
each Likert-type item, there were five alterna-
tives, varying from strongly disagree (1) to
strongly agree (5). The questionnaire included
some items about the students’ background as
well as items about their motivation and general
success during the teaching experiment.
The items were located randomly in the
questionnaire, which was accessible over the
Internet, and the students were asked to fill in
the forms after the last meeting. Eighty-five stu-
dents out of the 118 students who participated
in the project answered the questionnaire. A pre-
liminary item analysis based on item-to-item
correlations and item-to-total score correlations
led to the elimination of four of the question-
naire items. For example, the item I learned to
support the self-respect of other students only
had a 0.15 correlation to the total score and was,
therefore, rejected from the final analysis. It is
obvious that the students must have misunder-
stood the rejected items or that the items were
ambiguous. On the other hand, it is also possible
that the students did not agree with the rejected
items. The internal reliability of the remaining
19 items was high (Cronbach alpha = .89).
An exploratory factor analysis was used to
reduce the large number of original variables to
a smaller number of factors and to examine how
the problem-solving process was experienced by
the students. The Kaiser-Meyer-Olkin measure
was within a very reasonable range; KMO = .80
(Norusis, 1988). Barlett’s test of sphericity also
supported the use of a factor analytic approach
(Bartlett’s test = 845.9, p < .00001).
Results The questionnaire data were analyzed with
the SPSS program, utilizing principal axis fac-
toring as the extraction method and varimax
with Kaiser normalization as the rotation
method. This method was used to determine
how students experienced the key factors in
their creative problem-solving processes. The
exact number of factors was determined by
means of Cattell’s scree-test. The comprehensi-
bility criteria were also used, and the number
of factors was limited to four, since the mean-
ing of the factors was then readily comprehen-
sible (Dunteman, 1989). To determine the
internal consistency of each factor, a Cronbach
alpha coefficient, based on the average
interitem correlation, was determined for each
factor. The Cronbach alpha coefficients of the
factors varied between 0.83 and 0.88. Each
factor, therefore, measured one quality and,
thus, a meaningful interpretation of the factors
was possible. On the other hand, no far-reach-
111

Th
e J
ou
rna
l o
f Te
ch
no
log
y S
tud
ies
ing generalizations were allowed regarding the
structure or properties of the problem-solving
processes. The factor analysis simply made it
easier for us to describe how these 85 students
experienced creative problem-solving process-
es during the CTEP.
On an aggregate level, these four factors
explained 57.2% of the common variance, with
eigenvalues of 6.19, 2.14, 1.42, and 1.13, and
percentages of total variance of 32.57%,
11.26%, 7.46%, and 5.96%, respectively. The
communality, 57.2%, indicated that four factors
could be used satisfactorily as predictors for all
19 variables. Moreover, the extent to which each
item played a role in the interpretation of the
factors was high. The eigenvalues indicated that
Factor 1 covered most of the variance, and the
other factors each contributed about the same
amount to the explanation of the variances.
Each of the four factors indicating the stu-
dents’ perspectives regarding problem-solving
processes and variables (items) that described
the highest loading on each factor are presented
in Table 1. Three items also had loadings over
0.30 on other than their main factors, and these
are commented upon below. The factors were
labeled on the basis of researcher discussion on
variables (items) loading on a factor. The means
and standard deviations of each item are also
presented in Table 1.
Factor 1, success in problem-solving
processes, explained 32.5% of the total variance
and included seven items. The first two items
(F1-I1 and F1-I2) loading on this factor are con-
nected to the problem-solving processes.
Recognizing problems in one’s surroundings
(F1-I6) and restricting a problem (F1-I7) belong
to the first phase of the process and are, there-
fore, a natural starting point for the problem-
solving process. The creative atmosphere that is
indicated in items F1-I5 and F1-I3 is necessary
to establish a creative problem-solving process,
but it is not sufficient to ensure that one can be
launched. Another prerequisite for success
would be knowledge about ideation techniques
and ideation skills. These perspectives to prob-
lem-solving processes are indicated in items F1-
I3 and F1-I4, which describe perspectives for
ideation, but they do not tell how students suc-
ceeded in generating alternatives or about the
quality of their ideation. On the other hand,
these items also had high loadings (0.47 and
0.43) to the second factor dealing with the stu-
dents’ success in ideation.
Factor 2, productive ideation, consisting of
six items, explained 11.3% of the variance indi-
cating students’ opinion about their ideation
skills. Two items (F2-I1 and F2-I4) indicate the
quality of the ideas. It is important that ideas
generated during a creative process are
originalØotherwise one should label the process
as routine. It is also important that the students
learn to combine and develop others’ ideas fur-
ther. The key issue for success in creative
processes is how the creative power of the group
can be utilized in finding fresh ideas. The num-
ber of ideas (F2-I2, F2-I5) is also connected to
their quality. It is known that in the beginning of
an ideation session common, familiar ideas typi-
cally come to mind. Therefore, if there are many
ideas in the group, at least some of them will be
of high quality. It is important to use creativity
(F2-I6) and to be both intuitive and systematic
in turn (F2-I3) during the process of ideation.
Item F2-I6 also had a high loading (0.40) on the
fourth factor, which in this case dealt with posi-
tive attitude.
Factor 3, collaborative support and evalua-
tion, consisting of four items, explained 7.5% of
the variance. Items F3-I1 and F3-I4 indicate that
students learned to express their feedback posi-
tively and constructively. The two remaining
items (F3-I2, F3-I3) deal with positive attitudes
when evaluating ideas.
The remaining two statements loaded on
Factor 4, positive attitude, explained 6.0% of the
variance. Item F4-I1 indicates that students
behaved positively, and the other item (F4-I2)
deals with a positive attitude as regards the cre-
ative process.
Means of the first two items loading on
Factor F1 were 3.6 and 3.7. Thus, most students
thought that they had learned about the nature
of creative processes and how to work according
to the principles of creative processes as well.
This is what was expected, since these topics
were emphasized during both the lecture and the
112

Th
e J
ou
rna
l of Te
ch
no
log
y Stu
die
s
workshops. Much time was also spent on under-
standing the meanings of ideation and the evalu-
ation of ideas. Means of the items loading on
the second factor indicate that, according to the
self-evaluative data, the students had learned (at
least reasonably well) to generate alternatives.
Means of all items loading on the third factor
indicate that the students had, in their own opin-
ion, learned how to give positive and construc-
tive feedback regarding other students’ ideas.
One may also note that much was discussed as
regards how to give constructive feedback,
which was also practiced during the project.
Even the meaning and the value of such behav-
ior during creative processes were discussed.
The students were familiar, for example, with
how positive feedback defines what is valuable
in an idea presented by another student. Positive
feedback also indicates where or from which
direction possible solutions can be found.
Moreover, positive peer feedback is important
for the self-respect and confidence of other
students.
DiscussionBased on the identified factors, the means
and standard deviations of the self-evaluative
data on creative process skills, and the primary
school student teachers’ maps, it could be effec-
tively argued that the OMPS method helps stu-
dents understand the nature of creative processes
and, particularly, that there are different phases
involved in each of these processes. The mean
(3.7) of item F1-I7 indicates that the students
believed that they had learned to identify and
restrict a problem. This is one of the most impor-
tant phases in problem solving (Sapp, 1997).
Factors 2 and 3 indicate that the students
believed that they had succeeded in generating
alternatives and, in particular, to evaluate and
appreciate others’ ideas. This means that the stu-
dents felt that they had learned to give positive
feedback regarding other students’ ideas, to rec-
ognize the advantages of those ideas, and even to
develop them further. It is obvious that a formal
method in which each idea has to be backed up
by the presentation of at least three reasons for
its adoption is necessary for success. Such evalu-
ation creates a nonjudgmental positive atmos-
phere for creativity, and it helps to behave posi-
tively as indicated in Factor 4.
On the other hand, the number of approaches
(M = 3.4) and ideas (M = 3.3) generated during
113
Table 1. Means and Standard Deviations and Varimax, with Kaiser NormalizationRotated Factor Loadings for Principal Axis Factoring, Calculated for the ItemsMeasuring Primary School Student Teachers’ Opinions About the CreativeProcess in the Project

Th
e J
ou
rna
l o
f Te
ch
no
log
y S
tud
ies
the ideation phase was comparatively low. This
was reflected by the students’ opinion on the
item I learned to generate original and new
ideas. The mean of this item (3.4) was one of
the lowest. Furthermore, the students felt that
they did not learn enough about the generation
of many original and new alternatives. Those
skills are important when extremely new alter-
natives are wanted (Amabile, 1996). From the
point of view of similar projects, it is important
to observe that more efficient guidance in gen-
erating alternatives is needed. Students should
be carefully introduced to techniques that can be
used for generating numerous alternatives
because the best way to get good ideas is to
have plenty to choose from. It can be concluded
that the outcomes of creative problem-solving
activities depend on the creative processes as
well as ideation techniques learned and applied
(Smith, 1998).
The items measuring the students’ success
in the ideation and evaluation of ideas loaded on
different factors. This result means that the stu-
dents succeeded in separating those aspects
when evaluating their problem solving. Both
abilities (ideation and the evaluation of ideas)
are essential for creative problem solving as
well as the ability to segregate them. The ways
in which the human mind works when creating
new ideas can be argued. As de Bono (1970)
emphasized, critical thinking is needed when
one is evaluating ideas and in the open creative
thinking that is required to generate alternatives.
In summary, this case study indicates that
creative problem-solving approaches may be
efficiently used to improve teacher education.
On the other hand, students must be encouraged
to create many possible solutions to problems
and then to select the best ones. Furthermore,
students should receive a thorough introduction
to creative problem solving in general (Williams
& Williams, 1997). Such training could be ben-
eficial because many students in our study
became anxious when no formula existed or no
direct guidance was given to their work. In addi-
tion, the recognition of facts connected to the
background of the problem proved to be impor-
tant in this study. Thus, it is essential for the
creative process that students have relevant
information available.
Dr. Jari Lavonen is a senior lecturer and
docent in science and technology education at
the University of Helsinki and the president of
the Finnish Mathematics and Science Education
Research Association.
Dr. Ossi Autio is a professor in Skill and
Arts Education at the University of Helsinki.
Dr. Veijo Meisalo is a professor of peda-
gogy of mathematical sciences and the head of
the Department of Teacher Education at the
University of Helsinki.
114
References
Alamäki, A. (2000). Current trends in technology education in Finland. Journal of Technology Studies,26(1), 19–23. (Retrieved from: http://scholar.lib.vt.edu/ejournals/JTS/Winter-Spring-2000/alamaki.html)
Amabile, T. M. (1996). Creativity in context. Boulder, CO: Westview Press.
Custer, R. L. (Ed.). (1994). Performance based education: Technology activity modules. Columbia:University of Missouri, Instructional Materials Laboratory. (ERIC Document ReproductionService No. ED379460)
de Bono, E. (1970). Lateral thinking; Creativity step by step. New York: Harper & Row.
De Luca, V. W. (1993). Survey of technology education problem-solving activities. The Technology Teacher, 51(5), 26–30.
Dooley, C. (1997). Problem-centered learning experiences: Exploring past, present and futureperspectives. Roeper Review, 19(4), 192–196.
Dunteman, G. H. (1989). Principal components analysis (Quantitative Applications in the SocialSciences, No. 69). Thousand Oaks, CA: Sage.
Elmer, R., & Davies, T. (2000). Modelling and creativity in design and technology education.In J. Gilbert & C. Boulter (Eds.), Developing models in science education (pp. 137–156).Dodrecht, The Netherlands: Kluwer.
Fisher, R. (1990). Teaching children to think. Oxford, United Kingdom: Basil Blackwell.
Gilbert, J., & Boulter, C. (2000). Developing models in science education. Dodrecht, TheNetherlands: Kluwer.

Th
e J
ou
rna
l of Te
ch
no
log
y Stu
die
s
115
Grabinger, R. S. (1996). Rich environments for active learning. In R. Jonassen (Ed.), Handbook ofresearch for educational communications and technology: A project of the Association forEducational Communications and Technology (pp. 665–691). London: Prentice Hall.
Hennessy, S., & Murphy, P. (1999). The potential for collaborative problem solving in design andtechnology. International Journal of Technology and Design Education, 9(1), 1–36.
Higgins, J. M. (1994). Creative problem solving techniques: The handbook of new ideas for business.Winter Park, FL: New Management.
Hill, J. R. (1999). Teaching technology: Implementing a problem-centered, activity-based approach.Journal of Research on Computing in Education, 31(3), 261–280.
Johnsey, R. (1995). The design process: Does it exist? A critical review of published models for thedesign process in England and Wales. International Journal of Technology and Design Education,5, 199–217.
Kimbell, R. (1997). Assessing technology: International trends in curriculum and assessment.Buckingham, United Kingdom: Open University.
Lavonen, J. M., & Meisalo, V. P. (2001). Luovan ongelmanratkaisun työtavat [Models of teaching increative problem solving]. Retrieved February 10, 2002, fromhttp://www.malux.edu.helsinki.fi/kirjasto/lor/
Lee, L.-S. S. (1996, March). Problem-solving as intent and content of technology education. Paperpresented at the annual meeting of the International Technology Education Association, Phoenix,AZ. (Eric Document Reproduction Service No. ED391959)
Norusis, M. J. (1988). SPSS/PC + advanced statistics (V2.0). Chicago: SPSS.
Parker, G. M. (1991). Team players and teamwork: The competitive business strategy. San Francisco:Jossey-Bass.
Resnick, L. (1986). Learning in school and out. Educational Researcher, 16(9), 13–20.
Richey, R. C., & Nelson, A. N. (1996). Developmental research. In R. Jonassen (Ed.), Handbook ofresearch for educational communications and technology: A project of the Association forEducational Communications and Technology (pp. 1213–1245). London: Prentice Hall.
Sapp, D. D. (1997). Problem parameters and problem finding in art education. Journal of Creative Behaviour, 31(4), 282–298.
Sellwood, P. A. (1991). The investigative learning process. Journal of Design & Technology Teaching,24(1), 4–12.
Sinn, J. W. (1996). Building a model for technology studies. Journal of Technology Studies, 22(1),58–59. (Retrieved from: http://scholar.lib.vt.edu/ejournals/JTS/Summer-Fall-1996/PDF/8-sinn-article.pdf
Smith, G. (1998). Idea generation techniques: A formulary of active ingredients. Journal of CreativeBehaviour, 32(2), 107–133.
Stenhouse, L. (1985). Case study methods. In T. Husen & N. T. Postlethwaite (Eds.), The internationalencyclopaedia of educational research and studies (pp. 645–650). Oxford, United Kingdom:Pergamon.
Welch M., & Lim, H. S. (2000). The strategic thinking of novice designers: Discontinuity betweentheory and practice. Journal of Technology Studies 26(2), 34–44.Retrieved from: http://scholar.lib.vt.edu/ejournals/JTS/Summer-Fall-2000/welch.html
Whitty, G., & Willmott, E. (1991). Competence-based teacher education: Approaches and issues.Cambridge Journal of Education, 21(3), 309–319.
Williams, A., & Williams, J. (1997). Problem based learning: An appropriate methodology fortechnology education. Research in Science & Technological Education, 15(1), 91–103.
Wu, T.-F., Custer, R. L., & Dyrenfurth, M. J. (1996). Technological and personal problem solvingstyles: Is there a difference? Journal of Technology Education, 7(2), 55–71. Retrieved from:http://scholar.lib.vt.edu/ejournals/JTE/v7n2/wu.jte-v7n2.html

Theoretical FrameworkPractical arts is a subject that not only pro-
motes learners’ better understanding of work in
their daily lives, but also enables them to find
ways to solve work-related problems by foster-
ing basic skills and attitudes necessary for per-
forming the work (Ministry of Education,
1993). That is why the Ministry of Education in
Korea (1993) identified the practical arts subject
as a “practical living” subject, a “creative prob-
lem-solving subject,” and an “integrated knowl-
edge subject.” Moreover, practical arts educa-
tion in the aspect of its educational goal helps
develop students’ problem-solving and creative-
thinking skills. In the methodological aspect, it
also develops students’ self-efficacy by helping
them acquire daily living skills as well as the
joy of work experience and a sense of accom-
plishment through experiential learning based
on the work experience (Ministry of Education,
1993). That’s why the Ministry of Education
made the practical arts subject a required course
for the elementary education system in Korea.
The teaching of practical arts as a subject
should be focused on developing creativity and
self-efficacy by the active employment of scien-
tific thinking through the activity-centered deci-
sion-making process. Plus, the teaching of the
practical arts subject must be conducted accord-
ing to the problem-solving model (Kwak, 1988;
Seoul-Inchon Area Research Association of the
Practical Arts Education, 1995; Research
Association of the Practical Arts Education for
All Korea National Universities of Education,
1997). However, most elementary school teach-
ers in Korea have used the typical instruction
method (lecture) to teach students the practical
arts subject.
Choi (1997) suggested that practical arts
education should be performed based on work
experience activities by using problem-solving
methods since the assumption of a model for the
problem-solving method lies in the reflective
thinking process; learners by themselves try to
study creatively or reach conclusions compre-
hensively. And Kwak (1988) emphasized that
the topics of practical arts education need to be
taught by the problem-solving method while
considering the necessity of problem-solving
ability and creative thinking.
Na (1997) insisted that practical arts
instruction should signify learner-centered
instruction (i.e., learning by doing, using the
various methods such as investigation, discus-
sion, experiment, and work experience). While
considering what students learned in previous
instruction, then practical arts teachers could
Th
e J
ou
rna
l o
f Te
ch
no
log
y S
tud
ies
116The Effect of Problem-Solving Instruction on Children’sCreativity and Self-efficacy in the Teaching of thePractical Arts SubjectNamyong Chung and Gyoung-sug Ro
Type Male Female Total
Experimental 17 16 33
Control 16 17 33Total 33 33 66
Table 1. The Sexual Distribution of Subjects in the Study
R1 (Problem-Solving Instruction Group) O1 X1 O2
R2 (Problem-Solving Instruction Group) O3 X2 O4
R1 : experimental group X1 : problem-solving instruction O1, O3 : pre-test
R2 : comparative group X2 : typical instruction O2, O4 : post-test
Figure 1. Quasi-experiment design.

Th
e J
ou
rna
l of Te
ch
no
log
y Stu
die
s
apply the content of the subject in the real situa-
tion by giving a sense of accomplishment as
well as self-efficacy. Na added that in particular
there should be priority in the student-centered
problem-solving instruction so that creativity
and self-efficacy could be developed.
But there exists a remarkable difference
between the reality in educational fields and the
researchers’ insistence based on the result of the
studies on problem-solving ability, creative
thinking, and self-efficacy as shown in the above
studies. In other words, creativity education as
specified in the characteristics and goals of prac-
tical arts education has not been conducted prop-
erly, not to mention the lack of the establishment
of a theoretical foundation for creativity educa-
tion in the practical arts. However, Chung
(1997) provided the theoretical foundation of
creativity education in practical arts by analyzing
the factors of creativity and their relation to the
content of the practical arts subject and present-
ing the factors of the representative learning con-
tent for practical arts in each grade.
Hence, this study has two significant
points: one is the examination of the effects on
children’s creativity and self-efficacy by apply-
ing problem-solving instruction in practical arts
education, and the other is the implementation
of the first study in Korea on problem-solving,
creativity, and self-efficacy with the potential
for further research.
The purpose of this study was to examine
the effects on children’s creativity and self-effi-
cacy by applying problem-solving instruction in
practical arts education and to show how this is
reflected in the literature of problem-solving
learning. The following delineations are the
specific objectives used to achieve this purpose:
1. Identify the effects of problem-solving
instruction on the development of chil-
dren’s creativity.
2. Identify the effects of problem-solving
instruction on the children’s self-efficacy.
Subjects for StudyFor the subjects of this study, two out of
seventhird grade classes at H Elementary
School in the city of Pohang, Kyungsanpook-do,
Korea, studying practical arts as required in all
Korean elementary schools were chosen as the
experimental and comparative classes. The
experimental group received problem-solving
instruction for two hours a week, and the con-
117Table 2. Creativity Measurement Factors and the Test Content
Factors Time Test Content
Fluency 3 min As many imaginary words as possible to a given word should be written downwithin the time limit.
Flexibility 3 min Many things which can be expressed in number in everyday life should bewritten down in number within the time limit.
Originality 4 minBy using the given vertical line, a student is required to draw a certain shape,and put down its name below it. The score is given only when the shape isunique. The drawing is graded according to the content of the shape.
Problem-Solving Instruction Typical Instruction
Step1 MotivationIntroduction Recalling the previous learning
Step2 Group objectives
Step3 Confirmation of problems to solveDevelopment Teacher-centered development
of the current lessonStep4 Problem-solving
Step5 Test of solutions through applicationConsolidation Consolidating the current lesson
Step6 Evaluation of the solutions
Table 3. Comparison Between Problem-Solving Instruction and Typical Instruction

Th
e J
ou
rna
l o
f Te
ch
no
log
y S
tud
ies
trol group received typical instruction without
emphasis on problem solving with all other fac-
tors being constant. The duration of the study
was five weeks from May to June of 1999. The
demographic information on the participating
students is presented in Table 1.
Research DesignThis study shows the progress of creativity
and self-efficacy in the experimental and control
groups after the experimental group received
problem-solving instruction and the control
group received typical instruction (i.e., without
the problem-solving emphasis). Thus, the inde-
pendent variables in this study were, as instruc-
tional methods, problem-solving instruction (for
the experimental class) and typical instruction
with no problem-solving component (for the
control class). The dependent variables were the
post-test scores of the creativity and self-efficacy
tests. Figure 1, a diagram of the experimental
design, examines the assumptions of the study.
InstrumentationThe existing creativity test instruments were
not fit for the subjects and purpose of this study
since the instrument was made primarily for the
target of upper grade students. Recently, for the
third grade students, the Korea Creativity
Research Institute (1998) developed the
Creativity and Thinking Test with subareas for
fluency, flexibility, and originality. The reliability
of the creativity test was 0.93. The measurement
factors and the test content are shown in Table 2.
The Self-Efficacy Test instrument was
employed to measure the general level of self-
efficacy on learning. In this study, the revised
self-efficacy test from Sherer and Adams’
(1983) questionnaire and Chung’s (1987)
questionnaire were employed (Cronbach
alpha = 0.824).
ProcedureHomogeneity Test
In order to show the homogeneity between
the experimental class and the control class, a
pre-test was given to 246 students from seven
third grade classes on Monday, April 26, 1999
(i.e., two weeks before the experiment). After
the pre-test, two classes were chosen that
showed little difference in the test, meaning
118Table 4. A Form for Problem-Solving Instruction
I. Unit and ThemeII. Analysis of the Actual StateIII. Instructional ObjectivesIV. Procedure of Teaching
1. Motivation2. Expected Objectives of the Student Group3. Expected Problems4. Plan for Solving Each Problem
Problem 1: ¨ method ≠ data Æ summaryProblem 2, 3, 4, ... problem N
V. Application of LearningVI. Reference and Teaching AidsVII. Procedure of Assessment
Table 5. The Results of the Creativity Pre-Tests
Subarea Class n M SD df t value
Frequency ControlExperimental
3333
5.155.97
2.153.37 64 1.18
Flexibility ControlExperimental
3333
3.643.52
3.512.24 64 - 0.18
Originality ControlExperimental
3333
10.3611.70
5.286.94 64 0.88
Total(Creativity)
ControlExperimental
3333
19.7521.18
8.039.38 64 0.92

those two classes were not different in the
aspect of students’ creativity and self-efficacy.
For the necessary time of the test, 30 minutes
was allotted to the pre-test in considering the
degree of students’ attention and the range of
the questionnaire. The post-test was adminis-
tered in three weeks on July 5, 1999, after the
experimental treatment (five weeks in total from
May 10 to June 12, 1999). The test methodolo-
gy and the time allotted for the post-test was
equal to those of the pre-test.
Experiment Treatment
For the experimental treatment, the practi-
cal arts subject teaching plans with the problem-
solving instruction component and the typical
instruction method without such a component
were approved by a preliminary examination of
leading educators and elementary school teach-
ers with expertise in the area. These two types
of teaching plans are presented in Table 3.
Procedure of the Experiment
The teacher of the control class, who had
almost equal educational experience in compari-
son with the teacher of the experimental class
(researcher), clearly perceived the difference
between problem-solving instruction and typical
instruction. The control class teacher was asked
to conduct the instruction to the complete ful-
fillment of the constituent principle of each
aspect of instruction.
The following control conditions were
enforced to ensure the effects of this experiment:
1. Qualitative control: the instruction of the
experimental class was implemented by the
researcher
2. Quantitative control: two classes were
equally conditioned in the progression of
the instructional period and learning
3. Methodological control: the problem-
solving instruction was implemented in the
experimental class while the typical
instruction was implemented in the
control class
4. Content control: although the instructional
style for the class was different, the con-
tent-instruction was equal.
Analysis of DataThis study aimed to investigate whether or
not there was a meaningful difference in the
degree of students’ creativity and self-efficacy
between an experimental group with problem-
solving instruction and a comparative group
Th
e J
ou
rna
l of Te
ch
no
log
y Stu
die
s
119
Table 6. The Results of the Self-Efficacy Pre-Tests
Type n M SD df t value
Control Experimental 3333
80.5285.52
17.6114.13 64 1.27
Table 7. Comparison of the Pre-Test and Post-Test Results in the Creativity of the Control Class
Subarea Test n M SD df t value
Frequency Pre-testPost-test
3333
5.158.76
2.153.36 32 6.84**
Flexibility Pre-testPost-test
3333
3.644.85
3.512.17 32 2.49*
Originality Pre-testPost-test
3333
10.3610.36
5.285.28 32 -
Total(Creativity)
Pre-testPost-test
3333
19.7523.97
8.036.69 32 6.94**
*p < .05. **p < .01.
Table 8. Comparison of the Pre-Test and Post-Test Results for Self-Efficacy in the Control Class
Type n M SD df t valuePre-testPost-test
3333
85.5280.52
14.1311.92 32 - 2.44*
*p < .05.
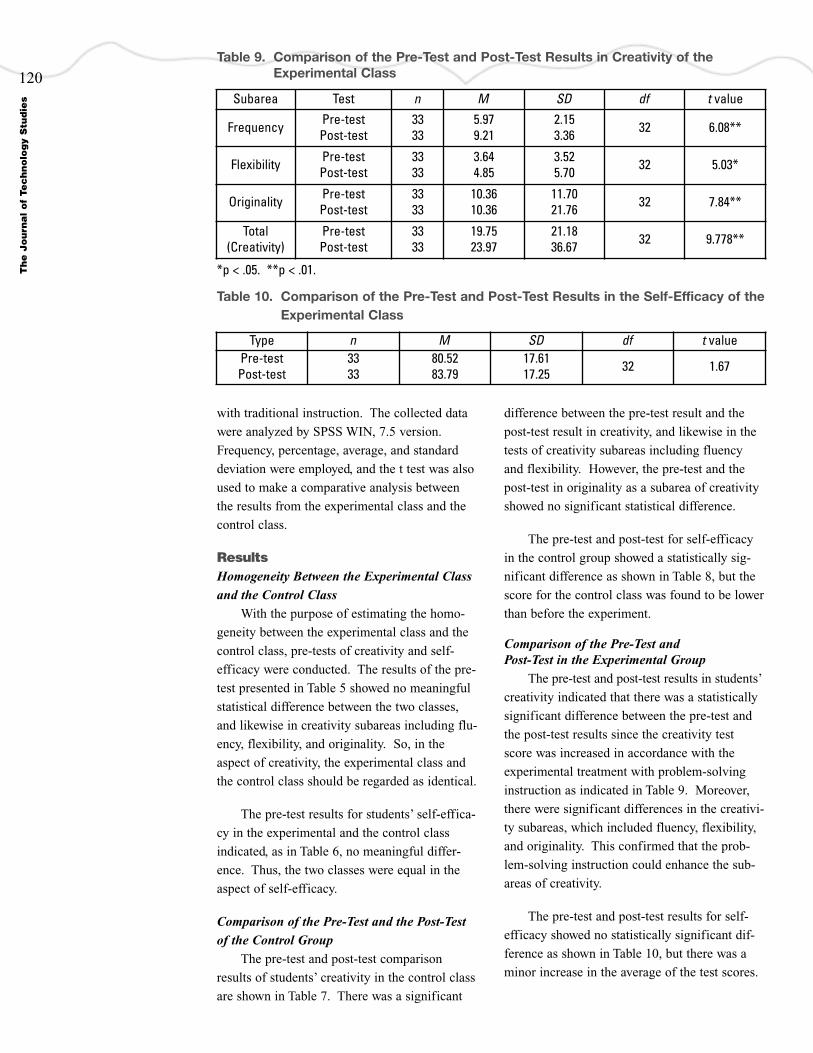
Th
e J
ou
rna
l o
f Te
ch
no
log
y S
tud
ies
with traditional instruction. The collected data
were analyzed by SPSS WIN, 7.5 version.
Frequency, percentage, average, and standard
deviation were employed, and the t test was also
used to make a comparative analysis between
the results from the experimental class and the
control class.
ResultsHomogeneity Between the Experimental Class
and the Control Class
With the purpose of estimating the homo-
geneity between the experimental class and the
control class, pre-tests of creativity and self-
efficacy were conducted. The results of the pre-
test presented in Table 5 showed no meaningful
statistical difference between the two classes,
and likewise in creativity subareas including flu-
ency, flexibility, and originality. So, in the
aspect of creativity, the experimental class and
the control class should be regarded as identical.
The pre-test results for students’ self-effica-
cy in the experimental and the control class
indicated, as in Table 6, no meaningful differ-
ence. Thus, the two classes were equal in the
aspect of self-efficacy.
Comparison of the Pre-Test and the Post-Test
of the Control Group
The pre-test and post-test comparison
results of students’ creativity in the control class
are shown in Table 7. There was a significant
difference between the pre-test result and the
post-test result in creativity, and likewise in the
tests of creativity subareas including fluency
and flexibility. However, the pre-test and the
post-test in originality as a subarea of creativity
showed no significant statistical difference.
The pre-test and post-test for self-efficacy
in the control group showed a statistically sig-
nificant difference as shown in Table 8, but the
score for the control class was found to be lower
than before the experiment.
Comparison of the Pre-Test and Post-Test in the Experimental Group
The pre-test and post-test results in students’
creativity indicated that there was a statistically
significant difference between the pre-test and
the post-test results since the creativity test
score was increased in accordance with the
experimental treatment with problem-solving
instruction as indicated in Table 9. Moreover,
there were significant differences in the creativi-
ty subareas, which included fluency, flexibility,
and originality. This confirmed that the prob-
lem-solving instruction could enhance the sub-
areas of creativity.
The pre-test and post-test results for self-
efficacy showed no statistically significant dif-
ference as shown in Table 10, but there was a
minor increase in the average of the test scores.
120Table 9. Comparison of the Pre-Test and Post-Test Results in Creativity of the
Experimental Class
Subarea Test n M SD df t value
Frequency Pre-testPost-test
3333
5.979.21
2.153.36 32 6.08**
Flexibility Pre-testPost-test
3333
3.644.85
3.525.70 32 5.03*
Originality Pre-testPost-test
3333
10.3610.36
11.7021.76 32 7.84**
Total(Creativity)
Pre-testPost-test
3333
19.7523.97
21.1836.67 32 9.778**
*p < .05. **p < .01.
Table 10. Comparison of the Pre-Test and Post-Test Results in the Self-Efficacy of theExperimental Class
Type n M SD df t valuePre-testPost-test
3333
80.5283.79
17.6117.25 32 1.67

Comparison Between the Post-Test Results in
the Control Class and the Experimental Class
The result of the post-test for students’ cre-
ativity showed that there was a statistically sig-
nificant difference between the control class and
the experimental class as indicated in Table 11.
In the creativity subareas, the aspects of fluency
and flexibility showed no statistical significant
difference between the two classes, but in the
aspect of originality, a significant difference
between the two groups was demonstrated. For
this reason, the problem-solving instruction
could be said to have more impact on the
advancement of creativity than in the case of
traditional instruction.
Although the post-tests for self-efficacy in
the control group and the experimental group
showed no statistically significant difference as
shown in Table 12, the comparison of average
scores on the post-tests for students’ self-effica-
cy indicated higher scores in the experimental
class than in the control class.
Conclusions and DiscussionThe findings reflect several significant dif-
ferences between the typical instruction group
and the group with the problem-solving compo-
nent. From the findings, the following conclu-
sions can be drawn:
1. The problem-solving instruction showed a
marked effect on originality, whereas the
other creativity subareas, including fluency
and flexibility, showed just a slightly higher
average not large enough to be statistically
significant. The reason for not showing a
statistically significant difference in fluen-
cy and flexibility might be the short period
of the experiment’s duration. Therefore,
using problem-solving instruction in the
long term can also have an effect on other
subareas of creativity.
2. The problem-solving instruction within the
context of practical arts class showed no
statistically significant difference in stu-
dents’ self-efficacy, but the experimental
class got a higher average score on the
post-test. This might also be caused by the
short period of the experiment’s duration.
3. In the traditional instruction without the
problem-solving component, students’ self-
efficacy was significantly lowered after the
instruction period. This result could have
been caused by (a) the short-term experi-
ment or (b) the control group teacher who
used a bad teaching skill. However, this
result still indicates that typical instruction
can be an obstacle in the development of
children’s self-efficacy.
All the details above indicate that the prob-
lem-solving instruction for elementary school
children is related to the teaching-learning
process in promoting children’s creativity.
Th
e J
ou
rna
l of Te
ch
no
log
y Stu
die
s
121Table 11. Comparison of the Post-Test Results in Creativity in the Control Class and
the Experimental Class
Subarea Test n M SD df t value
Frequency Pre-testPost-test
3333
8.769.21
3.364.62 64 0.46
Flexibility Pre-testPost-test
3333
4.855.70
2.173.18 64 1.27
Originality Pre-testPost-test
3333
10.3621.76
5.288.92 64 6.31**
Total(Creativity)
Pre-testPost-test
3333
23.9736.67
6.6912.83 64 5.04**
**p < .01.
Table 12. Comparison of the Post-Test Results for Students’ Self-Efficacy in theControl Class and the Experimental Class
Type n M SD df t valuePre-testPost-test
3333
80.0683.79
11.9217.25 64 1.02

Th
e J
ou
rna
l o
f Te
ch
no
log
y S
tud
ies
122
However, previous research on the effect of prob-
lem-solving instruction has suggested that it is
difficult to draw a general conclusion that one
process of instruction is always more effective
than others. This is why one kind of teaching-
learning process does not necessarily or consis-
tently work better than others. Moreover, change
in self-efficacy during the short term is hard to
assess. Thus, only after the steady use of prob-
lem-solving instruction can a positive change in
children’s self-efficacy likely be noted.
RecommendationsThe following recommendations are based
on the findings and conclusions of this study:
1. Research on various methods to develop
creativity and the development of an
instructional model and learning materials
are needed.
2. The positive effect of problem-solving
instruction can be expected in subjects other
than practical arts if problem-solving
instruction is employed. Therefore, the
experimental study of problem-solving
instruction compared with traditional non-
problem-solving instruction is suggested.
3. Long-term study of the promotion of cre-
ativity and development of curricula con-
necting elementary and secondary educa-
tion is recommended.
4. This study has significance in the point that
there was an attempt to promote creativity
by using problem-solving instruction in the
teaching of practical arts and that this study
can be utilized in other subjects as well.
The theories and research with positive
results for children are not supposed to be
directly used without any pre-examination or
regard of the students (subjects). Instead, there
should be an understanding of children’s abili-
ties and verification of the effects of theories
and methods suitable for children by carefully
examining them prior to implementation.
Dr. Namyong Chung is an assistant profes-
sor in the Department of Practical Arts
Education at the Daegu National University of
Education, South Korea. He is member-at-large
of Epsilon Pi Tau.
Gyoung-sug Ro is a teacher at Pohang
Honghae Elementary School, South Korea.
References
Choi, Y. H. (1997). Inquiry of practical arts education. Seoul, Korea: Hyungseol.
Chung, M. K. (1997). Practical arts subject teaching plans for the development of elementary schoolstudents’ creativity. Bulletin of Practical Arts Education Society of Korea, 10(2), 1-12.
Chung, T. H. (1987). Study of motivational factors of learning hour input in instruction and subjectanalysis. Unpublished doctoral dissertation, Graduate School of Korea University.
Korea Creativity Research Institute. (1998). Creativity and thinking faculty test. Seoul, Korea: Lee,Gi-Woo
Kwak, S. M. (1988). Practical arts education. Seoul, Korea: Kabeul.
Ministry of Education. (1993). Curriculum explanation III. Seoul, Korea: Daehan Textbook.
Na, S. I. (1997). Application methods of the problem-solving method on the practical arts subjectfor elementary school education. Proceedings for the Seminar for ’97 Elementary Practical ArtsEducation.
Research Association of the Practical Arts Education for All Korea National Universities of Education.(1997). Practical arts education. Seoul, Korea: Educational Science Publisher.
Seoul-Inchon Area Research Association of the Practical Arts Education. (1995). Practical artseducation. Seoul, Korea: Educational Science Publisher.
Sherer, M., & Adams, C. (1982). The self-efficacy scale: A construct validity study. Paper presentedat the annual meeting of the Southeastern Psychological Association, Atlanta, GA.
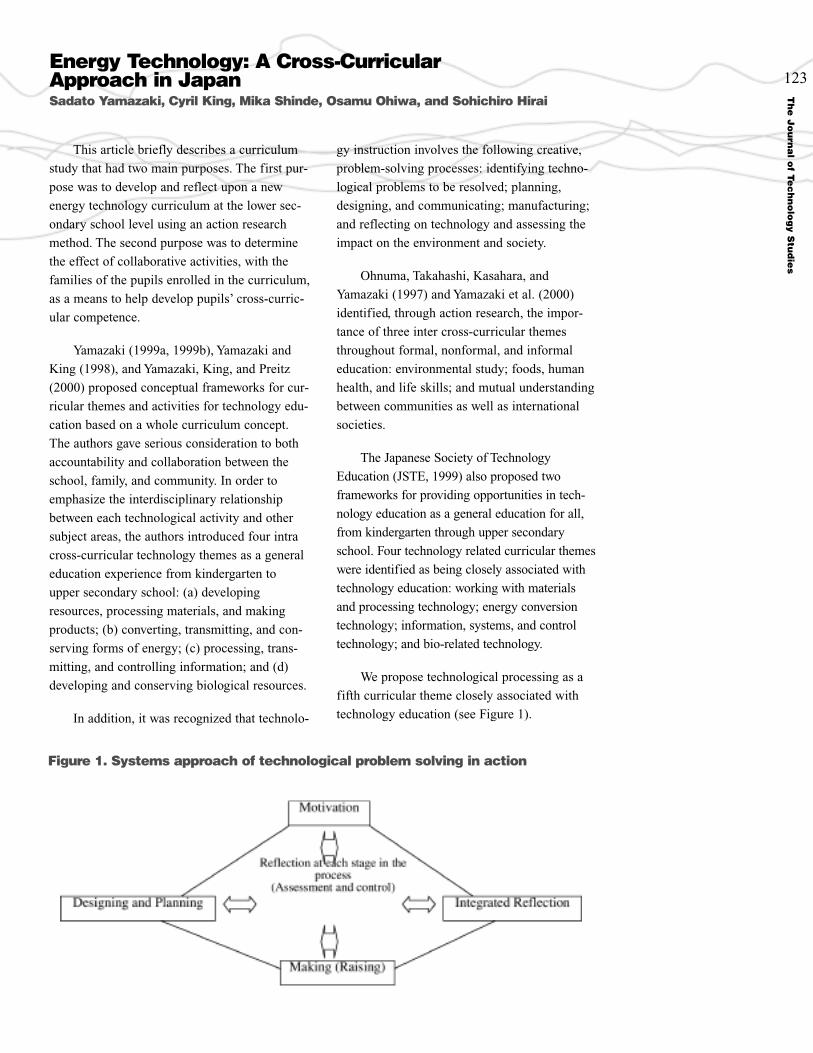
Th
e J
ou
rna
l of Te
ch
no
log
y Stu
die
s
123
This article briefly describes a curriculum
study that had two main purposes. The first pur-
pose was to develop and reflect upon a new
energy technology curriculum at the lower sec-
ondary school level using an action research
method. The second purpose was to determine
the effect of collaborative activities, with the
families of the pupils enrolled in the curriculum,
as a means to help develop pupils’ cross-curric-
ular competence.
Yamazaki (1999a, 1999b), Yamazaki and
King (1998), and Yamazaki, King, and Preitz
(2000) proposed conceptual frameworks for cur-
ricular themes and activities for technology edu-
cation based on a whole curriculum concept.
The authors gave serious consideration to both
accountability and collaboration between the
school, family, and community. In order to
emphasize the interdisciplinary relationship
between each technological activity and other
subject areas, the authors introduced four intra
cross-curricular technology themes as a general
education experience from kindergarten to
upper secondary school: (a) developing
resources, processing materials, and making
products; (b) converting, transmitting, and con-
serving forms of energy; (c) processing, trans-
mitting, and controlling information; and (d)
developing and conserving biological resources.
In addition, it was recognized that technolo-
gy instruction involves the following creative,
problem-solving processes: identifying techno-
logical problems to be resolved; planning,
designing, and communicating; manufacturing;
and reflecting on technology and assessing the
impact on the environment and society.
Ohnuma, Takahashi, Kasahara, and
Yamazaki (1997) and Yamazaki et al. (2000)
identified, through action research, the impor-
tance of three inter cross-curricular themes
throughout formal, nonformal, and informal
education: environmental study; foods, human
health, and life skills; and mutual understanding
between communities as well as international
societies.
The Japanese Society of Technology
Education (JSTE, 1999) also proposed two
frameworks for providing opportunities in tech-
nology education as a general education for all,
from kindergarten through upper secondary
school. Four technology related curricular themes
were identified as being closely associated with
technology education: working with materials
and processing technology; energy conversion
technology; information, systems, and control
technology; and bio-related technology.
We propose technological processing as a
fifth curricular theme closely associated with
technology education (see Figure 1).
Energy Technology: A Cross-CurricularApproach in JapanSadato Yamazaki, Cyril King, Mika Shinde, Osamu Ohiwa, and Sohichiro Hirai
Figure 1. Systems approach of technological problem solving in action

Th
e J
ou
rna
l o
f Te
ch
no
log
y S
tud
ies
124
Table 2. The Results of ANOVA Analysis in Each Comparison Between Preand Post Self- Assessments
Table 1. Curriculum and Modules
Action Research The Niigata and Ibaraki Prefectural
Technology and Homemaking Teacher Research
Associations, which are members of the All
Japan Technology and Homemaking Teacher
Research Association, cooperated in this action
research. Teachers of the Naoetsu and
Chiyokawa Public Lower Secondary Schools
also collaborated in this study from 1996 to
1999. Naoetsu Lower Secondary School is locat-
ed on the west coast of Honshu, the Sea of Japan
side of the island. Chiyokawa Lower Secondary

Th
e J
ou
rna
l of Te
ch
no
log
y Stu
die
s
School is located in Ibaraki prefecture next to
Tokyo’s metropolitan district. Participants were
Grade 8 and 9 pupils who were enrolled in a
compulsory course in technology and home-
making. The analysis of data was based on two
Grade 8 classes in Naoetsu Lower Secondary
School.
Curriculum and ModulesThe curriculum and modules used within
this study are shown in Table 1. Since the
schools in this study were not authorized by the
Ministry of Education Science, Sports and
Culture of the Government of Japan as curricu-
lar experimental schools, the statutory course of
study for lower secondary schools issued in
1989 (Ministry of Education Science, Sports
and Culture, 1989) was adhered to in this study.
Accordingly, we developed a school-based cur-
riculum for use in the two schools.
As part of the study, we developed curricu-
lum content links between the lower secondary
school compulsory subject areas of technology
and homemaking, and science. The technology
and homemaking subject area requires pupils to
study woodworking and home living at Grade 7,
and electricity, food, and another three topics at
Grades 8 to 9.
Another key aspect of the study was the
production of portfolios of study by the pupils.
We proposed that the production and use of
these portfolios would help pupils develop com-
petence in both technological creative processes
and collaborative study.
Quantitative ApproachThis article reports on the quantitative and
qualitative studies undertaken in Term 1. In
order to investigate the effect of collaborative
study with the pupils’ families in the develop-
ment of the curriculum, a three (A x B x C) fac-
torial design research was carried out as part of
the main research from October to November
1998 (see Table 2).
Factor A compared a self-study group and a
collaborative study group with the pupils’ families.
Factor B compared higher, middle, and lower lev-
els of pupil achievement in technology education.
Factor C compared pre and post self-assessments.
Pupils were pre and post self-assessed by means
of a 6-point scale in each term.
Qualitative ApproachPupils’ descriptions and comments in their
portfolios of study, and interviews with some
pupils, were used as assessment devices.
Participants were also observed in order to col-
lect ethnographic data in real classroom situa-
tions. Pupils also had the opportunity to give
their written evaluations within two weeks of
finishing Term 1.
125
Figure 2. The average of self-assessment as compared with self-study and collaborative groups

Th
e J
ou
rna
l o
f Te
ch
no
log
y S
tud
ies
The Curriculum Approach’s EffectsStatistical Results
Because it is impossible to control experi-
mental circumstances in a general, real class-
room study, it is important to interpret and
apply the data on pupils’ pre assessment. The
technology teacher Ohiwa, one of the authors,
recognized that there were not large differences
in his pupils’ achievement, capability, and
motivation. However, the authors, including
the teacher, considered that there were some
different ethnographical contexts between each
class. Identifying the sociocultural context of
the classroom is important in undertaking
action research.
The results of the ANOVA analysis between
pre and post self-assessments is shown in Table
2. The data for Item 3 shows that the interaction
between A (self vs. collaborative study) x C (pre
vs. post) was significant. The main effect of
Factor B (a degree of achievement) has signifi-
cant tendency. The simple effect of Factor A was
significant. The simple effect of Factor C, with a
degree of error at each level, has significant ten-
dency. Therefore, the data highlights the effect of
collaborative study involving the family.
The average of self-assessment as com-
pared with self-study and collaborative groups
in Item 3 is shown in Figure 2.
Portfolios, Cases, and InterviewsItem 1 in Table 3 shows a significance
between self and collaborative study with the
family. In the class where pupils undertook the
collaborative study with their families, nine
pupils described electric power saving. It is
clear that the pupils also performed as a contact
person and link between the class and family.
Case Studies A comparison between pre and post self-
assessments in the case of Pupil W (female) is
shown in Table 4. She gained the highest scores
in Item 11 in the post self-assessment though
lowest in the pre self-assessment. In addition,
she produced a very good portfolio entitled “Are
My Home’s Plug Receptacles Really Safe?” As
part of her portfolio, she made an instruction
manual, in the form of a cartoon comic strip, on
how to safely use and manage electricity safely.
Data for Pupil F (female) are shown in Table
5. In her portfolio, she studied how handicapped
or aged people safely use electrical appliances. In
addition, she paid attention to how to use elec-
tricity, taking account of environmental preserva-
tion and prevention of disasters. In the interview
with her, she answered that her father was very
helpful in giving her useful information.
Table 6 shows a third case study involving
Pupil W (female). The topic in her portfolio
126
Table 3. Number of Pupils Who Commented in the Delayed Assessment onElectricity Study and How They Practiced in Real Life
Table 4. Data of Comparison Between Pre and Post Self-Assessment in Case ofPupil W (Female)

was how to economize in the use of electric
power. She investigated the methods of saving
in the use of electric power for household
lights, a refrigerator, televisions, a video play-
er, an air conditioner and its remote controller,
and a personal computer. She described the
dangers of putting too much load on one elec-
tric outlet. She also noted how to use instruc-
tion manuals on electrical appliances and how
they should be electrically grounded. In her
interview, she was pleased that she undertook a
beneficial collaborative study with her father
in her homework because he was employed by
an electricity company. The results show that
both intra and inter cross-curricular approach-
es, together with collaborative study with the
family, are very effective in developing trans-
disciplinary competence.
What We Believe the Study IndicatesIt is clear that the indigenous and school-
based cross-curricular approaches in energy
technology developed in this study are effective.
This study has shown some evidence of the
educational benefits of pupils’ collaborative
study with their families in energy technology.
The development of a portfolio is a very
efficient study method in helping pupils develop
cross-curricular competence.
Dr. Sadato Yamazaki is an associate professor
in the Department of Learning Support, Joetsu
University of Education, Japan. He is a member of
the Omicron Field chapter of Epsilon Pi Tau.
Cyril King is an advisor in the South
Eastern Education and Library Board, Belfast,
United Kingdom. He is a Member-at-large of
Epsilon Pi Tau.
Mika Shinde is a technology teacher in the
Kanazawa Lower Secondary School, Kanazawa,
Japan.
The late Osamu Ohiwa was a technology
teacher in the Naoetsu Lower Secondary
School, Joetsu, Japan.
Sohichiro Hirai is currently an inspector in
the Ibaraki Regional Committee of Education.
Th
e J
ou
rna
l of Te
ch
no
log
y Stu
die
s
127
Table 5. Data of Comparison Between Pre and Post Self-Assessment in Case of"Pupil F" (Female)
Table 6. Data of Comparison Between Pre and Post Self Assessment in Case ofPupil W (Female)
References
Japanese Society of Technology Education. (1999). Technology education toward 21st century:What is rational and social accountability of technology education. Journal of the JapaneseSociety of Technology Education, 41(3). (In Japanese)
Ministry of Education, Science, Sports and Culture in Japan. (1989). Course of study for lowersecondary schools in Japan. Tokyo: Printing Bureau, Ministry of Finance in Japan. (In Japanese)
Ohnuma, S., Takahashi, K., Kasahara, Y., & Yamazaki, S. (1997). Development and effect of theportfolio system for cooperative learning in technology education. Study of TechnologyEducation (Proceedings of Technology Education Division, the Japanese Society of TechnologyEducation), 3(1), 27-32. (In Japanese)

Th
e J
ou
rna
l o
f Te
ch
no
log
y S
tud
ies
Yamazaki, S. (1999a). A comparative study between U.K., Canada and Japan on the structure ofproblem solving with creative designing and making in technology education. In Proceedings ofthe International Conference on Integrated Thinking in Technology Education (pp. 83-102).Taitung: Taitung University of Education Press.
Yamazaki, S. (1999b). Development on subject matters for making pupils develop concepts of environment preservation in science and technology education (Final Reports on ResearchProject, Grant-in-Aid for Scientific Research, Encouragement of Young Scientists, Project No.09780181). Joetsu, Niigata: Nagata Press. (In Japanese with English Abstracts)
Yamazaki, S., & King, C. (1998). A comparative study of the structure and linkages betweenscience and society in technology curricula in the U.S.A.; UK; British Columbia, Canada; andJapan. In Abstracts of the International Conference on Conference on Science, Technology &Society (p. 113), Meguro, Tokyo: Tokyo Institute of Technology Press.
Yamazaki, S., King, C., & Preitz, C. H. (2000). Linkage between science, technology and period forintegrated study on aboriginal cultivation for sustainable development. In Proceedings of theSouth East Asian Regional Symposium on International Organization for Science and TechnologyEducation (pp. 56-68). Penang, Malaysia: Universiti Sains Malaysia Press.
128

Volume XXX, 2004No. 3 Summer 2004
A refereed publication of The International Honor Society for Professions in Technology.
Promoting Excellence in Preparation and Excellence in Practice

EditorDennis Cheek
Board of Editors
E. Stephanie AtkinsonUniversity of SunderlandSchool of EducationHammerton Hall, Gray Rd.Sunderland, U.K. [email protected]
Wan-Lee ChengDepartment of Design and IndustrySan Francisco State University1600 Holloway Ave.San Francisco, CA 94132415.338.2211fax: [email protected]
David Devier(representing the Board of Directors)
Michael J. DyrenfurthDepartment of Industrial TechnologyPurdue University1410 Knoy Hall, Room 461West Lafayette, IN 47907-1410765.496.1203fax: [email protected]
Marie KraskaEducational Foundations, Leadership,and TechnologyAuburn University4036 Haley CenterAuburn University, AL 36849-5221334.844.4460fax: [email protected]
Linda Rae Markert200 Poucher HallState University of New Yorkat OswegoOswego, NY [email protected]
Howard E. MiddletonSchool of Vocational Technologyand Arts EducationFaculty of EducationGriffith UniversityNathan 4111 QueenslandAustralia61.7.3875.5724fax: [email protected]
Sam C. ObiDepartment of TechnologySan Jose State UniversityOne Washington SquareSan Jose, CA 95192-0061408.924.3218fax: [email protected]
Christopher J. Shelley CMfgEW. L. Gore & Associates705 Guido Dr.Middletown, DE [email protected]
Xeushu SongDepartment of TechnologyNorthern Illinois UniversityDekalb, IL 60115-2854815.753.1349fax: [email protected]
Staff for this IssueEditorialConsultantsNancy HooseSeth A. Streichler
PublisherJerry Streichler
Office ManagerSusan Pickens
Art & LayoutKnape Designs
The Journal of Technology Studies (JTS) (ISSN 1071-6048) is the flagship, peer-reviewed journal of Epsilon Pi Tau, Inc., a nonprofit, academic and professional honorsociety. Headquarters and editorial offices are located at the Technology Building,Bowling Green State University, Bowling Green, OH 43403-0305. Use this address [email protected] for subscription matters or purchases.
Copyright 2004 by Epsilon Pi Tau, Inc.
The opinions expressed by the journal’s authors are not necessarily those of the Boardof Directors, staff, or members of Epsilon Pi Tau.
Two print issues per year are mailed to all members of the society and to academic andgeneral libraries around the globe. Issues that are published online only, the aforemen-tioned printed issues, and past issues are available free online at scholar.lib.vt.edu/ejour-nals/JTS.
The journal is currently indexed in: Current Index to Journals of Education (USA);International Bibliography of the Social Sciences (IBSS) (UK); and the InternationalVocational Education and Training and Research Database at http://www.ncver.edu.au(Australia).
Separate articles or complete issues are also available in a variety of media forms from:
ProQuest Information and Learning Co., P.O. Box 1346, Ann Arbor, MI 48106-1346
Or EBSCO Publishing, 10 Estes Street, Ipswich, MA 01938-0682, USA
The JTS welcomes original manuscripts from scholars worldwide focused on the depthand breadth of technology as practiced and understood past, present, and future. EpsilonPi Tau, as perhaps the most comprehensive honor society among the technology profes-sions, seeks to provide up-to-date and insightful information to its increasingly diversemembership as well as the broader public. Authors need not be members of the societyin order to submit manuscripts for consideration. Contributions from both academicsand practitioners are equally welcome.
A general guide to the breadth of topics of potential interest to our readers can be gainedby consideration of the 17 subclasses within “Technology” of the classification schemeof the Library of Congress, USA <lcweb.loc.gov/catdir/cpso/lcco/lcco_t.pdf>. Thisincludes engineering and allied disciplines, informatics in its many manifestations,industrial technology, and education in and about technology.
Authors are strongly urged to consult the journal’s “Guidelines for Authors,” included inthis publication, or available at the society’s Web site or provided upon request. It providesadditional details on the breadth and nature of topics of interest, the journal’s scholarlywriting standards, submission guidelines, and review and publication processes.
Printed in the United States of America by Kennedy Printing Company, Findlay, Ohio.
Board of Directors
Region 1 (The nations of Europe, theEastern Provinces of Canada, and the Northeastern United States)Dr. Marvin SarapinDepartment of TechnologyKean UniversityUnion, NJ 07083908.737.3500fax: [email protected]
Region 2 (The nations of Africa, theCaribbean Islands, and theSoutheastern United States)Robert E. WenigDepartment of Mathematics, Science, & Technology EducationBox 7801North Carolina State UniversityRaleigh, NC 27695-7801919.515.1742fax: [email protected]
Region 3 (All members-at-large, theCanadian Province of Ontario, and the North Central United States)David DevierUniversity of Cincinnati, Clermont College4200 Clermont College DriveBatavia, OH 45103513.732.5209fax: [email protected]
Region 4 (The nations of Central andSouth America, the Northern Territoryand Central Provinces of Canada, andthe Central United States)Kennard G. Larson, on leave 9/1/04 - 12/31/04Dept. of Industrial TechnologyUniversity of Nebraska at Kearney905 West 25th StreetKearney, NE 68849308.865.8504fax: [email protected]
Dr. Ray Diez 9/1/04 - 12/31/04The University of North DakotaFaculty of Industrial TechnologyCornell St.Grand Forks, ND [email protected]
Region 5 (Australia, the island nationsof the Pacific and Indian Oceans, thenations of Asia, the Yukon Territoryand Western Provinces of Canada,and the Western United States)
James EdwardsDepartment of Design & IndustrySan Francisco State University1600 Holloway AvenueSan Francisco, CA 94132415.338.7896fax: [email protected]
Associate Executive Director for Information and CommunicationDr. Dennis CheekScience Applications International Corp.916 Springdale Dr.Exton, Pa [email protected]
Associate Executive Director forCommunity and Technical CollegesJerry C. OlsonTechnology BuildingBowling Green State UniversityBowling Green, Ohio 43403419.372.0378fax: [email protected]
Associate Executive Director forInternational AffairsMichael DyrenfurthSchool of TechnologyPurdue UniversityRoom 461, Knoy HallWest Lafayette, IN 47907-1410765.496.1203fax: [email protected]
Executive DirectorJerry StreichlerTechnology BuildingBowling Green State UniversityBowling Green, Ohio 43403419.372.2425fax: [email protected]
A refereed publication of The International Honor Society for Professions in Technology.
The Journal of Technology Studies

1
ARTICLES
2 Designing TechnologyEducation at the JuniorHigh School Level:Propositions from theFrench School CurriculumBy Lebeaume Joël
10 International Collaborationin Secondary LevelEducationBy Dr. Tom Loveland,
Dr. Hidetoshi Miyakawa, and
Yoshitaka Hirayama
19 Secondary School,University, and Business/Industry Cooperation YieldsBenefits to TechnologicalEducation StudentsBy Dr. Ann Marie Hill
27 Distance Education forTechnology TeachersBy P. John Williams
35 Databases Improve TechnicalStudies By Gabriele Graube
38 Strategies for ReformingWorkforce PreparationPrograms in EuropeBy Marja-Leena Stenström
and Johanna Lasonen
43 Relation of Technology,Science, Self-Concept,Interest, and GenderBy Ingeborg Wender
51 Malaysia Transitions Toward a Knowledge-Based EconomyBy Ramlee Mustapha
and Abu Abdullah
62 Books Briefly Noted
Table of ContentsVolume XXX, Number 3, Summer 2004

Joël Lebeaume is a professor at the École
Normale Supérieure of Cachan. His research
is focused on technology education from a
didactic point of view at the Unity of Research
in Scientific and Technology Education (UMR
STEF ENS Cachan INRP). He has been a mem-
ber of the “Technology” working group with the
Ministry of Education and has participated in
the examination and review of new programs
in the area of technology education.
In France, technology is a compulsory
school discipline at the junior high school level
(ages 11-15). Technology studies were initiated
at the beginning of the 1960s when school
attendance until the age of 16 became mandato-
ry and when it was decided to delay vocational
training because of the irreversible drive
towards technical modernity, a tremendous
cultural and social upheaval, and a dire shortage
of technicians in France. Designing and imple-
menting this new discipline, however, could not
happen spontaneously; it required the appropri-
ate tools, in addition to ideas, in order to
develop and coalesce the various suggestions,
identify likely consequences, and propose a
coherent structure. Across the world, technology
education systems vary depending upon politi-
cal, economic, and technical contexts, etc. (de
Vries, 1994; Foster, 1997; Zuga, 1997). These
differences are also tied to the historical forms
of this subject matter, such as industrial arts,
design, and arts and crafts, and the relationships
held with other disciplines in the educational
curriculum. Moreover, they depend upon the
philosophical precepts inherent in the definition
of the discipline, that is, content-oriented vs.
student-oriented.
Within the French context, research on the
history of this discipline (with a focus on manu-
al work) provides insight into the fundamental
issues of its place in the compulsory general
school curriculum. Such research has provided
the basis for suggesting a number of tools for
identifying relevant proposals from recent
technology education programs (1996-1998).
This historical inquiry examines two main
periods of school organization in France. The
first concerns the period 1880 to 1960, during
which primary schooling was opened up to the
entire population. The second is the period 1960
to 2000, when the school became an educational
system and when the junior high school pro-
gressively filled the role of middle school.
During both periods, the technical world was
represented first by means of manual work and
then with technological instruction. This histori-
cal approach serves to develop a didactic frame
of reference specifically regarding prescribed
course content and curriculum organization
(Lebeaume, 1996, 2000). The two aspects are
indeed similar due to the context of compulsory
teaching within the general education system.
Manual Work at the Primary School Level
For the past 100 years or so, manual work
has been prescribed for boys and girls at the pri-
mary school level. The name of this discipline
has been modified over the years: manual and
experimental work, manual activities, manual
educational activities, manual work, handicrafts,
etc. These changes are the consequence not only
of evolution in the pedagogical conceptions of
children and pupils and of their learning, but
also in the social roles of men and women. In
order to identify the various forms of this disci-
pline, it becomes necessary to characterize the
predominant prototypical situations encountered
in teaching-learning. A prototypical situation is
characterized by the tasks, their significance,
and their orientation: What exactly are the
pupils doing? And why are they doing it? How
do these tasks refer to actual practices? Figure 1
illustrates this coherence in the reciprocal
relationships between the three components of
this discipline: purposes, references, and tasks.
Th
e J
ou
rna
l o
f Te
ch
no
log
y S
tud
ies
Articles Designing Technology Education at the Junior High School Level: Propositions from the French School CurriculumBy Lebeaume Joël
2

Th
e J
ou
rna
l of Te
ch
no
log
y Stu
die
s
The diagram in Figure 1 depicts the coher-
ent structure present in each form of the disci-
pline and represents a method, which is to be
defined as the special methodology of the
discipline. It is necessary to distinguish between
the pedagogical and didactic meanings of the
methods observed. This distinction does not
pertain to the relationships between purposes
and means, as do the active methods (pedagogi-
cal meaning). According to the didactics per-
spective, the term method draws attention to
subject content. It indicates the special method-
ology behind a school subject, with its features
and its specific knowledge. It has been used
in the past for music learning, for example,
to distinguish between the marked method
and the numbered method.
The various forms of manual work at the
primary school level are thus: the technical
elements method (e.g., series of sewing stitches
for girls, or technical elements of woodwork
or metalwork), the everyday items method
(creation of objects, such as pillowcases, boxes,
or tablemats), the geometrical elements method
(drawing shapes, folding paper), the amusing
things method (toys, dolls, etc.), the logical
elements method (graphical representation of
threads in braiding, weaving, etc.), and the
technical projects method (process of producing
technical objects). Each of these methods is
represented in the chronological diagram in
Figure 2.
The main differences between these histori-
cal forms of manual work depend on both the
tasks and their references. Some tasks refer to
domestic practices, whereas others relate more
to workshop activities or industrial jobs and still
others to entertainment practices. The signifi-
cance ascribed to the tasks influences them via
systematic exercises or practical activities. Task
objectives are also contrasted when it comes to
learning technical matters, scientific or
mathematical knowledge, understanding the
psychological development of children, and
discovering the technical world. Without neces-
sarily being aimed at pre-professional training,
these purposes were all quite different.
Coherence has thus been defined in each of
these prototypical situations, as identified
respectively by the corresponding methods.
Technology Education at the Middle School Level
The history of technology education since
the 1960s also reveals the distinct methods
employed at the junior high school level. In
the past, it had been organized according to
a succession of methods, each featuring special
attributes (see Figure 3).
3
Figure 1. Representation of prototypical teaching-learning situations: Method.
Figure 2. Successive methods throughout the history of manual work in primary schools.
purposes
tasks references
orientation
significance
technicalelementsmethod
everydaythings
method
geometricalelementsmethod
amusingthings
method
logicalelementsmethod
technicalprojectsmethod
1872 1882 1892 1923 1977 1985

Th
e J
ou
rna
l o
f Te
ch
no
log
y S
tud
ies
According to these various forms, technology
education may be defined as a component of gen-
eral education without the goal of being or becom-
ing vocational training. Rather, it is intended as a
discovery or initiation to technical practices in
order to better cope with and act within the techni-
cal environment. Technology education has also
been constituted as a requisite school discipline
for identifying future jobs and professions.
The successive forms of the discipline at both
the primary and middle school levels reveal an
alternation in the methods adopted. Two types of
methods can be distinguished: syllabic methods
and global methods. The first are defined merely
by elementary efforts or notions along with the
pertinent scientific references, whereas the second
are defined by the production of basic objects
adapted for the students' comprehension. The first
are devoid of any technical significance, whereas
the second imply a translation for youngsters of
real-world practices as a means of proposing tech-
nical educational experiences. This alternation is a
sign of the instability of technology education in
schools, which often tends to become a series of
lessons with a pencil and paper but without
authenticity or connection to real-world technical
practices.
Main Theoretical IssuesThe historical analysis of this school
discipline raises three main issues with respect
to designing technology education within a
compulsory general educational context:
1. How to handle the interactions between
knowing and doing in order to design an
academic discipline based on reasoning
and action.
2. How to harmonize the diversity of tech-
nical practices in designing a general
school discipline.
3. How to maintain relationships with
current social and technical practices so
as to provide pupils with genuine inter-
pretations of the technical world they
will be required to understand.These three main issues are fundamental to thedesign of an elementary, progressive, and gener-al approach towards a whole range of situationscombined into a single school discipline underthe generic label technology education.
Designing the Foundations of Technology Education
The diagram in Figure 1 serves as a base to
query the foundations of technology education.
Which tasks are appropriate? For which purpos-
es? Which references apply to the set of tasks?
The choice regarding references and purposes
depends on educational policies aimed at training
young people as individuals, citizens, and future
members of the workforce. The choice of indus-
trial practices as references is directly linked to
the conception of the future from a social and
economic standpoint. Is it important to initiate
entrepreneurship (Raat, de Vries, & Mottier,
1995), to develop a critical point of view
(Deforge, 1993; Petrina, 2000), to promote scien-
4
Figure 3. Methods used in the history of technology education for middle schools.
logicalelementsmethod
technicalprojectsmethod
qualityelementsmethod
"scenarios"method
Method Tasks References PurposesLogical elements
Technical projects
Quality elements
Scenarios
• technical analysisof devices
• industrial drawing
• design andfabrication of technical objects
• use of valueanalysis tools
• implementationof technicalproducts
• mechanics
• domestic andsmall-scaleproduction
• value analysis
• contemporaryfirms
• understanding theworld of machines
• learning how to do,thinking before making
• understandingoptimizationprinciples
• using computers
1962 1977 1985 1996

tific and technical progress, to maintain the
technical heritage, to generate new individual or
collective skills, etc. Within the French context,
history has demonstrated the various choices
made over the past 30 years: to enhance the con-
dition of manual workers; to generate enthusiasm
for technical jobs; to fulfill the broad-based
needs of technicians, marketing professionals,
and engineers; to inform customers; etc. The
question of why technology education should be
included within the compulsory school curricu-
lum is linked to the question regarding references
that entails contemporary firms, mass production,
workshop activities, etc., as well as to that regard-
ing the choice of fields of technical practice such
as mechanics, electronics, economics, and
automation (Martinand, 1995).
In relation to the previous choices, the fun-
damental decision about curriculum would there-
by constitute the main type of approach. Would
this be a production approach; or an investigation
approach of processes and devices; or an analyti-
cal approach of quality, objects, and products; or
another approach altogether? Depending on the
decisions concerning the three method compo-
nents, a different technology education comes to
the fore with a distinct set of contents. The disci-
pline could consist of an experimental technology
education, a practical technology education,
a design-process technology education, a prob-
lem-solving technology education, a creative
technology education, and so forth.
In France, the preferred approach has
always been to rely upon project-building
adapted to the pupils’ ages. This decision,
however, requires a conceptual framework in
order to describe the nature of the school tasks
assigned. In technology education, tasks must
integrate material of a technical nature, which
has been defined from three components
(Combarnous, 1984): objects, technical think-
ing, and specialized roles. Put otherwise, a
technical task arises when pupils are confront-
ed with objects (machines, materials, docu-
ments, etc.); when they are asked to design,
produce, or, more simply, act or carry out as
efficiently as possible; and when they play a
technical role such as engineer, technician,
or technical agent in a context of teamwork.
Nevertheless, this project development
approach merely involves a few genuine
encounters with the technical world without
the intention of training project managers or
specialized agents.
These encounters with the technical world
via a project development approach then serve
as a means for interpreting real technical
processes and products. School projects enable
not only the generating of vital concepts for
examining technical reality, such as quality,
value, cost, market, organization, and technical
standards, but also learning some machine and
computer operating skills.
While concrete technical achievements lie
at the core of technology education, the use of
computers is very closely related therein.
Learning how to use computers thoroughly is
essential for future generations. Technology
education has the obligation of teaching these
multiple computer uses (word processing,
spreadsheet applications, database management,
computer-assisted drawing and manufacturing,
communication applications, etc.). One aspect
of these programs is centered directly upon the
Th
e J
ou
rna
l of Te
ch
no
log
y Stu
die
s
5
Table 1. Comparison of T/M/S Content Standards
Area # of Stds Second Level Grade Bands Date Issued Web Site(9-12) Statements
TECH 17 cognitive 51 cognitive K-2 2000 www.iteawww.org3 process 15 process 3-5
6-89-12
MATH 5 cognitive 71 cognitive PreK-2 1989/2000 www.nctm.org5 process 18 process 3-5
6-89-12
SCIENCE 7 cognitive 27 cognitive K-4 1995 www.nas.org1 process 2 process 5-8
9-12

Th
e J
ou
rna
l o
f Te
ch
no
log
y S
tud
ies
In order to maintain its foundations, tech-
nology education must generate prototypical
teaching-learning situations from tasks featuring
a real technical nature. Defining an elementary
school discipline implies choosing technical
experiences adapted to the pupils (i.e., enabling
them to live a series of adventures shaped by
objects, efficiency, and roles). It is also neces-
sary, however, to organize these experiences
within a coherent sequence throughout the
schooling period.
The history of technology education reveals
several principles for determining the progres-
sion of the curriculum. The first one consists of
repeating the same process in different technical
experiences throughout the junior high school
program. This principle is at odds with the pur-
pose of technology education by virtue of the
tendency of such training to produce project
managers. The second principle consists of
introducing these school experiences gradually
with more open-ended tasks: resources are
increasingly scarce, technical projects are
increasingly complex, and constraints are
increasingly present. This principle corresponds
with the definition of technology education as
both a school discipline that contributes to
developing problem-solving skills and a
pedagogical means for nurturing the pupils’ psy-
chological skills. The third principle consists of
defining just one generic technical area and then
progressively introducing new and broader
tasks. In the past, the areas of woodworking or
metalworking and the realm of mechanical prac-
tices constituted these generic references, which
provided an overview of the entire array of tech-
nical practices. This choice, however, does not
comply with the purpose of unspecialized
education because of its tendency of becoming
more of a vocational training. The fourth princi-
ple consists of varying the references from more
familiar to more unknown domains, for exam-
ple, from the home to firms or from domestic
practices to industrial practices. This principle
is typically applied at the nursery school and
primary school levels, where discovery of the
world initially proceeds from commonplace
tools and familiar objects. The fifth principle
consists of proposing different technical
experiences encompassing a wide diversity of
6
acquisition of such knowledge. This aspect does
not fall into the realm of information sciences
but rather of information technology, as a result
of the technological point of view inherent in
this systematic learning approach. However,
information technology does not span the
domain of the unconscious use of computers.
To handle these machines better, practical famil-
iarization does not consist solely of hands-on
use but includes reflexive practice as well.
Learning is organized by virtue of progressive
exercises aimed at understanding how to use
computers and how to open, enter, select, locate,
save, store, and retrieve files. These capacities
must be taught so as to remain with the pupil
for future activities and to assist in day-to-day
life. Pupils need to know about systems and
principles of data processing and assimilate
these processes in order to identify the advan-
tages and limitations of data-handling programs
or choose from among a set of programs. They
also have to build an effective model for dealing
with computer-related tasks.
Designing the Organization of Technology Education
Designing the organization of technology
education within a general educational context
raises two major and interrelated issues: how the
program is to be defined within the framework
of elementary learning and how its progressive
evolution is to be organized. Focus then turns
to the schedule of technology education courses
during the four-year junior high school
curriculum.
Given that school disciplines are defined
simply by a sequence of knowledge acquisition,
it is customary to divide the contents into a
number of small chunks and then teach them
one after the other. Mathematics or grammar
lessons, for example, are typically organized
around this principle from the simplest to the
most complex. In contrast, for technology edu-
cation (and for that matter for sports and artistic
education as well), specific content components
cannot be separated into smaller chunks. In the
past, this tendency to define technology educa-
tion as a cumulative discipline distorted its
foundations and the school subject got directed
towards applied sciences or geometry.

Th
e J
ou
rna
l of Te
ch
no
log
y Stu
die
s
social and technical references. As an example,
the program prescribes technological activities
in sewing, cooking, building, electronics, and
mechanical assembly. Comparison between
these contrasted experiences then enables identi-
fying the consistency of the technical process or
tasks along with their technical features. This
principle, however, has more to do with plan-
ning than with a progressive pace to the instruc-
tion. Keep in mind that progressiveness pertains
not only to the temporal organization but also
to the way in which pupils progress with their
learning.
The choice of which principle to employ in
setting up a general, elementary, and progressive
technology education depends on the purposes
inherent in the school discipline. Within the
French context, the principle of elementary
teaching entails defining project-based accom-
plishments, whereas the principle of progres-
siveness implies distinguishing tasks according
to the three junior high school degrees. During
the first degree, the principle dictates a year of
technical initiation in order to acquire basic
knowledge of the equipment and techniques,
coupled with the implementation of tools in
mechanics and electronics and an approach to
product marketing. The two years making up
the second degree represent a period for gaining
technical experience. Each year, pupils are
required to experience two contrasted project
sequences (to be chosen from among the follow-
ing: assembly and packaging of a product, mass
production after prototype-building, design and
building of a prototype, product testing and
improvement, diversification of a product range,
and service provision). During these project-
directed activities, pupils are asked to perform
several tasks with references to various types of
actual firms or companies (industrial or serv-
ice). The mass production scenario, for exam-
ple, proposes different tasks, including the
temporal and spatial organization of production,
cost calculations, and quality control. During
the second year of the middle degree program,
the service provision scenario offers new activi-
ties: a needs-based study, planning and organi-
zation, definition of functional purpose, cost
estimation, etc. During the final year of the
third degree, pupils are assigned to implement
a technical project comprising four main stages:
market study, solution search, production, and
dissemination.
Throughout the junior high school curricu-
lum, therefore, the principle of progressiveness
takes the form of differentiation-comparison
(see Figure 4). The first degree provides the
basic background of school-based technical
activities. The middle degree is centered on the
analysis and comparison of technical experi-
ences in the aim of developing a process model.
The final degree enables consolidating this
general process model and building upon the
knowledge and know-how previously acquired.
This progressiveness has been chosen in
order to add greater consistency to the school
discipline. Technology education is a discipline
of experience and not one of content. If the
curriculum is defined first by a list of skills,
talents, or capabilities, this discipline could be
progressively organized around a series of
graded exercises, yet the pupils’ activities would
be insignificant.
In order to comprehend the technological
world and act within it, in order to identify rela-
tionships between products and human needs,
and in order to know how solutions are chosen
at different stages of the design process, produc-
tion cycle, or sales chain in light of technical,
human, and economic constraints, technology
education focuses on development activities that
provide pupils with practical experience and a
conceptual framework for describing and
analyzing the technical and economic world
around them. Such project-oriented activities
are then progressively compared and refined
by the pupils themselves (Lebeaume &
Martinand, 1999).
7
Figure 4. Differentiation and comparisonof different technical experiences.
purposes
tasks reference reference reference

Th
e J
ou
rna
l o
f Te
ch
no
log
y S
tud
ies
Designing the Implementation of Technology Education
Thanks to its various features, technologyeducation only exists in the classroom in thepresence of teachers and pupils. This truism,however, implies two critical points:
• A program structure in compliance with a standard and a prescription that incor-porate the innovation necessary to devel-op the school discipline and that allowfor different types of implementation,depending on both the context and theheterogeneity of the student body.
• The choice of the contents of teachertraining in order to enable teachers to discuss their teaching, according to thefeatures and the principles of the schooldiscipline, and to provide their classroompresentations with responsibility andawareness.
The French educational context, which features a national curriculum determined bythe Education Ministry, acts to influence thestructure of teaching standards. As opposed tothe UK, for example, the French system doesnot include a national assessment based on standards for each year and for each programcomponent. According to pedagogical tradition,technology teachers implement their disciplinewith a wide degree of freedom. They areallowed to draw up their lesson plans and orienttheir teaching in a way they feel to be the mosteffective. It is thereby essential for learningassessment to be integrated into the foundationsof the discipline. Technology education, definedas a discipline structured by technical experi-ences and practical tasks, requires an assess-ment in accordance with this set of principles(Lebeaume & Martinand, 1998, 2002). Newprograms identify three components in assessingpupils: participation and involvement within ateamwork setting associated with a projectassignment; skill development associated withthese particular tasks; and mastery of a fewbasic skills required for all pupils upon comple-tion of each degree, in order to pursue the nexthigher degree program. At the end of the middledegree, they must be able to use measurementtools (e.g., electrical regulator, sliding gauge),operate equipment (e.g., soldering iron, drillingmachine), and be comfortable with presentationtools such as scheduling or matrices. In additionto the know-how acquired, a certain amount ofknowledge, not defined in words but in ideas,
proves necessary to querying, understanding,organizing space and time, and making choices.From this perspective, examples include syl-labus notes, production plans, design proposals,market studies, cost estimations, and productlife cycles. Upon graduation from junior highschool, the student assessment calls for the presentation of a technical project as a means of explaining decisions and choices and of usingcomputer-assisted tools. Students are asked toestablish a relationship with their work and thecorresponding technical reality and then to pro-duce an explanation that includes notions suchas value, flux, (needs defining) constraints, standards, functions, and market. The comple-mentarity of these three components of theassessment serves to maintain consistency in thediscipline. Since project tasks lie at the heart ofschool activities, the experiences turn out to bemore educational than merely skill-building orknowledge-building. Assessment is to be funda-mentally included within the school discipline.
Implementation of the discipline alsorequires compatibility with the highly distinctset of school parameters: facilities, environment,organization, timetable, teachers, and pupils.The “technology” structure needs a certaindegree of built-in flexibility. This characteristicis apparent by virtue of the decisions requiredby the teacher in the choices available as regardstechnical project components. Teachers have tochoose two scenarios from among the three,with this choice depending on the local context.They must also decide on the technical product,the resources allocated, the conditions or con-straints, and the stated goals and references(small vs. big firms, familiar or not to thepupils, overlapping or not with school prac-tices). These multifaceted choices thereby generate diverse combinations of the organizedtasks and different approaches to technologyeducation. Among the range of technology edu-cation formulae, the organizational frameworkfacilitates the maintainence of consistency within the discipline.
However, the existence of this disciplinealso presupposes new perspectives opened bymeans of controlled innovation. A school discipline cannot simply reproduce the sameactivities anytime and anyplace. Hence, innova-tion within the predominant framework offerssignificant potential for updating and shapingthe future of technology education.
8

Th
e J
ou
rna
l of Te
ch
no
log
y Stu
die
s
9
References
Combarnous, M. (1984). Les techniques et la technicité [The techniques and the technical nature]. Paris: Editions sociales.
Deforge, Y. (1993). De l'éducation technologique à la culture technique [From technology education to technical culture]. Paris: ESF.
de Vries, M. (1994). Technology education in Western Europe. In D. Layton (Ed.), Innovations dans l'enseignement des sciences et de la technologie [Innovations in science and technology teaching-learning] (pp. 31-44). Paris: Unesco.
Foster, P. N. (1997). Classifying approaches to and philosophies of elementary-school technology education. Journal of Technology Education, 8(2), 21-34.
Lebeaume, J. (1996). Ecole, technique et travail manuel [School, technique and manual work]. Paris: Delagrave Z’Editions.
Lebeaume, J. (2000). L'éducation technologique: Histoires et méthodes [Technology education: Histories and methods]. Paris: ESF.
Lebeaume, J., & Martinand, J.-L. (1998). Enseigner la technologie au college [Teaching technology atjunior high school]. Paris: Hachette.
Lebeaume, J., & Martinand, J.-L. (1999). Technology education in France: A school subject. In W. Theuerkauf & M. J. Dyrenfurth (Eds.), Proceedings of the International Working Seminar of Scholars in Technology Education, Washington DC (pp. 175-182). Braunschweig, Ames, Germany: EGTB-Wocate.
The contents of technology teacher trainingdisplay the consequences of the fundamentalprinciples adopted by new technology educationprograms in France. These contents can beorganized around three main themes:
• Knowledge of the programs and of thediscipline, for the purpose of identifyingthe broadest decision-making spaces.
• The skills involved in the pedagogicalimplementation of tasks and activities inconjunction with pupils, facilities, etc., to enable teachers to provide technologyeducation, regularize teaching situations,adapt situations by taking account ofpupils’ reactions, institutional require-ments, etc.
• The skills necessary for critiquing the relevance of academic situations in orderto control the technical nature of pupils’tasks, discuss their significance withrespect to external references, and defendtheir orientation in light of the purposes.This aspect relies upon negotiating withthe method, its three components, andtheir relationships.
The contents of this didactic teacher train-ing are not organized into syllabi of vocationaltechniques, but rather as the ability to deliberateabout technology education in its current con-figuration and perspectives. Technology educa-tors, defined as the specialists in this branch of
teaching, are required to possess expertise in allaspects of the school discipline for which theyhave been assigned responsibility.
Method Employed at the Core of Technology Education
To conceive of technology education todayas a disciplinary curriculum requires certainconceptual tools in order to identify key issuesand make pertinent design and implementationdecisions. Method provides a means for repre-senting the objectives of the discipline in lightof all its features, specific characteristics,nature, and conditions of existence. The authen-ticity of this discipline is fundamentally necessary because of its educational purpose in the compulsory general school system.
This analysis of the context specific toFrance also serves as a proposal to other schooldisciplines and to other countries. It clarifies thefact that technology education exhibits funda-mental characteristics and the infeasibility ofdesigning a technology education program witha model imported from another discipline. Itshistorical evolution and the alternation of meth-ods have revealed the major effects resultingfrom its marked structural approach.
Lebeaume Joël is a professor at the ÉcoleNormale Supérieure of Cachan, Paris, France.

Th
e J
ou
rna
l o
f Te
ch
no
log
y S
tud
ies
10
Lebeaume, J., & Martinand, J.-L. (2002). Technische bildung: Ideologische und theoretische aspeckte [Technology education: Ideological and theoretical issues]. In G. Graube & W. Theuerkauf (Eds.),Technische bildung: Ansätze und perspektiven [Technology education: Foundations and perspec-tives] (pp. 161-171). Frankfurt am Mein, Germany: Lang.
Martinand, J.-L. (1995). The purposes and methods of technological education. Prospects, 25(1), 49-56.
Petrina, S. (2000). The political ecology of design and technology education: An inquiry into methods. International Journal of Technology and Design Education, 10(3), 207-237.
Raat, J., de Vries, M., & Mottier, I. (Eds.). (1995). Teaching technology for entrepreneurship and employment, PATT-7 Conference Proceedings. Eindhoven, The Netherlands: PATT Foundation.
Zuga, K. (1997). An analysis of technology education in the United States based upon a historical overview and review of contemporary curriculum research. International Journal of Technology and Design Education, 7(3), 203-217.
International Collaboration in Secondary LevelEducationBy Dr. Tom Loveland, Dr. Hidetoshi Miyakawa, and Yoshitaka Hirayama
Global EducationOver the last 20 years, the economies of the
world have been linked closer and closer togeth-er. The passage of the North American FreeTrade Agreement (NAFTA) and the creation ofthe Euro currency in Europe are just two exam-ples of how the world economies are becomingintertwined (McLaughlin, 1996). Transnationalcorporations have operations scattered across theglobe to take advantage of access to raw materi-als, information, and labor. These corporationsrecruit and want to preserve their productiveglobal workforce (Branson, 1998; Franks, 1998).The largest transnational corporations havebudgets greater than many individual countries.The world is viewed by these corporations as asingle global marketplace (Branson, 1998). The increasing vitality of the global economyhas meant change for countries, businesses, andworkers. Countries find that they no longer have
total control over information and their localeconomies. Autocratic countries such as Chinaand Iran are trying, unsuccessfully, to block theircitizens’ access to information through theInternet. Economic meltdowns in Argentina andThailand in the late 1990s had far-reachingimpacts on the economies of other countries.Businesses find that they have to adapt to thenew business world or fade into obscurity.Workers find that they need new skills to compete globally.
The interconnectedness of the world hasbeen aided by the proliferation of personal computers and the Internet. Inexpensive e-mailallows people from different countries to com-municate instantaneously with each other.Organizations, educational institutions, and governments have contributed to the explosionof cross-border information exchange.
Th
e J
ou
rna
l of Te
ch
no
log
y Stu
die
s
These changes and new realities have been
described as a new age of interdependence.
This interdependence evolved from world trade
and international capitalism (Hughes & Ortero,
1989). Interdependence is most evident in the
areas of international trade, environment,
politics, telecommunications, transnational cor-
porations, and international travel (Fish, 1982).
The new global culture is placing new demands
on the people of the world. Production is no
longer restricted to geographical location so
workers need to be more globally astute.
According to Scarborough (1991), citizens need
to understand the changing technologies, work-
place adjustments, and competitive pressures.
Fish (1982) confirmed this by stating that
people need to be more aware of and more
effective participants in the global economy.
Lauda (1992) declared that students
throughout the world are internationally under-
nourished because education systems are too
narrowly focused on rigid content areas and
national issues. Globalization is a focus that the
business world has embraced while education
has tended to be more inwardly focused
(Scarborough, 1991).
Global education is the means to teach the
world’s citizens about the globalization trends.
According to the U.S. government report
Critical Needs in International Education
(National Advisory Board on International
Education Programs, 1983), “it is in our
schools, however, that the greatest progress can
be made. International and intercultural studies
should receive more attention and higher priori-
ty” (p. 7). The report goes on to promote the
learning of international awareness, cultural
sensitivity, and communication skills from for-
eign language and intercultural studies. Franks
(1998) found the following:
As the world grows increasingly interde-
pendent, we discover even more oppor-
tunities to learn and work from each other
about cooperative education. All over the
globe, nations face a critical need to devel-
op and maintain a supply of their most
valuable resource: trained and productive
workers. Work-integrated education has
emerged as a viable means to that end. (p
High school students are preparing them-
selves for college and future careers. Students in
discrete subject courses are not given the bigger
picture about the internationalization of the
world. Students miss the connections of how
all of these areas are interlinked. An opportunity
exists in the schools to solve this dilemma.
Secondary-level technology education classes
offer a curriculum that encompasses the study
of technology with links to all academic classes.
A technology education lab filled with Internet
accessible computers and equipment is the best
location to use distance learning tools and
research to create a curriculum that teaches
students about international culture, values,
and understanding. This program is accom-
plished by creating a collaborative program for
the students to unite with partners in other
countries. The goals of this collaborative effort
are to teach students in both countries to be
more respectful of each other’s cultures, to
create long-term friendships between the
teenagers, families, schools, communities, and
countries, and to see the relevance of studying
global issues and perspectives. McLaughlin
(1996) summarized the importance of global
education by stating “global education attempts
to teach people how to live in a world that is
increasingly interconnected and interdependent.
This method of education works to establish
cross-cultural understanding and to develop
cooperative attitudes needed to solve world
problems” (p. 15).
The Japan-Florida Teens Meet ProjectYumegakuen High School or Dream High
School in Tsu City, Mie-ken, Japan, was estab-
lished in 1997 as the first school in Japan that
has comprehensive courses as a forerunner of
Japanese education reform. High schools in
Japan offer either academic courses for students
who go on to university studies or vocational
courses for students who go into immediate
postsecondary employment. The new compre-
hensive courses at Yumegakuen High have led
to a mixture of students and curricula that is
unusual in Japan. Due to this educational reform
being conducted by the Ministry of Education,
Culture, Sports, Science and Technology
(Monbusho), Yumegakuen High School is
equipped with high tech computers and telecon-
11
72)

Th
e J
ou
rna
l o
f Te
ch
no
log
y S
tud
ies
ferencing facilities. An international studies
teacher at the school was looking for a partner
school in foreign countries and registered the
classroom at the Web site of ePALS
(http://www.ePALS.com). ePALS is dedicated
to creating partnerships between schools across
the world. When the teacher signed up in
October 1999, there were 36,000 classrooms
registered. As of July 2003, 81,514 classrooms
were registered.
Several weeks after this teacher registered
with ePALS, a technology education teacher
from Ridgewood High School in New Port
Richey, Florida, wrote to suggest a collabora-
tion. It was a very nice and interesting offer
because besides the educational purpose of the
teleconference, the American teacher showed
understanding toward the idea of promoting the
school’s image within the local community.
The school is new and relatively unknown in the
community of Tsu-City. It was thought that the
collaboration could help recruit good students
who would be suitable for these wonderful
facilities.
A video teleconference test was held on
November 18, 1999, for the two teachers to
meet live to discuss curricula and ideas. The
students in the two classes decided to call their
collaboration the Japan-Florida Teens Meet
Project (JFTMP). Activities were developed for
the students to work on group projects and indi-
vidual assignments. On December 14, 1999,
students with guests met their overseas friends
for the first time live through a video teleconfer-
ence. This event included welcoming statements
by the two school principals, introduction of
guests (school board members, parents, district
technology supervisors, reporters), some student
activities, and question/answers. One of the
activities the students did was a math dollar/yen
conversion exercise. Students researched what
the current conversion rate was and then calcu-
lated the cost of teen merchandise in both dollar
and yen denominations. Comparisons were then
made about the availability and costs of items
the teens were interested in. The teen items
were randomly pulled out of a hat to add some
excitement to the event. This first teleconfer-
ence was a great success and the media
favorably reported it.
In late spring of 2000, plans were presented
to the students about an international space sta-
tion project. American and Japanese students
would work on transnational student teams to
conceptualize, research, design, and construct
a 1/20th scale model international space station.
The students had to design a sustainable envi-
ronment built for teenagers living long term in
space. The teams focused on essential modules
of the international space station: living space,
water-based systems, command, solar power,
and scientific experiments. Two initial balsa-
wood modules, including command and water-
based systems, were completed by the American
students and shipped to Japan in early June
2000. During the 2000-2001 school year,
advanced technology studies students completed
the rest of the modules for shipment to Japan.
The design of the international space station
modules was developed using a WebQuest for-
mat. This was placed on the World Wide Web
for
students and parents to access outside of school.
The main JFTMP Web site is at http://www.tcp-
ip.or.jp/~hirayama/jftmp.
Two teleconferences were held in the fall
of 2000. New students in both countries were
introduced to each other. One of the teleconfer-
ences included 100 fifth graders from a local
elementary school in Tsu City. A Japanese
foreign exchange student at Ridgewood began
participating, adding to smoother communica-
tions and understanding. Over the next several
years, media in both countries reported about
the teleconferences and collaborative activities.
Yumegakuen High School received good
publicity and attracted more students. In the
spring of 2000, about twice as many students
took the entrance exam than there were
openings for admission.
In January 2000, the American teacher
received a grant from a local foundation to
travel to Japan in the summer of 2001 for two
weeks with eight Ridgewood students. Five of
the eight students traveling were from the tech-
nology education classes. Two days were used to
visit Yumegakuen High School so the students
could meet and participate in shared activities.
During the visit there, the Japanese and
American-built components of the model inter-
12

Th
e J
ou
rna
l of Te
ch
no
log
y Stu
die
s
13
national space station were assembled and put
on display. The event was covered extensively
in the Japanese press. A photo was taken of the
JFTMP students that day with their completed
model space station. A JFTMP goal was to have
that photo flown to the international space sta-
tion with a Japanese astronaut. A photo of the
astronaut holding the JFTMP picture in space
would then be enlarged and put on display in
both schools.
A decision was made to make a video
project the centerpiece of the 2001-2002 school
year. The video, Smoke and Mirrors, was a dra-
matic anti-tobacco story that had scenes taped
in both countries and in both languages. Two
different versions of the video were produced.
In addition to memorizing their English dia-
logue, the American students had to learn
Japanese for the same scenes. The Japanese had
to learn their lines in Japanese and English.
American students edited the English-only ver-
sion and the Yumegakuen students edited the
Japanese-only version. Both videos were pre-
miered during a teleconference in March 2002.
The videos were partially funded by the
Students Working Against Tobacco (SWAT)
organization in Florida.
The Future of JFTMPIn addition to the video projects, the teach-
ers are collaborating on expansion of the
JFTMP Web site. They are working to include
more schools in their international collaboration
because of their belief that high school students
benefit from this experience. American students
are taught critical thinking skills, but Japanese
students are expected to be docile. Now in the
age of information technology, Japanese teach-
ers are beginning to realize the importance of
critical thinking. Japanese businesses are realiz-
ing that having docile workers is not helpful to
their companies in the global economy. This
doesn’t mean the companies need argumentative
workers. They need workers who think differ-
ently and share their ideas. These different ideas
can be used creatively by the companies and/or
classrooms to generate better ways of doing
things. This is how society can improve. The
JFTMP is designed to make the most of interna-
tional collaboration and friendships.
Obstacles to CollaborationThere are obstacles to the success of inter-
national collaborations. According to
Weinbaum and Rogers (1995), “such projects
require a rethinking of traditional school sched-
ules, as well as providing opportunities for
teachers to learn new material, design curricula,
plan with their colleagues, and reflect on the
effectiveness of their practice” (p. 22).
Obstacles in the JFTMP program were summa-
rized into several categories: time difference,
school year schedule, language barriers,
and difference of interests.
The prime obstacle was the time difference
between Florida and Japan. This obstacle was
overcome by the Americans coming back to
school in the evening to meet live with their
Japanese partners who were in their regularly
scheduled first period class the following day.
The Japanese don’t observe daylight savings
time so it became important to check an interna-
tional time zone Web site to make sure the
meetings started at the correct time.
Another obstacle was the difference in
school schedules. The school year in Japan
starts in April,whereas American schools start
in August. JFTMP started in 1999 and some of
the active Japanese students have already gradu-
ated from high school and are now studying at
college. When the American students came to
Japan, most of their e-mail friends had graduat-
ed. A secondary goal of the JFTMP Web site
was to keep graduates informed about current
collaborative activities.
Some challenges were related to the nature
of the distance learning technologies them-
selves. The use of ISDN lines cost the schools
about $200 per teleconference. The two schools
shared responsibility for these costs although
both schools had to justify the phone costs to
administrators outside of their schools.
Language was a major source of concern
prior to the teachers talking live with each other.
It was helpful to the Americans that the
Japanese teacher fluently spoke English.
Ridgewood High is in a rural suburban area
with little opportunity for native Japanese

Th
e J
ou
rna
l o
f Te
ch
no
log
y S
tud
ies
speakers for translation assistance. The language
barrier is a continual hurdle, but English is the
target language for Japanese students to learn
so this is a part of the purpose of education and
the teleconferences.
Another challenge was in the shifting inter-
ests of the students. Yumegakuen is a mix of
high school and adult learners. Some of the
adult students were mainly interested in learning
about foreign cultures and English rather than
mechanical projects such as the space station.
The JFTMP program shifted with the American
teacher from Ridgewood High School to
Marchman Technical Education Center begin-
ning with the 2002-2003 school year. The newly
linked Marchman class was television produc-
tion so the teachers agreed to focus JFTMP
ideas towards video projects. This shift appeared
to satisfy the interests of the adult and high
school age students at both schools.
Due to a lack of curriculum materials on
international collaborations at the secondary
level, the teachers found that they had to devel-
op and write the curricula themselves. Plans are
underway to expand the core schools to include
more Florida and Japanese high schools into a
larger JFTMP consortium. This will expand the
curriculum resources for all teachers through
the sharing of ideas and experiences.
Information Technology Education in Japan
According to Miyakawa (1998), current
advancement in communication technology
is allowing for ever increasing access to
information. This not only promises to
change people’s life styles, but also may
change the value system of society itself.
In such a “technological” society, those
who can readily adjust to these changes
into technology will do very well while
those less able to adjust may be left
behind in the information revolution.
(p. 29)
The information society is highly advanced
in Japan as it is in the United States. The infor-
mation technology revolution in Japan is press-
ing leaders to consider how to manage the infor-
mation society in all fields including industrial
technology, business, society, and home.
Schools are no exception and are now trying
hard to adjust to the information society.
School computers are becoming networked so
the worldwide Internet is becoming more avail-
able. It is therefore important for the education
field to promote effective and efficient use of
computers and to develop new learning content
and curricula.
Information technology education in Japan
began in 1985. It has been promoted aggres-
sively and continuously since then. Various
policies have been adopted such as distributing
money to school education budgets and training
teachers through in-services. As a result of this
investment and the support of Japanese parents,
almost all Japanese students take information
technology education, a lowersecondary level
elective.
In 1999, surveys conducted by Monbusho
showed the state of information technology and
computer usage in Japanese schools. Ninety-
nine percent of the 39,096 schools had comput-
er equipment. Of those schools, 22,449 were
connected to the Internet. Internet guidelines
have been established in 9,477 schools. The
number of schools with their own Web site was
7,850. Among the 38,829 schools with comput-
ers, 27,205 were connected by LAN.
Of the 886,768 Japanese teachers, 66%
can operate computers and 32% can teach using
computers. The subject area with the highest
usage and ability to teach using computers is
in technology education. Of the 10,541 tech-
nology education teachers, 94.5% of these
use computers.
There are issues that affect the ability of
Japanese schools to participate in collaborative
projects with schools overseas. Monbusho is
addressing these with the following implemen-
tation schedule for information technology:
1. All public elementary, lower secondary,
and upper secondary schools were con-
nected to the Internet by the end of
2001.
2. By 2004, LAN networks will be
installed in all public schools.
3. By 2004, all private schools are targeted
14

Th
e J
ou
rna
l of Te
ch
no
log
y Stu
die
s
15
for Internet connection.
4. All 900,000 public school teachers took
an in-service Project for Enhancing
Teacher’s Information Literacy by the
end of 2001.
In addition to Monbusho’s plans, Japanese
leaders in the technology education field have
raised seven other information technology
issues that should be addressed by educational
institutions. Hardware that has functions
required for school education should be
equipped in all classrooms that need it. It is
necessary to make computer equipment avail-
able for anytime, anywhere, and anyone.
Effective and efficient educational software
should be researched, developed, and distributed
at low prices to schools. Educational objectives
about information technology should be clari-
fied and all teachers should examine the new
content and methods. Connection charges to
Japanese schools should be substantially
reduced. Teachers and students should be thor-
oughly taught ethics and morals in the appropri-
ate use of the Internet. Finally, teacher training
in information technology should be planned
and conducted according to the needs of teach-
ers. Steps like these can lead to more connec-
tions between technology education classrooms
in Japan and the rest of the world.
Benefits of CollaborationThere are two major benefits of internation-
al collaborations: the learning is authentic and
contextual-based, and student motivation to
learn increases substantially. Authentic instruc-
tion is a way of linking classroom work to real
work situations that employees face out of
school. Blank (1997) referred to authentic
instruction as “any instructional strategy, model
or technique that involves students in learning
something that is useful or important beyond the
school setting and that engages them in a man-
ner that helps them construct new knowledge or
develop deep understandings or insights” (p.15).
It is a teaching strategy and project-based cur-
riculum that mirrors work that adults perform
in their employment, home, or community.
Weinbaum and Rogers (1995) pointed out that
situating education in real-life contexts is an
answer to the concerns of vocational program
critics who feel there is a gulf between what is
in education and what the actual human
resource needs are of the U.S. economy. Resnick
(1987) concurred by recommending that schools
concentrate on teaching people to be adaptive
learners able to negotiate the inevitable transi-
tions that occur in the workplace.
High school graduates will be facing a far
different work world and will therefore need
to learn in far different ways in the classroom.
Global education was chosen as an overall
theme to enable students to work on real-life
projects that increase problem-solving skills,
create unique team settings, and help students
become better communicators and international
citizens. The two JFTMP teachers directly
observed many benefits to the students and
schools from participation in collaborative
projects.
For students:
• Increased technical skills.
• New understandings of applied math
and science.
• Better writing and communication skills.
• Increased technological literacy.
• Increased classroom motivation and
excitement about learning.
• New concepts of what a “team” means.
• Less stereotyping of other cultures.
• Broadened student views and
perspectives.
• Understanding on the implications of the
global economy.For schools:
• Enhanced parental support.
• Opening communication lines with other
education systems.
• Awareness of the advantages of using
new technologies.
• Promotion of new and creative school
curricula.
• Raised education standards at local
schools.
Planning an InternationalCollaboration
High school teachers interested in initiating
an international collaboration with a school in a
different country face many challenges. Using
the Decide phase of the DDD-E model (Barron
& Ivers, 1998), teachers can systematically
develop authentic learning, multimedia projects

with teachers from other countries.
The broad challenges that face teachers during
the planning section include:
• Fitting the project within the scope of
district and state curriculum mandates.
• Finding a sister school with similar
interests, curricula, and distance learning
technologies.
• Assessing their school’s distance learning
technologies.
• Developing the prerequisite skills to use
these technologies.
Setting Instructional GoalsThe first task for the teacher is to set
instructional goals. According to Barron andIvers (1998), instructional goals may includeresponding to different student learning styles,promoting cooperative learning, enhancingvocational-academic integration, developingcritical-thinking and problem-solving skills, and fostering presentation and speaking skills.
Broad and content-specific instructionalgoals were developed for the JFTMP collabora-tion. The first goal of the collaboration was toprepare students for careers in the global econo-my by having the project mirror projects done inthe workplace. Broad instructional goals for thiscollaborative effort were to teach students inboth countries to be more respectful of eachother’s cultures; to be more aware of the culturaldifferences; to create long-term friendshipsbetween the teenagers, families, schools, com-munities, and countries; and to see the relevanceof studying global issues and perspectives.
Deciding on the ProjectAfter developing the instructional goals, the
teacher now selects and designs a multimediaclassroom project. International collaborationprojects are complicated and require compre-hensive preparation and design. Teachers havethe choice of joining an education-based net-work with developed curricula, projects, andpreselected international classrooms or developtheir own original international collaboration.According to Bradsher (1996), “identifyingoverseas schools with the means and desire topursue a project that fits your curriculum andstudents’ needs and interests can take a lot oftime” (p. 50). Before contacting a teacher fromoverseas, the American teacher should study theculture and education system of the country heor she wishes to collaborate with. Initial studies
will help to increase the teacher’s cultural sensi-tivity, knowledge of the other education system,and make for a more polished introduction.
It is important for teachers to communicateopenly and clearly about goals and project ideaswith their partners. Projects will need to bestarted in incremental steps for several reasons.Overly enthusiastic American teachers may be intimidating to teachers from other cultures.Education systems in other countries may havetheir coursework rigidly set by a national cur-riculum that makes it difficult to accommodatecomprehensive collaborative projects. Finally,other cultures may be used to thoughtful, team-based decision making. American teacherswill need to be aware of and respectful of these differences.
Development of Prerequisite SkillsThe third stage of the decision process is to
develop the prerequisite multimedia skills with-in the teacher and the students to improve theproject’s success. These skills may be technolog-ical and related to global communication.Thach and Murphy (1994) found that
the distance learning instructor needs skillsand knowledge in eight major areas: 1)communication and feedback, 2) promotinginteraction between and among learners, 3)teamwork and collaboration, 4) administra-tive and support services, 5) conductinglearner needs assessments, 6) distancelearning technology and its impact onlearners, 7) identifying learning styles, and8) developing a systems perspective ofthinking. (p. 16)
Distance learning technologies includeInternet (research, e-mailing), desktop telecon-ferencing (NetMeeting, CUCMe), video tele-conferencing (Picture-Tel, ISDN lines), andinteractive multimedia (PowerPoint, Web pagedesign). The teacher should take in-services orclasses or use study time to master these tech-nologies before attempting to teach them to students. Fortunately, American students havebeen exposed to and have access to many ofthese technologies. In some cases, the studentswill be the expert and the teacher the learner.All students should be familiar with basic com-puter skills and the skills required for the specific multimedia project.
American students will need an introduc-
Th
e J
ou
rna
l o
f Te
ch
no
log
y S
tud
ies
16

Th
e J
ou
rna
l of Te
ch
no
log
y Stu
die
s
tion to and practice in global communicationskills. Their written communication with part-ners through e-mails will need to be clear, con-cise, and punctuated properly. During the videoteleconferences, normal American teenagehabits of wearing baseball caps, having armsfolded, using slang, or wearing provocativeclothing may be seen by foreigners as extremelyrude and offensive. When speaking with non-native English speakers, it is important to slowdown, not raise voices, and give plenty of timefor translation. Students will need to be madeaware of these communication skills. Theimportance of projecting a friendly, team-orient-ed image with respect for cultural diversity cannot be overstated.
Assessing ResourcesAt this fourth stage, teachers begin looking
at their classroom resources to see if there arehardware or software gaps. They would beginby thinking about how many computers theywill need to keep the students productive. Theywill need to know how many of the computerswill have Internet access. What level of Internetaccess should the teacher allow the student isanother important question. If Web sites withclassroom photographs are being considered, acopyright talent release form will have to bewritten and distributed to parents. Teacher fundsmay need to be set aside for the cost of theISDN lines used during teleconferences.Overseas mailing costs for curriculum materialswill have to be arranged. Software might haveto be installed and tested. If the computer anddistance learning technologies are outside theclassroom, the teacher will have to set exacttimes and schedule these with the schools inboth countries. The teacher will also need toinvestigate educational Internet sites forresources. The technology studies teacher spentcountless hours looking at NASA sites on theinternational space station. Before writing URLaddresses into student handouts, a teachershould check all to make sure they are stilloperative.
ConclusionThe use of computer-mediated communica-
tion is increasing exponentially in the UnitedStates. Whether schools realize it or not, thisincreased use of technologies works to engagelearners in ways that increase understanding andstudent success. When instructional techniquesenlist more than a learner’s logical/mathematical
intelligence, student motivation to learn increas-es. Students experience success and concludethat school is relevant in their lives.
When global education, international col-laboration, and authentic/applied learning projects are incorporated with increased use ofcomputer-mediated communication technolo-gies, student interest and motivation to learn isenhanced. All students, gifted to specific learn-ing disability, can benefit from exposure to thisinstructional strategy. The role of the teacher iscrucial. Instructional strategies should bedesigned to include computer-mediated commu-nication technologies. The benefits to studentsfar outstrip the planning that is required.Computer-mediated communication can form apowerful integrated model of human learningand intelligence. This model provides teacherswith the tools to meet high standards. The out-come of comprehensive planning is studentswith better attitudes and understandings of thecultures and values of students in other parts ofthe world. Students will become lifelong learn-ers, adaptable to change, and better prepared fortheir future work and careers.
In the initial phase of an international col-laborative project, the teacher will need to workdiligently to plan and organize before presentingthe project to their students. This planning stageincludes setting the instructional goals, decidingon the project, developing prerequisite skills inthemselves and their students, and assessingtheir resources. The benefit of this planning willbe an international collaborative project thataffects learners and teachers in profound ways.According to Jensen and Loveland (2000),“when learning environments mirror the restruc-tured work that students will eventually enter,they provide students with opportunities to seehow what they are learning in school adds valueto their lives” (p. 371). The new interconnected-ness of the world is a reality that teachers canutilize to develop projects that will prepare theirstudents for the career world they will be facingupon graduation. According to Thach andMurphy (1994):
Suddenly, separate cultures, laws, regula-tions, and customs have been broughttogether in a kaleidoscope of learning. The result is chaotic, fun, challenging, andanxiety-producing; it challenges all of thosewho work in the field of distance education
17

Th
e J
ou
rna
l o
f Te
ch
no
log
y S
tud
ies
References
Barron, A., & Ivers, K. (1998). Multimedia projects in education: Designing, producing, and assessing. Englewood, CO: Libraries Unlimited.
Blank, W. (1997). Authentic instruction. In W. Blank & S. Harwell (Eds.), Promising practices for connecting schools with the real world (pp. 15-21). Tampa: University of South Florida.
Bradsher, M. (1996). Making friends in the global village: Tips on international collaborations. Learning and Leading with Technology, 23(6), 48-51.
Branson, M. (1998). International education, citizenship, and national standards. Social Studies Review, 37(2), 18-21.
Fish, L. (1982). Alternative patterns of international collaboration for school improvement: An analysis of activities of the OECD/CERI Pacific Circle Consortium. Portland, OR: Northwest Regional Educational Laboratory. (ERIC Document Reproduction Service No. ED 214 827)
Franks, P. (1998). The world association for cooperative education: Filling a need for a strong global partnership. The Journal of Cooperative Education, 33(2), 68-73.
Hughes, S., & Ortero, G. (1989). Global education for the secondary and college student. The Political Science Teacher, 2(1), 21-23.
Jenkins, J., & Loveland, T. (2000). Educational opportunities in the global village.International Journal of Educational Reform, 9(4), 369-372.
Lauda, D. (1992). Internationalizing the curriculum in technology education. In D. Blandow & M. Dyrenfurth (Eds.), Technology literacy, competence and innovation in human resource development (pp. 464-470). Weimar, Germany: Thuringer Algemeine.
McLaughlin, C., Jr. (1996). Implications of global change: Technology education’s role.The Technology Teacher, 55(5), 14-18.
Miyakawa, H. (1998). Study on the fostering of self-educability in technology education: A consideration about practical teaching materials in “information technology” area. The Bulletin of Center for Research, Training and Guidance in Educational Practice, 1, 29-37.
National Advisory Board on International Education Programs. (1983). Critical needs in international education: Recommendations for action. Washington, DC: Department
of Education.
Resnick, L. (1987). Learning in school and out. Educational Researcher, 16(9), 13-20.
Scarborough, J. (1991). International perspectives on technological literacy. In M. Dyrenfurth & M. Kozak (Eds.), Technological literacy (pp. 54-55). Peoria, IL: Glencoe.
Thach, L., & Murphy, K. (1994). Collaboration in distance education: From local to international perspectives. The American Journal of Distance Education, 8(3), 5-21.
Weinbaum, A., & Rogers, A. (1995). Contextual learning: A critical aspect of school-to-
work transition programs (Report No. RR1172012). Washington, DC: Academy for Educational
Development, National Institute for Work and Learning. (ERIC Document Reproduction Service
No. ED 381 666)
18
to broaden their perspectives, to strive forthe implementation of best practices; and to encourage collaboration whilerespecting individual, group, and institutional integrity. (p. 17)
Dr. Thomas Loveland is a professor in theTechnology Education Department at St.Petersburg College in Florida. He is a member
of Eta Field Chapter of Epsilon Pi Tau. Dr. Hidetoshi Miyakawa, DTE, is a profes-
sor of technology education and director of theITEA-Japan International Information Center atAichi University of Education in Japan. He is amember-at-large of Epsilon Pi Tau.
Mr. Yoshitaka Hirayama teachesInternational Communications at YumegakuenHigh School in Mie, Japan. He is a member of

Th
e J
ou
rna
l of Te
ch
no
log
y Stu
die
s
19
Political Dimensions of School andCommunity Cooperation
The secondary school work environment oftechnological education teachers in Ontario haschanged. These teachers cope with pressuresfrom the Ontario Ministry of Education (OME),business and industry, and the public at large forincreased community involvement in educationand for relevant student learning that is connect-ed to life outside of school. This is whatRuddick (1999) referred to as the pressured,political dimensions of partnerships. Manyreports have portrayed this dimension of part-nerships at the national level in Canada (Dave,1976; Dryden, 1986; Human ResourcesDevelopment Canada, 1994, 1995) and at theprovincial level in Ontario (Premier’s Council,1994; Royal Commission on Learning, 1994a,1994b, 1994c, 1994d).
In Ontario, a past policy document (OntarioMinistry of Education and Training [OMET],1995) for secondary school technological educa-tion introduced the concept of partnership. Onechapter, titled “The Learning Environment,”consists of four subsections: the facility,resources, the role of the teacher, and processand project management. The latter subsectionstates:
It is necessary for students to move to dif-ferent areas in the school or out into thecommunity in order to complete projects.The teacher will need to work in close co-operation with all stakeholders (students,parents, community members, other teach-ers, and administrators) to co-ordinate thecontributions of all those participating inthe students’ activities and to address anyconcerns related to them. (p. 13)
The next chapter, titled “Considerations inProgram Development,” consists of seven sub-sections, one of which is school-communitypartnerships. This subsection argues:
In order to maintain and strengthen theirconnections with the community, schoolsmust involve community members andgroups in its planning, delivery, and evaluation of all broad-based technologyprograms. Schools should consult withcommunity representatives on a regularbasis in order to identify new needs as theyarise and allow programs to be adjustedaccordingly. (p. 16)
A new policy document (OME, 2000) nowreplaces the 1995 document, but the idea ofpartnerships remains.
In general, technological education pro-grams should be designed to take advantageof local opportunities for students to com-bine work experiences with classroomlearning. Programs may be modified toreflect community needs. In-class and out-of-class components must be carefullymatched and monitored so that students’experiences are relevant and authentic. (p. 200)
Community-Based Projects inSecondary School TechnologicalEducation
Research in technological education (Hill,1996, 1997, 1998, 1999) has documented that itis not solely the project that is important in proj-ect-based learning. While the project providesthe environment for students’ active engagementin their learning, the teacher alone frequently
Secondary School, University, and Business/Industry Cooperation Yields Benefits to Technological Education StudentsBy Dr. Ann Marie Hill

Th
e J
ou
rna
l o
f Te
ch
no
log
y S
tud
ies
defines the project. The experience of makingsuch projects may not be directly relevant,authentic, or meaningful to students’ lives.Dewey (1977) stated: “It is not enough to insistupon the necessity of experience, nor evenactivity in experience. Everything depends uponthe quality of experience” (p. 27). He describedtwo aspects of quality: “There is an immediateaspect of agreeable or disagreeableness andthere is its influence upon later experience” (p. 27).
Projects become more meaningful to stu-dents when the technological problem-solvingexperience is situated in and relevant to theirlives, such as involving them in the communityin which they live. A real-life context sets realhuman needs for projects and this in turn estab-lishes relevant activities for authentic learning.The learning environment in this approach shiftsfrom a situation of project-based learning,which is typically teacher conceived and of lessinterest or relevance to students, to community-based project learning, where students areinvolved in projects from their community,called community-based projects. The commu-nity is typically the immediate community serviced by the school, but it can expandbeyond local geography. Community partnerscan be business or industry-large or small—which are located in the community, local families, the school itself, or the school board.Students design projects for community part-ners, and the community partners provideresources and expertise to students.
A community-based project approach tolearning allows students to meet real humanneeds in their technological education courses;they carry out technological design for an identified need of a community member. Suchprojects encourage working cooperatively withpeople inside and outside of school. As studentsmeet with their community partners and withexperts in the community, they recognize otherpeople as important learning resources. Theyalso become motivated and engaged in theirown learning. Programs that reach out to theworld outside of school provide a means for relevant student learning and a stimulating andviable educational experience for students. Thegap between school and life outside of school isalso reduced as students see applications forwhat is learned in school and are presented witha new range of choices and opportunities from
these community experiences.
Community-Based Projects Applied ina Manufacturing Technology Program
Hill and Smith (1998) examined a second-ary school in southeastern Ontario where gradu-ates and others familiar with the setting spokehighly about a particular program and theteacher who had received national recognitionand teaching awards for his work in the school.The teacher’s program in technological educa-tion consisted of courses in ManufacturingTechnology, Grades 9 through 12. One Grade 10class and one Grade 11 class were studied intensively during a five-month period.
The CurriculumThe curriculum content for both Manu-
facturing Technology courses, Grade 10 andGrade 11, included: the technological designprocess, interpreted as a problem solvingprocess; mechanics (stress and strain, strengthof materials, gears, pulleys and belts); powersystems (electrical, pneumatic, hydraulic); con-trol theory; skills building using tools andequipment (including computers); and groupwork. There were also different communityprojects ongoing simultaneously in any onecourse as students worked in groups with different community partners.
Community-based projects during the yearof the research ranged from bike cars, a biketrailor, and classroom objects for teaching tech-nology at local elementary schools to projectswith local business and industry. A gardeningtable and a laundry bin device were created fora local retirement home, and a spool rewind system prototype was created as part of the production process of a large multinational tire producer.
The TeacherThe teacher had worked as an engineer
in a large multinational firm and had changedcareers to become a teacher. He had begun histeaching career teaching physics and mathemat-ics and after several years became a technologi-cal education teacher. His main reason for thechange was that the pedagogy used in techno-logical education courses “fit” with his philoso-phy of teaching. In an interview, the teacherdescribed the impact that the change in subjectarea assignment had had on him, and his adop-tion of a project-based approach to teaching thatincluded community involvement:
20

Th
e J
ou
rna
l of Te
ch
no
log
y Stu
die
s
I started teaching in the conventional man-ner. I was at the front of the class, youknow, going away at a bunch of people sit-ting in front of me, and...my sense of what I got back was that people weren’t learning.True, they were able to regurgitate, butthat’s not learning. They weren’t learning. It wasn’t registering....The material wasfine, but somehow it just didn’t have a con-text, and I was beginning to think aboutways, at that point, about how to make itrelevant to the kids....I think the context isreally the important thing....You know, justteaching the physics or a mechanics princi-ple in pictures doesn’t compare to some-body going and picking up something,pulling on it, and then by drawing a littlesketch...just having that tangible holding-oncontact makes all the difference to me. And so it grew there. I started thinking,well if that’s the case, why don’t we trybuilding something, and [I] began a longprocess of learning how to do that. (DH,1
personal communication, March 13, 1996)
He described “learning in context” as“being able to put together the doing somethingand the understanding of doing something.” His example of what he meant was based on lifeexperience. “I was doing physics problems withmy daughter...after doing a bunch of problemson paper, little pictures—I asked her ‘What’sthat for?’ and she didn’t have any idea...that’swhy I say...it’s not understanding...it didn’t haveconnection to the kids’ lives” (DH, personalcommunication, March 13, 1996). His life expe-rience had led him to technological educationwhere he involved the community in studentprojects in order to create a learning environ-ment where students could learn in a contextthat was connected to their lives.
The StudentsThe students in these two classes were both
male and female with a wide range of interestsand abilities. The Grade 10 ManufacturingTechnology class consisted of 14 students: 12male and 2 female. Grades on completed cours-es toward an Ontario secondary school diploma(OSSD), across all subjects, ranged from 51%to 95% for the males and 78% to 96% for thefemales. The students’ age varied from 16 to 19
years. There were 19 students enrolled in theGrade 11 class: 14 male and 5 female. Theirgrades on completed courses toward an OSSDranged from 23% to 97% for the males and 62%to 100% for the females. This group had com-pleted more OSSD courses. As well, their agerange was more uniform ranging from 17 to 18years. Student interviews from both gradesrevealed that students enrolled in the course fora variety of reasons: from gainful employmentdirectly related to the technological educationcourse to continuing on to university engi-neering programs.
Benefits of Community-BasedProjects to Secondary SchoolStudents
Community partners, the school principal,and students all commented on the benefits ofschool and community cooperation in the delivery of technological education at the secondary school level.
Community Partners’ PerspectivesThere were many community partners
associated with the Manufacturing Technologycourses. Data from one large-sized companyand one medium-sized company are reportedbelow. Both reveal similar perspectives aboutthe knowledge, skills, and values deemedimportant for high school students and howpartnerships assist students to close the gapbetween school and life beyond school.
Large-sized company. A major internationaltire producer had worked with the secondaryschool for several years. Company contact peo-ple assigned to work with the school wereselected for their technical abilities associatedwith class projects. One assigned contact persondescribed his role in the cooperative project forthat year: “I present them with the problem andallow them to come up with their own ideaswithout telling them what I think is the solu-tion” (SD, personal communication, March 22,1996).
Initially he described the skills, knowledge,and attitudes needed by students graduatingfrom high school in terms of generic skills suchas the ability to be flexible, solve problems, dealwith any situation effectively and in a timely
21
1 For purposes of anonymity in this qualitative study, pseudonyms in the form of initials were assigned
to represent real names.

Th
e J
ou
rna
l o
f Te
ch
no
log
y S
tud
ies
manner, continually adapt and learn, and workwith other people on a team. He stated that spe-cific skills were best learned in the workplace.“I think that technique and the ability to do, thatis more what they learn [in the workplace]”(SD, personal communication, March 22, 1996).
When asked to explain why specific skillsshould be learned “on the job,” he providedmore detail. “The need for specific skills… isgoing to be really dependent on where you’retrying to place them in the company.” Heexplained that if an employee were hired as awelder or an electrician, he would hire “some-body who has some sort of detailed [skills]background.” As such, the company wouldexpect the applicant to bring these skills to thejob. However, when an applicant was hired towork in production, the company provided spe-cific training. “If you’re talking about a lot ofour production jobs, the skills that are involvedare not things that you would normally learnfrom an educational institution,” because theskills required were specific to that company’sproduction process. When he described qualitiesof applicants who were hired to design andimplement company projects, he said, “Then inmy opinion you’re looking more at a problemsolver who works with other people” (SD, personal communication, March 22, 1996).
He cautioned against only specific skillstraining in secondary school. Instead, hedescribed the role of secondary school techno-logical education courses in terms of genericskills. “So the most important thing in my opinion wouldn’t be learning a particular func-tion or craft or whatever. It would be becominggenerally knowledgeable and flexible, to be ableto adapt, to learn” (SD, personal communica-tion, March 22, 1996).
In discussion about students obtaining specific technical abilities while participating in community-based course projects, he recog-nized the importance of technical skills to makethe artifact and generic skills to work in a groupand move through the design process. He alsorecognized the value of creativity in these proj-ects and the confidence that such a processinstilled in students. “It’s the getting there andthe learning it...and getting the confidence of,‘Hey, I can do this! I can do more!’, that attitude” (SD, personal communication, March 22, 1996).
Clearly, it was not only the acquisition and refinement of generic skills that moved student projects to completion. Knowledge andskills from many different technical areas wererequired for project completion. This large com-pany also required, for certain jobs, skilled andtechnical employees, but even these individualsneeded generic skills as well.
Medium-sized company. Interviews with thecontact person from one medium-sized compa-ny, a retirement home, also revealed a need forgeneric skills in the workplace. This work envi-ronment used a different model for teamwork.First, all employees were part of a team. Second,the teams were comprised of people with differ-ent skilled backgrounds who worked togetherfor a common goal—“to maintain the quality oflife” for each elderly resident. “All our teamsare composed of maintenance, housekeeping,health care aides, psychologists, right up to theadministration. Every committee has those peo-ple on it” (LA, personal communication, March 22, 1996).
The contact person for this care agencydescribed that while she brought to the team askill, she was also required to move beyond anarrow job description when needed and tochange her skills as the job evolved. Shedescribed job requirements as flexible (“My job here is housekeeping...but I also do otherthings...the cleaning staff [are] very involvedwith the residents...with the residents’ care—emotional care”; LA, personal communication,March 22, 1996) and as requiring on-going edu-cation (“We have to attend care conferences....Your job is not always what it appears to be”;LA, personal communication, March 22, 1996).She saw her role as sharing this with students,as well as providing them with project poss-ibilities to better the life of the residents.
The School PrincipalThe principal was very supportive of all
students’ life goals. He believed in makingschool relevant so students’ secondary schooleducation would be meaningful to them. When talking about the qualities important forgraduates, the school principal saw three impor-tant areas of an adolescent’s development: per-sonal qualities, general qualities, and specificskills. Personal skills were described as a senseof responsibility, recognition of the importanceof learning, and honesty. General skills weredescribed in terms of literacy, numeracy, science
22

Th
e J
ou
rna
l of Te
ch
no
log
y Stu
die
s
literacy, technical literacy, computer literacy,and data processing.
He talked about specific skills in the con-text of students in their senior high school yearsand students moving toward employment. Here,he pointed out the necessity and importance ofspecific skills. “If you’ve got two students goingfor a job in autobody...they both have the per-sonal skills that allow them to function in theworkplace. Who is that employer going tohire?....Well, my experience tells me they aregoing to hire someone with specific skills”(MD, personal communication, March 3, 1996).The principal recognized that school-communitypartnerships provided benefits to students. Theyprovided relevant learning opportunities for stu-dents and helped close the gap between schooland life beyond school.
StudentsBoth Grade 10 and Grade 11 students
appreciated their Manufacturing Technologycourses for the relevance the courses brought totheir learning. The teacher’s reasons for engag-ing in this approach to teaching were qualifiedby what students said.
Grade 10 students talked about the benefitsof community-based projects in their course.Their comments revealed that the course affect-ed their learning in other subjects and theiroverall secondary school experience. They usedwords related to not boring (“constantly do dif-ferent things,” “moving around,” “not formal,”“you don’t actually realize that you’re learning”)when talking about the course. They indicatedthat in learning by doing, the course was likereal life and that the theory and practice combi-nation made their learning more challenging.Community-based projects were described asproviding varied, not narrow, experiences andthat the combination of theory and practiceafforded in community-based projects madelearning relevant. “It gives you like, you knowhow school is. School, and then you want togrow up, and leave, do other stuff that has noth-ing to do with school. Both together, you don’tfeel like you are doing it for no reason. Likemost schooling is” (SA, personal communica-tion, December 5, 1995).
Grade 11 students revealed similar benefitsof community-based projects in their course. As well, they were cognizant of the social bene-fits of community-based projects. “If we didn’t
do it, then a lot of things wouldn’t get done [inthe community]” (HI, personal communication,November 17, 1995). “It’s profitable for bothpeople. They [the community] get somethingthat they can use, that they need, and we get theexperience of building it, of working on it for anentire semester” (JE, personal communication, November 17, 1995).They also appreciated the challenges that thiscourse offered them and they were aware of how it contributed to their plans for life beyond school.
These courses benefited students in moreways than just narrow skill acquisition. Problemsolving, decision making, creativity, teamwork,social responsibility, trust, and continuousimprovement and learning were evident in thecommunity-based projects.
Impact of Community-Based Projectson Teachers
Course delivery through cooperationbetween secondary schools and the communityhas a direct impact on the day-to-day life ofteachers. Hill and Hopkins (1999) wrote thatfrom the teacher’s perspective, it is feasible touse community-based projects in secondaryschool settings. One important factor is simplyto get started by establishing links with thecommunity. Once this first step is complete,additional opportunities arise by word of mouth.
Structurally, there is very little change to aschool day with this approach. There is the samenumber of classes per day and teachers stillhave to prepare for their classes. What changesis how teachers go about their teacher lives.Each day, each class, each period is never thesame, never repetitive. Students’ needs andactivities are never entirely predictable. How-ever, the curriculum is predictable. Course con-tent guides the course, but activities used tolearn the content are not as predictable. At theonset of a course, the teacher spends a substan-tial amount of time thinking about how to matchcourse content to community projects. Onceprojects are selected, the teacher must carefullyschedule student acquisition of content toadvance student projects.
The classroom setting also changes withthis mode of delivery. There is a need for a technology laboratory or “shop” area, whetherwithin or separate from the classroom. In addi-tion, the teacher’s workplace moves beyond only
23

Th
e J
ou
rna
l o
f Te
ch
no
log
y S
tud
ies
the school and classroom/laboratory setting intothe community. Community members bothattend class and are part of the course. Also, students and teachers go to community settings.Human and nonhuman community resources ofall kinds are sought out and used. Thus, teachersrelinquish a more authoritative role in theirclassrooms for the role of facilitator.
The teacher’s role changes significantly inthis model from the conventional transmitter ofknowledge to the facilitator of learning. Thepurpose for student learning is not because theteacher wants students to learn something, butbecause students need to learn to advance theircommunity-based projects. The focus of classtime is on the learner. The learning environmentbecomes more interesting for students and chal-lenging for the teacher. The challenge is todevelop the confidence to be a risk taker and to go beyond the boundaries of convention.
However, this pedagogical approach doesnot come without added pressures for teachers.There is pressure to succeed on various levels.Projects must successfully meet communityneeds and be completed within a negotiatedtime frame, typically by the end of a semester orat least by the end of the school year in the caseof larger projects. The teacher takes on personalresponsibility for successful completion of proj-ects. The teacher’s reputation and the program’slivelihood rest on the teacher’s ability to managesuch a program. There are also day-to-day pres-sures that arise from teaching courses wherestudents work on different projects. Attention todetail in the beginning weeks of school is para-mount, as evidenced in the following excerptfrom the Manufacturing Technology teacher’saudiotape journal: “Getting these things set upand organized is probably the most importantthing you can do; getting a proper definition of what the technology project is, getting a goodrelationship with the clients...getting the kids tounderstand the size and definition of the proj-ect” (DH, personal communication, September 6, 1995).
But this teacher believed that a community-based project approach was well worth theeffort on his part. Experience had shown himthat many students do not learn well in a tradi-tional teacher-centered classroom. He still usedmore traditional approaches to teaching, forexample, a 10-minute lesson at the beginning of class or a small teacher-focused project for
content not covered through community-basedprojects. However, this represented teachingmoments within the activities of the com-munity-based projects, not a main pedagogicalapproach.
After several years of examining the com-munity-based project approach in technologicaleducation courses, new teacher organizationalskills and knowledge have emerged, includingthe ability of the teacher to:
• Have faith in students’ abilities to learn.Relax in being a facilitator.
• Teach a short lesson of about 10 minutesat the beginning of every 70 minute class,and then trust and manage.
• Rearrange expectations of the teacher andstudents, for example:
- Don’t spend too much time with onegroup, one project.
- Give students encouragement andclues, and then move to anothergroup.
- Encourage students to ask theteacher for help when needed.
- Inform students that if they are wait-ing for teacher help, or for the com-munity partner visit, etc., they shouldbe doing some other activity whilewaiting.
- If students need materials, they areresponsible to make a list and give itto the teacher.
- Inform students they are also respon-sible for their learning.
• Accept that they do not know everything,that they are not the purveyors of allknowledge for all projects. Students areresponsible for their learning also. Thenthe teacher can focus on managing students’ learning and projects.
• Be enthusiastic and energetic.• Be an on-going learner.• Use human and resource materials in the
world outside of school.
Community-Based Projects andTeacher Education
Teacher education programs can model secondary school classrooms that link with thecommunity. Remembering that artifacts, systems, and processes are supposed to meethuman needs, in teacher education courses,teacher candidates would be required to findprojects based on community needs. In doingso, they would experience the technological
24

Th
e J
ou
rna
l of Te
ch
no
log
y Stu
die
s
problem-solving process that they in turn wouldexpect their secondary school students toengage. The community can be inside or outsideof the class.
The teacher education program at Queen’sUniversity, Ontario, engages teacher candidatesin both teacher-directed and community-basedprojects. In 1995-1996, examples of communi-ty-based projects to meet needs outside of theteacher education class were “The EmergencyFirst Aid Backpack,” a specially designed back-pack to carry emergency supplies and equip-ment to remote locations; the “Exit Buddy,” a device that enables firefighters to quicklylocate exits in dark, smoke-filled rooms;“Uropia,” a lightweight, portable rope course;“The Art Kart Centre,” a space organizing sys-tem for elementary school classrooms; and a“Support Table” for last year’s project, the “ArmRehabilitator 2000.” Projects that met in-classneeds were a “Multimedia Interactive CD,” aninformation program designed for the WorldWide Web about Queen’s University’s techno-logical education program; and an “InformationVideo on Broad-Based Technology” to introducehigh school students, staff, and the local com-munity to the study of technology in secondaryschools.
In 1994-1995, examples of community-based projects were the “Arm Rehabilitator2000,” designed for stroke patient therapy atSaint Mary’s of the Lake Hospital (Gubbels,1995), and the “Environmobile 2000,” a solar-charged battery land vehicle made from oldbicycles and an old chair. The former met anoutside community need while the latter met aninside (class) community need. In 1993-1994,projects included an “Equestri-Lift” for physi-cally challenged equestrian riders and a “WindPowered Generator.”
As teacher candidates move through theircommunity-based projects, discussion focuseson the transfer of their university experienceinto secondary school classrooms. They begin to think through what it means to act as facilita-tors. They begin to understand the connectionbetween the notion of facilitator, the negotiationof meaningful student projects, and alternativeways to deliver course content (see Boomer,1990). In the latter, the critical teacher skill is to be able to plan student learning of skills andknowledge to allow students to advance theircommunity-based projects. Teacher candidatesalso discuss ways to weave values and humanand environmental concerns into classroom talkand to provide a learning environment for sec-ondary school technological education studentsthat fosters creativity, exploration, critical think-ing, and connections to what is learned in otherschool subjects and to life beyond school.
ConclusionResearch about school and community
cooperation to deliver technological educationprograms at both secondary school and teachereducation levels in Ontario, Canada, has documented that such collaborative classroompractice is not only possible in technologicaleducation, but is highly desirable because manymodern theories of learning are seen in this educational practice (Hill & Smith, 1998).Collaboration between schools and communitypartners augments both secondary and universi-ty student learning and allows business andindustry to give something back to the community from which they benefit.
Ann Marie Hill is a professor of Educationand coordinator (Technological Education) atQueen's University, Kingston, Ontario, Canada.She is a member-at-large of Epsilon Pi Tau.
25
References
Boomer, G. (1990). Empowering students. In M. Brubacher, R. Payne, & K. Rickett (Eds.), Perspectives on small group learning: Theory and practice (pp. 42-51). Oakville, Ontario, Canada: Rubicon.
Dave, R. H. (Ed.). (1976). Foundations of lifelong learning. Oxford, United Kingdom: Pergamon Press.
Dewey, J. (1977). Experience and education (20th printing). New York: MacMillan Collier.
Dryden, K. (1986). Report of the Ontario youth commissioner. Toronto, Ontario, Canada: Queen’s Printer for Ontario.
Gubbels, A. A. (1995, April 25). Machine aids stroke victims: Graduating students develop device. The Kingston Whig Standard, p. 10.

Th
e J
ou
rna
l o
f Te
ch
no
log
y S
tud
ies
26
Hill, A. M. (1996). Relevant learning in technology education: A community-based project approach. Paper presented to the Curriculum Studies Department, Faculty of Education, The University of British Columbia.
Hill, A. M. (1997). Community projects in technology education. Paper presented to the School of Graduate Studies, Faculty of Education, Monash University.
Hill, A. M. (1998). Problem solving in real-life contexts: Alternatives for design in technology education. International Journal of Technology and Design Education, 8(3), 203-220.
Hill, A. M. (1999). Community-based projects in technology education: An approach for relevant learning. In W. E. Theuerkauf & M. J. Dyrenfurth (Eds.), International perspectives on technological education: Outcomes and futures (pp. 285-298). Braunschweig, Germany: Braunschweig/Ames.
Hill, A. M., & Hopkins, D. (1999). University/school collaboration in teacher education. In M. Lang, J. Olson, H. Hansen, & W. Bunder (Eds.), Changing schools/changing practices: Perspectives on educational reform and teacher professionalism (pp. 171-182). Louvain, France: Garant.
Hill, A. M., & Smith, H. A. (1998). Practice meets theory in technological education: A case of authentic learning in the high school setting. Journal of Technology Education, 9(1), 29-41.
Human Resources Development Canada. (1994). Improving social security in Canada. A discussion paper. Hull, Quebec, Canada: Minister of Supply and Services.
Human Resources Development Canada. (1995). Ontario’s occupational prospects (1995 to 1997).Toronto, Ontario, Canada: Queen’s Printer for Ontario.
Ontario Ministry of Education and Training. (1995). Broad-based technological education. Grades 10, 11, and 12. Toronto, Ontario, Canada: Queen’s Printer for Ontario.
Ontario Ministry of Education. (2000). The Ontario curriculum. Grades 11 and 12. Technological education. Toronto, Ontario, Canada: Queen’s Printer for Ontario.
Premier’s Council. (1994). Yours, mine and ours: Ontario’s children and youth. Phase One (Report ofthe Steering Committee of the Children and Youth Project to the Premier’s Council on Health, Well-Being and Social Justice). Toronto, Ontario, Canada: Queen’s Printer for Ontario.
Royal Commission on Learning. (1994a). For the love of learning. Vol. I. Mandate, context, issues.Toronto, Ontario, Canada: Queen’s Printer for Ontario.
Royal Commission on Learning. (1994b). For the love of learning. A short version. Toronto, Ontario, Canada: Queen’s Printer for Ontario.
Royal Commission on Learning. (1994c). For the love of learning. Vol. II. Learning: Our vision for schools. Toronto, Ontario, Canada: Queen’s Printer for Ontario.
Royal Commission on Learning. (1994d). For the love of learning. Vol. III. The educators. Toronto, Ontario, Canada: Queen’s Printer for Ontario.
Ruddick, J. (1999). Teacher practice and the student voice. In M. Lang, J. Olson, H. Hansen, & W. Bunder (Eds.), Changing schools/changing practices: Perspectives on educational reform and teacher professionalism (pp. 41-54). Louvain, France: Garant.
Notes1 This paper is in part derived from research conducted by A. M. Hill and H. A. Smith. The research
was supported by a Strategic Grant from the Social Science and Humanities Research Council ofCanada (SSHRC) under the theme Science Culture in Canada.
2 An earlier version of this paper was presented to the International Conference of Scholars on Technology Education, Technische Universitat Braunschweig, Braunschweig, Germany,September 24-27, 2000.

27
Distance Education for Technology TeachersBy P. John Williams
This article describes a distance education
approach that has been developed and imple-
mented in Mauritius, Seychelles, and Botswana
to help overcome limited teacher training oppor-
tunities and so help meet the demand for well-
qualified technology teachers. It outlines the
principles of course design, the mixed mode
of delivery, and some of the issues of course
delivery derived from program evaluations.
Technology in its current form is a relative-
ly new subject; it has a brief history in schools
as a component of general education (deVries,
1993; Layton, 1993). In some countries it has
derived from vocational programs such as in
Taiwan and Australia, and in others it is influ-
enced by craft subjects such as in Sweden.
Traditional technology education has also gener-
ally been gender biased, with activities designed
to reflect gender stereotypes. The new technol-
ogy education is moving away from narrow
vocational preparedness and from gender speci-
ficity. The culture of school technology identi-
fied in the early 1990s (Layton, 1993; Puk,
1993) is developing, though still in its infancy,
into a new paradigm about values, practices,
content, methodologies, and capability
(Kimbell, 2003).
The developing patterns of technology edu-
cation in many countries challenge some of the
traditional characteristics of schooling such as
the decontextualization of knowledge, the pri-
macy of the theoretical and secondment of the
practical, and the organization of the curriculum
along disciplinary lines. In contrast, technology
education emphasizes the context of the techno-
logical activity, learning is achieved through the
interaction of theory and practice, and it is inter-
disciplinary.
Some of the trends in technology education,
which are obvious in a number of countries,
include a movement from:
• Teacher as information giver to teacher as
facilitator of learning.
• Teacher-controlled learning to teacher-
learner partnership.
• Teacher-centered learning to student-
centered learning.
• Time, age, and group constraints to
individualized learning.
• Materials-based organization to needs-
based activity.
• Product-centered to process-centered.
• Elective area of study to a core subject.
• Social irrelevance to socially con-
textualized.
Within the context of these trends, there is
also a great degree of diversity throughout the
world in technology education (Williams,
1996b). This diversity ranges from the absence
of technology education in Japan (Elliot, 1990)
to its compulsory study by all students in Israel
(Israel Ministry of Education, Culture and
Sport, 1996), an instrumentalist approach in
Finland (Kananoja, 1996) to a basically human-
istic approach in Scotland (Birnie & Dewhurst,
1993), a focus on content in the United States to
a focus on the process in the United Kingdom,
an economic rationalist philosophy in Botswana
Th
e J
ou
rna
l of Te
ch
no
log
y Stu
die
s

Th
e J
ou
rna
l o
f Te
ch
no
log
y S
tud
ies
(Molwane, 1993) and China (Wu, 1991) to a
more liberal philosophy of science-technology-
society in the United States (Layton, 1988), a
staged and well-supported implementation of
change as proposed in South Africa (Ankiewicz,
1993) to a rushed and largely unsuccessful
implementation in England (McCormick, 1993),
integrated with other subjects such as science in
Israel, or as a discrete subject in Australia
(Williams, 1996a).
Both the commonalities and the diversity
are appropriate. The type of technology educa-
tion developed within a country must be
designed to serve that country’s needs and build
upon the unique history of technical education,
resulting in a unique technology education pro-
gram. This uniqueness challenges some of the
notions related to the internationalization of the
curriculum, particularly in the area of technolo-
gy education. Other more traditional disciplines
have developed an internationally acceptable
body of knowledge, but technology has not and
probably never will because of its variable his-
torical significance and the diverse needs of
different cultures.
Forms of Distance EducationA typical definition of distance education
is the delivery of instruction in a format that
separates the teacher and learner, often both in
time and space (Keegan, 1980). It tends to be an
umbrella term that may encompass more specif-
ic forms of education such as distributed learn-
ing, independent study, correspondence educa-
tion, satellite education, etc. The focus of this
discussion is text-based distance education, sup-
plemented by intensive face-to-face sessions.
The factors contributing to good quality
education are considered to be the same regard-
less of the mode of delivery, the country, or the
setting. This is because of the “no significant
difference” phenomenon associated with dis-
tance education research (Frost, 1998). The key
variables are the quality of content and the sup-
port provided for the students, not the technolo-
gy (Eastmond, 2000). “People learn as well
from traditional print based correspondence
courses as they do from the most slickly pro-
duced and/or interactive telecourses” (Russell,
1997, p. 6). If not designed and delivered well,
distance education, of whatever mode, will only
exacerbate poor quality instruction and com-
pound already existing educational problems.
It is difficult to find current research about
print-based distance technology education, this
having been overtaken by online and Internet
modes of delivery. Of the 558 articles on tech-
nology education referenced by this researcher,
and the 526 full-text online journals accessed
through WilsonWeb, a number of searches
revealed no research since 1990 on print-based
distance technology education.
A comparison of this research emphasis on
electronic forms of distance education with the
state of the world’s population in terms of com-
puter availability, phone lines, and arguably that
portion of the population in most need of educa-
tion indicates a significant imbalance (see Table
1). In low-income countries (40% of the world’s
population) there is one computer for every 250
people; in high-income countries (14.9% of the
population and generally the origin of online
distance education) there is one computer for
every three people. In low-income countries
there is one telephone line for every 37 people;
in high-income countries there is one for every
two people. There are about 400 million com-
puters in the world, and 300 million of them are
owned by 15% of the world’s population.
28
Table 1. Comparison of the World’s Population in Termsof Availability of Computers and Phone Lines
Category of Country
Low Income
High Income
% of WorldPopulation
40%
14.9%
PC’s/1000
4
346
PL’s/1000
27
583
Source: (World Bank, 2000).

Th
e J
ou
rna
l of Te
ch
no
log
y Stu
die
s
The United States and the former Soviet Union
have 15% of the world’s population but operate
50% of the geostationary satellites (World
Bank, 2000).
It would seem plausible to conclude that the
current direction of distance education research
is not serving the interests of the majority of the
population who need an education and are typi-
cally undereducated. This is compounded by the
high proportion of untrained and unqualified
teachers in low-income countries (Nielsen,
1997) and reinforced by the evaluation of dis-
tance education reported in this article.
Course DesignA teacher education course in technology
education derives its content from three main
sources. One is the educational system for
which the teachers are being trained. Infor-
mation from this source includes syllabi,
methodologies, school contexts, etc. The second
source is the technological activity that takes
place in society, and the third source is from the
discipline that is being studied, in this case tech-
nology education. The research and literature of
the discipline gives guidance on content, struc-
ture, learning patterns, and methodologies.
All these systems are vital sources for the
design of a teacher-training course in technolo-
gy education. Graduates need to be suited to the
system in which they are going to work, but
their tertiary studies should be more than a rep-
etition of the respective secondary syllabus at
a deeper level.
Each course reported in this article was
designed to accommodate the above characteris-
tics in the context of the appropriate education
system. This meant significant local input with
regard to the local educational system and the
social/technological context. It was found that it
is difficult to do this at a distance and requires
face-to-face negotiation. The core content and
instructional methods were derived from exist-
ing units of study, which were then customized
and contextualized to suit the specific environ-
ment. The background and learning styles of the
students are also important to consider, and to
some extent knowledge in this area develops as
the course proceeds. This revision and sensitiza-
tion process has been repeated each time the
course has been offered, as it is not possible
to internationalize a technology education cur-
riculum to the extent that it is generalizable
and relevant regardless of the country of
implementation.
A guiding principle of the course is that
students must learn how to learn. With technolo-
gy changing as rapidly as it is currently, there
is a limited life span in the skills students are
now taught. Students must be taught how to
independently develop new skills and how to
find out about new materials, equipment, and
systems. Then when the need later arises for
personal professional development or for school
development, teachers are well equipped for
the task.
The contextual goal of the courses is also
sustainable development within the country.
This applies to individual teachers who, as
a result of courses of study, will:
• develop relevant and current content
knowledge in technology education;
• incorporate contemporary pedagogical
skills into their teaching;
• be better equipped to guide the develop-
ment of young students; and
• understand international best practice in
technology curriculum development.
Typically, courses had to be designed quick-
ly. The identification of a market opportunity
was followed by the development and submis-
sion of a proposal to the key people in the mar-
ket. A lengthy delay at this stage could have
resulted in missed opportunities. The initial pro-
posal was clearly identified as a flexible starting
point for discussion and negotiation about the
structure and content of the course, and then
after a series of discussions and meetings, the
specifics were modified and developed later.
Initial proposals were not specifically cost-
ed, but a range of delivery options were out-
lined, with an indication of the relative expense
of each option. Sponsors do not necessarily
choose the least financially expensive option,
as other factors such as ease of administration
and perceived quality of delivery are important
factors. In one country the most expensive
29

Th
e J
ou
rna
l o
f Te
ch
no
log
y S
tud
ies
delivery option was selected because that was
the traditional approach to upgrading teachers
in that country.
If the market opportunity was identified by
a person not connected with the coordination or
delivery of the course, then it was found neces-
sary for a person expert in the content of the
course to visit the sponsors to negotiate the
course details, answer questions, and develop
an understanding of the environment in which
the course would be delivered. Important infor-
mation related to facilities and equipment,
prior experience and education of the potential
students, curriculum, cultural and regional
considerations, and local coordinators.
As a result of these initial visits and com-
munication, a specific and costed proposal and
course design was developed and signed by the
appropriate parties. Responsibilities of all
involved were specifically detailed. This detail
is essential and can significantly impact on
course success. For example, in one course stu-
dent consumables were the responsibility of the
local sponsors. This proved to be a greater
expense than was anticipated and would have
impacted significantly on university revenues.
Course Delivery and StructureThe Design and Technology Bachelor of
Education (Secondary) program is designed to
prepare students to teach design and technology
at all levels in the secondary school. The award
is granted after the successful completion of
four years of full-time study (or equivalent), that
is 8 semesters at 4 units each semester, or 32
units. The remainder of the suite of undergradu-
ate courses available in this area of D&T
include a three-year Bachelor of Arts degree,
a two-year Bachelor of Education upgrade for
diploma holders, and a one-year Bachelor of
Education upgrade for Bachelor of Arts degree
holders. These are all subsets of the 32 units of
the Bachelor of Education, which provides a
pool of units from which to select the most
appropriate for the specific market. So for
example, the 16 units of a two-year Bachelor of
Education upgrade offered in one country may
be different from that offered in another because
they are selected and matched to the specific
needs of the market.
The courses are delivered through a combi-
nation of distance mode and intensive work-
shops/lectures over a period of up to four years.
Students study part time, and enroll in two units
per semester. The part-time study involves read-
ings, assignments, assessment, and examina-
tions being forwarded to the students in concert
with a period of intensive lectures/workshops in
their country. This provides about 30 hours of
face-to-face interaction with the lecturer for
each unit and is delivered in about the middle
of each semester during the school holidays.
So students do some study both before and after
the on-site classes.
The advantages of this mode of delivery
include:
• no disruption to schools through the
absence of teachers;
• education activities, discussions, and
applications can be grounded in current
practice; and
• the opportunity for collaborative teaching
and research between local staff and
university lecturers.
The upgrade course consists of three types
of units:
• Education Studies: studies in the theory
of education, educational psychology, and
teaching studies and practice.
• Curriculum Studies: studies of relevant
curriculum resources and related teach-
ing.
• Content Studies: appropriate specializa-
tion content.
The balance of these units varies depending on
the local context and needs.
Some courses were proposed as a joint
venture between the university and the local
ministry of education (in the case of a spon-
sored cohort of students), with the provision of
concurrent opportunities for postgraduate study
(MEd or PhD) for local lecturers. This postgrad-
uate study can be done by distance, and oppor-
tunities for supervision and guidance would
arise through the undergraduate course activi-
ties. In some instances a fees-only postgraduate
study scholarship for the top academic student
has been provided upon completion of the
course. Other courses were advertised and
30

Th
e J
ou
rna
l of Te
ch
no
log
y Stu
die
s
offered to teachers who then are responsible for
their own fees.
Costs and ResponsibilitiesGenerally, distance education incurs lower
costs per student than traditional face-to-face
education, often generated through economies
of scale, but this is offset by large dropout and
repetition rates. The UK Open University has a
completion rate of 49% (200,000 students), 28%
at the Indira Gandhi National Open University
(431,000 students), and 10% at the Korean
National Open University. Completion rates
tend to be lower in less-developed countries as
students in those contexts typically enroll in dis-
tance programs as a matter of necessity rather
than from choice (Latchem, Abdullah, &
Xinhfu, 1999). The completion rates for the
courses described in this article vary from
90% to 100%.
For a specific program offered to a foreign
government by a university, the criteria which
form the basis of value-for-money decisions
include the reputation of the university, the level
of understanding of the delivery context, the
flexibility of both content and mode of delivery
options, fees, and politics.
In this situation the sponsor’s responsibili-
ties may include:
• nomination and resourcing of a locally
based program coordinator;
• recruitment of the cohort of teachers into
the program;
• the provision of an appropriate venue for
the on-site teaching;
• funding time off for course participants,
for example, one day/fortnight during
semesters;
• the provision of consumables and techni-
cal support for the on-site teaching;
• organization and funding of mentors; and
• organization and invigilation of examina-
tions.
The university’s responsibilities may
include:
• all costs associated with university or
local staff conducting the in-country
teaching;
• provision of all distance education
materials;
• implementing enrollment and recording
procedures;
• reasonable remediation of failing stu-
dents;
• setting and marking assignments and
examinations; and
• granting the relevant degree.
If the government sponsors the program, it
is funded on the basis of a specific number of
students being the minimum in the cohort. If the
number of students drops below that level, the
cost will be maintained. It is generally agreed
that a specific number of students above that
level can be enrolled for no extra cost. When
individual students are paying their own fees,
the university applies a formula of income
and costs to determine course viability.
IssuesThe following are some of the issues that
have arisen from the delivery of distance tech-
nology education to technology teachers and the
evaluation of those programs.
Level of Technology
Technology education in teacher training
serves the dual role of modeling experiences
and activities that teachers can implement in
their schools when they begin teaching and
experiences that enhance their understanding of
technology. Both are important because teachers
need starting points for their teaching, but also
need a sophisticated awareness of the nature of
technology. In extending educational experi-
ences across cultures, the correct balance, and
the justification of the balance between these
two goals, is imperative. In-country experts and
the students themselves can provide guidance
on achieving this balance. The principles of
appropriate technology become relevant in the
selection of technological activities and the
context of application of the processes of
technology education.
In relationship to the mode of delivery, the
instructional technology seems not to be a key
variable for success. As Frost (1998) has point-
ed out, any socially just delivery system must
ensure that we are not just servicing a small
group of well-off elites. New and advanced
31

Th
e J
ou
rna
l o
f Te
ch
no
log
y S
tud
ies
32
technologies will expose traditional cultures to
Western values and may create as many prob-
lems as it solves. Resulting unrealistic learning
behaviors may cause distance education to be
viewed as a cultural Trojan horse (Wennersten,
1997). So the level of technology must be at the
same time socially equitable, challenging to the
participants, and accessible.
Local Capacity Building
There is the recognition that as a result of
each course, apart from having better qualified
graduates, more local capacity to deliver the
course in the future should be developed. The
experience has been that unless such capacity
building is detailed in the initial contract, it is
very difficult to develop during the project.
People are very busy, and unless there is some
compulsion to undertake additional tasks, des-
pite any long-term advantage that may accrue,
opportunities will not be taken up.
The type of collaboration necessary to
achieve this end brings with it a number of dan-
gers. One is the danger of cultural imperialism,
which is difficult to resist when the visiting lec-
turers are presented as the international experts.
The other danger is the “trendy” aspect of col-
laboration. “Too often alliances are cobbled
together for the purposes of proposal submis-
sion. Alliances without ‘roots,’ without an
investment in partnership development, will
limit the potential for success of projects”
(Gerhard, 1997, p. 3).
Facilities
In some countries the facilities are not
available to offer units that would normally be
considered core units. For example, in technolo-
gy education these could relate to computer-
assisted drawing and machining, advanced
materials, electronics, and a range of computer-
based units. In some countries these units can-
not be offered; in others the unit content can be
modified to enable it to be offered in an appro-
priately contextualized way, for example, with
the use of share-ware software rather than
expensive commercially produced packages or
with local experts discussing local technologies.
Local Politics
There is invariably a political dimension
involved in the context in which the course is
delivered. A local course coordinator is invalu-
able in steering through the potential pitfalls of
teaching site selection and dealing with local
institutions and authorities, which may respond
to a variety of agendas. This can nevertheless
be a source of frustration as the sense of
urgency felt at the source institution about mate-
rial availability, for example, is not always repli-
cated in going through the protocols in the local
delivery context.
Lecturers
It takes some time interacting with a class
for a lecturer to develop a rapport with students,
and when they spend 30 hours together over one
or two weeks, the relationship seems to become
quite strong. Students do not want to go through
this “getting to know the lecturer” period with a
new lecturer for every unit. However, if the
“expert” in each unit is the person sent to do the
teaching, then many different people are
involved in a course. It has been necessary at
times to restrict the number of people involved
in course delivery in order to help ensure stu-
dent comfort.
In instances where it is appropriate to local-
ize course material, a local expert may be
involved in presenting to the students. This can,
however, be perceived negatively by the stu-
dents, who consider they are paying for an
overseas course and that is what they want,
not local lecturers.
Currency
Currency restrictions may inhibit the ability
of students to purchase course material. This
can occur at both personal and national levels
if there is close monitoring of the country’s for-
eign currency reserves. This has been overcome
at times by selling resources in local currency to
the students and then using that income for local
expenses of the project, but still may result in
curtailing the resources available to students.
Course Duration
Some of the students have been dissatisfied
with the duration of their course. They would
have preferred, for example, to study for three
semesters per year and complete a two-year full-
time course in under three years part time than

Th
e J
ou
rna
l of Te
ch
no
log
y Stu
die
s
to study for two semesters each year over four
years. This more intensive mode of delivery
places increased pressure on the source institu-
tion and may result in negative consequences on
other aspects of departmental activity.
Communication
Because standard means of communication
such as mail, Internet, and fax can be unreliable
or nonexistent, communication with both stu-
dents and coordinators in the host country can
be frustrating. Typically, some students have
Internet connections, and mail and fax are unre-
liable. This means forward planning is critical,
and normal processes may sometimes need to
be circumvented. For example, an unreliable
mail system resulted in a batch of exam papers
going missing and alternative strategies had to
be devised; and assignments, both to and from
students, are express mailed together to a central
location rather than to individual students.
ConclusionFor many students, text-based distance edu-
cation represents their only source of education-
al opportunity. In the area of technology educa-
tion, a successful mode of delivery incorporates
a period of intensive face-to-face interaction
with a lecturer. Detailed planning and the con-
textualization of both content and methodology
is vital, but flexibility in the implementation of
those plans is just as important in order to over-
come unforeseen barriers. Key variables for suc-
cess include high-quality content, appropriate
methods, and student support to enable them to
effectively utilize new knowledge.
P. John Williams is a senior lecturer and
coordinator in Technology Education at the
Edith Cowan University, Australia. He is a
member-at-large of Epsilon Pi Tau.
33
References
Ankiewicz, P. (1993, September). Aspects of planning of technology education for South African schools. Paper presented at the IDATER’93 Conference, Loughborough, United Kingdom.
Birnie, T., & Dewhurst, Y. (1993, April). Profiling technology within the Scottish environment.Paper presented at the PATT6 Conference, Eindhoven, the Netherlands.
de Vries, M. (1993). Technology education in the Netherlands. In R. McCormick & Others (Eds.), Teaching and learning technology (pp. 28-38). Wokingham, United Kingdom: Addison Wesley.
Eastmond, D. (2000). Realizing the promise of distance education in low technology countries. Educational Technology Research and Development, 48(2), 100-111.
Elliot, P. (1990, September). Study tour of Japan. Paper presented at the IDES 90 Conference, Edinburgh, Scotland.
Frost, C. H. (1998). Distance education for developing countries. International Education, 27(2), 56-67.
Gerhard, W. J. (1997). The care and feeding of partnerships. Paper presented at the 18th International Council for Distance Education Conference, Harrisburg, PA.
Israel Ministry of Education, Culture and Sport. (1996). Technology education in Israel. Tel Aviv, Israel: Amal Pedagogical-Technological Center.
Kananoja, T. (1996). The situation in Finnish technology education in 1995-1996. Unpublished paper,Oulu University, Finland.
Keegan, D. J. (1980). On defining distance education. Distance Education, 1(1), 13-36.
Kimbell, R. (2003). Reflections on the DATA Conference paradigm debate. The Journal of Design and Technology Education, 8(1), 12-17.
Layton, D. (1988). Revaluating the T in STS. International Journal of Science Education, 10(4), 373-378.
Layton, D. (1993). Technology’s challenge to science education. Milton Keynes, United Kingdom: Open University Press.
Th
e J
ou
rna
l o
f Te
ch
no
log
y S
tud
ies
34
Latchem, C., Abdullah, S., & Xinhfu, D. (1999). Open and dual-mode universities in east and southeast Asia. Performance Improvement Quarterly, 12(2), 96-121.
McCormick, R. (1993). Technology education in the UK. In R. McCormick & Others (Eds.), Teaching and learning technology (pp. 15-27). London: Addison Wesley.
Molwane, O. (1993, September). Developing technology education in Botswana. Paper presented at the IDATER’93 Conference, Loughborough, United Kingdom.
Nielsen, H. D. (1997). Quality assessment and quality assurance in distance teacher education. Distance Education, 18(2), 284-317.
Puk, T. (1993). The acculturation of technology education. The Technology Teacher, 52(7), 27-30.
Russell, T. L. (1997). The international implications of the videoclass system. Paper presented at the 18th International Council for Distance Education Conference, Harrisburg, PA.
Wennersten, J. R. (1997). Distance education and underdeveloped nations: Global learning or global baloney? Paper presented at the18th International Council for Distance Education Conference, Harrisburg, PA.
Williams, P. J. (1996a, January). Australian national technology education project. Paper presented at the Second Jerusalem International Science and Technology Education Conference, Jerusalem, Israel.
Williams, P. J. (1996b). International approaches to technology education. In P. J. Williams & A. P. Williams (Eds.), Technology education for teachers (pp. 266-290). Melbourne, Australia: Macmillan.
World Bank. (2000). Data and maps. Retrieved from http://www.worldbank.int/data/
Wu, X. (1991). The potential for technology education in People’s Republic of China. Journal of Technology Education, 3(1), 70-76.

Th
e J
ou
rna
l of Te
ch
no
log
y Stu
die
s
TargetIn Lower Saxony, technology studies as part
of preparing technical education teachers forprimary and partly for secondary education canbe studied only at two universities—theTechnical University of Brunswick and theUniversity of Oldenburg. Technology educationis not available at the Gymnasium (a type ofsecondary school leading to the university) inLower Saxony.
Universities in Lower Saxony and otherGerman states have agreed about the basic con-tents of technology education that should betaught in the public schools. However, thethemes are emphasized differently, because theuniversities view the subject and conduct theirresearch differently from one another.
The target is to connect the technicalresources of the participant universities to revealthe variety of contents of the subject and toallow access to sources of knowledge irrespec-tive of time and place. Specifically, the creationof accessible databases for technology educationvia the Internet will help educators teach tech-nology as thoroughly as possible and offer theopportunity to reach larger numbers of studentsat colleges and universities. A further step willbe to connect the databases of individual partneruniversities to a database network.
The technology education database is meantto represent an important scientific and didacticsource for the subject technology. Our furtherintention is to include the latest results ofresearch, including that gained from nationaland international technical learning processes,and to maintain teachers’ educational experi-ences in the form of evaluated teaching samples.We plan to include proven samples of lessonsthat have been tested by teachers, lecturers, and students as “methodical patterns” that can be used subsequently by other students and lecturers.
The technology education database willhelp students to fulfill the following tasks during their studies (Dick, 2000; Scheuermann,Schwab, & Augenstein 1998):
• Acquire and select specific informationfor special themes.
• Prepare papers and work on scientificreports.
• Prepare and rework lectures. • Study the contents of technology educa-
tion irrespective of the place of studiesand the type of school.
• Study as independently as possible.
Lecturers will get support to fulfill theireducational tasks:
• Compile and work with technical literature.
• Select adequate educational material,either discrete (texts, pictures) or continuous (video, audio, simulations,animations).
Advantages of the TechnologyEducation Database
The technology education database has several advantages. It will:
• Create a source of knowledge concerningtechnology education at universities andpublic schools.
• Ensure efficient presentation of the inter-disciplinary structure and the variety ofcontents of the subject and its variousmedia and methods.
• Have flexible application of the data-base’s modules (applicable in a new con-text, adjustment of contents, applicationregardless of time).
• Allow students and lecturers to haveaccess to the database via the Internet irrespective of time and place to planstudies independently or to prepare lectures.
• Enable national and internationalexchange of knowledge and experiencebetween universities.
• Promote self-learning.• Develop competence with regard to
media and information.• Awaken the interest of females in tech-
nology education by offering easy accessto knowledge.
• Enable worldwide distribution of educational material.
• Facilitate students’ transfers betweeninstitutions not only within one federalstate but all over Germany, as certificates
35Databases Improve Technical Studies By Gabriele Graube

Th
e J
ou
rna
l o
f Te
ch
no
log
y S
tud
ies
are mutually accepted.• Facilitate installation of a course of study
for Europe or overseas (medium-term andlong-term plans).
Contents of the Technology EducationDatabase
The contents of the technology educationdatabase are closely related to the courses ofstudy of the university. Although courses ofstudy differ from university to university, thefields of study are identical in most cases. Thecontent of the fields of study is focused on tech-nological processes and systems that are catego-rized by material, energy, and information.
The courses of study include not only spe-cial scientific fields, but also special didacticfields that students must study. Usually the contents are taught in the form of lectures, seminars, exercises, and practical training inlaboratories and workshops. As a target of thedatabase network, the fields of study will beenhanced by the multimedia teaching and learning modules of the technology educationdatabase.
If it is possible to update lectures and togive them a personal note, then the content willhave to be split into modules. The modules canthen be used in different types of lectures andcan be combined and completed in such a waythat they meet the requirements of the individ-ual courses of study.
The fields of study for the database must be selected. The modules have to be of specialimportance for the studies and, therefore, for the future professional work of a technologyteacher. Thus, the modules to be developedshould have a key function and students mustmaster them through examinations.
In the first phase of this database networkdevelopment, the University of Essen and theUniversities of Brunswick and Oldenburg willcreate databases in their special fields. TheInstitute for Technology and Technical Didacticsof the University of Essen plans to create mod-ules for the following fields of study: materialsscience, energy technology, measurement, open-loop control, closed-loop control, and environ-ment protection. The Department of TechnologyPedagogics of the Technical University ofBrunswick and the Institute for TechnologyEducation of the University of Oldenburg intend
to create modules for the following fields ofstudy: manufacturing engineering, informationand communication technology, and didactics of the subject technology.
In Essen as well as in Brunswick the firstmodules and experiences already exist. TheInstitute for Technology and Technical Didacticsof the University of Essen has created the firstmodules during a project, Component-BasedLearning Software for the Training of Teachers,sponsored by the federal state of Nordrhein-Westfalen (http://it.tud.uni-essen.de). During thesummer semester 2000, the Department ofTechnology Pedagogics of the University ofBrunswick tested the application of an Internetmodule, Creation and Application of Websitesfor Learning Processes.
The modules may include exercises, exam-ples of lectures, complete training programs,and single components. They are categorizedand stored according to criteria that are impor-tant to the courses of study. Texts, graphics, animations, and videos as well as simulations,virtual tests, virtual laboratories, and case studies will be included in the modules. Thepossibility of authentically presenting complextechnological/scientific matters is a project target that can be reached with the help of multimedia visualization.
One example is an ActiveX-Component,showing the characteristic of a feedback controlunit based on an operational amplifier, whichserves as a laboratory test. Video clips areintended to be used for the visualization of man-ufacturing processes to support the practicalpart of the studies (Schweres, Redeker,Theuerkauf, Balzer, & Rummel 1998). Videos will also be used for case studies that evaluatetechnology.
The individual databases of the network arebeing developed so that the contents of each arecomplementary. This process will take a longerperiod of time. The databases located at the uni-versities will be dynamic. They require ongoingmaintenance to remain current and thus requirea new form of cooperation between the partneruniversities.
Practical RealizationIt must be ensured that the database is
accessible at any time and from any place. Tomeet these requirements, the modules and the
36

Th
e J
ou
rna
l of Te
ch
no
log
y Stu
die
s
components of the database will be accessiblevia the Internet using Netscape or InternetExplorer. However, a prerequisite for this is thatthe didactically shaped modules are prepared insuch a way to allow Internet capability.
Thus, new and existing knowledge must bestructured, shaped, and transformed with respectto the rules of multimedia learning environ-ments. This means that they have to be trans-formed into Internet formats (HTML, ActiveX,Java, JavaScript, etc.). This requirement is alsonecessary for the components of the individualmodules. Texts must be formatted as xxx.pdf/rtf,graphics/pictures as xxx.jpg/gif/png, and videosas yy.mpg.
All files will be stored with their sourcecode and documentation in databases runningon Web servers of the universities.
As an example, the database will beinstalled on the computing center’s dataserver ofthe Technical University of Brunswick. For thispurpose, a determined storage capacity withdefined access authority is at the user’s disposal.
Learning Arrangement With the database, lecturers have a source
of the most up-to-date scientific and didacticcontents including an address collection ofInternet sources that enables them to use newmethods for teaching. The components andmodules can be used by the lecturer to demon-strate technological matters in lectures/exercis-es/tutorials. The lecturers can organize theircourses without restrictions concerning contentsand methods. The modules, which are independ-ent concerning the contents and which can becombined variably, represent a source of infor-mation for courses, exercises, and projects.
However, technological processes, systems,and virtual laboratories can be visualized moreauthentically with simulations than with conven-tional media (Fäßler, 2000). Knowledge aboutthe relationship of technological processes and systems can be obtained with the help of simulations.
With the database`s contents structuredaccording to didactical aspects, students canacquire information for a chosen or given themefor an exercise, a laboratory test, a task, or aproject. As an example, components of the database can be included in one’s own work.
The acquisition and evaluation of informationwill get more and more important, particularlyregarding technical competence.
The database supports independent study,so that the themes of the courses can be expand-ed and completed. At the same time, studentsachieve media competence with respect to selec-tion and evaluation of information as well aswith the creation of new or improved modulesduring seminars or exams. Afterwards, thesemodules can be stored into the database, too. A module that helps to create Web sites will bethe basis to transform teaching and learningmethods so that it can be used on the Internet.
Partners of the Database NetworkInternet-based studies and further education
courses already exist on national and interna-tional levels. Designing the database withoutrestrictions calls upon us to use experiences anddevelopments of the special fields of other uni-versities that are involved in the courses ofstudy for technology educators and that also use multimedia in teaching.
Partners for this project among the federalstates of Germany are the Department ofTechnology Pedagogics of the Institute forScientific Didactics of the Technical Universityof Brunswick and the Institute for TechnologyEducation of the University of Oldenburg. Other partners of the database network are theInstitute for Technology and Technical Didacticsof the University of Essen and the Institute forTechnology and their Didactics of the Universityof Dortmund, which is responsible for the subject technology in secondary schools. The Institute for Vocational Education of theUniversity of Rostock, which trains teachers forelectrical engineering at vocational colleges, hasannounced its partnership, too. These partnersensure that in Germany the different courses ofstudy for technology education in primary andsecondary schools and in vocational schools arerepresented appropriately.
Due to the international interest in anexchange of training modules, a continuationproject to enlarge the database network will fol-low in cooperation with partners, such as theUniversity of Marseille, the University ofLondon, and the Chilean Ministry of Culture.This database network can be seen as an impor-tant global source and as a forum for technologyeducation. This step seems to be reasonable to
37

Th
e J
ou
rna
l o
f Te
ch
no
log
y S
tud
ies
38
Strategies for Reforming Workforce PreparationPrograms in EuropeBy Marja-Leena Stenström and Johanna Lasonen
The SPES-NET ProjectThe Post-16 Strategies project coordinated
by Dr. Johanna Lasonen from 1996 to 1998 was
chiefly concerned with four post-16 education
strategies: vocational enhancement, mutual
enrichment, linkages, and unification. These
four strategies to promote parity of esteem
between vocational and academic/general edu-
cation were also seen as tools for analyzing the
differences and similarities between the reform
approaches adopted in the eight European
countries (Austria, England, Finland, France,
Germany, Norway, Scotland, and Sweden)
associated with the first project (Lasonen,
1996, 1999).
The strategy of vocational enhancement
entails reforming the content of vocational edu-
cation and training separately from general/
academic education. Esteem for vocational edu-
cation is assumed to be linked with the standard
of the content offered and the pedagogy applied
in vocational education and training.
In the strategy of mutual enrichment, the
aim is to cooperate across the divide between
general and vocational education and to give
students in each track a wider range of options
by drawing on the best features of the other
track. The two types of education are brought
closer to each other but retain their distinctive
character.
References
Dick, E. (2000). Multimediale lernprogramme und telematische lernarrangements [Multimedia learning programs and distance learning]. Nürnberg, Germany: Bildung und Wissen Verlag and Software GmbH.
Fäßler, V. B. (2000). Entwicklungen vonsSimulationen für technische lernprozesse [Development of simulations for technical learning processes]. New York: Peter Lang.
Scheuermann, F., Schwab, F., & Augenstein, H. (1998). Studieren und weiterbilden mit multimedia[Study and further education with multimedia]. Nürnberg, Germany: Bildung und Wissen Verlag and Software GmbH.
Schweres, M., Redeker G., Theuerkauf, W. E., Balzer, H.-J., & Rummel, J. (1998). Anwendergerechte unterstützung durch multimediatechnik im produktionsbereich [Application support via multimedia technology in production]. In H-J. Franke & T. Pfeifer, Qualitäts informations system.[Quality information systems]. Münich, Germany: Hanser.
internationalize the course of studies for technology education as it exists in othernations, too.
Gabriele Graube is a lecturer at theInstitute of Pedagogic and Technical Educationat the Technical University of Braunschweig,Germany

Th
e J
ou
rna
l of Te
ch
no
log
y Stu
die
s
39
In the linkages strategy, vocational and
general/academic education are given the same
formal status and linked through a common
certification framework. Both types of educa-
tion guarantee qualification for further and
higher education, and earlier studies are
recognized irrespective of track.
In unification, the distinction between voca-
tional and general education is abolished by
combining them within a unified system and
developing a curriculum that integrates the two
types of education.
The first three strategies aim to maintain
a separate identity for vocational and general
education. By contrast, the fourth strategy seeks
to combine them into a uniform upper second-
ary education system (Lasonen, 1999).
SPES-NET (Sharpening Post-16 Education
Strategies by Horizontal and Vertical
Networking) known as the Leonardo da Vinci
project, continued the work of the Post-16
Strategies project. Lasonen also launched and
Stenström coordinated the SPES-NET project
that was funded by the European Commission,
the Finnish Ministry of Education, and the proj-
ect partners, and that ran from 1997 to 2000.
It focused on reanalyzing and exploiting the
four hypothetically identified reform strategies
intended to promote parity of esteem between
general and vocational education in upper
secondary education.
Aims of the ProjectThe SPES-NET project focused on promot-
ing vocational education and training in the
partner countries, which increased from the
original eight countries in the first project to 13
nations in this project. An initial objective of the
Post-16 Strategies project was to find ways of
improving the status and attractiveness of
vocational education and training.
The aims of the succeeding project, SPES-NET,
were to:
• Find ways to improve the status of voca-
tional education and training.
• Find ways to forge links between educa-
tional establishments and enterprises.
• Disseminate the results of the Post-16
Strategies project.
• Define dissemination activities intended
to create national and international
networks.
Type of Institution New Partners Old Partners
Research instituteEnglandFranceAustria
Universitydepartment
SpainGreeceHungary
Germany
Further educationcollege
Scotland
Teacher trainingestablishment
Denmark Norway
Administrativeagency
Estonia Finland
Consultancy and trainingestablishment
Belgium
Table 1. Partner Institutions: Type of Institution
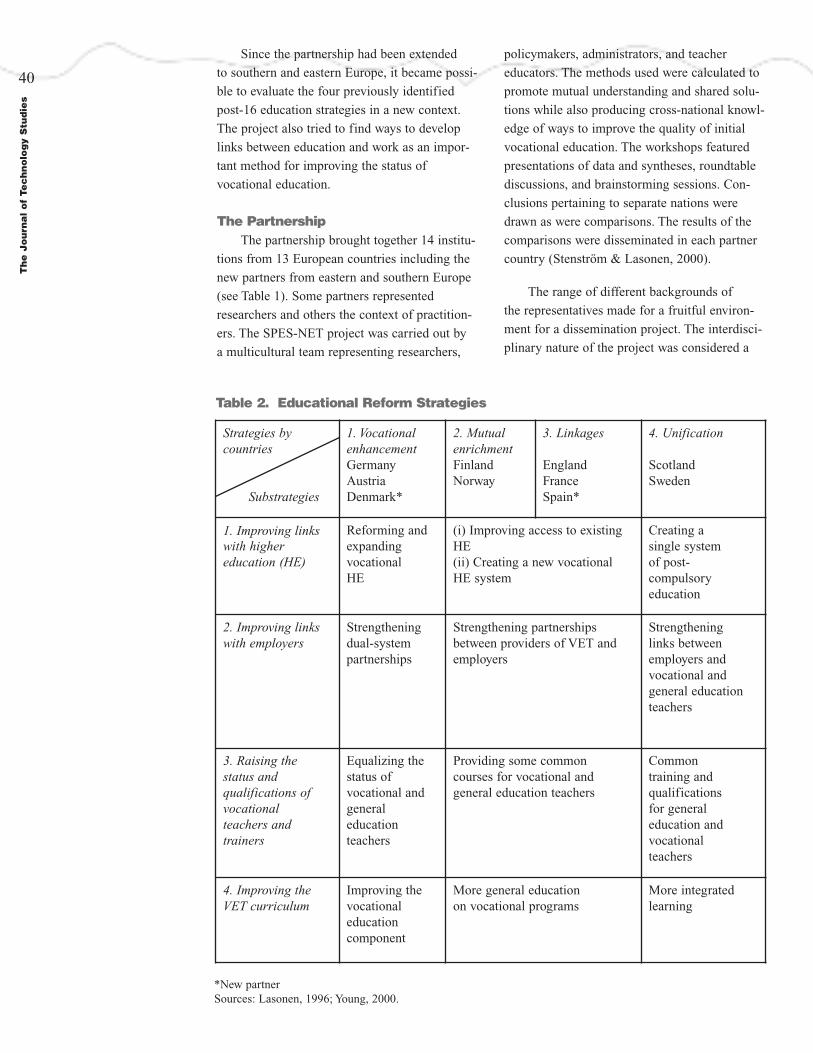
Th
e J
ou
rna
l o
f Te
ch
no
log
y S
tud
ies
Since the partnership had been extended
to southern and eastern Europe, it became possi-
ble to evaluate the four previously identified
post-16 education strategies in a new context.
The project also tried to find ways to develop
links between education and work as an impor-
tant method for improving the status of
vocational education.
The PartnershipThe partnership brought together 14 institu-
tions from 13 European countries including the
new partners from eastern and southern Europe
(see Table 1). Some partners represented
researchers and others the context of practition-
ers. The SPES-NET project was carried out by
a multicultural team representing researchers,
policymakers, administrators, and teacher
educators. The methods used were calculated to
promote mutual understanding and shared solu-
tions while also producing cross-national knowl-
edge of ways to improve the quality of initial
vocational education. The workshops featured
presentations of data and syntheses, roundtable
discussions, and brainstorming sessions. Con-
clusions pertaining to separate nations were
drawn as were comparisons. The results of the
comparisons were disseminated in each partner
country (Stenström & Lasonen, 2000).
The range of different backgrounds of
the representatives made for a fruitful environ-
ment for a dissemination project. The interdisci-
plinary nature of the project was considered a
40
Strategies by countries
Substrategies
1. Vocationalenhancement GermanyAustriaDenmark*
2. MutualenrichmentFinlandNorway
3. Linkages
EnglandFranceSpain*
4. Unification
ScotlandSweden
1. Improving linkswith higher education (HE)
Reforming andexpandingvocationalHE
(i) Improving access to existingHE(ii) Creating a new vocationalHE system
Creating asingle systemof post-compulsoryeducation
2. Improving linkswith employers
Strengtheningdual-systempartnerships
Strengthening partnershipsbetween providers of VET andemployers
Strengtheninglinks betweenemployers andvocational andgeneral educationteachers
3. Raising thestatus andqualifications ofvocationalteachers andtrainers
Equalizing thestatus ofvocational andgeneraleducationteachers
Providing some commoncourses for vocational andgeneral education teachers
Commontraining andqualificationsfor generaleducation andvocationalteachers
4. Improving theVET curriculum
Improving thevocationaleducationcomponent
More general education on vocational programs
More integratedlearning
Table 2. Educational Reform Strategies
*New partner Sources: Lasonen, 1996; Young, 2000.

Th
e J
ou
rna
l of Te
ch
no
log
y Stu
die
s
positive feature because it created bridges
to shared understanding between different coun-
tries in Europe. This multidisciplinary, multicul-
tural approach produced a range of different
solutions to the problems of vocational educa-
tion and training (Lasonen, 1998; Stenström,
2000).
The SPES-NET project undertook a
reanalysis of the previously identified reform
strategies, proceeding through the following
stages:
1. Analyzing the four post-16 education
strategies in a new context.
• Preparing and analyzing case studies
of the new partner countries.
2. Reflecting on the post-16 education
strategies.
• Fitting the new partner countries’
reforms into the framework of the
four post-16 education strategies.
3. Developing a framework paper on new
substrategies for the previously defined
four post-16 education strategies.
• Preparing a final summary of the sub-
strategies on the basis of the partners’
responses to an earlier draft of the
framework paper, which was prepared
by the English partner (Young, 2000).
4. Surveying the progress of forming links
between educational establishments and
enterprises.
• Preparing a framework paper on edu-
cation-work relationships (Marhuenda,
2000).
• Case studies of the partner countries.
Reflections on Post-16 EducationStrategies
It was not easy to classify educational
systems in terms of the four post-16 education
strategies. The four hypothetical reform strate-
gies of the Post-16 Strategies project revealed
that contexts existing in northern, western, and
central European countries made the compar-
isons complicated. Extending this analysis to
other regions was particularly difficult in the
case of countries undergoing structural and
political changes, such as Estonia and Hungary,
and in the case of countries such as Estonia and
Greece, where vocational secondary education
is not well developed (Stenström, 1999).
The question the SPES-NET project faced
was whether the previously defined four post-16
education strategies were relevant to the new
partners or whether a model that included
a strategy for academic track separate from
vocational and a strategy where they are unified
should be adopted instead. However, it was
decided to retain the original typology but shift
the focus of the comparisons to improvements
in the quality of vocational education. Out of
the larger context provided by the 13 European
partners a new conceptual framework of strate-
gies and trends emerged. It was clear that
reform strategies must be defined in a more
precise manner, distinguishing between the
different substrategies for improving vocational
education and its status relative to general edu-
cation as follows (Stenström & Lasonen, 2000;
Young, 2000):
• Improving progression to higher educa-
tion by students in vocational programs.
• Improving progression into employment
by students in vocational programs.
• Improving the status and qualifications
of vocational teachers.
• Improving the vocational and general
components of the vocational education
curriculum.
These substrategies were used for comparing
reforms launched in different countries to
improve vocational education.
In Table 2, the horizontal axis is represented
by the four strategies that were identified in the
original Post-16 Strategies project. The vertical
axis is the four substrategies for improving
vocational education that were identified in the
SPES-NET project. The matrix shows the rela-
tion between strategy (as context) and substrate-
gy (as content). The partly hypothetical options
presented in the matrix indicate the existence
of three types of reform strategy because the
matrix combines two of the previously defined
four strategies, mutual enrichment and linkages.
All partner countries had reported some
developments definable in terms of the four
substrategies. The substrategy of improving pro-
gression opportunities into higher education for
vocational education students seems to be the
easiest one to adopt. The substrategy of improv-
ing the status and qualifications of vocational
41

Th
e J
ou
rna
l o
f Te
ch
no
log
y S
tud
ies
teachers is difficult, especially in those coun-
tries in which salary differentials between pri-
vate and public sectors remain large. Finally,
improving the vocational curriculum depends
on administration, teaching, and teacher educa-
tion and on cooperative links between employ-
ers and vocational education providers. The
relationships between education and working
life is one of the key questions involved in
attempts to improve the quality of vocational
education and training.
The SPES-NET project focused exclusively
on internal strategies for improving vocational
education and training, ignoring external strate-
gies. Such external strategies as interventions
in labor markets might affect the status of voca-
tional education and training and the issue of
parity of esteem.
The SPES-NET project also concentrated
on differences between national systems and
national strategies for improving the quality
of vocational education and parity of esteem
between vocational and general education as
they are manifested at the policy level. It was
not concerned with new curricula and pedago-
gies. However, moving from the level of strate-
gy to the level of specific curriculum and
pedagogic initiatives would be a valuable topic
for further research (Young & Volanen, 2000).
The partner countries face a number of
common problems despite having very different
educational systems. These common issues
relate to ways in which attempts to improve
vocational education continue to be hampered
by the persistence of academic/vocational divi-
sions in the curriculum. First, there is academic
drift or the tendency to encourage students to
opt for academic programs. Second, there is the
concern expressed by both employers and voca-
tional teachers about the poor quality and lack
of motivation of students in vocational pro-
grams. Third, academic/vocational divisions
are inhibiting the development of new types
of vocational programs for the 21st century.
Despite the differences in how the sub-
strategies are interpreted in different countries,
some common trans-European trends did
emerge. These are summarized as:
• More standardization of qualifications
for students and teachers.
• Greater emphasis on work-based learning
and the educational potential of work-
places.
• Efforts to increase employer involvement
in all aspects of vocational education and
training provision.
• More choices for students and more
autonomy to localities and individual
institutions.
Dr. Marja-Leena Stenström is a senior
researcher of vocational education in the
Institute for Educational Research at the
University of Jyväskylä, Finland.
Dr. Johanna Lasonen is a professor in the
Institute for Educational Research at the
University of Jyväskylä, Finland. She is a
member-at-large of Epsilon Pi Tau.
42
References
Lasonen, J. (Ed.). (1996). Reforming upper secondary education in Europe: The Leonardo da Vinci project post-16 strategies (Theory Into Practice No. 92). Jyväskylä, Finland: University of Jyväskylä, Institute for Educational Research.
Lasonen, J. (1998). Finding new strategies for post-16 education to promote parity of esteem between vocational and general education. In A. Dietzen & M. Kuhn (Eds.), Building a European co-operative research tradition in vocational education and training (pp. 85-95). Berlin, Germany: BIBB, Bundesinstitut für Berufsbildung.
Lasonen, J. (1999). Sharpening post-16 education strategies: Building on the results of the previous projects. In M.-L. Stenström (Ed.), Reflections on post-16 strategies in European countries: Sharpening post-16 education strategies by horizontal and vertical networking (Working Papers No. 9, pp. 9–22). Jyväskylä, Finland: University of Jyväskylä, Institute for Educational Research.

Th
e J
ou
rna
l of Te
ch
no
log
y Stu
die
s
43
The Need for Promotion of Women in Science and Technology
For nearly 20 years the topic of “women
and technology” has played an important role in
discussions about gender equality in Germany.
The very first project for promoting females
started in 1978 under the title “Women in Male
Occupations.” It was initiated by the Federal
Ministry of Education and Science and was
aimed at vocational-technical levels. Soon a
variety of projects followed, financially support-
ed by the Federal and District Commission for
Educational Planning and Promotion of
Research and by the individual governments
of the various districts (Ostendorf, 1994).
The initial incentive to develop such proj-
ects was the fact that women were highly under-
represented in educational fields of technology
and in those related to technology. Increasing
Relation of Technology, Science, Self-Concept,Interest, and GenderBy Ingeborg Wender
Marhuenda, F. (2000). Rethinking education-work relationships. In M-L. Stenström & J. Lasonen (Eds.), Strategies for reforming initial vocational education and training in Europe (pp. 239–249).Jyväskylä, Finland: University of Jyväskylä, Institute for Educational Research.
Stenström, M.-L. (1999). Reflections on disseminating strategies for reforming post-16 education. In M.-L. Stenström (Ed.), Reflections on post-16 strategies in European countries: Sharpening post-16 education strategies by horizontal and vertical networking (Working Papers No. 9, pp. 159–168). Jyväskylä, Finland: University of Jyväskylä, Institute for Educational Research.
Stenström, M.-L. (2000). Reassessing VET reform strategies in a new context: Implementation of the SPES-NET project. In M.-L. Stenström & J. Lasonen (Eds.), Strategies for reforming initial vocational education and training in Europe (pp. 15–28). Jyväskylä, Finland: University of Jyväskylä, Institute for Educational Research.
Stenström, M.-L., & Lasonen, J. (Eds.). (2000). Strategies for reforming initial vocational education and training in Europe. Jyväskylä, Finland: University of Jyväskylä, Institute for Educational Research.
Young, M. (2000). Improving vocational education: Trans-European comparisons of developments in the late 1990s. In M.-L. Stenström & J. Lasonen (Eds.), Strategies for reforming initial vocationaleducation and training in Europe (pp. 147–162). Jyväskylä, Finland: University of Jyväskylä, Institute for Educational Research.
Young, M., & Volanen, M. V. (2000). Towards a vocational curriculum and pedagogy of the future: Taking the post-16 education strategies and SPES-NET project findings forward for future research. In M.-L. Stenström & J. Lasonen (Eds.), Strategies for reforming initial vocational education and training in Europe (pp. 258–279). Jyväskylä, Finland: University of Jyväskylä, Institute for Educational Research.

Th
e J
ou
rna
l o
f Te
ch
no
log
y S
tud
ies
the number of women in technology and science
was a political goal. Consequently, many actions
were initiated to increase women’s participation
in schools, universities, and/or extracurricular
fields. Currently, special attention is being paid
to specific subjects such as computer science
and computer technology. The reason for this
is the current lack of experts in these fields.
Despite the important role of technology in
society, it is seldom taught in schools. That was
not the case in the former Federal Republic of
Germany. A special polytechnical teaching
existed in schools; unfortunately, it was given
up after the reunion. Therefore, we have an
obvious deficit in Germany.
Because the proportion of students in
natural, computer, and technological sciences
has sunk dramatically in general, there are now
various educational programs to increase the
attractiveness of these subject areas. Most
prominently, colleges and research institutions
advertise intensively and offer their research
resources to teachers and pupils. The best exam-
ples are the Göttinger Experimental Laboratory
for young people (XLAB of the University of
Göttingen), which concentrates on natural sci-
ence, and the DLRSchoolLab of the German
Center for Aeronautics and Space Travel in
Göttingen, where aerodynamics is stressed.
Almost all technical colleges offer pupils a day
or a week of open house, including experiments
and special projects. Pupils aged 15 to 20 are
the main target group of these activities.
Because of the well-institutionalized pro-
motion of women at colleges, a diverse science
and technology campaign was developed, which
has acted as a forerunner for current activities
(such as our own projects Hands-On Technology
[1993-1999] and Step In—Mentoring &
Mobility [2001-2003], which will be described
later). Computer science was and is generally
an integral component in the projects. However,
there is a difference between computer science
as an independent subject and its application
in a technical discipline. Concepts have been
developed for both aspects. Activities for the
promotion of women in Germany are currently
somewhat one-sided with the emphasis on
computer science.
Little Increase in Female Proportions in
Technology and Science
In spite of these promotional efforts, the
proportion of females in those “hard” courses in
natural and computational sciences and in fields
of technical studies and occupations remains
small, though 45% of all students are female
and 50% of the students in university beginning
studies are female. Over the last decade the
activities to encourage women have only slightly
increased their percentages in the above-men-
tioned fields. The rate of female students in-
creased in electrical engineering from 4.4% in
1992 to 8.6% in 2001, in mechanical engineer-
ing from 5.3% in 1992 to 10% in 2001, and in
computer science from 13% in 1992 to 19%
in 2001 (Federal Ministry of Education and
Research, 1993–2002). The increase in women,
even if small, may be explained by the efforts
in the context of promotion activities for
women, that is, the projects have been never-
theless successful.
Consequences
The above-mentioned increases in women’s
participation need to continue at a greater pace.
This could happen if the projects could take
long-term perspectives into account and not
merely exist at brief intervals. Those who
engage in promotional efforts, and all educators,
for that matter, need to be aware of several other
factors that may affect women’s interest and
participation in the technology fields.
Self-Concept (Self-Efficacy Belief),Gender, and Technology
Self-concept gained scientific attention for
explaining the exclusion of women from tech-
nological fields, particularly young women’s
lack of confidence in their own efficacy to
handle technical situations adequately.
The concept of self-efficacy (Bandura,
1997) has gained popularity in recent years,
especially in educational and vocational issues.
When choosing a career, perceived self-efficacy
has long-term consequences. People with high
self-efficacy expectations consider a wider spec-
trum of possibilities to develop themselves in
relation to specific subjects and vocations and
hold higher aspirations. For example, when
choosing a career in mathematical/technical
44

Th
e J
ou
rna
l of Te
ch
no
log
y Stu
die
s
fields, high perceived self-efficacy bears more
relevance than actual quantitative and technical
competence (measured according to education
and capabilities; Hackett & Betz, 1989). Sub-
jective self-efficacy judgments are one
of the most relevant determiners of success
and persistence in a career.
Perceived self-efficacy refers to the beliefs
in one’s personal capabilities to organize and
execute the courses of action required to man-
age prospective situations (Bandura, 1997).
Self-efficacy produces effects in various ways,
including mainly cognitive, motivational,
affective, and selection processes.
People who have a low sense of efficacy
in a given domain
• shy away from difficult tasks,
• have low aspirations and a weak
commitment to goals,
• slacken their efforts and give up quickly
in the face of difficulties, and
• diagnose insufficient performance as
deficient aptitude and lose faith in their
capabilities.
Self-efficacy beliefs are products of complex
processes of self-persuasion. These processes
rely on the cognitive “working up”
of diverse efficacy information.
Bandura (1997) designated four sources
of self-efficacy that can help to dispel doubts
concerning one’s own self-efficacy perceptions.
These sources may enable persons to deal effec-
tively with certain situations, each including
• mastery experiences, an enactive factor;
• vicarious experiences, influenced by
perceived similarities to role models,
observed;
• coping processes and participant and
corrective modeling;
• encouragement from one’s environment
(e.g., social and/or verbal persuasion);
and
• positive interpretations of one’s physio-
logical and emotional states.
Women generally judge themselves as
being less efficacious then men for scientific
occupations requiring quantitative skills, such
as engineering and computing (typical male
vocations where the percentage of women is
equal or less than 25%), whereas men judge
themselves less efficacious than women for
education and psychology (typical female occu-
pations where the percentage of men is equal
or less than 25%; Wender, 1999).
Hackett (1995) provided empirical data that
supports the theory that the low proportion of
women in technical vocations can be traced
back to women’s low perceived self-efficacy
regarding technical problem-solving skills.
Because gender groups experience social-
ization differently, girls and young women find
it difficult to attain technical information and
experience, and when they do, they cannot
adequately process it. Women are hindered
in building up and enlarging high self-efficacy
expectancy for the technical and engineering
fields. This is connected to a high degree of
gender and social role model stereotyping.
A stereotype is a set of qualities ascribed
to all members of a group of people or objects
because of overgeneralization. Alfermann
(1996) pointed out that women are perceived
as preferring social relationships. For example,
a woman is regarded and regards herself as
preferring social relationships. Social roles
are distinguished through behavioral expecta-
tions that society assigns as norms to members
of a certain group. According to Alfermann,
even today it is still usual that women take care
of children and stay at home after the birth of
a child and men do industrial work.
In accordance with the stereotype that
describes women as incompetent in natural sci-
ence and technology, girls often underestimate
their own performance in mathematics and
natural sciences. The TIMMS studies confirmed
gender differences regarding confidence in one’s
own capabilities in these subjects and concluded
that even very capable, highly successful female
students tend to underestimate their own capa-
bilities and assign success more to luck or
accident (Baumert, Bos, & Lehmann, 1997).
Gender stereotypes and gender role expec-
tations also influence expectations of different
agents of socialization. Parents, teachers at
45

schools and universities, and instructors in
business develop expectations of their children,
their students, and their trainees. Thus, a sort of
self-fulfilling prophecy sets in and all involved
base their behavior and experience on expec-
tations set up by social groups. Even persons
being educated follow these expectations, be
they positive or—as concerning girls in relation
to technology—negative for themselves.
The Function of InterestsAccording to Hannover (1998, in press),
self-concepts are closely related to interests,
and these, in turn, are closely related to voca-
tional decisions. Self-concept influences the
development of interests, and interests shape
self-concept. Both determine the decision to
pursue a subject or a vocation.
Todt and Schreiber (1998) defined interest
as follows:
Interests are domain-specific behavior—
and experience activating and controlling
motives, which are generalized, serving as
structures of orientation and appearing in
a specific manner as preferences for activi-
ties. Interests are essential elements of the
structure of self-concept and are fully
integrated in the individual’s self-concept.
(p. 25)
They also differentiated three forms of
interest:
• General interests: content and age related,
relatively enduring, whereby the influ-
ence by concrete experience is rather
small, their function exists in orientation.
• Specific interests: relatively enduring,
dependent on external hint and on posi-
tive experience, related to relatively spe-
cific contents or activities and to specific
competence, their function exists in initi-
ation activities.
• Active interests: positive emotional state,
dependent on specific characteristics of
situations, for example, success, positive
social-emotional climate, can become
dispositional if, for example, stabilized
by positive consequences, their function
exists in activating cognitive functions
and stability activities.
As studies have shown, girls and boys,
women and men have differing interests.
Women prefer animated content, having some-
thing to do with people, having an obvious
relationship to everyday life, relating to natural
phenomena and of some use to humanity. Men,
on the other hand, are less context dependent;
they are more readily fascinated by apparatus
and machines as such and concentrate on the
object at hand (e.g., Häußler & Hoffmann,
1998). These elements can be distinguished as
general interests; they are aligned with orienta-
tion and hardly available to change by experi-
ence. Since they are considered relatively stable,
they must be taken into account in developing
activities to promote an increased interest of
women in technology and natural science.
In contrast, differing interests relating to
individual subject areas such as German and
physics can be affected by experience because
they are specific interests. They can be influ-
enced and affected by active interests.
According to Todt and Schreiber’s (1998)
model, positive feedback, success, and a
positive social-emotional climate closely
associated with the various subject areas
can influence them.
Hannover (1998) established that real life
behavior experiences in the particular subject
area are especially influential factors. Practical
experience gives knowledge about content that
is integrated into knowledge structures and
anchors the corresponding interests as a person-
al experience and part of self-applied knowl-
edge. These interests initiate new activities that
contribute to the expansion of object-knowl-
edge, of self-knowledge, and of the creation of
self-concept. Thus, these components evolve
into a circular process.
Hannover (1998) and Hannover and
Kessels (2002) support the theory that in coedu-
cational school situations, particularly with
exercises that revolve around technology, gender
segments of self-concept are activated and con-
trol interests in adolescents because of the pres-
ence of people of the opposite sex. In school
situations where only women are present in a
learning group, the gender-related segment
becomes relatively inactive, and interests could
Th
e J
ou
rna
l o
f Te
ch
no
log
y S
tud
ies
46

Th
e J
ou
rna
l of Te
ch
no
log
y Stu
die
s
develop independently. So if girls’ interests
should be turned to technology (against the
gender stereotype), gender separate teaching is
advisable.
These statements are empirically supported
by the fact in 1980 young women studying tech-
nology or the natural sciences in Germany
mainly graduated from girls’ schools (Jahnke-
Klein, 2001). And as Metz-Göckel (1999)
stated, graduates from the women’s colleges
are very successful both in science and in the
labor market.
Encouraging Women Into Technologyand Science
Summarizing the preceding paragraphs,
one may conclude that young women aged 15
to 20 are encouraged into technology and natu-
ral sciences if the following preconditions are
taken into account.
• Regarding self-efficacy (Bandura, 1997):
- Active, physical approach to technical
problems.
- Support from female role models.
- An atmosphere that encourages
confidence.
- Help to interpret possible tension
as positive stress.
• Regarding general aspects of interest
(Häußler & Hoffmann, 1998):
- Inclusion of technical problems in
everyday situations or an everyday
context.
- Consideration of relationship with life,
particularly with people.
- References to natural phenomena.
- Possibility to recognize human or social
usefulness of the exercise.
• Regarding the aspect of specific and
active interest (Todt & Schreiber, 1998):
- Active examination of technology.
- Acquisition of technical knowledge.
- Creation of a positive social climate.
It should be stressed, though, that knowl-
edge, self-concept (and in particular belief in
self-efficacy), interests, and choices/decisions
of vocation are closely related and mutually
dependent.
In order for girls to avoid activating gender-
related knowledge, a gender separate learning
situation should be available (Hannover &
Kessels, 2002). This would contribute to
building up their perceived self-efficacy and
promote development of a young woman’s
quantitative and technical talents. Future women
engineers need to be provided with a learning
environment that promotes and supports femi-
nine general interests, giving them the opportu-
nity to develop specific interests for natural
science and technology to maximize their poten-
tial in these fields. Such schooling would induce
girls and young women to gain technical knowl-
edge, make them aware of their own competen-
cies, give them a chance to develop specific
interests beyond gender stereotypes, and give
them the opportunity to acquire vocational skills
in technology and natural science.
Projects of the Universities inBrunswick to Encourage Women
The projects of the universities in Bruns-
wick, Hands-On Technology (1993-1999;
Wender, Strohmeyer, & Quentmeier, 1997) and
Step In—Mentoring & Mobility (2001-2003;
Wender, Popoff, Peters, Müller, & Foetzki,
2002), are based on the social-cognitive modifi-
cation strategies of Bandura (1997) as well as
on the previously cited views of Hannover (in
press), Häußler and Hoffmann (1998), and
Todt and Schreiber (1998) in relation to inter-
ests. They combine activity-related measures
(e.g., technology days or camps, computer
workshops) with a mentoring program for
schoolgirls, students, and experts from technolo-
gy. The Step In—Mentoring & Mobility project
concentrated its content on an interdisciplinary
subject, that is, mobility/traffic with its techni-
cal, social, ecological, and psychological
aspects.
The focus of the projects were on
• increasing knowledge of vocations
in science and technology,
• increasing perceived self-efficacy of
quantitative and technical tasks,
• increasing interest in technical fields, and
• considering occupational possibilities that
include technical tasks as the dependent
variables.
Several intervention modules were designed
47

Th
e J
ou
rna
l o
f Te
ch
no
log
y S
tud
ies
and applied. Established practices used in class-
es training students for their choice of future
occupations were changed or complemented for
the purposes of these projects: a three week-
period of practical work, courses and vacation
camps over several days designed for young
women to develop interest in natural and techni-
cal sciences and computational science. In order
to develop career orientation, a course lasting
one week was offered to young women and
men. The course included a work company over
two days in business for the young women in
technical domains and for the young men in
social and educational domains.
In order to guarantee long-term promotion
for the young women in the project Step In—
Mentoring & Mobility, a particular mentoring
program was conducted after the end of the
vacation camp that offered special coaching for
several months. During the camp the girls had
the opportunity to write down their wishes for
the mentoring program in a questionnaire.
Below follows an example of the practical
studies offered yearly between 1993 and 1998
by the Hands-On Technology project . These
three-week courses were attended by 120 young
women (aged 15 to 20) in the above-mentioned
period. The text is taken from an information
brochure that advertised these practical studies
in schools.
Institute of Flight Guidance and Control
Technical University of Brunswick/
Germany
During their practical courses, trainees are
involved in the preparation, the carrying
out and the evaluation of simulation-and
flight-experiments in a flight simulator.
Different methods of approach and landing
procedures, different turns and wind situa-
tions or specific motor flights are being
tested and analyzed. These experiments aim
at the test of new flight techniques in order
to increase security standards in air traffic.
Moreover, trainees will get to know the
evaluation of measured atmospheric data,
such as pressure, density and temperature
or data from real flight experiments such
as position, velocity vector or air data.
This includes an introduction to the meas-
uring instruments of our plane at the re-
search airport Braunschweig. Main aim
of this survey at our institute are both the
development and the test of new meas-
uring techniques.
Instructor: Dipl. Ing. Ronald Blume
The main activity of the Step In—
Mentoring & Mobility project is a mobility
camp in the summer holidays that was executed
in 2001 for the first time and will be repeated in
2003. More than 50 girls participated in the first
camp. For one week, girls have the possibility to
take an active role in technology by working on
two projects each. During the mornings, pro-
jects are offered at different technological insti-
tutes. These projects mainly deal with actual
research in the field of mobility. During the
afternoons, the projects concentrate on practical,
social, ecological, and psychological aspects of
the topic.
Below follows an example of the practical
project work offered by Step In—Mentoring &
Mobility in the framework of the above-men-
tioned mobility camp. The text is taken from
an information brochure that advertised the
camp in schools.
Who likes shaking cars?
How to transfer driving test collected data
on vehicle vibration to a hydraulic
simulator for a survey on driving comfort
Institute of Vehicle Engineering, Technical
University of Brunswick/Germany
The topic of driving comfort plays an
important role in the development of cars
as it is one of the main qualities in people’s
judgement of motor cars. Therefore, knowl-
edge of human vibration-perception—how
do people perceive and judge different
vibrations—is of great importance for
automotive industry.
By shifting the analysis of this vibration-
perception from the road to a simulator,
one not only reduces the amount of expen-
sive driving tests, but also offers additional
flexibility to the survey methods.
In this project, you are introduced to the
48

Th
e J
ou
rna
l of Te
ch
no
log
y Stu
die
s
main tools and processes involved in the
transfer of real vehicle movements to a test
bench. You may independently equip a car
with measuring technique and make meas-
uring drives on the institute’s grounds in
order to collect data on the vehicle’s vibra-
tions. In the end, you transmit these to the
institute’s simulator.
Instructor: Dipl.-Ing. Thorsten Bitter
The above-mentioned activity-related meas-
ures not only offer the possibility to actively
approach and experience technology, but, more-
over, give the opportunity to form or renew
mentoring relationships. Specific mentoring
workshops also facilitate an interchange
between schoolgirls, students, and experts from
technology. These workshops train female
experts for their role as mentors and role mod-
els, especially by showing their behavior in
male-dominated contexts. They also give the
opportunity to acquaint key qualifications.
The Step In—Mentoring & Mobility men-
toring program was developed especially to
consider the needs of schoolgirls. Temporally
restricted forms of group mentoring as part of
activity-related project measures are of great
importance for the mentoring process. Indi-
vidual contacts between a schoolgirl and several
mentors often continue after the group measures
are completed.
Evaluation
In order to guarantee a constant improve-
ment of the intervention program, all parts of
the projects are being regularly evaluated.
Among other things, participating girls have to
fill in pre- and post-participation questionnaires,
concentrating on knowledge, self-efficacy
belief, interests related to technical fields, and
the choice of vocation, as well as the expecta-
tions and experiences from the different aspects
of the project. Moreover, our own observations,
audio and video recordings, and posters and
reports made by the girls are part of the analy-
sis. Participating tutors and mentors are also
questioned in order to modify and constantly
improve the programs.
Two examples of the evaluation are
described here. The first example relates to the
Hands-On Technology project, concentrating on
the three-week period of practical work courses
that were offered yearly between 1993 and 1998
and were attended by 120 young women (aged
15 to 20). The second example relates to the
Step In—Mentoring & Mobility project and to
its main offer, a summer camp, organized for
the first time during the summer holidays in
2001. Fifty young women (aged 15 to 20)
participated in this camp.
In the Hands-On Technology project the
previously mentioned dependent variables were
measured for the three focus fields (civil engi-
neering, mechanical engineering, and electrical
engineering) in pre- and post-participation ques-
tionnaires. The data were collected based on
Betz and Hackett’s (1981) measurement instru-
ment. The statistical analysis compared the data
collection for knowledge, self-efficacy, interests,
and possible choice of vocation before and after
the intervention of the intervention group (only
women) with the control groups (women or men
in three week-period of nontechnical practical
studies). Follow-up analysis of the data was
completed with the help of the Kruskal-Wallis
one-way ANOVA (see Wender et al., 1997).
Between the intervention and control
groups high significant differences were found
with respect to the perceived self-efficacy relat-
ed to the field of engineering; significant differ-
ences appeared with respect to knowledge and
to interests; a numerical tendency was found
with respect to possible choice of vocation.
Most changes in the pre- and post-question-
naires were found in the intervention group.
As one result of Step In—Mentoring
& Mobility, data were collected from young
women participating in the summer camp.
The questionnaires were based on the dependent
variables previously mentioned, concentrating
on vocations in the domain of traffic. Again,
data were collected before and after the
intervention.
The statistical analysis was done with the
help of the Wilcoxon test. The data showed a
significant increase after the intervention on all
measured variables (see Wender et al., 2002).
49

Th
e J
ou
rna
l o
f Te
ch
no
log
y S
tud
ies
50
References
Alfermann, D. (1996). Geschlechterrollen und geschlechtstypisches Verhalten [Gender roles and sex typing behavior]. Stuttgart, Germany: Kohlhammer.
Bandura, A. (1997). Self-efficacy—The exercise of control. New York: Freeman.
Baumert, J., Bos, W., & Lehmann, R. (1997). TIMM: Mathematisch-naturwissenschaftlicher unterricht im internationalen Vergleich [TIMMS: International comparison of mathematics and science teaching]. Opladen, Germany: Leske + Budrich.
Betz, N. E., & Hackett, G. (1981).The relationship of career-related self-efficacy expectations to perceived career options in college women and men. Journal of Counseling Psychology, 28,399-410.
Federal Ministry of Education and Research. (1993–2002). Grund- und strukturdaten [Basic and structural data]. Magdeburg, Germany: Garloff Druckerei.
Hackett, G. (1995). Self-efficacy in career choice and development. In A. Bandura (Ed.), Self-efficacy in changing societies (pp. 232-258). New York: Cambridge.
Hackett, G., & Betz, N. E. (1989). An exploration of the mathematics self-efficacy/mathematics performance correspondence. Journal of Research in Mathematics Education, 20, 261-273.
Hannover, B. (1998). The development of self-concept and interests. In L. Hoffmann, A. Krapp, K. Remminger, & J. Baumert (Eds.), Interest and learning (pp. 105-125). Kiel, Germany: IPN.
Hannover, B. (in press). Vom biologischen zum psychologischen geschlecht: Die entwicklung von geschlechtsunterschieden [From sex to gender: The development of sex differences]. In A. Renkl (Ed.), Pädagogische psychologie [Educational psychology]. Bern, Swiss: Huber.
Hannover, B., & Kessels, U. (2002). Monoedukativer anfangsunterricht in physik: Auswirkungen auf motivation, selbstkonzept und kurswahlverhalten von gesamtschülerinnen und gesamtschülern [Monoeducational elementary courses in physics: Effects on motivation, self-concept, and course selection pattern of pupils in comprehensive schools]. Zeitschrift für Entwicklungspsychologie und Pädagogische Psychologie, 34, 201-215.
Häußler, P., & Hoffmann, L. (1998). Qualitative differences in student’s interest in physics and the dependence on gender and age. In L. Hoffmann, A. Krapp, K. Remminger, & J. Baumert (Eds.), Interest and learning (pp. 280-289). Kiel, Germany: IPN.
Jahnke-Klein, S. (2001). Sinnstiftender mathematikunterricht für mädchen undjJungen [Meaningful mathematics teaching for girls and boys]. Hohengehren, Germany: Schneider Verlag.
Metz-Göckel, S. (1999). Was Frauen an ‚Women’s Colleges’ lernen können [What women can learn
Conclusion About Intervention
It is safe to conclude that the intervention
programs were and still are successful.
The questionnaires show significant changes
regarding the schoolgirls’ knowledge, their self-
efficacy beliefs, and their interests in technolo-
gy. Their newly gained and/or more consciously
experienced knowledge and interests led to new
perspectives concerning the girls’ choices of
vocations. They now consider more vocations,
generally differing from stereotypically female
ones. Their possible choices of vocation there-
fore significantly rose due to their participation
in the project.
The mentoring workshops led to significant
changes regarding the self-confidence of both
schoolgirls and mentors in male-dominated
conflict situations. Moreover, network-building
can be noticed among all participating groups.
Therefore, when women are given the
opportunity to engage in technical tasks and to
succeed—and by doing so not to correspond
to traditional gender stereotypes—they are
contributing to the decline of the male stereo-
type traditionally connected with the perception
of technology.
Ingeborg Wender is a professor in the
Institute of Educational Psychology at the
Technical University of Brunswick, Germany.

Th
e J
ou
rna
l of Te
ch
no
log
y Stu
die
s
The emergence of a knowledge-based econ-
omy (k-economy) has spawned a “new” notion
of workplace literacy, changing the relationship
between employers and employees. The tradi-
tional covenant where employees expect a stable
or lifelong employment will no longer apply.
The retention of employees will most probably
be based on their skills and knowledge that can
create advantages for the company over its com-
petitors. Employers invest in the skills of their
employees to improve productivity and the prof-
itability of the company. Training costs can be
substantially higher than that of general or
academic education but are justified when the
value of the company’s earnings and productivi-
ty exceed the cost of the training. Numerous
empirical studies regarding entry-level employee
competencies from the perspective of employers
have been conducted in both industrialized and
developing nations. The results of the studies
found that employers prefer certain types of
entry-level competencies of the prospective
employees. This article provides an overview
of workplace literacy from the perspective
of the employers and also reviews pertinent
literature regarding Malaysia’s transition toward
a k-economy.
K-EconomyIn the information age, knowledge is power.
The k-economy is based on a paradigm that
focuses on intellectual capital as a prime mover.
With knowledge replacing physical and natural
resources as the key ingredient in economic
development, education and human resource
development (HRD) policies require rethinking.
While there is no standard definition of a
k-economy, the UK Department of Trade
51
in women’s colleges]. In M. A. Kreienbaum (Ed.), Schule lebendig gestalten [Forming schools full of life, pp. 62-71). Bielefeld, Germany: Kleine Verlag.
Ostendorf, Helga (1994). Öffnung von männerberufen für frauen [Opening the men’s jobs to women]. WSZ Mitteilungen, 47, 752-762.
Todt, E., & Schreiber, S. (1998). Development of interests. In L. Hoffmann, A. Krapp, K. Remminger,& J. Baumert (Eds.), Interest and learning (pp. 25-40). Kiel, Germany: IPN.
Wender, I. (1999). Einblicke in die entwicklungspsychologie, Teil III [Insight into developmental psychology, Part III]. Aachen, Germany: Shaker.
Wender, I., Strohmeyer, A., & Quentmeier, B. (1997). Technik bewegt die frauen—frauen bewegen die technik [Technology moves women—Women move technology]. Aachen, Germany: Shaker.
Wender, I., Popoff, A., Peters, A., Müller, K., & Foetzki, C. (2002). Step in—Mentoring & mobilität. Zwischenbericht [Step in—Mentoring and mobility. An interim report]. Braunschweig, Germany: Sigert.
Malaysia Transitions Toward a Knowledge-BasedEconomyBy Ramlee Mustapha and Abu Abdullah

Th
e J
ou
rna
l o
f Te
ch
no
log
y S
tud
ies
52
and Industry defined it as a knowledge-driven
economy in which the generation and exploita-
tion of knowledge play the predominant role
in the creation of wealth (Economic Research
Services Department, 2000). Meanwhile, the
Organization for Economic Cooperation and
Development (OECD, 1996) defined a k-
economy as an economy that is directly based
on the production, distribution, and use of
knowledge and information.
Investment in human capital is critical
in a k-economy. Human capital theory views
education and training as an investment that
can yield social and private returns through
increased knowledge and skills for economic
development and social progress (Schultz,
1963). The economic argument in favor of
knowledge-based education and training is
linked to the perceived need of the global
economy. It is based on the assumption that
economic growth and development are knowl-
edge driven and human capital dependent.
Despite a growing emphasis on knowledge-
based education and training, minimal research
exists with respect to the new workplace literacy
especially from the employers’ perspective.
Therefore, this article attempts to provide an
overview of workplace literacy from the per-
spective of the employers and also reviews
pertinent literature regarding Malaysia’s
transition toward a k-economy.
Workplace Literacy: Employers’Perspective
Murphy and Jenks (1983) conducted
interviews to identify the traits of successful
entry-level professional employment applicants.
The job opportunities investigated were either
management trainee, junior-level professional,
or apprenticeship positions. Employers clearly
indicated that both functional and adaptive skills
were needed. There was also a clear preference
for certain types of skills. Nearly 40% of the
responses related to communication and persua-
sion skills. Adaptive skills identified by the
employers included a wide range of attitudes,
personality traits, and work habits. Competition
is a major factor that motivates industry to be
more efficient and to employ strategies that
will improve production, service, and product
quality. Because such strategies usually require
workers’ collaboration and teamwork, employers
need creative, flexible workers who have a
broad range of interpersonal and managerial
skills.
Junge, Daniels, and Karmos (1984)
surveyed 116 large U.S. companies to rate the
knowledge and skills of employees related to
mathematics, writing, reading, speaking, listen-
ing, reasoning, and science. The purpose of the
survey was to determine the perceptions of
employers regarding the workplace literacy that
is important for successful employment. They
found that speaking, listening, and writing
followed by reasoning and reading skills were
regarded as important requirements for success-
ful employment. The most frequently cited
qualities were good attitude toward work;
willingness to adapt and learn; getting along
with others; neat and appropriate appearance;
promptness; infrequent absence from work;
familiarity with basic computer knowledge;
and good oral, written, and listening skills.
Research has also revealed reasons for
rejection of job applicants and termination of
employees. In a survey of employers conducted
by the Advisory Council for Technical and
Vocational Education in Texas, the reasons pro-
vided by employers for rejecting job applicants
included little interest for wanting the job, past
history of job hopping, poor communication
skills, health problems, immaturity, personal
appearance, poor mannerisms, personality,
lack of job-related skills, and poorly completed
application forms (Brown, 1976).
Zakaria (1988) studied the perceptions
of Malaysian employers regarding essential
employee traits and employability skills.
Employers rated arrive on time, demonstrate
a sense of responsibility, cooperate with the
supervisor, and possess a positive attitude
toward work as the major desirable employee
traits.
In 1989, Lieberman Research Incorporated
conducted a study of 1,000 senior executives
of FORTUNE 500 companies to explore the
beliefs of the executives regarding the American
public education system (Lieberman Research

Th
e J
ou
rna
l of Te
ch
no
log
y Stu
die
s
53
Inc., 1989; Passmore, 1994). Most of the
responding employers were highly critical of
the public education system. Approximately
two thirds of the respondents asserted that their
companies had difficulties hiring employees
because of basic skill deficiencies of job
applicants and that identifying potential
employees with adequate basic skills was
becoming more difficult. Clearly, employers
preferred employees who were motivated,
possessed basic skills, and had satisfied a
higher performance standard.
The Employment and Training
Administration of the U.S. Department of
Labor and the American Society for Training
and Development (ASTD) conducted a survey
of employers seeking potential employees
(Passmore, 1994). They found that many
employers valued basic literacy—reading, writ-
ing, and computing. In addition, the employers
preferred employees who had motivation to
learn; could communicate, especially through
listening and oral communication; could adapt
through creative thinking and problem-solving
skills; possessed effective personal management
skills; had interpersonal, negotiating, and
teamwork skills that made them effective work-
group members; and could influence others to
act through leadership skills. Moreover, employ-
ers preferred to conduct their own technical
skills training but only with employees who
possessed basic skills (Carnevale, Gainer,
& Meltzer, 1990).
The Harris Education Research Center
(HERC, 1991) assessed the views of employers,
educators, parents, and students regarding
American education. Employers clearly indicat-
ed that their new employees were borderline in
terms of functional literacy, capacity to express
themselves, and basic functional skills. In con-
trast, students and parents thought that their
schools were doing well (Passmore, 1994).
The U.S. Department of Labor Secretary’s
Commission on Achieving Necessary Skills
(SCANS, 1991) examined the literacy required
to enter employment using interviews with busi-
ness owners, public employers, union officials,
and line workers. The SCANS report identified
five major competencies and three foundation
areas that were required for entry-level job
performance. Basic skills, thinking skills, and
personal qualities formed the foundation on
which the five broad competencies were con-
structed. Basic skills included reading, writing,
arithmetic, mathematics, speaking, and listen-
ing. Thinking skills included creative thinking,
decision making, problem solving, abstract visu-
alizing of problems, knowing how to learn, and
reasoning. Desirable personal qualities included
individual responsibility, self-esteem, sociability,
self-management, and integrity.
Distler (1993) studied attitudes and percep-
tions of Maryland’s employers toward vocational
education and employment training programs.
The majority of the employers indicated that the
present educational approach is not sufficient to
train students effectively for the changing
demands of the workplace. If vocational and
training programs are to be effective, coopera-
tion among educators, legislators, employers,
and the community must be established.
An investigation by Custer and Claiborne
(1995) supported previous research
in which employers placed more emphasis on
employability skills rather than on technical
skills. They surveyed 299 U.S. employers in the
health, trade, and industry occupational areas.
The purpose was to explore employers’ priori-
ties regarding the types of skills they perceived
to be critical to their needs and the workforce.
The findings revealed that the most important
skills cluster was employability skills. Basic
skills ranked second and technical skills third.
A recent empirical research on the percep-
tions of Malaysian employers regarding employ-
ability and workplace literacy was conducted by
Mustapha (1999). The purpose of the study was
to examine employers’ perceptions regarding
the critical workplace literacy and employability
skills of vocational graduates. The sample
consisted of 120 employers from large and
medium-sized manufacturing companies.
The study found that employers believed that
the completers of vocational and technical pro-
grams had better employment opportunities than
completers of academic programs. Further,
employers indicated that vocational and techni-
cal graduates possessed necessary technical

Th
e J
ou
rna
l o
f Te
ch
no
log
y S
tud
ies
skills. However, employers were less satisfied
regarding the graduates’ motivation, communi-
cation, interpersonal, critical thinking, problem
solving, and entrepreneurial skills. This clearly
suggests that affective and employability skills
should be integrated into vocational and techni-
cal programs. Technical competencies were
perceived by Malaysian employers as the most
important knowledge and skills that vocational
and technical graduates should possess. They
also believed that communication and interper-
sonal skills are important. These results seem
to support previous research regarding the
importance of employability skills (Custer
& Claiborne, 1995; Greenan, Wu, Mustapha,
& Ncube, 1998; HERC, 1991; Lieberman
Research Inc., 1989).
Malaysia Transitions TowardKnowledge-Based Economy
The shift to the k-economy is part of
a wider plan to achieve the objective of the
nation’s Vision 2020. Vision 2020 is a 30-year
plan to “push” Malaysia to achieve a level at
par with industrial nations in terms of economic
performance and technological capability
(Mustapha & Abdullah, 2000). With the move
toward a k-economy, the country can achieve
sustainable Gross Domestic Product (GDP)
growth rates in the long run with knowledge
playing a dominant role in driving productivity
and sustaining economic growth. It is projected
that through an information and knowledge-
based economy, the level of the country’s
GDP can increase four fold within 20 to 25
years (Economic Research Services
Department, 2000).
However, Malaysia currently lacks some of
the critical elements to support the k-economy.
Among them are the lack of adequate knowl-
edge and skilled human resources, inadequacy
of a k-economy supportive education and train-
ing infrastructure, a lack of R&D capability,
a relatively weak science and technology base,
a deficiency in institutional support and info-
structure, a slowly evolving financing system,
and a lack of technopreneurs (Govindan, 2000).
The new global market calls for visionary
leadership and the adoption and application of
new management and organizational principles.
The old command-and-control management sys-
tem that many Malaysian organizations are used
to may not work in a new competitive environ-
ment. The education, training, and employment
policies have to change. Employers need to
recruit “knowledge” workers for higher skills
jobs. This requires our education system to pro-
duce graduates with relevant knowledge, critical
and higher order skills, and proper attitudes.
IT Infrastructure
Tangible evidence of Malaysia’s commit-
ment to the k-economy is the Multimedia Super
Corridor (MSC). This 50 x 15 km wide corridor
stretches from the center of Kuala Lumpur to
Cyberjaya, a newly established city approxi-
mately 40 km south of Kuala Lumpur, and is
designed to incubate high technology compa-
nies. When the MSC was first announced in
1995, it was estimated that the government
would spend RM 28 billion (approximately
USD 7.4 billion) to develop the infrastructure
and facilities required to attract international
high technology companies (Mohamed, Hasan,
Dzakiria, & Kassim, 1999).
It aims at revolutionizing IT and multime-
dia industries by creating a massive corridor
with a conducive environment for local and
international companies wanting to create,
distribute, and employ IT and multimedia prod-
ucts and services (Abdul Manab & Othman,
1999). MSC is also expected to place Malaysia
as a regional and international technology and
telecommunication hub. The MSC will propel
the transfer of technology and become the test
bed for R&D in high-tech industries
(Mohamed et al., 1999).
Due to the increasing demand for knowl-
edge workers to work in the IT and high-tech
industries of the MSC, the Smart School pro-
gram was adopted as one of the seven flagship
applications. The flagship will support the
government’s plan to obtain the status of an
industrialized nation by the year 2020 and to
gain a competitive edge over other developing
countries in the global economy (Mohamed et
al., 1999). In the Smart School concept, learn-
ing will be self-directed, individually paced,
contextualized, and reflective using IT as a
prime enabler (Abdul Manab & Othman, 1999).
54

Th
e J
ou
rna
l of Te
ch
no
log
y Stu
die
s
It is hoped that, eventually, all schools in this
country will be smart schools.
Despite the MSC project, schools in
Malaysia continue to lag behind other sectors
such as business and entertainment in utilizing
IT and multimedia technologies. A majority of
schools still do not have enough computers and
Internet facilities for most students to use fre-
quently. However, during the last decade the
increase in IT access and the emergence of new
telecommunication technologies have somewhat
changed how teachers perceive technology and
its applications in teaching and learning.
The IT literacy among Malaysian students
has not yet reached its satisfactory level. To
reach its maximum potential requires full com-
mitment, serious thinking, research, and experi-
mentation. Although Malaysia has made great
strides in enhancing its IT infrastructure, IT uti-
lization and structure in educational institutions
are still inadequate. Teachers and administrators
should reevaluate and restructure the curriculum
so that the curriculum is viable for IT literacy to
be developed among students (Mohamed et al.,
1999). Therefore, the administrators and educa-
tors should be urged to plan the curriculum
carefully and systematically in meeting the
needs of the society as a whole.
Policy Implications on NewWorkplace LiteracyHighest Level Commitment
The Malaysian government has already
recognized the importance of adapting to this
new economy and is committed to transform the
economy from a production-based to a knowl-
edge-driven economy. The prime minister dur-
ing his official speech at the launching of the
information technology campaign in 1997 stated
that IT is at the forefront of the country’s
national socioeconomic planning and develop-
ment. The government formulated the National
Information Technology Agenda (NITA) in
1996 to provide the country with the direction
and the way forward with IT. The NITA has
spelled out a three-pronged strategy aimed at
developing a knowledge society through build-
ing and developing the appropriate IT structure,
the creation and development of IT-based
applications, and human development effort.
In order to achieve this, the balanced develop-
ment of three important, interrelated elements
that involve people, infostructure, and applica-
tions are stressed (Economic Research Services
Department, 2000).
K-Economy Master Plan
The Malaysian K-Economy Master Plan
outlines the major k-economy policy initiatives.
Planned reforms in the education sector include
further privatization, twinning arrangements
with foreign institutions, and the construction
of advanced technical institutes and community
colleges. Infrastructure will be developed that
allows for the use of electronic diagnostic tools
in hospitals and networking among government
departments, their suppliers, and their cus-
tomers. Increased bandwidth is planned to facil-
itate greater e-commerce capacity. A draft of
amendments to various financial regulations
aims to create a more favorable investment
climate for local and foreign firms, particularly
those in designated high technology sectors.
It also includes profit repatriation and taxation
arrangements designed to lure foreign investors
back. This is in addition to a very publicized
crackdown on software piracy. Overall, the ini-
tiatives aim to address the serious shortages of
knowledge and skilled workers in Malaysia and
to attract much-needed foreign investment and
expertise, particularly in alliances with local
firms and institutions.
IT Literate Society
Reflected in a particular k-economy initia-
tive, the “One Home-One PC” policy allows
workers to withdraw their contributions to the
Employees Provident Fund (a retirement fund)
to purchase a personal computer. This initiative
supports a long-term plan to link 25% of the
population to the Internet by 2005. Another
initiative is the “Internet Desa” (Internet for
rural areas) program, which aims to provide
Internet access and basic computer skills to
people in rural areas via a networked personal
computer located in their local post office.
National Information Technology Council
The National Information Technology
Council (NITC) was established in 1994 to
guide the country toward the knowledge
empowerment of Vision 2020. The NITC aims
55

Th
e J
ou
rna
l o
f Te
ch
no
log
y S
tud
ies
to enhance the development and utilization of
IT as a strategic technology for national devel-
opment. The NITC acts as a think-tank at the
highest level and advises the government on
matters pertaining to the development of IT in
Malaysia (Infosoc Malaysia, 2000). The govern-
ment’s commitment toward the creation of a
k-economy is also evidenced by the develop-
ment of the Multimedia Super Corridor, the idea
mooted in 1994, and the creation of a pioneer
legal and regulatory framework encompassing,
inter alia, the Communication and Multimedia
Act, the Computer Crimes Act, and the Digital
Signatures Act (Economic Research Services
Department, 2000).
Development of Knowledge Workers
The creation of quality human resources
is important in a k-economy. These individuals
will form the backbone of the k-economy.
Knowledge workers are versatile, autonomous,
and highly skilled and are able to leverage and
build knowledge to produce useful action with
very strong and analytical skills. They are flexi-
ble and have a high tolerance for ambiguity.
For Malaysia to produce a pool of k-leaders and
k-workers, the educational system needs to be
revamped and restructured. The focus should be
directed to making the existing curriculum more
innovative to help students to invent and devel-
op a critical and analytical mode of thinking
and ultimately create a sufficient pool of
well-educated, highly skilled and strongly
motivated workers (Economic Research
Services Department, 2000).
The use of IT in teaching and learning
should facilitate knowledge construction and
engage learners in constructive, higher order,
creative, and critical thinking (Jonassen, 1996).
It should also develop team-based collaboration
and communication skills for solving real-life
problems. Teachers must redesign their instruc-
tional material to include the use of IT as a cog-
nitive tool rather than a mere delivery medium.
In this area, the government has already
taken the initiative of introducing the Smart
School project, which was launched during the
review of the Seventh Malaysia Plan (1996-
2000). The objective of the project is to produce
a new generation of IT-literate Malaysians who
are creative and innovative, adept with new
technologies, and able to access and manage
information to enhance the competitiveness and
productivity of the economy. At the same time,
the government is campaigning hard to woo
back Malaysians who are now working overseas.
In March 2000, the prime minister announced
a campaign to attract 5,000 skilled foreign
workers a year to help the nation into the infor-
mation age to ensure a massive brain gain, an
infusion of men and women of extraordinary
talent, creativity, knowledge, skill, and other
capabilities (Economic Research Services
Department, 2000).
To advance Malaysia into the forefront
of knowledge, investment in human capital is
critical, as a k-economy demands creative,
innovative, and knowledgable human resources.
It is for this reason that the state has continued
to allocate a substantial portion of the national
budget for financing the expansion and upgrad-
ing of education and training facilities. How-
ever, human resource development needs
to be further intensified, particularly through
public-private sector collaboration in building
science and technology human resources as well
as the intellectual capability and competency
in management and entrepreneurship. In this
regard, opportunities for lifelong learning for
all levels of the workforce should be enhanced
through this collaboration.
Rigorous Research and Development
The structure of the economy becomes
less distinct in the k-economy. Nevertheless, the
manufacturing sector, which accounts for more
than one third of the GDP of the country, still
continues to assume an important role in the k-
economy. However, in view of the migration of
the economy from production based to knowl-
edge based, the manufacturing sector would
have to gear up to adjust to the rapid change
in technological advancement by improving its
products through R&D and enhancing the pool
of “knowledge” workers (Economic Research
Services Department, 2000).
In a k-economy, it is crucial to develop the
R&D and the services sectors. It is generally
known that the level of development of the
services sector, particularly the knowledge
56

Th
e J
ou
rna
l of Te
ch
no
log
y Stu
die
s
57Selected R&D Statistics (1997)
Countries K-Skills
Workforce
(as % of total
workforce)
R&D/
GDP (%)
K-Skills in R&D
(per million
population)
Malaysia
Singapore
Korea
Taiwan
Japan
10.7
26.4
15.1
15.5
22.9
0.3
1.4
2.8
1.9
2.8
87
2,512
2,636
3,340
5,677
Table 1. Knowledge-Workforce Among Selected Countries
intensive segments of it, has become a key
determinant of the national competitiveness.
There are many compelling reasons for
Malaysia to develop its services sector. To begin
with, expanding this sector helps create national
wealth: A positive correlation exists between
high GDP per capita and the intensity of servic-
es activity in the economy, mostly because com-
pensation levels in this sector normally surpass
those in agriculture and manufacturing
(Economic Research Services Department,
2000). Moreover, in economies with a strong
emphasis on services, people tend to climb the
“value-chain ladder” much more rapidly. It is
generally believed that in the k-economy, the
information-related industries and knowledge-
intensive industries play the dominant role.
Innovation is one of the key success factors
in a k-economy, and it is R&D that determines
innovation. According to the OECD (1996), the
proxies generally used to represent the produc-
tion of new ideas and innovation is R&D expen-
diture and the number of patents. Based on
some available relevant statistics (see Table 1),
it is apparent that Malaysia currently has a rela-
tively low k-workforce and R&D investment.
Creativity, Innovation, and Entrepreneurship
IT leaders and business gurus believe that
the new economy is about the power of ideas
and knowledge, which is why it is important
to encourage entrepreneurship in Malaysia.
Entrepreneurship is a collaborative effort. It may
be easy to generate ideas, but hard to provide a
conducive environment to allow the ideas to
kick-start and grow. School systems at all levels
should include entrepreneurship in their curricu-
lum. It should focus on creating new and inno-
vative ideas by the students and converting them
into full-fledged business plans for future use.
Infrastructure, Accessibility,
and Connectivity
There must be affordable and equitable
access and connectivity to ensure that all levels
of society can participate in the new economy.
Businesses and citizens must have access to a
low-cost, high-speed communication infrastruc-
ture. This is key to balanced urban and regional
development across the country. Reducing
access costs plays a major role in this context.
In terms of accessibility to the IT infrastructure,
Malaysia performed better compared to other
developing countries, but the situation reversed
when compared with advanced countries.
Table 2 shows the number of personal comput-
ers and Internet hosts in Malaysia vis-à-vis
other countries.
Note. Data source: Bank Negara Malaysia, 2000.

Th
e J
ou
rna
l o
f Te
ch
no
log
y S
tud
ies
Lifelong Learning
With knowledge replacing physical and
natural resources as the key ingredient in eco-
nomic development, education and HRD poli-
cies must be given due priority. The approach to
HRD must be balanced and holistic. There must
be a genuine partnership among government
ministries, especially the Human Resource and
Education Ministries, and between the private
and public sectors to strategize and implement
a human resource policy that is directed towards
fulfilling the objectives of a k-economy
(Badawi, 2000). Because economic develop-
ment is now more dynamic than ever due to
rapid technological improvements and global
competition, the skills needed to succeed in this
new economy will be different. Few will be able
to equip themselves with lifetime working
skills just from their years of formal education.
Lifelong learning conducted through non-
formal channels such as virtual universities and
distance learning, with skill acquisition at all
age levels, must be promoted if the human
resource is to constantly stay abreast of new
and rapid development in the k-economy. In
the context of HRD, Malaysia needs to adopt
a two-pronged strategy (Badawi, 2000). One is
to ensure that those who are currently unskilled
or low skilled are given the opportunity to learn
and train so that they can have a productive role
in the k-economy. And second, incentives and
opportunities must be given to those with the
potential to keep on acquiring knowledge and
skills. HRD must move every Malaysian up the
skill ladder, and at the same time reward excel-
lence by allowing all individuals to fulfill their
potential. If the school and training systems fail
to train and retrain the traditional workers,
their existing skills may become obsolete in the
new economic environment. If those with mini-
mal education, knowledge, or skills are not
given the opportunity to continue their educa-
tion, they will lag behind and will be less likely
to participate in the k-economy. Indirectly, the
government will lose precious human capital
that could have been harnessed effectively into
a new economic paradigm. Therefore, HRD
must be geared toward providing every citizen
an opportunity to contribute at his or her
optimum level.
It is evident that the Malaysian government
is committed to building a critical mass of
“knowledge” workers. Already under considera-
tion are plans to build more advanced technical-
58
Indicators of Communication and Information Infrastructure in 1996
Countries No. of Personal
Computers (per
1,000 population)
No. of Internet
Hosts (per 1,000
population)
Malaysia
United States
United Kingdom
Japan
South Korea
Singapore
43
362
193
128
132
217
19
442
149
76
29
196
Table 2. Indicators of Communication and Information Infrastructure Among Selected Countries
Note. Data source: Jaafar, 2000.

Th
e J
ou
rna
l of Te
ch
no
log
y Stu
die
s
59
industrial training institutes and community
colleges in addition to the establishment of
more “second route” programs to provide
school leavers the opportunity to learn new
skills. There is also a need for greater alliances
between universities and the private sector to
encourage industrial placements and internships.
Greater attention must also be given to training
workers in the small and medium industries
(SMI). Most of the SMI firms can’t afford to
invest in training, retraining, and R&D.
Therefore, public sector HRD initiatives
must prioritize SMI workers who have minimal
opportunities to enhance their skills by their
employers. At the same time IT training must
be promoted, especially among working adults,
to increase IT literacy among the workforce.
School teachers should be given incentives to
continue to upgrade their IT skills in light of the
primacy of these tools in the k-economy. Civil
servants and servicemen should also be given
this training so that they are able to be absorbed
into the technology intensive private sector
upon the completion of their service. ICT train-
ing should also be extended to nonworking
adults such as the disabled, senior citizens, and
housewives so that they can contribute to the
k-economy as virtual home-based workers,
offering services through virtual interfaces such
as the Internet.
In recognizing that HRD is a critical factor
in a k-economy, smart partnerships between the
public and private sectors should be established.
In particular, the private sector must play a
greater role in technical and vocational training
in order to complement the efforts of the gov-
ernment. The government should continue to
assist the private sector in training and retrain-
ing workers, but there must be a continued
commitment from employers to encourage and
provide incentives for their workers to acquire
new knowledge and skills.
What It All MeansResearch has shown that employers
perceive technical competency as the critical
workforce literacy. Communication and inter-
personal skills are also essential. Other skills
include critical- and problem-solving skills,
self-motivation, and management skills.
However, to compete and survive in the era
of a k-economy and globalization, a new set
of workplace literacy is deemed necessary.
The k-economy requires knowledgeable, skilled,
dynamic, creative, and innovative human
resources. In addition, the new global market
calls for visionary leadership and the adoption
and application of new management and organi-
zational principles. The old command-and-con-
trol management system that many Malaysian
organizations are used to may not work in a
new competitive environment. Thus, education,
training, and employment policies have to
change. Employers need to recruit more
“knowledge” workers for higher skills jobs.
This requires the education system to produce
graduates with relevant knowledge, critical
skills, and proper attitudes. Teacher training
programs must also undergo substantial trans-
formation. To create a new kind of workplace
literacy based on the k-economy, some of the
recommendations include:
• Create a technology roadmap to search
for “niche” technology for Malaysia.
• Identify future knowledge and com-
petencies.
• Invest in human capital.
• Provide a world-class telecommunication
system that is accessible to all at com-
petitive prices.
• Create an information society for all,
where every citizen can play an active
role in the k-economy.
• Promote the use of information
technologies in all sectors.
• Equip all schools with high-speed
Internet connections and multimedia
PCs in sufficient numbers.
• Adapt the school curriculum and train
the teachers in IT.
• Provide opportunities for lifelong
learning.
• Invest in extensive research and
development in order to increase the
country’s competitiveness both regionally
and internationally.
• Establish systematic R&D networks
linking businesses, educational
institutions, and research institutes.
• Recognize and reward individuals or
industries that are involved in creative

Th
e J
ou
rna
l o
f Te
ch
no
log
y S
tud
ies
and innovative work practices.
• Promote smart partnerships between
the public and private sectors.
Ramlee Mustapha is the chair of the techni-
cal and vocational education program at the
National University of Malaysia. 60
ReferencesAbdul Manab, N., & Othman, A. (1999, December). The implementation of information and
communication technology in nurturing smart school learning environment in Malaysia:
The Tiger Web project. Paper presented at the Malaysian Educational Research Association
Conference, Melaka, Malaysia.
Badawi, A. (2000, September). Keynote address at the 4th national Smart Partnership Dialogue, Kuala Lumpur, Malaysia.
Bank Negara Malaysia. (2000). Annual report 1999. Kuala Lumpur, Malaysia: Author.
Brown, K. W. (1976). What employers look for in job applicants. Business Education Forum, 30(7), 7.
Carnevale, A. P., Gainer, L. J., & Meltzer, A. S. (1990). Workplace basics: The skills employers want.San Francisco: Jossey-Bass.
Custer, R. L., & Claiborne, D. M. (1995). Critical skills clusters for vocational education: The employers’ perspective—replication study. Journal of Vocational Education Research, 20(1), 7-33.
Distler, J. A. (1993). Attitudes and perceptions of Maryland’s mid-shore employers toward vocational education and employment training programs. Unpublished doctoral dissertation, Temple University, Philadelphia.
Economic Research Services Department. (2000, August). Special economic issue. Kuala Lumpur, Malaysia: Bumiputra-Commerce Bank.
Greenan, J. P., Wu, M., Mustapha, R. B., & Ncube, L. (1998). Attitudes and motivations of vocationalteachers regarding program improvement. Journal of Industrial Teacher Education, 35(3), 6-23.
Govindan, K. (2000). Globalization, k-economy, and the virtual state. Paper presented at the 12th National Real Estate Conference, Kuala Lumpur, Malaysia.
Harris Education Research Center. (1991). An assessment of American education: The views of employers, higher educators, the public, recent students, and their parents. New York: Louis Harris & Associates.
Infosoc Malaysia. (2000). Access and equity: Benchmarking for progress. Kuala Lumpur, Malaysia: National Information Technology Council.
Jaafar, A. S. (2000, June). K-economy: Issues and challenges. Paper presented at the national seminar on strengthening the macroeconomic fundamentals of the Malaysian economy, Kuala Lumpur, Malaysia.
Jonassen, D. H. (1996). Computers in the classroom: Mind tools for critical thinking.Englewood Cliffs, NJ: Prentice-Hall.
Junge, D. A., Daniels, M. H., & Karmos, J. S. (1984). Personnel managers’ perceptions of requisite basic skills. The Vocational Guidance Quarterly, 33(2), 138-146.
Lieberman Research Inc. (1989). Business responses to education in America: A study conducted among the largest U.S. companies. New York: Time.
Mohamed, A. H., Hasan, H., Dzakiria, H., & Kassim, A. (1999, October). IT impact on schools: Overcoming barriers in integrating computers in the Malaysian primary schools.Paper presented at the 10th Asian Workshop on IT, Bangi, Malaysia.

Th
e J
ou
rna
l of Te
ch
no
log
y Stu
die
s
61
Murphy, C., & Jenks, L. (1983). Getting a job after college: What skills are needed? Journal of Career Education, 10, 80-93.
Mustapha, R. (1999). The role of vocational and technical education in the industrialization of Malaysia as perceived by educators and employers. Unpublished doctoral dissertation, Purdue University, West Lafayette, IN.
Mustapha, R., & Abdullah, A. (2000). School-to-work and vocational training in Malaysia. International Journal of Vocational Education and Training, 8, 67–87.
Organization for Economic Cooperation and Development. (1996). The 1996 science, technology and industry outlook. Paris: Author.
Passmore, D. L. (1994). Expectations for entry-level workers: What employers say they want. In A. J. Pautler (Ed.), High school to employment transition: Contemporary issues (pp. 23-29). Ann Arbor, MI: Prakken.
Secretary’s Commission on Achieving Necessary Skills, U.S. Department of Labor. (1991). What work requires of schools. Washington, DC: U.S. Government Printing Office.
Schultz, T. W. (1963). The economic value of education. New York: Columbia University Press.
Zakaria, A. (1988). Perceptions of industrial training and employability skills: A comparative study of the vocational school and the MARA vocational institute students in Malaysia.Unpublished doctoral dissertation, University of Pittsburgh, Pittsburgh, PA.

Th
e J
ou
rna
l o
f Te
ch
no
log
y S
tud
ies
62Books Briefly Noted
Alexander, Brian (2003). Rapture: A raucous tour of cloning, transhumanism, and the new era
of immortality. New York: Basic Books. ISBN 0-7382-0761-6, pb, $15.00.
Brian Alexander takes readers into the surprising stories behind cloning, stem cells, miracle drugs, and genetic engineering to show how the battle for the human soul is playing out in the broader culture— and how the outcome will affect each and every one of us. Rapture’s Dickensian cast of characters includesthe father of regenerative medicine, an anti-aging guru, and a former fundamentalist Christian and founder of the company that reportedly cloned the first human cell. This motley crew is in part being united by theforce of the opposition: a burgeoning coalition of conservative Republicans, the Christian right, and theGreens—predicting impending doom should we become adherents of the new bio-utopian faith. The book is irreverent, shocking, and highly entertaining as it seeks to separate hype from reality.
Anderson, John D., Jr. (2004). Inventing flight: The Wright brothers and their predecessors.
Baltimore, MD: The Johns Hopkins University Press. ISBN 0-8018-6875-0, pb, $18.95.
The invention of heavier-than-air flight craft counts among humankind’s defining achievements. In thisbook, the renowned aeronautical engineer John D. Anderson, Jr., offers a concise and engaging account of the technical developments that help to explain the Wright brothers’ successful first flight on December 17,1903. While the accomplishments of the Wrights have become legendary, we do well to remember that theyinherited knowledge of aerodynamics and considerable flying-machine technology. Beginning with the earli-est attempts at flight, Anderson notes the many failed efforts. He tells the fascinating story of aviation pio-neers such as Sir George Cayley who proposed the modern design of a fixed-wing craft with a fuselage andhorizontal and vertical tail surfaces in 1799 and of William Samuel Henson who won a patent in 1842 butnever flew. He also examines the crucial contributions of German engineer Otto Lilienthal to the science of aerodynamics. With vintage photographs and informative diagrams, Inventing Flight will interest anyonewho has ever wondered what lies behind the miracle of flight.
Beattie, Andrew, Paul R. Ehrlich (2004). Wild solutions: How biodiversity is money in the bank.
New Haven, CT: Yale University Press, 2nd edition. ISBN 0-300-10506-1, pb, $16.00.
In this fascinating and abundantly illustrated book, two eminent ecologists explain how the millions of species on Earth not only help keep us alive but also hold possibilities for previously unimagined prod-ucts, medicines, and even industries. In an afterword written especially for this edition, the authors considerthe impact of two revolutions now taking place: the increasing rate at which we are discovering new speciesbecause of new technology available to us and the accelerating rate at which we are losing biological diversity. Also reviewed and summarized are many “new” wild solutions, such as innovative approaches to the discovery of pharmaceuticals, the “lotus effect,” the ever-growing importance of bacteria, molecularbiomimetics, ecological restoration, and robotics.
Bergeron, Kenneth D. (2004). Tritium on ice: The dangerous new alliance of nuclear weapons
and nuclear power. Cambridge, MA: The MIT Press. ISBN 0-262-52433-3, pb, $15.95.
This winner of the Gold Award in Political Science in 2002 is now in paperback. For more than 50 years after the start of the nuclear age, the U.S. followed a policy barring commercial nuclear reactors fromproducing the ingredients of nuclear weapons. But in the fall of 2003 all that changed when a power plantoperated by TVA started making tritium for the Department of Energy at the same time producing electricityfor the commercial grid. Tritium, a radioactive form of hydrogen, is needed to turn A-bombs into H-bombs,and the commercial nuclear power plant that was modified to produce tritium is of a type called “ice con-denser.” This book provides an insider’s perspective on how this nuclear policy reversal came about, and why it is dangerous.
Bødker, Keld, Finn Kensing, Jesper Simonsen (2004). Participatory IT design: Designing for business
and workplace realities. Cambridge, MA: MIT Press. ISBN 0262-02568-X, hc, $50.00.
The goal of participatory IT design is to set sensible, general, and workable guidelines for the introduc-tion of new information technology systems into an organization. Reflecting the latest systems-developmentresearch, this book encourages a business-oriented and socially sensitive approach that takes into considera-tion the specific organizational context as well as first-hand knowledge of users’ work practices and allowsall stakeholders—users, management, and staff—to participate in the process. Drawing on the work of a 10-

Th
e J
ou
rna
l of Te
ch
no
log
y Stu
die
s
63
year research program in which the authors worked with Danish and American companies, the book offers aframework for carrying out IT design projects as well as case studies that stand as examples of the process.
Broadbent, Marianne, Ellen Kitzis (2004). The new CIO leader: Setting the agenda and delivering results.
Boston: Harvard Business School Press. ISBN 1-59139-57-1, hc, $35.00.
Two converging factors—the ubiquitous presence of technology in organizations and the recent technology downturn—have brought Chief Information Officers to a critical breaking point. Then can seizethe moment to leverage their expertise into a larger and more strategic role than ever before or they canallow themselves to be relegated to the sideline function of “chief technology mechanic.” Drawing on exten-sive Gartner, Inc. interviews and research with thousands of CIOs and hundreds of companies, the authorsoutline the agenda CIOs need to integrate business and IT assets in a way that moves corporate strategy forward. Dozens of case examples appear throughout the book including AXA, Banknorth, British Airways,Citigroup, Commerce Bank, Disney, SKF, Starwood, Unicef, and U.S. city and federal agencies.
Bunch, B. & Hellermans, A. (2004). The history of science and technology: A browser’s guide to the great
discoveries, inventions, and the people who made them from the dawn of time to today. Boston:
Houghton Mifflin. ISBN: 0-618-22123-9, $40.00.
Have you ever wondered how bridges are built? Do you know what medical discoveries led to the introduction of vaccines and antibiotics? Do you know why PCR (polymerase chain reaction) is one of thepillars of the biotechnology revolution? The History of Science and Technology is the ultimate resource foranswers to questions about the when, what, why, and how of science and technology.
This accessible reference work, organized within 10 major periods of history, is a comprehensive,chronological guide to the scientific discoveries and technological innovations from the earliest periods of recorded history into the 21st century.
With more than 7,000 concise entries in such fields as archaeology, biology, computers, food and agriculture, medicine and health, and transportation, the book covers trends, important breakthroughs, births, deaths, and other useful information. Features include:
- in-depth section introductions that place each epoch in context- short essays on intriguing topics, such as the history of DNA, the transit of Venus,
the nature of light, and the relationship between electricity and magnetism- 300 brief biographies of such personalities in science and technology as Galileo,
the first scientist of the scientific revolution, and Charles Babbage, designer of the first mechanical computer
- 300 black-and-white drawings and photographsMost entries are cross-referenced so that the reader can easily trace connections over time.
This arrangement allows the reader to choose between following the development of a specific field through history and focusing on the breadth of innovation during a certain period.
Browsable yet richly detailed, The History of Science and Technology is an invaluable desktop reference for general reader and educator alike.
Campbell-Kelly, Martin (2004). From airline reservations to Sonic the hedgehog: A history of the software
industry. Cambridge, MA: The MIT Press. ISBN 0-262-53262-X, pb, $16.95.
From its first glimmerings in the 1950s, the software industry has evolved to become the fourth largestindustrial sector in the U.S. economy. Starting with a handful of software contractors who produced special-ized programs for a few existing machines, the industry grew to include producers of corporate softwarepackages and then makers of mass-market products and recreational software. This book tells the story ofeach of these types of firms, focusing on the products they developed, the business models they followed,and the markets they served.
Cassidy, David C. (2004). J. Robert Oppenheimer and the American century. New York: Pi Press. ISBN 0-13-147996-2, hc, $27.95.
The story of J. Robert Oppenheimer, physicist extraordinaire and the man who led the scientific teamfor the Manhattan Project that built the atomic bomb, has fascinated many people. Award-winning authorDavid Cassidy, using previously unexamined documents, presents for the first time an integrated and coher-ent account of the man within the context of the nation he loved and so profoundly affected. Cassidy hascrafted a richly detailed, gripping, and nuanced look at the theorist who theorized about black holes, thehumanist who read Sanskrit, the man who loved his family, and the statesman who confronted the hardest

Th
e J
ou
rna
l o
f Te
ch
no
log
y S
tud
ies
64
moral dilemmas and scientific problems of his age. The hidden story of the political and social forces thatshaped the world in the 20th century is the rise of American science, and Oppenheimer was at its epicenter.His story is at the crux of America’s astonishing rise to power and an insight into the technological progressof our nation.
Chadarevian, Soraya de, Nick Hopwood, Eds. (2004). Models: The third dimension of science.
Stanford, CA: Stanford University Press. ISBN 0-8047-3971-4, pb, $24.95.
Now that “3-D models” are so often digital displays on flat screens, it is timely to look back at solidmodels that were once the third dimension of science. This book is about wooden ships and plastic mole-cules, wax bodies and a perspex economy, monuments in cork and mathematics in plaster, casts of diseases,habitat dioramas, and extinct monsters rebuilt in bricks and mortar. These remarkable artifacts were fixturesof laboratories and lecture halls, studios and workshops, dockyards and museums. Considering such objectstogether for the first time, this interdisciplinary volume demonstrates how, in research, as well as teaching, 3-D models played major roles in making knowledge. Accessible and original chapters by leading scholarshighlight the special properties of models, explore the interplay between representation in two dimensionsand three, and investigate the shift to modeling with computers. The book is fascinating reading for anyoneinterested in the sciences, medicine, and technology, and in collections and museums.
Clarke, David, Ed. (2005). Theory of technology. New Brunswick, NJ: Transaction Publishers.
ISBN 0-7658-0844-7, pb, $29.95.
The history of technology is often troubled by good ideas that do not, for one reason or another, take off right away—sometimes for millennia. Sometimes, technology comes to a standstill, and sometimes, iteven reverses itself. Thus, unlike science, which seems to proceed at a reasonable and calm rate, the progressof technology is difficult to theorize about. David Clarke brings together 10 authors from a range of disci-plines who try to understand technology from a variety of viewpoints. These essays originally appeared intwo issues of Knowledge, Technology & Policy in 2002 and 2003.
Eglash, Ron, Jennifer L. Croissant, Giovanna Di Chiro, Rayvon Fouché, Eds. (2004). Appropriate
technology: Vernacular science and social power. Minneapolis, MN: University of Minnesota Press.
ISBN 0-8166-3427-0, pb, $25.95.
From the vernacular engineering of Latino car design to environmental analysis among rural women, to
the production of indigenous herbal cures—groups outside the centers of scientific power persistently defy
the notion that they are merely passive recipients of technological products and scientific knowledge. This
work is the first study of how such “outsiders” reinvent consumer products—often in ways that embody cri-
tique, resistance, or outright revolt.
Emsley, John (2004). Vanity, vitality, and virility: The science behind the products you love to buy. New York:
Oxford University Press. ISBN 0-19-280509-6, hc, $28.00.
Acclaimed popular science writer John Emsley explains the nature and behavior of about 40 ingredients
that play important roles in every aspect of modern living. There are chapters on cosmetics, foods, sex,
hygiene, depression, and on four unexpected ways in which modern products improve our lives. So if you
have ever asked yourself whether cosmetics can deliver what they promise, whether certain spreads really
can reduce cholesterol, whether nitrates in water are a cause of cancer, or whether Prozac is as safe as they
say, dive into Vanity, Vitality, and Virility and discover things you always wanted to know.

Volume XXX, 2004No. 4 Fall 2004
A refereed publication of The International Honor Society for Professions in Technology.
Promoting Excellence in Preparation and Excellence in Practice
EditorDennis Cheek
Board of Editors
E. Stephanie AtkinsonUniversity of SunderlandSchool of EducationHammerton Hall, Gray Rd.Sunderland, U.K. [email protected]
Wan-Lee ChengDepartment of Design and IndustrySan Francisco State University1600 Holloway Ave.San Francisco, CA 94132415.338.2211fax: [email protected]
David Devier(representing the Board of Directors)
Michael J. DyrenfurthDepartment of Industrial TechnologyPurdue University1410 Knoy Hall, Room 461West Lafayette, IN 47907-1410765.496.1203fax: [email protected]
Marie KraskaEducational Foundations, Leadership,and TechnologyAuburn University4036 Haley CenterAuburn University, AL 36849-5221334.844.4460fax: [email protected]
Linda Rae Markert200 Poucher HallState University of New Yorkat OswegoOswego, NY [email protected]
Howard E. MiddletonSchool of Vocational Technologyand Arts EducationFaculty of EducationGriffith UniversityNathan 4111 QueenslandAustralia61.7.3875.5724fax: [email protected]
Sam C. ObiDepartment of TechnologySan Jose State UniversityOne Washington SquareSan Jose, CA 95192-0061408.924.3218fax: [email protected]
Christopher J. Shelley CMfgEW. L. Gore & Associates705 Guido Dr.Middletown, DE [email protected]
Xeushu SongDepartment of TechnologyNorthern Illinois UniversityDekalb, IL 60115-2854815.753.1349fax: [email protected]
Staff for this IssueEditorialConsultantsNancy HooseSeth A. Streichler
PublisherJerry Streichler
Office ManagerSusan Pickens
Art & LayoutKnape Designs
The Journal of Technology Studies (JTS) (ISSN 1071-6048) is the flagship, peer-reviewed journal of Epsilon Pi Tau, Inc., a nonprofit, academic and professional honorsociety. Headquarters and editorial offices are located at the Technology Building,Bowling Green State University, Bowling Green, OH 43403-0305. Use this address [email protected] for subscription matters or purchases.
Copyright 2004 by Epsilon Pi Tau, Inc.
The opinions expressed by the journal’s authors are not necessarily those of the Boardof Directors, staff, or members of Epsilon Pi Tau.
Two print issues per year are mailed to all members of the society and to academic andgeneral libraries around the globe. Issues that are published online only, the aforemen-tioned printed issues, and past issues are available free online at scholar.lib.vt.edu/ejour-nals/JTS.
The journal is currently indexed in: Current Index to Journals of Education (USA);International Bibliography of the Social Sciences (IBSS) (UK); and the InternationalVocational Education and Training and Research Database at http://www.ncver.edu.au(Australia).
Separate articles or complete issues are also available in a variety of media forms from:
ProQuest Information and Learning Co., P.O. Box 1346, Ann Arbor, MI 48106-1346
Or EBSCO Publishing, 10 Estes Street, Ipswich, MA 01938-0682, USA
The JTS welcomes original manuscripts from scholars worldwide focused on the depthand breadth of technology as practiced and understood past, present, and future. EpsilonPi Tau, as perhaps the most comprehensive honor society among the technology profes-sions, seeks to provide up-to-date and insightful information to its increasingly diversemembership as well as the broader public. Authors need not be members of the societyin order to submit manuscripts for consideration. Contributions from both academicsand practitioners are equally welcome.
A general guide to the breadth of topics of potential interest to our readers can be gainedby consideration of the 17 subclasses within “Technology” of the classification schemeof the Library of Congress, USA <lcweb.loc.gov/catdir/cpso/lcco/lcco_t.pdf>. Thisincludes engineering and allied disciplines, informatics in its many manifestations,industrial technology, and education in and about technology.
Authors are strongly urged to consult the journal’s “Guidelines for Authors,” included inthis publication, or available at the society’s Web site or provided upon request. It providesadditional details on the breadth and nature of topics of interest, the journal’s scholarlywriting standards, submission guidelines, and review and publication processes.
Printed in the United States of America by Kennedy Printing Company, Findlay, Ohio.
Board of Directors
Region 1 (The nations of Europe, theEastern Provinces of Canada, and the Northeastern United States)Dr. Marvin SarapinDepartment of TechnologyKean UniversityUnion, NJ 07083908.737.3500fax: [email protected]
Region 2 (The nations of Africa, theCaribbean Islands, and theSoutheastern United States)Robert E. WenigDepartment of Mathematics, Science, & Technology EducationBox 7801North Carolina State UniversityRaleigh, NC 27695-7801919.515.1742fax: [email protected]
Region 3 (All members-at-large, theCanadian Province of Ontario, and the North Central United States)David DevierUniversity of Cincinnati, Clermont College4200 Clermont College DriveBatavia, OH 45103513.732.5209fax: [email protected]
Region 4 (The nations of Central andSouth America, the Northern Territoryand Central Provinces of Canada, andthe Central United States)Kennard G. Larson, on leave 9/1/04 - 12/31/04Dept. of Industrial TechnologyUniversity of Nebraska at Kearney905 West 25th StreetKearney, NE 68849308.865.8504fax: [email protected]
Dr. Ray Diez 9/1/04 - 12/31/04The University of North DakotaFaculty of Industrial TechnologyCornell St.Grand Forks, ND [email protected]
Region 5 (Australia, the island nationsof the Pacific and Indian Oceans, thenations of Asia, the Yukon Territoryand Western Provinces of Canada,and the Western United States)James EdwardsDepartment of Design & IndustrySan Francisco State University1600 Holloway AvenueSan Francisco, CA 94132415.338.7896fax: [email protected]
Associate Executive Director for Information and CommunicationDr. Dennis CheekScience Applications International Corp.916 Springdale Dr.Exton, Pa [email protected]
Associate Executive Director forCommunity and Technical CollegesJerry C. OlsonTechnology BuildingBowling Green State UniversityBowling Green, Ohio 43403419.372.0378fax: [email protected]
Associate Executive Director forInternational AffairsMichael DyrenfurthSchool of TechnologyPurdue UniversityRoom 461, Knoy HallWest Lafayette, IN 47907-1410765.496.1203fax: [email protected]
Executive DirectorJerry StreichlerTechnology BuildingBowling Green State UniversityBowling Green, Ohio 43403419.372.2425fax: [email protected]
A refereed publication of The International Honor Society for Professions in Technology.
The Journal of Technology Studies

1
2 Russia DevelopsEducational Standards for Higher VocationalTraining in the Technologyand EntrepeneurshipSpecialtyA. A. Karatchev and N. N. Lavrov
7 The Law and Technologists:Implications for theTechnology CurriculumJoan Forret
13 Recruitment Strategies for Industrial TechnologyProgramsRon O’Meara and Mindy Carmichael
17 Is the Serpent Eating ItsTail? The Digital Divide and African AmericansJacqueline Horton
25 Student Perceptions of Web-Based SupplementalInstructionSteven A. Freeman and Dennis W. Field
32 PC-Based Virtual Reality for CAD Model ViewingAbhishek Seth and Shana S-F Smith
38 Technology Profile:An Assessment Strategy for Technological LiteracyCharles W. Gagel
45 A Comparison of Industrialand Academic Perceptions ofQuality Control EducationR. Neal Callahan and Shawn D. Strong
54 Student Behaviors in theContext of Computer Aided Learning in Design andTechnology Teacher TrainingE. Stephanie Atkinson
65 The W. E. B. DuBois andBooker T. Washington Debate:Effects upon African AmericanRoles in Engineering and Engineering TechnologyKeith V. Johnson and Elwood Watson
71 A Multiple-Regression Modelfor Monitoring Tool Wear witha Dynamometer in MillingOperationsJacob C. Chen and Joseph C. Chen
78 Holistic Assessment of Studentsin Undergraduate IndustrialTechnology ProgramsDennis W. Field, Steven A. Freeman, and Michael J. Dyrenfurth
86 Technologies Applied in theToshka Project of EgyptWafeek S. Wahby
Table of ContentsVolume XXX, Number 4, Fall 2004

This article may not bring the reader to a sense
of closure, or a conclusion as to what will hap-
pen in Russian vocational education. It does
offer insight into what Russian educators are
facing on a daily basis as they try and find and
pursue the best course of action as they attempt
to create a curriculum that will address the
major needs of Russian society now and in the
immediate future. This article may make more
impact on our readers if they knew that the
average salary that a Russian university profes-
sor makes is equal to one U.S. dollar a day, or
that most schools either have no computers or
ones that can only run DOS programs, or that
Internet access is still a dream of the future for
most Russian students and professionals.
This article presents issues related to train-
ing teachers of technology and entrepreneurship
in Russia’s higher educational establishments,
that is, those who will actually represent in 1st
to 11th forms of Russia's general schools techno-
logical units, assigned to the technology educa-
tional field.
Technology, as a part of general education,
ensures that the school children acquire tech-
nological competence, being in tandem with
skills to master diversified means and ways to
transform and transfer materials, energy, and
data; to estimate the economy’s efficiency and
possible environmental implications of techno-
logical activity; and to set up their own course
for life and career. It facilitates building up gen-
eral skills and habits of work, simultaneously
develops creativity, and enables the tackling of
practical problems. In the system of general
education, technology is aimed so that the
school children are able to:
• Form technological knowledge and skills
as the basis for successful creative and
developing activity.
• Acquire inner need and deferential
treatment of work and its products.
• Acquaint themselves with different types
of vocational activity and contribute
to their career self-determination.
• Reveal and develop creativity; build up
and widen their cognitive interest.
• Form their working, graphical, business,
ecological, informative, ethic, and esthet-
ic culture.
• Enjoy every opportunity for self-actual-
ization, self-assertion, and socialization.
Used to this effect, technology concurs to devel-
op wholeness of one's personality, har-monically
combining inner need for both physical and
mental work, continuous self-education, and
self-development.
In Russia, teachers of technology are being
trained in 69 pedagogical universities at the fac-
ulties of technology and entrepreneurship. Their
training, in respect to future pedagogical spe-
cialty, is governed by the State Educational
Standard for Higher Vocational Training
(SESHVT). To educate a teacher, SESHVT
includes the following sections:
• General humanitarian and socioeconomi-
cal disciplines (philosophy, history, soci-
ology, economy, etc.) – 1,500 hr.
• General mathematical and natural-science
disciplines (higher mathematics, physics,
chemistry, etc.) – 1,000 hr.
• General vocational disciplines (pedagogy,
psychology, teaching methodology, etc.) –
1,600 hr.
• Disciplines of subject training (engineer-
ing science, electro-radio engineering,
technological practical training, info-
technologies, marketing, management,
etc.) – 4,334 hr., including 900 hr. taken
by disciplines referred to as a specializa-
tion.
In addition, there are standards developed to
acquire both basic and optional specialties.
When, in 2000, the Ministry of Education
of the Russian Federation adopted SESHVT for
the second generation, it actually meant review-
ing the achievements and starting a new essen-
tial stage of theoretical and practical work in the
Th
e J
ou
rna
l o
f Te
ch
no
log
y S
tud
ies
Articles Russia Develops Educational Standards for HigherVocational Training in the Technology andEntrepeneurship SpecialtyA. A. Karatchev and N. N. Lavrov
2
Th
e J
ou
rna
l of Te
ch
no
log
y Stu
die
s
field. Its results, worded in the respective stan-
dard regulations, teaching and methodological
documentations, that is, curricula, educational
programs, textbooks, training aids, methodologi-
cal recommendations, etc., shall govern training
of a specialist-teacher in the near future. Now
within the university level, where the powers
have been delegated, the issue of SESHVT’s
unambiguous interpretation has definitely
become of prime importance. In view of this
we, as the authors of SESHVT on the technolo-
gy and entrepreneurship specialty, would like
to dwell on certain conceptual notions, actually
the staple of standard's development and appli-
cation.
Presently, there is no uniformity among
Russia’s analysts in regard to how to treat issues
of higher education standardization. And, stan-
dardization of higher pedagogical education as
a subsystem of the general higher vocational
education is definitely not an exception. In
our opinion, SESHVT, specifying general
parameters and requirements to train a special-
ist-teacher, can be considered as a methodologi-
cal foundation for functioning and developing
the respective educational system. That is why,
taking a teacher of technology and entrepreneur-
ship training as an example, we have been gov-
erned by the absolute importance, necessity,
and expedience to draw up a federal regulatory
document in view of the:
1. Insistent need to preserve education
uniformity and, consequently, to ensure
similarity of educational programs
applied by Russia’s pedagogical universi-
ties concerning their aims, objectives,
requirements, and results of training a
specialist-teacher.
2. Strategic significance to legislatively
support academic freedom of universi-
ties, related to their self-independence in
forming the whole package of documents
to determine the respective educational
program.
It is worth pointing out that practical imple-
mentation of the first requirement should in no
way imply the absolute uniformity of university
educational programs identical training of teach-
ers based on previous years’ common curricula.
Equally, meeting the second requirement will
not justify unlimited educational freedom of the
90s. In other words, we regard the state standard
as some sort of controller to maintain the
required data balance, theoretically exclusive
concepts, which dialectical uniformity makes
it possible to establish a functioning system of
democratic education.
We believe, and have used this as conceptu-
al footing to develop the standard, that in the
foreseeable future Russia’s higher pedagogical
education should be primarily oriented toward
university education of a degree-holder special-
ist. This assumption has not been inspired by
conservatism, the fashion of today; it has actual-
ly resulted from tough-minded and thorough
analysis of Russia’s education system. To a cer-
tain extent, such a classical introduction of the
issue might seem too evident, so we would like
to pinpoint that not only does it correspond to
the traditional system of education in Russia
and meet requirements of the general school,
but it also forms a natural basis to modernize
the entire system.
Moreover, the above-stated assumption
implies our answer to the question concerning
the least required educational level for a teacher
to effect technological education in the school.
The law of the Russian Federation on Higher
Vocational Education stipulates three stages of
education each of which should be sufficient
to confer a certain degree or qualification to a
university graduate. What we are driving at is a
bachelor’s degree (qualification), degree-holder
specialist qualification, and a master’s degree
(qualification).
Unfortunately, the law does not differentiate
between a bachelor’s or master’s qualification
and degree. Nor does it comprehensively speci-
fy whether bachelors and masters are to be
simul-taneously educated for a degree and qual-
ification. These abstrusities complicate the prac-
tical implementation of law-stipulated patterns
of education, where diversity should theoretical-
ly enable a graduate to individually set up his or
her educational trajectory. Not only, and it is its
major advantage, can he or she pass “stages” in
a strictly limited one-way direction, but he or
she as well can get out of, or even alter direction
within, a unit of the educational trajectory.
3

Th
e J
ou
rna
l o
f Te
ch
no
log
y S
tud
ies
As it is, these patterns are far from being
entirely realized in all spheres of professional
activity due to the inequal demands required
of graduates, determined by the peculiarities
of their respective field. Quite often it results
in system contradictions, solved only by gener-
alizing further practical experience. To illustrate
this point, let’s analyze as an example the place
of a “teacher-bachelor” in general education. In
Russia, a school “discipline teacher” is assigned
to the main subject; traditionally the position is
taken by a specialist-teacher, holding a degree
corresponding to the particular discipline. Other
appointments, requiring lower qualification such
as tutors, assistant-teachers, etc., are simply not
available in Russia’s modern school system.
Qualified bachelors “added” to a specialist-
teacher at Russia's schools will drastically
imbalance the latter. Teachers with different pro-
fessional backgrounds could apply for similar
positions. But, equal professional duties evi-
dently presuppose equal qualification.
Therefore, it seems justified to acknowl-
edge that there is no need for graduate teachers
with a bachelor qualification. Otherwise, mere
admission of a bachelor-teacher to a school
might threaten training of the more “expensive”
specialist-teacher, with similar academic, but
considerably higher, professional level. This
would lead to a trivial reduction in teachers’
educational qualifications and the subsequent
general decline in Russia’s entire educational
system.
The approach mentioned above should not
be considered as an attempt to generally aban-
don training of the bachelor-teacher. If a bache-
lor’s training ends with granting him or her only
a degree, it will not result in the above contra-
diction. In fact, a bachelor’s degree will confirm
the level of academic training, enabling the
graduate to choose ways and forms of his or
her further activity. It will be up to him or her
whether to go on with his or her education, tak-
ing the subsequent stages, or to assume it com-
pleted and switch to any practical activity, i.e.,
entrepreneurship. However, professional peda-
gogical activity will be open, providing that the
stages following the bachelor’s degree are suc-
cessfully mastered. So a bachelor with a degree
and fundamental academic education, in terms
of the profession, is a bit “semi-finished,” fit
for further multitudinous “additional training”
(including taken on his or her own), thus suffi-
ciently widening his or her possible realization
as a pedagogue.
Analyses carried out in respect of “a
degree-holder specialist” and “a bachelor” with
a preferential role of the former in higher peda-
gogical education can be applied to notions of
“a degree holder-specialist” and “a master.”
A master’s stage can be attained by two means:
either by graduating from a bachelor’s educa-
tional program or receiving a specialist’s degree.
A master graduate is educated to work as a
teacher of a specific discipline at school, to
carry out research work in the field of educa-
tion, to teach at higher school within the chosen
direction, etc.
In context of the present article, the key
factor is the possibility for a master to conduct
his or her professional activity at school. So,
irrespective of any type of educational program,
professionally a master should not be educated
in any diminished degree from that of a respec-
tive degree-holder specialist. Nothing less than
practice can provide an answer to the path of
higher pedagogical education in Russia. The
given considerations only justify training a
degree-holder specialist as top priority in uni-
versity education for a future technology
teacher. Moreover, the given choice in no way
limits any democratic chances to develop higher
pedagogical education in the field. Naturally, a
specialist level of training set up by general
school requirements determines the limits used
to educate a bachelor and a master of technolog-
ical education; the difference is that the “upper”
boarder is applied for a bachelor and the
“lower” one for a master.
While developing the standard, we have
faced another equally significant problem, that
is, how to maintain a real level of university
academic freedom when working out respective
educational programs to train a teacher of tech-
nology and entrepreneurship. Currently Russia’s
legislation grants universities freedom to work
out their own educational programs, curricula,
etc. On the other side of the spectrum, the uni-
fied federal area, tendency towards simplicity
4

Th
e J
ou
rna
l of Te
ch
no
log
y Stu
die
s
5
of certifying procedures, need for opportunities
to change universities, etc., have resulted in
availability and a recent increase in unification
tendencies at higher pedagogical school
management.
Formal data implementation, being a quite
positive factor as a whole, specifies the hazard
of shifting back to the traditional, strictly regu-
lated pattern of educating a specialist-teacher;
it questions the availability of the university
(academic) freedom. In this context, the stan-
dard, due to its regulatory essence, might be
considered as a perfect executive instrument.
It seems worth pointing out that the preceding
standards bore an air of strict unification con-
cerning humanitarian, vocational, and pedagogi-
cal disciplines, with the universities free only to
stipulate their curricula sequence with evidently
low variability due to the natural logic of their
subject. In developing the first generation stan-
dards, it was assumed that a thesaurus approach
would constitute a democratic basis for imple-
mentation. Unfortunately, for various reasons
too lengthy to discuss in this article, no signifi-
cant results were obtained in the course.
Presumably, because the standardization of
Russia’s higher pedagogical school has not been
developed enough and there are a number of
mutually contradicting approaches, the problem
cannot yet be unambiguously resolved. So, the
authors are forced to apply largely imperative
approaches. It essentially complicates the situa-
tion, because the nonavailability of the objective
basis for a standard’s development enables the
authors to impose their subjective views. It be-
comes possible to introduce in the standard cer-
tain units, that match their personal preference,
so disciplines might be adopted without wide
appraisal. Not only is this problem quite famil-
iar for Russia’s higher pedagogical school, but it
can be classified as common for enacting feder-
al regulations. One can find a lot of examples to
the effect in the former practice of working out
and adopting the state standard curricula, as
well as new generation standards. Presently the
situation is worsened by a much too-detailed
obligatory minimum act of standards used to
educate a specialist, as well as by the simplified
order to adopt the standards.
Traditionally, one solution to the given
problem has been to facilitate a certain time
budget. This provides for studying the disci-
plines of the regional component and the disci-
plines chosen by a university; as a whole it
equals to 20% of a student’s total general educa-
tion. In our opinion, the given measure, though
necessary for vocational education variability,
fails to overcome the influence of the negative
factors under discussion. At best we can only
claim a reduction in their impact.
We believe that the necessary thing to max-
imally democratize specialist-teacher’s training
at the university is the discipline’s maximum
integrity, stipulated by the standard obligatory
minimum and by the model federal curricula.
On the one hand, it ensures a common federal
approach towards curricula; on the other hand,
universities are granted the opportunity to
develop their own structure of the respective
educational courses.
The offered approach has been used to
develop the structural pattern to train teachers
of technology and entrepreneurship in respect to
their subject. In general, the principal structure
used in the former standard has been preserved,
stipulating a student’s training on cycles of gen-
eral technical, technological, entrepreneurship,
creative, design, and other disciplines. This
approach corresponds to Russia’s experience
in educating teachers of technology and is con-
tinuously justified by pedagogical practice.
Ambiguity of specific subject training for
teachers of technology and entrepreneurship
is largely determined by introducing federally
mandated courses, namely, Applied Mechanics,
Engineering Science, Info-Technology, Electro-
Radio Engineering, Graphics, Fundamental
Entrepreneurship, Fundamental Designing
Disciplines, and Technological Practical
Training. Amounting to 59% of a subject’s train-
ing to become a teacher, the disciplines prede-
termine uniformity of the respective curricula.
Simultaneously, they do not violate academic
freedom of teaching because their interactivity
ensures a wide range of their individual fulfill-
ment within a certain university.
Finally, the last, but not the least essential,
issue reflected in the standard is the necessity

Th
e J
ou
rna
l o
f Te
ch
no
log
y S
tud
ies
up to 900 hours (amounting to 21% of the sub-
ject’s training time, though even this may seem
insufficient). Should it happen, we think it is
worthwhile to refer to the standard in part,
allowing for the use of time stipulated for the
regional component as well as the so-called
chosen disciplines (amounting to 20% of the
subject’s training) required to enlarge specializa-
tion disciplines.
By developing the new standard the authors
didn’t manage to realize all the ideas stated in
some of their latest articles and submissions in
Russian professional press (Karatchev &
Kaplin, 2000; Karatchev & Lavrov, 2000;
Karatchev & Yakobson, 2001; Lavrov, 1999,
2000). The main cause of it was the necessity
of providing quite a high level of the uniformity
of the standards for various pedagogical special-
ties. Notwithstanding this, we still hope that a
new educational standard on the technology and
entrepreneurship specialty shall make it possible
to enhance training of specialists in Russia’s
pedagogical universities.
Dr. Alexander Anatolievich Karatchev is a senior lecturer in the Technology andEntrepreneurship Department at the MoscowPedagogical State University.
Dr. Nikolay Nikolaevich Lavrov is a senior lecturer in the Technology andEntrepreneurship Department at the Moscow Pedagogical State University.
6
of considering the peculiarities of Russian tech-
nological education. We mean separate training
in engineering, housekeeping, farm-industry
production, etc. Each direction can be pursued
in variants depending on regional conditions
and requirements, state of the teaching and
material resources of educational institutions,
wishes of the school children and their parents,
etc. The mentioned multi-discipline (and multi-
aspect) essence of technological training is
complicated, over and over again, by the need
to follow the federal requirement of uniformity
towards acquiring minimum general technologi-
cal knowledge and skills by the school children.
These peculiarities of technology have been
envisaged in the standard by structural organiza-
tion of the Subject’s Training Disciplines unit,
where the so-called “Disciplines of Specializa-
tion” are introduced. The required invariant con-
stituent concerning the professional aptitude of
the future teacher of technology and entrepre-
neurship is ensured by the above federal integra-
tive disciplines, being basic to further education.
The Disciplines of Specialization, multi-variant
by their essence, lay down the guidelines for the
in-depth professional specialization of a teacher
to be, that is, a person capable of fulfilling this or
that variant of technology.
As compared to the first generation stan-
dard, the new standard somewhat increases the
time allocated for disciplines of specialization
References
Karatchev, A. A., & Kaplin, R. E. (2000). Problems of schoolchildren technological training in Russia. Problems and Prospects of Pedagogical Education in XXI Century: Research and Practical Conference Materials. Moscow: Promethean.
Karatchev, A. A., & Lavrov, N. N. (2000, March). Developing the state educational standard for higher vocational training on “Technology and Entrepreneurship” specialty. To EnhanceTraining of the Teachers of Technology on the XXI Century Eve: Materials of Moscow Municipal Research and Practical Conference. Moscow: Promethean.
Karatchev, A. A., & Yakobson, I. G. (2001). Problems of professions combining in educating teachers at pedagogical universities. Technology and Entrepreneurship. Izhevsk, Russa:
“Udmurt University” Publishing House.
Lavrov, N. N. (1999). The role of fundamental principal in forming the pattern to educate a teacher of technology and entrepreneurship. Problems of Forming Technological Culture, Social and Working Adaptation of Schoolchildren: Theses of the V International Conference
“Technology – 1999,” Moscow.

Th
e J
ou
rna
l of Te
ch
no
log
y Stu
die
s
7
The Law and Technologists: Implications for the Technology CurriculumJoan Forret
the expertise and credibility of expert witnesses,
and those expectations need to be met to ensure
that appropriate consideration is given to their
evidence. Technologists give crucial engineer-
ing, biochemical, and environmental opinion
testimony that can have implications for the
suitability of projects involving vast capital
investment and the potential for serious environ-
mental, social, and economic effects. Tech-
nologists also give evidence in criminal pro-
ceedings, and the credibility of that testimony
will often be the difference between a guilty or
not guilty verdict. Regardless of the type of
legal system or social structure within a com-
munity, legal decision making will involve
inquiry and an increasing reliance on expert
opinion. Thus, it is crucial that in any program
of technology education, lay perceptions and
misconceptions are anticipated and accommo-
dated so that technologists are taught how to
effectively communicate their work and the
importance of that communication as an aspect
of the integration of technology into society
(Jones, 1997).
Research with the New ZealandEnvironment Court
In New Zealand the environment court
hears all appeals from decisions made by local
authorities under the provisions of the Resource
Management Act 1991 (RMA). This act
Lavrov, N. N. (2000). Specialization or a specialty? School and Industry, 5, 21-22. State Educational Standard for Higher Vocational Training. (2000). “030600 – Technology and entrepreneurship” specialty. Moscow: RF MO.
A general theme of technology education
posits that participation in technology studies
will result in outcomes and (hopefully) benefits
for the wider society. Such an expectation is
reflected in the New Zealand Technology
Curriculum document where the aim of technol-
ogy education includes enabling students “to
achieve technological literacy through the devel-
opment of: understanding and awareness of the
relationship between technology and society.”
Although technology studies has developed as
a distinct curriculum area in many countries, it
is important to recognize that technology is not
recognized as such by many of those in deci-
sion-making roles within our various societies.
While educators have attempted to identify tech-
nology as a separate endeavor and knowledge
system from science (Layton, 1993), that dis-
tinction is not necessarily perceived by those
who may be very influential in making deci-
sions that have important legal, economic, and
social consequences. Research into the views
of legal decision makers concerning science
and scientific evidence has revealed a very wide
spectrum of understanding and expectations
of expert witnesses. Judges not only interpret
expert technical opinion evidence differently
from those within the expert community, they
also interpret that evidence differently from
each other. In addition, judges and other lay
decision makers have various expectations of

Th
e J
ou
rna
l o
f Te
ch
no
log
y S
tud
ies
provides that all local authorities must have
planning documents that cover the management
of natural resources. Any activity that is not
expressly permitted by such a planning docu-
ment must be authorized by a resource consent.
Thus, the court hears a lot of appeals arising
from the proposed contents of local authority
planning documents and also from those
aggrieved at the grant or refusal to grant a
resource consent. The subject of appeals varies
greatly and can range from relatively minor land
use matters, such as approvals for a residential
subdivision, to consideration of applications for
marine farming or multimillion dollar mining
developments that may involve serious environ-
mental and engineering considerations. A failure
by an expert witness to effectively communicate
his or her opinion on any of the matters signifi-
cant to a particular proposal may result in the
failure of the project at a vast cost to the appli-
cant or, conversely, the failure to prevent a proj-
ect at a vast cost to the environment itself and
also to the wider community.1 (See also Ayd &
Troeger, 1999.)
For most hearings that involve the presenta-
tion of scientific or technical evidence, the court
sits as a panel of three members, comprising an
environment judge and two environment com-
missioners. The judge is legally qualified;
however, the environment commissioners
come from a range of backgrounds. The RMA
requires that the court has a mix of knowledge
and experience including commercial, local
government and community affairs, resource
management, environmental science and engi-
neering, surveying and mining, and cultural
issues relevant to Maori being the indigenous
people of New Zealand.
In order to canvass the views of the court
regarding the role of science and scientific wit-
nesses, I interviewed all eight judges and 13 of
the 17 commissioners.2
Classification of Expert EvidenceTechnical Expertise
Interview results show that the court could
be divided into three unequal groups concerning
their understanding of the nature of science. The
largest group described science and scientific
evidence to include the traditional physical sci-
ences and technology in a wide range of forms,
under a general umbrella of technical expert
evidence. This group attributed all types of tech-
nical evidence to a general category of scientific
evidence, including medicine and all aspects of
engineering evidence. Many in this group,
which comprised four judges and five commis-
sioners, perceived the uniting concept of science
to be the empirical basis of data.
Another theme within this technical expert-
ise group was the notion of a methodological
basis for the evidence. For example, when one
judge who included engineering and medicine
under the umbrella of science was asked about
his categorization of sociological evidence, he
answered affirmatively because “they are giving
opinions based on analyses…conducted in, well
what I would hope, would be…using the scien-
tific method.”
His understanding of scientific method was
further described as “the principle of, and gain-
ing systematic formulation of knowledge and in
a way that can be tested, tested by replication,
I think.”
Another member of this group (a commis-
sioner) described the features of pure science as
“incontrovertible proof and by incontrovertible,
the only proof that’s incontrovertible is proof
that can be repeated and repeated and repeated
and you come up with the same answer.
Reproducibility of result. That’s pure science.”
This interviewee had previously indicated that
precise technical evidence could be categorized
as scientific; however, she described the social
sciences as “garbage” due to their “inexactness.”
8
1 The approval of an application by the government to build a high dam at Clyde, which resulted in the flooding of a fertile valley in intensive horticultural production in the South Island in the 1980s, is such an example. Theproposal was vigorously opposed at the time and has since been identified as contributing a significant cost to thecountry as the result of continued engineering expenses and debt burdens, and the extra hydro electricity pro-duced is not ever expected to balance those costs. 2 In order to maintain confidentiality, I have coded all of the interviewees as judge or commissioner only and myresearch findings refer to all of the judges as “he” and to all of the commissioners as “she.”

Th
e J
ou
rna
l of Te
ch
no
log
y Stu
die
s
9
The third major theme uniting the technical
expertise group concerned the nature of wit-
nesses’ qualifications. This view is well illus-
trated by the following comments from a
commissioner in response to a question asking
what makes evidence scientific: “[A] person
with discipline…with academic skills and train-
ing, qualifications…of a scientific background.
…they have got to have a scientific training,
academically, and…practiced in that field.”
Many of this group preferred to discuss evi-
dence as either expert or not and treated all
forms of technical evidence under the same
umbrella as science.
Hard Science vs. Applied Science
The second group of six commissioners
and two judges had a view that technology and
technical evidence was different from what they
described as “pure” or “hard” science. Most
of this group had a view of “applied” versus
“pure” science, although they often saw that
categories, particularly within engineering,
could be rather blurred depending on the evi-
dence being presented. The following comments
from a commissioner most clearly illustrate the
approach of this group:
I suppose you really have to distinguish
between science and applied science and
medicine would have to be applied science,
I would say, except for those at the van-
guard of research. The same thing, engi-
neers are applying science that somebody
else has discovered for the main part.
All Evidence Is Scientific
The third group, comprising two judges
and two commissioners, held the view that any
expert evidence, and in fact any admissible evi-
dence, was necessarily scientific. These inter-
viewees answered with reference to expert,
rather than scientific, evidence.
The “all evidence is scientific” group can
be best illustrated by the following comments
from a judge when asked if he perceived a dif-
ference between evidence and scientific evi-
dence: “I don’t quite. It’s all evidence, but I
think probably what you’re getting at is whether
it might be relevant in a certain situation.” When
the same interviewee was then asked what
makes expert evidence scientific, he continued:
“It never addressed my mind, it would never
occur to me. If what he is telling me is relevant
to the case we’ve got before us. To me it’s just
evidence.”
For this group the essential characteristic
of the evidence presented to them, whether from
a scientist, a technologist, or anyone else for
that matter, was the expert nature of that evi-
dence. This idea of expert evidence is important
for technology educators. For the effective
implementation of any technological develop-
ment, the technologist must be able to commu-
nicate the essence of that development and
persuade the relevant decision maker to invest
in or approve of it. In a legal framework, that
may mean that technologists will be required
to proffer expert opinion evidence so that the
decision maker or court can make an informed
decision. Whether those outside technology edu-
cation perceive technology or technologists to
have a commonality of purpose or method that
is different to science is not at issue. Clearly,
there are a range of views and many of those
prominent in decision making in our societies
will have very different views from each other
as well as from technology and science educa-
tors. However, within the courtroom framework
there are some consistent themes that educators
should address to ensure that technology stu-
dents are appropriately prepared for possible
future roles as experts.
Characteristics of a “Good” ExpertWitnessIndependent Evidence
When asked what were the characteristics
of good expert witnesses there were some com-
mon themes identified by all interviewees as
being essential. The most common, which was
mentioned by all interviewees, was the require-
ment that experts, whether classified by the
interviewee as a scientific expert or not, should
be independent of the parties, but should proffer
their opinion to the court objectively and with-
out appearing to advocate for the instructing
party in any way. Many interviewees noted that
the duty of the expert is to inform the court
using their own expert opinion, and the appear-
ance of bias or advocacy was the most common-
ly described indicator of a “poor” witness.

Th
e J
ou
rna
l o
f Te
ch
no
log
y S
tud
ies
10
The appearance of any advocacy or bias on the
part of an expert witness could result in his or
her evidence carrying considerably less weight,
or being completely ignored.
Some interviewees also noted that while
the lack of objectivity would damage an expert’s
credibility, the ability to concede a point would
enhance that credibility. One judge described
the characteristics of a good expert as follows:
“A person who is prepared to concede a point.
That’s number one. You can pretty well pick…
the expert who is going to dig his heels in
and no way is he going to shift and that guy
is useless….”
This reference to concession of a point was
repeated by several interviewees as an indicator
of an objective witness—possibly because to do
so is almost antithetical to advocacy. However,
and more seriously, if the worth of an expert’s
testimony is judged by how objective, in a non-
partisan sense, the expert is, then experts should
be taught how to communicate their evidence
accordingly.
Presentation
Another common theme among descrip-
tions of good expert witnesses was the depth
of understanding experts had for a particular
situation and their ability to effectively commu-
nicate their evidence. In some situations effec-
tive communication may mean an interesting
oral presentation. One commissioner commented:
…we do have some expert witnesses
who…and it is not about their evidence…
but they are boring and their voice is hard
to listen to. …the best ones are the ones
that have a passion and they really believe
in what they are on about and that is what
they are presenting…and they are clear.
It was also important for the interviewees
that experts were able to give their evidence
in nonjargon language so as to “educate and
inform the court.” In some cases the intervie-
wees preferred experts to use everyday analo-
gies as part of their explanations and to use
clear and simple diagrams and charts. This abil-
ity to clearly explain their evidence was also
seen as an indicator of the expert’s own knowl-
edge and understanding.
Personally, if a technical person or a scien-
tist can’t explain anything in terms that the
person you are speaking to can understand,
then I doubt whether they can understand it
themselves, in that, they are just parroting
terms that they acquired in their studies.
Whereas if they really understand it they
can explain, at least to an adequate extent.
[Commissioner]
This ability to explain issues in language
accessible to the lay members of the court does
have its limitations, however. One interviewee
commented that an expert should not appear
to “talk down” to the members of the court or
to give the impression that his or her evidence
was necessarily superior to that of other experts.
Likewise, the clarity and conciseness of evi-
dence was seen by some members of the court
to be relative to the type of expert. Those
experts perceived to be scientific might have
to give longer and more detailed evidence.
Qualifications
When asked how the court measures the
expertise of an expert witness, the most com-
mon response related to the expert’s qualifica-
tions and also his or her list of previous
publications. The importance of qualifications
to some members of the court is particularly
evident in the following comment from a com-
missioner who was describing the process for
deciding between several different experts
giving evidence on the same subject matter:
…we find out their commonality of agree-
ment and where they disagree, highlight
that…then you will line up the qualifica-
tions of the respective experts and that is
what we go with. So if one has got an extra
degree from Oxford, or something else
from Cambridge, or whatever.
A judge also emphasized the importance of
publications for the assessment of the credibility
of scientific witnesses: “…a scientist has pub-
lished papers. …the fact that they’ve published
papers in their curriculum vitae…is an impor-
tant part of their evidence, because they have
to qualify themselves as experts.”

Th
e J
ou
rna
l of Te
ch
no
log
y Stu
die
s
Given the scope of evidence perceived to
be scientific, this latter requirement may be
significant for many technical experts because
they may not routinely produce articles for pub-
lication as part of their professional practice.
Such witnesses would have to establish their
expertise in other ways, such as giving details
of their duration of professional practice or of
experience with similar matters to the proceed-
ings before the court.
Expectations Regarding MethodologyWhen asked how expert witnesses obtained
the substance of their evidence, there was no
apparent pattern to the requirements for good
practice. Some members strongly insisted that
an expert must have personally obtained the
substance of his or her evidence from measure-
ment of data. Several commissioners comment-
ed that they had been personally admonished
in court when in their earlier working lives they
had appeared as expert witnesses and had prof-
fered evidence that was not obtained under their
direct supervision. Other interviewees accepted
that in certain situations an expert may have
sent an assistant to obtain the raw data but must
have performed the analysis him or herself.
This practice was commonly acknowledged
in respect of acoustic engineers who may take
noise measurements at intervals throughout the
day and night. Some members were adamant
that evidence could not be based on analysis
of a literature search because the expert had
no direct knowledge of the subject matter. This
requirement is linked to common law rules con-
cerning the admissibility of expert evidence,
although these rules are not binding on the envi-
ronment court (Freckleton & Selby, 1993). For
other members, however, not only would a thor-
ough analysis of literature be acceptable, but
also an analysis of data proffered by an expert
engaged by the opposing party. This diversity
of expectation is worrying because there is no
obvious way that a given expert could appreci-
ate the requirements of the court regarding the
expert’s methodology. In addition, criticisms
about methodology were not only leveled at
newer experts. Sometimes very experienced
experts were criticized for presenting their
evidence in the same way that they had always
done but with less personal involvement in the
collection of their evidence than another expert
in the same field. In respect of methodology,
it is clearly necessary that the court develops its
own consistent policy, but that policy should be
informed by the members of the various profes-
sional groups that represent scientific and tech-
nical experts. In turn, technology and science
educators have a role in grounding students in
sound research methods and practices and in
contributing to the continuing education of
those people who are outside the technology or
science communities but who encounter the per-
sonnel and subject matter from those communi-
ties on a regular basis.
Implications for Technology EducationThe preparation and presentation of an expert
opinion is an important and common aspect of the
working life of many technologists. It is natural
that decision makers in a range of different arenas
will require expert technical advice concerning a
multitude of different proposals and issues. I sug-
gest that educators should have a role in preparing
students to face a variety of situations in which
their expert opinion will be under scrutiny. This
view was also expressed by several members of
the environment court as follows: “…the new,
young planner straight from graduate school…
isn’t fully given to understand what is his or her
role, and the failure is on the part of graduate
schools.” [Commissioner]
Technology education must emphasize the
importance of effective communication at two
different levels. First, students of technology need
to recognize the importance of communication
during all stages of their development. Effective
communication requires recognition of the expec-
tations of the intended audience (Nelkin, 1996).
For many students of technology that audience
may at times be a court of law. Although the envi-
ronment court has differences in its expectations
of experts, the qualities of independence, clarity,
and depth of understanding were approved by all
interviewees. Those qualities could easily be
incorporated into technology education by
encouraging students to present interactive semi-
nars to explain their work. The notion of inde-
pendent expertise could be developed by having
students present interactive seminars based on
each other’s work. The notion of an interactive
11

Th
e J
ou
rna
l o
f Te
ch
no
log
y S
tud
ies
seminar would promote the need for clarity,
consistency, and depth of understanding, which
were all valued qualities of expert witnesses.
At a second level, there is a role for technology
educators to provide continuing education to those
lay people who regularly assess information provid-
ed to them by experts. These lay people may be
members of a legal forum such as the environment
court or they may be members of local authorities,
governmental organizations, or other decision-mak-
ing bodies. While my research has focused on a rela-
tively small court in New Zealand, it is likely that
these results will be transferable to other courts and
other countries. The environment court hears a lot
of very technical evidence, and its specialist nature
is part of the reason for a combined legal and lay
composition. Thus decision-making bodies that are
constituted without any specialist technical expertise
are likely to be less familiar with the framework and
methods of technology as a curriculum component.
Most of these people will not have had the benefit of
any technology education and their views will reflect
their own personal educational and practical experi-
ences. It is likely that they will use language in dif-
ferent ways to each other and may view the role and
experience of the experts who proffer advice quite
differently from each other and from the experts.
Thus, there is a role for technology educators to
work with decision makers to develop appropriate
criteria for assessing expert opinion evidence and to
communicate the goals and methods of technology
studies as distinct from science and other education-
al frameworks that may be familiar to those decision
makers.
Modern legal decision makers regularly hear
a large amount of expert evidence from a wide
range of disciplines and in relation to a wide range
of issues, including environmental, criminal, and
commercial matters. Many of those experts proffer
technical evidence that concerns aspects of design,
manufacture, and use of technological develop-
ments. It will be a serious flaw in technology educa-
tion if that evidence is not successfully communicat-
ed in the legal environment because of a mismatch
between the expectations of decision makers with
those of expert witnesses.
Ms. Joan Forret is an associate with legal
firm Harkness Henry and Co., based in Hamilton,
New Zealand.
12
References
Ayd, P., & Troeger, M. (1999). Presenting sophisticated scientific evidence persuasively: The role of the scientific expert and the attorney at trial. In C. Meyer, Expert witnessing(pp. 134-152). London: CRC Press.
Freckelton, I., & Selby, H. (1993). Expert evidence. Sydney, Australia: Law Book Company.
Jones, A. (1997). Technology education in the New Zealand curriculum. In J. Burns (Ed.),Technology in the New Zealand curriculum: Perspectives on practice (pp. 46-59). Palmerston North, New Zealand: Dunmore Press.
Layton, D. (1993). Technology’s challenge to science education. Buckingham, England: Open University Press.
Nelkin, D. (1996). Law as communication. Aldershot, England: Dartmouth.

Th
e J
ou
rna
l of Te
ch
no
log
y Stu
die
s
13
IntroductionToday’s competitive marketplace requires
many colleges and universities to search forways to maintain or increase their programenrollment numbers. One method is to focus on an enrollment management program with anemphasis placed on retention efforts for existingstudents. Although this is one important issuefacing many colleges and universities, it is notthe only method for maintaining or enhancingenrollment figures. The need is to focus on bothretention efforts as well as the recruitment ofprospective students to provide the foundationto build enrollment numbers.
Competition in starting salaries of gradu-ates from business and /or engineering programscan make it challenging to recruit students intoindustrial technology programs. Further, it ispredicted that as technology continues changingat a rapid pace the new jobs created will requireadditional education (Brandon, 1997). Coupledwith this are projections of a shrinking laborsupply and increased competition among educa-tors for their respective programs. The interestin the field of industrial technology is evident,but it is imperative to make students aware ofboth industrial technology programs and careeropportunities. Educators need to be proactive inrecruiting students to meet society’s increasingemployment needs and for maintaining orstrengthening their enrollment numbers andeven more so ensure the quality of the students.
In order to meet the challenging demandsof student recruitment, industrial technologyeducators must leverage their recruitment strate-gies that specifically highlight industrial tech-nology disciplines. The general focus of thisarticle is to share a broad overview of severalrecruitment strategies that have proven effectiveat a regional university located in the Midwest.
Departmental Enrollment Enrollment in the Department of Industrial
Technology at the University of Northern Iowahas increased at a steady rate over a five-yearperiod. With a growth of 62.7% in five years,the department has gone from 295 majors in1996 to 480 majors in 2001 (see Figure 1).With 97% of the 13,533 students enrolled in the university coming from Iowa high schoolsand community colleges, the enrollmentincrease is due in part to recruiting efforts from these educational institutions. A strategicrecruitment plan was designed to generate stu-dents and gradually increase enrollment over afive-year period. The strategic plan was success-ful, and the increase in enrollment resulted fromfour different reasons: (a) an increasing numberof incoming freshmen to the university, (b)transfer students from two-year programs, (c) an on-going recruitment effort by a full-timerecruitment coordinator, and (d) the efforts offaculty, staff, and current students.
Recruitment Strategies for Industrial Technology ProgramsRon O’Meara and Mindy Carmichael
Figure 1. Enrollment increases in Department of IndustrialTechnology at University of Northern Iowa.

Th
e J
ou
rna
l o
f Te
ch
no
log
y S
tud
ies
According to Zargari, Devier, and Schumm
(1999), comprehensive transfer agreements
between community colleges and universities
need to be established to increase student enroll-
ment. Administrators at two- and four-year insti-
tutions seeking articulation agreements can
benefit through improved student retention rates
and cost savings (McDuffie & Stevenson, 1995;
Wattenbarger & Witt, 1995). One of the most
important reasons for developing articulation
agreements is to improve access by giving stu-
dents more options and smoothed pathways to
achieving degree completion (Bryant, 2001).
The Department of Industrial Technology real-
izes the benefits of this partnership, and articu-
lation agreements have been and will continue
to be a vital asset to the enrollment increase in
the department. In 1998 the Department of
Industrial Technology created and approved 60
articulation agreements with Iowa community
colleges. Three years later the department had
a total of 317 different articulation agreements
with all 15 of Iowa’s community colleges. The
university has a different agreement with almost
every associate of applied science degree at the
various community colleges in the state. In
1999, the university had a total of 1,114 transfer
students with nearly 70% coming from Iowa
two-year colleges (Carlson & Wyatt, 1999).
Of the 1,114 transfer students, the Department
of Industrial Technology had 58 students trans-
fer into its programs in 1999-2000. Further,
during the academic year 2001-2002, the num-
ber of transfer students increased to 76, and by
the academic year 2003-2004, the transfer stu-
dents increased to 114. The university expects
to see additional increases in students transfer-
ring from Iowa community colleges as more
departments generate articulation agreements
for their programs.
Enrollment TrendsTo examine the enrollment trends of indus-
trial technology programs within the state of
Iowa, data contained in the Industrial Teacher
Education Directories (Bell, 1997, 1998, 1999)
were analyzed. The three-year period reviewed
for this analysis is reflective of the University
of Northern Iowa’s departmental recruitment
plan that was initiated in 1996. Edmunds (1990)
established that the use of directories is germane
for quantitative analysis of such programs. The
data reviewed are aggregate numbers for the
state during the three respective years of the ini-
tiated marketing study. The aggregate numbers
were compiled to use as a baseline for compar-
ing the enrollment growth at the University of
Northern Iowa to the growth in the industrial
technology program at Iowa State University.
Based on the data reported in the Industrial
Teacher Education Directories from 1996 to
1999, enrollment growth of industrial technolo-
gy programs in Iowa experienced an increase
of 11.6%. In 1997, the total number of degrees
granted from four-year institutions having the
degree discipline of industrial technology or
technology education was 172. The number of
degrees granted in 1998 was 169, and in 1999
the number increased to 192. It is important
to note that these aggregate numbers represent
all degrees granted in the disciplines including
bachelor’s, master’s, and doctoral degrees.
There are limitations when using secondary
data for analyzing trends in enrollment figures.
However, this analysis was performed to estab-
lish a baseline for comparison of growth in
industrial technology programs statewide as
compared to departmental initiatives. It is worth
noting that the growth in industrial technology
programs appears to have occurred across all
emphases within the discipline.
RecruitmentEducational institutions have many strate-
gies for recruiting students, but awareness of the
program seems to be a key factor for industrial
technology. When the department designed its
recruitment plan in 1996, a vast span of recruit-
ment programs was created to either bring stu-
dents to the Department of Industrial Tech-
nology or to take industrial technology program
information to them. After initial attempts in
recruiting, the department focused on bringing
prospective students on campus to highlight the
department and programs. The plan has proven
effective and enrollment has continued to
increase.
One of the department’s largest recruiting
tools is the Industrial Technology Day. For one
day each semester, the department brings in
14

Th
e J
ou
rna
l of Te
ch
no
log
y Stu
die
s
15
about 125 students from Iowa’s high schools
and community colleges to view the department,
receive program information, and gain hands-on
experience. During this half-day event, students
are able to see what industrial technology has
to offer both from an educational and career
opportunities standpoint. The sessions relate
to the nine different emphasis areas to major
in within the department, of which students can
select three to participate in. A breakdown of
student participants from a recent IT Day is
shown in Figure 2. Faculty, staff, and college
students coordinate the sessions and design
them so the IT Day participants can view a vari-
ety of areas within the major. At the end of the
day, questionnaires are given to each student for
an evaluation and comments concerning the IT
Day. The responses have been positive with stu-
dents commenting on the benefits of the hands-
on experience, viewing the labs, and being able
to work directly with faculty, staff, and college
students. They also appreciated working on and
designing a project and having something to
take home with them. This day has been an
effective method in recruiting students by bring-
ing them to campus to consider the department
and learn the benefits of choosing a major area
of emphasis in industrial technology.
Survey of ImpactA multimedia recruitment survey was com-
piled in the spring of 1999 and sent to Iowa’s
420 high schools and 17 community colleges.
Guidance counselors were asked about video,
CD-ROM, and Internet use by students to
acquire college and career information. When
asked about videotape usage, 73% surveyed
stated that their students use videos for this pur-
pose, whereas 68% used CD-ROMs for college
and career information. Internet use is the most
effective tool; 96% of the counselors surveyed
acknowledged this usage for their students
because of easy access and availability.
This survey helped to determine future
recruitment tactics and proved the Department
of Industrial Technology’s hands-on method
of recruiting highly effective in attaining our
recruitment goals. Although schools suggested
that students use the multimedia references,
they still prefer to go to the college or job site
for information. Before our recruitment push
took place, videos were sent to requesting high
schools and community colleges, but feedback
was never received concerning interested stu-
dents. However, when recruiting efforts started
to bring students to campus, responses were
positive and enrollment also increased. The
multimedia survey was done to help determine
if changes needed to be made on the recruitment
strategy after four years or if the plan was still
on track. Although the hands-on method of
recruiting has been valuable, there are additional
tactics utilized to strengthen the department’s
goal.
Scholarships are an important emphasis
in our recruitment plan. The Department of
Industrial Technology gives more than 35 schol-
arships yearly to freshman, sophomore, junior,
and senior students. Many of these scholarships
are full tuition and are used to recruit students
and to reward current students. Other areas of
importance relating to the recruitment goals
are student organizations, high school outreach
programs, the NAIT interactive CD-ROM,
exhibitions at conferences, and advertising
in magazines.
ConclusionThere are many aspects impacting enroll-
ment figures at the start of the 21st century. The
tightening labor supply, new workplace skills,
and increases in starting salaries for shortage
areas influence students’ choice of programs
and the resulting enrollment numbers.
Figure 2. Student breakdown for IT Day, Spring 2000.

Enrollment figures for the state of Iowa
are growing at a nominal rate within the field
of industrial technology. The growth for the
state during the period of this study was 14.2%.
As a comparison, the growth realized at the
University of Northern Iowa for the same period
after implementing a strategic marketing plan
was 62.7%. This increase in enrollment is a pos-
itive indicator of program viability and a strong
commitment to a systematic marketing design.
To maintain existing enrollment figures and
increase future enrollment numbers, educators
will need to cast a wide net utilizing a cross-dis-
cipline marketing strategy. A commitment to
perform continuous recruiting to provide growth
in enrollment figures and fully utilizing the
resources at hand (i.e., faculty, staff, advisory
boards, recent industrial technology graduates)
is a key component of a successful recruitment
strategy.
Dr. Ronald O’Meara is an assistant
professor and program coordinator of the
Manufacturing Technology program in the
Department of Industrial Technology at the
University of Northern Iowa. He is a member
of Pi Chapter of Epsilon Pi Tau.
Ms. Mindy Carmichael is the director
of education for the Associated General
Contractors of Iowa.
Th
e J
ou
rna
l o
f Te
ch
no
log
y S
tud
ies
16
References
Bell, T. P. (Ed.). (1997). 1997-1998 Industrial technology teacher education directory.Millersville, PA: CTTE and NAITTE, Department of Industry and Technology, Millersville University.
Bell, T. P. (Ed.). (1998). 1998-1999 Industrial technology teacher education directory.Millersville, PA: CTTE and NAITTE, Department of Industry and Technology, Millersville University.
Bell, T. P. (Ed.). (1999). 1999-2000 Industrial technology teacher education directory.Millersville, PA: CTTE and NAITTE, Department of Industry and Technology, Millersville University.
Brandon, L. G. (1997). The top skills for tomorrow’s workers. The Futurist, 31, 50-51.
Bryant, A. N. (2001). ERIC review: Community college students: Recent findings and trends. Community College Review, 29, 3.
Carlson, C., & Wyatt, R. (1999, November). A profile of students enrolled at the University of Northern Iowa. Cedar Falls: University of Northern Iowa, Office of Information Management & Analysis.
Edmunds, N. A. (1990). Key factors influencing the supply of teachers. School Shop Tech Directories, 49, 32.
McDuffie, L., & Stevenson, J. (1995). The American community college: Providing pivotal points of progress for students. College Student Journal, 29, 264-269.
Wattenbarger, J. L., & Witt, A. A. (1995). Origins of the comprehensive community college. Community College Journal of Research and Practice, 19, 565-570.
Zargari, A., Devier, D., & Schumm, G. (1999). Preparation of industrial technology associate degree programs for the 21st century: Earning accreditation by the National Association of Industrial Technology. In Proceedings of the 32nd Annual NAIT Conference (pp. 22-24). Ann Arbor, MI: National Association of Industrial Technology.
Th
e J
ou
rna
l of Te
ch
no
log
y Stu
die
s
17
The Internet is getting larger every day.Computers, through the Internet, are becoming a significant part of our everyday lives. Moreand more companies and organizations areusing the Net to inform, educate, and entertain.As we travel the Information Highway, a grow-ing number of the phases of our lives—identifi-cation, money, security—are being handledelectronically.
The Digital Divide is alive and well inAmerica. What this means is the technologyhaves and the have-nots are continually growingfurther apart. Due to the pace of change in thefield of computer technology, this divide widensfaster in less time. Playing catch-up becomes anincreasingly more difficult game to endure, withthe government, public, and private sectors try-ing to invent ways to level the playing field.However, according to the U.S. CommerceDepartment’s National Telecommunications and Information Administration’s (NTIA, 1999)paper “Falling Through the Net III: Defining the Digital Divide,” many of those who are leftbehind (Blacks, Hispanics, Native Americans,those with education below the high schoollevel, single parent families, those with incomeless than $25,000 /year) are trying to catch upthemselves by accessing computers in commu-nity centers and libraries. Since parties on oneend of the Digital Divide are using computers to get themselves to the other end, why aren’tmore online?
The purpose of this study is to look atracial overtones to Internet access. It is assumedthat it is important to have both computer andInternet access to compete in both school andwork. By looking at how the Web is being used,ways can be suggested to make computer access
easier and more convenient for AfricanAmericans, thereby increasing their interest in computer technology and information.
What follows is a discussion on content andthe Internet. While cost is the dominant reasonfor discontinuance of online service, lack ofinterest (“don't want it”) is the number one rea-son for not having Internet access at home(NTIA, 1999). If individuals can’t perceive theimportance of an object or how it could affecttheir lives, they will not go out of their way totry to learn to use it, or excel at its application.
History of the InternetTechnology can indeed act as prostheticextension of human powers and communi-ties. (Brook & Boal, 1995, p. vii)
Welcome to the Information Age. TheInformation Age began when people turnedtheir minds from using machines to manufacturegoods to using machines to process information.Productivity in the Information Age is not dueto more workers or longer assembly lines but to informed teams and smarter modes of work(Carnoy, Castells, Cohen, & Cardoso, 1993).
Because the Information Age is relativelynew and has spawned a tremendous rise in, particularly, scientific information, I suggestthat the Information Age began in 1968 with the formation of the ARPANET (AdvancedResearch Projects Agency - net), the Internet’spredecessor (Zakon, 1993-1999), developed bythe U.S. Department of Defense. The develop-ment of the ARPANET necessitated the creationof packet switching technology and the differentbut compatible platforms from which it wouldneed to run consistently and reliably, importantconcepts on which today’s Internet is based.
Is the Serpent Eating Its Tail?The Digital Divide and African AmericansJacqueline Horton

Th
e J
ou
rna
l o
f Te
ch
no
log
y S
tud
ies
18
ARPANET and e-mail were first demon-strated publicly in 1972 (Zakon, 1993-1999).The Domain Name System (i.e., SFSU.edu) was introduced in 1984 (Zakon, 1993-1999). In1991, the World Wide Web was introduced, andthe NSFNET backbone was upgraded to T3(44.736 mbps) and passed 10 billion packets permonth (Zakon, 1993-1999). Ten billion packetsat 44.736 mbps is a lot of information movingvery fast.
A Brief History of the Effects of Technology
In any case, for millions across the globe,there is no private phone, fax, or TV, letalone a computer or an automobile. Andthere never will be. This is not a question of progress or modernity delayed. (Brook & Boal, 1995, p. 11)
Obviously everyone is not keeping up withthis increased flow of information. In 1994 theNTIA reported that while 27.1% of Whites hadcomputers in their homes, only 10.3% of Blacksand 12.3% of Hispanics owned computers(NTIA, 1999). In 1998, four years later, thenumber of households with computers doubledfor everyone; but in comparison with Whites,Blacks and Hispanics were even less likely tohave household access to computers (46.6%,23.2%, and 25.2%, respectively; NTIA, 1999).In fact, “Whites have more access to computersin the home than Blacks or Hispanics do fromany location” (NTIA, 1999, p. xv). In 2000,36% of Blacks had access to the Internet, incomparison to 50% of Whites who had access.While the difference between the two groups isgetting smaller, it does not appear as if everyonewill arrive in this Information Age at the sametime (Spooner & Rainie, 2000).
Is this Digital Divide an anomaly, an unlike-ly case of an egalitarian product that exacerbatesclass struggles? Or is the Internet simply theproduct that affects us today, a system whoseconsequences are even more dramatic due to this21st century globalization that we are experienc-ing? Several writers have noted that AfricanAmericans have routinely gotten the short end ofthe technology stick with computers and that theInternet is at the end of a long line of “firewalls”built to keep Blacks out.
One of the first major technological inven-tions to adversely affect African Americans wasEli Whitney's cotton gin. Whitney's gin allowedcotton to become an easy and cheap commodity.
Because more slaves were needed to aid in thisnew growing industry (Walton, 1999), there wasa huge jump in the slave trade. The year 1865saw the end of the Civil War and the beginningof the Reconstruction. African Americans werefree technically, but being penniless and landlessin an agrarian society, could not be economicallyor even physically emancipated. Most Blackswere uneducated after experiencing 200 years of slavery. What was the use of freedom withouteducation? Not much. It would be akin to beinggiven a boat with no oars. Blacks needed otheravenues for growth. Slowly but surely they madegains in areas other than farming, where theyhad previously had the most experience.
After the Civil War, Blacks began the migra-tion to the North. The Industrial Revolutionspurred the need for many more industrial work-ers, and Blacks were allowed to fill the void—some in semi-skilled jobs but most in unskilled,domestic, and janitorial jobs in both the Northand the South (Marshall, 1967). Automation inthe late 19th century to early 20th centuryincreased mechanization, which allowed moreBlacks to be employed in jobs that previouslyrequired training and experience (Harris, 1982).Technology at this point helped Blacks in theworkforce. The migration of Blacks to the Northhelped make up for the staunched immigrantlabor pool during World War I.
The National Recovery Act of 1933 was an attack on urban poverty. This act shortenedthe workweek and instituted minimum wages for occupations. But instead of offering Blacksand Whites the same wage for the same work,employers classified the jobs differently, whichallowed professions that were heavily worked by Blacks to be classified at a lower level or to be exempt from classification altogether(Marshall, 1967).
By the early 1940s African Americans,despite setbacks and opposition, had doubledtheir numbers as skilled craftsmen (Harris,1982). The increase in the diversification of jobs continued at this time leading to a generalincrease in the number of African Americansemployed. Unfortunately, 80% of the Black maleworking population still worked in jobs consid-ered unskilled (Harris, 1982).
World War II saw further increases in theNorthern migration and employment of Blacks.The number of Blacks employed in semi-skilledjobs grew, mainly because of the monies pumped

Th
e J
ou
rna
l of Te
ch
no
log
y Stu
die
s
19
into the war effort and the drafting of Whiteworkers into the armed forces, which depletedthe growing workforce (Marshall, 1967). Evenso, Blacks were not given adequate chances intraining programs and new jobs.
Negroes have faced a more serious unem-ployment problem than white workersthroughout the postwar; the jobless rate forNegro workers has remained about twicethat of white men and women since theearly 1950s. The ratio persists at each levelof educational attainment, with the differen-tial even greater among workers with moreschooling than among those with a minimallevel of education. (Harris, 1982, p. 123)
In the 1960s job opportunities did notimprove much for the Black male. Black gainsin the 1950s were in semi-skilled jobs. How-ever, when automation replaced semi-skilledworkers in the 1960s, their employmentdeclined to the level achieved in 1948 (Harris,1982). Mechanical cotton pickers were usedincreasingly, which caused further unemploy-ment among Blacks still living on Southernfarms (Harris, 1982). Blacks were able to makegains in securing professional employment withthe federal government, however. Even so, in1961 72% of the lower ranked jobs (grades GS1-4) were held by Blacks, while 35% of allemployees were employed in those levels.
Technology increased in the 1970s and1980s, and the economy shifted from manufac-turing to low-paying and service-oriented jobs(Harris, 1982). The accompanying decline in the numbers of low-skilled manufacturing jobsdid not help the standard of living for Blacks.“The socioeconomic status of Blacks was asdepressed in 1980 as it had been in 1969”(Harris, 1982, p. 179).
And now in the 21st century, we have com-puters and the Information Age. How preparedand how well positioned is the average AfricanAmerican to move on the Information Highway?
The Digital DivideMore than 100 million people around theworld, most of whom had never heard ofthe Internet four years ago, now use it to do research, send e-mail to friends, makerequests for bids to suppliers, and shop for cars and books. (U.S. Department ofCommerce, 1998, p. 4)
While the Internet is thought to be anequalizer, it has never been thought of as a level playing field. Black entrepreneurs makethe play, gaining footholds (Muhammad, 1999).Most of the Black Internet /computer users arebetween 24 and 48 years old and make morethan $40,000 (Hoffman & Novak, 1999).Though the numbers appear more egalitarian for Whites, they are still linked strongly tohousehold income and education. The higher theincome and education, the greater is the chancethat a person will own or use a computer.
In the United States, the person who doesn’town a computer is more likely to be a person ofcolor with little income and education. He orshe will more than likely be either single or asingle parent and live in the inner city or a ruralarea. If there were no Digital Divide, so accu-rate a picture of the have-not world could not bepainted. But study after study shows the aboveto be the case.
You can’t have the Digital Divide with-out the Digital, but is the Internet at fault?Remember that the Internet was not made foreveryone to use but developed by the Depart-ment of Defense. Perhaps it has problems scal-ing up for general use. While technology can be seen as morally neutral, it cannot be assumedthat the uses to which it is put are equally san-guine.
These uses seem to be either of no use or of no interest to most people. This creates aninformation disconnect, an information divide.This information divide is what is fueling theDigital Divide.
But the flight into cyberspace is motivatedby some of the same fears and longings as the flight to the suburbs: it is another“white flight.” (Brook & Boal, 1995, p. ix)
If the Internet is truly blind (“No oneknows if you are a dog on the Internet” [Steiner,1993, p. 61]), why isn’t everyone on it equally?There are so many variables (education, income,age) to the information have-nots when youlook at African Americans that it is hard to get a clear picture of what is happening and why,and what to then do about it. Let’s look at theeducation variable for example. While this arti-cle does not focus on the effect of education onthe Digital Divide, it should be noted that it mir-rors the Educational Divide as it pertains to

Th
e J
ou
rna
l o
f Te
ch
no
log
y S
tud
ies
Blacks who are, once again, on the wrong sideof the line. It is no secret that Blacks and otherminorities do not receive the best educations,particularly if they attend an urban school (Rist,2000; Temple, 1998). It is the same forces atwork in the Digital Divide as in the EducationalDivide. Large class sizes and crumbling institu-tions, which characterize the urban publicschool to which many minority and poor stu-dents are sent, are but the physical harbingers of the differential yet lasting treatment affordedto people of color (Temple, 1998). All of thesefactors work together. How else do you explainthe inability of Black high school dropouts to beemployed at the same rate as White high schooldropouts (Marshall, 1967)? There are manyfacets to the Black economy, and education isone of them; so is knowledge and manipulationof things digital. The idea here is to focus theissue of the Digital Divide on race in hopes thatit will focus attention on all race-related itemssuch as education and income and that the digi-tal tide will aid in floating all such boats forAfrican Americans.
Focusing on employment, do AfricanAmericans have jobs that do not require a com-puter and so are never exposed to one? Do theynot go grocery shopping or use an ATM or go to the library? The sad fact is that if you areBlack, you are more likely to live in an innercity, drop out of school, and earn a low income(Bolt & Crawford, 2000; Harris, 1982). So is the Digital Divide racial or is it education /income based? These items are so closely inter-twined for African Americans that you cannotsay either way. What we can do is take a look at what African Americans do when they areonline. Perhaps this will shed some light as to why they are not online in greater numbers.
African Americans use the Net for onlineclasses and job hunting (Hoffman & Novak,1999; NTIA, 1999). African Americans shoponline just like everyone else, but they do notsearch for product information as much as others (Hoffman & Novak, 1999).
So now we have a better idea, though notcomplete by any means, of what Blacks doonline. It sounds like they know how to put thecomputer to good use, so why aren’t they onlinemore? Three suggestions: exposure, cost, andcontent.
ExposureIn 1999, Tom Joyner and Tavi Smiley threat-
ened to sue CompUSA to get the retail giant toplace ads with African American-oriented media(Associated Press, 1999; Wickham, 1999).Digital technology is not so abundant in the innercity as elsewhere. Schools are considered wiredwhen they have one computer hooked up to theInternet; schools in wealthier areas have morecomputers hooked up to the Internet per studentthan those in poorer neighborhoods (Bolt &Crawford, 2000; Goslee, 1998).
CostWhile computers are coming down in price,
it is the webTV versions that are readily avail-able for under $500. Otherwise, a quick perusalof newspaper ads shows most computers to bestill at the $1,000 mark (monitor not included).Computers are also a lump sum purchase, whichis a large amount of money to pay all at oncefor an item with questionable usage and value.Then there are the monthly ISP fees to add tothe expense.
ContentWhile there are hundreds of thousands of
Web sites on the Net, there are only a few hun-dred of special interest to African Americans(Bolt & Crawford, 2000; Hoffman & Novak,1999). But do you have to have Black-specificcontent in order to get African Americansonline? Aren’t they cat lovers and stock buyersand music aficionados as well? Perhaps whatAfrican Americans need in order to get on theNet is a “killer app” (a software program thatdrives up sales of computers)—e-mail isn’t itand mp3 isn’t it. What will it take to get AfricanAmericans to see that the digital life is usefulfor them?
Again, the three possible reasons forAfrican American involvement on the wrongside of the Divide are exposure, cost, and con-tent. Content will be further explored next.
Content and City.netDespite the strong demand for labor, manyworkers are failing to realize the benefits of California’s economic boom. (Yelin,2000, p. 1)
There are many ways to bypass the costissue. The U.S. government is doing its part inthe reduction of the cost of computer equipmentand hookups to the Internet. An E-rate
20

Th
e J
ou
rna
l of Te
ch
no
log
y Stu
die
s
(NTIA, 1999) has been implemented thatensures discounted connection rates for schoolsand libraries, thus enabling more public schoolsto get wired. In addition, President Clinton’s“Call to Action for American Education”allowed for all public schools and libraries inthe U.S. to be wired for technology by the year2000 (Novak & Hoffman, 1998). The other halfof Clinton’s “Call to Action” is to connect everyU.S. home by 2007 (Novak & Hoffman, 1998).
Between the E-rate and the “Call toAction,” most of our nation’s children haveaccess to computers. Free PCs given out byInternet service providers and subsidized PCsgiven out by employers presumably take care ofany other cost concerns on the part of nonwiredAfrican Americans everywhere (Thierer, 2000).
What is more, computer prices are drop-ping. Some color TVs cost more than comput-ers, and yet people still buy them (Thierer,2000). Computers and other Internet technologywill get steadily cheaper and cheaper until theissue of cost simply fades away.
Clinton’s “Call to Action” will have everypublic school child exposed to the Internet.They will go home and spread the “tech-virus”to their siblings and other family members theycome in contact with. Also, adults withoutaccess to children are working in places that are getting wired, exposing more adults to thetechnological wonders.
As more people buy computers, computermakers and retailers will have to consider seri-ously the untapped market of the unwired: thelow-income, rural or inner-city dwelling minori-ty. The unwired are ripe for saturated exposurethrough advertising.
What is more, government entities willincreasingly put more information on theInternet. Therefore, people who require up-to-date knowledge of benefits, such as disability or Social Security, will find this informationbeing put online more often in the future (U.S.Internet Council & International Technologyand Trade Associates [USIC & ITTA], 2000).People will be forced to look to the Web forinformation that has a direct impact on theirlives. In time, the exposure for AfricanAmericans will increase, slower than their ability to gain access, but it will increase allthe same.
Content is the final piece of the puzzle.Content is what will make people take their firststeps onto the Internet and will make them stayonline once they try it. Content is what is goingto prepare America for the new “digital work-force” as described by the U.S. Department ofCommerce. Increased interest will come frommore significant content. Enlarged interest willreduce fear and allow Black people to take own-ership of things digital (U.S. Department ofCommerce, 1998).
But what content is needed to lure AfricanAmericans across the Digital Divide? As withany design problem, the best way to find outwhy the customer is not buying the product is to listen to the customer talk about the product.So one must either ask users directly or observethem during use (or nonuse as the case may be).This article does not contain results of inter-views with African Americans nor does itsauthor claim to have looked over the shouldersof African Americans while they used a comput-er or passed a computer store; that would begrist for a whole other article. However, fromwhat has been read and researched about theDigital Divide and African American computeruse, or lack thereof, I have come up with whatmight be an answer to the content question.
Access and exposure are good, but thosetwo conditions do not make one computer liter-ate. In Newsweek magazine, Alter (1999) statedthat, in addition to having access to the Internet,people must use their creativity and initiative toget the most out of the computer. Being superfi-cially introduced to the Internet or insufficientlyexposed to software will not be enough to makeone computer literate. The Digital Divide is notjust about access; it is about what people dowith a computer once they have one.
In Digital Divide: Computers and OurChildren’s Lives (Bolt & Crawford, 2000), B.Keith Fulton, director of Technology Programsand Policy with the National Urban League said,“In the Information Age, it is critically impor-tant to master the three basics: reading, writingand arithmetic…but also to have information lit-eracy: the ability to access, interpret, andrespond to information” (p. 114). Once again,access is important; but in our future and thefuture of the world, we cannot afford to leaveanyone behind. Everyone should becomeacquainted with this information literacy.People should be unafraid to approach
21

Th
e J
ou
rna
l o
f Te
ch
no
log
y S
tud
ies
technology and should have a general idea as to what can be done with it.
New studies suggest much the samething—content is the way to get people online.The Digital Divide Network (2000), quoting therecent Stanford University (2000) study andNational Public Radio (1999) study, stated thatthe Internet technology industry is building net-works for users as consumers but not for peoplewho want to make content themselves. TheChildren’s Partnership’s March 2000 report ononline content suggested that people, in particu-lar those with low incomes, would prefer tohave local information on the Web. Items peoplewould like to see more frequently are employ-ment, educational opportunities, and businessdevelopment prospects. The importance of pro-ducing content was also brought up by theDigital Divide Network (Lazarus & Mora, 2000;Twist, 2000). Even the U.S. Internet Council’s(USIC & ITTA, 2000) “State of the Internet2000” paper discussed the growth of “virtualcommunities” (p. 22). These virtual communi-ties have local information and have grown fromsimple chat rooms to Web portals with news,weather, e-mail, and the like.
So even content is not a simple matter ofjust giving it away. People want information thatis useful to them. If people don’t want to go onthe Internet, it is because the information is notuseful and because it is hard to find and navi-gate. But if people make their own content, then it is as interesting and as easy to navigateas they make it (Goslee, 1998; Lenhart, 2000;National Public Radio, 1999).
My idea to closing the Digital Divide forAfrican Americans is City.net, a portal wherethe residents create and edit the Web site. Forexample: San Francisco, California, has severaldifferent neighborhoods. Each neighborhood has its own character, its own main street, itsown cultural flavor. Each neighborhood wouldhave a Web site where each resident would havea login, e-mail if necessary, and access to thecitywide portal. After being given computers,hookups, software, and training provided by atech-savvy nonprofit, the neighborhood wouldhave a technical town hall meeting where thedesign of the neighborhood’s Web site would becreated and decided upon. So, as an example:Chris Johnson, resident of Bayview would havean e-mail address of [email protected] e-mail would allow access to Bayview’s
site as well as any sf.net neighborhood’s site.Chris also would be able, as a resident ofbayview.sf.net, to add information to the neigh-borhood’s site. Job availability, health risks, education opportunities in the near vicinitycould all be posted on the appropriate neighbor-hood page. Chris could query neighbors aboutwhat classes or information they would be interested in and then they could arrange tohave a class or speaker come and give a talk on that subject at the neighborhood center. The Web sites would be picture (graphic) heavy in order to make them easy to navigateand understand. The neighborhood could thenhave pages translated or even written in lan-guages other than English based on the needs of the neighborhood.
How would people without much computerliteracy (or whom may even be illiterate) be ableto post things on City.net? Once format is devel-oped, pages could be formatted so that addinginformation should be a matter of point-and-clicking or typing the information in. Importantcitywide announcements could then be broad-cast to all residents. Federal and state informa-tion could also be given out in this way. Buteveryone must be involved or the City.net willnot represent all of its people.
The City.net has been tested in otherlocales. It was documented in the Children’sPartnership’s On-Line Content (Lazarus &Mora, 2000) paper. Brooklynx, in New York,and Chicago’s www.northwest.com are twoexamples of online community resources thatbase their content on the values and input oftheir neighborhoods (Anderson, Bikson, Law, & Mitchell, 1999; Lazarus & Mora, 2000;Schön, Sanyal, & Mitchell, 1999). While thesevirtual communities are like the City.net intro-duced above, the scale is smaller and the partici-pation of all citizens is not as inclusive. Thatsaid, these online community resources have thecapability of increasing interest in the Internetand other digital technologies for those whohave been previously disenfranchised. City.netand like portals could be the “killer app” theInternet is waiting for.
In conclusion, one can hope that the DigitalDivide will disappear as a result of the decreasein prices for computers and the increase in alter-nate methods of accessing the Internet. But con-tent is the last key to the puzzle. Content willdraw those not previously interested into the
22

Th
e J
ou
rna
l of Te
ch
no
log
y Stu
die
s
fray. City.net, a portal that would combine homecomputer ownership with software training inorder to have residents build a neighborhood’spersonalized site, is my idea to increase theAfrican American presence on the Web.
ConclusionThe Gartner Report on the Digital Divide
(Smolenski, 2000) posited a three-stage DigitalDivide in America: Stage One is lack of com-puter access; Stage Two is lack of experiencewith technology, which limits the use of impor-tant information and sites away from disadvan-taged Americans; and Stage Three is lack ofbroadband access to the Internet. Throughoutthis article I have suggested three stages as well.The first stage is lack of computer access. Thesecond stage of the Digital Divide is lack ofaccess to the Internet (the first and secondstages are sometimes addressed concurrently),and the third stage is lack of expertise. Exper-tise is the equivalent to Gartner’s second stageof experience. However, expertise for this articlenot only includes experience with the Web andthe Net, but with all digital things. The furtherdevelopment of information literacy is the rea-son that closing the Digital Divide is so impor-tant. The Digital Divide is not an issue simplybecause people do not have access to computersor the Internet; it is an issue because this lack ofaccess breeds an unfamiliarity with the digitaltechnology and information revolution that is sopervasive and necessary here at the turn of thecentury and beyond.
For African Americans the effects of thisthird stage of the Digital Divide is real. Blacksare less likely to have a computer in the home(NTIA, 1999). While they may be getting wiredin record numbers, they are more likely to benew to computers and the Net, and thereforeforever behind the experience curve (Spooner & Rainie, 2000). A whole generation will be tooold for the wiring of the schools and too youngto have been in the first wave of computer use.These people don’t disappear. They movethrough their lives just a little bit behind every-one else. African Americans need a programthat will jump start them and propel themquickly to the level of, if not beyond, theirWhite and Asian counterparts. AfricanAmericans do not have time to wait for comput-ers to get cheaper or schools to be wired or Netcontent to realize their worth as consumers. Aprogram such as City.net, which would providefor training, access, and content production in aconcrete package, driven by private industry andmanaged by nonprofits and the citizens them-selves, would go a long way towards disman-tling the Digital Divide.
Ms. Jacqueline Horton is an educationalmaterials and textbook clerk at a middle schoolin Oakland, CA. She is a member of the BetaBeta Chapter of Epsilon Pi Tau.
23
References
Alter, J. (1999, September 20). Bringing the Digital Divide. Newsweek, 134, 55.
Anderson, R. H., Bikson, T., Law, S. A., & Mitchell, B. M. (1995). Universal access to e-mail feasibility and societal implications. Santa Monica, CA: Rand.
Associated Press. (1999, October 19). CompUSA makes concessions to Blacks. USA Today.Retrieved August 20, 2000, from http:www.usatoday.com/life/cyber/tech/cyg461.htm
Bolt, D., & Crawford, R. (2000). Digital Divide: Computers and our children’s future.New York: TV Books.
Brook, J., & Boal, I. A. (Eds.). (1995). Resisting the virtual life: The culture and politics of information. San Francisco: City Lights.
Carnoy, M., Castells, M., Cohen, S. S., & Cardoso, F. H. (1993). The new global economy in the Information Age: Reflections on our changing world. University Park: The Pennsylvania State University Press.
The Digital Divide Network. (2000). What do we mean when we say “Digital Divide.” Retrieved October 2, 2000, from http://www.digitaldividenetwork.org/tdd.adp
Goslee, S. (1998). Losing ground bit by bit: Low-income communities in the Information Age.Washington, DC: Benton Foundation.

Th
e J
ou
rna
l o
f Te
ch
no
log
y S
tud
ies
24
Harris, W. H. (1982). The harder we run: Black workers since the Civil War. New York: University Press.
Hoffman, D. E., & Novak, T. P. (1999). The evolution of the Digital Divide: Examiningrelationship of race to Internet access and usage over time. Retrieved June 20, 2000, from the Vanderbilt University Web site: http://elab.vanderbilt.edu/research/topics/digital_divide/index.htm
Lazarus, W., & Mora, F. (2000). On-line content for low-income and underserved Americans: The Digital Divide new frontier. Santa Monica, CA: The Children’s Partnership.
Lenhart, A. (2000). Who’s not on-line: 57% of those without Internet access say they do not want to log on. Retrieved October 11, 2000, from the Pew International and American Life Project Web site: http://www.pewinternet.org/reports/toc.asp?Report=21
Marshall, R. (1967). The Negro worker. New York: Random House.
Muhammad, T. (1999, March). Leaders of the digital economy. Black Enterprise, pp. 73-77.
National Public Radio. (1999). Survey shows widespread enthusiasm for high technology.Retrieved October 4, 2000, from http://www.npr.org/programs/specials/poll/ technology/index2.html
National Telecommunications and Information Administration. (1999). Falling through the Net III: Defining the Digital Divide. Retrieved October 1, 1999, from http://www.ntia.doc.gov/ntiahome/digitaldivide
Novak, T. P., & Hoffman, D. L. (1998). Bridging the Digital Divide: The impact of race on computer access and Internet use. Retrieved January 19, 2000, from the Vanderbilt University Web site: http://elab.vanderbilt.edu/research/papers/html/manuscripts/race/science.html
Rist, R. C. (2000). Student social class and teacher expectations: The self-fulfilling prophecy in ghetto education. Harvard Educational Review, 70(3), 257-301.
Schön, D. A., Sanyal, B., & Mitchell, W. J. (Eds.). (1999). High technology and low-income communities. Cambridge, MA: MIT Press.
Smolenski, M. (2000, October). The Digital Divide and American society. Retrieved October 31, 2000, from the Gartner Web site: http://gartner4.gartnerweb.com/public/static/techies/digtial_d/national_nav.html
Spooner, T., & Rainie, L. (2000). African-Americans and the Internet. Retrieved November 10, 2000, from the Pew Internet and American Life Project Web site: http://www.pewinternet.org/reports/toc.asp?Report=25
Stanford University. (2000). Digital Divide. Retrieved October 4, 2000, from http://cse.stanford.edu/class/cs201/projects-99-00/digital-divide/overview.html
Steiner, P. (1993, July). Cartoon. The New Yorker, p. 61.
Taglang, K. (2000). Content and the Digital Divide: What do people want?Retrieved October 2, 2000, from the Digital Divide Network Web site:http://digitaldividenetwork.org/content/stories/index.cfm?key=14
Temple, J. A. (1998). Recent Clinton urban education initiatives and the role of school quality in metropolitan finance. National Tax Journal, 51(3), 517-529.
Thierer, A. (2000). How free computers are filling the Digital Divide. The Backgrounder, p.15. Retrieved October 11, 2000, from http://www.heritage.org/Research/ InternetandTechnology/bg1361.cfm
U.S. Department of Commerce. (1998). The emerging digital economy. Retrieved
October 5, 2000, from http://www.technology.gov/digeconomy/emerging.htm
U.S. Internet Council and International Technology and Trade Associates, Inc. (2000).State of the Internet. Retrieved October 11, 2000, from http://usic.wslogic.com/intro.html or http://www.usinternetcouncil.org

Th
e J
ou
rna
l of Te
ch
no
log
y Stu
die
s
25
Walton, A. (1999, January). Technology versus African-Americans. The Atlantic, pp. 14-18.Retrieved January 19, 2000, from http://www.theatlantic.com/issues/99jan/aftech.htm
Wickham, D. (1999, October 19). Black radio show questions advertisers. USA Today, p. 17A. Retrieved August 20, 2000, from http://www.usatoday.com/news/comment/columnists/wickham/wick035.htm
Yelin, E. (2000). California labor market continues to be strong. Retrieved September 5, 2000, from http://medicine.ucsf.edu/programs/cwhs/2000/day1report.html
Zakon, R. H. (1993-1999). Hobbes’ Internet timeline (V4.1). Retrieved July 17, 1999, from http://www.isoc.org/zakon/Internet/History/HIT.html
Student Perceptions of Web-Based Supplemental InstructionSteven A. Freeman and Dennis W. Field
IntroductionNearly every university and college in
North America now has a Web presence (Saba,1998). Approximately 70% of U.S. colleges anduniversities provide undergraduate applicationsonline and nearly 77% provide their course cata-logs online (The Campus Computing Project,1999). The Internet is also changing the way inwhich education is delivered, and in fact, somepredict that the Internet will become the domi-nant distribution system for distance educationand training (Simonson, Smaldino, Albright, & Zvacek, 1999). Many faculty members areexpanding their traditional delivery methods(lecture, laboratory, face-to-face discussion) toinclude educational options ranging from Web-based course supplements to the complete deliv-ery of courses online. There are endless onlinechoices that instructors may consider in thisrange, from simply posting a syllabus to creat-
ing Web-based content to enhance classroominstruction to full online delivery. In 1997-98,nearly 44% of all U.S. higher education institu-tions offered distance-based courses, an increaseof one third since 1994-95, with most of thegrowth being primarily in Internet delivery(National Center for Education Statistics, 2000).The most recent Campus Computing Project(1999) survey identified that 45% of the 530participating higher education institutionsoffered at least one full course online.
While the primary focus of Web-baseddelivery has been in the development of stand-alone Web-based distance education courses,more faculty members are beginning to use the Web to supplement and enhance on-campusinstruction (e.g., Goldberg, 1997; Henson,Fridley, Pollock, & Brahler, 2002; Marks, 2002;Masten, Chen, Graulau, Kari, & Lee, 2002;

Th
e J
ou
rna
l o
f Te
ch
no
log
y S
tud
ies
26
Mohtar & Engel, 2000; Patterson, 1999; Stith,2000; Wallace & Weiner, 1998). Data collectedby The Campus Computing Project (1999)revealed that 28% of higher education courseshave an associated Web page compared to 9% in 1996. The authors have chosen to augment a traditional face-to-face on-campus safetycourse with an online supplement. This articledescribes the assessment process used to gauge student perceptions of this new onlinesupplement.
Setting the StageThe course chosen for the online compo-
nent was a new junior-level occupational safetycourse, Safety in Manufacturing, required for all industrial technology students at Iowa StateUniversity (ISU). This course covers broad topicareas in occupational safety and health from amanagement or supervisory role in a manufac-turing setting. The Web-based supplement,developed using WebCT (seehttp://www.webct.com/ for information onWebCT) consisted of outline notes for all coursetopics, online quizzes, a variety of communica-tion tools, and access to course grades. Thecourse calendar is used to keep studentsapprised of daily topics, reading assignments,field trips, and due dates for homework andprojects. There is a main bulletin board thateveryone in the class may access and privatebulletin boards that are assigned to each basegroup to facilitate within-group interaction.WebCT allows students to forward their WebCTe-mail to a different e-mail address should theyprefer to receive all of their e-mail at oneaddress. In addition to the communication tools,WebCT was also used to post student grades sothat students could access their current grade atany time. This online supplement was initiatedthe first time this course was offered during theFall 1999 semester. Freeman and Embleton(2000) provide a more detailed description ofthe course, the online supplement, and WebCT.
MethodsTo gauge the reaction of students to the
WebCT supplement for Safety in Manu-facturing, a student survey instrument wasadministered. The survey was adapted fromwork done by the University of Missouri’sWebCT Support Team (1999) to meet theauthors’ needs and address the specific WebCTcomponents implemented. The questionnaireconsisted of 13 questions divided into two sections. The first section addressed students’
previous experience with Web-based courses,computer competency, how often and fromwhere they accessed the online supplement, andany problems they encountered. The second sec-tion addressed their perceptions of the onlinesupplement. The questionnaire was pilot testedat the end of the Fall 1999 semester with the 34students enrolled in the course. The question-naire was distributed with student course evalu-ations. The completed questionnaires werereturned anonymously. The primary purpose ofthe pilot study was to assess the clarity of theinstructions and the usefulness of responses tothe questions as written.
Several questions were changed to clarifyissues identified during the pilot study.Additional questions were also added to addresscomponents of the supplement that were not yetimplemented during the first semester (e.g.,starting in the second semester, students wererequired to take an online quiz prior to eachclass meeting) and to more specifically identifythose components of the supplement that thestudents found useful. In its revised form, thequestionnaire consisted of 18 questions and theopportunity to provide additional comments.The questionnaire was administered at the endof each of the following semesters: Spring 2000,Fall 2000, Spring 2001, Fall 2001, Spring 2002,and Fall 2002. Participant responses wereanonymous.
Participants completed the questionnaireusing pen or pencil. The responses were thenarchived by coding them into a spreadsheet.Each semester, descriptive statistics of the stu-dent perceptions were analyzed as part of theprocess of preparing the course for the nextsemester. The data were transferred from thespreadsheet database to a statistical softwarepackage for the analysis presented here.
Limitations of This MethodologyAs with any self-reported survey, it is typi-
cally not possible to verify if the students com-pleted the questionnaire accurately, or honestly.Pilot testing the questionnaire, which indicatedthat the questions were sufficiently comprehen-sible to allow the students to answer accurately,reduced some of the potential impact of thislimitation. The question of honesty is harder toaddress. However, the responses were anony-mous, had no impact on the students’ grades,and were prefaced with a discussion of the needfor honest feedback to improve the use of theWebCT supplement for future semesters.

27
ResultsDuring the six semesters of this study, 210
students completed this course. A total of 178students completed the questionnaire for anoverall response rate of 85%. During these sixsemesters, the class size ranged from 19 to 47.The response rate ranged from 70.2% to 100%.During the Spring 2000 semester, this class wasthe first Web-based course experience for over76% of the respondents. The majority of the students for the next two semesters also had noprevious Web-based course experience. Thenstarting with the Fall 2001 semester, the trendshifted in the other direction, and by the Fall2002 semester, nearly 92% of the students hadprevious Web-based course experience. Thisclear demarcation between the percentage ofstudents who had Web-based course experiencesthe first three semesters versus the last threesemesters provided a natural split that was usedin subsequent analyses.
The class met face-to-face twice per week,and in every semester over 90% of the respon-dents indicated that they accessed the courseWeb site two or more times per week. The loca-tions from which students accessed WebCTmost often were the departmental computer labs and their places of residence. However, the location used most frequently changed fromthe departmental computer lab (59% in Spring2000) to the student’s house or apartment (69%by Fall 2002). Again, a natural split existedbetween the first three semesters and the lastthree semesters. During the first three semes-ters, over half of the respondents (59%, 59%,and 54%, respectively) used the departmentalcomputer labs as their primary location foraccessing WebCT. During the last three semes-ters, 50% or more of the respondents (55%,50%, and 69%, respectively) indicated that theymost often accessed WebCT from their resi-dence. It should also be noted that significantconstruction of “Internet ready” student housingwas opening up during this time.
When ranking their computing and infor-mation technology proficiency on a scale from1 = novice to 5 = expert, the industrial technolo-gy students responding considered themselvesto be competent computer users with 86% giv-ing themselves a rank of 3 or better in Spring2000 and 100% giving themselves a rank of 3 orbetter in Fall 2002. As expected, they were ableto quickly master the WebCT environment andindicated very few problems interacting with
WebCT. The most common problem during thefirst three semesters was logging in during thefirst two weeks of class (24%) and slowresponse time during the last three semesters(49%).
The WebCT course components consideredmost useful by the students were the coursenotes, access to grade information, and theonline quizzes. Nearly all (99%) of the studentswho had previous Web-based course experi-ences indicated that they preferred this WebCTcourse to those used in the past. More than 90%of these students indicated that the online notesand quizzes helped them prepare for class.Similarly, 89% indicated that the WebCT com-ponent was valuable and improved their learningexperience and 92% indicated that they weresatisfied with their WebCT experience. The lastquestion on the survey asked if they would pre-fer a class with a WebCT component to onewithout such a component, given a choice.Ninety-six percent indicated that they wouldprefer a class with a WebCT component.
Correlations and ComparisonsThe primary purpose of this study was to
gauge student perceptions of their experiencewith the WebCT supplement to Safety inManufacturing to help guide continuing devel-opment and use of the online supplement infuture semesters. In addition, this study alsoexplored potential differences between studentsubgroups based on (a) their self-reported com-puter competency, (b) the components of thesupplement they considered useful, and (c) theirperceptions of their WebCT experiences. Allcorrelations where a significant (a = 0.05) dif-ference between students was found in three ormore semesters are presented below. The impor-tance and/or implications of these findings arediscussed in the next section.
In all but the first semester, students whoindicated that the WebCT component was valu-able and improved their learning experiencewere more likely to consider the WebCT quizzeshelpful in preparing for class [the correspondingcorrelation and p values in parentheses for Fall2000 through Fall 2002 were .632 (.000), .836(.000), .525 (.002), .649 (.000), and .406 (.024)]and were more likely to be satisfied with theiroverall WebCT experience [the correspondingcorrelation and p values in parentheses for Fall2000 through Fall 2002 were .561 (.002), .561(.001), .788 (.000), .818 (.000), and .612
Th
e J
ou
rna
l of Te
ch
no
log
y Stu
die
s

Th
e J
ou
rna
l o
f Te
ch
no
log
y S
tud
ies
(.000)]. In four semesters, students who rankedtheir computer competency higher were alsoless likely to think that they spent too muchtime learning WebCT [the corresponding corre-lation and p values in parentheses were Spring2000, .492 (.045); Fall 2000, .499 (.006); Fall2001, .377 (.037); and Fall 2002, .461 (.009)].Students who considered the WebCT coursenotes helpful in preparing for class were morelikely to be satisfied with their overall WebCTexperience in four of the six semesters [the cor-responding correlation and p values in parenthe-ses were Spring 2000, .553 (.021); Fall 2000,.707 (.000); Spring 2001, .502 (.003); andSpring 2002, .517 (.002)]. During the last foursemesters, students who considered the WebCTquizzes helpful in preparing for class were alsomore likely to agree that access to their gradeinformation prompted them to take action [thecorresponding correlation and p values in paren-theses were Spring 2001, .349 (.047); Fall 2001,.429 (.018); Spring 2002, .358 (.044); and Fall2002, .427 (.017)].
In three of the six semesters, students whoconsidered that the WebCT component wasvaluable and improved their learning experiencewere also more likely to consider it important tohave experience using the latest technologyapplied to their discipline. During three semes-ters the students who considered the WebCTnotes helpful in preparing for class were morelikely to indicate that the notes also facilitatednote taking in class. Also during three semestersthe students who considered the WebCT noteshelpful in preparing for class were more likelyto indicate that the WebCT quizzes were helpfulin preparing for class. Finally, students whoindicated that the quizzes were a useful compo-nent of the WebCT course were more likely toindicate that the quizzes helped them preparefor class.
DiscussionLess than 25% of the students enrolled in
Safety in Manufacturing during the Spring 2000semester had any previous experience withcourses that utilized a Web site. While seriousefforts are underway across the country toincrease Web-based delivery of educational con-tent, the early focus was on using the Web forcomplete online delivery—distance education. It was not surprising that relatively few residentstudents, even in a technology discipline, hadbeen exposed to online components in theircourses. Although underutilized at the time,
research was available documenting that stu-dents who received a combination of face-to-face instruction with a Web supplement per-formed better than their counterparts whoreceived only traditional or only Web-basedinstruction and were much more satisfied with their learning experience (Goldberg, 1997, 2000). This may be particularly true for industrial technology students who are alreadycompetent computer users and, as the resultsconfirmed, were able to quickly pick up theintricacies of online delivery even without previous experience. However, WebCT wasbecoming the standard Web-based instructionalplatform at ISU and its use across campus wasexpanding. By Fall 2001 over 60% of the stu-dents in Safety in Manufacturing had previousexperience with a course that utilized a Website. A year later over 90% of the studentrespondents had previous Web-based education-al experiences. Since they were on-campus stu-dents, the majority of these experiences werelikely to be Web-based supplements to tradition-al course delivery methods. It is clear that Web-based components are now common across thecampus and in the industrial technology curricu-lum. It is also noteworthy that as the reliance onWeb-based components increased (both throughthe number of previous courses and the numberof access times per week) the students weremore likely to utilize access from their resi-dence than from departmental computer labs.However, the fact that more students wereaccessing their Web-based courses from offcampus is likely the reason that more studentscomplained of slow network response time inlater semesters.
The three components of the online supple-ment—course notes, grade information, andquizzes—that were considered the most usefulwere the components that were used most often.The students did not have a choice in using theonline quizzes. They were required to take apreparation quiz prior to each class on the topicto be discussed that day. Each quiz was avail-able for the 48 hours prior to the start of theclass covering that topic. The online notes wereused by students to help prepare for the quizzesand to facilitate note taking in class. Although itwas not encouraged or discouraged in any way,it was observed that by the second week of eachsemester the majority of the students were print-ing out the online notes and bringing them toclass. These results were corroborated in that
28

Th
e J
ou
rna
l of Te
ch
no
log
y Stu
die
s
more than 90% of the students agreed that thecourse notes and quizzes helped them preparefor class. Grades were not posted in hard copyor handed out in class. Instead, updated studentgrades were posted to WebCT. Since the stu-dents were accessing the WebCT component on a routine basis, they developed the habit ofchecking their grades frequently and letting theinstructor know if grades were not accessiblewithin a day of handing in assignments. Infor-mation that was accessible to the studentsincluded grades for all assignments, current dataon overall percentage, class rank, and currentletter grade. Having access to current grades atany time also received positive comments in thestudent course evaluations.
The other three major components of thesupplement—bulletin board, calendar, and e-mail—received less enthusiasm. The bulletinboard was used to provide general courseannouncements and provide private feedback to each group concerning group assignmentsand projects. During the first three semesters,homework assignments were posted to the bul-letin board. However, during the last threesemesters, the homework assignments were pro-vided in the “Class Resources” section of theWebCT supplement. This seems to have affectedthe perceived usefulness of the bulletin boardsas the ratings dropped more than 10% duringthe last three semesters. The calendar was prob-ably not deemed as useful as some other compo-nents since it duplicated information that wasprovided in the syllabus; the syllabus was quitedetailed and few changes were made to theschedule during the semester. The fact that fewof the students considered WebCT e-mail to beuseful is explained by the variety of responsesto the question on whether they preferred tohave the course-related e-mail separate fromtheir personal e-mail. The vast majority of thestudents already had an e-mail account that theywere actively using. The account they used mostoften was the one they tended to use to commu-nicate with their group members and theinstructor. WebCT allows students to forwardtheir WebCT e-mail to a different e-mail addressshould they prefer to receive all of their e-mailat one address; however, it does not allow othere-mail to be forwarded to WebCT e-mail. Thus,students who wanted only a single e-mail sys-tem used one outside WebCT as their primarymeans of communication with other studentsand the instructor.
It should be expected that students whobelieved that the WebCT supplement was valu-able and improved their learning were the mostsatisfied with their overall WebCT experience.If students considered the WebCT quizzes to be useful, it is logical for these same students to use the quizzes to help them prepare forclass. If they were using the online notes to pre-pare for the quizzes, it follows that they wouldalso consider the notes useful in preparing forclass. It is therefore not surprising that the stu-dents who considered the Web-based supple-ment to be valuable also considered the quizzesto be helpful in preparing for class. As previous-ly mentioned, the industrial technology studentswere already competent computer users andwere thus able to quickly learn WebCT. It fol-lows that the more competent their computerskills, the less likely they were to perceivelearning WebCT as a time burden. What isencouraging is that only two students (of the173 who responded to that particular question),regardless of previous experience or computercompetency, indicated that learning and interact-ing with the WebCT supplement was a problem.In addition, it seems natural to expect that stu-dents who found the online notes useful whilepreparing for class would use the notes in classto facilitate their own note taking. Since theonline notes helped them learn the material, it was expected that those who found the onlinenotes useful would be the most satisfied withtheir overall WebCT experience. Although stu-dents’ response to the online notes is rewardingto the authors, an obvious goal for future semesters is to continue to improve the onlinenotes until all the students find them useful and strongly agree that they help in class preparation.
A positive correlation existed between con-sidering the quizzes to be useful in preparing forclass and agreeing that access to grade informa-tion prompted them to seek assistance from theinstructor or other group members. It may sim-ply be that these students were more proactivein their learning and that the quizzes and seek-ing assistance from others were both viewed as active measures in learning the material. Inaddition, a positive correlation existed betweenregarding the WebCT component as valuableand considering it important to have experienceusing the latest technology applied to their dis-cipline. This is probably due to the fact that theindustrial technology students are competent
29

Th
e J
ou
rna
l o
f Te
ch
no
log
y S
tud
ies
computer users and consider Web-based instruc-tion as a “technology” process.
Conclusions and RecommendationsBased on work to date and the results
of this study, the following conclusions weredrawn:
• Industrial technology students at ISUwere already prepared and capable oflearning WebCT as a supplement toclassroom instruction quickly, regardlessof previous experience in using Web-based courses or course components.
• Students appreciated the Web-based sup-plement to Safety in Manufacturing andconsidered it to be a useful and valuablecomponent to the overall delivery of thecourse material.
• Students considered the online notes and quizzes particularly helpful to their overall experience in Safety inManufacturing.
• Students considered the access to gradeinformation to be a useful component of the WebCT supplement.
• Students accessed the Web-based materialfrom where they had easy access to theWeb–departmental computer labs or personal computers at their place of residence.
The authors believe there are opportunitiesfor faculty members to enhance and improve theeducational experience for on-campus studentsthrough the use of online course componentsand encourage all instructors to begin to explorethese opportunities. Based on the findings ofthis project, the following recommendations aresuggested for further inquiry:
• Studies need to be conducted to explorethe relationships between student percep-tions and educational outcomes (e.g.,here it was found that students perceivedthat the online quizzes and notes helped
prepare them for class, but the anony-mous nature of the questionnaire did notallow for an exploration of whether theuse of these online components resultedin improved class performance).
• Studies need to be conducted to evaluatethe use of specific online components(e.g., Why did some students put morevalue on the online notes? How were they using them? How could they beimproved? Were students that valuedthem using them differently than studentswho placed lower value on them?).
• Similar studies need to be conducted with other types of courses to determineif student perceptions are consistentacross technology curricula. The findingsof such studies, if tied to student out-comes, may suggest broad-based curricu-la reform for on-campus technologycourses.
In addition to the recommendations above,industrial technology faculty should also consid-er whether the lessons learned here and in futurestudies can be applied to asynchronous deliveryof hands-on technology curricula that forms thebasis of on-campus technology education.
Readers interested in details of this study in tabular form may contact the authors at [email protected].
Dr. Dennis W. Field is an associate professor in the Department of Technology at Eastern Kentucky University. He is a member of the Alpha Xi Chapter of Epsilon Pi Tau.
Dr. Steven A. Freeman is an associate professor in the Department of Agricultural and Biosystems Engineering at Iowa StateUniversity. He is a member of the Alpha XiChapter of Epsilon Pi Tau.
30
References
The Campus Computing Project. (1999). The 1999 national survey of information technology in US higher education. Encino, CA: Author.
Freeman, S. A., & Embleton, K. M. (2000). Enhancing a residential safety course with the development of an online component: A limited case study. Journal of Industrial Technology, 16(4). Retrieved September 11, 2000, from http://nait.org/jit/Articles/ freeman082200.pdf

Th
e J
ou
rna
l of Te
ch
no
log
y Stu
die
s
31
Goldberg, M. W. (1997, June). WebCT and first year computer science: Student reaction to and use of a Web-based resource in first year computer science. In Proceedings of the 2nd Conference on Integrating Technology into Computer Science Education (pp. 127-129). New York: ACM Press.
Goldberg, M. W. (2000, January 18). To lecture or not to lecture. Online Teaching and Learning Newsletter, 1(5). Retrieved October 30, 2003, from http://www.webct.com/OTL/View Content?contentID=2339269
Henson, A. B., Fridley, K. J., Pollock, D. G., & Brahler, C. J. (2002). Efficacy of interactive Internet-based education in structural timber design. Journal of Engineering Education, 91(4), 371-378.
Marks, B. P. (2002). Web-based readiness assessment quizzes. Journal of Engineering Education, 91(1), 97-102.
Masten, S. J., Chen, K., Graulau, J., Kari, S. L., & Lee, K. (2002). A Web-based and group learning environment for introductory environmental engineering. Journal of Engineering Education, 91(1),69-80.
Mohtar, R. H., & Engel, B. A. (2000). WWW-based water quality modeling systems to enhance student learning. Journal of Engineering Education, 89(1), 89-94.
National Center for Education Statistics. (2000). Distance education at postsecondary education institutions: 1997-98 (NCES 2000-013). Washington, DC: U.S. Department of Education.
Patterson, K. G. (1999). Student perceptions of Internet-based learning tools in environmental engineering education. Journal of Engineering Education, 88(3), 295-304.
Saba, F. (1998, August). Special report: World Wide Web. Distance Education Report, pp. 1-6.
Simonson, M., Smaldino, S., Albright, M., & Zvacek, S. (1999). Teaching and learning at a distance: Foundations of distance education. Columbus, OH: Prentice Hall.
Stith, B. (2000). Web-enhanced lecture course scores big with students and faculty. T.H.E. Journal, 27(8), 21-28.
University of Missouri’s WebCT Support Team. (1999). Student views on WebCT-based courses.Retrieved December 5, 1999, from http://web.missouri.edu/~muwww/ stusurvey_end_fs99.html
Wallace, D. R., & Weiner, S. T. (1998). How might classroom time be used given WWW-based lectures? Journal of Engineering Education, 87(3), 237-248.

PC-Based Virtual Reality for CAD Model ViewingAbhishek Seth and Shana S-F Smith
Th
e J
ou
rna
l o
f Te
ch
no
log
y S
tud
ies
32
Product design is a critical activity becauseit has been estimated that 70% to 80% of thecost of product development and manufacture isdetermined by the decisions made in the initialdesign stages (Kalpakjian & Schmid, 2001).During the design process, 92% of communica-tions are graphically based (Bertoline, Wiebe,Miller, & Mohler, 1997). Graphics is a visualcommunication language, which helps designersunderstand their developing designs and to con-vey their ideas to others. Thus, efficient graph-ics communication tools can improve designand decision-making processes.
Most designers currently use traditionalCAD tools to help communicate their designs toothers. However, CAD tools only allow users toexamine 3D models from outside flat computermonitors. In other words, the models and theviewers are in different realms. Using traditionalCAD tools, the designers cannot view modelswith natural stereoscopic vision.
Recently, virtual reality (VR), as an emerg-ing visualization technology, has introduced anunprecedented communication method for col-laborative design. VR refers to an immersive,interactive, multisensory, viewer-centered, 3Dcomputer-generated environment and the combi-nation of technologies required to build such anenvironment (Aukstakalnis & Blatner, 1992;Cruz-Neira, 1998). VR technology breaks downbarriers between humans and computers byimmersing viewers in a computer-generatedstereoscopic environment. VR allows users toexperience a strong sense of presence in a virtu-al scene and enhances user interactivity. UsingVR technology, depth cues provided by a stereoimage help convey spatial relationships in 3Dmodels, which enhances users’ understanding of a design. Viewers can perceive distance and spatial relationships between different objectcomponents more realistically and accuratelythan with conventional visualization tools.
Usually, however, implementation of VRtechnology is not easy. It requires skilled techni-cal people and highly specialized, sometimescostly, equipment. These requirements preventthe widespread use of VR in research and indus-trial communities (Olson, 2002). However, now,
most PC workstations have stereoscopic graphicdisplay capability built into their graphics cardchip sets. PC-based VR techniques, also calledlow-cost VR, bring VR to a usable level for people with basic technical computer skills and limited resources. Low-cost VR takes advantageof recent advances in low-end graphics systemsand other inexpensive VR commodities. Thus,VR solutions are becoming more accessible.
About This ArticleThis article introduces the current status
of VR applications in industry and the technolo-gies involved in the low-cost VR systems. Thenumber of companies producing low-cost VR-related hardware and software is continuouslyincreasing. New hardware and software techni-cal terms are confusing or meaningless to peo-ple without any prior background in VR. Thus,choosing the right VR tool for a particularapplication is challenging for potential users.This article introduces different available stereoimage rendering techniques, such as anaglyphic,page flipping, and sync doubling, and majorlow-cost VR hardware and software tools avail-able for CAD model viewing. The purpose ofthis article is to help CAD users and productdesigners have a better understanding about VRtechnology so that they can develop their ownVR systems to increase the efficiency of designcommunication.
Status in IndustryIn industry, VR has proven to be an effec-
tive tool for helping workers evaluate productdesigns (Kelsick, 1998). Using VR enableseveryone on a design team to understanddesigns better, leading to more informed andmeaningful communications. Such rapid andless-ambiguous communication greatlyenhances the speed and accuracy with whichdecisions can be made and designs can be completed.
Several major companies have incorporatedVR technology into their design or productionprocesses. In 1999, BMW explored the capabili-ty of VR for verifying product design (Gomesde Sa & Zachmann, 1999). They concluded thatVR has the potential to reduce the number ofphysical mockups needed, to improve overallproduct quality, and to obtain quick answers,

Th
e J
ou
rna
l of Te
ch
no
log
y Stu
die
s
in an intuitive way, during the concept phase ofa product. In addition, Motorola developed aVR system for training workers to run a pagerassembly line (Wittenberg, 1995). They foundthat VR can be used to successfully train manu-facturing personnel and that participants trainedin VR environments perform better on the jobthan those trained for the same time in real envi-ronments. In 1998, GE Corporate Researchdeveloped two VR software applications,Product Vision and Galileo, which allowed engi-neers to interactively fly through a virtual jetengine (Abshire & Barron, 1998). They reportedthat the two applications were used successfullyto enhance design communication and to solvemaintenance problems early, with minimal cost,delays, and effort. They also reported that usingthe VR applications helped make maintenancean integral part of their product design process.
Passive and Active Stereo SystemsBecause a person’s two eyes are some dis-
tance apart, upon viewing the same object theright eye sees a slightly different image from the left eye. Therefore, to see a stereo image on a PC screen, one needs to generate differentimages for the right eye and the left eye, respec-tively, and arrange the two images such that theright eye sees only the right view and the lefteye sees only the left view.
PC-based VR systems typically use one of several types of special viewing glasses toselectively send the right- and the left-eyeimages to the correct eyes. Depending upon the type of glasses used, stereo systems can beclassified into passive or active stereo systems.“Passive” systems use glasses without electroniccomponents; “active” systems use glasses withelectronic components.
Passive Stereo SystemsPassive stereo systems are the most com-
mon and basic type of stereo systems. They arepopular because they are very inexpensive, andcost is often a critical factor in public environ-ments. To the naked eye, passive stereo imagesappear to overlap and are doubled and blurry.However, when the stereo images are viewedwith glasses made from colored or polarized filters, the images become stereoscopic.
Passive anaglyphic systems create a dif- ferent colored image for the right and left eye. Users then view the colored imagesusing anaglyphic glasses made from colored filters (e.g., blue for the right eye and red forthe left eye). Anaglyphic glasses used for passive stereo cost about 80¢ per pair (VRex,http://www.vrex .com). However, image qualityin passive anaglyphic systems is relatively poor,and colored views are not possible. The lack ofcolored viewing capability is one of the majordrawbacks of anaglyphic passive stereo systems.
Another method for passive stereo viewingis based on the principle of light polarization.With oppositely polarized filters attached to twoprojectors and matching filters in a pair ofglasses, right- and left-eye images can be sepa-rated and multiple colors can also be viewed.The theory behind polarized viewing systems isbased upon the vibration characteristics of light(Barco, n.d.). Nonpolarized light waves canvibrate in any direction. A light wave vibratingin a single direction is called polarized light.The polarization of a light wave at any givenmoment is determined by the specific orienta-tion of the wave at that moment. Nonpolarizedlight can be transformed to polarized light bypassing the light wave through a polarizer (seeFigure 1). The depth perception required forstereo images can be created by directing
33
Figure 1. Polarizing light using a polarizing filter.

Th
e J
ou
rna
l o
f Te
ch
no
log
y S
tud
ies
34
different visual information, using differentpolarization directions, to the right and left eye.Thus, such a stereo system uses two projectors,as shown in Figure 2. Polarizing light wavesdoes not significantly degrade image qualitybecause human eyes are largely insensitive topolarization. The cost for a polarized projectorsystem is around $20,000 (VRex,http://www.vrex.com; 3-D ImageTeck,http://www.3dimagetek.com).
If light is polarized in a single direction(north/south, east/west, or even diagonally), thelight is linearly polarized. If a viewer changesthe orientation of linearly polarized glasses bytilting his or her head, the resulting polarizationorientation of the viewer’s glasses will notmatch that of the polarization filters mounted onthe projectors, and there will be a loss of stereoinformation, as perceived by the viewer (Barco,n.d.). Nevertheless, linear polarization is a cost-effective technology that can produce excellentright-eye and left-eye image separation forstereoscopic applications for which head tiltingis limited.
Using circularly, rather than linearly, polar-ized light is an effective solution to the head-tilting problem. For circularly polarized light,head tilting does not result in a loss of stereoinformation, since the light is not polarized in asingle direction. StereoGraphics Corporation’sMonitor ZScreen series provides a stereoscopicpanel, which mounts on a regular PC computermonitor, for circularly polarizing right-eye andleft-eye images (Stereographics Corporation,http://www.stereographics.com). The cost of aMonitor ZScreen system is $2,345. Polarizedglasses range in cost from $3.95 to $50 per pair(Stereographics Corporation, http://www.stereo-graphics.com; VRex, http://www.vrex.com).
One of the important advantages of polar-ized stereo viewing systems is that they can bedriven by non-stereo-capable hardware. In addi-tion, the polarizing method can provide coloredand high-quality stereo images.
Active Stereo SystemsIn active stereo systems, the viewing glass-
es used contain electronic components. Stereoimages are presented by rapidly alternating thedisplay of right-eye and left-eye images whilealternately masking the right and left eye usingsynchronous shutter eyewear, such as LCD shutter glasses. Available LCD shutter glassesuse various image switching techniques. Thefollowing three modes are most popular (Lipton, 1997):
• Interlacing • Page flipping• Sync doubling
InterlacingInterlacing is used in existing television
systems, such as NTSC, PAL etc., to transmitand broadcast signals. In interlace mode, a sin-gle frame is divided into two fields: the oddscan-line field and the even scan-line field.When the interlace mode is used for stereoimaging, the right-eye image and the left-eyeimage are divided into odd and even scan-linefields, or vice versa. First the odd scan-lines (1,3, 5, 7, etc.) are presented, followed by the evenscan-lines (2, 4, 6, 8, etc.; see Figure 3). Whenthe right-eye frame is displayed on the screen,the left eye is covered by the glasses, and whenthe left-eye frame is shown on the screen, theright eye is covered by the shutter glasses.
Figure 2. Double projector systemwith opposite polarizers.
Figure 3. Interlacing.

Th
e J
ou
rna
l of Te
ch
no
log
y Stu
die
s
Page-Flipping In page-flipping mode, the right- and the
left-eye frames are shown alternately on thescreen (see Figure 4). When the right-eye frameis shown on the screen, the left eye is coveredby the shutter glasses, and when the left-eyeframe is shown on the screen, the right eye iscovered by the shutter glasses. In this mode,both the horizontal and vertical resolutions arekept the same, since the frames are displayedone by one on the entire screen.
For page-flipping, high-end PC hardware is typically required. A monitor that supports a120 Hz or higher vertical scan frequency andspecially designed hardware are often required.As mentioned earlier, page-flipping providesfull resolution picture quality and, thus, providesthe best visual effect among the display modesfor shutter glasses. However, software and hard-ware dependence is a major drawback.
Sync-Doubling With sync-doubling, the right-eye and left-
eye frames of the image are scaled down in thevertical direction and arranged on the upper andlower half of the screen (see Figure 5). Sync-doubling differs from interlacing and page-flip-ping modes in that no specialized computerperipherals are required.
To create a stereo view, software designersonly need to arrange the right- and left-eyeimages properly on the screen, as shown inFigure 5. An external circuit (called a sync doubler) is then used, which allows the right-and left-eye images to stretch to normal size and appear in an interlaced pattern on screen.The image quality is not as good as page flip-
ping because the monitor’s vertical frequencyneeds to be doubled to stretch the frames to fullscreen. Overall image resolution is thereforereduced by one half. However, the advantage of sync-doubling is that it is not limited by computer hardware capabilities.
Available SoftwarePresently, there are a number of VR soft-
ware tools available for stereoscopically viewingCAD models. For example, 3Space Assistant byTemplate Graphics Software (http://www.tgs.com)and Quadro View by Nvidia Corporation(http://www.nvidia.com) are well developed and very user-friendly.
For the available software tools, the com-puter system must have an OpenGL driverinstalled to activate stereo modes. OpenGL is across-platform, high-performance standardlibrary for 3D graphics applications. If anOpenGL driver for the graphics card being usedis unavailable or if the driver is not installedwhen the active stereo mode is used, the com-puter will display the message “No OpenGLdriver installed on the computer,” and the stereo image will not be shown on the screen.GL Direct, by SciTech Software Inc.(www.scitechsoft.com), provides a solution tothe above problem. After the software isinstalled, whenever any stereo application (e.g.,TGS 3Space Assistant or Quadro View) starts,SciTech GL Direct will automatically start.
TGS 3Space Assistant3Space Assistant from Template Graphics
Software, Inc., is a stand-alone CAD modelviewer. The advantage of 3Space Assistant isthat it allows stereo viewing in a number of
35
Figure 4. Page-flipping. Figure 5. Sync-doubling.

Th
e J
ou
rna
l o
f Te
ch
no
log
y S
tud
ies
stereo modes such as Raw OpenGL, HorizontalInterlaced, Vertical Interlaced, Red-CyanAnaglyphic, and Blue-Yellow Anaglyphic (seeFigure 6). If the active stereo mode is used,LCD shutter glasses are required. If theanaglyphic stereo mode is enabled, passive col-ored filter glasses (red/cyan, blue/yellow, orgreen/magenta) are required.
Nvidia Quadro ViewTo use Nvidia’s Quadro View, users need
to purchase a quad-buffered graphics card or a computer system that already has a quad-buffered graphics card installed (NvidiaCorporation, http://www.nvidia.com; Redmond,n.d.). The stereo quality provided by QuadroView is very good, but the part handling fea-tures are not very user-friendly. Using QuadroView, 3D CAD models can be viewed usingpassive as well as active stereo modes. One ofthe unique features in Quadro View is its com-patibility with other CAD design packages (e.g.,AutoCAD, AutoCAD Architectural Desktop,and Mechanical Desktop), which makes it dif-ferent from all other stereo viewers.
Future DirectionsPC-based VR, in the future, will incorpo-
rate haptic and audio devices to give a bettersense of immersion in the computer-generatedenvironment and to provide a more intuitiveinteraction with design models. Haptic devicescould provide realistic force feedback so userscould feel objects that they touch or move.Audio devices could provide realistic soundeffects for collisions between objects. In addi-tion, because of the restrictions associated withmanipulating 3D virtual objects with a keyboardand mouse, data gloves will be used to increasemanipulation efficiency in low-cost VR sys-tems. Handling computational workloads whileproviding real-time response is also a criticalissue for realizing future low-cost VR systems.
Dr. Shana Smith is an associate professorin the Industrial Technology Program within the Department of Agricultural and BiosystemsEngineering at Iowa State University.
Mr. Abhishek Seth is pursuing his PhD in Mechanical Engineering at Iowa StateUniversity.
36
Figure 6. Stereo settings in the view menu of 3Space Assistant.
Th
e J
ou
rna
l of Te
ch
no
log
y Stu
die
s
37
References
Abshire, K. J., & Barron, M. K. (1998). Virtual maintenance: Real-world applications within
virtual environments. In IEEE Proceedings Annual Reliability and Maintainability Symposium
(pp. 132-137). Anaheim, CA: Institute of Electrical and Electronics Engineers.
Aukstakalnis, S., & Blatner, D. (1992). Silicon mirage: The art and science of virtual reality. Berkley, CA: Peachpit Press.
Barco. (n.d.). Stereoscopic projection. Retrieved September 25, 2002, from http://www.barco.com/Projection_systems/virtual_and_augmented_reality/content/info/downloads_broch.asp?bshow=1
Bertoline, G. R., Wiebe, E. N., Miller, C. L., & Mohler, J. L. (1997). Technical graphics communication (2nd ed.). Burr Ridge, IL: McGraw-Hill.
Cruz-Neira, C. (1998). Making virtual reality useful: Immersive interactive applications. Journal of Future Generation Computer Systems, 14, 147-156.
Gomes de Sa, A., & Zachmann, G. (1999). Virtual reality as a tool for verification of assembly and maintenance processes. Computers and Graphics, 23, 389-403.
Kalpakjian, S., & Schmid, S. R. (2001). Manufacturing engineering and technology (4th ed.). Upper Saddle River, NJ: Prentice-Hall.
Kelsick, J. J. (1998). The VR factory: Discrete event simulation implemented in a virtualenvironment. Unpublished master’s thesis, Iowa State University, Ames.
Lipton, L. (1997, May). Stereo-vision formats for video and computer graphics. Proceedings of SPIE, 3012, 239-244. Retrieved October 20, 2002, from http://spie.org/scripts/abstract.pl?bibcode=1997SPIE%2e3012%2e%2e239L&page=1&qs=spie
Olson, E. C. (2002). Cluster juggler-PC cluster virtual reality. Unpublished master’s thesis, Iowa State University, Ames.
Redmond, M. (n.d.). Using Nvidia XGL cards on Geowall. Retrieved November 9, 2002, from http://emedia.engr.wisc.edu/pages/geowall/Using_NVidia.pdf
Wittenberg, G. (1995). Training with virtual reality. Assembly Automation, 15(3), 12-14.
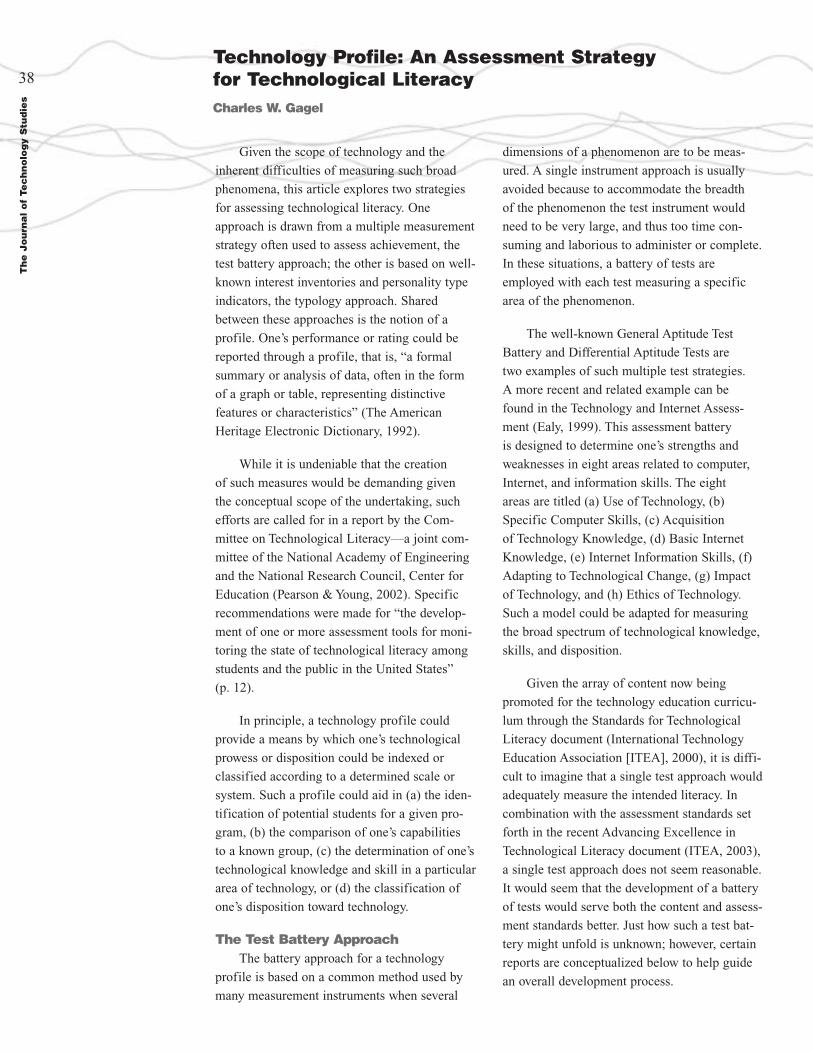
Th
e J
ou
rna
l o
f Te
ch
no
log
y S
tud
ies
38Technology Profile: An Assessment Strategy for Technological LiteracyCharles W. Gagel
Given the scope of technology and the
inherent difficulties of measuring such broad
phenomena, this article explores two strategies
for assessing technological literacy. One
approach is drawn from a multiple measurement
strategy often used to assess achievement, the
test battery approach; the other is based on well-
known interest inventories and personality type
indicators, the typology approach. Shared
between these approaches is the notion of a
profile. One’s performance or rating could be
reported through a profile, that is, “a formal
summary or analysis of data, often in the form
of a graph or table, representing distinctive
features or characteristics” (The American
Heritage Electronic Dictionary, 1992).
While it is undeniable that the creation
of such measures would be demanding given
the conceptual scope of the undertaking, such
efforts are called for in a report by the Com-
mittee on Technological Literacy—a joint com-
mittee of the National Academy of Engineering
and the National Research Council, Center for
Education (Pearson & Young, 2002). Specific
recommendations were made for “the develop-
ment of one or more assessment tools for moni-
toring the state of technological literacy among
students and the public in the United States”
(p. 12).
In principle, a technology profile could
provide a means by which one’s technological
prowess or disposition could be indexed or
classified according to a determined scale or
system. Such a profile could aid in (a) the iden-
tification of potential students for a given pro-
gram, (b) the comparison of one’s capabilities
to a known group, (c) the determination of one’s
technological knowledge and skill in a particular
area of technology, or (d) the classification of
one’s disposition toward technology.
The Test Battery ApproachThe battery approach for a technology
profile is based on a common method used by
many measurement instruments when several
dimensions of a phenomenon are to be meas-
ured. A single instrument approach is usually
avoided because to accommodate the breadth
of the phenomenon the test instrument would
need to be very large, and thus too time con-
suming and laborious to administer or complete.
In these situations, a battery of tests are
employed with each test measuring a specific
area of the phenomenon.
The well-known General Aptitude Test
Battery and Differential Aptitude Tests are
two examples of such multiple test strategies.
A more recent and related example can be
found in the Technology and Internet Assess-
ment (Ealy, 1999). This assessment battery
is designed to determine one’s strengths and
weaknesses in eight areas related to computer,
Internet, and information skills. The eight
areas are titled (a) Use of Technology, (b)
Specific Computer Skills, (c) Acquisition
of Technology Knowledge, (d) Basic Internet
Knowledge, (e) Internet Information Skills, (f)
Adapting to Technological Change, (g) Impact
of Technology, and (h) Ethics of Technology.
Such a model could be adapted for measuring
the broad spectrum of technological knowledge,
skills, and disposition.
Given the array of content now being
promoted for the technology education curricu-
lum through the Standards for Technological
Literacy document (International Technology
Education Association [ITEA], 2000), it is diffi-
cult to imagine that a single test approach would
adequately measure the intended literacy. In
combination with the assessment standards set
forth in the recent Advancing Excellence in
Technological Literacy document (ITEA, 2003),
a single test approach does not seem reasonable.
It would seem that the development of a battery
of tests would serve both the content and assess-
ment standards better. Just how such a test bat-
tery might unfold is unknown; however, certain
reports are conceptualized below to help guide
an overall development process.
Th
e J
ou
rna
l of Te
ch
no
log
y Stu
die
s
39
Figure 1. Conceptual representation of a Technology Profile.
The Nature of TechnologyStudents will develop an understanding of . . . .
S1: the characteristics and scope of technology.
S2: the core concepts of technology.
S3: the relationships among technologies and the connections betweentechnology and other fields of study.
Technology and SocietyStudents will develop an understanding of . . . .
S4: the cultural, social, economic, and political effects of technology.
S5: the effects of technology on the environment.
S6: the role of society in the development and use of technology.
S7: the influence of technology on history.
DesignStudents will develop an understanding of . . . .
S8: the attributes of design.
S9: engineering design.
S10: the role of troubleshooting, research and development, inventionand innovation, and experimentation in problem solving.
Abilities for a Technological WorldStudents will develop the abilities to . . . .
S11: apply the design process.
S12: use and maintain technological products and systems
S13: assess the impact of products and systems.
The Designed WorldStudents will develop an understanding
of and be able to select and use . . . .
S14: medical technologies.
S15: agricultural and related biotechnologies.
S16: energy and power technologies.
S17: information and communication technologies.
S18: transportation technologies.
S19: manufacturing technologies.
S20: construction technologies.
S Code Descriptions
Note: This page is the back of the Technology Profile.

Th
e J
ou
rna
l o
f Te
ch
no
log
y S
tud
ies
40
Figure 2. Conceptual representation of a Technology Profile and Summary Report.
Note: On your profile, a bar of X’s has been printed in the row for each performance standard. Your score is at the center of the bar. The reason for the bar instead of a single X is that a test is not a perfect measure of your knowledge, skills, or ability. You can be reasonably sure that you stand somewhere within the area covered by the bar.

Th
e J
ou
rna
l of Te
ch
no
log
y Stu
die
s
41
Technology Achievement ProfileIn addition to the test battery design, the
notion of a technology profile draws on certain
data representation associated with various sur-
vey and inventory instruments. This aspect of
the profile could serve to compare one’s scores
on the overall battery of tests with the character-
istic scores of others. Scores on the individual
tests of the battery (i.e., subtests) could be
reported in such a way as to provide an overall
portrait of one’s performance or rating. Such
reporting is often done in the form of charts
or derived scores. Two possible models are
described below. It should be noted that Figures
1 and 2 are conceptual representations only; the
test to generate these reports has not been creat-
ed or administered. All the data displayed in the
profiles, therefore, are fictitious.
The first model, the Technology Profile
(Figure 1), provides a graphic display of one’s
performance on 20 different subtests. For our
purposes here, the subtests are based on the 20
content standards set forth in the Standards for
Technological Literacy (ITEA, 2000). This
model promotes the idea of an individual profile
chart and cumulative record. The graphical
depiction also provides a means for comparing
one’s scores to other established scores, for
example, a cumulative overall school or school
district’s performance.
The second model, the Technology Profile
and Summary Report (Figure 2), provides
scoring bands for the 20 content standards
in addition to grouped scores for the five divi-
sions of the content standards: The Nature of
Technology, Technology and Society, Design,
Abilities for a Technological World, and The
Designed World. The scoring bands (bars of Xs)
represent the confidence range for the given test
score. Comparison norms for the individual
school, region, and nation are also included.
One’s achieved level of mastery is incorporated
into the report as well.
Given these two forms of reporting, one
could compare an individual’s score to those
of his or her classmates or to much broader
groups. It would allow for comparisons between
the many subcategories of technology. Such an
approach could provide a multidimensional
portrait of technological literacy.
The Typology ApproachA truly unique approach for a technology
profile could come in the form of a typology
indicator, that is, a depiction of one’s attitudes
toward technology. From a general education
perspective, given the ephemeral nature of tech-
nological knowledge and skills, this approach
could prove more meaningful over time. Such
an instrument would have greater longevity
(i.e., shelf life) and could provide information
that a competency scale would normally over-
look. The profile could be based on survey
and inventory type instruments, for instance,
the personality scales of the Myers-Briggs Type
Indicator (MBTI) and the Keirsey Temperament
Sorter (KTS). Here, one’s knowledge, skills,
and attitudes regarding technology could be
used to sort and categorize individuals accord-
ing to some scale of technological capacity,
interest, or disposition.
The MBTI uses four dichotomy scales to
produce 16 different personality types. Two of
the four scales deal with mental functions (i.e.,
thinking/feeling and sensing/intuition) and two
deal with attitudes (i.e., extraversion/introver-
sion and perceiving/judging). The KTS divides
these 16 types of the MBTI into four major cat-
egories (i.e., artisans, guardians, idealists, and
rationals). Each of the four categories is then
divided into four subcategories, each with its
own descriptor (see Table 1). Using the MBTI
and KTS as models, a technology disposition
profile is discussed in the next section.
Technology Disposition ProfileDeveloping a technology disposition profile
would require the creation of dichotomous
scales for a variety of attitudes and sentiments
toward technology. In keeping with the MBTI
(where the scales follow along mental and atti-
tudinal lines), the scales for a technology dispo-
sition profile would follow the same logic, that
is, mental and attitudinal. Mental functions
could be viewed as the mental dispositions (i.e.,
habits of mind) of certain creators and users of
technology; attitudes could be cast along the
lines of application and consequences (e.g.,
Engineer : Utility :: Artist : Aesthetics or
Environmentalist : Conservation :: Producer :
Consumption). Such scales might resemble
those shown in Table 2.

Th
e J
ou
rna
l o
f Te
ch
no
log
y S
tud
ies
42
Artisans Guardians Idealists Rationals
Promoter (ESTP) Supervisor (ESTJ) Teacher (ENFJ) Fieldmarshal (ENTJ)
Crafter (ISTP) Inspector (ISTJ) Counselor (INFJ) Mastermind (INTJ)
Performer (ESFP) Provider (ESFJ) Champion (ENFP) Inventor (ENTP)
Composer (ISFP) Protector (ISFJ) Healer (INFP) Architect (INTP)
Table 1. Types and Temperaments According to the Myers-Briggs TypeIndicator and Keirsey Temperament Sorter
Note: E = extraversion, I = intuition, F = feeling, J = judging, N = introversion, P = perceiving, S = sensing, T = thinking.
Table 2. Potential Dichotomy Scales for Attitudes Towards Technology
Creators / Users Applications / Consequences
Designers / Producers Products / Costs
Producers / Consumers Services / Benefits
Management / Labor Resources / Environment
Government / Citizenry Political / Economic
DiscussionThe notion of a technology profile, as just
described, raises a number of questions. For
instance, given the 20 content standards devel-
oped by the ITEA, is it conceivable that they
could serve as the constructs for test develop-
ment? If each standard was used for a separate
instrument, 20 individual tests would likely
be viewed as too cumbersome to develop and
administer. Would it be more manageable then
to use ITEA’s five major divisions of the content
standards to guide test development? Would five
tests be adequate? Given the breadth of technol-
ogy, five tests would seem limiting especially if
one’s everyday lived encounters with technology
were to be included. Everyday lived encounters
go beyond what can be expected from the typi-
cal classroom education. There are issues of
learned versus acquired literacy here (Gee,
1989).
A possible compromise might draw on
both the standards and their divisions. A combi-
nation approach may be comprised of 10 sepa-
rate instruments; for example, the test titles
may be as follows: The Nature of Technology,
Technology and Society, Design in Technology,
Medical Technologies, Agricultural and Related
Biotechnologies, Energy and Power Technolo-
gies, Information and Communication
Technologies, Transportation Technologies,
Manufacturing Technologies, and Construction
Technologies.
The above discussion has addressed a few
of the issues surrounding the more traditional
test battery approach; the typology approach
would have similar concerns regarding scope
and size. Given the number of occupational
interest inventories and scales that are available
today, would developing a type sorting scale for
technological dispositions add a meaningful
dimension to our measurement of technological
literacy? What might such a measure of beliefs
and attitudes add to our understanding of tech-
nological literacy?
The typology scale, as conceptualized here,
goes beyond occupational interest and fit. It
seeks to investigate further than one’s conscious

Th
e J
ou
rna
l of Te
ch
no
log
y Stu
die
s
43
knowledge, skills, and motivation. The objective
is to gain an understanding of one’s dispositions
toward technology—those beliefs and attitudes
that have both conscious and unconscious ori-
gins. It can be argued that one of technologies
most serious liabilities as a legitimate domain of
knowledge is its growing invisibility. There are
two dimensions to this invisibility. First, there is
one’s familiarity with technology; that is, as one
interacts with technology on a daily basis, one’s
awareness of that interaction is dimmed. This is
often explained as a level of automaticity, a
state in which one acts without attending much
conscious effort. In this dimension, the more
one interacts with and is dependent upon tech-
nology, the less one realizes and appreciates the
interaction.
The second dimension of technology’s
invisibility is based on technology’s own
evolution. As technology advances, it becomes
more invisible. In today’s computerized world,
we talk about a seamless interface. Essentially,
this means an invisible blending of multiple
components. This invisibility masks the real
complexity of what is transpiring; it simplifies
the technology for the human user. This phe-
nomenon of simplification often results in a
lack of awareness and appreciation of the tech-
nology. The simplification masks many of the
implications or impacts of technology on the
individual, the society, and the environment.
Closing ThoughtsThere remain numerous questions regarding
the viability of a profile approach for technolog-
ical literacy. The test taker’s own mental
endurance (potential boredom, for instance)
must be considered when determining the size
and number of tests in a battery. Like many
other test batteries, the individual tests can be
spread over a period of days, weeks, or perhaps
months. Since each test would address a specif-
ic area of content, boredom and a sense of
repetition could be minimized.
Another consideration must be one of
perception. How will these tests be viewed by
teachers, administrators, parents, or the general
public? In our era of high-stakes testing, adding
another layer of testing would likely be met with
resistance. Consequently, as mentioned earlier,
technology’s misunderstood nature is one of the
greatest challenges when it comes to perception.
At the school level, devoting time out of the
school day to measure technological literacy
will ultimately be gauged against its perceived
value with mathematics, language arts, science,
and other school subjects. Hence, it must be
acknowledged that technology still struggles for
a place in the greater sociology of knowledge.
The notion of a technology profile has
other entanglements with perception as well, for
instance, the negative image of profiling. Could
one’s technology profile be used in a negative
way? Could it be used to unfairly stereotype
individuals? While one must admit that such an
outcome is possible, it is certainly not the intent.
Whether a test is required or elective holds
still other perceptual concerns. The technology
profile is not envisioned as a mandatory test
unless, perhaps, the study of technology
achieves a required status in the total school
curriculum. It should be further understood that
a technology profile may not necessarily be part
of the K–12 schooling experience at all. A pro-
file could have value in both school and non-
school settings, as with many other tests related
to technical or workforce matters.
Perhaps the most difficult challenge for
developing a technology profile, whether for the
test battery approach or the typology approach,
would be the creation of the test items or state-
ments. Validity, and perhaps reliability, will
indeed be a challenge. Even though every
human being encounters technology everyday,
it is the diversity, combined with a certain level
of competency, that is problematic. Here, we
can take a lesson from the field of artificial
intelligence (AI).
At one time, AI held much promise for aid-
ing complex decision making. It was believed
that if we could create a large enough database
and access it with an appropriate algorithm that
AI would be able to answer almost any complex
question. In reality, the diversity of the human
knowledge base and the complexity of human
situations have proven much more difficult than
originally recognized. AI has given us many
very useful problem-solving tools but mostly in

Th
e J
ou
rna
l o
f Te
ch
no
log
y S
tud
ies
very restricted environments (e.g., selected
medical and engineering applications).
The AI lesson for measuring technological
literacy is twofold: (a) context must be limited
and (b) multiple, more narrowly defined tests
produce better results. Validity hinges primarily
on the first point; namely, validity must consider
the background and/or setting of the one being
tested. Thus, it could be argued that with tech-
nology’s diversity across human culture, it
would not seem unreasonable to design a given
test for a particular region of a country or, per-
haps, even for urban versus rural encounters
with technology. While this may seem to further
complicate the issue, its intent is to draw atten-
tion to the matter of application. Technology is
fundamentally an applied subject by nature. Test
items and statements will be valid to the extent
that they measure what one knows about tech-
nology and what one is able to do with technol-
ogy within a given context. To not include these
aspects of technology will yield an incomplete
measure of technological literacy and thus limit
the validity of the overall test.
Finally, the technology profiles conceptual-
ized in this article are intended to promote our
thinking about the assessment of technological
literacy. With the growing emphasis on stan-
dards and their assessment, the technology
profile may provide an alternate means for doc-
umenting one’s achievements and dispositions
toward technology. While such an approach
would surely require an extensive development
effort, it would seem that the complexity and
scope of technological literacy warrants such
an approach.
Dr. Charles W. Gagel is an associate
professor in the Industrial Technology
Education Program at the University of
Idaho. He is a member of Eta Field Chapter
of Epsilon Pi Tau.
44
References
The American Heritage electronic dictionary (3rd ed., Version 3.6) [Computer software]. (1992). Cambridge, MA: Softkey International.
Ealy, M. (1999). Technology and internet assessment. Clearwater, FL: H&H Publishing.
Gee, J. P. (1989). What is literacy? Journal of Education, 171(1), 18-25.
International Technology Education Association. (2000). Standards for technological literacy: Content for the study of technology. Reston, VA: Author.
International Technology Education Association. (2003). Advancing excellence in technological literacy: Student assessment, professional development, and program standards. Reston, VA: Author.
Pearson, G., & Young, A. T. (2002, September). Technically speaking: Why all Americans need to know more about technology. The Technology Teacher, 62, 8-12.
Author Note
Figures 1 and 2 in this article are based on the reports used by the Iowa Tests of Basic Skills and the Comprehensive Tests of Basic Skills.

Th
e J
ou
rna
l of Te
ch
no
log
y Stu
die
s
45
Effective quality control is easily recog-nized as a key component in successful manu-facturing operations. Companies place a highpriority on establishing a strong quality manage-ment team and sound quality procedures, yetmany employers find newly hired technicalgraduates unprepared to apply quality controlconcepts learned in the classroom. Companiesrealize that the success of their quality programhas a substantial influence on their bottom line.Quality program effectiveness is directly relatedto profitability through its impact on productivi-ty, product cost, customer satisfaction, productimage, and, ultimately, attainable product price.Considerable resources are spent on either train-ing existing employees or hiring additional oneswho are well versed in quality control princi-ples.
Educators in technical programs share inthis concern for developing well-trained gradu-ates who are competent in a variety of qualityrelated topics. Technology-based programs typi-cally include one or two courses focused onquality topics. As in industry, educators spend agreat deal of resources and effort developingappropriate quality related courses, faculty, andfacilities.
The purpose of this study was to investigatethe perceptions of both industry professionalsand faculty members of technology-based pro-grams concerning the preparedness of recentgraduates as they began a quality related posi-tion. To gain this information, surveys wereadministered among managers and technicalleaders in industry and compared with surveysof faculty members from four-year industrialtechnology and engineering technology pro-grams. Recent graduates were evaluated withregard to both theoretical knowledge andapplied skills. By analyzing survey results,recent literature, and in-depth conversationswith industry professionals, recommendationsare made for improving quality control curriculaand better serving industry needs.
BackgroundQuality control on the plant floor is prac-
ticed much differently than it is presented in the
classroom, with numerous opportunities forinaccurate data collection and unclear conclu-sions (Schenck, 1993). Experienced quality pro-fessionals often find that newly hired graduateshave difficulty with issues such as gaging, datainterpretation, and conforming to a productionand cost-oriented environment. While many ofthese issues are a matter of experience, bothindustry professionals and the related literatureindicated that applied quality concepts shouldbe added to basic quality control curricula at thecollege level. Every effort should be made tostrengthen students’ skills by combining theoret-ical knowledge with practical situations(Kemenade & Garre, 2000).
Successfully applying quality control con-cepts on the shop floor requires the ability toovercome common problems such as incompletedata, inaccurate measurements, and non-normaldistributions. Dealing with these types of prob-lems can be challenging for those who havebeen exposed to rigid statistical standards forquality analysis in the classroom. Wheeler andChambers (1992) indicated that many tech-niques can be used even when less than perfectconditions such as non-normal distributions andunstable processes exist. In addition, an under-standing of the ways in which the process andproduct impact the analysis of quality data iscritical in making correct judgments (T. Dorsey,personal communication, June 6, 2003). Famili-arity with basic data collection procedures andprotocols, along with an understanding of quali-ty standards and reference material, is alsoexpected. These requirements may seem over-whelming for those in entry-level positions, butexposure to a few key concepts before gradua-tion can make the transition much easier.Demanding production schedules and cost con-straints can be additional complications for thequality professional to overcome. The key tosuccess is an ability to understand and addressthese problems without abandoning basic quali-ty theory and standards.
Previous WorkPrevious studies have investigated methods
for improving quality control skills of employ-ees. Rungtusanatham (2001) surveyed
A Comparison of Industrial and Academic Perceptionsof Quality Control EducationR. Neal Callahan and Shawn D. Strong

production personnel to assess the impact ofquality control training. His findings indicatedan improvement in motivation and job perform-ance as quality control skills increased. Im-proved quality control practices by employeesalso have an impact on customer satisfactionaccording to Nilsson, Johnson, and Gustafsson(2001). Suleiman and Yourstone (1998) investi-gated the effects of training, performance evalu-ation, and rewards on the successful implemen-tation of a quality management program.Developing a sense of value for quality amongworkers is of particular importance. Deming(1994) concluded that external monitoring orbonuses are not the basis for an effective qualitysystem. Instilling a value of quality for its ownsake based on the pride and self-esteem of theworkers results in long-term success. A surveyconducted by Rao, Raghunathan, and Solis(1997) indicated that quality assurance perform-ance was affected by length of quality experi-ence in organizations.
Folkestad, Senior, and DeMiranda (2002)explored service learning as a method for devel-oping students’ social attitude toward workalong with strengthening technical literacy. Thismethod does hold some promise for strengthen-ing practical skills by increasing exposure toreal projects with real problems. However, cau-tion should be exercised to assure that the tech-nical content of the project is demandingenough for the particular course of which it is apart. Focusing on social development in a tech-nical course could reduce exposure to and com-prehension of specific skills that will be neededlater. Plaza (2004) proposed an integrativeapproach to technology education in which corecourses are developed around a topic involvingmany disciplines and many instructors. Thisapproach could be successful at the introductoryor capstone levels, but could also trend towardan excessive number of survey courses thatwould reduce the focus and depth of the pro-gram.
Bhote (1991) concluded that 90% of U.S.industry is not successful in solving chronicquality problems. He promoted the teaching ofvery powerful, but simple, statistical tools fordealing with persistent problems.
The previous studies have indicated thatquality control training can have a positiveimpact on employee performance. With agrounding in these findings, this study sought to
determine specific quality skills employersexpect in entry-level professionals. A compari-son of what is expected by employers versuswhat is emphasized by academia was theninvestigated.
Survey MethodologyBoth industry professionals and college fac-
ulty members were surveyed to gauge and com-pare expectations concerning quality controleducation. A questionnaire survey instrumentwas developed and a pilot test was conductedwith colleagues and industry professionals whohad significant roles in quality control. The pilottest was conducted to check the validity of thequestionnaire, identify and eliminate any ambi-guity, and make appropriate changes identifiedby respondents’ suggestions. Recommendationsfrom the pilot test were incorporated into thefinal version of the survey and included issuesconcerning specific topics covered, wording ofcertain questions, and the form of the surveyitself (see Figure 1 for the final version of thesurvey questionnaire).
Two populations were targeted for the sur-vey. One population consisted of a database ofindustry professionals maintained by the collegedepartment conducting the survey. This databasewas made up of production and quality assur-ance professionals who maintained contact withthe department and had involvement in applyingquality control concepts in the national or inter-national manufacturing environment. A secondpopulation consisted of college faculty whowere members of the engineering technologylistserv, which included technology-based facul-ty across the United States. A qualifying state-ment with the survey narrowed this populationto faculty of four-year industrial technology orengineering technology degree-granting institu-tions who were involved in teaching qualitycontrol. All surveys were sent via e-mail.
The survey employed twelve 5-point Likertscale questions and one rank order type ques-tion. The 5-point Likert scale design consistedof: (1) strongly disagree, (2) disagree, (3) unde-cided, (4) agree, and (5) strongly agree. Theachievement of new technology graduates wasevaluated with respect to six knowledge areas inquality control: basic statistics, statisticalprocess control, measuring equipment, non-nor-mal distributions, gage control, and documenta-tion standards. Each knowledge area was evalu-ated using a paired format consisting of a
Th
e J
ou
rna
l o
f Te
ch
no
log
y S
tud
ies
46

Th
e J
ou
rna
l of Te
ch
no
log
y Stu
die
s
47
StronglyAgree Agree Undecided Disagree
StronglyDisagree
Graduates have adequate knowledge of basic statistical theory
Graduates have adequate skills inapplying basic statistical concepts
Graduates have adequate knowledge of statistical processcontrol theory
Graduates have adequate skills in applying statistical process control concepts
Graduates have adequate knowledge of basic measuringequipment
Graduates have adequate skills inusing basic measuring equipment
Graduates have adequate knowledge of non-normal distributions
Graduates have adequate skills inapplying non-normal distributionsto analyze data
Graduates have adequate knowledge of gage control concepts
Graduates have adequate skills inapplying gage control concepts
Graduates have adequate knowledge of data collection and documentation standards
Graduates have adequate skills in applying data collection anddocumentation standards
Figure 1. Survey questionnaire.
The following survey questions relate to recent college graduates from four-year Industrial Technology or Engineering Technology programs entering the industrial workforce. Assume that the graduates will be significantly involved with the quality control function in their first assignment.
Do recent graduates from technology based programs possess the following knowledge and skills? Check one of the five boxes for each knowledge or skill listed.
Of the following quality related areas, rank the top three items (1, 2, 3; 1 = highest priority) that you feel mostneed additional attention in technology based programs. If an item is not listed please write it in the spaceprovided. Only select the top three items – leave all others blank.
___Statistical Process Control ___Gage Control ___Design of Experiments
___Basic Statistics ___Capability Studies ___Measuring Equipment
___Data Collection Standards ___Economic Aspects of Quality ___Hypothesis Testing
___Non-Normal Distributions ___Rational Subgrouping ___Sampling
___ ____________________ (list an additional item if not given)

Th
e J
ou
rna
l o
f Te
ch
no
log
y S
tud
ies
statement relating to theory and a second state-ment relating to applied skill.
The rank-order portion of the survey listed12 items for the participants to consider. Ablank was provided that allowed an additionalitem to be added if it was not already listed.Participants were asked to rank the top threequality control items (1, 2, 3; 1 = highest priori-ty) that they felt most needed additional atten-tion in technology-based programs. This portionof the survey was evaluated by applying a num-ber score to the ranked responses. For claritythis priority scale was then inverted. Qualitycontrol items rated with the highest prioritywere assigned a score of 3 followed by 2 and 1 for lower priority rankings. In this way graphical priority ratings may be more easilyinterpreted.
A total of 28 useable questionnaires out of64 were returned by industry professionals for aresponse rate of 44%. Three industry question-naires were discarded due to incomplete re-sponses. A total of 32 faculty members returnedsurveys from an original population of approxi-mately 175 for a response rate of 18%. One fac-ulty questionnaire was discarded due to improp-er ranking of items in the rank order portion.The faculty response rate was approximatedbased on the engineering technology listservmembership of 1,396 for four-year colleges. Aspot check of five institutions revealed thatabout 1 out of 8 faculty members from technol-
ogy-based programs were involved in teachingquality control courses. This reduced the targetpopulation to approximately 175.
The Likert portion of the survey stronglyindicated the rejection of the null hypothesisassociated with the means test indicating thesample sizes were sufficient to identify differ-ences between the two groups (see surveyresults). The rank order portion of the surveyrevealed that approximately half of the respon-dents chose the top three ranked items. Accord-ing to Cochran (1977), a minimum sample sizeof about 30 is needed to ensure validity if thepopulation proportion is approximately 0.50.Based on the above guidelines, we would classi-fy any conclusions drawn from the study to becautiously valid.
Survey ResultsThe survey was intended to evaluate the
abilities of recent graduates from two differentperspectives: industry and academia. The firstpart of the survey consisted of 12 statementsthat were rated according to the Likert scalepreviously described. In comparing the two sur-vey groups, we examined which knowledgeareas exhibited significantly different responsesbetween industry professionals and college fac-ulty. To illustrate this comparison, data fromboth groups were summarized in a single bargraph and listed in descending order of differen-tial magnitude (see Figure 2).
48
Figure 2. Combined bar chart for knowledge area ratings.

Th
e J
ou
rna
l of Te
ch
no
log
y Stu
die
s
The greatest difference between ratingsscores occurred in the applying SPC category. Alarge difference in ratings also occurred in eval-uating knowledge of SPC. This is surprisingconsidering the attention and effort expended onthis topic by both industry and academia. Otherareas that showed a large difference between thetwo evaluation groups include knowledge anduse of equipment, statistical theory, and apply-ing basic statistics. The overall evaluation ofrecent graduates’ knowledge and abilities isnoticeably lower from the industry professionalsaveraging 2.97 compared to the college facultygroup which assigned an average score of 3.41.In order to determine whether the differences in
ratings between industry and academia were sta-tistically significant, a means test (t test) wasperformed for each knowledge area. The resultsof these tests are shown in Table 1.
Table 1 indicates a statistically significantdifference between industry and academic rat-ings for SPC theory and application, equipmentknowledge and use, and applying basic statis-tics. In all of these categories the faculty ratingswere significantly higher than the industry rat-ings.
The rank order portion of the survey wasdesigned to identify the most crucial topics that
49
Knowledge AreaMeans
Industry Faculty t Value p Value
Applying SPC 2.59 3.59 -4.16 .000*
Use of equipment 3.04 3.72 -2.88 .006*
SPC theory 3.04 3.69 -2.51 .015*
Applying basic statistics 2.96 3.55 -2.13 .037*
Equipment knowledge 3.39 3.91 -2.32 .024*
Basic statistical theory 3.36 3.81 -1.82 .074
Applying standards—data collection and documentation
3.11 3.53 -1.63 .111
Standards knowledge—data collection and documentation
3.25 3.63 -1.41 .166
Applying gage control concepts 2.79 3.16 -1.47 .148
Gage control theory 2.93 3.25 -1.24 .222
Applying non-normal distribution theory
2.58 2.31 1.08 .287
Non-normal distribution theory 2.61 2.72 -0.43 .669
Note: t test of mean differences = 0 (vs. = 0).
*Meets significance level with a = 0.05.
Table 1. Means Tests for Theory Versus Academic Ratings

Th
e J
ou
rna
l o
f Te
ch
no
log
y S
tud
ies
50
should receive additional attention in technolo-gy-based programs. A bar chart was constructedto illustrate the difference in responses forindustry professionals compared to college fac-ulty. The chart shown in Figure 3 lists responsedifferences in descending order of magnitudefor all rank order data. The scoring for areas ofstudy needing further attention was noticeablydifferent between industry and faculty respons-es. Industry scored capability studies and SPChighest (most in need of further attention) whilefaculty members indicated SPC and design ofexperiments (DOE) should receive the highestpriority. Both groups listed basic statisticsamong the top three items. Due to the scoringmethod and an unequal number of participantsin the two groups, the raw score was convertedto a percentage of the total possible score foreach group. A means test was not feasible forthe rank order portion of the results due to thecomplicated scoring method.
Analysis of Survey ResultsThe fact that recent graduates’ overall skills
in quality control were rated significantly lowerby industrial professionals than by faculty mem-bers may indicate a disconnect between the twogroups. Increased interaction and communica-tion between the groups could be helpful inbridging this gap. The greatest differential wasassigned to applying SPC skills. SPC is taughtas a part of most technical programs and hasbeen recognized as a key quality concept fordecades. With great focus on this topic, it istroubling that such a gap exists between indus-try and faculty perceptions. Applying knowl-edge to industrial situations requires judgment
and experience that students often do notreceive in the classroom. Although this reality isinevitable to some degree, additional classroomprojects and laboratory exercises could helpaddress the problem. Perceptions concerninggraduates’ understanding of SPC theory, knowl-edge of common equipment, ability to applybasic statistics, and ability to use equipment allindicated a statistically significant differencebetween industry and faculty ratings. Most ofthese abilities require the application and prac-tice of theory. The survey results indicate thatfaculty members may need to focus much moreon developing the practical, applied skills ofstudents in order to meet industry expectations.
The rank order portion of the survey identi-fied differences in ratings concerning areas ofstudy needing further attention. Both industryand faculty strongly indicated that SPC andbasic statistics should receive more attention intechnology-based programs. Industry profes-sionals identified capability studies as the mostcrucial area for additional coverage whereas fac-ulty members’ evaluation of this topic was muchlower. The ability to perform and understandcapability studies is a critical part of most quali-ty control functions. Industry professionalsseemed to indicate that specific, practical skillssuch as this are very valuable and need muchmore attention in the academic environment.
Faculty members indicated that DOEshould receive much more attention in academicprograms whereas industry professionals ratedthis area much lower. DOE has been touted, andused to a lesser extent, in industry for many
Figure 3. Combined chart for areas needing further attention.

Th
e J
ou
rna
l of Te
ch
no
log
y Stu
die
s
years. Being a more complex area of study, itrequires a strong statistical background to befully utilized. Many in industry who have takenDOE training may still lack the statistical skillsto apply it effectively. This may explain thelower ranking assigned by industry; however,the importance of DOE has been clearly estab-lished. Montgomery (2001) and Roy (1990)have demonstrated the practical value of apply-ing DOE in industry using various factorialtechniques.
Analysis of Industry ConcernsThe results of the survey reveal industry
concerns and needs that should be furtherexplored. If academic programs are to beimproved, specific experiences and abilities thatare lacking must be identified and integratedinto industrial technology and engineering tech-nology curricula. To address these issues, in-depth discussions with industry professionalswere conducted. The issues identified duringthese discussions were very similar to thosehighlighted by the survey. In addition, a reviewof recent literature and teaching strategies wasconducted. The conclusions drawn from theseefforts follow.
Capability studies: The survey identifiedcapability studies as a major area for improve-ment. An understanding of how to conduct andinterpret these studies is a crucial basic skill inindustry. Students are often exposed to the for-mulas and methods for calculating Cp and Cpk
without gaining a clear understanding of themeaning and importance of the numbers beinggenerated. Exposure to one-sided specifications,non-normal distributions from specific process-es, and data collection methods as a part ofprocess capability studies can help strengthenstudents’ skills (T. Dorsey, personal communica-tion, June 6, 2003).
Statistical process control: Both faculty andindustry surveys indicated that SPC shouldreceive more attention in technology-based pro-grams. Most quality control courses include astudy of SPC involving theory and textbookproblem solving. This level of exposure may notrequire enough practice or development ofapplied skills as the industry survey indicated.Addressing applied skills in SPC provides anexcellent opportunity for faculty members andstudents to interact with local industry. Studentprojects that involve interaction with local man-ufacturers and data collection from real process-
es can greatly increase applied skills (K.Hubbard, personal communication, March 10,2004).
Relating process and product to quality:Before any quality control study begins, a clearunderstanding should exist of the process andproduct from which the data are to be drawn.Most quality control training in the classroomincludes statistical analysis, control charting,and basic procedures without emphasizing howcharacteristics of the particular process andproduct can influence the results. Without mak-ing this important link, opportunities for errorand misinterpretation are endless. Errors involv-ing incorrect subgrouping of data are particular-ly common in industry (Wise & Fair, 2001).Non-normal distributions are common amongmany processes such as the wear cycle associat-ed with drilling processes (Oberg, Jones,Horton, & Fyffell, 2000). Exposing students torealistic process characteristics such as thisexample can strengthen their skills as they begintheir careers (T. Dorsey, personal communica-tion, June 6, 2003).
Gage repeatability and reproducibility:When collecting data for analysis, assuring thataccurate gages and gaging methods are used is acritical first step. Incorrect use of commonmeasuring devices such as calipers and microm-eters can be a particular problem (Hewson,O’Sullivan, & Stenning, 1996). Measuringequipment and processes must be well con-trolled and suited for the particular use in orderto assure valid data collection (Little, 2001).Students who receive little or no practical expe-rience with measuring devices have difficulty inunderstanding the seriousness of this issue.Given that inaccurate gages and gaging methodsare common problems in industry, a strongargument can be made for strengthening gagecontrol coverage at the college level (N.Anderson, personal communication, June 4,2003). Hands-on projects involving gagerepeatability and reproducibility (R&R) studiesand gage control allow students to integrateknowledge with practical situations, strengthen-ing needed skills in the process (Kemenade &Garre, 2000).
Standards for data collection and sampling:Complying with appropriate sampling proce-dures and documentation practices is critical inmost quality control studies. The samplingmethod should contain enough data to conduct a
51

Th
e J
ou
rna
l o
f Te
ch
no
log
y S
tud
ies
52
complete analysis without the collection ofunneeded information that distracts when draw-ing conclusions (Carey, 2002). An introductionto quality standards and procedures can helpbetter prepare students to address issues such ascorrect sample size and sample identification,appropriate sampling procedure, and documen-tation requirements (N. Anderson, personalcommunication, June 4, 2003).
RecommendationsBased on the survey results, discussions
with industry professionals, and literaturereview, the following recommendations aremade concerning the improvement of qualitycontrol education:
• Improve interaction between industry andacademia. The survey indicated a signifi-cant difference in responses from indus-trial professionals as compared to thosefrom faculty members. Improved commu-nication and exchange of ideas betweenthe two groups is needed. By implement-ing an industrial advisory board, technol-ogy-based programs can take an impor-tant step toward this goal. Advisoryboards made up of local and regionalindustry leaders can provide invaluableinformation concerning what is neededand expected of graduating students. Thisforum also allows faculty members tointroduce ideas and methods that are notwell known to industry. Other contactswith industry through student internshipsand funded research can be quite helpfulin keeping the communication lines open.Industry interaction with student organi-zations through plant tours, guest speak-ers, and assistance with student projectscan also prove beneficial.
• Increase coverage of statistical processcontrol and capability studies. The surveystrongly indicated that both industry andfaculty recommend additional coverageof SPC and process capability analysis.Industry evaluation of recent graduates’applied SPC skills was particularly low.To compensate for this lack of appliedskills, additional theory coverage shouldbe combined with a “hands-on” laborato-ry component requiring process monitor-ing and interpretation. Realistic problemsand complications associated with SPCand process capability that are likely to
be experienced in industry should be dis-cussed and included in assignments.
• Emphasize the combination of practicalapplication with theory. The industry sur-vey indicated significantly lower ratingsfor equipment knowledge, equipment use,applying basic statistics, and applyingSPC as compared to the faculty survey.These applied skills appear to be lackingas graduates begin their careers. Thisshortfall can be improved by furtheremphasizing applied skills and practicalapplication in combination with theory.Examples presented earlier that can leadto the development of applied skillsinclude dealing with complications suchas one-sided specifications, using com-mon equipment to measure and collectdata, conducting capability studies, SPCmonitoring, performing gage R&R stud-ies using real parts and data, and locatingand using data collection and samplingstandards. These few examples are repre-sentative of numerous opportunities forgaining practice and experience in apply-ing theory. Many of these activities canbe implemented in the classroom. If addi-tional laboratory time is needed, it shouldbe added into the curriculum.
• Promote the introduction of new methodsand techniques in industry. New tech-niques and methods of analysis are oftendeveloped and perfected in academia, notindustry. More complex methods ofanalysis and process improvement maynot easily be introduced into industry.Although DOE techniques have beenused for many years, they are still valuedmuch more in academia than in industryaccording to the survey. These moreadvanced methods may require additionalsupport and interaction with industryfrom college faculty, and may be furtherintroduced by supplying graduates withsignificant training in these areas. Com-ments and opinions should not only flowdown from industry to academia, but alsoflow up as education develops new orcomplex ideas and methods that can ben-efit industry.
Summary Industry respondents evaluated recent grad-
uates’ knowledge and abilities in quality control

Th
e J
ou
rna
l of Te
ch
no
log
y Stu
die
s
53
significantly lower than the same evaluationprovided by college faculty. Industry profession-als and college faculty have different opinionsconcerning which areas of study should be fur-ther emphasized to improve quality control edu-cation. By improving the dialogue and interac-tion between industry and academia and imple-menting a more applied education, the qualitycontrol component of industrial technology andengineering technology programs can be greatlystrengthened.
Future ResearchAn important finding in this study was the
disconnect between industry and academia con-cerning which quality control skills most needfurther emphasis in technology-based degrees.A comparison of student skills after completing
a more traditional lecture-based course versus amore applied course as suggested by this studywould be of interest. This information couldhelp determine the potential for improving qual-ity control skills by revising course content andstructure.
Dr. Richard N. Callahan is an assistantprofessor in the Department of IndustrialManagement at Southwest Missouri StateUniversity.
Dr. Shawn D. Strong is an associate professor and head of the Department ofIndustrial Management at Southwest MissouriState University. He is a member of OmegaChapter of Epsilon Pi Tau.
References
Bhote, K. R. (1991). World class quality: Using design of experiments to make it happen. New York: AMACOM.
Carey, R. (2002, October). Constructing powerful control charts. Journal of Ambulatory Care Management, 25, 64-70.
Cochran, W. (1977). Sampling techniques (3rd ed.). New York: Wiley.
Deming, W. (1994). The new economics for industry, government, education (2nd ed.).Cambridge, MA: MIT Center for Advanced Engineering Study.
Folkestad, J., Senior, B., & DeMiranda, M. (2002). The implications of service-learning for technology studies. The Journal of Technology Studies, 28(1), 52-58.
Hewson, C., O’Sullivan, P., & Stenning, K. (1996). Training needs associated with statistical process control. Training for Quality, 4(4), 32-36.
Kemenade, E., & Garre, P. (2000, September). Teach what you preach. Quality Progress, 33, 33-39.
Little, T. (2001, February). 10 requirements for effective process control: A case study. Quality Progress, 34, 46-52.
Oberg, E., Jones, F. D., Horton, H. L., & Ryffell, H. H. (2000). Machinery’s handbook (26th ed.). New York: Industrial Press.
Montgomery, D. C. (2001). Design and analysis of experiments (5th ed.). New York: Wiley.
Nilsson, L., Johnson, M., & Gustafsson, A. (2001, October). The impact of quality practices on customer satisfaction and business results: Product versus service organizations. Journal of Quality Management, 6, 5-27.
Plaza, O. (2004). Technology education versus liberal arts education. The Journal of Technology Studies, 30(1), 16-19.
Rao, S., Raghunathan, S., & Solis, L. (1997). A comparative study of quality practices and results in India, China, and Mexico. Journal of Quality Management, 2(2), 235-250.
Roy, R. K. (1990). A primer on the Taguchi method. New York: Von Nostrand Reinhold.
Rungtusanatham, M. (2001, July). Beyond improved quality: The motivational effects of statistical process control. Journal of Operations Management, 19, 653-673.
Schenck, J. (1993, July). Quality assurance education: The sabbatical. Quality Progress, 26, 69-71.
Th
e J
ou
rna
l o
f Te
ch
no
log
y S
tud
ies
IntroductionThis article discusses the relationship
among an individual’s cognitive style, attitude to
learning, and his or her achievement in the con-
text of computer aided learning (CAL). The
results of a small-scale study involving 32 stu-
dents (18 male and 14 female) studying their
first electronics module during an Initial Teacher
Training (ITT) Design and Technology degree
program at a university in England are reported.
Data concerning cognitive style, gender, attitude
to CAL, appropriate prior knowledge, and the
test results from a unit of work that used a CAL
package as the main teaching strategy are ana-
lyzed and the relationship between selected vari-
ables are discussed. Conclusions pertinent to the
students in this study are then drawn.
BackgroundIn all sectors of higher education (HE),
there has been an increasing professional con-
cern with the processes of teaching, learning,
and assessment and their management, at a time
when economic and technological changes have
had a major impact (Dillon, 1998; Somekh,
1998). With the rapid growth in the power and
functionality of modern computing and network
systems, HE has been encouraged both at a
national level and by locally driven initiatives to
embrace technology-assisted teaching and learn-
ing strategies (Boucher, 1998). In the context of
this article, the technological changes referred to
by Dillon (1998) are centered on the developing
use of CAL packages to meet both lecturer and
student needs within electronics modules in an
ITT Design and Technology degree program.
The broad objectives for developing tech-
nology-assisted teaching and learning were first
set out in 1996 after the Higher Education
Funding Council for England (HEFCE) commis-
sioned a six-month research study of information
technology-assisted teaching and learning
(ITATL) in HE. Primarily these objectives were
to make teaching and learning more productive
and efficient, to enhance the learning experience
of students, and to widen access to HE through
its delivery in new and different locations
(Tearle, Davis, & Birbeck, 1998).
During recent years, a great variety of edu-
cational software has been designed that would
support students’ learning. Pedagogical advan-
tages and disadvantages of such materials have
been well researched (Alexander, 1995; Boucher,
Davis, Dillon, Hobbs, & Tearle, 1997; Dillon,
1998; Ford, 1999; Lee, 1999; National Council
for Education Technology [NCET], 2000; Pillay,
54
Suleiman K., & Yourstone, S. (1998). Training, performance evaluation, rewards, and TQM implementation success. Journal of Quality Management, 3(1), 25-38.
Wise, S., & Fair, D. (2001, November). New approaches to SPC. Quality, 40, 34-40.
Wheeler, D. J., & Chambers, D. S. (1992). Understanding statistical process control (2nd ed.). Knoxville, TN: SPC Press.
Student Behaviors in the Context of Computer Aided Learning in Design and Technology Teacher TrainingE. Stephanie Atkinson

Th
e J
ou
rna
l of Te
ch
no
log
y Stu
die
s
1998; Steurer, 1992). Benefits have been report-
ed in terms of individualized learning that can be
self-paced, self-accessed, asynchronous, synchro-
nous, provide nonsequential based delivery,
include positive motivational interactive features,
while affording access to more accurate apprais-
al and documentation of learners’ progress.
Research has indicated that the hierarchical link-
ing arrangements that facilitate browsing can
also act as an aid to learning. The merging of
formally separate media in a manner that
allowed associations or links between the various
elements (Ebersole, 1997) and under certain cir-
cumstances the modification of the form of the
material being presented, by the learner them-
selves, have also been cited as positive features
of CAL resources (Pillay, 1998; Steuer, 1992).
At a time of considerable expansion in HE, the
hope that Information and Communication
Technology (ICT) could deliver a more cost
effective teaching and learning environment has
also played a significant role in its development
(Somekh, 1998). However, there have been
expectations without due regard to the difficul-
ties that are an inevitable part of any technologi-
cal innovation in education. Disadvantages have
been cited (Ferris, 1999; Mak, 1995) in terms of
the teachers’ deficiency in understanding the dif-
ferences between the pedagogy and philosophy
underpinning the use of CAL and traditional
learning materials in a university environment
(Jones, 2001). There is also the lack of training
for lecturers to exploit its potential (Oliver,
1994), and the need for appropriate technical
support. In the context of the CAL materials
themselves, many of the interfaces employed at
present have been confusing and opaque to many
users. For example, the absence of personal con-
tact and clarity of message due to the nonexis-
tence of physical presence, voice intonation, ges-
ture, and other tacit cues (Harasim, 1989;
Moore, 1992), together with the difficulty in
conveying humor, irony, and subtle nuances of
meaning (Feenburg, 1989), have all been shown
to be disadvantageous for certain types of learn-
ers. It has also been shown that the nonlinear
organization of information highlighted by many
as an advantage has proved to be a distinct dis-
advantage for other users (Edwards & Hardman,
1989). Gygi (1990) referred to a lack of “dis-
course cues,” whereas Shum (1990) talked of the
need to reduce cognitive overload for the user by
designing better cognitive maps that would aid
the user’s navigation through the CAL materials.
Ebersole (1997) described designing effec-
tive interactive media as a daunting proposition.
He explained that in addition to the collection
and organization of useful content the designer
of CAL materials must create a user interface
that facilitates access to the content. He and oth-
ers (Lord, 1998; Pillary, 1998; Recker, 1995) all
believed that learning materials should be crafted
with careful attention to the mental processes
and learning style that the user was likely to
employ. Learners have been seen to waste valu-
able time navigating an erratic course through
the complex structure of the materials provided
for them often because they have been unable to
acquire the original author’s structure and map it
on to their own learning style (Alexander, 1995;
Shum, 1990). It would therefore seem important
that all learning materials, whether they are for
traditional or CAL environments, should be cog-
nitively well designed.
Just as an ergonomically designed chair is
well adapted to the physical requirements of
its user, so a cognitively ergonomic learning
resource is well adapted to the learning
requirements of its user. (Ford, 1999, p. 188)
The terms cognitive style and learning style
have been widely used by educational theorists
for the past 60 years. Terminology has varied
from writer to writer (Curry, 1983; Dunn &
Dunn, 1993; Riding & Cheema, 1991). On some
occasions the terms have been used interchange-
ably, while at other times they have been afford-
ed separate and distinct definitions (Cassidy,
2003). However, many (Biggs & Moore, 1993;
Goldstein & Blackman, 1978; Riding & Pearson,
1994; Tennant, 1988; Witkin, Oltman, Raskin, &
Karp, 1971) have agreed that cognitive style is a
distinct and consistent way for an individual to
encode, store, and perform, and one that is main-
ly independent of intelligence, whereas learning
style “is adopted to reflect a concern with the
application of cognitive style in a learning situa-
tion” (Cassidy, 2003, p. 81).
As the relevant research base on cognitive
style has grown, so has the number of terms
55

Th
e J
ou
rna
l o
f Te
ch
no
log
y S
tud
ies
used to describe cognitive style groupings.
Riding and Rayner’s (1998) analysis of the mul-
tiplicity of constructs concluded that the terms
could all be grouped into two principal cognitive
styles and a number of learning strategies. They
referred to these cognitive style dimensions as a
“Wholist-Analytic Cognitive Style Family” and a
“Verbalizer-Imager Cognitive Style Family.” The
Wholist-Analytic style they defined as the ten-
dency for individuals to process information in
wholes or in parts, whereas the Verbalizer-
Imager style they defined as the tendency for
individuals to represent information during
thinking verbally or pictorially. They believed
that these dimensions were totally independent
of one another.
Many notable investigations have been car-
ried out concerning the relationship between
cognitive style and ability. Witkin et al. (1977)
differentiated between cognitive style and ability
by emphasizing the bi-polar nature of cognitive
styles, unlike intelligence and other abilities.
They suggested that each pole of cognitive style
had adaptive value under specified circum-
stances, whereas having more of an attribute
such as intelligence was better than having less
of it. This difference was well defined by Riding
(1996). He explained that the basic distinction
between cognitive style and ability was that per-
formance on all tasks would improve as ability
increased, whereas the effect of style on per-
formance for an individual would either be posi-
tive or negative depending upon the nature of the
task and the way in which it was presented to the
learner.
In traditional teacher-led, paper-based envi-
ronments, learning in matched conditions
(instructional style matched to the student’s pre-
ferred learning style) has been demonstrated to
be significantly more effective than learning in
mismatched conditions in many instances (Ford,
1999; Pask & Scott, 1972). Research findings
using a sample of school children indicated that
this was especially the case for young pupils and
those of low ability. Conversely, more able
pupils, who were given the opportunity to use
mismatched learning materials at times, were
shown to develop learning strategies that coped
with a wider range of materials and experiences
on future occasions (Riding & Rayner, 1999).
In the context of CAL environments, Ford
(1999) suggested that it would be tempting to
think that the potential navigational freedom
inherent in such systems meant that mismatched
education was a thing of the past, although he
believed that the potential for navigational free-
dom was frequently not recognized by the learn-
er nor were they always able, or willing, to use
such freedom optimally, or even effectively, in
relation to their preferred style of information
processing.
Traditionally, learning materials in a univer-
sity environment have been presented mainly in
a text format. However, with the shift from an
elite to a mass higher education system (Rumble,
1998) it has become increasingly important that
materials are provided in a variety of forms that
are able to match individual student learning
style preferences. CAL packages, if designed to
do so, have the potential to provide materials that
can meet this need and be more sensitive to style
differences.
The CAL package “units of learning” under
consideration in this article were part of a suite
of mixed media, blended learning materials
developed over the past 25 years by LJ Technical
Systems (www.ljgroup.com). These materials
have been successfully and extensively used in
schools and further education colleges across
much of the world, particularly in America, the
Middle East, and the United Kingdom (UK),
although this was the first time a university in
the UK had used these materials as part of one
of its degree programs. The CAL package used
in this instance had four primary objectives:
• Understanding electrical quantities and
the use of instrumentation for their meas-
urement.
• Identification of individual components
and measurement of their characteristics.
• Synthesis of simple circuit building
blocks based on components investigated.
• Location and identification of computer
inserted “faults” within the investigated
circuits.
The software was linked to a dedicated elec-
tronics base unit, and various subcircuit modules
were connected to this for the investigations. All
connections were by removable wires and link
56

Th
e J
ou
rna
l of Te
ch
no
log
y Stu
die
s
57
pins, so no circuit construction skills were
required. The tasks were presented in the form of
an “on screen” manual but copies of this could
be printed and retained by the students as a log-
book of activities. The answers were entered in a
separate window and took a variety of forms.
These were predominately multiple choice, or
yes/no question formats, but in some instances
numeric answers were required. In the case of
calculations, the system required the exact value
for a mark to be awarded, but when entering
measured quantities, any value within a certain
range would be accepted because of component
and instrumentation tolerances. Within a partic-
ular group of questions, the student was free to
go back and alter an answer as often as neces-
sary. However, students were unable to proceed
to the next group until that section was submit-
ted and marks allocated. Failure to achieve a
certain minimum score would also prevent pro-
gression to the next stage and tutor intervention
was then required.
The educational theorist would hope that the
fundamental purpose of assessment is to give
feedback to learners and thereby enrich their
learning experience. In the past the culture and
traditions of universities have been deeply rooted
in enriching learning. However, recently there
have been indications that the purpose of assess-
ment in HE has changed. Factors such as gov-
ernment interventions, the massive increase in
the numbers of students entering higher educa-
tion, the change in the character and needs of the
student population, the worsening staff-student
ratios, the requirement for accountability, and
clarity in the relationship between learning
objectives, learning outcomes, and assessment
criteria have all led to the development of a pre-
dominantly categorizing assessment culture
within many universities.
Most of the investigations into the advan-
tages of assessing students using ICT have
assumed the educational theorists’ point of view,
yet the use of CAL in university environments
has brought the tensions between enriching
learning and the need to categorize students into
sharp focus. By their very nature, CAL-based
systems are designed to facilitate the maximum
number of positive outcomes for a cohort of stu-
dents—be this by allowing repeated attempts
until the correct outcome is achieved, by offering
unlimited time for grappling with the issues in
hand before offering a response, or even by
allowing group discussion of a problem before
arriving at a consensus viewpoint. However, the
very process of accommodating these differing
learning strategies in this manner can generate
relatively undifferentiated results for a cohort of
students, with all of them achieving fairly high
mark levels.
With the rapid growth in the use of CAL
within university environments, and the research
evidence to suggest that various factors could
affect learning and achievement within that con-
text, it seemed pertinent to the authors of this
article to design a small-scale research project
that could examine the relationship among atti-
tude, cognitive style, learning, and achievement
in the context of a CAL package that was being
used to teach electronics.
Methods and ProceduresSample and Components
The purposive nonprobability sample
referred to in this article comprised the total 32
students (18 male and 14 female) studying their
first electronics module during an ITT Design
and Technology degree program at a university
in England.
The following components were used:
1. Cognitive Style. A well-established cog-
nitive styles analysis (CSA; Riding,
1991), which was computer presented
and self-administered, was used. This
indicated a student’s position on both the
Wholist-Analytic (WA) and the Verbal-
Imagery (VI) dimensions of cognitive
style (Riding & Rayner, 1998) by means
of an independent ratio for each. Every
member of the sample carried out the
CSA in the manner prescribed in the
CSA administration documentation.
2. Attitude to CAL. The attitude of indi-
vidual members of the sample to work-
ing with and using computers as a tool
for learning was tested by means of a 58-
item summated rating scale. Each of the
items on the scale was subjected to a
measurement of its discriminative power
(DP). The 35 items with the highest DP

Th
e J
ou
rna
l o
f Te
ch
no
log
y S
tud
ies
indices were selected to establish an atti-
tude score for each student.
3. Achievement. One set of test results was
used in this study. The test used was
designed by LJ Systems and embedded
in the CAL material. The overall mark
for the module was calculated using the
marks awarded for each task as described
earlier in the article, together with a
posttest which provided alternative sce-
narios that once again tested the learning
that had taken place. As explained earli-
er, all the tests were computer generated
and marked although they also required
practical skills in creating the physical
circuits and cognitive skills in linking the
literature to the associated schematic dia-
grams, interpretation of instrumentation
data, and the development of deductive
reasoning to identify faults. The results
were automatically summated and stored
directly onto the computer managed
learning (CML) system database. In line
with university quality assurance require-
ments, all assignments were then both
internally and externally cross-moderated
to assess validity and reliability of both
the marks and the materials being used.
The students completed the module test
before any of the other data for the study
were collected.
4. Prior Knowledge of Computing and
Electronics. A questionnaire that
requested information regarding the pre-
vious computing and electronics experi-
ence of each student was used. Questions
concerning computing and electronics
were asked separately and involved
examinations taken in computing and
electronics prior to starting the degree
program and any school or work experi-
ence in industry utilizing computing or
electronics skills prior to starting the
degree program. The answers were sepa-
rated for scoring purposes into those that
concerned previous experience in elec-
tronics and those that concerned previous
experience in computing. A student who
had studied an examination and had
school or industrial experience in elec-
tronics or computing was given a score
of 2, whereas a student who had only
experienced one of those situations was
given a score of 1. A student with no
experience of either situation was given a
score of 0.
A student’s perception of the new-
ness of electronics and computing skills
required to complete the module success-
fully was established through a second
part of the questionnaire. This provided
students with two statements, one regard-
ing the newness of the electronics skills
required in the module being studied and
one about the newness of using comput-
ers for learning. These both needed a
summated scale response. These were
scored between 0 and 2. A score of 0 was
given to those who indicated that all the
materials were new to them, and also to
those who said that they had not used a
computer for learning before. A score of
1 was given to those who indicated that
most of the materials were new to them,
and also to those who said that they had
sometimes used a computer for learning
before. A score of 2 was given to those
who indicated that little of the materials
were new to them, and also to those who
said that they had often used a computer
for learning before.
5. End of Module Feedback. In line with
all university modules, anonymous writ-
ten feedback was collected from students
using an optically read questionnaire.
This feedback is primarily used to moni-
tor the educational health of the module.
However, it also provides the module
leader with data on aspects of the mod-
ule that students perceived as particularly
helpful and areas of the module in which
they believed their learning could have
been enhanced if things had been
approached differently.
Results and DiscussionCognitive Style
Recent debate into the stability and internal
consistency of many cognitive/learning style
models (Coffield, Mosely, Ecclestone, & Hall,
2003; Peterson, Deary, & Austin, 2003; Riding,
2003) was taken into consideration when
58
Th
e J
ou
rna
l of Te
ch
no
log
y Stu
die
s
59
methods of analyzing the collected data were
designed. Initially, the data were analyzed using
the raw CSA ratios as suggested by Peterson et
al. (2003). However, no linear correlation with
any of the variables under discussion was found,
so it was decided to group the sample by the
well used cognitive style categories defined in
the CSA administration documentation, as these
labels seemed appropriate to this research proj-
ect. The WA ratios of the total sample ranged
from 0.700 to 2.910 with a mean of 1.412 (SD =
0.463). The male and female means were,
respectively, 1.392 (SD = 0.475) and 1.436 (SD
= 0.459). The gender difference was not signifi-
cant (p = 0.7408). The VI ratios ranged from
0.750 to 1.430 with a mean of 1.094 (SD =
0.148). The male and female means were,
respectively, 1.096 (SD = 0.143) and 1.091 (SD
= 0.157). The gender difference was not signifi-
cant (p = 0.9104). The correlation between the
two cognitive style dimensions was -0.153,
attesting to the orthogonality of the two dimen-
sions (cf. Riding & Cheema, 1991; Riding &
Douglas, 1993). In comparison to the CSA stan-
dardization sample (N = 999) referred to by
Riding (2000), the sample reported in this study
had very similar mean scores on each dimen-
sion, both as a total sample and when divided by
gender. However, the sample in this study did
not have subjects at the extremes of either
dimension. This was particularly noticeable at
the Wholist end of the WA dimension and the
Imager end of the VI dimension.
This later result was initially very surpris-
ing, as it had been expected that many of the
sample would have been “strong” imagers
because these students were training to become
design and technology teachers where the need
to be able to manipulate images in the mind dur-
ing design activity was recognized as a valuable
skill. However, as prospective teachers, the need
to be able to work equally competently with both
text and diagrams and be able to communicate
with pupils at the extremes of a dimension
would suggest that being at the center of a
dimension could be an advantage. In this study,
the categories on the VI dimension were fairly
evenly divided into 9 Verbalizers towards one
end of the dimension, 13 Bimodals around the
center, and 10 Imagers towards the other end of
the dimension.
With regard to the WA dimension, in both
the task of being a successful teacher and a suc-
cessful design technologist, the authors would
suggest that being strongly Analytic or Wholist
could be an advantage at certain times and a dis-
advantage at others. Data from this study indi-
cated that the sample on the WA dimension was
unevenly balanced. It was predominantly
Analytic (n = 20) with only 7 Intermediates
around the center of the dimension and 5
Wholists at the other end of the dimension. It
was therefore recognized by the researchers that
this skewed distribution could affect results and
needed to be borne in mind during data analysis.
Attitude to Using CAL
The data concerning student attitude to CAL
was scrutinized using descriptive statistics. The
maximum score that could have been achieved
was 165 and the minimum was 35. The actual
maximum score achieved was 153 and the mini-
mum score was 69. The distribution was nega-
tively skewed (skewness = - 0.251) with an over-
all mean score of 117.281 and a standard devia-
tion of 22.036.
When individual student scores for attitude
were placed in rank order and split into equal
sized quartiles (top, 2nd, 3rd, bottom) there was
the expected significant difference between the
mean attitude scores for each quartile.
There were no significant differences
between the attitudes of male and female stu-
dents to using computers for learning.
Achievement
The pass mark for the test was set high at
60% in order to try to overcome the problem
highlighted earlier in this article concerning
CAL’s ability to facilitate the maximum number
of positive outcomes and the need to differenti-
ate between students’ achievement within the
electronics module. All students in the sample
took the test and achieved a mean score of
73.938 with a standard deviation of 17.212. Six
students failed and 10 students achieved scores
of 90% or over. There was no significant differ-
ence between male and female students,
although in both attitude to using computers as a

Th
e J
ou
rna
l o
f Te
ch
no
log
y S
tud
ies
learning strategy and in the test results, females
achieved lower mean scores than their male
counterparts.
Previous Experience
All members of the sample provided their
answers to the questionnaire regarding previous
experience and newness of computing and elec-
tronics as described in the methods section of
this article. In analyzing the data regarding pre-
vious computing activity, everyone in the sample
had some previous experience of using comput-
ers although only six of the students had studied
for an examination and used computers in an
industrial context. It was therefore not surprising
that 16 of the sample did not believe that they
had had to learn any new computing skills in
order to use a computer as a learning tool in this
instance, whereas nine suggested that they had
had to learn some new skills and seven had
found that learning using a computer was very
new to them.
With regard to previous electronics experi-
ence, a significant 28 students had no previous
experience of electronics prior to starting their
degree program, two had taken an examination
or had industrial experience, and only two stu-
dents had taken an examination and had industri-
al experience of electronics. It was therefore not
surprising that a significant number of the sam-
ple believed that the electronics material was
either entirely new to them or mostly new to
them. Only four students believed there was
little new material to learn.
The Relationship Between VariablesIt was the intention of the authors to discuss
the relationship between and among all the vari-
ables in the study. However, during analysis it
became apparent that in certain combinations of
the variables the cell size became too small for
meaningful analysis to be carried out. The rela-
tionship between cognitive style and attitude to
CAL; cognitive style and achievement; attitude,
prior experience, and achievement were found to
be statistically feasible. These are discussed in
the following paragraphs. Issues associated with
gender have also been included whenever the
cell size permitted.
Cognitive Style and Attitude to CAL
When the two separate cognitive style
dimensions were scrutinized in relation to atti-
tude to CAL, there was found to be a significant
difference between the mean scores for the three
categories on the two dimensions (p = < 0.0001
in both instances). On the VI dimension, the
largest difference was between Imagers and
Verbalizers. Imagers were the most positive and
Verbalizers the least positive. On the WA dimen-
sion, Wholists were the least positive and
Intermediates, at the center of the dimension, the
most positive. When comparing the two dimen-
sions, it could be seen that Wholists were even
less positive than Verbalizers in their attitude to
CAL while Imagers were more positive than
Intermediates.
This result would suggest that poor attitude
to CAL may be influenced more by the segment-
ed nature of the CAL materials than whether
those materials were biased towards the use of
images or text. However, it must be remembered
that the skewed distribution of the sample on the
WA dimension may or may not have influenced
this result.
Cognitive Style and Achievement
When the two cognitive style dimensions
were scrutinized separately in relation to test
scores, there was found to be a significant differ-
ence between each category on both dimensions
(p = < .0001 in both instances). Intermediates
achieved a high mean score, while Wholists
achieved a much lower mean score. On the other
dimension, Verbalizers achieved the highest
mean score and Bimodals, at the center of the
dimension, the lowest. When the rank order for
both attitude and achievement in the test were
compared, it could be seen that on the WA
dimension there was a positive relationship
between the two variables. However, on the VI
dimension Verbalizers were ranked lowest in atti-
tude to CAL while they managed to achieve the
highest mean score in the test.
Some explanation for the unexpected
inverse relationship between Verbalizers’ attitude
and achievement was sought. An analysis of the
CAL materials indicated that the balance
between the pictorial and text based material
remained relatively constant throughout and it
60

Th
e J
ou
rna
l of Te
ch
no
log
y Stu
die
s
61
was felt that neither had a preponderance of suf-
ficient significance to skew the outcomes. The
explanation was thought to lie not so much in
the way that the tasks were presented but more
in the way that the content was organized. Quite
complex text based instructions were designed to
become much clearer when linked to their corre-
sponding diagrams. The Verbalizer, in avoiding
use of image and remaining focused on text,
may have needed to read and re-read the material
before gaining sufficient understanding to pro-
ceed. Such difficult and time consuming tasks
may perhaps explain the resulting low CAL atti-
tude scores, but this very investment of time in a
task that they perceived as difficult may have led
to a deeper understanding of the requirements
and therefore the higher level of achievement.
Further examination of the VI data led the
researchers to examine the possible reasons for
the low mean score of Imagers in the context of
their high attitude score. Such individuals could
have been expected to have higher levels of sat-
isfaction resulting from their focus on diagrams
and the relative ease with which they were able
to correctly build circuits from the visual infor-
mation. Such activity one expected could have
engendered the more positive attitude to CAL.
However, the assessments required careful read-
ing of accompanying text, which explained set-
tings required before measurements could be
taken and answers given. Those Imagers who
were not as thorough in their attention to reading
the text could therefore expect significantly
lower scores as a result.
Attitude to CAL, Prior Experience and
Newness of the Materials, and Achievement
When data concerning attitude to computing
and previous experience and newness of elec-
tronics were combined, a positive relationship
was found. Students who believed that there was
little new electronic materials to learn had the
most positive attitude to using computers in their
quest for knowledge, while students who
believed that all the material they had to learn
was new to them were the least positive. The dif-
ference in attitude between the top and bottom
groups was found to be significant (χ2 = 61.350,
p = <0.0001). The anonymous “End of Module
Feedback” supported a possible explanation for
this outcome. Although the whole sample indi-
cated that they recognized the advantages that
independent learning using CAL could offer,
there was still a general feeling of resentment
that the lecturer had not been “on call” for sup-
port when needed. Those with more experience
of electronics naturally had a more secure mental
“scaffolding” to support the leaps of intuition
needed for progress beyond an impasse and such
success seemed by its nature to have led to a
degree of comfort in working with information
technology (IT). Conversely, those with little
electronics experience had no background to
draw from to help maintain progress. Being
unable to converse with the computer for the
help needed led to an inevitable frustration with
IT and the poorest attitude score.
When the test results were scrutinized with
the student perception of the level of new elec-
tronic materials present in the CAL program as
a second variable, it was found that the mean
scores for those who found the materials new
to them followed the expected pattern; they
achieved the lowest mean marks. However, the
mean marks for the other two groups were not
as expected. Those who believed that there was
little new material did not achieve as high a
mean mark as those for whom the electronic
materials were mainly new knowledge. Obser-
vation of the students while they were using the
CAL materials suggested a reason for this. Many
of the students who had not studied electronics
before recognized their deficiencies and were
prepared to invest the substantial amount of time
needed to become cognizant. Their newly
learned knowledge and understanding then led to
success in the tests. Whereas many of those who
believed that they already knew much of the
electronics needed were seen to bypass the sup-
porting materials available on the computer,
moving directly to the tests. The weaker score
for this group indicated that this confidence was
generally misplaced.
When data from the questionnaire concern-
ing students’ personal level of computing experi-
ence prior to taking the electronics modules were
analyzed in conjunction with attitude to CAL,
the result once again indicated a significant posi-
tive linear correlation between the two variables
(Fisher’s r to z; p = .0032). Those with previous
computing experience were the most positive

Th
e J
ou
rna
l o
f Te
ch
no
log
y S
tud
ies
and those with little computing experience
were the least positive about having to use
CAL to gain their electronic knowledge and
understanding.
A further scrutiny of the data also indicated
that there was a positive linear relationship
between test results and the level of previous
computing skills. Those with the most previous
computing experience achieved the highest test
results and those with little previous computing
experience achieved the lowest result. In fact,
when compared to the achievement data split by
levels of prior electronic knowledge, it could be
seen that levels of computing skills prior to the
start of the module had a more marked effect
upon achievement than the amount of electronics
knowledge known before studying the module.
ConclusionThe evidence for this study was collected
using a small purposive nonprobability sample.
Consequently, it was not statistically possible to
generalize to a larger population. However, the
data gathered provided a useful picture of the
relationship that existed between CAL materials,
appropriate prior knowledge, cognitive style, and
attitude to using computers as a learning tool, as
well as ability to achieve when using such mate-
rials, for this specific cohort of students.
The data indicated that those students who
had no previous electronics experience were sig-
nificantly less positive in their attitude to using
computers as a learning strategy in comparison
to those who had prior skills in electronics. It
was also found that there was a linear correlation
between previous computer experience and atti-
tude to using computers as a learning tool and
previous computer experience and levels of
achievement in the electronics test. The data
from this study also indicated that computing
skills were possibly more important for achiev-
ing high marks within the CAL situation under
consideration than the level of previous electron-
ics knowledge.
With regard to gender differences, there was
found to be no significant difference between
male and female students in either their attitude
to computing or in their levels of achievement
when using the CAL materials under scrutiny,
although in both instances males achieved a
higher mean score than females.
With regard to the relationship between atti-
tude, achievement, and cognitive style, it was
unfortunate that the sample was not evenly dis-
tributed between the three categories on one of
the two cognitive style dimensions. However, the
results on the VI dimension, where the distribu-
tion of the sample was evenly spread, provided
evidence to suggest that there was a different
relationship between students’ attitudes to using
a computer as a learning strategy and their abili-
ty to achieve using such materials depending
upon their cognitive style. The authors of this
article suggest that CAL packages designed to
present materials in a different manner to learn-
ers with different learning style preferences may
well help those learners to achieve their full
potential in terms of learning and achievement in
comparison to software that does not have this
facility.
The results of this research have also pro-
vided the stimulus for the authors of this article
to continue collecting data from subsequent
groups of students to see if these findings are
replicated with a larger sample size that can add
credence to the conclusions drawn from this ini-
tial small-scale study.
Dr Stephanie Atkinson is Reader of Design
and Technology Education in the School of
Education and Lifelong Learning at Sunderland
University, England. She is a member-at-large
of Epsilon Pi Tau.
62
References
Alexander, S. (1995). Teaching and learning on the World Wide Web. In AusWeb95, the first Australian World Wide Web Conference. Retrieved August 6, 2003, from http://www.scu.edu.au/sponsored/ ausweb/ausweb95/papers/education2/alexander
Biggs, J. B., & Moore, P. J. (1993). The process of learning (3rd ed.). Englewood Cliffs, NJ: Prentice Hall.

Th
e J
ou
rna
l of Te
ch
no
log
y Stu
die
s
63
Boucher, A. (1998). Information technology-based teaching and learning in higher education: A view of the economic issues. Journal of Information Technology for Teacher Education, 7(1), 87-112.
Boucher, A., Davis, N., Dillon, P., Hobbs, P., & Tearle, P. (1997). Information technology-assisted teaching and learning in higher education. Bristol, England: Higher Education Funding Council for England.
Cassidy, S. (2003). Learning styles: An overview of theories, models and measures. In S. Armstrong, S. Rayner, M. Graff, E. Sadler-Smith, C. Lashley, M. Schiering, E. Peterson, & D. Spencer (Eds.), ELSIN 2003—Bridging theory and practice (pp. 80-102). Hull, England: The University of Hull.
Coffield, F., Mosely, K., Ecclestone, K., & Hall, E. (2003). A systematic review of learning styles and pedagogy. In S. Armstrong, S. Rayner, M. Graff, E. Sadler-Smith, C. Lashley, M. Schiering, E. Peterson, & D. Spencer (Eds.), ELSIN 2003—Bridging theory and practice (p. 115). Hull, England: The University of Hull.
Curry, L. (1983). An organization of learning style theory and constructs. (ERIC Document Reproduction Service No. ED 235 185)
Dillon, P. (1998). Teaching and learning with telematics: An overview of the literature. Journal of Information Technology for Teacher Education, 7(1), 33-50.
Dunn, R., & Dunn, K. (1993). Teaching elementary students through their individual learning styles: Practical approaches for grades 3-6. Boston: Allyn & Bacon.
Ebersole, S. (1997). Cognitive issues in the design and development of interactive hypermedia: Implications for authoring WWW sites. Interpersonal Computing and Technology: An Electronic Journal for the 21st Century. Retrieved August 6, 2003, from http://www.helsinki.fi/science/ optek/1995/nl/ebersole.tx
Edwards, D. W., & Hardman, L. (1989). Lost in hyperspace: Cognitive mapping and navigation in a hypertext environment. In R. McAleese (Ed.), Hypertext: Theory into practice (pp. 105-125). Oxford, England: Intellect.
Feenburg, A. (1989). The written world: On the theory and practice of computer conferencing. In R. Mason & A. Kaye (Eds.), Mindweave: Communication, computers and distance education(pp. 63-73). Elmsford, New York: Pergamon Press.
Ferris, P. (1999). Effectively using technology in education: A review of Wired together: The on-line classroom in K-12 Volume 1: Perspectives and instructional design. Interpersonal Computing and Technology: An Electronic Journal for the 21st Century, 7(1-2). Retrieved September 28, 2004, from http://www.emoderators.com/ipct-j/1999/nl-2/ferris.html
Ford, N. (1999). Learning styles for adaptive course delivery: Problems and prospects. In J. Hill, S. Armstrong, M. Graff, S. Rayner, & E. Sadler-Smith (Eds.), Proceedings of the 4th Annual Conference of the European Learning Styles Information Network (pp. 187-202). Preston, England: University of Central Lancashire.
Goldstein, K. M., & Blackman, S. (1978). Cognitive style: Five approaches and relevant research. New York: Wiley.
Gygi, K. (1990). Recognizing the symptoms of hypertext ... and what to do about it. In B. Laurel (Ed.), The art of human-computer interface design (pp. 279-288). Reading, England: Addison-Wesley.
Harasim, L. (1989). Online education: A new domain. In R. Mason & A. Kaye (Eds.), Mindweave: Communication, computers and distance education (pp. 50-62). Elmsford, New York: Pergamon Press.
Jones, C. (2001). Three steps forward, two steps back: Approaches to the development of capability in information and communications technology in secondary schools. Computer Education, 98, 4-11.
Lee, C-H. (1999). An exploration of pedagogical implications of using networked-based computer mediated communication in the communicative language classroom. Interpersonal Computing

Th
e J
ou
rna
l o
f Te
ch
no
log
y S
tud
ies
64
and Technology: An Electronic Journal for the 21st Century. Retrieved August 6, 2003, from http://www.jan.ucc.nau.edu/~ipct-j/1999/nl-Lee.html
Lord, D. (1998). ICT supported multimedia learning materials: Catering for individual learner differences. Paper presented at annual conference of British Educational Research Association. Retrieved August 6, 2003, from http://www.bera.ac.uk
Mak, S. (1995). Developing a self-access and self-paced learning aid for teaching statistics. In AusWeb95: The first Australian World Wide Web Conference. Retrieved August 6, 2003, from http://www.scu.edu.au/sponsored/ausweb/ausweb95/papers/education1/mak
Moore, M. G. (1992). Distance education theory. American Journal of Distance Education, 5(3), 1-6.
National Council for Education Technology. (2000). Integrated learning systems: Report of phase 2 of the pilot evaluation of ILS in the UK. London, England: NCET.
Oliver, R. (1994). Information technology courses in teacher education: The need for integration. Journal of Information Technology and Teacher Education, 3(2), 11-31.
Pask, G., & Scott, B. C. E. (1972). Learning strategies and individual competence. International Journal of Man-Machine Studies, 4, 217-253.
Peterson, E. R., Deary, I. J., & Austin, E. J. (2003). The reliability of Riding’s cognitive style analysis test. Personality and Individual Differences, 34(5), 881-891. Retrieved August 6, 2003, from http://www.sciencedirect.com/science?
Pillay, H. (1998). An investigation of the effect of individual cognitive preferences on learning through computer-based instruction. Educational Psychology, 18(2), 171-182.
Recker, M. M. (1995). Cognitive media types for multimedia information access. Retrieved August 6, 2003, from http://www.comp.vuw.ac.nz/~mini/succeed/
Riding, R. J. (1991). Cognitive style analysis research administration. Birmingham, England: Learning & Training Technology.
Riding, R. J. (1996). Learning styles and technology-based training. Sheffield, England: Department for Education and Science.
Riding, R. J. (2000). Cognitive style analysis research administration. Birmingham, England: Learning & Training Technology.
Riding, R. J. (2003). On the assessment of cognitive style: A commentary on Peterson, Deary, and Austin. Personality and Individual Differences, 34(5), 893-897. Retrieved August 6, 2003, from http://www.sciencedirect.com/science?
Riding, R. J., & Cheema, I. (1991). Cognitive styles: An overview and integration. Educational Psychology, 11(3), 193-215.
Riding, R. J., & Douglas, G. (1993). The effect of cognitive style and mode of presentation on learning performance. British Journal of Educational Psychology, 63, 297-307.
Riding, R. J., & Pearson, F. (1994). The relationship between cognitive style and intelligence. Educational Psychology, 16, 81-106.
Riding, R. J., & Rayner, S. (1998). Cognitive styles and learning strategies. London: Fulton.
Riding, R. J., & Rayner, S. (1999). A cognitive style preventative intervention for improving behavior and learning in secondary school pupils. In J. Hill, S. Armstrong, M. Graff, S. Rayner, & E. Sadler-Smith (Eds.), Proceedings of the 4th Annual Conference of the European Learning Styles Information Network (pp. 351-368). Preston, England: University of Central Lancashire.
Rumble, G. (1998). Academic work in the information age: A speculative essay. Journal of Information Technology for Teacher Education, 7(1), 129-145.
Shum, S. (1990). Real and virtual spaces: Mapping from spatial cognition to hypertext.Hypermedia, 2, 133-158.
Somekh, B. (1998). Supporting information and communication technology innovations in higher education. Journal of Information Technology for Teacher Education, 7(1), 11-32.

Th
e J
ou
rna
l of Te
ch
no
log
y Stu
die
s
65
Steuer, J. (1992). Defining virtual reality: Dimensions determining telepresence. Journal of Communication, 42, 73-93.
Tearle, P., Davis, N., & Birbeck, N. (1998). Six case studies of information technology-assisted teaching and learning in higher education in England. Journal of Information Technology for Teacher Education, 7(1), 51-70.
Tennant, M. (1988). Psychology and adult learning. London: Routledge.
Witkin, H. A., Moore, C. A., Oltman, P. K., Goodnough, D. R., Friedman, F., Owen, D. R., & Others. (1977). Role of the field dependent and field independent cognitive styles in academic evolution: A longitudinal study. Journal of Educational Psychology, 69(3), 197-211.
Witkin, H. A., Oltman, P., Raskin, E., & Karp, S. (1971). A manual for embedded figures test. Palo Alto, CA: Consulting Psychologists Press.
The W. E. B. DuBois and Booker T. Washington Debate: Effects upon African American Roles in Engineering and Engineering TechnologyKeith V. Johnson and Elwood Watson
The messages of Booker T. Washingtonand W. E. B. DuBois could not have been morediverse. The philosophical rivalry betweenWashington and DuBois has deep historicalroots. To be on the same side fighting for thesame purpose, progress, and uplifting of theBlack race, these two Black intellectuals har-bored radically divergent views on how to assistAfrican Americans to free themselves from theiroften subhuman conditions. Both men wereaware that technological advancement was offoremost importance to the advancement ofAfrican Americans. Washington’s (1901) UpFrom Slavery and DuBois’ (1903) The Souls ofBlack Folks were immediately hailed as classiccommentary due to their efforts to address thethen “Negro” problem in America. There were anumber of Black Americans who made a valianteffort to mitigate poverty, illiteracy, racial dis-crimination, high mortality rates, and other des-
olate conditions that plagued many AfricanAmericans, particularly at the turn of the centu-ry. However, due to their influential appealamong certain constituencies, both Washingtonand DuBois garnered ample attention frommany segments of the American intelligence,many of which were European in ethnic origin.Thus, acknowledgment from the White powerstructure (this was particularly true in the caseof Washington) provided both men a platform topromote their message.
Washington was a student at HamptonInstitute and became convinced that vocationaleducation was the only means by which Blackswould become successful in America. In 1881Washington went to Alabama and foundedTuskegee Institute, where he put into practicehis belief that the ultimate solution to the raceproblem was for Blacks to prove themselves

Th
e J
ou
rna
l o
f Te
ch
no
log
y S
tud
ies
worthy by becoming reliable and superior labor-ers, eventually making themselves indispensableto the economic well-being of the country. Inorder to accomplish this, Blacks needed theright form of education: an education that wouldbe beneficial in an economic sense. Given hisexperience at Hampton, Washington felt thatindustrial education was superior to academiceducation for achieving his goal of Black socialimprovement (Spivey, 1978). As quoted inFranklin (1973), Washington believed that Blackeducation “should be so directed that the great-est proportion of the mental strength of themasses will be brought to bear upon the every-day practical things of life, upon something thatis needed to be done, and something which theywill be permitted to do (emphasis added) in thecommunity in which they reside” (p. 285). Thebasic philosophy of industrial education as prac-ticed at Hampton and Tuskegee was quite sim-ple. The training in various domestic and tradeskills within an authoritarian and religiouslybased environment would produce a Black whowould fit into the lower end of the occupationalstructure and, more important, know his or herplace among Whites and come to accept thatplace as proper.
Such a form of education was just whatWhite society sought. For Southerners, it wouldkeep Blacks subservient and exploitable. ForNortherners, it would serve as a way of calmingracial tensions and providing a well-trainedlaboring underclass that could be used in theeffort to industrialize the South. For these rea-sons, wealthy philanthropists in both the Northand the South were willing to give large grantsto institutions that adopted this vocationalmodel while ignoring those institutions thatremained academically oriented (Franklin, 1973;Quarles, 1969; Winston, 1971).
The results were as dramatic as they weredevastating. The ideology of vocational educa-tion became the panacea for the race problem inAmerica. Except for a few institutions of higherlearning (Fisk, Atlanta, and Howard), Black col-leges took the financial windfalls and adoptedthe vocational curriculum. Educationally, voca-tional training was a failure: It not only failed toprepare Blacks to move up in society, but it alsoguaranteed that they would move down. Theemphasis on manual training and the tradesserved to destroy the educational aspirationsthat had been aroused during Reconstructionand wiped out the hope that education could
provide a way out of poverty. By 1930 industrialeducation was seen as a “cynical political strate-gy, not a sound educational policy” and provedto be the “great detour” for Blacks from whichthey are just beginning to return (Winston,1971, p. 683).
Booker T. Washington was born a slave onthe plantation of James Burroughs near Hale’sFord, Virginia (Harlan, 1970). During the periodof Washington’s prominence, from the 1890suntil his death in 1915, probably the leadingideological orientation of American Negroescentered on the development of Negro businessenterprise through a combination of thrift,industry, and racial solidarity, or Negro supportof Negro business (Kusmer, 1991). Although thephilosophy of “self-help” has largely been cred-ited to Washington, this was a message that wasvery much in vogue as far back as the 1850s. It experienced a renaissance during Recons-truction, particularly among educated AfricanAmericans. The advocates of this progressiveform of African American empowerment arguedthat African Americans, despite facing rampantdiscrimination, disenfranchisement, Jim Crowlaws, and other forms of oppression, must turnfrom being defensive toward the capitalist sys-tem and adopt proactive methods of combatingsuch a system. Once African Americans hadproven their ability to help themselves and toacquire wealth and respectability, it wasbelieved that prejudice and discriminationwould disappear. During the mid 20th century,there were Black academics such as the late E.Franklin Frazier who argued that there wereAfrican American businessmen who were notabove exploiting the masses of Blacks to aug-ment their own economic welfare (Fraizer,1957).
At the close of the 19th century, the entre-preneurial class in the Black communitydepended in considerable part upon the supportof White customers. Though the range of occu-pations varied from city to city, this group wascomposed primarily of blacksmiths, tailors, bar-bers, and other skilled artisans, hackmen anddraymen, grocers, and less frequently meat deal-ers, hotel owners, caterers, real estate dealers,and contractors (Kusmer, 1991). Along withcivil servants, teachers, pullman porters ofupper class status, domestic servants in the mostelite White families, the more eminent and bet-ter educated ministers, a few doctors, and anoccasional lawyer, the more successful among
66

Th
e J
ou
rna
l of Te
ch
no
log
y Stu
die
s
these entrepreneurs composed the upper echelonof the African American community in the late19th century (DuBois, 1899).
By about 1900, however, significant eco-nomic and social changes were well under way.A growing antipathy on the part of Whitestoward trading with Black businessmen coupledwith rapid changes in technology and businessorganization forced many of these small entre-preneurs out of business. At the same time, theincreasing urbanization of African Americansprovided an economic base for professional andbusiness men who were dependent on the serv-ices of African Americans (Meier, 1963). Theseservices included banks, cemetery and realtyassociations, insurance enterprises, and numer-ous retail and service establishments (Meier,1963). Previously established businesses such asnewspapers, morticians, and retail merchantshad depended upon the money that the uppermiddle class African American community hadspent for their goods. By this juncture this eco-nomic class had increased in size. It was duringthe first two decades of the 20th century that two of the largest Black fortunes—that of R. R.Church, real estate magnet in Memphis,Tennessee, and Madame C. J. Walker, creator of the straightening comb and the first Blackfemale millionaire—were created (Pierce,1947). Walker was a profound example of early20th century Black technological genius. It wasthe combination of the aforementioned factorsof Black entrepreneurship that both Booker T.Washington and, to a lesser degree, W. E. B.DuBois attempted to espouse to the AfricanAmerican bourgeoisie (Meier, 1963).
Throughout American history, the Blackupper class had an easier time obtaining an eco-nomic and technological based education thantheir brethren in the lower class. Because of thisfact, they tended to be more acquainted withcurrent scientific technology. Depending uponthe city, the members of this socioeconomicclass varied. In New Orleans the Black upperclass consisted of free people of color. InCharleston, South Carolina, artisans, contrac-tors, barbers, and postal employees representedthe African American upper middle class. Incities such as Atlanta and Durham, there was asubstantial entrepreneurial class that DuBoiscalled the group economy. In Washington, DC,the situation was unique due to the large numberof government workers and politicians. Formany years (this was the case in many African
American communities, both urban and rural),ministers, teachers, and a few small business-men (particularly after the Civil War) were theAfrican Americans who were more inclined togravitate toward technological pursuits (Meier,1963).
Because of their diverse views on how toreduce the reductive circumstances of AfricanAmericans, both Washington and DuBois hadviewed technology from different perspectives.Washington was a Southerner who harboreddeep suspicion about the Black intellectualswho dwelt in the northern cities or attended thesouthern colleges that he never attended. He dis-missed their arcane knowledge as too muchfrom books and too little from life.
Washington was different than most South-erners in the fact that he was astute to the factthat in a capitalist society that it was pertinentfor African Americans to become skillfullyadept to the ever-changing economy. He knewthat becoming technologically efficient was onesuch way to do so. This Black man who was theoffspring of former Virginia slaves foundedTuskegee Institute in 1881. This was only fouryears after the Hayes/Tilden Compromise thatofficially ended Reconstruction in the South in1877. Beginning with a few ramshackle build-ings and a small sum from the state of Alabama,he built Tuskegee Institute into the best-knownAfrican American school in the nation. Whilenot totally negating academic training, theschool’s curriculum stressed industrial educa-tion, training in specific skills and crafts thatwould prepare students for jobs. Washingtonbuilt both his school and influence by tappingthe generosity of Northern philanthropists,receiving donations from wealthy NewEnglanders and some of the leading industrial-ists and businessmen of his time, such asAndrew Carnegie, William H. Baldwin, Jr.,Julius Rosenwald, and Robert C. Ogden.
Thus his establishment of TuskegeeInstitute was the cornerstone for future goalsthat he harbored for African Americans.Washington’s reputation as the principal ofTuskegee Institute grew through the late 1880sand 1890s; his school was considered the bestexemplar of industrial education, viewed as thebest method of training generations of AfricanAmericans who were either born into slavery orwere the sons and daughters of freed slaves. Hiscontrol of the purse strings of many of the
67

Th
e J
ou
rna
l o
f Te
ch
no
log
y S
tud
ies
Northern donors to his school increased hisinfluence with other African American schoolsin the South.
It was his legendary Atlanta Compromisespeech that firmly defined Washington as a manwho was deeply immersed with economic andtechnological advancement. It was during thisspeech that Washington urged African Ameri-cans to refrain from adamantly attempting tointegrate with White America. Rather, he advo-cated a gradual emancipation of AfricanAmericans through hard work, economicimprovement, and self-help (Washington, 1901).Technological advancement was an integral partof his message. His rhetoric gained universalacceptance among many Whites and a largenumber of Blacks.
What distinguished Washington fromDuBois and many other African American lead-ers of the early 20th century was his philosophythat Black Americans had to keep ever faithfulto the virtues of sacrifice, discipline, delayedgratification, and most important, economic sal-vation for their own communities.
The wisest among my race understand thatagitation of social equality is the extremistfolly, and that progress in the enjoyment ofall the privileges that will come to us mustbe the result of severe and constant strugglerather than of artificial forcing. No race thathas anything to contribute to the markets ofthe world is long in any degree ostracized.It is important and right that all privilegesof law be ours, but it is vastly more impor-tant that we be prepared for the exercise ofthese privileges. The opportunity to earn adollar in a factory just now is worth infi-nitely more that the opportunity to spend adollar in an opera house. (Franklin & Starr,1967, pp. 85-87)
Washington argued that business and tech-nological acumen were paramount. This was themeans by which the African American masseswould prosper. He believed that cultured-basededucation was secondary and could be pursuedat a later date.
DuBois concurred with Washington thatprogress among the Black race had to occur, buthe believed that it would be more aptly servedthrough a trickled down means. DuBois wasborn to a white French father, Alfred DuBois,
and Mary Burghart DuBois, a Black woman, inGreat Barrington, Massachusetts, in 1869. Hewas what many people referred to in those daysas “mulatto” or in contemporary terms, biracial.Unlike many Americans (Black or White) of thetime period, his stellar educational opportunitiesafforded him a national platform for him toespouse his message. He earned his BA at FiskUniversity in 1888, another BA at Harvard in1890, and later his doctorate in 1895. He wasthe first African American to earn a PhD at theinstitution (Aptheker, 1951). Ever determined touplift Black Americans from poverty, hefocused on how the skills of the Black profes-sional class could be utilized to achieve thisgoal.
It was during this time period that theNorth was experiencing a large number ofimmigrants from Europe as well as a large num-ber of African Americans migrating from theSouth. This fact provided for potentially volatilerelationships between the newly arrived immi-grants and the native born Black population.White Northern businessmen, primarily due tomore familiarity and comfort with Europeanswho shared their ancestral lineage, mores, andcustoms, began to align themselves with Jews,Greeks, Italians, and other White ethnics which,in turn, either marginalized or prohibited BlackAmericans from being able to provide servicesto their communities (Butler, 1991).
With regard to this problem, DuBoisengaged in a major study of the city of Phila-delphia. His work focused on four social classes within the city. The top 10% he called an upper class or aristocracy. These peopleincluded entrepreneurs and professional people. These people had decent jobs and their childrenattended the best schools. Group two was therespectable working class. These individualswere primarily made up of servants, waiters,porters, and laborers. This was a class that waseager to engage in upward mobility. The thirdgroup of African Americans was referred to asthe poor. It was made up of recent immigrantswho could not find work, unreliable persons,widows, and wives of broken families. The low-est class (about 6% of the Black population)was labeled as criminals (DuBois, 1899).
Because of the great discrepancies thatexisted between the two groups, upwardlymobile African Americans were able to success-fully distinguish themselves among other
68

Th
e J
ou
rna
l of Te
ch
no
log
y Stu
die
s
classes in the city. Class has often been used as a distinguishing feature of American society,especially among White Americans. However, it is also true that similar situations were com-monplace among Black Americans as well.Upon his conclusion of studying AfricanAmericans in Philadelphia, DuBois decided thatthe only way that African Americans couldadvance was through the leadership of the upperclasses. Thus the term talented tenth was adopt-ed. DuBois was adamant in his belief that intel-lectual guidance from the best and brightestamong the Black race was the means by whichto advance African Americans. A number ofyears after Washington’s death, DuBois (1940)reiterated his belief:
Since the controversy between myself andMr. Washington has become historic, itdeserves more careful statement than it hashad hitherto, both as to the matters and themotives involved. There was first of all theideological controversy. I believed in thehigher education of a Talented Tenth whothrough their knowledge of modern culturecould guide the American Negro into ahigher civilization. I knew that without thisthe Negro would have to accept white lead-ership, and such leadership could notalways be trusted to guide this group intoself-realization and to its highest culturalpossibilities. Mr. Washington, on the otherhand, believed that the Negro as an efficientworker could gain wealth and that eventual-ly through his ownership of capital hewould be able to achieve a recognized placein American culture and could then educatehis children as he might wish and develophis possibilities. For this reason he pro-posed to put the emphasis at present upontraining in the skilled trades and encourage-ment in industry and common labor. (p. 70)
There was no doubt that by the early yearsof the 1900s that Washington’s influence amongthe White elite was considerably stronger thanDuBois’. There was no gainsaying his influencein the highest places, his manifold services tohis people, and, above all, the radiating influ-
ence of Tuskegee’s good works (Lewis, 1993).
Washington’s leadership ultimately gaveway to new forces in the 20th century, whichplaced less emphasis on individual leadershipand more on organizational power. The foundingof the National Association for the Advance-ment of Colored People (NAACP) in 1909 withW. E. B. DuBois as its first president and theNational Urban League in 1911 challengedWashington’s power as a dispenser of politicalpatronage as well as his technological and eco-nomic message. Nevertheless, he remainedactive as a speaker until his death in 1915 at Tuskegee.
DuBois had a phenomenally prolific careeras a writer and scholar. Over time, he becamemore disillusioned with America, particularlythe Black elite—the group that he dubbed as the Black upper class—believing that they hadfailed on their obligation to lead the masses of African Americans out of retrograde circum-stances. In October 1961 he moved to Ghana. In 1963 he renounced his American citizenshipand officially became a citizen of Ghana. Hedied there on August 27, 1963, at the age of 95and was buried there (Rampersad, 1976).
Both men were aware that the need forAfrican Americans to become technologicallyliterate was paramount. However, whereasWashington advocated a hands-on externalapproach, DuBois promoted a paternalistic formof advancement of the Black race. Both men’sphilosophies are still being argued and appliedin the technological arena today.
Dr. Keith V. Johnson is chair of theDepartment of Technology and Geomatics at East Tennessee State University. He is amember of Gamma Zeta Chapter of Epsilon Pi Tau.
Dr. Elwood D.Watson is an associate professor and interim director of the African/African-American Studies Program at EastTennessee State University.
69
References
Aptheker, H. (1951). The Negro people in the United States. New York: The Citadel Press.
Butler, J. (1991). Entrepreneurship and self-help among Black Americans: A reconstruction of race and economics. Albany: State University of New York Press.

Th
e J
ou
rna
l o
f Te
ch
no
log
y S
tud
ies
70
DuBois, W. E. B. (1899). The Philadelphia Negro: A social study. Philadelphia: University of Pennsylvania Press.
DuBois, W. E. B. (1903). The souls of Black folks. Chicago: McClurg.
DuBois, W. E. B. (1940). Dusk of dawn: An essay toward an autobiography of a race concept.Franklin Center, PA: Franklin Library.
Franklin, J. H. (1973). From slavery to freedom: A history of Negro Americans. New York: Knopf.
Franklin, J. H., & Starr, I. (1967). The Negro in twentieth century America: A reader on the struggle for civil rights. New York: Vintage.
Fraizer, F. E. (1957). The Black bourgeoisie: The rise of a new middle class in the United States. New York: Collier Books.
Harlan, T. (1970). Booker T. Washington in biographical prospective. American Historical Review, 85, 89-92.
Kusmer, K. (1991). From reconstruction to the great migration, 1877-1917. New York: Garland.
Lewis, D. (1993). W. E. B. DuBois—Biography of race, 1968-1919 (1st ed.). New York: Holt.
Meier, A. (1963). Negro thoughts in America 1880-1915: Racial ideologies in the age of Booker T. Washington. Ann Arbor: University of Michigan Press.
Pierce, T. (1947). Controllable community characteristics related to the quality of education.New York: Bureau of Publications, Teachers College, Columbia.
Quarles, B. (1969). The Negro in the making of America. New York: Macmillan.
Ramperdas, A. (1976). The art and imagination of W. E. B. Du Bois. London: Harvard University Press.
Spivey, D. (1978). Schooling for the new slavery: Black industrial education, 1868-1915.Westport, CT: Greenwood.
Washington, B. T. (1901). Up from slavery. New York: Doubleday, Page & Company.
Winston, M. R. (1971). Through the back door: Academic racism and the Negro scholar in historical perspective. Daedalus, 100, 678-719.

Th
e J
ou
rna
l of Te
ch
no
log
y Stu
die
s
71
IntroductionA major goal of the manufacturing industry
is increasing product quality. The quality of aproduct is strongly associated with the conditionof the cutting tool that produced it. Catchingpoor tool conditions early in the production willhelp reduce defects. However, with current CNCtechnology, manufacturers still rely mainly onthe operator’s experience to operate and monitormachines to avoid defects from poor tool condi-tions. Since operator experience can be unreli-able, recent research has focused on integratinga tool condition monitoring system within themachine to allow online, real-time monitoring to reduce the dependence on human judgment.
Any effective monitoring system must beable to sense tool conditions, allow for effectivetool change strategies when tools deteriorate,and maintain proper cutting conditions through-out the process (Lee, Kim, & Lee, 1996).Among the many possible machining conditionsthat could be monitored, tool wear is the mostcritical for ensuring uninterrupted machining.
The traditional process for predicting thelife of a machine tool involves Taylor’s (1906)equation VTn=C, where V is cutting speed, T istool life, and n and C are coefficients. Thisequation has played an important role inmachining tool development (Kattan & Currie,1996). Since advanced machining was intro-duced in the mid-1900s, various tool wear mon-itoring methods have been proposed to expandthe scope and complexity of Taylor’s equation.However, none of these extensions has beensuccessfully adopted in industry universally dueto the complex nature of the machining process.Therefore, there have been many attempts toexplore other more promising methods for mon-itoring tool wear online using computers andsensing techniques (Atlas, Ostendorf, &Bernard, 2000; Li & Tzeng, 2000; Pai,Nagabhushana, & Rao, 2001; Roth & Pandit,1999; Wilkinson, Reuben, & Jones, 1999).Again, none of the in-process monitoring sys-tems has ever been applied in any form inindustry because research is still at the estima-tion stage; the systems are too immature toimplement for monitoring (Waurzyniak, 2001).
Therefore, researchers saw a need toexplore an experimental and statistical approachin developing an in-process tool wear monitor-ing (ITWM) system. In order to accomplish thisgoal, this ITWM system requires an integrationof sensing and decision-making techniques. Forany in-process machining monitoring system,the sensing techniques are used to give themachine the capability of “seeing” that is equiv-alent to the human’s eyes. However, the signalsfrom the sensor have to be processed in order todetermine whether or not something abnormalhas occurred. The decision-making techniquesare developed for the purpose of processing thesignals from the sensors and data from otherresources to determine whether or not themachining is satisfactory. Therefore, the deci-sion-making techniques function like the“brain” of machines to make them intelligent.
Studies in the past have shown that thedynamometer sensor was much more effectivethan any other sensors in the field of tool wear(Dutta, Kiran, & Paul, 2000; Wilkinson et al.,1999). However, cutting force is very com-plex—it varies in different directions and variesthroughout the whole revolution of the spindle.As a result, when tool wear occurs, it is sensibleto conduct a cutting force analysis experimen-tally and statistically to find the cutting forcerepresentation that best predicts tool wear.
There is no doubt that the dynamometer isthe most effective sensor available for monitor-ing tool wear. However, past studies of buildingtool wear prediction systems have used differentdecision mechanisms—either classic mathemati-cal equations (Cho, Choi, & Lee, 2000; Sarhan,Sayed, Nassr, & El-Zahry, 2001) or expert sys-tems (Dutta et al., 2000; Susanto & Chen,2002)—based on different interests. In thisstudy, a multiple regression approach was usedas the decision mechanism in the proposedITWM system.
Purpose of StudyThe purpose of this study was to develop an
ITWM system using cutting force as a sensingsignal and integrating the multiple regressionapproach as the decision mechanism. In order
A Multiple-Regression Model for Monitoring Tool Wearwith a Dynamometer in Milling OperationsJacob C. Chen and Joseph C. Chen

Th
e J
ou
rna
l o
f Te
ch
no
log
y S
tud
ies
to develop the proposed ITWM system, the fol-lowing two research outcomes were expected:
1. Identify the cutting force representationthat could best predict tool wear.
2. Build and test an in-process tool wearprediction system, which was a multiple-regression model in this study, with thecutting force identified from the firsttask.
Architecture of In-Process Tool Wear Prediction System
In this study, the ITWM system that inte-grated multiple-linear regression can be namedthe multiple-linear-regression-based in-processtool wear prediction (MLR-ITWP) system. Theinput variables were feed rate (F), depth of cut(D), and cutting force (Fc), while the only out-put variable was tool wear (Vb). The architec-ture of the MLR-ITWP system is illustrated inFigure 1.
In the MLR-ITWP system, the three inputsentered the system as follows: both feed rateand depth of cut were controlled and pro-grammed into the Fadal machine, while cuttingforce signals were collected through a dyna-mometer and converted to digital formatthrough an A/D (analog/digital) converter. Thedigitized cutting force data per revolution of the spindle were simplified to a representativevalue, which was selected based on the forceanalysis. The following section shows the exper-imental setup for the study.
Experimental SetupThe experimental setup is illustrated in
Figure 2. The dynamometer sensor was mountedon the feeding table of the Fadal verticalmachining center with the workpieces/tool hold-er on top of the sensor. The proximity sensorwas mounted on the spindle and connected to apower supply. Through an A/D converter, thesignals from both sensors were collected andconverted into digital codes on the computer.
HardwareTwo sensors were used in the study: a
Kistler 9257B type dynamometer sensor, whichis capable of detecting force signals in threeorthogonal directions (Fx, Fy, and Fz), and aMicro Switch 922 series 3-wire DC proximitysensor, which is used to determine the startingpoint of each revolution of the spindle in theforce diagram (see Figure 3). Together, thesetwo sensors were used to determine the cuttingforce magnitude.
An RCA WP-703A power supply was usedto provide about 2.5V of electromotive force tooperate the proximity sensor. A Kistler Type5010 amplifier was used to amplify the forcesignals from the dynamometer to the maximumof 10V. An Omega CIO-DAS-1602/12 A/D con-verter was used to convert cutting force datafrom analog to digital. A P5 133 personal com-puter was used to collect data from the A/Dconverter, which originated from the proximitysensor and the dynamometer sensor.
The workpiece material used in the studywas 1018 steel. A VNE90-1250C 3-insert millwith 1.25" cut diameter was used to holdinserts. APKT 160408R coated carbide inserts
72
Figure 1. The architecture of the MLR-ITWP system.

Th
e J
ou
rna
l of Te
ch
no
log
y Stu
die
s
were mounted on the tool holder for the millingmachining. A Meiji EMZ-5TR Zoom StereoMicroscope was used to observe and measurethe flank wears on the inserts.
Identifying the Best-PredictingCutting Force Representation
The goal of the first experimental run anddata analysis was for force analysis, in order toidentify the best cutting force representation forpredicting tool wear.
Force Analysis ExperimentThe first part of the study included deter-
mining the cutting force representation to berecorded and entered into the prediction systemin the second part of the study.
Past experiments have revealed that in end-milling operations, the Z direction (the verticaldirection) of the cutting force can be ignoredbecause it is insignificant relative to tool wear
73
Figure 2. Experimental setup.
Figure 3. An example of cutting force signal converted as collectable digital data.

Th
e J
ou
rna
l o
f Te
ch
no
log
y S
tud
ies
monitoring compared to the X and Y orthogonaldirections. Therefore, the selection of the forcedirections was limited to the forces in the X andY directions and the resultant force of the two:Fx, Fy, and Fr, where .
For each of these three directions of cuttingforce, one could identify two possible cuttingforce representations: average force ( ) andaverage peak force ( ). Therefore, six cuttingforce representations were identified:
In the equations, m is the total number ofcutting force signals collected in a revolution,and n is the number of the mill inserts (in thestudy, n = 3).
To decide the best cutting force representa-tion for predicting tool wear, the only independ-ent variable was the flank wear (Vb) of the tool,and the only dependent variable was the cuttingforce. The remaining cutting conditions were set to fixed values: feed rate = 5 in/min, spindle speed = 1800 rpm, and depth of cut = 0.05 inches.
F =r Fx y+ F2 2
Correlations of Six Cutting ForceCombinations and Tool Wear
One of the easiest ways to identify the bestcutting force representation out of the six was tocompare the correlations of these cutting forcecombinations and tool wear. The correlationcoefficients were determined using MicrosoftExcel, and the formula for the correlation coefficients is:
1)
where is the correlation coefficientbetween tool wear (Vb) and cutting force combination k (Fck); Vbi is the tool wear value of the ith cut, while n is the total number of the training data sets. In this study, n = 13, .
With six cutting force combinations, sixdifferent correlation coefficients were obtained:
. Thelargest correlation coefficient among the sixindicates that the correlation is the greatest andthe cutting force combination in that correlationis the best to predict tool wear.
Results of Force AnalysisFrom the analysis (please contact the
authors for the details), it can be concluded that the average peak forces in one revolution in the Y direction had the greatest correlationcoefficient (0.78) with a p value of 0.002.However, the Y direction here is from thedynamometer, which is oriented differently from the machine. Therefore, the Y direction in this study is better defined as the directionperpendicular to the direction of the table feed(see Figure 5). The theoretical reasons, althoughnot included in the study, definitely merit fur-ther study in the future.
ρVb –Fck =
∑n
i=1Vbi – )( Vb (Fc k
i – Fc k )
∑n
i=1Vbi – )( Vb (Fc k
i – Fc k )2 2
Vb = ∑n
i=1
Vbi n and Fc k = ∑n
i=1
Fc ki n .
ρVb –Fx
, ρVb –Fy
, ρVb –Fr
, ρVb –Fx
,ˆ ρVb –Fy
,ˆ ρVb –Fr̂
and
ρVb –Fck =
∑n
i=1Vbi – )( Vb (Fc k
i – Fc k )
∑n
i=1Vbi – )( Vb (Fc k
i – Fc k )2 2
Vb = ∑n
i=1
Vbi n and Fc k = ∑n
i=1
Fc ki n .
ρVb –Fx
, ρVb –Fy
, ρVb –Fr
, ρVb –Fx
,ˆ ρVb –Fy
,ˆ ρVb –Fr̂
and
74
Fx=F∑
i=1
mi
x
m
Fm
=F∑
i=1
mi
y
y
Fm
=F∑
i=1
mi
r
r
F =x̂ ∑n 1
=0
{Max{Fxi i = [—]
mn
+1, [—]mn
+ 2, , [—]mn
[—]mn
+ }} /n
F =ˆ ∑n 1
=0
{Max{F iy y i = [—]
mn
+1, [—]mn
+ 2, , [—]mn
+ [—]mn
}} /n
F =ˆ ∑n 1
=0
{Max{F ir r i = [—]
mn
+1, [—]mn
+ 2, , [—]mn
+ [—]mn
}} /n
Figure 4. A typical flank wear geometry on an edge of an insert.
ρVb –Fck =
∑n
i=1Vbi – )( Vb (Fc k
i – Fc k )
∑n
i=1Vbi – )( Vb (Fc k
i – Fc k )2 2
Vb = ∑n
i=1
Vbi n and Fc k = ∑n
i=1
Fc ki n .
ρVb –Fx
, ρVb –Fy
, ρVb –Fr
, ρVb –Fx
,ˆ ρVb –Fy
,ˆ ρVb –Fr̂
and
Figure 5. Definition of cutting force directions.
Fx=F∑
i=1
mi
x
m
Fm
=F∑
i=1
mi
y
y
Fm
=F∑
i=1
mi
r
r
F =x̂ ∑n 1
=0
{Max{Fxi i = [—]
mn
+1, [—]mn
+ 2, , [—]mn
[—]mn
+ }} /n
F =ˆ ∑n 1
=0
{Max{F iy y i = [—]
mn
+1, [—]mn
+ 2, , [—]mn
+ [—]mn
}} /n
F =ˆ ∑n 1
=0
{Max{F ir r i = [—]
mn
+1, [—]mn
+ 2, , [—]mn
+ [—]mn
}} /n
Fx=F∑
i=1
mi
x
m
Fm
=F∑
i=1
mi
y
y
Fm
=F∑
i=1
mi
r
r
F =x̂ ∑n 1
=0
{Max{Fxi i = [—]
mn
+1, [—]mn
+ 2, , [—]mn
[—]mn
+ }} /n
F =ˆ ∑n 1
=0
{Max{F iy y i = [—]
mn
+1, [—]mn
+ 2, , [—]mn
+ [—]mn
}} /n
F =ˆ ∑n 1
=0
{Max{F ir r i = [—]
mn
+1, [—]mn
+ 2, , [—]mn
+ [—]mn
}} /n
ρVb –Fck =
∑n
i=1Vbi – )( Vb (Fc k
i – Fc k )
∑n
i=1Vbi – )( Vb (Fc k
i – Fc k )2 2
Vb = ∑n
i=1
Vbi n and Fc k = ∑n
i=1
Fc ki n .
ρVb –Fx
, ρVb –Fy
, ρVb –Fr
, ρVb –Fx
,ˆ ρVb –Fy
,ˆ ρVb –Fr̂
and

Th
e J
ou
rna
l of Te
ch
no
log
y Stu
die
s
75
Vb = 0.1615 + 0.0454*F + 5.965*D -0.0429*Fc +0.1397*F*D -0.0781*F*Fc -8.2053*D*Fc + 1.3551*F*D*Fc
Fm
=∑i=1
y
y
Fm
=F∑
i=1
mi
r
r
F =x̂ ∑n 1
=0
{Max{Fxi i = [—]
mn
+1, [—]mn
+ 2, , [—]mn
[—]mn
+ }} /n
F =ˆ ∑n 1
=0
{Max{F iy y i = [—]
mn
+1, [—]mn
+ 2, , [—]mn
+ [—]mn
}} /n
F =ˆ ∑n 1
=0
{Max{F ir r i = [—]
mn
+1, [—]mn
+ 2, , [—]mn
+ [—]mn
}} /n
Developing the MLR-ITWP System After the best cutting force representation
for predicting tool wear had been identified asthe average peak forces in one revolution in theY direction ( y), all the input values for theMLR-ITWP system were clearly defined. Thesecond run of experiments and data analyseswere then conducted.
Tool Wear Monitoring ExperimentCutting Condition Selection
General cutting conditions usually refer tothree major cutting parameters: feed rate, spin-dle speed, and depth of cut. From the body ofresearch concerning tool wear (Lin & Lin, 1996;Susanto & Chen, 2002), spindle speed was not asignificant factor in predicting tool wear. Tosimplify the study, spindle speed was thereforefixed in the study; only feed rate and depth ofcut varied. The values of the cutting conditionswere as follows:
Feed rate (x4): 5, 7, 9, 11, and 13 inches/minute
Depth of cut (x3): 0.02, 0.03, 0.04, 0.05, and 0.06 inches
Spindle speed: 1,200 rpm
Tool WearIn the beginning of the experiment, all of
the tool wears of the industry-used inserts wereclassified into five range groups (0.20-0.29, 0.30-0.39, 0.40-0.49, 0.50-0.59, and 0.60-0.69mm), with the first group considered the lightestwear and the last group the heaviest wear. During the experiment, two sets of the inserts in the 0.60-0.69 mm group were worn out quickly and fractured in the third cut, which was quite different from the other inserts (whichremained almost intact during the experiment).For this reason, it could be concluded that thetool life ends for this kind of coated carbideinsert when it reaches the wear range of 0.60 mm.
Because many more industry-used insertsbroke during the experiment with no replace-ments available, the researchers decided to artificially grind new inserts to the appropriatelevel of wear. In the study, the inserts were finely ground to even artificial tool wear withvalues of 0.25, 0.35, 0.45 and 0.55 mm (the0.60 mm tool wear limit was observed).
Experimental DesignWith two factors from the cutting condition
and one factor from the tool wear, the experi-mental design was a factorial design with three
factors: feed rate (x5), depth of cut (x5), andtool wear (x4). Therefore, 100 experiments wereneeded for the purpose of training the monitor-ing system. The data to be collected were thecutting forces (that is, the best predicting cuttingforce representation concluded from the firstpart of the study: the average peak forces in theY direction).
Results of Monitoring Tool WearThe multiple-linear-regression model of
tool wear, the MLR-ITWP system in Figure 1,was built with the help of the statistical softwarepackage JMP. The regression model considersthe interactions among these three factors in theanalysis, according to the following equation:
2)
Where Vb = tool wear (flank); F = feed rate; D= depth of cut; y = cutting force (the most sig-nificant force representation revealed previous-ly); and βi (i = 0, 1, … 7) = the coefficients tobe decided.
Using the JMP software, all the coefficientsβi in the model were decided, and the followingregression model was obtained:
3)
The analysis of variance of the regressionmodel showed that the F ratio was smaller than.0001, which shows that this model is very sig-nificant for predicting tool wear.
Verification of the MLR-ITWP SystemOnce the regression model was formed, the
MLR-ITWP system was built. To evaluate theperformance of the developed system, nine setsof data were used for testing. The testing datasets were different from the 100 sets of trainingdata used to produce the regression models.
The actual tool wear and the tool wear pre-dicted with the testing data through the regres-sion model were then compared. Nine sets oftesting data were used to compare the actualwear with the predicted wear. The average erroris ± 0.039 mm.
Figure 6 compares predicted and measuredtool wear magnitude for all nine test cuts. Theresults suggest that the proposed MLR-ITWPsystem reasonably predicted tool wear in anonline, real-time fashion.
Vb = β0 + β1F + β2D + β3Fc + β4F*D +β5D*Fc+ β6Fc*F+ β7F*D*Fc

Th
e J
ou
rna
l o
f Te
ch
no
log
y S
tud
ies
ConclusionsA new in-process tool wear prediction
(MLR-ITWP) system in milling operations has been set up, developed, and examined. The system showed the capability of predictingtool wear during the machining process.
The conclusions of this study are sum-marized as follows:
1. The average peak forces in the Y direc-tion in a revolution best predict the toolwear among the force directions and themodes considered in the current study.
2. This proposed MLR-ITWP system canpredict the tool wear value to have aver-age error of ± 0.039 mm compared withthe actual tool wear.
3. The proposed ITWP system has somelimitations, which suggest the followingpossible directions for further research:
a. The tool wear used for developingthe system was changed from indus-try produced to artificially ground.The difference between the twowears needs further study.
b. During the experiment, theresearchers found that tool wear prediction is strongly affected by
the existence of tool chatter.Therefore, the study of chatter prediction and control is also necessary for the development of automated machining.
c. A MLR model has the limitation that it lacks the capability to learn—it does not allow any future datainputs. It is valuable to explore toolssuch as SPC, EMP, and DOE toassist in overcoming the problem in the future research.
d. A MLR model is limited in its abili-ty to simulate complex, nonlinearphenomena. Other ITWM systemsthat employ expert systems as deci-sion mechanisms have value forfuture research.
e. This research is limited to one typeof tool insert and one type of work-piece material. Enlarging this systemto include more cutting tools andmaterials for workpieces could makethe results of this line of researchmore practical for implementation in industry.
In summary, this study provides the authorswith a better position in continuing the toolmonitoring system to enable an automatedmachining process for more efficient manufac-turing in the future.
Dr. Jacob C. Chen is an assistant professorin the Department of Industrial Engineering andManagement at Ching-Yun University, Taiwan.
Dr. Joseph C. Chen is a professor in theDepartment of Agriculture and BiosystemsEngineering at Iowa State University, and is amember of Alpha Xi Chapter of Epsilon Pi Tau.
76
Actual
Predicted
Figure 6. The comparisons of the actual and predicted tool wears.
References
Atlas, L., Ostendorf, M., & Bernard, G. D. (2000). Hidden Markov models for monitoring machining tool-wear. Proc. of ICASSP, 6, 3887-3890.
Cho, D. W., Choi, W. C., & Lee, H. Y. (2000). Detecting tool wear in face milling with different workpiece materials. Key Engineering Materials, 183(1), 559-564.
Dutta, R. K., Kiran, G., & Paul, S. (2000). Assessment of machining features for tool condition monitoring in face milling using an artificial neural network. Proceedings of the Institution of Mechanical Engineers, Part B: Journal of Engineering Manufacture, 214(1), 535-546.
Kattan, I. A., & Currie, K. R. (1996). Developing new trends of cutting tool geometry. Journal of Materials Processing Technology, 61, 231-237.

Th
e J
ou
rna
l of Te
ch
no
log
y Stu
die
s
77
Lee, J. H., Kim, D. E., & Lee, S. J. (1998). Statistical analysis of cutting force ratios for flank-wear monitoring. Journal of Materials Processing Technology, 74, 104-114.
Li, C. J., & Tzeng, T. C. (2000). Multimilling-insert wear assessment using non-linear virtual sensor, time-frequency distribution and neural networks. Mechanical Systems and Signal Processing, 14(6), 945-957.
Lin, S. C., & Lin, R. J. (1996). Tool wear monitoring in face milling using force signals. Wear, 198(1-2), 136-142.
Pai, P. S., Nagabhushana, T. N., & Rao, P. K. R. (2001). Tool wear estimation using resource allocation network. International Journal of Machine Tools and Manufacture, 41(5), 673-685.
Roth, J. T., & Pandit, S. M. (1999). Using multivariate models to monitor end-mill wear andpredict tool failure. Technical Papers of NAMRI/SME, 27, 63-68.
Sarhan, A., Sayed, R., Nassr, A. A., & El-Zahry, R. M. (2001). Interrelationships between cutting force variation and tool wear in end-milling. Journal of Materials Processing Technology, 109(3), 229-235.
Susanto, V., & Chen, J. C. (2002). Fuzzy logic based in-process tool-wear monitoring system in face milling operations. International Journal of Advanced Manufacturing Technology, 21(3), 186-192.
Taylor, F. W. (1906). On the art of cutting metals. ASME Journal of Engineering for Industry, 28, 310-350.
Waurzyniak, P. (2001, November.). Moving toward the e-factory. Manufacturing Engineering, pp. 42-56.
Wilkinson, P., Reuben, R. L., & Jones, J. D. C. (1999). Tool wear prediction from acoustic emission and surface characteristics via an artificial neural network. Mechanical Systems and Signal Processing, 13(6), 955-966.

“External constituents are demanding notonly that departments say they are doing goodthings and not only that they measure how hardthey are trying, but also that they measure out-comes” (Walvoord et al., 2000). “[Colleges]should be focused on the ‘value added’ of thestudent experience. In today’s society, the needto educate for understanding—not just grades—has never been more important” (Merrow,2004). “What counts most is what students DOin college, not who they are, or where they go tocollege, or what their grades are” (Edgerton ascited in Merrow, 2004).
As evidenced by these quotations, thenature and assessment of education is changingsignificantly, and the assessment trajectory isaway from sole reliance on the traditional per-spective of student grades. Technology facultymust respond to the changing requirements ofstudent assessment and ensure that graduates of the program meet both the expectations andstandards of the institution as well as those ofother stakeholders, particularly the private sec-tor that typically employs those graduates.
We are reevaluating ways in which studentsin their departments are assessed. The three-step“backward design” process recommended byWiggins and McTighe (1998) has served as aconceptual framework and useful design per-spective. Broadly, these steps condense to (a)identify desired results, (b) determine accept-able evidence, and (c) plan learning experiencesand instruction. Wiggins and McTighe offered anumber of practical guidelines to the design anddevelopment of curricula, including the assess-ment process. They stated that “the backwarddesign approach encourages us to think about aunit or course in terms of the collected assess-ment evidence needed to document and validatethat the desired learning has been achieved, sothat the course is not just content to be coveredor a series of learning activities” (p. 12).
We have identified a number of elementsdriving assessments at the departmental level aswell as those that address the degree candidates’needs. We have explored non-classroom-cen-
tered assessment methods and have collectedand analyzed preliminary data towards reachingthe goal of more holistic assessment of studentprogression. The planning, work, and outcomesto date that support the learning goals andexpected outcomes set forth by stakeholders follow. However, a point of reference must beset prior to any attempt to address the dualissues of student and program assessment byindustrial technology faculty in higher educa-tion. For example, consistent with both ourexperiences and the recommendations outlinedin step one of the three-step “backward design”process, one must have a fairly specific visionof the knowledge, skills, and attitudes a technol-ogy student should develop prior to embarkingon his or her career before formulating anassessment plan. In other words, what is to be assessed? This might include such things as knowledge of technology and its associatedprocesses; practical skills associated with mate-rials, tools, processes, and systems related totechnology; ethics related to technology devel-opment and application; attitudes toward tech-nology; and issues impacting student learning.
A clear understanding of the reasons forassessing technology students is also critical.These reasons may originate in basic require-ments to uncover information regarding stu-dents’ knowledge, skills, or attitudes. One maywish to verify that students can demonstratepractical technology skills and related profes-sional skills, or one may desire to motivate andenhance learning. Ultimately, it is a goal of thefaculty to have more than just course grades toreflect student performance. As noted byWiggins and McTighe (1998), “Too often asteachers, we rely on only one or two types ofassessment, then compound that error by con-centrating on those aspects of the curriculumthat are most easily tested by multiple-choice or short answer items” (p. 65). A well-structuredprogram should include assessment by a varietyof methods and from a more holistic perspectivethan is often currently employed. An ancillarybenefit of a more holistic assessment may be a more positive student attitude toward the discipline.
Th
e J
ou
rna
l o
f Te
ch
no
log
y S
tud
ies
78Holistic Assessment of Students in UndergraduateIndustrial Technology ProgramsDennis W. Field, Steven A. Freeman, and Michael J. Dyrenfurth

Th
e J
ou
rna
l of Te
ch
no
log
y Stu
die
s
From the departmental perspective,improved student assessment allows faculty to do a better job evaluating and adjusting thetechnology curricula and program options (e.g.,manufacturing and occupational safety) to meeteducational objectives. Improved assessmentalso increases faculty credibility with otherstakeholders in the educational process, such as administration, parents, and employers. Givena clear understanding of the overall educationalobjectives and forces driving the need forassessment, one may turn to questions of avail-able assessment strategies and benefits they provide for the learner and the instructor.
We three authors formed an action researchcollaborative with the central goal being todevelop, implement, and evaluate innovativeforms of assessment that document studentgrowth in a holistic manner. The alternativeforms of assessment that we advance are notenvisioned as wholesale replacements for exist-ing knowledge-based tests; rather, we suggestthey supplement existing grade data with assess-ments targeted toward technological capabilityand problem solving. Outcomes of an improvedassessment process allow faculty to makeadjustments to both curricula and extracurricu-lar activities with greater clarity regarding theimpact of such changes on the industrial tech-nology program and students. Ultimately, thefaculty hope to accelerate the students’ learningmore effectively and efficiently and “jumpstart”them into their profession.
Technology Learning CommunityChanges to assessment processes are com-
plicated by simultaneous changes to the pro-gram. For example, the context for our actionresearch is a Technology “Learning Com-munity” (TLC) that we established within theindustrial technology curriculum at Iowa StateUniversity. Learning communities are relativelyrecent additions to the landscape of Americanuniversities. Research by Lenning and Ebbers(1999) has indicated improved student retentionand satisfaction with the academic experiencethrough the use of learning communities. TheTLC is an induction and support activity forfreshmen and transfer students in the industrialtechnology program. The purpose of the TLC isto help entering students (regardless of theiracademic stage) maximize their educationalexperience and begin their professional accul-turation within the discipline of industrial tech-
nology. TLC participants are organized intosmall groups of students. Each student groupworks with a peer mentor, an industrial mentor(an industrial technologist practicing in indus-try), a graduate assistant, the academic advisor,and industrial technology faculty members. Inaddition to more formal assessments, TLC stu-dents evaluate their experience each week inreflective summaries. Below are some com-ments selected from TLC students’ summaries:
• This was a very helpful class since it provided to me a strong idea of what Ican expect, and in turn what is expectedof me. Peer mentor groups met in classand we exchanged phone #'s and E-mailaddresses.
• Last class we had speakers come in from SME [Society of ManufacturingEngineers], ASSE [American Society of Safety Engineers], and SPE [Societyof Plastics Engineers] clubs who talkedabout what their organizations do andhow to get involved in these clubs. I thinkthis was a very good class day becausemost people are unaware of how they canget involved in something like this andwhat they actually do in these clubs. I amvery interested in SME and hope to joinnext fall. I would have liked to join thissemester but with my current scheduleand obligations this is impossible.
• Last week our group met with our peermentor for half an hour. We talked aboutour schedules and how classes are going.Our peer mentor suggested that we doour resumes and turn them in to him thenext time we meet. We discussed howimportant it is to go to Career Day on Feb19th. He wants our resumes so he can goover them and make possible correctionsso we can have them with us for careerday. We have assigned a day and time forour meetings, which is Wed. at 5 p.m. inthe TLC room.
• Last week’s class helped me to more fully understand the full potential that an Industrial Technology major couldprovide for me in the future. In our groupmeeting we talked about how to improveour resumes and how to sign up for ECS[Engineering Career Services].
79

Th
e J
ou
rna
l o
f Te
ch
no
log
y S
tud
ies
At the end of each semester, TLC studentswere asked to evaluate the ability of the TLCexperience to meet the goals of the TLC initia-tive using excellent, good, fair, or poor ratings.When questioned about their experiences withrespect to the goals of “Orientation to the indus-trial technology discipline and profession” andthe “Process of developing realistic self-assess-ments, career goals,” 93% of the studentsreported good/excellent. The responses wereeven more positive regarding the goals of“Connections with faculty, other students, and industry professionals” and the “Process of introducing the variety of professional rolesavailable through an industrial technologydegree,” with 96% of the students reportinggood/excellent experiences.
The experiences within the introductorycourse were crafted to establish both the smallgroup cohesiveness and interaction with peersthat is so essential to effective team-based tech-nological problem solving that employersdemand of industrial technology (ITEC) gradu-ates. Another key to the success of the TLC isthe use of industrial mentors. ITEC students arevery pragmatic—most have their sights setfirmly on a career in industry. Hence, inputsfrom industrial mentors are highly valued andpersuasive. They convey high expectations whiledemonstrating realistic practice and applicationsin industry.
Student learning has been enhancedthrough cooperative interaction with their TLCgroup members and mentoring team. The indus-trial and peer mentors have increased the TLCstudents’ understanding of the discipline and theimportance of curriculum components beyondwhat individual faculty members can accom-plish in the classroom. The TLC students have a better understanding of their personal learningstyles and how that impacts their studyinghabits and classroom interactions. By the end of the semester, TLC students have generated or updated their resumes, started professionalportfolios, and set the foundation of team build-ing and awareness of technology that they willcontinue to enhance and build upon throughouttheir academic career and beyond. Additionalinformation regarding the Iowa State UniversityTLC may be found in Freeman, Field, andDyrenfurth (2001).
Student Outcomes AssessmentDesired student outcomes include enhanced
capability with technology, increased studentsatisfaction, higher academic performance,refined career goals, and a greater awareness of one’s learning style and how to most effec-tively utilize that information. When studentsconclude their studies within technology pro-grams, it would be desirable for them to haveindicators of capability to demonstrate academicproficiency, beyond just course grades.
In order to assess student outcomes in a more holistic way, appropriate instrumentsmust be available. Efforts are underway to identify and evaluate such instruments for use in the undergraduate industrial technology cur-ricula. In addition to the qualitative and quanti-tative analyses related to the TLC, activitiesinclude an evaluation of the use of Dyrenfurth’s(1991) technological literacy instrument basedon the work reported in Dyrenfurth and Kozak(1991), the ACT Work Keys employability skillsexams, and the National Association ofIndustrial Technology (NAIT) certificationexam; reviews of each student’s portfolio byfaculty and an industrial team; and comparisonof participant satisfaction and academic per-formance with other students not participatingin TLC activities.
A number of other key targets have beenincluded as initial assessment areas. These tar-gets include student demographics, academicperformance, learning styles, technologicalunderstanding and capability, and ethical dimen-sions of technology.
With these assessments, faculty hope tobenchmark both the initial and exit competenceof students, document students’ progression overthe course of their academic experiences, docu-ment differences among groups and types ofstudents, and investigate implications arisingfrom these differences for program design anddevelopment. The assessments are also designedto focus attention on the various components ofcompetence (e.g., technical, managerial, founda-tional, personal) and to increase attention to theassessment process in order to strengthen itsvalidity and reliability.
The faculty has synthesized a set of targeted industrial technology competencies for students at Iowa State University through the efforts of individual instructors responsiblefor specific courses, the departmental curricu-lum committee, and other stakeholders
80
Th
e J
ou
rna
l of Te
ch
no
log
y Stu
die
s
(e.g., Industrial Advisory Council and NAIT). It would be advantageous for faculty to be ableto collect a wide variety of demographic dataand longitudinal data for tracking student per-formance, as well as data indicating perform-ance against desired outcomes; however, theyrecognize that constraints exist on the amount of data that can be collected and analyzed.
The NAIT accredits industrial technologyprograms. Department missions are expected tobe compatible with the approved definition ofindustrial technology. The mission, as listed inthe 2002 NAIT Self Study Report (Departmentof Industrial Education and Technology, 2002),states: “The Department of Industrial Educationand Technology at Iowa State University pre-pares technically oriented professionals to pro-vide leadership in manufacturing technologyand occupational safety through an undergradu-ate industrial technology program” (p. 6.2-2).
A second necessary, but not sufficient, con-dition for accreditation listed in the 2002 NAITSelf Study Report requires that competenciesshall be identified that are relevant to employ-ment opportunities available to graduates. Whilethe accreditation process serves as one drivingforce for curriculum review and outcomesassessment, there are others. Apart from theexpected continuous improvement efforts of thefaculty, the department retains an IndustrialAdvisory Council to assure that the industrialtechnology curriculum addresses the current andfuture needs of business and industry. TheCouncil recommends and reviews curriculumand program changes that will enable thedepartment to be responsive to business andindustry (Department of Industrial Educationand Technology, 1998). The department faculty,NAIT, and the Industrial Advisory Council allplay an important role in defining and refiningthe competencies expected of industrial technol-ogy graduates.
Ultimately, a reevaluation and alignment of course content offered in the programs wasneeded to ensure that the competencies expectedof industrial technology graduates were realized.This involved a comparison of curricular con-tent with required NAIT objectives. Gaps and/or superfluous material were identified andaddressed. Faculty members led this effort, but they were not without guidance with respectto the process. The aforementioned three-stepdesign process by Wiggins and McTighe (1998)
and work by Kenealy and Skaar (1997) offereduseful frameworks. Kenealy and Skaar suggest-ed an interesting outcomes-defined curriculumrenewal process that has continued to influencethis effort. Kenealy and Skaar described a multi-step “action planning” process that has beenadapted so that a large number of diverse facul-ty and students could contribute cooperativelyand with a sense of ownership. The needs ofclientele groups led to the definition of majoreducational outcomes for the program, which inturn formed the foundation for learning experi-ences that would serve to meet student needs.Kenealy and Skaar stated that by groupinglearning experiences, course titles and objec-tives are defined for a renewed curriculum.Subsequently, courses are defined by specificlearner competencies, which are edited for prop-er sequencing. They also examined cognitivelearning skills to ensure that upper level skillswere represented throughout the curriculum.
Assessment InstrumentsAssessment instruments exist that are
appropriate and readily available and for whichvalidity and reliability studies are already welldocumented. We entered into discussions withACT, Inc., regarding the use of the Work Keys®
system at the undergraduate level. This is a sys-tem designed to quantitatively measure certainemployability skills. It includes job profilingand work-related assessments and serves a vari-ety of needs in the industrial and educationalarenas. For example, the test component of theWork Keys system is designed to assess person-al skill levels in important areas of employabili-ty skills (ACT, 1997). There are currently eighttests: (a) applied mathematics, (b) applied tech-nology, (c) listening, (d) locating information,(e) observation, (f) reading for information, (g)teamwork, and (h) writing. ACT (1997) statedthat educators can use the Work Keys informa-tion to develop appropriate curricula andinstruction that target skills needed in the work-place. The Work Keys instruments have exten-sive reliability and validity studies completed(ACT, 1997) at the secondary level, but littleinformation was available demonstrating that its use could be extended to the baccalaureatelevel. Our preliminary research results withundergraduates would seem to warrant addition-al investigation of the Work Keys system. Fiveof the eight tests were administered to under-graduates, including (a) applied mathematics,(b) applied technology, (c) locating information,
81

Th
e J
ou
rna
l o
f Te
ch
no
log
y S
tud
ies
(d) teamwork, and (e) writing. Our primary con-cern was that a majority of the students wouldscore at the highest scale level of the exams,thus diminishing the usefulness of the exams for assessment purposes at the baccalaureatelevel. This did not prove to be the case as only9.1% (n = 33) achieved this level in the AppliedTechnology exam, 14.8% (n = 27) achieved thislevel in the Locating Information exam, and no students achieved the highest level in theTeamwork and Writing exams (n = 26 and n =22, respectively). Applied Mathematics yieldedthe only exam where significant numbers of students (45.2%, n = 31) scored at the highestlevel.
The ITEC program enrolls numerous trans-fer students from engineering. Many of thesestudents have not had a great deal of academicsuccess in the engineering program, but mostseem to thrive in the industrial technology program. It has been posited that a mismatchbetween instructional style and learning stylehas been a leading cause of at least some ofthese students’ previous academic problems andthat a change to a more “hands-on” curriculumhas allowed them to flourish. While there mayindeed be systemic differences in the instruc-tional approaches taken by engineering andindustrial technology faculty, a recent studyundertaken to investigate this question foundthat there were no statistically significant differ-ences in learning styles between groups of engineering students and industrial technologystudents at either Iowa State University or NorthCarolina A & T State University (Fazarro,2001). Fazarro used the Productivity Enviro-nmental Preference Survey to evaluate learningstyle differences (Dunn, Dunn, & Price, 1996).
A number of other planned assessmentinstruments require some additional develop-ment prior to their wholesale use. Some arelacking sufficient reliability and validity data,whereas some offer only partial coverage ofdesired content areas. For example, the NAITcertification test currently covers only four tech-nology categories: (a) production planning andcontrol, (b) safety, (c) quality control, and (d)management and supervision. There are othertopics that fall under the technology umbrellasuch as materials and processing, industrialtraining and development, energy, instrumenta-tion and control, and information technology.Rowe (2001) suggested an updated test blue-print for the NAIT certification exam. Rowe
used a modified Delphi technique to identifycore content, subject areas, and competencies.Thirteen core competency areas were identifiedincluding (a) leadership skills for supervisors,(b) teamwork, (c) fundamentals of management,(d) safety management, (e) technical graphics/CADD, (f) quality, (g) electronics, (h) humanresource management, (i) technical writing, (j)written communication, (k) verbal communica-tion, (l) computer integrated manufacturing, and(m) manufacturing automation. Rowe’s findingsindicated a need for expanding the use of writ-ten and verbal information, particularly withrespect to communicating technical information.
The current NAIT certification test is acognitive, norm-based, multiple-choice test. It contains four 40-question subsections: pro-duction planning and control, quality control,safety, and management/supervision. Summarystatistics, including classical difficulty and dis-crimination coefficients (point biserial correla-tion) based on a sample size of approximately1,200 students, are available from the authors.Efforts are also underway to analyze these examitems using item response theory (IRT) meth-ods. There appears to be a significant level ofinterest by NAIT-accredited programs for use of the certification exam in both program andstudent evaluations.
Description and sequencing of the test con-struction process (preparing test specifications,item construction and review, detecting itembias, estimating reliability, etc.) are readilyavailable in, for example, Crocker and Algina(1986). All tests used for assessment are expect-ed to pass a review against generally acceptedtest construction guidelines.
Other instruments currently under consider-ation include Dyrenfurth’s (1991) technologyliteracy test, a survey of attitudes toward tech-nology (DeVries, Dugger, & Bame, 1993; Raat& DeVries, 1986), multiple technological prob-lem-solving appraisals developed in the mannersuggested by Kimbell and Stables (1999), andthe assessment of technology projects and activ-ities using group process and student individual-ized performance rubrics suggested by Custer,Valesey, and Burke (2001).
We envisioned the deployment of the afore-mentioned assessment instruments across thedepartment and longitudinally over the students’four-year period of study. The plan would have
82
Th
e J
ou
rna
l of Te
ch
no
log
y Stu
die
s
the department’s faculty establish a database ofspecific course goals and objectives and thencrosswalk each to the department outcomes.Existing tests and other assessments would be cross-indexed to these goals and objectives.Tables of specification would be used to identi-fy weighting and/or coverage gaps, inappropri-ate proportions, etc.
Subsequently, innovative assessment mech-anisms, such as authentic assessments, portfo-lios, rubrics, and adaptive testing, would beexpanded to complement and/or modify the current assessment strategies. Some authenticassessment activities are currently in place inthe industrial technology program at Iowa StateUniversity. Freeman and Field (1999) discussedassignments given to groups of safety studentsthat involve job safety analyses, along withequipment and process reviews in labs run formanufacturing students. These assignments areidentical to the tasks safety students might findwhen working in an industrial setting followinggraduation. Students have also been asked, forexample, to develop and construct tooling forspecific tasks in metallic materials and process-es labs. Many of these laboratory-based activi-ties offer opportunities for authentic assessment.
Multiple-choice assessments will be subjectto item analysis and will be recorded in the itemdatabase. These assessments have their place astests of technological knowledge; however,Kimbell and Stables (1999) do not considerthem to be valid tests of technological problemsolving. Kimbell and Stables offer a great dealof insight into the development of performanceassessment instruments for technological prob-lem solving and the development of assessmentrubrics to translate performance qualities intonumeric data for statistical analysis.
A summary listing of the anticipated system development activities are shown below:
• Conceptualize outcomes based on inputsfrom faculty, NAIT, and the AdvisoryCouncil.
• Analyze objectives for each course inprogram.
• Analyze NAIT certification examinationtable of specifications.
• Crosswalk course outcomes to objectives.• Crosswalk objectives to NAIT certifica-
tion examination table of specificationsand exams for each course.
• Select instruments:
- Conduct additional literature review.- Review American Educational Research
Association presentations.- Explore available tests or identify and
develop appropriate new instruments.• Define benchmarking process.• Finalize assessment timing. • Develop assessment-sampling matrix
that secures data, which may then beaggregated without imposing all tests on all students.
• Bring test administration and analysisonline through the use of off-the-shelfsoftware.
• Develop analysis plan.
Student performance will also be recordedin a database and, within legal guidelines andpending student approval, certain elements ofthe information will be available to assist peerand industrial mentors in conducting discussionswith students. Peer and industrial mentors willbe expected to offer each student constructiveperspectives as to how his or her performance is progressing against personal and professionalstandards. Assessment validation will involvethe program’s industrial advisory council mem-bers so that real-world standards are not onlyemployed but are also made clear to students. A key goal is to demonstrate student awarenessof growth over time. Potentially confidentialtopics from a student perspective will be han-dled through discussions with faculty and faculty mentors.
SummaryThere are clear and persistent indicators
that changes are needed and expected in oursystem of education. In 1999, the NationalResearch Council reported, “The goals andexpectations for schooling have changed quitedramatically during the past century, and newgoals suggest the need to rethink such questionsas what is taught, how it is taught, and how stu-dents are assessed” (pp. 152-153). In 2001, theCouncil reviewed and expanded on trends,which “are changing expectations for studentlearning and the assessment of that learning”(National Research Council, 2001, p. 22).Efforts to design and implement a more holisticassessment of students in industrial technologyprograms are certainly timely and in keepingwith the spirit of the recommendations by theNational Research Council and others. Ourwork represents an initial step towards
83

Th
e J
ou
rna
l o
f Te
ch
no
log
y S
tud
ies
capitalizing on some of the innovation that,while important, nevertheless reflects singularenhancements. Our goal was also to integrateseveral of these innovations into a more system-atic approach. To this end, we have conceptual-ized a framework for moving forward, we haveestablished the feasibility of using the WorkKeys® employability skills instrumentation, andwe have described some necessary implementa-tion steps. We invite members of the professionto join in the challenge of implementation ofsuch enhanced systems of assessment.
Dr. Dennis W. Field is an associate professor in the Department of Technology atEastern Kentucky University. He is a memberof the Alpha Xi Chapter of Epsilon Pi Tau.
Dr. Steven A. Freeman is an associate professor in the Department of Agricultural and Biosystems Engineering at Iowa StateUniversity. He is a member of the Alpha XiChapter of Epsilon Pi Tau.
Dr. Michael J. Dyrenfurth is assistant deanfor graduate studies in the School of Technologyat Purdue University. He is a member of MuChapter of Epsilon Pi Tau and received hisDistinguished Citation in 2001.
84
References
ACT. (1997). Work Keys preliminary technical handbook. Iowa City, IA: Author.
Crocker, L. M., & Algina, J. (1986). Introduction to classical & modern test theory. Orlando, FL: Harcourt Brace Jovanovich.
Custer, R. L., Valesey, B. G., & Burke, B. N. (2001). An assessment model for a design approach to technological problem solving. Journal of Technology Education, 12(2). Retrieved June 9, 2003, from http://scholar.lib.vt.edu/ejournals/JTE/v12n2/custer.html
Department of Industrial Education and Technology. (1998). Outcomes assessment report. Ames, IA: Iowa State University, Department of Industrial Education and Technology.
Department of Industrial Education and Technology. (2002). National Association of Industrial Technology self study report. Ames, IA: Iowa State University, Department of Industrial Education and Technology.
DeVries, M., Dugger, W., & Bame, A. (1993). PATT USA research report. Unpublished research report, Virginia Polytechnic Institute and State University, Blacksburg.
Dunn, R., Dunn, K., & Price, K. E. (1996). Productivity environmental preference survey. Lawrence, KS: Price Systems.
Dyrenfurth, M. J. (1991). Technological literacy instrument. Columbia, MO: American Evaluation Association.
Dyrenfurth, M., & Kozak, M. (Eds.). (1991). Technology literacy. In 40th yearbook of the Council for Technology Teacher Education (pp. 138-183). Peoria, IL: Glencoe.
Fazarro, D. E. (2001). A factor analysis of the preferred learning styles of industrial technology and engineering undergraduate students at North Carolina Agriculture and Technical State University and at Iowa State University (Doctoral dissertation, Iowa State University, 2001). Dissertation Abstracts International, DAI-A 62(06), 2056.
Freeman, S. A., & Field, D. W. (1999). Benefits of a cross-functional safety curriculum. Journal of Industrial Technology, 15(4). Retrieved June 9, 2003, from http://www.nait.org/jit/Articles/ free0899.pdf
Freeman, S. A., Field, D. W., & Dyrenfurth, M. J. (2001). Enriching the undergraduate experience through a technology learning community. Journal of Technology Studies, 27(1), 53-58.
Kenealy, M. D., & Skaar, B. R. (1997). Outcomes defined curriculum renewal: Process and product. Journal of Animal Science, 75(Suppl. 1).

Th
e J
ou
rna
l of Te
ch
no
log
y Stu
die
s
85
Kimbell, R. A., & Stables, K. (1999). South Africa: Northwest province technology education project.London: Goldsmiths University of London, Technology Education Research Unit.
Lenning, O. I., & Ebbers, L. H. (1999). The powerful potential of learning communities: Improving education for the future (Report 26-6, #SPO266). Washington, DC: George Washington University, American Society for Higher Education.
Merrow, J. (2004, June). Grade inflation: It’s not just an issue for the Ivy League. Retrieved September24, 2004, from http://www.carnegiefoundation.org/perspectives/perspectives2004.June.html
National Research Council. (1999). How people learn: Brain, mind, experience, and school (J. D. Bransford, A. L. Brown, & R. R. Cocking, Eds.). Washington, DC: National Academy Press.
National Research Council. (2001). Knowing what students know: The science and design of educational assessment (J. Pelligrino, N. Chudowsky, & R. Glaser, Eds.). Washington, DC: National Academy Press.
Raat, J. H., & DeVries, M. (1986). What do boys and girls think of technology? Eindhoven, The Netherlands: Eindhoven University of Technology.
Rowe, S. E. (2001). Development of a test blueprint for the National Association of Industrial Technology certification exam (Doctoral dissertation, Iowa State University, 2001). Dissertation Abstracts International, DAI-A 62(11), 3754.
Walvoord, B. E., Carey, A. K., Smith, H. L., Soled, S. W., Way, P. K., & Zorn, D. (2000).Assessing the pressures for departmental change. Retrieved September 24, 2004, from http://ctl.stanford.edu/Tomprof/postings/547.html
Wiggins, G., & McTighe, J. (1998). Understanding by design. Alexandria, VA: Association for Supervision and Curriculum Development.

Th
e J
ou
rna
l o
f Te
ch
no
log
y S
tud
ies
86Technologies Applied in the Toshka Project of EgyptWafeek S. Wahby
BackgroundThe Toshka Project, located in Egypt (see
Figure 1), involves excavating a canal to carryabout 380 billion ft3 of water every year fromLake Nasser to the Toshka Depression, south-west of Aswan. This will eventually create anew valley to the River Nile in the westerndesert of Egypt in addition to the currentlyexisting prehistoric river course. Before dis-cussing the Toshka Project, it is important tofirst identify the following (see Figure 2):
• Toshka Region• Toshka City• Toshka Depression (in Arabic:
Mon-kha-fadd Toshka)• Toshka Bay (Khore Toshka)• Toshka Spillway (Ma-feed Toshka)• Toshka Canal (Sheikh Za-yed Canal)
The Toshka Region is located southwest ofAswan, about 600 miles south of Cairo. ToshkaCity is a new metropolitan city that is plannedto serve a future population of 5 million. ToshkaDepression is a natural depression in that areawith an average diameter of 14 miles and a stor-age capacity of 1,665 billion ft3. Toshka Bay is a shoot off Lake Nasser towards Toshka. ToshkaSpillway is a free spillway discharging the waterof Lake Nasser when it exceeds its highest stor-
age level of 620 ft. It is a 14-mile long, man-made canal connecting Toshka Bay with theToshka Depression and works as a safety valvefor Lake Nasser, upstream of the High Dam.
Toshka Canal is the heart and soul of theToshka Project. It is a new canal conveying the excess water of Lake Nasser that is pumpedinto it through a giant pumping station that ele-vates the water about 175 ft. The water thenflows through the canal to reclaim and irrigate534,000 new acres in the western desert ofEgypt (El-Hag-Gar, 2001). The Toshka Projectis an integral part of a much larger, mega proj-ect, the Southern Valley Development Project(SVDP), that aims at doubling the amount ofcultivated land in Upper Egypt through develop-ing the Toshka, East El-O-Wee-Nat, and theNew Valley Oases (Ministry of Water Resourcesand Irrigation, 2000).
The Southern Valley DevelopmentProject
The SVDP is not a mere irrigation or agri-cultural project. The SVDP is a multifaceted,multiphase, development project that mainlyinvolves horizontal expansion and land reclama-tion projects in the southern part of the NileValley in Egypt. It is a national, integrated,
Figure 1. Egypt.Figure 2. The Toshka Project (Younan, 2001).
Th
e J
ou
rna
l of Te
ch
no
log
y Stu
die
s
massive development project, aiming mainly atcreating a balanced, re-organized Egyptian mapfrom the demographic, habitation, economic,and security points of view. Total investmentsfor implementing this project by 2017 are esti-mated at some US$ 100 billion, of which 20%to 25% is pledged by the Egyptian governmentto construct the main canal and its four off-shoots, the pumping station, major roads, andmain electricity network. The remaining 75% to 80% is to be supplied by the private sector.
Agriculture in the SVDP is only a base forthe integrated development planned. Industry,mining, alternative energy production—and possibly oil and gas production and storage—and tourism are other parts of the vision, withplans for desert safaris, car rallies, conferences,and medical tourism.
Objectives of the SVDP include:1. Adding new areas of agricultural land
lying in the Southern Valley region.2. Establishing new agricultural and
industrial communities based on theexploitation of the agricultural rawmaterial available in the new land.
3. Attracting and retaining a workforce,thus gradually dealing with the problemof overpopulation in the old Nile Valley.
4. Constructing an efficient network ofmain and side roads in accordance withthe development objectives and plans.
5. Promoting tourist activities in suchregions rich in ancient monuments.
The Toshka Project InfrastructureThe Toshka Project infrastructure includes
the main pumping station (Mubarak pumpingstation), the Toshka Canal, water productionwells and artificial charging, and wind and sandstorm breakers (Wahby, 2001).
Mubarak Pumping Station (MPS)The Toshka Project begins with the main
pumping station—also known as Mubarakpumping station (MPS)—located on the leftbank (west) of Lake Nasser, and north of ToshkaBay. More specifically, the pumping station islocated 5 miles north of Toshka Bay spillwaycanal, 28 miles south of intersection with theAbu-Simbel/Aswan main highway. From thisintersection it is 133 miles to Aswan northwardand 37 miles to Abu Simbel southward. Whencompleted, it will deliver 12,000 ft3/sec into themain feeding canal.
The construction of the pumping station has been undertaken by the European EgyptianJapanese Consortium and led by London-basedSkanska Cementation International. Engineeringgroup ABB was awarded the contract to supplyall the electrical equipment by Japanese Hitachi(part of the European Egyptian Japanese Con-sortium) in 1998. The contract included thehigh-capacity frequency converters for the pumpmotors (Water Technology, 2003).
The multistage MPS is one of the world’slargest, designed to have a maximum static headof about 175 ft, which guarantees its operationwhen the water level in Lake Nasser reaches itslowest level of storage (445 ft; Abdel-Rahman,2001). SonTek/YSI has provided the ToshkaProject with four Argonaut-SLs to continuouslyrecord and display flow and level data for day-to-day operation of the canals. Data will also be logged and used as a historical record for amathematical model that will give optimal setpoints for the canal water level (Sontek, 2002).Twenty-four pumps (12 each side), each with a discharge capacity of 600 ft3/sec, are beinghoused inside the pumping station. The maxi-mum energy necessary to operate MPS duringmaximum lifting is 375 M.W.
The station will be fed with 11 kV electri-cal power through a transmission line from asubstation constructed close to the 11 kVswitchgear building that is linked to the electricpower double 220 kV line from Aswan HighDam with a length of 160 miles. The MPS isalso an integral part of a concurrent projectcalled the New Valley Development Project(NVDP), aimed at establishing an agro-industri-al development in an adjacent area of about988,000 acres.
Loughborough-based Morris MaterialHandling supplied five cranes having the com-bined qualities of size and flexibility requiredby the MPS project: three cranes with a capacityof 130t for lifting pumps and two smaller 30tgate cranes, each with a lift height of approxi-mately 180 ft. One 130t goliath and the two 30t“odd-leg” goliaths were mounted on top of thecompleted pumping station. The 130t goliathlifts the pumps from the pump room to the load-ing bay, and the two 30t odd leg goliaths liftgates within the station. The two 130t overheadtraveling pump room cranes started operation on site in mid-2001 with the other three cranesbeing installed on top of the pumping station at
87

Th
e J
ou
rna
l o
f Te
ch
no
log
y S
tud
ies
the end of 2002. These 5-500 series cranes werechosen because of their versatility to meet vary-ing customers’ requirements. Built on-site, thecranes for this project were designed and manu-factured in the UK, with Morris staff commis-sioning the machines on-site in Egypt (WaterTechnology, 2003).
Under a turnkey lump sum contract, withoperation supervision during a guarantee periodof 48 months, the MPS includes the design,construction, and maintenance of the following:
• An intake channel, 3 miles long, conveying water from Lake Nasser to the suction basin of the pumping station.Part of the channel (1 mile) is dry exca-vation (volume of excavation is 187 million ft3), and the rest (2 miles) is wetexcavation (volume of excavation is 196million ft3). The wet excavation is doneusing three gigantic dredgers (the world’slargest at 200 ft arm length) for excava-tion under water.
• A reinforced concrete pumping stationhaving length x width x height dimen-sions of 462 x 132 x 231 ft located as an island in the center of the suctionbasin. The lower 165 ft of its height willbe permanently submerged underwater.Project designers for the concrete structure are Germany's LahmeyerInternational and Cairo-based HamzaAssociates.
• Twenty-four discharge concrete ductshaving width x height dimensions of 9 x8 ft, delivering the water from the pumpsto the Toshka Canal via the dischargebasin.
• Two annex buildings housing the 11 kVswitchgear and the diesel generators.
• Three workshops: electrical workshopwith laboratory, mechanical workshop,and automotive workshop.
Groundbreaking of the Toshka Project tookplace on January 1998, and excavation work atthe MPS site started on June 1, 1998. The sta-tion was scheduled to be completed in 2002 at acost of US$ 400 million. However, on January12, 2003 during the celebrations of the 5th
anniversary of the project’s groundbreaking,only two pumps were put to work in a test oper-ation with symbolic power enough to let waterfill limited parts of the new Toshka Canal, onlyto a modest depth.
The Toshka CanalThe Toshka Canal is the main canal of the
project, having a length of 44 miles that branch-es into four subcanals, with a total length of 160 miles. The canal and its four subcanals aredesigned to carry a discharge of 900 millionft3/day to reclaim and irrigate four areas:118,600 acres, 118,600 acres, 198,000 acres,and 98,800 acres, respectively—totaling534,000 acres, an area equivalent to the com-bined areas of three neighboring governorates:Aswan, Kena, and So-Haag (Ministry of WaterResources and Irrigation, 1999).
The maximum designed water depth in thecanal is 20 ft and the bed width is 100 ft, with alongitudinal slope of 6.67 inches/mile. The sideslopes of the canal are 2:1, making the width atits top 200 ft. While the evaporation from thecanal is estimated to be 0.7%, its cross-sectionis being lined with dense concrete to preventany water leakage. After excavation to therequired section, an 8-inch thick layer of stabi-lized soil (a compacted sand/cement mixture) is placed. Before pouring the top 8 inches ofpadding concrete layer onto that sub-base, 0.04inches thick polyethylene sheets are placed ontop of the sub-base stabilized soil layer to com-pletely cover and “seal” it. A total of over 200million ft2 of polyethylene sheets are expected to be used in that process (Ramsis, 2001).
Two huge aggregate excavating and pro-cessing systems have been constructed and areable to supply coarse and fine size aggregatesfor concrete mixing. With the addition of twoother concrete batching plant systems, the concrete production rate could reach 86,000 ft3 per hour, which can satisfy the capability of20 million ft3 per month concrete placing. Eachbatching plant has its own cooling system thatguarantees a 45oF temperature for cooling concrete, even in extremely hot weather (Taha, 2001).
To date, 70 miles have been completelyexcavated, of which 25 miles have already been also padded. The strict commitment to the workplan helped in complying with theschedule set for concrete-padding works, evenunder extremely unfavorable weather conditions.The usual operating rates amount to more than370 longitudinal feet per day. However, in someinstances it exceeded 430 longitudinal feet perday. When finished, the Toshka Canal is
88

Th
e J
ou
rna
l of Te
ch
no
log
y Stu
die
s
expected to have utilized over 40 million ft3 ofconcrete. Quality assurance and quality control procedures guarantee that code requirements,technical specifications, proper work practices,and safety measures are rigorously followed inall engineering works.
Water Production Wells and ArtificialCharging
Currently, water required for various appli-cations is supplied through the available ground-water stored in the local aquifer. Along the maincanal, five productive wells were constructed to irrigate about 740 acres. However, to fullyutilize the available ground water, another 200wells are being dug to serve an area of about29,600 acres.
Meanwhile, the Egyptian Ground WaterResearch Institute (GWRI) carried out studies to use the excess in floodwater, discharged tothe Toshka Depression since 1996-97, to chargethe Nubian ground aquifer. Artificial charging is now being carried out with an expected initialcost of about US$ 3 million.
Wind and Sand Storm BreakersWind and sand storm breakers comprising
two rows of kaya and ponsiana trees are beingplanted on each side of the main canal as wellas its four branches to protect them from thewind and the sand storms that ravage this regionthroughout the year. Almost 65 miles of treeshave been planted to date (Abol-Hag-Gag,2001).
Data and StatisticsTotal excavation work in the Toshka Project
is estimated at 3,100 million ft3—seven timesthat which was needed in the construction ofAswan High Dam (only 445 million ft3). Todate, about 2,700 million ft3 of excavation work is complete. As for sand filling work, 290 million ft3 out of 540 million ft3 has been accomplished.
Basalt and gravel for concrete work are provided locally from the Toshka area, whereassand is transported from the nearby Kom-Ombo(65 miles) and the cement from Ass-Yoot (220miles). Patching plants are located at 3-mileintervals, and eight mixing units produce over37,000 ft3 per day. Special chemical additivesare incorporated into the water used for mixingand curing concrete to keep its temperature at 45oF.
Currently, five companies are working onthe site using seven padding machines to padthe sloping sides and the short horizontal partsat the berm and the bed levels (Kadry, 2001).The bottom segment of the canal padding ismanually lined using mechanical concrete mixers, pumps, and vibrators for concrete placement.
To serve ongoing reclamation projects, the area is equipped with an electric power grid and an excellent network of roads. Over 90 miles of new passageways and asphalt roads,besides another 375 miles of rehabilitated roads,were completed, which form an efficient andvital communication and transportation network(Hass-ssan, 2001).
The Toshka Project ControversyThe Toshka Project has attracted the atten-
tion of many individuals and groups in Egypt aswell as worldwide and created much controver-sy on whether it is a mirage or marvel (El-Khodari, 2000). Some are very enthusiastic andoptimistic about it, to the extent of calling it“The New Delta Project” or “The InvertedPyramid Project.” On the other hand, theToshka Project also has fierce critics, rangingfrom environmentalists worried about itsdemands on Nile water to economists who ques-tion its profitability.
Advantages of the Toshka Project include:1. Dealing with the complex problems
arising from skyrocketing populationgrowth in Egypt that include jobs,food, housing, health, education, and transportation.
2. Doubling the amount of cultivated landin Upper Egypt.
3. Utilizing the massive amounts of waterstored in Lake Nasser.
4. Facilitating power generation projects.5. Offering venues for navigation and
waterway transportation.6. Promoting and developing fishery,
tourism, and recreational activities. 7. Reaching new areas with fresh water
and creating favorable conditions forthe south-to-northwest water transfer.
8. May yield new archeological dis- coveries.
9. Relieving Lake Nasser from silt accu-mulating on its bed since the buildingof Aswan High Dam in the 1960s and
89
Th
e J
ou
rna
l o
f Te
ch
no
log
y S
tud
ies
alleviating its negative effects on thelake’s capacity as well as the HighDam’s stability.
10. Construction of the new Toshka Citythat would serve a population of 5 million to relieve the overcrowded old valley.
11. Yielding botanical and animalresources that can be utilized in several pharmaceutical and fish-processing industries.
12. Developing an environment in the area of the new project to attract wild birds and animals.
13. Including solar and wind energy development used in generating clean electrical power to meet expected demand.
Disadvantages of the Toshka Project include:1. Egypt is pouring money into desert
reclamation—wasted finances that could have been used more productivelyin other urgent needs such as health care,housing, and education.
2. This project, in addition to other con-current mega-projects in Egypt, is caus-ing liquidity and cash flow crises bysucking the lifeblood out of the economy.
3. Poor cost-benefit analysis of the project.4. Historically, Egyptians resist moving
from their homes to new settlements in the desert, and the Toshka Project is no exception.
5. Unrealistic water resources managementby diverting water badly needed in thetraditionally most fertile land of the Nile Valley.
6. Egypt could even run short of water if other Nile basin countries to the southshould build dams and divert some of the flow.
7. The negative effects this project may have on the River Nile ecology, particu-larly on wildlife, groundwater table level,irrigation, urbanization, and pollution.
The FutureA minimum of 720 billion ft3/year of
otherwise wasted water at Aswan can be saved by implementing water conservation projects inthe upper Nile sub-basin, through the cooperationof Egypt and the Nile basin countries. Thisexcess amount of saved water would be used tofill the Toshka Depression completely—through
the Toshka Canal and the Toshka Spillway—turning it into a permanent storage reservoir that could be used as a stable water supply for irrigation.
A new canal would then be constructed to convey water from the depression northwardtowards the Cut-taara Depression through thewestern desert of Egypt, forming a new greenvalley parallel to the existing valley (Younan,2001). This would create new communities aiming at expanding the Egyptian habitation land from the current 5% to about 25% ofEgypt’s area. Water would eventually be directed northward, as a second branch of the Nile and parallel to it, towards the Mediterranean Sea.
Started in 1998, the construction of theToshka Project was hoped to be completed by2004 with an estimated cost over US$ 2.5 billion.The Egyptian government wants to reclaim andcultivate some 534,000 acres (890 sq miles)around Toshka to deal with Egypt’s populationexplosion, crowded cities, and falling per-capitafarm output.
The construction of the Toshka Project in Egypt presents a challenge to engineeringtechnology because work is sometimes doneunder extremely unfavorable weather conditions.Production rates never before attained are becom-ing the norm in order to keep the sizable projecton schedule.
The first fruits of the promising success of the Toshka Project can be witnessed in manylocations such as that around Productive Well No.21, at the 45 mile landmark, where the volumeand density of the green color of vegetables,fruits, and flowers extend for almost 60 acres—wholly cultivated in an area previously thought of only as barren, uncultivable desert.
Dr. Wafeek S. Wahby is a professor of con-struction technology at the School of Technology,Eastern Illinois University (EIU), Charleston,Illinois. He is a member–at–large of Epsilon Pi Tau.
90

Th
e J
ou
rna
l of Te
ch
no
log
y Stu
die
s
91
References
Abdel-Rahman, M. (2001). Mubarak pumping station. Toshka, Egypt: Mubarak Pumping Station.
Abol-Hag-Gag, S. (2001). Experimental plantation projects in Toshka. Abu Simbel, Egypt: Abu Simbel Station for Agricultural Engineering.
El-Hag-Gar, M. (2001). New crops bloom in Toshka. Toshka, Egypt: Toshka Department of Plantation.
El-Khodari, N. (2000, December). Toshka: Mirage or marvel. Reuters News Service.Retrieved April 7, 2002, from http://www.planetark.org/ dailynewsstory.cfm?newsid=9340&newsdate=17-Dec-2000
Hass-ssan, A. F. (2001, June). The Toshka Project construction works. Toshka, Egypt: Toshka Research and Engineering Studies.
Kadry, E. (2001). Toshka Project soil investigations. Alexandria, Egypt: Toshka Office,Consultative Bureau for Civil Constructions.
Ministry of Water Resources and Irrigation, Arab Republic of Egypt. (1999, February).The Toshka Project. Cairo, Egypt: Author.
Ministry of Water Resources and Irrigation, Arab Republic of Egypt. (2000, October).The Southern Valley Development Project (SVDP). Cairo, Egypt: Author.
Ramsis, H. (2001). Construction details of Toshka Project. Alexandria, Egypt: Consultative Bureau for Civil Constructions.
Sontek. (2002). The Toshka Project. Retrieved September 19, 2003, from http://www.sontek.com/apps/channel/sltoshka/sltoshka.htm
Taha, H. (2001). The Toshka Project construction works. Toshka, Egypt: Toshka Quality Control.
Wahby, W. S. (2001). Egypt 2001—Report on a study abroad course in Egypt. Charleston: Eastern Illinois University.
Water technology. (2003). Retrieved September 19, 2003, from http://www.water-technology.net/ project_printable.asp?ProjectID=2583
Younan, N. A. (2001). Horizontal expansion projects in the southern part of the Nile Valley.Alexandria, Egypt: Consultative Bureau for Civil Constructions.
Acknowledgement:The author is indebted to a long list of colleagues, friends, and staff at Eastern Illinois University
and elsewhere for their help, advice, and support of “Egypt 2001”—the EIU study abroad course.Special thanks are due “my friends”—Egypt 2001 participants—for their enthusiasm and interactionthat made the course a memorable success. My deep appreciation goes to Dr. Mahyar Izadi, chair,School of Technology; Dr. Ted Ivarie, former dean; Dr. Martha Brown, acting dean, Lumpkin Collegefor Business and Applied Sciences; and Dr. Bob Augustine, dean, Graduate Studies and InternationalPrograms, for their continual and unfailing support of Egypt 2001 since its inception. For valuableinformation and warm hospitality, a word of gratitude is due Egyptian officials, and our colleagues andfriends in Egypt: The Honorable Dr. Yousif Waaly, Minister of Agriculture; The Honorable Eng. IbrahimKhalil, Deputy Minister and Senior Under Secretary of Agriculture; Dr. Mamdooh Riyadd, director ofthe Central Office for Environment; His Excellency Eng. Mohammed Saddeek, mayor of Abu Simbel;Eng. Abdel Fat-Tah Hass-ssan, general manager of Toshka Project Research and Engineering Studies;Eng. Hussain Taha, manager of Toshka Project Quality Control; Eng. Mohammed Abdel-Rahman, general manager, Mubarak Pumping Station; Eng. Mohammed Khala-Fal-lah, director of ToshkaProjects Follow-up; Eng. Saay-yed Abol-Hag-Gag, manager of Abu Simbel Station for AgriculturalEngineering; Eng. Mohammed El-Hag-Gar, manager of Toshka Department of Plantation; Prof. Dr.Eng. Nazieh Younan, civil engineering consultant of Toshka Project; and Eng. Hatem Ramsis and Eng. Ekram Kadry of the Consultative Bureau for Civil Constructions.

Th
e J
ou
rna
l o
f Te
ch
no
log
y S
tud
ies
92Books Briefly Noted
Alexander, Brian (2003). Rapture: A raucous tour of cloning, transhumanism, and the new era
of immortality. New York: Basic Books. ISBN 0-7382-0761-6, pb, $15.00.
Brian Alexander takes readers into the surprising stories behind cloning, stem cells, miracle drugs, and genetic engineering to show how the battle for the human soul is playing out in the broader culture— and how the outcome will affect each and every one of us. Rapture’s Dickensian cast of characters includesthe father of regenerative medicine, an anti-aging guru, and a former fundamentalist Christian and founder of the company that reportedly cloned the first human cell. This motley crew is in part being united by theforce of the opposition: a burgeoning coalition of conservative Republicans, the Christian right, and theGreens—predicting impending doom should we become adherents of the new bio-utopian faith. The book is irreverent, shocking, and highly entertaining as it seeks to separate hype from reality.
Anderson, John D., Jr. (2004). Inventing flight: The Wright brothers and their predecessors.
Baltimore, MD: The Johns Hopkins University Press. ISBN 0-8018-6875-0, pb, $18.95.
The invention of heavier-than-air flight craft counts among humankind’s defining achievements. In thisbook, the renowned aeronautical engineer John D. Anderson, Jr., offers a concise and engaging account of the technical developments that help to explain the Wright brothers’ successful first flight on December 17,1903. While the accomplishments of the Wrights have become legendary, we do well to remember that theyinherited knowledge of aerodynamics and considerable flying-machine technology. Beginning with the earli-est attempts at flight, Anderson notes the many failed efforts. He tells the fascinating story of aviation pio-neers such as Sir George Cayley who proposed the modern design of a fixed-wing craft with a fuselage andhorizontal and vertical tail surfaces in 1799 and of William Samuel Henson who won a patent in 1842 butnever flew. He also examines the crucial contributions of German engineer Otto Lilienthal to the science of aerodynamics. With vintage photographs and informative diagrams, Inventing Flight will interest anyonewho has ever wondered what lies behind the miracle of flight.
Beattie, Andrew, Paul R. Ehrlich (2004). Wild solutions: How biodiversity is money in the bank.
New Haven, CT: Yale University Press, 2nd edition. ISBN 0-300-10506-1, pb, $16.00.
In this fascinating and abundantly illustrated book, two eminent ecologists explain how the millions of species on Earth not only help keep us alive but also hold possibilities for previously unimagined prod-ucts, medicines, and even industries. In an afterword written especially for this edition, the authors considerthe impact of two revolutions now taking place: the increasing rate at which we are discovering new speciesbecause of new technology available to us and the accelerating rate at which we are losing biological diversity. Also reviewed and summarized are many “new” wild solutions, such as innovative approaches to the discovery of pharmaceuticals, the “lotus effect,” the ever-growing importance of bacteria, molecularbiomimetics, ecological restoration, and robotics.
Bergeron, Kenneth D. (2004). Tritium on ice: The dangerous new alliance of nuclear weapons
and nuclear power. Cambridge, MA: The MIT Press. ISBN 0-262-52433-3, pb, $15.95.
This winner of the Gold Award in Political Science in 2002 is now in paperback. For more than 50 years after the start of the nuclear age, the U.S. followed a policy barring commercial nuclear reactors fromproducing the ingredients of nuclear weapons. But in the fall of 2003 all that changed when a power plantoperated by TVA started making tritium for the Department of Energy at the same time producing electricityfor the commercial grid. Tritium, a radioactive form of hydrogen, is needed to turn A-bombs into H-bombs,and the commercial nuclear power plant that was modified to produce tritium is of a type called “ice con-denser.” This book provides an insider’s perspective on how this nuclear policy reversal came about, and why it is dangerous.
Bødker, Keld, Finn Kensing, Jesper Simonsen (2004). Participatory IT design: Designing for business
and workplace realities. Cambridge, MA: MIT Press. ISBN 0262-02568-X, hc, $50.00.
The goal of participatory IT design is to set sensible, general, and workable guidelines for the introduc-tion of new information technology systems into an organization. Reflecting the latest systems-developmentresearch, this book encourages a business-oriented and socially sensitive approach that takes into considera-tion the specific organizational context as well as first-hand knowledge of users’ work practices and allowsall stakeholders—users, management, and staff—to participate in the process. Drawing on the work of a 10-

Th
e J
ou
rna
l of Te
ch
no
log
y Stu
die
s
93
year research program in which the authors worked with Danish and American companies, the book offers aframework for carrying out IT design projects as well as case studies that stand as examples of the process.
Broadbent, Marianne, Ellen Kitzis (2004). The new CIO leader: Setting the agenda and delivering results.
Boston: Harvard Business School Press. ISBN 1-59139-57-1, hc, $35.00.
Two converging factors—the ubiquitous presence of technology in organizations and the recent technology downturn—have brought Chief Information Officers to a critical breaking point. Then can seizethe moment to leverage their expertise into a larger and more strategic role than ever before or they canallow themselves to be relegated to the sideline function of “chief technology mechanic.” Drawing on exten-sive Gartner, Inc. interviews and research with thousands of CIOs and hundreds of companies, the authorsoutline the agenda CIOs need to integrate business and IT assets in a way that moves corporate strategy forward. Dozens of case examples appear throughout the book including AXA, Banknorth, British Airways,Citigroup, Commerce Bank, Disney, SKF, Starwood, Unicef, and U.S. city and federal agencies.
Bunch, B. & Hellermans, A. (2004). The history of science and technology: A browser’s guide to the great
discoveries, inventions, and the people who made them from the dawn of time to today. Boston:
Houghton Mifflin. ISBN: 0-618-22123-9, $40.00.
Have you ever wondered how bridges are built? Do you know what medical discoveries led to the introduction of vaccines and antibiotics? Do you know why PCR (polymerase chain reaction) is one of thepillars of the biotechnology revolution? The History of Science and Technology is the ultimate resource foranswers to questions about the when, what, why, and how of science and technology.
This accessible reference work, organized within 10 major periods of history, is a comprehensive,chronological guide to the scientific discoveries and technological innovations from the earliest periods of recorded history into the 21st century.
With more than 7,000 concise entries in such fields as archaeology, biology, computers, food and agriculture, medicine and health, and transportation, the book covers trends, important breakthroughs, births, deaths, and other useful information. Features include:
- in-depth section introductions that place each epoch in context- short essays on intriguing topics, such as the history of DNA, the transit of Venus,
the nature of light, and the relationship between electricity and magnetism- 300 brief biographies of such personalities in science and technology as Galileo,
the first scientist of the scientific revolution, and Charles Babbage, designer of the first mechanical computer
- 300 black-and-white drawings and photographsMost entries are cross-referenced so that the reader can easily trace connections over time.
This arrangement allows the reader to choose between following the development of a specific field through history and focusing on the breadth of innovation during a certain period.
Browsable yet richly detailed, The History of Science and Technology is an invaluable desktop reference for general reader and educator alike.
Campbell-Kelly, Martin (2004). From airline reservations to Sonic the hedgehog: A history of the software
industry. Cambridge, MA: The MIT Press. ISBN 0-262-53262-X, pb, $16.95.
From its first glimmerings in the 1950s, the software industry has evolved to become the fourth largestindustrial sector in the U.S. economy. Starting with a handful of software contractors who produced special-ized programs for a few existing machines, the industry grew to include producers of corporate softwarepackages and then makers of mass-market products and recreational software. This book tells the story ofeach of these types of firms, focusing on the products they developed, the business models they followed,and the markets they served.
Cassidy, David C. (2004). J. Robert Oppenheimer and the American century. New York: Pi Press. ISBN 0-13-147996-2, hc, $27.95.
The story of J. Robert Oppenheimer, physicist extraordinaire and the man who led the scientific teamfor the Manhattan Project that built the atomic bomb, has fascinated many people. Award-winning authorDavid Cassidy, using previously unexamined documents, presents for the first time an integrated and coher-ent account of the man within the context of the nation he loved and so profoundly affected. Cassidy hascrafted a richly detailed, gripping, and nuanced look at the theorist who theorized about black holes, thehumanist who read Sanskrit, the man who loved his family, and the statesman who confronted the hardest

Th
e J
ou
rna
l o
f Te
ch
no
log
y S
tud
ies
94
moral dilemmas and scientific problems of his age. The hidden story of the political and social forces thatshaped the world in the 20th century is the rise of American science, and Oppenheimer was at its epicenter.His story is at the crux of America’s astonishing rise to power and an insight into the technological progressof our nation.
Chadarevian, Soraya de, Nick Hopwood, Eds. (2004). Models: The third dimension of science.
Stanford, CA: Stanford University Press. ISBN 0-8047-3971-4, pb, $24.95.
Now that “3-D models” are so often digital displays on flat screens, it is timely to look back at solidmodels that were once the third dimension of science. This book is about wooden ships and plastic mole-cules, wax bodies and a perspex economy, monuments in cork and mathematics in plaster, casts of diseases,habitat dioramas, and extinct monsters rebuilt in bricks and mortar. These remarkable artifacts were fixturesof laboratories and lecture halls, studios and workshops, dockyards and museums. Considering such objectstogether for the first time, this interdisciplinary volume demonstrates how, in research, as well as teaching, 3-D models played major roles in making knowledge. Accessible and original chapters by leading scholarshighlight the special properties of models, explore the interplay between representation in two dimensionsand three, and investigate the shift to modeling with computers. The book is fascinating reading for anyoneinterested in the sciences, medicine, and technology, and in collections and museums.
Clarke, David, Ed. (2005). Theory of technology. New Brunswick, NJ: Transaction Publishers.
ISBN 0-7658-0844-7, pb, $29.95.
The history of technology is often troubled by good ideas that do not, for one reason or another, take off right away—sometimes for millennia. Sometimes, technology comes to a standstill, and sometimes, iteven reverses itself. Thus, unlike science, which seems to proceed at a reasonable and calm rate, the progressof technology is difficult to theorize about. David Clarke brings together 10 authors from a range of disci-plines who try to understand technology from a variety of viewpoints. These essays originally appeared intwo issues of Knowledge, Technology & Policy in 2002 and 2003.
Eglash, Ron, Jennifer L. Croissant, Giovanna Di Chiro, Rayvon Fouché, Eds. (2004). Appropriate
technology: Vernacular science and social power. Minneapolis, MN: University of Minnesota Press.
ISBN 0-8166-3427-0, pb, $25.95.
From the vernacular engineering of Latino car design to environmental analysis among rural women, to
the production of indigenous herbal cures—groups outside the centers of scientific power persistently defy
the notion that they are merely passive recipients of technological products and scientific knowledge. This
work is the first study of how such “outsiders” reinvent consumer products—often in ways that embody cri-
tique, resistance, or outright revolt.
Emsley, John (2004). Vanity, vitality, and virility: The science behind the products you love to buy. New York:
Oxford University Press. ISBN 0-19-280509-6, hc, $28.00.
Acclaimed popular science writer John Emsley explains the nature and behavior of about 40 ingredients
that play important roles in every aspect of modern living. There are chapters on cosmetics, foods, sex,
hygiene, depression, and on four unexpected ways in which modern products improve our lives. So if you
have ever asked yourself whether cosmetics can deliver what they promise, whether certain spreads really
can reduce cholesterol, whether nitrates in water are a cause of cancer, or whether Prozac is as safe as they
say, dive into Vanity, Vitality, and Virility and discover things you always wanted to know.