
Talent Development & Excellence
94
April 2012 Talent Development & Excellence Official Journal of the Editors-in-Chief: Albert Ziegler Jiannong Shi
-
Upload
khangminh22 -
Category
Documents
-
view
1 -
download
0
Transcript of Talent Development & Excellence

April 2012
Talent Development
&
Excellence
Official Journal of the
Editors-in-Chief: Albert Ziegler Jiannong Shi
This journal
Talent Development and Excellence is the official scholarly peer reviewed journal of
the International Research Association for Talent Development and Excellence (IRATDE).
The articles contain original research or theory on talent development, expertise,
innovation, or excellence. The Journal is currently published twice annually. All published
articles are assessed by a blind refereeing process and reviewed by at least two
independent referees. Editors-in-Chief are Prof. Albert Ziegler, University of Erlangen-
Nuremberg, Germany, and Prof. Jiannong Shi of the Chinese Academy of Sciences, Bejing.
Manuscripts can be submitted electronically to either of them or to [email protected].
Editors-in-Chief:
Albert Ziegler, University of Erlangen-Nuremberg, Germany
Jiannong Shi, Academy of Sciences, Beijng, China
Editorial Assistant:
Bettina Harder, University of Erlangen-Nuremberg, Germany
International Advisory Board:
Ai-Girl Tan, Nanyang Technological University, Singapore
Barbara Schober, University of Vienna, Austria
Carmen M. Cretu, University of IASI, Romania
Elena Grigorenko, Yale University, USA
Hans Gruber, University of Regensburg, Germany
Ivan Ferbežer, University of Ljubljana, Slovenia
Javier Tourón, University of Navarra, Spain
Mantak Yuen, University of Hong Kong, P.R. China
Marion Porath, University of British Columbia, Canada
Osamah Maajeeni, King Abdul Aziz University, Saudi- Arabia
Peter Merrotsy, University of New England, Australia
Petri Nokelainen, University of Tampere, Finland
Robert Sternberg, Tufts University, USA
Wilma Vialle, University of Wollongong, Australia
Wolfgang Schneider, University of Würzburg, Germany
Impressum:
V.i.S.d.P.: Albert Ziegler, St.Veit-Str. 25, 81673 München, Germany
Talent Development & Excellence
Volume 4 Number 1 2012
Contents
The Relationship Between Intelligence and the Preference for Self-Regulated 1
Learning: A Longitudinal Study with Fourth-Graders
C. Sontag, H. Stoeger, and B. Harder
Training Differences and Selection in a Talent Identification System 23
J. Baker, S. Bagats, D. Büsch, B. Strauss, and J. Schorer
Improving the Educational Achievement of Gifted and Talented Students: 33
A Systematic Review
R. Bailey, G. Pearce, C. Smith, M. Sutherland, N. Stack, C. Winstanley, and M. Dickenson
Relative Age Effects in Higher Education: An Investigation of Potential Long Term 49
Impacts Resulting from Youth Sport and Education Policies
N. Wattie, J. Schorer, M. Tietjens, J. Baker, and S. Cobley
The Emergence of a New Research Direction at the Intersection of Talent and 65
Economy: The Influence of the Gifted on Economy
L. V. Shavinina

Intelligence and Self-Regulated Learning 1 Talent Development & Excellence
Vol. 4, No. 1, 2012, 1–22
The Relationship Between Intelligence and the
Preference for Self-Regulated Learning: A Longitudinal
Study with Fourth-Graders Christine Sontag1*, Heidrun Stoeger1 and Bettina Harder2
Abstract: The assumption that highly intelligent students prefer self-regulated
learning (SRL) over other forms of learning is still common in the field of gifted
education, but existing research yields heterogeneous results. We examined the
relationship between intelligence and SRL, thereby avoiding methodological and
design problems inherent in many empirical studies to date. 368 fourth-grade students
from 19 different German classrooms took Raven’s intelligence test at the beginning of
the school year and responded to a questionnaire based on Ziegler and Stoeger’s
(2005) cyclical model of SRL at three different points in time. Highly intelligent
students did not prefer SRL over other forms of learning, and they did not prefer self-
regulated learning more than their peers in the same learning environment.
Differences in changes in the preference for SRL in the course of the fourth grade were
not associated with intelligence. HLM analyses showed, however, that students in
different classrooms differed in their trajectories regarding the preference for SRL.
Practical implications and suggestions for future research are discussed.
Keywords:
self-regulated learning, intelligence, elementary school students, hierarchical linear
models (HLM), longitudinal analysis
Researchers specializing in the field of expertise have long explained exceptional
accomplishments primarily as a function of intensive learning processes (cf. Ericsson,
Krampe, & Tesch-Römer, 1993). Giftedness researchers, on the other hand, have
traditionally based their achievement prognoses largely on personality characteristics, in
particular on the learners’ cognitive abilities or their intelligence (e.g., Terman & Oden,
1959). More recently, however, giftedness researchers have also started paying more
attention to learning processes and, more specifically, to concepts such as self-regulated
learning (cf. Stoeger, 2008; Fischer & Stoeger, 2010). Nevertheless learning processes,
including self-regulated learning, are very seldom integrated into definitions of
giftedness (e.g., Ziegler, 2005). Rather, personality characteristics (for scholastic and
academic achievements primarily intelligence) continue to be viewed as the starting
point, while (self-regulated) learning is typically viewed as a mediating variable or
catalyst in the attainment of higher achievement (e.g., Fischer, 2008; Gagné, 2005; Heller,
Perleth, & Lim, 2005). Consequently, giftedness and self-regulated learning are
conceptualized as independent of one another. Giftedness, which is frequently
operationalized via intelligence, thus does not need to correlate with a marked preference
for, a greater frequency of, or a better quality of self-regulated learning. Nevertheless, the
assumption still stands that gifted individuals, usually meaning those identified as highly
intelligent, will show a higher rate of self-regulated learning, will be better at it, and will
profit more from training programs of self-regulated learning. Extant data on the issue
present an inconclusive picture, which can at least be partially explained by experiment
designs and methodological shortcomings. With the present study, we seek to contribute
1 University of Regensburg, Germany * Corresponding author. University of Regensburg, 93040 Regensburg, Germany. Email:
[email protected] 2 University of Erlangen-Nuremberg, Germany ISSN 1869-0459 (print)/ ISSN 1869-2885 (online)
2012 International Research Association for Talent Development and Excellence
http://www.iratde.org
C. Sontag et al. 2
to a better understanding of these inconsistent findings. To this end, we conducted an
empirical study in which we avoided a number of the methodological shortcomings of
earlier studies. As studies of the relationship between intelligence and self-regulated
learning rely on various definitions of these constructs, we will briefly state which
definitions we base our own study on before describing shortcomings of existing studies.
For this study, we define intelligence as general cognitive ability in the sense of
Spearman’s g-factor (Spearman, 1904), that is as cognitive ability that is relevant for
solving many different cognitive tasks. This definition allowed us to use an intelligence
test that correlates highly with many other intelligent tests, thereby increasing the
plausibility of generalizations. We understand self-regulated learning as an active process
that is characterized by individuals’ accepting responsibility for their own learning (cf.
Boekaerts, Pintrich, & Zeidner, 2000). Specifically, we base our study on the cyclical
process model described in Ziegler & Stoeger (2005), which is based on the social-
cognitive approach (Bandura, 1986; Zimmerman, 1995). In this model self-regulated
learning is described as a continuous learning process in which individuals repeatedly
pass through a cycle with seven phases: After (1) a self-assessment regarding their
current state of learning ability and understanding in a given area of learning, (2)
individuals set their own learning goals, (3) strategically plan their learning process, (4)
implement the chosen learning strategy, (5) monitor the implementation of this learning
strategy, (6) and, if necessary, adapt the chosen strategy. Finally, (7) they evaluate the
results of their learning process. These evaluations then serve as the basis for the self-
assessment when the cycle is traversed anew.
Findings and Limitations of Empirical Studies on Intelligence and Self-
Regulated Learning
As we mentioned above, research findings on the relationship between intelligence and
self-regulated learning are inconclusive (cf. Sontag & Stoeger, 2010, for a detailed
discussion). In some aspects of self-regulated learning, highly intelligent individuals
demonstrated or reported a higher frequency or greater quality of self-regulated learning
compared to individuals of average intelligence while in other aspects there was no
difference between these groups (e.g., Bouffard-Bouchard, Parent, & Larivée, 1993; Spörer,
2003; Zimmerman & Martinez-Pons, 1990). In some studies highly intelligent students
reported even lower levels of self-regulated learning (e.g., Dresel & Haugwitz, 2005;
Neber & Schommer-Aikens, 2002, in reference to the results of Wolters & Pintrich, 1998).
An interpretation of these heterogeneous results is difficult for several reasons. For
example, the studies are based on different conceptualizations of intelligence and self-
regulated learning. There also are differences in the operationalization of self-regulated
learning. Methods of data collection include, for example, questionnaires (Dresel &
Haugwitz, 2005), interviews (Zimmerman & Martinez-Pons, 1990), and think aloud
protocols (Bouffard-Bouchard et al., 1993). There are several other limitations. Five of them
have received special attention in the design of our study.
1. Sample selectivity. In many studies, groups of individuals were compared that differ
not only in their intelligence but also according to their respective learning
environments. Ewers and Wood (1993) and Zimmerman and Martinez-Pons (1990),
for instance, found that highly intelligent students were superior to students of
average intelligence in some subprocesses of self-regulated learning. But because,
in both studies, the highly intelligent students had received a special enrichment
offer at school, an alternative interpretation needs to be considered: Self-regulated
learning might have correlated with the more stimulating school environment
offered exclusively to the higher-intelligence group rather than with the level of
intelligence.
2. Failure to account for school-, grade-, and classroom-related contexts in statistical analyses. Even in studies with more comparable groups (e.g., groups of students
Intelligence and Self-Regulated Learning 3
who attend the same type of school) several students are usually drawn from the
same classroom and thereby from the same specific learning environment. Students
belonging to the same classroom tend to be more similar to each other with respect
to relevant variables than students from a random sample (cf. Hox, 2010). This
violates the assumption of independence, which many procedures of statistical
analysis require. Even though statistical methods adequately addressing this issue
exist, these methods, to our knowledge, were not applied in any study on self-
regulated learning and intelligence.
3. Solely examining individual subprocesses of self-regulated learning. A number of
studies in the areas of cognitive learning strategies and metacognition research
make valuable contributions to our understanding of the relationship between
intelligence and important subprocesses involved in self-regulated learning (e.g.,
Chan, 1996, for cognitive strategies, and Ewers & Wood, 1993, for metacognitive
strategies). However, researchers specifically interested in self-regulated learning
should use model-based investigative instruments that represent the theoretical
approach as a whole and assess all subprocesses of self-regulated learning that are
implied in the theoretical model. Only very few investigations of self-regulated
learning in giftedness research have taken such an approach (e.g., Bouffard-
Bouchard et al., 1993; Spörer, 2003; Zimmerman & Martinez-Pons, 1990).
4. Cross-sectional investigation of the relationship. Most of the studies we identified
that investigate the relationship between self-regulated learning and intelligence
are cross-sectional in design (for an overview, cf. Sontag & Stoeger, 2010). Thus, the
results of these studies do not allow for qualified statements about how intelligence
or other factors (e.g., motivation) influence the change in self-regulated learning
over time. Longitudinal studies in the area of metacognition (Alexander & Manion,
1996, April, as cited in Alexander & Schwanenflugel, 1996; Van der Steel & Veenman,
2010) as well as intervention studies conducted with students of various intelligence
levels (DeJager, Jansen, & Reezigt, 2005; Stoeger & Ziegler, 2005) yield inconsistent
results regarding the role of intelligence for the change of self-regulated learning
over time. To our knowledge, no research – except for the two intervention studies
just mentioned – has been published regarding the role played by intelligence in
the change of the various subprocesses of self-regulated learning over time.
5. Focus on older students. A majority of studies focused on students who were eleven
years or older (exceptions are, e.g., Alexander & Schwanenflugel, 1994, who
examined solely memory strategies; and Schneider & Bjorklund, 1992, who
examined self-assessment). The lack of investigation of younger children may reflect
the long-held assumption that younger children lacked the metacognitive
capabilities necessary for self-regulated learning (cf., for example, Baumert et al.,
2000; Lai, 2011). However, some studies show that younger children are capable of
carrying out less complex forms of self-regulated learning (e.g., Alexander,
Graham, & Harris, 1998; Kron-Sperl, Schneider, & Hasselhorn, 2008; Roebers, Schmid,
& Roderer, 2009; summarized in Wigfield, Klauda, & Cambria, 2011).
Goals and Research Questions
The goal of our study is to describe the role played by intelligence for the preference for
self-regulated learning (as opposed to a preference for externally regulated or impulsive
learning) among fourth-graders, that is, nine- to ten-year-old students. This addresses the
fifth of the above mentioned limitations. Our study design includes four further unique
characteristics which are intended to address the shortcomings of earlier studies
described above. First, an unselected sample of students was examined. Since, in
Germany, all students receive the same schooling irrespective of their cognitive abilities
through fourth grade, there is no reason to expect intelligence and learning environment
to automatically be confounded. Furthermore, among the various school forms in
C. Sontag et al. 4
Germany, elementary school (through fourth grade) brings together individuals with the
greatest span of cognitive abilities, therefore avoiding the problem of limited variance.
Second, in order to account for the fact that students learning in the same classroom are
surrounded by a comparable environment and thus may be more similar to each other
than students in a random sample, we used hierarchical linear models when conducting
our statistical analyses. Third, our measurements of self-regulated learning are model-
based, and all subprocesses (as described in the phase model by Ziegler & Stoeger,
2005) were assessed in one instrument. Fourth, contrary to the design chosen in most
studies we analyzed our research questions not only using a cross-sectional design but
also a longitudinal design. As mentioned above, we investigated fourth-graders in their
final year of elementary school. In this period of their education the scholastic demands
placed upon students increase, and students are expected to become more and more self-
reliant in their learning. Therefore, it seemed plausible to investigate if the students’
preference for self-regulated learning changes in the course of fourth grade. Even if, at
the beginning of fourth grade, intelligence were irrelevant for students’ preference for
self-regulated learning, intelligence might influence how much students’ preference for
self-regulated learning changes. As earlier research indicates that self-regulated learning
requires a high level of motivation (e.g., Ames & Archer, 1988; cf. Zimmerman, 2011, for an
overview), we also tested if a combination of intelligence and learning motivation
influences how the students’ preference for self-regulated learning changes.
We used cross-sectional data and longitudinal data to answer our questions. Cross-
sectional data were collected at the beginning of the school year and were used to answer
the following questions about the role played by intelligence in the preference for self-
regulated learning among fourth-graders:
Q1. Is there a correlation between intelligence and the preference for self-regulated
learning at the beginning of fourth grade?
Q2. Is there a difference between highly intelligent students and average intelligent
students with regard to their preference for self-regulated learning at the beginning
of fourth grade?
Longitudinal data were collected at the beginning of the school year, eleven weeks later,
and again ten weeks after that. They were used to answer the following questions about
the role of intelligence for the change in the preference for self-regulated learning among
fourth-graders.
Q3. Does the preference for self-regulated learning change in the course of fourth grade?
Q4. Does intelligence predict the change in individuals’ preferences for self-regulated
learning in the course of fourth grade?
Q5. Does the combination of intelligence and motivation predict the change in
individuals’ preferences for self-regulated learning in the course of fourth grade?
Method
Design and Procedure
The data set used in the current study is part of a larger data set from a training evaluation
study with fourth-grade elementary school students. For the present study, only data from
control classes were used, that is, data of students who received regular classroom
instruction. Data collection took place at three different points in time (T1, T2, T3): at the
beginning of the school year (T1), eleven weeks later (T2) and again ten weeks after that
(T3). The testing sessions were scheduled during regular classroom hours and were led
by trained research assistants or by the classroom teachers themselves. To answer the
research questions of our present study, we only used some of the instruments the
students worked on (these are described in the paragraph on instruments in more detail).

Intelligence and Self-Regulated Learning 5
Participants
368 fourth-grade elementary school students from 19 different classrooms in rural or
suburban Bavaria (a federal state of Germany) participated in the study at T1. The mean
age of these students was 9 years, 9 months (SD = 4.85 months). The gender distribution
was balanced (184 girls and 184 boys). 20.7 % of participating students had a migration
background, that is, they themselves and/or at least one of their parents was not born in
Germany. One student dropped out of the study after T1, 9 students (2.7 % of the sample)
missed the testing session at T2 and 11 (3.2 % of the sample) missed the testing session at
T3, resulting in a relatively low drop-out-rate.
Instruments
Preference for self-regulated learning was measured at T1, T2, and T3, intelligence and
motivation (learning-goal orientation) were measured only at T1.
Preference for Self-Regulated Learning. Preference for self-regulated learning was
measured with the 28 items of the “Fragebogen Selbstreguliertes Lernen-7, FSL-7” [Questionnaire of Self-regulated Learning-7] by Ziegler, Stoeger, & Grassinger (2010). The
FSL-7 is based on Ziegler and Stoeger‘s (2005) seven-phase cyclical model of self-
regulated learning. Four school-relevant situations are described briefly (studying for
school, preparing for the upcoming school year during the summer holidays, preparing
for a test at school, catching up on content missed due to illness). In each situation, the
students are asked to indicate their preferred approach to learning in each of the seven
phases of self-regulated learning (self-assessment, goal-setting, strategic planning,
strategy implementation, strategy monitoring, strategy adjustment, outcome monitoring)
by choosing one of three alternatives: self-regulated, externally regulated, or impulsive
learning. Sample item (Situation 1, phase 2, goal-setting): How do you study for school? a)
I set a fixed goal for myself describing what and how much I want to study [self-regulated
learning], b) The teacher or my parents ought to tell me which goal I should set for myself [externally regulated learning], c) When studying, I don’t set a specific goal for myself. I can rely on my intuition [impulsive learning behavior]. In the present study, the research
assistant or the classroom teacher read the four situations and the response alternatives
out loud, allowing for everyone, including weak readers, to complete the questionnaire
quickly and accurately.
To measure preference for self-regulated learning, we calculated scores for each phase as
well as an overall score for the whole instrument by counting the frequency with which a
child chose self-regulated learning and dividing it by the number of items answered. The
scores are reported as percentages. Example: In phase 2, goal-setting, a student chose the
self-regulated alternative in 3 of the 4 situations, resulting in a score of 75 %. Regarding
the entire questionnaire, that same student chose the self-regulated alternative for 13 out
of 28 items, resulting in an overall score of 46 %.
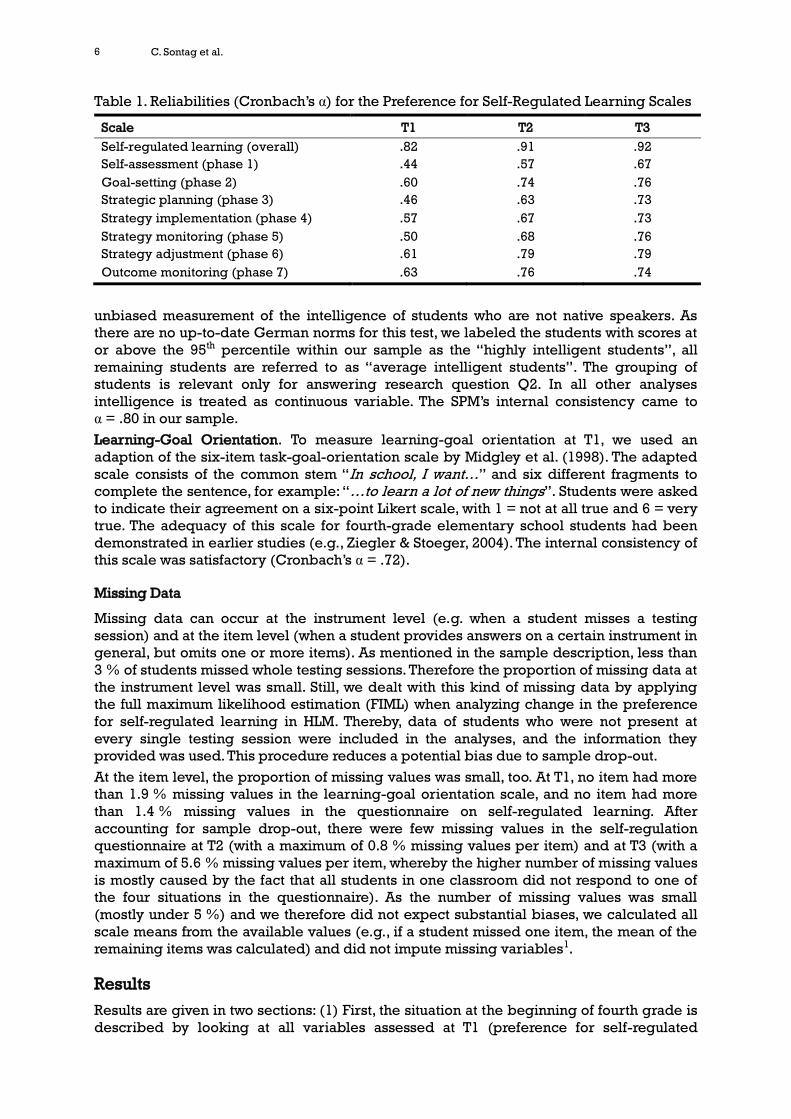
To calculate the internal consistency, both for the overall scale and the seven subscales,
we proceeded as if the questionnaire were a test of the preference for self-regulated
learning, with the self-regulated alternative coded as the ”right” answer and the other
alternatives as the “wrong” answer. Table 1 shows the internal consistencies for the
overall scale and the seven subscales. A possible explanation for the relatively low
reliabilities at T1 may be the students’ unfamiliarity with the response mode. At T2 and T3,
students were more familiar with the response mode and reliabilities were higher. In
addition, the internal consistencies of these scales were expected to be somewhat low, as
the construct of self-regulated learning explicitly allows for situation-specific behavior.
Intelligence. At T1 students completed the German version of Raven’s Standard
Progressive Matrices (SPM) Test (Heller, Kratzmeier, & Lengfelder, 1998) as a measure of
general intelligence. This non-verbal multiple choice test consists of 60 tasks in which
students are asked to select a single item that completes a given pattern of six or eight
items. This assessment method is well-suited for group testing and allows for a relatively
C. Sontag et al. 6
Table 1. Reliabilities (Cronbach’s α) for the Preference for Self-Regulated Learning Scales
Scale T1 T2 T3
Self-regulated learning (overall) .82 .91 .92
Self-assessment (phase 1) .44 .57 .67
Goal-setting (phase 2) .60 .74 .76
Strategic planning (phase 3) .46 .63 .73
Strategy implementation (phase 4) .57 .67 .73
Strategy monitoring (phase 5) .50 .68 .76
Strategy adjustment (phase 6) .61 .79 .79
Outcome monitoring (phase 7) .63 .76 .74
unbiased measurement of the intelligence of students who are not native speakers. As
there are no up-to-date German norms for this test, we labeled the students with scores at
or above the 95th percentile within our sample as the “highly intelligent students”, all
remaining students are referred to as “average intelligent students”. The grouping of
students is relevant only for answering research question Q2. In all other analyses
intelligence is treated as continuous variable. The SPM’s internal consistency came to
α = .80 in our sample.
Learning-Goal Orientation. To measure learning-goal orientation at T1, we used an
adaption of the six-item task-goal-orientation scale by Midgley et al. (1998). The adapted
scale consists of the common stem “In school, I want…” and six different fragments to
complete the sentence, for example: “…to learn a lot of new things”. Students were asked
to indicate their agreement on a six-point Likert scale, with 1 = not at all true and 6 = very
true. The adequacy of this scale for fourth-grade elementary school students had been
demonstrated in earlier studies (e.g., Ziegler & Stoeger, 2004). The internal consistency of
this scale was satisfactory (Cronbach’s α = .72).
Missing Data
Missing data can occur at the instrument level (e.g. when a student misses a testing
session) and at the item level (when a student provides answers on a certain instrument in
general, but omits one or more items). As mentioned in the sample description, less than
3 % of students missed whole testing sessions. Therefore the proportion of missing data at
the instrument level was small. Still, we dealt with this kind of missing data by applying
the full maximum likelihood estimation (FIML) when analyzing change in the preference
for self-regulated learning in HLM. Thereby, data of students who were not present at
every single testing session were included in the analyses, and the information they
provided was used. This procedure reduces a potential bias due to sample drop-out.
At the item level, the proportion of missing values was small, too. At T1, no item had more
than 1.9 % missing values in the learning-goal orientation scale, and no item had more
than 1.4 % missing values in the questionnaire on self-regulated learning. After
accounting for sample drop-out, there were few missing values in the self-regulation
questionnaire at T2 (with a maximum of 0.8 % missing values per item) and at T3 (with a
maximum of 5.6 % missing values per item, whereby the higher number of missing values
is mostly caused by the fact that all students in one classroom did not respond to one of
the four situations in the questionnaire). As the number of missing values was small
(mostly under 5 %) and we therefore did not expect substantial biases, we calculated all
scale means from the available values (e.g., if a student missed one item, the mean of the
remaining items was calculated) and did not impute missing variables1.
Results
Results are given in two sections: (1) First, the situation at the beginning of fourth grade is
described by looking at all variables assessed at T1 (preference for self-regulated
Intelligence and Self-Regulated Learning 7
learning, intelligence, and learning-goal orientation). Next we describe the correlations
between intelligence and the overall preference for self-regulated learning and between
intelligence and the preference for self-regulated learning in each phase at T1, taking into
account the hierarchical data structure, that is, the fact that students are organized within
classes. We conclude this section with the report of differences (or the lack thereof)
between highly intelligent and average intelligent students with respect to their
preference for self-regulated learning. (2) In the second section we will look at the
change in the preference for self-regulated learning throughout the school year. Again,
descriptive statistics for the overall preference for self-regulated learning and for the
preference for self-regulated learning in the seven phases at T1, T2, and T3 are presented
first. Next we describe the change in the students’ preference for self-regulated learning
by modeling growth curves in HLM (Raudenbush & Bryk, 2006). We examine – for the
overall preference as well as for all seven self-regulation phases separately – if
trajectories vary between students. Finally, we analyze if differences between students in
their change in the preference for self-regulated learning can be explained by
intelligence or by a combination of intelligence and learning-goal orientation.
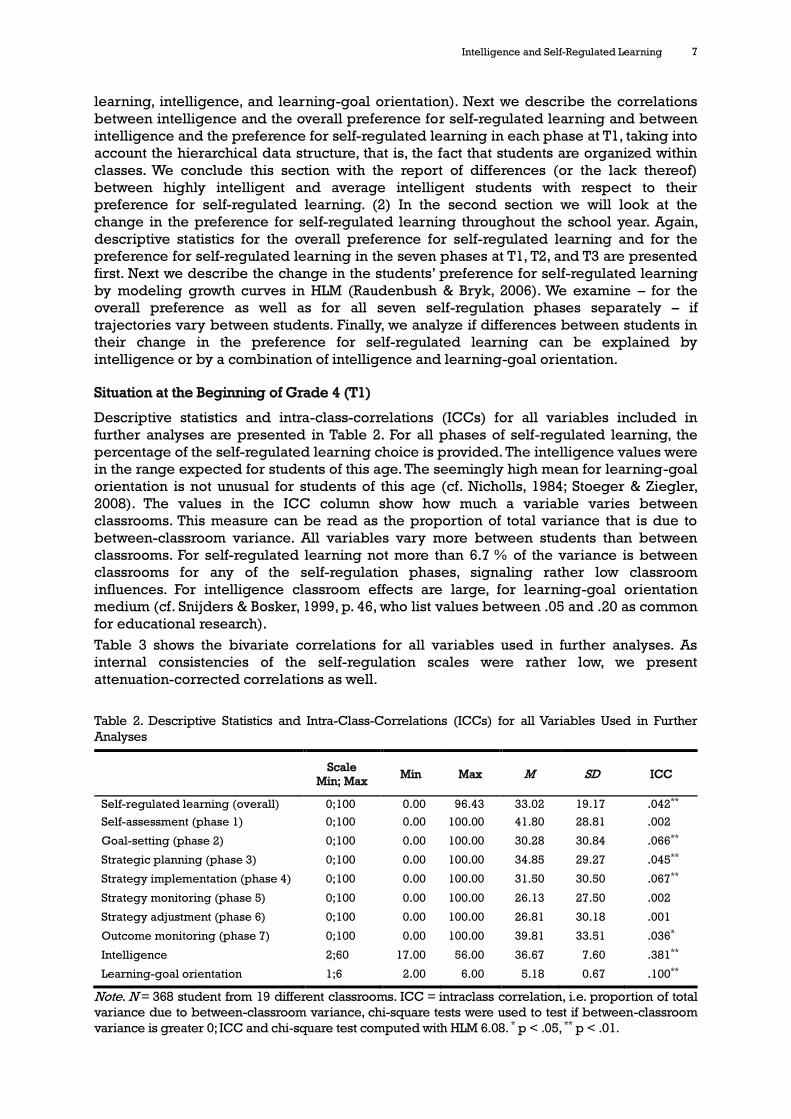
Situation at the Beginning of Grade 4 (T1)
Descriptive statistics and intra-class-correlations (ICCs) for all variables included in
further analyses are presented in Table 2. For all phases of self-regulated learning, the
percentage of the self-regulated learning choice is provided. The intelligence values were
in the range expected for students of this age. The seemingly high mean for learning-goal
orientation is not unusual for students of this age (cf. Nicholls, 1984; Stoeger & Ziegler,
2008). The values in the ICC column show how much a variable varies between
classrooms. This measure can be read as the proportion of total variance that is due to
between-classroom variance. All variables vary more between students than between
classrooms. For self-regulated learning not more than 6.7 % of the variance is between
classrooms for any of the self-regulation phases, signaling rather low classroom
influences. For intelligence classroom effects are large, for learning-goal orientation
medium (cf. Snijders & Bosker, 1999, p. 46, who list values between .05 and .20 as common
for educational research).
Table 3 shows the bivariate correlations for all variables used in further analyses. As
internal consistencies of the self-regulation scales were rather low, we present
attenuation-corrected correlations as well.
Table 2. Descriptive Statistics and Intra-Class-Correlations (ICCs) for all Variables Used in Further
Analyses
Scale
Min; Max Min Max M SD ICC
Self-regulated learning (overall) 0;100 0.00 96.43 33.02 19.17 .042**
Self-assessment (phase 1) 0;100 0.00 100.00 41.80 28.81 .002
Goal-setting (phase 2) 0;100 0.00 100.00 30.28 30.84 .066**
Strategic planning (phase 3) 0;100 0.00 100.00 34.85 29.27 .045**
Strategy implementation (phase 4) 0;100 0.00 100.00 31.50 30.50 .067**
Strategy monitoring (phase 5) 0;100 0.00 100.00 26.13 27.50 .002
Strategy adjustment (phase 6) 0;100 0.00 100.00 26.81 30.18 .001
Outcome monitoring (phase 7) 0;100 0.00 100.00 39.81 33.51 .036*
Intelligence 2;60 17.00 56.00 36.67 7.60 .381**
Learning-goal orientation 1;6 2.00 6.00 5.18 0.67 .100**
Note. N = 368 student from 19 different classrooms. ICC = intraclass correlation, i.e. proportion of total
variance due to between-classroom variance, chi-square tests were used to test if between-classroom
variance is greater 0; ICC and chi-square test computed with HLM 6.08. * p < .05, ** p < .01.
C. Sontag et al. 8
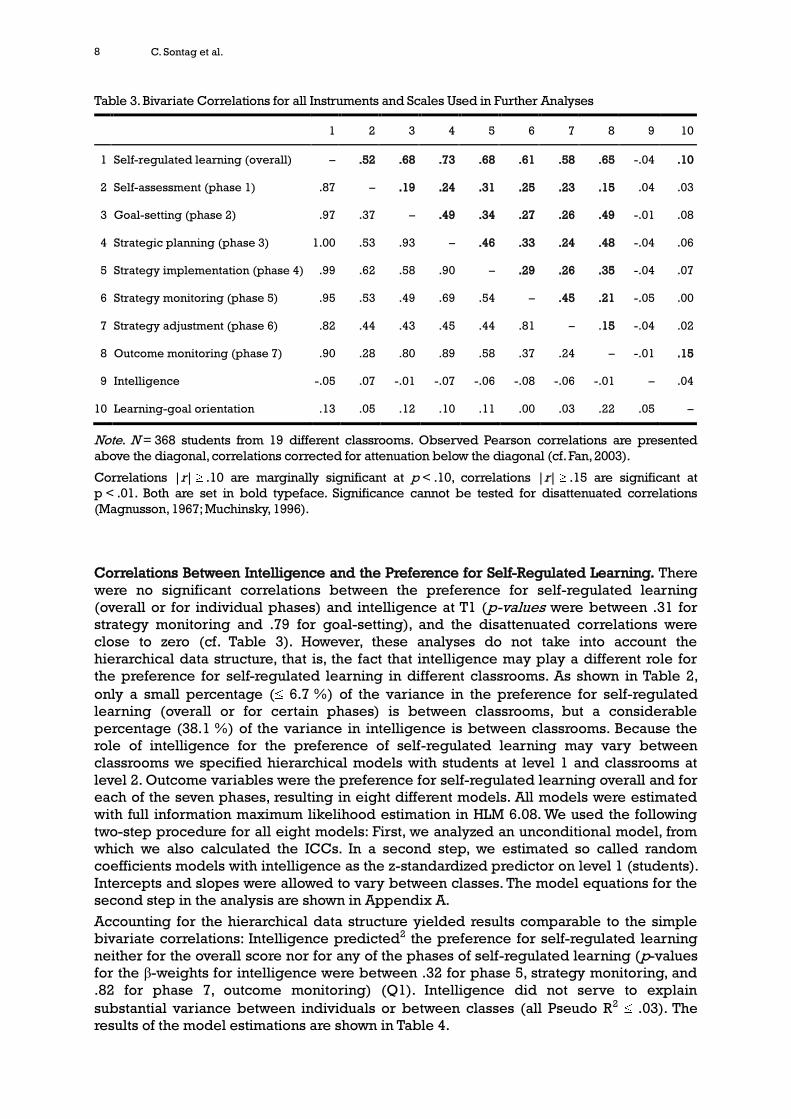
Table 3. Bivariate Correlations for all Instruments and Scales Used in Further Analyses
1 2 3 4 5 6 7 8 9 10
1 Self-regulated learning (overall) – .52 .68 .73 .68 .61 .58 .65 -.04 .10
2 Self-assessment (phase 1) .87 – .19 .24 .31 .25 .23 .15 .04 .03
3 Goal-setting (phase 2) .97 .37 – .49 .34 .27 .26 .49 -.01 .08
4 Strategic planning (phase 3) 1.00 .53 .93 – .46 .33 .24 .48 -.04 .06
5 Strategy implementation (phase 4) .99 .62 .58 .90 – .29 .26 .35 -.04 .07
6 Strategy monitoring (phase 5) .95 .53 .49 .69 .54 – .45 .21 -.05 .00
7 Strategy adjustment (phase 6) .82 .44 .43 .45 .44 .81 – .15 -.04 .02
8 Outcome monitoring (phase 7) .90 .28 .80 .89 .58 .37 .24 – -.01 .15
9 Intelligence -.05 .07 -.01 -.07 -.06 -.08 -.06 -.01 – .04
10 Learning-goal orientation .13 .05 .12 .10 .11 .00 .03 .22 .05 –
Note. N = 368 students from 19 different classrooms. Observed Pearson correlations are presented
above the diagonal, correlations corrected for attenuation below the diagonal (cf. Fan, 2003).
Correlations |r| .10 are marginally significant at p < .10, correlations |r| .15 are significant at
p < .01. Both are set in bold typeface. Significance cannot be tested for disattenuated correlations
(Magnusson, 1967; Muchinsky, 1996).
Correlations Between Intelligence and the Preference for Self-Regulated Learning. There
were no significant correlations between the preference for self-regulated learning
(overall or for individual phases) and intelligence at T1 (p-values were between .31 for
strategy monitoring and .79 for goal-setting), and the disattenuated correlations were
close to zero (cf. Table 3). However, these analyses do not take into account the
hierarchical data structure, that is, the fact that intelligence may play a different role for
the preference for self-regulated learning in different classrooms. As shown in Table 2,
only a small percentage ( 6.7 %) of the variance in the preference for self-regulated
learning (overall or for certain phases) is between classrooms, but a considerable
percentage (38.1 %) of the variance in intelligence is between classrooms. Because the
role of intelligence for the preference of self-regulated learning may vary between
classrooms we specified hierarchical models with students at level 1 and classrooms at
level 2. Outcome variables were the preference for self-regulated learning overall and for
each of the seven phases, resulting in eight different models. All models were estimated
with full information maximum likelihood estimation in HLM 6.08. We used the following
two-step procedure for all eight models: First, we analyzed an unconditional model, from
which we also calculated the ICCs. In a second step, we estimated so called random
coefficients models with intelligence as the z-standardized predictor on level 1 (students).
Intercepts and slopes were allowed to vary between classes. The model equations for the
second step in the analysis are shown in Appendix A.
Accounting for the hierarchical data structure yielded results comparable to the simple
bivariate correlations: Intelligence predicted2 the preference for self-regulated learning
neither for the overall score nor for any of the phases of self-regulated learning (p-values
for the β-weights for intelligence were between .32 for phase 5, strategy monitoring, and
.82 for phase 7, outcome monitoring) (Q1). Intelligence did not serve to explain
substantial variance between individuals or between classes (all Pseudo R2 .03). The
results of the model estimations are shown in Table 4.
Intelligence and Self-Regulated Learning 9
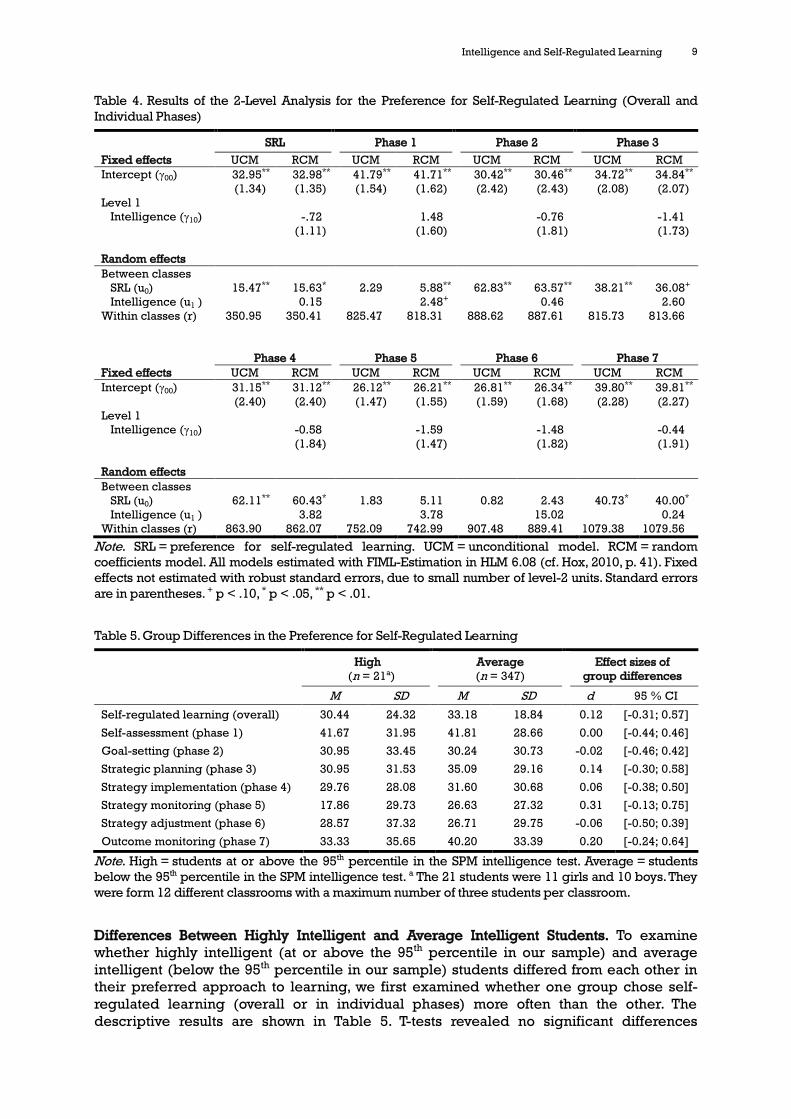
Table 4. Results of the 2-Level Analysis for the Preference for Self-Regulated Learning (Overall and
Individual Phases)
SRL Phase 1 Phase 2 Phase 3
Fixed effects UCM RCM UCM RCM UCM RCM UCM RCM
Intercept (γ00) 32.95** 32.98** 41.79** 41.71** 30.42** 30.46** 34.72** 34.84**
(1.34) (1.35) (1.54) (1.62) (2.42) (2.43) (2.08) (2.07)
Level 1
Intelligence (γ10) -.72 1.48 -0.76 -1.41
(1.11) (1.60) (1.81) (1.73)
Random effects
Between classes
SRL (u0) 15.47** 15.63* 2.29 5.88** 62.83** 63.57** 38.21** 36.08+
Intelligence (u1 ) 0.15 2.48+ 0.46 2.60
Within classes (r) 350.95 350.41 825.47 818.31 888.62 887.61 815.73 813.66
Phase 4 Phase 5 Phase 6 Phase 7
Fixed effects UCM RCM UCM RCM UCM RCM UCM RCM
Intercept (γ00) 31.15** 31.12** 26.12** 26.21** 26.81** 26.34** 39.80** 39.81**
(2.40) (2.40) (1.47) (1.55) (1.59) (1.68) (2.28) (2.27)
Level 1
Intelligence (γ10) -0.58 -1.59 -1.48 -0.44
(1.84) (1.47) (1.82) (1.91)
Random effects
Between classes
SRL (u0) 62.11** 60.43* 1.83 5.11 0.82 2.43 40.73* 40.00*
Intelligence (u1 ) 3.82 3.78 15.02 0.24
Within classes (r) 863.90 862.07 752.09 742.99 907.48 889.41 1079.38 1079.56
Note. SRL = preference for self-regulated learning. UCM = unconditional model. RCM = random
coefficients model. All models estimated with FIML-Estimation in HLM 6.08 (cf. Hox, 2010, p. 41). Fixed
effects not estimated with robust standard errors, due to small number of level-2 units. Standard errors
are in parentheses. + p < .10, * p < .05, ** p < .01.
Table 5. Group Differences in the Preference for Self-Regulated Learning
High
(n = 21a)
Average
(n = 347)
Effect sizes of
group differences
M SD M SD d 95 % CI
Self-regulated learning (overall) 30.44 24.32 33.18 18.84 0.12 [-0.31; 0.57]
Self-assessment (phase 1) 41.67 31.95 41.81 28.66 0.00 [-0.44; 0.46]
Goal-setting (phase 2) 30.95 33.45 30.24 30.73 -0.02 [-0.46; 0.42]
Strategic planning (phase 3) 30.95 31.53 35.09 29.16 0.14 [-0.30; 0.58]
Strategy implementation (phase 4) 29.76 28.08 31.60 30.68 0.06 [-0.38; 0.50]
Strategy monitoring (phase 5) 17.86 29.73 26.63 27.32 0.31 [-0.13; 0.75]
Strategy adjustment (phase 6) 28.57 37.32 26.71 29.75 -0.06 [-0.50; 0.39]
Outcome monitoring (phase 7) 33.33 35.65 40.20 33.39 0.20 [-0.24; 0.64]
Note. High = students at or above the 95th percentile in the SPM intelligence test. Average = students
below the 95th percentile in the SPM intelligence test. a The 21 students were 11 girls and 10 boys. They
were form 12 different classrooms with a maximum number of three students per classroom.
Differences Between Highly Intelligent and Average Intelligent Students. To examine
whether highly intelligent (at or above the 95th percentile in our sample) and average
intelligent (below the 95th percentile in our sample) students differed from each other in
their preferred approach to learning, we first examined whether one group chose self-
regulated learning (overall or in individual phases) more often than the other. The
descriptive results are shown in Table 5. T-tests revealed no significant differences
C. Sontag et al. 10
between the two groups of students (p-values were between .16 for strategy monitoring
and .98 for self-assessment). Effect sizes for the group differences ranged from no effects
to small effects; however, all 95 % confidence intervals included zero (cf. Table 5; Q2).
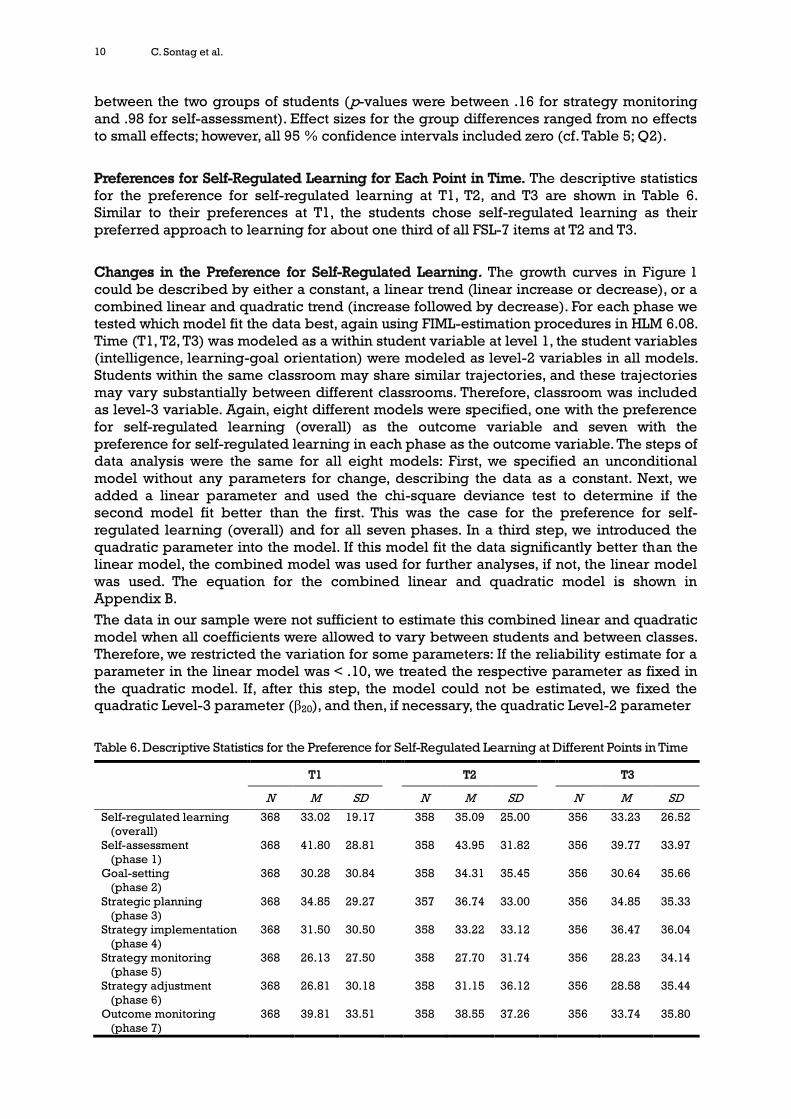
Preferences for Self-Regulated Learning for Each Point in Time. The descriptive statistics
for the preference for self-regulated learning at T1, T2, and T3 are shown in Table 6.
Similar to their preferences at T1, the students chose self-regulated learning as their
preferred approach to learning for about one third of all FSL-7 items at T2 and T3.
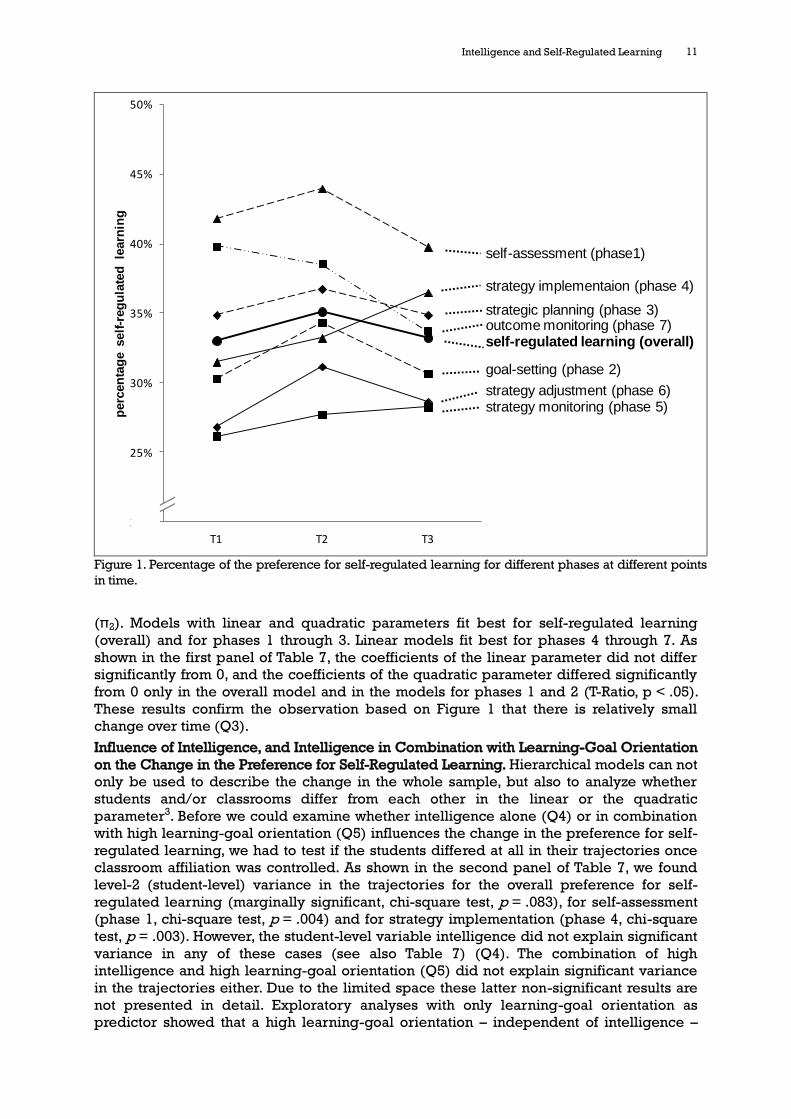
Changes in the Preference for Self-Regulated Learning. The growth curves in Figure 1
could be described by either a constant, a linear trend (linear increase or decrease), or a
combined linear and quadratic trend (increase followed by decrease). For each phase we
tested which model fit the data best, again using FIML-estimation procedures in HLM 6.08.
Time (T1, T2, T3) was modeled as a within student variable at level 1, the student variables
(intelligence, learning-goal orientation) were modeled as level-2 variables in all models.
Students within the same classroom may share similar trajectories, and these trajectories
may vary substantially between different classrooms. Therefore, classroom was included
as level-3 variable. Again, eight different models were specified, one with the preference
for self-regulated learning (overall) as the outcome variable and seven with the
preference for self-regulated learning in each phase as the outcome variable. The steps of
data analysis were the same for all eight models: First, we specified an unconditional
model without any parameters for change, describing the data as a constant. Next, we
added a linear parameter and used the chi-square deviance test to determine if the
second model fit better than the first. This was the case for the preference for self-
regulated learning (overall) and for all seven phases. In a third step, we introduced the
quadratic parameter into the model. If this model fit the data significantly better than the
linear model, the combined model was used for further analyses, if not, the linear model
was used. The equation for the combined linear and quadratic model is shown in
Appendix B.
The data in our sample were not sufficient to estimate this combined linear and quadratic
model when all coefficients were allowed to vary between students and between classes.
Therefore, we restricted the variation for some parameters: If the reliability estimate for a
parameter in the linear model was < .10, we treated the respective parameter as fixed in
the quadratic model. If, after this step, the model could not be estimated, we fixed the
quadratic Level-3 parameter (β20), and then, if necessary, the quadratic Level-2 parameter
Table 6. Descriptive Statistics for the Preference for Self-Regulated Learning at Different Points in Time
T1 T2 T3
N M SD N M SD N M SD
Self-regulated learning
(overall)
368 33.02 19.17 358 35.09 25.00 356 33.23 26.52
Self-assessment
(phase 1)
368 41.80 28.81 358 43.95 31.82 356 39.77 33.97
Goal-setting
(phase 2)
368 30.28 30.84 358 34.31 35.45 356 30.64 35.66
Strategic planning
(phase 3)
368 34.85 29.27 357 36.74 33.00 356 34.85 35.33
Strategy implementation
(phase 4)
368 31.50 30.50 358 33.22 33.12 356 36.47 36.04
Strategy monitoring
(phase 5)
368 26.13 27.50 358 27.70 31.74 356 28.23 34.14
Strategy adjustment
(phase 6)
368 26.81 30.18 358 31.15 36.12 356 28.58 35.44
Outcome monitoring
(phase 7)
368 39.81 33.51 358 38.55 37.26 356 33.74 35.80
Intelligence and Self-Regulated Learning 11
Figure 1. Percentage of the preference for self-regulated learning for different phases at different points
in time.
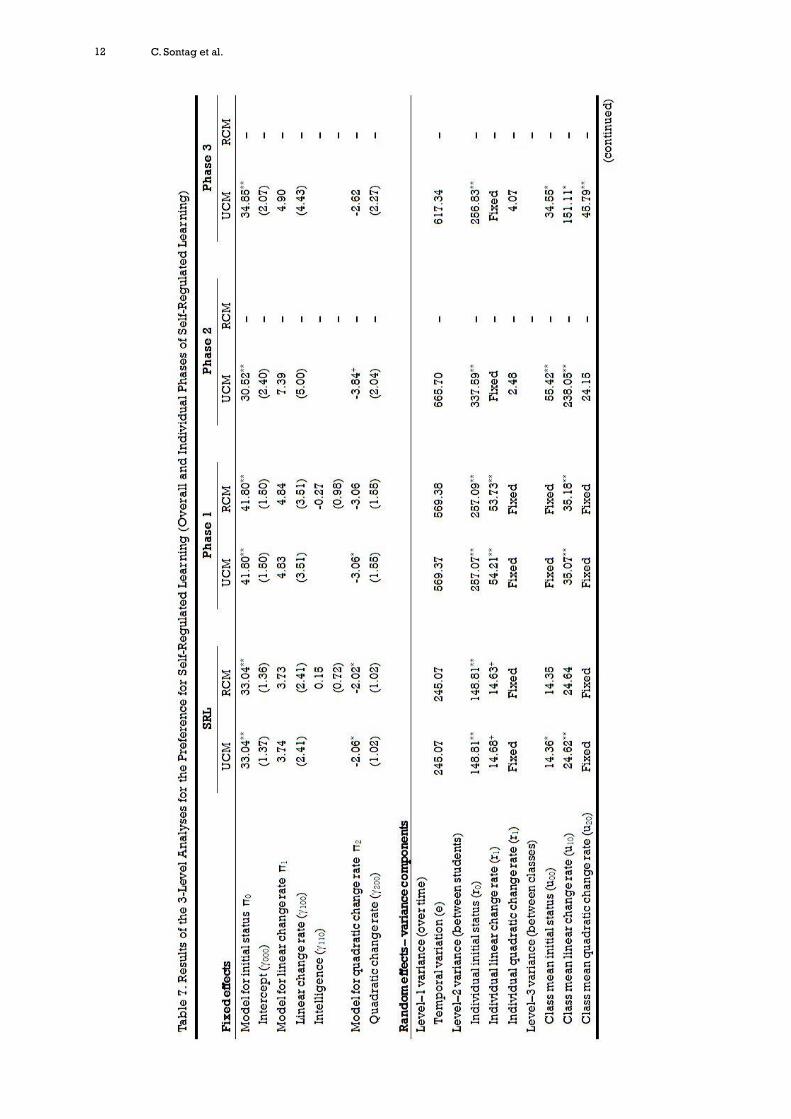
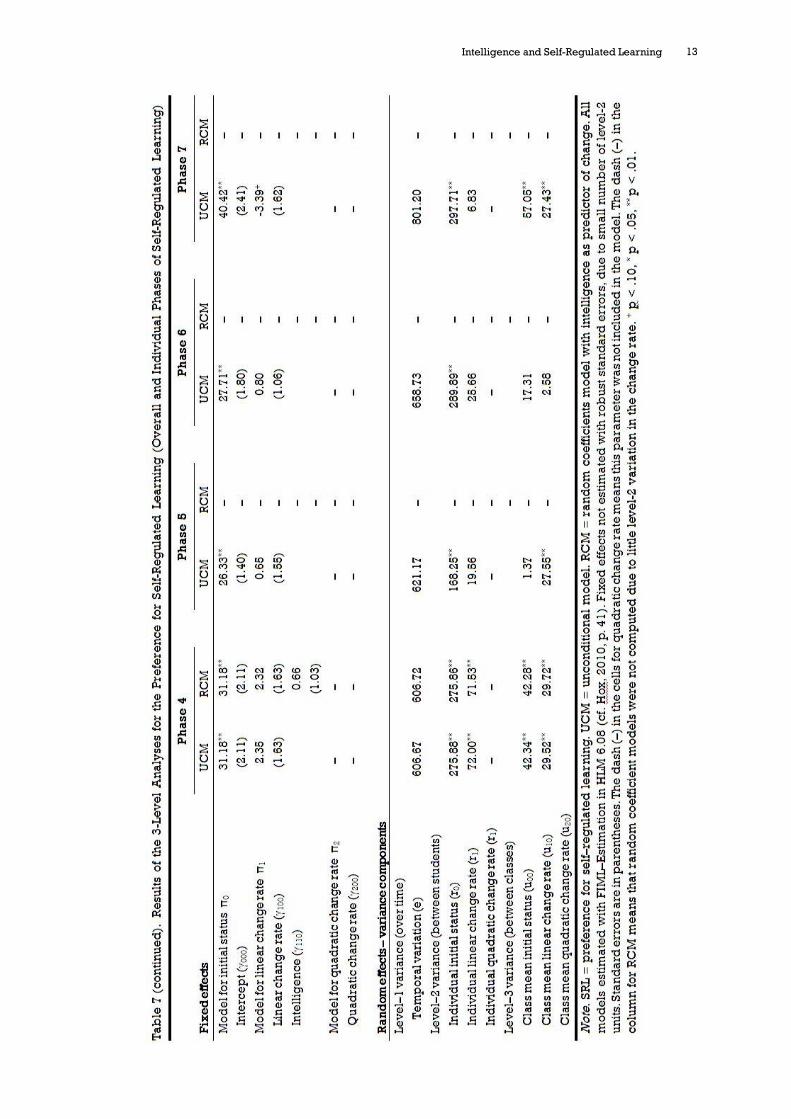
(π2). Models with linear and quadratic parameters fit best for self-regulated learning
(overall) and for phases 1 through 3. Linear models fit best for phases 4 through 7. As
shown in the first panel of Table 7, the coefficients of the linear parameter did not differ
significantly from 0, and the coefficients of the quadratic parameter differed significantly
from 0 only in the overall model and in the models for phases 1 and 2 (T-Ratio, p < .05).
These results confirm the observation based on Figure 1 that there is relatively small
change over time (Q3).
Influence of Intelligence, and Intelligence in Combination with Learning-Goal Orientation
on the Change in the Preference for Self-Regulated Learning. Hierarchical models can not
only be used to describe the change in the whole sample, but also to analyze whether
students and/or classrooms differ from each other in the linear or the quadratic
parameter3. Before we could examine whether intelligence alone (Q4) or in combination
with high learning-goal orientation (Q5) influences the change in the preference for self-
regulated learning, we had to test if the students differed at all in their trajectories once
classroom affiliation was controlled. As shown in the second panel of Table 7, we found
level-2 (student-level) variance in the trajectories for the overall preference for self-
regulated learning (marginally significant, chi-square test, p = .083), for self-assessment
(phase 1, chi-square test, p = .004) and for strategy implementation (phase 4, chi-square
test, p = .003). However, the student-level variable intelligence did not explain significant
variance in any of these cases (see also Table 7) (Q4). The combination of high
intelligence and high learning-goal orientation (Q5) did not explain significant variance
in the trajectories either. Due to the limited space these latter non-significant results are
not presented in detail. Exploratory analyses with only learning-goal orientation as
predictor showed that a high learning-goal orientation – independent of intelligence –
20%
25%
30%
35%
40%
45%
50%
T1 T2 T3
perc
en
tag
e s
elf
-reg
ula
ted
le
arn
ing
Self-regulated learning (total)
Selbsteinschätzung (Stufe 1)
Ziele setzen (Stufe 2)
Strategische Planung (Stufe 3)
Strategieanwendung (Stufe 4)
Strategieüberwachung (Stufe 5)
Strategieanpassung (Stufe 6)
Ergebnis bewerten (Stufe 7)
self-assessment (phase1)
strategy implementaion (phase 4)
strategic planning (phase 3)outcome monitoring (phase 7)self-regulated learning (overall)
goal-setting (phase 2)
strategy adjustment (phase 6)strategy monitoring (phase 5)
C. Sontag et al. 12
Intelligence and Self-Regulated Learning 13
C. Sontag et al. 14
influenced the slope for strategy implementation (phase 4): For students whose learning-
goal orientation is one standard deviation above the mean, the preference for
implementing strategies in a self-regulated way increases 4 % more in the course of time
than for students with average learning-goal orientation.
Analyzing the classroom-level variance in the slope (also shown in the second panel of
Table 7), we found significant variance in the change in the overall preference for self-
regulated learning as well as in the change in all phases except for phase 6 (strategy
adjustment). No specific classroom variables were included in this study. Therefore
variance on the classroom level could not be explained by classroom characteristics.
Overall, however, the results show that the preference for self-regulated learning changes
differently for students in different classrooms.
Discussion
The assumption that highly intelligent students prefer self-regulated learning over other
forms of learning is still common in the field of gifted education. However, existing
research regarding the relationship of intelligence and self-regulated learning yields
heterogeneous results. As heterogeneous definitions, inadequate methods, and
inappropriate designs make it hard to interpret findings from these studies the goal of our
study was to shed more light on this relationship, thereby avoiding several drawbacks of
previous studies. We gave clear definitions of both constructs under investigation and
used instruments that specifically matched these definitions. Intelligence was defined as
g-factor and operationalized via the German version of Raven’s Standard Progressive
Matrices (Heller et al., 1998), self-regulated learning was based on the definition by
Ziegler and Stoeger (2005), operationalized via the preference for self-regulated learning
and measured with a theory-based questionnaire (Ziegler et al., 2010). We examined not
only the relationship between intelligence and the overall preference for self-regulated
learning, but also the relationship between intelligence and all seven phases of self-
regulated learning postulated in the theoretical model of self-regulated learning that our
study is based on. In contrast to many other studies we used a non-selective sample, that
is, the highly intelligent students in our sample did not attend special classes or schools
for gifted students but studied in the same learning environment as their peers. This
design choice minimizes confounding effects of the learning environment. To
nevertheless control for classroom influences we analyzed our data with hierarchical
linear modeling (cf. Raudenbush & Bryk, 2006). Although this statistical procedure has
been available for quite some time (cf. Hox, 1998), to our knowledge it has not yet been
used in the joint examination of intelligence and self-regulated learning.
Moreover, we expanded the cross-sectional design used in existing studies by a
longitudinal component. We chose to work with fourth-grade elementary school students
who were approximately nine to ten years old. Not only are they from a population that has
received little attention in the research literature on intelligence and self-regulated
learning so far, but they are also in an interesting phase in their education: In Germany,
the country in which this study was conducted, fourth grade is less playful than previous
grades, tasks are more challenging and students are expected to become more and more
self-reliant in their learning behavior. It seemed reasonable to assume that under these
circumstances the students’ preference for self-regulated learning could increase. We
therefore analyzed if this was the case for all students. Additionally, we examined if the
change in students’ preference for self-regulated learning was predicted by intelligence
or by intelligence in combination with learning-goal orientation.
Taken together, the findings from our cross-sectional analyses do not support the
assumption that highly intelligent students prefer self-regulated learning over other
approaches to learning. We conducted different types of analyses to answer our first two
research questions: First, both simple bivariate correlations and hierarchical linear
regressions yielded very small and non-significant relationships between intelligence
and the preference for self-regulated learning. This holds true both for the overall
Intelligence and Self-Regulated Learning 15
preference for self-regulated learning and for the preference for self-regulated learning
in all seven phases of the learning cycle (Ziegler & Stoeger, 2005). Second, comparing the
most intelligent students (top 5 %) with their peers yielded no significant differences in
the average preference for self-regulated learning, neither for the overall preference nor
for the preference in any of the seven phases.
From a methodological point of view, the lack of significant correlations cannot be
attributed to restricted variance as the variance in all variables was considerable.
Regarding the group comparisons, differences in the mean preference for self-regulated
learning might in fact be overlooked due to the small number of highly intelligent
students. If, in fact, there were differences, a look at the groups’ mean values suggests that
it is the average intelligent students who have a higher preference for self-regulated
learning.
How do we explain these findings? One explanation could be that highly intelligent
students already internalized some aspects of self-regulated behavior and therefore do
not remember self-regulated learning as such when asked about it in a questionnaire. To
find out if this assumption holds, additional research involving other methods of data
collection would be necessary (see Limitations and Future Research). Another quite likely
explanation is that a learning environment that is not challenging or complex enough
prevents students from self-regulating their learning. This could be the case for all
students, but especially for highly intelligent students. If highly intelligent students can
solve tasks easily without thoroughly thinking them or the associated learning process
through, they could be right in not self-regulating their learning, as it is the most efficient
approach to learning in this specific environment (cf. Rabinowitz, Freeman, & Cohen,
1992). In other words, highly intelligent students may avoid the extra effort associated
with self-regulated learning when there is no immediate benefit to it. Additional analyses
within our sample showed indeed, that the highly intelligent students managed to get
better grades than their peers, even though they did not self-regulate their learning more.
The assumption that students only self-regulate their learning in challenging
environments in which they actually benefit from doing so seems to be supported by the
results of other studies. Many studies that show advantages in self-regulated learning for
the more intelligent students compared highly intelligent students who attended special
schools or tracks for high achievers to students in regular schools or tracks (e.g.
Zimmerman & Martinez-Pons, 1990), whereas studies in which no advantage was found
looked at students from the same or similar environments (e.g. Dresel & Haugwitz, 2005).
Regarding the longitudinal analyses, we assumed that demands and task difficulties
would rise in the course of fourth grade, possibly resulting in an increase in the
preference for self-regulated learning among students. As the assumption that intelligent
students prefer self-regulated learning is still common in the field of giftedness research
we explored the question of whether the preference for self-regulated learning increases
more for the more intelligent students in the course of grade four. While it seems
plausible to generally assume that more intelligent students adapt better to the more
challenging tasks and the changing situation in fourth grade by increasing their self-
regulated learning, at the same time, it seems plausible that the preference for self-
regulated learning increases more the more learning-goal oriented and intelligent
students are.
Contrary to our assumptions, we found that, irrespective of intelligence, the overall
preference for self-regulated learning did not increase throughout the school year. In fact,
although we observed some change in the preference for self-regulated learning in
individual phases, the change itself was small. Although fourth grade is generally seen as
more challenging and serious than previous grades, it is conceivable that most students –
irrespective of their intelligence – either do not notice the change or do not feel the need
to react to it by changing their approach to learning. In addition, students could be more
aware of the importance of grades for their school career than we anticipated and
therefore might feel it is safer not to experiment with new approaches to learning and/or
C. Sontag et al. 16
think they will fare better if they learn exactly as parents or teachers tell them to learn.
The hierarchical regression analyses allowed us to separate the variance in the change in
the preference for self-regulated learning that is due to students’ belonging to a certain
classroom from the variance that is due to individual differences. While we did not see
classroom effects in the cross-sectional analyses at the beginning of the school year –
suggesting that classrooms did not differ in their promotion of self-regulated learning in
the previous years – we did find classroom effects regarding the change in the preference
for self-regulated learning in all but one phase (strategy adjustment), indicating that
classrooms differed with respect to fostering self-regulated learning in the course of
fourth grade. At this point we can only speculate as to why classrooms did not differ in the
change of strategy adjustment. One possible explanation could be that none of the
teachers paid particular attention to this phase, and therefore students in all classrooms
change in similar ways. As we were not primarily interested in classroom effects in this
study, we did not measure variables that might explain the classroom effects. We will
return to this issue when discussing the study’s limitations and suggesting future research.
With the classroom effects statistically controlled, we found individual variance in the
change in the preference for self-regulated learning only in the overall measure, in self-
assessment (phase 1), and in strategy implementation (phase 4). This is to say that
students within the same classroom differ in the degree to which they change their
preference for self-regulating these phases. It might be the case that all classrooms
provide opportunities for self-assessment and strategy implementation to some extent,
and students’ characteristics determine if students make use of them. However,
intelligence did not explain any of these individual differences in change. The more
intelligent students did not develop a more pronounced preference for self-regulated
learning, and neither did students with a combination of higher intelligence and higher
learning-goal orientation. Exploratory analyses showed that a higher learning goal
orientation alone was associated with a stronger increase in the preference for self-
regulated strategy implementation (phase 4). This is in line with the theoretical reasoning
that self-regulated learning is a taxing activity that requires learning motivation (cf.
Pintrich, 2000). However, for the overall measure and for self-assessment (phase 1)
learning-goal orientation did not explain individual differences in the change.
Taken together, our results suggest that classroom influences have a greater impact on the
change in the preference for self-regulated learning than individual students’
characteristics. We believe that this finding is highly relevant in the field of giftedness
research in which individuals and their characteristics (such as intelligence) have been
the main focus for a long time. By now, learning processes have gained importance, but
still the research focus seems to be on the individual.
Practical Implications
A practical implication of our study is that teachers should be encouraged to integrate
elements of self-regulated learning into their regular classroom instruction, thereby
fostering self-regulated learning in all – including the highly intelligent – students. While
research has already shown that teachers can successfully implement specific training
programs over a distinct period of time (Dignath, Buettner, & Langfeldt, 2008), it remains a
challenge to find ways in which teachers can permanently create learning environments
to foster self-regulated learning on a continuing basis. Drawing on our own results and on
the literature (cf. Perry & Rahim, 2011) we believe this implies, first, assigning tasks that
are challenging and complex enough to necessitate self-regulated learning, second,
supporting students in acquiring, coordinating and practicing self-regulation skills such
as self-assessing, goal-setting, strategic planning, strategy use, strategy monitoring,
strategy adjustment and outcome monitoring, and third, demonstrating the value of self-
regulated learning by drawing attention to the connection between self-regulated
learning and achievement.
Intelligence and Self-Regulated Learning 17
A second practical implication concerns the fact that we observed a considerable overlap
in the preference for self-regulated learning between the highly intelligent and the
average intelligent students, and a large variation within each of the two groups. Therefore
we recommend that practitioners diagnose each student’s preferred approach to learning
individually, for example by applying the FSL-7 (Ziegler et al., 2010). Ideally, practitioners
should also talk to students about the reasons for their preferring a certain approach to
learning, especially if students prefer impulsive or externally regulated learning
behavior. Knowing the students’ preferred approach to learning is a good start for
systematically improving their learning.
Limitations and Future Research
Before closing we would like to address some limitations of this study and make
suggestions for future research. First, we used a self-report questionnaire to measure the
preference for self-regulated learning. Self-report data can be distorted by social
desirability, measuring more what students think is expected of them than their actual
behavior. However, the following reason alleviates this concern: It is not self-evident that
fourth-graders view self-regulated learning as the most socially desirable option. Rather
they might think that either listening to parents and teachers or effortless/impulsive
learning is more socially desirable. Ergo, if students do view self-regulated learning as
the most socially desirable option, this would be a step in the right direction. They might
be more willing to self-regulate their learning and be more successful in the long run.
Second, as self-regulated learning is a very complex construct and we wanted to capture
all theoretically implied subprocesses in the context of various school-relevant situations,
we decided to measure just one aspect of self-regulated-learning, namely the preference
for self-regulated learning over externally regulated and impulsive learning. We did not
measure the overall frequency of self-regulated actions during actual learning tasks, the
quality, or even the adequacy of self-regulated learning behavior. Therefore, we have to
be cautious when generalizing our findings to these aspects. Similarly, we succeeded in
measuring all theoretically relevant phases with one coherent instrument, but so far have
not investigated interconnections between the phases.
We recommend that future research on giftedness and self-regulated learning also
include the measurement of self-regulated behavior in real life tasks, for example by
using think aloud protocols (cf. Greene, Robertson, & Croker Costa, 2011), computer tools
(Azevedo, Johnson, Chauncey, & Graesser, 2011) or video analysis of real classroom
instruction (cf. Perry & Rahim, 2011). These methods allow for the observation of the
quality and frequency of self-regulated learning as well as for the investigation of
interactions between different phases.
Still, we believe that questionnaires remain a useful tool for measuring general
preferences or attitudes towards self-regulated learning, especially in large samples.
Ideally, all these methods are used in combination, as there is a good chance that they
measure slightly different concepts that could tap into different sources of variance when
explaining students’ achievement gains (cf. Spörer & Brunstein, 2006).
Third, we assumed that the task difficulty would rise in the course of fourth grade,
resulting in a greater preference for self-regulated learning among highly intelligent
students. However, as we could not actively manipulate the task level, it might be the case
that the threshold for task difficulty had not been reached for highly intelligent students –
or that even highly intelligent students did not notice the change in difficulty. Therefore
we recommend that the role of changing task difficulty (in relation to a person’s cognitive
abilities) for self-regulated learning be further explored in an experimental setting.
Finally, although we controlled for classroom effects, we did not measure classroom or
teacher variables that could explain them. We already discussed the importance of
teachers’ providing appropriate tasks for students of all cognitive ability levels. Similarly,
other variables of instructional quality such as the provision of support or the use of
C. Sontag et al. 18
adequate evaluation practices (cf. Perry & VandeKamp, 2000) could explain different
trajectories with regard to self-regulated learning. In addition, variables associated
directly with the teacher, such as his or her attitude towards self-regulated learning,
should be explored as well. Especially in elementary schools, where students spend most
of their time in school with one teacher, teachers’ attitudes – manifested in their behavior
– could strongly influence how students develop as learners.
To sum up, we presented a study examining the relationship of intelligence and the
preference for self-regulated learning, avoiding some methodological and design
problems inherent in many empirical studies to date. Highly intelligent students did not
prefer self-regulated learning more than their peers in the same learning environment,
and differences in the changes in the preference for self-regulated learning in the course
of the fourth grade were not associated with intelligence. Interestingly however, students
in different classrooms differed in their trajectories of the preference for self-regulated
learning. Based on these results we propose that practitioners explore the students’
preferred approach to learning individually and irrespective of their intelligence level,
and provide opportunities and support for self-regulated learning for all students,
including highly intelligent students. Finally, we emphasize the importance of including
real learning tasks and classroom variables in future research on giftedness and self-
regulated learning.
Acknowledgments
We would like to thank our colleague Teresa Greindl for her assistance in data collection,
and our colleague Judith Schmirl for language proofreading.
A shorter and modified version of this article will be published in the Proceedings of the
IRATDE conference 2011, Al Jubail, Saudi Arabia.
Notes 1 Also, the imputation of missing values would have involved the estimation of categorical
variables in the self-regulation questionnaire (Was self-regulated learning chosen or not
in a certain phase and situation?). We are not aware of a procedure that can reliably deal
with estimating a large number of categories in one instrument with justifiable effort.
2 We use the term „predicted“ strictly in the statistical sense and do not imply a causal
relationship as intelligence and self-regulated learning were both measured at T1.
3 Variance in the intercept, i.e., in the mean preference for self-regulated learning
between students and/or between classrooms, could be analyzed as well. At T1, we
found only little intercept variance at the classroom level. Although we did find large
intercept variance at the student level, this variance could not be explained with
intelligence as predictor. For this reason, we excluded the analysis of intercept variance
from our further analyses. Instead, we focus on the difference in the slope variance, i.e.,
the change over time.
Appendix A
Equations to Predict the Preference for Self-Regulated Learning by Intelligence
Level 1: SRL = β0 + β1(intelligence) + r
Level 2: β0 = γ00 + u0
β1 = γ10 + u1
Intelligence and Self-Regulated Learning 19
Appendix B
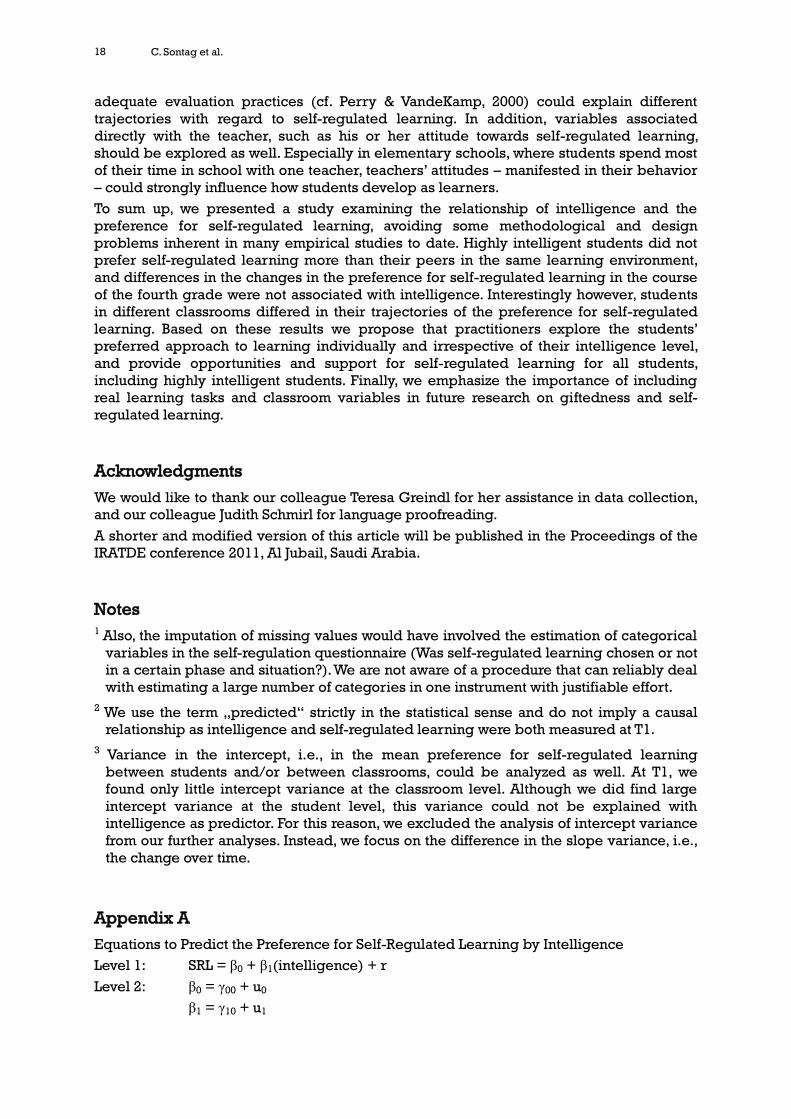
Equations to Model the Change in the Preference for Self-Regulated Learning Over Time
Level 1: SRL = π0 + π1(T) + π2(T2) + e
Level 2: π0 = β00 + r0
π1 = β10 + r1
π2 = β20 + r2
Level 3: β00 = γ000 + u00
β10 = γ100 + u10
β20 = γ200 + u20
References
Alexander, J. M., & Manion, V. (1996, April).
Metacognition and sorting strategy development. Poster presented at the annual
meeting of the American Educational
Research Association, New York City, New
York. Alexander, J. M., & Schwanenflugel, P. J. (1994).
Strategy regulation: The role of intelligence,
metacognitive attributions, and knowledge
base. Developmental Psychology, 30, 709–
723. doi:10.1037/0012-1649.30.5.709
Alexander, J. M., & Schwanenflugel, P. J. (1996).
Development of metacognitive concepts
about thinking in gifted and nongifted
children: recent research. Learning and Individual Differences, 8, 305–325.
doi:10.1016/S1041-6080(96)90021-7
Alexander, P. A., Graham, S., & Harris, K. R. (1998).
A perspective on strategy research: Progress
and prospects. Educational Psychology Review, 10, 129–154. doi:10.1023/A:
1022185502996
Ames, C., & Archer, J. (1988). Achievement goals in
the classroom: Students’ learning strategies
and motivation processes. Journal of Educational Psychology, 80, 260–267.
doi:10.1037/0022-0663.80.3.260
Azevedo, R., Johnson, A., Chauncey, A., & Graesser,
A. (2011). Use of hypermedia to assess and
convey self-regulated learning. In B. J.
Zimmerman & D. H. Schunk (Eds.), Handbook of self-regulation of learning and performance (pp. 102–121). New York:
Routledge.
Bandura, A. (1986). Social foundations of thought
and action: A social cognitive theory.
Englewood Cliffs, NJ: Prentice-Hall.
Baumert, J., Klieme, E., Neubrand, M., Prenzel, M.,
Schiefele, U., Schneider, W., … Weiß, Manfred
(2000). Fähigkeit zum selbstregulierten Lernen als fächerübergreifende Kompetenz
[The ability to engage in self-regulated
learning as an interdisciplinary competence].
Berlin, Germany: PISA Projekt Konsortium.
Retrieved from http://www.mpib-
berlin.mpg.de/Pisa/ CCCdt.pdf
Boekaerts, M., Pintrich, P. R., & Zeidner, M. (Eds.).
(2000). Handbook of self-regulation. San
Diego, CA: Academic Press.
Bouffard-Bouchard, T., Parent, S., & Larivée, S.
(1993). Self-regulation on a concept-formation
task among average and gifted students.
Journal of Experimental Child Psychology, 56,
115–134. doi:10.1006/jecp.1993.1028
Chan, L. K. S. (1996). Motivational orientations and
metacognitive abilities of intellectually gifted
students. Gifted Child Quarterly, 40, 184–193.
doi:10.1177/001698629604000403
De Jager, B., Jansen, M., & Reezigt, G. (2005). The
development of metacognition in primary
school learning environments. School Effectiveness and School Improvement, 16,
179–196. doi:10.1080/09243450500114181
Dignath, C., Buettner, G., & Langfeldt, H.-P. (2008).
How can primary school students learn self-
regulated learning strategies most
effectively? A meta-analysis on self-
regulation training programs. Educational Research Review, 3, 101–129.
doi:10.1016/j.edurev.2008.02.003
Dresel, M., & Haugwitz, M. (2005). The relationship
between cognitive abilities and self-
regulated learning: Evidence for interactions
with academic self-concept and gender. High Ability Studies, 16, 201–218. doi:10.1080/
13598130600618066
Ericsson, K. A., Krampe, R. T., & Tesch-Römer, C.
(1993). The role of deliberate practice in the
acquisition of expert performance. Psycho-logical Review, 100, 363–406.
Ewers, C. A., & Wood, N. L. (1993). Sex and ability
differences in children’s math self-efficacy
and prediction accuracy. Learning and Individual Differences, 5, 259–267. doi:10.
1016/1041-6080(93)90006-E
Fan, X. (2003). Two approaches for correcting
correlation attenuation caused by
measurement error: Implications for research
practice. Educational and Psychological Measurement, 63, 915–930. doi:10.1177/
0013164403251319
Fischer, C. (2008). Lernstrategien in der
Begabtenförderung [Learning strategies in
gifted education]. News & Science, 7 (2), 31–
34.
Fischer, C., & Stoeger, H. (Eds.). (2010).
Selbstreguliertes Lernen [Self-regulated
learning]. Journal für Begabtenförderung,
C. Sontag et al. 20
10(1). Innsbruck, Austria: StudienVerlag.
Gagné, F. (2005). From gifts to talents. The DMGT
as a developmental model. In R. J. Sternberg
& J. E. Davidson (Eds.), Conceptions of giftedness (2nd ed., pp. 98–119). Cambridge:
Cambridge University Press.
Greene, J. A., Robertson, J., & Croker Costa, L.-J.
(2011). Assessing self-regulated learning
using think-aloud-methods. In B. J.
Zimmerman & D. H. Schunk (Eds.), Handbook of self-regulation of learning and performance (pp. 313–328). New York:
Routledge.
Heller, K. A., Kratzmeier, H., & Lengfelder, A.
(1998). Matrizen-Test Manual, Band 1 [accompanying manual for the ‚matrices-test‘,
volume I]. Göttingen, Germany: Beltz-Test.
[German version of Raven, J.C. (1976).
Standard Progressive Matrices. Oxford:
Oxford Psychologists Press.]
Heller, K. A., Perleth, C., & Lim, T. K. (2005). The
Munich model of giftedness designed to
identify and promote gifted students. In R. J.
Sternberg & J. E. Davidson (Eds.),
Conceptions of giftedness (2nd ed., pp. 147–
170). Cambridge: Cambridge University
Press.
Hox, J. (1998). Multilevel Modeling: When and Why.
In I. Balderjahn (Ed.), Studies in classification,
data analysis, and knowledge organization:
Vol. 21. Classification, data analysis, and data
highways (pp. 147–154). Berlin: Springer.
Hox, J. J. (2010). Multilevel analysis: Techniques and applications (2nd ed.). New York:
Routledge.
Kron-Sperl, V., Schneider, W., & Hasselhorn, M.
(2008). The development and effectiveness of
memory strategies in kindergarten and
elementary school: Findings from the
Würzburg and Göttingen longitudinal
memory studies. Cognitive Development, 23,
79–104. doi:10.1016/j.cogdev.2007.08.011
Lai, E. R. (2011). Metacognition: A literature review (Research Report). Retrieved from
http://www.pearsonassessments.com/hai/im
ages/tmrs/Metacognition_Literature_Review_
Final.pdf
Magnusson, D. (1967). Test theory. Reading, MA:
Addison-Wesley.
Midgley, C., Kaplan, A., Middleton, M., Maehr, M.
L., Urdan, T., Hicks-Anderman, L., … Roeser, R.
(1998). The development and validation of
scales assessing students’ achievement goal
orientations. Contemporary Educational Psychology, 23, 113–131. doi:10.1006/
ceps.1998.0965
Muchinsky, P. M. (1996). The correction for
attenuation. Educational and Psychological Measurement, 56, 63–75. doi:10.1177/
0013164496056001004
Neber, H., & Schommer-Aikins, M. (2002). Self-
regulated science learning with highly gifted
students: The role of cognitive, motivational,
epistemological, and environmental
variables. High Ability Studies, 13, 59–74.
doi:10.1080/13598130220132316
Nicholls, J. G. (Ed.). (1984). The development of
achievement motivation. Greenwich, CT: JAI
Press.
Perry, N. E., & Rahim, A. (2011). Studying self-
regulated learning in classrooms. In B. J.
Zimmerman & D. H. Schunk (Eds.), Handbook of self-regulation of learning and performance (pp. 122–136). New York:
Routledge.
Perry, N. E., & VandeKamp, K. O. (2000). Creating
classroom contexts that support young
children’s development of self-regulated
learning. International Journal of Educational Research, 33, 821–843. doi:10.1016/S0883-
0355(00)00052-5
Pintrich, P. R. (2000). The role of goal orientation in
self-regulated learning. In M. Boekaerts, P. R.
Pintrich, & M. Zeidner (Eds.), Handbook of self-regulation (pp. 451–502). San Diego, CA:
Academic Press.
Rabinowitz, M., Freemann, K., & Cohen, S. (1992).
Use and maintenance of strategies: The
influence of accessibility to knowledge. Journal of Educational Psychology, 84, 211–
218.
Raudenbush, S. W., & Bryk, A. S. (2006).
Hierarchical linear models: Applications and data analysis methods (2nd ed.). Thousand
Oaks, CA: Sage Publications.
Roebers, C. M., Schmid, C., & Roderer, T. (2009).
Metacognitive monitoring and control
processes involved in primary school
children’s test performance. British Journal of Educational Psychology, 79, 749–767.
doi:10.1348/978185409X429842
Schneider, W., & Bjorklund, D. F. (1992). Expertise,
aptitude, and strategic remembering. Child Development, 63, 461473. doi 10.1111/j.1467-
8624.1992.tb01640.x
Snijders, T. A. B., & Bosker, R. J. (2003). Multilevel
analysis: An introduction to basic and
advanced modeling. London: Sage.
Sontag, C., & Stoeger, H. (2010). Selbstreguliertes
Lernen und Hochbegabung [Self-regulated
learning and giftedness]. Journal für Begabtenförderung, 10(1), 6–23.
Spearman, C. (1904). “General intelligence,”
objectively determined and measured. The American Journal of Psychology, 15, 201–292.
Spörer, N. (2003). Strategie und Lernerfolg: Validierung eines Interviews zum selbstgesteuerten Lernen [Strategies and
successful learning: Validation of an interview
on self-regulated learning] (Doctoral
dissertation, University of Potsdam,
Germany). Retrieved from: http://opus.
kobv.de/ubp/volltexte/2005/150/
Spörer, N., & Brunstein, J. C. (2006). Erfassung
selbstregulierten Lernens mit
Selbstberichtverfahren. Ein Überblick zum
Stand der Forschung. [Assessing self-
regulated learning with self-report measures.
A state-of-the-art review] Zeitschrift für Pädagogische Psychologie, 20, 147–160. doi
10.1024/1010-0652.20.3.147
Stoeger, H. (2008). Editorial. High Ability Studies, 19, 99–102. doi:10.1080/13598130600647529
Stoeger, H., & Ziegler, A. (2005). Individual
Intelligence and Self-Regulated Learning 21
promotion of gifted students in the classroom
through self-regulated learning: Results of a
training study on homework behavior. Gifted and Talented International, 20(2), 7–19.
Stoeger, H., & Ziegler, A. (2008). Evaluation of a
classroom based training to improve self-
regulation in time management tasks during
homework activities with fourth graders.
Metacognition and Learning, 3, 207–230.
doi:10.1007/s11409-008-9027-z
Terman, L., & Oden, M. (1959). The gifted group at
midlife: Thirty-five years’ follow-up of the
superior child. Stanford, CA: Stanford
University Press.
Van der Stel, M., & Veenman, M. V. (2010).
Development of metacognitive skillfulness: A
longitudinal study. Learning and Individual Differences, 20, 220–224. doi:10.1016/j.lindif.
2009.11.005
Wigfield, A., Klauda, S. L., & Cambria, J. (2011).
Influences on the development of academic
self-regulatory processes. In B. J. Zimmerman
& D. H. Schunk (Eds.), Handbook of self-regulation of learning and performance (pp.
33–48). New York: Routledge.
Wolters, C. A., & Pintrich, P. R. (1998). Contextual
differences in student motivation and self-
regulated learning in mathematics, English,
and social studies classrooms. Instructional Science, 26, 27–47. doi:10.1023/A:100303592
9216
Ziegler, A. (2005). The actiotope model of
giftedness. In R. J. Sternberg & J. E. Davidson
(Eds.), Conceptions of giftedness (2nd ed.,
pp. 411–436). Cambridge: Cambridge
University Press.
Ziegler, A., & Stoeger, H. (2004). Differential effect
of motivational orientation on self-confidence
and helplessness among high achievers and
underachievers. Gifted and Talented International, 19(2), 61–68.
Ziegler, A., & Stoeger, H. (2005).
Trainingshandbuch selbstreguliertes Lernen
I. Lernökologische Strategien für Schüler der
4. Jahrgangsstufe Grundschule zur Verbes-
serung mathematischer Kompetenzen
[Accompanying manual for a training of self-
regulated learning I: Resource strategies for
4th grade elementary school students to
improve math skills]. Lengerich, Germany:
Pabst.
Ziegler, A., Stoeger, H., & Grassinger, R. (2010).
Diagnostik selbstregulierten Lernens mit
dem FSL-7 [Assessing self-regulated learning
with the FSL-7.] Journal für Begabten-förderung, 10(1), 24–33.
Zimmerman, B. J. (1995). Self-regulation involves
more than metacognition: A social cognitive
perspective. Educational Psychologist, 30,
217–221. doi:10.1207/s15326985ep3004_8
Zimmerman, B. J. (2011). Motivational sources and
outcomes of self-regulated learning and
performance. In B. J. Zimmerman & D. H.
Schunk (Eds.), Handbook of self-regulation of learning and performance (pp. 49–64). New
York: Routledge.
Zimmerman, B. J., & Martinez-Pons, M. (1990).
Student differences in self-regulated
learning: Relating grade, sex, and giftedness
to self-efficacy and strategy use. Journal of Educational Psychology, 82, 51–59. doi:10.
1037/0022-0663.82.1.51
The Authors
Christine Sontag holds a master’s degree in psychology from the University of
Regensburg, Germany. In her current position as research assistant and Ph.D.
candidate at the Chair for School Research, School Development, and
Evaluation at the University of Regensburg she conducts research on self-
regulated learning with elementary and secondary school students.
Heidrun Stoeger, PhD is chair professor for Educational Sciences at the
University of Regensburg, Germany. She holds the Chair for School Research,
School Development, and Evaluation. She is Editor-in-Chief of the journal High
Ability Studies and member of the editorial board of the German journal of
Talent Development. Her publications include articles and chapters on
giftedness, self-regulated learning, motivation, fine motor skills and gender.
C. Sontag et al. 22
Bettina Harder is research assistant and lecturer at the Department for
Educational Psychology at the University of Erlangen-Nuremberg, Germany.
She is vice-director and research coordinator of the departments’ counseling
center for the gifted. Her research projects focus on giftedness and the
development of achievement excellence from different perspectives. In her
PhD thesis she drew a theoretical and empirical comparison of common
models of giftedness in the context of a longitudinal study.
Training and Talent Selection 23 Talent Development & Excellence
Vol. 4, No. 1, 2012, 23–32
Training Differences and Selection in a Talent
Identification System Joseph Baker1*, Sebastian Bagats2, Dirk Büsch3, Bernd Strauss2 and Jörg Schorer2
Abstract: Contemporary models of human expertise (e.g., Ericsson, Nandagopal, &
Roring, 2009; Howe, Davidson, & Sloboda, 1998) emphasize the crucial role that
experience and training play in skill acquisition. However, the value of different forms
of training across development is not clear. This study compared training histories of
young athletes who were selected (n = 65) during talent identification camps with
athletes from the same camps who were not-selected (n = 64). As hypothesized,
selected players had different training profiles than those not-selected, although these
effects were restricted to females. Selected females performed more sport-specific
training than their not-selected counterparts and had greater involvement in sports
outside their area of expertise (i.e., non-sport-specific training). These results suggest
training behaviors distinguish between skill levels even within a single step along the
athlete development pathway, at least in females. Furthermore, they suggest non-
specific training may have value during early athlete development. The inconsistent
effects across sex groups highlight the need to control for sex in examinations of
expertise development. Further work is necessary to confirm these results in other
populations and integrate these findings into more comprehensive training-based
models of expert performance.
Keywords:
development, expertise, skill acquisition
Historically, discussions of the qualities that ultimately determine an individual’s potential
in a domain have focused on the roles of biological factors (i.e., nature) and/or
experience, practice and learning (i.e., nurture). Although the utility of the nature versus
nurture division has been criticized (see Davids & Baker, 2007, for example), researchers
continue to cling to this dichotomy when explaining how we acquire skills. Throughout the
early part of the 19th century, the role of biological factors was emphasized while more
contemporary models of human expertise (e.g., Ericsson, Roring, & Nandagopal, 2009;
Howe, Davidson, & Sloboda, 1998) emphasize the crucial role that experience and training
play in skill acquisition. Although most researchers support the notion that both genetic
and environmental factors are important to understanding this phenomenon, some (e.g.,
Ericsson, Krampe, & Tesch-Römer, 1993; Howe et al., 1998) have argued that attention to
appropriate high quality training is sufficient to explain differences between
performances of experts and their lesser skilled counterparts, essentially discounting the
role of genetic or biological factors as constraints on achievement.
This extreme nurturist approach is grounded in evidence indicating that differences
between experts and non-experts are due to learned skills rather than innate capacities.
For instance, Simon and Chase’s landmark study of expertise in 1973 (after de Groot,
1965) examined the differences between chess players at the grandmaster, master and
novice levels. The critical difference between performers at higher levels of skill was
being able to recognize and re-construct structured patterns of chess play; this difference
disappeared when pieces were presented in a random fashion (i.e., without a structure
1 School of Kinesiology and Health Science, York University, Toronto, Canada * Corresponding author. School of Kinesiology and Health Science, York University, 4700
Keele St., Toronto, ON, M3J 1P3, Canada. Email: [email protected] 2 Institute of Sport and Exercise Sciences, University of Muenster, Germany 3 Institute of Applied Training Science, Leipzig, Germany
ISSN 1869-0459 (print)/ ISSN 1869-2885 (online)
2012 International Research Association for Talent Development and Excellence
http://www.iratde.org
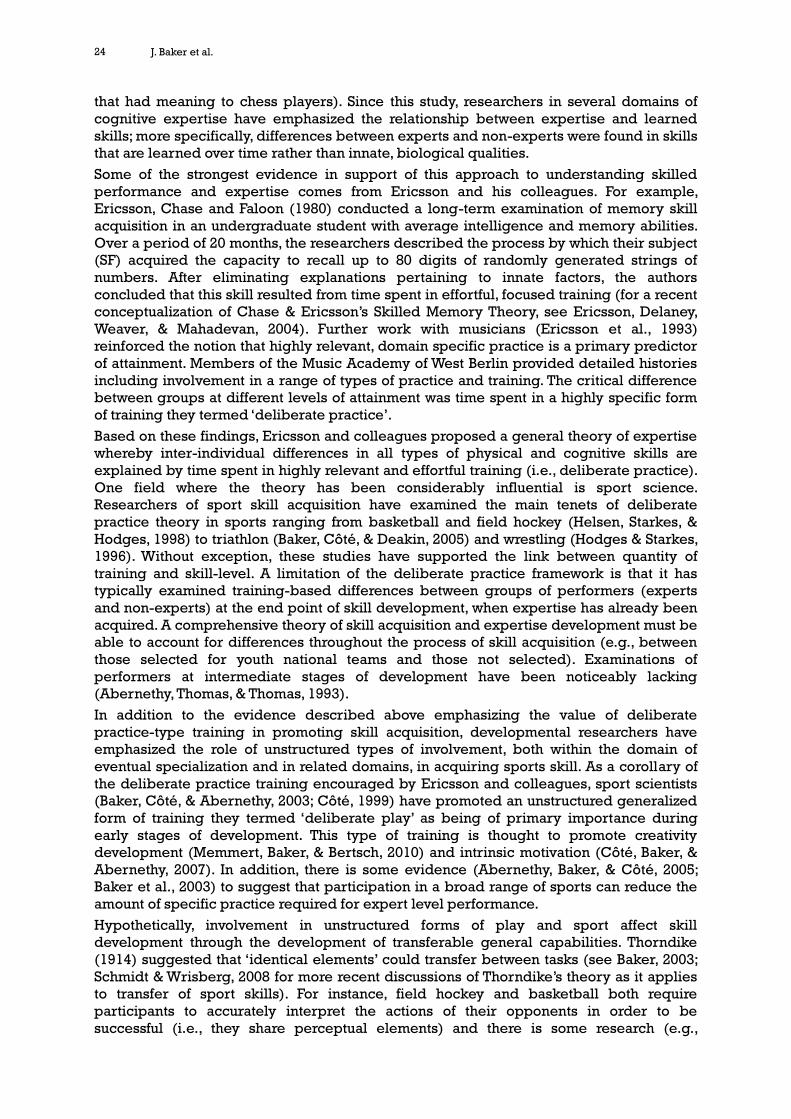
J. Baker et al.
24
that had meaning to chess players). Since this study, researchers in several domains of
cognitive expertise have emphasized the relationship between expertise and learned
skills; more specifically, differences between experts and non-experts were found in skills
that are learned over time rather than innate, biological qualities.
Some of the strongest evidence in support of this approach to understanding skilled
performance and expertise comes from Ericsson and his colleagues. For example,
Ericsson, Chase and Faloon (1980) conducted a long-term examination of memory skill
acquisition in an undergraduate student with average intelligence and memory abilities.
Over a period of 20 months, the researchers described the process by which their subject
(SF) acquired the capacity to recall up to 80 digits of randomly generated strings of
numbers. After eliminating explanations pertaining to innate factors, the authors
concluded that this skill resulted from time spent in effortful, focused training (for a recent
conceptualization of Chase & Ericsson’s Skilled Memory Theory, see Ericsson, Delaney,
Weaver, & Mahadevan, 2004). Further work with musicians (Ericsson et al., 1993)
reinforced the notion that highly relevant, domain specific practice is a primary predictor
of attainment. Members of the Music Academy of West Berlin provided detailed histories
including involvement in a range of types of practice and training. The critical difference
between groups at different levels of attainment was time spent in a highly specific form
of training they termed ‘deliberate practice’.
Based on these findings, Ericsson and colleagues proposed a general theory of expertise
whereby inter-individual differences in all types of physical and cognitive skills are
explained by time spent in highly relevant and effortful training (i.e., deliberate practice).
One field where the theory has been considerably influential is sport science.
Researchers of sport skill acquisition have examined the main tenets of deliberate
practice theory in sports ranging from basketball and field hockey (Helsen, Starkes, &
Hodges, 1998) to triathlon (Baker, Côté, & Deakin, 2005) and wrestling (Hodges & Starkes,
1996). Without exception, these studies have supported the link between quantity of
training and skill-level. A limitation of the deliberate practice framework is that it has
typically examined training-based differences between groups of performers (experts
and non-experts) at the end point of skill development, when expertise has already been
acquired. A comprehensive theory of skill acquisition and expertise development must be
able to account for differences throughout the process of skill acquisition (e.g., between
those selected for youth national teams and those not selected). Examinations of
performers at intermediate stages of development have been noticeably lacking
(Abernethy, Thomas, & Thomas, 1993).
In addition to the evidence described above emphasizing the value of deliberate
practice-type training in promoting skill acquisition, developmental researchers have
emphasized the role of unstructured types of involvement, both within the domain of
eventual specialization and in related domains, in acquiring sports skill. As a corollary of
the deliberate practice training encouraged by Ericsson and colleagues, sport scientists
(Baker, Côté, & Abernethy, 2003; Côté, 1999) have promoted an unstructured generalized
form of training they termed ‘deliberate play’ as being of primary importance during
early stages of development. This type of training is thought to promote creativity
development (Memmert, Baker, & Bertsch, 2010) and intrinsic motivation (Côté, Baker, &
Abernethy, 2007). In addition, there is some evidence (Abernethy, Baker, & Côté, 2005;
Baker et al., 2003) to suggest that participation in a broad range of sports can reduce the
amount of specific practice required for expert level performance.
Hypothetically, involvement in unstructured forms of play and sport affect skill
development through the development of transferable general capabilities. Thorndike
(1914) suggested that ‘identical elements’ could transfer between tasks (see Baker, 2003;
Schmidt & Wrisberg, 2008 for more recent discussions of Thorndike’s theory as it applies
to transfer of sport skills). For instance, field hockey and basketball both require
participants to accurately interpret the actions of their opponents in order to be
successful (i.e., they share perceptual elements) and there is some research (e.g.,
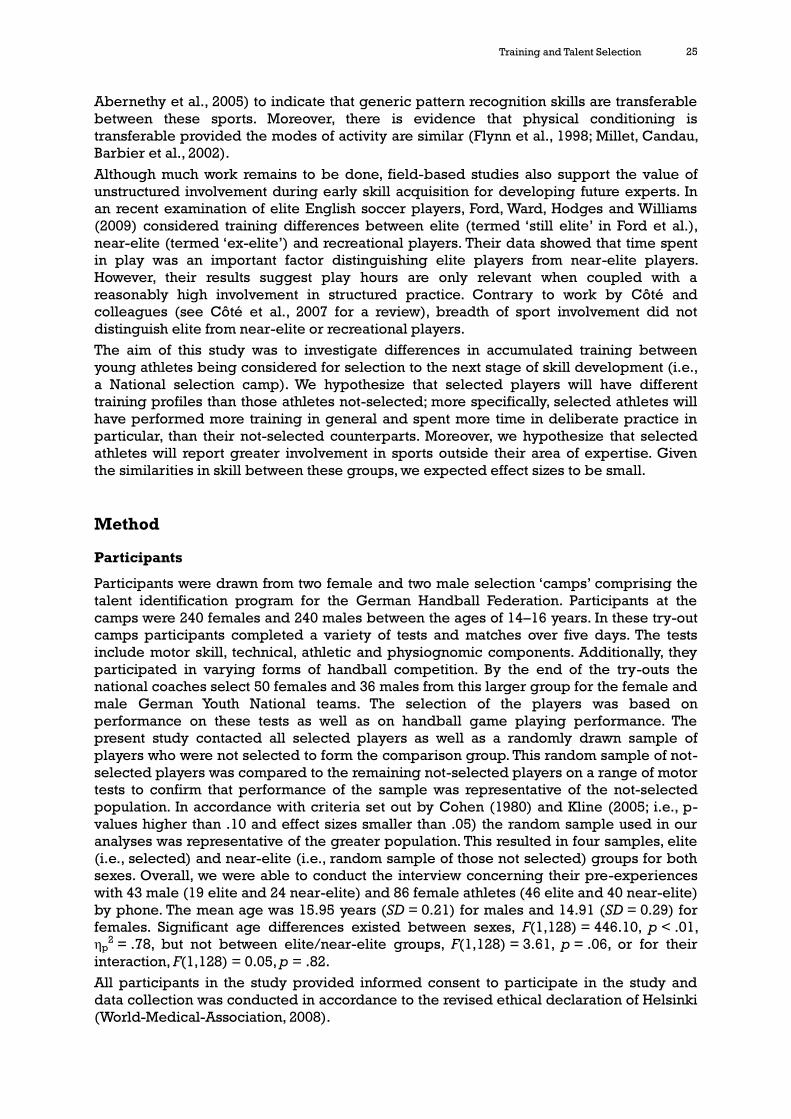
Training and Talent Selection 25
Abernethy et al., 2005) to indicate that generic pattern recognition skills are transferable
between these sports. Moreover, there is evidence that physical conditioning is
transferable provided the modes of activity are similar (Flynn et al., 1998; Millet, Candau,
Barbier et al., 2002).
Although much work remains to be done, field-based studies also support the value of
unstructured involvement during early skill acquisition for developing future experts. In
an recent examination of elite English soccer players, Ford, Ward, Hodges and Williams
(2009) considered training differences between elite (termed ‘still elite’ in Ford et al.),
near-elite (termed ‘ex-elite’) and recreational players. Their data showed that time spent
in play was an important factor distinguishing elite players from near-elite players.
However, their results suggest play hours are only relevant when coupled with a
reasonably high involvement in structured practice. Contrary to work by Côté and
colleagues (see Côté et al., 2007 for a review), breadth of sport involvement did not
distinguish elite from near-elite or recreational players.
The aim of this study was to investigate differences in accumulated training between
young athletes being considered for selection to the next stage of skill development (i.e.,
a National selection camp). We hypothesize that selected players will have different
training profiles than those athletes not-selected; more specifically, selected athletes will
have performed more training in general and spent more time in deliberate practice in
particular, than their not-selected counterparts. Moreover, we hypothesize that selected
athletes will report greater involvement in sports outside their area of expertise. Given
the similarities in skill between these groups, we expected effect sizes to be small.
Method
Participants
Participants were drawn from two female and two male selection ‘camps’ comprising the
talent identification program for the German Handball Federation. Participants at the
camps were 240 females and 240 males between the ages of 14–16 years. In these try-out
camps participants completed a variety of tests and matches over five days. The tests
include motor skill, technical, athletic and physiognomic components. Additionally, they
participated in varying forms of handball competition. By the end of the try-outs the
national coaches select 50 females and 36 males from this larger group for the female and
male German Youth National teams. The selection of the players was based on
performance on these tests as well as on handball game playing performance. The
present study contacted all selected players as well as a randomly drawn sample of
players who were not selected to form the comparison group. This random sample of not-
selected players was compared to the remaining not-selected players on a range of motor
tests to confirm that performance of the sample was representative of the not-selected
population. In accordance with criteria set out by Cohen (1980) and Kline (2005; i.e., p-
values higher than .10 and effect sizes smaller than .05) the random sample used in our
analyses was representative of the greater population. This resulted in four samples, elite
(i.e., selected) and near-elite (i.e., random sample of those not selected) groups for both
sexes. Overall, we were able to conduct the interview concerning their pre-experiences
with 43 male (19 elite and 24 near-elite) and 86 female athletes (46 elite and 40 near-elite)
by phone. The mean age was 15.95 years (SD = 0.21) for males and 14.91 (SD = 0.29) for
females. Significant age differences existed between sexes, F(1,128) = 446.10, p < .01,
ηp2 = .78, but not between elite/near-elite groups, F(1,128) = 3.61, p = .06, or for their
interaction, F(1,128) = 0.05, p = .82.
All participants in the study provided informed consent to participate in the study and
data collection was conducted in accordance to the revised ethical declaration of Helsinki
(World-Medical-Association, 2008).
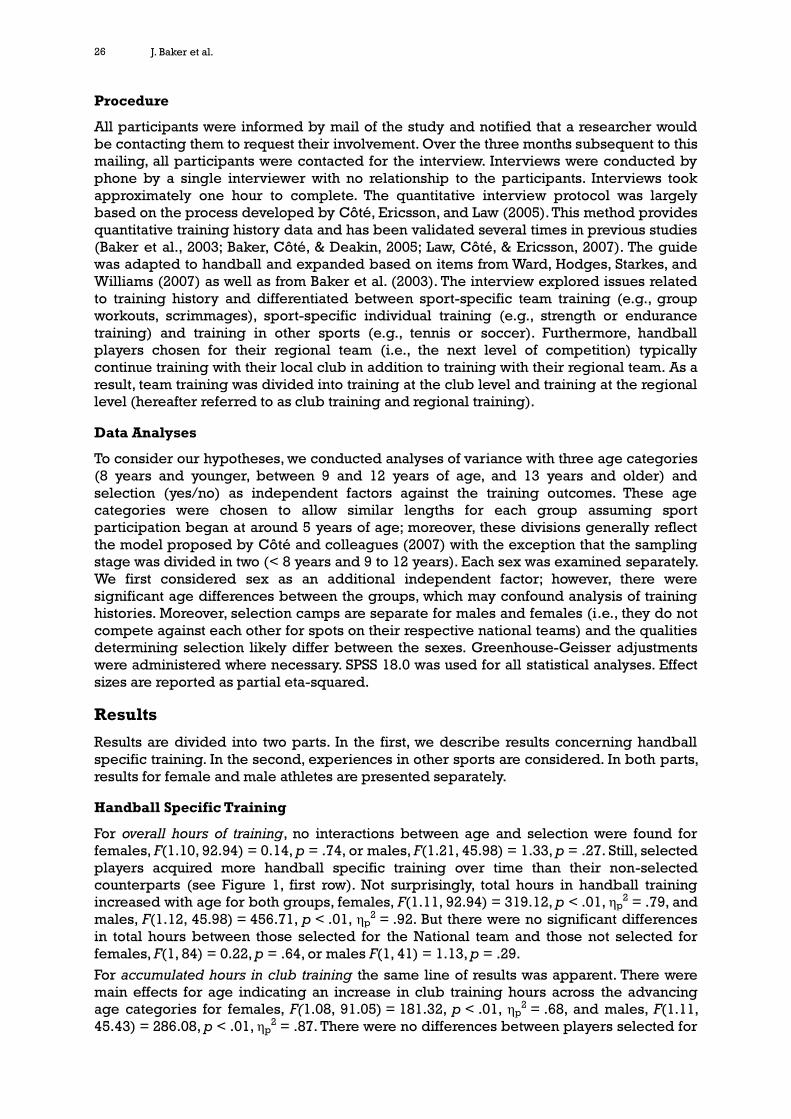
J. Baker et al.
26
Procedure
All participants were informed by mail of the study and notified that a researcher would
be contacting them to request their involvement. Over the three months subsequent to this
mailing, all participants were contacted for the interview. Interviews were conducted by
phone by a single interviewer with no relationship to the participants. Interviews took
approximately one hour to complete. The quantitative interview protocol was largely
based on the process developed by Côté, Ericsson, and Law (2005). This method provides
quantitative training history data and has been validated several times in previous studies
(Baker et al., 2003; Baker, Côté, & Deakin, 2005; Law, Côté, & Ericsson, 2007). The guide
was adapted to handball and expanded based on items from Ward, Hodges, Starkes, and
Williams (2007) as well as from Baker et al. (2003). The interview explored issues related
to training history and differentiated between sport-specific team training (e.g., group
workouts, scrimmages), sport-specific individual training (e.g., strength or endurance
training) and training in other sports (e.g., tennis or soccer). Furthermore, handball
players chosen for their regional team (i.e., the next level of competition) typically
continue training with their local club in addition to training with their regional team. As a
result, team training was divided into training at the club level and training at the regional
level (hereafter referred to as club training and regional training).
Data Analyses
To consider our hypotheses, we conducted analyses of variance with three age categories
(8 years and younger, between 9 and 12 years of age, and 13 years and older) and
selection (yes/no) as independent factors against the training outcomes. These age
categories were chosen to allow similar lengths for each group assuming sport
participation began at around 5 years of age; moreover, these divisions generally reflect
the model proposed by Côté and colleagues (2007) with the exception that the sampling
stage was divided in two (< 8 years and 9 to 12 years). Each sex was examined separately.
We first considered sex as an additional independent factor; however, there were
significant age differences between the groups, which may confound analysis of training
histories. Moreover, selection camps are separate for males and females (i.e., they do not
compete against each other for spots on their respective national teams) and the qualities
determining selection likely differ between the sexes. Greenhouse-Geisser adjustments
were administered where necessary. SPSS 18.0 was used for all statistical analyses. Effect
sizes are reported as partial eta-squared.
Results
Results are divided into two parts. In the first, we describe results concerning handball
specific training. In the second, experiences in other sports are considered. In both parts,
results for female and male athletes are presented separately.
Handball Specific Training
For overall hours of training, no interactions between age and selection were found for
females, F(1.10, 92.94) = 0.14, p = .74, or males, F(1.21, 45.98) = 1.33, p = .27. Still, selected
players acquired more handball specific training over time than their non-selected
counterparts (see Figure 1, first row). Not surprisingly, total hours in handball training
increased with age for both groups, females, F(1.11, 92.94) = 319.12, p < .01, ηp2 = .79, and
males, F(1.12, 45.98) = 456.71, p < .01, ηp2 = .92. But there were no significant differences
in total hours between those selected for the National team and those not selected for
females, F(1, 84) = 0.22, p = .64, or males F(1, 41) = 1.13, p = .29.
For accumulated hours in club training the same line of results was apparent. There were
main effects for age indicating an increase in club training hours across the advancing
age categories for females, F(1.08, 91.05) = 181.32, p < .01, ηp2 = .68, and males, F(1.11,
45.43) = 286.08, p < .01, ηp2 = .87. There were no differences between players selected for
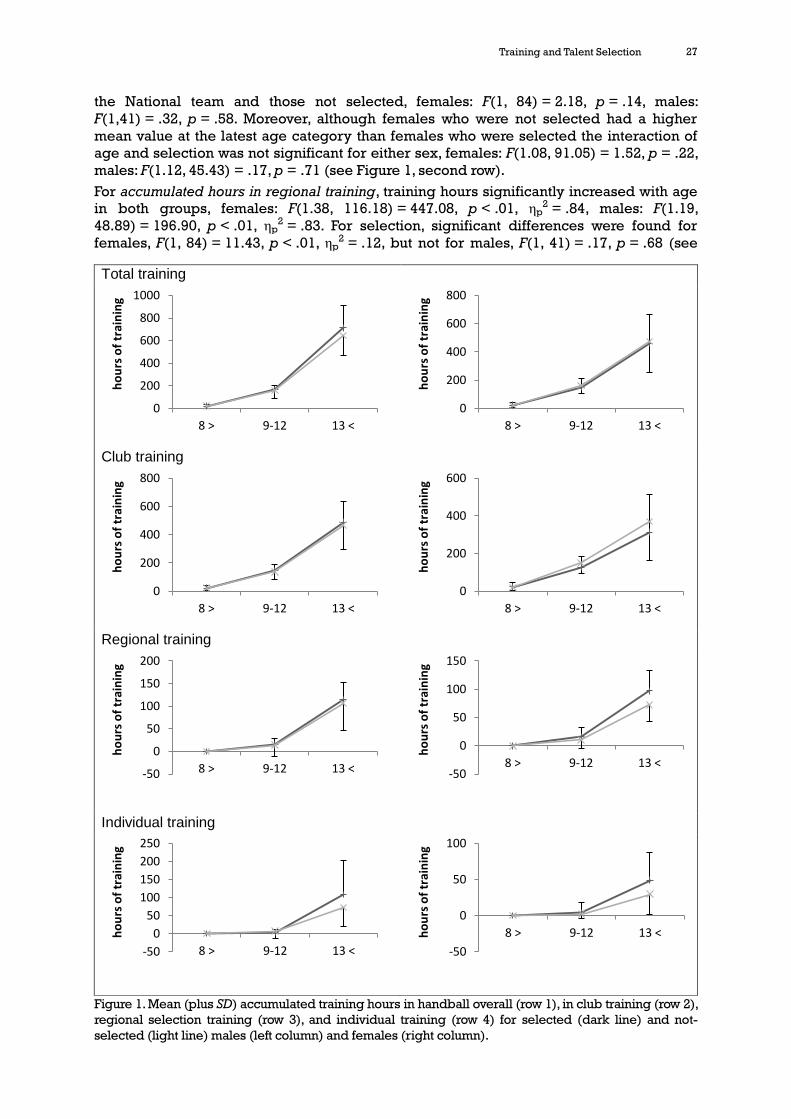
Training and Talent Selection 27
the National team and those not selected, females: F(1, 84) = 2.18, p = .14, males:
F(1,41) = .32, p = .58. Moreover, although females who were not selected had a higher
mean value at the latest age category than females who were selected the interaction of
age and selection was not significant for either sex, females: F(1.08, 91.05) = 1.52, p = .22,
males: F(1.12, 45.43) = .17, p = .71 (see Figure 1, second row).
For accumulated hours in regional training, training hours significantly increased with age
in both groups, females: F(1.38, 116.18) = 447.08, p < .01, ηp2 = .84, males: F(1.19,
48.89) = 196.90, p < .01, ηp2 = .83. For selection, significant differences were found for
females, F(1, 84) = 11.43, p < .01, ηp2 = .12, but not for males, F(1, 41) = .17, p = .68 (see
Total training
Club training
Regional training
Individual training
Figure 1. Mean (plus SD) accumulated training hours in handball overall (row 1), in club training (row 2),
regional selection training (row 3), and individual training (row 4) for selected (dark line) and not-
selected (light line) males (left column) and females (right column).
0
200
400
600
800
1000
8 > 9-12 13 <
ho
urs
of
trai
nin
g
0
200
400
600
800
8 > 9-12 13 < h
ou
rs o
f tr
ain
ing
0
200
400
600
800
8 > 9-12 13 <
ho
urs
of
trai
nin
g
0
200
400
600
8 > 9-12 13 <
ho
urs
of
trai
nin
g
-50
0
50
100
150
200
8 > 9-12 13 <
ho
urs
of
trai
nin
g
-50
0
50
100
150
8 > 9-12 13 <
ho
urs
of
trai
nin
g
-50
0
50
100
150
200
250
8 > 9-12 13 <
ho
urs
of
trai
nin
g
-50
0
50
100
8 > 9-12 13 < ho
urs
of
trai
nin
g
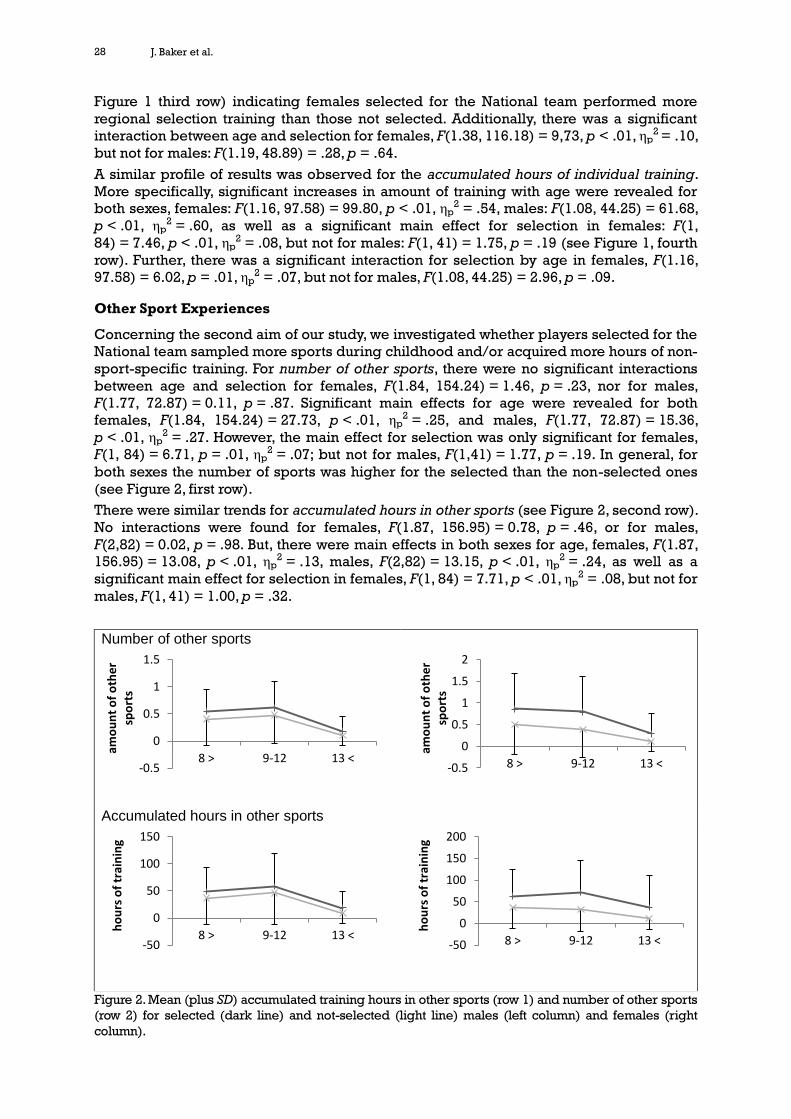
J. Baker et al.
28
Figure 1 third row) indicating females selected for the National team performed more
regional selection training than those not selected. Additionally, there was a significant
interaction between age and selection for females, F(1.38, 116.18) = 9,73, p < .01, ηp2 = .10,
but not for males: F(1.19, 48.89) = .28, p = .64.
A similar profile of results was observed for the accumulated hours of individual training.
More specifically, significant increases in amount of training with age were revealed for
both sexes, females: F(1.16, 97.58) = 99.80, p < .01, ηp2 = .54, males: F(1.08, 44.25) = 61.68,
p < .01, ηp2 = .60, as well as a significant main effect for selection in females: F(1,
84) = 7.46, p < .01, ηp2 = .08, but not for males: F(1, 41) = 1.75, p = .19 (see Figure 1, fourth
row). Further, there was a significant interaction for selection by age in females, F(1.16,
97.58) = 6.02, p = .01, ηp2 = .07, but not for males, F(1.08, 44.25) = 2.96, p = .09.
Other Sport Experiences
Concerning the second aim of our study, we investigated whether players selected for the
National team sampled more sports during childhood and/or acquired more hours of non-
sport-specific training. For number of other sports, there were no significant interactions
between age and selection for females, F(1.84, 154.24) = 1.46, p = .23, nor for males,
F(1.77, 72.87) = 0.11, p = .87. Significant main effects for age were revealed for both
females, F(1.84, 154.24) = 27.73, p < .01, ηp2 = .25, and males, F(1.77, 72.87) = 15.36,
p < .01, ηp2 = .27. However, the main effect for selection was only significant for females,
F(1, 84) = 6.71, p = .01, ηp2 = .07; but not for males, F(1,41) = 1.77, p = .19. In general, for
both sexes the number of sports was higher for the selected than the non-selected ones
(see Figure 2, first row).
There were similar trends for accumulated hours in other sports (see Figure 2, second row).
No interactions were found for females, F(1.87, 156.95) = 0.78, p = .46, or for males,
F(2,82) = 0.02, p = .98. But, there were main effects in both sexes for age, females, F(1.87,
156.95) = 13.08, p < .01, ηp2 = .13, males, F(2,82) = 13.15, p < .01, ηp
2 = .24, as well as a
significant main effect for selection in females, F(1, 84) = 7.71, p < .01, ηp2 = .08, but not for
males, F(1, 41) = 1.00, p = .32.
Number of other sports
Accumulated hours in other sports
Figure 2. Mean (plus SD) accumulated training hours in other sports (row 1) and number of other sports
(row 2) for selected (dark line) and not-selected (light line) males (left column) and females (right
column).
-0.5
0
0.5
1
1.5
8 > 9-12 13 <
amo
un
t o
f o
the
r sp
ort
s
-0.5
0
0.5
1
1.5
2
8 > 9-12 13 <
amo
un
t o
f o
the
r sp
ort
s
-50
0
50
100
150
8 > 9-12 13 <
ho
urs
of
trai
nin
g
-50
0
50
100
150
200
8 > 9-12 13 <
ho
urs
of
trai
nin
g
Training and Talent Selection 29
Discussion
This study examined whether specific types of training differentiated athletes selected for
a junior national handball team from those not selected. Investment in training increased
with age in both groups; moreover, in line with our hypotheses, training-related
differences were found between selected and not-selected females; however, this effect
did not hold for males. More importantly, in females, involvement in higher quality
training differentiated athletes with higher levels of skill. As athletes move through the
talent selection process, opportunities to train with superior coaches and more skilled
competitors become available (Helsen, Hodges, Van Winckel, & Starkes, 2000). The
significant interactions for females indicate that during later development those selected
for the national team spent more time in regional selection training (i.e., a superior form
of training) than those not-selected, but not in club training (i.e., regular training), which
did not differ between the groups.
Further, female athletes selected for the next stage of talent development performed
more individual training than their non-selected peers. In Ericsson et al.’s (1993) study of
development of expertise in musicians, individual training was the primary variable
differentiating performers at the different levels of attainment. Although the specific
qualities characterizing deliberate practice have been somewhat vague, the multi-
dimensional nature of sport training and competition has led some sport scientists
(Helsen et al., 1998) to suggest that all forms of sport-specific training be considered
deliberate practice, at least in team sports.
Interestingly, our results suggest some value to non-sport-specific training, at least during
early development. As expected, there were also significant differences in the breadth
and depth of sport experience reported by females selected for the National team
compared to those not selected, although this effect was not-significant for males.
Selected females accumulated more hours in more sports during early development than
their peers.
The differing effects for the male and female athletes are somewhat confusing. Although
we hypothesized similar effects for both groups, there are clear differences between male
and female handball, which may explain this inconsistency. Considerably more males
participate in handball in Germany than females (Schorer et al., 2009); moreover, male
handball has attained a superior level of prominence in German society (e.g., male
handball players at the highest league in Germany are considered professional and can
live well off their earnings while top female players cannot), which may affect the depth of
competition for spots on a team. Collectively, these factors (i.e., greater participant pool
and greater competition) may affect the quantity and quality of training necessary to
make it through different stages of development and suggest that the social-
developmental constraints are different for male and female handball players. At the
stage of development examined in this study (i.e., adolescence), it is possible that other
factors (e.g., creativity, decision-making) take prominence over training-based outcomes.
For the male talents training seems to be a necessary condition, but not a sufficient one to
explain skill differences at this stage of career. Additionally, there was a significant age
difference between the male and female groups (i.e., males were one year older on
average), which may have confounded any training x development relationships. Future
research is necessary to clarify the relationships between sex and training-related
variables in models of skill development and expertise attainment.
The lack of clear defining criteria for deliberate practice presents continuing challenges
for researchers in this area. It is possible that the value of specific forms of training is
dependent on the developmental status of the athlete under consideration. In early stages
of development, for example, unstructured, play-like involvement in a range of related
activities may meet the most critical aspect of deliberate practice, namely its relevance
for skill acquisition. During early development, broad generic foundational
skills/capabilities are developed, such as generic pattern recognition skills or general
J. Baker et al.
30
physiological capabilities, which seem to be transferable across domains (Abernethy et
al., 2005; Millet, Candau, Barbler et al., 2002). Over time adaptations to training become
much more specific, as reflected, for example, by experts’ skill at perceiving highly
specific body position ‘cues’ from their opponents in order to anticipate their forthcoming
actions (Mann, Williams, Ward, & Janelle, 2007). From this perspective, it may be more
advantageous to view the relevance of a specific type of training for athlete skill
acquisition along two dimensions, immediate relevance (as it relates to increases in
proficiency from day to day) and long-term relevance (as it relates to providing the
necessities for the extended practice associated with expertise development). Early
involvement in unstructured play-like activities across a range of related activities may be
more relevant for long-term skill development than structured practice (Côté, Baker, &
Abernethy, 2007) and, arguably (cf., Baker, 2003), equally relevant for short-term skill
acquisition, but only during early periods of development. Later in development, when
general cognitive and physical adaptations have been made, more specific deliberate
practice is required to continue improving performance.
Perhaps what is most notable about these findings, and most supportive of training-based
models of expertise, is that training behaviors were able to distinguish between female
athletes selected or not-selected in a single instance along the developmental pathway.
Although we only found significant effects for two out of six dependent variables and
these effects were restricted to the female participants, selection processes such as the
one examined in this study occur at regular intervals throughout an athlete’s development
and the ability to distinguish between athletes at such similar levels of skill is impressive.
Comparisons of athletes at similar levels of skill are rare in skill acquisition research
(Abernethy et al., 1991), which typically compares novices or non-experts to an expert
group. It is important to note that the design of this investigation does not allow us to
conclude that skill-based differences (i.e., between those selected versus not selected)
result from differing training profiles. It is equally plausible that selected athletes were
more ‘talented’ (i.e., biologically predisposed to higher levels of performance in the
domain) or demonstrated superior motivation (i.e., Winner, 1996, ‘rage to master’). The
high degree of variability in the training profiles among the male and female athletes in
both selected and not-selected groups also supports the possibility that some athletes are
able to attain similar levels of achievement with less training than required by others. A
design similar to the one used by Ericsson et al. (1980) would allow resolution of these
issues, although the practicality of this approach for long-term studies of skill acquisition
is questionable.
Concluding Remarks
Our results suggest some intriguing avenues for further applied and theoretical work. The
different pattern of results between the male and female groups suggests notable
differences between the developmental profiles in these groups; however, models of
athlete development do not typically distinguish between sexes. Although it was not
possible to test these differences in the current study, they provide important directions
for future work. Talent selection systems may wish to re-consider their athlete
development pathways since the current results suggest that training factors (and not
innate talent) explain, or at the very least confound, talent selection. Moreover, the value
of play and exposure to other sports during early and later development has not been
sufficiently examined in studies of long-term athlete development. Given the proposed
value of this type of sport involvement for developing intrinsic motivation and other
qualities associated with long-term devotion to a domain (Côté et al., 2007), further field-
based and experimental work is necessary.
Acknowledgements
We would like to thank all athletes who participated in this study as well as the German
Handball Federation for their support and cooperation on this project. This study was
Training and Talent Selection 31
partly supported by a grant from the German Federal Institute of Sport Science.
Additionally, we want to express our gratitude to Christina Janning and Rebecca Rienhoff,
who helped with the data collection.
References
Abernethy, B., Baker, J., & Côté, J. (2005).Transfer of
pattern recall skills may contribute to the
development of sport expertise. Applied
Cognitive Psychology, 19, 705–718.
Abernethy, B., Thomas, K. T., & Thomas, J. R. (1993).
Strategies for improving understanding of
motor mistakes (or mistakes we have made
and things we haved learned!). In J. L. Starkes
& F. Allard (Eds.), Cognitive issues in motor
expertise (pp. 317–356). Amsterdam: Elsevier
Science.
Baker, J. (2003). Early specialization in sport: A
requirement for adult expertise? High Ability
Studies, 14, 85–94.
Baker, J., Côté, J., & Abernethy, B. (2003). Sport-
specific practice and the development of
expert decision-making in team ball sports.
Journal of Applied Sport Psychology, 15, 12–25.
Baker, J., Côté, J., & Deakin, J. (2005). Cognitive
characteristics of expert, middle of the pack,
and back of the pack ultra-endurance
triathletes. Psychology of Sport and Exercise,
6, 551–558.
Baker, J., Côté, J., & Deakin, J. (2005). Expertise in
ultra-endurance triathletes early sport
involvement, training structure, and the
theory of deliberate practice. Journal of
Applied Sport Psychology, 17, 64–78.
Côté, J. (1999). The influence of the family in the
development of talent in sport. Sport
Psychologist, 13, 395–417.
Côté, J., Baker, J., & Abernethy, B. (2007). Practice
and play in the development of sport
expertise. In R. Eklund & G. Tenenbaum
(Eds.), Handbook of sport psychology (3rd ed.,
pp. 184–202). Hoboken, NJ: Wiley.
Côté, J., Ericsson, K. A., & Law, M. P. (2005). Tracing
the development of athletes using
retrospective interview methods: A proposed
interview and validation procedure for
reported information. Journal of Applied Sport
Psychology, 17, 1–19.
Davids, K., & Baker, J. (2007). Genes, environment
and sport performance: Why the nature-
nurture dualism is no longer relevant. Sports
Medicine, 37, 961–980.
de Groot, A. D. (1965). Thought and choice in chess.
Amsterdam: Noord-Hollandsche
Uitgeversmaatschappij.
Ericsson, K. A., Chase, W. G., & Faloon, S. (1980).
Acquisition of a memory skill. Science, 208,
1181–1182.
Ericsson, K. A., Delaney, P. F., Weaver, G., &
Mahadevan, R. (2004). Uncovering the
structure of a memorist’s superior “basic”
memory capacity. Cognitive Psychology, 49,
191–237.
Ericsson, K. A., Krampe, R. T., & Tesch-Römer, C.
(1993). The role of deliberate practice in the
acquisition of expert performance.
Psychological Review, 100, 363–406.
Ericsson, K. A., Nandagopal, K., & Roring, R. W.
(2009). Toward a Science of Exceptional
Achievement. Annals of the New York Academy
of Sciences, 1172, 199–217.
Flynn, M. G., Carroll, K. K., Hall, H. L., Bushman, B.
A., Brolinson, P. G., & Weideman, C. A. (1998).
Cross training: Indices of training stress and
performance. Medicine & Science in Sports
and Exercise, 30, 294–300.
Ford, P. R., Ward, P., Hodges, N. J., & Williams, A. M.
(2009). The role of deliberate practice and
play in career progression in sport: the early
engagement hypothesis. High Ability Studies,
20, 65–75.
Helsen, W. F., Hodges, N. J., Van Winckel, J., &
Starkes, J. L. (2000). The roles of talent,
physical precocity and practice in the
development of soccer expertise. Journal of
Sports Sciences, 18, 727–736.
Helsen, W. F., Starkes, J. L., & Hodges, N. J. (1998).
Team sports and the theory of deliberate
practice. Journal of Sport and Exercise
Psychology, 20, 12–34.
Hodges, N. J., & Starkes, J. (1996). Wrestling with
the nature of expertise: A sport specific test of
Ericsson, Krampe and Tesch-Römer's (1993)
theory of ≪deliberate practice≫.
International Journal of Sport Psychology, 27,
400–424.
Howe, M. J. A., Davidson, J. W., & Sloboda, J. A.
(1998). Innate talents: Reality or myth?
Behavioral and Brain Sciences, 21, 399–442.
Law, M., Côté, J., & Ericsson, K. A. (2007).
Characteristics of expert development in
rhythmic gymnastics: A retrospective study.
International Journal of Sport and Exercise
Psychology, 5, 82–103.
Mann, D. T. Y., Williams, A. M., Ward, P., & Janelle, C.
M. (2007). Perceptual-cognitive expertise in
sport: A meta-analysis. Journal of Sport and
Exercise Psychology, 29, 457–478.
Memmert, D., Baker, J., & Bertsch, C. (2010). Play
and practice in the development of sport-
specific creativity in team ball sports: A
preliminary examination. High Ability Studies,
21, 3–18.
Millet, G. P., Candau, R. B., Barbier, B., Busso, T.,
Rouillon, J. D., & Chatard, J. C. (2002).
Modelling the transfers of training effects on
performance in elite triathletes. International
Journal of Sports Medicine, 23, 55–63.
Millet, G. P., Candau, R. B., Barbler, B., Busso, T.,
Rouillon, J. D., & Chatard, J. C. (2002).
Modelling the transfers of training effects on
performance in elite triathletes. International
Journal of Sports Medicine, 23, 55–63.
Schmidt, R. A., & Wrisberg, C. A. (2008). Motor
learning and performance: A problem-based
learning approach (4th ed.). Champaign, IL:

J. Baker et al.
32
Human Kinetics.
Simon, H. A., & Chase, W. H. (1973). Skill in chess.
American Scientist, 61, 394–403.
Ward, P., Hodges, N. J., Starkes, J. L., & Williams, A.
M. (2007). The road to excellence: deliberate
practice and the development of expertise.
High Ability Studies, 18, 119–153.
Winner, E. (1996). The rage to master: The decisive
role of talent in the visual arts. In K. A.
Ericsson (Ed.), The road to excellence: The
acquisition of expert performance in the arts
and sciences, sports and games (pp. 271–301).
Hillsdale: Erlbaum.
World-Medical-Association. (2008). Declaration of
Helsinki – Ethical principles for medical
research involving human subjects. Retrieved
from http://www.wma.net/en/30publications/
10policies/b3/index.html
The Authors
Dr. Joe Baker is an associate professor in the School of Kinesiology and Health
Science at York University, Canada. His research examines the factors affecting
athlete development across the lifespan.
Sebastian Bagats finished his MA in sports and German studies at the University
of Münster. He is currently a teacher in training at the Marianne-Weber
Gymnasium in Lemgo.
Prof. Dr. Dirk Büsch is vice-director of the Institute for Applied Training Science
Leipzig, Germany and head of the department of game and combat sports. He
is also professor at the university of health and sport Berlin, Germany and
speaker of the commitee of game sports of the German Society of Sport
Science. His research considers game sports, talent, and motor behaviour.
Bernd Strauss is a full professor in sport psychology at the University of Münster
and the vice dean for strategy and budget. He serves as Co-Editor-in-Chief of
the journal Psychology of Sport and Exercise. His main research interests are
social processes in sports (e.g., home advantage, spectators), expertise in
sports (e.g., problem-solving, perception and performance), and diagnostics
(e.g., IRT models).
Dr. Jörg Schorer is a post-doctoral fellow at the University of Münster in the
Institute of Sport and Exercise Sciences. His research considers the
development and maintenance of expertise across the life-span from multiple
perspectives.
Educational Achievement of Gifted and Talented Students 33 Talent Development & Excellence
Vol. 4, No. 1, 2012, 33–48
Improving the Educational Achievement of Gifted and
Talented Students: A Systematic Review Richard Bailey1, Gemma Pearce2, Chris Smith3, Margaret Sutherland4, Niamh Stack4,
Carrie Winstanley5 and Matt Dickenson6
Abstract: This paper reports on the first systematic review of Gifted and Talented
Education. Its main aim was to investigate interventions designed to improve the
educational achievement of students identified as Gifted and Talented. A systematic
literature review method was used for both content analysis and in-depth thematic
synthesis of the articles. The review offers tentative corroboration for recent English
educational policies that focus support for Gifted and Talented students within
mainstream settings. Materials that emphasise personalised, differentiated learning
are, therefore, generally well-placed to offer specific guidance.
Keywords:
gifted; talented; educational achievement; systematic review; high ability
Introduction
Recent years have seen a radical change in both policy and practice related to the
education of our most able students around the world (Heller, Mönks, Sternberg, &
Subotnik, 2000). In the UK, for example, the issue of the education for the most able
students has moved from the margins of the educational arena towards centre stage. From
the late 1990s, Central government introduced a series of initiatives aiming to raise the
profile and substantially improve the quality of experience of these children, and it made
clear its expectation that schools and local authorities must formally support the
education of their able students (Dracup, 2003). These changes are, in part, in response to
calls from schools and parents that there was a group of children – the most able – whose
needs were not being met. They also followed on from inspection reports indicating that,
in general, so-called Gifted and Talented (G&T) students were not being sufficiently
challenged (OfSTED, 2001).
The main aim of this study was to investigate interventions designed to improve the
educational achievement of students identified as being G&T. Several reviews have
examined different aspects of G&T pedagogy (Hewston et al., 2005; Riley, Bevan-Brown,
Bicknell, Carroll-Lind & Kearney, 2004; VanTassel-Baska & Feng, 2004; White, Fletcher-
Campbell & Ridley, 2003; Ziegler & Raul, 2000; Freeman, 1998), but none have used a
systematic review methodology. Earlier reviews took a broader focus and tended to be
critical summaries of research literature in specific subject contexts (e.g. VanTassel-Baska
& Feng, 2004). The study upon which this paper is based (Bailey et al., 2008) is the first
systematic review conducted of G&T education.
1 RBES Ltd, Birmingham, United Kingdom 2 University of Birmingham, United Kingdom Corresponding author. School of Sport and Exercise Sciences, University of Birmingham,
Edgbaston, Birmingham, England, B15 2TT. Email: [email protected] 3 West Dunbartonshire Council, United Kingdom 4 University of Glasgow, United Kingdom 5 Roehampton University, London, United Kingdom 6 London G&T, United Kingdom
ISSN 1869-0459 (print)/ ISSN 1869-2885 (online)
2012 International Research Association for Talent Development and Excellence
http://www.iratde.org
R. Bailey et al.
34
On Systematic Reviews
Systematic reviews aim to identify, evaluate and summarise the findings of all relevant
studies in an explicit way in order to make the available evidence more accessible to
decision-makers (Centre for Reviews and Dissemination, 2001). They are distinguishable
from other forms of review (such as expert reviews and narrative reviews) by this
explicitness (Mulrow, Langhorne, & Grimshaw 1997; Templin & Pearce, in press). Central
support for this approach arose partly in tandem with the spread of the notion of
‘evidence-based practice’ from medicine into other fields, and of the rise of the new
managerialism within central government (Hammersley, 2008). The methods of a
systematic review are made explicit in a protocol that is largely determined from the
beginning. In this way, the process of assessing the relevance and quality of specific
studies is reproducible and transparent (Hemmingway & Brereton, 2009).
Systematic reviews originated in medical science, and many have questioned its
relevance for educational research (Evans & Benefield, 2001; Oancea & Pring, 2008).
Nevertheless, they continue to be popular, especially among policy makers, which seems
to be partly due to widely held perception that the preparation of reviews has traditionally
depended on implicit, idiosyncratic methods of data collection and interpretation. For all
their ubiquity, narrative and other ‘non-systematic’ reviews were criticisable for allowing
reviewers looking at the same body of evidence to generate completely different findings
and draw conclusions heavily influenced by personal interest or bias. In contrast,
“systematic reviews use explicit and rigorous methods to identify, critically appraise and
synthesise relevant studies” (Mulrow, Cook & Davidoff, 1997, p. 389).
Scope and Definitional Issues
Most countries recognise the need to support students who display high ability. However,
differences between countries exist in the way that they conceptualise and provide for
this group of students. A result of this varying conceptualisation is a difference in the
vocabulary used to describe the group. Within the UK each of the four nations refers to
these students in different terms: in England and Northern Ireland they are called ‘Gifted
and Talented’; in Scotland they are referred to as ‘More Able’; in Wales they are known as
being ‘Talented’ and ‘More Able’.
This review adopted the terminology of the English funding agency (Department for
Children, Schools and Families, DCSF; which changed from Department for Education and
Skills in July 2007), namely ‘Gifted and Talented’. Its working definition of Giftedness
and/or Talent was: “those who have one or more abilities developed to a level
significantly ahead of their peer group (or with the potential to develop these abilities)”
(DCSF, 2007). The DCSF (2008) distinguishes between ‘Gifted’ and ‘Talented’ students in
terms of the curriculum areas in which they excel: the former relates to high ability in
academic subjects, such as English or History; the latter in areas requiring visio-spatial
skills or practical abilities, such as in games and physical education, drama, or art.
Such definitions are functional, allowing for an examination of G&T education that was
broader than the traditional conception of high ability within a narrow range of domains,
often restricted to mathematical and linguistic aptitude. It also recognises a wider
conception of intelligence than in traditional uni-dimensional models (Ziegler & Heller,
2000). This allowed for a wider range of abilities and subject areas, and potentially a more
inclusive framework. Studies of both ‘Gifted’ and ‘Talented’ students were included in this
review.
Given the stated intentions of the national G&T initiatives in England, and the use of
concepts such as ‘underachievement’ and ‘potential to achieve’, it was felt important to
note that the impact of G&T provision might be measured in terms of the capacity of
individuals to achieve. This reflected the composition of a G&T population in terms of
representation of distinct student groups, for instance those from minority ethnic groups
or from disadvantaged backgrounds. Increasing participation has been seen as much a
Educational Achievement of Gifted and Talented Students 35
measure of effective provision as high achievement for those already included (Smith,
2006). Furthermore, the rationale of these initiatives makes it clear that educational
achievement should be interpreted broadly with reference to a wider view of education,
inclusive of development in areas beyond test scores and examinations. This would also
allow for achievements usually labelled as ‘value-added’, where the apparent levels of
success and achievement may be low in relation to an accepted average, but in fact
improvements from baseline to end of project have been very significant.
Methods
The research question addressed in this review was: Which types of interventions improve
the educational achievement of students identified as G&T?
Three sub-questions were also drafted:
(1) Do school-based interventions for G&T students lead to the improvement of their
educational achievement?
(2) Which interventions demonstrate a positive impact on educational achievement?
(3) Which contexts are most effective in facilitating educational improvement?
A two-stage review model was employed. The first stage consisted of identifying all
studies that met the review inclusion criteria. Descriptive information about these studies
was collected and presented in the form of a ‘map’ of research literature related to the
education of G&T students. This map provided a basis for informed discussion and
decision-making between the review team and review users concerning the focus of the
second stage in-depth review which follows. The map also provided valuable information
and stands as a discrete document that can be consulted in its own right. The in-depth
review was a detailed investigation of a focused subset of the wider literature. The review
was focused in a way that corresponded to current policy and practice priorities, such as
the English ‘Classroom Quality Standards’ and ‘Institutional Quality Standards’
(http://ygt.dcsf.gov.uk). This required the introduction of a second set of inclusion criteria,
developed from a revised and more focused in-depth review question (see below) and
applied to the studies initially identified in the map. Detailed data-extraction was then
undertaken to facilitate synthesis of the final 15 selected studies in order to provide
answers to the in-depth review question. The review used an a priori approach for the
mapping stage of the review, becoming more iterative for the in-depth stage as the focus
was made narrower. The review used narrative empirical data.
The target population for this review was school students between the ages of 5-16 years,
which represents the range of ages experiencing compulsory schooling in the UK. The
study focused on curriculum interventions for G&T classroom-aged students. Intervention
was understood to mean planned, discrete curriculum strategies designed to improve
achievement. The review examined research carried out during or after 1998 but before
November 2007. The start date was chosen as the year when G&T education was formally
presented as an expectation for English schools (Department for Education and
Employment: DfEE, 1997). The final date reflects the submission date for the interim report
to the funder.
Identifying and Describing Studies
The search strategy identified a selection of abstracts, which were then subject to a
screening process of exclusion criteria. These criteria were applied consecutively using
the EPPI-centre software. This narrowed the focus of the studies and ensured that only
relevant papers were reviewed. Full text versions of all of the papers whose abstracts
were not excluded after applying the criteria, were requested for further review.
The following exclusion criteria were developed:

R. Bailey et al.
36
EXCLUDE 1. Not written in English.
EXCLUDE 2. Published before 1998.
EXCLUDE 3. The focus is not explicitly about G&T/highly able/more able.
EXCLUDE 4. Study is not empirical – Study needs to be evidence based, not conceptual or
philosophical only.
EXCLUDE 5. Not an intervention – Scope of intervention should be within the parameters
of the Classroom Quality Standards.
EXCLUDE 6. Students are not aged from 5 to 16 years.
EXCLUDE 7. Study does not report the measure of intervention outcomes.
In-Depth Review
As the review moved in to the in-depth stage, the focus narrowed. This created a need to
revise the research questions and develop them to coincide with the narrower aim of the
review. The initial research questions for the map were revised for the in-depth review to
guide and focus the final studies included. So, the terminology in the questions was
changed from ‘school-based’ interventions to ‘classroom-based’ interventions to offer a
narrower focus, and ‘children’ was changed to ‘students’ as this term relates more directly
to the classroom. Furthermore, the emphasis on pedagogical implications was reinforced
by adding ‘educational achievement’ to the questions in order to specify the outcome of
the intervention.
Educational achievement refers to attainment of standards and the meeting of personal
goals. Generally, measured achievement in formal education refers to how students and
students in learning contexts perform in relation to stated outcomes. Achievement can be
measured in a variety of ways and interpretation of any such results must be nuanced and
detailed if it is to be of use. The context and demographics of the test subjects must also
be taken into account if the achievement is to be understood more fully. For example,
achievement is often measured normatively in education and in these cases, the test
subject is considered against the average performance of a comparable group. However,
achievement can also be measured through criterion referencing in which students are
examined against a set standard of achievement on specific tasks.
The in-depth review then successively applied the additional six exclusion criteria to the
remaining studies.
EXCLUDE 8. The study is not related to the engagement of learners and learning.
EXCLUDE 9. The study does not have a ‘what works?’ focus.
EXCLUDE 10. The study is not set in primary, middle, secondary or special needs school.
EXCLUDE 11. The study is not related to learners.
EXCLUDE 12. The study does not explicitly focus on the teaching and learning process.
EXCLUDE 13. The study does not report on educational achievement.
The review began by identifying 20,947 abstracts, 1,285 of which were duplicates and
were excluded. 19,662 abstracts were then abstract screened and full text screened if
more information was needed. 130 were included, 29 full texts of the papers could not be
obtained and so 101 full texts of the papers were coded for the mapping stage. The
application of exclusion criteria 8-13 resulted in 86 studies being excluded from the in-
depth review. The conclusion of this process was that 15 studies were included in the in-
depth review. The data were heterogeneous in nature and so further narrative analyses of
the quality of the data were needed to create an in-depth synthesis of the data using a
meta-empirical approach.
Figure 1 below presents a stage-by-stage summary of the process of filtering the large
pool of studies initially identified through to the systematic map and in-depth review
stages.
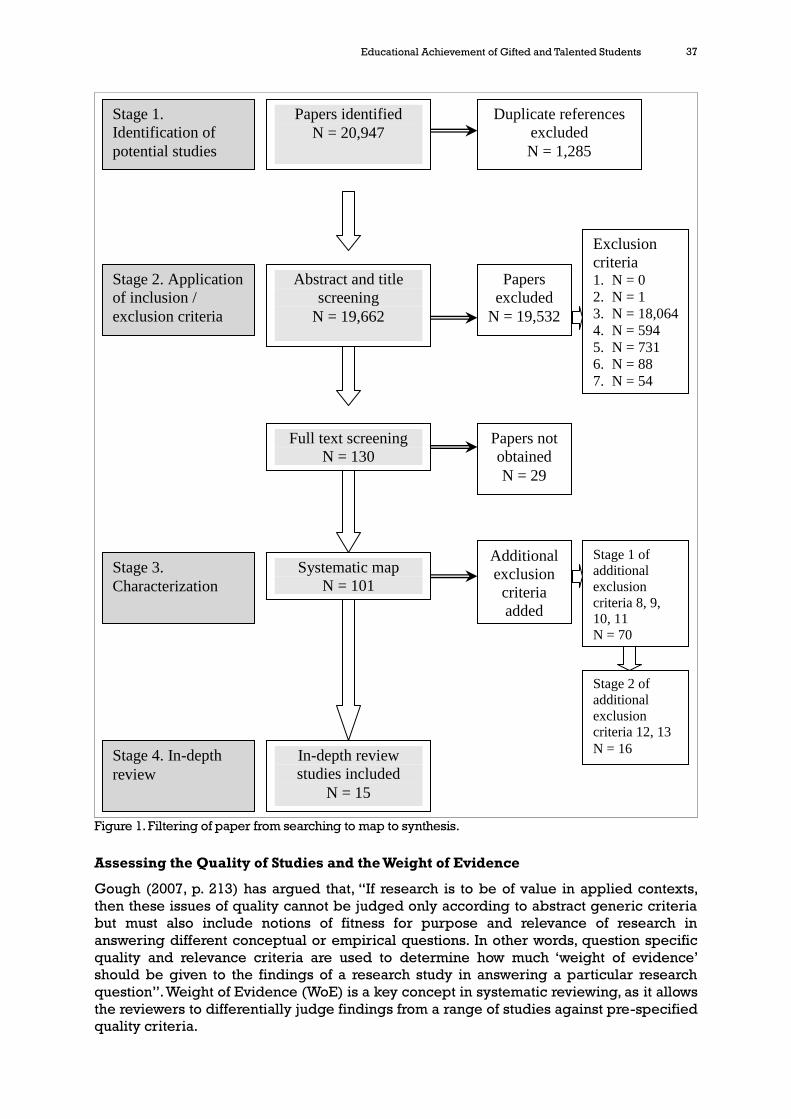
Educational Achievement of Gifted and Talented Students 37
Figure 1. Filtering of paper from searching to map to synthesis.
Assessing the Quality of Studies and the Weight of Evidence
Gough (2007, p. 213) has argued that, “If research is to be of value in applied contexts,
then these issues of quality cannot be judged only according to abstract generic criteria
but must also include notions of fitness for purpose and relevance of research in
answering different conceptual or empirical questions. In other words, question specific
quality and relevance criteria are used to determine how much ‘weight of evidence’
should be given to the findings of a research study in answering a particular research
question”. Weight of Evidence (WoE) is a key concept in systematic reviewing, as it allows
the reviewers to differentially judge findings from a range of studies against pre-specified
quality criteria.
Full text screening
N = 130
Papers not
obtained
N = 29
Stage 4. In-depth
review
Stage 3.
Characterization
In-depth review
studies included
N = 15
Stage 1 of
additional
exclusion
criteria 8, 9,
10, 11
N = 70
Systematic map
N = 101
Stage 2 of
additional
exclusion criteria 12, 13
N = 16
Additional
exclusion
criteria
added
Abstract and title
screening
N = 19,662
Papers
excluded
N = 19,532
Exclusion
criteria
1. N = 0
2. N = 1
3. N = 18,064
4. N = 594
5. N = 731
6. N = 88
7. N = 54
Stage 2. Application
of inclusion /
exclusion criteria
Papers identified
N = 20,947
Stage 1.
Identification of
potential studies
Duplicate references
excluded
N = 1,285
R. Bailey et al.
38
In this study, WoE was assessed using the EPPI-Centre data-extraction framework
(www.eppi.ioe.ac.uk), with the detail for such assessment being determined by the
review-specific framework. Three elements helped make explicit the process of
appointing different weights to the different studies. These WoE were based on:
WoE A: Can the study findings be trusted in answering the study question?
WoE B: Appropriateness of research design and analysis for addressing the question,
or sub-questions, of this specific systematic review.
WoE C: Relevance of particular focus of the study (including conceptual focus,
context, sample and measures) for addressing the question, or sub-questions, of this
specific systematic review.
WoE D: Overall weighting, taking into account A, B and C.
The WoE contributed by each study in the in-depth review was derived through
assessment by two independent and blind reviewers. In three cases, quality assurance
was provided by colleagues from the EPPI-Centre. Any disagreements in WoE were
discussed until resolved.
A summary table (Table 1) of the judgments made for each of the studies in the final stage
of the review is presented below (bibliographic data of these studies are provided in the
Reference section).
Eleven studies were rated High for one or more WoE criteria, although this figure should
be viewed with caution. In eight of these cases the rating related only to the relevance of
the particular study for addressing the research question for this systematic review. Of
greater significance are the three studies that were rated High for WoE D, which is the
overall weighting, based on all other categories. A further eight studies were deemed
Medium for WoE D. These studies all provide important evidence for answering the
review’s research question. In the synthesis that follows, the WoE allocated for the different
studies is taken into account. This means that studies in which there is more confidence, as
reflected in the WoE D, carry a greater influence in the synthesis. This does not mean that
the three studies that are rated Low for WoE D were disregarded in the synthesis; rather
their influence was less than the other studies.
Results
Map Findings – Characteristics of the Studies
There were 2 single sex studies, both consisting of male only participants. There were
41 mixed sex participant studies, these consisted of: 12 studies with more male
participants than female; 8 with more female participants than male; 7 studies with a
1:1 ratio of male/female participants and 14 studies that stated that they were mixed
sex participants but did not explicitly state the break down.
The studies included samples from the full range of socio-economic groups. 11
studies explicitly referred to students of Low Socio-Economic Status (SES); 6 to
middle and high SES; the rest were from diverse groups.
There was considerable variation in the ethnicity of the samples in different studies.
Most studies involved mixed groups, although 13 involved significant proportion of
students from minority ethnic groups.
In almost all instances, ‘Giftedness’ or a similar description was cited as the cause of
a special need. Some individual studies focused on students with other conditions,
including Attention Deficit Hyperactivity Disorder (ADHD); autism; English as a
second language; specific learning difficulties and cerebral palsy.
All studies included ‘learners’ as expected, due to the inclusion criteria. However,
other participants within the studies were senior management; teaching staff; local
education authority officers; parents; non-teaching staff and others.
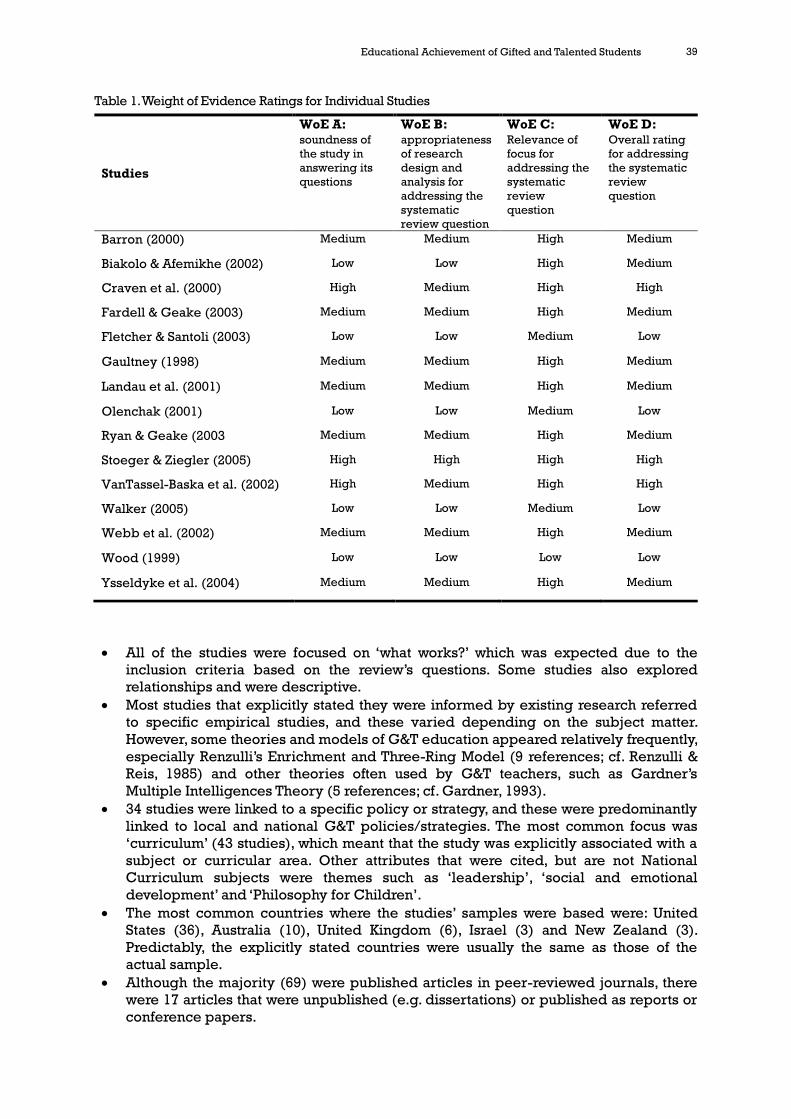
Educational Achievement of Gifted and Talented Students 39
Table 1. Weight of Evidence Ratings for Individual Studies
Studies
WoE A: soundness of
the study in
answering its
questions
WoE B: appropriateness
of research
design and
analysis for
addressing the
systematic
review question
WoE C: Relevance of
focus for
addressing the
systematic
review
question
WoE D: Overall rating
for addressing
the systematic
review
question
Barron (2000)
Medium Medium High Medium
Biakolo & Afemikhe (2002)
Low Low High Medium
Craven et al. (2000)
High Medium High High
Fardell & Geake (2003)
Medium Medium High Medium
Fletcher & Santoli (2003)
Low Low Medium Low
Gaultney (1998)
Medium Medium High Medium
Landau et al. (2001)
Medium Medium High Medium
Olenchak (2001)
Low Low Medium Low
Ryan & Geake (2003
Medium Medium High Medium
Stoeger & Ziegler (2005)
High High High High
VanTassel-Baska et al. (2002)
High Medium High High
Walker (2005)
Low Low Medium Low
Webb et al. (2002)
Medium Medium High Medium
Wood (1999)
Low Low Low Low
Ysseldyke et al. (2004)
Medium Medium High Medium
All of the studies were focused on ‘what works?’ which was expected due to the
inclusion criteria based on the review’s questions. Some studies also explored
relationships and were descriptive.
Most studies that explicitly stated they were informed by existing research referred
to specific empirical studies, and these varied depending on the subject matter.
However, some theories and models of G&T education appeared relatively frequently,
especially Renzulli’s Enrichment and Three-Ring Model (9 references; cf. Renzulli &
Reis, 1985) and other theories often used by G&T teachers, such as Gardner’s
Multiple Intelligences Theory (5 references; cf. Gardner, 1993).
34 studies were linked to a specific policy or strategy, and these were predominantly
linked to local and national G&T policies/strategies. The most common focus was
‘curriculum’ (43 studies), which meant that the study was explicitly associated with a
subject or curricular area. Other attributes that were cited, but are not National
Curriculum subjects were themes such as ‘leadership’, ‘social and emotional
development’ and ‘Philosophy for Children’.
The most common countries where the studies’ samples were based were: United
States (36), Australia (10), United Kingdom (6), Israel (3) and New Zealand (3).
Predictably, the explicitly stated countries were usually the same as those of the
actual sample.
Although the majority (69) were published articles in peer-reviewed journals, there
were 17 articles that were unpublished (e.g. dissertations) or published as reports or
conference papers.
R. Bailey et al.
40
In-Depth Review
It was decided that for the purposes of this study, the most appropriate form for this
synthesis would be a structured narrative describing patterns or themes that were evident
among the characteristics of the in-depth review. Themes that emerged during data-
extraction were subject to rigorous discussion and interrogation.
Emergent Themes
The review’s research question required evidence that will provide teachers and
policymakers with an understanding of the types of interventions that support the
educational achievement of G&T students. The 15 studies gathered for the in-depth stage
of the review provide an evidential base for making recommendations about the kinds of
approaches that could support students identified as G&T.
Three themes emerged from the studies synthesised for the review question:
(1) Interventions based on school and class organisation (the focus of these
interventions was the ways in which students were grouped or placed in different
settings);
(2) Interventions based on social interactions (the focus here was on the ways in which
conversations and the exchange of ideas between students were prompted);
(3) Interventions based on the development of new skills and strategies (the focus of
these studies was the explicit teaching of specific skills and strategies).
Interventions Based on Grouping and Class Organisation
A theme that was common to many of the studies was the impact of different settings for
G&T students. Craven, Marsh and Print (2000), for example, evaluated three types of
organisation: selective programmes (separate provision, sometimes requiring students to
change schools); streamed classes (providing G&T students an enriched environment,
without changing schools); and mixed-ability classes (catering for G&T students in the
context of a regular classroom). These categories capture the different contexts of most of
the studies, although not all of them specifically measured the effectiveness of the setting,
per se. Some of the studies involved samples in selective settings, others involved
streaming, and some studies involved students in mixed ability classes. Finally, some
studies involved specific interventions that occurred independent of classroom
organisation.
The study by Craven, Marsh and Print (2000), was framed primarily in terms of social
comparison theory (or the Big-Fish-Little-Pond Effect). According to this theory,
participation in special G&T classes or schools will lead to a decline in academic self-
concept. This is clearly of great relevance for G&T education, because one of the most
frequently cited justifications for differentiated provision has been that it enhances G&T
students’ self-concepts and learning motivation. The results of this study do not support
selective G&T provision; in fact, students in the selective cohort in this study had greater
declines in academic self-concept and positive motivation than both the streamed and
mixed ability groups. It is unlikely that social comparison completely explains this effect,
however, since the children in the streamed class did not experience the same decline. An
alternative or supplementary explanation for this pattern of effects is that the students in
the selective group were adversely affected by their change of schools or peer groups.
Wood’s (1999) study is interesting in this regard, since it involved the establishment of a
special class drawing in students from a number of schools. Wood offers no comparative
data, and very poor descriptive data, so it is impossible to judge accurately the effects of
the intervention on students’ self-concept and motivation. She does, however, provide a
great deal of contextual information about the difficulty of establishing a selective
programme within an otherwise non-selective system, as well as indications of
antagonism from parents and other teachers.
Educational Achievement of Gifted and Talented Students 41
Streaming offers an alternative solution to the problem of differentiating provision for G&T
students than selective programmes. Webb, Nemer and Zuniga (2002) investigated the
effects of group composition (homogeneous or streamed/heterogeneous) on group
processes and outcomes of science assessments for G&T students. They found that G&T
students in homogeneous groups outperformed their G&T peers in heterogeneous
groups. However, they also found that the types of social interactions within the groups
predicted student performance more strongly than either student ability or the overall
ability composition of the groups (which is a topic we will return to later). This is an
important finding worth reiterating: G&T students in mixed classes can perform as well as
those in streamed classes if those classes function well. A similar finding was reported by
VanTassel-Baska, Zuo, Avery and Little (2002), where students showed important gains
from a new curriculum across all grouping approaches. Walker (2005) approached this
issue of interaction within streamed classes from a different perspective in his
examination of girls’ verbal participation. He did not provide comparative data, but his
study does undermine the notion of genuinely homogeneous groups in terms of
participation in classes and access to teacher support.
Two studies (Ryan & Geake, 2003; Fardell & Geake, 2003) examined a more radical
approach to streaming, which they call the ‘vertical curriculum model’. This approach
allows students to be grouped according to their levels of readiness, rather than
according to age, within a school. As such, the vertical curriculum might be seen as a
school-wide version of streaming. Ryan & Geake (2003) found that a vertical mathematics
curriculum structure in a Primary School resulted in significant increases in mathematics
performance for both G&T and other students. They suggested that G&T students
benefited from placement within a group of peers of similar mathematical readiness and
interest, where the curriculum was set at an appropriate challenging level of difficulty, and
proceded at an appropriately challenging pace. A similar study with secondary students
(Fardell & Geake 2003) came to similar conclusions regarding the virtues of vertical
curriculum organisation. In this case, students undertook ‘accelerated’ courses in advance
of their school year. Both G&T and non-G&T students benefited from the opportunity to
accelerate, producing better-than-expected levels of performance in their accelerated
units, with G&T students performing particularly well. We accept Fardell and Geake’s
(2003) suggestion that factors other than ability alone may have contributed to these
levels of performance, such as greater group homogeneity of ability and interest, fewer
interruptions due to bad behaviour, and greater students’ motivation. However, the extent
to which these factors are attributable to acceleration or simply to an element of personal
choice in provision is difficult to tell. Finally, Ysseldyke, Tardrew, Betts, Thill and Hannigan
(2004) found that G&T students who used a self-directed, individualised mathematics
instruction experienced significant increases in performance compared to their peers
who did not receive the programme. The researchers reported that such personalised
learning meant that students were able to explore and use concepts beyond those
normally taught in the classroom.
Overall, the studies that focus on grouping and class organisation support the use of
differentiated provision for G&T students. Of the various models presented the least
persuasive was selective programmes in which students move to a new school, due to the
relative poverty of empirical support, as well as an unattractive cost-benefit analysis.
There is evidence in favour of streaming, mixed ability provision and individualised
programmes, although the heterogeneous approach presumes a favourable classroom
climate, and individualised programmes are not applicable in all subject areas. The
‘vertical’ approach to curriculum delivery presents a potentially interesting alternative to
these more traditional models.
Interventions Based on Social Interactions
Most of the studies presumed social interaction as an important factor in the design of
their interventions. Barron (2000) found evidence that collaborative learning among G&T
R. Bailey et al.
42
students would result in superior performance in an Information and Communication
Technology task. She also found that small groups of G&T students generated better
planning and solutions than those working alone, and that such learning transferred to
later individual performance. However, Barron did not examine the nature of collaborative
work, nor the conditions under which it might operate most effectively.
Webb, Nemer and Zuniga (2002) explored the social interactions among students in
homogeneous (G&T) and heterogeneous (mixed ability) groups. They found that some
G&T students in mixed ability groups performed as well as those in homogeneous groups.
The differences between the G&T students who succeeded in mixed ability classes and
those who did less well “probably result from a complex interplay of individual and group
factors” (Webb, Nemer, & Zuniga, 2002, p. 979). Some G&T students react positively to
working with less able peers, and some do not, and this may well affect the character of
their relationships within the group; some dominate discussions and tasks, and some
collaborate fully with their group mates. Webb, Nemer and Zuniga (2002) describe this
phenomenon, but it is also worthwhile emphasizing that the way a group functions may
well be mediated by the classroom climate.
The centrality of the teacher is a premise of Walker’s (2005) study, which was concerned
with the ‘problem’ of G&T girls’ verbal engagement in lessons. Whilst we would be
somewhat hesitant to accept the universality of some of the presumptions made about
girls’ social interactions in classes, it does seem plausible to claim that a series of
structured interventions, such as the use of creative arts activities, celebration of a wide
range of talents, the development of meta-cognitive strategies, and the development of
leadership skills, will encourage otherwise reticent G&T students to participate in class
discussions. Likewise, Landau, Weissler and Golod (2001) included within their
intervention a ‘social thinking’ element, an expectation on the part of teachers to
encourage, praise and specifically attend to the learning needs of girls within a G&T class.
The development of social skills was also an implicit feature of the intervention reported
by Olenchak (2001). Three of the four G&T students allocated personal mentors had
identified personal and social difficulties, and these difficulties were reported to have
significantly reduced after one year. Olenchak explained improvements in terms of more
personalised learning opportunities and identity development. It would seem equally
plausible to suggest that a year working with a personal mentor might benefit social
interactions and engagement in school life. Most forms of provision for G&T students
occur in social settings, and students’ abilities to deal with such contexts are likely to be
important factors in academic success and personal motivation. The teacher has an
important role to play in generating and sustaining contexts for appropriate social
interactions.
Interventions Based on the Development of New Skills and Strategies
Six of the studies were concerned with the development of specific skills or strategies in
G&T students. This seems to be primarily influenced by the view that G&T students
require different or advanced content and opportunities for higher-order thinking skills.
Certainly, this is the rationale for the project reported by Gaultney (1998). She suggested
that G&T students differ from their non-G&T peers, in part, by their superior memory, and
this can mean that G&T students fail to develop a repertoire of conscious strategies. The
need for higher-order thinking skills among G&T students was also underlying the study
reported by VanTassel-Baska, Zuo, Avery and Little (2002) in which G&T students were
exposed to units of work based on advanced literature, reasoning skills and a range of
communication skills. Similarly, Landau, Weissler and Golod (2001) offered G&T students
an enrichment programme consisting of creative, scientific and social thinking tasks.
Another study of this ilk is that of Biakolo and Afemikhe (2002), which employed literature-
based reading to increase creativity, reading skills and attitude to reading. Landau’s study
focused specifically on G&T students from low socio-economic groups and found that
such students benefited from its curriculum model, and that benefits were especially
Educational Achievement of Gifted and Talented Students 43
noticeable among girls. It is not clear why this should be the case, but VanTassel-Baska,
Zuo, Avery and Little (2002) found broadly similar outcomes of their intervention.
The view that many G&T students do not attain the levels of educational achievement of
which they are capable is a recurring theme in many of the papers in this review. The
studies of VanTassel-Baska, Zuo, Avery and Little (2002), Landau, Weissler and Golod
(2001), Walker (2005) and Olenchak (2001) discuss underachievement explicitly. Stoeger
and Ziegler (2005) found that one way of eliminating some of the causes of
underachievement is to help G&T students develop self-regulation skills. Their training
programme taught children to set goals for themselves, manage their time effectively and
to plan their homework. In other words, the study succeeded in teaching children how to
monitor, regulate and control their academic lives to some degree.
There is good reason to believe that broadly based enrichment programmes that
introduce and develop self-regulation and higher order thinking skills can have
measurable effects for G&T students, irrespective of the socio-economic background and
gender. Moreover, the evidence related to G&T students’ superior memory suggests that
there is a need to adapt the difficulty of tasks and the curriculum in order to challenge
their cognitive systems.
Discussion
Systematic reviews often aspire to provide the evidence for evidence-based practice;
their rationale is premised on the rigour used in identifying and developing findings. This
section discusses the implications of this study in terms of: policy; practice; and research.
Implications for Policy
The English strategy for G&T education was intended to provide a distinct programme of
teaching and learning for G&T students (Dracup, 2003). This review set out, in part, to
establish what type of interventions would support the aims of the strategy by identifying
research evidence that could inform its further development. The strategy has since
become embedded in notions of personalised learning (DfES, 2007). Within the context of
G&T education, this has been translated as a strategy to improve understanding of how
the needs of G&T students may be meaningfully different from their peers and how these
needs can be met through a combination of learning experiences both within and beyond
the classroom (DCSF, 2007).
This review set out to identify what works for G&T students in classroom learning, in order
to identify what works in mainstream contexts and to support the development of practice.
Studies that did not relate to classroom learning were excluded in order to narrow the
focus on what works and to reduce the influence of bolt-on programmes in the synthesis.
However, it is interesting that many of the studies also gave evidence of the effectiveness
of provision delivered beyond the mainstream classrooms. Extra-curriculum provision has
been the mainstay of G&T education in many countries, and this context ought not to be
ignored. However, it also needs to be remembered that access and opportunity are not
synonymous, and a curriculum located outside of the school day almost inevitably results
in exclusion (Bailey & Morley, 2006).
Generally speaking, policies in England have moved from promoting and funding high
cost/low volume enrichment towards an emphasis on providing challenge and high
expectations for all students as part of everyday learning experiences. The review
provided evidence in favour of this policy development.
It is a truism that G&T students benefit from learning that is high in challenge, and that
teaching sensitive to students’ needs is most likely to be successful (Renzulli & Reis, 1985).
The three themes discussed in the in-depth synthesis relate to the dynamics of classroom
learning and a focus on collaborative learning and flexible grouping. Learning processes
are supported and facilitated by social scaffolding. This supports the hypothesis that
social interaction underlies effective strategies for G&T students (Barab & Plucker, 2002).
R. Bailey et al.
44
It may also challenge the emphasis within some guidance of the importance on
independent learning, which provides extension activities and solitary learning
experiences as part of a supplementary strategy (DCSF, 2007).
Implications for Practice
There seems to be a common divide in educational research between evidence produced
and sourced by teachers on ‘what works’ and evidence that is considered
methodologically sound but does not include practical recommendations for the
classroom in its conclusion. For example, of the 15 articles included in the review 13 have
as an emerging theme of grouping and class organisation. While undoubtedly this is
important as it can help establish the conditions for effective learning, there are
contrasting findings. The results from Craven, Marsh and Print (2000), for example, do not
support selective (i.e., separate) provision for G&T students. Alternatively, Wood (1999)
challenges this finding reporting positive outcomes for the students in her special class.
In light of the evident methodological superiority of Craven, Marsh and Print (2000) study,
in terms of both research design and analysis, we are led to conclude that planners and
teachers should be cautious in considering separate provision of G&T students. The
review identified a common thread across the papers, namely that the diversity apparent
in this cohort of students needs to be married to differentiated provision in which G&T
students, whether as a group or individually, are offered an adopted form of provision or
curriculum that reflects their abilities.
The other emerging themes from the synthesis of the review were social interaction, and
development of new skills and strategies. Across both of these themes, two implications
are clear for classroom practice:
(1) Specific strategies can be taught that enhance G&T students’ learning and
engagement (in particular, those developing self-regulation and higher-order
thinking skills);
(2) Most forms of provision for G&T students occur in social settings, and students’
abilities to deal with such contexts are likely to be important factors in academic
success and personal motivation. The teacher has an important role to play in
generating and sustaining contexts for appropriate social interactions.
Only one paper made clear how the intervention used was uniquely appropriate for G&T
populations, yet all papers reported positive results. Thus, it may be that careful attention
to generic teaching and learning skills is sufficient to meet the needs of many G&T
students and, further, is also appropriate for a much wider group of learners. Perhaps a
more positive way of framing this finding is that the pedagogical principles prescribed for
G&T education – such as high levels of challenge, deliberate teaching of thinking and
regulation skills, and careful orchestration of social groupings – are equally applicable to
the rest of the population.
Implications for Research
Different types of research methods elicit different types of data. Certainly, the use of
systematic reviewing in this study has necessarily resulted in the privileging of some
studies and the relative marginalising and even ignoring of others, and it is entirely
possible that studies belonging to this latter group contained useful information for
related lines of enquiry. Such omission is an unfortunately but ultimately inevitable
consequence of methodological adherence. As researchers, we reconcile ourselves to this
predicament by acknowledging that we do not believe that systematic reviewing is
superior to other forms of reviewing. Rather, our conjecture is that the results from this
study ought to be considered alongside the fruits of other research. The great humanistic
psychologist Abraham Maslow once wrote, “If the only tool you have is a hammer, you
tend to see every problem as a nail” (Maslow, unknown). Our intention is to introduce a
new tool to G&T education’s conceptual tool-kit.
Educational Achievement of Gifted and Talented Students 45
The preceding preamble notwithstanding, there is an evident need for well-designed
research studies in G&T education. In this review there were a low number of studies
included in the final synthesis that were rated as having a High overall Weight of
Evidence. Only three studies were rated as High for the soundness of the study in
answering its questions, and only one for the appropriateness of research design and
analysis for addressing the systematic review question. If this is indicative of the field as a
whole, there is cause for concern. This is particularly true as the interventions employed
in many of the studies involved changing the educational experiences of students in quite
radical ways. Many of these studies also concluded that positive results were
generalisable to other G&T populations and advocated the wider use and applicability of
interventions; we suggest that such confidence is unwarranted. If research in the field of
G&T education is to influence practice then it is essential that the quality of research
design and reporting be improved.
The strongest studies in this review in terms of methodological rigor were predominantly
quantitative. Yet it would seem that more in-depth qualitative data and analyses might
have addressed some of our concerns for the disregard of relevant variables such as: the
impact of the researchers themselves; the wider context; teacher attitudes; student
motivation; differences in environment between classrooms, schools and districts; the
implications of using ‘volunteers’ to implement the interventions; teacher experience and
education; the existence of multiple exceptionalities; and grouping issues. More research
using, or at least incorporating, rigorous qualitative data and analysis would enable these
variables to be investigated and the findings from these studies to be tested and firmer
conclusions drawn.
Generally speaking, the concept of giftedness was presented as unproblematic. However,
there is a need in the literature for key terms such as ‘Gifted’, ‘Talented’ and associated
concepts like ‘educational achievement’ to be explicitly defined and for identification
procedures to be comprehensively detailed. This is not just a matter of clarity; different
definitions of G&T are likely to result in different students, with different abilities, being
identified and researched.
It is difficult to draw clear conclusions about generalisable pedagogies due to the large
number of variables that can affect students, teachers and learning environments.
Increasing the quality, quantity and variety of research is one useful response to this
difficulty. Comparative studies, making use of existing data would be valuable, showing
similarities and differences across a range of contexts. This would also help overcome the
problem of small sample groups, which is difficult to avoid in the field of G&T education.
References
Bailey, R. P., Pearce, G., Winstanley, C., Sutherland,
M., Smith, C., Stack, N., & Dickenson, M.
(2008). A systematic review of interventions
aimed at improving the educational
achievement of students identified as Gifted
and Talented. Report. Research Evidence in
Education Library. London, UK: EPPI-Centre,
Social Science Research Unit, Institute of
Education, University of London.
Bailey, R. P., & Morley, D. (2006). Towards a model
of talent development in Physical Education.
Sport, Education and Society, 11, 211–230.
Barab, S. A., & Plucker, J. A. (2002). Smart people or
smart contexts? Cognition, ability, talent
development in an age of situated
approaches to knowing and learning,
Educational Psychologist, 37, 165–182.
Barron, B. (2000). Problem solving in video-based
microworlds: Collaborative and individual
outcomes of high-achieving sixth-grade
students. Journal of Educational Psychology,
92, 391–398.
Biakolo, M., & Afemikhe, A. (2002). The effect of
literature-based reading on gifted students in
Botswana. Research in Education, 68, 15–25.
Centre for Reviews & Dissemination. (2001).
Undertaking systematic reviews of research on
effectiveness (2nd ed.). York, UK: Centre for
Reviews and Dissemination.
Craven, R., Marsh, H., & Print, M. (2000). Gifted,
streamed and mixed-ability programs for
gifted students. Australian Journal of
Education, 44, 51–75.
DfEE. (1997). Excellence in schools. London, UK:
Stationery Office.
R. Bailey et al.
46
DFES, (2007) Personalised learning. Retrieved 4
June 2007 from www.standards.dfes.gov.uk/
personalisedlearning
DCSF. (2007). What do we mean by Gifted and
Talented? London: Standards Site, DCSF
(http://www.standards.dfes.gov.uk/Giftedand
Talented/identification/gandt/; accessed 3
July 2007).
DCSF. (2008). What do we mean by Gifted and
Talented? London: Standards Site, DCSF
(www.standards.dfes.gov.uk/GiftedandTalent
ed/identification/gandt/; accessed 2 May
2008).
Dracup, T. (2003). Understanding the national
approach to gifted and talented students.
Curriculum Briefing, 1, 7–12.
Evans, J., & Benefield, P. (2001). Systematic reviews
of educational research. British Educational
Research Journal, 27, 527–41.
Fardell, R., & Geake, J. (2003). Vertical semester
organization in a rural secondary school as a
vehicle for acceleration of gifted students.
Australasian Journal of Gifted Education, 11,
16–30.
Fletcher, M., & Santoli, S. (2003). Reading to learn
concepts in mathematics. Unpublished report:
Davidson High School and University of South
Alabama.
Freeman, J. (1998). Educating the very able: Current
international research. London, UK: The
Stationery Office.
Gardner, H. (1993) Multiple intelligences. New York:
Basic Books.
Gaultney, J. (1998). Differences in benefit from
strategy use. Journal for the Education of the
Gifted, 21, 160–178. Retrieved from:
http://psycnet.apa.org/psycinfo/1998–
00428–002
Gough, D. (2007). Weight of evidence: A
framework for the appraisal of the quality and
relevance of evidence. Research Papers in
Education, 22, 213–228. Retrieved from:
http://eprints.ioe.ac.uk/5532/1/Gough2007W
eight213.pdf
Hammersley, M. (2008). Paradigm war revived? On
the diagnosis of resistance to randomized
controlled trials and systematic review in
education. Journal of Research and Method in
Education, 31, 3–10.
Hemmingway, P., & Brereton, N. (2009). What is a
systematic review? London: Hayward Medical
Communications.
Hewston, R., Campbell, R., Eyre, D., Muijis, R.,
Neelands, J., & Robinson, W. (2005). A baseline
review of the literature on effective pedagogies
for Gifted and Talented students. Warwick, UK:
National Academy for Gifted and Talented
Youth.
Heller, K., Mönks, F., Sternberg, R., & Subotnik, R.
(Eds.). (2000). International handbook of
giftedness and talent (2nd ed.). Oxford, UK:
Elsevier.
Landau, E., Weissler, K., & Golod, G. (2001). Impact
of an enrichment program on intelligence, by
sex, among low SES population in Israel.
Gifted Education International, 15, 207–214.
Maslow, A. (unknown) Abraham Maslow Infosite.
Retrieved 18 April 2011 from http://www.
abrahammaslow.net/more.html
Mulrow, C., Langhorne, P., & Grimshaw, J. (1997).
Integrating heterogeneous pieces of
evidence in systematic reviews. Annals of
Internal Medicine, 127, 989–995. Retrieved
from http://www.annals.org/content/127/11/
989.short
Mulrow, C., Cook, D., & Davidoff, F. (1997).
Systematic reviews: Critical links in the great
chain of evidence. Annals of Internal
Medicine, 126, 389–391. Retrieved from
http://www.annals.org/content/126/5/389.sh
ort
Oancea, A., & Pring, R. (2008). The Importance of
being thorough: On systematic accumulations
of ‘what works’ in education research. Journal
of Philosophy of Education, 42, 15–39.
OfSTED. (2001). Guidance to inspectors – The
identification and provision for gifted and
talented students. London, UK: Office for
Standards in Education.
Olenchak, F. (2001). Lessons learned from gifted
children about differentiation. Teacher
Educator, 36, 185–198.
Renzulli, J., & Reis, S. (1985). The schoolwide
enrichment model: A comprehensive plan for
educational excellence. Mansfield Center, CT:
Creative Learning Press.
Riley, T., Bevan–Brown, J., Bicknell, B., Carroll-Lind,
J., & Kearney, A. (2004). Gifted and talented
education in New Zealand schools. Wellington,
NZ: New Zealand Ministry of Education.
Ryan, M., & Geake, J. (2003). A vertical
mathematics curriculum for gifted primary
students. Australasian Journal of Gifted
Education, 12, 31–41.
Smith, C. (2006). Including the gifted and talented:
Making inclusion work for more gifted and
able learners. London, UK: Routledge.
Stoeger, H., & Ziegler, A. (2005). Evaluation of an
elementary classroom self-regulated learning
program for gifted math underachievers.
International Education Journal, 6, 261–271.
Retrieved from http://education2.uvic.ca/
Faculty/hfrance/special%20issue%20on%20
giftedness.pdf#page=141
Templin, T., & Pearce, G. (in press). Reviewing
literature. In K. Armour & D. MacDonald
(Eds.), Research methods in physical education
and youth sport. London: Routledge.
VanTassel-Baska, J., & Feng, A. (Eds.). (2004).
Evaluation of gifted programs. Waco, TX:
Prufrock.
VanTassel-Baska, J., Zuo, L., Avery, L., & Little, C.
(2002). A curriculum study of gifted student
learning in the language arts. Gifted Child
Quarterly, 46, 30–44.
Walker, D. (2005). Increasing verbal participation of

Educational Achievement of Gifted and Talented Students 47
gifted females through the utilization of
multiple intelligence theory. Unpublished
Doctoral dissertation, Nova Southeastern
University.
Webb, N., Nemer, K., & Zuniga, S. (2002). Short
circuits or superconductors? American
Educational Research Journal, 39, 943-989.
White, K., Fletcher-Campbell, F., & Ridley, K.
(2003). What works for gifted and talented
students: A review of recent research. Slough,
UK: NFER.
Wood, D. (1999). Factors involved in the
establishment and development of a special
primary school class for academically gifted
students: a case study. Unpublished Master’s
dissertation, Charles Stuart University,
Australia.
Ysseldyke, J., Tardrew, S., Betts, J., Thill, T., &
Hannigan, E. (2004). Use of an instructional
management system to enhance math
instruction of gifted and talented students.
Journal for the Education of the Gifted, 27, 293–
319.
Ziegler, A., & Heller, K. (2000). Conceptions of
giftedness from a meta-theoretical
perspective. In K. Heller, F. Mönks, R.
Sternberg, & R. Subotnik (Eds.), International
handbook of giftedness and talent (2nd ed.,
pp. 3–21). Oxford, UK: Elsevier.
Ziegler, A., & Raul, T. (2000). Myth and reality: A
review of empirical studies on giftedness.
High Ability Studies, 11, 113–136.
The Authors
Richard Bailey has been a Professor at Canterbury, Roehampton and most
recently Birmingham Universities in the UK, and now directs a specialist
international research company, focusing on sport and education. Current
projects include the use of sport in post-disaster settings, the behavioral
economics of physical activity, and the philosophical foundations of radical
education. He is author of more than 100 publications; recent books include the
Routledge Physical Education Reader, the Sage Handbook of the Philosophy of
Education, The Philosophy of Education: an introduction (Continuum), and
Physical Education for Learning (Continuum).
Gemma Pearce is a Doctoral Researcher in the School of Sport and Exercise
Sciences at the University of Birmingham. Recent publications focus on children's
perceptions of physical activity, research methods, literature reviews, body image
and health, elite athletes’ attitudes to doping, player pathways in sport, and gifted
and talented education. She was the project manager of this systematic literature
review and a researcher for the National Impact Evaluation of excellent practice
in Gifted and Talented Physical Education. She teaches and has written on
systematic reviewing.
Over her 30 year career Chris Smith has taught in the primary, secondary and
higher sectors of education in Scotland. Most of that time has been involved in
supporting pupils with additional support needs. For the past 20 years this has
included the support of gifted and talented pupils. She has held lecturing posts in
St Andrew’s College of Education and the University of Glasgow and is currently a
Pupil Support Coordinator with west Dunbartonshire Council.
Margaret Sutherland lectures at the University of Glasgow. She is the Director of
the Scottish Network for Able Pupils and Deputy Director of the Centre for
Research and Development in Adult and Lifelong Learning. She has 31 years
teaching experience in schools and higher education. She has written in the field
of gifted education and is the author of two books. She is on the editorial board of
the Korean Journal of Educational Policy. She speaks at conferences and has
worked across the UK and been invited to work with staff and students in
Tanzania, Malawi, Korea and Denmark.
R. Bailey et al.
48
Dr Niamh Stack is a lecturer in developmental psychology at the University of
Glasgow. As the Development Officer for the Scottish Network for Able Pupils
(SNAP) she is engaged in professional knowledge exchange partnerships with
the Scottish Government and local education authorities and in CPD activities
focusing on gifted development. In addition she is actively engaged in research
and publications in the field of gifted development.
Dr Carrie Winstanley’s interests lie in inclusive and special education,
emphasising the needs of able children with difficulties, and on broadening
diversity in all phases of education and social justice. Carrie is a Principal
Lecturer at Roehampton University, London, having taught in schools and higher
education for more than 20 years. She continues to run holiday and weekend
workshops with able children from varied backgrounds in museums, galleries
and schools. With higher degrees in psychology, philosophy and history of
education, Carrie’s practical work is strongly grounded in theory. She also acts as
a consultant, sharing ideas on supporting able children.
Matt Dickenson works for London Gifted and Talented.
Relative Age Effects in Higher Education
49 Talent Development & Excellence
Vol. 4, No. 1, 2012, 49–63
Relative Age Effects in Higher Education:
An Investigation of Potential Long Term Impacts
Resulting from Youth Sport and Education Policies Nick Wattie1*, Jörg Schorer2, Maike Tietjens2, Joseph Baker1and Steve Cobley3
Abstract: Within education and sport a ubiquitous policy, annual age grouping, is used
to group youths into one year cohorts using a cut-off date. Those born early in the
selection year can be up to 12 months older than their cohort peers, a phenomena
termed ‘relative age’ differences. Relative age differences have been implicated with a
number of short and long term developmental outcomes in sport (e.g., elite athlete
development) and education (e.g., academic achievement). In this investigation, we
summarize two studies examining whether relative age in education and/or sport
affected the likelihood of enrolling into higher education sport science or kinesiology
programs within Germany and England. In Study 1, there was a disproportionate
number of relatively older students (as determined by sport cut-off dates) choosing to
study sport science in Germany. However, these results were not replicated in an
English sample (Study 2), nor were relative age effects found for academic
performance. These results highlight the complex relationships between relative age,
contexts and developmental outcomes, and stress the need for further research.
Keywords:
relative age, policy, sport participation, development, admission, academic
performance
Annual age grouping policies within education and youth sport are often used as means of
assembling children and adolescents for the purpose of eligibility and participation
(Allen & Barnsley, 1993; Musch & Grondin, 2001). However, this policy and practice
unavoidably creates relative age differences. Relative age describes the fact that within an
annual age group defined by a set selection date (e.g., September 1st), those born
immediately following the selection date are relatively older (by up to 364 days) than
their peers born immediately before the selection date (e.g., August 31st). These relative
age differences, which can create different developmental contexts for children to grow
up in, have been shown to cause socially created phenomena (Wattie, Cobley, & Baker,
2008) known as relative age effects (RAEs, Barnsley, Thompson, & Barnsley, 1985).
In sport advantages often exist for relatively older children (for reviews see Cobley, Baker,
Wattie, & McKenna, 2009a; Musch & Grondin, 2001). Research suggests that relatively
older youths are more likely to be selected to school sports teams (Cobley, Abraham, &
Baker, 2008; Wilson, 1999), local community competitive sports teams (most notable in
soccer and ice hockey: Barnsley & Thompson, 1988; Helsen, Van Winckel, & Williams,
2005), and are more likely to make it to elite levels of professional sport (Barnsley et al.,
1985; Musch & Hay, 1999; Wattie, Baker, Cobley, & Montelpare, 2007; for an exception see
Schorer, Cobley, Büsch, Bräutigam, & Baker, 2009).
The norm in relative age research on sport-related outcomes has been to categorize
relative age as Quartile of birth, with Quartile 1 (Q1) comprised of those born in the first
three months that follow the selection date, and Quartile 4 (Q4) comprised of those born
1 School of Kinesiology and Health Science, York University, Toronto, Canada 2 Institute for Sport Science, Westfalian Wilhelms-University Münster, Germany 3 Faculty of Health Sciences, University of Sydney, Sydney, Australia * Corresponding author. Bethune College, Keele Campus, York University, Toronto, M3J 1P3,
Canada. Email: [email protected]
ISSN 1869-0459 (print)/ ISSN 1869-2885 (online)
2012 International Research Association for Talent Development and Excellence
http://www.iratde.org
N. Wattie et al.
50
in the three months that immediately precede the selection date. When RAEs have been
observed it has often been such that there is an overrepresentation of those born in Q1
and Q2, and underrepresentations of those born in Q3 and Q4. For example, in the first
relative age study on sport Grondin and colleagues (Grondin, Deschaies, & Nault, 1984)
observed that there were approximately 20 % more participants born in Q1 among 10–11
and 12–13 year old ice hockey players, when compared to population birth statistics.
Conversely, there were significantly fewer players born in Q4 than would normally be
expected. Similarly, Barnsley and colleagues (Barnsley, Thompson, & Legault, 1992)
analysed the relative age distributions of 16 rosters from the 1989 Under-17s (N = 287)
and Under-20s (N = 288) World Cup Tournaments. Chi-square tests of difference revealed
statistically significant asymmetries according to quartile of birth for the rosters of Under-
17s teams (Q1 = 44.95 %, Q2 = 33.80 %, Q3 = 13.59 %, Q4 = 7.66 %) and the Under-20s
rosters (Q1 = 46.87 %, Q2 = 32.64 %, Q3 = 12.85 %, Q4 = 7.64 %).
Evidence of RAEs, as described above, have been observed among Canadian youth
(Baker, Cobley, Montelpare, Wattie, Faught, & The Ontario Hockey Research Group, 2010;
Montelpare, Scott, & Pelino, 1998; Sherar, Baxter-Jones, Faulkner, & Russell, 2007; Sherar,
Bruner, Munrow-Chandler, & Baxter-Jones, 2007) and professional (NHL) ice hockey
players (Grondin & Trudeau, 1991; Montelpare et al., 1998; Wattie et al., 2007), as well as
non-Canadian professional ice hockey players (Daniel & Janssen, 1987). Researchers have
also confirmed the international existence of RAEs among youth and professional soccer
samples. For example, RAEs have been identified among soccer players in France,
England, Germany, Sweden, Netherlands, Brazil, Japan, Australia, Spain, and the United
States (Brewer, Balson, & Davis, 1995; Carling, Le Gall, Reilly, & Williams, 2009; Dudink,
1994; Edgar & O’Donoghue, 2004; Helsen et al., 2005; Jimenez & Pain, 2008; Musch, 2002;
Mujika, Vaeyans, Matthys, Santisteban, Goiriena, & Philippaerts, 2009; Simmons & Paull,
2001).
In addition to ice hockey and soccer, over-representations of relatively older players have
also been documented for baseball in the United States (Thompson, Barnsley, & Stebelsky,
1991; Côté, MacDonald, Baker, & Abernethy, 2006) and Japan (Grondin & Koren, 2000), and
rugby union in Australia (Abernethy & Farrow, 2005). More recently, one of the largest
magnitude RAE was observed in competitive youth rugby league in England, with nearly
60 % of all players being born in the first three months (Q1) of the selection year (Till,
Cobley, Wattie, O’Hara, Cooke, & Chapman, 2010).
In addition to sport RAEs have also been observed in education. Being relatively older has
been related to higher academic achievement across subjects (e.g., math, science,
physical education: Cobley, Baker, Wattie, & McKenna, 2009b) and the likelihood of being
identified as academically gifted (Cobley et al., 2009b; Thompson, 1971). By contrast,
being relatively younger has been related to an increased likelihood of being referred for
learning support, as having ‘special educational needs’ (Bookbinder,1967; Martin, Foels,
Clanton, & Moon, 2004; Wallingford & Prout, 2000), being categorised as ‘learning
disabled’(Maddux, 1980), and logging lower attendance rates in school (Carroll, 1992;
Cobley et al., 2009b). The most distressing outcomes associated with relative age
differences in education systems were reported by Thompson and colleagues: Relatively
younger youths (6 to 15 years of age) had lower levels of self-esteem (Thompson,
Barnsley, & Battle, 2004), and higher rates of suicide (Thompson, Barnsley, & Dyck, 1999).
In addition to education-related outcomes at the primary and secondary levels, there is
research to suggest these effects persist into adulthood. Bedard and Dhuey (2006)
demonstrated a 9.8 % over-representation of relatively older youths among “University-
bound” pupils (i.e., highly successful secondary school students that had completed pre-
University course requirements) in Canada. Bedard and Dhuey (2006) also reported
similar trends for University enrolment behaviour in the United Sates. Here relatively
older pupils were 11.6 % more likely to enrol in four-year College or University
programs. More recently, researchers examined the relationship between relative age and
applications to a medical school in the United States. Although a greater proportion of
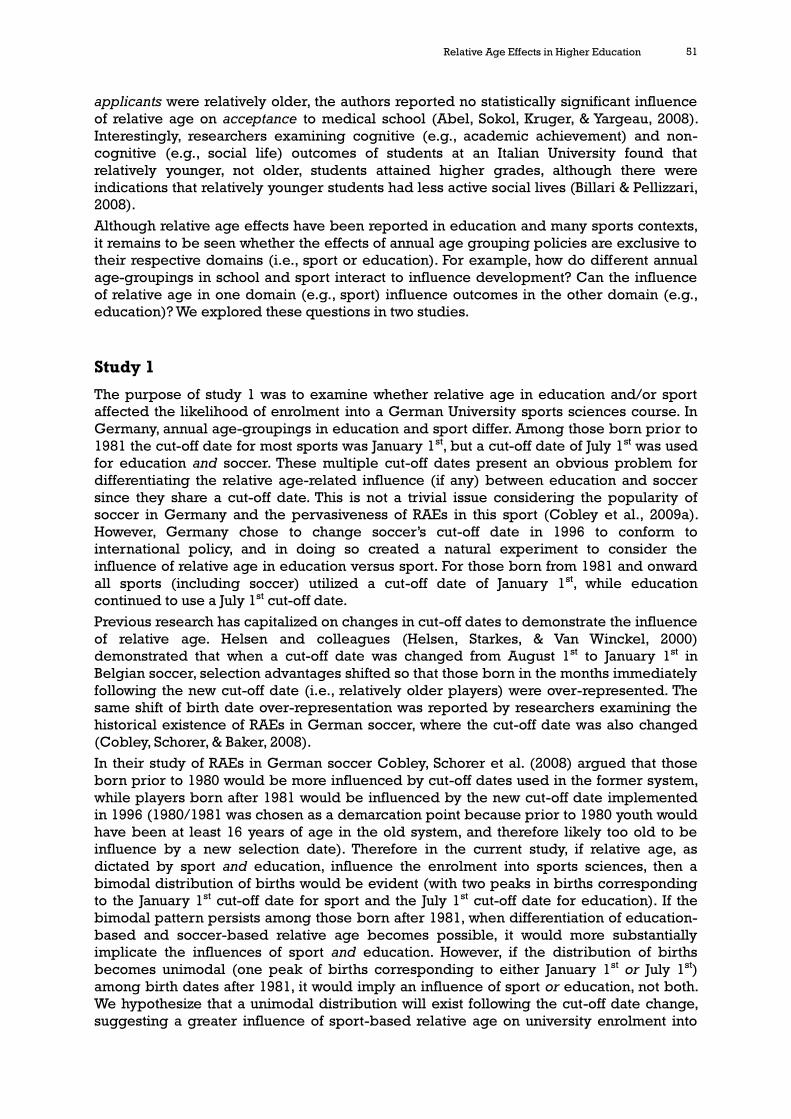
Relative Age Effects in Higher Education
51
applicants were relatively older, the authors reported no statistically significant influence
of relative age on acceptance to medical school (Abel, Sokol, Kruger, & Yargeau, 2008).
Interestingly, researchers examining cognitive (e.g., academic achievement) and non-
cognitive (e.g., social life) outcomes of students at an Italian University found that
relatively younger, not older, students attained higher grades, although there were
indications that relatively younger students had less active social lives (Billari & Pellizzari,
2008).
Although relative age effects have been reported in education and many sports contexts,
it remains to be seen whether the effects of annual age grouping policies are exclusive to
their respective domains (i.e., sport or education). For example, how do different annual
age-groupings in school and sport interact to influence development? Can the influence
of relative age in one domain (e.g., sport) influence outcomes in the other domain (e.g.,
education)? We explored these questions in two studies.
Study 1
The purpose of study 1 was to examine whether relative age in education and/or sport
affected the likelihood of enrolment into a German University sports sciences course. In
Germany, annual age-groupings in education and sport differ. Among those born prior to
1981 the cut-off date for most sports was January 1st, but a cut-off date of July 1st was used
for education and soccer. These multiple cut-off dates present an obvious problem for
differentiating the relative age-related influence (if any) between education and soccer
since they share a cut-off date. This is not a trivial issue considering the popularity of
soccer in Germany and the pervasiveness of RAEs in this sport (Cobley et al., 2009a).
However, Germany chose to change soccer’s cut-off date in 1996 to conform to
international policy, and in doing so created a natural experiment to consider the
influence of relative age in education versus sport. For those born from 1981 and onward
all sports (including soccer) utilized a cut-off date of January 1st, while education
continued to use a July 1st cut-off date.
Previous research has capitalized on changes in cut-off dates to demonstrate the influence
of relative age. Helsen and colleagues (Helsen, Starkes, & Van Winckel, 2000)
demonstrated that when a cut-off date was changed from August 1st to January 1st in
Belgian soccer, selection advantages shifted so that those born in the months immediately
following the new cut-off date (i.e., relatively older players) were over-represented. The
same shift of birth date over-representation was reported by researchers examining the
historical existence of RAEs in German soccer, where the cut-off date was also changed
(Cobley, Schorer, & Baker, 2008).
In their study of RAEs in German soccer Cobley, Schorer et al. (2008) argued that those
born prior to 1980 would be more influenced by cut-off dates used in the former system,
while players born after 1981 would be influenced by the new cut-off date implemented
in 1996 (1980/1981 was chosen as a demarcation point because prior to 1980 youth would
have been at least 16 years of age in the old system, and therefore likely too old to be
influence by a new selection date). Therefore in the current study, if relative age, as
dictated by sport and education, influence the enrolment into sports sciences, then a
bimodal distribution of births would be evident (with two peaks in births corresponding
to the January 1st cut-off date for sport and the July 1st cut-off date for education). If the
bimodal pattern persists among those born after 1981, when differentiation of education-
based and soccer-based relative age becomes possible, it would more substantially
implicate the influences of sport and education. However, if the distribution of births
becomes unimodal (one peak of births corresponding to either January 1st or July 1st)
among birth dates after 1981, it would imply an influence of sport or education, not both.
We hypothesize that a unimodal distribution will exist following the cut-off date change,
suggesting a greater influence of sport-based relative age on university enrolment into
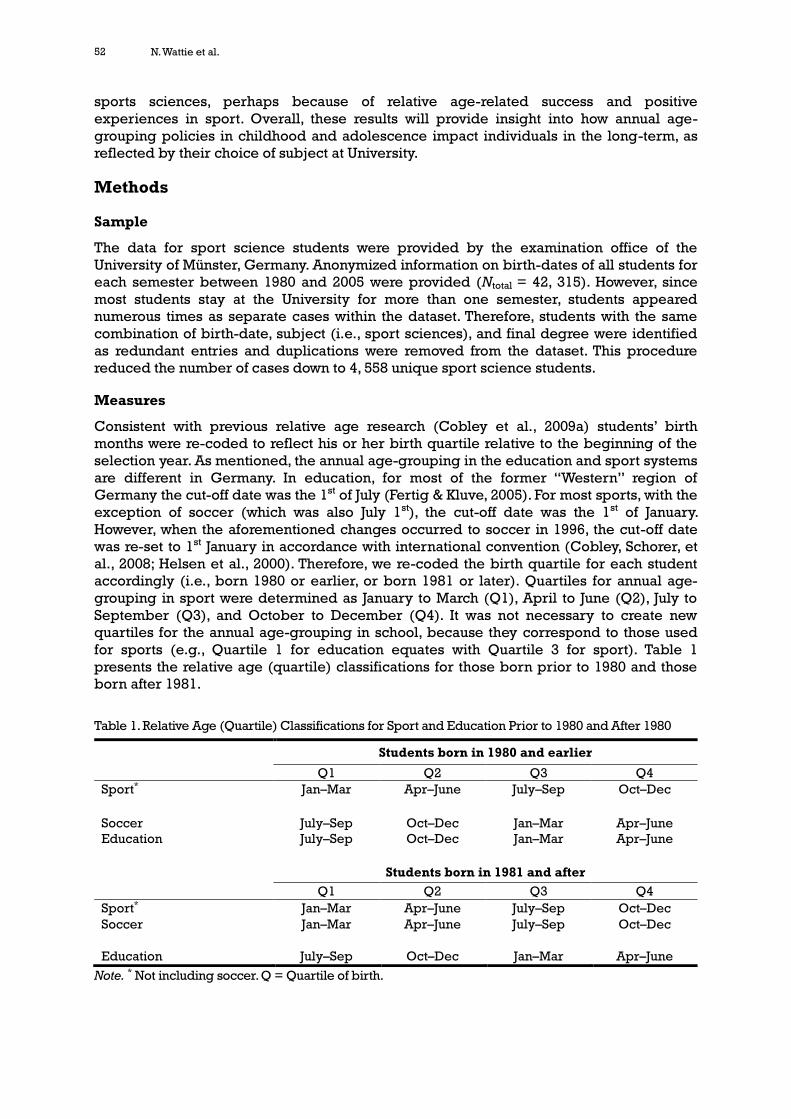
N. Wattie et al.
52
sports sciences, perhaps because of relative age-related success and positive
experiences in sport. Overall, these results will provide insight into how annual age-
grouping policies in childhood and adolescence impact individuals in the long-term, as
reflected by their choice of subject at University.
Methods
Sample
The data for sport science students were provided by the examination office of the
University of Münster, Germany. Anonymized information on birth-dates of all students for
each semester between 1980 and 2005 were provided (Ntotal = 42, 315). However, since
most students stay at the University for more than one semester, students appeared
numerous times as separate cases within the dataset. Therefore, students with the same
combination of birth-date, subject (i.e., sport sciences), and final degree were identified
as redundant entries and duplications were removed from the dataset. This procedure
reduced the number of cases down to 4, 558 unique sport science students.
Measures
Consistent with previous relative age research (Cobley et al., 2009a) students’ birth
months were re-coded to reflect his or her birth quartile relative to the beginning of the
selection year. As mentioned, the annual age-grouping in the education and sport systems
are different in Germany. In education, for most of the former “Western” region of
Germany the cut-off date was the 1st of July (Fertig & Kluve, 2005). For most sports, with the
exception of soccer (which was also July 1st), the cut-off date was the 1st of January.
However, when the aforementioned changes occurred to soccer in 1996, the cut-off date
was re-set to 1st January in accordance with international convention (Cobley, Schorer, et
al., 2008; Helsen et al., 2000). Therefore, we re-coded the birth quartile for each student
accordingly (i.e., born 1980 or earlier, or born 1981 or later). Quartiles for annual age-
grouping in sport were determined as January to March (Q1), April to June (Q2), July to
September (Q3), and October to December (Q4). It was not necessary to create new
quartiles for the annual age-grouping in school, because they correspond to those used
for sports (e.g., Quartile 1 for education equates with Quartile 3 for sport). Table 1
presents the relative age (quartile) classifications for those born prior to 1980 and those
born after 1981.
Table 1. Relative Age (Quartile) Classifications for Sport and Education Prior to 1980 and After 1980
Students born in 1980 and earlier
Q1 Q2 Q3 Q4
Sport* Jan–Mar Apr–June July–Sep Oct–Dec
Soccer July–Sep Oct–Dec Jan–Mar Apr–June
Education July–Sep Oct–Dec Jan–Mar Apr–June
Students born in 1981 and after
Q1 Q2 Q3 Q4
Sport* Jan–Mar Apr–June July–Sep Oct–Dec
Soccer Jan–Mar Apr–June July–Sep Oct–Dec
Education July–Sep Oct–Dec Jan–Mar Apr–June
Note. * Not including soccer. Q = Quartile of birth.
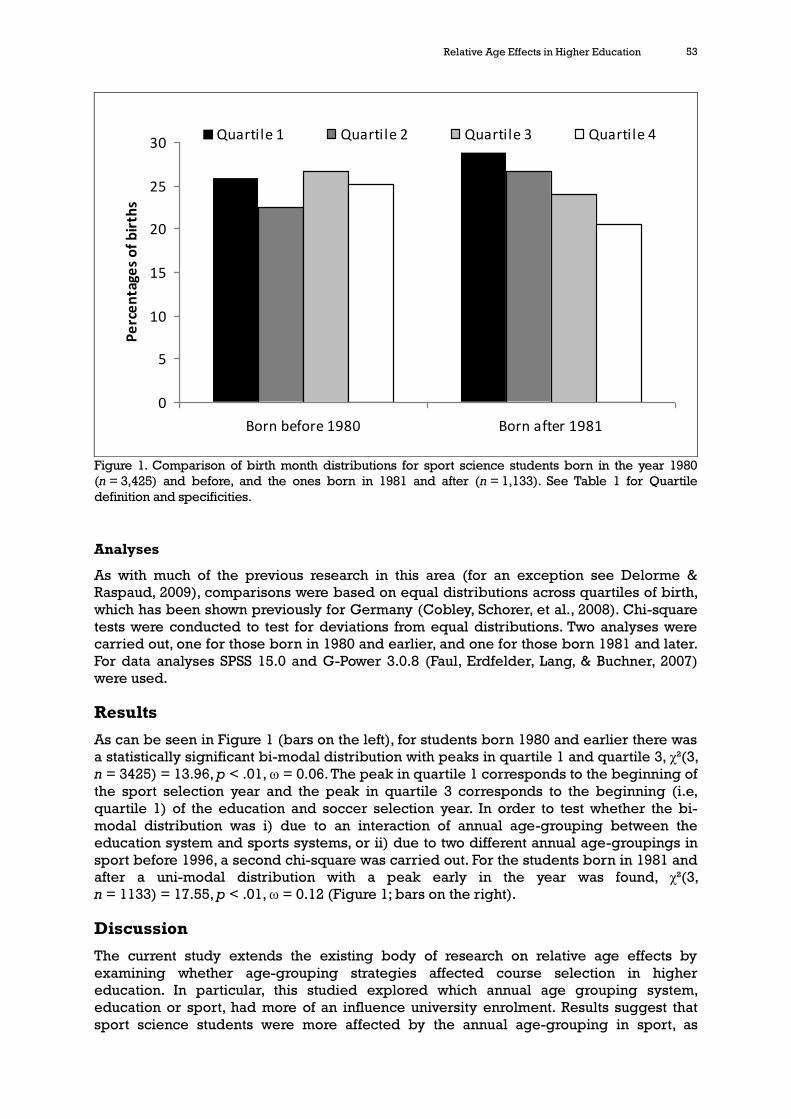
Relative Age Effects in Higher Education
53
Figure 1. Comparison of birth month distributions for sport science students born in the year 1980
(n = 3,425) and before, and the ones born in 1981 and after (n = 1,133). See Table 1 for Quartile
definition and specificities.
Analyses
As with much of the previous research in this area (for an exception see Delorme &
Raspaud, 2009), comparisons were based on equal distributions across quartiles of birth,
which has been shown previously for Germany (Cobley, Schorer, et al., 2008). Chi-square
tests were conducted to test for deviations from equal distributions. Two analyses were
carried out, one for those born in 1980 and earlier, and one for those born 1981 and later.
For data analyses SPSS 15.0 and G-Power 3.0.8 (Faul, Erdfelder, Lang, & Buchner, 2007)
were used.
Results
As can be seen in Figure 1 (bars on the left), for students born 1980 and earlier there was
a statistically significant bi-modal distribution with peaks in quartile 1 and quartile 3, χ²(3,
n = 3425) = 13.96, p < .01, ω = 0.06. The peak in quartile 1 corresponds to the beginning of
the sport selection year and the peak in quartile 3 corresponds to the beginning (i.e,
quartile 1) of the education and soccer selection year. In order to test whether the bi-
modal distribution was i) due to an interaction of annual age-grouping between the
education system and sports systems, or ii) due to two different annual age-groupings in
sport before 1996, a second chi-square was carried out. For the students born in 1981 and
after a uni-modal distribution with a peak early in the year was found, χ²(3,
n = 1133) = 17.55, p < .01, ω = 0.12 (Figure 1; bars on the right).
Discussion
The current study extends the existing body of research on relative age effects by
examining whether age-grouping strategies affected course selection in higher
education. In particular, this studied explored which annual age grouping system,
education or sport, had more of an influence university enrolment. Results suggest that
sport science students were more affected by the annual age-grouping in sport, as
0
5
10
15
20
25
30
Born before 1980 Born after 1981
Pe
rce
nta
ges
of
bir
ths
Quartile 1 Quartile 2 Quartile 3 Quartile 4
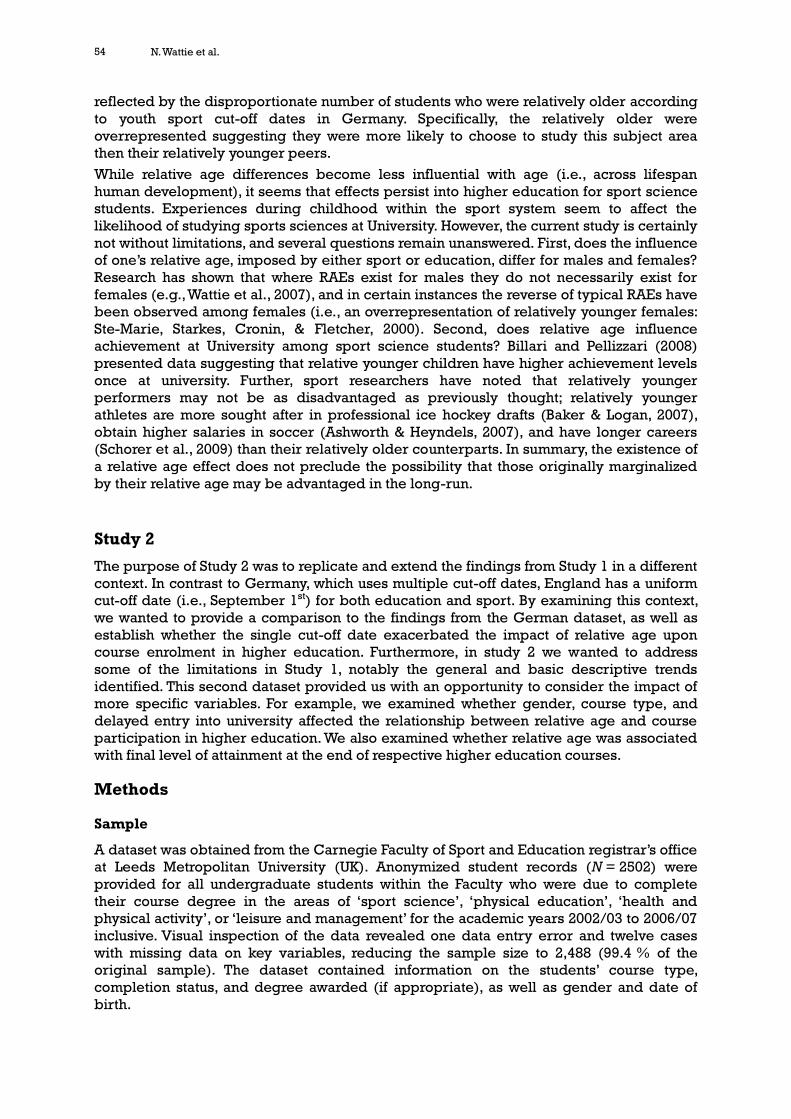
N. Wattie et al.
54
reflected by the disproportionate number of students who were relatively older according
to youth sport cut-off dates in Germany. Specifically, the relatively older were
overrepresented suggesting they were more likely to choose to study this subject area
then their relatively younger peers.
While relative age differences become less influential with age (i.e., across lifespan
human development), it seems that effects persist into higher education for sport science
students. Experiences during childhood within the sport system seem to affect the
likelihood of studying sports sciences at University. However, the current study is certainly
not without limitations, and several questions remain unanswered. First, does the influence
of one’s relative age, imposed by either sport or education, differ for males and females?
Research has shown that where RAEs exist for males they do not necessarily exist for
females (e.g., Wattie et al., 2007), and in certain instances the reverse of typical RAEs have
been observed among females (i.e., an overrepresentation of relatively younger females:
Ste-Marie, Starkes, Cronin, & Fletcher, 2000). Second, does relative age influence
achievement at University among sport science students? Billari and Pellizzari (2008)
presented data suggesting that relative younger children have higher achievement levels
once at university. Further, sport researchers have noted that relatively younger
performers may not be as disadvantaged as previously thought; relatively younger
athletes are more sought after in professional ice hockey drafts (Baker & Logan, 2007),
obtain higher salaries in soccer (Ashworth & Heyndels, 2007), and have longer careers
(Schorer et al., 2009) than their relatively older counterparts. In summary, the existence of
a relative age effect does not preclude the possibility that those originally marginalized
by their relative age may be advantaged in the long-run.
Study 2
The purpose of Study 2 was to replicate and extend the findings from Study 1 in a different
context. In contrast to Germany, which uses multiple cut-off dates, England has a uniform
cut-off date (i.e., September 1st) for both education and sport. By examining this context,
we wanted to provide a comparison to the findings from the German dataset, as well as
establish whether the single cut-off date exacerbated the impact of relative age upon
course enrolment in higher education. Furthermore, in study 2 we wanted to address
some of the limitations in Study 1, notably the general and basic descriptive trends
identified. This second dataset provided us with an opportunity to consider the impact of
more specific variables. For example, we examined whether gender, course type, and
delayed entry into university affected the relationship between relative age and course
participation in higher education. We also examined whether relative age was associated
with final level of attainment at the end of respective higher education courses.
Methods
Sample
A dataset was obtained from the Carnegie Faculty of Sport and Education registrar’s office
at Leeds Metropolitan University (UK). Anonymized student records (N = 2502) were
provided for all undergraduate students within the Faculty who were due to complete
their course degree in the areas of ‘sport science’, ‘physical education’, ‘health and
physical activity’, or ‘leisure and management’ for the academic years 2002/03 to 2006/07
inclusive. Visual inspection of the data revealed one data entry error and twelve cases
with missing data on key variables, reducing the sample size to 2,488 (99.4 % of the
original sample). The dataset contained information on the students’ course type,
completion status, and degree awarded (if appropriate), as well as gender and date of
birth.
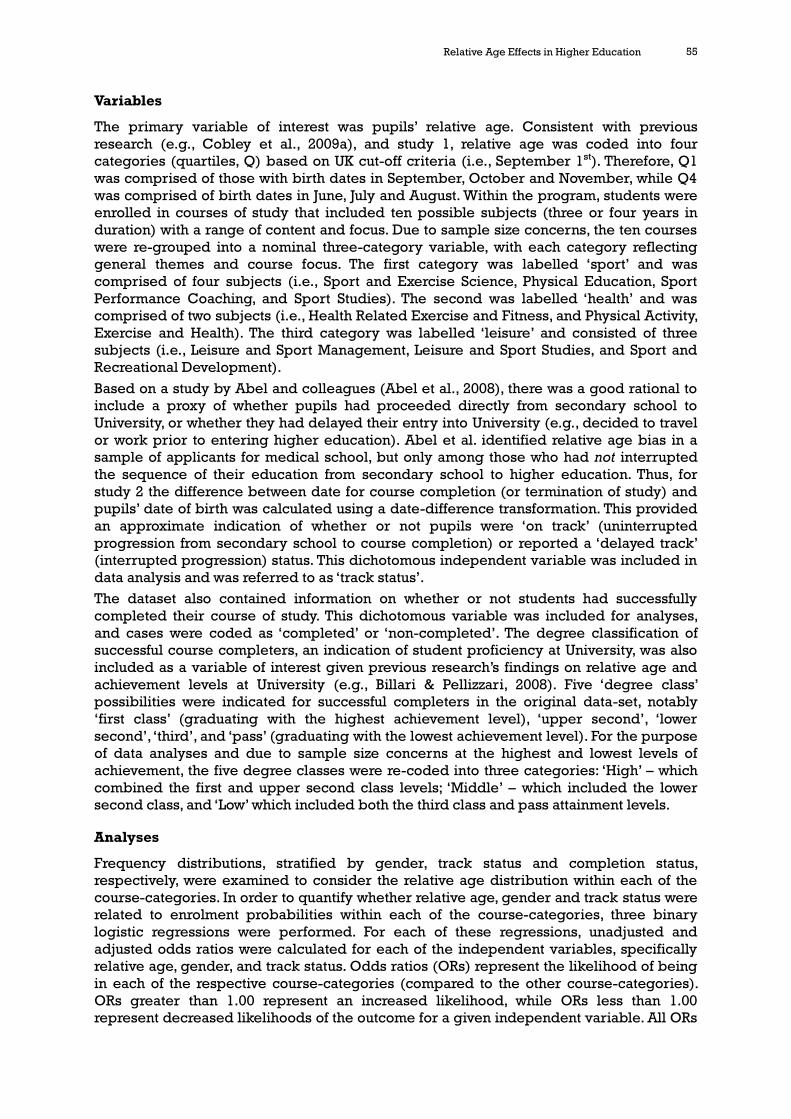
Relative Age Effects in Higher Education
55
Variables
The primary variable of interest was pupils’ relative age. Consistent with previous
research (e.g., Cobley et al., 2009a), and study 1, relative age was coded into four
categories (quartiles, Q) based on UK cut-off criteria (i.e., September 1st). Therefore, Q1
was comprised of those with birth dates in September, October and November, while Q4
was comprised of birth dates in June, July and August. Within the program, students were
enrolled in courses of study that included ten possible subjects (three or four years in
duration) with a range of content and focus. Due to sample size concerns, the ten courses
were re-grouped into a nominal three-category variable, with each category reflecting
general themes and course focus. The first category was labelled ‘sport’ and was
comprised of four subjects (i.e., Sport and Exercise Science, Physical Education, Sport
Performance Coaching, and Sport Studies). The second was labelled ‘health’ and was
comprised of two subjects (i.e., Health Related Exercise and Fitness, and Physical Activity,
Exercise and Health). The third category was labelled ‘leisure’ and consisted of three
subjects (i.e., Leisure and Sport Management, Leisure and Sport Studies, and Sport and
Recreational Development).
Based on a study by Abel and colleagues (Abel et al., 2008), there was a good rational to
include a proxy of whether pupils had proceeded directly from secondary school to
University, or whether they had delayed their entry into University (e.g., decided to travel
or work prior to entering higher education). Abel et al. identified relative age bias in a
sample of applicants for medical school, but only among those who had not interrupted
the sequence of their education from secondary school to higher education. Thus, for
study 2 the difference between date for course completion (or termination of study) and
pupils’ date of birth was calculated using a date-difference transformation. This provided
an approximate indication of whether or not pupils were ‘on track’ (uninterrupted
progression from secondary school to course completion) or reported a ‘delayed track’
(interrupted progression) status. This dichotomous independent variable was included in
data analysis and was referred to as ‘track status’.
The dataset also contained information on whether or not students had successfully
completed their course of study. This dichotomous variable was included for analyses,
and cases were coded as ‘completed’ or ‘non-completed’. The degree classification of
successful course completers, an indication of student proficiency at University, was also
included as a variable of interest given previous research’s findings on relative age and
achievement levels at University (e.g., Billari & Pellizzari, 2008). Five ‘degree class’
possibilities were indicated for successful completers in the original data-set, notably
‘first class’ (graduating with the highest achievement level), ‘upper second’, ‘lower
second’, ‘third’, and ‘pass’ (graduating with the lowest achievement level). For the purpose
of data analyses and due to sample size concerns at the highest and lowest levels of
achievement, the five degree classes were re-coded into three categories: ‘High’ – which
combined the first and upper second class levels; ‘Middle’ – which included the lower
second class, and ‘Low’ which included both the third class and pass attainment levels.
Analyses
Frequency distributions, stratified by gender, track status and completion status,
respectively, were examined to consider the relative age distribution within each of the
course-categories. In order to quantify whether relative age, gender and track status were
related to enrolment probabilities within each of the course-categories, three binary
logistic regressions were performed. For each of these regressions, unadjusted and
adjusted odds ratios were calculated for each of the independent variables, specifically
relative age, gender, and track status. Odds ratios (ORs) represent the likelihood of being
in each of the respective course-categories (compared to the other course-categories).
ORs greater than 1.00 represent an increased likelihood, while ORs less than 1.00
represent decreased likelihoods of the outcome for a given independent variable. All ORs
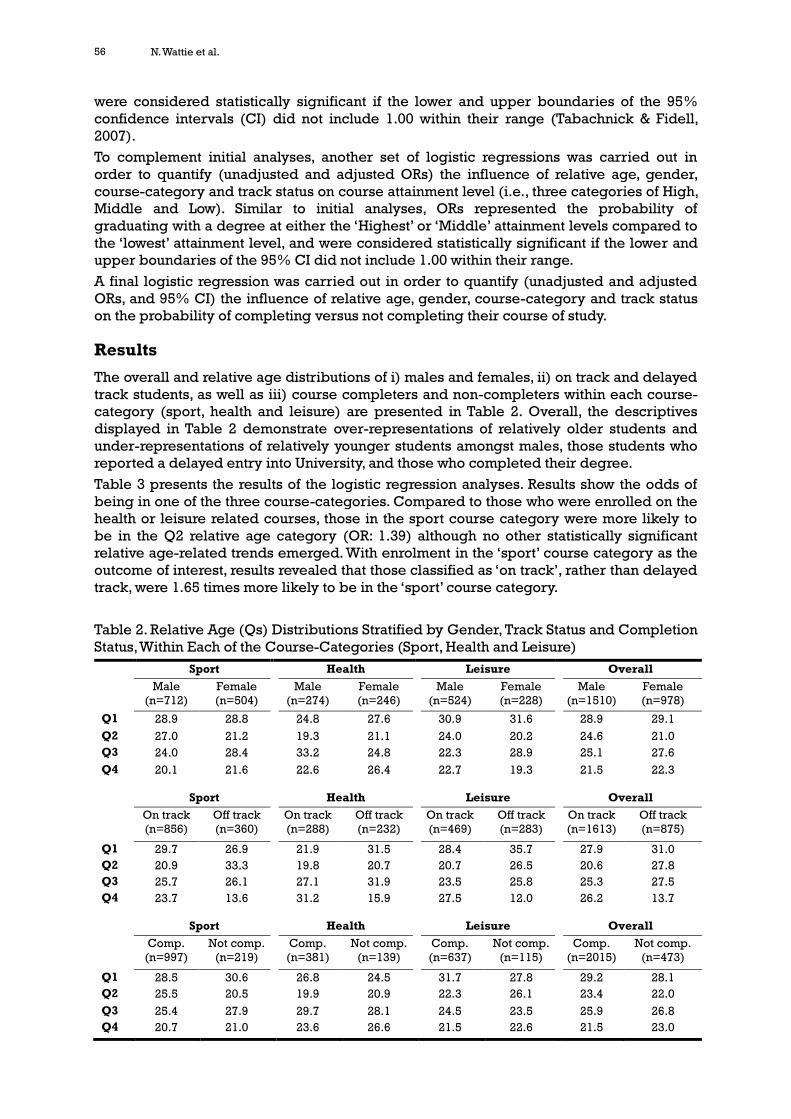
N. Wattie et al.
56
were considered statistically significant if the lower and upper boundaries of the 95%
confidence intervals (CI) did not include 1.00 within their range (Tabachnick & Fidell,
2007).
To complement initial analyses, another set of logistic regressions was carried out in
order to quantify (unadjusted and adjusted ORs) the influence of relative age, gender,
course-category and track status on course attainment level (i.e., three categories of High,
Middle and Low). Similar to initial analyses, ORs represented the probability of
graduating with a degree at either the ‘Highest’ or ‘Middle’ attainment levels compared to
the ‘lowest’ attainment level, and were considered statistically significant if the lower and
upper boundaries of the 95% CI did not include 1.00 within their range.
A final logistic regression was carried out in order to quantify (unadjusted and adjusted
ORs, and 95% CI) the influence of relative age, gender, course-category and track status
on the probability of completing versus not completing their course of study.
Results
The overall and relative age distributions of i) males and females, ii) on track and delayed
track students, as well as iii) course completers and non-completers within each course-
category (sport, health and leisure) are presented in Table 2. Overall, the descriptives
displayed in Table 2 demonstrate over-representations of relatively older students and
under-representations of relatively younger students amongst males, those students who
reported a delayed entry into University, and those who completed their degree.
Table 3 presents the results of the logistic regression analyses. Results show the odds of
being in one of the three course-categories. Compared to those who were enrolled on the
health or leisure related courses, those in the sport course category were more likely to
be in the Q2 relative age category (OR: 1.39) although no other statistically significant
relative age-related trends emerged. With enrolment in the ‘sport’ course category as the
outcome of interest, results revealed that those classified as ‘on track’, rather than delayed
track, were 1.65 times more likely to be in the ‘sport’ course category.
Table 2. Relative Age (Qs) Distributions Stratified by Gender, Track Status and Completion
Status, Within Each of the Course-Categories (Sport, Health and Leisure)
Sport Health Leisure Overall
Male
(n=712)
Female
(n=504)
Male
(n=274)
Female
(n=246)
Male
(n=524)
Female
(n=228)
Male
(n=1510)
Female
(n=978)
Q1 28.9 28.8 24.8 27.6 30.9 31.6 28.9 29.1
Q2 27.0 21.2 19.3 21.1 24.0 20.2 24.6 21.0
Q3 24.0 28.4 33.2 24.8 22.3 28.9 25.1 27.6
Q4 20.1 21.6 22.6 26.4 22.7 19.3 21.5 22.3
Sport Health Leisure Overall
On track
(n=856)
Off track
(n=360)
On track
(n=288)
Off track
(n=232)
On track
(n=469)
Off track
(n=283)
On track
(n=1613)
Off track
(n=875)
Q1 29.7 26.9 21.9 31.5 28.4 35.7 27.9 31.0
Q2 20.9 33.3 19.8 20.7 20.7 26.5 20.6 27.8
Q3 25.7 26.1 27.1 31.9 23.5 25.8 25.3 27.5
Q4 23.7 13.6 31.2 15.9 27.5 12.0 26.2 13.7
Sport Health Leisure Overall
Comp.
(n=997)
Not comp.
(n=219)
Comp.
(n=381)
Not comp.
(n=139)
Comp.
(n=637)
Not comp.
(n=115)
Comp.
(n=2015)
Not comp.
(n=473)
Q1 28.5 30.6 26.8 24.5 31.7 27.8 29.2 28.1
Q2 25.5 20.5 19.9 20.9 22.3 26.1 23.4 22.0
Q3 25.4 27.9 29.7 28.1 24.5 23.5 25.9 26.8
Q4 20.7 21.0 23.6 26.6 21.5 22.6 21.5 23.0
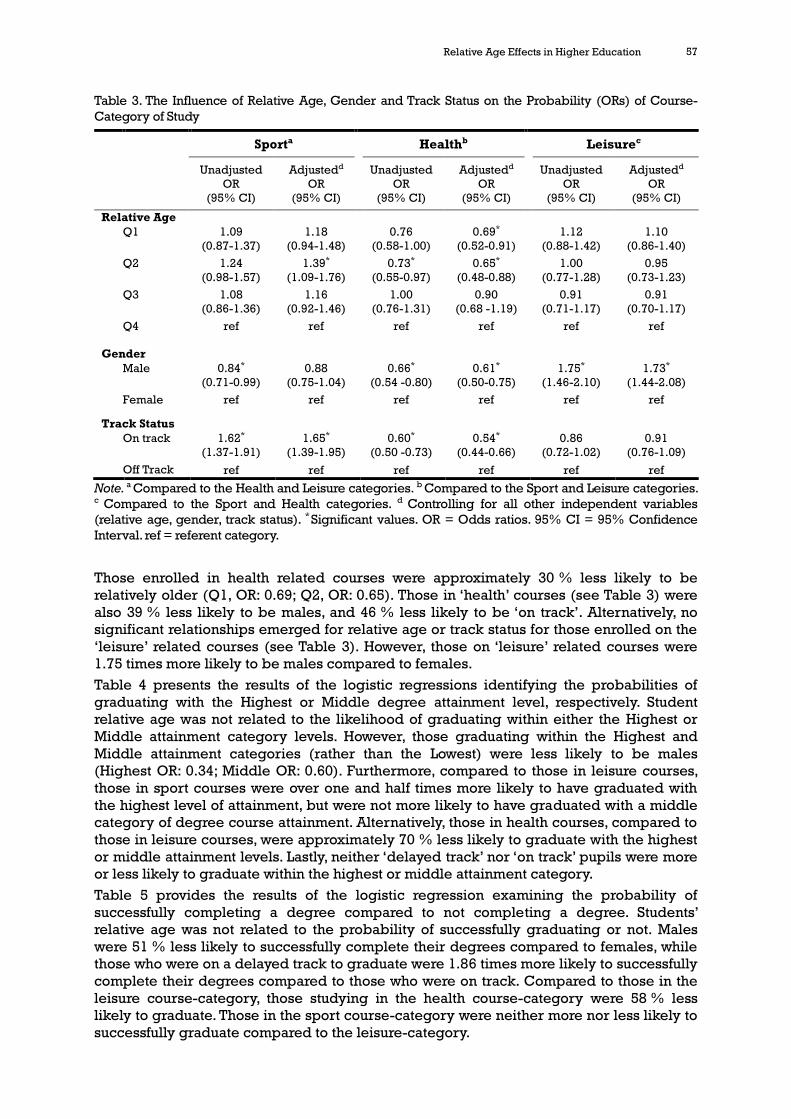
Relative Age Effects in Higher Education
57
Table 3. The Influence of Relative Age, Gender and Track Status on the Probability (ORs) of Course-
Category of Study
Sporta Healthb Leisurec
Unadjusted
OR
(95% CI)
Adjustedd
OR
(95% CI)
Unadjusted
OR
(95% CI)
Adjustedd
OR
(95% CI)
Unadjusted
OR
(95% CI)
Adjustedd
OR
(95% CI)
Relative Age Q1 1.09
(0.87-1.37)
1.18
(0.94-1.48)
0.76
(0.58-1.00)
0.69*
(0.52-0.91)
1.12
(0.88-1.42)
1.10
(0.86-1.40)
Q2 1.24
(0.98-1.57)
1.39*
(1.09-1.76)
0.73*
(0.55-0.97)
0.65*
(0.48-0.88)
1.00
(0.77-1.28)
0.95
(0.73-1.23)
Q3 1.08
(0.86-1.36)
1.16
(0.92-1.46)
1.00
(0.76-1.31)
0.90
(0.68 -1.19)
0.91
(0.71-1.17)
0.91
(0.70-1.17)
Q4 ref ref ref ref ref ref
Gender Male 0.84*
(0.71-0.99)
0.88
(0.75-1.04)
0.66*
(0.54 -0.80)
0.61*
(0.50-0.75)
1.75*
(1.46-2.10)
1.73*
(1.44-2.08)
Female ref ref ref ref ref ref
Track Status On track 1.62*
(1.37-1.91)
1.65*
(1.39-1.95)
0.60*
(0.50 -0.73)
0.54*
(0.44-0.66)
0.86
(0.72-1.02)
0.91
(0.76-1.09)
Off Track ref ref ref ref ref ref
Note. a Compared to the Health and Leisure categories. b Compared to the Sport and Leisure categories. c Compared to the Sport and Health categories. d Controlling for all other independent variables
(relative age, gender, track status). * Significant values. OR = Odds ratios. 95% CI = 95% Confidence
Interval. ref = referent category.
Those enrolled in health related courses were approximately 30 % less likely to be
relatively older (Q1, OR: 0.69; Q2, OR: 0.65). Those in ‘health’ courses (see Table 3) were
also 39 % less likely to be males, and 46 % less likely to be ‘on track’. Alternatively, no
significant relationships emerged for relative age or track status for those enrolled on the
‘leisure’ related courses (see Table 3). However, those on ‘leisure’ related courses were
1.75 times more likely to be males compared to females.
Table 4 presents the results of the logistic regressions identifying the probabilities of
graduating with the Highest or Middle degree attainment level, respectively. Student
relative age was not related to the likelihood of graduating within either the Highest or
Middle attainment category levels. However, those graduating within the Highest and
Middle attainment categories (rather than the Lowest) were less likely to be males
(Highest OR: 0.34; Middle OR: 0.60). Furthermore, compared to those in leisure courses,
those in sport courses were over one and half times more likely to have graduated with
the highest level of attainment, but were not more likely to have graduated with a middle
category of degree course attainment. Alternatively, those in health courses, compared to
those in leisure courses, were approximately 70 % less likely to graduate with the highest
or middle attainment levels. Lastly, neither ‘delayed track’ nor ‘on track’ pupils were more
or less likely to graduate within the highest or middle attainment category.
Table 5 provides the results of the logistic regression examining the probability of
successfully completing a degree compared to not completing a degree. Students’
relative age was not related to the probability of successfully graduating or not. Males
were 51 % less likely to successfully complete their degrees compared to females, while
those who were on a delayed track to graduate were 1.86 times more likely to successfully
complete their degrees compared to those who were on track. Compared to those in the
leisure course-category, those studying in the health course-category were 58 % less
likely to graduate. Those in the sport course-category were neither more nor less likely to
successfully graduate compared to the leisure-category.
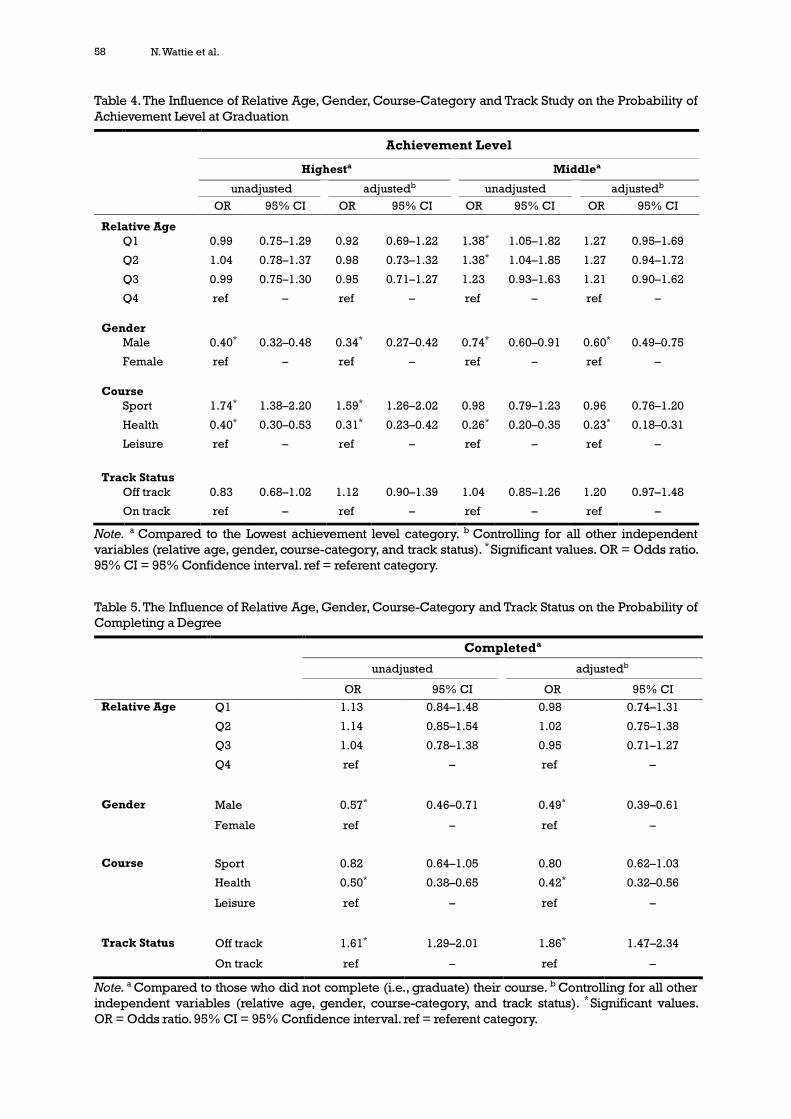
N. Wattie et al.
58
Table 4. The Influence of Relative Age, Gender, Course-Category and Track Study on the Probability of
Achievement Level at Graduation
Achievement Level
Highesta Middlea
unadjusted adjustedb unadjusted adjustedb
OR 95% CI OR 95% CI OR 95% CI OR 95% CI
Relative Age
Q1 0.99 0.75–1.29 0.92 0.69–1.22 1.38* 1.05–1.82 1.27 0.95–1.69
Q2 1.04 0.78–1.37 0.98 0.73–1.32 1.38* 1.04–1.85 1.27 0.94–1.72
Q3 0.99 0.75–1.30 0.95 0.71–1.27 1.23 0.93–1.63 1.21 0.90–1.62
Q4 ref – ref – ref – ref –
Gender
Male 0.40* 0.32–0.48 0.34* 0.27–0.42 0.74* 0.60–0.91 0.60* 0.49–0.75
Female ref – ref – ref – ref –
Course
Sport 1.74* 1.38–2.20 1.59* 1.26–2.02 0.98 0.79–1.23 0.96 0.76–1.20
Health 0.40* 0.30–0.53 0.31* 0.23–0.42 0.26* 0.20–0.35 0.23* 0.18–0.31
Leisure ref – ref – ref – ref –
Track Status
Off track 0.83 0.68–1.02 1.12 0.90–1.39 1.04 0.85–1.26 1.20 0.97–1.48
On track ref – ref – ref – ref –
Note. a Compared to the Lowest achievement level category. b Controlling for all other independent
variables (relative age, gender, course-category, and track status). * Significant values. OR = Odds ratio.
95% CI = 95% Confidence interval. ref = referent category.
Table 5. The Influence of Relative Age, Gender, Course-Category and Track Status on the Probability of
Completing a Degree
Completeda
unadjusted adjustedb
OR 95% CI OR 95% CI
Relative Age Q1 1.13 0.84–1.48 0.98 0.74–1.31
Q2 1.14 0.85–1.54 1.02 0.75–1.38
Q3 1.04 0.78–1.38 0.95 0.71–1.27
Q4 ref – ref –
Gender Male 0.57* 0.46–0.71 0.49* 0.39–0.61
Female ref – ref –
Course Sport 0.82 0.64–1.05 0.80 0.62–1.03
Health 0.50* 0.38–0.65 0.42* 0.32–0.56
Leisure ref – ref –
Track Status Off track 1.61* 1.29–2.01 1.86* 1.47–2.34
On track ref – ref –
Note. a Compared to those who did not complete (i.e., graduate) their course. b Controlling for all other
independent variables (relative age, gender, course-category, and track status). * Significant values.
OR = Odds ratio. 95% CI = 95% Confidence interval. ref = referent category.
Relative Age Effects in Higher Education
59
Discussion
The purpose of the current study was (i) to examine the generalizability of the findings
presented in study 1 within a different context, and (ii) to examine the interaction of
relative age with gender trends and achievement-related trends in higher education.
Results from the UK sample are more ambiguous than those from Germany. Results
revealed no clear asymmetries favouring relatively older students in relation to course-
type selection or academic achievement once at University. However, among those
enrolled in courses with ‘health-related’ foci, relatively older students were significantly
underrepresented. This trend is difficult to account for. It is possible that females are more
likely to be enrolled in health-related courses than other course-types (i.e., sport and
leisure). More realistically, however, is that this trend was due to chance. Unlike the
findings reported by Billari and Pellizzari (2008), the current study did not find any
relationship between relative and attainment or the likelihood of completing versus not
completing courses. Factors such as gender, course-type and track status appeared to be
more influential on achievement and completion of courses. Again, this highlights the
importance of considering relative age influences in specific contexts, as different trends
may exist in different countries and even in different academic disciplines.
General Discussion
To our knowledge, these two studies are the first to attempt to examine whether relative
age in one domain (sport) can influence outcomes in another domain (education). Results
from the German sample (Study 1) suggest that relative age in sport is related, albeit
modestly (ω = 0.12), to the likelihood of pursuing a sports science degree in higher
education. The advantages observed for relatively older youths (for reviews see Cobley et
al., 2009a, and Musch & Grondin, 2001) may foster attraction to, and motivation for,
pursuing sports sciences in higher education. These results suggest that attributes
acquired as a result of annual age grouping policies in sport may influence outcomes later
in life (i.e., attending university).
While it was not investigated in this study, further studies should clarify whether positive
and negative experiences in childhood and adolescent sport affect psychological
constructs such as motivation, self-concept, self-efficacy and/or self-identity. Such studies
may help explain the etiology of the trends identified in the present data set, and help to
position relative age effects within a social psychological framework. Likewise, they may
identify how positive experiences and interactions in education relate to the choice of
entering higher education, or entering particular disciplines such as medicine or law.
Comparisons between the UK and Germany data suggest three things. First, that the
influence of relative age on higher education pursuits is dependent on context-specific
factors. For example, differences in the structure of UK and German ‘sports science’
University programs may explain the differences between the observed trends. For
Germany, the course can accurately be described as a ‘sports sciences’ program while
the sample from the UK was drawn from a more diverse spectrum of courses ranging from
leisure, business and management to physiology and biomechanics. The scope of
kinesiology programs (as compared to ‘sports science’ programs) may market to students
with a variety of interests, obtained from experiences beyond just sport participation,
thereby negating the influence of sport-specific relative age. In this regard it may not be
that relative age has no influence on pursuing sports studies in higher education, but that
the different structure of UK kinesiology university programs confound and obfuscate the
influence (if any) of relative age.
Another possible explanation for the discrepancies observed between German and UK
programs could relate to the existence of different cultural norms. Given that relative age
has been shown to influence sport participation within the UK, why does such an
advantage not precipitate an increased likelihood of pursuing sport-related studies in
N. Wattie et al.
60
higher education for relatively older members? It is possible that the culture of sport
participation within the UK does not implicitly include or promote higher education
pursuits as a facet or avenue for expressing intrinsic interest in sport. As a result, relative
age, via its influence on sport participation, has no influence on pursuits in higher
education. These points are speculative, and more research is needed within both
contexts (Germany and UK) in order to confirm and understand the findings of the current
studies.
While it is clear that relative age is one minor factor amongst many associated with higher
education, to date it has received little attention as an influence on choice and higher
education enrolment patterns. These results highlight the complex relationships between
relative age and developmental outcomes, and stress the need for further research. From
a policy perspective, the body of research on relative age effects in sport and education
continues to grow and highlights the need for equitable age grouping systems to diminish
discriminatory relative age effects.
Acknowledgments
At the time of writing Nick Wattie was supported by a doctoral research fellowship from
the Social Sciences and Humanities Research Council of Canada (SSHRC fellowship # 752-
2008-0280).
References
Abernethy, B., & Farrow, D. (2005). Contextual
factors influencing the development of
expertise in Australian athletes. Paper
presented at the 11th World Congress of
Sport Psychology, Aug 15–19 2005, Sydney,
Australia.
Abel, E. L., Sokol, R. J., Kruger, M. L., & Yargeau, D.
(2008). Birthdates of medical school
applicants. Educational Studies, 34, 271–275.
Allen, J. M., & Barnsley, R. H. (1993). Streams and
Tiers: the interaction of ability, maturity, and
training in systems with age-dependent
recursive selection. The Journal of Human Resources, 28, 649–659.
Ashworth, J., & Heyndels, B. (2007). Selection bias
and peer effects in team sports: The affect of
age grouping on earnings of German soccer
players. Journal of Sport Economics, 8, 355–
377.
Baker, J., Cobley, S., Montelpare, W. J., Wattie, N.,
Faught, B., & The Ontario Hockey Research
Group (2010). Exploring proposed
mechanisms of the relative age effect in
Canadian Minor Hockey. International Journal of Sport Psychology, 41, 148–159.
Baker, J., & Logan, A. J. (2007). Developmental
contexts and sporting success: Birth date and
birthplace effects in national hockey league
draftees 2000–2005. British Journal of Sports
Medicine, 41, 515–517.
Barnsley, R. H., & Thompson, A. H. (1988). Birthdate
and success in minor hockey: The key to the
NHL. Canadian Journal of Behavioural Science,
20, 167–176.
Barnsley, R. H., Thompson, A. H., & Barnsley, P. E.
(1985). Hockey success and birthdate: The
relative age effect. Canadian Association of
Health, Physical Education and Recreation
Journal, 51, 23–28.
Barnsley, R. H., Thompson, A. H., & Legault, P.
(1992). Family planning: Football style –
Relative age effects in football. International
Review for the Sociology of Sport, 27, 77–88.
Bedard, K., & Dhuey, E. (2006). The persistence of
early childhood maturity: International
evidence of long-run age effects. The
Quarterly Journal of Economics, 121, 1437–
1472.
Billari, F. C., & Pellizzari, M. (2008). The younger the
better? Relative age effects at University
(Discussion Paper No. 3795). Retrieved from
the Institute for the Study of Labor (IZA)
website: http://www.iza.org/en/webcontent/
publications/papers/viewAbstract?dp_id=37
95
Bookbinder, G. E. (1967). The preponderance of
summer-born children in E. S. N. classes:
Which is responsible: Age or length of infant
schooling? Educational Psychology, 9, 213–
218.
Brewer, J., Balson, P. D., & Davis, J. (1995). Seasonal
birth distribution amongst European soccer players. Sports Exercise Injury, 1, 154–157.
Carling, C., Le Gall, F., Reilly, T., & Williams, A. M.
(2009). Do anthropometric and fitness
characteristics vary according to birth date
distribution in elite youth academy soccer
players? Scandinavian Journal of Medicine &
Science in Sports, 19, 3–9.
Carroll, H. C. M. (1992). Season of birth and school
attendance. British Journal of Educational
Psychology, 62, 391–396.
Cobley, S., Abraham, C., & Baker, J. (2008). Relative
age effects on physical education attainment
and school sport, Physical Education and Sport
Pedagogy, 13, 267–276.
Relative Age Effects in Higher Education
61
Cobley, S., Baker, J., Wattie, N., & McKenna, J.
(2009a). Annual age-grouping and athlete
development: A meta analytical review of
relative age effects in sport. Sports Medicine,
39, 235–256.
Cobley, S., Baker, J., Wattie, N., & McKenna, J.
(2009b). How pervasive are relative age
effects in secondary school education?
Journal of Educational Psychology, 101, 520–
528.
Cobley, S., Schorer, J., & Baker, J. (2008). Relative
age effects in elite German football: A
historical analysis. Journal of Sports Sciences,
26, 1531–1538.
Côté, J., MacDonald, D. J., Baker, J., & Abernethy, B.
(2006). When ‘where’ is more important that
‘when’: birthplace and birthdate effects on
the achievement of sporting expertise.
Journal of Sports Sciences, 24, 1065–1073.
Daniel, T. E., & Janssen, C. T. L. (1987). More on the
relative age effect. Canadian Association of
Health, Physical Education and Recreation
Journal, 53, 21–24.
Delorme, N., & Raspaud, M. (2009). The relative
age effect in young French basketball
players: A study on the whole population.
Scandinavian Journal of Medicine and Science
in Sports, 19, 235–242.
Dudink, A. (1994). Birthdate and sporting success.
Nature, 368, 592.
Edgar, S., & O’Donoghue, P. (2004). The
distribution of season-of-birth among players
of the 2002 FIFA World Cup. Journal of Sports
Sciences, 22, 578–579.
Faul, F., Erdfelder, E., Lang, A. G., & Buchner, A.
(2007). G*Power 3: A flexible statistical power
analysis program for the social, behavioural,
and biomedical sciences. Behavior Research
Methods, 39, 175–191.
Fertig, M., & Kluve, J. (2005). The effect of age at
school entry on educational attainment in
Germany. (Discussion Paper No. 1507).
Retrieved from the Institute for the Study of
Labor (IZA) website: http://www.iza.org/de/
webcontent/publications/papers/viewAbstra
ct?dp_id=1507
Grondin, S., Deschaies, P., & Nault, L. P. (1984).
Trimestres de naissance et participation au
hockey et au volleyball [Trimester of birth
and participation in hockey and volleyball].
La Revue Québecoise de l’Activité Physique, 2,
97-103.
Grondin, S., & Koren, S. (2000). The relative age
effect in professional baseball: A look at the
history of major league baseball and at
current status in Japan. Avante, 6, 64–74.
Grondin, S., & Trudeau, F. (1991). Date de
naissance et ligue nationale de hockey:
analyses en function de différents parameters
[Date of birth and the National Hockey
League: Analyses of different parameters].
Revue des Sciences et Techniques des Activités
Physique et Sportives, 26, 37–45.
Helsen, W. F., Starkes, J. L., & Van Winckel, J. (2000).
Effect of a change in selection year on
success in male football players. American
Journal of Human Biology, 12, 729–735.
Helsen, W. F., Van Winckel, J., & Williams, A. M.
(2005). The relative age effect in youth soccer
across Europe. Journal of Sports Sciences, 23,
629–636.
Jimenez, I. P., & Pain, M. T. G. (2008). Relative age
effect in Spanish association football: Its
extent and implications for wasted potential.
Journal of Sports Sciences, 26, 995–1003.
Maddux, C. D. (1980). First-grade entry age in a
sample of children labelled learning
disabled. Learning Disabled Quarterly, 3, 79–
83.
Martin, R. P., Foels, P., Clanton, G., & Moon, K.
(2004). Season of birth is related to child
retention rates, achievement, and rate of
diagnosis of specific LD. Journal of Learning
Disabilities, 37, 307–317.
Montelpare, W. J., Scott, D., & Pelino, M. (1998).
Tracking the relative age effect across minor
amateur and professional ice hockey leagues.
In A. B. Ashare (Ed.), Safety in ice hockey (pp.
250–260). Philadelphia: American Society for
Testing Materials.
Mujika, I., Vaeyans, R., Matthys, S. P. J., Santisteban,
J., Goiriena, J., & Philippaerts, R. (2009). The
relative age effect in a professional football
club setting. Journal of Sports Sciences, 27,
1153–1158.
Musch, J. (2002). Birthdate and success in youth
soccer: Investigating the development of the
relative age effect. Sportonomics, 8, 22–28.
Musch, J., & Grondin, S. (2001). Unequal
competition as an impediment to personal
development: A review of the relative age
effect in sport. Developmental Review, 21, 147–
167.
Musch, J., & Hay, R. (1999). The relative age effect
in soccer: cross-cultural evidence for a
systematic discrimination against children
born late in the competition year. Sociology of
Sport, 16, 729–735.
Schorer, J., Cobley, S., Büsch, D., Bräutigam, H., &
Baker, J. (2009). Influences of competition
level, gender, player nationality, career stage
and playing position on relative age effects.
Scandinavian Journal of Sport Science and
Medicine, 12, 720–730.
Sherar, L. B., Baxter-Jones, A. D. G., Faulkner, R.A .,
& Russell, K. W. (2007). Does physical maturity
and birth date predict talent in male youth ice
hockey players? Journal of Sports Sciences, 25,
879–886.
Sherar, L. B., Bruner, M. W., Munroe-Chandler, K. J.,
& Baxter-Jones, A. D. G. (2007). Relative age
and fast tracking of elite major junior ice
hockey players. Perceptual and Motor Skills,
104, 702–706.
Simmons, C., & Paull, G. C. (2001). Season-of-birth
bias in assocation football. Journal of Sports
Sciences, 19, 677–686.
Ste-Marie, D. M., Starkes, J. L., Cronin, A., &
Fletcher, H. (2000). The relative age effect: A
‘flip-flop’ phenomenon in gymnasts.
Proceedings of the Canadian Society for
Psychomotor Learning and Sport Psychology
Conference, Waterloo (ON), Canada.
Tabachnick, B. G. & Fidell, L. S. (2007). Using
N. Wattie et al.
62
Multivariate Statistics. Boston: Allyn & Bacon.
Thompson, D. (1971). Season of birth and success
in the secondary school. Educational
Research, 14, 56–60.
Thompson, A. H., Barnsley, R. H., & Battle, J. (2004).
The relative age effect and the development
of self-esteem. Educational Research, 46, 313–
320.
Thompson, A. H., Barnsley, R. H., & Dyck, R. J.
(1999). A new factor in youth suicide: The
relative age effect. Canadian Journal of
Psychiatry, 44, 82–85.
Thompson, A. H., Barnsley, R. H., & Stebelsky, G.
(1991). ”Born to play ball”: The relative age
effect and major league baseball. Sociology
of Sport Journal, 8, 146–151.
Till, K., Cobley, S., Wattie, N., O’Hara, J., Cooke, C.,
& Chapman, C. (2010). The prevalence,
influential factors and mechanisms of relative
age effects in UK Rugby League. Scandinavian Journal of Medicine & Science in Sports, 20,
320–329.
Vincent, J., & Glamser, F. (2006). Gender
differences in the relative age effect among
US Olympic development program youth
soccer players. Journal of Sports Sciences, 24,
405–413.
Wallingford, E. L., & Prout, H. T. (2000). The
relationship of season of birth and special
education referral. Psychology in the Schools,
37, 379–387.
Wattie, N., Baker, J., Cobley, S., & Montelpare, W. J.
(2007). A historical examination of relative
age effects in Canadian hockey players.
International Journal of Sport Psychology, 38,
178–186.
Wattie, N., Cobley, S., & Baker, J. (2008). Towards a
unified understanding of relative age effects.
Journal of Sports Sciences, 26, 1403–1409.
Wilson, G. (1999). The birthdate effect in school
sports teams. European Journal of Physical
Education, 4, 139–145.
The Authors
Dr. Nick Wattie is a post-doctoral fellow in the School of Kinesiology and Health
Science at York University, Canada. His research examines factors that influence
the developmental of expertise in sport and the factors affecting positive
human development in education and sport.
Dr. Jörg Schorer is a post-doctoral fellow at the University of Muenster in the
Institute of Sport and Exercise Sciences. His research considers the
development and maintenance of expertise across the life-span from multiple
perspectives.
Dr. Maike Tietjens is a professor at the University of Münster in the Institute of
Sport and Exercise Sciences. Her research focus is on the development and
methodological tracking of social support, self-concept, and motor ability in
childhood and adolescence in the contexts of sport, exercise and Physical
Education.

Relative Age Effects in Higher Education
63
Dr. Joe Baker is an associate professor in the School of Kinesiology and Health
Science at York University, Canada. His research examines the factors affecting
athlete development across the lifespan.
Dr. Steve Cobley (born 1977) is a Senior Lecturer in Skill Acquisition and Sport
Psychology within the Faculty of Health Sciences at The University of Sydney
(Australia). He is also a Chartered Psychologist with the British Psychological
Society. His research interests focus upon developmental factors that constrain
learning, performance and attainment. Dr. Cobley is also a joint editor of:
‘Talent identification & Development in Sport: International Perspectives’
(2011).

N. Wattie et al.
64
Influence of the Gifted on Economy
65 Talent Development & Excellence
Vol. 4, No. 1, 2012, 65–88
The Emergence of a New Research Direction at the
Intersection of Talent and Economy: The Influence of
the Gifted on Economy Larisa V. Shavinina*
Abstract: This article opens a new, interdisciplinary and multidisciplinary research
direction in the study of talent: the study of talent and economy. The progress of human
civilization is based on scientific, technological, educational, political, and commercial
achievements of the mind of its most talented individuals. The gifted and talented are
thus mainly responsible for innovations worldwide. The degree of societal interest in
talented individuals will hence be eventually reflected in the level of innovations in
society, that is, in its economic prosperity. Innovation is hence strongly related to
giftedness, and giftedness is closely related to economy and public policy and
therefore should be among the top priorities on any government’s agenda. The case-
study of Silicon Valley as a region of excellence based on giftedness is presented as an
illustration of the impact of talented individuals on economy. Talent and economy is an
unexplored research subject and a promising scientific trend.
Keywords:
talent, Silicon Valley, excellence, compensatory mechanisms, innovation, regions of
excellence, economic prosperity
The Talent-Based Economy: Introduction to Some Important Issues
The publications on talent are full of statements like “the gifted and talented children are
our best resource available,” “highly able kids are the most precious asset that any
country possesses,” “individuals with extraordinary developed intelligence and creativity
are the most valuable gift that humankind has,” and so on (Kholodnaya, 2007). The bottom-
line is that the gifted and talented represent a unique resource in a global society. But
what is behind this? In fact, all these statements are eventually linked to economy. That is,
the growing-up gifted and talented will make great scientific discoveries, technological
inventions, or produce ideas with money-making potential leading to the creation of new
ventures and thus increasing employment and economic prosperity. Scientific talent and
entrepreneurial giftedness are cases in point. Even achievements of those gifted and
talented individuals which do not look like to be directly associated with economy, are
actually related to it. For example, scientific discoveries that save lives of many people
significantly enhance the level of the well-being of any society even if they do not result in
immediate or great financial outcomes. Similarly, amazing musical symphonies enrich
inner worlds of people, inspire and motivate them to do their best and thus are also
contributing to the well-being of countries. Therefore, any kind of talent contributes to the
economic prosperity of human beings.
It should be noted that some governments around the world indeed understand the
economic arguments in favour of highly able children and adolescents and try to develop
the appropriate policies as well as significantly invest in gifted education. For instance,
the government of Singapore understands it very well. A small country with a lack of
natural resources has been realizing that the gifted and talented citizens are its most
* Département des sciences administratives, Université du Québec en Outaouais, Pavillon
Lucien-Brault, 101, rue Saint-Jean-Bosco, Case postale 1250, succursale Hull,
Gatineau,Québec, J8X 3X7, Canada. Email: [email protected]
ISSN 1869-0459 (print)/ ISSN 1869-2885 (online)
2012 International Research Association for Talent Development and Excellence
http://www.iratde.org
L. V. Shavinina 66
important resource. As a manifestation of this is the fact that Singapore sent 70 delegates
to attend the 2007 World Giftedness Conference in the UK. This is an amazingly high
number in the proportion to all 900 delegates registered for this Conference.
Another manifestation of governments’ efforts in developing talents is a widespread
interest in establishing their own versions of the Center for Talented Youth (CTY), which
famous Julian Stanley created in 1979 at the Johns Hopkins University in Baltimore, USA.
Such Centers were already created in Ireland, Spain, Malaysia, Hong Kong and are in the
process of creation in Saudi Arabia, China, United Arab Emirates, and Brazil.
What Does Literature Tell Us About Talent and Economy?
With a few exceptions (Clinkenbird, 2007; Florida, 2002, 2005), there is no literature on the
topic of talent and economy. (And to be more accurate, Florida’s (2002, 2005) research is
about the role of creative class in urban economic development). As an expert on
giftedness, Clinkenbird (2007) analyzed economic arguments in favour of gifted
education and found that future contributions of today’s talented individuals to science,
technology, and business are the soundest ones and governments should generously
invest in educational programs for highly able children.
A regional economist, Florida (2003, 2005) has written a lot about the critical role of
creative and talented classes in developing and transforming societies. Talent and
economy is a new, unexplored research topic and a promising scientific direction.
It looks like the best-known, unquestionable example of the impact of talented individuals
on the global economy is the case of Silicon Valley in California, USA. This is the subject
from which my research on talent and economy started. Business specialists, economists,
regional geographers, policy researchers, and many other scientists working in various
disciplines have been trying for decades to explain the phenomenon of Silicon Valley.
Nevertheless, they are far from succeeding. Governments around the world have been
attempting to reproduce this phenomenon in the form of Silicon Valley North, Silicon
Alleys, Silicon Irelands, and so on. However, they did not reach remarkable results. I think
that talent is behind the success of Silicon Valley, that is, talented people. This article will
explain why and how it happened. This is probably the first attempt to explain the Silicon
Valley phenomenon via giftedness and high abilities in general. This shows how
giftedness and economy come closely together and lead to amazing achievements. Before
presenting our findings, traditional accounts of the Silicon Valley phenomenon should be
considered.
The Silicon phenomenon was, is, and will be an extremely important phenomenon in the
accelerated technological, scientific, and economic development of countries. The ever-
increasing role of clusters in an era of global competition (Porter, 1998a, 1998b) fuels
researchers’ interest in further understanding the world’s prominent Silicon region,
California’s Silicon Valley (Kenney, 2000b; Lee et al., 2000). Its success1 – that made it one
of the most innovative and wealthy areas on the globe – inspires governments all around
the world to establish Silicon Valleys, Alleys, and Islands in their own countries in order to
promote economic development and prosperity (Cohen & Fields, 1999; Mathews, 1997,
1999; Shavinina, 2004).
Today people increasingly realize that the Silicon phenomenon is even more important
than in the past. The New Economy is a knowledge-based economy. In this kind of context
innovation conceptualised as a particular transformation of knowledge and information
leading to new ideas – which are beginning to rule the global economy – products and
services, is the key process that characterizes the New Economy (Shavinina, 2003; Swan et
al., 2003). Successful, creative ideas, with money making potential produced by
companies in Silicon regions and which resulted in innovations, generate long term,
sustainable economic prosperity. Due to this, the Silicon phenomenon in general – and
California’s Silicon Valley in particular – have been receiving considerable attention from
policy makers, management and business scholars, innovation researchers, economists,
Influence of the Gifted on Economy
67
urban planners, economic geographers, sociologists, and futurists. Taken together, they
provided a wide range of explanations for the “secret” of Silicon Valley, such as complex
social and technical networks rooted in an industrial community (Saxenian, 1994); close
proximity to Stanford and other research universities; labour mobility (Angel, 2000);
advanced technology, plenty of venture capital, and entrepreneurship; specific norms and
culture which predetermine the willingness to create new companies (Weiss & Delbecq,
1990); a “social structure of innovation” (i.e., an interactive set of institutions dedicated to
facilitating the commercialization of new technological innovations by new companies;
Florida & Kenny, 1999); a network of organizations specialized in the creation of new firms
(Kenny, 2001); the specific nature of the social capital on which Silicon Valley was built and
through which it continues to construct itself ” (Cohen & Fields, 1999); an “ecosystem”
consisting of various institutions and skill sets embodied in individuals united by an
entrepreneurial culture (Bahrami & Evans, 2000); a set of two separate economies: one
consists of existing firms, another encompasses organizations dedicated to the
development of start-ups (Kenny & von Burg, 2000); and others2. Some of these
explanations intersect with one another, which is not surprising in the case of such a
multidimensional and multifaceted phenomenon as Silicon Valley. Altogether, they mainly
describe the know-what part of the “secret” of Silicon Valley, little is known about its know-
how part, which looks like the most difficult part in understanding the phenomenon of
Silicon Valley.
Researchers from various disciplines therefore contributed to the understanding of this
phenomenon. It appears that only psychologists have not yet provided their accounts of
the phenomenon of Silicon Valley. Nonetheless, the time is ripe for psychological
explanations. Why? There are at least a few interrelated explanations for this.
First, many of the above-mentioned perspectives on the “secret” of Silicon Valley concern
human behaviour – both the behaviour of individual (e.g., entrepreneurs) and collective
(e.g., firms, intermediary organizations) actors – that is the subject of psychological
analysis. It is interesting to notice that economists come very closely to psychological
constructs when they try to explain the success of Silicon Valley. Thus, Porter includes
motivation 3 along with knowledge and relationships, which form a competitive advantage
of clusters in a global economy (Porter, 1998). The above-mentioned account by Weiss &
Delbecq (1990) comprises willingness to create new firms. Cohen & Fields (1999)
describe Silicon Valley as “a world of independent – even isolated – newcomers;” one of
its distinguishing characteristics is “the rampant individualism among its most talented
workers”; or “me-first” individualism (Rogers & Larsen, 1984). In general, the talent pool of
professionals is one of the crucial components of Silicon Valley. Bahrami & Evans (2000)
emphasize skill sets or expertise embodied in individuals as an essential part of Silicon
Valley. Discussing why it was difficult for social sciences (e.g., economics and sociology)
to explain entrepreneurship in the case of Silicon Valley, Kenney (2001) pointed out, “It
appears so idiosyncratic and individualistic.” Finally, many scholars emphasized that
networks and networking – important constructs of social psychology – are essential
characteristics of the magic of Silicon Valley (Rogers & Larsen, 1984; Saxenian, 1994)4. This
brief listing shows that psychological constructs are really included in the existing
explanations of the phenomenon of Silicon Valley. The list also demonstrates that the
region’s “secret” cannot be understood only in terms of economics and related concepts.
The second reason is related to the innovativeness of Silicon Valley. The region attracts
worldwide attention mainly as a result of its phenomenal capacity to produce a constant
flow of high tech innovations. Entrepreneurs in Silicon Valley recognized a long time ago
that the best way to be at the cutting-edge of business is through innovation. Global
competition is increasingly harsh and companies must continuously bring innovative
products, processes, and services to the worldwide market. As any innovation originates
from within the individual, that is, from his or her new idea(s), companies hence need
innovative people whose novel ideas are a necessity for the companies’ success.
Employees of exceptionally innovative ability thus remain an extremely important source
L. V. Shavinina 68
of innovation. Since the foundation of innovation is ideas, and it is people who “develop,
carry, react to, and modify ideas” (Van de Ven, 1986), psychology in general and
psychology of high abilities5 in particular have an important role to play in explaining the
phenomenon of such an innovative region as Silicon Valley.
Taken together, the two reasons indicate the need for psychological perspectives on
Silicon Valley’s “secret,” which would complement and extend the existing economic and
related approaches. Based on a synthesis of the literature, this article presents a
psychological perspective, which fills an apparent niche in understanding Silicon Valley,
especially in understanding the know-how part of its “secret” and opens a new direction in
research on talent and economy. In light of this perspective, Silicon Valley is a region of
excellence, where actual actors are talented individuals who try to do their very best,
sometimes surpassing themselves, or they compensate for a lack of excellence in
something. This perspective in no way rejects the above-mentioned explanations of the
phenomenon of Silicon Valley. Rather, it enhances and deepens the available explanations.
Such a complex phenomenon as Silicon Valley requires multidisciplinary and
interdisciplinary efforts in the successful understanding of its nature.
The Talent-Based Economy Is Beyond the “Secret” of California’s
Silicon Valley
If we ask ourselves, what is so exceptional about Silicon Valley that stimulates many
countries to follow it as a prototypical model, the ultimate answer is more or less known:
This is the Silicon Valley’s exceptional capacity to generate and nurture technological
innovations leading to the birth of dozens of the world’s most successful high-technology
companies, such as Hewlett-Packard, Apple Computers, Sun Microsystems, Intel,
Advanced Micro Devices (AMD), Silicon Graphics, Cisco, Yahoo, 3Com, and many others.
In light of the conventional wisdom of economists its general success formula is also more
or less known: entrepreneurship, relatively easily accessible venture capital, institutions of
higher education, which supply talented employees and conduct research, intermediary
organizations, and social and technical networks (Kenney, 2000b; Rogers & Larsen, 1984;
Saxenian, 1994). According to Rogers & Larsen (1984, p. 234), “The most important single
factor in the rise of a “Silicon Valley” is entrepreneurial fever.” Nevertheless, this is not the
whole story. This article proposes a new perspective on the phenomenon of Silicon Valley.
It focuses on those less evident ingredients of the region’s triumph, which might be
referred to as hidden mechanisms. The word “hidden” does not mean that the facets
presented below were not mentioned in the literature; they were. However, they were not
considered as essential factors when compared to venture capital, entrepreneurship,
universities, social and technical networks, and so on. Specifically, it will be shown that
these hidden mechanisms were equally important in building the success story of Silicon
Valley. This is the real novelty of the proposed explanation.
Concepts and Definitions
The most important mechanism, which is responsible for the Silicon Valley’s “secret,” is
excellence of its gifted entrepreneurs, broadly defined. The term excellence refers to
perfection, “achievement far above average” (Trost, 2000, p. 317). This is the common
denominator of all possible definitions of excellence (Hunt, 1983; National Commission on
Excellence in Education, 1983; Feldhusen, 1984; Tannenbaum, 1986). It seems reasonable
to differentiate between excellence or potential excellence and excellence in execution.
Any individual is excellent in something. For example, one may have creative ideas for
increasing company profits, but until implemented, we cannot give merit to excellence in
execution. For instance, two renowned publishing companies simultaneously receive a
proposal for publishing a potentially important book. The vice-president of the first
company declines, stating “lack of market appeal”. However, the second company
decides to publish the book, only to become a bestseller. Both companies are excellent,
Influence of the Gifted on Economy
69
due to their status in the realm of publishing business. Yet, the second company exercised
excellence in execution: its editors made the right decision in detecting the merits of the
book, resulting in increased company profits.
Does it mean that the second company is always excellent? Definitely, not. Differentiating
between temporal or situated excellence and more or less permanent excellence is
appropriate here. When the book became a bestseller, its author tried to bring new ways
to advertise it to the attention of the marketing manager. However, the manager did not
tap new opportunities. Further differentiation between individual excellence and corporate
excellence is warranted as well. The marketing manager in the above example certainly
did not perform excellently. However, he could have perfect reasons to not follow the
author’s ideas. “The book is already a bestseller,” is one of them. Likewise, the vice-
president of the first company had sufficient reason not to publish the book. Such nuances
in understanding the term excellence show that it does not equate to success. The term
success refers to “the favorable result, attainment of what is desired or intended; the issue
or result of an undertaking” (The Concise English Dictionary, 1992). One may be perfectly
excellent in something (e.g., knowledge of French grammar), but unless it is sensibly
done well (e.g., speak French fluently), one is not successful. Excellence per se does not
constitute success. Excellence in execution of the Silicon Valley’s talented entrepreneurs is
thus a key term and the focal point in the explanation of the Valley’s phenomenon.
Signs of the Silicon Valley Excellence in Action
Nearly every generation6 of the Silicon Valley’s entrepreneurs and their start-up
companies have been constantly excellent in many aspects of their business activity. As
many of them did not have managerial backgrounds, their understanding of excellence
was often based on a simple, uncompromising edict: do your best. They indeed attempted
perfection in all aspects of their professional activities, sometimes surpassing themselves.
It looks like they were internally motivated to make every effort to achieve excellence.
Rogers & Larsen (1984) found that, “It isn’t enough just to be hard-working and dedicated.
Meritocracy reigns supreme in Silicon Valley and that means knowing what you are
doing… It’s what you know; intelligence is mandatory…” (p. 139). If intelligence of
talented entrepreneurs is responsible for the what part of the success, then their
excellence is responsible for its how part.
Tom Peters (1988) wrote, “There are no excellent companies” (p. 3). This is probably
correct only in the case of large, mature corporations. Nevertheless, this is not true in the
case of recently created firms. Start-ups, being by definition at the early, critical stage of
their development (the so-called “sensitive periods” in organizational development), try
to attempt perfection in all aspects of their business activities. The reality is that there are
always people in any company who really want to excel.
There are definitely many multifaceted, sometimes overlapping manifestations of the
excellence of key players in Silicon Valley. The overlapping occurs because companies
were excellent in many – if not in all – aspects of their business activities. As Robert
Noyce, one of the founders of Intel and its vice-chairman, put it, “I believe that Intel has
been a very successful company, that we have innovated in terms of how things are done, in
terms of management styles, and in terms of culture as well as product…” (italics added;
Salerno, 1980, p. 129). The following distinct and at the same time interrelated
manifestations of excellence have turned Silicon Valley into a versatile system of
excellence.
1. All key players, and especially entrepreneurs, in Silicon Valley highly value
excellence as a worthy goal per se. As one semiconductor executive who has worked
in Silicon Valley for three decades told, “Here in Silicon Valley there is far greater
loyalty to one’s craft than to one’s company. A company is just a vehicle, which allows
you to work. If you are a circuit designer it is important for you to do excellent work.
If you cannot in one firm, you will move on to another one” (Saxenian, 1994, p. 36)7.
L. V. Shavinina 70
This is why they frequently changed jobs, and high job mobility was the norm, not
the exception. Intel is a good example. It was known for recruiting high achievers to
work in the company and for its encouragement of excellence through competitive
achievement (Salerno, 1980, p. 124).
Silicon Valley companies relied, to a significant extent, on external suppliers, which
acquired a great deal of expertise in developing certain products or processes.
Relying on best experts and top talents in the field means nothing else than relying
on excellence of the gifted. Thus, Frederick Terman, an electrical engineering
professor at Stanford University, who is considered the godfather of Silicon Valley,
realized this many years ago when he proposed a special strategy for “steeples of
excellence.” According to Terman, “Academic prestige depends upon high but
narrow steeples of academic excellence, rather than upon coverage of more modest
height extending solidly over a broad discipline” (quoted in Rogers & Larsen, 1984,
p. 36). In a similar way one engineer described the talent of employees in his small
R&D company: “…I work with extremely bright and capable people who move
quickly, both intellectually and conceptually. I have to use every wily trick I can think
of just to survive” (Rogers & Larsen, 1984, p. 139). Saxenian (1994) concluded that
shared commitment to technological excellence unified Silicon Valley’s community
even under persistent competitive pressure.
2. Talented entrepreneurs in the Silicon Valley created an exceptionally democratic
atmosphere or humanistic culture in their start-up companies, rejecting the idea of a
social hierarchy and any social distinctions. This is one of the distinguishing
characteristics of the gifted and talented. Specifically, entrepreneurs did their best
in eliminating the usual boundaries between employers and employees and
between corporate functions within the company. They refused such things as
executive offices, special parking lots, executive dining rooms, and other privileges
for top management. As Robert Noyce pointed out, “If Intel were divided into
workers and bosses, with the implication that each side had to squeeze its money
out of the hides of the other, the enterprise would be finished. Motivation would no
longer be internal; it would be objectified in the deadly form of work rules and
grievance procedures” (Saxenian, 1994, p. 56). This specific culture made Intel Intel
(Salerno, 1980, p. 123). Intrinsic motivation is another key characteristic of the gifted.
It is quite appropriate to notice that talented entrepreneurs in the Silicon Valley not
simply initiated the democratic atmosphere in their companies; they were excellent
in supporting this atmosphere in all possible manifestations. For instance, they
treated people fairly, trusting them and in their ability to produce innovative ideas,
and granting them an exceptionally high extent of professional freedom to execute
on these ideas, all while rewarding their work generously. Rogers & Larsen (1984, p.
146) found that “being nice to one’s employees with financial rewards, exercise
facilities, and calling them by their first names seems to be good business sense in
Silicon Valley.” It does not contradict the fact that Silicon Valley’s people were
internally motivated to make every effort to achieve excellence. Rather, all the high-
powered financial incentives that were part of the standard package, the lavish
benefits, and the like constitute the external motivation that significantly increased
the individual’s internal motivation.
It means that talented entrepreneurs intuitively applied a common sense wisdom
known for centuries: treat all as you want to be treated. That is, they did their best in
promoting a sense of teamwork, open and informal communication, initiative, and a
participative style well before experts on project team management figured out that
these are the optimal conditions for successfully realizing projects and crucial
factors for high performance teams (Bennis & Biederman, 1997; Hershock, Cowman,
& D. Peters, 1994; Katzenbach & Smith, 1993). As one of the Silicon Valley’s executives
noticed, “The most important communications that occur in our company are
informal, the ad hoc meetings that occur when we walk around the plant. Structured
Influence of the Gifted on Economy
71
meetings held between 2:30 and 3:30 P.M. on specific topics really are atypical”
(Saxenian, 1994, p. 54). It further means that Silicon Valley’s entrepreneurs
successfully managed not only technological innovations in their companies; they
also did their best in managing people, the human – and critically important – side
of any business (Katz, 1997).
The evident consequence of the democratic and creative atmosphere was not just a
group of people working together in the same company, but a community with the
common objectives and team spirit, and passionate employees with a commitment
to company goals. Only in such an informal environment employees could do their
best: be excellent in their respective roles, and outperform themselves by
constantly producing great ideas and working long hours to implement them into
practice in the form of new products, processes, and services. It was a chain
reaction: the excellence in one direction initiated by top management led to
excellence in many other directions, critical for the company’s success and
prosperity. The rule was therefore simple: if top management did its best (from the
point of view of common sense), employees did their best, too.
Another consequence of the democratic atmosphere or the humanistic culture in
Silicon Valley’s companies was increased motivation or enthusiasm in employees. As
one engineer noticed, “… We were all treated well, and there was a sense that
everyone knew what was going on and everyone could get a piece of the wealth
through stock options. Our attitude was ‘we are all in this together, so let us work
hard and let us play hard’” (Saxenian, 1994, p. 55). In this light it is not surprising at
all that many observers felt companies in Silicon Valley demonstrated a unique
management style (Rogers & Larsen, 1984, p. 146). This is because senior managers
in those companies were talented individuals.
3. Talented entrepreneurs in Silicon Valley were also excellent in creating decentralized
organizations, which were especially appropriate for rewarding individual initiative
and creativity and keeping the focus and responsiveness of start-up companies. For
instance, Cypress Semiconductor demonstrated an exceptionally innovative
approach in this regard. When it reached $100 million in sales, the company adopted
a venture capital model. Its CEO, T. J. Rodgers, saw his goal to “become a $ 1 billion
company made up of ten loosely linked $100 million subsidiaries. The four
subsidiaries… receive cash, management advice, and contacts (as in traditional
venture capital arrangement), as well as access to one another’s sales and
distribution channels and fabrication facilities” (Saxenian, 1994, p. 196). Such
excellence in decentralization of their companies allowed talented entrepreneurs to
develop and introduce innovative products faster than their more integrated, large
competitors. For example, Cirrus Logic and Chips and Technologies shortened their
development times to 9 months in comparison to more than 2 years, the normal new-
product lead-time in the industry of the day (Saxenian, 1994).
Likewise, when Sun became a $3.5 billion company in 1990, the company broke
itself into five companies. The idea behind such decentralization was to bring the
market “inside the company.” The management of each company or “planet” were
granted full responsibility for profit and loss and their own independent sales force.
Interestingly, these five companies were stimulated to look for business
opportunities even if their actions might harm another Sun planet. Saxenian
provided examples of how Sun companies worked in this direction (Saxenian, 1994).
In this way Sun successfully followed common sense marketing wisdom that states:
customers would better identify than managers as to where Sun was competitive and
really added value, and where it was not and should hence rely on external partners
to continue to be a radically innovative company.
Rogers & Larsen concluded that the goal of rapidly growing large companies in
Silicon Valley is to retain the entrepreneurial spirit of the small company. They found

L. V. Shavinina 72
that a favoured way to do this is by decentralization, delegating greater
responsibility to managers. Thus, “when a division reaches 1,500 employees at
Hewlett-Packard, it becomes a separate administrative unit, and employees are
encouraged to identify with the division rather than with the H-P worldwide
monolith” (Rogers & Larsen, 1984, pp. 145–146).
These examples demonstrate a great influence of decentralized organizational
structures on the ability of talented individuals to constantly generate technological
breakthroughs. This is why one CEO in Silicon Valley recommended: “Avoid vertical
integration like the plague. Vertical integration forces a company to build in a high
fixed cost, which assures loss of profitability when volume drops…” (Saxenian, 1994,
p. 125).
Nevertheless, an interesting question might arise. How is excellence related to
decentralization when Silicon Valley companies continuously re-organize and try to
strike a dynamic balance between centralization and decentralization? The correct
answer would probably be that excellence is also about an endless search for new
ways to be excellent. As mentioned above, it is impossible to discuss every sub-
manifestation of Silicon Valley’s key players’ excellence in this article. If company X
is excellent in decentralization, which contributes to its success, then that is fine. If
company Y needs a dynamic balance between centralization and decentralization in
order to succeed, then the company should be excellent in this dialectical balance.
No facet of one’s excellence is important per se (e.g., decentralization, rapid
prototyping, constant flow of innovation, and so on); but constant excellence in each
of these facets. The “know-what” part plays a relatively secondary role in
comparison to the functional “know-how” role.
4. All key players in the Silicon Valley were excellent in developing intensive informal
communication networks, which supported collaboration and stimulated
experimentation (e.g., creativity), that transcending company boundaries. For
instance, they openly communicated with competitors. Openness to everything new
is a distinguishing characteristic of talented individuals. They do not afraid anything
(Shavinina, 1995). As one experienced CEO said, “This is a culture in which people
talk to their competitors. If I had a problem in a certain area, I felt no hesitation to
call another CEO and ask about the problem – even if I did not know him…”
(Saxenian, 1994, p. 33). Another executive added, “…I have senior engineers who
are constantly on the phone and sharing information with our competitors. I know
what my competitors say in their speeches and they know what I say in private
conversations” (Saxenian, 1994, pp. 36–37). Frequent face-to-face communication is
needed to sustain successful collaboration. Foreigners were very impressed by such
extreme openness and informal communication networks. As one German engineer
recalled, “I was sent by my company to visit our representative in Sunnyvale, in
order to get help with a particular technical problem… Our guy had part of the
answer, and he knew where to find the rest of the information. After work, he took me
to a bar in Silicon Valley. Then he called over engineers from adjoining tables, who
were acquaintances of his. They really enjoyed telling us what to do. By 9 pm, I had
the solution to our company’s problem. The next morning I flew back to Stuttgart. I
was really amazed at how freely people cooperate in California” (Rogers & Larsen,
1984, p. 84).
5. Open informal communication – a distinguishing characteristic of talented people –
led to high-trust business relationships, which, in turn, resulted into accelerated
speed of information exchange. As one manager at Apple noted, “We have found you
do not always need a formal contract… If you develop trust with your suppliers, you
do not need armies of attorneys” (Saxenian, 1994, p. 149). Fast tempo of information
exchange explains in part Silicon Valley’s competitive advantage in generating high
tech innovations. Nolan Bushnell – a talented entrepreneur in all respects –
Influence of the Gifted on Economy
73
exemplified this point in a following way: “There’s a tremendous amount of
networking here in Silicon Valley, unmatched anywhere else. I recently visited a
group of engineers in London who were working on a new product in competition
with a group here in Silicon Valley. Both started at the same time, but the Silicon
Valley team got the jump by six months. Our group included an engineer that had a
friend working at Intel. He smuggled out a couple of prototypes of a new chip that
was just what they needed. The chip was soon to be on the market, but it wasn’t yet
in the catalog. Intel was very happy because there were some immediate buyers.
Just that six months shows that we have tremendous advantage here. That’s why
Silicon Valley is always ahead” (Rogers & Larsen, 1984, p. 80).
Key players in the Silicon Valley were excellent in making quick decisions based on
their intuition. Intuition is an important part of the extracognitive abilities of talented
individuals in general, and of gifted entrepreneurs and talented managers in
particular. One observer emphasized “intuitive, quick-fire approach” in Silicon
Valley, pointing out that “tactical decisions that take six weeks in Boston can take
anywhere from six days to six nanoseconds in Cupertino…” (Saxenian, 1994, p. 68).
As one venture capitalist noted, “Somehow, companies in California get things done
faster, deals go down faster… they seem to run with technology faster; each year we
are spending money faster there” (Saxenian, 1994, p. 105; italics added). It is
appropriate to notice that a quick and accurate decision-making process, or speed
of human information processing, is considered one of the key characteristics of
talented individuals (Shavinina & Kholodnaya, 1996).
Here one can see the chain reaction again: The timely new information received
from reliable personal networks was certainly more important in fast changing
industry than traditional, but less timely professional journals and meetings at
conferences. As one Silicon Valley executive observed, “There is an absolute desire
to be highly informal on the West Coast. Individuals find it easy to communicate
quickly. This informality allows us to share consensus and move rapidly” (Saxenian,
1994, p. 54; italics added). This quick decision-making process and informality –
another distinguishing characteristic of talented individuals – led to the general fast
pace of business activity in Silicon Valley that, in its turn, had many manifestations
(e.g., the quick tempo with which new companies were spun off from Fairchild
Semiconductor and other large corporations).
6. Talented entrepreneurs in the Silicon Valley were excellent in cooperation, in
developing habits of informal cooperation and a wide range of cooperative
practices. It was their way of life: their way to successful continuous innovations in an
environment of high technological volatility. As Silicon Graphics CEO told, “Our
engineers jointly design products with other companies. We do not worry if they go
and sell them to our competitors. Our whole style is not to compete defensively, but
to take the offensive. The world is changing too fast to just try to defend your
position. In order to keep up with change, you have to be on the offensive all the
time… The key is to have products that are good” (Saxenian, 1994, p. 150). Silicon
Graphics was not an exception. As one AMD executive pointed out, “AMD has the
reputation of being close to our customers, by helping them design their systems
around our chips…” (Rogers & Larsen, 1984, p. 49).
They did not want to collaborate for the sake of it; they wished to gain the best from
cooperation. This strive for excellence strategy rewarded all players involved in
collaboration. Individuals and companies in Silicon Valley participated in joint
problem solving and were mutually interested in one another’s success. This is an
important characteristic of talented people.
7. Talented entrepreneurs were exceptionally excellent in creating an open business
environment, both inside and outside their companies, that accelerated the
exchange of know-what and know-how. It manifested itself, for instance, in open
L. V. Shavinina 74
communication that guaranteed open knowledge sharing and fast exchange of
information and in openness to risk-taking, both at the levels of individuals,
companies, and technological community as a whole. Openness to everything new
is a distinguishing characteristic of the gifted. Thus, at Intel, when the company was
smaller, Robert Noyce and Gordon Moore had lunch every Thursday with a random
group of employees. Employees were encouraged to say whatever they think. For
example, a new engineer was supposed to challenge Noyce or other engineers with
differing ideas. Later, when Intel became large, it began to break down. However,
the tradition was set up and lunch discussions continued to be held at smaller group
levels (Salerno, 1980, p. 125). Another executive compared the specific business
environment in Silicon Valley with that of other regions in the following way: “The
communication patterns are clearly different in Silicon Valley. There is far more
openness and much less worrying about whether someone goes around you. There
is not only a tendency not to follow channels, there is a deliberate attempt to
stimulate a wide variety of ideas. Innovations bubble up in unexpected places.
Champions receive support from unexpected sponsors…” (Saxenian, 1994, p. 54).
8. Such intensive informal communication networks, democratic atmosphere or
humanistic culture, and open business environment provided a strong foundation for
excellent flourishing of creativity. As one gifted executive noted, “…a management
style that permits geniuses to contribute is important. If you were to look at why GE
and RCA have failed [in semiconductors], it is because their organization was too
disciplined and unable to respond quickly to true innovation” (Saxenian, 1994, p. 82).
True creativity, which leads to innovations, cannot prosper in highly disciplined
environment (Amabile, 1998; Kiely, 1993; Lehr, 1979; Mumford, 2000). Creative
giftedness flourishes when a great degree of freedom, openness, and supervisory
encouragement are provided and reasonable deadlines are set up (Amabile, 1998).
Saxenian (1994) emphasized that a decentralized and fluid social climate
accelerated the diffusion of new technological knowledge with amazing speed
within the Silicon Valley industrial community. What was not explicitly pointed out is
the fact that the diffused knowledge and ideas were re-combined, modified, and
elaborated by its receivers in multiple ways into new ideas; and this is the essence
of creativity or new knowledge creation. Consequently, it is not surprising that
Silicon Valley experienced multiple trajectories of the development of technological
innovations simultaneously, which led to a wide range of cutting edge new products,
which were often rapidly introduced to the marketplace. This is one of the reasons
why talented entrepreneurs in Silicon Valley were very good in sensing new market
opportunities, new technological trends, and new product developments. Another
reason is the highly developed extracognitive abilities of gifted entrepreneurs,
which refer to their intuition, sense of new products or services, senses of good
ideas, promising technologies and elegant solutions, and feelings of being right,
being wrong, or having come across something important. For instance, Steve Jobs’
feeling of being right and sense for new products manifested itself in an unalloyed
confidence is viewed as his distinguishing characteristic. As a consequence, Silicon
Valley as a whole was able to continuously create new markets and industrial
sectors. The gifted and talented are primary responsible for generating innovation
and this is why giftedness is closely related to economy. The end of the 1980s
particularly demonstrated that competition was increasingly based on exceptional
creativity, that is, on companies’ ability to add value (i.e., to see new applications
and improvements in performance, quality, and service) rather than simply on
lowering costs. The ease of new firm formation (e.g., easy access to venture
capitalists, which were mainly former talented entrepreneurs themselves) also
contributed to pursuing multiple paths of technological innovation development.
In analyzing creativity at both the individual and regional levels the most important
factor was therefore that Silicon Valley entrepreneurs were mostly highly creative
Influence of the Gifted on Economy
75
people, whose internal or intrinsic motivation to create – new products, new
companies, and so on – was behind their success. This motivation to create was a
driving force for them; and this is one key to their excellence. For example, many of
the special marketing strategies used by AMD came from the creative mind of its
CEO, Jerry Sanders. As his former colleagues said, “It was Jerry that thought of
producing all of our semiconductors to Mil Spec 883 [military specifications for
semiconductor quality, set by the U.S. Department of Defence] so that our customers
knew we were up to a high quality standard, even though we sold very little to
Defence” (Rogers & Larsen, 1984, p. 51). Sanders was also credited with creating a
variety of price incentives for customers. For example, AMD was the first company
to offer price breaks on the purchase of a mixture of 100 semiconductor chips.
As all creatively talented individuals, engineers in Silicon Valley often experienced
frustration, disappointment, and similar feelings when they were unable to develop
and implement their ideas in the current workplace. It should be noticed that in
spite of all the exceptionally positive characteristics of the unique business
environment in Silicon Valley described above, certain companies were not still
conducive to talented entrepreneurs. One Silicon Valley venture capitalist
highlighted this point very well by emphasizing that “The presumption is that
employees of the big companies leave and go to venture companies to found start-
ups to make more money. That is not the way. Andy Grove, Bob Noyce and others left
Fairchild to found Intel, not to make more money. They left to make a product that
Fairchild was either unable or unwilling to make or, for whatever reason, did not get
around to making. That is why ventures are started: from lack of responsiveness in
big companies… The only reason good people leave is because they become
frustrated. They want to do something they cannot do in their present environment”
(Saxenian, 1994, pp. 112–113). Careers of T. J. Rodgers of Cypress Semiconductors
and Gordon Campbell of Chips and Technologies also support this observation.
They both left jobs at large semiconductor companies being frustrated by their
employers’ growing isolation from customers and unwillingness to assimilate new
ideas and inability to sense new market opportunities. Rogers & Larsen (1984, p. 66)
found that a very high level of energy, motivated in part by dissatisfaction with their
present position, was one of the distinguishing characteristics of Silicon Valley
entrepreneurs. Abound energy is an important personality trait of gifted and
talented individuals (Shavinina, 1995).
It is important to emphasize that every manifestation of the Silicon Valley key
players’ excellence has many sub-manifestations. It is impossible to discuss all of
them in a single article. Also, many various factors contributed to the appearance of
every manifestation of their excellence. In this regard Ray’s course on creativity
offered by the Stanford University School of Business played a certain role in
developing creative abilities of talented entrepreneurs and engineers in Silicon
Valley (Ray & Myers, 1989). At a minimum, the course contributed to increasing
awareness of creativity in those students who attended it. Creativity scholars can
certainly debate its content and the overall impact on the performance of Silicon
Valley. Nevertheless, we cannot assert that its impact was negligible. Evaluation
studies of creativity training show that it is difficult to evaluate all the multifaceted
impacts of such programs on emerging creative ideas in students’ minds,
particularly if the ideas appear in the shorter versus longer timeframes.
9. Talented entrepreneurs in Silicon Valley did their best in tolerating failures. Not all
Silicon Valley start-ups became successful ventures, some of them failed.
Understanding that failure is an integral part of risk-taking, failures were socially
acceptable in Silicon Valley. As one expert pointed out, “In Silicon Valley, failure is an
accepted way of life, unlike the East where failure is viewed as a death sentence…”
(Saxenian, 1994, p. 68). It looks like the Silicon Valley businessmen intuitively
followed dialectical nature of risk-taking, that is, if you are open to and highly
L. V. Shavinina 76
encourage risk-taking, you also have to be open to its consequences, one of which is
failure. The positive side of failure is certainly its contribution to learning and
developing professional experience and eventually to the emergence of innovation.
One executive noticed, “Everybody knows that some of the best presidents in the
Valley are people that have stumbled” (Saxenian, 1994, pp. 111–112). John Sculley,
the Apple Computer CEO emphasized, “In Silicon Valley, if someone fails, we know
they are in all likelihood going to reappear in some other company in a matter of
months” (Saxenian, 1994, p. 111). They were excellent in understanding how failure
is important, both for personal, organizational, and regional successes. Success by
learning from failure was the norm for Silicon Valley entrepreneurs. As one
executive noted, “Unless failure is possible, no learning is possible… in the realm of
ideas, unless falsification is possible, learning is not possible. As a matter of fact, in
information theory, no information is transmitted unless negation is possible, and so
the tolerance of failure is absolutely critical to the success of Silicon Valley. If you do
not tolerate failure, you cannot permit success. The successful people have a lot
more failures than the failures do” (Saxenian, 1994, p. 112). Such excellence in failure
tolerance was the norm in Silicon Valley well before management scholars, business
consultants, and practitioners emphasized it as a desirable leadership style (i.e., the
failure-tolerant leadership) and a reliable way to innovation (Deschamps, 2003;
Farson & Keyes, 2002; Lehr, 1979).
10. In a highly competitive business environment characterized by shorter product
cycles and accelerating technological change, talented entrepreneurs in the Silicon
Valley were excellent in applying common sense and intuition. Wisdom and intuition
are critical elements of giftedness (Shavinina, 2009). Examples of intuition and
wisdom are abundant in Silicon Valley. For instance, when Sun Microsystems was
working on its first product, the founders, all in their twenties, decided to adopt the
Unix operating system developed by AT&T because they felt that the market would
never accept a workstation custom designed by four graduate students. Sun also
used standard, readily available components by relying on outside suppliers. As a
result, the Sun products were cheaper to produce and lower priced than that of
competitors. Sun was thus a pioneer in recognizing customers’ preferences for
standard operating systems (Saxenian, 1994).
Additional sign of Sun’s ability to excel in applying common sense wisdom was
already discussed above when Sun broke itself into five quasi-independent
companies allowing them to sell their products even to competitors. The common
sense in this case was to mainly let customers – not Sun’s managers – to identify
where Sun was or was not innovative and competitive.
Generally, Silicon Valley start-ups were founded by a group of talented engineers –
friends and/or former colleagues – who developed a certain deal of expertise
working in other companies and who had an innovative idea, which they could not
realize in their current workplace (Saxenian, 1994). They deliberately avoided hiring
professional managers. For example, Intel preferred to recruit recent graduates of
schools of engineering rather than experienced managers. It is interesting to note
that many of Silicon Valley entrepreneurs did not have any managerial background.
They simply did their best in applying common sense to managing their companies;
they relied on intuition and wisdom. As one executive put it, “…In semiconductors, it
turned out that it was better to have a new industry filled with young people who did
not know much about how you were supposed to do business” (Saxenian, 1994, p.
81). Youth is associated with creative imagination, risk-taking, openness to
everything new and other characteristics of talented people. It was certainly good
from the viewpoint of excellence to hire young individuals: minds of young Silicon
Valley engineers/entrepreneurs were not restricted by certain norms imposed by
traditional theories of management and business schools. As a consequence, they
were able to actively experiment with organizational alternatives in addition to
Influence of the Gifted on Economy
77
multiple technological innovations. It means that their open minds were sensitive to
any creative ideas. Later business researchers studied managerial styles of Silicon
Valley entrepreneurs as exemplary ones. For instance, the Harvard Business School
developed a special case-study about Hewlett-Packard way of management. They
were just excellent in using common sense and intuition. Excellence is not equal to
knowledge about how to do business or to university degrees. It is something above
that, as well as above any other attributes of conventional wisdom associated with
successful business development. A highly intuitive decision-making process is one
of the important characteristics of creative people (Shavinina, 2003; Shavinina &
Ferrari, 2004). It is interesting that when some executives compared Silicon Valley
business culture with that of the large East Coast companies, they noted the
formality of the communication process, emphasizing that “there is so much staff
work done before top managers see anything, so much report generation that you
are not really involved intuitively in key decisions…” (Saxenian, 1994, p. 54). Silicon
Valley entrepreneurs’ “intuitive, quick-fire approach” to decision making was
already mentioned above.
Likewise, they intuitively realize the importance of positive emotions – of having fun
– for high performance on truly innovative technological projects. For instance,
while the traditional American corporations of the East Coast enforced a dress code,
Sun Microsystems’s employees showed up in gorilla suits on Halloween. Everything
was natural in Silicon Valley companies in this respect. They followed their common
sense well before management scholars found that fun is one of the distinguishing
characteristics of effective teams (D. C. Smith et al., 2000).
11. Talented engineers and entrepreneurs in the Silicon Valley were excellent not only
in anticipating new market opportunities and promising technological advances;
they were equally excellent in developing new products, many of which turned out to
be breakthrough innovations. To paraphrase Ted Hoff, the inventor of the
microprocessor, they “looked forward to inventing technologies that would soon
have a huge impact on consumers” (Rogers & Larsen, 1984, p. 111). It looks like they
did not simply want new products, they wanted excellent, the best possible products,
products at the cutting edge of that day’s technology. As Robert Noyce noted, “Intel
is working on the edge of disaster. We are absolutely trying to do those things which
nobody else could do from a technical point of view” (Salerno, 1980, p. 129). Another
case in point is Sun Microsystems. For instance, rather than manufacturing the new
chip itself for its workstations, or subcontracting it to a single maker, the company
set up collaboration with five semiconductor manufacturers. Each manufacturer used
its own technological process to develop the required microprocessor. The final
chips were common in design, but had different speed and price. It looks like the
Sun Microsystems strategy was to choose the best from the best. Interestingly
enough that after receiving the chips, Sun Microsystems encouraged these
manufacturers to sell the chips to its competitors. This allowed Sun Microsystems to
expand acceptance of its architecture that led to increasing market share. As
Saxenian (1994) concluded, Silicon Valley companies competed by rapidly
introducing differentiated and high-value-added products.
12. Similarly, Silicon Valley entrepreneurs were excellent in reducing time-to-market
process, in rapid introduction of new designs of best products. As one Intel sales
manager said, “If you stop for a week in this industry, I swear you would lose your
technological state of the art knowledge. There is nothing about a two-year-old
product that I couldn’t divulge to my competitors. A one-year-old product, you might
not be able to tell everything, but a two-year-old is old” (Rogers & Larsen, 1984, p.
50). Robert Noyce summarized it well, “We’re in an intensely competitive industry
where change is very rapid, and there is no resting on your laurels because you’ll
get wiped out next year if you just sit back” (Salerno, 1980, p. 128). Another manager
noticed, “There is a real urgency here… For us, the timing is tremendous. Beating a
L. V. Shavinina 78
competitor to market by 60 days may be the difference between surviving and
going under. Whoever gets to the marketplace first makes a splash” (Rogers &
Larsen, 1984, pp. 137–138). In a similar way, an executive at 3Com stressed, “One of
the things that Silicon Valley lets you do is minimize the costs associated with getting
from idea to product. Vendors here can handle everything. If you specify
something… you can get hardware back so fast that your time-to-market is incredibly
short” (Saxenian, 1994, p. 114). The presence of a wide range of sophisticated local
customers was important in this respect and this ultimately led to success of many
start-ups. As one executive at a semiconductor company told, “When we come out
with the specs for a new product, we take them to a series of companies that we have
relations with… and they will give us feedback on the features they like and do not
like. It is an iterative process: we define a product, we get feedback and improve it,
we refine it and develop associated products. The process feeds on itself. And the
fact that these customers are nearby means that the iterations are faster; rapid
communication is absolutely critical to ensuring fast time-to-market” (Saxenian, 1994,
p. 114).
A good question might arise. If the term “excellence” refers to “perfection,” then
how can the offered perspective explain reliance on experimentation and rapid
prototyping by many successful companies in Silicon Valley? The proposed
explanation highlights excellence in any aspect of an individual’s business activity.
That is, any person and any company can be excellent in fast experimentation and
rapid prototyping, too. Also, fast experimentation and rapid prototyping are
necessary steps in the innovation process.
13. Taking into account the outstanding role played by Stanford University in
developing Silicon Valley, it should be stressed that its professors did their best in
encouraging students to start up new companies and commercialize their ideas by
developing new products. The case in point is certainly exemplified in Frederick
Terman, an electrical engineering professor, who encouraged his graduate students
Bill Hewlett and David Packard to commercialize an audio-oscillator that Bill Hewlett
had designed while working on his master’s thesis. Terman lent Bill and David “$538
to start producing the machine, he helped them find work to finance their initial
experiments, and he arranged a loan from a Palo Alto bank, which allowed them to
begin commercial production” (Saxenian, 1994, p. 20). Definitely, Terman’s support
of his students greatly exceeded the normal limits of usual professorial
encouragement. When Terman became Dean of Engineering at Stanford University,
he extended the scope of his support to start-ups and entrepreneurs in Silicon Valley
by establishing and promoting the Stanford Research Institute, the Honors
Cooperative Program, and the Stanford Industrial Park. Professors at Stanford
University were thus excellent in stimulating the development of entrepreneurial
giftedness and innovation talent in their students. It is interesting to mention that
Frederick Terman was a son of Lewis Terman, a well-known psychologist who
initiated the famous longitudinal study of gifted children in California.
14. Silicon Valley venture capitalists (usually former entrepreneurs and engineers
themselves) were excellent in moving very rapidly on promising opportunities, in
believing in new entrepreneurs, and in making fast decisions. Saxenian (1994)
provided many examples showing that for many entrepreneurs, it took only a few
days or even minutes to finance their start-ups. Thus, the founder of a successful
computer company recalled, “When I started Convergent, I got commitments for
$2.5 million in 20 minutes from three people over lunch who saw me write the
business plan on the back of a napkin. They believed in me…” (Saxenian, 1994, p. 65).
Intermediary organizations also were excellent in their business activities. For
instance, Regis McKenna, Inc., a public relations company, was quite successful in
inventing new marketing strategies, which suited a world of fast-changing innovative
Influence of the Gifted on Economy
79
markets and complex, advanced high tech products. More precisely, the company
developed a new approach to marketing, “an approach that takes into account the
dynamic changes in industries and markets. It is an approach that stresses the
building of relationships rather than the promotion of products, the communication
of concepts rather than the dispersal of information, and the creation of new markets
rather than the sharing of old ones” (McKenna, 1986, p. 4).
15. Understanding that cutting-edge innovations require intense concentration, talented
engineers, and gifted entrepreneurs in the Silicon Valley were excellent in working
incredibly long hours over extended periods of time. Rogers & Larsen (1984)
concluded that “a distinctive life-style and work-style is found in Silicon Valley.
Engineers put in fifteen-hour days and seven-day weeks…” (p. 29). For instance,
Robert Noyce characterized the working environment at Intel as “confident, but not
relaxed” (Salerno, 1980, p. 122). The essential aspect of the Intel culture is that “we
expect people to work hard” (Salerno, 1980, p. 123). “When people come in from
other companies… they just don’t believe the intensity of Intel” (Salerno, 1980, p.
128). This is the ‘price,’ which Intel – as well as other innovative companies in Silicon
Valley – paid in order to be the front-runner in a fast-moving high tech industry. High
ability researchers found a long time ago that gifted and talented individuals are
hard working, exceptionally focused on their task at hand (Renzulli, 1986; Roe, 1952;
Shavinina, 1995).
These 15 multidimensional, sometimes overlapping, facets testify to an excellence in
many aspects of business activities demonstrated by the talented players in Silicon
Valley8. It was noticed above that excellence is associated with giftedness and many of the
identified facets of excellence are in fact distinguishing characteristics of the gifted and
talented. Consequently, one can conclude that entrepreneurs and engineers in Silicon
Valley were gifted and talented individuals. The 15 identified manifestations of excellence
can be grouped into four clusters. Trust, informality, humanistic culture, and democratic
approaches form the first cluster, which could be called the “democracy” or “democratic”
cluster. Fast-to-market, quick decision-making, and accelerated speed of information
exchange constitute the second, “time” cluster. Open business environment and
cooperation form the third, “openness” cluster. Finally, flourishing creativity, developing
new products, tolerating failures, professors’ encouragement, and using wisdom and
intuition outline the fourth, “creativity” cluster. Also, the 15 manifestations of excellence
can be differentiated into qualities of excellence at the “individual” level (be it the person
or the corporation) and those that operate at the “ecosystem” level. In this light, trust,
informality, and democratic approaches belong to the manifestations of excellence at the
“ecosystem” level.
Compensatory Mechanisms
The second mechanism in building the success story of Silicon Valley is the conscious or
unconscious use of compensatory mechanisms by its talented key players. It means their
highly developed metacognitive abilities. The essence of compensatory mechanisms is
straightforward: if you are not exceedingly excellent in some aspects of your business
activity, then compensate for that. To put it even more briefly: be excellent in
compensating for your lack of excellence in something. The case in point is Sun
Microsystems. Whether its young gifted founders realized it or not, but they did their best
in using compensatory mechanisms. The above-considered examples demonstrate that
Sun Microsystems constantly evaluated its “points of excellence” (i.e., those products and
processes in which it could add value) and tried to improve them. Otherwise, Sun
Microsystems subcontracted [to other specialized companies] those components [of their
workstations] in which it did not have a great expertise. Sun Microsystems thus realized
and successfully applied the simple rule of compensatory mechanisms: if you are not
competitive – that is, if you are not excellent – rely on partners and/or suppliers who are.
L. V. Shavinina 80
The compensatory mechanisms can therefore manifest themselves in conscious relying
on strengths and avoiding weaknesses. For instance, an integral element of Intel’s long-
range strategic planning is the analysis of its strengths and weaknesses, and, as a result,
the avoidance of certain areas of business. As Robert Noyce highlighted, “We build on
strength and try to stay out of competition where we’re weak” (Salerno, 1980, p. 129).
Sun Microsystems and Intel were not the exceptions in Silicon Valley. The computer
producers MIPS, Pyramid, Tandem, and Silicon Graphics all relied to a great extent on
networks of external suppliers. For example, Silicon Graphics CEO noticed that his
company mostly relied on “interdisciplinary teams that focus on bringing new products to
market fast” (Saxenian, 1994, p. 143). By extending the definition of an interdisciplinary
team (Katzenbach & D. Smith, 1993), one would say that this is a group of people with
complementary knowledge bases and skills that allow its members to compensate for a
lack of some kinds of expertise at the team level.
Furthermore, the entire way of doing business in Silicon Valley consciously or
unconsciously applied compensatory mechanisms. Thus, the typical Silicon Valley start-up
included talented people from a range of companies and industries, which represented a
combination of technical and corporate competencies. Managerial and engineering
teams were therefore ready to compensate for a lack of excellence in something just from
the beginning. Eisenhardt’s et al. (1990) research demonstrated that the heterogeneity of
past professional experiences among founders of semiconductor start-ups was correlated
with higher growth.
In order to be highly profitable and compete with large companies which produced
memory and other commodity devices, the new semiconductor companies of the 1980s
successfully compensated for usual weaknesses of start-ups. In particular, they created a
new market of high value-added chips by greatly relying on the proximity of customers,
engineering talent, specialized suppliers, and fast information exchange via social
networks. Weitek founder and CEO noticed that “contrast commodity products which have
no engineering content and are priced at cost with Weitek chips which have high
engineering content, small output, and high value-added. This is a talent-leveraged
business, which is highly competitive but not capital intensive. The key to winning is [not
cost or price, but] getting close to the customer” (Saxenian, 1994, p. 121; italics added).
This compensatory strategy turned out to be successful: the new companies were highly
profitable and fast growing. While large companies – National Semiconductor or AMD –
struggled to stay in business, many of the 1980s start-ups experienced growth rates of 45–
50 percent a year (Saxenian, 1994). These are amazing numbers and a clear indication that
the talent based economy is more successful than any other type of economy.
Moreover, many founders of Silicon Valley start-ups were smart enough to know what they
did not know and how to compensate (e.g., where to find good management advice or
marketing expertise). It was the manifestation of their excellence in metacognition.9 Thus,
Les Hogan, former president of Fairchild, said about Lee Boysel, founder of Four-Phase
Systems, “He was smart enough to know what he didn’t know” (Rogers & Larsen, 1984, p.
45). Similarly, Adam Osborne in a speech at the Innovation 2 Conference on 2 November
1982 in Palo Alto said, “Steve Jobs was not just a lucky kid. He knew what he didn’t know,
and sought people who did. That was a very mature strategy” (Rogers & Larsen, 1984, p.
278). To be more precise, that was a very mature compensatory strategy.
Everything discussed up to this point does not mean that Silicon Valley entrepreneurs
were always excellent; as well as they were not excellent in absolutely all aspects of
business activity. They made mistakes as well. However, this only confirms the general
rule of excellence: as soon as they stopped to be excellent, to do their best – at some
point in their development – they began to fail. For example, they missed a series of key
markets and technological opportunities, such as “the return to semi-custom and
application-specific integrated circuits (ASICs), the complementary metal-oxide
semiconductor (CMOS) process, and chip sets… It took a new generation of start-ups in
the 1980s to commercialize these technologies” (Saxenian, 1994, p. 93).
Influence of the Gifted on Economy
81
Apple Computer’s failure to open up the proprietary architecture for its Macintosh
personal computers is another example. Protecting itself in such a way, Apple turned out
to be in isolation from the computer industry, and, as a result, lost market share. The
similar case is when some leading Silicon Valley companies – National Semiconductor,
Intel, and AMD – sacrificed their organizational flexibility in order to become the “big
three” of the semiconductor industry. They built bureaucratic companies that centralized
authority and limited the autonomy of formerly independent business divisions. At the
level of the region as a whole, Silicon Valley entrepreneurs failed to acknowledge the
significance of the social networks of informal communication and collaboration they had
created in their own success. Saxenian (1994) concluded that entrepreneurs’
individualistic view of themselves and their successes as independent of the Silicon Valley
and a variety of its relationships have limited their ability to respond collectively to
challenges. The examples of such failures in excellence can be continued. Nevertheless,
the general imperative is clear: if you want to succeed, you have to be excellent in as
many facets of your professional activity as possible, or compensate for a lack of
excellence. Otherwise, you will fail.
It is true that some researchers came close to the notion of compensatory mechanisms
when they wrote about “complementary alliances” and “complementary innovation”
(Saxenian, 2000) in Silicon Valley. That is, “the Silicon Valley ecosystem achieves flexibility
through “diverse specialization,” with each firm focusing on what it does best and taking
advantage of the capabilities of other entities for complementary activities” (Bahrami &
Evans, 2000, p. 178). Complementary alliances thus lead to complementary innovation.
Nonetheless, the idea of complementarity is not equal to the concept of compensatory
mechanisms. Complementarity in general and complementary alliances in particular are
possible manifestations of compensatory mechanisms. The construct of compensatory
mechanisms is broader than the notion of complementarity.
Silicon Valley Cannot Be Easily Replicated Around the World. Why?
This article presented a perspective on the Silicon Valley “secret” – the talent-based
economy – which deepens the available explanations. To be more precise, it sets the stage
for understanding Silicon Valley as a region of excellence inhabited by gifted and
talented players of entrepreneurial activities. That is, the gifted and talented – with their
excellence – are first and foremost behind the phenomenal success of Silicon Valley in
almost all aspects of business activities, and/or, an ability to compensate for a lack of
excellence in something. An interesting question then emerges: how does the proposed
explanation account for the low probability of success and the high “death” rates
associated with new entrepreneurial ventures? In light of the offered perspective, the
answer is straightforward: the high “death” rates are related to the fact that key players in
those ventures were not talented and did not attempt perfection in almost all facets of
their business activities, or did not sufficiently compensate for a lack of excellence in
some areas.
Certainly, the proposed explanation of the phenomenon of Silicon Valley does not account
for all possible facets of its excellence, and sometimes it is both vague and speculative in
its formulations. Nevertheless, it provides a useful attempt to further understand how the
gifted human side contributes to the prosperity of the region. At the first glance, it looks
very obvious: do your exceptionally best, surpass yourself, and know when, where and
how to compensate for those things in which you are not excellent. However, this rule
might not be so easily implemented in other regions, because human understanding of
excellence and its fulfilment, as well as the use of compensatory mechanisms, will be
different. Due to numerous individual differences, people vary significantly. For example,
Steven Jobs was successful in convincing intermediary firms (i.e., a public relations
company) to provide their services to Apple on a pay-later basis (Rogers & Larsen, 1984,
p. 10). Does it mean that other entrepreneurs will be able to do it in the same way, say, in
Silicon Alley? Even if we assume that regional differences are reduced to a minimum, the
L. V. Shavinina 82
answer is definitely “No.” People are different. What Jobs could successfully do in
California’s Silicon Valley could not be easily repeated in other Silicon regions. Similarly,
what professor Frederick Terman could do in inspiring his students to start-up new
companies in California’s Silicon Valley does not mean that, say, I would be able to do that
as a professor in a Silicon Valley North (Shavinina, 2004). Perhaps, this explains why
Terman was not entirely successful in giving advice to government officials and policy
makers on how to build ‘Silicon Valleys’ in other regions. The role of individual differences
in human excellence was omitted. Individual differences in talent play a critical role in
ultimate accomplishments. Other regions have other people. Human side matters,
because this is the most important carrier or provider of excellence, as well as the most
difficult part of an innovation process. The perspective presented in this article therefore
explains the deep roots of the uniqueness of Silicon Valley and thus contributes to a
current argument about its uniqueness (Kenny, 2000a).
The presented perspective complements and extends existing explanations of the Silicon
Valley phenomenon in a number of ways. For instance, from the point of view of this
perspective, it is not enough to have “networks of innovation” at the foundation of the
Silicon Valley (Cohen & Fields, 1999) or “a network of organizations specialized in the
creation of new firms” (Kenny, 2001). These networks must be excellent: their talented
players must demonstrate constant excellence in order for innovation to happen. One
cannot exaggerate the role of a collaborative process in innovation, which “generates and
refines what is essentially the intangible raw material of technological change – ideas”
(Cohen & Fields, 1999, p. 127). The social psychology of creativity certainly exists and it
really matters (Amabile, 1983, 1996), nonetheless, we cannot neglect the fact that
innovative ideas usually appear in the minds of gifted and talented individuals. The
collaborative process may fuel human creativity further, but the final representation of any
idea or problem – and the entire pathway to innovation – frequently comes to an
individual mind (Shavinina & Sheeratan, 2003). Human excellence is behind the
collaborative process or networks of innovation, and it is at the heart of the region’s
innovative ability.
Rogers & Larsen (1984) believe that in Silicon Valley “one can create value out of thin air,
from virtually nothing: Information and innovation combine to produce economic value”
(p. 276). Nevertheless, this is not entirely correct. Such value creation is the profound
process of transformation of information into creative ideas and the subsequent
transformation of these ideas into innovations (Shavinina, 2003). This process depends on
human excellence. Beyond “thin air or virtually nothing” there is excellence of talented
individuals.
A logical question then arises: Can excellence be taught or learned in formal classes? The
answer is “yes;” this is possible to a certain extent. Courses on excellence can indeed
provide both declarative and procedural knowledge about excellence thus extending
students’ knowledge base. However, there is no guarantee that students will indeed apply
that knowledge in real business settings. This kind of knowledge application depends
greatly on individual differences among people. Nevertheless, this is not a reason to
abandon the existing programs on excellence or not to develop the new ones. The case in
point is the interdisciplinary, international Masters program “Studies of Excellence”
offered by the University of Munich in Germany. Munich is the center of the German
biotechnology cluster. The program is taught in English, and it covers a wide range of
personal, social, and organizational issues related to excellence, for example, in the
corporate world. It includes such courses as Conceptions of Excellence, Cognitive and
Motivational Aspects of Excellence, Promoting Excellence in Business and Industry, and so
on, as well as includes two internships. The internships aim to provide a series of
vocational experiences (e.g., in some area of industry that has a particular commitment to
excellence), which complement the academic training provided in the Excellence
Program. As such, the internships are considered to be a vital part of the overall program.
Influence of the Gifted on Economy
83
They represent an attempt to bridge the gap between the academic environment and the
world of practical application.
Policy Related Implications for the Advancement of the Talent-Based
Economy
The presented perspective rooted in the deep understanding of the role of the gifted and
talented in economy sheds additional light on a very important issue of why the
phenomenon of Silicon Valley cannot be easily replicated around the world. Researchers
and policy decision-makers actively discuss how the Silicon Valley model could be
reproduced in other regions and countries. Some scholars think that this is possible to
some degree, others believe that this is impossible (Menon, 2001), arguing, for example,
that Silicon Valley requires “a technological innovation [like semiconductors] whose time
has come. So just plain luck was also involved in the rise of Silicon Valley” (Rogers &
Larsen, 1984, p. 39). In the first case the result will be of limited success. In the second
case it will be imitation, at best. For instance, analyses of science parks show their low
success rates (Phillimore & Joseph, 2003), despite the availability of all the traditional
components needed for successful technological growth, such as entrepreneurship,
venture capital, research universities, and highly qualified labour markets. Nonetheless,
many of them (e.g., Cambridge, UK) cannot be named “the second Silicon Valley.” A
reasonable question therefore is, why? Saxenian (1994) would say that a variety of social
and technical networks were not developed at that regional level. According to the
proposed perspective, this is because those regions are not regions of excellence full of
gifted and talented entrepreneurs and engineers.
Nobody can motivate people – for example, in start-ups in those regions – to really do
their best, to surpass themselves. It is largely because only individuals themselves know
what they can and cannot do, that is, their existing abilities. Furthermore, often even
people themselves do not know the limits of their excellence, that is, their hidden or
potential abilities. How can we measure unborn creative ideas, which could lead to
innovative technologies and highly profitable start-ups? Nobody can encourage people to
create their own companies if they are frustrated in the current workplace by inability to
realize their innovative ideas; they may find another employer. Also, nobody can inspire
professors in local universities to encourage students in such a way as Frederick Terman
did. Policymakers cannot do everything. It is thus a time to realize the limits of all parties
involved in building Silicon regions. The major lesson in this respect is that some common
ingredients of the phenomenon of Silicon Valley can be shared by other Silicon areas (e.g.,
plenty of venture capital and easy access to it, the availability of a sophisticated
supporting service infrastructure such as law firms, executive search firms, public
relations firms, and so on). This is the know-what part of the lesson. Other ingredients –
especially related to human excellence and talent – cannot be easily reproduced. For
example, entrepreneurial giftedness (Shavinina, 2006, 2008) is not about how to get
venture capital. This is the know-how part of the lesson, which is the most difficult part of
the equation in understanding the phenomenon of Silicon Valley and the extent to which it
can be replicated. The presented perspective is therefore a bit pessimistic about policies
aimed at replicating Silicon Valley around the world. At the same time, this perspective is
quite optimistic. For instance, many scholars and practitioners in the late 1980s and the
early 1990s thought that the Silicon Valley’s magic had finally ended (Kenny, 2000a). They
were definitely wrong, as the new companies focused on Internet innovations
demonstrated in 1995–1998. The fact that nobody could predict the appearance of the
great wave of such start-ups shows that excellence of talented individuals is
unpredictable. One reason for this is that human creativity – a foundation for any
innovation – is an endless source for new ideas; and the gifted generate more ideas than
other people. Thus, nobody knows what ideas are in the minds of Stanford University
students today. Even if we know, it is impossible to say what degree of excellence the
students would invest in transforming those ideas into commercial innovations, if any. This

L. V. Shavinina 84
unpredictability of human excellence excludes in principle any attempt to predict the end
of Silicon Valley or the future development of other Silicon regions.
There are a few other essential points as well, which should be mentioned here. When we
argue, for instance, that people cooperate more in Silicon Valley than elsewhere, then the
question arises: why? After all, most people working in Silicon Valley came from
somewhere else – were they less cooperative in their old locales?
To successfully answer these questions, special attention must be paid to the first wave of
comers to Silicon Valley. The first comers – its founders – were primarily students in their
previous locations. They were in the process of acquiring academic knowledge and
professional expertise, and, therefore, did not have the opportunity to cooperate as
working specialists. Their professional life started later, in Silicon Valley.
The best example of the first comers is arguably the eight young, talented engineers
invited by Nobel laureate William Shomsky to work in Silicon Valley in his research and
development company. Thomas Perkins, Eugene Kleiner, Robert Noyce, Andy Grove, and
Gordon Moore were among them. Each became a prominent figure in the Valley. When
they and other young newcomers arrived at Silicon Valley, they brought the spirit (e.g.,
extreme openness, boundless energy) and ideals (e.g., honesty) of youth, and built
working relationships in a friendly environment in accordance with these values, beliefs,
and standards.
Nevertheless, they not only brought a wide range of attributes related to youth, they also
brought a broad array of attributes associated with exceptional talent. Honesty, openness,
intrinsic achievement motivation with a strong drive towards excellence, enthusiasm,
boundless energy, striving toward success, self-confidence, ability to work hard,
perseverance, nonconformity, individualism, curiosity, and other distinguishing
characteristics of highly talented people. It is easy to see that many of these traits overlap
with the attributes of youth. Such an overlap greatly strengthened and crystallized some of
these characteristics (e.g., openness, striving toward success, and so on), and thus
increased the likelihood to predetermine the unique climate of Silicon Valley. With time,
the overlapped attributes became the distinguishing features of the overall unique Silicon
Valley environment, many of which were described in this article. The law of talent and
youth built the basis of an unrepeatable Silicon Valley milieu.
In order to succeed, the second and subsequent waves of comers to Silicon Valley had to
adapt to the already established environment. As a consequence, the distinguishing
features of this environment were further refined. This explains why subsequent
newcomers could be less cooperative in their old locales (e.g., along Route 128).
However, they demonstrated an entirely different pattern of professional behavior in
Silicon Valley. Saxenian (1994) provided examples of such people. Adapting to the
existing context of the Valley and accepting its “rules of game” was the only way to
succeed for these people.
Silicon Valley is not simply a learning region; this is a region of excellence. Some
researchers assert that learning regions will succeed in knowledge economy (Florida,
1995). This is a simplistic way of thinking about entrepreneurial, industrial, or innovation
clusters full of talented people. Learning is not equal to innovation. Regions of excellence
based on talent will flourish in the future, and this is exactly what the talent-based
economy is all about. Today’s global business economy is an economy of excellence and
talent.
Summing-Up
Talented people play a great role in the economic prosperity of any country and the
whole world. Nonetheless, the topic of giftedness and economy is terra incognita from a
research viewpoint. Despite its great importance and an enormous potential for solving
many societal and global problems, this is nearly unchartered territory by scholars. This
article proposed one of the possible ways to tackle the topic of giftedness and economy,
Influence of the Gifted on Economy
85
that is, it analyzed the impact of talented individuals on the economic development of
Silicon Valley and hence introduced the concept of talent-based economy. More precisely,
it explained the Silicon Valley phenomenon via talent in particular and high abilities in
general. It means that talented people with their fully actualized and realized abilities
(e.g., entrepreneurial giftedness, leadership talent, and so on) are behind the
unbelievable economic success of this region. Further research is certainly desirable to
firmly establish and advance this new and exciting scientific direction in the area of high
ability studies.
Notes
1 Scholars agree that “it is difficult to imagine an example of regional economic
development that is more successful, or more famous, than California’s Silicon Valley”
(Cohen & Fields, 1999, p. 108).
2 It should be emphasized that the goal of this article is not to present and analyze all the
existing explanations of the Silicon Valley phenomenon. Rather, its objective consists of
presenting a new perspective on the success of Silicon Valley, which complements and
extends the available scholarly explanations.
3 Italics in this paragraph, as well as in all the quotes in this article, are added by the
author.
4 For an explanation of the differences between “networks” and “networking” see Swan et
al. (2003).
5 The construct of high abilities refers to giftedness, talent, creativity, excellence,
innovation, wisdom, exceptional intelligence, extraordinary leadership, expertise,
competence, and related concepts.
6 “Virtually all generations” refers to early semiconductor companies like Hewlett-
Packard, semiconductor companies of the 1960s–1970s, semiconductor equipment
companies of the 1980s, and the 1980s-generation computer firms.
7 Saxenian’s book and Rogers & Larsen’s book are the most comprehensive accounts
available on Silicon Valley. This article will thus rely to a great extent on the “lived”
experiences of the actual actors presented in the books.
8 It should be noticed that my goal was not to identify distinguishing features of Silicon
Valley per se, but to identify manifestations of excellence in its key players. Although
distinguishing features of Silicon Valley and the manifestations of its excellence overlap
to a significant extent, they are not entirely the same.
9 Metacognition refers to (1) one’s own knowledge about his or her cognitive set-up and
intellectual activity in general, (2) the ability to evaluate the ‘strong’ and ‘weak’ aspects
of his or her mental functioning and to compensate for one’s own weaknesses and to rely
on strengths, as well as (3) planning, guiding, monitoring, and coordinating one’s own
cognitive processes (Kholodnaya, 1993).
References
Amabile, T. M. (1983). The social psychology of
creativity. New York: Springer Verlag.
Amabile, T. M. (1996). Creativity in context. Boulder,
CO: Westview Press.
Amabile, T. M. (1998). How to kill creativity. Harvard
Business Review, September-October, 76–87.
Angel, D. P. (2000). High-technology agglom-
eration and the labor market: The case of
Silicon Valley. In M. Kenney (Ed.),
Understanding Silicon Valley: The anatomy of
an entrepreneurial region (pp.124–140).
Stanford, California: Stanford University Press.
Bahrami, H., Evans, S. (2000). Flexible recycling
and high technology entrepreneurship. In M.
Kenney (Ed.), Understanding Silicon Valley:
The anatomy of an entrepreneurial region (pp.
L. V. Shavinina 86
165–189). Stanford, CA: Stanford University
Press,
Bennis, W., & Biederman, P. (1997). Organizing
genius: The secrets of creative collaboration.
Reading, MA: Addison-Wesley.
Clinkenbird, P. (2007). Economic arguments for
gifted education. Paper presented at the
World Conference on Giftedness (6 August,
2007, University of Warwick, Coventry, UK).
Cohen, S.S., & Fields, G. (1999). Social capital and
capital gains in Silicon Valley. California
Management Review, 41(2) (Winter 1999),
108–129.
Deschamps, J. P. (2003). Innovation and leadership.
In L. V. Shavinina (Ed.), The International
handbook on innovation (pp. 815–831). Oxford,
UK: Elsevier Science.
Eisenhardt, K. M., & Schoonhoven, C. B. (1990).
Organizational growth: Linking founding team
strategy, environment, and growth among U.S.
semiconductor ventures, 1978–1988. Adminis-
trative Sciences Quarterly, 35(3), 504–529.
Farson, R., & Keyes, R. (2002). The failure-tolerant
leader. Harvard Business Review, 80(8), 64–71.
Feldhusen, J. F. (1984). The pursuit of excellence in
gifted education. In J. F Feldhusen (Ed.),
Towards excellence in gifted education (pp. 1–
16). Denver, CO: Love.
Florida, R. (1995). Toward the learning region.
Futures, 27 (5), 527–536.
Florida, R. (2002). The Rise of the creative class.
New York: Basic Books.
Florida, R. (2005). Cities and the creative class.
London: Routledge.
Florida, R., & Kenny, M. (1999). Venture capital and
high technology entrepreneurship. Journal of
Business Venturing, 3(4), 301–319.
Hershock, R. J., Cowman, C. D., & Peters, D. (1994).
From experience: Actions teams that work.
Journal of Product Innovation Management, 11,
95–104.
Hunt, J. (1983). Action for excellence. Education
Commission of the States, Task Force on
Education for Economic Growth. Denver, CO.
Katz, R., (Ed.). (1997). The human side of managing
technological innovation. New York: Oxford
University Press.
Katzenbach, J. R., & Smith, D. K. (1993). The wisdom
of teams: Creating the high-performance
organization. Boston, MA: Harvard Business
School Press.
Kenney, M. (2000a). Introduction. In M. Kenney
(Ed.), Understanding Silicon Valley: The
anatomy of an entrepreneurial region (pp.1–
12). Stanford, CA: Stanford University Press.
Kenney, M., (Ed.). (2000b). Understanding Silicon
Valley: The anatomy of an entrepreneurial
region. Palo Alto, CA: Stanford University
Press.
Kenny, M. (2001). Regional clusters, venture capital
and entrepreneurship: What can the social
sciences tell us about Silicon Valley? In OECD
(Ed.), Social Sciences and Innovation (pp. 57–
75). Paris, France: OECD.
Kenny, M., & von Burg, U. (2000). Institutions and
economies: Creating Silicon Valley. In M.
Kenney (Ed.), Understanding Silicon Valley:
The anatomy of an entrepreneurial region
(pp.218–240). Stanford, CA: Stanford
University Press.
Kholodnaya, M. A. (2007). The psychology of
intelligence (2nd edition) Moscow: IPRAN
Press.
Kiely, T. (1993). The idea makers. Technology
Review, January, 33–40. Reprinted in R. Katz
(Ed.), The human side of managing
technological innovation (pp. 60–67). New
York: Oxford University Press.
Leavitt, H. J., & Lipman-Blumen, J. (1995). Hot
groups. Harvard Business Review, 73, 109–116.
Lee, C.-M. (2000). The Silicon Valley Edge. Stanford,
CA: Stanford University Press.
Lehr, L.W. (1979). Stimulating technological
innovation – The role of top management.
Research Management, November, 23–25.
Mathews, J.A. (1997). A Silicon Valley of the east:
Creating Taiwan’s semiconductor industry.
California Management Review, 39(4), 26–54.
Mathews, J.A. (1999). A Silicon Island of the east:
Creating a semiconductor industry in
Singapore. California Management Review,
41(2), 55–78.
McKenna, R. (1986). The regis touch. Reading, MA: Addison-Wesley.
Menon, M. G. K. (2001). The characteristics and
promotion of innovation. In OECD (Ed.),
Social Sciences and Innovation (pp. 77–87).
Paris, France: OECD.
Mumford, M. (2000). Managing creative people:
Strategies and tactics for innovation. Human
Resource Management Review, 10(3), 313–351.
National Commission on Excellence in Education
(1983). A nation at risk: the imperative for
educational reform (a report to the Nation and
the Secretary of Education). Washington, D.C.:
U.S. Government Printing Office.
Peters, T. (1988). Thriving on Chaos. New York:
Harper & Row Publishers.
Phillimore, J., & Joseph, R. (2003). Science parks: A
triumph of hype over experience? In L. V.
Shavinina (Ed.), International handbook on
innovation (pp. 750–757). Oxford, UK: Elsevier
Science.
Porter, M. (1998a). Clusters and the new
economics of competition. Harvard Business
Review, November-December, 77–90.
Porter, M. (1998b). On competition. Boston, MA:
Harvard Business School Publishing.
Ray, M., & Myers, R. (1989). Creativity in business
based on the famed Stanford University course
that has revolutionized the art of success. New
York: Doubleday.
Renzulli J. S. (1986). The three-ring conception of
giftedness: a developmental model for
creative productivity. In R. J. Sternberg & J.
Davidson (Eds.), Conceptions of giftedness,
(2nd ed., pp. 53–92). Cambridge: Cambridge
University Press.
Roe, A. (1952). The making of a scientist. New York:
Dodd & Meed.
Rogers, E., & Larsen, J. (1984). Silicon Valley Fever:
Growth of high-technology culture. New York:
Basic Books.
Salerno, L. (1980). Creativity by the numbers: An
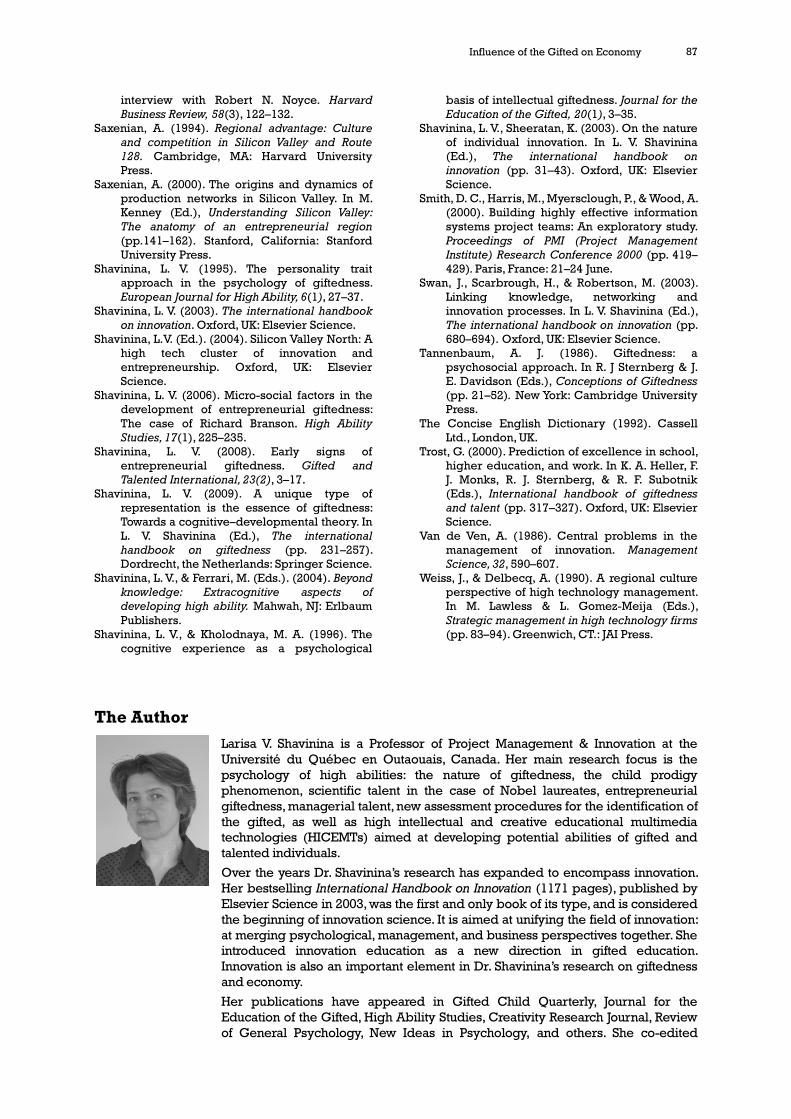
Influence of the Gifted on Economy
87
interview with Robert N. Noyce. Harvard
Business Review, 58(3), 122–132.
Saxenian, A. (1994). Regional advantage: Culture
and competition in Silicon Valley and Route
128. Cambridge, MA: Harvard University
Press.
Saxenian, A. (2000). The origins and dynamics of
production networks in Silicon Valley. In M.
Kenney (Ed.), Understanding Silicon Valley:
The anatomy of an entrepreneurial region
(pp.141–162). Stanford, California: Stanford
University Press.
Shavinina, L. V. (1995). The personality trait
approach in the psychology of giftedness.
European Journal for High Ability, 6(1), 27–37.
Shavinina, L. V. (2003). The international handbook
on innovation. Oxford, UK: Elsevier Science.
Shavinina, L.V. (Ed.). (2004). Silicon Valley North: A
high tech cluster of innovation and
entrepreneurship. Oxford, UK: Elsevier
Science.
Shavinina, L. V. (2006). Micro-social factors in the
development of entrepreneurial giftedness:
The case of Richard Branson. High Ability
Studies, 17(1), 225–235.
Shavinina, L. V. (2008). Early signs of
entrepreneurial giftedness. Gifted and
Talented International, 23(2), 3–17.
Shavinina, L. V. (2009). A unique type of
representation is the essence of giftedness:
Towards a cognitive–developmental theory. In
L. V. Shavinina (Ed.), The international
handbook on giftedness (pp. 231–257).
Dordrecht, the Netherlands: Springer Science.
Shavinina, L. V., & Ferrari, M. (Eds.). (2004). Beyond
knowledge: Extracognitive aspects of
developing high ability. Mahwah, NJ: Erlbaum
Publishers.
Shavinina, L. V., & Kholodnaya, M. A. (1996). The
cognitive experience as a psychological
basis of intellectual giftedness. Journal for the
Education of the Gifted, 20(1), 3–35.
Shavinina, L. V., Sheeratan, K. (2003). On the nature
of individual innovation. In L. V. Shavinina
(Ed.), The international handbook on
innovation (pp. 31–43). Oxford, UK: Elsevier
Science.
Smith, D. C., Harris, M., Myersclough, P., & Wood, A.
(2000). Building highly effective information
systems project teams: An exploratory study.
Proceedings of PMI (Project Management
Institute) Research Conference 2000 (pp. 419–
429). Paris, France: 21–24 June.
Swan, J., Scarbrough, H., & Robertson, M. (2003).
Linking knowledge, networking and
innovation processes. In L. V. Shavinina (Ed.),
The international handbook on innovation (pp.
680–694). Oxford, UK: Elsevier Science.
Tannenbaum, A. J. (1986). Giftedness: a
psychosocial approach. In R. J Sternberg & J.
E. Davidson (Eds.), Conceptions of Giftedness
(pp. 21–52). New York: Cambridge University
Press.
The Concise English Dictionary (1992). Cassell
Ltd., London, UK.
Trost, G. (2000). Prediction of excellence in school,
higher education, and work. In K. A. Heller, F.
J. Monks, R. J. Sternberg, & R. F. Subotnik
(Eds.), International handbook of giftedness
and talent (pp. 317–327). Oxford, UK: Elsevier
Science.
Van de Ven, A. (1986). Central problems in the
management of innovation. Management
Science, 32, 590–607.
Weiss, J., & Delbecq, A. (1990). A regional culture
perspective of high technology management.
In M. Lawless & L. Gomez-Meija (Eds.),
Strategic management in high technology firms
(pp. 83–94). Greenwich, CT.: JAI Press.
The Author
Larisa V. Shavinina is a Professor of Project Management & Innovation at the
Université du Québec en Outaouais, Canada. Her main research focus is the
psychology of high abilities: the nature of giftedness, the child prodigy
phenomenon, scientific talent in the case of Nobel laureates, entrepreneurial
giftedness, managerial talent, new assessment procedures for the identification of
the gifted, as well as high intellectual and creative educational multimedia
technologies (HICEMTs) aimed at developing potential abilities of gifted and
talented individuals.
Over the years Dr. Shavinina’s research has expanded to encompass innovation.
Her bestselling International Handbook on Innovation (1171 pages), published by
Elsevier Science in 2003, was the first and only book of its type, and is considered
the beginning of innovation science. It is aimed at unifying the field of innovation:
at merging psychological, management, and business perspectives together. She
introduced innovation education as a new direction in gifted education.
Innovation is also an important element in Dr. Shavinina’s research on giftedness
and economy.
Her publications have appeared in Gifted Child Quarterly, Journal for the
Education of the Gifted, High Ability Studies, Creativity Research Journal, Review
of General Psychology, New Ideas in Psychology, and others. She co-edited

L. V. Shavinina 88
CyberEducation and Beyond Knowledge. Her International Handbook on
Giftedness (1539 pages) has been recently published in 2 parts by Springer
Science & Business Media. This Handbook sets a new standard for the field and
will be essential to scholars’ knowledge base for years to come.
Instructions to authors
The Journal
Talent Development and Excellence is an international scholarly journal.
Manuscripts should be written in accordance with the publication manual of the American
Psychological Association. See http://apastyle.apa.org/
Manuscripts must be written in English. It is recommended that non-native English speakers
have their papers checked in regard to language accuracy prior to submission.
Submission and Reviewing
Manuscripts may be submitted electronically to one of the Editors-in-Chief.
All personal data will be removed by the Editor prior to the refereeing process to allow for a
masked review.
Manuscript
Length: A paper submitted should not exceed 6000 words including abstract, references,
illustrations and appendixes.
Abstract: An abstract should consist of a maximum 125 words. The abstract must, if it is the
result of an empirical research, briefly outline theoretical basis, research question/s,
methodology and instrumentation, sample/s and important characteristics (e.g. number,
gender and age) as well as the main findings of the study. Also, it should include main
conclusions. An abstract for a theoretical article or a review should describe the topic, the
objective or thesis and the scope of the article. It should also outline the main conclusions.
Footnotes should be numbered consecutively with superscript Arabic numerals.
If reporting statistics, sufficient information must be included according to the APA Manual.
Figures and Tables
Figures and Tables must be placed on separate pages; not included in the text. They should be
submitted as separate file/s. Figures and Tables must have an Arabic number, an explaining
text and a title. Their approximate place in the text should be clearly indicated.
Authors should follow APA format in designing tables and figures and consider the fact that illustrations supplements - not duplicates - the text. In the text, refer to every table and figure
and tell the reader what to look for. Discuss only the table's highlights.
Presentation of the Authors
For the presentation of the Author(s) please hand in a digital photograph (min. 300 dpi,
4x5 cm/ 1.6x2 inch) and a description of yourself (max. 100 words).
If you have any questions about references or formatting your article, please contact the
Editors-in-Chief.
Copyright
It is a condition of publication that authors assign copyright or licence the publication
rights in their articles, including abstracts, to the International Research Association for
Talent Development and Excellence. Authors are themselves responsible for obtaining
permission to reproduce copyright material from other sources.

ISSN 1869-0459 (print)/ ISSN 1869-2885 (online)
kfu Printing Press 1959