Combining Excellence - Superior Industries
128
Combining Excellence 2017 Annual Report
-
Upload
khangminh22 -
Category
Documents
-
view
0 -
download
0
Transcript of Combining Excellence - Superior Industries

Combining Excellence
2017
Annual Report

TRANSFORMATION
1 Southfield, Michigan • World Headquarters
2 Fayetteville, Arkansas • Production • Engineering R&D Center
3 Chihuahua, Mexico • Production • Shared Services Center
1 Bad Dürkheim, Germany • European Office • Logistic Center (Accessory)
2 Werdohl / Lüdenscheid, Germany • Production • Engineering R&D Center
3 Stalowa Wola, Poland • Production • Tool Shop
4 Fußgönheim, Germany • Motorsports and Forged Wheel Production
• Prototype Development and Production
NORTH AMERICAN LOCATIONS
2
4
EUROPEAN LOCATIONS
3
1
2
3
DIVERSIFIED GEOGRAPHY
2016 2017
$733M
$619M
$1.4B
$732M
EuropeNorth America
1) 2017 Net Sales based on full twelve months of sales for Europe. For U.S. GAAP purposes, Europe has been consolidated for the seven months since June 1, 2017.
NET SALES BY GEOGRAPHY1
1
1) 2017 Net Sales based on full twelve months of sales for Europe. For US GAAP purposes, Europe has been consolidated for the seven months since June 1, 2017.

2016 TOP 3 = 82% (NET SALES)2
DIVERSIFIED CUSTOMERS
1
OUR VISION
OUR COMPANY• We strive to be a provider of
world class products to the global mobility industry and to be best in class in the markets we serve.
• As a technology and quality leader, Superior desires to be the employer, the partner and the investment of choice.
• Together we work to maximize sustainable value and to achieve returns for our shareholders.
• #1 North American OEM wheel supplier
• #3 European OEM wheel supplier
• #1 European aftermarket wheel supplier
• 9 Manufacturing facilities
• ~21M wheels sold2
OTHER
OTHER
2017 TOP 3 = 46% (NET SALES)2
DIVERSIFIED PRODUCT
Our AftermarketBrands
2) 2017 Wheels Sold and Sales by Customer based on full twelve months of sales for Europe. For US GAAP purposes, Europe has been consolidated for the seven months since June 1, 2017.

In the 60th year since our founding, I am extremely excited to tell you about the transformation taking place at Superior. With the acquisition of Uniwheels AG in May of 2017, our Company took a major step toward delivering on our strategic plan as we became one of the largest light vehicle aluminum wheel suppliers in the world. In this ongoing evolution, we now employ approximately 8,000 team members, operating in nine manufacturing facilities in the United States, Germany, Mexico, and Poland with a combined annual manufacturing capacity of approximately 22 million wheels. We are the largest OEM aluminum wheel supplier in North America, the third largest OEM aluminum wheel supplier in Europe, and the aluminum wheel leader in the European aftermarket and, as a result, Superior is positioned better than ever to compete and serve our global customer base.
The acquisition of Uniwheels grew our geographic reach into Europe, expanded our product portfolio into the aftermarket and significantly diversified our customer base. Net sales for 2018 is expected to be split approximately 50% in Europe and 50% in North America (from almost 100% in North America one year ago), while close to 10% of those revenues will be from our newly acquired aftermarket and motorsport businesses. The acquisition expanded our customer base by adding Audi, Jaguar, Land Rover and Mercedes, to name a few, and it substantially diversified our revenue stream.
The acquisition has essentially doubled our innovation and technology portfolio as we now assist our customers in both North America and Europe to meet their requirements for customized and lighter weight products to meet ever-changing carbon emission and fuel efficiency targets, while being aesthetically pleasing. We are pleased to announce that we were awarded a patent in 2017 for our AluLite™ technology, which reduces the weight of a wheel by as much as 10%. Additionally, as customers seek greater customization, we continue to increase our offerings of specialized product inscriptions through pad printing and laser etching.
Beyond the acquisition of Uniwheels, we are also enjoying revenue growth opportunities presented by the market trends of larger diameter wheels, more aggressive styling, and more sophisticated finishes. Capitalizing on this projected increased content, we have shifted from a focus on high volume wheel programs to wheels with increased technical content, greater differentiation, and higher revenues. With the market focus on premium
DEAR FELLOW SHAREHOLDERS,
SUPERIOR IS A LEADING GLOBAL PROVIDER OF INNOVATIVE WHEEL SOLUTIONS FOR THE MOBILITY INDUSTRY.
2

finishes, we are excited to be in the midst of launching our new physical vapor deposition facility in Mexico, making Superior the first wheel supplier in North America and Europe to apply these high-end finishes in-house.
We delivered strong financial results in 2017 with net sales exceeding $1.1 billion, an increase of 51% from last year, while our adjusted EBITDA of $140 million increased 58%. As we look forward to 2018, we are focused on continuing down the path toward operational excellence, integration of our global operations, new business wins, and solid financial performance.
The considerable changes in our business in 2017 extended to Superior’s leadership team as well. We welcomed five new management team members – Joanne Finnorn as SVP General Counsel and Corporate Secretary; Wolfgang Hiller as SVP European Operations and Aftermarket; Nadeem Moiz as EVP and CFO; Karsten Obenaus as SVP and CFO Europe; and Rob Tykal as SVP North American Operations. With these additions, the senior leadership team is focused on driving excellence in our business and maximizing the benefits of our combined organization.
A transformation of the magnitude we experienced in 2017 requires extraordinary efforts by highly functioning teams. As I look back on all that we accomplished together last year, I wish to thank our employees for their significant contributions and dedication. I would also like to welcome our new employees in Germany and Poland and recognize their contributions as we came together as one organization. I am grateful to our Board of Directors for their guidance and support, to Jack Hockema who will retire from our Board and his role as Chair of our Nominating and Corporate Governance Committee after years of significant contributions, to our customers for their collaboration and the confidence they place in us, and to you, our shareholders, for your continued trust.
Sincerely,
Don Stebbins
“WE NOW EMPLOY APPROXIMATELY 8,000 TEAM MEMBERS, OPERATING IN NINE MANUFACTURING FACILITIES IN NORTH AMERICA AND EUROPE WITH A COMBINED ANNUAL MANUFACTURING CAPACITY OF APPROXIMATELY 22 MILLION WHEELS.”
“WE DELIVERED STRONG FINANCIAL RESULTS IN 2017 WITH NET SALES EXCEEDING $1.1 BILLION, AN INCREASE OF 51% FROM LAST YEAR, WHILE OUR ADJUSTED EBITDA OF $140 MILLION INCREASED 58%.”

($ in millions, Units in thousands)
2015 2016 2017
Units 11,244 12,260 17,008
Net Sales $727.9 $732.7 $1,108.1
Value-Added Sales $360.8 $408.7 $ 616.8
Value-Added Sales per Wheel $32.09 $33.34 $ 36.27
Gross Profit $ 71.2 $ 86.2 $ 102.9
Adj. EBITDA $ 76.1 $ 88.5 $ 140.1
Adj. EBITDA Margin (% of Value-Added Sales) 21% 22% 23%
UNITS(in thousands)
VALUE-ADDED SALES PER WHEEL
VALUE-ADDED SALES($ in millions)
ADJUSTED EBITDA MARGIN (% of Value-Added Sales)
KEY FINANCIAL FACTS
11,244
2015 2016 2017 2015 2016 2017
2015 2016 2017 2015 2016 2017
17,008 $616.8
12,260
$360.8$408.7
$32.09
$36.27 23%
$33.34 21%
22%
4

UNITED STATESSECURITIES AND EXCHANGE COMMISSION
WASHINGTON, D.C. 20549
FORM 10-KÈ ANNUAL REPORT PURSUANT TO SECTION 13 OR 15(d) OF THE SECURITIES
EXCHANGE ACT OF 1934For the fiscal year ended December 31, 2017
Commission file number: 1-6615
SUPERIOR INDUSTRIES INTERNATIONAL, INC.(Exact Name of Registrant as Specified in Its Charter)
Delaware 95-2594729(State or Other Jurisdiction ofIncorporation or Organization)
(I.R.S. EmployerIdentification No.)
26600 Telegraph Road, Suite 400Southfield, Michigan 48033
(Address of Principal Executive Offices) (Zip Code)
Registrant’s Telephone Number, Including Area Code: (248) 352-7300
Securities registered pursuant to Section 12(b) of the Act:Title of Each Class Name of Each Exchange on Which Registered
Common Stock, $0.01 par value New York Stock Exchange
Securities registered pursuant to Section 12(g) of the Act: None
Indicate by check mark if the registrant is a well-known seasoned issuer, as defined in Rule 405 of the Securities Act. Yes ‘ No È
Indicate by check mark if the registrant is not required to file reports pursuant to Section 13 or Section 15(d) of the Act. Yes ‘ No È
Indicate by check mark whether the registrant: (1) has filed all reports required to be filed by Section 13 or 15(d) of the Securities ExchangeAct of 1934 during the preceding 12 months (or for such shorter period that the registrant was required to file such reports), and (2) has beensubject to such filing requirements for the past 90 days. Yes È No ‘
Indicate by check mark whether the registrant has submitted electronically and posted on its corporate Web site, if any, every InteractiveData File required to be submitted and posted pursuant to Rule 405 of Regulation S-T (§ 232.405 of this chapter) during the preceding 12 months(or for such shorter period that the registrant was required to submit and post such files). Yes È No ‘
Indicate by check mark if the disclosure of delinquent filers pursuant to Item 405 of Regulation S-K (§ 229.405) is not contained herein, andwill not be contained, to the best of the registrant’s knowledge, in definitive proxy or information statements incorporated by reference in Part IIIof this Form 10-K or any amendment to this Form 10-K. ‘
Indicate by check mark whether the registrant is a large accelerated filer, an accelerated filer, a non-accelerated filer, a smaller reportingcompany or an emerging growth company. See the definitions of “large accelerated filer,” “accelerated filer,” “smaller reporting company” and“emerging growth company” in Rule 12b-2 of the Exchange Act.
Large accelerated filer ‘ Accelerated filer È
Non-accelerated filer ‘ Smaller reporting company ‘
Emerging growth company ‘
If an emerging growth company, indicate by check mark if the registrant has elected not to use the extended transition period for complyingwith any new or revised financial accounting standards provided pursuant to Section 13(a) of the Exchange Act. ‘
Indicate by check mark whether the registrant is a shell company (as defined in Rule 12b-2 of the Act). Yes ‘ No È
The aggregate market value of the registrant’s $0.01 par value common equity held by non-affiliates as of the last business day of theregistrant’s most recently completed second quarter was $486,960,608, based on a closing price of $19.55. On February 28, 2018, there were24,917,025 shares of common stock issued and outstanding.
DOCUMENTS INCORPORATED BY REFERENCEPortions of the registrant’s 2018 Proxy Statement, to be filed with the Securities and Exchange Commission within 120 days after the close of the
registrant’s fiscal year, are incorporated by reference into Part III of this Form 10-K.
SUPERIOR INDUSTRIES INTERNATIONAL, INC.ANNUAL REPORT ON FORM 10-K
TABLE OF CONTENTS
PART I PAGE
Item 1 Business. . . . . . . . . . . . . . . . . . . . . . . . . . . . . . . . . . . . . . . . . . . . . . . . . . . . . . . . . . . . . . . 1Item 1A Risk Factors. . . . . . . . . . . . . . . . . . . . . . . . . . . . . . . . . . . . . . . . . . . . . . . . . . . . . . . . . . . . . 7Item 1B Unresolved Staff Comments. . . . . . . . . . . . . . . . . . . . . . . . . . . . . . . . . . . . . . . . . . . . . . . . 20Item 2 Properties. . . . . . . . . . . . . . . . . . . . . . . . . . . . . . . . . . . . . . . . . . . . . . . . . . . . . . . . . . . . . . 20Item 3 Legal Proceedings. . . . . . . . . . . . . . . . . . . . . . . . . . . . . . . . . . . . . . . . . . . . . . . . . . . . . . . . 20Item 4 Mine Safety Disclosures. . . . . . . . . . . . . . . . . . . . . . . . . . . . . . . . . . . . . . . . . . . . . . . . . . . 20Item 4A Executive Officers of the Registrant. . . . . . . . . . . . . . . . . . . . . . . . . . . . . . . . . . . . . . . . . . 21
PART IIItem 5 Market for Registrant’s Common Equity, Related Stockholder Matters and Issuer
Purchases of Equity Securities. . . . . . . . . . . . . . . . . . . . . . . . . . . . . . . . . . . . . . . . . . . . 23Item 6 Selected Financial Data. . . . . . . . . . . . . . . . . . . . . . . . . . . . . . . . . . . . . . . . . . . . . . . . . . . . 25Item 7 Management’s Discussion and Analysis of Financial Condition and Results of
Operations. . . . . . . . . . . . . . . . . . . . . . . . . . . . . . . . . . . . . . . . . . . . . . . . . . . . . . . . . . . . 27Item 7A Quantitative and Qualitative Disclosures About Market Risk. . . . . . . . . . . . . . . . . . . . . . 49Item 8 Financial Statements and Supplementary Data. . . . . . . . . . . . . . . . . . . . . . . . . . . . . . . . . . 52Item 9 Changes in and Disagreements With Accountants on Accounting and Financial
Disclosure. . . . . . . . . . . . . . . . . . . . . . . . . . . . . . . . . . . . . . . . . . . . . . . . . . . . . . . . . . . . 103Item 9A Controls and Procedures. . . . . . . . . . . . . . . . . . . . . . . . . . . . . . . . . . . . . . . . . . . . . . . . . . . 103Item 9B Other Information. . . . . . . . . . . . . . . . . . . . . . . . . . . . . . . . . . . . . . . . . . . . . . . . . . . . . . . . 104
PART IIIItem 10 Directors, Executive Officers and Corporate Governance. . . . . . . . . . . . . . . . . . . . . . . . . 105Item 11 Executive Compensation. . . . . . . . . . . . . . . . . . . . . . . . . . . . . . . . . . . . . . . . . . . . . . . . . . 105Item 12 Security Ownership of Certain Beneficial Owners and Management and Related
Stockholder Matters. . . . . . . . . . . . . . . . . . . . . . . . . . . . . . . . . . . . . . . . . . . . . . . . . . . . 105Item 13 Certain Relationships and Related Transactions, and Director Independence. . . . . . . . . . 105Item 14 Principal Accountant Fees and Services. . . . . . . . . . . . . . . . . . . . . . . . . . . . . . . . . . . . . . . 105
PART IVItem 15 Exhibits and Financial Statement Schedules. . . . . . . . . . . . . . . . . . . . . . . . . . . . . . . . . . . 106Schedule II Valuation and Qualifying Accounts. . . . . . . . . . . . . . . . . . . . . . . . . . . . . . . . . . . . . . . . . . 110
SIGNATURES

CAUTIONARY STATEMENT REGARDING FORWARD-LOOKING INFORMATION
The Private Securities Litigation Reform Act of 1995 provides a safe harbor for forward-looking statementsmade by us or on our behalf. We have included or incorporated by reference in this Annual Report on Form 10-K(including in the sections entitled “Risk Factors” and “Management’s Discussion and Analysis of FinancialCondition and Results of Operations”) and from time to time our management may make statements that mayconstitute “forward-looking statements” within the meaning of Section 27A of the Securities Exchange Act of1933 and Section 21E of the Securities Act of 1934. These forward-looking statements are based uponmanagement’s current expectations, estimates, assumptions and beliefs concerning future events and conditionsand may discuss, among other things, anticipated future performance (including sales and earnings), expectedgrowth, future business plans and costs and potential liability for environmental-related matters. Any statementthat is not historical in nature is a forward-looking statement and may be identified by the use of words andphrases such as “expects,” “anticipates,” “believes,” “will,” “will likely result,” “will continue,” “plans to” andsimilar expressions. These statements include our belief regarding general automotive industry and marketconditions and growth rates, as well as general domestic and international economic conditions.
Readers are cautioned not to place undue reliance on forward-looking statements. Forward-looking statementsare necessarily subject to risks, uncertainties and other factors, many of which are outside the control of thecompany, which could cause actual results to differ materially from such statements and from the company’shistorical results and experience. These risks, uncertainties and other factors include, but are not limited to, thosedescribed in Part I, Item 1A, “Risk Factors” and Part II - Item 7, “Management’s Discussion and Analysis ofFinancial Condition and Results of Operations” of this Annual Report on Form 10-K and elsewhere in theAnnual Report and those described from time to time in our other reports filed with the Securities and ExchangeCommission.
Readers are cautioned that it is not possible to predict or identify all of the risks, uncertainties and other factorsthat may affect future results and that the risks described herein should not be considered to be a complete list.Any forward-looking statement speaks only as of the date on which such statement is made, and the companyundertakes no obligation to update or revise any forward-looking statement, whether as a result of newinformation, future events or otherwise.

ITEM 1 - BUSINESS
Description of Business and Industry
The principal business of Superior Industries International, Inc. (referred to herein as the “company” or “we,”“us” and “our”) is the design and manufacture of aluminum wheels for sale to original equipment manufacturers(“OEMs”) and aftermarket customers. We believe we are the #1 North American aluminum wheel supplier, the#3 European OEM supplier and #1 European aftermarket supplier. Our OEM aluminum wheels are primarilysold for factory installation, as either standard equipment or optional equipment, on approximately 180 vehiclemodels manufactured by Audi, BMW, Fiat Chrysler Automobiles N.V. (“FCA”), Ford, General Motors (“GM”),Jaguar-Land Rover, Mercedes-Benz, Mitsubishi, Nissan, Subaru, Tesla, Toyota, Volkswagen and Volvo. NorthAmerica and Europe represent the principal markets for our products but we have a global presence andopportunities with North American, European and Asian OEMs. The following chart below included twelvemonths of proforma sales for our European operations for informational purposes. All of the other charts in thisdocument include seven months of sales for our European operations, which aligns with the acquisition date. OnMay 30, 2017, we acquired a majority interest in Uniwheels AG (“Uniwheels”), which is also referred to as our“European operations.”
CUSTOMER SALES PERCENTAGES FOR 2016 AND 2017 ASSUMING 12 MONTHS OF UNIWHEELS
30%
14%
12%
6%
0%
Ford
2016 PERCENT SALES BY CUSTOMER
GM
Toyota
Other
FCA
10% 20% 30% 40%
38%19%
18%
16%
12%
8%
8%
5%
8%
6%
Other
Ford
GM
Toyota
VW/Audi
Aftermarket
Nissan
Mercedes
Volvo
2017 PERCENT SALES BY CUSTOMER
0% 5% 10% 15% 20%
With the acquisition of our European operations in 2017, we diversified our customer base from predominatelyNorth American to include Europe and North America. The following chart demonstrates the shift indiversification of our business from 2016 to 2017.
DIVERSIFICATION
2016 SALES BY CUSTOMER REGION
NorthAmerica
99%
Other 1%
2017 SALES BY CUSTOMER REGION
NorthAmerica
Europe*
65%
34%
Other 1%*Includes the 7 months of Europe sales after acquisition
1

Uniwheels is a European supplier of OEM aluminum wheels and also a supplier of European aftermarketaluminum wheels. As a result of the acquisition, we have expanded into the European market, broadened ourproduct portfolio and acquired a significant customer share with European OEMs, including Audi, Jaguar-LandRover, Mercedes Benz and Volvo. The acquisition is not only complementary in terms of customers, marketcoverage and product offerings but also very much aligned with our strategic direction with a focus on largerdiameter wheels, premium finishes, luxury brands and specialty wheels for high performance motorsport racingvehicles, all providing enhanced opportunity for higher value added business. With the acquisition, our globalreach encompasses sales to nine of the ten largest OEMs in the world with sales surpassing $1.1 billion. Thefollowing charts show key highlights of 2017 and sales by major customer based on seven months of Uniwheels.The chart includes net income from operations and Adjusted EBITDA, which is a key metric we use to measureoperating performance but is not calculated according to GAAP.
SALES BY CUSTOMER AND PROFITABILITY
0% 5% 10% 15% 20% 25%
Other
Ford
GM
Toyota
VW/Audi
Aftermarket
Nissan
Mercedes
Volvo
22%
20%
19%
9%
8%
6%
6%
6%
4%
2017 Sales by Customer (7 Months Uniwheels)
2015
2016
2017
Income from Operations for 2015 to 2017
$36.3
$54.6
$44.3*
$21.5
2015
2016
2017
$76.1
$88.5
$140.1
Growth in Adj.EBITDA from 2015
84%
Adjusted EBITDA* for 2015 to 2017
* Income from operations in 2017includes $44.3 million in costs relatedto acquisition costs and integrationcosts.
* See the Non-GAAP Financial Measuressection of this annual report for areconciliation of our Adjusted EBIDAto income from operations.
Historically, the focus of the Company was on providing wheels for relatively high-volume programs with lowerdegrees of competitive differentiation. In order to improve our strategic position and better serve our customers,we are augmenting our product portfolio with wheels containing higher technical content and greaterdifferentiation. We believe this direction is consistent with current trends in the market and needs of ourcustomers. To achieve this objective, we have invested and continue to invest in new manufacturing capabilitiesin order to produce more sophisticated finishes and larger diameter products, which typically provide highervalue in the market. The acquisition of our European operations and the construction of a new finishing facilityalign with this strategic mission. We have constructed a physical vapor deposition (“PVD”) finishing facility,which we believe will establish us as the first OEM automotive wheel manufacturer to have this capabilityin-house in North America and Europe. PVD is a wheel coating process that creates bright chrome-like surfacesin an environmentally friendly manner.
Demand for our products is mainly driven by light-vehicle production levels in North America and Europe. TheNorth American light-vehicle production level in 2017 was 17.0 million vehicles, a 4.7 percent decrease from2016. Despite this decrease, the 2017 North American production level was one of the highest in the history ofthe industry. In Europe, the passenger car and light duty truck vehicle production level in 2017 was 18.7 millionvehicles, a 0.3 percent increase over 2016. We track annual production rates based on information from Ward’sAutomotive Group, as well as other sources. The majority of our customers’ wheel programs are awarded tosuppliers two or three years in advance. Our purchase orders with OEMs are typically specific to a particularvehicle model.
Raw Materials
The raw materials used in manufacturing our products are readily available and are obtained through numeroussuppliers with whom we have established trade relations. Purchased aluminum accounted for the vast majority of
2

our total raw material requirements during 2017. Our aluminum requirements are met through purchase orderswith major producers, with physical supply primarily obtained from in-country production locations. Generally,aluminum purchase orders are fixed as to minimum and maximum quantities, which the producers must supplyand we must purchase during the term of the orders. During 2017, we were able to successfully secure aluminumcommitments from our primary suppliers to meet production requirements, and we anticipate being able tosource aluminum requirements to meet our expected level of production in 2018. We procure other raw materialsthrough numerous suppliers with whom we have established trade relationships. We also enter into commodityforward contracts and swaps covering up to twelve months aftermarket production volume in which thealuminum price is linked to the London Metal Exchange (LME) index. Moreover, in both our North Americanand European businesses, OEM wheel sale prices are adjusted for fluctuating aluminum commodity prices basedon changes in commodity indices.
When market conditions warrant, we may also enter into purchase commitments to secure the supply of certaincommodities used in the manufacture of our products, such as aluminum, natural gas and other raw materials.
Customer Dependence
We have proven our ability to be a consistent producer of high quality aluminum wheels with the capability tomeet our customers’ price, quality, delivery and service requirements. We strive to continually enhance ourrelationships with our customers through continuous improvement programs, not only through our manufacturingoperations but in the engineering, design, development and quality areas as well. These key businessrelationships have resulted in multiple vehicle supply contract awards with our key customers in the past fewyears.
Ford and GM were our only customers individually accounting for more than 10 percent of our consolidatedtrade sales in 2017. Net sales to these customers, as well as Toyota, in 2017, 2016 and 2015 were as follows(dollars in millions):
2015 2016 2017
Percent ofNet Sales Dollars
Percent ofNet Sales Dollars
Percent ofNet Sales Dollars
Ford . . . . . . . . . . . . . . . . . . . . . . . . . . . . . . . . . . . . . . 44% $315.1 38% $271.4 22% $248.8GM . . . . . . . . . . . . . . . . . . . . . . . . . . . . . . . . . . . . . . 24% $175.6 30% $216.4 20% $217.5Toyota . . . . . . . . . . . . . . . . . . . . . . . . . . . . . . . . . . . . 14% $104.5 14% $ 98.4 9% $103.8
In addition, sales to Nissan and Volkswagen Group (“VW”), which includes Audi, exceeded 5 percent of salesduring 2017, and sales to Mercedes and Volvo for the seven months following the acquisition of Uniwheelsexceeded 5 percent during 2017 on an annualized basis. The loss of all or a substantial portion of our sales toFord, GM, Toyota, Nissan, VW, Mercedes or Volvo would have a significant adverse effect on our financialresults. See also Item 1A, “Risk Factors” of this Annual Report.
Foreign Operations
We manufacture a significant portion of our North American products in Mexico that are sold both in the UnitedStates and Mexico. Net sales of wheels manufactured in our Mexico operations in 2017 totaled $608.0 millionand represented 83.0 percent of our total net sales in North America. We anticipate that the portion of ourproducts produced in Mexico versus the United States will remain comparable in 2018. Net property, plant andequipment used in our operations in Mexico totaled $214.5 million at December 31, 2017. The overall cost for usto manufacture wheels in Mexico currently is lower than in the United States, due to lower labor costs as a resultof lower prevailing wage rates.
Similarly, we manufacture the majority of our products for the European market in Poland, which are soldthroughout Europe. Net sales of wheels manufactured in our Poland operations for the seven months following
3

the acquisition were $220.4 million and represented 58.7 percent of our total net sales in Europe in 2017. Netproperty, plant and equipment used in our operations in Poland totaled $227.3 million at December 31, 2017.Similar to our Mexican operations, the overall cost to manufacture wheels in Poland is substantially lower than inboth the United States and Germany at the present time due principally to lower labor costs.
Cost of manufacturing our product in Mexico, Germany and Poland may be affected by changes in coststructures, tariffs imposed by the United States, trade protection laws, policies and other regulations affectingtrade and investments, social, political, labor, or general economic conditions. Other factors that can affect thebusiness and financial results of our Mexican, German, Polish and U.S. operations include, but are not limited to,currency effects of the Peso, Euro and Zloty currencies, availability and competency of personnel and taxregulations. See also Item 1A, “Risk Factors - Our international operations and international trade agreementsmake us vulnerable to risks associated with doing business in foreign countries that can affect our business,financial condition and results of operations” and Item 1A, “Risk Factors - Fluctuations in foreign currenciesmay adversely impact our financial condition.”
Net Sales Backlog
Our customers typically award programs several years before actual production is scheduled to begin. Each year,the automotive manufacturers introduce new models, update existing models and discontinue certain models. Inthis process, we may be selected as the supplier on a new model, we may continue as the supplier on an updatedmodel or we may lose a new or updated model to a competitor. The Company’s estimated net sales may beimpacted by various assumptions, including new program vehicle production levels, customer price reductions,currency exchange rates and program launch timing. Our customers may terminate the awarded programs at anytime or reduce order levels. Therefore, expected net sales information does not represent firm commitments orfirm orders. We estimate that we have been awarded programs covering approximately 89 percent of ourmanufacturing capacity over the next three years.
Competition
Competition in the market for aluminum wheels is based primarily on delivery, overall customer service, price,quality and technology. We are the largest producer of aluminum wheels for OEM installations in North Americaand one of the largest in Europe. We currently supply approximately 20 percent and 14 percent of the aluminumwheels installed on passenger cars and light-duty trucks in North America and Europe, respectively.
Competition is global in nature with a significant volume of exports from Asia into North America. There areseveral competitors with facilities in North America but we estimate that we have more than twice the NorthAmerican production capacity of any competitor. Some of the key competitors in North America include CentralMotor Wheel of America (“CMWA”), CITIC Dicastal Co., Ltd., Prime Wheel Corporation, and Ronal. In 2017,the European Union renewed a tariff on aluminum wheels from China, which lessens the competitive pressuresfrom Chinese competitors in that market. Key European competitors include Ronal (Switzerland), Borbet(Germany) and CMS (Turkey). The accessories market, by contrast, is heavily fragmented. We are the leadingmanufacturer of alloy wheels in the European aftermarket. Key competitors include Alcar (Austria), Brock(Germany), Borbet (Germany), ATU (Germany) and Mak (Italy). See also Item 1A, “Risk Factors” of thisAnnual Report.
Steel and other types of wheels also compete with our products. According to Ward’s Automotive Group, thealuminum wheel penetration rate on passenger cars and light-duty trucks in North America was 87 percent for the2017 model year and 81 percent for the 2016 model year, compared to 79 percent for the 2015 model year. Thealuminum wheel penetration rate on passenger cars and light-duty trucks in Europe was 70 percent in 2017. Weexpect the aluminum wheel penetration rate to continue to increase. However, several factors can affect this rateincluding price, fuel economy requirements and styling preference. Although aluminum wheels currently aremore costly than steel, aluminum is a lighter material than steel, which is desirable for fuel efficiency andgenerally viewed as aesthetically superior to steel and, thus, more desirable to the OEMs and their customers.
4

Research and Development
Our policy is to continuously review, improve and develop our engineering capabilities to satisfy our customerrequirements in the most efficient and cost-effective manner available. We strive to achieve this objective byattracting and retaining top engineering talent and by maintaining the latest state-of-the-art computer technologyto support engineering development. Fully developed engineering centers located in Fayetteville, Arkansas, andin Lüdenscheid, Germany support our research and development manufacturing needs. We also have a technicalsales function at our corporate headquarters in Southfield, Michigan that maintains a complement of engineeringstaff located near some of our largest customers’ headquarters and engineering and purchasing offices.
Research and development costs (primarily engineering and related costs), which are expensed as incurred, areincluded in cost of sales in our consolidated income statements. Research and development costs during each ofthe last three years were $7.7 million in 2017, $3.8 million in 2016 and $2.6 million in 2015.
Government Regulation
Safety standards in the manufacture of vehicles and automotive equipment have been established under theNational Traffic and Motor Vehicle Safety Act of 1966, as amended. We believe that we are in compliance withall federal standards currently applicable to OEM suppliers and to automotive manufacturers.
Environmental Compliance
Our manufacturing facilities, like most other manufacturing companies, are subject to solid waste, water and airpollution control standards mandated by federal, state and local laws. Violators of these laws are subject to finesand, in extreme cases, plant closure. We believe our facilities are in material compliance with all presentlyapplicable standards. However, costs related to environmental protection may grow due to increasingly stringentlaws and regulations. The cost of environmental compliance was approximately $0.6 million in 2017,$0.4 million in 2016 and $0.7 million in 2015. We expect that future environmental compliance expenditures willapproximate these levels and will not have a material effect on our consolidated financial position or results ofoperations. However, climate change legislation or regulations restricting emission of “greenhouse gases” couldresult in increased operating costs and reduced demand for the vehicles that use our products. See also Item 1A,“Risk Factors - We are subject to various environmental laws” of this Annual Report.
In response to climate change, the reduction of greenhouse gas emissions is on the agenda of the Europeanauthorities. As a result, the EU has made a commitment in an EU Directive to reduce emissions by at least20 percent by the year 2020 (measured on 1990 levels). Passenger cars have been identified as a key causal factorin emissions. A central element of the regulation is an average CO2 emissions target of 95g CO2 / km per newcar registration. From 2025 this target has been further tightened to an average of between 68 and 78g CO2 / km.This value should be reached by means of improvements to engine technology and innovative technologies interms of weight reduction.
Employees
As of December 31, 2017, we had approximately 7,800 full-time employees and 350 contract employeescompared to 4,189 full-time employees and 682 contract employees at December 31, 2016. None of ouremployees in North America are covered by a collective bargaining agreement. Uniwheels’ subsidiary,Uniwheels Production (Germany) GmbH (“UPG”), is a member of the employers’ association for the metal andelectronic industry in North Rhine-Westphalia (METALL NRW Verband der Metall und Elektro-Industrie NorthRhine-Westphalia e.V.) and is subject to various collective bargaining agreements for the metal and electronicindustry in North Rhine-Westphalia entered into by the employers’ association with the trade union IG Metall.These collective bargaining agreements include provisions relating to wages, holidays, and partial retirement. Itis estimated that approximately 410 employees of Uniwheels employed at UPG in Germany were unionized
5

and/or subject to collective bargaining agreements in 2017. UPG and Uniwheels Automotive (Germany) GmbH(operating a joint workers council) operate a statutory workers council and Uniwheels Production (Poland) Sp. zo.o. (“UPP”) operates a voluntary workers council. The increase in employees in 2017 was due to the acquisitionof the Uniwheels business in Europe. See Item 7, “Management’s Discussion and Analysis of FinancialConditions and Results of Operations.”
Fiscal Year End
The fiscal year of 2017 consisted of the 53-week period ended December 31, 2017 and the 2016 and 2015 fiscalyears consisted of the 52-week periods ended on December 25, 2016 and December 27, 2015, respectively.Historically, our fiscal year ended on the last Sunday of the calendar year. Uniwheels, our European operationacquired on May 30, 2017, is reported on a calendar year end. These fiscal periods align as of December 31,2017. Beginning in 2018, both our North American and European operations will be on a calendar fiscal yearwith each month ending on the last day of the calendar month. For convenience of presentation, all fiscal yearsare referred to as beginning as of January 1, and ending as of December 31, but actually reflect our financialposition and results of operations for the periods described above.
Segment Information
As a result of the Uniwheels acquisition, the company expanded into the European market and extended itscustomer base to include the principal European OEMs. As a consequence, we have realigned our executivemanagement structure, organization and operations to focus on our performance in our North American andEuropean regions. Accordingly, we have concluded that our North American and European businesses representseparate operating segments in view of significantly different markets and customers within each of theseregions. Financial information about our operating segments is contained in Note 6, “Business Segments” in theNotes to Consolidated Financial Statements in Item 8, “Financial Statements and Supplementary Data” of thisAnnual Report.
Seasonal Variations
The automotive industry is cyclical and varies based on the timing of consumer purchases of vehicles, which inturn varies based on a variety of factors such as general economic conditions, availability of consumer credit,interest rates and fuel costs. While there have been no significant seasonal variations in the past few years,production schedules in our industry can vary significantly from quarter to quarter to meet the schedulingdemands of our customers. Typically, our aftermarket business experiences two seasonal peaks, which requiresubstantially higher levels of production. The higher demand for aftermarket wheels from our customers occursin March and September leading into the spring and winter peak consumer selling seasons.
History
We were initially incorporated in Delaware in 1969. Our entry into the OEM aluminum wheel business in 1973resulted from our successful development of manufacturing technology, quality control and quality assurancetechniques that enabled us to satisfy the quality and volume requirements of the OEM market for aluminumwheels. The first aluminum wheel for a domestic OEM customer was a Mustang wheel for Ford MotorCompany. We reincorporated in California in 1994, and in 2015, we moved our headquarters from Van Nuys,California to Southfield, Michigan and reincorporated in Delaware. On May 30, 2017, we acquired a majorityinterest in Uniwheels, which is a European supplier of OEM and aftermarket aluminum wheels. Our stock istraded on the New York Stock Exchange under the symbol “SUP.”
Available Information
Our Annual Report on Form 10-K, quarterly reports on Form 10-Q and any amendments thereto are available,without charge, on or through our website, www.supind.com, under “Investors,” as soon as reasonably
6

practicable after they are filed electronically with the Securities and Exchange Commission (“SEC”). The publicmay read and copy any materials filed with the SEC at the SEC’s Public Reference Room at 100 F Street, NE,Washington, DC 20549. Information on the operation of the Public Reference Room can be obtained by callingthe SEC at 1-800-SEC-0330. The SEC also maintains a website, www.sec.gov, which contains these reports,proxy and information statements and other information regarding the company. Also included on our website,www.supind.com, under “Investor,” is our Code of Conduct, which, among others, applies to our ChiefExecutive Officer (“CEO”), Chief Financial Officer and Chief Accounting Officer. Copies of all SEC filings andour Code of Conduct are also available, without charge, upon request from Superior Industries International, Inc.,Shareholder Relations, 26600 Telegraph Road, Suite 400, Southfield, Michigan 48033.
The content on any website referred to in this Annual Report on Form 10-K is not incorporated by reference inthis Annual Report on Form 10-K.
ITEM 1A. Risk Factors
The following discussion of risk factors contains “forward-looking” statements, which may be important tounderstanding any statement in this Annual Report or elsewhere. The following information should be read inconjunction with Item 7, “Management’s Discussion and Analysis of Financial Condition and Results ofOperations (“MD&A”)” and Item 8, “Financial Statements and Supplementary Data” of this Annual Report.
Our business routinely encounters and addresses risks and uncertainties. Our business, results of operations andfinancial condition could be materially adversely affected by the factors described below. Discussion about theimportant operational risks that our business encounters can also be found in the MD&A section and in thebusiness description in Item 1, “Business” of this Annual Report. Below, we have described our present view ofthe most significant risks and uncertainties we face. Additional risks and uncertainties not presently known to us,or that we currently do not consider significant, could also potentially impair our business, results of operationsand financial condition. Our reactions to these risks and uncertainties as well as our competitors’ reactions willaffect our future operating results.
Risks Relating to Our Company
Efforts to integrate our Europe segment, including substantial integration expenses and the additionalindebtedness incurred to finance our acquisition of Uniwheels, could disrupt our business and adversely impactour stock price and future business and results of operations.
Since the acquisition of Uniwheels (now referred to as our “Europe segment,” “Europe business” or “Europeoperations”) on May 30, 2017 (the “Acquisition”), we have made significant strides toward integrating the twocompanies. However, the continuing integration of our Europe segment with our North America segment will bea complex and time-consuming process that may not be successful. The company has a limited history ofintegrating a significant acquisition into its business and the integration process may produce unforeseenoperating difficulties and expenditures. The primary areas of focus for successfully combining our Europesegment with our North American operations may include, among others: retaining and integrating managementand other key employees; realizing overall improvement in the design, engineering, start-up and production ofwheel programs; aligning customer interface across the combined business; integrating information,communications and other systems; and managing the growth of the combined company. Our integration effortscould disrupt our business in the following ways, among others, and any of the following could adversely affectour business, harm our financial condition, results of operations or business prospects:
• the attention of management may be directed toward the completion of the integration and othertransaction-related considerations and may be diverted from the day-to-day business operations ofSuperior, and matters related to the Acquisition may require commitments of time and resources thatcould otherwise have been devoted to other opportunities that might have been beneficial to us;
7

• our employees may experience uncertainty regarding their future roles in the combined company,which might adversely affect our ability to retain, recruit and motivate key personnel; and
• customers, suppliers and other third parties with business relationships with Superior may decide not torenew or may decide to seek to terminate, change and/or renegotiate their relationships with Superioras a result of the Acquisition, whether pursuant to the terms of their existing agreements with Superioror otherwise.
There are a large number of processes, policies, procedures, operations, technologies and systems that must beintegrated with the rest of our operations, including purchasing, accounting and finance, sales, billing, payroll,manufacturing, marketing and employee benefits. While we expect to incur integration and restructuring costsand other transaction-related costs following completion of the Acquisition that currently are estimated to rangebetween $5.0 million and $7.0 million, many of the expenses that will be incurred, especially with respect tomanufacturing operations are, by their nature, difficult to estimate accurately. These expenses could, particularlyin the near term, exceed the savings that we expect to achieve from elimination of duplicative expenses and therealization of economies of scale and cost savings. Although we expect that the realization of efficiencies relatedto the integration of the businesses will offset incremental transaction, Acquisition-related and restructuring costsover time, we cannot give any assurance that this net benefit will be achieved in the near term, or at all.
Even if we successfully integrate our Europe segment with our North American operations, there can be noassurance that we will realize the anticipated benefits. The Acquisition is expected to result in various benefitsfor the combined company including, among others, business growth opportunities and synergies in operations,purchasing and administration. Increased competition and/or deterioration in business conditions may limit ourability to expand this business. As such, we may not be able to realize the synergies, business opportunities andgrowth prospects anticipated in connection with the Acquisition.
The automotive industry is cyclical and volatility in the automotive industry could adversely affect our financialperformance.
The majority of our sales are made in European and domestic U.S. markets. Therefore, our financial performancedepends largely on conditions in the European and U.S. automotive industry, which in turn can be affectedsignificantly by broad economic and financial market conditions. Consumer demand for automobiles is subject toconsiderable volatility as a result of consumer confidence in general economic conditions, levels of employment,prevailing wages, fuel prices and the availability and cost of consumer credit. There can be no guarantee that theimprovements in recent years will be sustained or that reductions from current production levels will not occur infuture periods. Demand for aluminum wheels can be further affected by other factors, including pricing andperformance comparisons to competitive materials such as steel. Finally, the demand for our products isinfluenced by shifts of market share between vehicle manufacturers and the specific market penetration ofindividual vehicle platforms being sold by our customers.
A limited number of customers represent a large percentage of our sales. The loss of a significant customer ordecrease in demand could adversely affect our operating results.
Ford, GM and Toyota, together, represented 82 percent of our sales in 2016 and just more than half of our totalconsolidated combined sales in 2017. Despite the decrease in the combined percentage of our three largestcustomers in 2017, a loss of a significant customer or decrease in demand still remains a risk. Our OEMcustomers are not required to purchase any minimum amount of products from us. Increasingly globalprocurement practices, the pace of new vehicle introduction and demand for price reductions may make it moredifficult to maintain long-term supply arrangements with our customers, and there are no guarantees that we willbe able to negotiate supply arrangements with our customers on terms acceptable to us in the future. Thecontracts we have entered into with most of our customers provide that we will manufacture wheels for aparticular vehicle model, rather than manufacture a specific quantity of products. Such contracts range from one
8

year to the life of the model (usually three to five years), typically are non-exclusive and do not require thepurchase by the customer of any minimum number of wheels from us. Therefore, a significant decrease inconsumer demand for certain key models or group of related models sold by any of our major customers, or adecision by a manufacturer not to purchase from us, or to discontinue purchasing from us, for a particular modelor group of models, could adversely affect our results of operations and financial condition.
We operate in a highly competitive industry.
The automotive component supply industry is highly competitive, both domestically and internationally.Competition is based on a number of factors, including price, technology, quality, delivery and overall customerservice and available capacity to meet customer demands. Some of our competitors are companies, or divisionsor subsidiaries of companies, which are larger and have greater financial and other resources than we do. Wecannot ensure that our products will be able to compete successfully with the products of these competitors. Inparticular, our ability to increase manufacturing capacity typically requires significant investments in facilities,equipment and personnel. Our operating facilities are at full or near to full capacity levels which may cause us toincur labor costs at premium rates in order to meet customer requirements, experience increased maintenanceexpenses or require us to replace our machinery and equipment on an accelerated basis. Furthermore, the natureof the markets in which we compete has attracted new entrants, particularly from low cost countries. As a result,our sales levels and margins continue to be adversely affected by pricing pressures reflective of significantcompetition from producers located in low-cost foreign markets, such as China. Such competition with lowercost structures poses a significant threat to our ability to compete internationally and domestically. These factorshave led to our customers awarding business to foreign competitors in the past, and they may continue to do so inthe future. In addition, any of our competitors may foresee the course of market development more accurately,develop products that are superior to our products, have the ability to produce similar products at a lower cost oradapt more quickly to new technologies or evolving customer requirements. Consequently, our products may notbe able to compete successfully with competitors’ products.
We experience continual pressure to reduce costs.
The vehicle market is highly competitive at the OEM level, which drives continual cost-cutting initiatives by ourcustomers. Customer concentration, relative supplier fragmentation and product commoditization have translatedinto continual pressure from OEMs to reduce the price of our products. It is possible that pricing pressuresbeyond our expectations could intensify as OEMs pursue restructuring and cost-cutting initiatives. If we areunable to generate sufficient production cost savings in the future to offset such price reductions, our grossmargin, rate of profitability and cash flows could be adversely affected. In addition, changes in OEMs’purchasing policies or payment practices could have an adverse effect on our business. Our OEM customerstypically attempt to qualify more than one wheel supplier for the programs we participate in and for programs wemay bid on in the future. As such, our OEM customers are able to negotiate favorable pricing or may decreasewheel orders. Such actions may result in decreased sales volumes and unit price reductions for our company,resulting in lower revenues, gross profit, operating income and cash flows.
We may be unable to successfully implement cost-saving measures or achieve expected benefits under our plansto improve operations.
As part of our ongoing focus to provide high quality products, we continually analyze our business to furtherimprove our operations and identify cost-cutting measures. We may be unable to successfully identify orimplement plans targeting these initiatives, or fail to realize the benefits of the plans we have alreadyimplemented, as a result of operational difficulties, a weakening of the economy or other factors. Cost reductionsmay not fully offset decreases in the prices of our products due to the time required to develop and implementcost reduction initiatives. Additional factors such as inconsistent customer ordering patterns, increasing productcomplexity and heightened quality standards are making it increasingly more difficult to reduce our costs. It ispossible that as we incur costs to implement improvement strategies, the impact on our financial position, resultsof operations and cash flow may be negative.
9

Interruption in our production capabilities could result in increased freight costs or contract cancellations.
In the last six months of 2016, we experienced significant operating inefficiencies primarily in one of ourmanufacturing facilities. The inefficiencies stemmed from a variety of issues that reduced production rates.Contributing factors to the inefficiencies included an electricity outage and unanticipated equipment reliabilityissues which reduced finished goods and work-in-process inventories. We also experienced several new productlaunches and significant ramp-up in demand for newer products for which unusually high scrap rates wereoccurring. Lower than normal production yields coupled with the loss of inventory safety stock resulted in aseries of expedited shipments to customers. The higher than normal costs included approximately $13 million infreight expediting costs and additional costs related to the production inefficiencies. In 2017, we were able toreduce the expedited shipping costs to less than $1 million and have made strides toward improving theproduction inefficiencies at this plant. However, headcount at this plant remained at elevated levels in 2017 toensure we could meet new product launches, better serve our customers and avoid expedited shipping charges.
An interruption in production capabilities at any of our facilities as a result of equipment failure, interruption ofraw materials or other supplies, labor disputes or other reasons could result in our inability to produce ourproducts, which would reduce our sales and operating results for the affected period and harm our customerrelationships. We have, from time to time, undertaken significant re-tooling and modernization initiatives at ourfacilities, which in the past have caused, and in the future may cause, unexpected delays and plantunderutilization, and such adverse consequences may continue to occur as we continue to modernize ourproduction facilities. In addition, we generally deliver our products only after receiving the order from thecustomer and thus typically do not hold large inventories. In the event of a production interruption at any of ourmanufacturing facilities, even if only temporary, or if we experience delays as a result of events that are beyondour control, delivery times to our customers could be severely affected. Any significant delay in deliveries to ourcustomers could lead to premium freight costs and other performance penalties, as well as contract cancellations,and cause us to lose future sales and expose us to other claims for damages. Our manufacturing facilities are alsosubject to the risk of catastrophic loss due to unanticipated events such as fires, earthquakes, explosions orviolent weather conditions. We have in the past, and may in the future, experience plant shutdowns or periods ofreduced production which could have a material adverse effect on our results of operations or financial condition.
Similarly, it also is possible that our customers may experience production delays or disruptions for a variety ofreasons, which could include supply-chain disruption for parts other than wheels, equipment breakdowns or otherevents affecting vehicle assembly rates that impact us, work stoppages or slow-downs at factories where ourproducts are consumed, or even catastrophic events such as fires, disruptive weather conditions or naturaldisasters. Such disruptions at the customer level may cause the affected customer to halt or limit the purchase ofour products.
We may be unable to successfully launch new products and/or achieve technological advances.
In order to effectively compete in the automotive supply industry, we must be able to launch new products andadopt technology to meet our customers’ demands in a timely manner. However, we cannot ensure that we willbe able to install and certify the equipment needed for new product programs in time for the start of production,or that the transitioning of our manufacturing facilities and resources under new product programs will notimpact production rates or other operational efficiency measures at our facilities. In addition, we cannot ensurethat our customers will execute the launch of their new product programs on schedule. We are also subject to therisks generally associated with new product introductions and applications, including lack of market acceptance,delays in product development and failure of products to operate properly. Further, changes in competitivetechnologies may render certain of our products obsolete or less attractive. Our ability to anticipate changes intechnology and to successfully develop and introduce new and enhanced products on a timely basis will be asignificant factor in our ability to remain competitive. Our failure to successfully and timely launch new productsor adopt new technologies, or a failure by our customers to successfully launch new programs, could adverselyaffect our results. We cannot ensure that we will be able to achieve the technological advances that may benecessary for us to remain competitive or that certain of our products will not become obsolete.
10

Our international operations and international trade agreements make us vulnerable to risks associated withdoing business in foreign countries that can affect our business, financial condition and results of operations.
We manufacture a substantial portion of our products in Mexico, Germany and Poland and we sell our productsinternationally. Accordingly, unfavorable changes in foreign cost structures, trade protection laws, tariffs onaluminum, regulations and policies affecting trade and investments and social, political, labor or economicconditions in a specific country or region, among other factors, could have a negative effect on our business andresults of operations. Legal and regulatory requirements differ among jurisdictions worldwide. Violations ofthese laws and regulations could result in fines, criminal sanctions, prohibitions on the conduct of our businessand damage to our reputation. Although we have policies, controls and procedures designed to ensure compliancewith these laws, our employees, contractors, or agents may violate our policies.
Changes in North American and European Union (EU) social, political, regulatory and economic conditions or inlaws and policies governing foreign trade, manufacturing, development and investment in the countries where wecurrently develop and sell products could adversely affect our business. A significant portion of our businessactivities are conducted in Mexico. Current leadership in the U.S. federal government is not supportive of certainexisting international trade agreements, including the North American Free Trade Agreement (“NAFTA”). If theU.S. withdraws from or materially modifies NAFTA or certain other international trade agreements, ourbusiness, financial condition and results of operations could be adversely affected. In addition, proposals toinstitute a border adjustment of 20 percent for imports could have a negative impact on our operations.
Fluctuations in foreign currencies may adversely impact our financial condition.
Due to the growth of our operations outside of the United States, we have experienced increased exposure toforeign currency gains and losses in the ordinary course of our business. As a result, fluctuations in the exchangerate between the U.S. dollar, the Mexican peso, the Euro, the Polish Zloty and any currencies of other countriesin which we conduct our business may have a material impact on our financial condition, as cash flows generatedin foreign currencies may be used, in part, to service our U.S. dollar-denominated liabilities, or vice versa.
Fluctuations in foreign currency exchange rates may also affect the value of our foreign assets as reported in U.S.dollars, and may adversely affect reported earnings and, accordingly, the comparability of period-to-periodresults of operations. Changes in currency exchange rates may affect the relative prices at which we and ourforeign competitors sell products in the same market. In addition, changes in the value of the relevant currenciesmay affect the cost of certain items required in our operations. We cannot ensure that fluctuations in exchangerates will not otherwise have a material adverse effect on our financial condition or results of operations or causesignificant fluctuations in quarterly and annual results of operations.
Our business requires us to settle transactions between currencies in both directions - i.e., peso to U.S. dollar,Euro to U.S. Dollar, Euro to Zloty and vice versa for all transactions. To the greatest extent possible, we attemptto match the timing and magnitude of transaction settlements between currencies to create a “natural hedge.”Based on the current business model and levels of production and sales activity, the net imbalance betweencurrencies depends on specific circumstances. While changes in the terms of the contracts with our customerswill be creating an imbalance between currencies that we are hedging with foreign currency forward contracts,there can be no assurances that our hedging program will effectively offset the impact of the imbalance betweencurrencies or that the net transaction balance will not change significantly in the future.
To manage this risk, we may enter into foreign currency forward and option contracts with financial institutionsto protect against foreign exchange risks associated with certain existing assets and liabilities, certain firmlycommitted transactions and forecasted future cash flows. We have a program to hedge a portion of our materialforeign exchange exposures, typically for up to 42 months. However, we may choose not to hedge certain foreignexchange exposures for a variety of reasons including, but not limited to, accounting considerations and theprohibitive economic cost of hedging particular exposures. There is no guarantee that our hedge program willeffectively mitigate our exposures to foreign exchange changes which could have material adverse effects on ourcash flows and results of operations.
11

Our substantial indebtedness could adversely affect our financial condition
We have a significant amount of new indebtedness. As of December 31, 2017, our total debt was $707.9 million($683.6 million, net of unamortized debt issuance costs of $24.3 million), and we had availability of$157.2 million under the Senior Secured Credit Facilities, as well as 30.0 million Euros under a Europeanrevolving line of credit. The interest expense on the significant amount of new indebtedness will be significantlyhigher than historical interest expense and could adversely affect our financial condition.
Subject to the limits contained in the Credit Agreement governing the Senior Secured Credit Facilities and theindenture governing the Notes (the “Indenture”) and our other debt instruments, we may be able to incursubstantial additional debt from time to time to finance working capital, capital expenditures, investments oracquisitions, or for other purposes. If we do so, the risks related to our high level of debt could intensify.
In addition, the Indenture and the Credit Agreement governing the Senior Secured Credit Facilities containrestrictive covenants that will limit our ability to engage in activities that may be in our long-term best interest.Our failure to comply with those covenants could result in an event of default which, if not cured or waived,could result in the acceleration of all our debt.
We may not be able to generate sufficient cash to service all of our indebtedness, including the Notes, and maybe forced to take other actions to satisfy our obligations under our indebtedness, which may not be successful.
Our ability to make scheduled payments or to refinance our debt obligations depends on our financial andoperating performance, which is subject to prevailing economic, industry and competitive conditions and tocertain financial, business, economic and other factors beyond our control. We may not be able to maintain asufficient level of cash flow from operating activities to permit us to pay the principal, premium, if any, andinterest on the Notes and our other indebtedness.
If our cash flows and capital resources are insufficient to fund our debt service obligations, we may be forced toreduce or delay capital expenditures, sell assets, seek additional capital or seek to restructure or refinance ourindebtedness, including the Notes. Our ability to restructure or refinance our debt will depend on the condition ofthe capital and credit markets and our financial condition at such time. Any refinancing of our debt could be athigher interest rates and may require us to comply with more onerous covenants, which could further restrict ourbusiness operations and limit our financial flexibility. In addition, any failure to make payments of interest andprincipal on our outstanding indebtedness on a timely basis would likely result in a reduction of our credit rating,which could harm our ability to incur additional indebtedness. These alternative measures may not be successfuland may not permit us to meet our scheduled debt service obligations. In the absence of such cash flows andresources, we could face substantial liquidity problems and might be required to sell material assets or operationsto attempt to meet our debt service and other obligations. The Credit Agreement governing the Senior SecuredCredit Facilities and the Indenture will restrict our ability to conduct asset sales and/or use the proceeds fromasset sales. We may not be able to consummate these asset sales to raise capital or sell assets at prices and onterms that we believe are fair and any proceeds that we do receive may not be adequate to meet any debt serviceobligations then due. For more information on the Indenture, see Exhibit 4.2 to this Annual Report onForm 10-K. If we cannot meet our debt service obligations, the holders of our debt may accelerate our debt and,to the extent such debt is secured, foreclose on our assets. In such an event, we may not have sufficient assets torepay all of our debt.
The terms of the Credit Agreement governing the Senior Secured Credit Facilities and the Indenture will, and thedocuments governing other debt that we may incur in the future may, restrict our current and future operations,particularly our ability to respond to changes or to take certain actions.
The Indenture and the Credit Agreement governing the Senior Secured Credit Facilities, and the documentsgoverning other debt that we may incur in the future may, contain a number of restrictive covenants that impose
12

significant operating and financial restrictions on us and may limit our ability to engage in acts that may be in ourlong-term best interests, including restrictions on our ability to:
• incur additional indebtedness and guarantee indebtedness;
• create or incur liens;
• engage in mergers or consolidations or sell all or substantially all of our assets;
• sell, transfer or otherwise dispose of assets;
• make investments, acquisitions, loans or advances or other restricted payments;
• pay dividends or distributions, repurchase our capital stock or make certain other restricted payments;
• prepay, redeem, or repurchase any subordinated indebtedness;
• designate our subsidiaries as unrestricted subsidiaries;
• enter into agreements which limit the ability of our non-guarantor subsidiaries to pay dividends or makeother payments to us; and
• enter into certain transactions with our affiliates.
In addition, the restrictive covenants in the Credit Agreement governing the Senior Secured Credit Facilitiesrequire us to maintain specified financial ratios and satisfy other financial condition tests to the extent subject tocertain financial covenant conditions. Our ability to meet those financial ratios and tests can be affected by eventsbeyond our control. We may not meet those ratios and tests.
A breach of the covenants or restrictions under the Indenture governing the Notes or under the Credit Agreementgoverning the Senior Secured Credit Facilities could result in an event of default under the applicableindebtedness. Such a default may allow the creditors under such facility to accelerate the related debt, which mayresult in the acceleration of any other debt to which a cross-acceleration or cross-default provision applies. Inaddition, an event of default under the Credit Agreement governing our Senior Secured Credit Facilities wouldpermit the lenders under our revolving credit facility to terminate all commitments to extend further credit underthat facility. Furthermore, if we were unable to repay the amounts due and payable under the Senior SecuredCredit Facilities, those lenders could proceed against the collateral granted to them to secure that indebtedness.We have pledged substantially all of our assets as collateral under the Senior Secured Credit Facilities. In theevent our lenders or holders of the Notes accelerate the repayment of our borrowings, we may not have sufficientassets to repay that indebtedness or be able to borrow sufficient funds to refinance it. Even if we are able toobtain new financing, it may not be on commercially reasonable terms or on terms acceptable to us. As a result ofthese restrictions, we may be:
• limited in how we conduct our business;
• unable to raise additional debt or equity financing to operate during general economic or businessdownturns; or
• unable to compete effectively or to take advantage of new business opportunities. These restrictions, alongwith restrictions that may be contained in agreements evidencing or governing other future indebtedness,may affect our ability to grow or pursue other important initiatives in accordance with our growth.
Our variable rate indebtedness subjects us to interest rate risk, which could cause our debt service obligations toincrease significantly.
Borrowings under our Senior Secured Credit Facilities are at variable rates of interest and expose us to interestrate risk. If interest rates increase, our debt service obligations on the variable rate indebtedness could increaseeven though the amount borrowed remains the same, and our net income and cash flows, including cash available
13

for servicing our indebtedness, would correspondingly decrease. As of December 31, 2017, approximately$386.8 million of our debt was variable rate debt. Our anticipated annual interest expense on $386.8 millionvariable rate debt at the current rate of 6.05 percent would be $23.4 million. In the future, we may enter intointerest rate swaps that involve the exchange of floating for fixed rate interest payments in order to reduceinterest rate volatility. However, we may not maintain interest rate swaps with respect to all of our variable rateindebtedness, and any swaps we enter into may not fully mitigate our interest rate risk.
We are subject to taxation related risks in multiple jurisdictions.
We are a U.S.-based multinational company subject to tax in multiple U.S. and foreign tax jurisdictions.Significant judgment is required in determining our global provision for income taxes, deferred tax assets orliabilities and in evaluating our tax positions on a worldwide basis. While we believe our tax positions areconsistent with the tax laws in the jurisdictions in which we conduct our business, it is possible that thesepositions may be overturned by jurisdictional tax authorities, which may have a significant impact on our globalprovision for income taxes. Tax laws are dynamic and subject to change as new laws are passed and newinterpretations of the law are issued or applied. We are also subject to ongoing tax audits. These audits caninvolve complex issues, which may require an extended period of time to resolve and can be highly subjective.Tax authorities may disagree with certain tax reporting positions taken by us and, as a result, assess additionaltaxes against us. We regularly assess the likely outcomes of these audits in order to determine the appropriatenessof our tax provision.
On December 22, 2017, the Tax Cuts and Jobs Act (the “Tax Reform”) was signed into law. The newly enactedTax Reform, among other things, contains significant changes to corporate taxation, including the reduction ofthe corporate tax rate from 35 percent to 21 percent, a one-time transition tax on offshore earnings at reduced taxrates regardless of whether earnings are repatriated, the elimination of U.S. tax on foreign dividends (subject tocertain important exceptions), new taxes on certain foreign earnings, a new minimum tax related to payments toforeign subsidiaries and affiliates, immediate deductions for certain new investments and the modification orrepeal of many business deductions and credits.
The changes effected by the Tax Reform required us to remeasure existing net deferred tax liabilities using thelower rate in the period of enactment. We have reported provisional amounts for the income tax effects of TaxReform for which the accounting is incomplete but a reasonable estimate could be determined. Based on acontinued analysis of the estimates and further guidance on the application of the law, it is anticipated thatadditional revisions may occur throughout the allowable measurement period.
In addition, governmental tax authorities are increasingly scrutinizing the tax positions of companies. Manycountries in the European Union, as well as a number of other countries and organizations such as theOrganization for Economic Cooperation and Development, are actively considering changes to existing tax lawsthat, if enacted, could increase our tax obligations in countries where we do business. The impact of tax reform inthe US or other foreign tax law changes could result in an overall tax rate increase to our business.
Increases in the costs and restrictions on availability of raw materials could adversely affect our operatingmargins and cash flow.
Generally, we obtain our raw materials, supplies and energy requirements from various sources. Although wecurrently maintain alternative sources, our business is subject to the risk of price increases and periodic delays indelivery. Fluctuations in the prices of raw materials may be driven by the supply/demand relationship for thatcommodity or governmental regulation. In addition, if any of our suppliers seek bankruptcy relief or otherwisecannot continue their business as anticipated, the availability or price of raw materials could be adverselyaffected.
Although we are able to periodically pass certain aluminum cost increases on to our customers, we may not beable to pass along all changes in aluminum costs, or there may be a delay in passing the aluminum costs onto our
14

customers. Our customers are not obligated to accept energy or other supply cost increases that we may attemptto pass along to them. This inability to pass on these cost increases to our customers could adversely affect ouroperating margins and cash flow, possibly resulting in lower operating income and profitability.
Aluminum and alloy pricing may have a material effect on our operating margins and results of operations.
The cost of aluminum is a significant component in the overall cost of a wheel and in our selling prices to OEMcustomers. The price for aluminum we purchase is adjusted monthly based primarily on changes in certainpublished market indices, but the timing of such adjustments is based on specific customer agreements and canvary from monthly to quarterly. As a result, the timing of aluminum price adjustments flowing through salesrarely will match the timing of such changes in cost and can result in fluctuations to our gross profit. This isespecially true during periods of frequent increases or decreases in the market price of aluminum.
The aluminum we use to manufacture wheels also contains additional alloy materials, including silicon. The costof alloying materials also is a component of the overall cost of a wheel. The price of the alloys we purchase isalso based on certain published market indices; however, most of our customer agreements do not provide priceadjustments for changes in market prices of alloying materials. Increases or decreases in the market prices ofthese alloying materials could have a material effect on our operating margins and results of operations.
There is a risk of discontinuation of anti-dumping duty from China which may increase the competitive pressurefrom Chinese producers, primarily in the aftermarket.
In 2010, the European Commission imposed provisional anti-dumping duties of 22.3 percent on imports ofaluminum road wheels from China after a complaint of unfair competition from European manufacturers. TheEuropean Commission argued that the EU manufacturers had suffered a significant decrease in production andsales, and a loss of market share, as well as price depression due to cheaper imports from China. On January 23,2017, the European Commission decided to maintain the anti-dumping duties (Commission ImplementingRegulation (EU) 2017/109) for another five year period. The anti-dumping duties protect the EU producers untilJanuary 24, 2022. After this date, the competitive pressures from Chinese producers, which have cost advantages,primarily in the aftermarket, may adversely affect the company’s assets, financial condition and results ofoperations or prospects.
We are subject to various environmental laws.
We incur costs to comply with applicable environmental, health and safety laws and regulations in the ordinarycourse of our business. We cannot ensure that we have been or will be at all times in complete compliance withsuch laws and regulations. Failure to be in compliance with such laws and regulations could result in materialfines or sanctions. Additionally, changes to such laws or regulations may have a significant impact on our cashflows, financial condition and results of operations.
We are also subject to various foreign, federal, state and local environmental laws, ordinances and regulations,including those governing discharges into the air and water, the storage, handling and disposal of solid andhazardous wastes, the remediation of soil and groundwater contaminated by hazardous substances or wastes andthe health and safety of our employees. The nature of our current and former operations and the history ofindustrial uses at some of our facilities expose us to the risk of liabilities or claims with respect to environmentaland worker health and safety matters which could have a material adverse effect on our financial health. Inaddition, some of our properties are subject to indemnification and/or cleanup obligations of third parties withrespect to environmental matters. However, in the event of the insolvency or bankruptcy of such third parties, wecould be required to bear the liabilities that would otherwise be the responsibility of such third parties.
Further, changes in legislation or regulation imposing reporting obligations on, or limiting emissions ofgreenhouse gases from, or otherwise impacting or limiting our equipment and operations or from the vehiclesthat use our products could adversely affect demand for those vehicles or require us to incur costs to becomecompliant with such regulations.
15
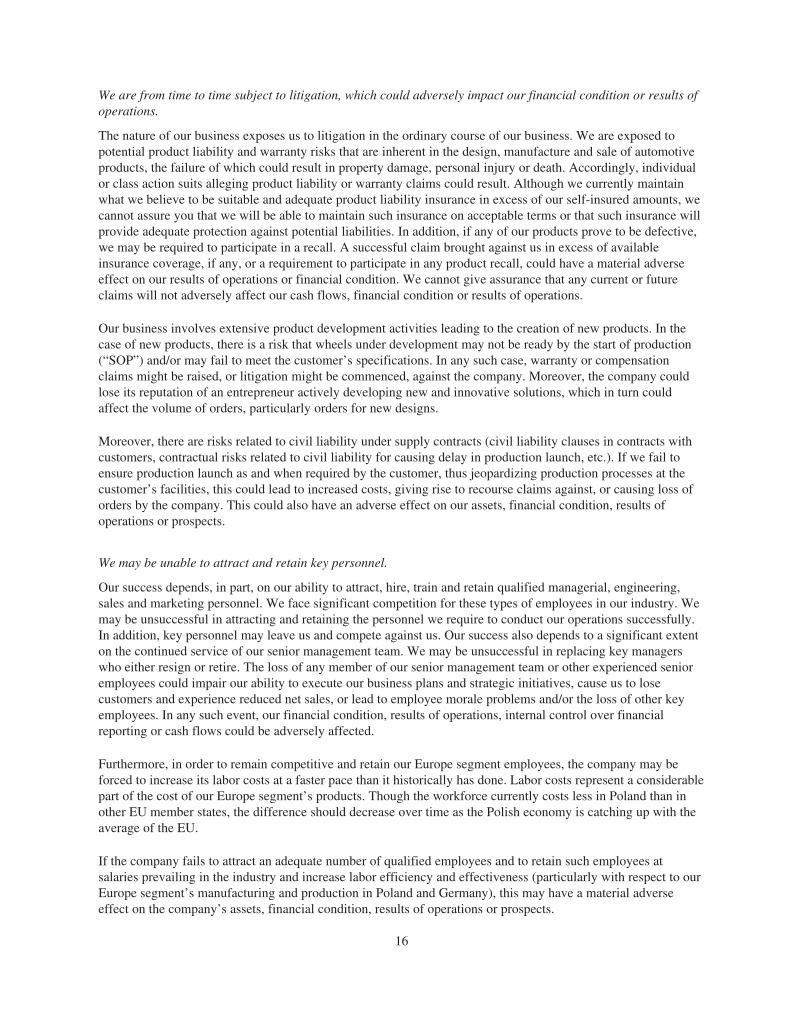
We are from time to time subject to litigation, which could adversely impact our financial condition or results ofoperations.
The nature of our business exposes us to litigation in the ordinary course of our business. We are exposed topotential product liability and warranty risks that are inherent in the design, manufacture and sale of automotiveproducts, the failure of which could result in property damage, personal injury or death. Accordingly, individualor class action suits alleging product liability or warranty claims could result. Although we currently maintainwhat we believe to be suitable and adequate product liability insurance in excess of our self-insured amounts, wecannot assure you that we will be able to maintain such insurance on acceptable terms or that such insurance willprovide adequate protection against potential liabilities. In addition, if any of our products prove to be defective,we may be required to participate in a recall. A successful claim brought against us in excess of availableinsurance coverage, if any, or a requirement to participate in any product recall, could have a material adverseeffect on our results of operations or financial condition. We cannot give assurance that any current or futureclaims will not adversely affect our cash flows, financial condition or results of operations.
Our business involves extensive product development activities leading to the creation of new products. In thecase of new products, there is a risk that wheels under development may not be ready by the start of production(“SOP”) and/or may fail to meet the customer’s specifications. In any such case, warranty or compensationclaims might be raised, or litigation might be commenced, against the company. Moreover, the company couldlose its reputation of an entrepreneur actively developing new and innovative solutions, which in turn couldaffect the volume of orders, particularly orders for new designs.
Moreover, there are risks related to civil liability under supply contracts (civil liability clauses in contracts withcustomers, contractual risks related to civil liability for causing delay in production launch, etc.). If we fail toensure production launch as and when required by the customer, thus jeopardizing production processes at thecustomer’s facilities, this could lead to increased costs, giving rise to recourse claims against, or causing loss oforders by the company. This could also have an adverse effect on our assets, financial condition, results ofoperations or prospects.
We may be unable to attract and retain key personnel.
Our success depends, in part, on our ability to attract, hire, train and retain qualified managerial, engineering,sales and marketing personnel. We face significant competition for these types of employees in our industry. Wemay be unsuccessful in attracting and retaining the personnel we require to conduct our operations successfully.In addition, key personnel may leave us and compete against us. Our success also depends to a significant extenton the continued service of our senior management team. We may be unsuccessful in replacing key managerswho either resign or retire. The loss of any member of our senior management team or other experienced senioremployees could impair our ability to execute our business plans and strategic initiatives, cause us to losecustomers and experience reduced net sales, or lead to employee morale problems and/or the loss of other keyemployees. In any such event, our financial condition, results of operations, internal control over financialreporting or cash flows could be adversely affected.
Furthermore, in order to remain competitive and retain our Europe segment employees, the company may beforced to increase its labor costs at a faster pace than it historically has done. Labor costs represent a considerablepart of the cost of our Europe segment’s products. Though the workforce currently costs less in Poland than inother EU member states, the difference should decrease over time as the Polish economy is catching up with theaverage of the EU.
If the company fails to attract an adequate number of qualified employees and to retain such employees atsalaries prevailing in the industry and increase labor efficiency and effectiveness (particularly with respect to ourEurope segment’s manufacturing and production in Poland and Germany), this may have a material adverseeffect on the company’s assets, financial condition, results of operations or prospects.
16

We may be unable to maintain effective internal control over financial reporting.
Management is responsible for establishing and maintaining adequate internal control over financial reporting.Many of our key controls rely on maintaining personnel with an appropriate level of accounting knowledge,experience and training in the application of U.S. GAAP in order to operate effectively. Material weaknesses ordeficiencies may cause our financial statements to contain material misstatements, unintentional errors oromissions and late filings with regulatory agencies may occur. As part of the integration, we will be aligning thecontrol framework in 2018 to ensure our Europe segment has adequate internal control over financial reporting,as such term is defined in Exchange Act Rule 13a-15(f). If the Europe segment is unable to implement thecontrol framework in 2018, we will not have adequate control over financial reporting for the consolidatedcompany.
A disruption in our information technology systems, including a disruption related to cybersecurity, couldadversely affect our financial performance.
We rely on the accuracy, capacity and security of our information technology systems. Despite the securitymeasures that we have implemented, including those measures related to cybersecurity, our systems, as well asthose of our customers, suppliers and other service providers could be breached or damaged by computer viruses,malware, phishing attacks, denial-of-service attacks, natural or man-made incidents or disasters or unauthorizedphysical or electronic access. These types of incidents have become more prevalent and pervasive acrossindustries, including in our industry, and are expected to continue in the future. A breach could result in businessdisruption, theft of our intellectual property, trade secrets or customer information and unauthorized access topersonnel information. Although cybersecurity and the continued development and enhancement of our controls,processes and practices designed to protect our information technology systems from attack, damage orunauthorized access are a high priority for us, our activities and investment may not be deployed quickly enoughor successfully protect our systems against all vulnerabilities, including technologies developed to bypass oursecurity measures. In addition, outside parties may attempt to fraudulently induce employees or customers todisclose access credentials or other sensitive information in order to gain access to our secure systems andnetworks. There are no assurances that our actions and investments to improve the maturity of our systems,processes and risk management framework or remediate vulnerabilities will be sufficient or completed quicklyenough to prevent or limit the impact of any cyber intrusion. Moreover, because the techniques used to gainaccess to or sabotage systems often are not recognized until launched against a target, we may be unable toanticipate the methods necessary to defend against these types of attacks and we cannot predict the extent,frequency or impact these problems may have on us. To the extent that our business is interrupted or data is lost,destroyed or inappropriately used or disclosed, such disruptions could adversely affect our competitive position,relationships with our customers, financial condition, operating results and cash flows. In addition, we may berequired to incur significant costs to protect against the damage caused by these disruptions or security breachesin the future.
We are also dependent on security measures that some of our third-party customers, suppliers and other serviceproviders take to protect their own systems and infrastructures. Some of these third parties store or have access tocertain of our sensitive data, as well as confidential information about their own operations, and as such aresubject to their own cybersecurity threats. Any security breach of any of these third-parties’ systems could resultin unauthorized access to our information technology systems, cause us to be non-compliant with applicable lawsor regulations, subject us to legal claims or proceedings, disrupt our operations, damage our reputation, and causea loss of confidence in our products and services, any of which could adversely affect our financial performance.
Competitors could copy our products or technologies and we could violate protected intellectual property rightsor trade secrets of our competitors or other third parties.
We register business-related intellectual property rights, such as industrial designs and trademarks, hold licensesand other agreements covering the use of intellectual property rights, and have taken steps to ensure that our
17

trade secrets and technological know-how remain confidential. Nevertheless, there is a risk that third partieswould attempt to copy, in full or in part, our products, technologies or industrial designs, or to obtainunauthorized access and use of company secrets, technological know-how or other protected intellectual propertyrights. Also, other companies could successfully develop technologies, products or industrial designs similar to,and thus potentially compete with, us.
Further, there can be no assurance that we will not unknowingly infringe intellectual property rights of ourcompetitors, such as patents and industrial designs, especially due to the fact that the interpretations of whatconstitutes protected intellectual property may differ. Similarly, there is a risk that we will illegitimately useintellectual property developed by our employees, which is subject in each case to relevant regulations governingemployee-created innovations. If a dispute concerning intellectual property rights arises, in which the relevantcourt issues an opinion on the disputed intellectual property rights contrary to us, identifying a breach ofintellectual property rights, we may be required to pay substantial damages or to stop the use of such intellectualproperty. In addition, we are exposed to the risk of injunctions being imposed to prevent further infringement,leading to a decrease in the number of orders.
All these events could have a material adverse effect on our assets, financial condition, results of operations orprospects.
We may be unable to successfully achieve expected benefits from our joint ventures or acquisitions.
As we continue to expand globally, we have engaged, and may continue to engage, in joint ventures and we maypursue acquisitions that involve potential risks, including failure to successfully integrate and realize theexpected benefits of such joint ventures or acquisitions. Integrating acquired operations is a significant challenge,and there is no assurance that we will be able to manage the integrations successfully. Failure to successfullyintegrate operations or to realize the expected benefits of such joint ventures or acquisitions may have an adverseimpact on our results of operations and financial condition.
Our financial statements are subject to changes in accounting standards that could adversely impact ourprofitability or financial position.
Our consolidated financial statements are subject to the application of U.S. GAAP, which are periodically revisedand/or expanded. Accordingly, from time to time, we are required to adopt new or revised accounting standardsissued by recognized authoritative bodies, including the FASB. Recently, accounting standard setters issued newguidance which further interprets or seeks to revise accounting pronouncements related to revenue recognitionand lease accounting as well as to issue new standards expanding disclosures. The impact of accountingpronouncements that have been issued but not yet implemented is disclosed in our annual and quarterly reportson Form 10-K and Form 10-Q. An assessment of proposed standards is not provided, as such proposals aresubject to change through the exposure process and, therefore, their effects on our consolidated financialstatements cannot be meaningfully assessed. It is possible that future accounting standards we are required toadopt could change the current accounting treatment that we apply to our consolidated financial statements andthat such changes could have a material adverse effect on our reported results of operations and financialposition.
We may fail to comply with conditions of the state tax incentive programs in Poland.
We have three production plants in a special Poland economic zone, Tanobrzeska Specjalna Strefa EkonomicznaEuro-Park Wislosan in Stalowa Wola, Poland. Our Polish operations were granted seven permits to operate insuch special economic zone, which allows us to benefit from Polish state tax incentives. The permits requirecertain conditions to be met, which include increasing the number of employees, keeping the number ofemployees at such level and incurring required capital expenditures. In addition, particular permits indicatedeadlines for completion of respective stages of investments. For three of the seven permits, conditions have
18

already been fulfilled. As of December 31, 2017, the tax subsidies are limited to 2017 (for three permits) and2026 (for four permits). If we do not fulfill the conditions required by the permits, the permits might bewithdrawn and we would no longer benefit from state tax incentives, which may impact our assets, financialcondition, results of operations or prospects in a material way. Furthermore, under current Polish regulations,special economic zones are scheduled to cease to exist in 2026.
We are currently unable to fully deduct interest charges on German indebtedness.
The interest deduction barrier (Zinsschranke) limits the tax deductibility of interest expenses for a Germanbusiness. If no exception to the interest deduction barrier applies, the net interest expense (interest expense lessinterest income) is deductible up to 30 percent of the taxable EBITDA (verrechenbares EBITDA) taxable inGermany in a given financial year. Non-deductible interest expenses can be carried forward. Interest carry-forwards are subject to the same tax cancellation rules as tax loss carry-forwards. Whenever interest expenses arenot deductible or if an interest carry-forward is lost, the tax burden in future assessment periods could rise, whichmight have alone, or in combination, a material adverse effect on our assets, financial condition, results ofoperation or prospects.
We may be exposed to risks related to existing and future profit and loss transfer agreements executed withGerman subsidiaries of Uniwheels.
Profit and loss transfer agreements are one of the prerequisites of the taxation of Superior and its Germansubsidiaries as a German tax group. For tax purposes, a profit and loss transfer agreement must have a contractterm for a minimum of five years. In addition, such agreement must be fully executed. If a profit and loss transferagreement or its actual execution does not meet the prerequisites for the taxation as a German tax group, SuperiorIndustries International AG (SII AG) and each subsidiary are taxed on their own income (and under certaincircumstances even with retrospective effect). Additionally, 5 percent of dividends from the subsidiary to SII AGwould be regarded as non-deductible expenses at the SII AG level. Furthermore, the compensation of a loss of asubsidiary would be regarded as contribution by SII AG into the subsidiary and thus, would not directly reduceSII AG’s profits. As a consequence, if the profit and loss transfer agreements do not meet the prerequisites of aGerman tax group, this could have a future material adverse effect on our assets, financial condition, results ofoperations or prospects.
We may not have the ability to use cash to settle the principal amount of the Notes upon redemption or torepurchase the Notes upon a fundamental change, which could adversely affect our financial condition.
The Notes are redeemable any time on or after June 15, 2020 at a redemption price set forth in the Indenture. Inaddition, the company may redeem some or all of the Notes prior to June 15, 2020 at a price equal to 100 percentof the principal amount thereof plus a “make-whole” premium and accrued and unpaid interest, if any, to, but notincluding, the redemption date. Prior to June 15, 2020, the company may redeem up to 40 percent of theaggregate principal amount of the Notes using the proceeds of certain equity offerings at the redemption price setforth in the Indenture. If the company experiences a change of control or sells certain assets, the company may berequired to offer to purchase the Notes from holders. If we do not have adequate cash available or cannot obtainadditional financing, or our use of cash is restricted by applicable law, regulations or agreements governing ourcurrent or future indebtedness, we may not be able to repurchase the Notes when required under the Indenture,which would constitute an event of default under the Indenture. An event of default under the Indenture couldalso lead to a default under other agreements governing our current and future indebtedness, and if the repaymentof such other indebtedness were accelerated, we may not have sufficient funds to repay the indebtedness andrepurchase the Notes or make cash payments upon conversion of the Notes.
The terms of the Notes could delay or prevent an attempt to take over our company.
The terms of the Notes require us to repurchase the Notes in the event of a fundamental change. A takeover ofour company would constitute a fundamental change. This could have the effect of delaying or preventing atakeover of our company that may otherwise be beneficial to our stockholders.
19

Purchase of additional shares of Uniwheels could take more time than anticipated and may take more resourcesand a higher purchase price.
Superior executed a Domination and Profit Loss Transfer Agreement, “DPLTA”, which became effective inJanuary 2018. According to the terms of the DPLTA, Superior AG offered to purchase any further tenderedshares for cash consideration of Euro 62.18, or approximately Polish Zloty 264 per share. This cash considerationmay be subject to change based on appraisal proceedings that the minority shareholders of Uniwheels haveinitiated.
ITEM 1B - UNRESOLVED STAFF COMMENTS
None.
ITEM 2 - PROPERTIES
Our worldwide headquarters is located in Southfield, Michigan. In our North American operations, we maintainand operate five facilities that manufacture aluminum wheels for the automotive industry and a new facility forfinishing wheels. Four of these five facilities are located in Chihuahua, Mexico and one facility is located inFayetteville, Arkansas. The five manufacturing facilities encompass 2.5 million square feet of manufacturingspace. We own all of our manufacturing facilities, and we lease our worldwide headquarters located inSouthfield, Michigan and other temporary facilities.
Our European operations include five locations. The European headquarters is situated in Bad Dürkheim,Germany which includes our European management, sales and distribution functions, as well as the logisticscenter for the aftermarket business. European production operations consist of three production facilities, thelargest of which is in Stalowa Wola, Poland which includes three plants. Another plant is situated in Werdohl,Germany, where most development work is performed. Forged wheels are manufactured in Fußgönheim,Germany, near the Bad Dürkheim offices. The newest plant in Poland was put into operation in the beginning ofJune 2016. Our European production facilities encompass approximately 1.5 million square feet.
In general, our manufacturing facilities, which have been constructed at various times over the past several years,are in good operating condition and are adequate to meet our current production capacity requirements. There areactive maintenance programs to keep these facilities in good condition, and we have an active capital spendingprogram to replace equipment as needed to maintain factory reliability and remain technologically competitiveon a worldwide basis.
Additionally, reference is made to Note 1, “Summary of Significant Accounting Policies,” Note 9, “Property,Plant and Equipment” and Note 15 “Leases and Related Parties”, in the Notes to the Consolidated FinancialStatements in Item 8, “Financial Statements and Supplementary Data” of this Annual Report.
ITEM 3 - LEGAL PROCEEDINGS
We are party to various legal and environmental proceedings incidental to our business. Certain claims, suits andcomplaints arising in the ordinary course of business have been filed or are pending against us. Based on factsnow known, we believe all such matters are adequately provided for, covered by insurance, are without merit,and/or involve such amounts that would not materially adversely affect our consolidated results of operations,cash flows or financial position. See also under Item 1A, “Risk Factors - We are from time to time subject tolitigation, which could adversely impact our financial condition or results of operations” of this Annual Report.
ITEM 4 - MINE SAFETY DISCLOSURES
Not applicable.
20

ITEM 4A - EXECUTIVE OFFICERS OF THE REGISTRANT
Information regarding executive officers who are also Directors is contained in our 2018 Proxy Statement underthe caption “Election of Directors.” Such information is incorporated into Part III, Item 10, “Directors, ExecutiveOfficers and Corporate Governance.” With the exception of the CEO, all executive officers are appointedannually by the Board of Directors and serve at the will of the Board of Directors. For a description of the CEO’semployment agreement, see “Employment Agreements” in our 2018 Proxy Statement, which is incorporatedherein by reference.
21

Listed below alphabetically are the name, age, position and business experience of each of our officers, as of thefiling date:
Name Age PositionAssumedPosition
Scot S. Bowie 44 Vice President and Corporate Controller 2015Corporate Controller, Black Diamond Equipment 2014Chief Accounting Officer, Affinia Group Inc. 2011Corporate Controller of External Reporting, Affinia Group Inc. 2008
Joanne M. Finnorn 53 Senior Vice President, General Counsel and Corporate Secretary 2017Vice President and General Counsel of Amerisure MutualInsurance Company 2016General Counsel and Principal of HouseSetter LLC 2013Principal of Finnorn Law & Advisory Services 2012Vice President, Subscriber Services, OnStar 2011Vice President and General Counsel, OnStar 2004
Parveen Kakar 51 Senior Vice President Sales, Marketing and ProductDevelopment 2014Senior Vice President, Corporate Engineering and ProductDevelopment 2008Vice President, Program Development 2003
Nadeem Moiz 47 Executive Vice President, Chief Financial Officer 2017Senior Vice President and Chief Financial Officer, DirectChassisLink Inc. 2013Vice President of Finance Strategic Planning and Supply ChainFinance, Graphic Packaging International 2011
Shawn J. Pallagi 60 Senior Vice President and Chief Human Resources Officer 2016Senior Vice President Chief Human Resource Officer, RemyInternational 2014Vice President, Human Resources, Remy International 2011Executive Director, Human Resources, Global Manufacturingand Labor Relations, General Motors 2006
James F. Sistek 54 Senior Vice President, Business Operations and Systems 2014Chief Executive Officer and Founder, Infologic, Inc. 2013Vice President, Shared Services and Chief Information Officer,Visteon Corporation 2009
Donald J. Stebbins 60 President and Chief Executive Officer 2014Chairman, President and Chief Executive Officer of VisteonCorporation 2008
Robert M. Tykal 55 Senior Vice President, Operations 2017Vice President, Global Operations, Gilbarco Veeder Root,Fortive Corporation 2013President and Chief Executive Officer, DaimlerChrysler AG/MTU Drive Shafts 2002
In addition to the officers of the Company we have two key executives, Dr. Wolfgang Hiller and Dr. KarstenObenaus, that manage the European operations.
22

PART II
ITEM 5 - MARKET FOR REGISTRANT’S COMMON EQUITY, RELATED STOCKHOLDERMATTERS AND ISSUER PURCHASES OF EQUITY SECURITIES
Performance Graph
The following graph compares the cumulative total stockholder return from December 31, 2012 throughDecember 31, 2017, for our common stock, the Russell 2000 and a peer group(1) of companies that we haveselected for purposes of this comparison. We have assumed that dividends have been reinvested, and the returnsof each company in the Russell 2000 and the peer group have been weighted to reflect relative stock marketcapitalization. The graph below assumes that $100 was invested on December 31, 2012, in each of our commonstock, the stocks comprising the Russell 2000 and the stocks comprising the peer group.
$250
COMPARISON OF 5 YEAR CUMULATIVE TOTAL RETURN*Among Superior Industries International, Inc., Russel 2000 and Proxy Group
$200
$150
$100
$50
$012/12 12/13
Superior Industries International, Inc. Russel 2000 Proxy Group
12/14 12/15 12/16 12/17
SuperiorIndustries
International, Inc. Russel 2000 Peer Group(1)
2012 . . . . . . . . . . . . . . . . . . . . . . . . . . . . . . . . . . $100 $100 $1002013 . . . . . . . . . . . . . . . . . . . . . . . . . . . . . . . . . . $102 $139 $1442014 . . . . . . . . . . . . . . . . . . . . . . . . . . . . . . . . . . $102 $146 $1322015 . . . . . . . . . . . . . . . . . . . . . . . . . . . . . . . . . . $ 98 $139 $1322016 . . . . . . . . . . . . . . . . . . . . . . . . . . . . . . . . . . $144 $169 $1742017 . . . . . . . . . . . . . . . . . . . . . . . . . . . . . . . . . . $ 83 $194 $193
(1) We do not believe that there is a single published industry or line of business index that is appropriate forcomparing stockholder returns. As a result, we have selected a peer group comprised of companies asdisclosed in the 2018 Proxy Statement.
23

Dividends
Per share quarterly cash dividends declared totaled $0.45 during 2017 and $0.72 during 2016. Continuation ofdividends is contingent upon various factors, including economic and market conditions, none of which can beaccurately predicted, and the approval of our Board of Directors.
Holders of Common Stock
As of March 12, 2018, there were approximately 368 holders of record of our common stock.
Quarterly Common Stock Price Information
Our common stock is traded on the New York Stock Exchange under the symbol “SUP”.
The following table sets forth the high and low sales price per share of our common stock during the fiscalperiods indicated.
2017 2016
High Low High Low
First Quarter . . . . . . . . . . . . . . . . . . . . . . . . . . . . . . . . . . . . . . $27.40 $21.90 $23.43 $16.35Second Quarter . . . . . . . . . . . . . . . . . . . . . . . . . . . . . . . . . . . . $25.90 $18.58 $27.90 $21.53Third Quarter . . . . . . . . . . . . . . . . . . . . . . . . . . . . . . . . . . . . . . $20.95 $14.00 $32.12 $24.76Fourth Quarter . . . . . . . . . . . . . . . . . . . . . . . . . . . . . . . . . . . . . $17.45 $13.95 $30.12 $22.45
Purchases of Equity Securities by the Issuer and Affiliated Purchasers
The following table shows our purchases of our common stock during the fourth quarter of 2017:
Period
(a)Total Number
of SharesPurchased1
(b)Average PricePaid Per Share
(c)Total Number ofShares Purchasedas Part of Publicly
AnnouncedPrograms
(d)Maximum DollarValue of Shares
That May Yet bePurchased Under
Publicly AnnouncedPrograms (1)
(in thousands)
October 2017 . . . . . . . . . . . . . — — — 34,600,000November 2017 . . . . . . . . . . . — — — 34,600,000December 2017 . . . . . . . . . . . . — — — 34,600,000
Total . . . . . . . . . . . . . . . . — —
(1) In October 2014, our Board of Directors approved a stock repurchase program (the “2014 RepurchaseProgram”) authorizing the repurchase of up to $30.0 million of our common stock. Under the 2014Repurchase Program, we repurchased common stock from time to time on the open market or in privatetransactions, totaling 1,056,954 shares of company stock at a cost of $19.6 million in 2015 and585,970 shares for $10.3 million in January of 2016, which completed the 2014 Repurchase Program. Therepurchased shares described above were either canceled and retired or added to treasury stock after thereincorporation in Delaware in 2015.
In January of 2016, our Board of Directors approved a new stock repurchase program (the “2016Repurchase Program”), authorizing the repurchase of up to an additional $50.0 million of common stock.The timing and extent of the repurchases under the 2016 Repurchase Program will depend upon marketconditions and other corporate considerations in our sole discretion. Under the 2016 Repurchase Program,we repurchased common stock from time to time on the open market or in private transactions, totaling
24

454,718 shares of company stock at a cost of $10.4 million in 2016. In the aggregate, we purchased$20.7 million in company stock during 2016 under the 2014 Repurchase Program and 2016 RepurchaseProgram. During 2017, we purchased an additional 215,841 shares of company stock at a cost of$5.0 million under the 2016 Repurchase Program.
Recent Sales of Unregistered Securities
Except as set forth below, the company has not issued any securities that were not registered under the SecuritiesAct of 1933, as amended (the “Securities Act”) within the past three fiscal years.
On May 22, 2017, we completed the private placement of 140,202 shares of our Series A redeemable preferredstock, par value $0.01 per share, and 9,798 shares of our Series B redeemable preferred stock, par value $0.01 pershare (together, the “Preferred Stock”), to TPG Growth III Sidewall, L.P. (the “Investor”) for a purchase price of$150.0 million. On August 30, 2017, our stockholders approved the conversion of the 9,798 shares of Series Bredeemable preferred stock into Series A redeemable preferred stock and all shares of Series B redeemablepreferred stock were automatically converted. Series A redeemable preferred stock is convertible into shares ofSuperior common stock equal to the number of shares determined by dividing the sum of the stated value and anyaccrued and unpaid dividends by the conversion price of $28.162.
The private placement of the Preferred Stock is exempt from the registration requirements of the Securities Actunder Section 4(a)(2) and Regulation D thereunder. The Investor has represented to Superior that it is an“accredited investor” as defined by Rule 501 of the Securities Act and that the Preferred Stock is being acquiredfor investment purposes and not with a view to or for sale in connection with any distribution thereof andappropriate legends will be affixed to any certificates evidencing the shares of Preferred Stock. Additionalinformation regarding this transaction is set forth in Note 13, “Redeemable Preferred Shares” in the Notes to ourConsolidated Financial Statements in Item 8.
On June 15, 2017, we issued €250.0 million aggregate principal amount of our 6.00% Senior Notes due June 15,2025 (the “Notes”) to initial purchasers including J.P. Morgan Securities plc, Citigroup Global Markets Limited,RBC Europe Limited and Deutsche Bank Securities Inc. The offering of the Notes is exempt from theregistration requirements of the Securities Act under Rule 144A and Regulation S. The purchasers of the noteshave represented to Superior that they are either (1) Qualified Institutional Buyers within the meaning ofRule 144A of the Securities Act or (2) is a qualified investor outside of the United States. Additional informationregarding this transaction is set forth in Note 12, “Long-Term Debt” in the Notes to our Consolidated FinancialStatements in Item 8.
Securities Authorized for Issue Under Equity Compensation Plans
The information about securities authorized for issuance under Superior’s equity compensation plans is includedin Note 18, “Stock-Based Compensation” in the Notes to Consolidated Financial Statements in Item 8 and willalso be included in our 2018 Proxy Statement under the caption “Securities Authorized for Issuance under theEquity Compensation Plans.”
ITEM 6 - SELECTED FINANCIAL DATA
The following selected consolidated financial data should be read in conjunction with Item 7, “Management’sDiscussion and Analysis of Financial Condition and Results of Operations” and Item 8, “Financial Statementsand Supplementary Data” of this Annual Report.
The fiscal year of 2017 consisted of the 53-week period ended December 31, 2017 and the 2016 and 2015 fiscalyears consisted of the 52-week periods ended on December 25, 2016 and December 27, 2015, respectively.Historically, our fiscal year ended on the last Sunday of the calendar year. Uniwheels, our European operation
25

acquired on May 30, 2017, is based on a calendar year end. These fiscal periods align as of December 31, 2017.Beginning in 2018, both our North American and European operations will be on a calendar fiscal year with eachmonth ending on the last day of the month. For convenience of presentation, all fiscal years are referred to asbeginning as of January 1, and ending as of December 31, but actually reflect our financial position and results ofoperations for the periods described above.
Fiscal Year Ended December 31, 2017 2016 2015 2014 2013
Income Statement (000s)Net sales . . . . . . . . . . . . . . . . . . . . . . . . . . . . . . $1,108,055 $732,677 $727,946 $745,447 $789,564Value added sales (1) . . . . . . . . . . . . . . . . . . . . . $ 616,753 $408,690 $360,846 $369,355 $400,591Closure and Impairment Costs (2) . . . . . . . . . . . $ 138 $ 1,458 $ 7,984 $ 8,429 $ —Gross profit . . . . . . . . . . . . . . . . . . . . . . . . . . . . $ 102,897 $ 86,204 $ 71,217 $ 50,222 $ 64,061Income from operations . . . . . . . . . . . . . . . . . . $ 21,518 $ 54,602 $ 36,294 $ 17,913 $ 34,593Consolidated Income before income taxes and
equity earnings . . . . . . . . . . . . . . . . . . . . . . . $ 866 $ 54,721 $ 35,283 $ 15,702 $ 36,841Income tax benefit (provision) (3) . . . . . . . . . . . $ (6,875) $ (13,340) $ (11,339) $ (6,899) $ (14,017)Net income . . . . . . . . . . . . . . . . . . . . . . . . . . . . $ (6,009) $ 41,381 $ 23,944 $ 8,803 $ 22,824Adjusted EBITDA (4) . . . . . . . . . . . . . . . . . . . . . $ 140,085 $ 88,511 $ 76,053 $ 55,753 $ 63,616
Balance Sheet (000s)Current assets . . . . . . . . . . . . . . . . . . . . . . . . . . $ 417,383 $254,081 $245,820 $276,011 $384,218Current liabilities . . . . . . . . . . . . . . . . . . . . . . . . $ 195,059 $ 85,964 $ 73,862 $ 71,962 $ 99,430Working capital . . . . . . . . . . . . . . . . . . . . . . . . . $ 222,324 $168,117 $171,958 $204,049 $284,788Total assets . . . . . . . . . . . . . . . . . . . . . . . . . . . . $1,551,252 $542,756 $539,929 $579,910 $653,388Long-term debt . . . . . . . . . . . . . . . . . . . . . . . . . $ 679,552 $ — $ — $ — $ —Shareholders’ equity . . . . . . . . . . . . . . . . . . . . . $ 445,723 $398,226 $413,912 $439,006 $483,063
Financial RatiosCurrent ratio (5) . . . . . . . . . . . . . . . . . . . . . . . . . 2.1:1 3.0:1 3.3:1 3.8:1 3.9:1Return on average shareholders’ equity (6) . . . . (1.4)% 10.2% 5.6% 1.9% 4.8%
Share DataNet income . . . . . . . . . . . . . . . . . . . . . . . . . . . .- Basic . . . . . . . . . . . . . . . . . . . . . . . . . . . . . . . . $ (1.01) $ 1.63 $ 0.90 $ 0.33 $ 0.83- Diluted . . . . . . . . . . . . . . . . . . . . . . . . . . . . . . . $ (1.01) $ 1.62 $ 0.90 $ 0.33 $ 0.83Shareholders’ equity at year-end . . . . . . . . . . . . $ 17.89 $ 15.84 $ 15.86 $ 16.42 $ 17.79Dividends declared . . . . . . . . . . . . . . . . . . . . . . $ 0.45 $ 0.72 $ 0.72 $ 0.72 $ 0.20
(1) Value added sales is a key measure that is not calculated according to U.S. GAAP. In the discussion ofoperating results, we provide information regarding value added sales. Value added sales represents net salesless the value of aluminum and services provided by outside service providers that are included in net sales. Asdiscussed further below, arrangements with our customers allow us to pass on changes in aluminum prices andoutside service provider costs; therefore, fluctuations in underlying aluminum prices and the use of outsideservice providers generally do not directly impact our profitability. Accordingly, value added sales is worthyof being highlighted for the benefit of users of our financial statements. Our intent is to allow users of thefinancial statements to consider our net sales information both with and without the aluminum and outsideservice provider cost components thereof. Management uses value added sales as a key metric to determinegrowth of the company because it eliminates the volatility of aluminum prices. During 2015, we modified thepresentation of value added sales to also exclude third-party manufacturing costs passed directly through tocustomers and retrospectively applied this modification to 2012 through 2014. See the Non-GAAP FinancialMeasures section of this Annual Report for a reconciliation of value added sales to net sales.
(2) See Note 3, “Restructuring” in the Notes to Consolidated Financial Statements in Item 8, “FinancialStatements and Supplementary Data” in this Annual Report for a discussion of restructuring charges. During2016, we sold the shut-down Rogers facility for total proceeds of $4.3 million, resulting in a $1.4 million gainon sale. Prior to selling the facility, we incurred $1.5 million of further closure costs including carrying costs
26

for the closed facility and $0.3 million in depreciation. During 2015, the shutdown of the Rogers facilityresulted in a gross margin loss of $8.0 million. We incurred $4.3 million in restructuring costs related to animpairment of fixed assets and other associated costs such as asset relocation costs. Additionally, we incurred$2.0 million of further closure costs including carrying costs for the closed facility and $1.7 million indepreciation. The Adjusted EBITDA impact of the Rogers facility closure for 2015 was $6.3 million, whichincludes the $4.3 million of restructuring costs and $2.0 million of carrying costs related to the closed facility.During 2014, we had $8.4 million of restructuring costs related to the closure of the Rogers facility. Thecarrying costs for the closed facility are not included in the restructuring line in the Consolidated IncomeStatements of our Consolidated Financial Statements.
(3) See Note 14, “Income Taxes” in the Notes to Consolidated Financial Statements in Item 8, “FinancialStatements and Supplementary Data” in this Annual Report for a discussion of material items impacting the2017, 2016 and 2015 income tax provisions.
(4) Adjusted EBITDA is a key measure that is not calculated according to GAAP. Adjusted EBITDA is defined asearnings before interest income and expense, income taxes, depreciation, amortization, restructuring and otherclosure costs, impairments of long-lived assets and investments, acquisition costs and integration costs. Weuse Adjusted EBITDA as an important indicator of the operating performance of our business. We useAdjusted EBITDA in internal forecasts and models when establishing internal operating budgets,supplementing the financial results and forecasts reported to our Board of Directors and evaluating short-termand long-term operating trends in our operations. We believe the Adjusted EBITDA financial measure assistsin providing a more complete understanding of our underlying operational measures to manage our business,to evaluate our performance compared to prior periods and the marketplace, and to establish operational goals.We believe that these non-GAAP financial adjustments are useful to investors because they allow investors toevaluate the effectiveness of the methodology and information used by management in our financial andoperational decision-making. Adjusted EBITDA is a non-GAAP financial measure and should not beconsidered in isolation or as a substitute for financial information provided in accordance with GAAP. Thisnon-GAAP financial measure may not be computed in the same manner as similarly titled measures used byother companies. See the Non-GAAP Financial Measures section of this Annual Report for a reconciliation ofour Adjusted EBITDA to net income.
(5) The current ratio is current assets divided by current liabilities.(6) Return on average shareholders’ equity is net income divided by average shareholders’ equity. Average
shareholders’ equity is the beginning of the year shareholders’ equity plus the end of year shareholders’ equitydivided by two.
ITEM 7 - MANAGEMENT’S DISCUSSION AND ANALYSIS OF FINANCIAL CONDITION ANDRESULTS OF OPERATIONS
The following discussion of our financial condition and results of operations should be read in conjunction withour Consolidated Financial Statements and the Notes to the Consolidated Financial Statements included inItem 8, “Financial Statements and Supplementary Data” in this Annual Report. This discussion contains forward-looking statements, which involve risks and uncertainties. Please refer to the section entitled “Forward LookingStatements” at the beginning of this Annual Report immediately prior to Item 1. Our actual results could differmaterially from those anticipated in the forward-looking statements as a result of certain factors, including butnot limited to those discussed in Item 1A, “Risk Factors” and elsewhere in this Annual Report.
Executive Overview
We believe we are the #1 North American aluminum wheel manufacturer, the #3 European aluminum wheelmanufacturer and the #1 European aluminum wheel aftermarket supplier. Our OEM aluminum wheels accountedfor approximately 94 percent of our sales and are primarily sold for factory installation on many vehicle modelsmanufactured by Audi, BMW, FCA, Ford, GM, Jaguar-Land Rover, Mercedes-Benz, Mitsubishi, Nissan, Subaru,Tesla, Toyota, Volkswagen and Volvo. We sell aluminum wheels to the European aftermarket under the brandsATS, RIAL, ALUTEC and ANZIO. North America and Europe represent the principal markets for our products
27

but we have a global presence and influence with North American, European and Asian OEMs. With theacquisition of our European operations in 2017, we diversified our customer base from predominately NorthAmerican OEMs (e.g. Ford and G.M.) to a global customer base of OEMs (e.g. Audi, Mercedes-Benz, andToyota). The following chart demonstrates the shift in diversification of our business from 2016 to 2017.
DIVERSIFICATION
2016 SALES BY CUSTOMER REGION
NorthAmerica
99%
Other 1%
2017 SALES BY CUSTOMER REGION
NorthAmerica
Europe*
65%
34%
Other 1%*Includes the 7 months of Europe sales after acquisition
Historically, the focus of the Company was on providing wheels for relatively high-volume programs with lowerdegrees of competitive differentiation. In order to improve our strategic position and better serve our customers,we are augmenting our product portfolio with wheels containing higher technical content and greaterdifferentiation. We believe this direction is consistent with current trends in the market and needs of ourcustomers. To achieve this objective, we have invested in the past and continue to invest in new manufacturingcapabilities in order to produce more sophisticated finishes and larger diameter products, which typically providehigher value in the market. The acquisition of our European operations and the construction of a new finishingfacility align with this strategic mission. We are in the process of constructing a physical vapor deposition PVDfinishing facility, which will establish us as the first OEM automotive wheel manufacturer to have this capabilityin-house. PVD is a wheel coating process that creates bright chrome-like surfaces in an environmentally friendlymanner.
As a result of the acquisition of the European operations on May 30, 2017, we have broadened our productportfolio and acquired a significant customer share with European OEMs, including Audi, Jaguar-Land Rover,Mercedes Benz and Volvo. The acquisition is not only complementary in terms of customers, market coverageand product offerings but also very much aligned with our strategic direction with a priority focus on largerdiameter wheels, premium finishes, luxury brands and specialty wheels for high performance motorsport racingvehicles, all providing enhanced opportunity for higher margin business. With the acquisition, our global reachencompasses sales to nine of the ten largest OEMs in the world with sales surpassing $1.1 billion. The followingcharts show sales by major customer. The sales to our top four customers in 2017 represented 59 percent of totalsales compared to 88 percent in 2016.
28

SALES BY CUSTOMER
2017 SALES BY CUSTOMER*
OtherFord22%
GM20%VW
8%Toyota
9%
41%
Other Ford
38%12%
GM
Toyota14%
30%
FCA 6%
2016 SALES BY CUSTOMER
Net sales in 2017 increased 51 percent to $1,108.1 million from $733 million in 2016 due to the inclusion ofseven months of our European operations. Our North American sales were $732 million and $733 million for2017 and 2016, respectively. During 2017, we incurred $44.3 million in nonrecurring costs related to theacquisition of Uniwheels and integration of our European business with our North American operations.Excluding the nonrecurring costs, our income from operations improved compared to last year due to theinclusion of the seven months of European operations. We anticipate incurring further integration costs in 2018to complete the integration of the two companies. The following charts show the impact of the nonrecurring costson our 2017 operating results.
SALES AND PROFITABILITY
Sales for 2015 to 2017
Growth from 2015
$727.9
2015
2016
2017
$732.7
$1,108.152%
2015
2016
2017
Income from Operations for 2015 to 2017
$36.3
$54.6$44.3*
$21.5
2015
2016
2017
$76.1
$88.5
$140.1Growth in Adj.
EBITDA from 2015
84%
Adjusted EBITDA* for 2015 to 2017
* Income from operations in 2017 includes$44.3 million in costs related to acquisitioncosts and integration costs.
* See the Non-GAAP Financial Measuressection of this annual report for areconciliation of our Adjusted EBIDA toincome from operations.
Our current year income from operations decreased while our Adjusted EBITDA increased. Income fromoperations decreased in 2017 to $21.5 million from $54.6 million in 2016 due to $44.3 million of nonrecurringexpenses related to the acquisition of Uniwheels and integration of our European business. Our AdjustedEBITDA increased to $140.1 million in 2017 from $88.5 million in 2016. The increase in Adjusted EBITDA wasdriven by the inclusion of $61.0 million from our new European operations. On a comparable basis the NorthAmerican Adjusted EBITDA decreased from $88.5 in 2016 to $79.1 million in 2017 due to lower volumes andMexican operational inefficiencies.
Overall North American production of passenger cars and light-duty trucks in 2017 was reported by industrypublications as decreasing by 4.7 percent versus 2016 with production of light-duty trucks, which includespick-up trucks, SUVs, vans and “crossover vehicles,” increasing 2.1 percent and production of passenger carsdecreasing 15.8 percent. While North American production was a solid 17.0 million this year, it did decrease for
29

the first time since 2009. The decrease in sales is driven by a shift in consumer demand away from passengercars to crossover vehicles and used vehicles. Superior North America unit sales followed the industry declinewith a sales decrease of 6.4 percent in 2017 due to a 21.4 percent decline in passenger cars offset by 1.0 percentincrease in light-duty trucks. In 2017, we had decreased sales with our North American OEM customers offset byincreased sales with Nissan and other international customers.
Overall European new vehicle production of passenger cars and light-duty trucks in 2017 were reported byindustry publications as increasing 0.3 percent versus 2016. This was the fourth consecutive annual increase inEuropean new vehicle registrations. Germany, UK, France, Italy and Spain remained the five largest car marketsin Europe for 2017. Germany, France, Italy and Spain new vehicle registrations increased in 2017 while the UKexperienced a decrease in the current year. From an OEM perspective, European sales increased in 2017 forRenault, Peugeot, Mercedes and FIAT, partially offset by slight decreases in Volkswagen, Audi, Opel and Ford.Our 2017 European operation sales increased at a rate higher than the industry. Unit sales for the last sevenmonths of 2017 increased by 6.2 percent over the same time period in 2016 due to favorable market conditions.
Results of Operations
Fiscal Year Ended December 31, 2017 2016 2015
(Thousands of dollars, except per share amounts)
Net SalesNorth America . . . . . . . . . . . . . . . . . . . . . . . . . . . . . . . . . . . . . $ 732,418 $732,677 $727,946Europe . . . . . . . . . . . . . . . . . . . . . . . . . . . . . . . . . . . . . . . . . . . 375,637 — —
Net sales . . . . . . . . . . . . . . . . . . . . . . . . . . . . . . . . . . . . . . . . . . . . . . . . . 1,108,055 732,677 727,946Cost of sales . . . . . . . . . . . . . . . . . . . . . . . . . . . . . . . . . . . . . . . . . . . . . . 1,005,158 646,473 656,729
Gross profit . . . . . . . . . . . . . . . . . . . . . . . . . . . . . . . . . . . . . . . . . . . . . . . 102,897 86,204 71,217Percentage of net sales . . . . . . . . . . . . . . . . . . . . . . . . . . . . . . . . . . 9.3% 11.8% 9.8%Selling, general and administrative . . . . . . . . . . . . . . . . . . . . . . . . . 81,379 31,602 34,923
Income from operations . . . . . . . . . . . . . . . . . . . . . . . . . . . . . . . . . . . . . 21,518 54,602 36,294Percentage of net sales . . . . . . . . . . . . . . . . . . . . . . . . . . . . . . . . . . 1.9% 7.5% 5.0%
Interest (expense) income, net . . . . . . . . . . . . . . . . . . . . . . . . . . . . . . . . . (40,004) 245 103Other income (expense), net . . . . . . . . . . . . . . . . . . . . . . . . . . . . . . . . . . 13,188 (126) (1,114)Change in fair value of redeemable preferred stock embedded
derivative . . . . . . . . . . . . . . . . . . . . . . . . . . . . . . . . . . . . . . . . . . . . . . . 6,164 — —Income tax benefit (provision) . . . . . . . . . . . . . . . . . . . . . . . . . . . . . . . . (6,875) (13,340) (11,339)
Consolidated net income . . . . . . . . . . . . . . . . . . . . . . . . . . . . . . . . . . . . . (6,009) 41,381 23,944Less: net loss attributable to non-controlling interests . . . . . . . . . . . . . . (194) — —
Net income attributable to Superior . . . . . . . . . . . . . . . . . . . . . . . . . . . . (6,203) 41,381 23,944Percentage of net sales . . . . . . . . . . . . . . . . . . . . . . . . . . . . . . . . . . (0.6)% 5.6% 3.3%
Diluted (loss) earnings per share . . . . . . . . . . . . . . . . . . . . . . . . . . . . . . . $ (1.01) $ 1.62 $ 0.90Value added sales (1) . . . . . . . . . . . . . . . . . . . . . . . . . . . . . . . . . . . . . . . . 616,753 408,690 360,846Adjusted EBITDA (2) . . . . . . . . . . . . . . . . . . . . . . . . . . . . . . . . . . . . . . . . $ 140,085 $ 88,511 $ 76,053
Percentage of net sales (3) . . . . . . . . . . . . . . . . . . . . . . . . . . . . . . . . 12.6% 12.1% 10.4%Percentage of value added sales (4) . . . . . . . . . . . . . . . . . . . . . . . . . 22.7% 21.7% 21.1%Unit shipments in thousands . . . . . . . . . . . . . . . . . . . . . . . . . . . . . . 17,008 12,260 11,244
(1) Value added sales is a key measure that is not calculated according to GAAP. In the discussion of operatingresults, we provide information regarding value added sales. Value added sales represents net sales less thevalue of aluminum and services provided by outside service providers that are included in net sales. Asdiscussed further below, arrangements with our customers allow us to pass on changes in aluminum prices andoutside service provider costs; therefore, fluctuations in underlying aluminum prices and the use of outsideservice providers generally do not directly impact our profitability. Accordingly, value added sales is worthy
30

of being highlighted for the benefit of users of our financial statements. Our intent is to allow users of thefinancial statements to consider our net sales information both with and without the aluminum and outsideservice provider cost components thereof. Management utilizes value added sales as a key metric to determinegrowth of the company because it eliminates the volatility of aluminum prices. See the Non-GAAP FinancialMeasures section of this Annual Report for a reconciliation of value added sales to net sales.
(2) Adjusted EBITDA is a key measure that is not calculated according to GAAP. Adjusted EBITDA is defined asearnings before interest income and expense, income taxes, depreciation, amortization, restructuring and otherclosure costs, impairments of long-lived assets and investments, acquisition costs and integration costs. Weuse Adjusted EBITDA as an important indicator of the operating performance of our business. We useAdjusted EBITDA in internal financial forecasts and models when establishing internal operating budgets,supplementing the financial results and forecasts reported to our Board of Directors and evaluating short-termand long-term operating trends in our operations. We believe the Adjusted EBITDA financial measure assistsin providing a more complete understanding of our underlying operational measures to manage our business,to evaluate our performance compared to prior periods and the marketplace and to establish operational goals.We believe that these non-GAAP financial measures are useful to investors because they allow investors toevaluate the effectiveness of the methodology and information used by management in our financial andoperational decision-making. Adjusted EBITDA is a non-GAAP financial measure and should not beconsidered in isolation or as a substitute for financial information provided in accordance with GAAP. Thisnon-GAAP financial measure may not be computed in the same manner as similarly titled measures used byother companies. See the Non-GAAP Financial Measures section of this Annual Report for a reconciliation ofour Adjusted EBITDA to net income.
(3) Adjusted EBITDA: Percentage of net sales is a key measure that is not calculated according to GAAP.Adjusted EBITDA as a percentage of net sales is defined as Adjusted EBITDA divided by net sales. See theNon-GAAP Financial Measures section of this Annual Report for a reconciliation of Adjusted EBITDA.
(4) Adjusted EBITDA: Percentage of value added sales is a key measure that is not calculated according toGAAP. Adjusted EBITDA as a percentage of value added sales is defined as Adjusted EBITDA divided byvalue added sales. See the Non-GAAP Financial Measures section of this Annual Report for a reconciliation ofAdjusted EBITDA and value added sales.
2017 versus 2016
Net Sales
Net sales for 2017 increased $375.4 million over 2016 due to the inclusion of seven months of sales of ourEuropean operations. Overall unit shipments increased in the current year to 17.0 million from 12.3 million, anincrease of 38.2 percent, which was driven by the addition of seven months’ unit sales for our newly acquiredEuropean operations. Net sales were also favorably impacted by an increase in the value of the aluminumcomponent of sales, which we generally pass through to our customers. The North American average sellingprice per wheel increased by 6.8 percent during 2017 in comparison to 2016 due mainly to favorable mix with ahigher percentage of larger diameter wheels and the increase in aluminum prices.
As a result of the acquisition of Uniwheels in 2017, our major customer mix of shipments became morediversified as shown below:
Fiscal Year Ended December 31, 2017 2016 2015
Ford . . . . . . . . . . . . . . . . . . . . . . . . . . . . . . . . . . . . . . . . . . . . . . . . . . . . 22% 36% 42%GM . . . . . . . . . . . . . . . . . . . . . . . . . . . . . . . . . . . . . . . . . . . . . . . . . . . . . 20% 29% 25%Toyota . . . . . . . . . . . . . . . . . . . . . . . . . . . . . . . . . . . . . . . . . . . . . . . . . . 9% 14% 14%Other international customers . . . . . . . . . . . . . . . . . . . . . . . . . . . . . . . . 49% 21% 19%
Total . . . . . . . . . . . . . . . . . . . . . . . . . . . . . . . . . . . . . . . . . . . . . . . . . . . . 100% 100% 100%
31

Cost of Sales
Cost of sales increased significantly in 2017 due to the inclusion of seven months of costs of our newly acquiredEuropean operations. In addition, an increase in aluminum costs resulted in higher cost of sales in our NorthAmerican operations, which is typically passed through to the customer.
Selling, General and Administrative Expenses
Selling, general and administrative expenses also increased significantly in 2017 in comparison to 2016 due tothe inclusion of seven months of our European operations and $32.1 million of acquisition and integrationexpenses related to the acquisition of Uniwheels.
Net Interest Expense
Net interest expense for 2017 was $40.0 million, while the company recognized $0.2 million of net interestincome in 2016. Interest expense increased in 2017 due to the new debt issued to finance the acquisition ofUniwheels.
Net Other Income
Net other income was $13.2 million in 2017 compared with net other expense of $0.1 million in 2016. Thesignificant increase was due in part to foreign exchange gains of $12.9 million in 2017 (including an acquisition-related foreign exchange gain of $8.2 million), as compared to foreign exchange losses of $0.4 million in 2016.We also recognized a $0.5 million gain on sale of our minority interest in Synergies Casting Limited, a privatealuminum wheel manufacturer based in Visakhapatnam, India
Change in Fair Value of Embedded Derivative Liability
During 2017, we recognized a $6.2 million change in the fair value of our redeemable preferred stock embeddedderivative liability. The beginning fair value of the embedded derivative liability was measured as of the date ofissuance, May 22, 2017. During the third and fourth quarter, the fair value of the embedded derivative liabilitydecreased, primarily due to the decline in our stock price.
Income Tax Provision
The income tax provision for 2017 was $6.9 million on a pre-tax income of $0.9 million due primarily to the splitof jurisdictional pre-tax income or loss, certain non-deductible acquisition costs related to the Uniwheelsacquisition, and provisional estimates recorded for the transition tax on offshore earnings and a deferred taxexpense. The deferred tax expense resulted from the reduction of our deferred tax assets due to the change in thestatutory federal income tax rate from 35% to 21% for years subsequent to 2017, based on the newly enactedU.S. Tax Cuts and Jobs Act (“The Act”). The income tax provision for 2016 was $13.3 million, representing aneffective income tax rate of 24.4 percent. The effective tax rate for 2016 was lower than the statutory rate due toearnings in countries with tax rates lower than the U.S. statutory rate.
Net Income Attributable to Superior
Net loss attributable to Superior in 2017 was $6.2 million, or a loss of $1.01 per diluted share, compared to netincome in 2016 of $41.4 million, or $1.62 per diluted share. The decrease in 2017 diluted per share was mainlydriven by the acquisition costs, integration costs, interest expense, accretion on preferred equity, and thedividends that were issued to the preferred equity holder.
32

Segment Sales and Income from Operations
Year EndedDecember 31,
2017 2016 Change
(Dollars in thousands)
Selected dataNet Sales
North America . . . . . . . . . . . . . . . . . . . . . . . . . . $ 732,418 $732,677 $ (259)Europe . . . . . . . . . . . . . . . . . . . . . . . . . . . . . . . . 375,637 — 375,637
Total net sales . . . . . . . . . . . . . . . . . . . . . . $1,108,055 $732,677 $375,378
Income (loss) from OperationsNorth America . . . . . . . . . . . . . . . . . . . . . . . . . . $ 9,808 $ 54,602 $ (44,794)Europe . . . . . . . . . . . . . . . . . . . . . . . . . . . . . . . . 11,710 — 11,710
Total income from operations . . . . . . . . . . $ 21,518 $ 54,602 $ (33,084)
North America
Due to the acquisition of our European operations on May 30, 2017, we will provide geographical segmentanalysis for the 2017 and 2016 results of operations discussion and analysis rather than the geographicaldiscussion that was provided in 2016 and 2015. In 2017, net sales of our North America segment remained at aconsistent level despite a 6.4 percent decrease in volume due to a 6.8 percent increase in average unit sellingprice. Unit shipments declined from 12.3 million in 2016 to 11.5 million in 2017 resulting in a $47.0 millionreduction in revenue which was fully offset by the increase in average selling price. The decline in volumeresulted from lower unit sales with Ford, GM and FCA, partially offset by increased sales at Nissan and Subaru.The increase in average selling price was driven by an increase in the value of the aluminum component of sales,which we generally pass through to our customers, and our value added sales. The split between U.S. and Mexicosales were approximately 17.0 percent and 83.0 percent, respectively during 2017, which compares to16.4 percent and 83.6 percent for 2016.
The North America segment income from operations decreased in 2017 due to nonrecurring costs and productioninefficiencies. During 2017, the company incurred $29.5 million of additional costs relating to the acquisitionand integration of the European operations. We continued to invest in our machinery through higher levels ofmaintenance than in past years to alleviate the production issues that we have experienced since the secondquarter of 2016.
Europe
We acquired the Uniwheels business on May 30, 2017, which comprises our European operations. As a result,we have included seven months of our European operations in our consolidated statement of operations for 2017.The European operations sales increased over the same seven-month period last year by 18.6 percent. Incomefrom operations for this period included purchase accounting adjustments of $14.8 million related to inventory,and other expenses related to the acquisition and integration of the business.
2016 versus 2015
Net Sales
Net sales in 2016 increased $4.8 million to $732.7 million from $727.9 million in 2015. Wheel shipmentsincreased by 9 percent in 2016 compared to 2015 resulting in $60.8 million higher sales compared to 2015. Netsales were unfavorably impacted by a decline in the value of the aluminum component of sales which we
33

generally pass through to our customers and resulted in $61.5 million lower revenues. The average selling priceof our wheels decreased 8 percent due to the unfavorable impact of the decline in aluminum value. Increases inunit shipments to GM, Nissan, Toyota and Subaru were partially offset by decreases in unit shipments to Fordand FCA. Wheel program development revenues totaled $10.0 million in 2016 and $6.9 million in 2015.
U.S. Operations
Net sales of our U.S. plants in 2016 decreased 32 percent, to $120.4 million from $177.2 million in 2015,reflecting a decrease in unit shipments and a decrease in the average selling price of our wheels. Unit shipmentsfrom our U.S. plants decreased 28 percent in 2016, primarily reflecting the reallocation of production volume toour plants in Mexico. The decline in volume resulted in $50.5 million lower sales. The average selling price ofour wheels decreased 7 percent primarily due to the decline in the value of the aluminum component coupledwith the mix of wheel sizes and finishes sold. The lower aluminum value decreased revenues by approximately$9.4 million when compared to 2015.
Mexico Operations
Net sales of our Mexico plants in 2016 increased 11 percent, to $612.3 million from $550.7 million in 2015,reflecting a 20 percent increase in unit shipments offset partially by an 8 percent decrease in the average sellingprices of our wheels. The unit shipment volume increase in 2016 resulted in $111.3 million higher sales. The8 percent decrease in the average selling price of our wheels was primarily a result of the lower pass-throughprice of aluminum partially offset by a favorable mix of wheel sizes and finishes sold. The lower aluminum valuedecreased revenues by approximately $52.1 million when compared to 2015.
Our major customer mix, based on unit shipments, is shown below:
Fiscal Year Ended December 31, 2016 2015 2014
Ford . . . . . . . . . . . . . . . . . . . . . . . . . . . . . . . . . . . . . . . . . . . . . . . . . . . . 36% 42% 42%GM . . . . . . . . . . . . . . . . . . . . . . . . . . . . . . . . . . . . . . . . . . . . . . . . . . . . . 29% 25% 24%Toyota . . . . . . . . . . . . . . . . . . . . . . . . . . . . . . . . . . . . . . . . . . . . . . . . . . 14% 14% 12%FCA . . . . . . . . . . . . . . . . . . . . . . . . . . . . . . . . . . . . . . . . . . . . . . . . . . . . 6% 8% 10%Other international customers . . . . . . . . . . . . . . . . . . . . . . . . . . . . . . . . 15% 11% 12%
Total . . . . . . . . . . . . . . . . . . . . . . . . . . . . . . . . . . . . . . . . . . . . . . . . . . . . 100% 100% 100%
According to Ward’s Auto Info Bank, overall North American production of passenger cars and light-duty trucksin 2016 increased approximately 3 percent, while production of the specific passenger car and light-duty truckprograms using our wheels increased 1 percent. In contrast to the overall market, our total shipments increasedby 9 percent, resulting in our share of the North American aluminum wheel market increasing by 1 percentagepoint on a year-over-year basis. The increase in market share was 4 percentage points in passenger car programs,offset by a 3 percentage point decline in light-duty trucks.
Cost of Sales
In 2016, our consolidated cost of goods sold decreased $10.2 million to $646.5 million, or 88 percent of net sales,compared to $656.7 million, or 90 percent of net sales, in 2015. Cost of sales in 2016 primarily reflects a declinein aluminum prices of approximately $53.8 million, which we generally pass through to our customers, offset byan increase in freight, maintenance and supply costs. Freight costs increased $16.4 million to $20.4 million in2016, compared to $4.0 million in 2015 due mainly to expedited shipments of approximately $13 million tocustomers arising from the operating inefficiencies discussed in the executive overview section. Repair andmaintenance costs increased $4.3 million and supply costs increased $3.4 million in 2016 when compared to2015. Cost of sales associated with corporate services such as engineering support for wheel programdevelopment and manufacturing support increased $2.4 million in 2016 when compared to 2015 primarily due topre-production charges incurred on new product platforms and increased compensation costs.
34

U.S. Operations
Cost of sales for our U.S. operations decreased in 2016 by $61.6 million, or 30 percent when compared to2015. The 2016 decline in cost of sales for our U.S. plant primarily reflects the effect of reallocating productionvolume to our Mexico facilities which resulted in a 28 percent decline in unit shipments and the reduction oflabor and aluminum costs by $6.1 million and $10.9 million, respectively, when compared to 2015. Loweraluminum prices also contributed to the decline.
Mexico Operations
Cost of sales for our Mexico operations increased by $51.4 million in 2016 when compared to 2015, which ismainly driven by a 20 percent increase in wheel shipments. During 2016, plant labor and benefit costs, includingovertime premiums, increased approximately $4.6 million, primarily as a result of higher average headcount andwage increases. Direct material and contract labor costs increased approximately $1.9 million from 2015primarily due to the 20 percent rise in unit shipments. The increase in direct material costs was more than offsetby a decrease of approximately $42.9 million of aluminum purchase costs which we generally pass through toour customers. Depreciation increased $0.8 million in 2016 compared to 2015. Supply and small tool costsincreased $4.5 million and plant repair and maintenance expenses increased $4.9 million in 2016 compared to2015.
Gross ProfitConsolidated gross profit increased $15.0 million to $86.2 million, or 12 percent of net sales, compared to$71.2 million, or 10 percent of net sales, last year. The increase in gross profit primarily reflects the favorableimpact of the 9 percent increase in unit shipments and cost reduction resulting from the shift in manufacturingfrom our U.S. facility to facilities in Mexico. Partially offsetting the increase in gross profit were operatinginefficiencies incurred in one of our manufacturing facilities in the last six months of 2016.
Selling, General and Administrative Expenses
Selling, general and administrative expenses were $31.6 million, or 4 percent of net sales, in 2016 compared to$34.9 million, or 5 percent of net sales, in 2015. The 2016 decrease is primarily attributable to a $1.4 million gainon sale of the Rogers facility in the last quarter of 2016, a $1.0 million reduction of severance costs and a$1.4 million decline in compensation and employee benefit costs.
Income from Operations
Consolidated income from operations increased $18.3 million in 2016 to $54.6 million, or 7 percent of net sales,from $36.3 million, or 5 percent of net sales, in 2015.
Consolidated income from operations in 2016 was favorably impacted by a 9 percent increase in unit shipments,which was partially offset by operating inefficiencies incurred in one of our manufacturing facilities as morefully explained in the cost of sales discussion above.
U.S. Operations
Operating income from our U.S. operations for 2016 increased by $5.5 million compared to 2015. Operatingincome increased in 2016 as improved cost performance offset the impact of a 28 percent decrease in unitshipments. The overall cost improvement resulted from improved productivity, as well as lower supply andrepair and maintenance costs. However, the lower production levels had an unfavorable impact on operatingincome due to lower absorption of fixed overhead costs in 2016 when compared to 2015.
35

Mexico Operations
Operating income from our Mexico operations increased by $12.8 million in 2016 compared to 2015 and reflectsa $12.5 million increase in gross profit in 2016. The increase in gross profit primarily reflects a 20 percentincrease in unit shipments and a favorable mix of wheel sizes and finishes sold, when compared to 2015.
U.S. versus Mexico Production
During 2016, wheels produced by our Mexico and U.S. operations accounted for 86 percent and 14 percent,respectively, of our total production. During 2015, wheels produced by our Mexico and U.S. operationsaccounted for 78 percent and 22 percent, respectively, of our total production.
Interest Income, net and Other Income (Expense), net
Net interest income was $0.2 million and $0.1 million in 2016 and 2015, respectively due to the increase in theaverage cash balance which was mainly related to the increase in operating income.
Net other income (expense) was expense of $0.1 million and $1.1 million in 2016 and 2015, respectively.
Also included in other income (expense) net are foreign exchange losses of $0.4 million and $1.2 million in 2016and 2015, respectively.
Effective Income Tax Rate
Our income before income taxes was $54.7 million in 2016 and $35.3 million in 2015. The effective tax rate onthe 2016 pretax income was 24.4 percent compared to 32.1 percent in 2015.
The 2016 effective income tax rate was 24.4 percent. The effective tax rate was lower than the U.S. federalstatutory rate primarily as a result of income in jurisdictions where the statutory rate is lower than the U.S. rateand tax benefits due to the release of tax liabilities related to uncertain tax positions as a result of settlementswith various tax jurisdictions.
Our effective income tax rate for 2015 was 32.1 percent. The effective tax rate was lower than the U.S. federalstatutory rate primarily as a result of net decreases in the liability for uncertain tax positions partially offset bythe reversal of deferred tax assets related to stock based compensation.
Net Income
Net income in 2016 was $41.4 million, or 6 percent of net sales compared to $23.9 million, or 3 percent of netsales in 2015. Earnings per share were $1.62 and $0.90 per diluted share in 2016 and 2015, respectively.
Liquidity and Capital Resources
Our sources of liquidity primarily include cash, cash equivalents and short-term investments, net cash providedby operating activities, our senior notes and borrowings under available debt facilities and, from time to time,other external sources of funds. Working capital (current assets minus current liabilities) and our current ratio(current assets divided by current liabilities) were $222.3 million and 2.1:1, respectively, at December 31, 2017,versus $168.1 million and 3.0:1 at December 31, 2016. As of December 31, 2017, our cash, cash equivalents andshort-term investments totaled $47.1 million compared to $58.5 million at December 31, 2016. The 2017increase in working capital resulted primarily from the acquisition of Uniwheels.
Our working capital requirements, investing activities and cash dividend payments historically have been fundedfrom internally generated funds, or existing cash, cash equivalents and short-term investments, and we believethese sources will continue to meet our capital requirements in the foreseeable future. Our working capitaldecreased in 2017, primarily due to an increase in accounts payable related to timing of payments.
36

In connection with the acquisition of Uniwheels, we entered into several debt and equity financing arrangementsduring 2017. On March 22, 2017, we entered into a senior secured credit agreement (the “Credit Agreement”)with Citibank, N.A, JP Morgan Chase N.A., Royal Bank of Canada and Deutsche Bank A.G. New York Branch(collectively, the “Lenders”). The Credit Agreement consists of a $400.0 million senior secured term loan facility(the “Term Loan Facility”) and a $160.0 million revolving credit facility. On May 22, 2017, we issued140,202 shares of Series A redeemable preferred stock and 9,798 shares of Series B redeemable preferred stockto TPG Superior and TPG Growth III Sidewall, L.P. (“TPG”) for an aggregate purchase price of $150.0 million.On June 15, 2017, we issued €250.0 million aggregate principal amount of 6.00% Senior Notes (the “Notes”) dueJune 15, 2025. In addition, as a part of the Uniwheels acquisition, we assumed $70.7 million of outstanding debt.At December 31, 2017, balances outstanding under the Term Loan Facility, Notes and an equipment loan were$386.8 million, $300.3 million and $20.8 million, respectively. Unused commitments under the revolving creditfacility were $157.2 million and there was 30.0 million Euro available under a Uniwheels line of credit as ofDecember 31, 2017.
As part of our commitment to enhancing shareholder value, we have engaged in repurchases of our commonstock from time to time. In October 2014, our Board of Directors approved the 2014 Repurchase Program,authorizing the repurchase of up to $30.0 million of our common stock. The 2014 Repurchase Program wascompleted in January 2016, with purchases from October 2014 to January 2016 of 1,642,924 shares for a cost of$30.0 million. In January 2016, the Board of Directors authorized the repurchase of up to $50.0 million ofcommon stock under the 2016 Repurchase Program. Under the 2016 Repurchase Program, we may repurchasecommon stock from time to time on the open market or in private transactions. During 2016, we repurchased454,718 shares of company stock at a cost of $10.4 million under the 2016 Repurchase Program. During 2017,we purchased an additional 215,841 shares of company stock at a cost of $5.0 million under the 2016 RepurchaseProgram. The timing and extent of the repurchases under the 2016 Repurchase Program will depend upon marketconditions and other corporate considerations in our sole discretion.
The following table summarizes the cash flows from operating, investing and financing activities as reflected inthe consolidated statements of cash flows.
Fiscal Year Ended December 31, 2017 2016 2015
(Thousands of dollars)
Net cash provided by operating activities . . . . . . . . . . $ 63,710 $ 78,491 $ 59,349Net cash used in investing activities . . . . . . . . . . . . . . (777,614) (35,038) (34,946)Net cash used in financing activities . . . . . . . . . . . . . . 701,107 (37,327) (31,348)Effect of exchange rate changes on cash . . . . . . . . . . . 1,371 (376) (3,470)
Net (decrease) increase in cash and cashequivalents . . . . . . . . . . . . . . . . . . . . . . . . . . . . . . . . $ (11,426) $ 5,750 $(10,415)
2017 versus 2016
Operating Activities
Net cash provided by operating activities was $63.7 million in 2017, compared to net cash provided by operatingactivities of $78.5 million for 2016. The decrease in cash flow provided by operating activities was mainly due tolower net income primarily due to the acquisition of Uniwheels and integration related fees, and an increase ininventory partially offset by increases in trade payables.
Investing Activities
Net cash used in investing activities was $777.6 million in 2017 compared to $35.0 million in 2016. Net cashused in investing activities was higher in 2017 primarily due to the Uniwheels acquisition.
37

Financing Activities
Net cash provided by financing activities was $701.1 million in 2017 compared to net cash used in financingactivities of $37.3 million in 2017. Net cash provided by financing activities was higher in 2017 due to debtissued to finance the Uniwheels acquisition.
2016 versus 2015
Our liquidity remained strong in 2016. Working capital (current assets minus current liabilities) and our currentratio (current assets divided by current liabilities) were $168.1 million and 3.0:1, respectively, at December 31,2016, versus $172.0 million and 3.3:1 at December 31, 2015. The 2016 decrease in working capital resultedprimarily from an increase in accounts payable related to timing of payments which was partially offset by anincrease in inventory. We generate our principal working capital resources primarily through operations. Theincrease in cash from working capital in 2016 primarily reflects a significant increase in net income and anincrease in accounts payable offset by increased inventories. Assuming continuation of our historically strongliquidity, which includes funds available under our revolving credit facility, we believe we are well positioned totake advantage of new and complementary business opportunities, and to fund our working capital and capitalexpenditure requirements for the foreseeable future.
Operating Activities
Net cash provided by operating activities increased $19.1 million to $78.5 million for 2016, compared to net cashprovided by operating activities of $59.3 million for 2015. The increase in operating activities relates primarily tothe $17.4 million increase in net income. Additional sources of cash flow related to a $15.9 million increase inaccounts payable and an $8.0 million decrease in accounts receivable. Offsetting amounts were cash flow uses of$22.3 million increase in inventories and a $4.7 million decrease in income tax payable.
Investing Activities
Our principal investing activities during 2016 were the funding of $39.6 million of capital expenditures and$4.3 million proceeds from the sale of the Rogers facility. Principal investing activities during 2015 included thefunding of $39.5 million of capital expenditures and the purchase of $1.0 million of certificates of deposit,partially offset by the receipt of $3.8 million cash proceeds from maturing certificates of deposit and $1.9 millionproceeds from sales of fixed assets.
Financing Activities
Our principal financing activities during 2016 consisted of the repurchase of our common stock for cash totaling$20.7 million and payment of cash dividends on our common stock totaling $18.3 million, partially offset by thereceipt of cash proceeds from the exercise of stock options totaling $1.6 million. Financing activities during 2015consisted of the repurchase of our common stock for cash totaling $19.6 million and payment of cash dividendson our common stock totaling $19.1 million, partially offset by the receipt of cash proceeds from the exercise ofstock options totaling $7.3 million.
Risk Management
We are subject to various risks and uncertainties in the ordinary course of business due, in part, to thecompetitive global nature of the industry in which we operate, to changing commodity prices for the materialsused in the manufacture of our products, and to development of new products.
We have operations in Mexico with sale and purchase transactions denominated in both Pesos and dollars. ThePeso is the functional currency of certain of our operations in Mexico. The settlement of accounts receivable and
38

accounts payable transactions denominated in a non-functional currency results in foreign currency transactiongains and losses. In 2017, the value of the Mexican Peso increased by 5.1 percent in relation to the U.S.dollar. We had foreign currency transaction gains in 2017 of $11.0 million and losses in 2016 and 2015 of$0.4 million and $1.2 million, respectively, which are included in other income (expense) in the ConsolidatedIncome Statements in Item 8, “Financial Statements and Supplementary Data” of this Annual Report. In additionto gains on Peso foreign currency transactions, the 2017 gain includes an $8.2 million realized gain on a Zlotyforward contract used to hedge the acquisition purchase price and a $2.5 million unrealized loss on a Euro crosscurrency swap.
Since 1990, the Mexican Peso has experienced periods of relative stability followed by periods of major declinesin value. The impact of changes in value of our foreign operations relative to the U.S. dollar has resulted in acumulative unrealized translation loss at December 31, 2017 of $101.0 million. Translation gains and losses areincluded in other comprehensive income (loss) in the Consolidated Statements of Shareholders’ Equity in Item 8,“Financial Statements and Supplementary Data” of this Annual Report.
We also have operations in Europe with sale and purchase transactions denominated in Euros and Zlotys. TheEuro is the functional currency of our operations in Europe. A significant component of our European productionoperations is located in Poland. The settlement of accounts receivable and accounts payable for these operationsrequires the transfer of funds denominated in Zlotys. The value of the Euro has increased 7.2 percent in relationto the U.S. dollar in the seven months following the acquisition of Uniwheels ended December 31, 2017. Duringthat same period the value of the Zloty has remained relatively flat in relation to the Euro. Foreign currencytransaction gains totaled $1.9 million in 2017. All transaction gains and losses are included in other income(expense) in the condensed consolidated statements of operations.
As it relates to foreign currency translation gains and losses, the Euro has experienced periods of relative stabilityin value. The impact of changes in value relative to our European operations resulted in a cumulative unrealizedtranslation gain at December 31, 2017 of $26.2 million. Translation gains and losses are included in othercomprehensive income in the condensed consolidated statements of comprehensive income.
Changes in currency exchange rates may affect the relative prices at which we and our foreign competitors sellproducts in the same market. In addition, changes in the value of the relevant currencies may affect the cost ofcertain items required in our operations. The vast majority of our European revenues will be denominated in theEuros. Accordingly, the foreign exchange exposure associated with Peso and Zloty denominated costs is agrowing risk factor and could have a material adverse effect on our operating results.
We are entering into foreign currency forward and option contracts with financial institutions to protect againstforeign exchange risks associated with certain existing assets and liabilities, certain firmly committedtransactions and forecasted future cash flows. We have implemented a program to hedge a portion of our materialforeign exchange exposures, typically for up to 48 months. However, we may choose not to hedge certain foreignexchange exposures for a variety of reasons, including but not limited to accounting considerations andprohibitive economic cost of hedging particular exposures. We do not use derivative contracts for trading,market-making, or speculative purposes. For additional information on our derivatives, see Notes 5 and 20 of theNotes to the Financial Statements in Item 8, “Financial Statements and Supplementary Data” of this AnnualReport.
When market conditions warrant, we may enter into purchase commitments to secure the supply of certaincommodities used in the manufacture of our products, such as aluminum, natural gas and other raw materials. Wepreviously had several purchase commitments for the delivery of natural gas through 2015. These natural gascontracts were considered to be derivatives under U.S. GAAP, and when entering into these contracts, it wasexpected that we would take full delivery of the contracted quantities of natural gas over the normal course ofbusiness. Accordingly, at inception, these contracts qualified for the normal purchase, normal sale (“NPNS”)exemption provided for under U.S. GAAP.
39

Contractual Obligations
Contractual obligations as of December 31, 2017 are as follows (amounts in millions):
Payments Due by Fiscal Year
Contractual Obligations 2018 2019 2020 2021 2022 Thereafter Total
Long-term debt . . . . . . . . . . . . . . . . . . . . . . . . . . . . . . $ 4.0 $ 3.2 $ 3.2 $ 7.2 $ 7.2 $683.1 $707.9Retirement plans . . . . . . . . . . . . . . . . . . . . . . . . . . . . . 1.4 1.4 1.5 1.4 1.5 43.9 51.1Purchase obligations . . . . . . . . . . . . . . . . . . . . . . . . . . 13.6 — — — — — 13.6Capital leases . . . . . . . . . . . . . . . . . . . . . . . . . . . . . . . 0.8 0.5 — — — — 1.3Operating leases . . . . . . . . . . . . . . . . . . . . . . . . . . . . . 4.4 3.2 3.2 2.9 2.5 7.2 23.4
Total . . . . . . . . . . . . . . . . . . . . . . . . . . . . . . . . . . . . . . $24.2 $ 8.3 $ 7.9 $11.5 $11.2 $734.2 $797.3
The table above does not reflect unrecognized tax benefits and related interest and penalties of $35.5 million, forwhich the timing of settlement is uncertain, a $16.1 million liability carried on our consolidated balance sheet atDecember 31, 2017 for derivative financial instruments maturing in 2018 through 2021 nor the redeemablepreferred stock embedded derivative liability of $4.7 million. In addition, the table does not include dividendpayments nor redemption of the redeemable preferred stock
Off-Balance Sheet Arrangements
As of December 31, 2017, we had no significant off-balance sheet arrangements other than factoring of$13.6 million of our trade receivables in European business.
Inflation
Inflation has not had a material impact on our results of operations or financial condition for the three yearsended December 31, 2017. Cost increases in our principal raw material, aluminum, fundamentally are passedthrough to our customers, with timing of the pass-through dependent on the specific commercial agreements.Wage increases during the current year ranged from approximately 3 percent to 6 percent depending on locationand job performance. Cost increases for labor, other raw materials and for energy may not be recovered in ourselling prices. Additionally, competitive global pricing pressures are expected to continue, which may lessen thepossibility of recovering these types of cost increases in selling prices.
NON-GAAP FINANCIAL MEASURES
In this Annual Report, we discuss two important measures that are not calculated according to U.S. GAAP, valueadded sales and Adjusted EBITDA.
Value added sales is a key measure that is not calculated according to GAAP. In the discussion of operatingresults, we provide information regarding value added sales. Value added sales represents net sales less the valueof aluminum and services provided by outsourced service providers (OSPs) that are included in net sales. Asdiscussed further below, arrangements with our customers allow us to pass on changes in aluminum prices andOSP costs; therefore, fluctuations in underlying aluminum price and the use of OSPs generally do not directlyimpact our profitability. Accordingly, value added sales is worthy of being highlighted for the benefit of users ofour financial statements. Our intent is to allow users of the financial statements to consider our net salesinformation both with and without the aluminum and OSP cost components thereof. Management utilizes value
40

added sales as a key metric to determine growth of the company because it eliminates the volatility of aluminumprices.
Fiscal Year Ended December 31, 2017 2016 2015 2014 2013
(Thousands of dollars)
Net Sales . . . . . . . . . . . . . . . . . . . . . . . . . . . . . . . $1,108,055 $ 732,677 $ 727,946 $ 745,447 $ 789,564Less, aluminum value and OSP . . . . . . . . . . . . . . (491,302) (323,987) (367,100) (376,092) (388,973)
Value added sales . . . . . . . . . . . . . . . . . . . . . . . . . $ 616,753 $ 408,690 $ 360,846 $ 369,355 $ 400,591
Adjusted EBITDA is a key measure that is not calculated according to GAAP. Adjusted EBITDA is defined asearnings before interest income and expense, income taxes, depreciation, amortization, restructuring charges andother closure costs and impairments of long-lived assets and investments, acquisition costs and integration costs.We use Adjusted EBITDA as an important indicator of the operating performance of our business. AdjustedEBITDA is used in our internal forecasts and models when establishing internal operating budgets,supplementing the financial results and forecasts reported to our Board of Directors and evaluating short-termand long-term operating trends in our operations. We believe the Adjusted EBITDA financial measure assists inproviding a more complete understanding of our underlying operational measures to manage our business, toevaluate our performance compared to prior periods and the marketplace and to establish operational goals.Adjusted EBITDA is a non-GAAP financial measure and should not be considered in isolation or as a substitutefor financial information provided in accordance with GAAP. This non-GAAP financial measure may not becomputed in the same manner as similarly titled measures used by other companies.
Adjusted EBITDA as a percentage of net sales is a key measure that is not calculated according to GAAP.Adjusted EBITDA as a percentage of net sales is defined as Adjusted EBITDA divided by net sales.Adjusted EBITDA as a percentage of value added sales is a key measure that is not calculated according toGAAP. Adjusted EBITDA as a percentage of value added sales is defined as Adjusted EBITDA divided by valueadded sales.
41

The following table reconciles our net income, the most directly comparable GAAP financial measure, to ourAdjusted EBITDA:
Fiscal Year Ended December 31, 2017 2016 2015 2014 2013
(Thousands of dollars)
Income from operations . . . . . . . . . . . . . . . . . . . . . . . . . . 21,518 54,602 36,294 17,913 34,593Interest (expense) income, net . . . . . . . . . . . . . . . . . . . . . (40,004) 245 103 1,095 1,691Other income (expense), net . . . . . . . . . . . . . . . . . . . . . . 13,188 (126) (1,114) (3,306) 557Change in fair value of redeemable preferred stock
embedded derivative liability (3) . . . . . . . . . . . . . . . . . . 6,164 — — — —Income tax provision . . . . . . . . . . . . . . . . . . . . . . . . . . . . (6,875) (13,340) (11,339) (6,899) (14,017)
Net income . . . . . . . . . . . . . . . . . . . . . . . . . . . . . . . . . . . . $ (6,009) $ 41,381 $ 23,944 $ 8,803 $ 22,824Interest expense (income), net . . . . . . . . . . . . . . . . . . . . . 40,004 (245) (103) (1,095) (1,691)Income tax provision . . . . . . . . . . . . . . . . . . . . . . . . . . . . 6,875 13,340 11,339 6,899 14,017Depreciation (1) . . . . . . . . . . . . . . . . . . . . . . . . . . . . . . . . . 54,167 34,261 34,530 35,582 28,466Amortization . . . . . . . . . . . . . . . . . . . . . . . . . . . . . . . . . . . 15,168 — — — —Acquisition support, integration and other (2) . . . . . . . . . . 35,906 — — — —Change in fair value of redeemable preferred stock
embedded derivative liability (3) . . . . . . . . . . . . . . . . . . (6,164) — — — —Closure costs (excluding accelerated depreciation) (4) . . . 138 1,210 6,343 5,564 —Gain on sale of facility (4) . . . . . . . . . . . . . . . . . . . . . . . . . — (1,436) — — —
Adjusted EBITDA . . . . . . . . . . . . . . . . . . . . . . . . . . . . . . $140,085 $ 88,511 $ 76,053 $55,753 $ 63,616
Adjusted EBITDA as a percentage of net sales . . . . 12.6% 12.1% 10.4% 7.5% 8.1%Adjusted EBITDA as a percentage of value added
sales . . . . . . . . . . . . . . . . . . . . . . . . . . . . . . . . . . . 22.7% 21.7% 21.1% 15.1% 15.9%
(1) Depreciation expense in 2016 and 2015 includes $0.2 million and $1.7 million, respectively, of accelerateddepreciation charges as a result of shortened estimated useful lives due to restructuring activities described inNote 3, “Restructuring” in the Notes to Consolidated Financial Statements in Item 8, “Financial Statementsand Supplementary Data” in this Annual Report.
(2) We incurred $25.1 million of costs related to the acquisition of Uniwheels. Additionally, we have incurredapproximately $10.8 million in integration costs related to aligning the two companies.
(3) The change in the fair value is mainly driven by the change in our stock price from the original valuation datein May 2017. Refer to Note 13, “Redeemable Preferred Shares” in the Notes to the Consolidated FinancialStatements in Item 8, “Financial Statements and Supplementary Data” in this Annual Report.
(4) In the fourth quarter of 2016, we sold the Rogers facility for total proceeds of $4.3 million, resulting in a$1.4 million gain on sale. Prior to the sale in 2016, Rogers incurred $1.5 million in closure and operating costs,which included $0.3 million in depreciation. The Rogers facility Adjusted EBITDA was a positive$0.2 million in 2016 due to the $1.4 million gain on sale. During 2015, we had completed the shutdown of theRogers facility which resulted in a gross margin loss of $8.0 million. We incurred $4.3 million in restructuringcosts related to an impairment of fixed assets and other associated costs such as asset relocation costs.Additionally, we experienced $2.0 million of further closure costs including inefficiencies and $1.7 million indepreciation. The Adjusted EBITDA impact of the Rogers facility closure for 2015 was $6.3 million, whichincludes the $4.3 million of restructuring costs and $2.0 million of inefficiency costs related to the closure.During 2014, we recorded $3.1 million of restructuring costs excluding accelerated depreciation and weimpaired an investment by $2.5 million.
Critical Accounting Policies and Estimates
The preparation of consolidated financial statements in conformity with U.S. GAAP requires management toapply significant judgment in making estimates and assumptions that affect amounts reported therein, as well as
42

financial information included in this Management’s Discussion and Analysis of Financial Condition and Resultsof Operations. These estimates and assumptions, which are based upon historical experience, industry trends,terms of various past and present agreements and contracts and information available from other sources that arebelieved to be reasonable under the circumstances, form the basis for making judgments about the carryingvalues of assets and liabilities that are not readily apparent through other sources. There can be no assurance thatactual results reported in the future will not differ from these estimates, or that future changes in these estimateswill not adversely impact our results of operations or financial condition. As described below, the mostsignificant accounting estimates inherent in the preparation of our financial statements include estimates andassumptions as to revenue recognition, inventory valuation, amortization of preproduction costs, impairment ofand the estimated useful lives of our long-lived assets, the fair value of stock-based compensation, as well asthose used in the determination of liabilities related to self-insured portions of employee benefits, workers’compensation, derivatives and deferred income taxes.
Wheel Revenue Recognition - Our products are manufactured to customer specifications under standard purchaseorders. We ship our products to OEM customers based on release schedules provided weekly by our customers.Our sales and production levels are highly dependent upon the weekly forecasted production levels of ourcustomers. Sales of these products, net of estimated pricing adjustments and their related costs are recognizedwhen title and risk of loss transfers to the customer, generally upon shipment. A portion of our selling prices toOEM customers is attributable to the aluminum content of our wheels. Our selling prices are adjustedperiodically for changes in the current aluminum market based upon specified aluminum price indices duringspecific pricing periods, as agreed with our customers. See Preproduction Costs and Revenue RecognitionRelated to Long-Term Supply Arrangements below for a discussion of tooling reimbursement revenues.
Derivative Financial Instruments and Hedging Activities - In order to hedge exposure related to fluctuations inforeign currency rates and the cost of certain commodities used in the manufacture of our products, weperiodically may purchase derivative financial instruments such as forward contracts, options or collars to offsetor mitigate the impact of such fluctuations. Programs to hedge currency rate exposure may address ongoingtransactions, including foreign-currency-denominated receivables and payables, as well as specific transactionsrelated to purchase obligations. Programs to hedge exposure to commodity cost fluctuations would be based onunderlying physical consumption of such commodity.
We account for our derivative instruments as either assets or liabilities and carry them at fair value. Forderivative instruments that hedge the exposure to variability in expected future cash flows that are designated ascash flow hedges, the effective portion of the gain or loss on the derivative instrument is reported as a componentof accumulated other comprehensive income (“AOCI”) in shareholders’ equity and reclassified into income inthe same period or periods during which the hedged transaction affects earnings. The ineffective portion of thegain or loss on the derivative instrument, if any, is recognized in current income. To receive hedge accountingtreatment, cash flow hedges must be highly effective in offsetting changes to expected future cash flows onhedged transactions. For forward exchange contracts designated as cash flow hedges, changes in the time valueare included in the definition of hedge effectiveness. Accordingly, any gains or losses related to this componentare reported as a component of AOCI in shareholders’ equity and reclassified into income in the same period orperiods during which the hedged transaction affects earnings. Derivatives that do not qualify as hedges areadjusted to fair value through current income. See Note 5, “Derivative Financial Instruments” in the Notes toConsolidated Financial Statements in Item 8 for further discussion of derivatives.
When market conditions warrant, we may also enter into contracts to secure the supply of certain commoditiesused in the manufacture of our products, such as aluminum, natural gas and other raw materials. We previouslyhad several purchase commitments for the delivery of natural gas through the end of 2015. These natural gascontracts were considered to be derivative instruments under U.S. GAAP and when entering into these contracts,it was expected that we would take full delivery of the contracted quantities of natural gas over the normal courseof business. Accordingly, at inception, these contracts qualified for the normal purchase normal sale exemptionprovided for under U.S. GAAP. As such, we do not account for these purchase commitments as derivatives
43

unless there is a change in the facts or circumstances that causes management to believe that these commitmentswould not be used in the normal course of business. In our European business, we have entered into forwardcontracts for aluminum which hedge the risk of fluctuations in commodity prices. See Note 20, “RiskManagement” in the Notes to Consolidated Financial Statements in Item 8 for additional information pertainingto these purchase commitments.
Redeemable Preferred Stock Embedded Derivative - In addition to derivative financial instruments used inhedging activities, we issued redeemable preferred stock as a part of the financing for the acquisition of ourEuropean business. The redeemable preferred stock includes embedded derivatives relating to the conversion andearly redemption options. Accordingly, we have recorded an embedded derivative liability representing thecombined fair value of the right of holders to receive common stock upon conversion of Series A redeemablepreferred stock at any time (the “conversion option”) and the right of the holders to exercise their earlyredemption option upon the occurrence of a redemption event (the “early redemption option”). The embeddedderivative liability is adjusted to reflect fair value at each period end with changes in fair value recorded in the“Change in fair value of redeemable preferred stock embedded derivative liability” financial statement line itemof the company’s consolidated statements of operations.
A binomial option pricing model is used to estimate the fair value of the conversion and early redemption optionsembedded in the redeemable preferred stock. The binomial model utilizes a “decision tree” whereby futuremovement in the company’s common stock price is estimated based on the volatility factor. The binomial optionspricing model requires the development and use of assumptions. These assumptions include estimated volatilityof the value of our common stock, assumed possible conversion or early redemption dates, an appropriate risk-free interest rate, risky bond rate and dividend yield. See Note 13, “Redeemable Preferred Shares” in the Notes toConsolidated Financial Statements in Item 8 for additional information pertaining to these embedded derivatives.
Fair Value Measurements - The company applies fair value accounting for all financial assets and liabilities andnon-financial assets and liabilities that are recognized or disclosed at fair value in the financial statements on arecurring basis, while other assets and liabilities are measured at fair value on a nonrecurring basis, such as whenwe have an asset impairment. Fair value is estimated by applying the following hierarchy, which prioritizes theinputs used to measure fair value into three levels and bases the categorization within the hierarchy upon thelowest level of input that is available and significant to the fair value measurement:
Level 1 - Quoted prices in active markets for identical assets or liabilities.
Level 2 - Observable inputs other than quoted prices in active markets for identical assets and liabilities,quoted prices for identical or similar assets or liabilities in inactive markets, or other inputs that areobservable or can be corroborated by observable market data for substantially the full term of the assets orliabilities.
Level 3 - Inputs that are generally unobservable and typically reflect management’s estimate of assumptionsthat market participants would use in pricing the asset or liability.
Our derivatives are over-the-counter customized derivative transactions and are not exchange traded. Weestimate the fair value of these instruments using industry-standard valuation models such as a discounted cashflow. These models project future cash flows and discount the future amounts to a present value using market-based expectations for interest rates, foreign exchange rates, commodity prices and the contractual terms of thederivative instruments. The discount rate used is the relevant interbank deposit rate (e.g., LIBOR) plus anadjustment for non-performance risk. In certain cases, market data may not be available and we may use brokerquotes and models (e.g., Black-Scholes) to determine fair value. This includes situations where there is lack ofliquidity for a particular currency or commodity or when the instrument is longer dated. The fair valuemeasurements of the redeemable preferred shares embedded derivatives are based upon Level 3 unobservableinputs reflecting management’s own assumptions about the inputs used in pricing the liability - refer to Note 5,“Derivative Financial Instruments” in the Notes to Consolidated Financial Statements in Item 8.
44

Inventories - Inventories are stated at the lower of cost or market value and categorized as raw material,work-in-process or finished goods. When necessary, management uses estimates of net realizable value to recordinventory reserves for obsolete and/or slow-moving inventory. Our inventory values in North America, which arebased upon standard costs for raw materials and labor and overhead established at the beginning of the year, areadjusted to actual costs on a first-in, first-out (“FIFO”) basis. Current raw material prices and labor and overheadcosts are utilized in developing these adjustments. Our inventories in Europe are based on average cost or theFIFO method.
Preproduction Costs and Revenue Recognition Related to Long-Term Supply Arrangements - We incurpreproduction engineering and tooling costs related to the products produced for our customers under long-termsupply agreements. We expense all preproduction engineering costs for which reimbursement is not contractuallyguaranteed by the customer or which are in excess of the contractually guaranteed reimbursement amount. Weamortize the cost of the customer-owned tooling over the expected life of the wheel program on a straight-linebasis. Also, we defer any reimbursements made to us by our customers and recognize the tooling reimbursementrevenue over the same period in which the tooling is in use. Changes in the facts and circumstances of individualwheel programs may accelerate the amortization of both the cost of the customer-owned tooling and the deferredtooling reimbursement revenues. Recognized tooling reimbursement revenues, which totaled approximately$11.9 million, $8.0 million and $5.8 million, in 2017, 2016 and 2015, respectively, are included in net sales in theConsolidated Income Statements in Item 8, “Financial Statements and Supplementary Data” of this AnnualReport. The following tables summarize the unamortized customer-owned tooling costs included in ournon-current assets, and the deferred tooling revenues included in accrued liabilities and other non-currentliabilities:
December 31, 2017 2016
(Dollars in Thousands)
Unamortized Preproduction CostsPreproduction costs . . . . . . . . . . . . . . . . . . . . . . . . . . . . . . . $ 84,198 $ 78,299Accumulated amortization . . . . . . . . . . . . . . . . . . . . . . . . . (71,409) (65,100)
Net preproduction costs . . . . . . . . . . . . . . . . . . . . . . . . . . . $ 12,789 $ 13,199
Deferred Tooling RevenueAccrued liabilities . . . . . . . . . . . . . . . . . . . . . . . . . . . . . . . . $ 4,654 $ 5,419Other non-current liabilities . . . . . . . . . . . . . . . . . . . . . . . . 1,974 2,593
Total deferred tooling revenue . . . . . . . . . . . . . . . . . . . . . . $ 6,628 $ 8,012
Impairment of Goodwill - As of December 31, 2017, we had recorded goodwill of $304.8 million as a result ofour acquisition of our European business on May 30, 2017. Goodwill must be tested on at least an annual basisand as of an interim period if an event or circumstance indicates that an impairment is more likely than not tohave occurred. In conducting our annual impairment testing, we may first perform a qualitative assessment ofwhether it is more likely than not that a reporting unit’s fair value is less than its carrying amount. If not, nofurther goodwill impairment testing is performed. If it is more likely than not that a reporting unit’s fair value isless than its carrying amount, or if we elect not to perform a qualitative assessment of a reporting unit, wecompare the fair value of the reporting unit to the related net book value. If the net book value of a reporting unitexceeds its fair value, an impairment loss is measured and recognized. We conduct our annual impairment testingas of the last day of our fourth quarter. We utilize a market approach supplemented by an income approach toassess fair value for goodwill.
In 2017, we performed a quantitative assessment of our European reporting unit as of December 31, 2017. Theassessment indicated that the fair value of the European reporting unit exceeded its respective carrying value.
Impairment of Long-Lived Assets and Investments - In accordance with U.S. GAAP, management evaluates therecoverability and estimated remaining lives of long-lived assets whenever facts and circumstances suggest that
45

the carrying value of the assets may not be recoverable or the useful life has changed. See Note 1, “Summary ofSignificant Accounting Policies” in the Notes to Consolidated Financial Statements in Item 8 for furtherdiscussion of asset impairments.When facts and circumstances indicate that there may have been a loss in value, management will also evaluateits cost and equity method investments to determine whether there was an other-than-temporary impairment. If aloss in the value of the investment is determined to be other than temporary, then the decline in value isrecognized in earnings. See Note 10, “Investment in Unconsolidated Affiliate” in the Notes to ConsolidatedFinancial Statements in Item 8 for discussion of our investment.
Trade names - The fair value of our trade name is estimated based upon management’s estimates using a royaltysavings approach, which is based on the principle that, if the business did not own the asset, it would have tolicense it in order to earn the returns that it was earning. The fair value is calculated based on the present value ofthe royalty stream that the business was saving by owning the asset. The projections that we use in our model areupdated annually and will change over time based on the historical performance and changing businessconditions of the European business. The determination of whether a trade name is impaired involves asignificant level of judgment in these assumptions, and changes in our business strategy, or economic or marketconditions could significantly impact these judgments.
Retirement Plans - Subject to certain vesting requirements, our unfunded retirement plan generally provides for abenefit based on final average compensation, which becomes payable on the employee’s death or upon attainingage 65, if retired. The net periodic pension cost and related benefit obligations are based on, among other things,assumptions of the discount rate, future salary increases and the mortality of the participants. The net periodicpension costs and related obligations are measured using actuarial techniques and assumptions. See Note 16,“Retirement Plans” in the Notes to Consolidated Financial Statements in Item 8 for a description of theseassumptions.
The following information illustrates the sensitivity to a change in certain assumptions of our unfundedretirement plans as of December 31, 2017. Note that these sensitivities may be asymmetrical and are specific to2017. They also may not be additive, so the impact of changing multiple factors simultaneously cannot becalculated by combining the individual sensitivities shown.
The effect of the indicated increase (decrease) in selected factors is shown below (in thousands):
Increase (Decrease) in:
AssumptionPercentage
Change
Projected BenefitObligation atDecember 31,
2017
2017 NetPeriodicPension
Cost
Discount rate . . . . . . . . . . . . . . . . . . . . . . . . . . . . . . . +1.0% $(3,429) $(156)Rate of compensation increase . . . . . . . . . . . . . . . . . +1.0% $ 427 $ 51
Stock-Based Compensation - We account for stock-based compensation using the fair value recognition inaccordance with U.S. GAAP. We use the Black-Scholes option-pricing model to determine the fair value of anystock options granted, which requires us to make estimates regarding dividend yields on our common stock,expected volatility in the price of our common stock, risk free interest rates, forfeiture rates and the expected lifeof the option. To the extent these estimates change, our stock-based compensation expense would change as well.The fair value of any restricted shares awarded is calculated using the closing market price of our common stockon the date of issuance. We recognize these compensation costs net of the applicable forfeiture rates andrecognize the compensation costs for only those shares expected to vest on a straight-line basis over the requisiteservice period of the award, which is generally the option vesting term of three or four years. We estimated theforfeiture rate based on our historical experience.
Trade names - The fair value of our trade name is estimated based upon management’s estimates using a royaltysavings approach, which is based on the principle that, if the business did not own the asset, it would have to
46

license it in order to earn the returns that it was earning. The fair value is calculated based on the present value ofthe royalty stream that the business was saving by owning the asset. The projections that we use in our model areupdated annually and will change over time based on the historical performance and changing businessconditions of the European business. The determination of whether a trade name is impaired involves asignificant level of judgment in these assumptions, and changes in our business strategy, or economic or marketconditions could significantly impact these judgments.
Workers’ Compensation and Loss Reserves - We self-insure any losses arising out of workers’ compensationclaims. Workers’ compensation accruals are based upon reported claims in process and actuarial estimates forlosses incurred but not reported. Loss reserves, including incurred but not reported reserves, are estimated usingactuarial methods and ultimate settlements may vary significantly from such estimates due to increased claimfrequency or the severity of claims.
Accounting for Income Taxes - We account for income taxes using the asset and liability method. The asset andliability method requires the recognition of deferred tax assets and liabilities for expected future taxconsequences of temporary differences that currently exist between the tax basis and financial reporting basis ofour assets and liabilities. We calculate current and deferred tax provisions based on estimates and assumptionsthat could differ from actual results reflected on the income tax returns filed during the following years.Adjustments based on filed returns are recorded when identified in the subsequent years.
The effect on deferred taxes for a change in tax rates is recognized in income in the period that the tax ratechange is enacted. In assessing the realizability of deferred tax assets, we consider whether it is more likely thannot that some portion of the deferred tax assets will not be realized. A valuation allowance is provided fordeferred income tax assets when, in our judgment, based upon currently available information and other factors,it is more likely than not that all or a portion of such deferred income tax assets will not be realized. Thedetermination of the need for a valuation allowance is based on an on-going evaluation of current informationincluding, among other things, historical operating results, estimates of future earnings in different taxingjurisdictions and the expected timing of the reversals of temporary differences. We believe that the determinationto record a valuation allowance to reduce a deferred income tax asset is a significant accounting estimate becauseit is based, among other things, on an estimate of future taxable income in the U.S. and certain other jurisdictions,which is susceptible to change and may or may not occur, and because the impact of adjusting a valuationallowance may be material.
In determining when to release the valuation allowance established against our net deferred income tax assets, weconsider all available evidence, both positive and negative. Consistent with our policy, the valuation allowanceagainst our net deferred income tax assets will not be reversed until such time as we have generated three yearsof cumulative pre-tax income and have reached sustained profitability, which we define as two consecutiveone-year periods of pre-tax income.
We account for our uncertain tax positions utilizing a two-step approach to evaluate tax positions. Step one,recognition, requires evaluation of the tax position to determine if based solely on technical merits it is morelikely than not to be sustained upon examination. Step two, measurement, is addressed only if a position is morelikely than not to be sustained. In step two, the tax benefit is measured as the largest amount of benefit,determined on a cumulative probability basis, which is more likely than not to be realized upon ultimatesettlement with tax authorities. If a position does not meet the more likely than not threshold for recognition instep one, no benefit is recorded until the first subsequent period in which the more likely than not standard is met,the issue is resolved with the taxing authority, or the statute of limitations expires. Positions previouslyrecognized are derecognized when we subsequently determine the position no longer is more likely than not to besustained. Evaluation of tax positions, their technical merits and measurements using cumulative probability arehighly subjective management estimates. Actual results could differ materially from these estimates.
Presently, we have not recorded a deferred tax liability for temporary differences related to investments inforeign subsidiaries that are essentially permanent in duration. These temporary differences may become taxable
47

upon a repatriation of earnings from the subsidiaries or a sale or liquidation of the subsidiaries. At this time thecompany does not have any plans to repatriate income from its foreign subsidiaries.
New Accounting Standards
In May 2014, the FASB issued ASU 2014-09, Revenue from Contracts with Customers. This update outlines asingle, comprehensive model for accounting for revenue from contracts with customers. We plan to adopt thisupdate on January 1, 2018. The guidance permits two methods of adoption: retrospectively to each priorreporting period presented (full retrospective method), or retrospectively with the cumulative effect of initiallyapplying the guidance recognized at the date of initial application (modified retrospective method). We anticipateadopting the standard using the modified retrospective method. We have completed our assessment and do notexpect that implementation will have any material effect on our financial position or operations.
In February 2016, the FASB issued ASU 2016-02, Leases (Topic 842) (“ASU 2016-02”). ASU 2016-02 requiresan entity to recognize right-of-use assets and lease liabilities on its balance sheet and disclose key informationabout leasing arrangements. ASU 2016-02 offers specific accounting guidance for a lessee, a lessor and sale andleaseback transactions. Lessees and lessors are required to disclose qualitative and quantitative information aboutleasing arrangements to enable a user of the financial statements to assess the amount, timing and uncertainty ofcash flows arising from leases. For public companies, ASU 2016-02 is effective for annual reporting periodsbeginning after December 15, 2018, including interim periods within that reporting period, and requires amodified retrospective adoption, with early adoption permitted. We are evaluating the impact this guidance willhave on our financial position and statement of operations.
In August 2016, the FASB issued an ASU entitled “Statement of Cash Flows (Topic 740): Classification ofCertain Cash Receipts and Cash Payments.” The objective of the ASU is to address the diversity in practice inthe presentation of certain cash receipts and cash payments in the statement of cash flows. This ASU is effectivefor fiscal years beginning after December 15, 2017, including interim periods within those fiscal years. Earlyadoption is permitted. We are evaluating the impact this guidance will have on our statement of cash flows.
In January 2017, the FASB issued an ASU entitled “Intangibles - Goodwill and Other (Topic 350): Simplifyingthe Test for Goodwill Impairment.” The objective of the ASU is to simplify how an entity is required to testgoodwill for impairment by eliminating Step 2 from the goodwill impairment test. Step 2 measures a goodwillimpairment loss by comparing the implied fair value of a reporting unit’s goodwill with the carrying amount ofthat goodwill. This ASU is effective for fiscal years beginning after December 15, 2019, including interimperiods within those fiscal years. Early adoption is permitted. We are evaluating the impact this guidance willhave on our financial position and statement of operations.
In January 2017, the FASB issued an ASU entitled “Business Combinations (Topic 805): Clarifying theDefinition of a Business.” The objective of the ASU is to assist entities with evaluating whether transactionsshould be accounted for as acquisitions (or disposals) of assets or businesses. This ASU is effective for fiscalyears beginning after December 15, 2017, including interim periods within those fiscal years. Early adoption ispermitted. We are evaluating the impact this guidance will have on our financial position and statement ofoperations.
In March 2017, the FASB issued an ASU entitled “Compensation-Retirement Benefits (Topic 715): Improvingthe Presentation of Net Periodic Pension Cost and Net Periodic Postretirement Benefit Cost.” The objective ofthe ASU is to improve the reporting of net benefit cost in the financial statements. This ASU is effective forfiscal years beginning after December 15, 2017, including interim periods within those fiscal years. Earlyadoption is permitted. We are evaluating the impact this guidance will have on our financial position andstatement of operations.
In July 2017, the FASB issued an ASU entitled “(Part I) Accounting for Certain Financial Instruments withDown Round Features, (Part II) Replacement of the Indefinite Deferral for Mandatorily Redeemable Financial
48

instruments of Certain Nonpublic Entities and Certain Mandatorily Redeemable Noncontrolling Interests with aScope Exception.” The objective of this ASU is to reduce the complexity in accounting for certain financialinstruments with down round features. When determining whether certain financial instruments should beclassified as debt or equity instruments, a down round feature would no longer preclude equity classificationwhen assessing whether the instrument is indexed to an entity’s own stock. As a result, a freestanding equity-linked financial instrument (or embedded conversion option) no longer would be accounted for as a derivativeliability at fair value as a result of the existence of a down round feature. Early adoption is permitted. We areevaluating the impact this guidance will have on our financial position and statement of operations.
In August 2017, the FASB issued an ASU entitled “Derivatives and Hedging (Topic 815).” The objective of thisstandard is to better align financial reporting with risk management activities, provide a more faithfulrepresentation of hedging activities and reduce complexity and costs associated with hedging. This ASU removesthe requirement to recognize hedge ineffectiveness in income prior to settlement, allows documentation of hedgeeffectiveness at inception to be completed by quarter-end, allows qualitative rather than quantitative assessmentof effectiveness (subsequent to initial quantitative assessment), allows critical terms match for cash flow hedgesof a group of forecasted transactions if derivatives mature within the same month as transactions, permits use ofthe “back up” long haul method for hedges initially designated using the short cut method and permits cash flowhedging of a component of purchases and sales of non-financial assets (i.e., commodity price excludingtransportation) resulting in higher hedge effectiveness. The ASU also permits fair value hedging of thebenchmark interest rate component of interest rate risk as well as partial term hedging, allows partial term fairvalue hedges of interest rate risk, permits cash flow hedging of interest rate risk for a contractually specified raterather than a benchmark rate and permits exclusion of cross currency basis spread in determining effectiveness.This ASU is effective for fiscal years beginning after December 15, 2018 and early adoption is permitted. We areevaluating the impact this guidance will have on our financial position and statement of operations.
On December 22, 2017, the Securities and Exchange Commission issued Staff Accounting Bulletin No. 118(SAB 118) to provide guidance regarding accounting and disclosure for tax effects arising from changes in taxregulations under the Tax Cuts and Jobs Act (the “Act”) enacted December 22, 2017. The Act containssignificant changes to corporate taxation, including reduction in the corporate tax rate from 35 percent to21 percent, a one-time transition tax on offshore earnings at reduced tax rates, elimination of U.S. tax on foreigndividends, new taxes on certain foreign earnings, a new minimum tax related to payments to foreign subsidiariesand affiliates, immediate deductions for certain new investments and the modification or repeal of many businessdeductions and credits. The Act will also have international tax consequences for many companies that operateinternationally. Generally, the SEC guidance directs companies to recognize income tax effects where requisiteanalysis can be completed prior to issuance of financial statements; estimate income tax effects where analysis isnot yet complete but a reasonable estimate can be determined; and disclose effects where no reasonable estimatecan be determined. The reasonable estimate would be reported as a provisional amount during a “measurementperiod.” In circumstances in which provisional amounts cannot be prepared, tax provisions should be determinedbased on tax laws in effect immediately prior to enactment of the Act. Disclosures should include tax effects forwhich accounting is incomplete; items reported as provisional amounts; current or deferred tax amounts forwhich the income tax effects of the Act have not been completed; the reason the initial accounting is incomplete;additional information needed to complete the accounting requirements under ASC Topic 740; nature andamount of any measurement period adjustments recognized during the reporting period; effect of measurementperiod adjustments on the effective tax rate; and the point at which accounting for the all tax effects of the Acthas been completed. Refer to Note 14, “Income Taxes” in the Notes to the Consolidated Financial Statements inItem 8 for additional information including the impact of the Act on our financial position and results ofoperations.
ITEM 7A - QUANTITATIVE AND QUALITATIVE DISCLOSURES ABOUT MARKET RISK
Foreign Currency. A significant portion of our business operations are conducted in Mexico and Europe,principally Germany and Poland. As a result, we have a certain degree of market risk with respect to our cash
49

flows due to changes in foreign currency exchange rates when transactions are denominated in currencies otherthan our functional currency, including inter-company transactions.
In accordance with our corporate risk management policies, we may enter into foreign currency forward andoption contracts and currency swaps with financial institutions to protect against foreign exchange risksassociated with certain existing assets and liabilities, certain firmly committed transactions and forecasted futurecash flows. We have implemented a program to hedge a portion of our material foreign exchange exposures, forup to approximately 48 months. However, we may choose not to hedge certain foreign exchange exposures for avariety of reasons including, but not limited to, accounting considerations and prohibitive economic cost ofhedging particular exposures. We do not use derivative contracts for trading, market-making, or speculativepurposes. For additional information on our derivatives, see Note 5, “Derivative Financial Instruments” in theNotes to Consolidated Financial Statements in Item 8.
At December 31, 2017, the fair value net liability for foreign currency exchange derivatives for the Peso was$11.5 million. The potential loss in fair value for such financial instruments from a 10 percent adverse change inquoted foreign currency exchange rates would be $23.3 million at December 31, 2017.
During 2017, the Mexican peso to U.S. dollar exchange rate averaged 18.96 Pesos to $1.00. Based on the balancesheet at December 31, 2017, the value of net assets for our operations in Mexico was 2,456 million Pesos.Accordingly, a 10 percent change in the relationship between the peso and the U.S. dollar would result in atranslation impact of $13.0 million, which would be recognized in other comprehensive (loss) income.
Since Uniwheels was acquired on May 30, 2017, the Euro to U.S. dollar exchange rate averaged $1.17 to1.00 Euro. Based on the balance sheet at December 31, 2017, the value of net assets for our operations in Europewas 683.1 million Euros. Accordingly, a 10 percent change in the relationship between the Euro and the U.S.dollar would result in a translation impact of $79.8 million, which would be recognized in other comprehensiveincome.
At December 31, 2017 the fair value liability for foreign currency exchange derivatives (consisting of crosscurrency swaps) for the Euro was $2.5 million. The potential loss in fair value for such financial instrumentsfrom a 10 percent adverse change in quoted foreign currency exchange rates would be $4.2 million atDecember 31, 2017.
At December 31, 2017, the fair value net asset for foreign currency exchange derivatives for the Zloty was$2.4 million. The potential loss in fair value for such financial instruments from a 10 percent adverse change inquoted foreign currency exchange rates would be $17.2 million at December 31, 2017.
Our business requires us to settle transactions between currencies in both directions - i.e., peso to U.S. dollar andvice versa. To the greatest extent possible, we attempt to match the timing and magnitude of transactionsettlements between currencies to create a “natural hedge.” For 2017, we had a $12.9 million net gain on foreignexchange transactions related to the Peso, Euro and Zloty. The net imbalance between currencies depends onmany factors including but not limited to, the company’s business model, location of production operations andassociated currencies, and geographic distribution of sales activity and associated currencies. While changes inthe terms of the contracts with our customers may create an imbalance between currencies that we are hedgingwith foreign currency forward contracts, there can be no assurances that our hedging program will effectivelyoffset the impact of the imbalance between currencies or that the net transaction balance will not changesignificantly in the future.
Commodity Purchase Commitments. When market conditions warrant, we enter into purchase commitments tosecure the supply of certain commodities used in the manufacture of our products, such as aluminum, natural gasand other raw materials. However, we do not enter into derivatives or other financial instrument transactions forspeculative purposes. At December 31, 2017, we had no purchase commitments in place for the delivery of
50

aluminum, natural gas or other raw materials. However, our European business has entered into forwardcontracts to hedge price fluctuations in its aluminum raw materials. At December 31, 2017 the fair value assetrelating to forward contracts for aluminum was $1.8 million. The change in fair value for such financialinstruments from a 10 percent adverse change in market price for aluminum would be $1.6 million atDecember 31, 2017.
See the section captioned “Risk Management” in Item 7, “Management’s Discussion and Analysis of FinancialCondition and Results of Operations” for a further discussion about the market risk we face.
51

ITEM 8 - FINANCIAL STATEMENTS AND SUPPLEMENTARY DATA
Index to the Consolidated Financial Statements of Superior Industries International, Inc.
PAGE
Report of Independent Registered Public Accounting Firm . . . . . . . . . . . . . . . . . . . . . . . . . . . . . . . . . . . . . 53
Financial Statements
Consolidated Income Statements for the Fiscal Years 2017, 2016 and 2015 . . . . . . . . . . . . . . . . . . . . 57
Consolidated Statements of Comprehensive Income for the Fiscal Years 2017, 2016 and 2015 . . . . . 58
Consolidated Balance Sheets as of the Fiscal Year End 2017 and 2016 . . . . . . . . . . . . . . . . . . . . . . . . 59
Consolidated Statements of Shareholders’ Equity for the Fiscal Years 2017, 2016 and 2015 . . . . . . . 60
Consolidated Statements of Cash Flows for the Fiscal Years 2017, 2016 and 2015 . . . . . . . . . . . . . . . 63
Notes to Consolidated Financial Statements . . . . . . . . . . . . . . . . . . . . . . . . . . . . . . . . . . . . . . . . . . . . . 64
52

REPORT OF INDEPENDENT REGISTERED PUBLIC ACCOUNTING FIRM
To the shareholders and the Board of Directors of Superior Industries International, Inc.
Opinion on the Financial Statements
We have audited the accompanying consolidated balance sheets of Superior Industries International, Inc. andsubsidiaries (the “Company”) as of December 31, 2017 and December 25, 2016, the related consolidated incomestatements, statements of comprehensive income, shareholders’ equity, and cash flows, for each of the threeyears in the periods ended December 31, 2017, December 25, 2016, and December 27, 2015, and the relatednotes and the schedule listed in the Index at Item 15 (collectively referred to as the “financial statements”). In ouropinion, the financial statements present fairly, in all material respects, the financial position of the Company asof December 31, 2017 and December 25, 2016, and the results of its operations and its cash flows for each of thethree years in the periods ended December 31, 2017, December 25, 2016, and December 27, 2015, in conformitywith accounting principles generally accepted in the United States of America.
We have also audited, in accordance with the standards of the Public Company Accounting Oversight Board(United States) (PCAOB), the Company’s internal control over financial reporting as of December 31, 2017,based on criteria established in Internal Control — Integrated Framework (2013) issued by the Committee ofSponsoring Organizations of the Treadway Commission and our report dated March 15, 2018, expressed anunqualified opinion on the Company’s internal control over financial reporting.
Basis for Opinion
These financial statements are the responsibility of the Company’s management. Our responsibility is to express anopinion on the Company’s financial statements based on our audits. We are a public accounting firm registered withthe PCAOB and are required to be independent with respect to the Company in accordance with the U.S. federalsecurities laws and the applicable rules and regulations of the Securities and Exchange Commission and the PCAOB.
53

We conducted our audits in accordance with the standards of the PCAOB. Those standards require that we planand perform the audit to obtain reasonable assurance about whether the financial statements are free of materialmisstatement, whether due to error or fraud. Our audits included performing procedures to assess the risks ofmaterial misstatement of the financial statements, whether due to error or fraud, and performing procedures thatrespond to those risks. Such procedures included examining, on a test basis, evidence regarding the amounts anddisclosures in the financial statements. Our audits also included evaluating the accounting principles used andsignificant estimates made by management, as well as evaluating the overall presentation of the financialstatements. We believe that our audits provide a reasonable basis for our opinion.
/s/ Deloitte & Touche LLP
Detroit, MichiganMarch 15, 2018
We have served as the Company’s auditor since 2009.
54

REPORT OF INDEPENDENT REGISTERED PUBLIC ACCOUNTING FIRM
To the shareholders and the Board of Directors of Superior Industries International, Inc.
Opinion on Internal Control over Financial Reporting
We have audited the internal control over financial reporting of Superior Industries International, Inc. andsubsidiaries (the “Company”) as of December 31, 2017, based on criteria established in Internal Control -Integrated Framework (2013) issued by the Committee of Sponsoring Organizations of the TreadwayCommission (COSO). In our opinion, the Company maintained, in all material respects, effective internal controlover financial reporting as of December 31, 2017, based on criteria established in Internal Control - IntegratedFramework (2013) issued by COSO.
We have also audited, in accordance with the standards of the Public Company Accounting Oversight Board(United States) (PCAOB), the consolidated financial statements and financial statement schedule as of and forthe year ended December 31, 2017, of the Company and our report dated March 15, 2018, expressed anunqualified opinion on those financial statements.
As described in Management’s Report on Internal Control Over Financial Reporting, management excluded fromits assessment the internal control over financial reporting at Uniwheels AG, which was acquired on May 30,2017 and whose financial statements constitute 32.8 percent of total assets (excluding goodwill and intangibleswhich are included within the scope of management’s assessment) and 33.9 percent of net sales of theconsolidated financial statement amounts as of and for the year ended December 31, 2017. Accordingly, ouraudit did not include the internal control over financial reporting at Uniwheels AG.
Basis for Opinion
The Company’s management is responsible for maintaining effective internal control over financial reporting andfor its assessment of the effectiveness of internal control over financial reporting, included in the accompanyingManagement’s Report on Internal Control Over Financial Reporting. Our responsibility is to express an opinionon the Company’s internal control over financial reporting based on our audit. We are a public accounting firmregistered with the PCAOB and are required to be independent with respect to the Company in accordance withthe U.S. federal securities laws and the applicable rules and regulations of the Securities and ExchangeCommission and the PCAOB.
We conducted our audit in accordance with the standards of the PCAOB. Those standards require that we planand perform the audit to obtain reasonable assurance about whether effective internal control over financialreporting was maintained in all material respects. Our audit included obtaining an understanding of internalcontrol over financial reporting, assessing the risk that a material weakness exists, testing and evaluating thedesign and operating effectiveness of internal control based on the assessed risk, and performing such otherprocedures as we considered necessary in the circumstances. We believe that our audit provides a reasonablebasis for our opinion.
55

Definition and Limitations of Internal Control over Financial Reporting
A company’s internal control over financial reporting is a process designed to provide reasonable assuranceregarding the reliability of financial reporting and the preparation of financial statements for external purposes inaccordance with generally accepted accounting principles. A company’s internal control over financial reportingincludes those policies and procedures that (1) pertain to the maintenance of records that, in reasonable detail,accurately and fairly reflect the transactions and dispositions of the assets of the company; (2) provide reasonableassurance that transactions are recorded as necessary to permit preparation of financial statements in accordancewith generally accepted accounting principles, and that receipts and expenditures of the company are being madeonly in accordance with authorizations of management and directors of the company; and (3) provide reasonableassurance regarding prevention or timely detection of unauthorized acquisition, use, or disposition of thecompany’s assets that could have a material effect on the financial statements.
Because of its inherent limitations, internal control over financial reporting may not prevent or detectmisstatements. Also, projections of any evaluation of effectiveness to future periods are subject to the risk thatcontrols may become inadequate because of changes in conditions, or that the degree of compliance with thepolicies or procedures may deteriorate.
/s/ Deloitte & Touche LLP
Detroit, MichiganMarch 15, 2018
56

SUPERIOR INDUSTRIES INTERNATIONAL, INC.CONSOLIDATED INCOME STATEMENTS(Dollars in thousands, except per share data)
Fiscal Year Ended December 31, 2017 2016 2015
NET SALES . . . . . . . . . . . . . . . . . . . . . . . . . . . . . . . . . . . . . . . . . . . . . . . . . . $1,108,055 $732,677 $727,946Cost of sales:
Cost of sales . . . . . . . . . . . . . . . . . . . . . . . . . . . . . . . . . . . . . . . . . . . . . . 1,005,020 645,015 650,717Restructuring costs (Note 3) . . . . . . . . . . . . . . . . . . . . . . . . . . . . . . . . . . 138 1,458 6,012
1,005,158 646,473 656,729
GROSS PROFIT . . . . . . . . . . . . . . . . . . . . . . . . . . . . . . . . . . . . . . . . . . . . . . 102,897 86,204 71,217Selling, general and administrative expenses . . . . . . . . . . . . . . . . . . . . . . . . . 81,379 31,602 34,923
INCOME FROM OPERATIONS . . . . . . . . . . . . . . . . . . . . . . . . . . . . . . . . 21,518 54,602 36,294Interest (expense) income, net . . . . . . . . . . . . . . . . . . . . . . . . . . . . . . . . . . . . . (40,004) 245 103Other income (expense), net . . . . . . . . . . . . . . . . . . . . . . . . . . . . . . . . . . . . . . 13,188 (126) (1,114)Change in fair value of redeemable preferred stock embedded derivative
liability . . . . . . . . . . . . . . . . . . . . . . . . . . . . . . . . . . . . . . . . . . . . . . . . . . . . 6,164 — —
CONSOLIDATED INCOME BEFORE INCOME TAXES . . . . . . . . . . . 866 54,721 35,283Income tax provision . . . . . . . . . . . . . . . . . . . . . . . . . . . . . . . . . . . . . . . . . . . . (6,875) (13,340) (11,339)
CONSOLIDATED NET INCOME (LOSS) . . . . . . . . . . . . . . . . . . . . . . . . . . (6,009) 41,381 23,944Less: Net income attributable to non-controlling interest . . . . . . . . . . . . . . . . (194) — —
NET INCOME (LOSS) ATTRIBUTABLE TO SUPERIOR . . . . . . . . . . $ (6,203) $ 41,381 $ 23,944
EARNINGS (LOSS) PER SHARE ATTRIBUTABLE TO SUPERIOR– BASIC . . . . . . . . . . . . . . . . . . . . . . . . . . . . . . . . . . . . . . . . . . . . . . . . . . . $ (1.01) $ 1.63 $ 0.90
EARNINGS (LOSS) PER SHARE ATTRIBUTABLE TO SUPERIOR– DILUTED . . . . . . . . . . . . . . . . . . . . . . . . . . . . . . . . . . . . . . . . . . . . . . . . $ (1.01) $ 1.62 $ 0.90
The accompanying notes are an integral part of these consolidated financial statements.
57

SUPERIOR INDUSTRIES INTERNATIONAL, INC.CONSOLIDATED STATEMENTS OF COMPREHENSIVE INCOME(Dollars in thousands)
Fiscal Year Ended December 31, . . . . . . . . . . . . . . . . . . . . . . . . . . . . . . . . . . . . 2017 2016 2015
Net income (loss) attributable to Superior . . . . . . . . . . . . . . . . . . . . . . . . . . . . . . . $ (6,203) $ 41,381 $ 23,944Other comprehensive (loss) income, net of tax:
Foreign currency translation gain (loss) . . . . . . . . . . . . . . . . . . . . . . . . . . . . 29,822 (16,904) (16,810)Change in unrecognized gains (losses) on derivative instruments:
Change in fair value of derivatives . . . . . . . . . . . . . . . . . . . . . . . . . . . . 14,067 (11,062) (7,189)Tax benefit (provision) . . . . . . . . . . . . . . . . . . . . . . . . . . . . . . . . . . . . . (6,464) 4,250 2,665
Change in unrecognized gains (losses) on derivative instruments,net of tax . . . . . . . . . . . . . . . . . . . . . . . . . . . . . . . . . . . . . . . . . . 7,603 (6,812) (4,524)
Defined benefit pension plan:Actuarial (losses) gains on pension obligation, net of curtailments and
amortization . . . . . . . . . . . . . . . . . . . . . . . . . . . . . . . . . . . . . . . . . . . . (1,931) 799 1,807Tax benefit (provision) . . . . . . . . . . . . . . . . . . . . . . . . . . . . . . . . . . . . . 310 (295) (761)
Pension changes, net of tax . . . . . . . . . . . . . . . . . . . . . . . . . . . . . . (1,621) 504 1,046
Other comprehensive income, net of tax . . . . . . . . . . . . . . . . . . . . . . . . . . . . 35,804 (23,212) (20,288)
Comprehensive income attributable to Superior . . . . . . . . . . . . . . . . . . . . . . . . . . $29,601 $ 18,169 $ 3,656
The accompanying notes are an integral part of these consolidated financial statements.
58

SUPERIOR INDUSTRIES INTERNATIONAL, INC.CONSOLIDATED BALANCE SHEETS(Dollars in thousands)
Fiscal Year Ended December 31, 2017 2016
ASSETSCurrent assets:
Cash and cash equivalents . . . . . . . . . . . . . . . . . . . . . . . . . . . . . . . . . . . . . . . . . . . . $ 46,360 $ 57,786Short-term investments . . . . . . . . . . . . . . . . . . . . . . . . . . . . . . . . . . . . . . . . . . . . . . . 750 750Accounts receivable, net . . . . . . . . . . . . . . . . . . . . . . . . . . . . . . . . . . . . . . . . . . . . . . 160,167 99,331Inventories . . . . . . . . . . . . . . . . . . . . . . . . . . . . . . . . . . . . . . . . . . . . . . . . . . . . . . . . . 173,999 82,837Income taxes receivable . . . . . . . . . . . . . . . . . . . . . . . . . . . . . . . . . . . . . . . . . . . . . . 6,929 3,682Other current assets . . . . . . . . . . . . . . . . . . . . . . . . . . . . . . . . . . . . . . . . . . . . . . . . . . 29,178 9,695
Total current assets . . . . . . . . . . . . . . . . . . . . . . . . . . . . . . . . . . . . . . . . . . . . . . 417,383 254,081Property, plant and equipment, net . . . . . . . . . . . . . . . . . . . . . . . . . . . . . . . . . . . . . . . . . . 536,686 227,403Investment in unconsolidated affiliate . . . . . . . . . . . . . . . . . . . . . . . . . . . . . . . . . . . . . . . — 2,000Non-current deferred income tax assets, net . . . . . . . . . . . . . . . . . . . . . . . . . . . . . . . . . . . 54,302 28,838Goodwill . . . . . . . . . . . . . . . . . . . . . . . . . . . . . . . . . . . . . . . . . . . . . . . . . . . . . . . . . . . . . . 304,805 —Intangibles . . . . . . . . . . . . . . . . . . . . . . . . . . . . . . . . . . . . . . . . . . . . . . . . . . . . . . . . . . . . . 203,473 —Other non-current assets . . . . . . . . . . . . . . . . . . . . . . . . . . . . . . . . . . . . . . . . . . . . . . . . . . 34,603 30,434
Total assets . . . . . . . . . . . . . . . . . . . . . . . . . . . . . . . . . . . . . . . . . . . . . . . . . . . . . . . . . . . . $1,551,252 $ 542,756
LIABILITIES, MEZZANINE EQUITY AND SHAREHOLDERS’ EQUITYCurrent liabilities:
Accounts payable . . . . . . . . . . . . . . . . . . . . . . . . . . . . . . . . . . . . . . . . . . . . . . . . . . . $ 118,424 $ 37,856Short-term debt . . . . . . . . . . . . . . . . . . . . . . . . . . . . . . . . . . . . . . . . . . . . . . . . . . . . . 4,000 —Accrued expenses . . . . . . . . . . . . . . . . . . . . . . . . . . . . . . . . . . . . . . . . . . . . . . . . . . . 68,786 46,315Income taxes payable . . . . . . . . . . . . . . . . . . . . . . . . . . . . . . . . . . . . . . . . . . . . . . . . 3,849 1,793
Total current liabilities . . . . . . . . . . . . . . . . . . . . . . . . . . . . . . . . . . . . . . . . . . . 195,059 85,964Long-term debt (less current portion) . . . . . . . . . . . . . . . . . . . . . . . . . . . . . . . . . . . . . . . . 679,552 —Embedded derivative liability . . . . . . . . . . . . . . . . . . . . . . . . . . . . . . . . . . . . . . . . . . . . . . 4,685 —Non-current income tax liabilities . . . . . . . . . . . . . . . . . . . . . . . . . . . . . . . . . . . . . . . . . . 5,731 5,301Non-current deferred income tax liabilities, net . . . . . . . . . . . . . . . . . . . . . . . . . . . . . . . . 28,539 3,628Other non-current liabilities . . . . . . . . . . . . . . . . . . . . . . . . . . . . . . . . . . . . . . . . . . . . . . . 47,269 49,637Commitments and contingent liabilities (Note 21) . . . . . . . . . . . . . . . . . . . . . . . . . . . . . . — —Mezzanine equity:
Preferred stock, $0.01 par valueAuthorized - 1,000,000 shares; issued and outstanding - 150,000 shares (no
shares at December 31, 2016) . . . . . . . . . . . . . . . . . . . . . . . . . . . . . . . . . . . . 144,694 —Shareholders’ equity:
Common stock, $0.01 par valueAuthorized - 100,000,000 sharesIssued and outstanding - 24,917,025 shares (25,143,950 shares at
December 31, 2016) . . . . . . . . . . . . . . . . . . . . . . . . . . . . . . . . . . . . . . . . . . . 89,755 89,916Accumulated other comprehensive loss . . . . . . . . . . . . . . . . . . . . . . . . . . . . . . . . . . . . . . (89,121) (124,925)Retained earnings . . . . . . . . . . . . . . . . . . . . . . . . . . . . . . . . . . . . . . . . . . . . . . . . . . . . . . . 393,146 433,235
Superior shareholders’ equity . . . . . . . . . . . . . . . . . . . . . . . . . . . . . . . . . . . . . . 393,780 398,226Noncontrolling interests . . . . . . . . . . . . . . . . . . . . . . . . . . . . . . . . . . . . . . . . . . 51,943 —
Total shareholders’ equity . . . . . . . . . . . . . . . . . . . . . . . . . . . . . . . . . . . . . . . . 445,723 398,226
Total liabilities, mezzanine equity and shareholders’ equity . . . . . . . . . . . . . . . . . . . . . . $1,551,252 $ 542,756
The accompanying notes are an integral part of these consolidated financial statements.
59

SUPERIOR INDUSTRIES INTERNATIONAL, INC.CONSOLIDATED STATEMENTS OF SHAREHOLDERS’ EQUITYFISCAL YEAR ENDED DECEMBER 31, 2015(Dollars in thousands, except per share data)
Accumulated Other ComprehensiveIncome (Loss)
RetainedEarnings Total
UnrecognizedGains/Losseson DerivativeInstruments
PensionObligations
CumulativeTranslationAdjustment
Common Stock
Number ofShares Amount
BALANCE AT FISCAL YEAREND 2014 . . . . . . . . . . . . . . . . . 26,730,247 $81,473 $(4,765) $(5,186) $(71,474) $438,958 $439,006
Net income . . . . . . . . . . . . . . . . . . . — — — — — 23,944 23,944Change in unrecognized gains/
losses on derivative instruments,net of tax . . . . . . . . . . . . . . . . . . — — (4,524) — — — (4,524)
Change in employee benefit plans,net of taxes . . . . . . . . . . . . . . . . . — — — 1,046 — — 1,046
Net foreign currency translationadjustment . . . . . . . . . . . . . . . . . — — — — (16,810) — (16,810)
Stock options exercised . . . . . . . . . 420,642 7,265 — — — — 7,265Restricted stock awards granted,
net of forfeitures . . . . . . . . . . . . 4,960 — — — — — —Stock-based compensation
expense . . . . . . . . . . . . . . . . . . . — 2,807 — — — — 2,807Tax impact of stock options . . . . . — — — — — — —Common stock repurchased . . . . . (1,056,954) (3,437) — — — (16,201) (19,638)Cash dividends declared ($0.72 per
share) . . . . . . . . . . . . . . . . . . . . . — — — — — (19,184) (19,184)
BALANCE AT FISCAL YEAREND 2015 . . . . . . . . . . . . . . . . . 26,098,895 $88,108 $(9,289) $(4,140) $(88,284) $427,517 $413,912
The accompanying notes are an integral part of these consolidated financial statements.
60

SUPERIOR INDUSTRIES INTERNATIONAL, INC.CONSOLIDATED STATEMENTS OF SHAREHOLDERS’ EQUITYFISCAL YEAR ENDED DECEMBER 31, 2016(Dollars in thousands, except per share data)
Accumulated Other ComprehensiveIncome (Loss)
RetainedEarnings Total
UnrecognizedGains/Losseson DerivativeInstruments
PensionObligations
CumulativeTranslationAdjustment
Common Stock
Number ofShares Amount
BALANCE AT FISCAL YEAREND 2015 . . . . . . . . . . . . . . . . . 26,098,895 $88,108 $ (9,289) $(4,140) $ (88,284) $427,517 $413,912
Net income . . . . . . . . . . . . . . . . . . — — — — — 41,381 41,381Change in unrecognized gains/
losses on derivative instruments,net of tax . . . . . . . . . . . . . . . . . . — — (6,812) — — — (6,812)
Change in employee benefit plans,net of taxes . . . . . . . . . . . . . . . . — — — 504 — — 504
Net foreign currency translationadjustment . . . . . . . . . . . . . . . . . — — — — (16,904) — (16,904)
Stock options exercised . . . . . . . . . 86,908 1,641 — — — — 1,641Restricted stock awards granted,
net of forfeitures . . . . . . . . . . . . (1,165) — — — — — —Stock-based compensation
expense . . . . . . . . . . . . . . . . . . . — 3,618 — — — — 3,618Tax impact of stock options . . . . . — 92 — — — — 92Common stock repurchased . . . . . (1,040,688) (3,543) — — — (17,176) (20,719)Cash dividends declared ($0.72
per share) . . . . . . . . . . . . . . . . . . — — — — — (18,487) (18,487)
BALANCE AT FISCAL YEAREND 2016 . . . . . . . . . . . . . . . . . 25,143,950 $89,916 $(16,101) $(3,636) $(105,188) $433,235 $398,226
The accompanying notes are an integral part of these consolidated financial statements.
61

SUPERIOR INDUSTRIES INTERNATIONAL, INC.CONSOLIDATED STATEMENTS OF SHAREHOLDERS’ EQUITYFISCAL YEAR ENDED DECEMBER 31, 2017(Dollars in thousands, except per share data)
Accumulated Other ComprehensiveIncome (Loss)
RetainedEarnings
Non-Controlling
Interest Total
UnrecognizedGains/Losseson DerivativeInstruments
PensionObligations
CumulativeTranslationAdjustment
Common Stock
Number ofShares Amount
BALANCE AT FISCALYEAR END 2016 . . . . . . . . 25,143,950 $89,916 $(16,101) $(3,636) $(105,188) $433,235 $ — $398,226
Consolidated net income(loss) . . . . . . . . . . . . . . . . . . — — — — — (6,203) 194 (6,009)
Change in unrecognized gains/losses on derivativeinstruments, net of tax . . . . . — — 7,603 — — — — 7,603
Change in employee benefitplans, net of taxes . . . . . . . . — — — (1,621) — — — (1,621)
Net foreign currencytranslation adjustment . . . . . — — — — 29,822 — 4,267 34,089
Stock options exercised . . . . . 2,000 41 — — — — — 41Restricted stock awards
granted, net of forfeitures . . (13,084) — — — — — — —Stock-based compensation
expense . . . . . . . . . . . . . . . . — 889 — — — — — 889Common stock repurchased . . (215,841) (777) — — — (4,237) — (5,014)Cash dividends declared . . . . . — — — — — (10,737) — (10,737)($0.45 per share)Redeemable preferred
dividend and accretion — — — — — (18,912) — (18,912)Non-controlling interest . . . . . — — — — — — 63,200 63,200Uniwheels additional
tenders . . . . . . . . . . . . . . . . . — (314) — — — — (15,718) (16,032)
BALANCE AT FISCALYEAR END 2017 . . . . . . . . 24,917,025 $89,755 $ (8,498) $(5,257) $ (75,366) $393,146 $ 51,943 $445,723
The accompanying notes are an integral part of these consolidated financial statements.
62

SUPERIOR INDUSTRIES INTERNATIONAL, INC.CONSOLIDATED STATEMENTS OF CASH FLOWS(Dollars in thousands)
Fiscal Year Ended December 31, 2017 2016 2015
CASH FLOWS FROM OPERATING ACTIVITIES:Net income . . . . . . . . . . . . . . . . . . . . . . . . . . . . . . . . . . . . . . . . . . . . . . . . . $ (6,009) $ 41,381 $ 23,944Adjustments to reconcile net income to net cash provided by operating
activities:Depreciation and amortization . . . . . . . . . . . . . . . . . . . . . . . . . . . . . . 69,335 34,261 34,530Income tax, non-cash changes . . . . . . . . . . . . . . . . . . . . . . . . . . . . . . (3,395) (4,669) (9,531)Impairments of long-lived assets and other charges . . . . . . . . . . . . . — — 2,688Stock-based compensation . . . . . . . . . . . . . . . . . . . . . . . . . . . . . . . . . 2,576 3,618 2,807Debt amortization . . . . . . . . . . . . . . . . . . . . . . . . . . . . . . . . . . . . . . . . 7,328 — —Other non-cash items . . . . . . . . . . . . . . . . . . . . . . . . . . . . . . . . . . . . . 1,133 812 1,400
Changes in operating assets and liabilities:Accounts receivable . . . . . . . . . . . . . . . . . . . . . . . . . . . . . . . . . . . . . . 4,599 8,043 (14,030)Inventories . . . . . . . . . . . . . . . . . . . . . . . . . . . . . . . . . . . . . . . . . . . . . (1,264) (22,339) 11,509Other assets and liabilities . . . . . . . . . . . . . . . . . . . . . . . . . . . . . . . . . (8,214) 6,244 2,469Accounts payable . . . . . . . . . . . . . . . . . . . . . . . . . . . . . . . . . . . . . . . . 1,411 15,880 (1,132)Income taxes . . . . . . . . . . . . . . . . . . . . . . . . . . . . . . . . . . . . . . . . . . . . (3,790) (4,740) 4,695
NET CASH PROVIDED BY OPERATING ACTIVITIES . . . . . . . . . . . . . . . 63,710 78,491 59,349
CASH FLOWS FROM INVESTING ACTIVITIES:Additions to property, plant and equipment . . . . . . . . . . . . . . . . . . . . . . . . (70,937) (39,575) (39,543)Acquisition of Uniwheels, net of cash acquired . . . . . . . . . . . . . . . . . . . . . (706,733) — —Proceeds from sales and maturities of investments . . . . . . . . . . . . . . . . . . — 200 3,750Purchase of investments . . . . . . . . . . . . . . . . . . . . . . . . . . . . . . . . . . . . . . . — — (950)Proceeds from sales of fixed assets . . . . . . . . . . . . . . . . . . . . . . . . . . . . . . 56 4,337 1,815Other . . . . . . . . . . . . . . . . . . . . . . . . . . . . . . . . . . . . . . . . . . . . . . . . . . . . . . — — (18)
NET CASH USED IN INVESTING ACTIVITIES . . . . . . . . . . . . . . . . . . . . . . (777,614) (35,038) (34,946)
CASH FLOWS FROM FINANCING ACTIVITIES:Proceeds from issuance of long-term debt . . . . . . . . . . . . . . . . . . . . . . . . . 975,571 — —Proceeds from issuance of redeemable preferred shares . . . . . . . . . . . . . . 150,000 — —Debt repayment . . . . . . . . . . . . . . . . . . . . . . . . . . . . . . . . . . . . . . . . . . . . . (323,177) — —Cash dividends paid . . . . . . . . . . . . . . . . . . . . . . . . . . . . . . . . . . . . . . . . . . (19,473) (18,340) (19,082)Cash paid for common stock repurchase . . . . . . . . . . . . . . . . . . . . . . . . . . (5,014) (20,719) (19,638)Payments related to tax withholdings for stock-based compensation . . . . (1,687) — —Net increase (decrease) in short term debt . . . . . . . . . . . . . . . . . . . . . . . . . (10,877) — —Proceeds from borrowings on revolving credit facility . . . . . . . . . . . . . . . 71,750 — —Repayments of borrowings on revolving credit facility . . . . . . . . . . . . . . . (100,650) — —Proceeds from exercise of stock options . . . . . . . . . . . . . . . . . . . . . . . . . . 41 1,641 7,265Redeemable preferred shares issuance costs . . . . . . . . . . . . . . . . . . . . . . . (3,737) — —Financing costs paid . . . . . . . . . . . . . . . . . . . . . . . . . . . . . . . . . . . . . . . . . . (31,640) — —Excess tax benefits from exercise of stock options . . . . . . . . . . . . . . . . . . — 91 107
NET CASH PROVIDED BY (USED IN) FINANCING ACTIVITIES . . . . . . 701,107 (37,327) (31,348)
Effect of exchange rate changes on cash . . . . . . . . . . . . . . . . . . . . . . . . . . . . . . 1,371 (376) (3,470)
Net increase (decrease) in cash and cash equivalents . . . . . . . . . . . . . . . . . . . . (11,426) 5,750 (10,415)Cash and cash equivalents at the beginning of the period . . . . . . . . . . . . . . . . . 57,786 52,036 62,451
Cash and cash equivalents at the end of the period . . . . . . . . . . . . . . . . . . . . . . $ 46,360 $ 57,786 $ 52,036
The accompanying notes are an integral part of these consolidated financial statements.
63

SUPERIOR INDUSTRIES INTERNATIONAL, INC.NOTES TO CONSOLIDATED FINANCIAL STATEMENTSDecember 31, 2017
NOTE 1 - SUMMARY OF SIGNIFICANT ACCOUNTING POLICIES
Nature of Operations
Headquartered in Southfield, Michigan, the principal business of Superior Industries International, Inc. (referredto herein as “Superior”, the “Company” or “we,” “us” and “our”) is the design and manufacture of aluminumwheels for sale to original equipment manufacturers (“OEMs”). We are one of the largest suppliers of castaluminum wheels to the world’s leading automobile and light truck manufacturers, with manufacturingoperations in the United States, Mexico, Germany and Poland. Customers in North America and Europerepresent the principal markets for our products. On May 30, 2017, we acquired Uniwheels, a large Europeansupplier of OEM aluminum wheels, as well as a supplier of European aftermarket wheels, which we believe isviewed as one of the technological leaders in the market for alloy wheels. As a result of the Uniwheelsacquisition, we have determined that our North American and European businesses should be treated as separatereportable segments in view of differences in economic circumstances, markets and customers as furtherdescribed in Note 6, “Business Segments”.
Presentation of Consolidated Financial Statements
The consolidated financial statements include the accounts of the company and its wholly owned subsidiaries.All intercompany transactions are eliminated in consolidation.
We have made a number of estimates and assumptions related to the reporting of assets, liabilities, revenues andexpenses to prepare these financial statements in conformity with U.S. GAAP as delineated by the FASB in itsASC. Generally, assets and liabilities that are subject to estimation and judgment include the allowance fordoubtful accounts, inventory valuation, amortization of preproduction costs, impairment of and the estimateduseful lives of our long-lived assets, intangible assets and goodwill, self-insurance portions of employee benefits,workers’ compensation and general liability programs, fair value of stock-based compensation, income taxliabilities and deferred income taxes. While actual results could differ, we believe such estimates to bereasonable.
The fiscal year for 2017 consisted of the 53-week period ended December 31, 2017 and the 2016 and 2015 fiscalyears consisted of the 52-week periods ended on December 25, 2016 and December 27, 2015, respectively.Historically our fiscal year ended on the last Sunday of the calendar year. Uniwheels, our European operationacquired on May 30, 2017, is reported on a calendar year end. These fiscal periods align as of December 31,2017. Beginning in 2018, both our North American and European operations will be on a calendar fiscal yearwith each month ending on the last day of the calendar month. For convenience of presentation, all fiscal yearsare referred to as beginning as of January 1, and ending as of December 31, but actually reflect our financialposition and results of operations for the periods described above.
Cash and Cash Equivalents
Cash and cash equivalents generally consist of cash, certificates of deposit and fixed deposits and money marketfunds with original maturities of three months or less. Our cash and cash equivalents are not subject to significantinterest rate risk due to the short maturities of these investments. Certificates of deposit and fixed deposits whoseoriginal maturity is greater than three months and is one year or less are classified as short-term investments andcertificates of deposit and fixed deposits whose maturity is greater than one year at the balance sheet date areclassified as non-current assets in our consolidated balance sheets. The purchase of any certificates of deposit orfixed deposits that are classified as short-term investments or non-current assets appear in the investing section ofour consolidated statements of cash flows. At times throughout the year and at year-end, cash balances held atfinancial institutions were in excess of federally insured limits.
64

Restricted Deposits
We purchase certificates of deposit that mature within twelve months and are used to secure or collateralizeletters of credit securing our workers’ compensation obligations. At December 31, 2017 and 2016, certificates ofdeposit totaling $0.8 million were restricted in use and were classified as short-term investments on ourconsolidated balance sheet.
Derivative Financial Instruments and Hedging Activities
In order to hedge exposure related to fluctuations in foreign currency rates and the cost of certain commoditiesused in the manufacture of our products, we periodically may purchase derivative financial instruments such asforward contracts, options or collars to offset or mitigate the impact of such fluctuations. Programs to hedgecurrency rate exposure may address ongoing transactions including, foreign-currency-denominated receivablesand payables, as well as specific transactions related to purchase obligations. Programs to hedge exposure tocommodity cost fluctuations would be based on underlying physical consumption of such commodity.
We account for our derivative instruments as either assets or liabilities and carry them at fair value. Forderivative instruments that hedge the exposure to variability in expected future cash flows that are designated ascash flow hedges, the effective portion of the gain or loss on the derivative instrument is reported as a componentof accumulated other comprehensive income or loss in shareholders’ equity and reclassified into income in thesame period or periods during which the hedged transaction affects earnings. The ineffective portion of the gainor loss on the derivative instrument, if any, is recognized in current income. To receive hedge accountingtreatment, cash flow hedges must be highly effective in offsetting changes to expected future cash flows onhedged transactions. For forward exchange contracts designated as cash flow hedges, changes in the time valueare included in the definition of hedge effectiveness. Accordingly, any gains or losses related to this componentare reported as a component of accumulated other comprehensive income or loss in shareholders’ equity andreclassified into income in the same period or periods during which the hedged transaction affects earnings.Derivatives that do not qualify as hedges are adjusted to fair value through current income. See Note 5,“Derivative Financial Instruments” for additional information pertaining to our derivative instruments.
We enter into contracts to purchase certain commodities used in the manufacture of our products, such asaluminum, natural gas and other raw materials. These contracts are considered to be derivative instruments underU.S. GAAP. However, upon entering into these contracts, we expect to fulfill our purchase commitments andtake full delivery of the contracted quantities of these commodities during the normal course of business.Accordingly, under U.S. GAAP, these purchase contracts are not accounted for as derivatives because theyqualify for the normal purchase normal sale exception under U.S. GAAP, unless there is a change in the facts orcircumstances that causes management to believe that these commitments would not be used in the normalcourse of business. See Note 20, “Risk Management” for additional information pertaining to these purchasecommitments.
Cash Paid for Interest and Taxes and Non-Cash Investing Activities
Cash paid for interest was $24.3 million, $0.3 million and $0.3 million for the years ended December 31, 2017,2016 and 2015. Cash paid for income taxes was $11.1 million, $21.9 million and $12.6 million for the yearsended December 31, 2017, 2016 and 2015.
As of December 31, 2017, 2016 and 2015, $15.1 million, $4.0 million and $1.1 million, respectively, ofequipment had been purchased but not yet paid for and are included in accounts payable and accrued expenses inour consolidated balance sheets.
65

Accounts Receivable
We maintain an allowance for doubtful accounts receivable based upon the expected collectability of all tradereceivables. The allowance is reviewed continually and adjusted for amounts deemed uncollectible bymanagement.
Inventories
Inventories, which are categorized as raw materials, work-in-process or finished goods, are stated at the lower ofcost or market using the first-in, first-out method. When necessary, management uses estimates of net realizablevalue to record inventory reserves for obsolete and/or slow-moving inventory. Aluminum is the primary materialcomponent in our inventories. Our aluminum requirements have historically been supplied from two primaryvendors, each accounting for more than 10 percent of our aluminum purchases during 2016 and 2015. During2017, we added an additional vendor and we added the suppliers from our European operations. Despite thediversification of aluminum vendors, the two primary vendors still made up more than 10 percent of ouraluminum purchases in 2017.
Property, Plant and Equipment
Property, plant and equipment are carried at cost, less accumulated depreciation. The cost of additions,improvements and interest during construction, if any, are capitalized. Our maintenance and repair costs arecharged to expense when incurred. Depreciation is calculated generally on the straight-line method based on theestimated useful lives of the assets.
Classification Expected Useful Life
Computer equipment . . . . . . . . . . . . . . . . . . . . . . . . . 3 to 5 yearsProduction machinery and technical equipment . . . . 3 to 20 yearsBuildings . . . . . . . . . . . . . . . . . . . . . . . . . . . . . . . . . . 15 to 50 yearsOther equipment, operating and office equipment . . 3 to 20 years
When property, plant and equipment is replaced, retired or disposed of, the cost and related accumulateddepreciation are removed from the accounts. Property, plant and equipment no longer used in operations, whichare generally insignificant in amount, are stated at the lower of cost or estimated net realizable value. Gains andlosses, if any, are recorded as a component of operating income if the disposition relates to an operating asset. Ifa non-operating asset is disposed of, any gains and losses are recorded in other income or expense in the periodof disposition or write down.
Preproduction Costs and Revenue Recognition Related to Long-Term Supply Arrangements
We incur preproduction engineering and tooling costs related to the products produced for our customers underlong-term supply agreements. We expense all preproduction engineering costs for which reimbursement is notcontractually guaranteed by the customer or which are in excess of the contractually guaranteed reimbursementamount. We amortize the cost of the customer-owned tooling over the expected life of the wheel program on astraight-line basis. Also, we defer any reimbursements made to us by our customer and recognize the toolingreimbursement revenue over the same period in which the tooling is in use. Changes in the facts andcircumstances of individual wheel programs may accelerate the amortization of both the cost of customer-ownedtooling and the deferred tooling reimbursement revenues. Recognized tooling reimbursement revenues, whichtotaled $11.9 million, $8.0 million and $5.8 million in 2017, 2016 and 2015, respectively, are included in netsales in the consolidated income statements. The following tables summarize the unamortized customer-owned
66

tooling costs included in our other non-current assets, and the deferred tooling revenues included in accruedexpenses and other non-current liabilities:
December 31, 2017 2016
(Dollars in Thousands)
Customer-Owned Tooling CostsPreproduction costs . . . . . . . . . . . . . . . . . . . . . . . . . . . . . . . $ 84,198 $ 78,299Accumulated amortization . . . . . . . . . . . . . . . . . . . . . . . . . (71,409) (65,100)
Net preproduction costs . . . . . . . . . . . . . . . . . . . . . . . . . . . $ 12,789 $ 13,199
Deferred Tooling RevenueAccrued expenses . . . . . . . . . . . . . . . . . . . . . . . . . . . . . . . . $ 4,654 $ 5,419Other non-current liabilities . . . . . . . . . . . . . . . . . . . . . . . . 1,974 2,593
Total deferred tooling revenue . . . . . . . . . . . . . . . . . . . . . . $ 6,628 $ 8,012
Impairment of Goodwill
Goodwill must be tested on at least an annual basis, and as of an interim period if an event or circumstanceindicates that an impairment is more likely than not to have occurred. In conducting our annual impairmenttesting, we may first perform a qualitative assessment of whether it is more likely than not that a reporting unit’sfair value is less than its carrying amount. If not, no further goodwill impairment testing is performed. If it ismore likely than not that a reporting unit’s fair value is less than its carrying amount, or if we elect not to performa qualitative assessment of a reporting unit, we compare the fair value of the reporting unit to the related net bookvalue. If the net book value of a reporting unit exceeds its fair value, an impairment loss is measured andrecognized. We conduct our annual impairment testing as of December 31 of each year.
Impairment of Long-Lived Assets and Investments
In accordance with ASC 360 entitled “Property, Plant and Equipment”, management evaluates the recoverabilityand estimated remaining lives of long-lived assets. The company reviews long-lived assets for impairmentwhenever facts and circumstances suggest that the carrying value of the assets may not be recoverable or theuseful life has changed.
When facts and circumstances indicate that there may have been a loss in value, management will also evaluateits cost method investments to determine whether there was an other-than-temporary impairment. If a loss in thevalue of the investment is determined to be other than temporary, then the decline in value is recognized as aloss.
Foreign Currency Transactions and Translation
We have wholly-owned foreign subsidiaries with operations in Mexico and Europe whose functional currency isthe peso and Euro, respectively. In addition, we have operations with U.S. dollar functional currency withtransactions denominated in pesos and other currencies and operations in Europe with Euro functional currencywith transactions denominated in Polish Zlotys and other currencies. These operations had monetary assets andliabilities that were denominated in currencies that were different than their functional currency and weretranslated into the functional currency of the entity using the exchange rate in effect at the end of each accountingperiod. Any gains and losses recorded as a result of the remeasurement of monetary assets and liabilities into thefunctional currency are reflected as transaction gains and losses and included in other expense, net in theconsolidated income statements. We had foreign currency transaction gains of $12.9 million in 2017 and lossesof $0.4 million and $1.2 million in 2016 and 2015, respectively, which are included in other income (expense),net in the consolidated income statements. In addition, we had a minority investment in India that had afunctional currency of the Indian rupee which was divested in September 2017.
67

When our foreign subsidiaries translate their financial statements from the functional currency to the reportingcurrency, the balance sheet accounts are translated using the exchange rates in effect at the end of the accountingperiod and retained earnings is translated using historical rates. The income statement accounts are generallytranslated at the weighted average of exchange rates during the period and the cumulative effect of translation isrecorded as a separate component of accumulated other comprehensive income or loss in shareholders’ equity, asreflected in the consolidated statements of shareholders’ equity. The value of the Mexican peso and Euroincreased 5.1 percent and 7.2 percent, respectively, in relation to the U.S. dollar, while the Zloty remainedessentially flat in relation to the Euro in 2017.
Revenue Recognition
Sales of products and any related costs are recognized when title and risk of loss transfers to the purchaser,generally upon shipment. Tooling reimbursement revenues related to initial tooling reimbursed by our customersare deferred and recognized over the expected life of the wheel program on a straight-line basis, as discussedabove.
Research and Development
Research and development costs (primarily engineering and related costs) are expensed as incurred and areincluded in cost of sales in the consolidated income statements. Amounts expensed during 2017, 2016 and 2015were $7.7 million, $3.8 million and $2.6 million, respectively.
Value-Added Taxes
Value-added taxes that are collected from customers and remitted to taxing authorities are excluded from salesand cost of sales.
Stock-Based Compensation
We account for stock-based compensation using the estimated fair value recognition method in accordance withU.S. GAAP. We recognize these compensation costs net of the applicable forfeiture rate and recognize thecompensation costs for only those shares expected to vest on a straight-line basis over the requisite service periodof the award, which is generally the vesting term of three to four years. We estimate the forfeiture rate based onour historical experience. See Note 18, “Stock-Based Compensation” for additional information concerning ourshare-based compensation awards.
Income Taxes
We account for income taxes using the asset and liability method. The asset and liability method requires therecognition of deferred tax assets and liabilities for expected future tax consequences of temporary differencesthat currently exist between the tax basis and financial reporting basis of our assets and liabilities. We calculatecurrent and deferred tax provisions based on estimates and assumptions that could differ from actual resultsreflected on the income tax returns filed during the following years. Adjustments based on filed returns arerecorded when identified in the subsequent years.
The effect on deferred taxes for a change in tax rates is recognized in income in the period that the tax ratechange is enacted. In assessing the realizability of deferred tax assets, we consider whether it is more likely thannot that some portion of the deferred tax assets will not be realized. A valuation allowance is provided fordeferred income tax assets when, in our judgment, based upon currently available information and other factors,it is more likely than not that all or a portion of such deferred income tax assets will not be realized. Thedetermination of the need for a valuation allowance is based on an on-going evaluation of current informationincluding, among other things, historical operating results, estimates of future earnings in different taxing
68

jurisdictions and the expected timing of the reversals of temporary differences. We believe that the determinationto record a valuation allowance to reduce a deferred income tax asset is a significant accounting estimate becauseit is based, among other things, on an estimate of future taxable income in the U.S. and certain other jurisdictions,which is susceptible to change and may or may not occur, and because the impact of adjusting a valuationallowance may be material.
In determining when to release the valuation allowance established against our net deferred income tax assets, weconsider all available evidence, both positive and negative. Consistent with our policy, the valuation allowanceagainst our net deferred income tax assets will not be reversed until such time as we have generated three yearsof cumulative pre-tax income and have reached sustained profitability, which we define as two consecutive oneyear periods of pre-tax income.
We account for uncertain tax positions utilizing a two-step approach to evaluate tax positions. Step one,recognition, requires evaluation of the tax position to determine if based solely on technical merits it is morelikely than not to be sustained upon examination. Step two, measurement, is addressed only if a position is morelikely than not to be sustained. In step two, the tax benefit is measured as the largest amount of benefit,determined on a cumulative probability basis, which is more-likely-than-not to be realized upon ultimatesettlement with tax authorities. If a position does not meet the more-likely-than-not threshold for recognition instep one, no benefit is recorded until the first subsequent period in which the more likely than not standard is met,the issue is resolved with the taxing authority, or the statute of limitations expires. Positions previouslyrecognized are derecognized when we subsequently determine the position no longer is more likely than not to besustained. Evaluation of tax positions, their technical merits, and measurements using cumulative probability arehighly subjective management estimates. Actual results could differ materially from these estimates.
Presently, we have not recorded a deferred tax liability for temporary differences related to investments inforeign subsidiaries that are essentially permanent in duration. These temporary differences may become taxableupon a repatriation of earnings from the subsidiaries or a sale or liquidation of the subsidiaries. At this time thecompany does not have any plans to repatriate income from its foreign subsidiaries.
Earnings (Loss) Per Share
As summarized below, basic earnings (loss) per share is computed by dividing net income (loss) attributable toSuperior, less preferred dividends, by the weighted average number of common shares outstanding for the period.For purposes of calculating diluted earnings per share, net income is divided by the total of the weighted averageshares outstanding plus the dilutive effect outstanding stock options and restricted stock under the treasury stockmethod, which includes consideration of stock-based compensation required by U.S. GAAP. The redeemableconvertible preferred stock has been excluded from the weighted average shares since inclusion would be
69

antidilutive. Accordingly, preferred stock dividends (including accretion of the preferred stock redemptionpremium which has been treated as deemed dividends) have been deducted from net income.
Year Ended December 31, 2017 2016 2015
(Dollars in thousands, except per share amounts)
Basic Earnings (Loss) Per ShareNet income (loss) attributable to Superior . . . . . . . . . . . . $ (6,203) $41,381 $23,944Less: Redeemable preferred stock dividends and
accretion . . . . . . . . . . . . . . . . . . . . . . . . . . . . . . . . . . . . (18,912) — —
Basic Numerator . . . . . . . . . . . . . . . . . . . . . . . . . . . . . . . . (25,115) 41,381 23,944
Weighted average shares outstanding - basic . . . . . . . . . . 24,929 25,439 26,599
Basic (loss) earnings per share . . . . . . . . . . . . . . . . . . . . . $ (1.01) $ 1.63 $ 0.90
Diluted Earnings Per ShareNet income (loss) attribute to Superior . . . . . . . . . . . . . . . $ (6,203) $41,381 $23,944Less: Redeemable preferred stock dividends and
accretion . . . . . . . . . . . . . . . . . . . . . . . . . . . . . . . . . . . . (18,912) — —
Diluted Numerator . . . . . . . . . . . . . . . . . . . . . . . . . . . . . . (25,115) 41,381 23,944
Weighted average shares outstanding - basic . . . . . . . . . . 24,929 25,439 26,599Weighted average dilutive stock options and restricted
stock . . . . . . . . . . . . . . . . . . . . . . . . . . . . . . . . . . . . . . . — 100 34
Weighted average shares outstanding - diluted . . . . . . . . 24,929 25,539 26,633
Diluted (loss) earnings per share . . . . . . . . . . . . . . . . . . . $ (1.01) $ 1.62 $ 0.90
For the year ended December 31, 2017, no options or restricted stock were included in the diluted earnings pershare calculation because to do so would have been anti-dilutive. All stock options and restricted stock have beenincluded in the diluted earnings per share calculations for the year ended December 31, 2016, but for the yearended December 31, 2015, we have excluded options to purchase 147,150 shares at prices ranging from $21.84to $22.57 because exercise prices exceeded average market price and as a consequence they were antidilutive. Inaddition, the performance shares discussed in Note 18, “Stock-Based Compensation” are not included in thediluted income per share because the performance metrics had not been met as of December 31, 2017.
New Accounting Pronouncements
In May 2014, the FASB issued ASU 2014-09, Revenue from Contracts with Customers. This update outlines asingle, comprehensive model for accounting for revenue from contracts with customers. We plan to adopt thisupdate on January 1, 2018. The guidance permits two methods of adoption: retrospectively to each priorreporting period presented (full retrospective method), or retrospectively with the cumulative effect of initiallyapplying the guidance recognized at the date of initial application (modified retrospective method). We willadopt the standard using the modified retrospective method. We have completed our assessment and do notexpect that implementation will have a material effect on our financial position or results of operations.
In February of 2016, the FASB issued ASU 2016-02, Leases (Topic 842) (“ASU 2016-02”). ASU 2016-02requires an entity to recognize right-of-use assets and lease liabilities on its balance sheet and disclose keyinformation about leasing arrangements. ASU 2016-02 offers specific accounting guidance for a lessee, a lessorand sale and leaseback transactions. Lessees and lessors are required to disclose qualitative and quantitativeinformation about leasing arrangements to enable a user of the financial statements to assess the amount, timingand uncertainty of cash flows arising from leases. For public companies, ASU 2016-02 is effective for annualreporting periods beginning after December 15, 2018, including interim periods within that reporting period, and
70

requires a modified retrospective adoption, with early adoption permitted. We are evaluating the impact thisguidance will have on our financial position and results of operations.
In August 2016, the FASB issued an ASU entitled “Statement of Cash Flows (Topic 740): Classification ofCertain Cash Receipts and Cash Payments.” The objective of the ASU is to address the diversity in practice inthe presentation of certain cash receipts and cash payments in the statement of cash flows. This ASU is effectivefor fiscal years beginning after December 15, 2017, including interim periods within those fiscal years. We areevaluating the impact this guidance will have on our statement of cash flows.
In January 2017, the FASB issued an ASU entitled “Intangibles - Goodwill and Other (Topic 350): Simplifyingthe Test for Goodwill Impairment.” The objective of the ASU is to simplify how an entity is required to testgoodwill for impairment by eliminating Step 2 from the goodwill impairment test. Step 2 measures a goodwillimpairment loss by comparing the implied fair value of a reporting unit’s goodwill with the carrying amount ofthat goodwill. This ASU is effective for fiscal years beginning after December 15, 2019, including interimperiods within those fiscal years. Early adoption is permitted. We are evaluating the impact this guidance willhave on our financial position and results of operations.
In January 2017, the FASB issued an ASU entitled “Business Combinations (Topic 805): Clarifying theDefinition of a Business.” The objective of the ASU is to add guidance to assist entities with evaluating whethertransactions should be accounted for as acquisitions (or disposals) of assets or businesses. This ASU is effectivefor fiscal years beginning after December 15, 2017, including interim periods within those fiscal years. We willapply this guidance in the future as applicable.
In March 2017, the FASB issued an ASU entitled “Compensation-Retirement Benefits (Topic 715): Improvingthe Presentation of Net Periodic Pension Cost and Net Periodic Postretirement Benefit Cost.” The objective ofthe ASU is to improve the reporting of net benefit cost in the financial statements. This ASU is effective forfiscal years beginning after December 15, 2017, including interim periods within those fiscal years. We areevaluating the impact this guidance will have on our financial position and results of operations.
In July 2017, the FASB issued an ASU entitled “(Part I) Accounting for Certain Financial Instruments withDown Round Features, (Part II) Replacement of the Indefinite Deferral for Mandatorily Redeemable Financialinstruments of Certain Nonpublic Entities and Certain Mandatorily Redeemable Noncontrolling Interests with aScope Exception”. The objective of this ASU is to reduce the complexity in accounting for certain financialinstruments with down round features. When determining whether certain financial instruments should beclassified as debt or equity instruments, a down round feature would no longer preclude equity classificationwhen assessing whether the instrument is indexed to an entity’s own stock. As a result, a freestanding equity-linked financial instrument (or embedded conversion option) no longer would be accounted for as a derivativeliability at fair value as a result of the existence of a down round feature. We are evaluating the impact thisguidance will have on our financial position and results of operations.
In August 2017, the FASB issued an ASU entitled “Derivatives and Hedging (Topic 815).” The objective of thisstandard is to better align financial reporting with risk management activities, provide a more faithfulrepresentation of hedging activities and reduce complexity and costs associated with hedging. This ASU removesthe requirement to recognize hedge ineffectiveness in income prior to settlement, allows documentation of hedgeeffectiveness at inception to be completed by quarter-end, allows qualitative rather than quantitative assessmentof effectiveness (subsequent to initial quantitative assessment), allows critical terms match for cash flow hedgesof a group of forecasted transactions if derivatives mature within the same month as transactions, permits use ofthe “back up” long haul method for hedges initially designated using the short cut method and permits cash flowhedging of a component of purchases and sales of non-financial assets (i.e., commodity price excludingtransportation) resulting in higher hedge effectiveness. The ASU also permits fair value hedging of thebenchmark interest rate component of interest rate risk as well as partial term hedging, allows partial term fairvalue hedges of interest rate risk, permits cash flow hedging of interest rate risk for a contractually specified rate
71

rather than a benchmark rate and permits exclusion of cross currency basis spread in determining effectiveness.This ASU is effective for fiscal years beginning after December 15, 2018 and early adoption is permitted. We areevaluating the impact this guidance will have on our financial position and statement of operations.
On December 22, 2017, The Securities and Exchange Commission issued Staff Accounting Bulletin No. 118(SAB 118) to provide guidance regarding accounting and disclosure for tax effects arising from changes in taxregulations under the Tax Cuts and Jobs Act (the “Act”) enacted December 22, 2017. The Act containssignificant changes to corporate taxation, including reduction in the corporate tax rate from 35 percent to21 percent, a one-time transition tax on offshore earnings at reduced tax rates, elimination of U.S. tax on foreigndividends, new taxes on certain foreign earnings, a new minimum tax related to payments to foreign subsidiariesand affiliates, immediate deductions for certain new investments and the modification or repeal of many businessdeductions and credits. The Act will also have tax consequences for many companies that operate internationally.Generally, the SEC guidance directs companies to recognize income tax effects where requisite analysis can becompleted prior to issuance of financial statements; estimate income tax effects where analysis is not yetcomplete but a reasonable estimate can be determined; and disclose effects where no reasonable estimate can bedetermined. The reasonable estimate would be reported as a provisional amount during a “measurement period.”In circumstances in which provisional amounts cannot be prepared, tax provisions should be determined based ontax laws in effect immediately prior to enactment of the Act. Disclosures should include tax effects for whichaccounting is incomplete; items reported as provisional amounts; current or deferred tax amounts for which theincome tax effects of the Act have not been completed; the reason the initial accounting is incomplete; additionalinformation needed to complete the accounting requirements under ASC Topic 740; nature and amount of anymeasurement period adjustments recognized during the reporting period; effect of measurement periodadjustments on the effective tax rate; and the point at which accounting for the all tax effects of the Act has beencompleted. Refer to Note 14, “Income Taxes” in the Notes to the Consolidated Financial Statements in Item 8 foradditional information including the impact of the Act on our financial position and results of operations.
NOTE 2 - ACQUISITION
On March 23, 2017, Superior announced that it had entered into various agreements to commence a tender offerto acquire 100 percent of the outstanding equity interests of Uniwheels (the “Acquisition”) through a newly-formed, wholly-owned subsidiary (the “Acquisition Sub”). The Acquisition will be effected through a multi-stepprocess as more fully described below.
In the first step of the Acquisition, on March 23, 2017, Superior obtained a commitment from the owner ofapproximately 61 percent of the outstanding stock of Uniwheels, Uniwheels Holding (Malta) Ltd. (the“Significant Holder”), evidenced by an irrevocable undertaking agreement (the “Undertaking Agreement”) totender such stock in the second step of the Acquisition. In connection with the Undertaking Agreement, onMarch 23, 2017: (i) Superior entered into a business combination agreement with Uniwheels pursuant to which,subject to the provisions of the German Stock Corporation Act, Uniwheels and its subsidiaries undertook to,among other things, cooperate with the financing of the Acquisition; and (ii) Superior and the Significant Holderentered into a guarantee and indemnification agreement pursuant to which Superior will hold the SignificantHolder harmless for claims that may arise relating to its involvement with Uniwheels. As Uniwheels was acompany listed on the Warsaw Stock Exchange, the Acquisition was required to be carried out in accordancewith the Polish Act of 29 July 2005 on Public Offerings and the Conditions for Introducing Financial Instrumentsto Organized Trading and Public Companies (the “Public Offering Act”).
Following the publication of a formal tender offer document by Superior, as required by the Public Offering Act,Superior commenced the acceptance period for the tender offer (the “Tender Offer”) on April 12, 2017, pursuantto which Superior offered to purchase all (but not less than 75 percent) of the outstanding stock of Uniwheelsand, upon the consummation of the Tender Offer, agreed to purchase the stock of the Significant Holder alongwith all other stock of Uniwheels tendered pursuant to the Tender Offer. On May 30, 2017, Superior acquired92.3 percent of the outstanding stock of Uniwheels for approximately $703.0 million (based on an exchange rateof 1.00 Dollar = 3.74193 Polish Zloty). We refer to this acquisition as the “First Step Acquisition.”
72

Under the terms of the Tender Offer:
• the Significant Holder received cash consideration of Polish Zloty 226.5 per share; and
• Uniwheels’ other shareholders received cash consideration of Polish Zloty 247.87 per share, equivalent tothe volume weighted-average-price of Uniwheels’ shares for the three months prior to commencement ofthe Tender Offer, plus 5.0 percent.
On June 30, 2017, the company announced that it had commenced the delisting and associated tender process forthe remaining outstanding shares of Uniwheels. As of July 31, 2017, 153,251 additional shares (representing1.2 percent of Uniwheels shares) were tendered at Polish Zloty 247.87 per share. On December 15, 2017, anadditional 75,000 shares (representing 0.6 percent of Uniwheels shares) were tendered at Polish Zloty 262.50 pershare.
Superior decided to pursue a DPLTA, without concurrently pursuing a merger/squeeze-out. This was executedand became effective in January 2018. This approach enables Superior to realize substantial synergies of aconsolidated entity without the distraction or expense associated with simultaneously pursuing the purchase ofthe remaining shares. According to the terms of the DPLTA, Superior AG offered to purchase any furthertendered shares for cash consideration of Euro 62.18, or approximately Polish Zloty 264 per share. This cashconsideration may be subject to change based on appraisal proceedings that the minority shareholders ofUniwheels have initiated. Because the aggregate equity purchase price of the Acquisition (assuming an exchangerate of 1.00 Dollar = 3.74193 Polish Zloty) was determined at the time of the initial acquisition, any increase inthe resulting price must be reflected as a reduction to common stock. For each share that is not tendered, Superiorwill be obligated to pay a guaranteed annual dividend of Euro 3.23 as long as the DPLTA is in effect beginningin 2019.
The aggregate equity purchase price of the Acquisition (assuming the remaining shares of Uniwheels’ stock areacquired for cash consideration of Polish Zloty 247.87 per share, the price paid to Uniwheels’ shareholders in theTender Offer, and an exchange rate of 1.00 Dollar = 3.74193 Polish Zloty) will be approximately $778.0 million,including the cost of shares which have not yet been tendered. We entered into foreign currency hedges prior tothe closing of the First Step Acquisition intended to reduce currency risk associated with the settlement of theTender Offer (the “Hedging Transactions”). The net benefit of such Hedging Transactions to Superior reducedthe total anticipated purchase price of the Acquisition to $766.2 million.
The company’s consolidated financial statements for the year ended December 31, 2017 include Uniwheelsresults of operations subsequent to May 30, 2017 (please see Note 6, “Business Segments” for the segmentresults in 2017). The company’s consolidated financial statements reflect the purchase accounting adjustments inaccordance with ASC 805 “Business Combinations”, whereby the purchase price was allocated to the assetsacquired and liabilities assumed based upon their estimated fair values on the acquisition date.
73

During the fourth quarter of 2017, the company obtained an updated valuation of the identifiable assets acquiredand the liabilities assumed. The following is the preliminary allocation of the purchase price:
(Dollars in thousands)
Estimated purchase priceCash consideration . . . . . . . . . . . . . . . . . . . . . . . . . . . . . $703,000
Non-controlling interest . . . . . . . . . . . . . . . . . . . . . . . . . . . . 63,200
Preliminary purchase price allocationCash and cash equivalents . . . . . . . . . . . . . . . . . . . . . . . 12,296Accounts receivable . . . . . . . . . . . . . . . . . . . . . . . . . . . . 60,580Inventories . . . . . . . . . . . . . . . . . . . . . . . . . . . . . . . . . . . 83,901Prepaid expenses and other current assets . . . . . . . . . . . 11,859
Total current assets . . . . . . . . . . . . . . . . . . . . . . . . . 168,636Property and equipment . . . . . . . . . . . . . . . . . . . . . . . . . 259,784Intangible assets (1) . . . . . . . . . . . . . . . . . . . . . . . . . . . . . 205,000Goodwill . . . . . . . . . . . . . . . . . . . . . . . . . . . . . . . . . . . . . 286,249Other assets . . . . . . . . . . . . . . . . . . . . . . . . . . . . . . . . . . 32,987
Total assets acquired . . . . . . . . . . . . . . . . . . . . . . . 952,656
Accounts payable . . . . . . . . . . . . . . . . . . . . . . . . . . . . . . 61,883Other current liabilities . . . . . . . . . . . . . . . . . . . . . . . . . 40,903
Total current liabilities . . . . . . . . . . . . . . . . . . . . . . 102,786Other long-term liabilities . . . . . . . . . . . . . . . . . . . . . . . 83,670
Total liabilities assumed . . . . . . . . . . . . . . . . . . . . . 186,456
Net assets acquired . . . . . . . . . . . . . . . . . . . . . . . . . . . . . . . . $766,200
(1) Intangible assets are recorded at estimated fair value, as determined by management based on availableinformation which includes a preliminary valuation prepared by an independent third party. The fair valuesassigned to identifiable intangible assets were determined through the use of the income approach,specifically the relief from royalty and multi-period excess earnings methods. The major assumptions usedin arriving at the estimated identifiable intangible asset values included management’s estimates of futurecash flows, discounted at an appropriate rate of return which are based on the weighted average cost ofcapital for both the company and other market participants. The useful lives for intangible assets weredetermined based upon the remaining useful economic lives of the intangible assets that are expected tocontribute directly or indirectly to future cash flows. The estimated fair value of intangible assets and relateduseful lives as included in the preliminary purchase price allocation include:
EstimatedFair Value
EstimatedUseful Life(in Years)
(Dollars in thousands)
Brand name . . . . . . . . . . . . . . . . . . . . . . . . . . . . . . . . . . . . $ 9,000 4-6Technology . . . . . . . . . . . . . . . . . . . . . . . . . . . . . . . . . . . . 15,000 4-6Customer relationships . . . . . . . . . . . . . . . . . . . . . . . . . . . 167,000 7-11Trade names . . . . . . . . . . . . . . . . . . . . . . . . . . . . . . . . . . . 14,000 Indefinite
$205,000
The above goodwill represents future economic benefits expected to be recognized from the company’sexpansion into the European wheel market, as well as expected future synergies and operating efficiencies fromcombining operations with Uniwheels. Acquisition goodwill of $304.8 million (initial balance of $286.2 million,increased for post-acquisition translation adjustments) has been allocated to the European segment.
74

The following unaudited combined pro forma information is for informational purposes only. The pro formainformation is not necessarily indicative of what the combined company’s results actually would have been hadthe Acquisition been completed as of the beginning of the periods as indicated. In addition, the unaudited proforma information does not purport to project the future results of the combined company.
Twelve Months EndedDecember 31,
2017December 31,
2016
Proforma Proforma(Dollars in thousands)
Net sales as reported . . . . . . . . . . . . . . . . . . . . . . . . . $1,108,055 $ 732,677Uniwheels sales, prior to the Acquisition . . . . . 243,744 513,571
Proforma combined sales . . . . . . . . . . . . . . . . . . . . . . $1,351,799 $1,246,248
Net (loss) income as reported . . . . . . . . . . . . . . . . . . $ (6,009) $ 41,381Uniwheels net income before income taxes,
prior to the Acquisition . . . . . . . . . . . . . . . . . 25,394 55,883Incremental interest expense on the debt . . . . . . (17,716) (42,518)Incremental amortization on the identifiable
intangible assets . . . . . . . . . . . . . . . . . . . . . . . (9,769) (23,446)Transaction expenses incurred by both the
company and Uniwheels . . . . . . . . . . . . . . . . 35,906 —Income tax expense related to the proforma
adjustments . . . . . . . . . . . . . . . . . . . . . . . . . . (10,114) 7,509
Proforma net income . . . . . . . . . . . . . . . . . . . . . . . . . $ 17,692 $ 38,809
Proforma basic and diluted (loss) earnings pershare (1) . . . . . . . . . . . . . . . . . . . . . . . . . . . . . . . . . $ (0.55) $ 0.28
(1) Earnings attributable to Superior common stockholders used in computing basic and diluted earnings pershare has been reduced by estimated annual preferred stock dividends (including accretion of the preferredstock redemption premium which has been treated as a deemed dividend). Refer to Note 1 “Summary ofSignificant Accounting Policies - Earnings per Share” for further information.
NOTE 3 - RESTRUCTURING
During 2014, we completed a review of initiatives to reduce costs and enhance our competitive position. Basedon this review, we committed to a plan to close operations at our Rogers, Arkansas facility, which was completedduring the fourth quarter of 2014. The action was undertaken in order to reduce costs and enhance our globalcompetitive position. During 2016, we sold the Rogers facility for total proceeds of $4.3 million, resulting in a$1.4 million gain on sale, which is recorded as a reduction to selling, general and administrative expense in theconsolidated income statements.
75

The total cost incurred as a result of the Rogers facility closure was $16.0 million, of which $0.1 million,$1.5 million, $6.0 million and $8.4 million was recognized as of December 31, 2017, 2016, 2015 and 2014,respectively. The following table summarizes the Rogers, Arkansas plant closure costs and classification in theconsolidated income statement for the years ended December 31, 2017, 2016, 2015 and 2014:
(Dollars in thousands)
CostsIncurredThrough
December 31,2016
Costs inthe YearEnded
December 31,2017
TotalCosts Classification
Accelerated and other depreciation of assetsidled (1) . . . . . . . . . . . . . . . . . . . . . . . . . . . . . . . . . . $ 7,254 $ 13 $ 7,267
Cost of sales,Restructuring costs
Severance costs (2) . . . . . . . . . . . . . . . . . . . . . . . . . . . Cost of sales,2,011 — 2,011 Restructuring costs
Equipment removal and impairment, inventorywritten-down, lease termination and othercosts (3) . . . . . . . . . . . . . . . . . . . . . . . . . . . . . . . . . . 6,634 125 6,759
Cost of sales,Restructuring costs
Total restructuring costs . . . . . . . . . . . . . . . . . . . . . . . 15,899 138 16,037Gain on sale of the facility . . . . . . . . . . . . . . . . . . . . . (1,436) — (1,436)
Total . . . . . . . . . . . . . . . . . . . . . . . . . . . . . . . . . . . . . . $14,463 $138 $14,601
(1) Cost of sales includes accelerated depreciation due to shorter useful lives for assets to be retired afteroperations ceased at the Rogers facility.
(2) The closure resulted in a reduction of workforce of approximately 500 employees and a shift in productionto other facilities.
(3) We incurred other associated costs such as moving costs, impairment of assets and other closing costs. In2016, the majority of the costs related to closing, maintenance and other costs. In 2015, we determined thatsome of the assets would not ultimately be transferred to other facilities and recorded a $2.7 millionimpairment. In 2014, the majority of the restructuring costs related to inventory write-downs, moving costsand other costs.
Changes in the accrued expenses related to restructuring liabilities during the years ended December 31, 2017and 2016 were less than $0.1 million.
NOTE 4 - FAIR VALUE MEASUREMENTS
The company applies fair value accounting for all financial assets and liabilities and non-financial assets andliabilities that are recognized or disclosed at fair value in the financial statements on a recurring basis, whileother assets and liabilities are measured at fair value on a nonrecurring basis, such as when we have an assetimpairment. Fair value is estimated by applying the following hierarchy, which prioritizes the inputs used tomeasure fair value into three levels and bases the categorization within the hierarchy upon the lowest level ofinput that is available and significant to the fair value measurement:
Level 1 - Quoted prices in active markets for identical assets or liabilities.
Level 2 - Observable inputs other than quoted prices in active markets for identical assets and liabilities,quoted prices for identical or similar assets or liabilities in inactive markets, or other inputs that areobservable or can be corroborated by observable market data for substantially the full term of the assets orliabilities.
Level 3 - Inputs that are generally unobservable and typically reflect management’s estimate of assumptionsthat market participants would use in pricing the asset or liability.
76

The carrying amounts for cash and cash equivalents, investments in certificates of deposit, accounts receivable,accounts payable and accrued expenses approximate their fair values due to the short period of time untilmaturity.
Cash and Cash Equivalents
Included in cash and cash equivalents are highly liquid investments that are readily convertible to knownamounts of cash, and which are subject to an insignificant risk of change in value due to interest rate, quotedprice or penalty on withdrawal. A debt security is classified as a cash equivalent if it meets these criteria and if ithas a remaining time to maturity of three months or less from the date of acquisition. Amounts on deposit andavailable upon demand, or negotiated to provide for daily liquidity without penalty, are classified as cash andcash equivalents. Time deposits, certificates of deposit and money market accounts that meet the above criteriaare reported at par value on our balance sheet and are excluded from the table below.
Derivative Financial Instruments
Our derivatives are over-the-counter customized derivative transactions and are not exchange traded. Weestimate the fair value of these instruments using industry-standard valuation models such as a discounted cashflow. These models project future cash flows and discount the future amounts to a present value using market-based expectations for interest rates, foreign exchange rates, commodity prices and the contractual terms of thederivative instruments. The discount rate used is the relevant interbank deposit rate (e.g., LIBOR) plus anadjustment for non-performance risk. In certain cases, market data may not be available and we may use brokerquotes and models (e.g., Black-Scholes) to determine fair value. This includes situations where there is lack ofliquidity for a particular currency or commodity or when the instrument is longer dated. The fair valuemeasurements of the redeemable preferred shares embedded derivatives are based upon Level 3 unobservableinputs reflecting management’s own assumptions about the inputs used in pricing the liability – refer to “Note 5,Derivative Financial Instruments.”
Cash Surrender Value
The cash surrender value of the life insurance policies is the sum of money the insurance company will pay to thecompany in the event the policy is voluntarily terminated before its maturity or the insured event occurs. Overthe term of the life insurance contracts, the cash surrender value changes as a result of premium payments andinvestment income offset by investment losses, charges and miscellaneous fees. The amount of the asset recordedfor the investment in the life insurance contracts is equal to the cash surrender value which is the amount that willbe realized under the contract as of the balance sheet date if the insured event occurs.
77

The following tables categorize items measured at fair value at December 31, 2017 and 2016:
Fair Value Measurement at Reporting Date Using
December 31, 2017
Quoted Prices inActive Markets
for Identical Assets(Level 1)
Significant OtherObservable
Inputs (Level 2)
SignificantUnobservable
Inputs(Level 3)
(Dollars in thousands)
AssetsCertificates of deposit . . . . . . . . $ 750 — 750 —Cash surrender value . . . . . . . . . 8,040 — 8,040 —Derivative contracts . . . . . . . . . . 6,342 — 6,342 —
Total . . . . . . . . . . . . . . . . . . 15,132 — 15,132 —
LiabilitiesDerivative contracts . . . . . . . . . . 16,106 — 16,106 —Embedded derivative
liability . . . . . . . . . . . . . . . . . . 4,685 — — 4,685
Total . . . . . . . . . . . . . . . . . . $20,791 — 16,106 4,685
Fair Value Measurement at Reporting Date Using
December 31, 2016
Quoted Prices inActive Markets
for Identical Assets(Level 1)
Significant OtherObservable
Inputs (Level 2)
SignificantUnobservable
Inputs(Level 3)
(Dollars in thousands)
AssetsCertificates of deposit . . . . . . . . $ 750 $— $ 750 $—Cash surrender value . . . . . . . . . 7,480 — 7,480 —Derivative contracts . . . . . . . . . . 13 — 13 —
Total . . . . . . . . . . . . . . . . . . 8,243 — 8,243 —
LiabilitiesDerivative contracts . . . . . . . . . . 24,773 — 24,773 —
Total . . . . . . . . . . . . . . . . . . $24,773 $— $24,773 $—
The following table summarizes the changes during 2017 in level 3 fair value measurement of the embeddedderivative liability relating to the redeemable preferred shares issued May 22, 2017 in connection with theacquisition of Uniwheels:
Year Ended December 31, 2017
(Dollars in thousands)
Change in fair value:Beginning fair value at date of issuance on May 22, 2017 . . . $10,849
Change in fair value of redeemable preferred stockembedded derivative liability . . . . . . . . . . . . . . . . . . . . (6,164)
Ending fair value at December 31, 2017 . . . . . . . . . . . . . . . . . $ 4,685
Debt Instruments
The carrying values of the company’s debt instruments vary from their fair values. The fair values weredetermined by reference to transacted prices of these securities (Level 2 input based on the GAAP fair value
78

hierarchy). The estimated fair value, as well as the carrying value, of the company’s debt instruments are shownbelow (in thousands):
December 31,2017
(Dollars in thousands)
Estimated aggregate fair value . . . . . . . . . . . . . . . . . . . . . . $704,005Aggregate carrying value (1) . . . . . . . . . . . . . . . . . . . . . . . . 707,864
(1) Long-term debt excluding the impact of unamortized debt issuance costs.
NOTE 5 - DERIVATIVE FINANCIAL INSTRUMENTS
Derivative Instruments and Hedging Activities
We use derivatives to partially offset our business exposure to foreign currency risk. We may enter into forwardcontracts, option contracts, swaps, collars or other derivative instruments to offset some of the risk on expectedfuture cash flows and on certain existing assets and liabilities. However, we may choose not to hedge certainexposures for a variety of reasons including, but not limited to, accounting considerations and the prohibitiveeconomic cost of hedging particular exposures. During 2017, the Company entered into a Euro cross currencyswap to effectively convert Uniwheels Euro denominated earnings into dollars for use in repaying the debt issuedto finance the acquisition. There can be no assurance the hedges will offset more than a portion of the financialimpact resulting from movements in foreign currency exchange rates.
To help protect gross margins from fluctuations in foreign currency exchange rates, certain of our subsidiarieswhose functional currency is the U.S. dollar hedge a portion of forecasted foreign currency costs. Generally, wemay hedge portions of our forecasted foreign currency exposure associated with costs, typically for up to48 months.
We record all derivatives in the consolidated balance sheet at fair value. Our accounting for these instrumentsdepends on whether the hedges have been designated for hedge accounting treatment. For hedges subject tohedge accounting treatment, the effective portions of cash flow hedges are recorded in accumulated othercomprehensive income or loss until the hedged item is recognized in earnings. The ineffective portions of cashflow hedges are recorded in cost of sales. Derivatives that are not designated as hedging instruments are adjustedto fair value through earnings in the financial statement line item to which the derivative relates. AtDecember 31, 2017, the Company held derivatives that were designated for hedge accounting treatment as wellas derivatives that did not qualify or had not been designated for hedge accounting treatment. All derivativeswere designated as hedging instruments at December 31, 2016.
Deferred gains and losses associated with cash flow hedges of foreign currency costs are recognized as acomponent of cost of sales in the same period as the related cost is recognized. Our foreign currency transactionshedged with cash flow hedges as of December 31, 2017, are expected to occur within 1 month to 48 months.
Derivative instruments designated as cash flow hedges must be de-designated as hedges when it is probable theforecasted hedged transaction will not occur in the initially identified time period or within a subsequenttwo-month time period. Deferred gains and losses in accumulated other comprehensive income or loss associatedwith such derivative instruments are reclassified immediately into other expense. Any subsequent changes in fairvalue of such derivative instruments are reflected in other expense unless they are re-designated as hedges ofother transactions.
Redeemable Preferred Stock Embedded Derivative
We have determined that the conversion option embedded in the Series A redeemable preferred stock is requiredto be accounted for separately from the Series A redeemable preferred stock as a derivative liability. Separation
79

of the conversion option as a derivative liability is required because its economic characteristics are consideredmore akin to an equity instrument and therefore the conversion option is not considered to be clearly and closelyrelated to the economic characteristics of the redeemable preferred stock. This is because the economiccharacteristics of the redeemable preferred stock are considered more akin to a debt instrument due to the factthat the shares are redeemable at the holder’s option, the redemption value is significantly greater than the faceamount, the shares carry a fixed mandatory dividend and the stock price necessary to make conversion moreattractive than redemption is $56.324 and is significantly greater than the company’s stock price at the date ofissuance of $19.05, all of which lead to the conclusion that redemption is more likely than conversion. Foradditional information on the redeemable preferred stock, see Note 13, “Redeemable Preferred Shares”.
We have also determined that the early redemption option upon the occurrence of a redemption event (e.g.change of control) must be bifurcated and accounted for separately from the redeemable preferred stock at fairvalue, because the debt host contract involves a substantial discount (face of $150.0 million as compared to theredemption value of $300 million) and exercise of the early redemption option would accelerate the holder’soption to redeem the shares.
Accordingly, we have recorded an embedded derivative liability representing the combined fair value of the rightof holders to receive common stock upon conversion of Series A redeemable preferred stock at any time (the“conversion option”) and the right of the holders to exercise their early redemption option upon the occurrence ofa redemption event (the “early redemption option”). The embedded derivative liability is adjusted to fair value ateach period end with changes in fair value recorded in change in fair value of redeemable preferred stockembedded derivative liability in the company’s consolidated statements of operations (refer to Note 13,“Redeemable Preferred Shares”).
A binomial option pricing model is used to estimate the fair value of the conversion and early redemption optionsembedded in the redeemable preferred stock. The binomial model utilizes a “decision tree” whereby futuremovement in the company’s common stock price is estimated based on a volatility factor. The binomial optionspricing model requires the development and use of assumptions. These assumptions include estimated volatilityof the value of our common stock, assumed possible conversion or early redemption dates, an appropriate risk-free interest rate, risky bond rate and dividend yield.
The expected volatility of the company’s equity is estimated based on the historical volatility of our commonstock. The assumed base case term used in the valuation model is the period remaining until May 22, 2024 (theearliest date at which the holder may exercise its unconditional redemption option). A number of other scenariosincorporated earlier redemption dates to address the possibility of early redemption upon the occurrence of aredemption event. The risk-free interest rate is based on the yield on the U.S. Treasury zero coupon yield curvewith a remaining term equal to the expected term of the conversion and early redemption options. The significantassumptions utilized in the company’s valuation of the embedded derivatives at December 31, 2017 are asfollows: valuation scenario terms between 4.0 and 6.39 years, volatility of 32.0 percent, risk-free rate of2.1 percent to 2.3 percent related to the respective assumed terms, a risky bond rate of 19.2 percent and adividend yield of 2.4 percent.
Based on the foregoing assumptions, the fair value of the redeemable preferred stock embedded derivativeliability at December 31, 2017 is $4.7 million and the change in fair value of redeemable preferred stockembedded derivative liability during the year was $6.2 million mainly due to the decline in our stock price from$19.05 (at date of issuance) to $14.85 (at December 31, 2017) and the reduction in the remaining term of theoptions used in the valuation scenarios due to the months elapsed since issuance.
80

The following tables display the fair value of derivatives by balance sheet line item at December 31, 2017 andDecember 31, 2016:
December 31, 2017
OtherCurrentAssets
OtherNon-current
AssetsAccrued
Liabilities
OtherNon-current
Liabilities
(Dollars in thousands)
Foreign exchange forward contracts and collarsdesignated as hedging instruments . . . . . . . . . . . . $3,065 723 4,922 8,405
Foreign exchange forward contracts not designatedas hedging instruments . . . . . . . . . . . . . . . . . . . . . 721 — 206 —
Aluminum forward contracts not designated ashedges . . . . . . . . . . . . . . . . . . . . . . . . . . . . . . . . . . 1,833 — — —
Cross currency swap not designated as hedginginstrument . . . . . . . . . . . . . . . . . . . . . . . . . . . . . . . — — 1,467 1,106
Embedded derivative liability . . . . . . . . . . . . . . . . . — — — 4,685
Total derivative financial instruments . . . . . . . . . . . $5,619 723 6,595 14,196
December 31, 2016
OtherCurrentAssets
OtherNon-current
AssetsAccrued
Liabilities
OtherNon-current
Liabilities
(Dollars in thousands)
Foreign exchange forward contracts and collarsdesignated as hedging instruments . . . . . . . . . . . . $13 $— $10,076 $14,697
Total derivative financial instruments . . . . . . . . . . . $13 $— $10,076 $14,697
The following table summarizes the notional amount and estimated fair value of our derivative financialinstruments:
December 31, 2017 December 31, 2016
NotionalU.S. Dollar
AmountFair
Value
NotionalU.S. Dollar
AmountFair
Value
(Dollars in thousands)
Foreign currency forward contracts and collarsdesignated as hedging instruments . . . . . . . . . . . . . $397,744 $(9,539) $160,461 $24,760
Foreign exchange forward contracts not designated ashedging instruments . . . . . . . . . . . . . . . . . . . . . . . . . 23,305 515 — —
Aluminum forward contracts not designated ashedges . . . . . . . . . . . . . . . . . . . . . . . . . . . . . . . . . . . 15,564 1,833 — —
Cross currency swap not designated as hedginginstrument . . . . . . . . . . . . . . . . . . . . . . . . . . . . . . . . 36,454 (2,573) — —
Total derivative financial instruments . . . . . . . . . . . . . $473,067 $(9,764) $160,461 $24,760
Notional amounts are presented on a gross basis. The notional amounts of the derivative financial instruments donot represent amounts exchanged by the parties and, therefore, are not a direct measure of our exposure to thefinancial risks described above. The amounts exchanged are calculated by reference to the notional amounts andby other terms of the derivatives, such as interest rates, foreign currency exchange rates or commodity volumesand prices.
81

The following table provides the impact of derivative instruments designated as cash flow hedges on ourconsolidated income statement:
Year ended December 31, 2017
Amount of Gain or (Loss)Recognized in AOCI onDerivatives (Effective
Portion)
Amount of Pre-tax Gain or(Loss) Reclassified from
AOCI into Income (EffectivePortion)
Amount of Pre-tax Gain or(Loss) Recognized in Income
on Derivatives (IneffectivePortion and Amount Excluded
from Effectiveness Testing)
(Dollars in thousands)
Foreign currency forwardcontracts and collars . . . . . . . . $7,603 $(4,539) $(538)
Total . . . . . . . . . . . . . . . . . . . . . . $7,603 $(4,539) $(538)
Year ended December 31, 2016
Amount of Gain or (Loss)Recognized in AOCI onDerivatives (Effective
Portion)
Amount of Pre-tax Gain or(Loss) Reclassified from
AOCI into Income (EffectivePortion)
Amount of Pre-tax Gain or(Loss) Recognized in Income
on Derivatives (IneffectivePortion and Amount Excluded
from Effectiveness Testing)
(Dollars in thousands)
Foreign currency forwardcontracts and collars . . . . . . . . $(6,812) $(13,597) $(156)
Total . . . . . . . . . . . . . . . . . . . . . . $(6,812) $(13,597) $(156)
Year ended December 31, 2015
Amount of Gain or (Loss)Recognized in AOCI onDerivatives (Effective
Portion)
Amount of Pre-tax Gain or(Loss) Reclassified from
AOCI into Income (EffectivePortion)
Amount of Pre-tax Gain or(Loss) Recognized in Income
on Derivatives (IneffectivePortion and Amount Excluded
from Effectiveness Testing)
(Dollars in thousands)
Foreign currency forwardcontracts and collars . . . . . . . . $(4,524) $(9,960) $19
Total . . . . . . . . . . . . . . . . . . . . . . $(4,524) $(9,960) $19
82

NOTE 6 - BUSINESS SEGMENTS
As a result of the Acquisition, the company expanded into the European market and extended its customer baseto include the principal European OEMs. As a consequence, we have realigned our executive managementstructure, organization and operations to focus on our performance in our North American and European regions.In accordance with the requirements of ASC Topic 280, “Segment Reporting,” we have concluded that our NorthAmerican and European businesses represent separate operating segments in view of significantly differentmarkets, customers and products within each of these regions. Each operating segment has discrete financialinformation which is evaluated regularly by the company’s CEO in determining resource allocation and assessingperformance. Within each of these regions, markets, customers, products and production processes are similarand production can be readily transferred between production facilities. Moreover, our business within eachregion leverages common systems, processes and infrastructure. Accordingly, North America and Europecomprise the company’s reportable segments for purposes of segment reporting.
(Dollars in thousands)
Net Sales Income from Operations
2017 2016 2015 2017 2016 2015
North America . . . . . . . . . . . . . . . . . . . . . . . $ 732,418 $732,677 $727,946 $ 9,808 $54,602 $36,294Europe . . . . . . . . . . . . . . . . . . . . . . . . . . . . . 375,637 — — 11,710 — —
$1,108,055 $732,677 $727,946 $21,518 $54,602 $36,294
(Dollars in thousands)
Depreciation andAmortization Capital Expenditures
2017 2016 2015 2017 2016 2015
North America . . . . . . . . . . . . . . . . . . . . . . . . . . . . $35,931 $34,261 $34,530 $47,493 $39,575 $39,543Europe . . . . . . . . . . . . . . . . . . . . . . . . . . . . . . . . . . 33,404 — — 23,444 — —
$69,335 $34,261 $34,530 $70,937 $39,575 $39,543
(Dollars in thousands)Property, plant, and
equipment, netLong-lived
intangible assets
2017 2016 2017 2016
North America . . . . . . . . . . . . . . . . . . . . . . . . . . . . $245,178 $227,403 $ — $—Europe . . . . . . . . . . . . . . . . . . . . . . . . . . . . . . . . . . 291,508 — 203,473 —
$536,686 $227,403 $203,473 $—
(Dollars in millions)
Total Assets
2017 2016
North America . . . . . . . . . . . . . . . . . . . . . . . . . . . . . . . . $ 519,192 $542,756Europe . . . . . . . . . . . . . . . . . . . . . . . . . . . . . . . . . . . . . . 1,032,060 —
$1,551,252 $542,756
83

Geographic information
Net sales by geographic location is the following:
Year Ended December 31, 2017 2016 2015
(Dollars in thousands)
Net sales:U.S. . . . . . . . . . . . . . . . . . . . . . . . . . . . . . . . . . . $ 124,711 $120,395 $177,198Mexico . . . . . . . . . . . . . . . . . . . . . . . . . . . . . . . . 607,707 612,282 550,748Germany . . . . . . . . . . . . . . . . . . . . . . . . . . . . . . 155,227 — —Poland . . . . . . . . . . . . . . . . . . . . . . . . . . . . . . . . 220,410 — —
Consolidated net sales . . . . . . . . . . . . . . . . . . . . . . . . $1,108,055 $732,677 $727,946
NOTE 7 - ACCOUNTS RECEIVABLE
December 31, 2017 2016
(Dollars in thousands)
Trade receivables . . . . . . . . . . . . . . . . . . . . . . . . . . . . . . . . $152,476 $ 91,213Other receivables . . . . . . . . . . . . . . . . . . . . . . . . . . . . . . . . 10,016 9,037
162,492 100,250Allowance for doubtful accounts . . . . . . . . . . . . . . . . . . . (2,325) (919)
Accounts receivable, net . . . . . . . . . . . . . . . . . . . . . . . . . . $160,167 $ 99,331
The following percentages of our consolidated net sales were made to Ford, GM and Toyota: 2017 - 22 percent,20 percent and 9 percent, respectively; 2016 - 38 percent, 30 percent and 14 percent, respectively; and 2015 -44 percent, 24 percent and 14 percent, respectively.
The accounts receivable from GM, Ford and Toyota at December 31, 2017 represented approximately26 percent, 20 percent and 4 percent, respectively of the total accounts receivable. The accounts receivable fromGM, Ford and Toyota at December 31, 2016, represented approximately 39 percent, 32 percent and 14 percent,respectively of the total accounts receivable.
NOTE 8 - INVENTORIES
December 31, 2017 2016
(Dollars in thousands)
Raw materials . . . . . . . . . . . . . . . . . . . . . . . . . . . . . . . . . . . $ 59,353 $40,255Work in process . . . . . . . . . . . . . . . . . . . . . . . . . . . . . . . . . . 48,803 21,447Finished goods . . . . . . . . . . . . . . . . . . . . . . . . . . . . . . . . . . . 65,843 21,135
Inventories . . . . . . . . . . . . . . . . . . . . . . . . . . . . . . . . . . . . . . $173,999 $82,837
Service wheel and supplies inventory included in other non-current assets in the consolidated balance sheetstotaled $8.1 million and $6.5 million at December 31, 2017 and 2016, respectively. Included in raw materialswere operating supplies and spare parts totaling $12.5 million and $10.3 million at December 31, 2017 and 2016,respectively.
84

NOTE 9 - PROPERTY, PLANT AND EQUIPMENT
December 31, 2017 2016
(Dollars in thousands)
Land and buildings . . . . . . . . . . . . . . . . . . . . . . . . . . . . . $ 136,918 $ 67,915Machinery and equipment . . . . . . . . . . . . . . . . . . . . . . . 720,175 485,185Leasehold improvements and others . . . . . . . . . . . . . . . 12,192 4,868Construction in progress . . . . . . . . . . . . . . . . . . . . . . . . . 58,753 26,301
928,038 584,269Accumulated depreciation . . . . . . . . . . . . . . . . . . . . . . . (391,352) (356,866)
Property, plant and equipment, net . . . . . . . . . . . . . . . . . $ 536,686 $ 227,403
Depreciation expense was $54.2 million, $34.3 million and $34.5 million for the years ended December 31,2017, 2016 and 2015, respectively.
NOTE 10 - INVESTMENT IN UNCONSOLIDATED AFFILIATE
On June 28, 2010, we executed a share subscription agreement (the “Agreement”) with Synergies, a privatealuminum wheel manufacturer based in Visakhapatnam, India, providing for our acquisition of a minorityinterest in Synergies. The total cash investment in Synergies amounted to $4.5 million, representing 12.6 percentof the outstanding equity shares of Synergies. Our Synergies investment is accounted for using the cost method.During 2011, a group of existing equity holders, including the company, made a loan of $1.5 million to Synergiesfor working capital needs. The company’s share of this unsecured advance was $0.5 million. The remainingprincipal balance of the unsecured advance was paid in full during the first quarter of 2015.
In October 2014, a typhoon caused significant damage to the facilities and operations of Synergies, and in thefourth quarter of 2014, we tested the $4.5 million carrying value of our investment for impairment. Based on ourevaluation, we determined there was an other-than-temporary impairment and wrote the investment down to itsestimated fair value of $2.0 million, with the $2.5 million loss recognized in income for the year endedDecember 31, 2014. The valuation was based on an income approach using current financial forecast data, andrates and assumptions market participants would use in pricing the investment. There was no further impairmentin 2016 and 2015.
In the third quarter of 2017, the company divested its interest Synergies in exchange for a $2.6 million notereceivable realizing a gain of $0.5 million. The note receivable is payable in installments through April 4, 2019.A payment of $0.5 million due October 14, 2017 was received and the remaining balance at December 31, 2017was $2.1 million.
NOTE 11 - GOODWILL AND OTHER INTANGIBLE ASSETS
Goodwill and indefinite-lived assets, such as certain trade names acquired in connection with the Acquisition onMay 30, 2017, are not amortized, but are instead evaluated for impairment on an annual basis, or more frequentlyif events or circumstances indicate that impairment may be more likely. At December 31, 2017, the goodwillbalance is $304.8 million, consisting of the initial balance of $286.2 million, increased for post-Acquisitiontranslation adjustments. The carrying amount of goodwill arose from the Acquisition described in Note 2,“Acquisition”.
We conducted the annual impairment testing as of December 31, 2017. In performing our valuation, we haveutilized a market approach to estimate the fair value of our European reporting unit due to the fact that Uniwheelsstock is still publicly traded. In our market approach, we estimated value based on the market price of Uniwheelsshares as of December 31, 2017 of 305 Polish Zloty, as well as the price of our most recent purchase of
85

Uniwheels shares of 264 Zloty on December 15, 2017. In addition to the market approach, we have used theincome approach to further support our analysis. The income approach is based on projected debt-free cash flowwhich is discounted to the present value using discount factors that consider the timing and risk of cash flows.The discount rate used is the value-weighted average of our estimated cost of equity and of debt (“weightedaverage cost of capital”). Our weighted average cost of capital is adjusted as necessary to reflect risk associatedwith the business of the reporting unit. Business forecasts are based on estimated production volumes, productprices and expenses, including raw material cost, wages, energy and other expenses. Other significantassumptions include terminal value cash flow and growth rates, future capital expenditures and changes in futureworking capital requirements. Our assessment indicated that the fair value of the European reporting unitexceeded its respective carrying value.
The company’s other intangible assets consist of assets with finite lives and a trade name with an indefinite life.These assets are amortized on a straight-line basis over their estimated useful lives. Following is a summary ofthe company’s finite-lived and indefinite-lived intangible assets as of December 31, 2017. There were no suchintangible assets at December 31, 2016.
GrossCarryingAmount
AccumulatedAmortization
CurrencyTranslation Net
RemainingWeightedAverage
AmortizationPeriod
(Dollars in thousandsBrand name . . . . . . . . . . . . . . . . . . . . . . . . . . . . . . $ 9,000 $ (1,091) $ 581 $ 8,490 5-6Technology . . . . . . . . . . . . . . . . . . . . . . . . . . . . . . 15,000 (1,818) 968 14,150 4-6Customer relationships . . . . . . . . . . . . . . . . . . . . . 167,000 (12,259) 11,005 165,746 6-11
Total finite . . . . . . . . . . . . . . . . . . . . . . . . . . 191,000 (15,168) 12,554 188,386Trade names . . . . . . . . . . . . . . . . . . . . . . . . . . . . . 14,000 — 1,087 15,087 Indefinite
Total . . . . . . . . . . . . . . . . . . . . . . . . . . . . . . . . . . . $205,000 $(15,168) $13,641 $203,473
Amortization expense for these intangible assets was $15.2 million for the year ended December 31, 2017. Theanticipated annual amortization expense for these intangible assets is $25.0 million for 2018 to 2021 and$22.2 million for 2022.
Note 12 – LONG-TERM DEBT
A summary of long-term debt and the related weighted average interest rates is shown below (in thousands):
December 31, 2017
Debt InstrumentTotalDebt
DebtIssuanceCosts (1)
TotalDebt, Net
WeightedAverageInterest
Rate
Credit Facility - Term Loan . . . . . . . . . . . . . . . . . . . . . . . . . . . . . . . . $386,800 $(15,802) $370,998 5.6%6.00% Senior Notes due 2025 . . . . . . . . . . . . . . . . . . . . . . . . . . . . . . 300,250 (8,510) 291,740 6.0%Other . . . . . . . . . . . . . . . . . . . . . . . . . . . . . . . . . . . . . . . . . . . . . . . . . 20,814 — 20,814 1.0%
$707,864 $(24,312) 683,552
Less: Current portion . . . . . . . . . . . . . . . . . . . . . . . . . . . . . . . . . . . . . (4,000)
Long-term debt . . . . . . . . . . . . . . . . . . . . . . . . . . . . . . . . . . . . . $679,552
(1) Unamortized portion
86

Senior Notes
On June 15, 2017, Superior issued €250.0 million aggregate principal amount of 6.00% Senior Notes (the“Notes”) due June 15, 2025. Interest on the Notes is payable semiannually, on June 15 and December 25.Superior may redeem the Notes, in whole or in part, on or after June 15, 2020 at redemption prices of 103.000%and 101.500% of the principal amount thereof if the redemption occurs during the 12-month period beginningJune 15, 2020 or 2021, respectively, and a redemption price of 100.000% of the principal amount thereof on orafter June 15, 2022, in each case plus accrued and unpaid interest to, but not including, the applicable redemptiondate. In addition, the company may redeem some or all of the Notes prior to June 15, 2020 at a price equal to100.000% of the principal amount thereof plus a “make-whole” premium and accrued and unpaid interest, if any,to, but not including, the redemption date. Prior to June 15, 2020, the company may redeem up to 40.000% of theaggregate principal amount of the Notes using the proceeds of certain equity offerings at a certain redemptionprice. If we experience a change of control or sell certain assets, the company may be required to offer topurchase the Notes from the holders.
The Notes are senior unsecured obligations ranking equally in right of payment with all of the Company’sexisting and future senior indebtedness and senior in right of payment to any subordinated indebtedness. Thenotes are effectively subordinated in right of payment to the existing and future secured indebtedness of theCompany, including the Senior Secured Credit Facilities (as defined below), to the extent of the assets securingsuch indebtedness.
Guarantee
The Notes are unconditionally guaranteed by all material wholly-owned direct and indirect domestic restrictedsubsidiaries of the company (the “Subsidiary Guarantors”), with customary exceptions including, among otherthings, where providing such guarantees is not permitted by law, regulation or contract or would result in adversetax consequences.
Covenants
Subject to certain exceptions, the indenture governing the Notes contains restrictive covenants that, among otherthings, limit the ability of Superior and the Subsidiary Guarantors to: (i) incur additional indebtedness or issuecertain preferred stock; (ii) pay dividends on, or make distributions in respect of, their capital stock; (iii) makecertain investments or other restricted payments; (iv) sell certain assets or issue capital stock of restrictedsubsidiaries; (v) create liens; (vi) merge, consolidate, transfer or dispose of substantially all of their assets; and(vii) engage in certain transactions with affiliates. These covenants are subject to a number of importantlimitations and exceptions that are described in the indenture.
The indenture provides for customary events of default that include, among other things (subject in certain casesto customary grace and cure periods): (i) nonpayment of principal, premium, if any, and interest, when due;(ii) breach of covenants in the indenture; (iii) a failure to pay certain judgments; and (iv) certain events ofbankruptcy and insolvency. If an event of default occurs and is continuing, the Trustee or holders of at least30 percent in principal amount of the then outstanding Notes may declare the principal, premium, if any, andaccrued and unpaid interest on all the Notes to be due and payable. These events of default are subject to anumber of important qualifications, limitations and exceptions that are described in the indenture. As ofDecember 31, 2017, the company was in compliance with all covenants under the indentures governing theNotes.
Senior Secured Credit Facilities
On March 22, 2017, Superior entered into a senior secured credit agreement (the “Credit Agreement”) withCitibank, N.A, JP Morgan Chase N.A., Royal Bank of Canada and Deutsche Bank A.G. New York Branch
87

(collectively, the “Lenders”). The Credit Agreement consists of a $400.0 million senior secured term loan facility(the “Term Loan Facility”) and a $160.0 million revolving credit facility (the “Revolving Credit Facility” and,together with the Term Loan Facility, the “Senior Secured Credit Facilities”). Borrowings under the Term LoanFacility will bear interest at a rate equal to, at the company’s option, either (a) LIBOR for the relevant interestperiod, adjusted for statutory reserve requirements, subject to a floor of 1.00 percent per annum, plus anapplicable rate of 4.50 percent or (b) a base rate, subject to a floor of 2.00 percent per annum, equal to the highestof (1) the rate of interest in effect as publicly announced by the administrative agent as its prime rate, (2) thefederal funds rate plus 0.50 percent and (3) LIBOR for an interest period of one month plus 1.00 percent, in eachcase, plus an applicable rate of 3.50 percent. Borrowings under the Revolving Credit Facility initially bearinterest at a rate equal to, at the company’s option, either (a) LIBOR for the relevant interest period, adjusted forstatutory reserve requirements, subject to a floor of 1.00 percent per annum, plus an applicable rate of3.50 percent or (b) a base rate, subject to a floor of 2.00 percent per annum, equal to the highest of (1) the rate ofinterest in effect as publicly announced by the administrative agent as its prime rate, (2) the federal fundseffective rate plus 0.50 percent and (3) LIBOR for an interest period of one month plus 1.00 percent, in eachcase, plus an applicable rate of 3.50 percent provided such rate may not be less than zero. The initial commitmentfee for unused commitments under the Revolving Credit Facility shall be 0.50 percent. After September 30,2017, the applicable rates for borrowings under the Revolving Credit Facility and commitment fees for unusedcommitments under the Revolving Credit Facility are based upon the First Lien Net Leverage Ratio effective forthe preceding quarter with LIBOR applicable rates between 3.50 percent and 3.00 percent, base rate applicablerates between 2.50 percent and 2.00 percent and commitment fees between 0.50 percent and 0.25 percent.Commitment fees are included in our consolidated financial statements line, interest (expense) income, net.During the year ended December 31, 2017, the company repaid $13.2 million under the term loan facilityresulting in a balance of $386.8 million.
Quarterly principal payments of $1.0 million are due on the term loan, however, as a result of prepayments, thereare no quarterly payments due until 2021. Beginning in January 2019, payments may be due on the term loan inan amount equal to a percentage (up to 50 percent) of excess cash flow as defined under the Credit Agreement. Inaddition, further payments may be due in the event of asset sales equal to net proceeds on such dispositions inexcess of $5.0 million individually and $20.0 million in the aggregate in any year.
As of December 31, 2017, the company had no outstanding borrowings under the Revolving Credit Facility, hadoutstanding letters of credit of $2.8 million and available unused commitments under the facility of$157.2 million.
Guarantees
Our obligations under the Credit Agreement are unconditionally guaranteed by all material wholly-owned directand indirect domestic restricted subsidiaries of the company, with customary exceptions including, among otherthings, where providing such guarantees is not permitted by law, regulation or contract or would result in adversetax consequences. The guarantees of such obligations, will be secured, subject to permitted liens and otherexceptions, by substantially all of our assets and the Subsidiary Guarantors’ assets, including but not limited to:(i) a perfected pledge of all of the capital stock issued by each of the company’s direct wholly-owned domesticrestricted subsidiaries or any guarantor (subject to certain exceptions) and up to 65 percent of the capital stockissued by each direct wholly-owned foreign restricted subsidiary of the company or any guarantor (subject tocertain exceptions) and (ii) perfected security interests in and mortgages on substantially all tangible andintangible personal property and material fee-owned real property of the Company and the guarantors (subject tocertain exceptions and exclusions).
Covenants
The Senior Secured Credit Facilities contain a number of covenants that, among other things, restrict, subject tocertain exceptions, our ability to incur additional indebtedness and guarantee indebtedness, create or incur liens,
88

engage in mergers or consolidations, sell, transfer or otherwise dispose of assets, make investments, acquisitions,loans or advances, pay dividends, distributions or other restricted payments, or repurchase our capital stock,prepay, redeem, or repurchase any subordinated indebtedness, enter into agreements which limit our ability toincur liens on our assets or that restrict the ability of restricted subsidiaries to pay dividends or make otherrestricted payments to us, and enter into certain transactions with our affiliates.
In addition, the Credit Agreement contains customary default provisions, representations and warranties andrestrictive covenants. The Credit Agreement also contains a provision permitting the Lenders to accelerate therepayment of all loans outstanding under the Senior Secured Credit Facilities during an event of default. As ofDecember 31, 2017, the Company was in compliance with all covenants under the Credit Agreement.
Uniwheels Debt
In connection with the Acquisition, the Company assumed $70.7 million of outstanding debt. At December 31,2017, $20.8 million of debt remained outstanding, relating to an equipment loan with quarterly principalpayments of $0.8 million. At December 31, 2017, $4.0 million of this debt was classified as current. Uniwheelsalso has an undrawn revolving line of credit for 30 million Euro which expires July 31, 2020. The revolvingcredit facility bears interest at Euribor plus 0.95 percent (but in any event not less than 0.95 percent) and theequipment loan bears interest at 2.20 percent.
NOTE 13 - REDEEMABLE PREFERRED SHARES
On March 22, 2017, Superior and TPG Growth III Sidewall, L.P. (“TPG”) entered into an Investment Agreementpursuant to which Superior agreed to issue a number of shares of Series A Perpetual Convertible Preferred Stock(the “Series A redeemable preferred stock”) and Series B Perpetual Preferred Stock (the “Series B redeemablepreferred stock”), par value $0.01 per share (the “Series A redeemable preferred stock” and “Series B redeemablepreferred stock” referred to collectively as the “redeemable preferred stock”) to TPG for an aggregate purchaseprice of $150.0 million (the “Investment”). As of the closing of the Investment on May 22, 2017, Superior issued140,202 shares of Series A redeemable preferred stock, which was equal to 19.99 percent of Superior’s commonstock outstanding on such date, and 9,798 shares of Series B redeemable preferred stock to TPG.
On August 30, 2017, our stockholders approved the conversion of 9,798 shares of Series B redeemable preferredstock into Series A redeemable preferred stock and all outstanding shares of Series B redeemable preferred stockwere automatically converted into Series A redeemable preferred stock (the “Conversion”). Series A redeemablepreferred stock has an initial stated value of $1,000 per share, par value of $0.01 per share and liquidationpreference over common stock. Series A redeemable preferred stock is convertible into shares of Superiorcommon stock equal to the number of shares determined by dividing the sum of the stated value and any accruedand unpaid dividends by the conversion price of $28.162. Series A redeemable preferred stock accrues dividendsat a rate of 9 percent per annum, payable at Superior’s election either in-kind or in cash. Series A redeemablepreferred stock is also entitled to participate in dividends on common stock in an amount equal to that whichwould have been due had the shares been converted into common stock.
We may mandate conversion of the Series A redeemable preferred stock if the price of the common stockexceeds $84.49. TPG may redeem the shares upon the occurrence of any of the following events (referred to as a“redemption event”): a change in control, recapitalization, merger, sale of substantially all of the company’sassets, liquidation or delisting of the company’s common stock. In addition, TPG may, at its option,unconditionally redeem the shares at any time after May 23, 2024. Superior may, at its option, redeem in wholeat any time all of the shares of Series A redeemable preferred stock outstanding. If redeemed by either party onor before October 22, 2018, the redemption value (the “redemption value”) would be $262.5 million (1.75 timesstated value). If redeemed after October 22, 2018, the redemption value would be the greater of $300 million (2.0times stated value) or the product of the number of common shares into which the Series A redeemable preferredstock could be converted (5.3 million shares currently) and the then current market price of the common stock.
89

We have determined that the conversion option embedded in the redeemable preferred stock is required to beaccounted for separately from the redeemable preferred stock as a derivative liability. Separation of theconversion option as a derivative liability is required because its economic characteristics are considered moreakin to an equity instrument and therefore the conversion option is not considered to be clearly and closelyrelated to the economic characteristics of the redeemable preferred stock. This is because the economiccharacteristics of the redeemable preferred stock are considered more akin to a debt instrument due to the factthat the shares are redeemable at the holder’s option, the redemption value is significantly greater than the faceamount, the shares carry a fixed mandatory dividend, the stock price necessary to make conversion moreattractive than redemption ($56.324) is significantly greater than the price at the date of issuance ($19.05), all ofwhich lead to the conclusion that redemption is more likely than conversion.
We have also determined that the early redemption option exercisable upon the occurrence of a redemption eventmust also be bifurcated and accounted for separately from the redeemable preferred stock at fair value, becausethe debt host contract involves a substantial discount (face of $150.0 million as compared to the redemptionvalue of $300.0 million) and the exercise of the early redemption option upon the occurrence of a redemptionevent would accelerate the holder’s option to redeem the shares.
Accordingly, we have recorded an embedded derivative liability representing the estimated combined fair valueof the right of holders to receive common stock upon conversion (the “conversion option”) and the right of theholders to exercise their early redemption option upon the occurrence of a redemption event. The embeddedderivative liability is adjusted to reflect fair value at each period end with changes in fair value recorded in the“Change in fair value of redeemable preferred stock embedded derivative liability” financial statement line itemof the company’s consolidated statements of operations. Refer to Note 5, “Derivative Financial Instruments” forfurther information regarding the valuation of the embedded derivative.
Since the redeemable preferred stock may be redeemed at the option of the holder, but is not mandatorilyredeemable, the redeemable preferred stock has been classified as mezzanine equity and initially recognized atfair value of $150.0 million (the proceeds on the date of issuance) less issuance costs of $3.7 million, resulting inan initial value of $146.3 million. This amount had been further reduced by $10.9 million assigned to theembedded derivative liability at date of issuance, resulting in an adjusted initial value of $135.5 million. We areaccreting the difference between the adjusted initial value of $135.5 million and the redemption value of$300.0 million over the seven-year period from date of issuance through May 23, 2024 (the date at which theholder has the unconditional right to redeem the shares, deemed to be the earliest likely redemption date) usingthe effective interest method. The accretion to the carrying value of the redeemable preferred stock is treated as adeemed dividend, recorded as a charge to retained earnings and deducted in computing earnings per share(analogous to the treatment for stated and participating dividends paid on the redeemable preferred shares). Wehave accreted $9.2 million through December 31, 2017 resulting in a balance of $144.7 million.
NOTE 14 - INCOME TAXES
Income before income taxes from domestic and international jurisdictions is comprised of the following:
Year Ended December 31, 2017 2016 2015
(Dollars in thousands)
Income before income taxes:Domestic . . . . . . . . . . . . . . . . . . . . . . . . . . . . . . . . . . . . . . $(63,716) $18,499 $25,069Foreign . . . . . . . . . . . . . . . . . . . . . . . . . . . . . . . . . . . . . . . 64,582 36,222 10,214
$ 866 $54,721 $35,283
90

The provision for income taxes is comprised of the following:
Year Ended December 31, 2017 2016 2015
(Dollars in thousands)
Current taxesFederal . . . . . . . . . . . . . . . . . . . . . . . . . . . . . . . . . . $ 6,121 $ (5,017) $(10,900)State . . . . . . . . . . . . . . . . . . . . . . . . . . . . . . . . . . . . (390) 450 481Foreign . . . . . . . . . . . . . . . . . . . . . . . . . . . . . . . . . . (12,564) (10,639) (2,099)
Total current taxes . . . . . . . . . . . . . . . . . . . . . (6,833) (15,206) (12,518)
Deferred taxesFederal . . . . . . . . . . . . . . . . . . . . . . . . . . . . . . . . . . (4,387) (1,199) (961)State . . . . . . . . . . . . . . . . . . . . . . . . . . . . . . . . . . . . 1,492 (332) (576)Foreign . . . . . . . . . . . . . . . . . . . . . . . . . . . . . . . . . . 2,853 3,397 2,716
Total deferred taxes . . . . . . . . . . . . . . . . . . . . (42) 1,866 1,179
Income tax provision . . . . . . . . . . . . . . . . . . . . . . . . . . . $ (6,875) $(13,340) $(11,339)
The following is a reconciliation of the U.S. federal tax rate to our effective income tax rate:
Year Ended December 31, 2017 2016 2015
Statutory rate . . . . . . . . . . . . . . . . . . . . . . . . . . . . . . . . . . . . . . . . (35.0)% (35.0)% (35.0)%State tax provisions, net of federal income tax benefit . . . . . . . . 263.4 (6.3) 3.8Tax credits . . . . . . . . . . . . . . . . . . . . . . . . . . . . . . . . . . . . . . . . . . 88.9 0.6 0.9Foreign income taxes at rates other than the statutory rate . . . . . 1,206.6 11.7 2.3Valuation allowance and other . . . . . . . . . . . . . . . . . . . . . . . . . . (138.0) 5.1 (5.6)Changes in tax liabilities, net . . . . . . . . . . . . . . . . . . . . . . . . . . . (11.3) 0.5 6.4Share based compensation . . . . . . . . . . . . . . . . . . . . . . . . . . . . . (61.5) (1.2) (4.4)Transaction costs . . . . . . . . . . . . . . . . . . . . . . . . . . . . . . . . . . . . . (372.2) — —Tax Reform . . . . . . . . . . . . . . . . . . . . . . . . . . . . . . . . . . . . . . . . . (1,918.7) — —Non taxable income . . . . . . . . . . . . . . . . . . . . . . . . . . . . . . . . . . . 152.6 — —Other . . . . . . . . . . . . . . . . . . . . . . . . . . . . . . . . . . . . . . . . . . . . . . 31.3 0.2 (0.5)
Effective income tax rate . . . . . . . . . . . . . . . . . . . . . . . . . . . . . . (793.9)% (24.4)% (32.1)%
Our effective income tax rate for 2017 was 793.9 percent. The effective tax rate was higher than the U.S. federalstatutory rate primarily due to non-deductible acquisition costs related to the Uniwheels acquisition, andprovisional estimates recorded for the transition tax on offshore earnings and a deferred tax expense resultingfrom the reduction of our deferred tax assets. The reduction in deferred tax assets was due to the change in theU.S. statutory federal income tax rate from 35% to 21% for years subsequent to 2017 arising from the newlyenacted U.S. Tax Cuts and Jobs Act.
Our effective income tax rate for 2016 was 24.4 percent. The effective tax rate was lower than the U.S. federalstatutory rate primarily as a result of income in jurisdictions where the statutory rate is lower than the U.S. rateand tax benefits due to the release of tax liabilities related to uncertain tax positions.
Our effective income tax rate for 2015 was 32.1 percent. The effective tax rate was lower than the U.S. federalstatutory rate primarily as a result of net decreases in the liability for uncertain tax positions partially offset bythe reversal of deferred tax assets related to share-based compensation shortfalls.
91
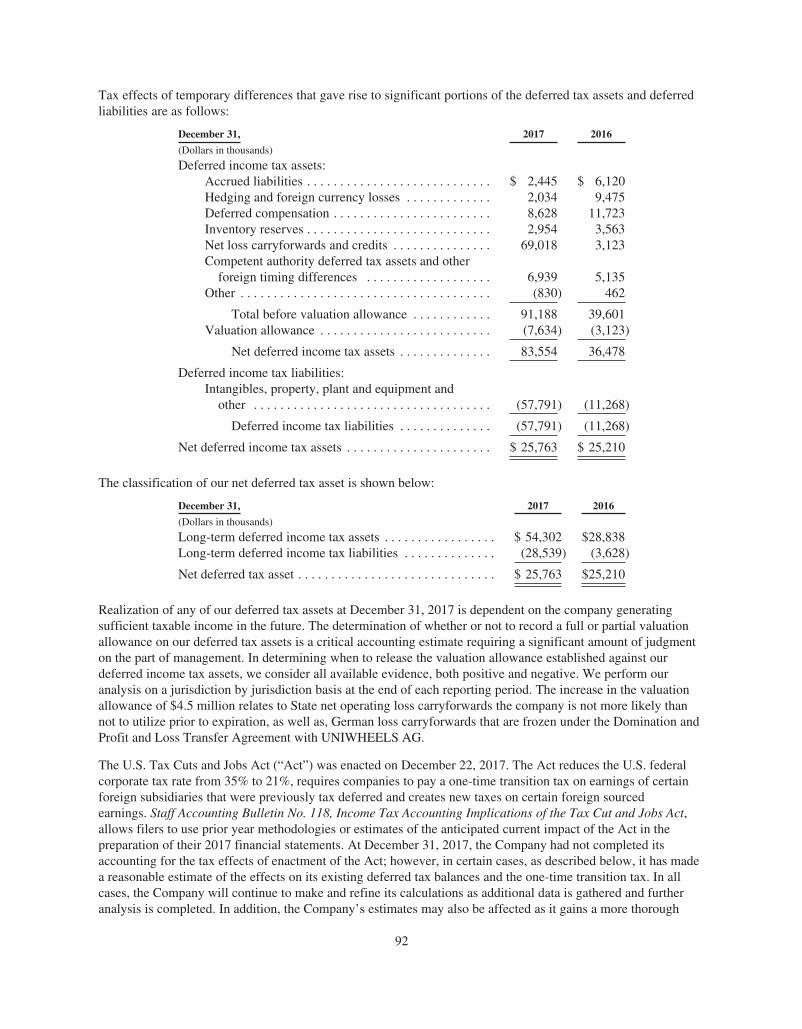
Tax effects of temporary differences that gave rise to significant portions of the deferred tax assets and deferredliabilities are as follows:
December 31, 2017 2016
(Dollars in thousands)
Deferred income tax assets:Accrued liabilities . . . . . . . . . . . . . . . . . . . . . . . . . . . . $ 2,445 $ 6,120Hedging and foreign currency losses . . . . . . . . . . . . . 2,034 9,475Deferred compensation . . . . . . . . . . . . . . . . . . . . . . . . 8,628 11,723Inventory reserves . . . . . . . . . . . . . . . . . . . . . . . . . . . . 2,954 3,563Net loss carryforwards and credits . . . . . . . . . . . . . . . 69,018 3,123Competent authority deferred tax assets and other
foreign timing differences . . . . . . . . . . . . . . . . . . . 6,939 5,135Other . . . . . . . . . . . . . . . . . . . . . . . . . . . . . . . . . . . . . . (830) 462
Total before valuation allowance . . . . . . . . . . . . 91,188 39,601Valuation allowance . . . . . . . . . . . . . . . . . . . . . . . . . . (7,634) (3,123)
Net deferred income tax assets . . . . . . . . . . . . . . 83,554 36,478
Deferred income tax liabilities:Intangibles, property, plant and equipment and
other . . . . . . . . . . . . . . . . . . . . . . . . . . . . . . . . . . . . (57,791) (11,268)
Deferred income tax liabilities . . . . . . . . . . . . . . (57,791) (11,268)
Net deferred income tax assets . . . . . . . . . . . . . . . . . . . . . . $ 25,763 $ 25,210
The classification of our net deferred tax asset is shown below:
December 31, 2017 2016
(Dollars in thousands)
Long-term deferred income tax assets . . . . . . . . . . . . . . . . . $ 54,302 $28,838Long-term deferred income tax liabilities . . . . . . . . . . . . . . (28,539) (3,628)
Net deferred tax asset . . . . . . . . . . . . . . . . . . . . . . . . . . . . . . $ 25,763 $25,210
Realization of any of our deferred tax assets at December 31, 2017 is dependent on the company generatingsufficient taxable income in the future. The determination of whether or not to record a full or partial valuationallowance on our deferred tax assets is a critical accounting estimate requiring a significant amount of judgmenton the part of management. In determining when to release the valuation allowance established against ourdeferred income tax assets, we consider all available evidence, both positive and negative. We perform ouranalysis on a jurisdiction by jurisdiction basis at the end of each reporting period. The increase in the valuationallowance of $4.5 million relates to State net operating loss carryforwards the company is not more likely thannot to utilize prior to expiration, as well as, German loss carryforwards that are frozen under the Domination andProfit and Loss Transfer Agreement with UNIWHEELS AG.
The U.S. Tax Cuts and Jobs Act (“Act”) was enacted on December 22, 2017. The Act reduces the U.S. federalcorporate tax rate from 35% to 21%, requires companies to pay a one-time transition tax on earnings of certainforeign subsidiaries that were previously tax deferred and creates new taxes on certain foreign sourcedearnings. Staff Accounting Bulletin No. 118, Income Tax Accounting Implications of the Tax Cut and Jobs Act,allows filers to use prior year methodologies or estimates of the anticipated current impact of the Act in thepreparation of their 2017 financial statements. At December 31, 2017, the Company had not completed itsaccounting for the tax effects of enactment of the Act; however, in certain cases, as described below, it has madea reasonable estimate of the effects on its existing deferred tax balances and the one-time transition tax. In allcases, the Company will continue to make and refine its calculations as additional data is gathered and furtheranalysis is completed. In addition, the Company’s estimates may also be affected as it gains a more thorough
92

understanding of the tax law and certain aspects of the Act are clarified by the taxing authorities. Anyadjustments to these provisional amounts will be reported as a component of tax expense (benefit) in thereporting period in which any such adjustments are determined, which will be no later than the fourth quarter of2018.
We recognized the impact of the Act for the year ended December 31, 2017. The impact primarily consists of a$7.3 million related to re-measurement of U.S. deferred tax assets due to the lowering of the corporate tax ratedescribed above and $9.3 million of expense for the estimate of the impact of one-time transition tax on themandatory repatriation of earnings of foreign subsidiaries. The Company anticipates additional guidance andclarification regarding the implementation of the transition tax will be issued by federal and state taxingauthorities and this estimate is, therefore, subject to future refinement.
As of December 31, 2017, we have cumulative U.S. state and Germany NOL carryforwards of $87.0 million thatexpire in the years 2018 to 2037. Also, we have $58.0 million of tax credit carryforwards, primarily in Poland,which expire in the years 2021 to 2026.
Historically, U.S. income tax has not been recognized on the excess of the amount for financial reporting over thetax basis of the Company’s investment in its non-U.S. subsidiaries derived from foreign earnings that areindefinitely reinvested outside the U.S. At December 31, 2017, unremitted earnings of the $164.3 million havebeen included in the computation of the transition tax associated with the Act. The Company remains indefinitelyreinvested with respect to its initial investment and any associated potential withholding tax on earnings of itsnon-U.S. subsidiaries subject to the transition tax, as well as with respect to future earnings that will primarilyfund the operations of the subsidiary; however, the Company continues to evaluate its position under SAB 118.
We account for our uncertain tax positions in accordance with U.S. GAAP. A reconciliation of the beginning andending amounts of these tax benefits is as follows:
Year Ended December 31, 2017 2016 2015
(Dollars in thousands)
Beginning balance . . . . . . . . . . . . . . . . . . . . . . . . . . . . . . . . $ 3,446 $ 7,318 $ 7,193Increases (decreases) due to foreign currency
translations . . . . . . . . . . . . . . . . . . . . . . . . . . . . . . . . — — —Increases (decreases) as a result of positions taken
during: . . . . . . . . . . . . . . . . . . . . . . . . . . . . . . . . . . . — — —Prior periods . . . . . . . . . . . . . . . . . . . . . . . . . . . . — (3,872) 1,238Current period . . . . . . . . . . . . . . . . . . . . . . . . . . . 29,773 — 1,798
Settlements with taxing authorities . . . . . . . . . . . . . . . — — —Expiration of applicable statutes of limitation . . . . . . (165) — (2,911)
Ending balance (1) . . . . . . . . . . . . . . . . . . . . . . . . . . . . . . . . $33,054 $ 3,446 $ 7,318
(1) Increases in uncertain tax positions are primarily due to acquisition of UNIWHEELS AG. These uncertaintax positions offset certain deferred tax assets of UNIWHEELS AG.
Our policy regarding interest and penalties related to uncertain tax positions is to record interest and penalties asan element of income tax expense. At the end of 2017, 2016 and 2015 the company had liabilities of$2.4 million, $1.8 million and $2.1 million of potential interest and penalties associated with uncertain taxpositions. Included in the unrecognized tax benefits is $1.8 million that, if recognized, would favorably affect ourannual effective tax rate. Within the next twelve-month period we do not expect a decrease in unrecognized taxbenefits.
93

Income tax returns are filed in multiple jurisdictions and are subject to examination by tax authorities in variousjurisdictions where the Company operates. The Company has open tax years from 2013 to 2017 with varioussignificant tax jurisdictions.
NOTE 15 - LEASES AND RELATED PARTIES
We lease certain land, facilities and equipment under long-term operating leases expiring at various dates through2026. Total lease expense for all operating leases amounted to $4.3 million in 2017 and $1.9 million in 2016 and2015. During 2015, we moved our headquarters from Van Nuys, California to Southfield, Michigan.
Our former headquarters in Van Nuys, California is leased from the Louis L. Borick Foundation (the“Foundation”). The Foundation is controlled by Mr. Steven J. Borick, the former Chairman and CEO of thecompany, as President and Director of the Foundation.
The lease provided for annual lease payments of approximately $427,000, through March 2015. In November2014, the lease was amended to extend the lease term from March 2015 to March 2017, and to reduce the amountof office space and annual rent. As amended, beginning April 2015, the annual lease payment is approximately$225,000. The future minimum lease payments that are payable to the Foundation for the Van Nuysadministrative office lease total $0.1 million. Total lease payments to these related entities were less than$0.1 million, $0.2 million and $0.3 million for 2017, 2016 and 2015, respectively. We also have a lease for ourheadquarters in Southfield, Michigan from October 2015 to September 2026 which is with an unrelated party.
The following are summarized future minimum payments under all leases:
Year Ended December 31,Operating
Leases
(Dollars in thousands)
2018 . . . . . . . . . . . . . . . . . . . . . . . . . . . . . . . . . . . . . . . . . . . . . $ 4,4472019 . . . . . . . . . . . . . . . . . . . . . . . . . . . . . . . . . . . . . . . . . . . . . 3,2422020 . . . . . . . . . . . . . . . . . . . . . . . . . . . . . . . . . . . . . . . . . . . . . 3,2072021 . . . . . . . . . . . . . . . . . . . . . . . . . . . . . . . . . . . . . . . . . . . . . 2,8452022 . . . . . . . . . . . . . . . . . . . . . . . . . . . . . . . . . . . . . . . . . . . . . 2,463Thereafter . . . . . . . . . . . . . . . . . . . . . . . . . . . . . . . . . . . . . . . . 7,192
$23,396
Purchase Agreement
In the first quarter of 2015, we entered into an agreement to purchase a subscription to online software providedby NGS Inc. Our Senior Vice President, Business Operations, is a passive investor and our Vice President ofInformation Technology is also a passive investor in NGS. We made payments to NGS of $376,920 and$243,000 during the 2017 and 2016 fiscal year, respectively. The transaction was entered into in the ordinarycourse of business and is an arms-length transaction.
NOTE 16 - RETIREMENT PLANS
We have an unfunded salary continuation plan covering certain directors, officers and other key members ofmanagement. We purchase life insurance policies on certain participants to provide in part for future liabilities.Cash surrender value of these policies, totaling $8.0 million and $7.5 million at December 31, 2017 and 2016,respectively, are included in other non-current assets in the company’s consolidated balance sheets. Subject tocertain vesting requirements, the plan provides for a benefit based on final average compensation, whichbecomes payable on the employee’s death or upon attaining age 65, if retired. The plan was closed to newparticipants effective February 3, 2011. We have measured the plan assets and obligations of our salarycontinuation plan for all periods presented.
94

The following table summarizes the changes in plan benefit obligations:
Year Ended December 31, 2017 2016
(Dollars in thousands)
Change in benefit obligationBeginning benefit obligation . . . . . . . . . . . . . . . . . . . . . . . . . $27,612 $28,399
Service cost . . . . . . . . . . . . . . . . . . . . . . . . . . . . . . . . . . — —Interest cost . . . . . . . . . . . . . . . . . . . . . . . . . . . . . . . . . . 1,189 1,216Actuarial gain (loss) . . . . . . . . . . . . . . . . . . . . . . . . . . . 2,300 (464)Benefit payments . . . . . . . . . . . . . . . . . . . . . . . . . . . . . . (1,342) (1,539)
Ending benefit obligation . . . . . . . . . . . . . . . . . . . . . . . . . . . $29,759 $27,612
Year Ended December 31, 2017 2016
(Dollars in thousands)
Change in plan assetsFair value of plan assets at beginning of year . . . . . . $ — $ —
Employer contribution . . . . . . . . . . . . . . . . 1,342 1,539Benefit payments . . . . . . . . . . . . . . . . . . . . (1,342) (1,539)
Fair value of plan assets at end of year . . . . . . . . $ — $ —
Funded status . . . . . . . . . . . . . . . . . . . . . . . . . . . . . . . . . . . $(29,759) $(27,612)
Amounts recognized in the consolidated balance sheetsconsist of:
Accrued expenses . . . . . . . . . . . . . . . . . . . . . . . . (1,407) (1,177)Other non-current liabilities . . . . . . . . . . . . . . . . (28,352) (26,435)
Net amount recognized . . . . . . . . . . . . . . . . . . . . $(29,759) $(27,612)
Amounts recognized in accumulated other comprehensiveloss consist of:
Net actuarial loss . . . . . . . . . . . . . . . . . . . . . . . . $ 7,722 $ 5,692Prior service cost . . . . . . . . . . . . . . . . . . . . . . . . (1) (1)
Net amount recognized, before tax effect . . . . . . $ 7,721 $ 5,691
Weighted average assumptions used to determine benefitobligations:
Discount rate . . . . . . . . . . . . . . . . . . . . . . . . . . . . 3.7% 4.4%Rate of compensation increase . . . . . . . . . . . . . . 3.0% 3.0%
Components of net periodic pension cost are described in the following table:
Year Ended December 31, 2017 2016 2015
(Dollars in thousands)
Components of net periodic pension cost:Service cost . . . . . . . . . . . . . . . . . . . . . . . . . . . . . . . . . . . $ — $ — $ 44Interest cost . . . . . . . . . . . . . . . . . . . . . . . . . . . . . . . . . . . 1,189 1,216 1,230Amortization of actuarial loss . . . . . . . . . . . . . . . . . . . . . 369 335 535
Net periodic pension cost . . . . . . . . . . . . . . . . . . . . . . . . . . . . . 1,558 $1,551 $1,809
Weighted average assumptions used to determine net periodic pension cost:Discount rate . . . . . . . . . . . . . . . . . . . . . . . . . . . . . . . . . . 4.4% 4.4% 4.2%Rate of compensation increase . . . . . . . . . . . . . . . . . . . . . 3.0% 3.0% 3.0%
95

The decrease in the 2017 net periodic pension cost compared to the 2016 cost was primarily due to decreasedamortization of actuarial losses. The decrease in the 2016 net periodic pension cost compared to the 2015 costwas primarily due to decreased amortization of actuarial losses and decreased service cost from terminations andretirements.
Benefit payments during the next ten years, which reflect applicable future service, are as follows:
Year Ended December 31, Amount
(Dollars in thousands)
2018 . . . . . . . . . . . . . . . . . . . . . . . . . . . . . . . . . . . . . . . . . . . . . . $1,4332019 . . . . . . . . . . . . . . . . . . . . . . . . . . . . . . . . . . . . . . . . . . . . . . $1,4102020 . . . . . . . . . . . . . . . . . . . . . . . . . . . . . . . . . . . . . . . . . . . . . . $1,4682021 . . . . . . . . . . . . . . . . . . . . . . . . . . . . . . . . . . . . . . . . . . . . . . $1,4422022 . . . . . . . . . . . . . . . . . . . . . . . . . . . . . . . . . . . . . . . . . . . . . . $1,479Years 2023 to 2027 . . . . . . . . . . . . . . . . . . . . . . . . . . . . . . . . . . $8,282
The following is an estimate of the components of net periodic pension cost in 2018:
Estimated Year Ended December 31, 2018
(Dollars in thousands)
Service cost . . . . . . . . . . . . . . . . . . . . . . . . . . . . . . . . . . . . . . . . $ —Interest cost . . . . . . . . . . . . . . . . . . . . . . . . . . . . . . . . . . . . . . . . 1,086Amortization of actuarial loss . . . . . . . . . . . . . . . . . . . . . . . . . . 437
Estimated 2018 net periodic pension cost . . . . . . . . . . . . . . . . . $1,523
Other Retirement Plans
We also contribute to employee retirement savings plans in the U.S. and Mexico that cover substantially all ofour employees in those countries. The employer contribution totaled $1.7 million, $1.4 million and $1.5 millionfor the three years ended December 31, 2017, 2016 and 2015, respectively.
NOTE 17 - ACCRUED EXPENSES
December 31, 2017 2016
(Dollars in thousands)
Payroll and related benefits . . . . . . . . . . . . . . . . . . . . . . . . . . $27,954 $12,766Taxes, other than income taxes . . . . . . . . . . . . . . . . . . . . . . . 9,419 7,325Current portion of derivative liability . . . . . . . . . . . . . . . . . . 6,595 10,076Dividends . . . . . . . . . . . . . . . . . . . . . . . . . . . . . . . . . . . . . . . 7,322 5,127Deferred tooling revenue . . . . . . . . . . . . . . . . . . . . . . . . . . . . 4,654 5,419Current portion of executive retirement liabilities . . . . . . . . 1,407 1,177Other . . . . . . . . . . . . . . . . . . . . . . . . . . . . . . . . . . . . . . . . . . . 11,435 4,425
Accrued liabilities . . . . . . . . . . . . . . . . . . . . . . . . . . . . . . . . . $68,786 $46,315
NOTE 18 - STOCK-BASED COMPENSATION
2008 Equity Incentive Plan
Our 2008 Equity Incentive Plan, as amended (the “Plan”), authorizes us to issue up to 3.5 million shares ofcommon stock, along with non-qualified stock options, stock appreciation rights, restricted stock andperformance units to our officers, key employees, non-employee directors and consultants. At December 31,
96

2017, there were 1.7 million shares available for future grants under this Plan. No more than 600,000 shares maybe used under the Plan as “full value” awards, which include restricted stock and performance stock units. It isour policy to issue shares from authorized but not issued shares upon the exercise of stock options.
During the first quarter of 2015, the company implemented a long-term incentive program for the benefit ofcertain members of company management. The program was designed to strengthen employee retention and toprovide a more structured incentive program to stimulate improvement in future company results. Per the termsof the program, participants were granted, in 2015, 2016 and 2017, time value restricted stock units (“RSUs”),vesting ratably over a three-year time period, and performance restricted stock units (“PSUs”), with a three-yearcliff vesting. Upon vesting, each restricted stock award is exchangeable for one share of the company’s commonstock, with accrued dividends. The PSUs are categorized further into three individual categories whose vesting iscontingent upon the achievement of certain targets as follows:
• 40 percent of the PSUs vest upon certain Return on Invested Capital targets for 2017, 2016 and 2015 units
• 40 percent of the PSUs vest upon certain Cumulative EPS targets for 2017 and 2016 units
• 40 percent of the PSUs vest upon certain EBITDA margin targets for 2015 units
• 20 percent of the PSUs vest upon certain market based Shareholder Return targets for 2017, 2016 and2015 units
Other Awards
During 2014, we granted 132,455 restricted shares, including 50,000 shares vesting April 30, 2017, and 82,455shares vesting on December 31, 2016 under an Executive Employment Agreement (the “EmploymentAgreement”). The fair value of each of these restricted shares was $19.44. These grants were made outside of thePlan as inducement grants in connection with the appointment of our current CEO and company President.Beginning in 2015, the CEO will be granted restricted stock unit awards each year under Superior’s 2008 EquityIncentive Plan, or any successor equity plan. Under the CEO’s Employment Agreement, time-vested restrictedstock units will be granted each year with cliff vesting at the third fiscal year end following grant. The CEO willalso be granted performance-vested restricted stock units each year, vesting based on company performancegoals established by the independent compensation committee during the three fiscal years following the grant.
97

Options
Options are granted at not less than fair market value on the date of grant and expire no later than ten years afterthe date of grant. Options and restricted shares granted under this Plan generally require no less than a three-yearratable vesting period. Stock option activity in 2017 and 2016 are summarized in the following table:
Outstanding
WeightedAverageExercise
Price
RemainingContractual
Life inYears
AggregateIntrinsic
Value
Balance at December 31, 2015 . . . . . . . . . . . . . . 376,033 $18.89 3.6 $ 452,128Granted . . . . . . . . . . . . . . . . . . . . . . . . . . . . — $ —Exercised . . . . . . . . . . . . . . . . . . . . . . . . . . (86,908) $18.77Canceled . . . . . . . . . . . . . . . . . . . . . . . . . . . (24,750) $21.51Expired . . . . . . . . . . . . . . . . . . . . . . . . . . . . (32,750) $17.56
Balance at December 31, 2016 . . . . . . . . . . . . . . 231,625 $18.88 3.1 $1,845,263Granted . . . . . . . . . . . . . . . . . . . . . . . . . . . . — —Exercised . . . . . . . . . . . . . . . . . . . . . . . . . . (2,000) $16.76Canceled . . . . . . . . . . . . . . . . . . . . . . . . . . . (6,000) $21.09Expired . . . . . . . . . . . . . . . . . . . . . . . . . . . . (78,000) $18.62
Balance at December 31, 2017 . . . . . . . . . . . . . . 145,625 $18.96
Options vested or expected to vest atDecember 31, 2017 . . . . . . . . . . . . . . . . . . . . . 145,625 $18.96 2.0 $ —
Exercisable at December 31, 2017 . . . . . . . . . . . 145,625
We received cash proceeds of less than $0.1 million, $1.6 million and $7.3 million from stock options exercisedin 2017, 2016 and 2015, respectively. The total intrinsic value of options exercised was less than $0.1 million,$0.7 million and $0.8 million, for the years ended December 31, 2017, 2016 and 2015, respectively. Upon theexercise of stock options and the issuance of restricted stock awards, it is our policy to only issue shares fromauthorized common stock.
The aggregate intrinsic value represents the total pretax difference between the closing stock price on the lasttrading day of the reporting period and the option exercise price, multiplied by the number of in-the-moneyoptions. This is the amount that would have been received by the option holders had they exercised and sold theiroptions on that day. This amount varies based on changes in the fair market value of our common stock. Theclosing price of our common stock on the last trading day of our fiscal year was $14.85.
Stock options outstanding at December 31, 2017 and 2016 are summarized in the following tables:
Range ofExercise Prices
OptionsOutstanding
at12/31/2017
WeightedAverage
RemainingContractual
Life (inYears)
WeightedAverageExercise
Price
OptionsExercisable
at12/31/2017
WeightedAverageExercise
Price
$15.17 — $15.75 29,375 1.6 $15.17 29,375 $15.17$15.76 — $16.54 24,250 2.4 $16.32 24,250 $16.32$16.55 — $19.65 22,000 4.5 $17.07 22,000 $17.07$19.66 — $22.21 49,000 0.4 $21.84 49,000 $21.84$22.22 — $22.57 21,000 3.4 $22.57 21,000 $22.57
145,625 2.0 $18.96 145,625 $18.96
98

Range ofExercise Prices
OptionsOutstanding
at12/31/2016
WeightedAverage
RemainingContractual
Life (inYears)
WeightedAverageExercise
Price
OptionsExercisable
at12/31/2016
WeightedAverageExercise
Price
$15.17 — $16.54 54,625 3.0 $15.68 54,625 $15.68$16.55 — $17.58 36,000 5.5 $16.95 36,000 $16.95$17.59 — $20.20 54,000 2.3 $18.16 54,000 $18.16$20.21 — $22.21 51,000 1.4 $21.84 51,000 $21.84$22.22 — $22.57 36,000 4.4 $22.57 36,000 $22.57
231,625 3.1 $18.88 231,625 $18.88
Restricted Stock Awards
Restricted stock awards, or “full value” awards, generally vest ratably over no less than a three-year period.Shares of restricted stock granted under the Plan are considered issued and outstanding at the date of grant, havethe same dividend and voting rights as other outstanding common stock, are subject to forfeiture if employmentterminates prior to vesting, and are expensed ratably over the vesting period. Dividends paid on the restrictedshares granted under the Plan are non-forfeitable if the restricted shares do not ultimately vest. Restricted stockactivity in 2017 and 2016 are summarized in the following table:
Numberof Awards
WeightedAverageGrant
Date FairValue
WeightedAverage
RemainingAmortization
Period (inYears)
Balance at December 31, 2015 . . . . . . . . . . . . . . . . . . 192,293 $19.20 1.7Granted . . . . . . . . . . . . . . . . . . . . . . . . . . . . . . . . — $ —Vested . . . . . . . . . . . . . . . . . . . . . . . . . . . . . . . . . (42,546) $18.47Canceled . . . . . . . . . . . . . . . . . . . . . . . . . . . . . . . (5,452) $18.75
Balance at December 31, 2016 . . . . . . . . . . . . . . . . . . 144,295 $19.43 0.5Granted . . . . . . . . . . . . . . . . . . . . . . . . . . . . . . . . — $ —Vested . . . . . . . . . . . . . . . . . . . . . . . . . . . . . . . . . (140,628) $19.43Canceled . . . . . . . . . . . . . . . . . . . . . . . . . . . . . . . (3,667) $19.16
Balance at December 31, 2017 . . . . . . . . . . . . . . . . . . — $ — —
99

Restricted Stock Units
Restricted stock unit activity in 2017 and 2016 are summarized in the following table:
Numberof Awards
WeightedAverageGrant
Date FairValue
WeightedAverage
RemainingAmortization
Period (inYears)
Balance at December 31, 2015 . . . . . . . . . . . . . . . . . . 53,323 $18.78 2.1Granted . . . . . . . . . . . . . . . . . . . . . . . . . . . . . . . . 84,200 $23.71Vested . . . . . . . . . . . . . . . . . . . . . . . . . . . . . . . . . (7,227) $18.78Canceled . . . . . . . . . . . . . . . . . . . . . . . . . . . . . . . (2,729) $18.78
Balance at December 31, 2016 . . . . . . . . . . . . . . . . . . 127,567 $22.03 1.7Granted . . . . . . . . . . . . . . . . . . . . . . . . . . . . . . . . 131,656 $22.24Vested . . . . . . . . . . . . . . . . . . . . . . . . . . . . . . . . . (67,889) $21.54Canceled . . . . . . . . . . . . . . . . . . . . . . . . . . . . . . . (22,068) $22.95
Balance at December 31, 2017 . . . . . . . . . . . . . . . . . . 169,266 $22.27 1.6
Restricted Performance Stock Units
Restricted performance stock unit activity in 2017 and 2016 are summarized in the following table:
Numberof Awards
WeightedAverageGrant
Date FairValue
WeightedAverage
RemainingAmortization
Period (inYears)
Balance at December 31, 2015 . . . . . . . . . . . . . . . . . . 106,647 $18.78 2.0Granted . . . . . . . . . . . . . . . . . . . . . . . . . . . . . . . . 127,139 $23.14Vested . . . . . . . . . . . . . . . . . . . . . . . . . . . . . . . . . — $ —Canceled . . . . . . . . . . . . . . . . . . . . . . . . . . . . . . . (6,593) $19.92
Balance at December 31, 2016 . . . . . . . . . . . . . . . . . . 227,193 $21.72 1.6Granted . . . . . . . . . . . . . . . . . . . . . . . . . . . . . . . . 164,566 $22.39Vested . . . . . . . . . . . . . . . . . . . . . . . . . . . . . . . . . (71,493) $19.00Added by performance factor . . . . . . . . . . . . . . . 4,268 19.00Canceled . . . . . . . . . . . . . . . . . . . . . . . . . . . . . . . (84,860) $22.76
Balance at December 31, 2017 . . . . . . . . . . . . . . . . . . 239,674 $22.58 1.7
Stock Based Compensation
Stock-based compensation expense related to our equity incentive plans in accordance with U.S. GAAP wasallocated as follows:
Year Ended December 31, 2017 2016 2015
(Thousands of dollars)
Cost of sales . . . . . . . . . . . . . . . . . . . . . . . . . . . . . . . . . . . . . . $ 452 $ 472 $ 370Selling, general and administrative expenses . . . . . . . . . . . . 2,124 3,218 2,437
Stock-based compensation expense before income taxes . . . 2,576 3,690 2,807Income tax benefit . . . . . . . . . . . . . . . . . . . . . . . . . . . . . . . . . (970) (1,361) (1,044)
Total stock-based compensation expense after incometaxes . . . . . . . . . . . . . . . . . . . . . . . . . . . . . . . . . . . . . . . . . . $1,606 $ 2,329 $ 1,763
100

As of December 31, 2017, a total of $2.5 million of unrecognized stock-based compensation expense related tonon-vested awards is expected to be recognized over a weighted average period of approximately 1.6 years.There were no significant capitalized stock-based compensation costs at December 31, 2017, 2016 or 2015.
NOTE 19 - COMMON STOCK REPURCHASE PROGRAMS
In October 2014, our Board of Directors approved the 2014 Repurchase Program, which authorized therepurchase of up to $30.0 million of our common stock. Under the 2014 Repurchase Program, we repurchasedcommon stock from time to time on the open market or in private transactions. Shares repurchased under the2014 Repurchase Program during 2015 totaled 1,056,954 shares at a cost of $19.6 million. The 2014 RepurchaseProgram was completed in the beginning of 2016, with purchases of 585,970 shares for a cost of $10.3 million.The repurchased shares described above were either canceled and retired or added to treasury stock after thereincorporation in Delaware in 2015.
In January of 2016, our Board of Directors approved the 2016 Repurchase Program, which authorized therepurchase of up to $50.0 million of common stock. Under the 2016 Repurchase Program, we may repurchasecommon stock from time to time on the open market or in private transactions. During 2016, we repurchased454,718 shares of company stock at a cost of $10.4 million under the 2016 Repurchase Program. In theaggregate, we purchased $20.7 million in company stock during 2016 under the 2014 Repurchase Program and2016 Repurchase Program. During 2017, we purchased an additional 215,841 shares of company stock at a costof $5.0 million under the 2016 Repurchase Program.
NOTE 20 - RISK MANAGEMENT
We are subject to various risks and uncertainties in the ordinary course of business due, in part, to thecompetitive global nature of the industry in which we operate, changing commodity prices for the materials usedin the manufacture of our products and the development of new products.
We have operations in Mexico with sale and purchase transactions denominated in both Pesos and dollars. ThePeso is the functional currency of certain of our operations in Mexico. The settlement of accounts receivable andaccounts payable for our operations in Mexico requires the transfer of funds denominated in the Mexican peso,the value of which increased 5.1 percent in relation to the U.S. dollar in 2017. Foreign currency transaction gainstotaled $11.0 million in 2017, and foreign currency losses were $0.4 million and $1.2 million in 2016 and 2015,respectively. In addition to gains on Peso foreign currency transactions, the 2017 foreign currency transactiongains include an $8.2 million realized gain on a Zloty forward contract used to hedge the acquisition purchaseprice, partially offset by $2.5 million unrealized loss on a Euro cross currency swap. All transaction gains andlosses are included in other income (expense), net, in the consolidated income statements.
As it relates to foreign currency translation gains and losses, however, since 1990, the Mexican peso hasexperienced periods of relative stability followed by periods of major declines in value. The impact of thesechanges in value relative to our Mexico operations resulted in a cumulative unrealized translation loss atDecember 31, 2017 of $101.0 million. Translation gains and losses are included in other comprehensive income(loss) in the consolidated statements of comprehensive income.
We also have operations in Europe with sale and purchase transactions denominated in Euros and Zlotys. TheEuro is the functional currency of our operations in Europe. A significant component of our European productionoperations is located in Poland. The settlement of accounts receivable and accounts payable for these operationsrequires the transfer of funds denominated in Zlotys. The value of the Euro has increased 7.2 percent in relationto the U.S. dollar in the seven months following the acquisition of Uniwheels ended December 31, 2017. Duringthat same period, the value of the Zloty has remained relatively flat in relation to the Euro. Foreign currencytransaction gains totaled $1.9 million for the seven months ended December 31, 2017. All transaction gains andlosses are included in other income (expense) in the consolidated income statements.
101

As it relates to foreign currency translation gains and losses, the Euro has experienced periods of relative stabilityin value. The impact of changes in value relative to our European operations resulted in a cumulative unrealizedtranslation gain at December 31, 2017 of $26.2 million. Translation gains and losses are included in othercomprehensive income (loss) in the consolidated statements of comprehensive income.
When market conditions warrant, we may also enter into purchase commitments to secure the supply of certaincommodities used in the manufacture of our products, such as aluminum, natural gas and other raw materials.However, our European business had entered into forward contracts to hedge price fluctuations in its aluminumraw materials. At December 31, 2017, the fair value asset relating to foreign contracts for aluminum was$1.8 million.
NOTE 21 - CONTINGENCIES
We are party to various legal and environmental proceedings incidental to our business. Certain claims, suits andcomplaints arising in the ordinary course of business have been filed or are pending against us. Based on factsnow known, we believe all such matters are adequately provided for, covered by insurance, are without meritand/or involve such amounts that would not materially adversely affect our consolidated results of operations,cash flows or financial position.
NOTE 22 - QUARTERLY FINANCIAL DATA (UNAUDITED)
(Dollars in thousands, except per share amounts)
Year 2017First
QuarterSecondQuarter
ThirdQuarter
FourthQuarter Year
Net sales . . . . . . . . . . . . . . . . . . . . . . . . . . . . . . . . . . . . . . $174,220 240,628 331,404 361,803 1,108,055Gross profit . . . . . . . . . . . . . . . . . . . . . . . . . . . . . . . . . . . . $ 19,204 20,105 23,893 39,695 102,897Income (loss) from operations . . . . . . . . . . . . . . . . . . . . . $ 3,944 (1,998) 5,758 13,814 21,518Consolidated income (loss) before income taxes . . . . . . . $ 3,300 (9,241) (501) 7,308 866Income tax (provision) benefit . . . . . . . . . . . . . . . . . . . . . $ (198) 1,722 3,355 (11,754) (6,875)Consolidated net income (loss) . . . . . . . . . . . . . . . . . . . . . $ 3,102 (7,519) 2,854 (4,446) (6,009)Less: Net (income) loss attributable to non-controlling
interest . . . . . . . . . . . . . . . . . . . . . . . . . . . . . . . . . . . . . .non-controlling interest . . . . . . . . . . . . . . . . . . . . . . . . . . . — 247 (239) (202) (194)Net income (loss) attributable to Superior . . . . . . . . . . . . 3,102 (7,272) 2,615 (4,648) (6,203)Income (loss) per share:
Basic . . . . . . . . . . . . . . . . . . . . . . . . . . . . . . . . . . . . . $ 0.12 (0.41) (0.22) (0.50) (1.01)Diluted . . . . . . . . . . . . . . . . . . . . . . . . . . . . . . . . . . . . $ 0.12 (0.41) (0.22) (0.50) (1.01)
Dividends declared per share . . . . . . . . . . . . . . . . . . . . . . $ 0.18 0.09 0.09 0.09 0.45
Year 2016First
QuarterSecondQuarter
ThirdQuarter
FourthQuarter Year
Net sales . . . . . . . . . . . . . . . . . . . . . . . . . . . . . . . . . . . . $186,065 $182,709 $175,580 $188,323 $732,677Gross profit . . . . . . . . . . . . . . . . . . . . . . . . . . . . . . . . . . $ 27,715 $ 29,540 $ 10,981 $ 17,968 $ 86,204Income from operations . . . . . . . . . . . . . . . . . . . . . . . . $ 18,722 $ 19,540 $ 5,250 $ 11,090 $ 54,602Income before income taxes . . . . . . . . . . . . . . . . . . . . . $ 19,022 $ 19,247 $ 4,910 $ 11,542 $ 54,721Income tax (provision) benefit . . . . . . . . . . . . . . . . . . . $ (4,558) $ (6,082) $ 1,064 $ (3,764) $ (13,340)Net income . . . . . . . . . . . . . . . . . . . . . . . . . . . . . . . . . . $ 14,464 $ 13,165 $ 5,974 $ 7,778 $ 41,381Income per share:
Basic . . . . . . . . . . . . . . . . . . . . . . . . . . . . . . . . . . . $ 0.56 $ 0.52 $ 0.24 $ 0.31 $ 1.63Diluted . . . . . . . . . . . . . . . . . . . . . . . . . . . . . . . . . $ 0.56 $ 0.52 $ 0.23 $ 0.31 $ 1.62
Dividends declared per share . . . . . . . . . . . . . . . . . . . . $ 0.18 $ 0.18 $ 0.18 $ 0.18 $ 0.72
102

ITEM 9 - CHANGES IN AND DISAGREEMENTS WITH ACCOUNTANTS ON ACCOUNTING ANDFINANCIAL DISCLOSURE
None.
ITEM 9A - CONTROLS AND PROCEDURES
Evaluation of Disclosure Controls
We acquired Uniwheels on May 30, 2017 and are in the process of reviewing and evaluating their internalcontrols as a part of the process of aligning and integrating the business and operations. SEC guidance allowscompanies to exclude acquisitions from their assessment of internal control over financial reporting during thefirst year of acquisition while integrating the acquired company. Accordingly, the scope of our assessment of theeffectiveness of disclosure controls and procedures does not include internal control over financial reportingrelating to Uniwheels constituted 32.8 percent of our total assets as of December 31, 2017 (excluding goodwilland intangibles which are included within the scope of the assessment), and 33.9 percent of our net sales for theyear ended December 31, 2017.
The company’s management, with the participation of the CEO and Chief Financial Officer, evaluated theeffectiveness of the company’s disclosure controls and procedures (as defined in Rules 13a-15(e) and 15d-15(e)under the Exchange Act) as of December 31, 2017. Our disclosure controls and procedures are designed toensure that information required to be disclosed in reports we file or submit under the Exchange Act is recorded,processed, summarized and reported within the time periods specified in SEC rules and forms and that suchinformation is accumulated and communicated to our management, including our CEO and Chief FinancialOfficer, to allow timely decisions regarding required disclosures.
Based on this evaluation, our Chief Executive Officer and Chief Financial Officer concluded that, as ofDecember 31, 2017 our disclosure controls and procedures were effective.
Management’s Report on Internal Control Over Financial Reporting
Management is responsible for establishing and maintaining adequate internal control over financial reporting.As defined in Rule 13a-15(f) under the Exchange Act, internal control over financial reporting is a processdesigned to provide reasonable assurance regarding the reliability of financial reporting and the preparation offinancial statements for external purposes in accordance with generally accepted accounting principles. Thecompany’s internal control over financial reporting includes those policies and procedures that (i) pertain to themaintenance of records that, in reasonable detail, accurately and fairly reflect the transactions and dispositions ofthe assets of the company; (ii) provide reasonable assurance that transactions are recorded as necessary to permitpreparation of financial statements in accordance with generally accepted accounting principles, and that receiptsand expenditures of the company are being made only in accordance with authorizations of management anddirectors of the company; and (iii) provide reasonable assurance regarding prevention or timely detection ofunauthorized acquisition, use, or disposition of the company’s assets that could have a material effect on thefinancial statements.
As previously mentioned, we acquired Uniwheels on May 30, 2017 and are in the process of reviewing andevaluating its internal control over financial reporting as a part of the process of aligning and integrating thebusiness and operations. SEC guidance allows companies to exclude acquisitions from their assessment ofinternal control over financial reporting during the first year of acquisition while integrating the acquiredcompany. Accordingly, the scope of our assessment does not include internal control over financial reportingrelating to Uniwheels. Uniwheels constituted 32.8 percent of our total assets as of December 31, 2017 (excludinggoodwill and intangibles which are included within the scope of the assessment) assets recorded as part of thepurchase accounting), and 33.9 percent of our net sales for the year ended December 31, 2017.
103

Because of its inherent limitations, internal control over financial reporting may not prevent or detect allmisstatements. Also, projections of any evaluation of effectiveness to future periods are subject to the risk thatcontrols may become inadequate because of changing conditions, or that the degree of compliance with policiesor procedures may deteriorate.
A material weakness is a deficiency, or combination of deficiencies, in internal control over financial reporting,such that there is a reasonable possibility that a material misstatement of the company’s annual or interimfinancial statements will not be prevented or detected on a timely basis.
Management performed an assessment of the effectiveness of the company’s internal control over financialreporting as of December 31, 2017 based upon criteria established in the 2013 Internal Control - IntegratedFramework issued by the Committee of Sponsoring Organizations of the Treadway Commission (COSO). Basedon our assessment, management determined that our internal control over financial reporting, excluding therecently acquired Uniwheels business, was effective as of December 31, 2017 based on the criteria in the 2013Internal Control - Integrated Framework issued by COSO.
The effectiveness of the company’s internal control over financial reporting as of December 31, 2017 has beenaudited by Deloitte and Touche LLP, an independent registered public accounting firm, as stated in their report,which is included in this Annual Report.
Changes in Internal Control Over Financial Reporting
Other than the acquisition of Uniwheels referenced above, there has been no change in our internal control overfinancial reporting during the most recent fiscal quarter ended December 31, 2017 that has materially affected, oris reasonably likely to materially affect, our internal control over financial reporting.
ITEM 9B - OTHER INFORMATION
None.
104

PART III
ITEM 10 - DIRECTORS, EXECUTIVE OFFICERS AND CORPORATE GOVERNANCE
Except as set forth herein, the information required by this Item is incorporated by reference to our 2018 ProxyStatement.
Executive Officers - The names of corporate executive officers as of fiscal year end who are not also Directorsare listed at the end of Part I of this Annual Report. Information regarding executive officers who are Directors iscontained in our 2018 Proxy Statement under the caption “Proposal No. 1 - Election of Directors.” Suchinformation is incorporated herein by reference. With the exception of the CEO, all executive officers areappointed annually by the Board of Directors and serve at the will of the Board of Directors. For a description ofthe CEO’s employment agreement, see “Executive Compensation and Related Information - CompensationDiscussion and Analysis” in our 2018 Proxy Statement, which is incorporated herein by reference.
Code of Ethics - Included on our website, www.supind.com, under “Investors,” is our Code of Conduct, which,among others, applies to our CEO, Chief Financial Officer and Chief Accounting Officer. Copies of our Code ofConduct are available, without charge, from Superior Industries International, Inc., Shareholder Relations, 26600Telegraph Road, Suite 400, Southfield, Michigan 48033.
ITEM 11 - EXECUTIVE COMPENSATION
Information relating to Executive Compensation is set forth under the captions “Compensation of Directors” and“Executive Compensation and Related Information - Compensation Discussion and Analysis” in our 2018 ProxyStatement, which is incorporated herein by reference.
ITEM 12 - SECURITY OWNERSHIP OF CERTAIN BENEFICIAL OWNERS AND MANAGEMENTAND RELATED STOCKHOLDER MATTERS
Information related to Security Ownership of Certain Beneficial Owners and Management and RelatedStockholder Matters is set forth under the caption “Voting Securities and Principal Ownership” in our 2018Proxy Statement. Also see Note 18, “Stock Based Compensation” in the Notes to the Consolidated FinancialStatements in Item 8, “Financial Statements and Supplementary Data” of this Annual Report.
ITEM 13 - CERTAIN RELATIONSHIPS AND RELATED TRANSACTIONS, AND DIRECTORINDEPENDENCE
Information related to Certain Relationships and Related Transactions is set forth under the caption, “CertainRelationships and Related Transactions,” in our 2018 Proxy Statement, and in Note 15, “Leases and RelatedParties” in the Notes to the Consolidated Financial Statements in Item 8, “Financial Statements andSupplementary Data” of this Annual Report.
ITEM 14 - PRINCIPAL ACCOUNTANT FEES AND SERVICES
Information related to Principal Accountant Fees and Services is set forth under the caption “Proposal No. 4 -Ratification of Independent Registered Public Accounting Firm - Principal Accountant Fees and Services” in our2018 Proxy Statement and is incorporated herein by reference.
105

PART IV
ITEM 15 - EXHIBITS AND FINANCIAL STATEMENT SCHEDULES
(a) The following documents are filed as a part of this report:
1. Financial Statements: See the “Index to the Consolidated Financial Statements and Financial StatementSchedule” in Item 8 of this Annual Report.
2. Financial Statement Schedule
Schedule II – Valuation and Qualifying Accounts for the Years Ended December 31, 2017, 2016and 2015
3. Exhibits
2.1 Agreement and Plan of Merger of Superior Industries International, Inc., a Delaware corporation(Incorporated by reference to Exhibit 2.1 to the Registrant’s Current Report on Form 8-K filedMay 21, 2015).
2.2 Undertaking Agreement, dated as of March 23, 2017, between Superior Industries International,Inc. and Uniwheels Holding (Malta) Ltd. (Incorporated by reference to Exhibit 2.1 of theRegistrant’s Current Report on Form 8-K filed March 24, 2017).
2.3 Combination Agreement, dated March 23, 2017, between Superior Industries International, Inc.and Uniwheels AG (Incorporated by reference to Exhibit 2.2 of the Registrant’s Current Report onForm 8-K filed March 24, 2017).
3.1 Certificate of Incorporation of the Registrant (Incorporated by reference to Exhibit 3.1 toRegistrant’s Current Report on Form 8-K filed May 21, 2015).
3.2 Amended and Restated By-Laws of the Registrant effective as of October 25, 2017 (Incorporatedby reference to Exhibit 3.1 to Registrant’s Current Report on Form 8-K filed October 30, 2017).
3.3 Certificate of Designations, Preferences and Rights of Series A Perpetual Convertible PreferredStock and Series B Perpetual Preferred Stock of Superior Industries International, Inc.(Incorporated by reference to Exhibit 3.1 to the Registrant’s Current Report on Form 8-K filedMay 26, 2017).
4.1 Form of Superior Industries International, Inc.‘s Common Stock Certificate (Incorporated byreference to Exhibit 4.1 to the Registrant’s Current Report on Form 8-K filed May 21, 2015).
4.2 Indenture, dated as of June 15, 2017, among Superior Industries International, Inc., the subsidiariesof Superior identified therein, The Bank of New York Mellon SA/NV, Luxembourg Branch, asregistrar and transfer agent and The Bank of New York Mellon acting through its London Branch,as trustee (Incorporated by reference to Exhibit 4.1 to the Registrant’s Current Report on Form 8-Kfiled June 20, 2017).
10.1 2003 Equity Incentive Plan of the Registrant (Incorporated by reference to Exhibit 99.1 toRegistrant’s Form S-8 dated July 28, 2003. Registration No. 333-107380). *
10.2 Salary Continuation Plan of The Registrant, amended and restated as of November 14, 2008(Incorporated by reference to Exhibit 10.12 to Registrant’s Annual Report on Form 10-K for theyear ended December 31, 2008). *
10.3 2008 Equity Incentive Plan of the Registrant (Incorporated by reference to Exhibit A toRegistrant’s Definitive Proxy Statement on Schedule 14A filed on April 28, 2008).*
10.4 2008 Equity Incentive Plan Notice of Stock Option Grant and Agreement (Incorporated byreference to Exhibit 10.2 to Registrant’s Form S-8 filed November 10, 2008. RegistrationNo. 333-155258).*
106

10.5 Employment letter between the Registrant and Kerry A. Shiba, Senior Vice President and ChiefFinancial Officer (Incorporated by reference to Exhibit 10.1 to Registrant’s Quarterly Report onForm 10-Q for the period ended September 26, 2010).*
10.6 Form of Notice of Grant and Restricted Stock Agreement pursuant to Registrant’s 2008 EquityIncentive Plan (Incorporated by reference to Exhibit 10.1 to Registrant’s Current Report on Form8-K filed May 20, 2010).*
10.7 Second Amendment to Sublease Agreement dated April 1, 2010 by and among The Louis L.Borick Trust and The Nita Borick Management Trust and Registrant (Incorporated by reference toExhibit 10.1 to Registrant’s Current Report on Form 8-K filed March 25, 2010).
10.8 2010 Employee Incentive Plan of the Registrant (Incorporated by reference to exhibit 10.14 toRegistrant’s Annual Report on Form 10-K for the year ended December 31, 2010).*
10.9 Superior Industries International, Inc. Annual Incentive Performance Plan (Incorporated byreference to Exhibit 10.1 to Registrant’s Current Report on Form 8-K dated March 24, 2011).*
10.10 Superior Industries International, Inc. CEO Annual Incentive Performance Plan (Incorporated byreference to Exhibit 10.2 to Registrant’s Current Report on Form 8-K dated March 24, 2011).*
10.11 Superior Industries International, Inc. Executive Change in Control Severance Plan (Incorporatedby reference to Exhibit 10.4 to Registrant’s Current Report on Form 8-K dated March 24, 2011).*
10.12 Amended and Restated 2008 Equity Incentive Plan of the Registrant (Incorporated by reference toExhibit 10.1 to Registrant’s Current Report on Form 8-K filed May 23, 2013).*
10.13 Amended and Restated Executive Employment Agreement, dated August 10, 2016, between theRegistrant and Donald J. Stebbins. (Incorporated by reference to Exhibit 10.1 to Registrant’sCurrent Report on Form 8-K dated August 11, 2016).*
10.14 Credit agreement dated December 19, 2014 between Superior Industries International, Inc. andJPMorgan Chase Bank, N.A. and Wells Fargo Bank, National Association (Incorporated byreference to Exhibit 10.1 to Registrant’s Current Report on Form 8-K filed December 23, 2014).
10.15 Amendment No. 1 to the Credit Agreement dated as of March 3, 2015, by and among SuperiorIndustries International, Inc., the Lenders from time to time a party thereto and JP Morgan ChaseBank, N.A. as Administrative Agent (Incorporated by reference to Exhibit 10.2 to Registrant’sQuarterly Report on Form 10-Q for the quarter ended March 29, 2015).
10.16 Consent and Amendment No. 2 dated as of October 14, 2015 to the Credit Agreement dated as ofDecember 19, 2014, by and among Superior Industries International, Inc., the Lenders from time totime party thereto and JP Morgan Chase Bank, N.A., as Administrator (Incorporated by referenceto Exhibit 10.2 to Registrant’s Quarterly Report on Form 10-Q for the quarter ended September 27,2015).
10.17 Form of Restricted Stock Unit Agreement under the Superior Industries International, Inc.Amended and Restated 2008 Equity Incentive Plan (Incorporated by reference to Exhibit 10.24 toRegistrant’s Annual Report on Form 10-K for the year ended December 31, 2015).*
10.18 Form of Performance Based Restricted Stock Unit Agreement under the Superior IndustriesInternational, Inc. Amended and Restated 2008 Equity Incentive Plan (Incorporated by reference toExhibit 10.25 to Registrant’s Annual Report on Form 10-K for the year ended December 31,2015).*
10.19 Form of Non-Employee Director Restricted Stock Unit Agreement under the Superior IndustriesInternational, Inc. Amended and Restated 2008 Equity Incentive Plan (Incorporated by reference toExhibit 10.1 to Registrant’s Quarterly Report on Form 10-Q filed on July 29, 2016).*
107

10.20 Superior Industries International, Inc. Annual Incentive Performance Plan (Incorporated byreference to Annex A to Registrant’s Definitive Proxy Statement on Schedule 14-A filed onMarch 25, 2016).*
10.21 Indemnification Agreement, dated March 23, 2017, between Superior Industries International, Inc.and Uniwheels Holding (Malta) Ltd. (Incorporated by reference to Exhibit 10.1 of the Registrant’sCurrent Report on Form 8-K filed March 24, 2017).
10.22 Investment Agreement, dated March 22, 2017, between Superior Industries International, Inc., andTPG Growth III Sidewall, L.P. (Incorporated by reference to Exhibit 10.2 of the Registrant’sCurrent Report on Form 8-K filed March 24, 2017).
10.23 Credit Agreement, dated March 22, 2017, among Superior Industries International, Inc., Citibank,N.A., as Administrative Agent, and the Lenders party thereto.*** (Incorporated by reference toExhibit 10.3 of the Registrant’s Current Report on Form 8-K filed March 24, 2017).
10.24 First Amendment to Credit Agreement, dated May 23, 2017, among Superior IndustriesInternational, Inc., the subsidiaries of Superior identified therein, Citibank, N.A., as AdministrativeAgent, and the Lenders party thereto. (Incorporated by reference to Exhibit 10.1 of the Registrant’sCurrent Report on Form 8-K filed June 20, 2017).
10.25 Second Amendment to Credit Agreement, dated May 31, 2017, among Superior IndustriesInternational, Inc., the subsidiaries of Superior identified therein, Citibank, N.A., as AdministrativeAgent, and the Lenders party thereto. (Incorporated by reference to Exhibit 10.2 of the Registrant’sCurrent Report on Form 8-K filed June 20, 2017).
10.26 Third Amendment to Credit Agreement, dated June 15, 2017, among Superior IndustriesInternational, Inc., the subsidiaries of Superior identified therein, Citibank, N.A., as AdministrativeAgent, and the Lenders party thereto. (Incorporated by reference to Exhibit 10.3 of the Registrant’sCurrent Report on Form 8-K filed June 20, 2017).
10.27 Bridge Credit Agreement, dated March 22, 2017, among Superior Industries International, Inc.,Citibank, N.A., as Administrative Agent, and the Lenders party thereto.*** (Incorporated byreference to Exhibit 10.4 of the Registrant’s Current Report on Form 8-K filed March 24, 2017).
10.28 Investor Rights Agreement, dated as of May 22, 2017, by and between Superior IndustriesInternational, Inc. and TPG Growth III Sidewall, L.P. (Incorporated by reference to Exhibit 10.1 tothe Registrant’s Current Report on Form 8-K filed May 26, 2017).
10.29 Separation Agreement, dated June 30, 2017, between Superior Industries International, Inc. andKerry Shiba * (Incorporated by reference to Exhibit 10.1 to the Registrant’s Current Report onForm 8-K filed June 30, 2017).
10.30 Offer Letter of Employment, dated April 18, 2017, between Superior Industries International Inc.and Nadeem Moiz * (Incorporated by reference to Exhibit 10.1 to the Registrant’s QuarterlyReport on Form 10-Q filed August 4, 2017).
10.31 Offer Letter of Employment, dated April 28, 2017 between Superior Industries International, Inc.and Robert Tykal * (Incorporated by reference to Exhibit 10.1 to the Registrant’s Quarterly Reporton Form 10-Q filed November 13, 2017).
10.32 Offer Letter of Employment, dated July 28, 2017 between Superior Industries International, Inc.and Joanne Finnorn * (Incorporated by reference to Exhibit 10.2 to the Registrant’s QuarterlyReport on Form 10-Q filed November 13, 2017).
10.34 English Translation of the Domination and Profit Transfer Agreement between Superior IndustriesInternational Germany AG and UNIWHEELS AG, dated December 5, 2017 (Incorporated byreference to Exhibit 10.1 to the Registrant’s Current Report on Form 8-K filed December 11,2017).
108

11 Computation of Earnings Per Share (contained in Note 1 – Summary of Significant AccountingPolicies in the Notes to Consolidated Financial Statements in Item 8 – Financial Statements andSupplementary Data of this Annual Report on Form 10-K).
21 List of Subsidiaries of the Company.**
23 Consent of Deloitte and Touche LLP, our Independent Registered Public Accounting Firm.**
31.1 Chief Executive Officer Certification Pursuant to 18 U.S.C. Section 1350, as Adopted Pursuant toSection 302(a) of the Sarbanes-Oxley Act of 2002.**
31.2 Chief Financial Officer Certification Pursuant to 18 U.S.C. Section 1350, as Adopted Pursuant toSection 302(a) of the Sarbanes-Oxley Act of 2002.**
32.1 Certification of Donald J. Stebbins, Chief Executive Officer and President, and Nadeem Moiz,Executive Vice President and Chief Financial Officer, Pursuant to 18 U.S.C. Section 1350, asAdopted Pursuant to Section 906 of the Sarbanes-Oxley Act of 2002 (furnished herewith).
101.INS XBRL Instance Document.****
101.SCH XBRL Taxonomy Extension Schema Document.****
101.CAL XBRL Taxonomy Extension Calculation Linkbase Document.****
101.LAB XBRL Taxonomy Extension Label Linkbase Document.****
101.PRE XBRL Taxonomy Extension Presentation Linkbase Document.****
101.DEF XBRL Taxonomy Extension Definition Linkbase Document.****
* Indicates management contract or compensatory plan or arrangement.** Filed herewith.*** Certain schedules and exhibits to this agreement have been omitted in accordance with Item 601(b)(2) of
Regulation S-K. A copy of any omitted schedule or exhibit will be furnished supplementally to theSecurities and Exchange Commission upon request.
**** Submitted electronically with the report.
109

SUPERIOR INDUSTRIES INTERNATIONAL, INC.ANNUAL REPORT ON FORM 10-K
Schedule II
VALUATION AND QUALIFYING ACCOUNTSFOR THE YEARS ENDED DECEMBER 31, 2017, 2016 AND 2015
(Dollars in thousands)
Additions
Balanceat
Beginningof
Year
Chargeto
Costsand
Expenses Other
DeductionsFrom
Reserves
Balanceat
End ofYear
2017Allowance for doubtful accounts receivable . . . . . . . . . . . . . . $ 919 $1,127 $1,162 $ (883) $2,325Valuation allowances for deferred tax assets . . . . . . . . . . . . . $3,123 $1,005 $3,506 — $7,6342016Allowance for doubtful accounts receivable . . . . . . . . . . . . . . $ 867 $ 403 $ — $ (351) $ 919Valuation allowances for deferred tax assets . . . . . . . . . . . . . $5,891 $ 698 $ — $(3,466) $3,1232015Allowance for doubtful accounts receivable . . . . . . . . . . . . . . $ 514 $ 380 $ — $ (27) $ 867Valuation allowances for deferred tax assets . . . . . . . . . . . . . $3,911 $1,980 $ — $ — $5,891
110

SUPERIOR INDUSTRIES INTERNATIONAL, INC.ANNUAL REPORT ON FORM 10-K
SIGNATURES
Pursuant to the requirements of Section 13 or 15(d) of the Securities Exchange Act of 1934, the Registranthas duly caused this report to be signed on its behalf by the undersigned, thereunto duly authorized.
SUPERIOR INDUSTRIES INTERNATIONAL, INC.(Registrant)
By /s/ Donald J. Stebbins March 15, 2018
Donald J. StebbinsChief Executive Officer and President
Pursuant to the requirements of the Securities Exchange Act of 1934, this report has been signed below bythe following persons on behalf of the registrant and in the capacity and on the dates indicated.
/s/ Donald J. Stebbins
Donald J. Stebbins
Chief Executive Officer andPresident (Principal Executive
Officer)
March 15, 2018
/s/ Nadeem Moiz
Nadeem Moiz
Executive Vice President and ChiefFinancial Officer (Principal
Financial Officer)
March 15, 2018
/s/ Scot S. Bowie
Scot S. Bowie
Vice President and CorporateController (Principal Accounting
Officer)
March 15, 2018
/s/ Michael R. Bruynesteyn
Michael R. Bruynesteyn
Director March 15, 2018
/s/ Jack A. Hockema
Jack A. Hockema
Director March 15, 2018
/s/ Paul J. Humphries
Paul J. Humphries
Director March 15, 2018
/s/ James S. McElya
James S. McElya
Director March 15, 2018
/s/ Timothy C. McQuay
Timothy C. McQuay
Director March 15, 2018
/s/ Ellen B. Richstone
Ellen B. Richstone
Director March 15, 2018
/s/ Francisco S. Uranga
Francisco S. Uranga
Director March 15, 2018
/s/ Ransom A. Langford
Ransom A. Langford
Director March 15, 2018
111

EXHIBIT 21
LIST OF SUBSIDIARIES AS OF DECEMBER 31, 2017
Name of Subsidiaries Jurisdiction of Incorporation
ATS Leichtmetallräder GmbH Germany
SIIP Holdings, LLC Delaware, U.S.A.
Superior Industries International Arkansas, LLC Delaware, U.S.A.
Superior Industries International Asset Management, LLC Delaware, U.S.A.
Superior Industries International Cyprus Limited Nicosia, Cyprus
Superior Industries International (Dutch) B.V. The Netherlands
Superior Industries International Germany AG Germany
Superior Industries International Holdings, LLC Delaware, U.S.A.
Superior Industries International (Ireland) Limited Ireland
Superior Industries International Michigan, LLC Delaware, U.S.A.
Superior Industries International Netherlands B.V. The Netherlands
Superior Industries International Production S.R.L. Costa Rica
Superior Industries de Mexico, S. de R.L. de C.V. Chihuahua, Mexico
Superior Industries North America, S. de R.L. de C.V. Chihuahua, Mexico
Superior Industries Trading de Mexico, S. de R.L. de C.V. Chihuahua, Mexico
Superior Shared Services S. de R.L. de C.V. Chihuahua, Mexico
Uniwheels AG Germany
Uniwheels Automotive (Germany) GmbH Germany
Uniwheels Investment (Germany) GmbH Germany
Uniwheels Leichtmetallräder (Germany) GmbH Germany
Uniwheels OEM (Germany) GmbH Germany
Uniwheels Production (Poland) Sp.zo.o. Poland
Uniwheels Production (Germany) GmbH Germany
Uniwheels Trading (Sweden) AB Sweden
Exhibit 23
CONSENT OF INDEPENDENT REGISTERED PUBLIC ACCOUNTING FIRM
We consent to the incorporation by reference in Registration Statements No. 333-52211, 333-107380, and 333-155258 on Form S-8 of our report dated
March 15, 2018, relating to the consolidated financial statements and financial statement schedule of Superior Industries International, Inc. (the
“Company”), and the effectiveness of the Company’s internal control over financial reporting appearing in this Annual Report on Form 10-K of the
Company for the year ended December 31, 2017.
/s/ Deloitte & Touche LLP
Detroit, Michigan
March 15, 2018

EXHIBIT 31.1
CERTIFICATION
PURSUANT TO EXCHANGE ACT RULES 13a-14(a) AND 15d-14(a),
AS ADOPTED PURSUANT TO
SECTION 302(a) OF THE SARBANES-OXLEY ACT OF 2002
I, Donald J. Stebbins, certify that:
1 I have reviewed this Annual Report on Form 10-K of Superior Industries International, Inc.;
2 Based on my knowledge, this report does not contain any untrue statement of a material fact or omit to state a material fact necessary to make the
statements made, in light of the circumstances under which such statements were made, not misleading with respect to the period covered by this
report;
3 Based on my knowledge, the financial statements, and other financial information included in this report, fairly present in all material respects the
financial condition, results of operations and cash flows of the registrant as of, and for, the periods presented in this report;
4 The registrant’s other certifying officer and I are responsible for establishing and maintaining disclosure controls and procedures (as defined in
Exchange Act Rules 13a-15(e) and 15d-15(e)) and internal control over financial reporting (as defined in Exchange Act Rules 13a-15(f) and
15d-15(f)) for the registrant and have:
a) Designed such disclosure controls and procedures, or caused such disclosure controls and procedures to be designed under our supervision,
to ensure that material information relating to the registrant, including its consolidated subsidiaries, is made known to us by others within
those entities, particularly during the period in which this report is being prepared;
b) Designed such internal control over financial reporting or caused such internal control over financial reporting to be designed under our
supervision, to provide reasonable assurance regarding the reliability of financial reporting and the preparation of financial statements for
external purposes in accordance with generally accepted accounting principles;
c) Evaluated the effectiveness of the registrant’s disclosure controls and procedures and presented in this report our conclusions about the
effectiveness of the disclosure controls and procedures as of the end of the period covered by the report based on such evaluation; and
d) Disclosed in this report any change in the registrant’s internal control over financial reporting that occurred during the registrant’s most
recent fiscal quarter (the registrant’s fourth fiscal quarter in the case of an annual report) that has materially affected, or is reasonably likely
to materially affect, the registrant’s internal control over financial reporting; and
5 The registrant’s other certifying officer and I have disclosed, based on our most recent evaluation of internal control over financial reporting, to
the registrant’s auditors and the audit committee of the registrant’s board of directors (or persons performing the equivalent functions):
a) All significant deficiencies and material weaknesses in the design or operation of internal control over financial reporting which are
reasonably likely to adversely affect the registrant’s ability to record, process, summarize and report financial information; and
b) Any fraud, whether or not material, that involves management or other employees who have a significant role in the registrant’s internal
control over financial reporting.
Date: March 15, 2018 /s/ Donald J. Stebbins
Donald J. Stebbins
Chief Executive Officer and President

EXHIBIT 31.2
CERTIFICATION
PURSUANT TO EXCHANGE ACT RULES 13a-14(a) AND 15d-14(a),
AS ADOPTED PURSUANT TO
SECTION 302(a) OF THE SARBANES-OXLEY ACT OF 2002
I, Nadeem Moiz, certify that:
1 I have reviewed this Annual Report on Form 10-K of Superior Industries International, Inc.;
2 Based on my knowledge, this report does not contain any untrue statement of a material fact or omit to state a material fact necessary to make the
statements made, in light of the circumstances under which such statements were made, not misleading with respect to the period covered by this
report;
3 Based on my knowledge, the financial statements, and other financial information included in this report, fairly present in all material respects the
financial condition, results of operations and cash flows of the registrant as of, and for, the periods presented in this report;
4 The registrant’s other certifying officer and I are responsible for establishing and maintaining disclosure controls and procedures (as defined in
Exchange Act Rules 13a-15(e) and 15d-15(e)) and internal control over financial reporting (as defined in Exchange Act Rules 13a-15(f) and
15d-15(f)) for the registrant and have:
a) Designed such disclosure controls and procedures, or caused such disclosure controls and procedures to be designed under our supervision,
to ensure that material information relating to the registrant, including its consolidated subsidiaries, is made known to us by others within
those entities, particularly during the period in which this report is being prepared;
b) Designed such internal control over financial reporting or caused such internal control over financial reporting to be designed under our
supervision, to provide reasonable assurance regarding the reliability of financial reporting and the preparation of financial statements for
external purposes in accordance with generally accepted accounting principles;
c) Evaluated the effectiveness of the registrant’s disclosure controls and procedures and presented in this report our conclusions about the
effectiveness of the disclosure controls and procedures as of the end of the period covered by the report based on such evaluation; and
d) Disclosed in this report any change in the registrant’s internal control over financial reporting that occurred during the registrant’s most
recent fiscal quarter (the registrant’s fourth fiscal quarter in the case of an annual report) that has materially affected, or is reasonably likely
to materially affect, the registrant’s internal control over financial reporting; and
5 The registrant’s other certifying officer and I have disclosed, based on our most recent evaluation of internal control over financial reporting, to
the registrant’s auditors and the audit committee of the registrant’s board of directors (or persons performing the equivalent functions):
a) All significant deficiencies and material weaknesses in the design or operation of internal control over financial reporting which are
reasonably likely to adversely affect the registrant’s ability to record, process, summarize and report financial information; and
b) Any fraud, whether or not material, that involves management or other employees who have a significant role in the registrant’s internal
control over financial reporting.
Date: March 15, 2018 /s/ Nadeem Moiz
Nadeem Moiz
Executive Vice President and Chief Financial Officer

EXHIBIT 32.1
CERTIFICATION PURSUANT TO
18 U.S.C. SECTION 1350,
AS ADOPTED PURSUANT TO
SECTION 906 OF THE SARBANES-OXLEY ACT OF 2002
Each of the undersigned hereby certifies, in his capacity as an officer of Superior Industries International, Inc. (the “company”), for purposes of 18
U.S.C . Section 1350, as adopted pursuant to Section 906 of the Sarbanes-Oxley Act of 2002, that to the best of his knowledge:
• The Annual Report of the company on Form 10-K for the period ended December 31, 2017 as filed with the Securities and Exchange
Commission fully complies with the requirements of Section 13(a) or Section 15(d), as applicable, of the Securities Exchange Act of 1934,
as amended; and
• The information contained in such report fairly presents, in all material respects, the financial condition and results of operations of the
company.
Dated: March 15, 2018 /s/ Donald J. Stebbins
Name: Donald J. Stebbins
Title: Chief Executive Officer and President
/s/ Nadeem Moiz
Name: Nadeem Moiz
Title: Executive Vice President and Chief Financial Officer

This page left blank intentionally.

DIRECTORS
Timothy C. McQuayChairman of the Board
Michael R. BruynesteynAudit CommitteeNominating and Corporate Governance Committee
Jack A. HockemaAudit CommitteeNominating and Corporate Governance Committee*
Paul J. HumphriesAudit CommitteeCompensation and Benefits Committee
Ransom A. LangfordCompensation and Benefits Committee
James S. McElyaCompensation and Benefits Committee*Nominating and Corporate Governance Committee
Ellen B. RichstoneAudit Committee*Nominating and Corporate Governance Committee
Donald J. StebbinsPresident and Chief Executive Officer
Francisco S. UrangaCompensation and Benefits CommitteeNominating and Corporate Governance Committee
* Committee Chair Effective March 8, 2018, Timothy McQuay was appointed as Chair of the Nominating and Corporate Governance Committee.
EXECUTIVES
Donald J. StebbinsPresident andChief Executive Officer
Nadeem MoizExecutive Vice President –Chief Financial Officer
Joanne FinnornSenior Vice President –General Counsel and Corporate Secretary
Dr. Wolfgang HillerSenior Vice President – European Operations, Aftermarket
Parveen KakarSenior Vice President – Sales, Marketing and Product Development
Dr. Karsten ObenausSenior Vice President –Chief Financial Officer Europe
Shawn PallagiSenior Vice President – Chief Human Resources Officer
James F. SistekSenior Vice President –Business Operations
Rob TykalSenior Vice President –North American Operations
INVESTOR RELATIONSSuperior IndustriesTroy Ford(248) [email protected]
REGISTRAR AND TRANSFER COMPANYShareholder correspondenceshould be mailed to:ComputershareP.O. Box 505000Louisville, KY 40233
Overnight correspondence shouldbe sent to:Computershare462 South 4th Street, Suite 1600Louisville, KY 40202
Shareholder website:www.computershare.com/investor
Shareholder online inquiries:https://wwwus.computershare.com/investor/Contact
Toll free in the US + 1 (800) 368-5948Outside the US + (781) 575-4223Fax (866) 519-2854
ANNUAL MEETINGThe annual meeting of SuperiorIndustries International, Inc. will beheld at 10:00 a.m. Eastern Time on May 7, 2018 at:
Superior Industries International26600 Telegraph Rd.Southfield, MI 48033
STOCK EXCHANGESuperior common stock is listed for trading on the New York Stock Exchange under the ticker symbol SUP.
AUDITORSDeloitte & Touche LLP
CORPORATE INFORMATION
CORPORATE OFFICES Superior Industries International, Inc.26600 Telegraph Rd.Suite 400Southfield, MI 48033Phone: 248.352.7300Fax:248.352.6989www.supind.com

26600 Telegraph Rd.Suite 400Southfield, MI 48033248.352.7300
NYSE: SUPwww.supind.com