Minda Industries
45
Share price (%) 1 mth 3 mth 12 mth Absolute performance 0.3 20.6 1.8 Relative to Nifty (5.7) 8.6 (4.2) Shareholding Pattern (%) Mar-20 Sep-20 Promoter 70.8 70.9 Public 29.2 29.1 Scenario Analysis Bear case Base case Bull case Console Rev CAGR FY20- FY23 (%) 12.0 15.0 17.0 FY23E EBIDTA Margins (%) 12.0 12.6 13.0 FY23E EPS (Rs.) 12.6 15.3 17.4 Target P/E mutiple (x) 25 30 35 TP (Rs.) 315 460 610 1 Year Stock Price Performance Note: * CMP as on 10 November 2020 Multiple Growth Drivers Justify Premium Valuation Financial Summary Y/E Mar (Rs.mn) FY19 FY20E FY21E FY22E FY23E Net Sales 59,081 54,651 56,522 74,322 83,340 EBITDA 7,252 6,192 5,244 9,043 10,536 EBITDA margin (%) 12.3 11.3 9.3 12.2 12.6 EPS(Rs.) 10.9 6.3 2.1 11.5 15.3 RoE (%) 18.2 9.3 3.0 14.4 16.7 P/E (x) 31.1 54.0 161.8 29.5 22.1 Source: Company, RSec Research f Minda Industries Ltd. (MNDA) is well-diversified auto ancillary company in Indian auto component space with strong presence in lighting, switching, horn and light weight products segments for domestic as well as global original equipment manufacturers (OEMs). f MNDA enjoys leadership in 4W and 2W switches segment with 55% and 65% market share, respectively. It is also the leader in domestic horn segment with ~47% market share, while it has decent presence in lighting segment with ~22% market share. f Its core i.e. switches, lighting and acoustic businesses contribute 37%, 23%, 12% (combined 72%) to its consolidated revenue. Newer product lines comprising of alloy wheels, aluminium die casting, sensors/controllers, which account for the balance 28% of consolidated sales are the real growth drivers, going ahead. It has the largest installed 4W alloy wheel capacity in India and recently started production of 2W alloy wheels. f Newly launched products i.e. Advance Driver Assistance System (ADAS), airbags, filters, sensors and upcoming product lines would help MNDA to outperform the industry despite the current tough time. Incremental revenue from Harita Seating business, addition of sensor plant in FY21, filter business and 2W alloy wheel plant would help the company to improve its revenue over the next 2 years. f Presence across various key product segments of ancillary, new product addition, acquisition of new product segment and technological up-gradation justify premium valuation. ESG Analysis: While analyzing 20 key criteria under ESG Matrix, we have assigned an overall score of 65% to MNDA. Under “Environmental Head”, we have assigned 56% score, as it has sizable power generation through non-conventional (wind and solar) energy sources and various energy efficiency initiative. Under “Social Head”, we have assigned 66% score, as the company scores high on customer satisfaction, despite scoring low on gender diversity. Under “Governance Head”, the company scores fairly well (73%) across criteria (please refer to page no 4. for detailed ESG analysis). Outlook & Valuation Strong rebound in automobile production post a major slump would be key driver for earnings revival, in our view. Moreover higher content, value addition on the back of premiumization, entry into new high-margin segments would be key triggers for MNDA’s earnings and valuation re-rating, going forward. Its consolidated revenue is likely to clock 15% CAGR over FY20-FY23E, while its earnings would clock 35% CAGR over the same period. Considering the multiple positive triggers on revenue and margin front from long-term perspective, we expect the stock’s valuation to steadily move towards the industry’s peak multiple. In light of outperformance despite COVID-led uncertainty and faster-than-expected recovery of auto industry, we initiate coverage on MNDA with BUY and a 2-year Target Price of Rs460, valuing the stock at 30x FY23E EPS), which implies >35% upside from the current level. Head of Research: Mitul Shah Contact: (022) 4303 4628 / 9869253554 Email: [email protected] Research Associate: Sheryl Fernandes Contact: (022) 4303 4628 / 8879415031 Email: [email protected] Click Image for Video Presentation Minda Industries CMP (Rs)* 339 Upside/(Downside) (%) 36 Bloomberg Ticker MNDA IN Market Cap. (Rs bn) 92 Free Float (%) 29 Shares O/S (mn) 272 Automobile | India Institutional Equity Research Initiating Coverage | 11 November 2020 BUY Key Triggers Sustained outperformance with value addition and continued portfolio expansion Premiumization and favourable regulation to expand value-added product offerings Expected strong recovery in 2HFY21E and FY22E Expanding product portfolio and inorganic expansion Valuation expansion to continue for such conglomerates of key auto ancillary segments 2 Year Target Price: Rs.460 We have made changes to our Recommendation and Target Price. Please refer to Page no. 44 at the end of the report. 200 250 300 350 400 450 Nov-19 Dec-19 Jan-20 Feb-20 Mar-20 Apr-20 May-20 Jun-20 Jul-20 Aug-20 Sep-20 Oct-20 Nov-20
-
Upload
khangminh22 -
Category
Documents
-
view
6 -
download
0
Transcript of Minda Industries

Share price (%) 1 mth 3 mth 12 mth
Absolute performance 0.3 20.6 1.8
Relative to Nifty (5.7) 8.6 (4.2)
Shareholding Pattern (%) Mar-20 Sep-20
Promoter 70.8 70.9
Public 29.2 29.1
Scenario Analysis Bear case
Base case
Bull case
Console Rev CAGR FY20-FY23 (%)
12.0 15.0 17.0
FY23E EBIDTA Margins (%) 12.0 12.6 13.0
FY23E EPS (Rs.) 12.6 15.3 17.4
Target P/E mutiple (x) 25 30 35
TP (Rs.) 315 460 610
1 Year Stock Price Performance
Note: * CMP as on 10 November 2020
Multiple Growth Drivers Justify Premium Valuation
Financial Summary Y/E Mar (Rs.mn)
FY19 FY20E FY21E FY22E FY23E
Net Sales 59,081 54,651 56,522 74,322 83,340EBITDA 7,252 6,192 5,244 9,043 10,536EBITDA margin (%) 12.3 11.3 9.3 12.2 12.6EPS(Rs.) 10.9 6.3 2.1 11.5 15.3RoE (%) 18.2 9.3 3.0 14.4 16.7P/E (x) 31.1 54.0 161.8 29.5 22.1Source: Company, RSec Research
f Minda Industries Ltd. (MNDA) is well-diversified auto ancillary company in Indian auto component space with strong presence in lighting, switching, horn and light weight products segments for domestic as well as global original equipment manufacturers (OEMs).
f MNDA enjoys leadership in 4W and 2W switches segment with 55% and 65% market share, respectively. It is also the leader in domestic horn segment with ~47% market share, while it has decent presence in lighting segment with ~22% market share.
f Its core i.e. switches, lighting and acoustic businesses contribute 37%, 23%, 12% (combined 72%) to its consolidated revenue. Newer product lines comprising of alloy wheels, aluminium die casting, sensors/controllers, which account for the balance 28% of consolidated sales are the real growth drivers, going ahead. It has the largest installed 4W alloy wheel capacity in India and recently started production of 2W alloy wheels.
f Newly launched products i.e. Advance Driver Assistance System (ADAS), airbags, filters, sensors and upcoming product lines would help MNDA to outperform the industry despite the current tough time. Incremental revenue from Harita Seating business, addition of sensor plant in FY21, filter business and 2W alloy wheel plant would help the company to improve its revenue over the next 2 years.
f Presence across various key product segments of ancillary, new product addition, acquisition of new product segment and technological up-gradation justify premium valuation.
ESG Analysis: While analyzing 20 key criteria under ESG Matrix, we have assigned an overall score of 65% to MNDA. Under “Environmental Head”, we have assigned 56% score, as it has sizable power generation through non-conventional (wind and solar) energy sources and various energy efficiency initiative. Under “Social Head”, we have assigned 66% score, as the company scores high on customer satisfaction, despite scoring low on gender diversity. Under “Governance Head”, the company scores fairly well (73%) across criteria (please refer to page no 4. for detailed ESG analysis).
Outlook & ValuationStrong rebound in automobile production post a major slump would be key driver for earnings revival, in our view. Moreover higher content, value addition on the back of premiumization, entry into new high-margin segments would be key triggers for MNDA’s earnings and valuation re-rating, going forward. Its consolidated revenue is likely to clock 15% CAGR over FY20-FY23E, while its earnings would clock 35% CAGR over the same period. Considering the multiple positive triggers on revenue and margin front from long-term perspective, we expect the stock’s valuation to steadily move towards the industry’s peak multiple. In light of outperformance despite COVID-led uncertainty and faster-than-expected recovery of auto industry, we initiate coverage on MNDA with BUY and a 2-year Target Price of Rs460, valuing the stock at 30x FY23E EPS), which implies >35% upside from the current level.
Head of Research: Mitul Shah
Contact: (022) 4303 4628 / 9869253554Email: [email protected]
Research Associate:Sheryl Fernandes
Contact: (022) 4303 4628 / 8879415031Email: [email protected]
Click Image for Video Presentation
Minda Industries CMP (Rs)* 339
Upside/(Downside) (%) 36
Bloomberg Ticker MNDA IN
Market Cap. (Rs bn) 92
Free Float (%) 29
Shares O/S (mn) 272
Automobile | India
Institutional Equity Research
Initiating Coverage | 11 November 2020
BUY
Key Triggers Sustained outperformance with value addition and continued portfolio expansion
Premiumization and favourable regulation to expand value-added product offerings
Expected strong recovery in 2HFY21E and FY22E
Expanding product portfolio and inorganic expansion
Valuation expansion to continue for such conglomerates of key auto ancillary segments
2 Year Target Price: Rs.460
We have made changes to our Recommendation and Target Price. Please refer to Page no. 44 at the end of the report.
200
250
300
350
400
450
Nov
-19
Dec
-19
Jan-
20
Feb
-20
Ma
r-20
Ap
r-20
Ma
y-20
Jun-
20
Jul-2
0
Aug
-20
Sep
-20
Oct
-20
Nov
-20

1
Our ThesisOur Thesis
Key Investment Theme
Key Sectoral Theme
f Domestic 2W & 4W Industry: After sharp plunge due to COVID-19, we expect domestic 2W and PV industry to record CAGR of 16% and 17% over FY21-FY23E, post recording decline of 12% and 7.5% YoY in FY21E, respectively.
f Premiumization & Favourable Regulation: Trend of higher sales of entry-level vehicles during the ongoing pandemic would reverse soon and trend of premiumization would reestablish across vehicle and component segments in terms of value addition. Further, the government regulation has been warranting many new components to be mandatorily fitted in the vehicles.
f Fuel Efficiency & Light Weighting: In order to meet the emission norms and have better fuel efficiency, every OEM is in the race of reducing overall weight of the vehicle by maximizing usage of light weight components.
f After Market Opportunities: In past few years, after market segment has witnessed strong traction for the branded components, particularly post GST implementation, which eliminated many small players from the system.
f Strong Outperformance vs. Industry: MNDA recorded 21% revenue CAGR as against domestic 2W and 4W industry growth of 2% and 1% over FY15-FY20. We expect similar outperformance to continue, going forward on account of value addition and increasing content per vehicle.
f Higher Content & New Products to Drive Profitability: Premiumization trend and favourable regulation would not only drive the revenue but also would expand margin due to entry into high-margin light weight components segment. This would drive 38% earning CAGR over FY21-FY23E.
f New Segment & Aftermarket Business: To mitigate the concentration risk, MNDA has entered into light weight components segment, which has been witnessing strong traction over the years. Further, it entered into new segment through acquisition (Harita Seating). With increasing focus, its aftermarket business is also expected to witness double-digit growth over next 2 years.
Key Risks
f Delayed economic recovery from COVID-led slowdown
f Delayed recovery of domestic and global PV/2W industry
f Pricing pressure from the OEMs
f Split in JVs and/or technology tie-ups with global partners
f Sharp rise in commodity prices
f Adverse government regulation
2
EPS & Target Price
Source: Company, RSec Research
Price Sensitivity AnalysisEPS (Rs) Growth (%) FWD P/E 27.5 30.0 32.5 35.0
FY17 (-3) 6.5 49.3 178 195 211 227
FY18 (-2) 10.7 65.2 29.9 295 322 348 375
FY19 (-1) 10.9 1.6 29.4 299 327 354 381
FY20E (Base Year) 6.3 -42.3 51.0 173 188 204 220
FY21E (Year 1) 2.1 -66.6 152.4 58 63 68 74
FY22E (Year 2) 11.5 447.6 27.8 316 345 374 403
FY23E (Year 3) 15.3 33.2 20.9 421 460 498 536
Source: Company, RSec Research
6.5
10.7 10.9
6.3
2.1
11.5
15.3
195
322 327
188
63
345
460
-
50
100
150
200
250
300
350
400
450
500
-
2.0
4.0
6.0
8.0
10.0
12.0
14.0
16.0
18.0
FY17 (-3) FY18 (-2) FY19 (-1) FY20E (Base Year)
FY21E (Year 1) FY22E (Year 2) FY23E (Year 3)
EPS (Rs) Target price
Scenario AnalysisRevenue & Margin Sensitivity on Consolidated Earnings
Bear case Base case Bull case
Console Rev CAGR FY20-FY23 (%) 12.0 15.0 17.0
FY23E EBIDTA Margins (%) 12.0 12.6 13.0
FY23E EPS (Rs.) 12.6 15.3 17.4
Source: Company, Rsec Research
Base Case Scenario: In Base Case scenario, we expect MNDA’s revenue to clock 15% CAGR over FY20-FY23E assuming marginally higher growth from new product segment, while FY23E EBITDA margin is pegged at 12.6%. Assigning 30x P/E multiple to its FY23E EPS of Rs15.32, we arrive at a Target Price of Rs460.
Bull Case Scenario: In Bull Case scenario, we expect MNDA’s revenue to clock 17% CAGR over FY20-FY23E with higher growth in OEM production and strong growth in its new product segments, while FY23E EBITDA margin is pegged at 13%. Assigning 35x P/E multiple to its FY23E EPS of Rs17.44, we arrive at a Fair Value of Rs610.
Bear Case Scenario: In Bear Case scenario, we expect MNDA’s revenue to clock 12% CAGR over FY20-FY23E with lower growth in OEM production and lower traction from new product segment, while FY23E EBITDA margin is pegged at 12%. Assigning 25x P/E multiple to its FY23E EPS of Rs12.6, we arrive at a Fair Value of Rs315, which is more or less around CMP, making risk reward favourable for the company.
Price Target Scenario
Target Price (Rs) FY23E EPS Down-Cycle Target Up-Cycle(Rs) Multiple Multiple Multiple
1 Yr Fwd P/E 25 30 35Bear case 12.61 315 378 441
Base case 15.32 383 460 536Bull case 17.44 436 523 610
Source: Company, Rsec Research

3
Key Criteria Score Risk Comments
Management Quality 7 Low The management is capable to manage tough situations across business segments; track record on guidance front has so far been fair
Promoter's Holding Pledge 9 Low Overall promoters’ holding is 71% with zero pledging
Board of Directors Profile 8 LowA perfect blend of experience, expertise and professionalism offers great comfort; MNDA’s total board strength is 7, consisting of 4 independent directors, 1 non-executive director and 2 executive directors
Industry Growth 8 Low Industry (2W and 4W) is expected to witness high double-digit growth over FY21-FY23E
Regulatory Environment / Risk 5 MediumDue to nature of business linked with the OEMs, MNDA has higher issue on environment and regulatory front; however, regulatory changes provide an opportunity for new products/content addition, which are beneficial from long-term perspective
Entry Barriers / Competition 6 Low Competition level is low due to entry barriers for high-quality products
New Business/Client Potential 8 Low The company has been consistently adding business segment as well as new clients; it has a decent potential of expansion through new products / clients
Business Diversification 7 LowBusiness is diversified into lighting, switch, acoustics, LMT and other segments (4W and 2W); it has also developed exports and aftermarket business along with OEM business
Market Share Potential 6 Low Over the years its market share improved gradually with likelihood of further market share gain, going forward
Margin Expansion Potential 7 Low Its margin is expected to contract by 200bps in FY21E and improve by 80bps and 40bps in FY22E and FY23E, respectively
Earning Growth 8 Low EPS is expected to clock 170% CAGR over FY21-23E compared to -33% CAGR over FY17-FY20
Balance Sheet Strength 6 Low Balance sheet is fair enough to manage the current challenging business situation despite some debt on book
Debt Profile 5 Medium Its Debt/Equity ratio is under control; net debt stood at ~Rs8bn as of Sept'20 end
FCF Generation/NWC 5 Medium FCF would remain negative for the next 2 years, while its FCF generation is seen at Rs2bn in FY23E
Dividend Policy 6 Low Though the company pays regular dividend, dividend yield is low; current dividend yield is 0.12%; average dividend payout ratio stood at ~8% over last 3 years
Total Score Out of 150 101
Average Score (%) 67% Low
Investment Decision Matrix (IDM)

4
Key Criteria Score Risk Comments
Environmental
Climate Change and Carbon Emission 3 HighAs MNDA is primarily into manufacturing of vehicle parts, it emits CO2 and creates air pollution, while the end-use of the finished products also emits huge CO2; however, the company has implemented several initiatives i.e. solar power/wind power across plants, which reduce CO2 emission by 65,928T; about 30% of power requirement is met through green/alternative energy
Air & Water Pollution 3 HighAs the company is in the business of manufacturing vehicle parts, it generates sizable pollution. To mitigate water and air pollution associated with its business, the company has waste and effluent treatment plants in place to reduce toxic /emission
Biodiversity 6 Low In its endeavour towards protecting biodiversity, MNDA planted 3,000 trees in FY20
Deforestation 5 MediumAs most of its plants are located in a remote industrial zone since many years, deforestation is not carried out in recent time; moreover it planted 3,000 trees in FY20; the company is constantly expanding its business across various locations including close to the forest areas, which may require deforestation in future
Energy Efficiency 6 LowMNDA has installed (1) 315 KWP solar plant and (2) transparent sheet on roof terrace of shop floor for optimum usage of sunlight during the day time; further, it plans to (1) replace diesel fired burners with PNG burners for powder coating; (2) replace old ACs with new inverter drive energy efficient ACs; and (3) install solar panel in 2022-23
Waste Management 6 LowIts business operations do not create any significant process waste; it recycles the reusable materials and responsibly discards non-usable materials as per applicable statutory provisions
Defence / Arms / Ammunition Exposure 10 Low No exposure to arms and ammunition space
Social
Customer Satisfaction 8 LowThe company is rated high on customer satisfaction in terms of quality, precision and technology; it received several awards from domestic and global OEMs; the company continues to be one of the most preferred auto ancillary suppliers for the OEMs
Data Protection & Privacy 8 Low The company maintains high level of data protection and privacy of customers’ data/details; it follows confidentiality policy
Gender & Diversity 8 Low Out of total 3,895 employees, ~1,050 are permanent women employees (~27%), which is one of the highest in the auto ancillary industry
Employee Engagement 7 LowThe company conducts various employee-engagement programmes i.e. safety training, skill up-gradation, and cultural activities to ensure an employee-friendly environment; it has recognized employee welfare association and union
Community Relations / Service 6 LowThe company is proactive in CSR activities to support community; it spent Rs30mn in FY20 towards CSR activities, which include education and vocational trainings
Human Rights 6 LowIt has proper human rights policy in place, which is applicable to all stakeholders and extended to all JV plants of the group; the stakeholders include: suppliers, contractors, consultants and outsourced employees besides employees and directors of the company
Labour Standard 3 HighThe company follows labour standards in terms of work place, facilities and employee benefits; though it has employee union at its plants, which is recognized by management but only ~4% of permanent employees are members of the recognized employee union, which is very low compared to peers
Environmental Social Governance Matrix (ESGM)
5
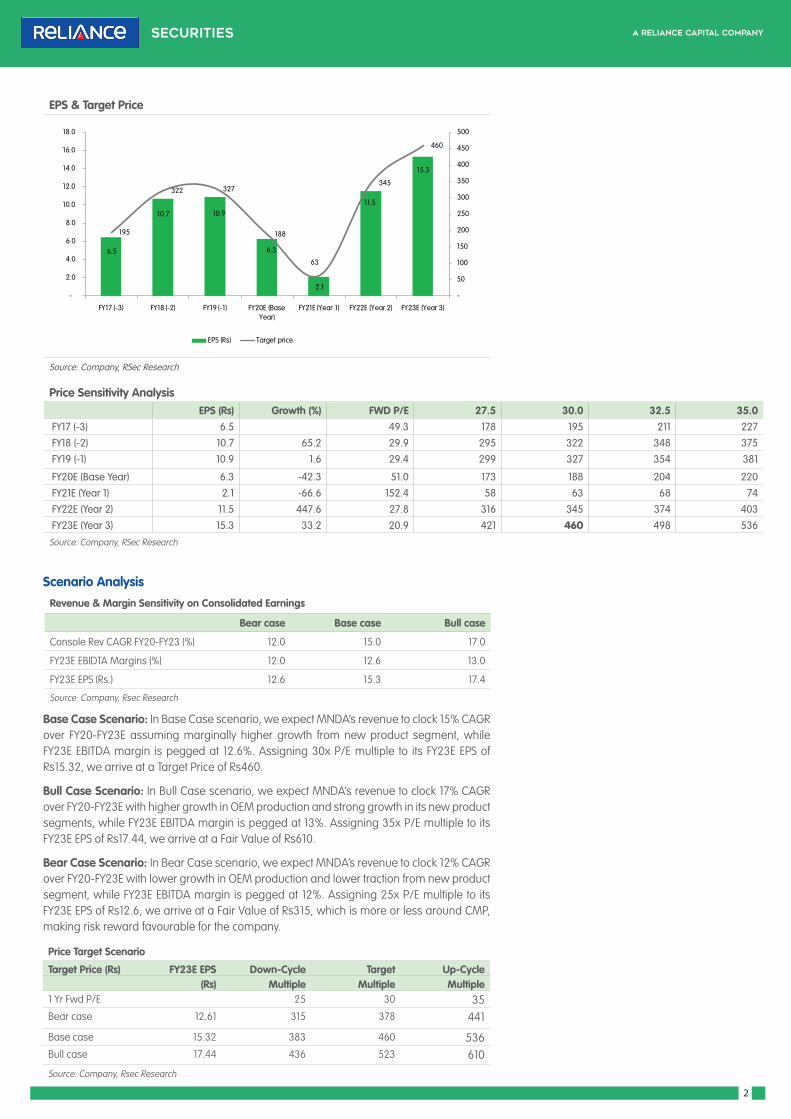
GovernanceAudit Committee Structure 5 Medium The audit committee comprises of 3 independent directors; all members of the committee have requisite expertise in financial management domain
Bribery & Corruption 7 LowThe company has an exhaustive code of conduct covering all aspects of ethical practices with emphasis on adoption of the highest standards of personal ethics, integrity, confidentiality and discipline, which is applicable to all stakeholders i.e. suppliers, customers, and subsidiaries etc.
Executive Compensation 7 Low Overall executive compensation is broadly in line with the industry standard, while chairman's compensation is on the lower side compared to peers
Lobbying 9 LowAs the company has excellent track record of the best manufacturing quality, it does not require any lobbying/similar tactics for business expansion; moreover, no carteling is observed in this industry
Political Contribution 8 Low No political connection is observed
Whistleblower Scheme 8 LowThe company has established a vigil mechanism / whistleblower policy to enable all stakeholders (including directors and employees) to report any unethical behaviour, actual/suspected fraud or violation of any code of conduct; the company affirms that no director/employee has ever been denied access to the chairman of the audit committee
Total Score Out of 200 129
Total Score (%) 65% Low
Score For < 5 Red High Risk For 5 Blue Medium Risk For > 5 Green Low Risk
Total Score (%) For < 50 Red High Risk For 50 Blue Medium Risk For > 50 Green Low Risk

6
Higher Automobile Production: Waning Impact of Covid-19 despite Rising Cases
As given in below table, deterioration due to COVID-led disruptions seems to be waning, as people have accepted it as routine phenomenon for the medium-term. It is visible from the fact that despite rising number of COVID-19 cases, monthly automobile vehicle production has been rising constantly, which almost reverted to pre-COVID-19 level in Aug’20. This also indicates that no further deterioration is expected, while other favourable economic factors like good monsoon, healthy agri output, higher MSP, strong rural economy, pent-up demand from urban markets and improving sentiment across regions would keep automobile volume momentum healthy, going forward.
New COVID cases per day in India
Source: World data
Monthly Production Trend - 2W
Source: SIAM
Monthly Production Trend - PV
Source: SIAM
-1.5
-1.0
-0.5
0.0
0.5
1.0
1.5
2.0
2.5
3.0
0
5,00,000
10,00,000
15,00,000
20,00,000
25,00,000
Sep-
19
Oct
-19
Nov
-19
Dec
-19
Jan-
20
Feb-
20
Mar
-20
Apr-
20
May
-20
Jun-
20
Jul-2
0
Aug-
20
Sep-
20
(%)
2W (unit) MoM growth (RHS)
-1.5
-1.0
-0.5
0.0
0.5
1.0
1.5
2.0
2.5
3.0
0
50,000
1,00,000
1,50,000
2,00,000
2,50,000
3,00,000
3,50,000
Sep-
19
Oct
-19
Nov
-19
Dec
-19
Jan-
20
Feb-
20
Mar
-20
Apr-
20
May
-20
Jun-
20
Jul-2
0
Aug-
20
Sep-
20
(%)
PV (unit) MoM growth (RHS)

7
Table of Key Fundamental Parameters
As indicated in above table, all fundamental factors relating to domestic industry would become favourable over next 2 years and would help MNDA in witnessing healthy earnings growth. This would transform into valuation expansion for the company, going forward.
Key Parameters (%) FY14 FY15 FY16 FY17 FY18 FY19 FY20 FY21E FY22E FY23E
Overall Automobile Sales Growth 4.0 6.6 3.2 7.1 14.5 5.3 -17.7 -12.6 25.2 10.0
Consolidated Rev. Growth 27.3 30.8 13.2 34.0 32.0 32.2 -7.5 3.4 31.5 12.1
PV Production Growth -4.9 4.8 7.6 9.7 5.8 0.2 -14.8 -8.0 25.0 9.0
2W Production Growth 7.2 9.5 1.8 5.9 16.2 5.8 -14.1 -12.0 22.0 10.0
Ratio of Mini-car/PV 21.3 18.9 17.6 16.8 15.1 12.4 9.7 11.0 10.0 11.0
Ratio of SUV/PV 18.4 19.5 20.7 23.9 27.2 27.3 32.8 37.0 37.0 37.0
Ratio of 125CC+ Bikes to total 2W 12.0 13.0 14.0 15.0 15.0 15.0 14.0 14.0 14.0 14.0
LMT Rev. Contribution NA NA NA NA 13.1 15.0 14.0 15.4 15.6 16.0
Acoustic Rev. Contribution 21.0 27.0 22.0 18.2 15.0 12.0 12.0 9.7 9.7 9.5
Consolidated EBIDTA Margin 4.6 6.9 9.4 11.0 11.9 12.3 11.3 9.3 12.2 12.6
Aftermarket Rev. Growth 15.0 25.0 17.4 3.4 11.3 13.7 -2.6 -5.0 30.0 18.0
RoE 2.1 16.3 25.2 21.3 22.7 18.2 9.3 3.0 14.4 16.7
RoCE 2.7 11.4 15.2 14.0 14.9 11.8 6.6 3.9 9.8 11.3
No of Positive Fundamental Parameters out of 13 2 4 6 8 9 10 6 5 13 13
1 Yr Fwd P/E (x) 77.4 9.1 4.7 15.4 9.9 29.4 50.9 152.7 27.8 20.9
Source: Company, Rsec Research NA: Not Available

8
Key Takeaways of Management Commentary
f Whilst MNDA’s domestic and overseas plants are fully operational, they are operating at utilization level of ~75% currently.
f The company commissioned 2 lines of its new projects i.e. 2W alloy wheel and BS-VI sensor in 2QFY21 and is likely to commission another 2 lines by FY21-end. The management foresees promising growth opportunities from these two businesses, going forward.
f Post successful acquisition in Dec’19, Delvis was consolidated for the full quarter in 4QFY20. The company received new orders from Daimler and Audi for its Delvis operations.
f In terms of other businesses, the company has started supply of wheel speed sensor for its Korean customers.
f The final NCLT hearing on merger of Harita Seating Systems is scheduled to be held on 16th Nov, 2020. Whilst all requisite approvals are in place, the merger was delayed due to the COVID-19 pandemic.
f The company received its first order for electronic horn from M&M for PV division. In 2W lighting space, it received new orders from Royal Enfield, E-bikes, TVS, Bajaj and Honda.
f It incurred ~Rs7bn capex in FY20 and plans to spend ~Rs2.5bn routine capex and Rs1.2-1.5bn for subsidiary and associate companies taking overall capex and investment to <Rs5bn in FY21E.

9
Channel CheckIndian PV Companies Management Commentaries/ViewMaruti Suzuki According to the management, the company witnessed a strong start of the festival season led by Onam and Ganesh Chaturthi
in August and positive on coming festivals. However, demand sustainability will depend on overall economic recovery as well as improvement in COVID scenario. It expects some down-trading due to fall in income. In PV segment, lower-end models continued to see the strongest demand, which suggest higher demand from rural areas and middle-class families. The company expects better traction, going forward on the back of rising personal mobility led by the need for social distancing. Enquiry levels and bookings for ongoing festivals are healthy.
Tata Motors As per the management, this year demand (bookings) is going to be significantly higher than last year. And this would be true for the industry, indicating very strong festive demand to kick in. The second big growth driver would be personal mobility, with cars and two-wheelers having gone up in the priority of discretionary spending of people. This will remain a priority purchase for a lot of households. The company expects this to be a sustainable trend for at least a year or so. It has also taken certain proactive actions since two months in anticipation of supply constraints and expects to ramp-up capacity to meet the demand.
M&M With 2-week delay in festive season this year, the company is gearing up to build inventory to meet the festive demand. The company gained market share in LCV segment and it is positive on tractors, SUVs and LCVs, going ahead. The company sees decent positive traction for on going festive season.
Toyota The company stated that there might be a good demand during the festive season particularly from Tier-I-II cities.
Hyundai The company anticipates a positive outlook for the festive season and expects increased demand for personal mobility amid the COVID-19 pandemic to further enhance sale prospects for passenger vehicle industry. In order to cater to the expected increase in demand, the company is ramping up production.
2 Wheeler Cos
Bajaj Auto As the supply chain continues to remain very fragile, the focus is on ramping up capacity and meeting demand. Currently, demand stands at ~90% level as compared to the same period last year.
Hero MotoCorp The company stated that the inquiries and call trends are very encouraging and they are confident of a good festive season. It also stated that semi-urban and urban also are catching up and this wave of growth is not going to end. It further indicated that the positivity would continue, going forward.
HMSI The company expects demand to improve during upcoming festive period, which will support retail sales further. Along with the pent-up demand, the company is seeing new customers who are moving away from public transport to personal mobility. Launch of couple of new products and upgrades from BS-IV to BS-VI have been helping the company to gain additional traction.
Source: Company

10
Comparative AnalysisMinda Industries Minda Corporation Varroc Engineering Motherson sumi Systems
Business Minda Industries is a leading multi-product auto ancillary with a diversified presence across industry segments and products. It primarily caters to 2W and PV segments. Its major product include: Switching, Lighting, Acoustics and Light Weight Products.
Minda Corporation is a diversified automotive components maker catering all automobile segments. Its product portfolio includes: Safety, Security, Restraint Systems, Plastic Interior Systems and Driver Information & Telematics Systems for auto OEMs across the globe.
Varroc is a global Tier-I automotive component group. It designs, manufactures and supplies exterior lighting systems, plastic/ polymer components, electrical-electronics components and precision metallic components. It caters primarily to PVs, CVs and 2Ws with some presence in off-highway vehicle OEMs.
Motherson Sumi Systems is a specialised full-system solutions provider. It caters to a diverse range of customers in automotive industries across Asia, Europe, North America, South America, Australia and Africa. The company primarily caters to PV segment. It has a strong presence in wiring harnesses, mirrors and plastics comprising cockpits, bumpers, interior trim.
Manufacturing Facilities
It has 62 manufacturing facilities globally.
It has 28 manufacturing facilities in India and 2 manufacturing facilities in South-East Asia.
It has 16 global manufacturing facilities and 26 manufacturing facilities for India business.
It has 41 new plants (16 Greenfield and 25 Brownfield)
Annual Turnover
Rs72bn (Group turnover), while MNDA’s turnover is Rs54.6bn
Rs28bn Rs23bn Rs626bn
Key Clients Bajaj Auto, BMW, Daimler, Hero MotoCorp, Audi, Honda Motorcycle and Scooter India, Hyundai, M&M, Maruti Suzuki, Suzuki Motorcycle, TVS Motor, Tata Motors, Volkswagen, Yamaha Motor and Renault etc.
Ashok Leyland, Bajaj Auto, CNH, Daimler, Hero MotoCorp, Honda Motorcycle and Scooter India, Hyundai, M&M, Maruti Suzuki, Suzuki Motorcycle, TVS Motor, Tata Motors, VE Commercial Vehicles, Volkswagen and Yamaha Motor etc.
Bajaj Auto, Honda, Royal Enfield, Yamaha and M&M etc.
Audi, Mercedes Benz, Volkswagen, Ford, BMW, Maruti Suzuki, Renault, Daimler, Hyundai, GM and Paccar etc.
Revenue Break-up
Switch: 37%Lightings: 23%Acoustics: 12%LMT: 14%Others: 14%
Mechatronics: 46.4%Information & Connected Systems: 33.5%Plastics & Interiors:20.1%
Lightings; 60.4%Polymer: 15.7%Electrical: 12%Metallic: 16.9%Others: 5%
Modules & Polymer Products:55%Wiring Harness: 25.3%Vision System: 19.4%Others: 0.3%
Specialty The company is aggressively progressing in new segments of LMT, sensors and controllers.
The company is a specialist in Mechatronics segment with strong presence in domestic and global markets.
The company is a specialist in lighting system with strong presence in domestic and global markets.
The company is a specialist in plastics / polymers and mirror segment in global markets, while it is the leader with strong presence in wiring harness in domestic markets.
Management The management is very strong and capable to manage uncertain situation.
The management’s capability is not as high as Minda Industries and past track record of guidance is also not very impressive.
The management is better than the average but not as strong as Minda Industries.
The management is very strong and capable to manage uncertain situation.
Financials (Rs Mn) FY19 FY20 FY19 FY20 FY19 FY20 FY19 FY20
Minda Industries Minda corporation Varroc Eng Motherson sumiRevenue 59081 54651 30920 28131 120365 111219 635229 635368
EBITDA 7252 6192 3751 175 11810 9105 56817 54895
PBT 4,547 2,522 2361 -1544 5185 395 32003 21129
PAT 2856 1550 1692 -1998 4287 25 20981 12945
Adj PAT 2856 1647 1575.1 -42.8 4217 -8 16071 11677.5
Growth (%)Revenue 32.2% -7.5% 19.2% -9.0% 17.1% -7.6% 12.8% 0.0%
EBITDA 35.8% -14.6% 23.0% -95.3% 19.5% -22.9% 8.2% -3.4%
PBT 12.1% -44.5% 23.4% -165.4% 0.5% -92.4% -2.0% -34.0%
Adjusted PAT 1.6% -42.3% 9.2% -102.7% -6.3%s -100.2% -6.6% -27.3%
Margin (%)EBITDA Margin 12.3% 11.3% 12.1% 0.6% 9.8% 8.2% 8.9% 8.6%
NPM 4.8% 3.0% 5.1% -0.2% 3.5% 0.0% 2.5% 1.8%
Source: Company;RSec Research

11
Key ChartsExhibit 1: PV Volume growth vs. MNDA’s PV Revenue growth
Source: SIAM, RSec Research
Exhibit 2: 2W Volume growth vs. MNDA’s 2W Revenue growth
Source: SIAM, RSec Research
Exhibit 3:EBIDTA Margin Trend
Source: Company, RSec Research
Exhibit 4: Premium P/E Valuation to Continue
Source: Company, RSec Research
f PV segment is non-cyclical industry, which records growth during most fiscals.
f Long-term average industry growth is 11%.
f During positive economic situation, it records a decent double-digit growth of 12-25%, while during slowdown, it records either lower or flat growth except for 1-2 occasions.
f MNDA’s PV segmental revenue outperformed the industry by 18% over FY15-FY20.
f We expect the PV industry to witness strong bounce-back in FY22E and FY23E.
f 2W is non-cyclical industry, which records decent growth during most fiscals.
f Long-term average industry growth is 8.5%.
f During positive economic situation, it records a decent growth of 12-18%, while during slowdown, it records lower growth of 2-5% except for 1-2 occasions.
f MNDA’s 2W segmental revenue outperformed the industry by 12% over FY15-FY20.
f We expect 2W industry to witness strong bounce-back in FY22E and FY23E.
f MNDA’s EBIDTA margin has expanded gradually to double-digit over the years.
f The company has decent pricing power with higher focus on high-margin products.
f MNDA’s margin would expand on account of increasing contribution of new segments, majority of which enjoy higher margin.
f MNDA’s long-term average 1-year forward P/E was lower due to lower RoE, while its P/E would expand with increasing return from the high-margin segments.
f Higher earnings CAGR of 35% over FY21-FY23E justifies premium valuation.
f Continuous outperformance vs. the industry warrants valuation expansion.
Exhibit 5: Product-wise Revenue Break-up & Segmental Revenue Break-up
Source: Company
f MNDA has diversified its revenue segments across product categories i.e. Switches, Lights, Acoustics, Light Metal Products and other smaller segments.
f Balanced revenue across 2Ws and PVs also supports de-risking.
-20.0%
-10.0%
0.0%
10.0%
20.0%
30.0%
40.0%
50.0%
60.0%
0
5,00,000
10,00,000
15,00,000
20,00,000
25,00,000
30,00,000
35,00,000
40,00,000
45,00,000
2015 2016 2017 2018 2019 2020
PV (unit) YoY growth (RHS) MNDA PV Rev. growth (RHS)
-20.0%
-15.0%
-10.0%
-5.0%
0.0%
5.0%
10.0%
15.0%
20.0%
25.0%
30.0%
0
50,00,000
1,00,00,000
1,50,00,000
2,00,00,000
2,50,00,000
3,00,00,000
2015 2016 2017 2018 2019 2020
2W (unit) YoY growth (RHS) MNDA 2W Rev. growth (RHS)
0.0%
2.0%
4.0%
6.0%
8.0%
10.0%
12.0%
14.0%
0
2,000
4,000
6,000
8,000
10,000
12,000
FY11 FY12 FY13 FY14 FY15 FY16 FY17 FY18 FY19 FY20 FY21 FY22 FY23
EBITDA (Rs Mn) EBITDA Margin (RHS)
0.00
50.00
100.00
150.00
200.00
250.00
300.00
350.00
400.00
450.00
Date
May
-10Au
g-10
Nov-
10Fe
b-11
May
-11Au
g-11
Nov-
11Fe
b-12
May
-12Au
g-12
Nov-
12Fe
b-13
May
-13Au
g-13
Nov-
13Fe
b-14
May
-14Au
g-14
Nov-
14Fe
b-15
May
-15Au
g-15
Nov-
15Fe
b-16
May
-16Au
g-16
Nov-
16Fe
b-17
May
-17Au
g-17
Nov-
17Fe
b-18
May
-18Au
g-18
Nov-
18Fe
b-19
May
-19Au
g-19
Nov-
19Fe
b-20
May
-20
Close -Unit Curr 28x 15x 20x 25x 30x

12
Investment RationaleOur investment thesis is based on the following premises:
1. Strong Presence across Product Offerings with Sustained Segmental Leadership
2. Multiple Technological Tie ups & Strong R&D Capabilities
3. Strong Long-term Relationship with Major OEMs Bodes Well
4. Premiumization Trend & Favourable Regulatory Measures to Drive Growth
5. Rising Opportunities in High-margin New Product Segments
6. Continued Focus on Aftermarket
7. Successful Acquisition Strategy to Drive Revenue
I. Strong Presence across Product Offerings with Sustained Segmental Leadership Minda Industries (MNDA) is a leading multi-products auto ancillary company with a diversified presence across industry segments. Over the years, it has demonstrated excellent foresight in entering into diverse product lines. It has evolved as a Tier-I supplier to various auto components with solutions for most major Indian OEMs across 4W and 2W segments.
It is the largest manufacturer of 2W switches, 4W switches and automotive horns and has the largest installed alloy wheel capacity in India. MNDA’s core businesses i.e. switches, lighting, acoustics form 37%, 23%, 12%, (combined ~72%) of its consolidated sales. It enjoys leadership position across segments with higher market share, which helped its outperformance vs. the industry over the years.
Exhibit 7: Product wise Revenue Break-up
Source: Company Source: Company
Exhibit 6: Consistent outperformance across segments vs. OEM industry led by higher content/vehicles
Source: Company
-20%
-10%
0%
10%
20%
30%
40%
50%
60%
FY15 FY16 FY17 FY18 FY19 FY20
2W Production volume growth PV Production volume growth
MNDA 2W Rev. growth MNDA PV Rev. growth

13
Exhibit 9: Segment wise contribution to MIL revenue growth in FY15-20
Source: Company; RSec Research
Exhibit 10: MNDA: Among the top players in each segment (FY20)Component Segment Remarks
Switch 4W #1 player with 55% market share
2W #1 player with 65% market share
Horns 4W #1 player with 40% market share
2W #1 player with 47% market share
Lights 4W #3 player with 13% market share
2W #3 player with 27% market share
Air Bags 4W #2 player with 25% market share
Alloy Wheels 4W #1 player with 45% market share
Air Filters 4W #2 player
Source: Company
The company commands 55% and 65% market share in 4W and 2W switches, respectively, ~22% in lighting, ~47% in horns in domestic market. It has the largest installed 4W alloy wheel capacity in India. Its newer product lines i.e. alloy wheels, aluminium die casting, sensors/controllers, air bag, infotainment system (28% of consolidated sales) are the key growth drivers, going ahead. The company is largely a domestic-focused play with its India business accounting for ~81% of its consolidated revenue..
Exhibit 8: Product segment wise revenue break-up
Source: Company
11344 1475323042 20221
958311579
1299812570
6163
6706
70906558
3950
5856
88627651
2823
5812
70907651
0
10000
20000
30000
40000
50000
60000
70000
FY17 FY18 FY19 FY20
Switches Lighting Acoustic LMT Others
44,706
54,651
33,863
59,081
(Rs Mn)
22,320
0
10000
20000
30000
40000
50000
60000
70000
80000
90000
FY15
Switc
hes
Light
ings
Acou
stics LM
T
Oth
ers
FY20
Switc
hes
Light
ings
Acou
stics LM
T
Oth
ers
FY23
E
11,293
8,329 5327,651 4,526
6,073 3,439 1,390
5,666 3,052
54,651
83,340(Rs Mn)

14
Exhibit 12: Group product portfolio - 4W
Source: Company
Exhibit 11: Group product portfolio - 2W
Source: Company

15
Exhibit 13: Product portfolio and clientele
Source: Company

16
Exhibit 15: Switch EBITDA and Margin Trend Exhibit 16: Key Clients (FY20)
Source: Company; RSec Research Source: Company
Switches: MNDA is the largest automotive switch player in India (4W and 2W) and the largest 2W switch manufacturer worldwide by volume. The segment is the company’s oldest and largest and contributes ~37% to its total revenue. Its 4W products include: switches for audio, cruise, door lamp, HVAC, power window, mirror, panel and lever combination etc. The 2W products include: switches for handlebar assemblies, CBS, off-road, noise suppressor caps and other customized switches.
The company serves the 4W segment through subsidiary i.e. Mindarika (MNDA has 51% stake, rest with Japanese partner Tokai Rika), while the 2W switch business is a standalone entity. It focuses on development of cost-effective and advanced solutions i.e. tactile switching technology, smart switch system, integrated blinker with hazard switching system, winker with flasher and engine stop with start. It has its own independent in-house R&D and also a design office in Japan to design and develop latest switching solutions. The company has 5 plants in India and 1 each in Indonesia and Vietnam. In addition to Mindarika, the company had another subsidiary i.e. Minda Auto Component (MACL), which was merged with the standalone business in FY20. However, the company has 2 other foreign subsidiaries in switching division i.e. (1) Minda Industries Vietnam Company Pvt. Ltd. (which caters to domestic customers in Vietnam and few other countries) and (2) PT Minda ASEAN Automotive, which caters to domestic customers including Yamaha, Toyota, Honda, Suzuki, Kawasaki and Nissan. Overall switch division exports to the USA, France, Italy, Austria and others countries, which accounts for ~6% of total switch sales.
Exhibit 14: Switch Revenue Trend
Source: Company; RSec Research
0.0%
2.0%
4.0%
6.0%
8.0%
10.0%
12.0%
14.0%
0
500
1000
1500
2000
2500
3000
3500
FY14 FY15 FY16 FY17 FY18 FY19 FY20 FY21E FY22E FY23E
EBITDA (Rs Mn) EBITDA Margin (RHS)
-30.0%-20.0%-10.0%0.0%10.0%20.0%30.0%40.0%50.0%60.0%
0
5000
10000
15000
20000
25000
30000
FY14 FY15 FY16 FY17 FY18 FY19 FY20 FY21E FY22E FY23E
Revenue (Rs Mn) YoY growth (RHS)
40% 43% 34%
% of overall revenue
33% 39% 37% 32% 32% 32%46%

17
This business clocked ~17% revenue CAGR over FY14-FY20 outperforming the auto sales over the same period. Operating margin for the business has improved by 190bps from 8% % in FY14 to 9.9% in FY20. The growth in this segment is led by growth in auto production and higher premiumization. The company has been able to grow faster than the industry by taking advantage of technology evolution for ease of riding, e.g. climate control and transition from manual to automatic. The company has a strong relationship with at MSIL and Toyota in 4W and Bajaj Auto, TVS Motor and HMSI in the 2W space. Though the current uncertainty is expected to weigh on the near-term prospects for the switching division, we expect the company to return to positive growth territory and continue to grow faster than the industry in the forward years.
BS-VI transition – which has led to sizable increase in switching and sensor content – is expected to augment MNDA’s switching revenue over the medium-term despite current sluggish volume. MNDA’s content per vehicle ranges between Rs4,000-12,000/vehicle in 2W space and Rs445-1,40,800/vehicle in 4W space. While the overall demand could be impacted by several factors i.e. COVID-19 and overall slow pick up in the automotive market, MNDA will continue to inch up with its content per vehicle owing to BS-VI transition and safety norms.
We expect this segment to decline by 12% in FY21E and witness 21% CAGR over FY21-23E. We estimate its EBIDTA margin to improve by 260bps to 12.5% over FY20-FY23E.
Lighting: The lighting business is MNDA’s second oldest product segment, which contributed ~23% to its consolidated revenue in FY20. MNDA is India’s third largest automotive lighting player with ~13% market share in 4W space and ~27% market share in 2W space (overall market share of ~22%). It has a design centre in Taiwan and technical arrangement with AMS Company, Korea.
Acquisition of Rinder Group in Spain (2016) for €5mn benefitted the company significantly, as Rinder is the pioneer in technology relating to automotive LED lighting. Its expertise on the lighting front from design to aftermarket is backed by R&D facilities in India (for PV), Spain (for 2W) and Taiwan (including design centre). Whilst this segment witnessed strong organic growth, acquisition of Rinder pushed MNDA to a higher orbit (Minda-Rinder currently accounts for ~50% of overall lighting segment at the consolidated level. Acquisition of Rinder boosted MNDA’s competitiveness in the premium lighting space especially in LED lighting space given its technological support. In FY20, the company merged its Rinder business with the standalone entity. Acquisition of of Germany-based Delvis in 2019 is set to further complement MNDA’s competitiveness in lighting division particularly in PV headlamps with recent new annual orders of worth Rs1bn from 2 large OEMS. MNDA aims to leverage Delvis’ technological, design and R&D capabilities as well as its presence with global 4W OEMs like Volkswagen, Audi and Skoda. The content per vehicle for lighting ranges between
Exhibit 17: Lightings Revenue Trend
Source: Company; RSec Research
-40%
-20%
0%
20%
40%
60%
80%
100%
120%
02000400060008000
1000012000140001600018000
FY14 FY15 FY16 FY17 FY18 FY19 FY20 FY21E FY22E FY23E
Revenue (Rs Mn) YoY growth (RHS) % of overall revenue
14% 19% 18% 28% 26% 22% 23% 20% 20% 20%

18
Exhibit 18: Lighthings EBITDA and Margin Trend Exhibit 19: Key Clients (FY20)
Source: Company; RSec Research Source: Company
0.0%
2.0%
4.0%
6.0%
8.0%
10.0%
12.0%
0
200
400
600
800
1000
1200
1400
1600
1800
FY13 FY14 FY15 FY16 FY17 FY18 FY19 FY20 FY21E FY22E FY23E
EBITDA (Rs Mn) EBITDA Margin (RHS)
Going forward, we expect the overall prospects of lighting division to remain strong due to increasing LED penetration and market share gain from the peers in non-LED segment. Currently, LED penetration stands at 30% in 4Ws and 45-50% in 2Ws, which we expect to reach to 75% in 4W and ~95% in 2W space over next 3-4 years. Given low heat emission and higher energy efficiency, LED lights have much longer life vs. the conventional halogen lamps, which has resulted in more vehicles getting equipped with LED lights. Moreover, the value of LED lighting is >2x compared to that of halogen, which indicates a sharp rise in content per vehicle. MNDA, with diversified presence in 2W/4W LED lighting space, stands to gain further market share, going forward. Recently, it has won new orders for supplying 2W headlamps to TVS’ (for Qute electric scooter) and LED headlamps for Honda’s Dio. Within 4W, it has secured large orders from Maruti and Toyota for supplying headlamps and tail lamps.
We expect this segment to clock 21% CAGR over FY21E-23E, post recording 14% decline in FY21E. We expect segmental EBIDTA margin to expand by 280bps to 10.5% over FY20-FY23E.
Acoustics: Acoustics i.e. automotive horns form ~12% of MNDA’s consolidated revenue. The company is India’s largest player in this segment (with 47% market share) and also the second largest player globally. It has strong in-house R&D capabilities developed with FIAMM, Italy. After acquiring Spain-based Clarton Horns in 2013, MNDA became the sec-ond largest global player. Clarton has the technology for electronic horns in Europe, which can be eventually introduced in India as well. It manufactures electronic automotive horns, trumpet horns and disc horns for PVs, 2Ws, CVs and other vehicles. Acquisition of Clarton Horns significantly expanded MNDA’s scale in the segment. Clarton chiefly serves leading European PV OEMs and contributes around two-third of current segmental revenues. The Indian acoustics business caters equally to PV and 2W segments.
Currently, MNDA has plants in Manesar and Pantnagar with installed capacity of 36mn and supplies to all major OEMs i.e. Maruti Suzuki, Bajaj Auto, TVS Motor, Royal Enfield, Ya-maha and M&M. Acoustics division has clocked 2% CAGR over FY17-20 despite flattish vol-ume recorded by the OEMs. However, revenue growth was impacted by muted demand in Europe owing to World harmonized Light-duty vehicles Test Procedure (WLTP) norms, which came into effect in 2018 and thus had an impact on MNDA’s acoustics division. Content in-crease in this segment is driven by shift from mechanical horns to electro-mechanical and electronic horns. Major global/domestic clients for the division include: BMW, Volkswagen, Daimler and Audi, Maruti Suzuki, Bajaj Auto, Tata Motors, Hyundai and Honda Motorcycles.

19
Exhibit 21: Acoustics EBITDA and Margin Trend Exhibit 22: Key Clients (FY20)
Source: Company; RSec Research Source: Company
0.0%
2.0%
4.0%
6.0%
8.0%
10.0%
12.0%
14.0%
16.0%
0
100
200
300
400
500
600
700
800
900
FY14 FY15 FY16 FY17 FY18 FY19 FY20 FY21E FY22E FY23E
EBITDA (Rs Mn) EBITDA Margin (RHS)
Exhibit 20: Acoustics Revenue Trend
Source: Company; RSec Research
While the acoustics division would support MNDA’s overall performance in coming years in absolute terms, we expect the growth rate to be relatively slower largely on account of significant presence in slow-growing European markets.
We expect this segment to clock 20% CAGR over FY21E-23E, post recording 16% decline in FY21E. We expect EBIDTA margin to expand by 280bps to 10% over FY20-FY23E.
Sensors, Actuators & Controller (SAC): With the acquisition of iSYS, MNDA entered into controllers business, which comprises of body control for door closure, gate closure and pinch technology etc. Further, MNDA also has presence in controllers for CV segment (with acquired technology from KPIT), which will be used for application in the buses and cabs, where AIS 140 has become mandatory. Sensor content in a car is likely to rise rapidly, as the vehicles become more intelligent and autonomous. MNDA is one of the early entrants in this segment (started in 2005). It supplies start stop sensors, contact and non-contact type speed sensors, HID ballast, tyre pressure monitoring system (TPMS), electronic accelerator pedal module (EAPM), DC-DC converter, and head lamp leveling motors etc.
In order to enhance its expertise in this division, MNDA also entered into tie-up with US-based Sensata Technologies and telematics division of KPIT.
Sensors from Sensata: MNDA entered into an agreement with US-based Sensata Technologies in 2018 for high-end sensors for BS-VI vehicles. This includes acquisition of magnetic speed and position sensors and sharing of technology support for 5 years. Sensata is exposed to a wide range of sensors used in different industries and in the automotive business. It manufactures sensors for engines, transmission, tyre pressure monitoring, air conditioning and electronic stability. Whilst MNDA imports high-temperature sensors, high-end sensors for pressure, BS-VI compliant engine and crank sensors, it has also started manufacturing few sensors in India in its endeavour to localize sensor production to a greater extent.
-30.0%
-20.0%
-10.0%
0.0%
10.0%
20.0%
30.0%
40.0%
0100020003000400050006000700080009000
FY16 FY17 FY18 FY19 FY20 FY21E FY22E FY23E
Revenue (Rs Mn) YoY growth (RHS)% of overall revenue
22% 18% 15% 12% 12% 10%10% 10%

20
Controllers: MNDA acquired Germany-based iSYS RTS for €5mn (for 80% stake) in Jul’18, which specializes in electronic control units (ECUs) for automotive body and control systems and software components for automotive lighting, interior lighting, electrical drive ECUs, HMI and infotainment applications. MNDA plans to localize this technology and offer it to existing clients.
Telematics: MNDA has also acquired KPIT’s telematics hardware business for Rs250mn in Jan’19. The products included vehicle telematics system i.e. AIS 140, On Bus Integrated Telematics Systems OBITS, and products for school buses.
MNDA enjoys competitive advantage over global peers owing to cost advantage of (~20-25%) led by localization. The management targets to achieve market share in the excess of 30%. This segment contributed ~2% to total revenue in FY20. We estimate its share would jump to ~7% by FY23E. Segmental EBITDA margin is likely to be higher than the company’s average, which would positively impact its overall margin. The company expects addressable market size of controllers and sensors would be ~Rs10-15bn and targets to achieve ~30% market share, as the overall market is expected to reach ~Rs18-20bn over next 2 years. Currently, controller is imported into India in the absence of ability for manufacturing the same locally by any major auto ancillary company. MNDA sees an opportunity in controller manufacturing, which would be mutually helpful for both the OEMs and MNDA.
Infotainment Systems: In-vehicle infotainment systems are likely to see incremental demand led by premiumization, as the customers prefer mid-to-high-end variants over entry-level variants. Broadly, the penetration of infotainment system as OE fitment is ~100% in sedan and higher segment cars but significantly lower in entry level cars (20-30% only) and hatchback (~45%). Thus, we expect penetration of infotainment systems in the entry segment cars to rise to ~50% over the next few years with rising premiumization trend. These systems cost from ~Rs4k for entry models to ~Rs15k for higher-end models. It has a JV with Denso Ten of Japan, which is one of the key manufacturers of infotainment products. The JV has an integrated design, development and localized manufacturing plant of car infotainment systems with products i.e. audio visual navigation (AVN), display audio, CD tuner, rear view camera, speakers and antenna amplifier. These products are marketed by another JV i.e. Minda D-ten. MNDA has 2 JVs – manufacturing is done in a 49% JV (Denso-ten Minda) while marketing is done in 51% JV (Minda D-ten). Minda Onkyo is a 50% JV with Onkyo Japan, and supplies speakers to Denso-ten, aftermarkets and exports.
Light Metal Technology (LMT): Since FY19, MNDA started reporting LMT as an individual segment, as revenue/profitability of this segment started contributing meaningfully. MNDA entered into LMT business with 30:70 JV with Kosei aluminum in Dec’10. This subsidiary manufactures alloy wheels and precision aluminum die casting parts majorly for Toyota with no major contribution in overall segment. In 2011, MNDA established MJ casting for die casting components for the 2W OEMs i.e. HMSI, TVS Motor and Wabco India. MJ casting operates two plants in India (1 each in Hosur and Bawal). This business was merged with the standalone entity in FY20. In Feb’15, MNDA established a JV with Kosei Aluminum Co. and started alloy wheel manufacturing in May’16. Minda Kosei Aluminum wheels (MKAW) is the market leader in PV segment with 45% market share and supplies to the 4W OEMs i.e. MSIL, M&M, RNA, Nisaan and Honda cars etc. MNDA has also set up a plant for 2W alloy wheels in FY21 and expects a huge demand for the same (as import substitute) over next
Exhibit 23: LMT Revenue Trend
Source: Company; RSec Research
-40%-20%0%20%40%60%80%100%120%140%
0
2000
4000
6000
8000
10000
12000
14000
FY17 FY18 FY19 FY20 FY21E FY22E FY23E
Revenue (Rs Mn) YoY growth (RHS)
13% 15% 14% 15% 16% 16%
% of overall revenue

21
Exhibit 24: LMT EBITDA and Margin Trend Exhibit 25: Key Clients (FY20)
Source: Company; RSec Research Source: Company
The 2W industry is expected to grow in higher single-digit in the long-term, while premiumisation would lead to double digit growth for MNDA’s 2W business over next 3-4 years. Alloy wheel penetration currently stands at ~80%, which we expect to reach to 95% over next 2-3 years. While major chunk of 2W alloys are imported currently, MNDA sees huge potential for local manufacturing with a dedicated plant, which has already started production at the end of 2QFY21 with major customer being Bajaj Auto.
Overall LMT business contributed ~14% to MNDA’s consolidated revenue in FY20 with EBITDA margin of ~26.7% (the highest in MNDA’s business segments).
Other Products: We believe that focus on value creation within the business through technology led inorganic growth and systematic realignment of businesses has helped MNDA so far. We expect new products lines, which include: airbags, reverse parking assistance system (RPAS), filters and upcoming products of Harita Seating would help MNDA to improve its financials. We believe additional revenue from Harita Seating, addition of sensor plant in FY21, filter business and 2W alloy wheel plant would improve MNDA’s revenue further despite the current difficult times. Further, focus on EV has helped MNDA to secure orders for smart plugs i.e. chargers and DC/AC converters from 2W OEMs like TVS and Bajaj auto. We envisage MNDA would continue to deliver healthy growth even during the difficult times, as evolving technologies i.e. automated manual transmission (AMT), antilock braking systems (ABS), and electronic control units/sensors etc. are expected to witness higher demand.
Air filter/Canisters: MNDA’s 49% JV with Roki Compamy of Japan manufactures air filtration systems and carbon canisters. This product segment is likely to see a significant jump in demand under BS-VI regime, which came into effect from April’20. Activated carbon canisters are used to capture hydrocarbon vapor emissions from the fuel tank as a part of evaporative emission control system (EVAP). Roki is a leading manufacturer of automotive air intake systems, carbon canisters, and auto transmission fluid filters etc., and it supports the entity for all product design and development needs.
Toyoda GOSEI (TG Minda): Toyoda Gosei is a part of Toyoda Group and it is a Toyoda ancillary. Considering the Toyoda brand and quality, it has an excellent track record. TG Minda is into automotive safety system (airbags), fuel cap and weather-strips sealing parts and body ceiling parts. TG Minda is an associate company of MNDA with ~48% holding. This associate company started generating meaningful revenue from Jul’19 onwards, as the government made airbags mandatory from Jul’19. However, regulation was revised later to make only driver bag mandatory and not the co-passenger, which impacted the overall growth. Currently, it is supplying to the OEMs like Maruti Suzuki (~25% market share and supplying ~0.75mn airbags), Toyota and Honda Cars.
Minda TTE DAPS: MNDA entered into 50:50 JV with TT Electronics in FY17 to manufacture reverse parking assistance system (RPAS). The JV was expecting mandatory implementation of RPAS from Apr’18, which was eventually got implemented in July’19. Both JV partners have made investment of ~Rs350-400mn and expect revenue of Rs2.5bn in future with >15% RoCE. Currently, it has assembling facility in Manesar with import content to the tune of ~30%. Minda TTE DAPS currently supplying RPASs to Maruti Suzuki and M&M and target to achieve ~30% market share.
0.0%
5.0%
10.0%
15.0%
20.0%
25.0%
30.0%
0
500
1000
1500
2000
2500
3000
FY18 FY19 FY20 FY21E FY22E FY23E
EBITDA (Rs Mn) EBITDA Margin (RHS)

22
II. Multiple Technological Tie ups & Strong R&D CapabilitiesWe believe market leadership in key product offering on the back of investments in R&D would continue to help MNDA in coming period. The company has long-standing technical agreements with global players in several areas. Over the period of time, MNDA has explored inorganic route to gain and extend capabilities in diverse product offerings.
Leveraging its JVs and tie-ups with global players, MNDA has expanded product offerings in the technology-intensive segments i.e. infotainment systems, airbags, ADAS, alloy wheels, carbon canisters and sensors and controllers. We expect these faster growing segments to contribute 30% to MNDA’s PAT in FY23E compared to 15% in FY20. Safety norms introduced in 2019, which made RPAS and airbags mandatory for all PVs benefited Minda TTE and TG Minda, the leading suppliers of ADAS and airbags, respectively. MNDA’s JVs with Denso Ten and Onkyo will capitalize on rising demand for infotainment systems, which is largely met through CBU imports. Minda Kosei is the leader in alloy wheels, benefiting from rapidly rising penetration. Implementation of BS-VI emission norms from FY21 is boosting demand for carbon canisters made by ROKI Minda. MNDA has tied-up with SENSATA for sensors for BS-VI applications and has acquired iSys RTS, which develops ECUs for automobiles.
Exhibit 26: Minda has a leadership position in core product segments
Product segment Entity Technology tie-up Competitive scenario
2W switches Minda Industries Design centre in Japan 65% OEM market share in India
4W switches Minda Rika Tokai Rika is global leader in 4W switches 55% OEM market share in India
Horns Minda Industries, Clarton Horns FIAMM Italy is technology partner #1 player in India with 47% mkt share
2W Lighting Rinder Light Systems and Technical Centre (Spain) 27% market share in 2W lighting space
4W Lighting Minda Industries Technical license with AMS (Korea) #3 player behind Lumax and Fiem
Lighting Delvis Access to global lighting technology and deep R&D capabilities
Source: Company
Exhibit 27: Key technical agreements
Year Company Country Product area
1995 Tokai Rika Japan 4-W switches
2010 Emer Italy CNG kits
2010 Roki Co Japan Air filters
2011 Kyoraku Nagase Japan Blow moulding
2011 Toyoda Gosei Japan Safety system and hoses
2015 Kosei Japan Alloy wheels
2016 Onkyo Japan Infotainment
2017 Katolec Japan Printed circuit boards (PCB)
2017 TTE taiwan Driver Assistance Systems & Products (DAPS)
2018 Sensata Technologies USA High-end sensors for BS-VI
2019 Harita Seating Systems India Seating systems
2019 iSys RTS Germany Embedded software
2019 Delvis Germany Lightings
Source: Company
Strong R&D Capabilities: MNDA has limited exposure to engine and engine related parts in its product portfolio. The company makes CNG, LPG kits (alternate fuel systems), fuel hoses and fuel caps, which contribute ~5-10% to its consolidated revenues. To mitigate it, the company is proactively working on development of EV components i.e. battery management systems, on-board chargers, DC controllers and innovative technologies like wireless charging systems etc., which will open up new areas of possible revenue generation. MNDA has consistently demonstrated its focus on R&D as a means to be more self-reliant in areas of technology and product innovation. Its state-of-the-art Centre for Research, Engineering and Advance Technologies (CREAT) is a significant step in this direction. The centre works on embedded electronic products related to connected vehicles, telematics, ADAS, infotainment, EV technologies, controllers and sensors, advance lighting and others. It works for various areas like cockpit electronics and advanced technologies, body exterior and safety technologies, creative design and innovation and product assurance lab.
23
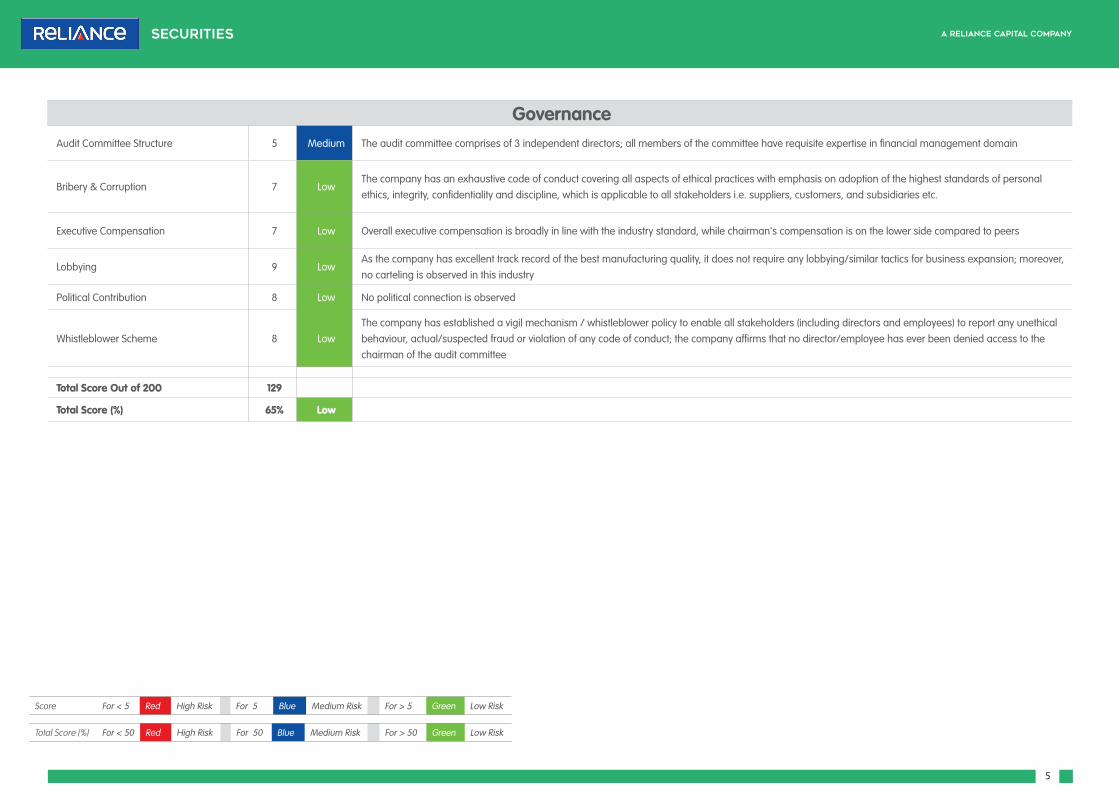
Exhibit 28: R&D expenses trend at MNDA
Source: Company; RSec Research
On the technology development front, it has in-house capabilities for electronics. Minda Katolec JV has set up plant in Pune as an Electronic Manufacturing Services (EMS). The company offers turnkey as well as job work solutions. The products manufactured include: Printed Circuit Boards (PCB) and Box Build Assemblies.
iSys RTS – incorporated in 2004 – develops and produces embedded systems and ECUs for automotive applications. It is engaged in engineering services, prototype development and series production in the field of automotive ECUs. Key customers for iSys are: Rolls Royce, BMW and Webasto etc. iSys’ products find their application in: (i) infotainment; (ii) body (door control) and interiors; (iii) EV applications; and (iv) ADAS and autonomous driving.
BS-VI transition, higher active safety features and rising share of hybrid/electric vehicles are expected to increase sensors and electronics content in vehicles rapidly. MNDA has already tied-up with technology leaders i.e. Sensata, and acquired ECU specialists i.e. iSYS and telematics hardware business from KPIT Engineering. We believe the future potential of this segment is high with competition mainly from the global players.
Localizations through Partnerships with Global Leaders: MNDA has been a pioneer in successfully forging partnership with global technology leaders for affordable localization of several components. This started with Tokai Rika, Japan for 4W switches in 1995 and expanded over 14 partnerships till date. Apart from providing technical support, the partners also help in providing latest solutions to meet the demand of the OEMs. MNDA provides a local understanding and operating environment to these partners, which include Toyota group companies. We believe that these tie-ups can potentially benefit MNDA, going forward.
Other Small Business: In addition to major revenue contribution from switches, horns, lighting, sensors electronics, infotainment and alloy wheels, MNDA has also invested in few more businesses i.e. Minda Kyoraku in blow moulding, MJ Casting in aluminium die casting, TG Rubber in fuel caps and Minda Storage Batteries. Cross-selling has helped MNDA to increase revenue of each of these businesses at a healthy pace
2.1%2.0%
1.7%
1.5% 1.5%
1.3%
0.0%
0.5%
1.0%
1.5%
2.0%
2.5%
0
100
200
300
400
500
600
700
800
900
1000
FY15 FY16 FY17 FY18 FY19 FY20
R&D Expense (Rs Mn) as % of revenue (RHS)
24
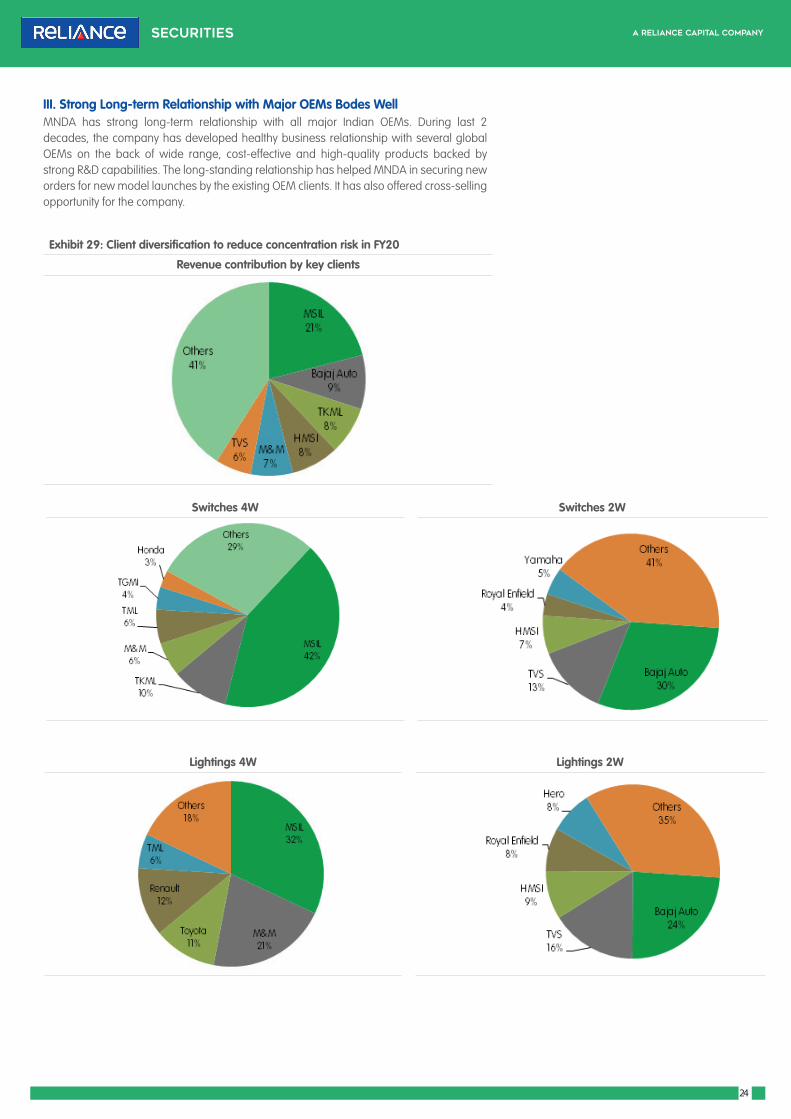
III. Strong Long-term Relationship with Major OEMs Bodes WellMNDA has strong long-term relationship with all major Indian OEMs. During last 2 decades, the company has developed healthy business relationship with several global OEMs on the back of wide range, cost-effective and high-quality products backed by strong R&D capabilities. The long-standing relationship has helped MNDA in securing new orders for new model launches by the existing OEM clients. It has also offered cross-selling opportunity for the company.
Exhibit 29: Client diversification to reduce concentration risk in FY20
Revenue contribution by key clients
Switches 4W Switches 2W
Lightings 4W Lightings 2W
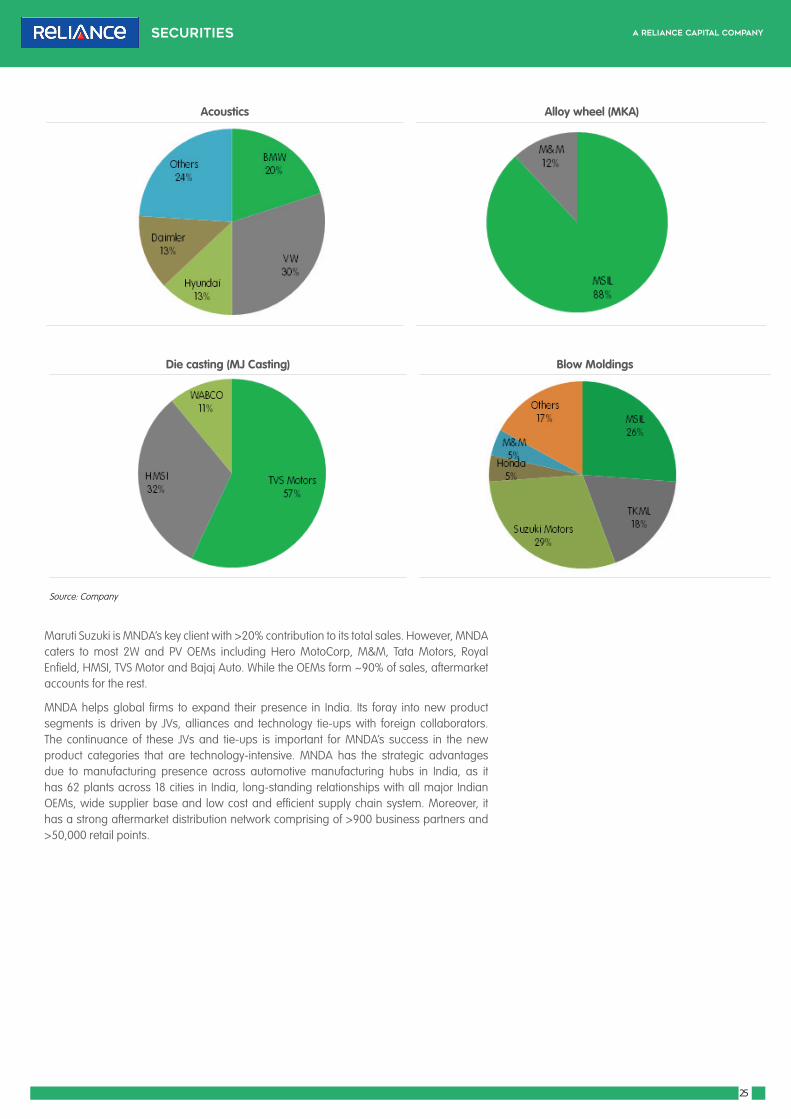
25
Acoustics Alloy wheel (MKA)
Die casting (MJ Casting) Blow Moldings
Source: Company
Maruti Suzuki is MNDA’s key client with >20% contribution to its total sales. However, MNDA caters to most 2W and PV OEMs including Hero MotoCorp, M&M, Tata Motors, Royal Enfield, HMSI, TVS Motor and Bajaj Auto. While the OEMs form ~90% of sales, aftermarket accounts for the rest.
MNDA helps global firms to expand their presence in India. Its foray into new product segments is driven by JVs, alliances and technology tie-ups with foreign collaborators. The continuance of these JVs and tie-ups is important for MNDA’s success in the new product categories that are technology-intensive. MNDA has the strategic advantages due to manufacturing presence across automotive manufacturing hubs in India, as it has 62 plants across 18 cities in India, long-standing relationships with all major Indian OEMs, wide supplier base and low cost and efficient supply chain system. Moreover, it has a strong aftermarket distribution network comprising of >900 business partners and >50,000 retail points.

26
IV. Premiumization Trend & Regulatory Measures to Drive GrowthWith five chief product lines (switches, lighting, acoustics, light metal technology and others), MNDA has a widespread manufacturing units (62 plants in 7 countries), R&D centres (6 locations) and global sales presence. Its corporate structure is slightly complex, encompassing 16 direct subsidiaries, 12 step-down subsidiaries, 8 JVs, 2 associate companies as of FY20. In the second leg of its corporate history, MNDA has been ahead of the curve in identification of product segments that have attracted higher market attention. Accelerated adoption of some of these products (e.g. alloy wheels, LED lighting and infotainment systems etc.) coupled with up-gradation in purchase by the Indian consumers have helped the company in gaining positive traction across product offerings.
Exhibit 30: MNDA Average Kit Value for 2W Exhibit 31: MNDA Average Kit Value for 4W
Source: Company
Premiumization in Lighting through LED: Globally, growth in LED lighting in the PV space has outpaced growth of competing technologies i.e. halogen and xenon in the first half of the last decade (LED lighting clocked 15.7% CAGR over 2012-16 vs. flattish growth for halogen and xenon, as per Yole research). The technology gained prominence owing to its higher design flexibility and luminous efficacy as well as lower power consumption. Further, LED lights can last up to 50,000 hours (several times more than halogen and xenon lights). LED penetration remains skewed towards tail lamps on account of relatively lower ASPs. Looking ahead, we expect tighter regulatory requirement around fuel consumption/emission along with consumers’ preference for aesthetically appealing products to drive penetration of LED headlamps in coming years.
Exhibit 32: Rising Premiumisation in PVs with Higher SUV Contribution
Exhibit 33: UV’s to dominate fresh launches in CY20 & CY21
Source: SIAM Source: Company, autocar india
5,53,699 5,86,6767,61,972
9,22,322 9,41,461 9,42,922
26,01,11127,89,239
30,46,66732,88,581 33,77,436
27,75,081
21.3% 21.0%
25.0%28.0% 27.9%
34.0%
0.0%
5.0%
10.0%
15.0%
20.0%
25.0%
30.0%
35.0%
40.0%
0
5,00,000
10,00,000
15,00,000
20,00,000
25,00,000
30,00,000
35,00,000
40,00,000
FY15 FY16 FY17 FY18 FY19 FY20
UV Volumes PV Volumes UV as a % of PV
OEM Model
Hyundai Tucson Facelift, New Creta
TML Tata HBX, Altroz EV, Gravitas
Nissan Nissan Magnite, Nissan Leaf
M&M New XUV 500, New Scorpio, eXUV300
Renault Kiger
MSIL Jimny, Brezza Petrol
Volkswagen T-Roc, Taigun
Kia Sonet
4572 51
62
6801
4308
2750
5209 57
66 6966
4664
3580
8387 92
75
11932
6137
4042
0
2000
4000
6000
8000
10000
12000
14000
MCC upto 110 cc
MCC upto 135 cc
MC>135 cc Scooters Mopeds
FY18 FY19 FY20
(Rs)
1989
3 3290
6
4406
4
7587
9
3378
2592
4 4359
6
5045
2
8093
4
3450
4454
5 5852
8
5838
9
1407
88
6873
0
20000
40000
60000
80000
100000
120000
140000
160000
Up to Rs. 2.2 Lacs
Rs. 2.21 - 4.5 Lacs
Rs. 4.5 - 8.3 Lacs >Rs 16 lacs Tractors
FY18 FY19 FY20
(Rs)

27
Despite increasing LED adoption, India remains behind the western markets in terms of overall penetration of ~40%. Domestic PV OEMs started introducing LED elements for headlamps in a meaningful manner only from 2014 with the pace of adoption increasing thereafter. Most PV launches (new launches or facelifts) over the past few years have incorporated LED content, while the trend is expected to continue amid the ongoing premiumization in automotive space.
For MNDA, LED lighting forms 40% of its 2W lighting business, while the share of LED is lower on the PV segment at ~25-30%, largely owing to price differential in these two segments (2W LED ASPs at ~Rs1000-2500, which can go as high as ~Rs15000 for 4W). LED lamps are priced at >2x their halogen counterparts. LED prices are expected to fall due to increasing volume, higher localization and increased competitive intensity. Moreover, this is a high-margin segment compared to the conventional halogen lighting. We expect the demand for LED lighting to form an important factor of MNDA’s premiumization play. Further, the technological edge provided by acquisition of Rinder and Delvis are expected to help MNDA in improving the share of LED lighting further. Increased preference for localized sourcing from by the domestic OEMs as a cost control measure during the ongoing industry downturn is a positive development for MNDA. On 2W front, adoption rate of LED lighting has increased post implementation of AHO regulations from 2017.
Moreover, premiumization trend has also led to increased usage of infotainment system with more added features, music system, other interior lightings and increased aesthetics. Consumers’ increasing preference for higher variants of vehicles is visible from the shift from entry level mini cars to compact/super compact cars over last 5 years. Kit value per vehicles is 30% higher in compact cars as against mini cars. This would drive the demand for higher component and value of kit per vehicle, which augurs well for MNDA.
Regulatory Factors as Kit Value Booster: Over last 5 years, the government has moved legislation in areas relating to crash tests (NCAP), braking (ABS/CBS), better on-road visibility (AHO), vehicular and pedestrian safety. Regulatory push and higher consumer awareness have led to the trend of gravitation towards safer vehicles.
Safety scores for Indian cars tested under the global NCAP crash procedures have improved significantly over the past decade. Component makers in areas of airbags, sensors, ABS/CBS and other electronics are set to benefit from realisation-led growth in this space in future. For MNDA, higher preference for safer 4W provides a huge opportunity in the form of higher demand on airbag and sensors/controllers front.
The 4W airbag industry in India is pegged at ~Rs25bn. Front airbags (mainly driver side airbag) had reached ~65% penetration, while other airbags (side, side torso, knees, curtain and rear etc.) are penetrated to the extent of ~10%. MNDA is well-placed in this space as one of the leading players, commanding ~25% market share. It serves the segment through its 48% JV with Toyoda Gosei i.e. TG Minda India and caters to Toyota Kirloskar and Maruti Suzuki among others.
Post regulatory push towards compulsory front passenger airbag, this segment reported strong growth with at least 1 air bag per car, while it is becoming more common for the top-end variants of new launches to feature up to 6 (or even 8) airbags in some cases e.g. Tata Harrier, Kia Seltos, Hyundai Venue, MG Hector, Hyundai Creta all carry 6 airbags in premium variants.
Thus, we believe several regulatory moves for increased passengers’ safety and higher demand for more features/components by consumers (even in basic models) will drive the value of kit per vehicle, going forward.
Exhibit 34: Recent vehicular safety related regulations in India
Regulation Description New models Existing models
Anti-lock Braking System (ABS) for 2-W above 125 cc and PV /Combi-brake system (CBS) for 2-W upto 125 cc
Prevention of skidding instances even under hard braking or wet conditions (ABS) and use of single lever to enable braking on both wheels simultaneously (CBS)
01-04-2018 01-04-2019
Pedestrian safety norms For greater safety of pedestrians in case of accidents 01-10-2018 01-10-2020
Automatic Headlight On (AHO) for new 2-W Headlamps to remain switched on for all new 2-W to aid better visibility even in daylight hours on both wheels simultaneously (CBS)
01-04-2017
Vehicle safety norms for cars Incorporation of driver airbag, speed warning system, seatbelt reminder (driver & front passenger) and rear parking sensors reminder (driver & front passenger) and rear parking sensors as standard fitments
01-07-2019
Crash test norms for Indian cars i.e. Bharat NCAP
Crash tests for Full frontal impact (AIS096), Offset frontal impact (AIS098) and Side impact (AIS099)
01-10-2017 01-10-2019
Source: Industry Data

28
V. Rising Opportunities in High-margin New Product SegmentsAs stated above, MNDA has accelerated its business volume from new segments, which it entered into over last 3-5 years. Moreover, as this new areas of business enjoy higher margin than the company’s average margin, these would expand its overall EBIDTA margin, going
A. Airbags: TG Minda – a JV between Toyoda Gosei and Minda Group – is the second largest supplier of airbags in India with ~25% market share. With the implementation of safety norms, the penetration of airbags rose from 45% in FY18 to 100% in 2020. Notably, most car brands have 1-2 airbags at present, while the high-end cars have 6-8 airbags. Looking ahead, we believe a sizable portion of PVs would have 6-8 airbags, which would lead to outperformance of MNDA’s revenue from air bag business. TG Minda has 35% share of business with Maruti, Toyota and Honda and the company is targeting to increase share of business to 50% with these 3 OEMs. TG Minda has 3 operational plants in India.
TG Minda’s revenue stood at Rs4.9bn and Rs4.2bn in FY19 and FY20, respectively with EBITDA margin of 12-13%. While airbag business accounts for 70% of revenue, body sealing business accounts for the rest for TG Minda. We expect its revenue to clock 24% CAGR over FY21-23E led by an increase in penetration of airbags.
B. Seat Belts & AMT Shifters: Tokairika Minda (TR Minda) – a JV between Tokai Rika of Japan and Uno Minda group – manufactures seat belts, steering roll connectors and gear shifters. The company operates one plant in Bangalore and supplies to Toyota Kirloskar and Maruti Suzuki. We expect its revenue to clock 21% CAGR over FY21-23E, in line with PV production growth in India.
C. Driving Assistance Products and Systems (DAPS): Minda TTE DAPS – Minda’s 50:50 JV with Tung Thih Electronic of Taiwan – will capitalize on the rising penetration of Advanced Driver Assistance Systems (ADAS). It supplies RPASs to Maruti Suzuki and gained market shares owing to mandatory fitment of RPAS in all PVs from Jul’19. The JV will supply DAPS including RPAS, Auto Parking Aid Systems, Cameras and Round View Monitor Systems etc. to the OEMs. Minda TTE supplies RPAS to Maruti Suzuki’s popular models like Swift and Dzire and its share of business with Maruti Suzuki is ~80%. We expect Minda TTE to achieve revenue of Rs2bn by FY23E.
D. Infotainment Systems: Denso Ten Minda – 51:49 JV between Denso Ten and Minda, which manufactures car infotainment products – is expected to benefit from growing demand for infotainment systems. Its manufacturing facility is located at Bawal. The JV supplies infotainment systems to Maruti Suzuki, Toyota and Honda and enjoys ~21% market share in automotive infotainment in India. As most of the cars in India have audio system installed as aftermarket fitment now, the JV would tap into the OEM market by providing better technology and locally-manufactured, cost-effective products to the OEMs.
Minda Onkyo – Minda’s 50:50 JV with Onkyo of Japan – manufacturers sound amplifier systems (speakers) and supplies to Minda Denso Ten, aftermarkets in India and sells in overseas markets. The JV is engaged in manufacturing, design and sales of speakers and related audio technologies. We expect revenue from infotainment (Minda D-Ten and Minda Onkyo) to top Rs8bn in FY23E.
Exhibit 35: Rising revenue contribution of new businesses in revenue
Source: Company, RSec Research
0
10000
20000
30000
40000
50000
60000
70000
80000
90000
FY20 FY21E FY22E FY23E
Switches Lightings Acoustics Alloy wheel Die casting
Sensor/SAC Blow Molding KPIT Controler Rubber/Hose/Minda TG Battery Segment
Fuel Cap iSSYS Seating Others

29
Apart from PV alloy wheels, MNDA has recently entered into 2W alloy wheels segment. In 2W segment, alloy wheels are preferred over steel due to lower weight and better braking, stability and control. 2W alloy wheels penetration in India is estimated at ~80% in FY20. Now, it is more competitive, with ~65% of the industry served by imports (in the absence of any anti-dumping duty unlike the PV segment), which provides an import substitution opportunity for the domestic manufacturers. Therefore, there is lower scope to gain market share quickly. However, there exists a scope for MNDA to gain volume share to expected penetration level of ~95-98% in next 2 years. MNDA would also benefit from import substitution.
For MNDA, 2W alloy wheel business would form part of the standalone entity. MNDA plans to invest Rs5bn to produce ~6mn units per annum, which will be supplied primarily to Bajaj Auto along with HMSI and TVS Motor. While it plans to invest Rs3bn in Phase-I for annual capacity of ~3.6mn units (which started recently), the Phase-II will need ~Rs2bn investment, which would take the annual capacity to the desired level. It aims to reach peak revenue potential of Rs5bn per annum from the segment by FY24E. Alloy wheel segment enjoys >20% EBIDTA margin at present and we expect MNDA’s EBIDTA margin to remain at ~20% level, going forward despite foraying into the competitive 2W business.
F. Sensors, Controllers & Embedded Software: MNDA’s sensors, actuators and controllers (SAC) division, established in 2005, manufactures products i.e. start-stop sensors, contact and non-contact speed sensors, tyre pressure monitoring systems, electronic accelerator pedal modules, DC-DC converters and headlamp leveling motors among others. It caters to the leading OEMs like M&M, Bajaj Auto, VECV, Royal Enfield, Tata Motors and General Motors etc. SAC segment is the major beneficiary of regulatory push towards vehicular safety, shift to BS-VI emission norm and vehicular tracking. Further, the general trend of increasing electronics content in vehicles would lead to higher usage of sensor based applications in the PVs, which is a longer-term demand driver for this segment.
Exhibit 37: Alloy wheel presence in major recent model launches
Year … as standard across variants
2016 Toyota Fortuner, Toyota Innova Crysta (except base variant), Ford Endeavour
2017 Maruti Baleno RS, Jeep Compass, Tata Nexon2018 Maruti Ciaz refresh (except base variant), Mahindra Alturas G4
2019 Kia Seltos, MG Hector (except base variant), Maruti XL6
2020 Brezza petrol, Tucson facelift, New Creta
Year ... as exclusive to higher priced variants
2016 Maruti Brezza, Tata Tiago
2017 Maruti Swift Dzire, Tata Tigor, Hyundai Verna, Tata Hexa, Maruti Ignis, Honda WRV
2018 Maruti Suzuki Swift refresh, Honda new Amaze, Mahindra Marazzo, Maruti Ertiga refresh, Hyundai Elite i20 refresh
2019 Hyundai Venue, Mahindra XUV300, Renault Triber, Tata Harrier, Hyundai Grand i10 Nios
2020 Mahindra Thar, Kia Sonet, Honda City, MG Gloster
Source: Company
Exhibit 36: LMT Division
Company Type Stake % Products
MJ Casting Ltd Subsidiary 100 Die Casting Components
Minda Kosei Aluminium Wheels (P) Ltd Subsidiary 70 Alloy Wheel
KOSEI Minda Mould (P) Ltd JV 49 LMT
KOSEI Minda Aluminium Company Ltd Associate 30 Alloy Wheel, precision alu Die Casting
Source: Company
E. Alloy Wheels: Alloy wheel penetration has increased in India over the past 2-3 years, as customer preference has evolved in favour of products with higher aesthetic appeal. Aluminium alloy wheels have the benefit of superior design flexibility and lighter weight over the steel. This trend is more popular in SUVs compared to other PVs. As the penetration level of alloy wheel in the Indian 4W market stands at ~30% at present, we see is huge potential in the coming period led by increasing premiumization and regulatory push for reducing the weight of the vehicles.

30
G. Air filters & Canisters: ROKI Minda – a 49:51 JV between Minda Industries and ROKI (Japan) has set up plants in Bawal, Bangalore and Gujarat for manufacturing air-intake systems for automobiles. Implementation of of BS-VI emission norms in India from FY21 led to higher in demand for air filtration systems and carbon canisters made by ROKI Minda, which would get booster with incremental pick-up in volume. Carbon canisters developed by ROKI meets the strictest environmental regulations. ROKI Minda posted Rs3.9bn and Rs4.1bn revenue in FY19 and FY20, respectively with an EBITDA margin of 15-16%. We expect segmental revenue to clock 25% CAGR over FY21-23E led by increased demand led by BS-VI implementation. We expect segmental EBIDTA margin in the excess of 15% for the company, going forward.

31
VI. Continued Focus on Aftermarket OpportunitiesStrong Presence in Replacement Market: Minda Distribution & Services Ltd. (MDSL), wholly owned subsidiary of MNDA (which was merged with standalone entity in FY20), distributes all the group products in the aftermarket. Aftermarket products, manufactured by MNDA and group companies are sold to MDSL, which sells auto parts and components in the aftermarket through dealers and distributors and retailers. There are ~900 distributors throughout India supported by retailer and mechanics network comprising of >50,000 retail points as on FY20-end from 30,000 retail points as of FY18-end.
Exhibit 38: Aftermarket sales growth trend Exhibit 39: Aftermarket revenue mix - FY20
Source: Company
MNDA’s aftermarket revenue clocked ~20% CAGR over the past 7 years. Aftermarket segment accounted for ~11% of revenue in FY20. Looking ahead, we expect the segmental growth to remain healthy in the medium-term on the back of rising premiumization trend, introduction of new products, increasing preference for branded products post GST roll-out and a widespread distribution reach coupled with further network expansion.
Switches33%
Lightings32%
Horns13%
Others22%
Exhibit 40: Strong presence in replacement market
Source: Company
0102030405060708090
100
Mah
aras
htra
Utta
r Pra
desh
Bihar
Delhi
Tam
il Nad
u
Raja
sthan
Wes
t Ben
gal
Guja
rat
Mad
hya
Prad
esh
Karn
atak
a
Hary
ana
Punja
b
Kera
la
Andh
ara
Prad
esh
Oriss
a
Him
acha
l Pra
desh
Jhar
khan
d
Chat
tisga
rh
Tela
ngan
a
Assa
m
J&K
Utta
rakh
and
Goa
Retail Points
17.4%
3.4%
11.3%
13.7%
-2.6%
-5.0%
0.0%
5.0%
10.0%
15.0%
20.0%
0
1000
2000
3000
4000
5000
6000
7000
FY16 FY17 FY18 FY19 FY20
After Market sales (Rs Mn) YoY growth (RHS)

32
Harita Seating - Prudent & Inexpensive: In Feb’19, MNDA announced the acquisition of Harita Seating Systems (HSSL), completion of which is likely in FY21. HSSL is a domestic leader in seating solutions for the tractor, CVs and construction equipment segment with 12 manufacturing plants. HSSL is the key player in the seating segment with market share of ~53% in CVs (~15% in bus) and 33% in tractors. CV segment contributes ~20% to its revenues, while 2W and tractor segments account for ~30% and ~8%, respectively. It has a JV with Germany-based FS Fehrer Automotive Gmbh, which is a leader in the automotive foam business. Its client base includes: Tata Motors, TVS Motor, Royal Enfield, TAFE, Daimler, and John Deere, etc. MNDA offered two exit options to the existing shareholders of HSSL i.e. (1) share swap (1.52 MNDA shares for every HSSL share, implying an equity dilution of ~4.5%); and (2) non-convertible redeemable preference share with yield of 7.5% per annum, coupon of 0.01% over a period of three years.
We believe acquisition of HSSL is a strategic fit for MNDA, as it augments its product profile as well as expanding its clientele base. HSSL is a financially sound company with lower D/E, decent CFO generation and strong return ratios (RoCE>20%). Moreover, it is being acquired at a reasonable valuation of ~<2x P/B. It has huge potential in light of value addition i.e. seat heating, automation and control, etc., which provides a significant opportunity for MNDA to penetrate more into its 2W and 4W clients base.
HSSL’s PAT stood at Rs248mn in FY20, which was ~15% of MNDA’s FY20 PAT. EPS accretion over the long-term can be higher given addition of new clients and expansion of portfolio.
Exhibit 41: Group Consolidation Table
Subsidiary % stake required
Business Year of Acquisition
Final Share (%)
Asean 21 Indonesia Jul-15 51
MJCL 48 Die-casting Aug-15 98
Minda TG Rubber 51 Fuel hoses Mar-16 51
Kosei Minda 30 Alloy wheels Mar-16 30
Roki Minda 49 Air filter, Carbon canister Oct-16 49
Minda Katolec 51 PCBs Feb-17 51
Asean 49 Indonesia Apr-17 100
Densoten Minda 49 Infotainment Jan-18 49
MRPL 24 4W Switches Jan-18 51
MI Torica 60 Procurement of RM Jan-18
SAM Global 49 Vietnam Mar-18 100
TG Minda 6 Air bags, Body selling Prts Mar-18 6
TG Minda 42 Air bags, Body selling Prts Sep-18 48
Source: Company
VII. Successful Acquisition Strategy to Drive RevenueMNDA has been able to witness successful inorganic growth through several acquisitions, which include: Clarton Horns in Spain (2013), Rinder Group in Spain (2015), iSYS RTS in Germany (2018), Harita Seating in India (2020) along with several JVs over last decade. The company continues to perform strongly via organic and inorganic strategy with its presence in new-age opportunities (alloy wheels, LED, air bags, telematics, sensors and controllers etc.) making it one of the most vibrant auto ancillary companies having promising future in the Indian auto ancillary space.

33
Delvis: Global Premium Lighting: MNDA recently completed the acquisition of Delvis GmbH at an enterprise value of €21mn (acquisition cost at ~0.5x EV/sales looks reasonable). Delvis is a German player, which provides advanced lighting solutions to major German PV OEMs (VW, Audi and Porsche etc.) for exterior and interior lighting, lighting electronics and testing services. Its capabilities in the space span across automotive lamps engineering and design & testing along with contract manufacturing for some components. Delvis offers the full range of products from cost-optimized basic headlights and design solutions to adaptive LED headlight systems with dynamic lighting functions. Delvis is expected to clock annual sales of ~€40mn (~Rs3bn) with corresponding EBITDA margin of ~7% over the next 1-2 years. This acquisition is strategic play in the premiumization drive, which will augment the contents provided by MNDA to its customer. MNDA has already received new orders from the Indian OEM for Delvis products.
Exhibit 42: HSSL FinancialsParticulars FY16 FY17 FY18 FY19 FY20P&L Line ItemsRevenue (Rs Mn) 6369.4 7105.8 8634.8 9749.6 7436.6
EBITDA (Rs Mn) 585.9 681.8 901.7 776.1 302.7
EBITDA Margin (%) 9.2 9.6 10.4 8.0 4.1
Adj PAT (Rs Mn) 228.9 261.2 366 287.1 138.0
B/S Line ItemsNetworth (Rs Mn) 965 1188 1543 1784 1918
Debt (Rs Mn) 50 113 224 317 208
D:E (x) 0.4 0.1 0.1 0.2 0.1
Capital Efficiency RatiosRONW (%) 37 34 36 24 13
ROCE (%) 40 44 45 3% 14
Cash Flow Line ItemsCFO (Rs Mn) 543.6 382.7 347.4 1173.7 349.2
CFI (Rs Mn) -146.6 -357.6 -385 -1037.7 -175.5
Source: Company

34
Outlook & ValuationStrong rebound in automobile production post a major slump would be key driver for earnings revival, in our view. Moreover higher content, value addition on the back of premiumization, entry into new high-margin segments would be key triggers for MNDA’s earnings and valuation re-rating, going forward. Its consolidated revenue is likely to clock 15% CAGR over FY20-FY23E, while its earnings would clock 35% CAGR over the same period. Considering the multiple positive triggers on revenue and margin front from long-term perspective, we expect the stock’s valuation to steadily move towards the industry’s peak multiple. In light of outperformance despite COVID-led uncertainty and faster-than-expected recovery of auto industry, we initiate coverage on MNDA with BUY and a 2-year Target Price of Rs460, valuing the stock at 30x FY23E earnings (historically stock has traded at 1 Yr forward P/E of ~28x), which implies >35% upside from the current level.Exhibit 43: 1 year forward PE
Source: Company, RSec Research
0.00
50.00
100.00
150.00
200.00
250.00
300.00
350.00
400.00
450.00
Dat
eM
ay-1
0Au
g-10
Nov
-10
Feb-
11M
ay-1
1Au
g-11
Nov
-11
Feb-
12M
ay-1
2Au
g-12
Nov
-12
Feb-
13M
ay-1
3Au
g-13
Nov
-13
Feb-
14M
ay-1
4Au
g-14
Nov
-14
Feb-
15M
ay-1
5Au
g-15
Nov
-15
Feb-
16M
ay-1
6Au
g-16
Nov
-16
Feb-
17M
ay-1
7Au
g-17
Nov
-17
Feb-
18M
ay-1
8Au
g-18
Nov
-18
Feb-
19M
ay-1
9Au
g-19
Nov
-19
Feb-
20M
ay-2
0
Close -Unit Curr 28x 15x 20x 25x 30x
RSec vs. Consensus EstimatesOur consolidated revenue/PAT estimate for FY22E and FY23E is 11%/10% and 12%/12% higher than the Bloomberg consensus, primarily on account of higher volume estimates for domestic PVs and 2Ws led by faster-than-expected recovery and higher revenue contribution from the new segments over next 2 years. We expect the consensus to upgrade earnings estimates gradually with better visibility in business over the next 2-3 years.
Our View: While MNDA’s revenue performance was adversely impacted in the near-term due to weakness in underlying segments led by COVID-19 pandemic, it improved towards the end of 2QFY21. We expect a strong bounce back in 2HFY21E and FY22E. We envisage significant volume traction over next 2 years on account of sizable shift to high-end cars/SUVs and added features in 2Ws. As volume growth and value addition would be at higher level than the street’s expectations, we believe consensus is likely to upgrade earnings estimates for FY22E and FY23E gradually.
Exhibit 44: RSec Vs. Consensus
RSec Consensus % Change
Rs Mn FY21E FY22E FY23E FY21E FY22E FY23E FY21E FY22E FY23E
Consolidated Revenue 56,522 74,322 83,340 51,320 67,124 75,984 10.1 10.7 9.7
EBIDTA 5,244 9,043 10,536 5,187 8,081 9,652 1.1 11.9 9.2
EBIDTA Margin (%) 9.28% 12.17% 12.64% 10.11% 12.04% 12.70%
PAT 594 3,264 4,347 835 2,912 3,886 -28.8 12.1 11.9
Source: Bloomberg, Rsec Research
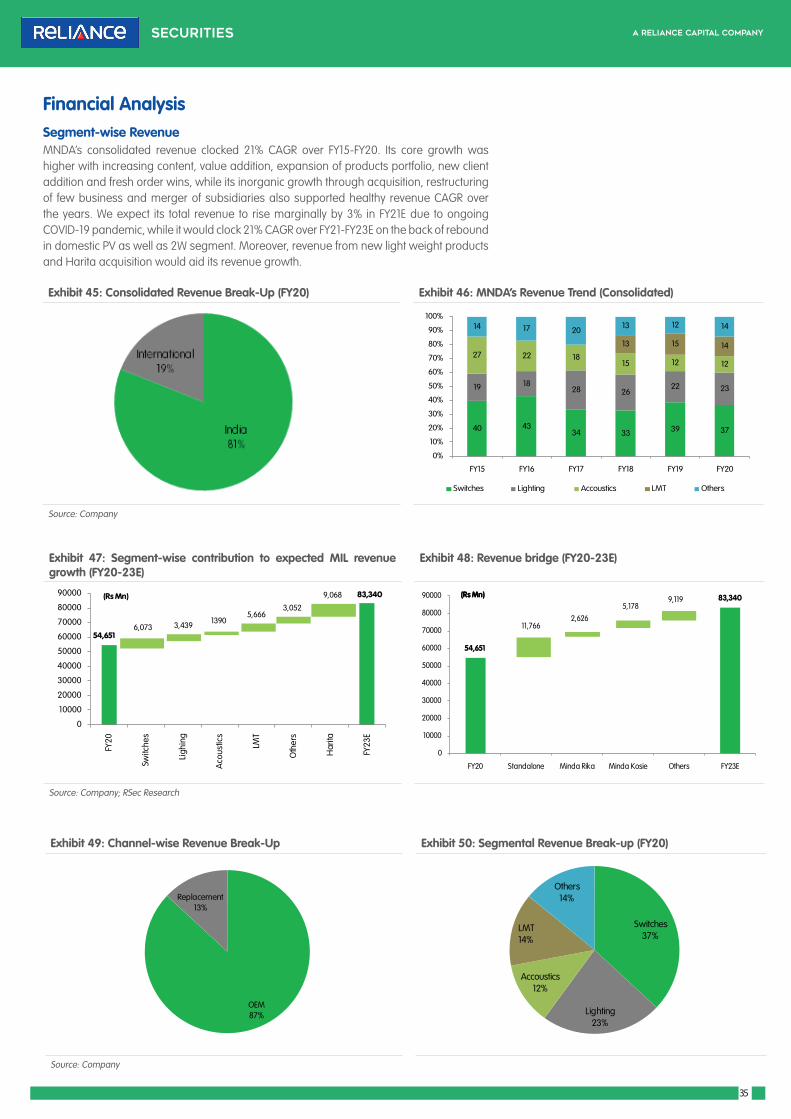
35
Financial Analysis Segment-wise RevenueMNDA’s consolidated revenue clocked 21% CAGR over FY15-FY20. Its core growth was higher with increasing content, value addition, expansion of products portfolio, new client addition and fresh order wins, while its inorganic growth through acquisition, restructuring of few business and merger of subsidiaries also supported healthy revenue CAGR over the years. We expect its total revenue to rise marginally by 3% in FY21E due to ongoing COVID-19 pandemic, while it would clock 21% CAGR over FY21-FY23E on the back of rebound in domestic PV as well as 2W segment. Moreover, revenue from new light weight products and Harita acquisition would aid its revenue growth.
Exhibit 45: Consolidated Revenue Break-Up (FY20) Exhibit 46: MNDA’s Revenue Trend (Consolidated)
Source: Company
Exhibit 47: Segment-wise contribution to expected MIL revenue growth (FY20-23E)
Exhibit 48: Revenue bridge (FY20-23E)
Source: Company; RSec Research
Exhibit 49: Channel-wise Revenue Break-Up Exhibit 50: Segmental Revenue Break-up (FY20)
Source: Company
Switches 37%
Lighting 23%
Accoustics 12%
LMT 14%
Others 14%
OEM 87%
Replacement 13%
54,651
83,340
0
10000
20000
30000
40000
50000
60000
70000
80000
90000
FY20
Switc
hes
Ligh
ing
Aco
ustic
s
LMT
Oth
ers
Har
ita
FY23
E
13905666
9068
13905666
9068
5666
9068
5,6663,052
9,068(Rs Mn)
6,073 3,439
40 4334 33 39 37
19 1828 26
22 23
27 22 1815 12 12
13 15 14
14 17 20 13 12 14
0%
10%
20%
30%
40%
50%
60%
70%
80%
90%
100%
FY15 FY16 FY17 FY18 FY19 FY20
Switches Lighting Accoustics LMT Others
54,651
83,340
0
10000
20000
30000
40000
50000
60000
70000
80000
90000
FY20 Standalone Minda Rika Minda Kosie Others FY23E
(Rs Mn)(Rs Mn)
11,7662,626
5,1789,119

36
Revenue & Asset TurnoverMNDA has consistently been recording revenue growth despite marginal decline in asset turnover over last decade due to constant expansion and acquisition, which kept its utilization level lower than the optimum level. However, it has been able to record higher revenue CAGR and outperformed industry. We expect its asset turnover ratio to increase to 1.4x in FY23E from 1.2x in FY20.
Exhibit 51: Asset Turnover
Source: Company, RSec Research
1.951.86 1.91
2.26
2.04
1.761.56 1.56
1.21 1.14
1.38 1.39
0.00
0.50
1.00
1.50
2.00
2.50
0
10,000
20,000
30,000
40,000
50,000
60,000
70,000
80,000
90,000
FY11 FY12 FY14 FY15 FY16 FY17 FY18 FY19 FY20 FY21E FY22E FY23E
Total Revenue (Rs Mn) Asset Turnover (x,RHS)
EBITDA & EBITDA MarginMNDA‘s EBITDA margin will witness meaningful up-tick over next 2-3 years due to rising contribution of high-margin products. However, expansion into new segments, capacity expansion in LMT business and Harita acquisition would restrict the margin expansion over the medium-term. Also, initial lower capacity utilization at the new plants (alloy wheel and sensors) keeps margin under pressure. MNDA‘s consolidated EBIDTA margin would expand by 130bps over FY20-FY23E to 12.6%.
Exhibit 52: EBITDA Margin Trend Exhibit 53: Segment-wise EBITDA margin trend
Source: Company; RSec Research
0.0%
5.0%
10.0%
15.0%
20.0%
25.0%
30.0%
35.0%
40.0%
FY17 FY18 FY20 FY21E FY22E FY23E
Switches Lightings Acoustics LMT Others
8.8%
6.4%7.0%
4.6%
6.9%
9.4%
11.0%11.9% 12.3%
11.3%
9.3%
12.2% 12.6%
0.0%
2.0%
4.0%
6.0%
8.0%
10.0%
12.0%
14.0%
0
2,000
4,000
6,000
8,000
10,000
12,000
FY11 FY12 FY13 FY14 FY15 FY16 FY17 FY18 FY19 FY20 FY21E FY22E FY23E
EBITDA EBITDA Margin (RHS)
(Rs Mn)

37
Exhibit 54: Net Profit & NPM
Source: Company, RSec Research
Net Income & NI MarginMNDA posted Rs1.65bn net profit on Rs54.7bn revenue in FY20. Its EBIDTA margin and NPM stood at 11.3% and 3% in FY20, respectively. However, its margin remained under pressure in FY20 mainly due to slump in domestic PV business and lower operating margin in Lighting, Switching and Acoustic segments. Its EBIDTA margin of lighting business fell by >250bps YoY in FY20, while its NPM fell by 180bps YoY to 3% in FY20 owing to higher depreciation and higher interest outgo. We believe volume recovery, improved operating leverage and rising contribution from high-margin LMT business will drive 220bps expansion in MNDA’s NPM to 5.2% over FY20-FY23E.
3.7%
3.1%
0.4%
2.5%
4.2%
4.9%
6.3%
4.8%
3.0%
1.1%
4.4%
5.2%
0.0%
1.0%
2.0%
3.0%
4.0%
5.0%
6.0%
7.0%
0
500
1,000
1,500
2,000
2,500
3,000
3,500
4,000
4,500
5,000
FY11 FY12 FY14 FY15 FY16 FY17 FY18 FY19 FY20 FY21E FY22E FY23E
Net Profit (Rs mn) NPM (%, RHS)
Exhibit 55: Return Ratios Trend
Source: Company, RSec Research
RoE & RoCE to Improve from FY20 LevelWe expect to MNDA’s return ratios to improve from the FY20 level, though it would remain below its historical peak level due to addition of low-margin Harita Seating business and overall margin pressure. Whilst its return ratios are expected to remain subdued over FY21-FY22E due to slow ramp-up of new businesses and lower initial utilisation of new facilities, we expect meaningful improvement from FY23E onwards.
0.0%
5.0%
10.0%
15.0%
20.0%
25.0%
30.0%
FY11 FY12 FY14 FY15 FY16 FY17 FY18 FY19 FY20 FY21E FY22E FY23E
ROE ROCE (RHS)
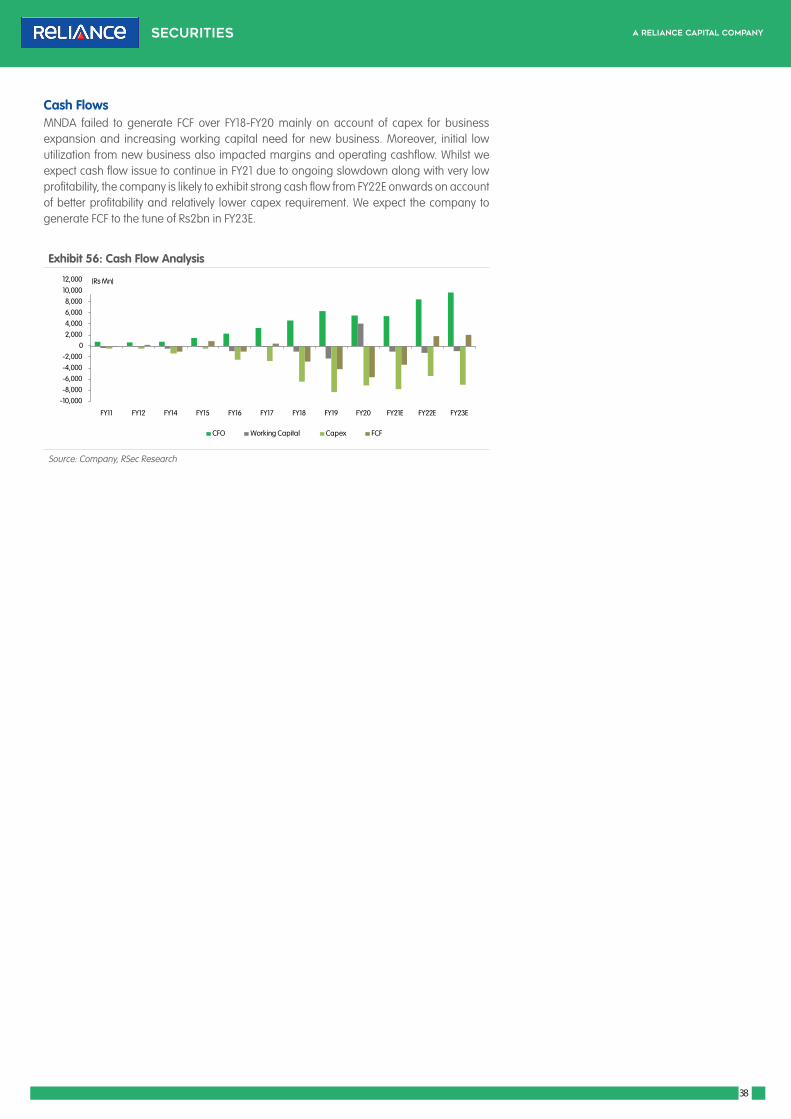
38
Exhibit 56: Cash Flow Analysis
Source: Company, RSec Research
Cash FlowsMNDA failed to generate FCF over FY18-FY20 mainly on account of capex for business expansion and increasing working capital need for new business. Moreover, initial low utilization from new business also impacted margins and operating cashflow. Whilst we expect cash flow issue to continue in FY21 due to ongoing slowdown along with very low profitability, the company is likely to exhibit strong cash flow from FY22E onwards on account of better profitability and relatively lower capex requirement. We expect the company to generate FCF to the tune of Rs2bn in FY23E.
-10,000-8,000-6,000-4,000-2,000
02,0004,0006,0008,000
10,00012,000
FY11 FY12 FY14 FY15 FY16 FY17 FY18 FY19 FY20 FY21E FY22E FY23E
CFO Working Capital Capex FCF
(Rs Mn)

39
Profit & Loss Statement (Consolidated)
Y/E Mar (Rs mn) FY19 FY20E FY21E FY22E FY23E
Net revenue 59,081 54,651 56,522 74,322 83,340
Expenditure 51,829 48,460 51,278 65,279 72,804
Raw Materials 36,225 32,841 34,478 44,965 50,337
Employee Expenses 7,913 8,468 8,720 10,464 11,301
Other expenditure 7,691 7,151 8,080 9,851 11,165
EBITDA 7,252 6,192 5,244 9,043 10,536
Depr. and amortization expense 2,344 3,019 3,551 3,878 4,132
EBIT 4,908 3,173 1,693 5,164 6,404
Non-operating income 270 393 353 442 552
Interest including finance charges 632 902 1,127 994 931
Adjusted pre-tax profit 4,547 2,663 920 4,612 6,025
Extra Ordinary Exp - 141 - - -
Reported pre-tax profit 4,547 2,522 920 4,612 6,025
Less: taxes 1,341 775 193 1,015 1,325
Reported net profit 3,206 1,747 726 3,597 4,699
Add: Associate/JV Income 189 130 13 130 208
Less: minority Int 539 328 145 463 560
Reported net profit for shareholders 2,856 1,550 594 3,264 4,347
Adjusted net profit for shareholders 2,856 1,647 594 3,264 4,347
EPS (Rs), based on fully diluted shares 10.9 6.3 2.1 11.5 15.3
Fully diluted shares outstanding (mn) 262 262 284 284 284
Balance Sheet Statement (Consolidated)
Y/E Mar (Rs mn) FY19 FY20E FY21E FY22E FY23E
Equity capital 524 524 568 568 568
Reserves and surplus 16,517 17,633 20,474 23,358 27,325
Total equity 17,042 18,157 21,042 23,926 27,893
Minority Interest 2,667 2,828 2,973 3,436 3,996
Deferred tax liability (net) 1,788 2,105 2,105 2,105 2,105
Total borrowings 10,796 12,953 13,253 13,253 12,753
Current liabilities 10,013 12,345 11,438 14,329 15,751
Total liabilities 42,306 48,389 50,812 57,049 62,498
Cash and cash equivalents 1,101 3,278 1,391 2,044 2,466
Inventory 5,610 5,553 5,620 6,796 7,580
Trade receivables 8,992 7,264 8,517 11,199 12,558
Total current assets 15,703 16,095 15,527 20,040 22,603
Gross block 23,842 30,252 35,572 39,822 45,572
Less: depreciation and amortization 5,230 8,292 11,843 15,721 19,854
Add: capital work-in-process 1,501 3,571 1,750 2,500 3,250
Total fixed assets 20,113 25,530 25,479 26,601 28,968
Investments 3,556 3,722 7,998 8,423 8,850
Other assets 2,935 3,042 1,807 1,985 2,076
Total assets 42,306 48,389 50,812 57,049 62,498

40
Cash Flow Statement (Consolidated)
Y/E Mar (Rs mn) FY19 FY20E FY21E FY22E FY23E
Operating cashflow
Pre-tax income 4,547 2,522 920 4,612 6,025
Add: depreciation and amortization 2,344 3,019 3,551 3,878 4,132
Add: interest expense (net) 578 809 1,127 994 931
Less: other adjustments 59 320 - - -
Less: taxes paid (1,154) (1,112) (193) (1,015) (1,325)
Add: working capital changes (2,234) 4,093 (993) (1,146) (811)
Total operating cashflow 4,140 9,651 4,411 7,324 8,952
Investing cashflow
Capital expenditure (6,542) (5,313) (3,500) (5,000) (6,500)
Investments (1,713) (2,336) (4,276) (426) (427)
Others 102 254 - - -
Total investing cashflow (8,152) (7,395) (7,776) (5,426) (6,927)
Financing cashflow
Share issuances 81 - 2,428 - -
Loans 4,575 526 300 - (500)
Dividend (354) (451) (380) (380) (380)
Interest Payment (618) (748) (1,127) (994) (931)
Less: Others 173 769 256 130 208
Total financing cashflow 3,858 95 1,477 (1,244) (1,604)
Net change in cash (155) 2,351 (1,888) 654 421
Opening cash 1,256 928 3,278 1,391 2,044
Closing cash 1,101 3,278 1,391 2,044 2,466
Key Ratios
Y/E Mar FY19 FY20E FY21E FY22E FY23E
Growth Ratios (%)
Net revenue 32.2 (7.5) 3.4 31.5 12.1
EBITDA 35.8 (14.6) (15.3) 72.5 16.5
Adjusted net profit 1.6 (42.3) (63.9) 449.1 33.2
Ratios (%)
Effective tax rate 29.5 30.7 21.0 22.0 22.0
EBITDA margin 12.3 11.3 9.3 12.2 12.6
Adjusted net income margin 4.8 3.0 1.1 4.4 5.2
ROaCE 11.8 6.6 3.9 9.8 11.3
ROaE 18.2 9.3 3.0 14.4 16.7
Total asset turnover ratio (x) 1.6 1.2 1.1 1.4 1.4
Inventory days 35 37 36 33 33
Debtor days 56 49 55 55 55
Creditor days 52 67 59 59 59
Per share numbers (Rs)
Diluted earnings 10.9 6.3 2.1 11.5 15.3
Free cash (9.2) 16.5 3.2 8.2 8.6
Book value 65.0 69.2 74.2 84.3 98.3
Valuations (x)
P/E 31.1 54.0 161.8 29.5 22.1
EV/EBITDA 13.6 15.9 20.6 11.9 10.1
P/B 5.2 4.9 4.6 4.0 3.4

41
Minda Industries Ltd. (MNDA), a part of UNO Minda Group, was incepted in 1958. It has six decades of experience in automotive ancillary business. It supplies a wide range of automotive components to the OEMs. The company has various joint ventures (JVs) and subsidiaries both in India and overseas. It has a diversified range of products which is supplied to 2W and 4W manufacturers. MNDA manufactures Switches, lighting, acoustic, infotainment systems, driver parking assistance (DAPS), airbags, sensors, alternative fuel systems, air filtration systems, canisters, brake hoses, fuel hoses, fuel caps, combined braking systems (CBS), noise suppressor cap, PDC parts, alloy wheels, seat belts, cameras, steering wheel, air brakes, air ducts, washer bottle, spoiler, body sealing, handle bar assembly, cigar lighters, wheel covers, shifters, speakers, actuators, controllers, relay, end-to-end telematics, connected car solutions and seating systems. The company has a strong clientele base consisting of Bajaj Auto, HMSI, Maruti Suzuki, Honda, M&M, Hyundai, Tata Motors, Toyota, and Volkswagen etc. It has 62 manufacturing plants in India, Indonesia, Vietnam, Spain, Morocco, Mexico, Colombia, and Germany and design centers in Taiwan, Japan and Spain. Its corporate structure is slightly complex, encompassing 16 direct subsidiaries, 12 step-down subsidiaries, 8 JVs, 2 associates as of FY20.
Company Overview
Pioneer in localization: through JVs and associates
Source: Company

42
MNDA’s consolidated corporate structure (as of 2020)
Source: Company
Key Promoters
Name Designation Brief Profile
Mr. Nirmal K Minda
Chairman & Managing Director
Mr. Minda has rich experience of more than three decades in auto components industry. He has been instrumental in forging new alliances / JV / partnership with globally renowned names. He has served as the Chairman of ACMA (Northern Region) for three consecutive years, followed by Vice President for 2016-17, President of ACMA for the year 2017-18.
Mr. Anand K Minda
Non-Executive DirectorMr. Minda has over 35 years of experience in the field of financial control, reviews, manufacturing, and project management. He has been appointed as the member of board since 2011. He plays a pivotal role in new projects and strategy formulation.
Mr. Amit JainCEO- Advance Electronics Domain & CTO
Mr. Jain has 21 years of experience in the automotive industry. Prior to joining UNO Minda group, he was associated with Visteon Corporation as its Country Head (Electronics)
Mr. Sunil BohraED & Group Chief Financial Officer
Mr. Bohra is a member of the Institute of Chartered Accountant of India and alumni of the Harvard Business School. Prior to UNO Minda group, he has worked with Vedanta Group for ~2 decades. He has in-depth experience in setting up systems and processes, formulating new strategies and developing organization structures to facilitate growth.
Source: Company
Key Milestones
1958 f Commenced operations as ammeter manufacturer for Royal Enfield
1960 f Ventured into automotive switches
1980 f Started manufacturing of automotive lighting products
1993 f Entered into 4W switches space through associate company i.e. Mindarika Pvt. Ltd. (later converted into subsidiary)
2000s f Forayed into batteries, blow-moulded products, alternative fuel kits and aluminum die casting products
2013 f Acquired Spain's Clarton Horns, a leading European horn manufacturer
2015 f Formed JV with Kosei for 4W alloy wheels
2016 f Gained access to LED technology with the acquisition of Spain's Rinder Group
2017 f Formed JV with Katolec (EMS) and Onkyo (infotainment accessories)
2018 f Entered into agreements for upcoming technologies like ADAS, BS-VI related high-end sensors
2019 f Acquired Harita Seating Systems, Delvis GmBH & KPIT Technologies' telematics hardware division
Source: Company
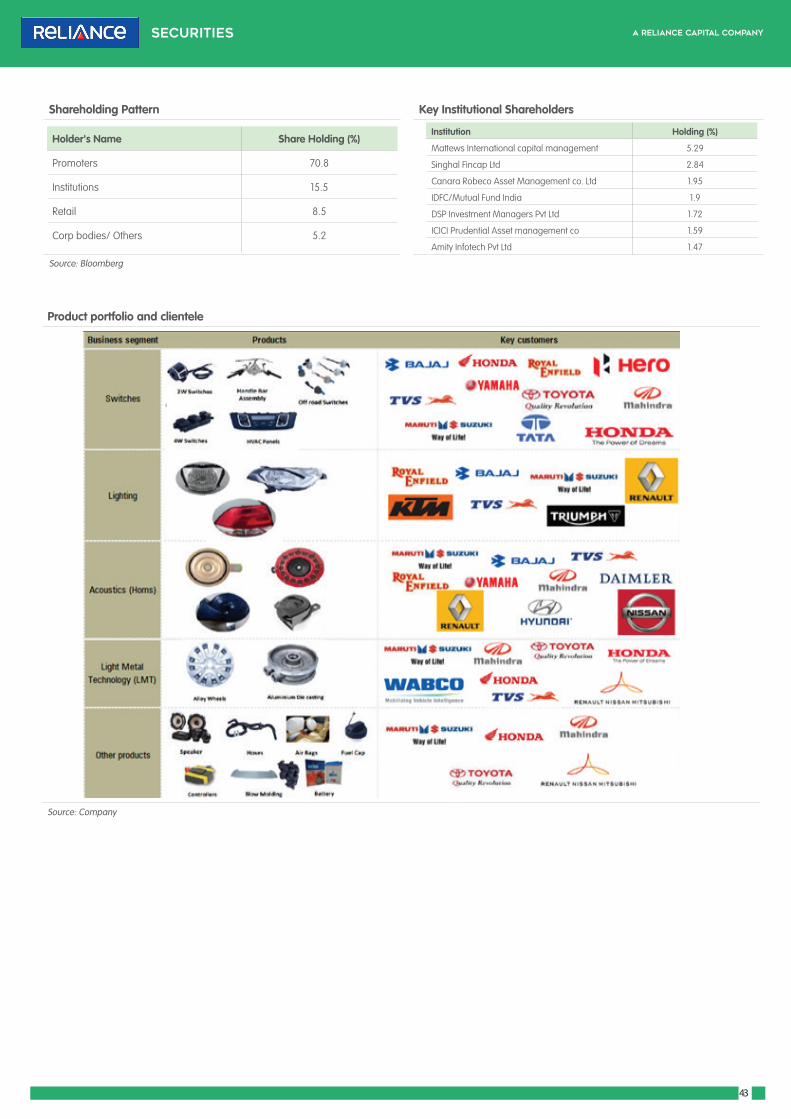
43
Shareholding Pattern Key Institutional Shareholders
Source: Bloomberg
Holder's Name Share Holding (%)
Promoters 70.8
Institutions 15.5
Retail 8.5
Corp bodies/ Others 5.2
Institution Holding (%)
Mattews International capital management 5.29
Singhal Fincap Ltd 2.84
Canara Robeco Asset Management co. Ltd 1.95
IDFC/Mutual Fund India 1.9
DSP Investment Managers Pvt Ltd 1.72
ICICI Prudential Asset management co 1.59
Amity Infotech Pvt Ltd 1.47
Product portfolio and clientele
Source: Company

44
Reliance Securities Limited (RSL), the broking arm of Reliance Capital is one of the India’s leading retail broking houses. Reliance Capital is amongst India’s leading and most valuable
financial services companies in the private sector. Reliance Capital has interests in asset management and mutual funds, life and general insurance, commercial finance, equities and
commodities broking, wealth management services, distribution of financial products, private equity, asset reconstruction, proprietary investments and other activities in financial services.
The list of associates of RSL is available on the website www.reliancecapital.co.in. RSL is registered as a Research Analyst under SEBI (Research Analyst) Regulations, 2014
General Disclaimers: This Research Report (hereinafter called ‘Report’) is prepared and distributed by RSL for information purposes only. The recommendations, if any, made herein are
expression of views and/or opinions and should not be deemed or construed to be neither advice for the purpose of purchase or sale of any security, derivatives or any other security
through RSL nor any solicitation or offering of any investment /trading opportunity on behalf of the issuer(s) of the respective security(ies) referred to herein. These information / opinions /
views are not meant to serve as a professional investment guide for the readers. No action is solicited based upon the information provided herein. Recipients of this Report should rely
on information/data arising out of their own investigations. Readers are advised to seek independent professional advice and arrive at an informed trading/investment decision before
executing any trades or making any investments. This Report has been prepared on the basis of publicly available information, internally developed data and other sources believed by
RSL to be reliable. RSL or its directors, employees, affiliates or representatives do not assume any responsibility for, or warrant the accuracy, completeness, adequacy and reliability of such
information / opinions / views. While due care has been taken to ensure that the disclosures and opinions given are fair and reasonable, none of the directors, employees, affiliates or
representatives of RSL shall be liable for any direct, indirect, special, incidental, consequential, punitive or exemplary damages, including lost profits arising in any way whatsoever from the
information / opinions / views contained in this Report.
Risks: Trading and investment in securities are subject to market risks. There are no assurances or guarantees that the objectives of any of trading / investment in securities will be achieved.
The trades/ investments referred to herein may not be suitable to all categories of traders/investors. The names of securities mentioned herein do not in any manner indicate their prospects
or returns. The value of securities referred to herein may be adversely affected by the performance or otherwise of the respective issuer companies, changes in the market conditions,
micro and macro factors and forces affecting capital markets like interest rate risk, credit risk, liquidity risk and reinvestment risk. Derivative products may also be affected by various risks
including but not limited to counter party risk, market risk, valuation risk, liquidity risk and other risks. Besides the price of the underlying asset, volatility, tenor and interest rates may affect
the pricing of derivatives.
Disclaimers in respect of jurisdiction: The possession, circulation and/or distribution of this Report may be restricted or regulated in certain jurisdictions by appropriate laws. No action
has been or will be taken by RSL in any jurisdiction (other than India), where any action for such purpose(s) is required. Accordingly, this Report shall not be possessed, circulated and/
or distributed in any such country or jurisdiction unless such action is in compliance with all applicable laws and regulations of such country or jurisdiction. RSL requires such recipient to
inform himself about and to observe any restrictions at his own expense, without any liability to RSL. Any dispute arising out of this Report shall be subject to the exclusive jurisdiction of the
Courts in India.
Disclosure of Interest: The research analysts who have prepared this Report hereby certify that the views /opinions expressed in this Report are their personal independent views/opinions
in respect of the securities and their respective issuers. None of RSL, research analysts, or their relatives had any known direct /indirect material conflict of interest including any long/short
position(s) in any specific security on which views/opinions have been made in this Report, during its preparation. RSL’s Associates may have other potential/material conflict of interest
with respect to any recommendation and related information and opinions at the time of publication of research report. RSL, its Associates, the research analysts, or their relatives might
have financial interest in the issuer company(ies) of the said securities. RSL or its Associates may have received a compensation from the said issuer company(ies) in last 12 months for the
brokerage or non brokerage services.RSL, its Associates, the research analysts or their relatives have not received any compensation or other benefits directly or indirectly from the said
issuer company(ies) or any third party in last 12 months in any respect whatsoever for preparation of this report.
The research analysts has served as an officer, director or employee of the said issuer company(ies)?: No
RSL, its Associates, the research analysts or their relatives holds ownership of 1% or more, in respect of the said issuer company(ies).?: No
Copyright: The copyright in this Report belongs exclusively to RSL. This Report shall only be read by those persons to whom it has been delivered. No reprinting, reproduction, copying,
distribution of this Report in any manner whatsoever, in whole or in part, is permitted without the prior express written consent of RSL.
RSL’s activities were neither suspended nor have defaulted with any stock exchange with whom RSL is registered. Further, there does not exist any material adverse order/judgments/
strictures assessed by any regulatory, government or public authority or agency or any law enforcing agency in last three years. Further, there does not exist any material enquiry of
whatsoever nature instituted or pending against RSL as on the date of this Report.
Important These disclaimers, risks and other disclosures must be read in conjunction with the information / opinions / views of which they form part of.
RSL CIN: U65990MH2005PLC154052. SEBI registration no. (Stock Broker: INZ000172433, Depository Participants: CDSL IN-DP-257-2016 IN-DP-NSDL-363-2013, Research Analyst:
INH000002384); AMFI ARN No.29889.
Change in Ratings
We have now only BUY and SELL Recommendation and have discontinued HOLD Recommendation.
We now have 2 Year Target Price and have discontinued with 1 year Target Price.