Hindalco Industries Limited
33
Hindalco Industries Limited Q4 & FY20 Earnings Presentation 12 th June, 2020
-
Upload
khangminh22 -
Category
Documents
-
view
3 -
download
0
Transcript of Hindalco Industries Limited

Hindalco IndustriesLimited
Q4 & FY20 Earnings Presentation12th June, 2020

EXCELLENCE BY DESIGNHindalco Industries Limited 2
SAFE HARBOUR
Certain statements in this report may be “forward looking statements” within the meaning of applicablesecurities laws and regulations. Actual results could differ materially from those expressed or implied.Important factors that could make a difference to the company’s operations include global and Indiandemand supply conditions, finished goods prices, feed stock availability and prices, cyclical demand andpricing in the company’s principal markets, changes in Government regulations, tax regimes, economicdevelopments within India and the countries within which the company conducts business and other factorssuch as litigation and labour negotiations. The company assume no responsibility to publicly amend, modifyor revise any forward looking statement, on the basis of any subsequent development, information orevents, or otherwise.

EXCELLENCE BY DESIGNHindalco Industries Limited
Table of Content
3
Key Highlights – Q4 FY20 vs. Q4 FY19
08
14Business Performance Highlights : Operational & Financial – Q4 & FY20- Novelis - Aluminium (Hindalco Aluminium including Utkal Alumina)- Copper
Economy & Industry Updates – Global & Domestic
05
Annexures :- Awards & Recognitions 2019-20 - Result Tables – Q4 & FY20 Consolidated & India Business
29
• Novelis
• Aluminium
(India)
• Copper
COVID 19 - Actions to Maintain Safety, Operational Stability & Liquidity 04

EXCELLENCE BY DESIGNHindalco Industries Limited 4
COVID 19 - Actions to Maintain Safety, Operational Stability & Liquidity
All four Aluminum smelters in India continue to operate’ with a minimal workforce. Currently exporting more than 80% of total output to minimize inventory risk and absorbing plant fixed costs
Aluminium downstream plants have started operations after initial temporary shutdown and are now operating in-line with existing low market demand and Government directives
Copper smelters, CC Rods and DAP plants have started operations, after initial temporary shutdowns and are now stabilizing to reach optimal levels
Temporarily or partial shutdowns in Novelis’ automotive plants across regions due to customer shutdowns or reduced demand, or by government decree. The plant schedules are being adjusted in-line with the latest customer demand.
All CapEx excluding maintenance and essential CapEx are curtailed for the next year in India and Novelis.
Focussed fixed cost reduction and maintaining adequate liquidity to sustain operations.
Top priority to help ensure the safety, health and well-being of all our employees, facilities and communities across all locations
Continue to take precautions with all the workforce and surroundings to ensure that this infection – COVID, remains at bay
As a precaution, many employees at offices in metropolitan areas, have been asked to Work from Home as much as possible until the situation is normalised and under control.
All non-essential business travel has been suspended
Emphasized adequately on community care and conducting drives in nearby surroundings of our plants, distributing masks/ sanitizers/PPE, providing food & shelters etc.
Undertaking further stringent measures to remain safe and maintain functional check and balance by way of Social-Distancing, Sanitization, Surveillance, Surrounding, Sequencing and Stress-testing.
Safety & Community Maintain Stable Operations with Adequate Liquidity

EXCELLENCE BY DESIGNHindalco Industries Limited
Key Highlights – Q4 FY20 vs. Q4 FY19
5

EXCELLENCE BY DESIGNHindalco Industries Limited
EBITDA at Rs. 1,039 crore (vs. Rs. 1,010 crore), up 3% YoY, despite challenging macro environment
Recorded a healthy EBITDA margin of 20% (vs. 17%), best in the industry
Aluminium metal production at 327 Kt (vs. 321 Kt ) up 2% YoY
Aluminium metal sales at 314 Kt (vs. 325 Kt ) down 3% YoY, due to lock down
Aluminium VAP (excluding wire rods) sales at 76 Kt (vs 83 kt ) down 8% YoY, due to lock down
Highest ever quarterly production of 441 Kt by Utkal Alumina, world’s most economical alumina producer
Successful revival and ramp-up of Muri Alumina to re-strengthen the integrated value chain
Uktal Alumina capacity expansion of 500 Kt is on track and expected to be commissioned in Q4 FY21
Net Income (excluding special items#) at US$ 153 million up 18% YoY
Highest ever quarterly adjusted EBITDA of US$ 383 million, up 7% YoY
Highest ever quarterly adjusted EBITDA per ton at US $472, up 15% YoY
Strong liquidity position of $2.6 billion on March 31, 2020
Completed acquisition of Aleris on 14th April ‘20 and integration process has commenced while drivingsynergies and long-term value
6
Key Highlights : Q4 FY20 (vs. Q4 FY19)
* As per US GAAP
#*Tax-effected special items includes restructuring & impairment, metal price lag, gain/loss on assets held for sale, loss on extinguishment of debt, loss on sale of business, business acquisition and other integration costs
Aluminium (Hindalco
including Utkal Alumina)
Novelis*

EXCELLENCE BY DESIGNHindalco Industries Limited 7
Key Highlights : Q4 FY20 (vs. Q4 FY19) .Contd.
EBITDA at Rs. 406 crores, up 9%, YoY; EBITDA margin at 9%
Highest ever quarterly VAP (CC Rod) production of 71kt with of growth 15% YoY
VAP Sales (CC Rods) at 73 kt, up 4% YoY; share of VAP sales at 86% of total volumes in Q4 FY20.
Overall Metal Sales volume at 86 Kt lower by 14% YoY, impact by the lock down in Mar ’20
Benchmark Tc/Rc for CY20 is settled at 15.9 cents/lb, lower by 23% from CY19.
Copper
Consolidated EBITDA at Rs. 4,173 crore (vs. Rs. 3,938 crore), up 6% YoY
Recorded Consolidated EBITDA margin at 14% (vs. 12%), mainly contributed by Novelis
Consolidated Profit Before Exceptional Items and Tax at Rs. 1,395 crore (vs. Rs. 1,725 crore in Q4 FY19); impact ofone-time refinancing cost of Rs. 568 crore in Novelis.
Consolidated PAT at Rs. 668 crore (vs. Rs. 1,178 crore in Q4 FY19)
Novelis successfully issued US$ 1.6 billion bonds at an attractive rate of 4.75% due in 2030, to repay itsexisting US$ 1.15 billion bonds due in 2024
Strong Cash position as on March 31, 2020 - Novelis - $ 2.4 billion; India – ~Rs. 9,900 Crore
Consolidated Net Debt to EBITDA at 2.61x as at 31st Mar. 2020 (vs. 2.48x as at March 31, 2019)
Hindalco (Consolidated)

EXCELLENCE BY DESIGNHindalco Industries Limited
Economy & Industry Updates:
Global & Domestic
8

EXCELLENCE BY DESIGNHindalco Industries Limited
3.5 3.5 3.6 3.5 3.43.8 3.6
2.9
-3.0
CY
12
CY
13
CY
14
CY
15
CY
16
CY
17
CY
18
CY
19
CY
20 E
5.5
6.4
7.48.0 8.3
7.0
6.1
4.2
FY13 FY14 FY15 FY16 FY17 FY18 FY19 FY20
9
Economy Updates
IMF's April ‘20 forecast of (-)3% contraction in the global GDPgrowth in CY20 vs. 2.9% growth in CY19, is much worse than the2008-09 global financial crisis. This contraction is expected mainlydue to the impact of COVID 19, however, full impact of this healthcrisis on the global growth is yet to be ascertained.
Both emerging and advanced economies are expected to de-growin CY20 with the extent of de-growth much more in advancedeconomies
Key risks to watch -Re-emergence of US- China tensions
India GDP growth in Q4 FY20 was at a low of 3.1%. As a result,the FY20 GDP growth fell to a 11 year low to 4.2%. Thisslowdown was primarily led by manufacturing and constructionsector
Monthly indicators (like IIP, PMI, car sales etc.) showed a sharpde-growth in the economic activity in Q1 FY21.
The RBI projects a negative growth in FY21 Govt. of India has announced an economic stimulus package of
10% of GDP to revive the Economic Growth majorly hit by COVID
Global GDP Growth (% YoY) India GDP Growth (% YoY)

EXCELLENCE BY DESIGNHindalco Industries Limited
21592259
20571971
1,859 1793 1,762 1,752
1690
15% fall in global aluminium prices
10
Aluminium Industry – Global Market
Global consumption declined by (-)1.6% in CY19 vs growth of 3.2% in CY18
Consumption in World ex.China declined in CY19 by (-)3.5% vs. growth of 2% in CY18;
In China, consumption de-grew marginally by (-)0.1% in CY19 vs. growth 4.1% in CY18.
In Q1 CY20, in backdrop of COVID 19, global consumption declined by (-) 9.3%
Consumption in World Ex. China declined in CY19 by (-) 8.6%
In China, consumption declined by (-)9.8% in CY19
Global aluminium prices also witnessed decline of 15% in CY19 to US$ 1,791/t vs. previous year ; In Q1 CY20, prices further declined to $1690/t
Global Demand & Supply Balance (Mt) Global Price of Aluminium (Cash -$/T)
27.7 28.0 6.8 7.0
29.4 28.4 7.2 6.6
1.70.4 0.4 0.4
36.2 35.1
8.7 8.9
35.8 35.8
8.0 7.2 0.4
0.70.7
1.7
World Ex China China
63.9 63.1 15.5 15.9 65.2 64.2 15.3 13.9 -1.3 -1.1 0.3 2.1
Production Consumption Metal Balance
CY18 : $2,110 CY19 :$1,791

EXCELLENCE BY DESIGNHindalco Industries Limited
376 422 393 463
1654
414 403 358 376
1550556 607 605 549
2318
583 554 503 529
2170
Apr-Jun18 Jun-Sep18 Oct-Dec18 Jan-Mar19 FY 19 Apr-Jun19 Jun-Sep19 Oct-Dec19 Jan-Mar20 E FY 20 E
Domestic Sales Imports
11
Aluminium Industry – Domestic Market
Domestic Demand (Kt)
Domestic consumption in FY20 declined by (-)6% to 3,720 Kt
Imports including scrap de-grew by (-)6% to 2,170 Kt in FY20 ; Domestic sales declined by (-)6% to 1,550 Kt in FY20
Domestic consumption in Q4 FY20 declined by (-)11% YoY, to 905 Kt
Imports including scrap de-grew by (-)4% to 529 Kt in Q4 FY20 ; Domestic sales sharply declined by (-)19% to 376 Kt in Q4 FY20
931 1,029 999 1,013 3,972 996 957 861 905 3,720
EXCELLENCE BY DESIGNHindalco Industries Limited 12
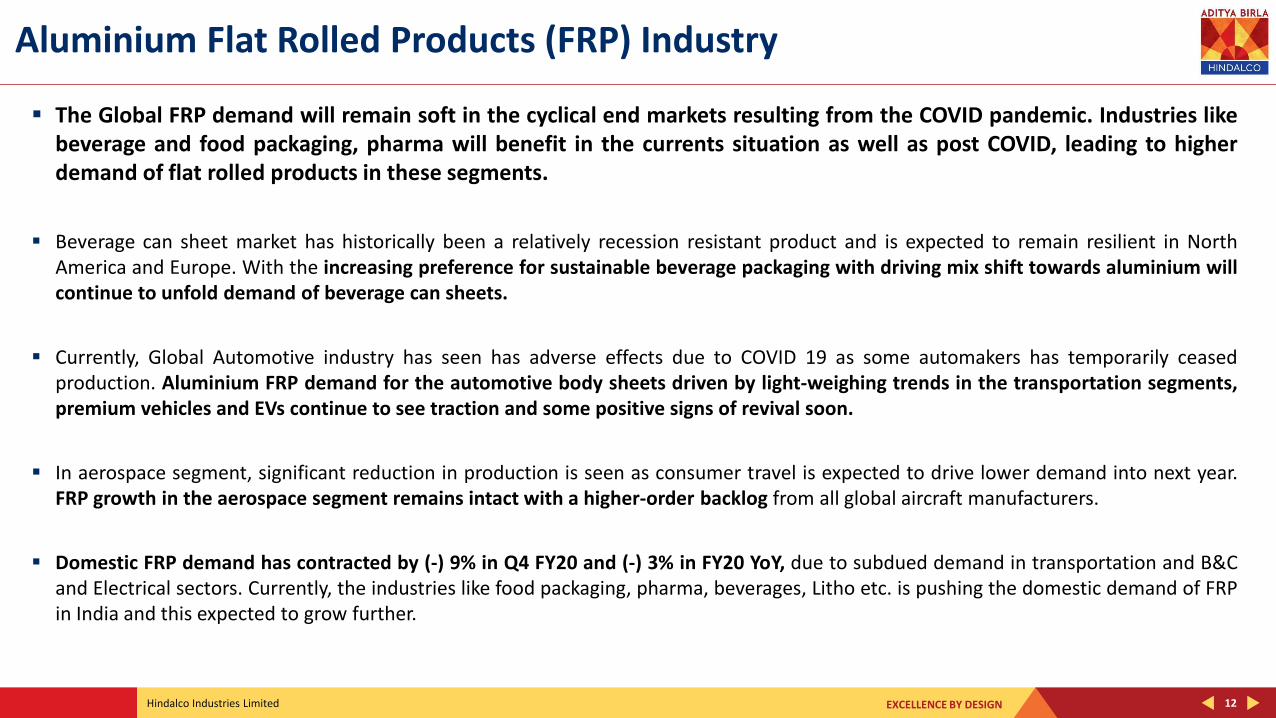
Aluminium Flat Rolled Products (FRP) Industry
The Global FRP demand will remain soft in the cyclical end markets resulting from the COVID pandemic. Industries likebeverage and food packaging, pharma will benefit in the currents situation as well as post COVID, leading to higherdemand of flat rolled products in these segments.
Beverage can sheet market has historically been a relatively recession resistant product and is expected to remain resilient in NorthAmerica and Europe. With the increasing preference for sustainable beverage packaging with driving mix shift towards aluminium willcontinue to unfold demand of beverage can sheets.
Currently, Global Automotive industry has seen has adverse effects due to COVID 19 as some automakers has temporarily ceasedproduction. Aluminium FRP demand for the automotive body sheets driven by light-weighing trends in the transportation segments,premium vehicles and EVs continue to see traction and some positive signs of revival soon.
In aerospace segment, significant reduction in production is seen as consumer travel is expected to drive lower demand into next year.FRP growth in the aerospace segment remains intact with a higher-order backlog from all global aircraft manufacturers.
Domestic FRP demand has contracted by (-) 9% in Q4 FY20 and (-) 3% in FY20 YoY, due to subdued demand in transportation and B&Cand Electrical sectors. Currently, the industries like food packaging, pharma, beverages, Litho etc. is pushing the domestic demand of FRPin India and this expected to grow further.

EXCELLENCE BY DESIGNHindalco Industries Limited
8.9 9.22.4 2.2
11.7 11.82.6 2.0
14.4 14.0
3.5 3.5
11.8 11.5
2.9 2.9
23.2 23.3
5.9 5.7
23.5 23.3
5.5 4.9
China World Ex China124 106 98 93 116
442 41472 89 92 99 56
289 335
Jan- Mar '19 Apr-June'19 July-Sep'19 Oct-Dec '19 Jan-Mar '20 FY19 FY20
Domestic Sales Imports
13
Copper Industry
Key Macro Drivers (FY20 vs FY19)
TC/RC (US Cents/lb) S. Acid Price (Rs./Mt) DAP Realization (Rs./Mt)
Global refined copper consumption declined by (-) 0.7% in CY19 vs. growth of 2.9% in CY18. China grew by 1% whereas World ex. China saw a dip of (-) 2.3% in CY19.
Owing to COVID crisis, global refined copper consumption plunged by 10% in Q1 CY20 on Y-o-Y basis. All of this de-growth has come from China that slump by 22%, whereas World ex China remained flat.
Concentrate consumption in CY19 increased by 1.6% to 16.8 Mt; Market deficit in CY19 is 168 Kt vs. surplus of 141 Kt in CY18.
Q1 CY20 saw a dip in concentrate consumption by (-)2.7%. At 4.1 Mt on Y-o-Y basis.
In FY20, Refined copper market Increased by 2.5% to 750 KT as compared to 731 KT of FY19.
In Q4 FY20, sales of domestic producers contracted by (-)6% (to 116 Kt) and imports contracted by 23% (to 56 Kt) vs same quarter last year.
Market share of imports decreased to 32% in Q4 FY20 vs. 37% in Q4 FY19 owing to the CVD imposed on imports from ASEAN region.
Domestic Demand (KT)Global Demand & Supply Balance (in Mt)
Production Consumption
196 195172
731 750
190 192

EXCELLENCE BY DESIGNHindalco Industries Limited
Business Performance Highlights : Q4 & FY20
14

EXCELLENCE BY DESIGNHindalco Industries Limited
Novelis
15

EXCELLENCE BY DESIGNHindalco Industries Limited
870 797 811
3,274 3,273
Q4 FY19 Q3 FY20 Q4 FY20 FY19 FY20
16
Operational Performance - Novelis
Overall Shipments (KT)
66%
19%
15%
FY20
Can Automotive Specialities
Shipment Mix (%)
63%20%
17%
FY19
Can Automotive Specialities
Novelis is well positioned to navigate near-term uncertainty and extend industryleadership
Total shipments were flat, YoY at 3,273 Kt in FY20 with Can sheet shipments up by4% YoY
Can sheet shipments were 66% of the total product mix in FY20 (vs. 63% in FY19)
Committed to all its organic expansions projects in US, China and Brazil
Aleris acquisition update :
On April 14, 2020, Novelis completed its acquisition of Aleris andintegration process has commenced while to driving synergies with priorityas the safe integration of new employees and facilities.
Divestment procedures for automotive assets in Lewisport in the US andDuffel in Europe are underway.
Further product diversification with addition of high-end aerospace andexpanded speciality capabilities with addition of Aleris
Utilizing high levels of recycled content at 60 % in FY20
Strong Liquidity position of $2.6 billion with cash and cash equivalents of $2.4billion at the end of March 31, 2020
EXCELLENCE BY DESIGNHindalco Industries Limited
410 430 472
418 450
Q4 FY19 Q3 FY20 Q4 FY20 FY19 FY20
357 343 383
1,368 1,472
Q4 FY19 Q3 FY20 Q4 FY20 FY19 FY20
3.1 2.7 2.7
12.311.2
Q4 FY19 Q3 FY20 Q4 FY20 FY19 FY20
17
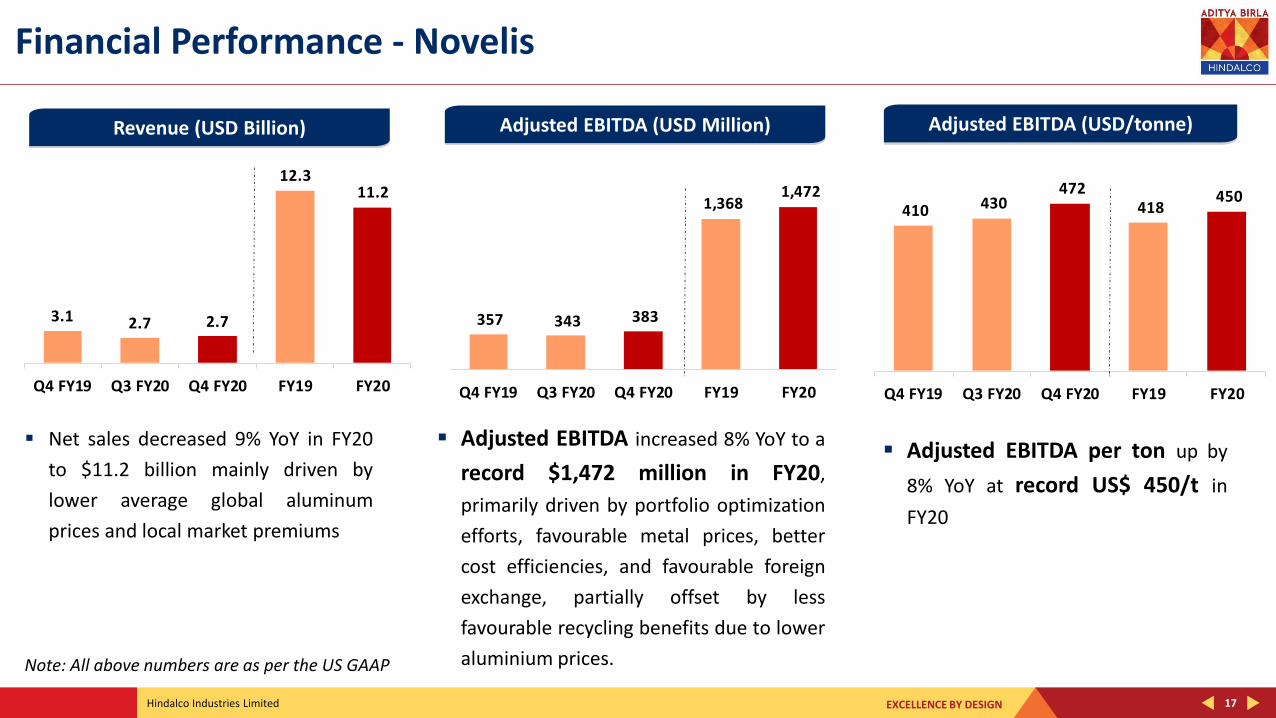
Financial Performance - Novelis
Revenue (USD Billion) Adjusted EBITDA (USD Million) Adjusted EBITDA (USD/tonne)
Adjusted EBITDA per ton up by
8% YoY at record US$ 450/t in
FY20
Net sales decreased 9% YoY in FY20
to $11.2 billion mainly driven by
lower average global aluminum
prices and local market premiums
Note: All above numbers are as per the US GAAP
Adjusted EBITDA increased 8% YoY to a
record $1,472 million in FY20,
primarily driven by portfolio optimization
efforts, favourable metal prices, better
cost efficiencies, and favourable foreign
exchange, partially offset by less
favourable recycling benefits due to lower
aluminium prices.

EXCELLENCE BY DESIGNHindalco Industries Limited
Aluminium (Hindalco Aluminium including Utkal)
18

EXCELLENCE BY DESIGNHindalco Industries Limited
81 80 79
320 319
Q4 FY19 Q3 FY20 Q4 FY20 FY19 FY20
321 330 327
1,295 1,314
Q4 FY19 Q3 FY20 Q4 FY20 FY19 FY20
749 662 720
2,893 2,735
Q4 FY19 Q3 FY20 Q4 FY20 FY19 FY20
19
Production – Alumina, Aluminium Metal & VAP
In Q4 FY20, Aluminium Metal Production
was higher by 2%, YoY
In FY20, Aluminium metal
production was all-time high at 1,314
Kt up 1% YoY, despite some disruption due
to the COVID 19 in March 2020
Aluminium Metal (KT) Aluminium VAP# (KT)Alumina* (Inc. Utkal Alumina) KT
Muri Alumina plant re-started
production in December 2019
In FY20, Utkal Alumina refinery
recorded its best ever performance
with a record production
*Hydrate as Alumina# Excluding Wire Rods
In Q4 FY20, Aluminum VAP production
was lower by 3% YoY.
In FY20, Aluminium VAP production
was flat, YoY

EXCELLENCE BY DESIGNHindalco Industries Limited 20
Sales Volume – Aluminium Metal & VAP
Aluminium Metal Sales in all forms (KT) Aluminium VAP# (KT)
In Q4 FY20, Aluminium VAP Sales was lower by 8%
YoY, due to lower off take on account of COVID 19
In FY20, Aluminium VAP sales were up 2% YoY ;
Share of Aluminium VAP was maintained at 24%
of total metal sales in FY20
# Excluding Wire Rods
In Q4 FY20, Aluminium Metal Sales was lower by
3% YoY, due to COVID impact
In FY20, Recorded highest ever Aluminium
metal sales of 1290 Kt, up 1% YoY, despite
challenging market conditions
325 328 314
1,274 1,290
Q4 FY19 Q3 FY20 Q4 FY20 FY19 FY20
83 75 76
301 306
Q4 FY19 Q3 FY20 Q4 FY20 FY19 FY20

EXCELLENCE BY DESIGNHindalco Industries Limited
1,010 1,036 1,039
5,096
3,729
Q4 FY19 Q3 FY20 Q4 FY20 FY19 FY20
5,953 5,467 5,284
23,775 21,749
Q4 FY19 Q3 FY20 Q4 FY20 FY19 FY20
21
Financial Performance - Hindalco Aluminium including Utkal Alumina
Revenue (Rs. Crore) EBITDA (Rs. Crore)
In Q4 FY20, EBITDA was higher by 3% YoY with margins at 20%
In FY20, EBITDA was down 27% YoY, due to lower realisations
partially offset by lower input costs and better efficiencies
In FY20, EBITDA margin at 17.1% , best in the industry
In FY20, Aluminium revenues were down by 9%
YoY, due to lower aluminium prices

EXCELLENCE BY DESIGNHindalco Industries Limited
Copper
22
EXCELLENCE BY DESIGNHindalco Industries Limited
69 80 64
303
230
Q4FY19 Q3FY20 Q4FY20 FY19 FY20
62 60 71
245263
Q4FY19 Q3FY20 Q4FY20 FY19 FY20
89 86 75
347321
Q4FY19 Q3FY20 Q4FY20 FY19 FY20
23
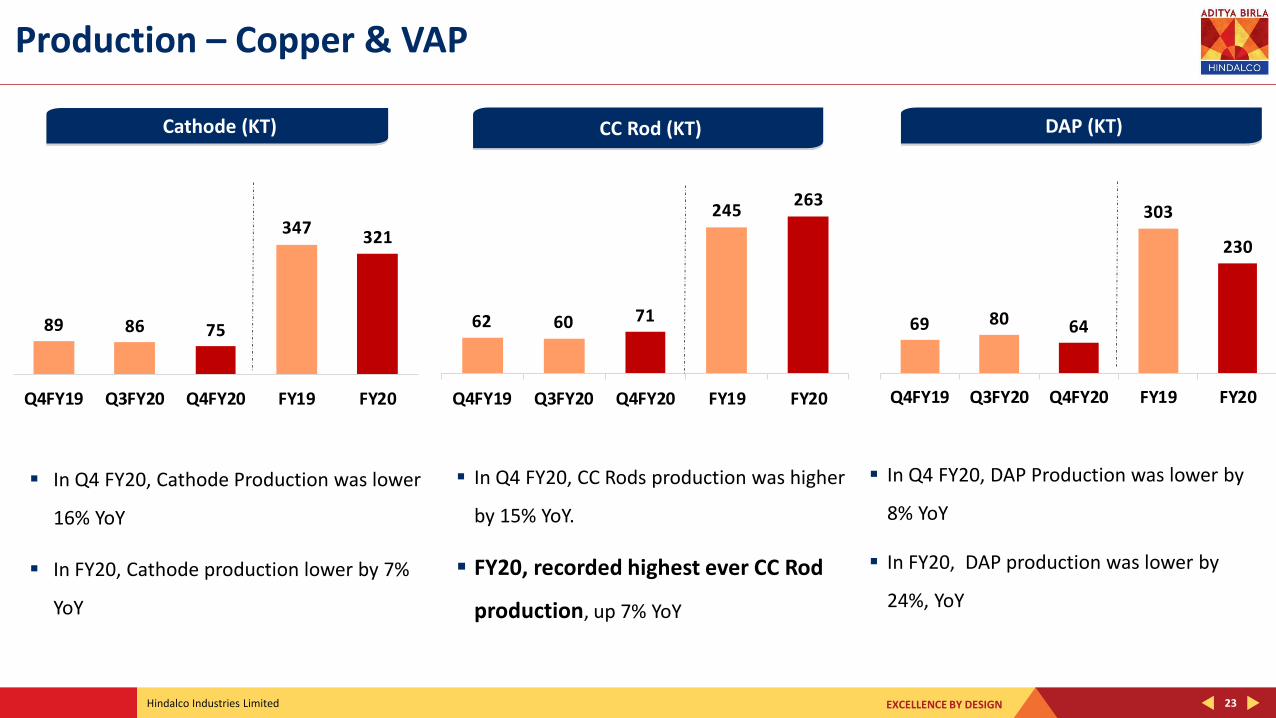
Production – Copper & VAP
In Q4 FY20, Cathode Production was lower
16% YoY
In FY20, Cathode production lower by 7%
YoY
Cathode (KT) CC Rod (KT) DAP (KT)
In Q4 FY20, CC Rods production was higher
by 15% YoY.
FY20, recorded highest ever CC Rod
production, up 7% YoY
In Q4 FY20, DAP Production was lower by
8% YoY
In FY20, DAP production was lower by
24%, YoY

EXCELLENCE BY DESIGNHindalco Industries Limited
70 5873
243 257
Q4FY19 Q3FY20 Q4FY20 FY19 FY20
24
Sales Volume – Copper & VAP
CC Rods (KT)Copper Metal Sales in All Forms (KT)
In Q4 FY20, CC Rod Sales were up 4% YoY
In FY20, CC Rods sales volumes were up 6% YoY
In Q4 FY20, Copper Metal Sales was lower by 14% YoY
In FY20, Copper metal sales lower by 7% YoY,
respectively due to lower production
100 84 86
359335
Q4FY19 Q3FY20 Q4FY20 FY19 FY20

EXCELLENCE BY DESIGNHindalco Industries Limited
373 256
406
1,683
1,276
Q4FY19 Q3FY20 Q4FY20 FY19 FY20
6,513 4,774 4,717
22,198
18,533
Q4FY19 Q3FY20 Q4FY20 FY19 FY20
25
Copper Business – Financial Performance
Revenue (Rs. Crore) EBITDA (Rs. Crore)
In FY20, Revenues were down by 17% YoY, on
account of lower realizations and volumes
In Q4 FY20, EBITDA was higher by 9% YoY,
despite challenging market conditions.
In FY20, EBITDA was down 24% YoY, due to lower
volumes and by-product realizations

EXCELLENCE BY DESIGNHindalco Industries Limited
33,745 29,197 29,318
1,30,542 1,18,144
Q4 FY19 Q3 FY20 Q4 FY20 FY19 FY20
1,178 1,062 668
5,495
3,767
Q4 FY19 Q3 FY20 Q4 FY20 FY19 FY20
1,725 1,487 1,395
8,083
6,208
Q4 FY19 Q3 FY20 Q4 FY20 FY19 FY20
3,938 3,676 4,173
16,627 15,536
Q4 FY19 Q3 FY20 Q4 FY20 FY19 FY20
26
Financial Trend - Consolidated
Revenue (Rs. Crore) EBITDA (Rs. Crore)
PBT (Before Exceptional Items) (Rs. Crore) Profit After Tax (Rs. Crore)

EXCELLENCE BY DESIGNHindalco Industries Limited 27
Key Takeaways
Ensure Employee Safety,Precautionary Actions and
Creating Essential Infrastructure
Navigate the Current Crisis&
Focus on Value-accretive long term growth
Relentless Focus on Efficiencies and
Cost Competitiveness
Focus on Cash Conservation,Maintain Stable Operations
AndPrioritizing Essential Capex
Sustainable Business Modeland
Strategic Investments to Enhance Capabilities

Thank You

EXCELLENCE BY DESIGNHindalco Industries Limited
Annexures
29

EXCELLENCE BY DESIGNHindalco Industries Limited 30
Awards & Recognitions – 2019-20
Hindalco entered S&P Dow Jones Sustainability Index (DJSI) and is amongst the world’s top 3 aluminium companies
Hindalco received 1st National Corporate Social Responsibility (CSR) Award 2019, by the MoCA, GOI
Hindalco won the “Silver Shield” for Excellence in Financial Reporting for FY 2018-19 by ICAI
Leaders Award – Mega Large Business, Metal Sector at Frost & Sullivan and TERI Sustainability 4.0 Awards 2019
FAME Excellence Award - Platinum category for outstanding project in Agricultural Development – Mahan Aluminium
Future Ready Factory of the Year Award 2019 at Frost & Sullivan’s India - Manufacturing Excellence - Mahan
CSR Impact Award 2019 in Education category for its Quality Education Project- Mahan Aluminium
Mahatma Award for Excellence in Corporate Social Responsibility by Liveweek - Utkal Alumina
CSR Health Impact Award 2019 - Rural Health Initiative in the Champion Category – Renukoot
National CSR Award by the Ministry of Corporate Affairs - for Project Unnatti -Renukoot

EXCELLENCE BY DESIGNHindalco Industries Limited 31
Financials – Hindalco Consolidated
(Rs. Crore)
*As per US GAAP
Particulars Q4 FY19 Q3 FY20 Q4 FY20Change
YoY %FY19 FY20
Change
YoY %
Revenue from Operations 33,745 29,197 29,318 -13% 1,30,542 1,18,144 -9%
Earning Before Interest, Tax, Depreciation & Amortisation (EBITDA)
Novelis* 2,517 2,446 2,773 10% 9,565 10,435 9%
Aluminium 1,010 1,036 1,039 3% 5,096 3,729 -27%
Copper 373 256 406 9% 1,683 1,276 -24%
All Other Segments (34) (6) (1) (76) (16)
Unallocable Income/ (Expense) - (Net) & GAAP Adjustments 72 (56) (44) 359 112
Total EBITDA 3,938 3,676 4,173 6% 16,627 15,536 -7%
Finance Costs 975 889 1,429 -47% 3,778 4,197 -11%
PBDT 2,963 2,787 2,744 -7% 12,849 11,339 -12%
Depreciation & Amortisation (including impairment) 1,236 1,302 1,349 -9% 4,766 5,135 -8%
Share in Profit/ (Loss) in Equity Accounted Investments (Net of Tax) (2) 2 - - 4
PBT before Exceptional Items and Tax 1,725 1,487 1,395 -19% 8,083 6,208 -23%
Exceptional Income/ (Expenses) (Net) - (6) - - (284)
Profit Before Tax (After Exceptional Item) 1,725 1,481 1,395 -19% 8,083 5,924 -27%
Profit/ (Loss) After Tax 1,178 1,062 668 -43% 5,495 3,767 -31%

EXCELLENCE BY DESIGNHindalco Industries Limited 32
Financials – Hindalco India Business
(Rs. Crore)
Particulars Q4 FY19 Q3 FY20 Q4 FY20YOY
Change %FY19 FY20
YOY
Change %
Revenue from Operations 12,478 10,254 10,014 -20% 45,990 40,324 -12%
Earning Before Interest, Tax, Depreciation & Amortisation (EBITDA)
Aluminium (including Utkal) 1,010 1,036 1,039 3% 5,096 3,729 -27%
Copper (including DHIL) 373 256 406 9% 1,683 1,276 -24%
Others 18 9 10 -45% 32 34 6%
Unallocable Income/ (Expense) (Net) 359 87 119 730 444
Total EBITDA 1,760 1,388 1,574 -11% 7,541 5,483 -27%
Finance Costs 459 455 438 1,881 1,866 1%
PBDT 1,301 933 1,136 -13% 5,660 3,617 -36%
Depreciation 537 511 523 3% 2,003 2,035 -2%
PBT before Exceptional Items and Tax 764 422 613 -20% 3,657 1,582 -57%
Exceptional Income/ (Expenses) (Net) - (11) - - (64)
Profit Before Tax (After Exceptional Item) 764 411 613 -20% 3,657 1,518 -58%
Profit/ (Loss) After Tax 527 262 379 -28% 2,654 958 -64%
Registered Office Ahura Centre, 1st Floor, B WingMahakali Caves Road Andheri (East), Mumbai 400 093 Telephone- +91 22 6691 7000Website: www.hindalco.comE mail: [email protected] Identity No. L27020MH1958PLC011238
For Futher Queries Please Contact : Subir Sen, Investor RelationsTelephone- +91 22 6662 6666E mail: [email protected]: www.hindalco.com