Grasim Industries Limited
43
Quarterly Performance Review Quarterly Performance Review Quarter 1 : 2017-18 Mumbai, 14 th August, 2017 Mumbai, 14 th August, 2017 Grasim Industries Limited Building, Consolidating, Growing Building, Consolidating, Growing 1
-
Upload
khangminh22 -
Category
Documents
-
view
1 -
download
0
Transcript of Grasim Industries Limited

Quarterly Performance ReviewQuarterly Performance ReviewQuarter 1 : 2017-18
Mumbai, 14th August, 2017Mumbai, 14th August, 2017
Grasim Industries Limited
Building, Consolidating, GrowingBuilding, Consolidating, Growing
1

Contents
Highlights 3 - 6
Financial Performance 7 - 8 Financial Performance 7 - 8
Business Performance 9 - 13
Capex Plan 14 - 15
Merger of ABNL 16 - 22Merger of ABNL 16 - 22
Business Outlook 23 - 24
GlossaryVSF : Viscose Staple Fiber, MT : Metric Ton, TPA : Tons Per Annum, YoY: Year on Year Comparison, CY : Current Year, LY : Last Year,
YTD : Year to Date, EBITDA : Earnings Before Interest, Tax ,Depreciation and Amortisation, ECU : Electro Chemical Unit
2
YTD : Year to Date, EBITDA : Earnings Before Interest, Tax ,Depreciation and Amortisation, ECU : Electro Chemical Unit
ROAvCE : Return on Avg. Capital Employed (Excluding Capital Work In Progress), RONW : Return on Net Worth
Revenue is net of excise unless stated otherwise, EBITDA Margin = EBITDA / (Revenue + Other Income) * 100
Financials from FY16 onwards are as per Ind AS

Indian Economy
India’s GDP growth decelerated to 6.1% YoY in Q4FY17 (Q3FY17 : 7%)
Although it comes on a higher revised base of 9.2% in Q4FY16Although it comes on a higher revised base of 9.2% in Q4FY16
Corporate debt overhang
Weak private investment activity Weak private investment activity
GST led temporary disruptions
To accelerate the economic growth, the government has front loaded its spending
Total government expenditure in April’ 17 and May’ 17 has increased by a robust 54% YoY Total government expenditure in April’ 17 and May’ 17 has increased by a robust 54% YoY
Highest YoY growth in any first two months of the fiscal year
Economic growth expected to pickup led by higher consumption, specially in rural area with good monsoon
3

VSF Business- Quarter 1 Highlights
Leading Global Player
- Prices witnessed weakness in China during the quarter, recovery started towards- Prices witnessed weakness in China during the quarter, recovery started towardsquarter end
- Destocking in domestic market ahead of GST implementation- Our plants continue to operate at full capacity
Sales Volume
121K Tons
Revenue
` 1,836 Cr.
EBITDA
` 349 Cr.
- Our plants continue to operate at full capacity
121K Tons
Up 11% YoY Up 8% YoY
EBITDA / ton ( `) ROAvCEEBITDA / ton ( `)
26%
ROAvCE
26700 28860 22%
4
Q1 FY17 Q1 FY18 Q1 FY17 Q1 FY18
Chemical Business - Quarter 1 Highlights
- Domestic Caustic prices remained firm during the quarter in line with global prices
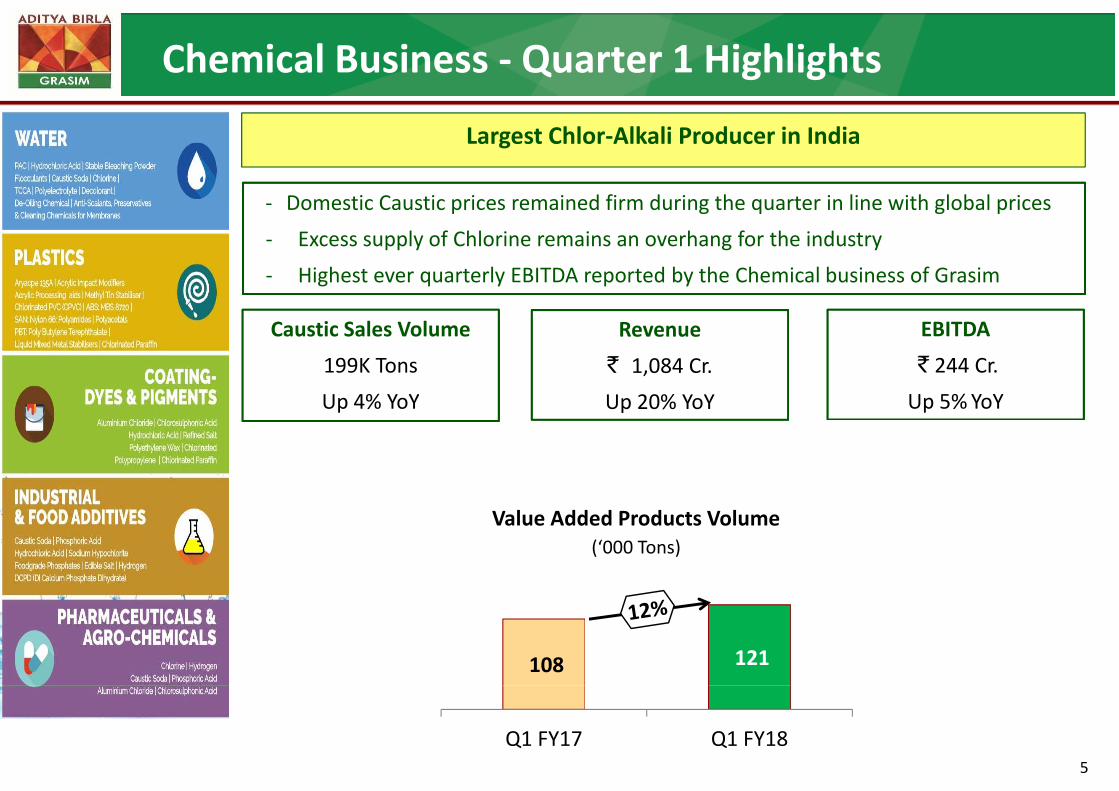
Largest Chlor-Alkali Producer in India
- Domestic Caustic prices remained firm during the quarter in line with global prices
- Excess supply of Chlorine remains an overhang for the industry
- Highest ever quarterly EBITDA reported by the Chemical business of Grasim
Caustic Sales Volume
199K Tons
Up 4% YoY
Revenue
` 1,084 Cr.
Up 20% YoY
EBITDA
` 244 Cr.
Up 5% YoYUp 4% YoY Up 20% YoY Up 5% YoY
Value Added Products Volume(‘000 Tons)
108 121
5
Q1 FY17 Q1 FY18

UltraTech - Quarter 1 Highlights
- Improved operating margins for UltraTech led by better operating efficiency
Largest Cement Producer in India
- Improved operating margins for UltraTech led by better operating efficiency
- UltraTech completed acquisition of Cement plants from Jaiprakash Associates Ltd.and Jaypee Cement Corporations Ltd. with a total capacity of 21.2 Mn. TPA
Sales Volume
14.0 Mn. Tons
Up 1% YoY
Revenue
` 7,035 Cr.
Up 7% YoY
EBITDA
` 1,798 Cr.
Up 11% YoYUp 1% YoY Up 7% YoY Up 11% YoY
EBITDA/Ton – Indian Operations( ` )
1191 1308
6
Q1 FY17 Q1 FY18

Financial Performance – Quarter 1
Net ProfitEBITDANet Revenue
Standalone` Cr.
6%13%
8%
321 347586 6212,426 2,740
Q1FY17 Q1FY18 Q1FY17 Q1FY18 Q1FY17 Q1FY18Q1FY17 Q1FY18
Consolidated
Q1FY17 Q1FY18 Q1FY17 Q1FY18
Net Revenue Net ProfitEBITDA
Consolidated
9,085 9,846890
2,214 2,419
9%8%
7%
7
9,085 9,846
830 8902,214 2,419
Q1FY17 Q1FY18 Q1FY17 Q1FY18Q1FY17 Q1FY18

Strong Balance Sheet and Robust Financial Ratios
1143821835
Consolidated Debt / SurplusConsolidated Financial Ratios
Consolidated ` Cr.
9213
11438
2225
10530 11305
31-03-2017 30-06-20117
Debt:Equity (x) 0.22 0.51
2225
Mar-17 Jun-17Net Debt: Equity (x) - 0.27
2546` Cr.
Standalone Debt / Surplus*Net Debt / EBITDA - 1.17
701
2546
1845
2901
2287ROAvCE (%)
(Excluding CWIP)12.8 15.5*
701
Mar-17
615
Jun-17
Debt Liquid Investments Net Debt Surplus
RONW (%) 10.8 11.5
• Excluding capital employed pertaining to Cement plants acquired by
8
Debt Liquid Investments Net Debt Surplus• Excluding capital employed pertaining to Cement plants acquired by
UltraTech on 29th June, 2017

Business PerformanceBusiness Performance VSF
Chemical Chemical
Cement
9

International Fibre Price Trend
$/ Kg
1.92
2.50
1.92
1.87
1.50
2.00
0.96
0.50
1.00
-
0.50
13
13 13
13
13
14
14
14 14
14
14
15
15
15 15
15
15
16
16
16 16
16
16
17
17
17
Ap
r-1
3
Jun
-13
Au
g-1
3
Oct
-13
De
c-1
3
Feb
-14
Ap
r-1
4
Jun
-14
Au
g-1
4
Oct
-14
De
c-1
4
Feb
-15
Ap
r-1
5
Jun
-15
Au
g-1
5
Oct
-15
De
c-1
5
Feb
-16
Ap
r-1
6
Jun
-16
Au
g-1
6
Oct
-16
De
c-1
6
Feb
-17
Ap
r-1
7
Jun
-17
Grey VSF Cotton PSFGrey VSF Cotton PSF
VSF : VSF prices went down during the quarter, albeit started to rebound from June onwards
Cotton : Prices remained stable during the quarter, recording 22% increase YoY
10
Cotton : Prices remained stable during the quarter, recording 22% increase YoY
PSF : Prices remained steady during the quarter

VSF : Performance
EBITDA (` Cr.) Volumes were maintained YoY despite
Destocking of inventory in domestic market by value
chain ahead of GST implementation
Revenue ( ` Cr.)11%
322 349
Higher exports material in transit due to disruption at
Nhava Sheva in view of ransom ware attack at Shipping
Company installation1,654 1,836
8%
Q1FY17 Q1FY18
Lower production at Harihar (partial shutdown due to
water shortage)
Realisation up 11% YoY
Q1FY17 Q1FY18
Increase in input cost
Better realisation of specialty fibre
EBITDA up by 8% at ` 349 Cr.Volume (‘000 Tons)
EBITDA up by 8% at ` 349 Cr.
Higher realisation
Partially offset by higher pulp and Caustic cost
Operations at captive Pulp plant at Harihar have121 121 Operations at captive Pulp plant at Harihar haveresumed towards June end
Better performance of Pulp and Fibre JVs
Company’s share of PAT at ` 36 Cr. as against ` 21 Cr. in
121 121
Q1FY17 Q1FY18
11
Company’s share of PAT at ` 36 Cr. as against ` 21 Cr. in
Q1LY driven by higher volume and improved realisation
and favourable exchange rate

Chemical : Performance
Volume up 4%
ECU realisation up by 2%
Higher Caustic prices
Revenue ( ` Cr.)
20%
EBITDA (` Cr.)
5% Higher Caustic prices
Offset by negative Chlorine realisation
With rising production of Chlorine based value
added products, impact is controlled
9031084
232 244
5%
added products, impact is controlled
Highest ever EBITDA for the quarter, up by 5% YoY
Increase in volume
Q1FY17 Q1FY18Q1 FY17 Q1 FY18
Higher ECU realisation
Higher volumes of Chlorine VAPs
Brownfield expansion at Vilayat from 220K TPA to
Caustic Volume *
(000’ Tons) Brownfield expansion at Vilayat from 220K TPA to
365K TPA
Work is in full swing
Expected to be commissioned by Q4 FY18192
199
(000’ Tons)4%
Expected to be commissioned by Q4 FY18
Phosphoric acid capacity to increase from 25K MT to54K MT is on track
Expected to be complete by Q3 FY18
192
Q1FY17 Q1FY18
12
Expected to be complete by Q3 FY18* Includes captive consumption

Cement : Performance
Revenue (` Cr.) EBITDA (` Cr.) Volume up by 1%
Weak quarter for the industry7% 11%
6587 70351,626 1,798
Energy cost up by 28%
Petcoke prices doubled, negated by
Enhanced share of power from waste heat recoveryQ1FY17 Q1FY18 Q1 FY17 Q1 FY18 Enhanced share of power from waste heat recovery
Reduced power consumption
Use of industrial waste over coal
Conso. Volume*
(Mn. MT)
Use of industrial waste over coal
EBITDA up by 11% at ` 1,798 Cr. helped by
Increase in productivity1%
13.8 14.0
(Mn. MT) Increase in productivity
Improved consumption norms
Effective procurement management
1%
13.8 14.0
Q1FY17 Q1FY18
Manpower optimization
13
* Includes captive consumption for RMC

CapexCapex
14

Capex plan(` Cr.)
Capex
Net of CWIP
as on
(01-07-17)
Cash Outflow
Capex spent -
Q1FY18FY18 FY19
Onward
(01-07-17)
Standalone
Vilayat Caustic Plant Brownfield expansion (144K TPA) 442
VSF : Water supply augmentation & usage reduction,602
Research & Development, Environment & Other capex
VSF capacity expansion 680
VSF debottlenecking (38K TPA) 123
Chemical capacity debottlenecking (64K TPA) & VAPs 188
VSF Expansion : Vilayat Residual capex 115
Chemical & Others : Normal capex 237
Erstwhile ABNL 195
Standalone Capex (A) 2,582 1,484 1,098 150
Cement Subsidiary : UltraTechCement Subsidiary : UltraTech
Capacity expansion 2716
Modernisation, Plant Infrastructure, Environment, Upgradation, logistic infraetc.
2,067
15
etc.2,067
Cement Business Capex (B) 4,783 2,191 2,592 1,239
Capex (A + B) 7,365 3,675 3,690 1,389

Merger of Aditya Birla Nuvo Limited (ABNL)Merger of Aditya Birla Nuvo Limited (ABNL)
16

Merger of ABNL into Grasim
_ Update on the Scheme
NCLT sanction received for the composite Scheme of merger of ABNL into Grasim and demerger of Financial
Services businessServices business
Merger of ABNL into Grasim has become effective from 1st July, 2017
Demerger of Financial Services business from Grasim has become effective from 4th July, 2017 Demerger of Financial Services business from Grasim has become effective from 4th July, 2017
All the shareholders of ABNL as on 6th July (record date 1) have been allotted Grasim shares in the ratio of 10:15
All the shareholders of Grasim as on 20th July (record date 2) will be allotted shares of Aditya Birla Capital All the shareholders of Grasim as on 20th July (record date 2) will be allotted shares of Aditya Birla Capital
Limited (ABCL, formerly known as Aditya Birla Financial Services) in the ratio of 5:7
_ Update related to Financial Statements
As the merger of ABNL has become effective from 1st July, 2017, financial results of Q1FY18 of ABNL are not
included in the Company's results of Q1FY18included in the Company's results of Q1FY18
Financial results of the ABNL businesses merged with the Company will be included in the Company's
results effective from 1st July, 2017
17
Extract of ABNL results for Q1FY18 is included in the following slides for information

Financial Performance of ABNL – Quarter 1` Cr.
Standalone
Net ProfitEBITDANet Revenue
1,233 1,233
13058
219158
1,233 1,233
Q1FY17 Q1FY18 Q1FY17 Q1FY18 Q1FY17 Q1FY18
*
Consolidated
Q1FY17 Q1FY18 Q1FY17 Q1FY18 Q1FY17 Q1FY18
Net Revenue EBITDA Net ProfitNet Revenue EBITDA Net Profit
3,220 3,507 304
79
430 448
18
79
Q1FY17 Q1FY18 Q1FY17 Q1FY18 Q1FY17 Q1FY18
* Excluding exceptional item

Aditya Birla Capital
Revenue
Q1FY17 Q1FY18 ∆%(` Crore)
EBT
Q1FY17 Q1FY18 ∆%Remarks
783 1025 31% NBFC1 178 266 50% Higher lending book (38%↑ y-o-y)783 1025 31% NBFC1 178 266 50% Higher lending book (38%↑ y-o-y)
1072 990 (8%) Life Insurance 26 11 (60%)New business growth, cost optimization and
improvement in quality metrics
204 271 32% Asset Management2 109 119 9% Growth in AUM (38%↑ y-o-y)
38 47 24% General Insurance Advisory 19 19 Higher premium placement (46%↑ y-o-y)
Broking28 34 23% Broking (2) 1 Higher revenue (23%↑ y-o-y)
5 3 (30%) Private Equity 1 (0) Funds being wound down through exits
0 (5) Others / Elimination (11) (0)0 (5) Others / Elimination (11) (0)
2,130 2,365 11% Established businesses 320 415 30%
New Operating BusinessesHousing Finance, MyUniverse & Health
60 181 New Operating Businesses (33) (36)Housing Finance, MyUniverse & Health
Insurance are in the investment phase
2,189 2,546 16% Total 287 379 32%
19
Note 1: Wealth Management business has been merged with Aditya Birla Finance Ltd. (ABFL) w.e.f. 1st Apr’16. Previous year financials of ABFL have been restated to make the performance comparable
Note 2: Full financials of Aditya Birla Sun Life AMC have been considered above. In the consolidated financials of ABNL, ABSLAMC gets consolidated based on equity accounting as per Ind AS
Idea Cellular
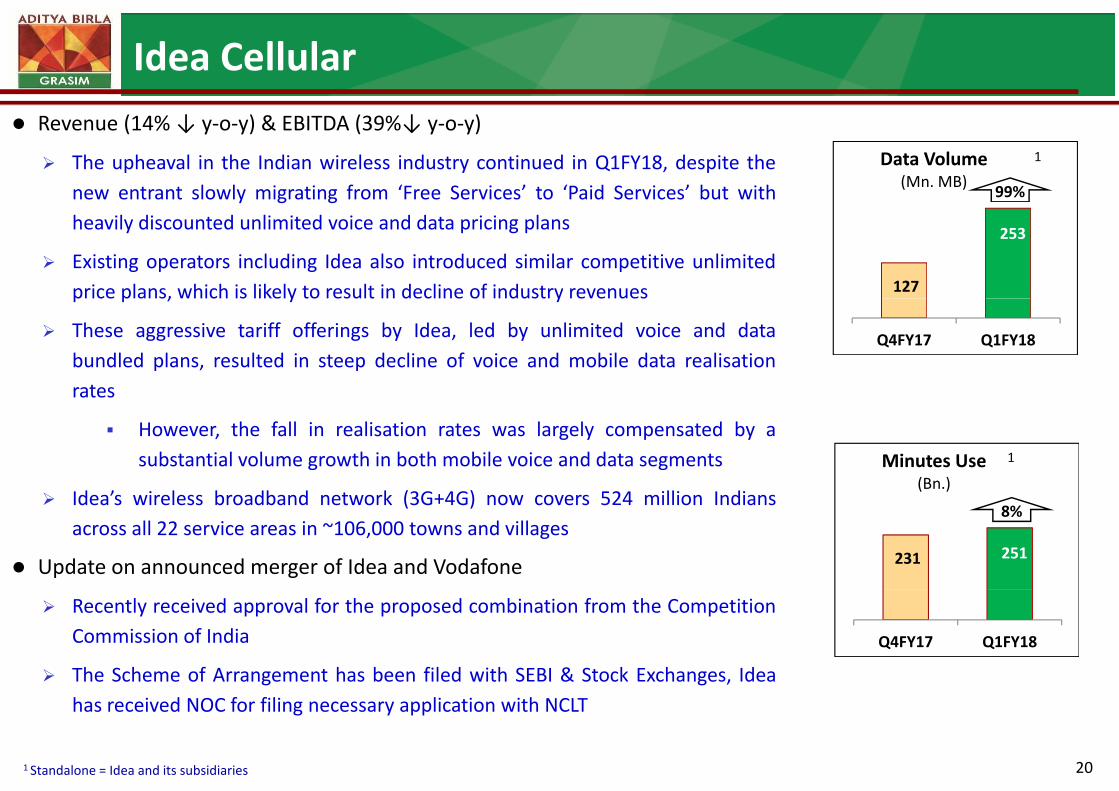
Revenue (14% ↓ y-o-y) & EBITDA (39%↓ y-o-y)
The upheaval in the Indian wireless industry continued in Q1FY18, despite the
new entrant slowly migrating from ‘Free Services’ to ‘Paid Services’ but with
Data Volume(Mn. MB)
99%
1
new entrant slowly migrating from ‘Free Services’ to ‘Paid Services’ but with
heavily discounted unlimited voice and data pricing plans
Existing operators including Idea also introduced similar competitive unlimited
price plans, which is likely to result in decline of industry revenues 127
253
price plans, which is likely to result in decline of industry revenues
These aggressive tariff offerings by Idea, led by unlimited voice and data
bundled plans, resulted in steep decline of voice and mobile data realisation
rates
Q4FY17 Q1FY18
rates
However, the fall in realisation rates was largely compensated by a
substantial volume growth in both mobile voice and data segments
Idea’s wireless broadband network (3G+4G) now covers 524 million Indians
Minutes Use(Bn.)
1
Idea’s wireless broadband network (3G+4G) now covers 524 million Indians
across all 22 service areas in ~106,000 towns and villages
Update on announced merger of Idea and Vodafone 231 251
(Bn.)
8%
Recently received approval for the proposed combination from the Competition
Commission of India
The Scheme of Arrangement has been filed with SEBI & Stock Exchanges, Idea
Q4FY17 Q1FY18
20
The Scheme of Arrangement has been filed with SEBI & Stock Exchanges, Idea
has received NOC for filing necessary application with NCLT
1 Standalone = Idea and its subsidiaries

Divisions (Jaya Shree, Indo-Gulf Fertilisers, Indian Rayon, Aditya Birla Insulators)
Revenue EBITDAQ1FY17 Q1FY18 ∆%
Remarks on profitabilityQ1FY17 Q1FY18 ∆% Q1FY17 Q1FY18 ∆%
Remarks on profitability
352 319 (9%) Jaya Shree 41 22 (46%)
Strike in unit from 16th May’17 till night shift of 20th
May’17 impacting operations. Lower profitability across
linen and worsted segment.
501 467 (7%) Agri 54 42 (22%)
Plant shutdown for maintenance from 17th Mar’17 to 9th
April 2017 impacting urea volumes along with lower gain501 467 (7%) Agri 54 42 (22%) April 2017 impacting urea volumes along with lower gain
on Agri trading business
260 289 (10%) Rayon 74 80 8%
Higher realizations along with higher volumes in SSY
segment. Negative chlorine realization impacting volume260 289 (10%) Rayon 74 80 8% segment. Negative chlorine realization impacting volume
and ECU realization.
120 128 6% Insulators 20 8 (60%)Lower volumes & relisation due to sluggish domestic
120 128 6% Insulators 20 8 (60%)demand
21

Strong Financials Post Merger(` Cr.)
Grasim
Q1FY18
Aditya Birla Nuvo
Q1FY18
AggregateProformaFinancialsQ1FY18
Q1FY18 Q1FY18Q1FY18
Net Revenue 9,846 3,507 13,353+ =
EBITDA 2,419 448 2,867+ =
PAT921* 79 1,000+ =
EBITDA 2,419 448 2,867+ =
(After MI)
Net Debt
921*
11,305
79
2,085
1,000
13,390
+ =
Net Debt to
Net Debt(As on 30.6.17)
11,305
1.2x
2,085
1.2x
13,390
1.2x
+ =
22
Net Debt toEBITDA
1.2x 1.2x 1.2x+ =
* Before exceptional item
EBITDA for ABNL has been adjusted for finance cost
Business Outlook
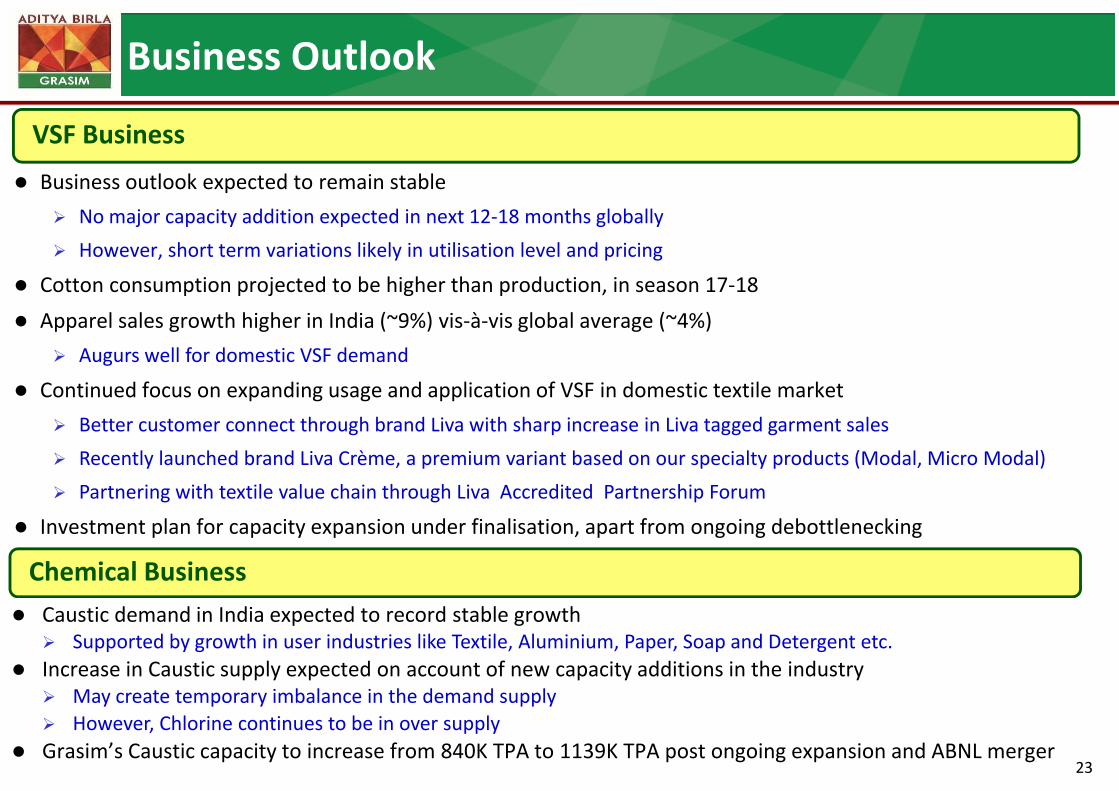
VSF Business:
Business outlook expected to remain stable
VSF Business
No major capacity addition expected in next 12-18 months globally
However, short term variations likely in utilisation level and pricing
Cotton consumption projected to be higher than production, in season 17-18
Apparel sales growth higher in India (~9%) vis-à-vis global average (~4%)
Augurs well for domestic VSF demand
Continued focus on expanding usage and application of VSF in domestic textile market Continued focus on expanding usage and application of VSF in domestic textile market
Better customer connect through brand Liva with sharp increase in Liva tagged garment sales
Recently launched brand Liva Crème, a premium variant based on our specialty products (Modal, Micro Modal)
Partnering with textile value chain through Liva Accredited Partnership Forum Partnering with textile value chain through Liva Accredited Partnership Forum
Investment plan for capacity expansion under finalisation, apart from ongoing debottlenecking
Chemical Business
Caustic demand in India expected to record stable growth Supported by growth in user industries like Textile, Aluminium, Paper, Soap and Detergent etc.
Increase in Caustic supply expected on account of new capacity additions in the industryMay create temporary imbalance in the demand supply
23
May create temporary imbalance in the demand supply
However, Chlorine continues to be in over supply
Grasim’s Caustic capacity to increase from 840K TPA to 1139K TPA post ongoing expansion and ABNL merger
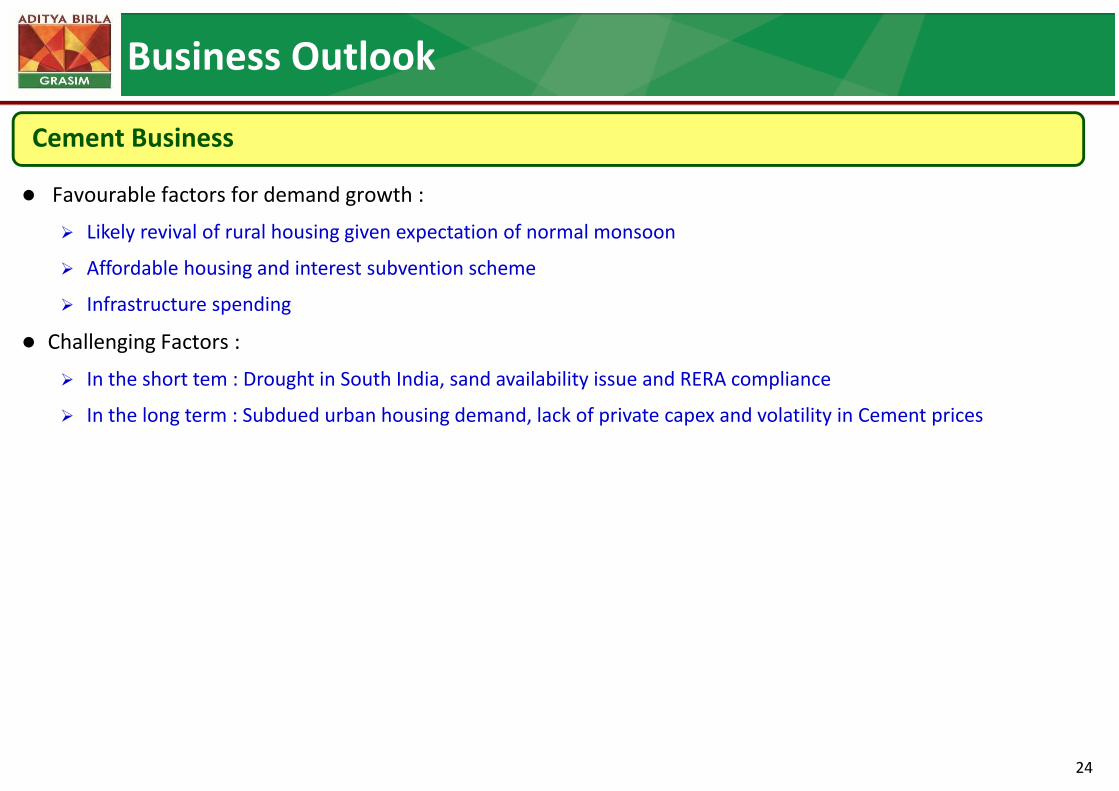
Business Outlook
Favourable factors for demand growth :
Cement Business
Favourable factors for demand growth :
Likely revival of rural housing given expectation of normal monsoon
Affordable housing and interest subvention scheme
Infrastructure spending Infrastructure spending
Challenging Factors :
In the short tem : Drought in South India, sand availability issue and RERA compliance
In the long term : Subdued urban housing demand, lack of private capex and volatility in Cement prices
24
Thank YouThank You
25

Grasim Industries LimitedGrasim Industries Limited
Annexure - FinancialsAnnexure - Financials
26
Annexure
Consolidated Financial Performance
Standalone Financial Performance Standalone Financial Performance
Balance sheet
VSF Summary VSF Summary
Chemical Summary
Cement Summary
Organisational Structure
Plant Locations
27

Consolidated Financial Performance(` Cr.)
2017-18 2016-17
Net Sales & Op. Income 9,846 9,085 8
Quarter 1 %
Change
Net Sales & Op. Income 9,846 9,085 8
Other Income 236 200 18
EBITDA 2,419 2,214 9
EBITDA Margin (%) 24.0% 23.8%EBITDA Margin (%) 24.0% 23.8%
Finance Cost 149 204 (27)
Depreciation 443 436 2
Share in Profit of JVs & Associates (1) 47Share in Profit of JVs & Associates (1) 47
Exceptional item (31) -
Earnings before Tax 1,794 1,621 11
Total Tax 546 481 13
PAT 1,248 1,140 9
Less: Minority Interest 358 310 15
PAT (After Minority Interest & EI) 890 830 7
Other Comprehensive Income (after tax) 208 386 (46)
Total Comprehensive Income (after tax) 1,098 1,217 (10)
28
Total Comprehensive Income (after tax) 1,098 1,217 (10)
EPS 19.1 17.8 7
Cash Profit (Before Minority Share) 1,820 1,717 6

Standalone Financial Performance
(` Cr.)
2017-18 2016-17
Net Sales & Op. Income 2,740 2,426 13
Quarter 1 %
Change
Net Sales & Op. Income 2,740 2,426 13
Other Income 66 58 14
EBITDA 621 586 6
EBITDA Margin (%) 22.1% 23.6%EBITDA Margin (%) 22.1% 23.6%
Finance Cost 7 23 (68)
Depreciation 110 110 (0)
Earnings before Tax 504 453 11
Tax Expense 156 132 19
PAT 347 321 8
Other Comprehensive Income (after tax) 163 407
Total Comprehensive Income (after tax) 510 728
EPS 7.4 6.9 8EPS 7.4 6.9 8
Cash Profit 482 463 4
29

Balance Sheet( Cr.)(` Cr.)
30th June'17 31st Mar'17 EQUITY & LIABILITIES 30th June'17 31st Mar'17
16,742 16,231 Net Worth 32,490 31,387
Standalone Consolidated
- - Minority Interest 10,059 9,702
615 701 Borrowings * 21,835 9,213
716 663 Deferred Tax Liability (Net) 3,677 3,518
2,320 2,256 Liabilities & Provisions 11,627 8,927
20,393 19,851 SOURCES OF FUNDS 79,688 62,747
ASSETS
6,811 6,887 Net Fixed Assets 47,786 31,793
539 430 Capital WIP & Advances 1,825 1,650
- - Goodwill on Consolidation 2,938 2,994
Investments:
2,636 2,636 Cement Subsidiary - -
2,901 2,546 Liquid Investments 10,530 11,438
3,909 3,814 Other Investments 5,126 4,992
3,597 3,538 Current Assets, Loans & Advances 11,483 9,880
20,393 19,851 APPLICATION OF FUNDS 79,688 62,747
30
* Consolidated borrowing increased by ` 12,622 Cr. mainly on account of acquisition of
Jaiprakash Associates Limited and Jaypee Cement Corporations Limited plants by UltraTech Cement
(2,287) (1,845) Net Debt / (Surplus) 11,305 (2,225)
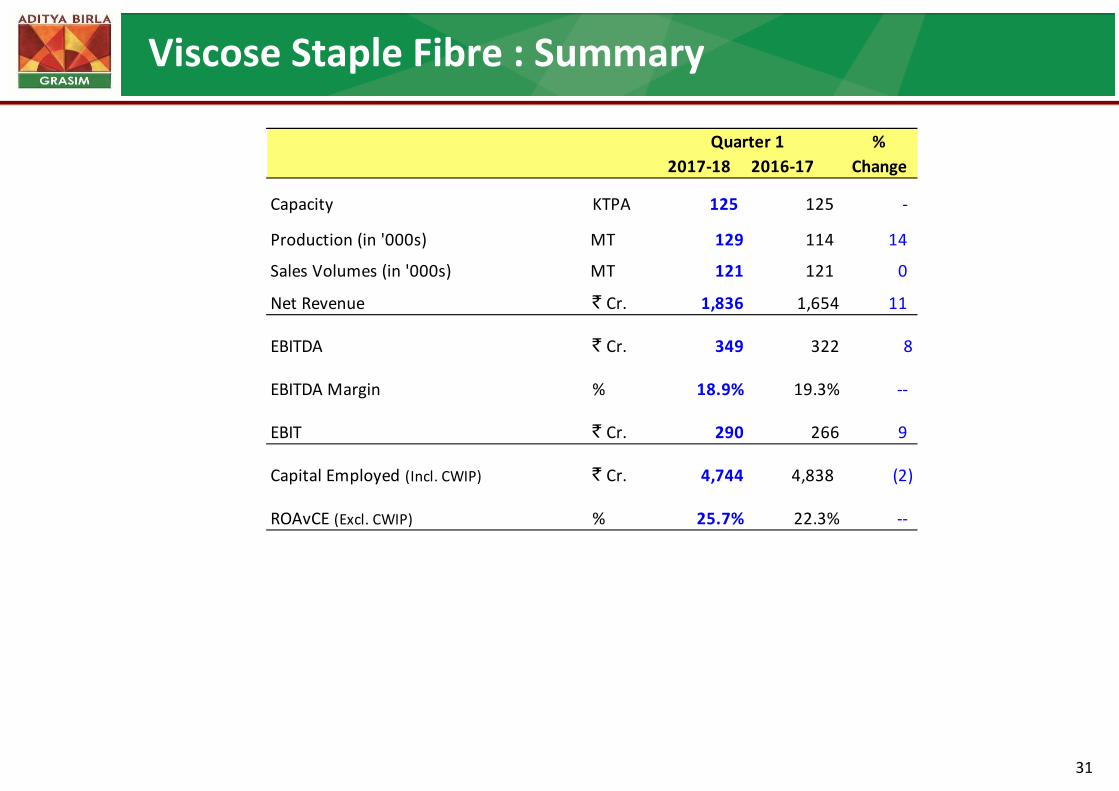
Viscose Staple Fibre : Summary
2017-18 2016-17
Capacity KTPA 125 125 -
Quarter 1 %
Change
Capacity KTPA 125 125 -
Production (in '000s) MT 129 114 14
Sales Volumes (in '000s) MT 121 121 0
Net Revenue ` Cr. 1,836 1,654 11Net Revenue ` Cr. 1,836 1,654 11
EBITDA ` Cr. 349 322 8
EBITDA Margin % 18.9% 19.3% --EBITDA Margin % 18.9% 19.3% --
EBIT ` Cr. 290 266 9
Capital Employed (Incl. CWIP) ` Cr. 4,744 4,838 (2)
ROAvCE (Excl. CWIP) % 25.7% 22.3% --
31

Chemical : Summary
2017-18 2016-17
Quarter 1 %
Change
Capacity KTPA 210 210 -
Production (in '000s) MT 201 193 4
Sales Volumes (in '000s) MT 199 192 4Sales Volumes (in '000s) MT 199 192 4
Net Revenue ` Cr. 1,084 903 20
EBITDA ` Cr. 244 232 5EBITDA ` Cr. 244 232 5
EBITDA Margin % 22.5% 25.6% --
EBIT ` Cr. 196 181 8EBIT ` Cr. 196 181 8
Capital Employed (Incl. CWIP) ` Cr. 3,779 3,694 2
ROAvCE (Excl. CWIP) % 21.9% 20.1% --ROAvCE (Excl. CWIP) % 21.9% 20.1% --
32
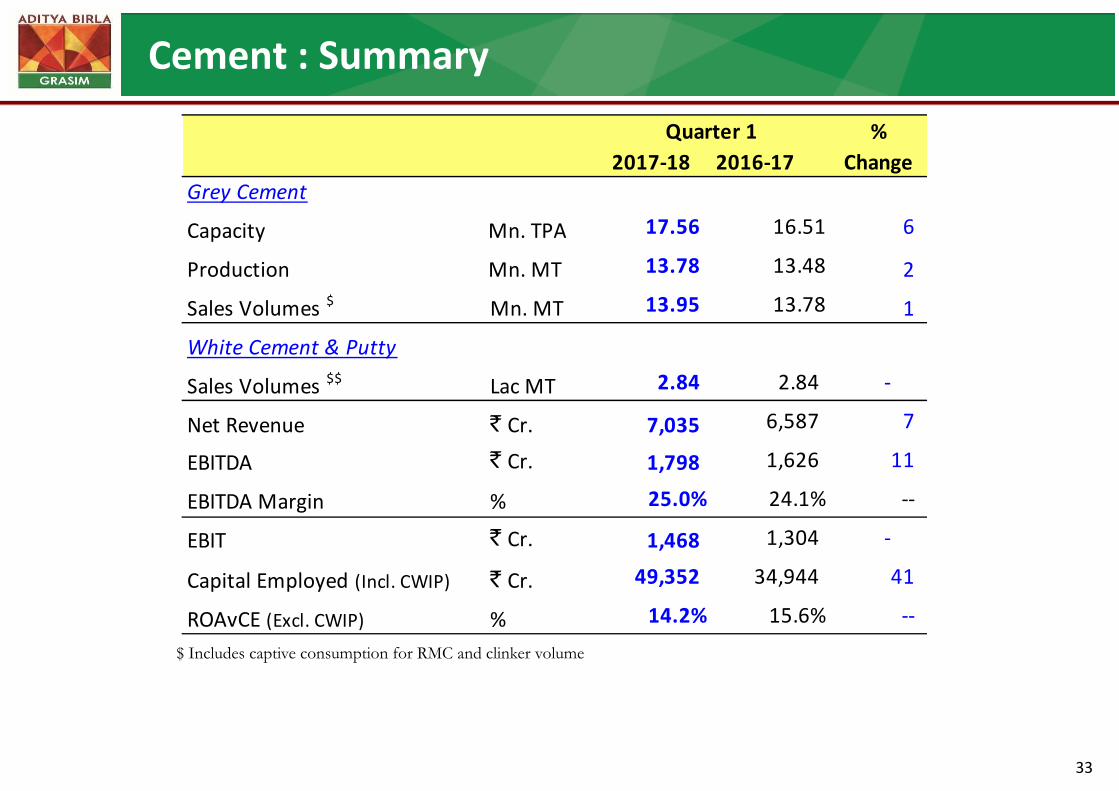
Cement : Summary
2017-18 2016-17
Grey Cement
%
Change
Quarter 1
Grey Cement
Capacity Mn. TPA 17.56 16.51 6
Production Mn. MT 13.78 13.48 2
Sales Volumes $ Mn. MT 13.95 13.78 1Sales Volumes $ Mn. MT 13.95 13.78 1
White Cement & Putty
Sales Volumes $$ Lac MT 2.84 2.84 -Sales Volumes Lac MT 2.84 2.84 -
Net Revenue ` Cr. 7,035 6,587 7
EBITDA ` Cr. 1,798 1,626 11
EBITDA Margin % 25.0% 24.1% --EBITDA Margin % 25.0% 24.1% --
EBIT ` Cr. 1,468 1,304 -
Capital Employed (Incl. CWIP) ` Cr. 49,352 34,944 41
$ Includes captive consumption for RMC and clinker volume
Capital Employed (Incl. CWIP) ` Cr. 49,352 34,944 41
ROAvCE (Excl. CWIP) % 14.2% 15.6% --
33

Grasim Group Structure
Pulp & Fibre UltraTech Cement (60.23%) OthersChemicalPulp & Fibre
VSF VSF JV Overseas
UltraTech Cement (60.23%)
Pulp
Others
Domestic OverseasEpoxyCaustic
Chemical
VSF498K TPA
VSF JVChina
Overseas
Pulp JVs
AV Group NBInc.
GrasimBhiwaniTextiles
Birla Jingwei73K TPA
Pulp70K TPA
Domestic Overseas4 Mn. TPA,
(UAE, Bangladesh,Sri Lanka)
Nagda162K TPA
Nagda270K TPA
Epoxy51K TPA
Caustic840K TPA
Grey Cement
89 Mn. TPAHarihar70K TPA
Domsjo255K TPA (33.3%)
Inc.320K TPA (45%)
Textiles18 Mn. Mtr.
(100%)
73K TPA(26.6%)
18 Integratedplants &
1 clinkerisationunit
162K TPA
Kharach128K TPA
Vilayat219K TPA
89 Mn. TPA70K TPA
Renukoot129K TPA
AV Terrace Bay(40%)
255K TPA (33.3%)
Idea Cellular(4.74%)
unit
25 Split GrindingUnits
>100 RMC Plants
Harihar87K TPA
Vilayat120K TPA BCML
129K TPA
Rehla105K TPA
Ganjam59K TPA
34
>100 RMC Plants
White Cement &Putty
1.4 Mn. TPA
Vilayat120K TPA BCML
(26%)
Standalone Subsidiary JV Associate
59K TPA
Karwar59K TPA

Plant Locations– Grasim & Its subsidiaries
Bathinda(G)
PanipatJhajjar
Shambhupura
Jodhpur
BhiwaniT
Kotputli
DadriPanipat
T Malanpur
Aligarh
PC
RenukootPatliputra
UltraTech Cement Plants
UltraTech Grinding Units (G)
UltraTech White Cement Plant
ShambhupuraJawad
RaipurPipavav
Jafrabad
Magdalla (G) Awarpur HirmiJharsuguda (G)
Durgapur(G)BharuchF
NagdaF C
F Vilayat
P Katni
Sewagram WanakboriC
Dankuni`(G)
C
RehlaCNagpur
UltraTech White Cement Plant
UltraTech Putty Plant
Fibre plants
Pulp plant
F
P
P
Malkhed
Hotgi(G)
Magdalla (G)
Tadpatri
Ratnagiri(G)Harihar
F P
CGanjam
Pulp plant
Chemical plant
Textiles unitsT
P
C
ReddipalayamArakonam(G)
Ginigera
CKarwar
35Not to scale

Cautionary Statement
Statements in this “Presentation” describing the Company’s objectives, estimates, expectations orpredictions may be “forward looking statements” within the meaning of applicable securities lawsand regulations. Actual results could differ materially from those expressed or implied. Importantand regulations. Actual results could differ materially from those expressed or implied. Importantfactors that could make a difference to the Company’s operations include global and Indian demandsupply conditions, finished goods prices, feedstock availability and prices, cyclical demand and pricingin the Company’s principal markets, changes in Government regulations, tax regimes, economicin the Company’s principal markets, changes in Government regulations, tax regimes, economicdevelopments within India and the countries within which the Company conducts business and otherfactors such as litigation and labour negotiations. The Company assumes no responsibility to publiclyamend, modify or revise any forward looking statement, on the basis of any subsequent development,amend, modify or revise any forward looking statement, on the basis of any subsequent development,information or events, or otherwise.
GRASIM INDUSTRIES LIMITEDGRASIM INDUSTRIES LIMITEDAditya Birla Centre, 'A’ Wing, 2nd Floor, S. K. Ahire Marg, Worli, Mumbai - 400 030
Registered Office : Birlagram, Nagda - 456 331 (M.P.),
Corporate Office : A-2, Aditya Birla Centre, S.K. Ahire Marg, Worli, Mumbai - 400030 CIN: L17124MP1947PLC000410
36
Corporate Office : A-2, Aditya Birla Centre, S.K. Ahire Marg, Worli, Mumbai - 400030 CIN: L17124MP1947PLC000410
www.grasim.com & www.adityabirla.com
Email : [email protected]

` Crore
STATEMENT OF CONSOLIDATED UNAUDITED RESULTS FOR THE QUARTER ENDED 30-06-2017
30-06-2017 31-03-2017 30-06-2016 31-03-2017
(Unaudited)(Audited)
Refer Note 2(b)(Unaudited) (Audited)
1 Revenue from Operations 10,986.09 11,140.21 10,173.52 40,247.17
2 Other Income 236.08 269.20 199.95 947.78
3 Total Income (1+2) 11,222.17 11,409.41 10,373.47 41,194.95
4 Expenses
Cost of Materials Consumed 2,431.27 2,335.37 2,084.58 8,688.85
Purchases of Stock-in-Trade 159.05 171.00 155.74 624.41
Changes [Decrease / (Increase)] in Inventories of Finished Goods, (200.73) 254.30 147.98 161.75
Work-in-Progress and Stock-in-Trade
Employee Benefits Expense 599.73 573.18 543.49 2,265.59
Finance Costs 149.47 176.30 203.87 702.40
Depreciation and Amortisation Expense 443.16 472.06 436.38 1,807.59
Power and Fuel Cost 1,737.17 1,646.81 1,348.27 5,795.41
Freight and Handling Expenses 1,649.97 1,736.26 1,604.78 6,092.09
Excise Duty 1,140.17 1,144.81 1,088.03 4,178.77
Other Expenses 1,286.67 1,405.24 1,186.50 5,055.17
Total Expenses 9,395.93 9,915.33 8,799.62 35,372.03
5 1,826.24 1,494.08 1,573.85 5,822.92
6 Add : Share in Profit/(Loss) of Equity Accounted Investees (net of tax) (1.03) (1.34) 47.11 129.40
7 1,825.21 1,492.74 1,620.96 5,952.32
8 Less : Exceptional Items (31.47) - - -
9 1,793.74 1,492.74 1,620.96 5,952.32
10 Tax Expense (Net)
Current Tax 416.55 371.77 340.58 1,346.00
Deferred Tax 129.09 57.35 140.35 360.71
11 Net Profit for the period (9 - 10) 1,248.10 1,063.62 1,140.03 4,245.61
(i) Items that will not be reclassified to profit or loss 165.98 452.64 386.12 1,010.04
(ii) Income Tax relating to items that will not be reclassified to profit or loss (3.45) (17.05) (3.40) (18.39)
(iii) Items that will be reclassified to profit or loss 40.76 (28.16) 2.60 (28.32)
(iv) Income Tax relating to items that will be reclassified to profit or loss (5.51) (6.65) (0.44) 0.11
12 Other Comprehensive Income for the period 197.78 400.78 384.88 963.44
13 1,445.88 1,464.40 1,524.91 5,209.05
Net Profit attributable to :
Owners of the Company 890.45 774.54 830.22 3,167.30
Non-controlling interest 357.65 289.08 309.81 1,078.31
1,248.10 1,063.62 1,140.03 4,245.61
Other Comprehensive Income attributable to :
Owners of the Company 207.67 418.23 386.33 951.48
Non-controlling interest (9.89) (17.45) (1.45) 11.96
197.78 400.78 384.88 963.44
Total Comprehensive Income attributable to :
Owners of the Company 1,098.12 1,192.77 1,216.55 4,118.78
Non-controlling interest 347.76 271.63 308.36 1,090.27
1,445.88 1,464.40 1,524.91 5,209.05
Paid up Equity Share Capital (Face Value ` 2 per share) {Refer Note 7} 93.38 93.37 93.36 93.37
Reserve excluding Revaluation Reserves as at Balance Sheet Date 31,293.44
14 Earnings per Share of Face Value ` 2/- each (not annualised) {Refer Note 7}
(a) Basic (`) 19.07 16.59 17.79 67.85
(b) Diluted (`) 19.05 16.57 17.77 67.77
See accompanying notes to the Financial Results
UNAUDITED CONSOLIDATED FINANCIAL RESULTS
FOR THE QUARTER ENDED 30-06-2017
Particulars
Three Months Ended Year Ended
Profit from Ordinary Activities before Share in Profit/(Loss) of Equity Accounted
Investees, Exceptional Items and Tax (3 - 4)
Profit before Exceptional Items and Tax (5 + 6)
Profit before Tax (7 + 8)
Other Comprehensive income (including related to Joint Ventures and Associates)
Total Comprehensive Income (after tax) (11+12)

Crore
30-06-2017 31-03-2017 30-06-2016 31-03-2017
(Unaudited) (Audited) Refer Note 2(b)
(Unaudited) (Audited)
1. SEGMENT REVENUE
Viscose Staple Fibre 1,997.71 2,115.10 1,801.87 7,714.64 Cement - Grey,White and Allied Products 7,928.50 7,923.96 7,452.35 28,645.93 Chemicals - Caustic Soda and Allied Chemicals 1,185.03 1,167.81 992.45 4,179.62 Others # 100.71 127.13 103.86 465.24
TOTAL 11,211.95 11,334.00 10,350.53 41,005.43 (Less) : Inter Segment Revenue (225.86) (193.79) (177.01) (758.26) Total Operating Income 10,986.09 11,140.21 10,173.52 40,247.17
2. SEGMENT RESULTS
Viscose Staple Fibre 289.78 284.13 265.55 1,206.10 Cement - Grey,White and Allied Products 1,322.83 1,133.63 1,183.47 4,065.25 Chemicals - Caustic Soda and Allied Chemicals 195.43 160.95 181.01 639.94 Others # 1.32 7.63 2.15 14.95
TOTAL 1,809.36 1,586.34 1,632.18 5,926.24 Add / (Less) :
Finance Costs (149.47) (176.30) (203.87) (702.40) Net Unallocable Income 166.35 84.04 145.54 599.08
Add : Share in Profit/(Loss) of Equity Accounted Investees (net of tax) (1.03) (1.34) 47.11 129.40
Less : Exceptional Items (31.47) - - -
1,793.74 1,492.74 1,620.96 5,952.32
As on As on As on As on30-06-2017 31-03-2017 30-06-2016 31-03-2017
3. SEGMENT ASSETS
Viscose Staple Fibre 5,957.60 5,960.08 5,726.01 5,960.08 Cement - Grey,White and Allied Products 52,687.90 37,316.20 37,838.56 37,316.20 Chemicals - Caustic Soda and Allied Chemicals 4,445.03 4,418.77 4,288.85 4,418.77 Others # 375.74 364.99 377.48 364.99
TOTAL 63,466.27 48,060.04 48,230.90 48,060.04 Add: Unallocated Assets 16,243.47 14,707.55 12,456.76 14,707.55
TOTAL ASSETS 79,709.74 62,767.59 60,687.66 62,767.59
4. SEGMENT LIABILITIES
Viscose Staple Fibre 1,810.63 1,886.22 1,872.91 1,886.22 Cement - Grey,White and Allied Products 29,722.42 14,472.26 15,859.47 14,472.26 Chemicals - Caustic Soda and Allied Chemicals 683.65 683.28 978.39 683.28 Others # 190.01 181.43 189.24 181.43
TOTAL 32,406.71 17,223.19 18,900.01 17,223.19
Add : Unallocated Liabilities 4,754.78 4,455.66 4,137.61 4,455.66
TOTAL LIABILITIES 37,161.49 21,678.85 23,037.62 21,678.85
# Others represent mainly Textiles
UNAUDITED CONSOLIDATED SEGMENT WISE REVENUE, RESULTS, ASSETS
AND LIABILITIES FOR THE QUARTER ENDED 30-06-2017
Particulars Three Months Ended Year Ended
Profit from Ordinary Activities after Finance Costs but before Share in Profit/(Loss) of Equity Accounted Investees and Exceptional Items 1,826.24 5,822.92 1,494.08 1,573.85
Profit before Tax

Grasim Industries Limited
NOTES:
1. The Company has opted to publish Consolidated Financial Results which are reviewed by the Audit
Committee and approved by the Board of Directors today. The Statutory Auditors of the Company have
carried out limited review as required under SEBI (Listing Obligations and Disclosure Requirements)
Regulations, 2015 and the related report is being submitted to the concerned stock exchanges.
2. a. Key Standalone Financial Results information:
` Crore
Three Months Ended Year Ended
30-06-2017
(Unaudited)
31-03-2017
(Audited)
30-06-2016
(Unaudited)
31-03-2017
(Audited)
Total Income 3,052.34 3,147.08 2,706.76 11,726.88
Profit before Tax 503.56 434.29 452.58 2,124.94
Net Profit after Tax 347.19 315.49 320.89 1,560.00
Other Comprehensive Income
after Tax
162.94 451.54 406.94 1,011.53
Total Comprehensive Income
after Tax
510.13 767.03 727.83 2,571.53
The Standalone Financial Results are available at the Company’s and Stock Exchanges’ websites.
b. The results for the three months ended 31st March, 2017 were derived as difference between the audited
accounts for the financial year ended 31st March, 2017 and published unaudited results for Nine months
ended 31st December 2016.
3. a. During the quarter, National Company Law Tribunal has sanctioned the Composite Scheme of
Arrangement ("Scheme") between the Company, Aditya Birla Nuvo Ltd. ("ABNL") and Aditya Birla
Capital Ltd. (formerly known as Aditya Birla Financial Services Limited) (“ABCL”- a wholly owned
Subsidiary of ABNL) and their respective shareholders and creditors, for merger of ABNL with the
Company and the subsequent demerger of financial services business into ABCL and listing of equity shares
of ABCL.
Basis the Scheme, the merger of ABNL with and into the Company is effective from 1st July, 2017 and the
demerger of financial services business into ABCL is effective from 4th July, 2017.
In terms of the Scheme, the Company has issued 19,04,62,665 equity shares on 9th July, 2017 to the
shareholders of ABNL in the ratio of 15 (fifteen) equity Shares of ` 2/- each fully paid up against 10 (ten)
equity shares of ` 10/- each fully-paid up of ABNL held by them on the record date for this purpose. As a
result the Company’s paid up share capital has increased from ` 93.38 Crore to ` 131.47 Crore.
During the quarter, ABCL has issued 4,84,00,000 shares to PI Opportunities Fund-I on private placement
basis at a price of ` 145.40 each including premium of ` 135.40.
On account of demerger of financial services business, ABCL will issue it's equity shares in the ratio of 7
(seven) equity shares of ` 10 each fully paid-up in respect of 5 (five) equity shares of ` 2 each fully paid up
of the Company held by the shareholders of the Company on the record date for this purpose. As a result,
the holding of the Company in ABCL will be reduced to 55.99%.

Grasim Industries Limited
b. As the merger of ABNL is effective from 1st July, 2017, financial results for the three months ended 30th
June, 2017 of ABNL are not included in the Company's results for the said period. The key numbers of
Standalone and Consolidated financial results of ABNL for the three months ended 30th June, 2017 are as
under :
` Crore
Standalone Consolidated
30-06-2017
(Audited)
30-06-2016
(Unaudited)
30-06-2017
(Unaudited)
30-06-2016
(Unaudited)
Total Income 1,269.36 1,289.16 3,583.02 3,315.02
Profit before Exceptional Item and
Tax
75.87 124.96 333.55 322.42
Exceptional Item # - 1,119.70 - -
Profit before Tax 75.87 1,244.66 333.55 322.42
Net Profit after Tax
(Before Exceptional Item)
58.37 129.54 78.70 303.65
Net Profit after Tax
(After Exceptional Item)
58.37 1,102.60 78.70 303.65
Other Comprehensive Income after
Tax
118.21 97.03 159.64 90.54
Total Comprehensive Income after
Tax
176.58 1,199.63 238.34 394.19
# Exceptional Item represents profit on sale of Investment in Birla Sun Life Insurance Company Limited by erstwhile ABNL
4. Grasim Bhiwani Textiles Limited (GBTL), a wholly owned subsidiary of the Company has ceased to be a
subsidiary w.e.f. 10th July, 2017 as the Company has divested it's entire shareholding in GBTL to Rajendra
Synthetics Private Limited. There will be a loss of ` 53.96 Crore on the said divestment. Divestment of GBTL
will not have any material impact on the consolidated financials of the Company.
5. The Scheme of Arrangement between the UltraTech Cement Limited (UltraTech), a subsidiary of the
Company, Jaiprakash Associates Limited (“JAL”), Jaypee Cement Corporation Limited (“JCCL”) and their
respective shareholders and creditors has become effective from 29th June, 2017 (the "Acquisition Date").
Accordingly, as per Ind AS 103 purchase consideration has been allocated by UltraTech on a provisional
basis, pending determination of the fair value of assets and liabilities of the business acquired. The effect of
this acquisition on the Company’s results accounted on provisional basis for the current quarter were not
material.
UltraTech has filed an appeal with Competition Appellate Tribunal (“COMPAT”) against two orders of the
Competition Commission of India (“CCI”) dated 31st August, 2016 and 19th January, 2017 respectively and
as per the directions of COMPAT, has deposited ` 117.55 Crores, being 10% of the penalty imposed by CCI
under its order dated 31st August 2016. COMPAT has since granted a stay on both the CCI orders.
Based on legal opinion, UltraTech believes that it has a good case and therefore no provision has been made
in the accounts.
6. The equity shares of the Company have been sub- divided from one (1) equity share of face value `10 each
fully paid up into five (5) equity shares of face value ` 2 each fully paid up effective from 8th October,
2016. The Earning per Share for previous periods' have also been adjusted for the face of ` 2 each in
accordance with Ind AS 33-Earnings Per Share.

Grasim Industries Limited
7. In respect of Idea Cellular Limited (Idea), an Associate of the Company:
On 8th January, 2013, Department of Telecommunication (DoT) issued demand notices towards one time
spectrum charges:
- for spectrum beyond 6.2 Mhz in respective service areas with retrospective period from 1st July
2008 to 31st December 2012, Group share amounting to ` 17.49 Crore; and
- for spectrum beyond 4.4 Mhz in respective services areas effective 1st January 2013 till expiry
of the period as per respective licenses, Group share amounting to ` 82.69 Crore.
In the opinion of Idea, inter-alia, the above demands amount to alteration of financial terms of the licenses
issued in the past. Idea had therefore, petitioned the Hon'ble High Court of Bombay, where the matter was
admitted and is currently sub-judice. The Hon'ble High Court of Bombay has directed the DoT not to take
any coercive action until the matter is further heard. No effect has been given in the Consolidated Financial
results for the above.
8. During the quarter, the Company has allotted 30,855 fully paid up equity shares of ` 2 each upon excercise
of employee stock options.
9. Previous period's figures have been regrouped/rearranged wherever necessary to conform to the current
period’s classification.
For and on behalf of Board of Directors
Place : Mumbai Dilip Gaur
Date : 14th August, 2017 Managing Director
Grasim Industries Limited
Regd. Office: Birlagram, Nagda 456 331 (M.P.)
An Aditya Birla Group Company
www.adityabirla.com and www.grasim.com
Tel: (07366) 246760-66 | Fax: (07366) 244114, 246024 | CIN: L17124MP1947PLC000410

1
Press Release Mumbai, 14th August, 2017
Building, Consolidating, Growing
Consolidated Financial Performance
Q1 FY18: Net Revenue up 8%; EBITDA up 9%; Net Profit up 7%
` Cr.
Grasim has reported an all-round growth in Revenue, EBITDA and Net profit for the quarter ended 30th June, 2017. The Consolidated revenue at ` 9,846 Cr. was up by 8%. EBITDA at
` 2,419 Cr. was up by 9% on the back of improved profitability from all the businesses. Net
profit for the quarter rose by 7% at ` 890 Cr.
Viscose Staple Fibre (VSF)
Global VSF prices witnessed some weakness during the quarter due to subdued demand
conditions from downstream players in China. Prices recovered towards the quarter end,
with improving market sentiments.
The Domestic market saw destocking in the value chain given the announcement of GST
implementation. The company’s sales volumes were maintained at 121K tons. EBITDA for the quarter was at ` 349 Cr., up by 8% led by better product mix and improved operating
efficiency.
The Operations of the captive pulp plant at Harihar resumed towards June end, with the
onset of monsoon.
Chemical Business
The Domestic Caustic Soda prices remained firm in line with international prices. The Over
supply of Chlorine due to new capacity additions last year continued to impact Chlorine
prices in the domestic market.
For Q1FY18, our sales volumes were up by 4% at 199K tons. ECU realisation augmented by
2% helped by higher Caustic prices and partially restricted by negative Chlorine realisation.
The business continues to focus on increasing the volume of Chlorine based value added products. Despite the increase in power cost EBITDA at ` 244 Cr. rose by 5% backed by
higher ECU realisation and higher sales volume of Epoxy products.
The Brownfield expansion at Vilayat is progressing as planned. The commissioning of the
plant is expected by Q4FY18. With debottlenecking under implementation at its other
plants and the capacity of Aditya Birla Nuvo Ltd. (ABNL) coming into Grasim’s fold
(effective from 1st July 2017), the total Caustic soda capacity will increase from 840K TPA to
1139K TPA.
Quarter ended
30.06.2017 30.06.2016
Net Revenue 9,846 9,085
EBITDA 2,419 2,214
Net Profit 890 830

2
Cement Subsidiary - UltraTech
UltraTech reported an increase in consolidated revenue by 7% at ` 7,035 Cr. EBITDA
enhanced by 11% to ` 1,798 Cr. On the cost front, the increase in pet coke and fuel prices
led to higher energy and logistic costs, offset to some extent by an improvement in
operating efficiencies.
During the quarter, UltraTech completed the acquisition of the Cement plants from
Jaiprakash Associates Limited and Jaypee Cement Corporations Limited with a total
capacity of 21.2 Mn. TPA. The acquisition propels UltraTech’s total capacity to 93 Mn. TPA
and provides a strong foothold in Central India.
Composite Scheme of Arrangement for merger of Aditya Birla Nuvo Limited
With the sanction from NCLT for the composite scheme of merger of ABNL into Grasim and
the demerger of Financial Services business, ABNL has merged with Grasim effective from
1st July, 2017. The demerger of the Financial Services business has been rendered effective
from the 4th July, 2017. The allotment and listing of equity shares of Aditya Birla Capital
Limited (formerly known as Aditya Birla Financial Services Limited) is in process.
As the merger of ABNL has become effective from 1st July, 2017, its financial results are not
included in the Company’s results. The results of erstwhile ABNL will be included in the
Company’s financial result from Q2 FY18 onwards. For current quarter, erstwhile ABNL’s consolidated EBITDA was ` 448 Cr. and PAT was ` 79 Cr.
Outlook
The VSF business will continue to focus on expanding the VSF market in India by partnering
with the textile value chain, achieving better customer connect through Brand Liva and
enriching the product mix through a larger share of specialty fibre. The Company is working
on investment plan for capacity expansion in addition to the ongoing debottlenecking of
its plants to meet the growing consumer demand.
The demand for Caustic Soda in India is expected to grow with rising consumption from the
Alumina and Textile sectors. However, the increase in supply on account of new capacities
in the industry may create a temporary imbalance in the demand supply situation. Chlorine
continues to remain in the oversupply mode.
In Cement, the demand is expected to grow, driven by the Government’s focus on
infrastructure spending, affordable housing and the likely revival of rural housing with good
monsoon. The Company is well positioned across the country to cater to the growth in
demand.
The Company, with leadership positions across its businesses and the merger of ABNL, is
poised to enter into a new era of growth with a combination of high growth sectors and
businesses with healthy cash flows supported by a strong Balance Sheet.
GRASIM INDUSTRIES LIMITED Aditya Birla Centre, 'A’ Wing, 2nd Floor, S. K. Ahire Marg, Worli, Mumbai - 400 030
Registered Office : Birlagram, Nagda - 456 331 (M.P.)
Tel: (07366) 246760-66, Fax : (07366) 244114, 246024, CIN: L17124MP1947PLC000410
www.grasim.com & www.adityabirla.com
twitter: www.twitter.com/adityabirlagrp Twitter handle is @AdityaBirlaGrp
Cautionary Statement
Statements in this “Press Release” describing the Company’s objectives, projections, estimates, expectations or predictions
may be “forward looking statements” within the meaning of applicable securities law and regulations. Actual results could
differ materially from those express or implied. Important factors that could make a difference to the Company’s operations
include global and Indian demand supply conditions, finished goods prices, feedstock availability and prices, cyclical
demand and pricing in the Company’s principal markets, changes in Government regulations, tax regimes, economic
developments within India and the countries within which the Company conducts business and other factors such as litigation
and labour negotiations. The Company assumes no responsibility to publicly amend, modify or revise any forward looking
statement, on the basis of any subsequent development, information or events, or otherwise.