Hindalco Industries Limited
37
Hindalco Industries Limited Q1 FY22 Earnings Presentation 06 th August, 2021
-
Upload
khangminh22 -
Category
Documents
-
view
1 -
download
0
Transcript of Hindalco Industries Limited
Hindalco IndustriesLimited
Q1 FY22 Earnings Presentation06th August, 2021
Hindalco Industries Limited 2
SAFE HARBOUR
Certain statements in this report may be “forward looking statements” within the meaning of applicablesecurities laws and regulations. Actual results could differ materially from those expressed or implied.Important factors that could make a difference to the company’s operations include global and Indiandemand supply conditions, finished goods prices, feed stock availability and prices, cyclical demand andpricing in the company’s principal markets, changes in Government regulations, tax regimes, economicdevelopments within India and the countries within which the company conducts business and other factorssuch as litigation and labour negotiations. The company assume no responsibility to publicly amend, modifyor revise any forward looking statement, on the basis of any subsequent development, information orevents, or otherwise.
Hindalco Industries Limited
Table of Content
3
2. Key Highlights – Q1 FY22
4. Business Performance : Operational & Financial – Q1 FY22 - Novelis- Aluminium (India)- Copper - Consolidated
3. Economy & Industry Updates – Global & Domestic
5. Annexures :- Consolidated - Key Financials- Hindalco (India) Business - Key Financials - Alumina Production Trend
• Novelis
• Aluminium
(India)
• Copper
1. Hindalco Sustainability Updates

Hindalco Industries Limited
Hindalco (India) Sustainability Updates
4
Hindalco Industries Limited 5
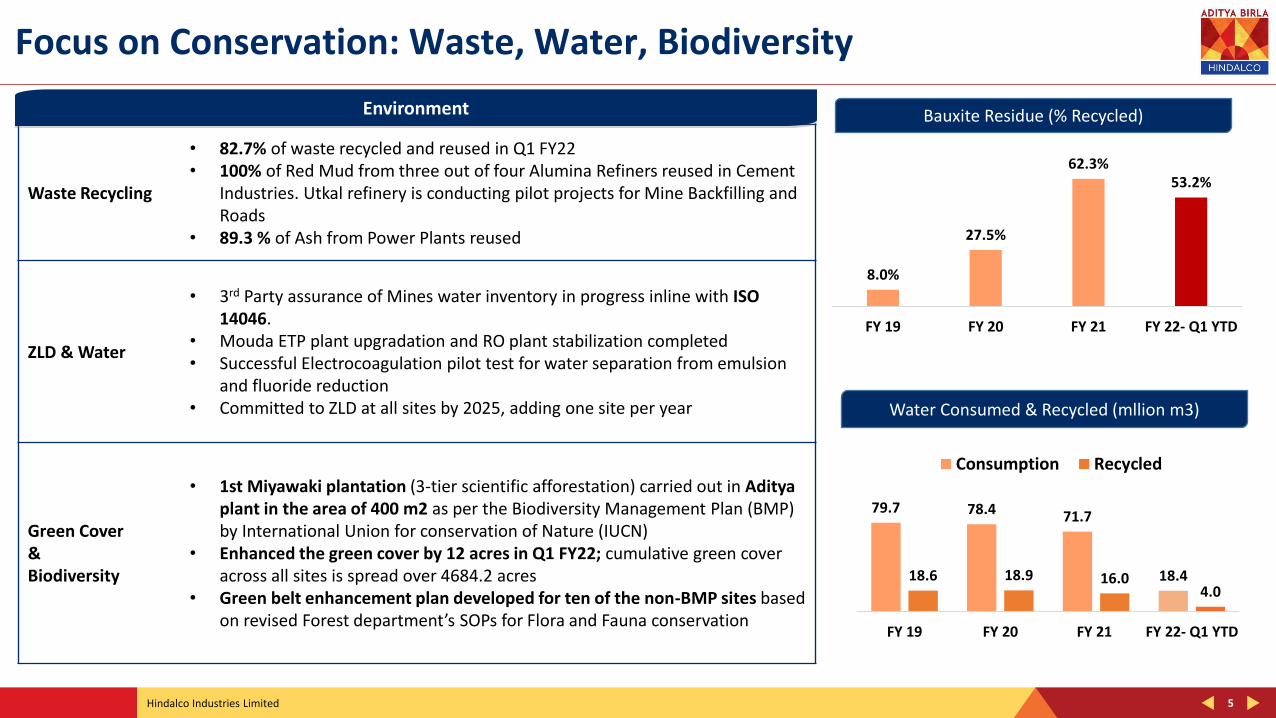
Focus on Conservation: Waste, Water, Biodiversity
Waste Recycling
• 82.7% of waste recycled and reused in Q1 FY22• 100% of Red Mud from three out of four Alumina Refiners reused in Cement
Industries. Utkal refinery is conducting pilot projects for Mine Backfilling and Roads
• 89.3 % of Ash from Power Plants reused
ZLD & Water
• 3rd Party assurance of Mines water inventory in progress inline with ISO 14046.
• Mouda ETP plant upgradation and RO plant stabilization completed• Successful Electrocoagulation pilot test for water separation from emulsion
and fluoride reduction• Committed to ZLD at all sites by 2025, adding one site per year
Green Cover & Biodiversity
• 1st Miyawaki plantation (3-tier scientific afforestation) carried out in Aditya plant in the area of 400 m2 as per the Biodiversity Management Plan (BMP) by International Union for conservation of Nature (IUCN)
• Enhanced the green cover by 12 acres in Q1 FY22; cumulative green cover across all sites is spread over 4684.2 acres
• Green belt enhancement plan developed for ten of the non-BMP sites based on revised Forest department’s SOPs for Flora and Fauna conservation
Environment
Water Consumed & Recycled (mllion m3)
79.7 78.4 71.7
18.418.6 18.9 16.04.0
FY 19 FY 20 FY 21 FY 22- Q1 YTD
Consumption Recycled
Bauxite Residue (% Recycled)
8.0%
27.5%
62.3%53.2%
FY 19 FY 20 FY 21 FY 22- Q1 YTD
Hindalco Industries Limited
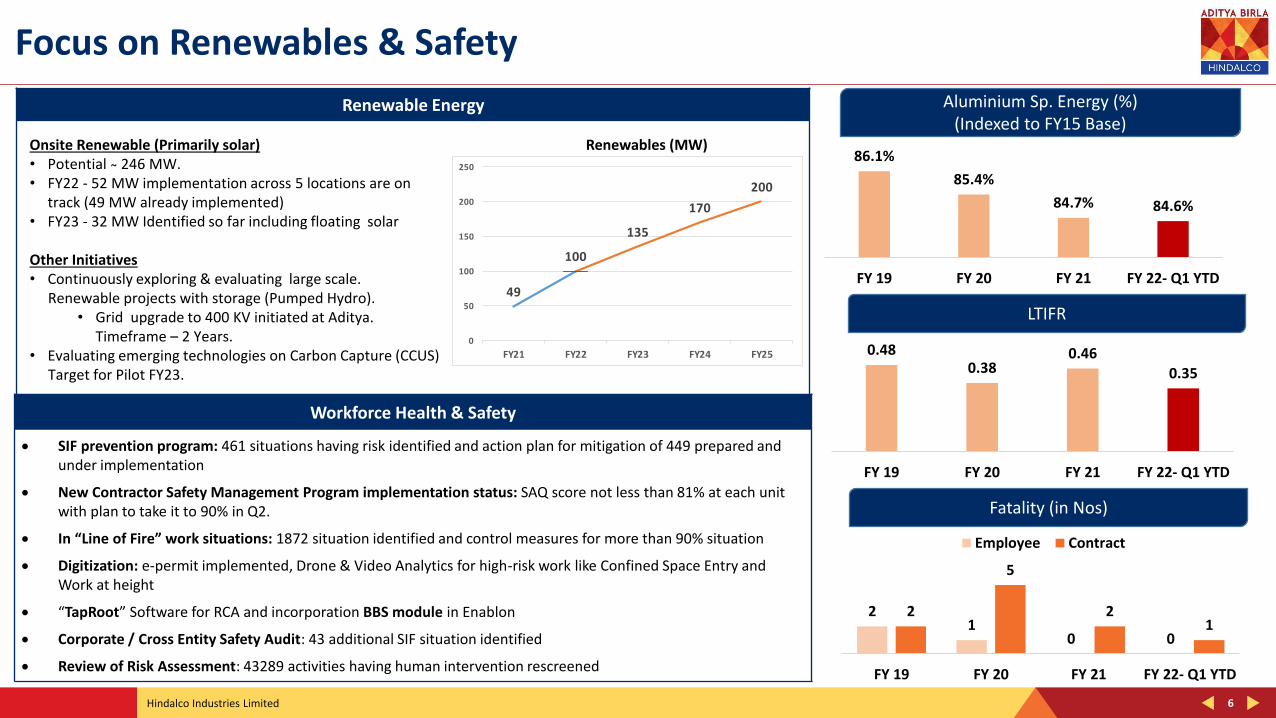
Renewable Energy
6
Focus on Renewables & Safety
LTIFR
0.480.38
0.460.35
FY 19 FY 20 FY 21 FY 22- Q1 YTD
Aluminium Sp. Energy (%)(Indexed to FY15 Base)
86.1%
85.4%
84.7% 84.6%
FY 19 FY 20 FY 21 FY 22- Q1 YTD
Workforce Health & Safety
• SIF prevention program: 461 situations having risk identified and action plan for mitigation of 449 prepared and under implementation
• New Contractor Safety Management Program implementation status: SAQ score not less than 81% at each unit with plan to take it to 90% in Q2.
• In “Line of Fire” work situations: 1872 situation identified and control measures for more than 90% situation
• Digitization: e-permit implemented, Drone & Video Analytics for high-risk work like Confined Space Entry and Work at height
• “TapRoot” Software for RCA and incorporation BBS module in Enablon
• Corporate / Cross Entity Safety Audit: 43 additional SIF situation identified
• Review of Risk Assessment: 43289 activities having human intervention rescreened
Onsite Renewable (Primarily solar)• Potential ̴ 246 MW.• FY22 - 52 MW implementation across 5 locations are on
track (49 MW already implemented)• FY23 - 32 MW Identified so far including floating solar
Other Initiatives• Continuously exploring & evaluating large scale.
Renewable projects with storage (Pumped Hydro).• Grid upgrade to 400 KV initiated at Aditya.
Timeframe – 2 Years.• Evaluating emerging technologies on Carbon Capture (CCUS)
Target for Pilot FY23.
49
100
135
170
200
0
50
100
150
200
250
FY21 FY22 FY23 FY24 FY25
Renewables (MW)
Fatality (in Nos)
21
0 0
2
5
21
FY 19 FY 20 FY 21 FY 22- Q1 YTD
Employee Contract

Hindalco Industries Limited
Business Performance Key Highlights - Q1 FY22
7
Hindalco Industries Limited
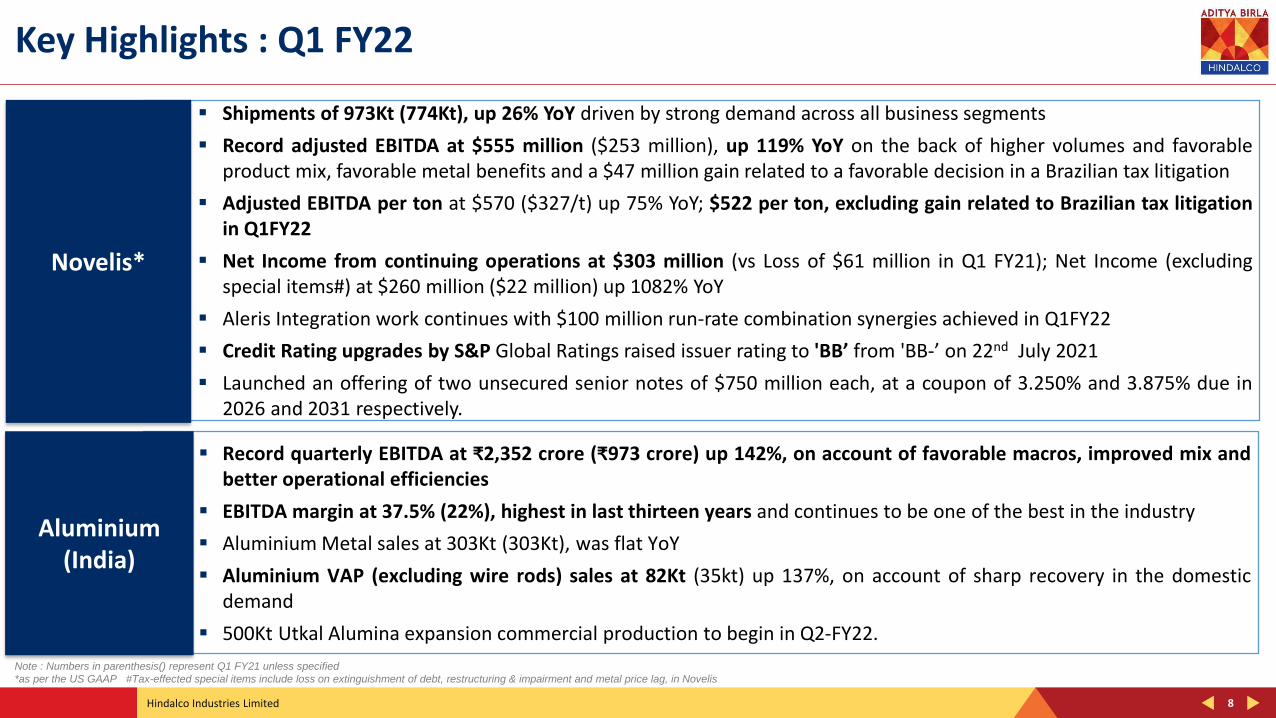
▪ Record quarterly EBITDA at ₹2,352 crore (₹973 crore) up 142%, on account of favorable macros, improved mix andbetter operational efficiencies
▪ EBITDA margin at 37.5% (22%), highest in last thirteen years and continues to be one of the best in the industry
▪ Aluminium Metal sales at 303Kt (303Kt), was flat YoY
▪ Aluminium VAP (excluding wire rods) sales at 82Kt (35kt) up 137%, on account of sharp recovery in the domesticdemand
▪ 500Kt Utkal Alumina expansion commercial production to begin in Q2-FY22.
▪ Shipments of 973Kt (774Kt), up 26% YoY driven by strong demand across all business segments
▪ Record adjusted EBITDA at $555 million ($253 million), up 119% YoY on the back of higher volumes and favorableproduct mix, favorable metal benefits and a $47 million gain related to a favorable decision in a Brazilian tax litigation
▪ Adjusted EBITDA per ton at $570 ($327/t) up 75% YoY; $522 per ton, excluding gain related to Brazilian tax litigationin Q1FY22
▪ Net Income from continuing operations at $303 million (vs Loss of $61 million in Q1 FY21); Net Income (excludingspecial items#) at $260 million ($22 million) up 1082% YoY
▪ Aleris Integration work continues with $100 million run-rate combination synergies achieved in Q1FY22
▪ Credit Rating upgrades by S&P Global Ratings raised issuer rating to 'BB’ from 'BB-’ on 22nd July 2021
▪ Launched an offering of two unsecured senior notes of $750 million each, at a coupon of 3.250% and 3.875% due in2026 and 2031 respectively.
8
Key Highlights : Q1 FY22
Aluminium (India)
Novelis*
Note : Numbers in parenthesis() represent Q1 FY21 unless specified
*as per the US GAAP #Tax-effected special items include loss on extinguishment of debt, restructuring & impairment and metal price lag, in Novelis
Hindalco Industries Limited 9
Key Highlights : Q1 FY22 ...Contd.
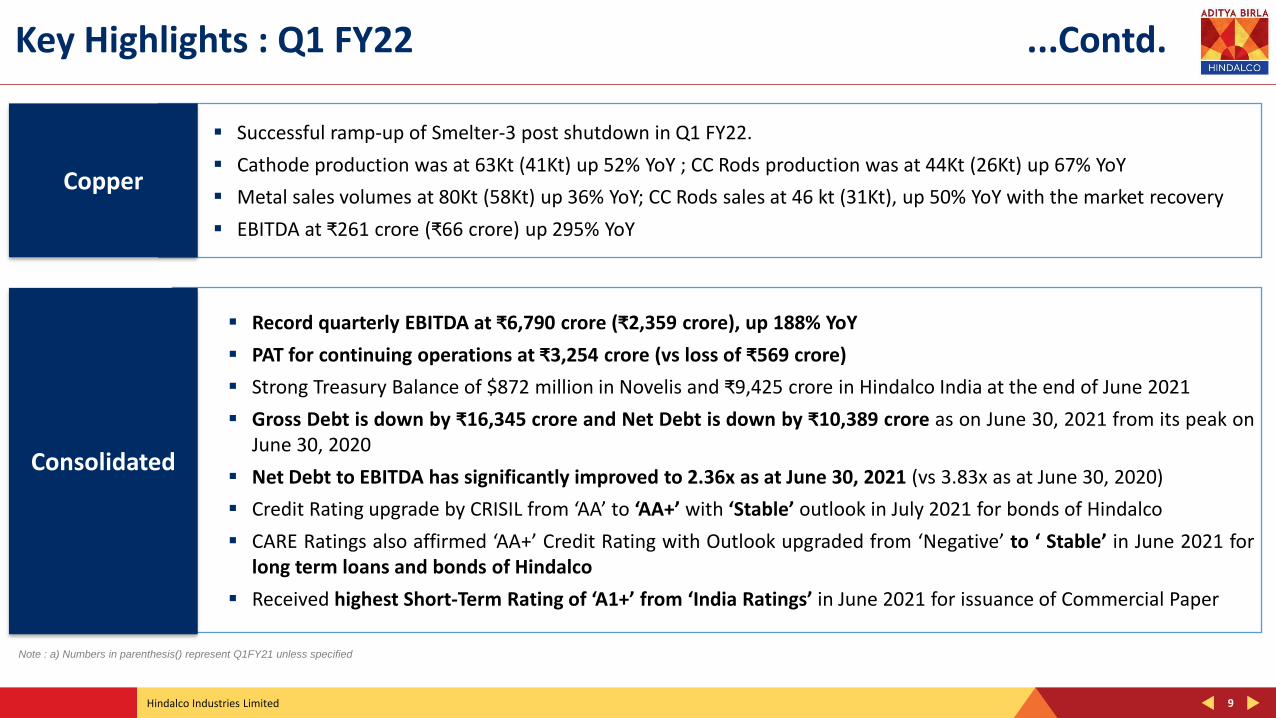
▪ Successful ramp-up of Smelter-3 post shutdown in Q1 FY22.
▪ Cathode production was at 63Kt (41Kt) up 52% YoY ; CC Rods production was at 44Kt (26Kt) up 67% YoY
▪ Metal sales volumes at 80Kt (58Kt) up 36% YoY; CC Rods sales at 46 kt (31Kt), up 50% YoY with the market recovery
▪ EBITDA at ₹261 crore (₹66 crore) up 295% YoY
Copper
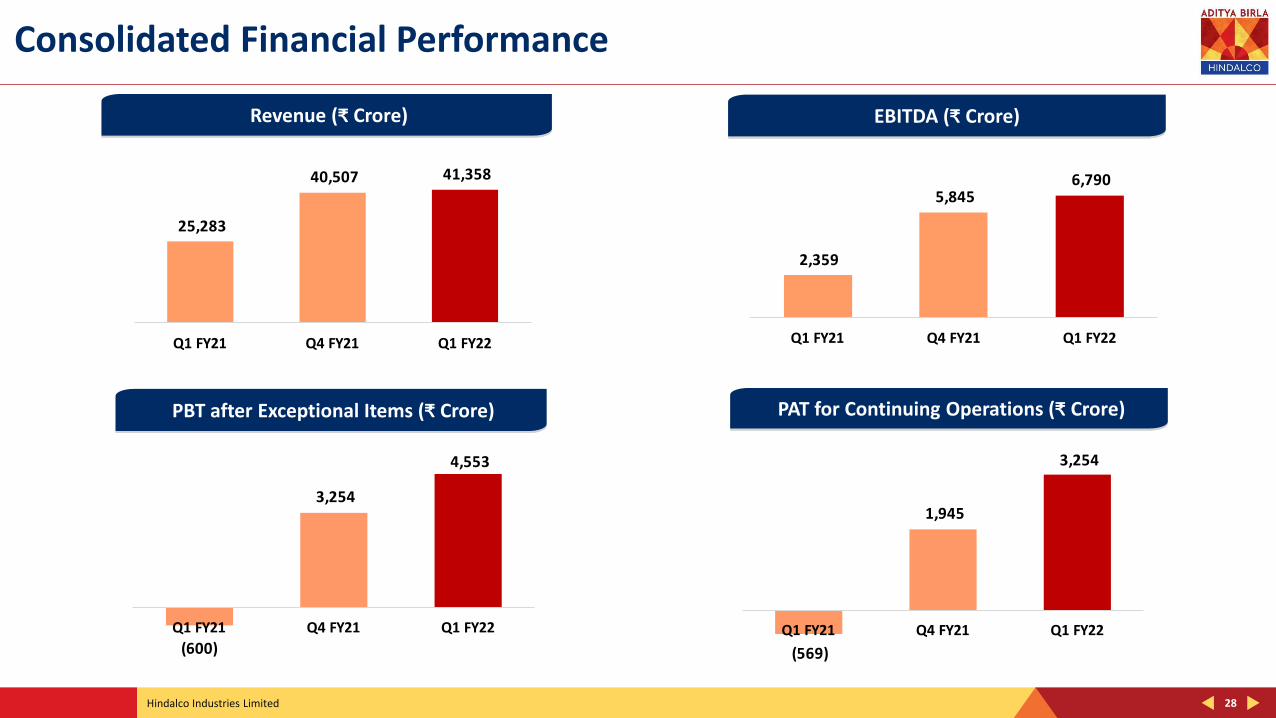
▪ Record quarterly EBITDA at ₹6,790 crore (₹2,359 crore), up 188% YoY
▪ PAT for continuing operations at ₹3,254 crore (vs loss of ₹569 crore)
▪ Strong Treasury Balance of $872 million in Novelis and ₹9,425 crore in Hindalco India at the end of June 2021
▪ Gross Debt is down by ₹16,345 crore and Net Debt is down by ₹10,389 crore as on June 30, 2021 from its peak onJune 30, 2020
▪ Net Debt to EBITDA has significantly improved to 2.36x as at June 30, 2021 (vs 3.83x as at June 30, 2020)
▪ Credit Rating upgrade by CRISIL from ‘AA’ to ‘AA+’ with ‘Stable’ outlook in July 2021 for bonds of Hindalco
▪ CARE Ratings also affirmed ‘AA+’ Credit Rating with Outlook upgraded from ‘Negative’ to ‘ Stable’ in June 2021 forlong term loans and bonds of Hindalco
▪ Received highest Short-Term Rating of ‘A1+’ from ‘India Ratings’ in June 2021 for issuance of Commercial Paper
Consolidated
Note : a) Numbers in parenthesis() represent Q1FY21 unless specified
Hindalco Industries Limited
Economy & Industry Updates
Global & Domestic
10
Hindalco Industries Limited
5.6
3.0
-0.1
5.4
4.33.5 3.5 3.6 3.5 3.4
3.9 3.62.9
-3.2
6.0
CY07 CY08 CY09 CY10 CY11 CY12 CY13 CY14 CY15 CY16 CY17 CY18 CY19 CY20 CY21E
9.8
3.9
8.5
10.3
6.65.5
6.47.4 8.0 8.3 8.3
7.0
4.2
-7.3
9.5
FY08 FY09 FY10 FY11 FY12 FY13 FY14 FY15 FY16 FY17 FY18 FY19 FY20 FY21 FY22E
11
Economy Updates
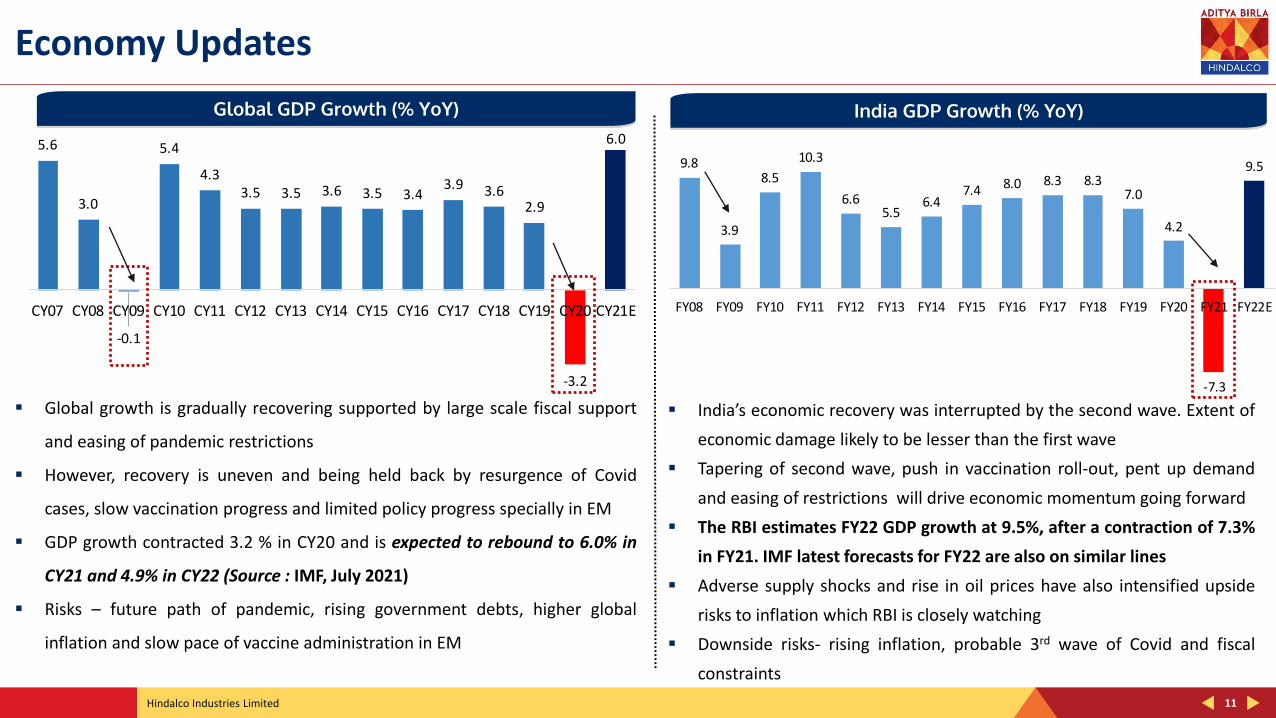
▪ Global growth is gradually recovering supported by large scale fiscal support
and easing of pandemic restrictions
▪ However, recovery is uneven and being held back by resurgence of Covid
cases, slow vaccination progress and limited policy progress specially in EM
▪ GDP growth contracted 3.2 % in CY20 and is expected to rebound to 6.0% in
CY21 and 4.9% in CY22 (Source : IMF, July 2021)
▪ Risks – future path of pandemic, rising government debts, higher global
inflation and slow pace of vaccine administration in EM
▪ India’s economic recovery was interrupted by the second wave. Extent of
economic damage likely to be lesser than the first wave
▪ Tapering of second wave, push in vaccination roll-out, pent up demand
and easing of restrictions will drive economic momentum going forward
▪ The RBI estimates FY22 GDP growth at 9.5%, after a contraction of 7.3%
in FY21. IMF latest forecasts for FY22 are also on similar lines
▪ Adverse supply shocks and rise in oil prices have also intensified upside
risks to inflation which RBI is closely watching
▪ Downside risks- rising inflation, probable 3rd wave of Covid and fiscal
constraints
Global GDP Growth (% YoY) India GDP Growth (% YoY)
Hindalco Industries Limited 12
Global Aluminium Industry
2.0 0.2 1.7 0.3
0.1
(0.3) (1.6) (0.9)
H1
CY2
0
H1
CY2
1
Q2
CY2
0
Q2
CY2
1
13.9 14.3 6.9 7.2
12.0 14.1 5.2 6.9
17.7 19.4
8.9 9.7
17.6 19.7
10.4 10.6
H1
CY2
0
H1
CY2
1
Q2
CY2
0
Q2
CY2
1
H1
CY2
0
H1
CY2
1
Q2
CY2
0
Q2
CY2
1
1,690
1,497
1,704
1,916
2,096
2,399
Q1
CY2
0
Q2
CY2
0
Q3
CY2
0
Q4
CY2
0
Q1
CY2
1
Q2
CY2
1
12
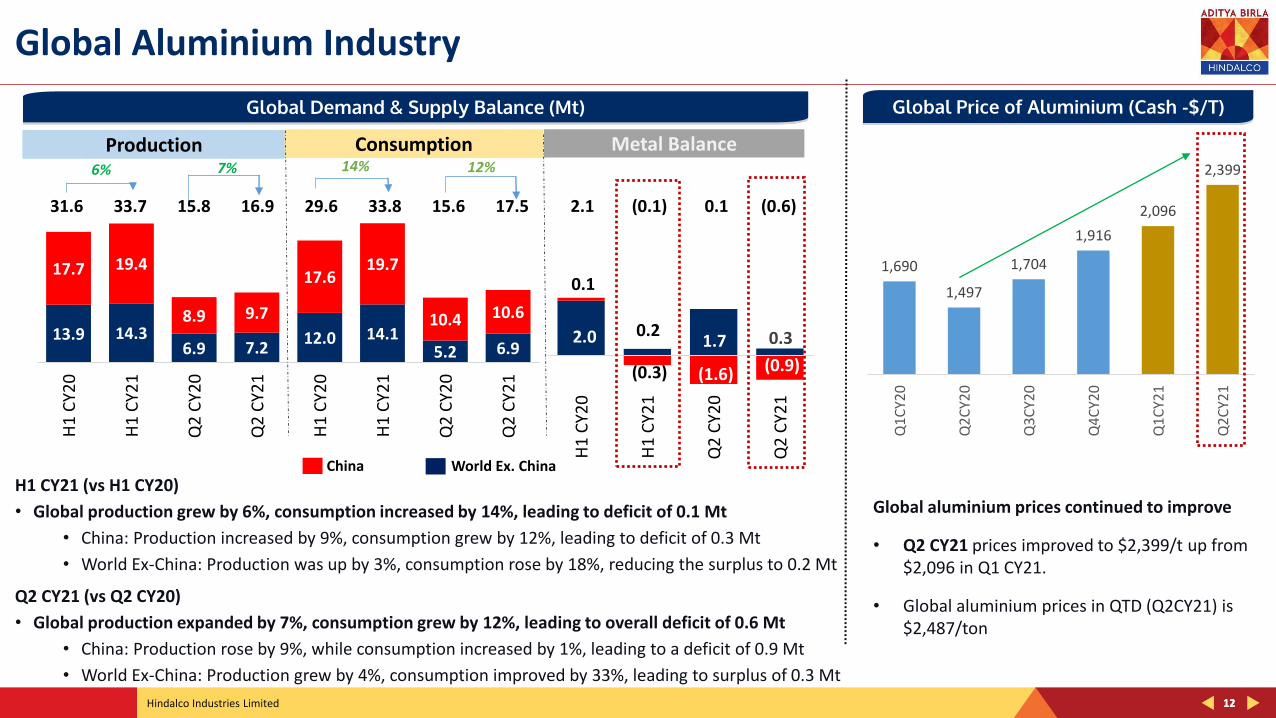
H1 CY21 (vs H1 CY20)
• Global production grew by 6%, consumption increased by 14%, leading to deficit of 0.1 Mt
• China: Production increased by 9%, consumption grew by 12%, leading to deficit of 0.3 Mt
• World Ex-China: Production was up by 3%, consumption rose by 18%, reducing the surplus to 0.2 Mt
Q2 CY21 (vs Q2 CY20)
• Global production expanded by 7%, consumption grew by 12%, leading to overall deficit of 0.6 Mt
• China: Production rose by 9%, while consumption increased by 1%, leading to a deficit of 0.9 Mt
• World Ex-China: Production grew by 4%, consumption improved by 33%, leading to surplus of 0.3 Mt
Global Demand & Supply Balance (Mt) Global Price of Aluminium (Cash -$/T)
31.6 33.7 15.8 16.9 29.6 33.8 15.6 17.5 2.1 (0.1) 0.1 (0.6)
Production Consumption Metal Balance6% 7% 14% 12%
Global aluminium prices continued to improve
• Q2 CY21 prices improved to $2,399/t up from $2,096 in Q1 CY21.
• Global aluminium prices in QTD (Q2CY21) is $2,487/ton
China World Ex. China
Hindalco Industries Limited 13
Domestic Aluminium Industry
186 363 382 422 340
272
262 442 415
371 116
122
195 237
173
Q1 FY21 Q2 FY21 Q3 FY21 Q4 FY21 Q1 FY22E
Domestic Sales Scrap Imports Imports Ex Scrap
Domestic Demand (Kt)
574 747 1018 1073 884
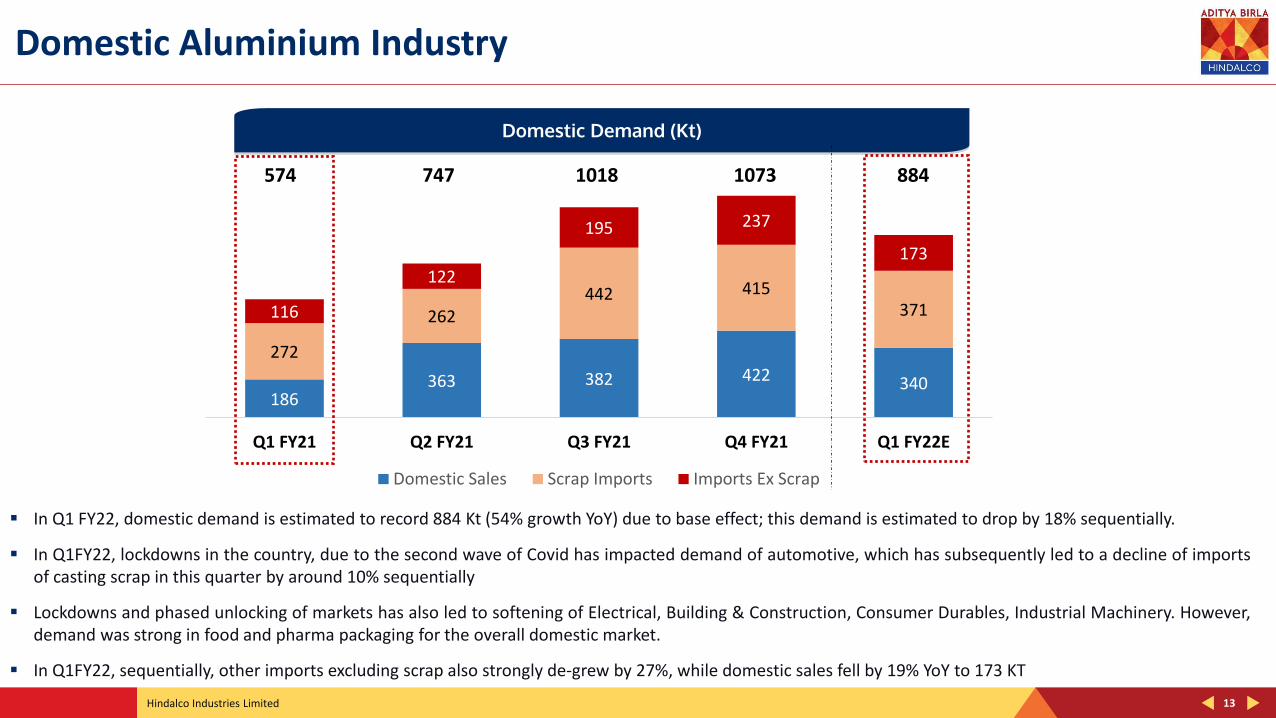
▪ In Q1 FY22, domestic demand is estimated to record 884 Kt (54% growth YoY) due to base effect; this demand is estimated to drop by 18% sequentially.
▪ In Q1FY22, lockdowns in the country, due to the second wave of Covid has impacted demand of automotive, which has subsequently led to a decline of importsof casting scrap in this quarter by around 10% sequentially
▪ Lockdowns and phased unlocking of markets has also led to softening of Electrical, Building & Construction, Consumer Durables, Industrial Machinery. However,demand was strong in food and pharma packaging for the overall domestic market.
▪ In Q1FY22, sequentially, other imports excluding scrap also strongly de-grew by 27%, while domestic sales fell by 19% YoY to 173 KT
Hindalco Industries Limited 14
Aluminium Flat Rolled Products (FRP) Industry
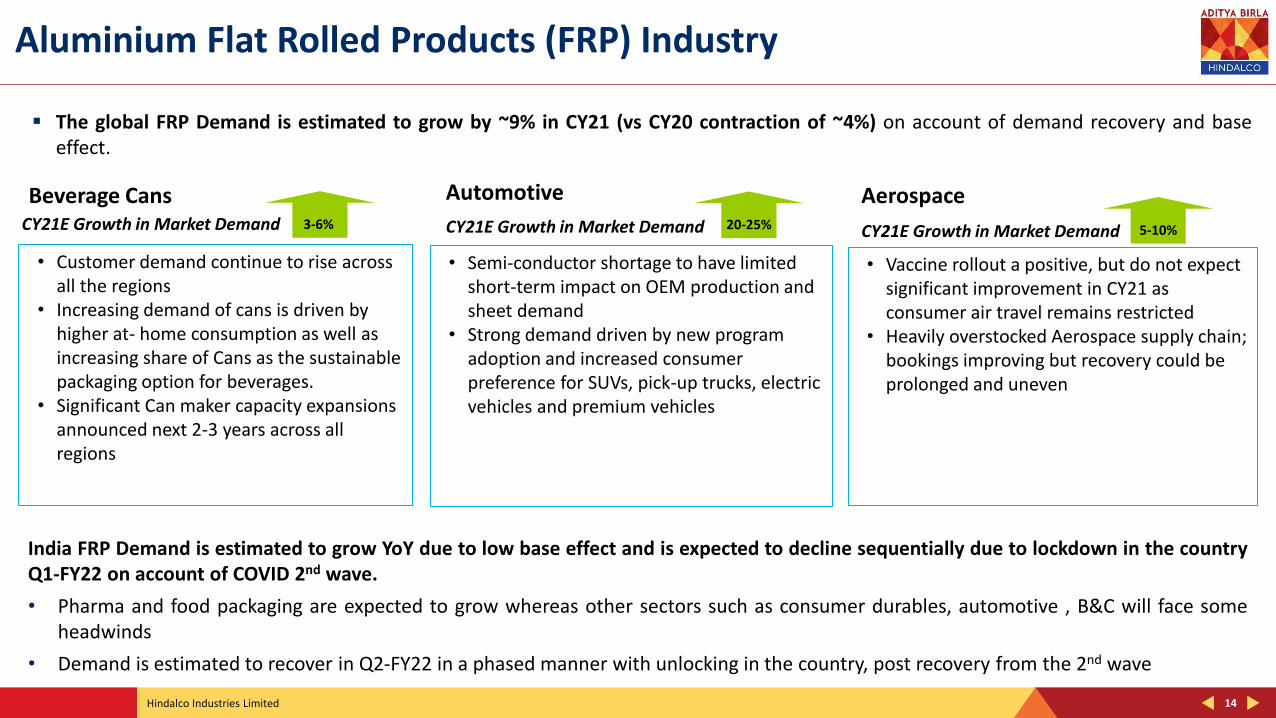
▪ The global FRP Demand is estimated to grow by ~9% in CY21 (vs CY20 contraction of ~4%) on account of demand recovery and baseeffect.
India FRP Demand is estimated to grow YoY due to low base effect and is expected to decline sequentially due to lockdown in the countryQ1-FY22 on account of COVID 2nd wave.
• Pharma and food packaging are expected to grow whereas other sectors such as consumer durables, automotive , B&C will face someheadwinds
• Demand is estimated to recover in Q2-FY22 in a phased manner with unlocking in the country, post recovery from the 2nd wave
• Customer demand continue to rise across all the regions
• Increasing demand of cans is driven by higher at- home consumption as well as increasing share of Cans as the sustainable packaging option for beverages.
• Significant Can maker capacity expansions announced next 2-3 years across all regions
• Semi-conductor shortage to have limited short-term impact on OEM production and sheet demand
• Strong demand driven by new program adoption and increased consumer preference for SUVs, pick-up trucks, electric vehicles and premium vehicles
• Vaccine rollout a positive, but do not expect significant improvement in CY21 as consumer air travel remains restricted
• Heavily overstocked Aerospace supply chain; bookings improving but recovery could be prolonged and uneven
Beverage Cans Automotive AerospaceCY21E Growth in Market Demand 20-25%CY21E Growth in Market Demand CY21E Growth in Market Demand 5-10%3-6%
Hindalco Industries Limited
6.9 7.0
3.4 3.65.2 5.7
2.3 2.8
4.6 5.0
2.3 2.5
5.56.0
3.5 3.3
H1 CY20 H1CY21 Q2 CY20 Q2 CY21 H1 CY20 H1CY21 Q2 CY20 Q2 CY21
Production ConsumptionWorld ex-China China
15
Copper Industry (Global)
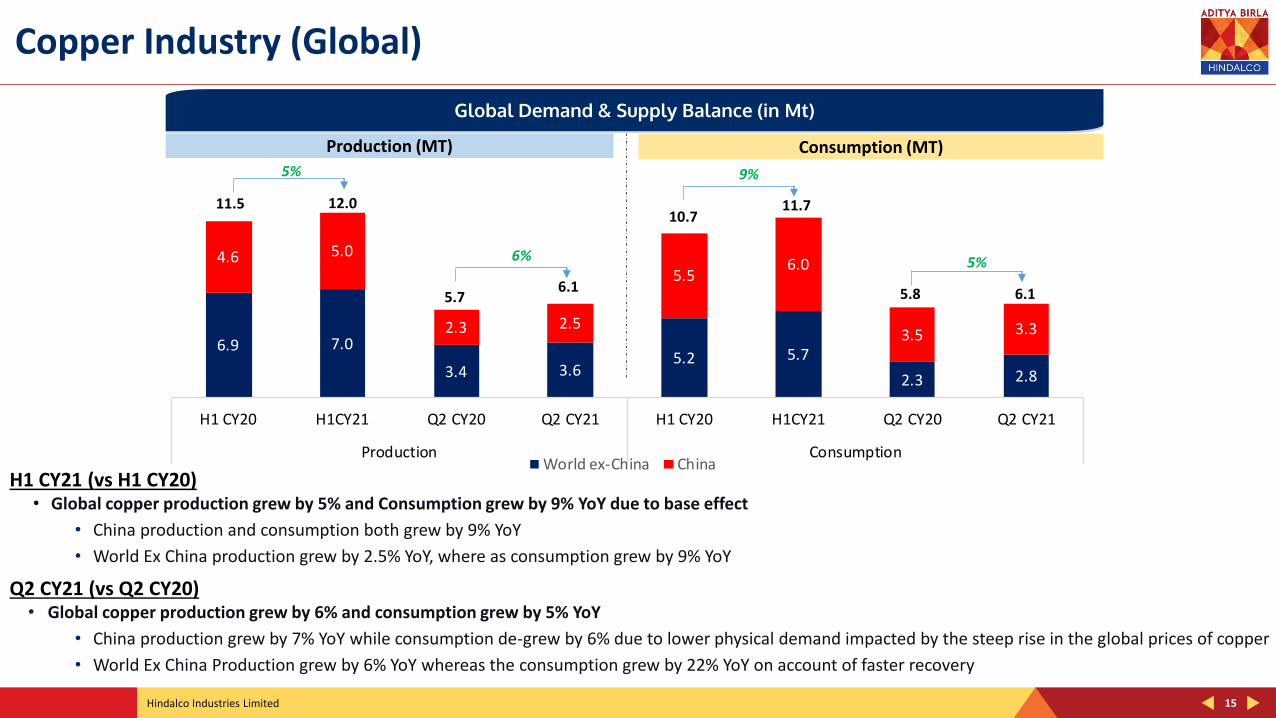
H1 CY21 (vs H1 CY20)• Global copper production grew by 5% and Consumption grew by 9% YoY due to base effect
• China production and consumption both grew by 9% YoY
• World Ex China production grew by 2.5% YoY, where as consumption grew by 9% YoY
Q2 CY21 (vs Q2 CY20)• Global copper production grew by 6% and consumption grew by 5% YoY
• China production grew by 7% YoY while consumption de-grew by 6% due to lower physical demand impacted by the steep rise in the global prices of copper
• World Ex China Production grew by 6% YoY whereas the consumption grew by 22% YoY on account of faster recovery
Global Demand & Supply Balance (in Mt)
11.5 12.0
5.76.1
10.711.7
5.8 6.1
Production (MT) Consumption (MT)5%
6%
9%
5%
Hindalco Industries Limited
51
113 106 119
74
40
37 59 42
44
Q1FY21 Q2 FY21 Q3FY21 Q4FY21 Q1FY22Domestic Supply Import
16
Copper Industry (Domestic)
Q1 FY22 vs Q1 FY21
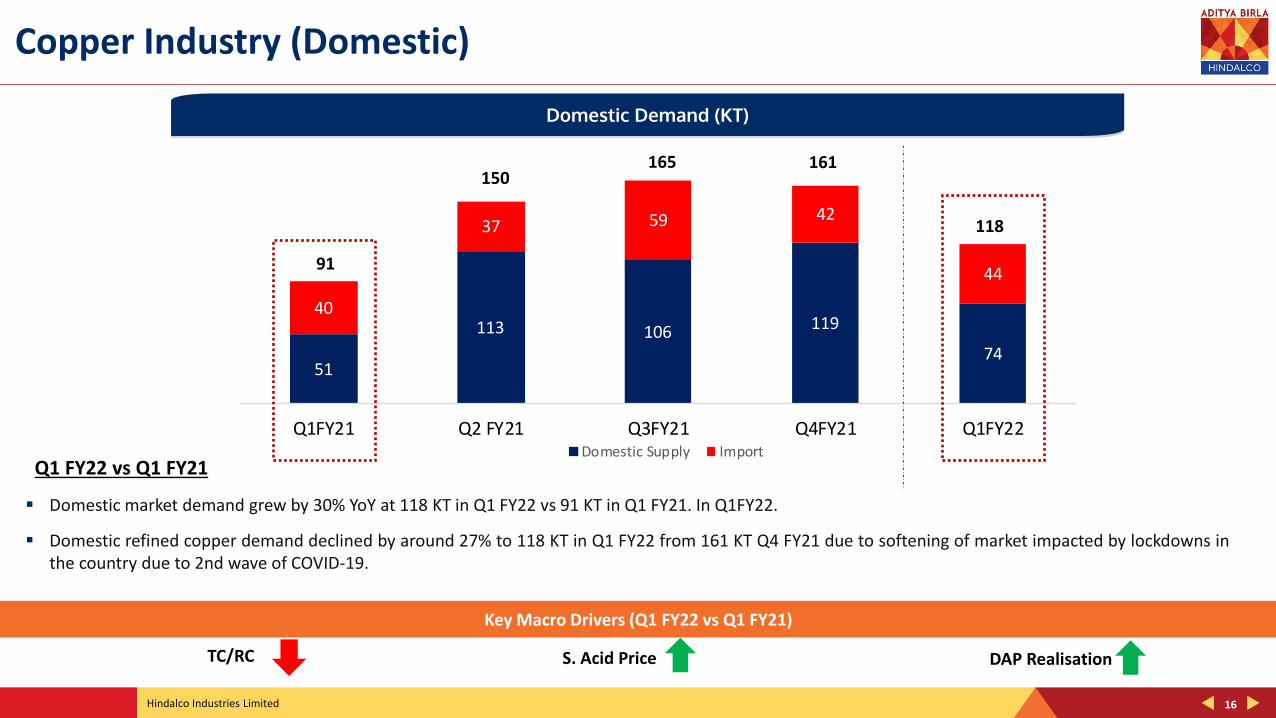
▪ Domestic market demand grew by 30% YoY at 118 KT in Q1 FY22 vs 91 KT in Q1 FY21. In Q1FY22.
▪ Domestic refined copper demand declined by around 27% to 118 KT in Q1 FY22 from 161 KT Q4 FY21 due to softening of market impacted by lockdowns inthe country due to 2nd wave of COVID-19.
Domestic Demand (KT)
91
TC/RC S. Acid Price DAP Realisation
Key Macro Drivers (Q1 FY22 vs Q1 FY21)
165150
161
118
Hindalco Industries Limited
Business Performance : Q1 FY22
17

Hindalco Industries Limited
Novelis
18
Hindalco Industries Limited
774
983 973
Q1FY21 Q4FY21 Q1FY22
19
Operational Performance – Novelis
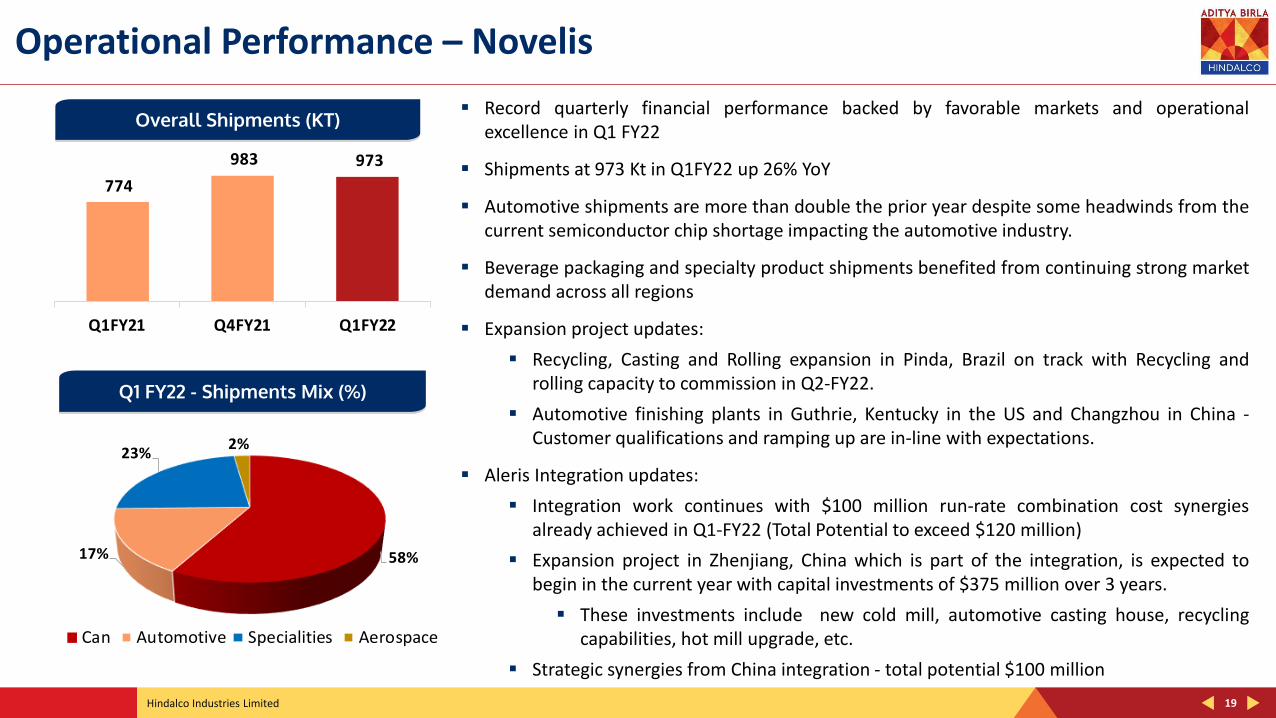
Overall Shipments (KT)▪ Record quarterly financial performance backed by favorable markets and operational
excellence in Q1 FY22
▪ Shipments at 973 Kt in Q1FY22 up 26% YoY
▪ Automotive shipments are more than double the prior year despite some headwinds from thecurrent semiconductor chip shortage impacting the automotive industry.
▪ Beverage packaging and specialty product shipments benefited from continuing strong marketdemand across all regions
▪ Expansion project updates:
▪ Recycling, Casting and Rolling expansion in Pinda, Brazil on track with Recycling androlling capacity to commission in Q2-FY22.
▪ Automotive finishing plants in Guthrie, Kentucky in the US and Changzhou in China -Customer qualifications and ramping up are in-line with expectations.
▪ Aleris Integration updates:
▪ Integration work continues with $100 million run-rate combination cost synergiesalready achieved in Q1-FY22 (Total Potential to exceed $120 million)
▪ Expansion project in Zhenjiang, China which is part of the integration, is expected tobegin in the current year with capital investments of $375 million over 3 years.
▪ These investments include new cold mill, automotive casting house, recyclingcapabilities, hot mill upgrade, etc.
▪ Strategic synergies from China integration - total potential $100 million
58%17%
23%2%
Can Automotive Specialities Aerospace
Q1 FY22 - Shipments Mix (%)
Hindalco Industries Limited 20
Financial Performance – Novelis
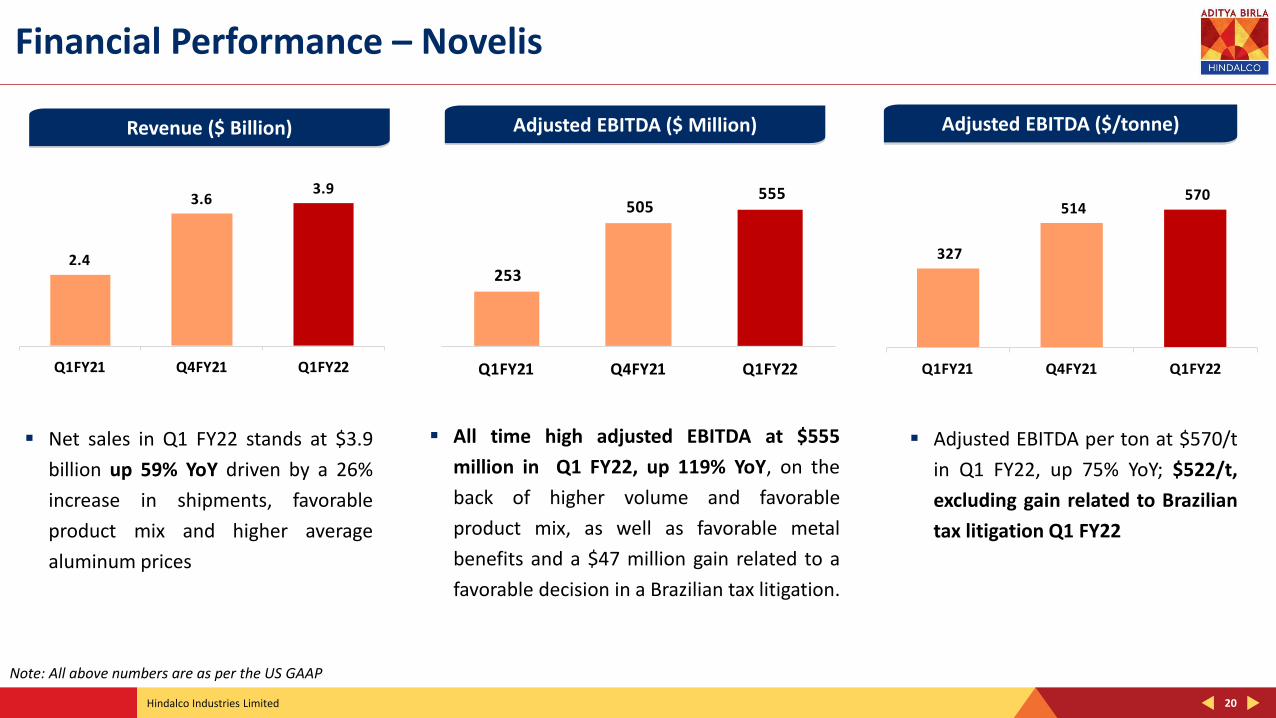
Revenue ($ Billion) Adjusted EBITDA ($ Million) Adjusted EBITDA ($/tonne)
▪ Adjusted EBITDA per ton at $570/t
in Q1 FY22, up 75% YoY; $522/t,
excluding gain related to Brazilian
tax litigation Q1 FY22
▪ Net sales in Q1 FY22 stands at $3.9
billion up 59% YoY driven by a 26%
increase in shipments, favorable
product mix and higher average
aluminum prices
▪ All time high adjusted EBITDA at $555
million in Q1 FY22, up 119% YoY, on the
back of higher volume and favorable
product mix, as well as favorable metal
benefits and a $47 million gain related to a
favorable decision in a Brazilian tax litigation.
Note: All above numbers are as per the US GAAP
2.4
3.63.9
Q1FY21 Q4FY21 Q1FY22
253
505 555
Q1FY21 Q4FY21 Q1FY22
327
514 570
Q1FY21 Q4FY21 Q1FY22

Hindalco Industries Limited
Aluminium (India)
21
Hindalco Industries Limited 22
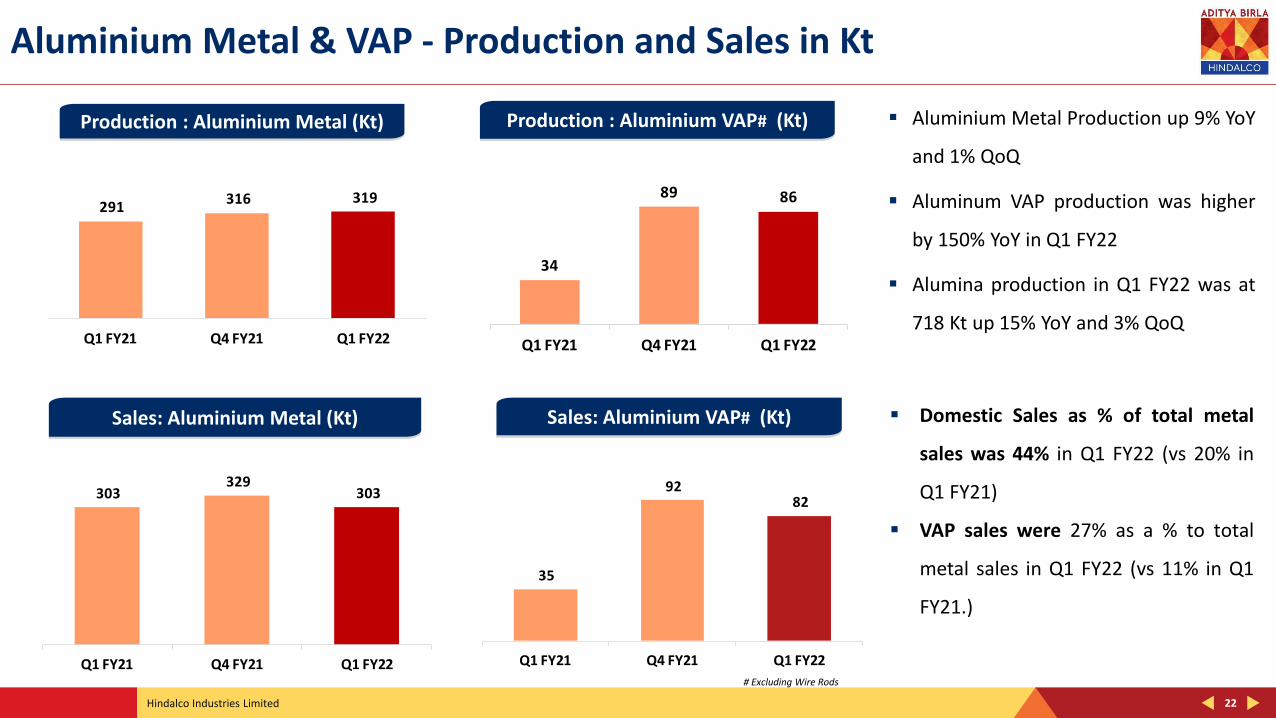
Aluminium Metal & VAP - Production and Sales in Kt
Production : Aluminium Metal (Kt) Production : Aluminium VAP# (Kt)
# Excluding Wire Rods
Sales: Aluminium Metal (Kt) Sales: Aluminium VAP# (Kt) ▪ Domestic Sales as % of total metal
sales was 44% in Q1 FY22 (vs 20% in
Q1 FY21)
▪ VAP sales were 27% as a % to total
metal sales in Q1 FY22 (vs 11% in Q1
FY21.)
▪ Aluminium Metal Production up 9% YoY
and 1% QoQ
▪ Aluminum VAP production was higher
by 150% YoY in Q1 FY22
▪ Alumina production in Q1 FY22 was at
718 Kt up 15% YoY and 3% QoQ
291 316 319
Q1 FY21 Q4 FY21 Q1 FY22
34
89 86
Q1 FY21 Q4 FY21 Q1 FY22
303 329
303
Q1 FY21 Q4 FY21 Q1 FY22
35
92 82
Q1 FY21 Q4 FY21 Q1 FY22
Hindalco Industries Limited 23
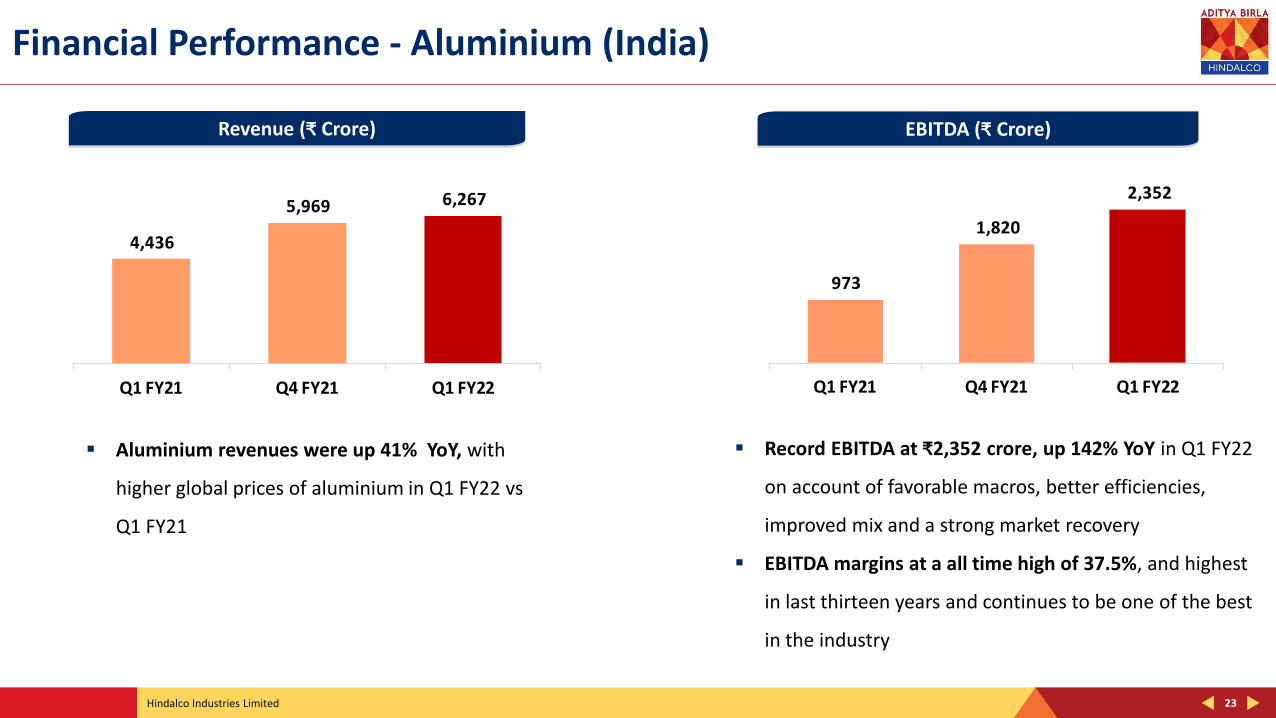
Financial Performance - Aluminium (India)
Revenue (₹ Crore) EBITDA (₹ Crore)
▪ Record EBITDA at ₹2,352 crore, up 142% YoY in Q1 FY22
on account of favorable macros, better efficiencies,
improved mix and a strong market recovery
▪ EBITDA margins at a all time high of 37.5%, and highest
in last thirteen years and continues to be one of the best
in the industry
▪ Aluminium revenues were up 41% YoY, with
higher global prices of aluminium in Q1 FY22 vs
Q1 FY21
4,436
5,969 6,267
Q1 FY21 Q4 FY21 Q1 FY22
973
1,820
2,352
Q1 FY21 Q4 FY21 Q1 FY22

Hindalco Industries Limited
Copper
24
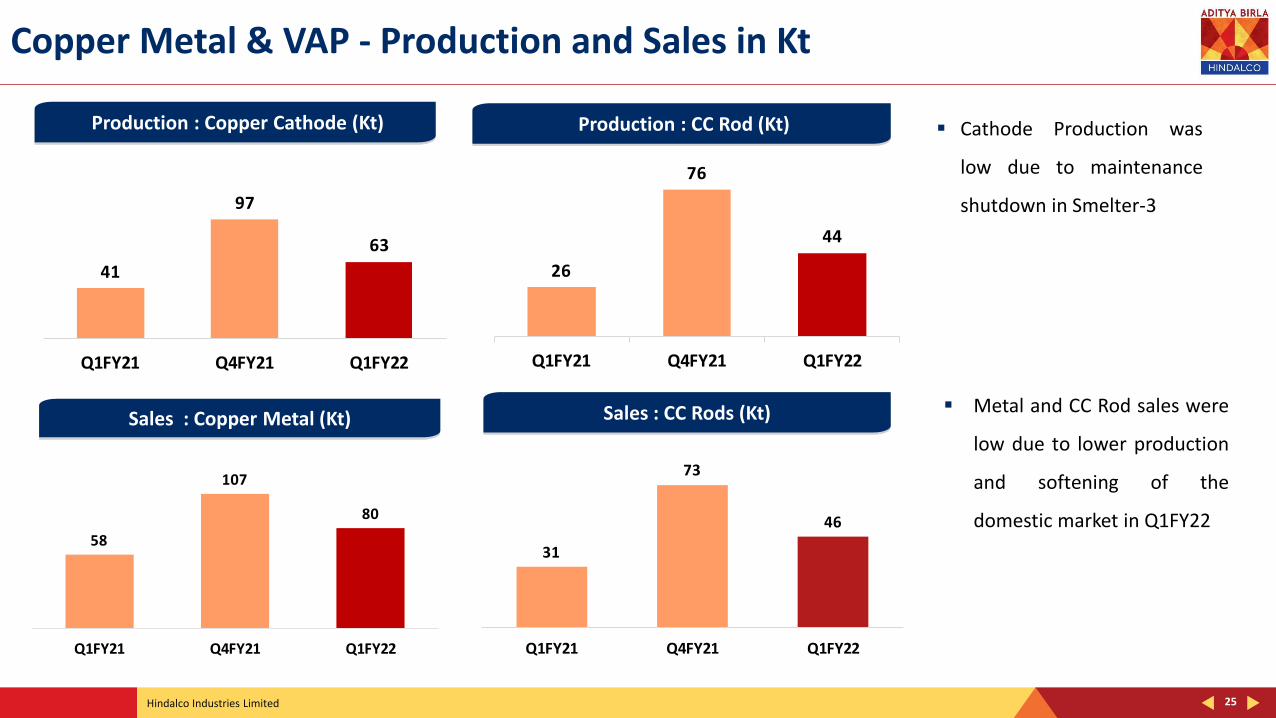
Hindalco Industries Limited
26
76
44
Q1FY21 Q4FY21 Q1FY22
25
▪ Cathode Production was
low due to maintenance
shutdown in Smelter-3
Production : Copper Cathode (Kt) Production : CC Rod (Kt)
Sales : Copper Metal (Kt) Sales : CC Rods (Kt) ▪ Metal and CC Rod sales were
low due to lower production
and softening of the
domestic market in Q1FY22
Copper Metal & VAP - Production and Sales in Kt
41
97
63
Q1FY21 Q4FY21 Q1FY22
58
107
80
Q1FY21 Q4FY21 Q1FY22
31
73
46
Q1FY21 Q4FY21 Q1FY22
Hindalco Industries Limited 26
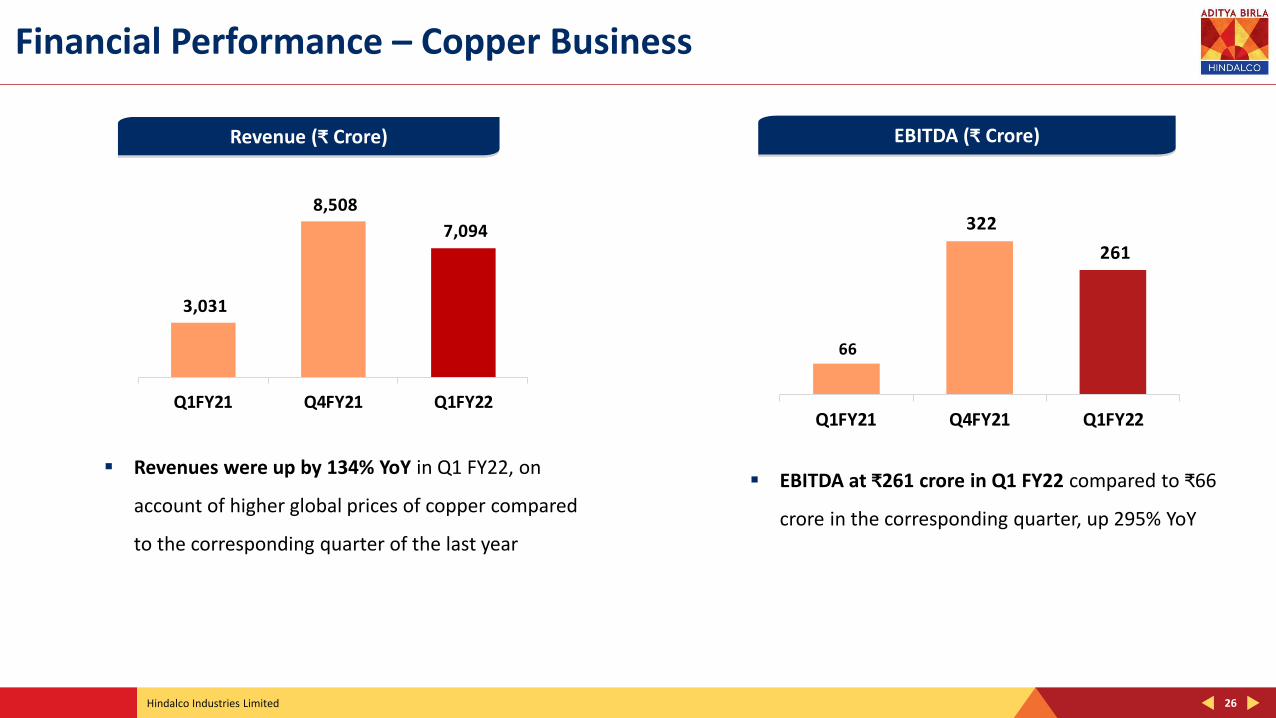
Financial Performance – Copper Business
Revenue (₹ Crore) EBITDA (₹ Crore)
▪ EBITDA at ₹261 crore in Q1 FY22 compared to ₹66
crore in the corresponding quarter, up 295% YoY
▪ Revenues were up by 134% YoY in Q1 FY22, on
account of higher global prices of copper compared
to the corresponding quarter of the last year
3,031
8,508
7,094
Q1FY21 Q4FY21 Q1FY22
66
322
261
Q1FY21 Q4FY21 Q1FY22

Hindalco Industries Limited
Consolidated Financial Performance
27
Hindalco Industries Limited
2,359
5,845 6,790
Q1 FY21 Q4 FY21 Q1 FY22
28
Consolidated Financial Performance
Revenue (₹ Crore) EBITDA (₹ Crore)
PBT after Exceptional Items (₹ Crore) PAT for Continuing Operations (₹ Crore)
25,283
40,507 41,358
Q1 FY21 Q4 FY21 Q1 FY22
(600)
3,254
4,553
Q1 FY21 Q4 FY21 Q1 FY22
(569)
1,945
3,254
Q1 FY21 Q4 FY21 Q1 FY22

Hindalco Industries Limited 29
Consolidated (Debt Position)
(₹ Crores)
As on As on As on As on As on
30-Jun-20 30-Sep-20 31-Dec-20 31-Mar-21 30-Jun-21
Gross Debt 84,181 78,266 71,996 65,994 67,836
Cash & Cash Equivalents 21,879 20,265 18,194 18,575 15,923
Net Debt 62,302 58,001 53,802 47,419 51,913
TTM Adjusted EBITDA 16,276 16,491 17,409 18,293 21,997
Particulars
3.83
3.52
3.09
2.59 2.36
1.50
2.00
2.50
3.00
3.50
4.00
4.50
30-06-2020 30-09-2020 30-12-2020 31-03-2021 30-06-2021
Net Debt : EBITDA(x)
Hindalco Industries Limited
In Summary
30

Hindalco Industries Limited 31
Key Focus Areas
Enrich product mix through increasing the share of high-end value-added products in the overall product portfolio
Stakeholder
Value Enhancement
Strengthen capital structure by accelerating the pace of deleveraging through robust cash generation
Creating a sustainable world together through strong commitment to ESG
Profitable growth through investments in recycling, debottlenecking and organic expansions in more stable and predictable downstream businesses
Product Mix Diversification/ Enhancement
Optimum Capital Structure
Profitable Growth
ESG
Thank You

Hindalco Industries Limited
Annexures
33
Hindalco Industries Limited 34
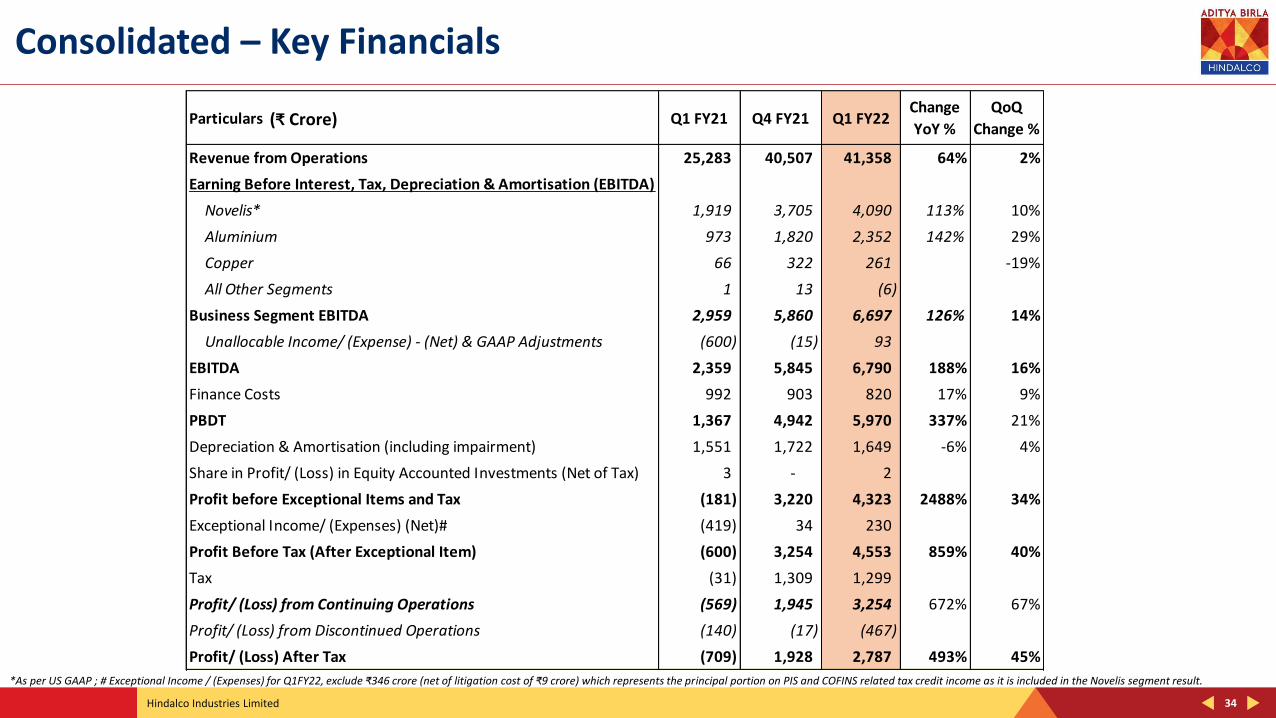
Consolidated – Key Financials
(₹ Crore)
*As per US GAAP ; # Exceptional Income / (Expenses) for Q1FY22, exclude ₹346 crore (net of litigation cost of ₹9 crore) which represents the principal portion on PIS and COFINS related tax credit income as it is included in the Novelis segment result.
Particulars Q1 FY21 Q4 FY21 Q1 FY22Change
YoY %
QoQ
Change %
Revenue from Operations 25,283 40,507 41,358 64% 2%
Earning Before Interest, Tax, Depreciation & Amortisation (EBITDA)
Novelis* 1,919 3,705 4,090 113% 10%
Aluminium 973 1,820 2,352 142% 29%
Copper 66 322 261 -19%
All Other Segments 1 13 (6)
Business Segment EBITDA 2,959 5,860 6,697 126% 14%
Unallocable Income/ (Expense) - (Net) & GAAP Adjustments (600) (15) 93
EBITDA 2,359 5,845 6,790 188% 16%
Finance Costs 992 903 820 17% 9%
PBDT 1,367 4,942 5,970 337% 21%
Depreciation & Amortisation (including impairment) 1,551 1,722 1,649 -6% 4%
Share in Profit/ (Loss) in Equity Accounted Investments (Net of Tax) 3 - 2
Profit before Exceptional Items and Tax (181) 3,220 4,323 2488% 34%
Exceptional Income/ (Expenses) (Net)# (419) 34 230
Profit Before Tax (After Exceptional Item) (600) 3,254 4,553 859% 40%
Tax (31) 1,309 1,299
Profit/ (Loss) from Continuing Operations (569) 1,945 3,254 672% 67%
Profit/ (Loss) from Discontinued Operations (140) (17) (467)
Profit/ (Loss) After Tax (709) 1,928 2,787 493% 45%
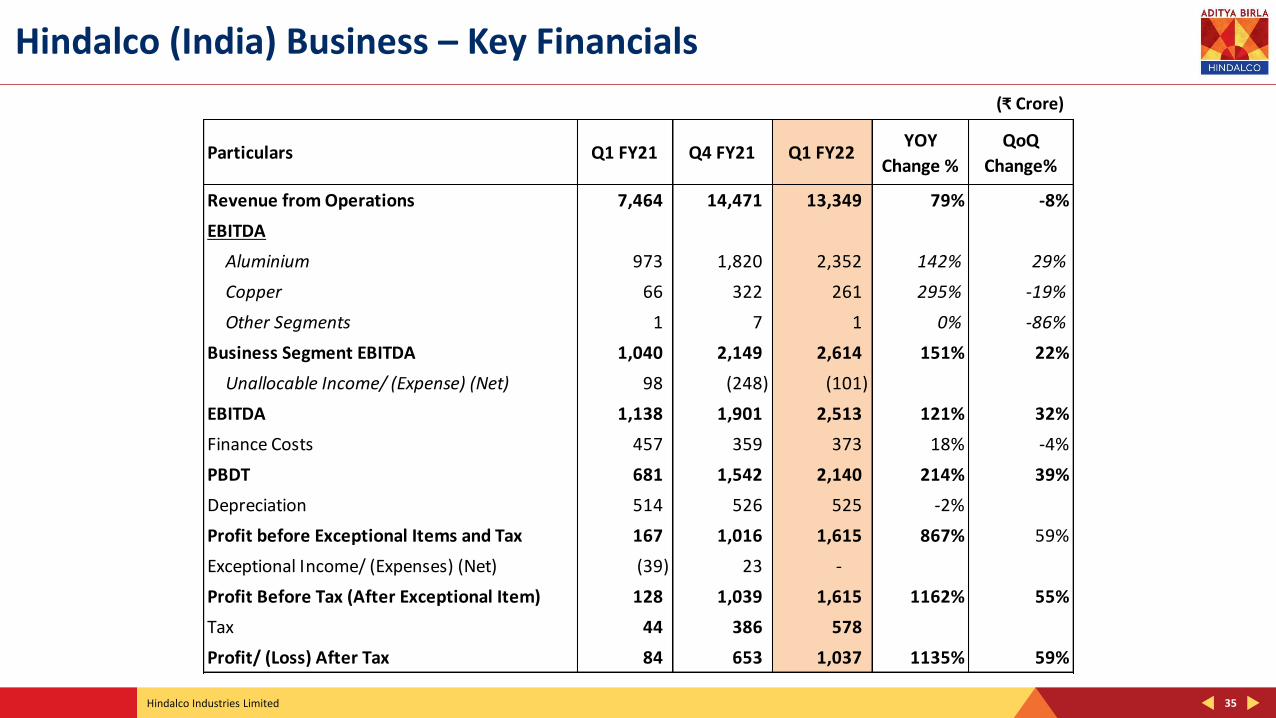
Hindalco Industries Limited 35
Hindalco (India) Business – Key Financials
(₹ Crore)
Particulars Q1 FY21 Q4 FY21 Q1 FY22YOY
Change %
QoQ
Change%
Revenue from Operations 7,464 14,471 13,349 79% -8%
EBITDA
Aluminium 973 1,820 2,352 142% 29%
Copper 66 322 261 295% -19%
Other Segments 1 7 1 0% -86%
Business Segment EBITDA 1,040 2,149 2,614 151% 22%
Unallocable Income/ (Expense) (Net) 98 (248) (101)
EBITDA 1,138 1,901 2,513 121% 32%
Finance Costs 457 359 373 18% -4%
PBDT 681 1,542 2,140 214% 39%
Depreciation 514 526 525 -2%
Profit before Exceptional Items and Tax 167 1,016 1,615 867% 59%
Exceptional Income/ (Expenses) (Net) (39) 23 -
Profit Before Tax (After Exceptional Item) 128 1,039 1,615 1162% 55%
Tax 44 386 578
Profit/ (Loss) After Tax 84 653 1,037 1135% 59%
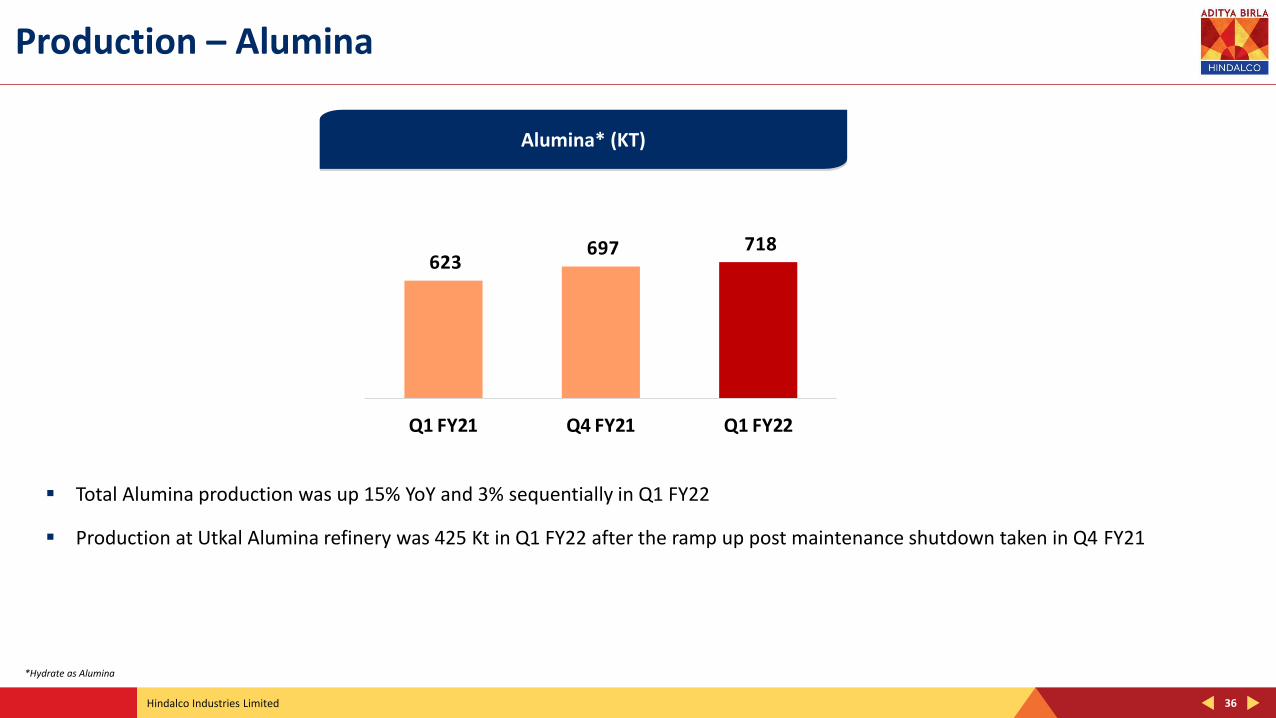
Hindalco Industries Limited 36
Production – Alumina
Alumina* (KT)
▪ Total Alumina production was up 15% YoY and 3% sequentially in Q1 FY22
▪ Production at Utkal Alumina refinery was 425 Kt in Q1 FY22 after the ramp up post maintenance shutdown taken in Q4 FY21
*Hydrate as Alumina
623 697 718
Q1 FY21 Q4 FY21 Q1 FY22
Registered Office Ahura Centre, 1st Floor, B WingMahakali Caves Road Andheri (East), Mumbai 400 093 Telephone- +91 22 6691 7000Website: www.hindalco.comE mail: [email protected] Identity No. L27020MH1958PLC011238
For Further Queries Please Contact : Subir Sen, Investor RelationsTelephone- +91 22 6662 6666E mail: [email protected]: www.hindalco.com