Guidelines for fire resistance design of high-strength concrete ...
Upload
khangminh22Category
view
1download
0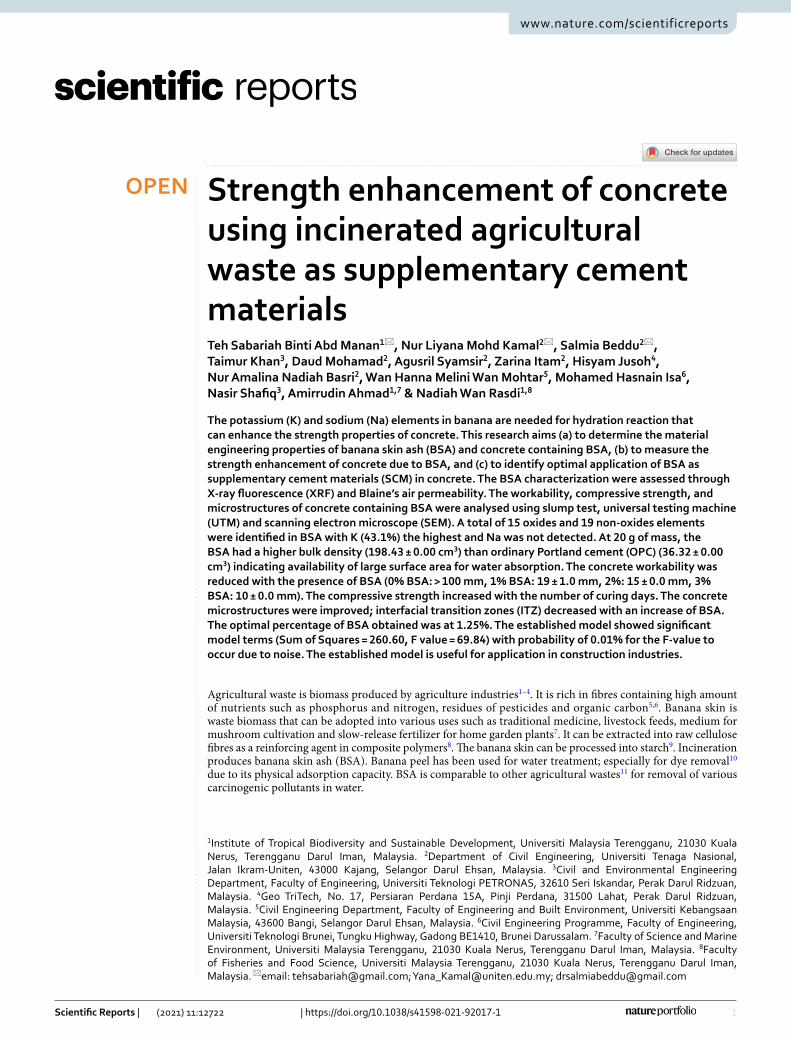
1
Vol.:(0123456789)
Scientific Reports | (2021) 11:12722 | https://doi.org/10.1038/s41598-021-92017-1
www.nature.com/scientificreports
Strength enhancement of concrete using incinerated agricultural waste as supplementary cement materialsTeh Sabariah Binti Abd Manan1*, Nur Liyana Mohd Kamal2*, Salmia Beddu2*, Taimur Khan3, Daud Mohamad2, Agusril Syamsir2, Zarina Itam2, Hisyam Jusoh4, Nur Amalina Nadiah Basri2, Wan Hanna Melini Wan Mohtar5, Mohamed Hasnain Isa6, Nasir Shafiq3, Amirrudin Ahmad1,7 & Nadiah Wan Rasdi1,8
The potassium (K) and sodium (Na) elements in banana are needed for hydration reaction that can enhance the strength properties of concrete. This research aims (a) to determine the material engineering properties of banana skin ash (BSA) and concrete containing BSA, (b) to measure the strength enhancement of concrete due to BSA, and (c) to identify optimal application of BSA as supplementary cement materials (SCM) in concrete. The BSA characterization were assessed through X-ray fluorescence (XRF) and Blaine’s air permeability. The workability, compressive strength, and microstructures of concrete containing BSA were analysed using slump test, universal testing machine (UTM) and scanning electron microscope (SEM). A total of 15 oxides and 19 non-oxides elements were identified in BSA with K (43.1%) the highest and Na was not detected. At 20 g of mass, the BSA had a higher bulk density (198.43 ± 0.00 cm3) than ordinary Portland cement (OPC) (36.32 ± 0.00 cm3) indicating availability of large surface area for water absorption. The concrete workability was reduced with the presence of BSA (0% BSA: > 100 mm, 1% BSA: 19 ± 1.0 mm, 2%: 15 ± 0.0 mm, 3% BSA: 10 ± 0.0 mm). The compressive strength increased with the number of curing days. The concrete microstructures were improved; interfacial transition zones (ITZ) decreased with an increase of BSA. The optimal percentage of BSA obtained was at 1.25%. The established model showed significant model terms (Sum of Squares = 260.60, F value = 69.84) with probability of 0.01% for the F-value to occur due to noise. The established model is useful for application in construction industries.
Agricultural waste is biomass produced by agriculture industries1–4. It is rich in fibres containing high amount of nutrients such as phosphorus and nitrogen, residues of pesticides and organic carbon5,6. Banana skin is waste biomass that can be adopted into various uses such as traditional medicine, livestock feeds, medium for mushroom cultivation and slow-release fertilizer for home garden plants7. It can be extracted into raw cellulose fibres as a reinforcing agent in composite polymers8. The banana skin can be processed into starch9. Incineration produces banana skin ash (BSA). Banana peel has been used for water treatment; especially for dye removal10 due to its physical adsorption capacity. BSA is comparable to other agricultural wastes11 for removal of various carcinogenic pollutants in water.
OPEN
1Institute of Tropical Biodiversity and Sustainable Development, Universiti Malaysia Terengganu, 21030 Kuala Nerus, Terengganu Darul Iman, Malaysia. 2Department of Civil Engineering, Universiti Tenaga Nasional, Jalan Ikram-Uniten, 43000 Kajang, Selangor Darul Ehsan, Malaysia. 3Civil and Environmental Engineering Department, Faculty of Engineering, Universiti Teknologi PETRONAS, 32610 Seri Iskandar, Perak Darul Ridzuan, Malaysia. 4Geo TriTech, No. 17, Persiaran Perdana 15A, Pinji Perdana, 31500 Lahat, Perak Darul Ridzuan, Malaysia. 5Civil Engineering Department, Faculty of Engineering and Built Environment, Universiti Kebangsaan Malaysia, 43600 Bangi, Selangor Darul Ehsan, Malaysia. 6Civil Engineering Programme, Faculty of Engineering, Universiti Teknologi Brunei, Tungku Highway, Gadong BE1410, Brunei Darussalam. 7Faculty of Science and Marine Environment, Universiti Malaysia Terengganu, 21030 Kuala Nerus, Terengganu Darul Iman, Malaysia. 8Faculty of Fisheries and Food Science, Universiti Malaysia Terengganu, 21030 Kuala Nerus, Terengganu Darul Iman, Malaysia. *email: [email protected]; [email protected]; [email protected]
2
Vol:.(1234567890)
Scientific Reports | (2021) 11:12722 | https://doi.org/10.1038/s41598-021-92017-1
www.nature.com/scientificreports/
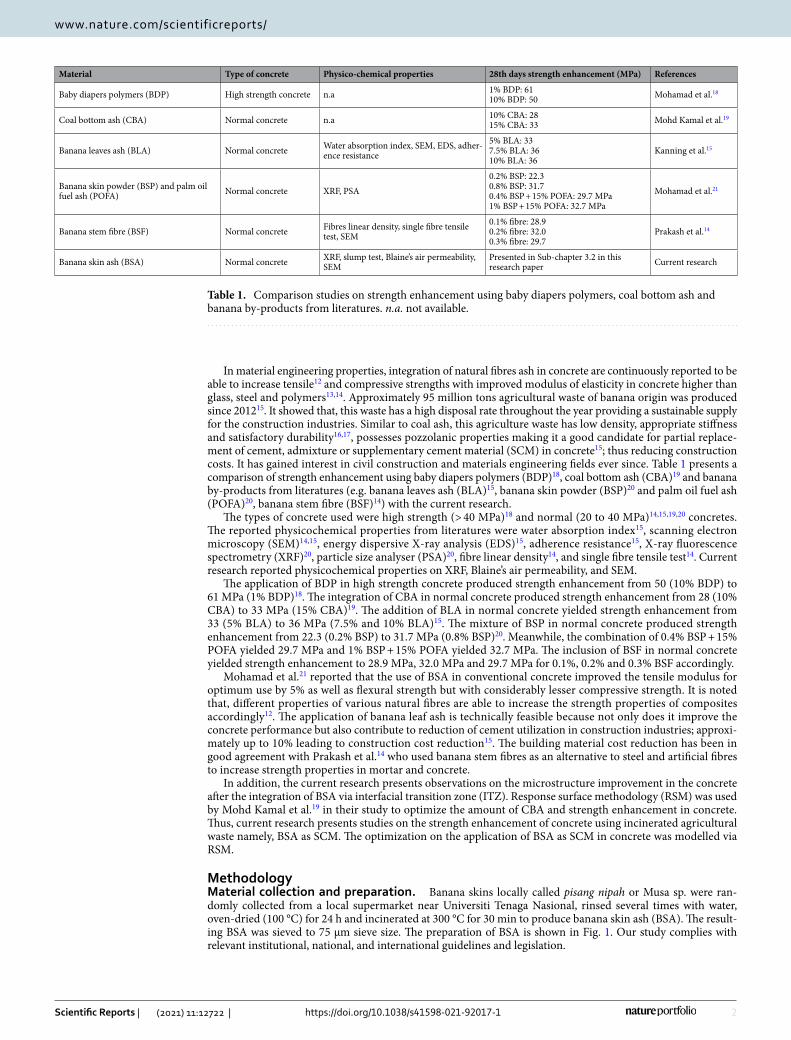
In material engineering properties, integration of natural fibres ash in concrete are continuously reported to be able to increase tensile12 and compressive strengths with improved modulus of elasticity in concrete higher than glass, steel and polymers13,14. Approximately 95 million tons agricultural waste of banana origin was produced since 201215. It showed that, this waste has a high disposal rate throughout the year providing a sustainable supply for the construction industries. Similar to coal ash, this agriculture waste has low density, appropriate stiffness and satisfactory durability16,17, possesses pozzolanic properties making it a good candidate for partial replace-ment of cement, admixture or supplementary cement material (SCM) in concrete15; thus reducing construction costs. It has gained interest in civil construction and materials engineering fields ever since. Table 1 presents a comparison of strength enhancement using baby diapers polymers (BDP)18, coal bottom ash (CBA)19 and banana by-products from literatures (e.g. banana leaves ash (BLA)15, banana skin powder (BSP)20 and palm oil fuel ash (POFA)20, banana stem fibre (BSF)14) with the current research.
The types of concrete used were high strength (> 40 MPa)18 and normal (20 to 40 MPa)14,15,19,20 concretes. The reported physicochemical properties from literatures were water absorption index15, scanning electron microscopy (SEM)14,15, energy dispersive X-ray analysis (EDS)15, adherence resistance15, X-ray fluorescence spectrometry (XRF)20, particle size analyser (PSA)20, fibre linear density14, and single fibre tensile test14. Current research reported physicochemical properties on XRF, Blaine’s air permeability, and SEM.
The application of BDP in high strength concrete produced strength enhancement from 50 (10% BDP) to 61 MPa (1% BDP)18. The integration of CBA in normal concrete produced strength enhancement from 28 (10% CBA) to 33 MPa (15% CBA)19. The addition of BLA in normal concrete yielded strength enhancement from 33 (5% BLA) to 36 MPa (7.5% and 10% BLA)15. The mixture of BSP in normal concrete produced strength enhancement from 22.3 (0.2% BSP) to 31.7 MPa (0.8% BSP)20. Meanwhile, the combination of 0.4% BSP + 15% POFA yielded 29.7 MPa and 1% BSP + 15% POFA yielded 32.7 MPa. The inclusion of BSF in normal concrete yielded strength enhancement to 28.9 MPa, 32.0 MPa and 29.7 MPa for 0.1%, 0.2% and 0.3% BSF accordingly.
Mohamad et al.21 reported that the use of BSA in conventional concrete improved the tensile modulus for optimum use by 5% as well as flexural strength but with considerably lesser compressive strength. It is noted that, different properties of various natural fibres are able to increase the strength properties of composites accordingly12. The application of banana leaf ash is technically feasible because not only does it improve the concrete performance but also contribute to reduction of cement utilization in construction industries; approxi-mately up to 10% leading to construction cost reduction15. The building material cost reduction has been in good agreement with Prakash et al.14 who used banana stem fibres as an alternative to steel and artificial fibres to increase strength properties in mortar and concrete.
In addition, the current research presents observations on the microstructure improvement in the concrete after the integration of BSA via interfacial transition zone (ITZ). Response surface methodology (RSM) was used by Mohd Kamal et al.19 in their study to optimize the amount of CBA and strength enhancement in concrete. Thus, current research presents studies on the strength enhancement of concrete using incinerated agricultural waste namely, BSA as SCM. The optimization on the application of BSA as SCM in concrete was modelled via RSM.
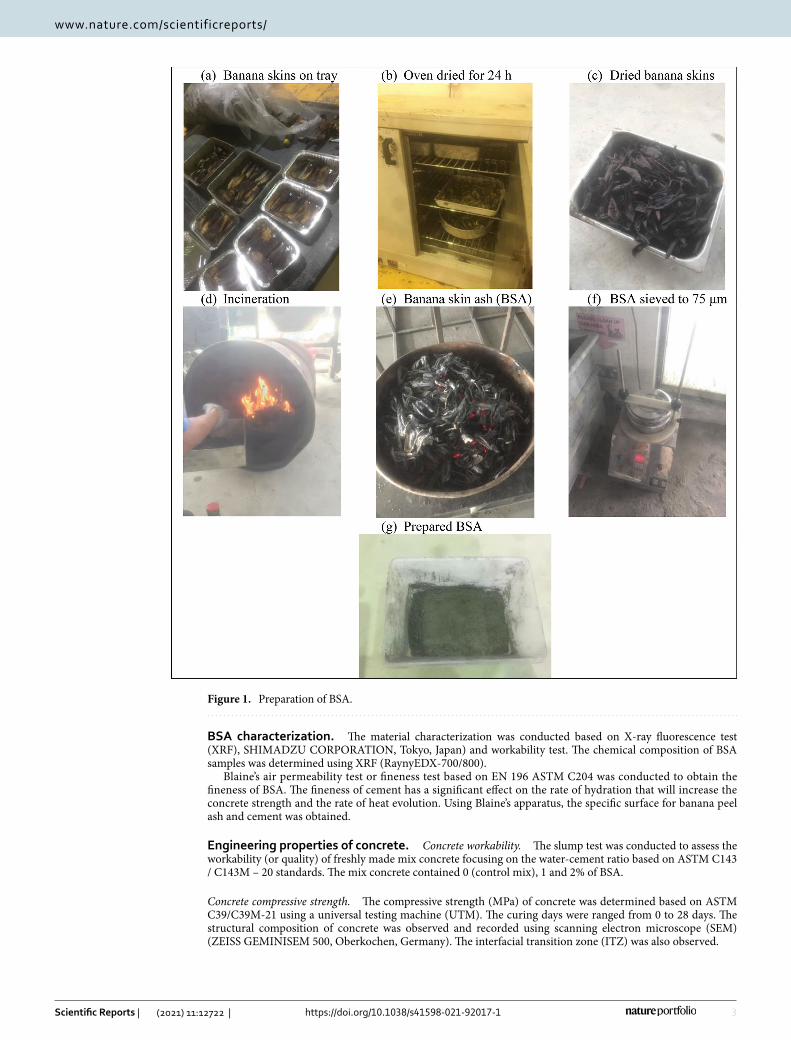
MethodologyMaterial collection and preparation. Banana skins locally called pisang nipah or Musa sp. were ran-domly collected from a local supermarket near Universiti Tenaga Nasional, rinsed several times with water, oven-dried (100 °C) for 24 h and incinerated at 300 °C for 30 min to produce banana skin ash (BSA). The result-ing BSA was sieved to 75 μm sieve size. The preparation of BSA is shown in Fig. 1. Our study complies with relevant institutional, national, and international guidelines and legislation.
Table 1. Comparison studies on strength enhancement using baby diapers polymers, coal bottom ash and banana by-products from literatures. n.a. not available.
Material Type of concrete Physico-chemical properties 28th days strength enhancement (MPa) References
Baby diapers polymers (BDP) High strength concrete n.a 1% BDP: 6110% BDP: 50 Mohamad et al.18
Coal bottom ash (CBA) Normal concrete n.a 10% CBA: 2815% CBA: 33 Mohd Kamal et al.19
Banana leaves ash (BLA) Normal concrete Water absorption index, SEM, EDS, adher-ence resistance
5% BLA: 337.5% BLA: 3610% BLA: 36
Kanning et al.15
Banana skin powder (BSP) and palm oil fuel ash (POFA) Normal concrete XRF, PSA
0.2% BSP: 22.30.8% BSP: 31.70.4% BSP + 15% POFA: 29.7 MPa1% BSP + 15% POFA: 32.7 MPa
Mohamad et al.21
Banana stem fibre (BSF) Normal concrete Fibres linear density, single fibre tensile test, SEM
0.1% fibre: 28.90.2% fibre: 32.00.3% fibre: 29.7
Prakash et al.14
Banana skin ash (BSA) Normal concrete XRF, slump test, Blaine’s air permeability, SEM
Presented in Sub-chapter 3.2 in this research paper Current research
3
Vol.:(0123456789)
Scientific Reports | (2021) 11:12722 | https://doi.org/10.1038/s41598-021-92017-1
www.nature.com/scientificreports/
BSA characterization. The material characterization was conducted based on X-ray fluorescence test (XRF), SHIMADZU CORPORATION, Tokyo, Japan) and workability test. The chemical composition of BSA samples was determined using XRF (RaynyEDX-700/800).
Blaine’s air permeability test or fineness test based on EN 196 ASTM C204 was conducted to obtain the fineness of BSA. The fineness of cement has a significant effect on the rate of hydration that will increase the concrete strength and the rate of heat evolution. Using Blaine’s apparatus, the specific surface for banana peel ash and cement was obtained.
Engineering properties of concrete. Concrete workability. The slump test was conducted to assess the workability (or quality) of freshly made mix concrete focusing on the water-cement ratio based on ASTM C143 / C143M – 20 standards. The mix concrete contained 0 (control mix), 1 and 2% of BSA.
Concrete compressive strength. The compressive strength (MPa) of concrete was determined based on ASTM C39/C39M-21 using a universal testing machine (UTM). The curing days were ranged from 0 to 28 days. The structural composition of concrete was observed and recorded using scanning electron microscope (SEM) (ZEISS GEMINISEM 500, Oberkochen, Germany). The interfacial transition zone (ITZ) was also observed.
Figure 1. Preparation of BSA.
4
Vol:.(1234567890)
Scientific Reports | (2021) 11:12722 | https://doi.org/10.1038/s41598-021-92017-1
www.nature.com/scientificreports/
Model optimization. Central composite design (CCD) with second order polynomial equation (Eq. 1) was used in response surface methodology (RSM) using the Design Expert ® software (Version 12) to assess the interrelation of process variables namely BSA composition in concrete and curing days with the response vari-able, compressive strength.
where Y = Predicted response variable, β = Regression coefficient, k = Number of factors or process variables in the experiment, e = Random error
The ranges of process variables and code factors are shown in Table 2. The error percentage between experi-mental and predicted values was evaluated using Eq. (2).
Pearson’s correlation coefficient (r) was used to measure linear association between two variables (Eq. 3) with the assumption that both variables are normally distributed. The correlation coefficient between variables can range from − 1 (shows negative linear correlation) to 0 (shows no linear relationship), to + 1 (shows positive linear correlation)4,17,22,23.
where, r = Correlation coefficient, xi = values of the ‘x’ variable in a sample, x = mean of the values of the ‘x’ vari-able, yi = values of the ’y’ variable in a sample, y = mean of the values of the ‘y’ variable.
Results and discussionBSA characterization. The XRF analysis (wt. %) for BSA, (a) percentages of oxide elements (%) and (b) percentages of non-oxides elements (%), is shown in Table 3. The Class F fly ash (FA) comes from burning anthracite, possesses pozzolanic property, with little or no cementitious value (silicon dioxide (SiO2) + alumin-ium oxide (Al2O3) + iron (III) oxide (FeO3) ≥ 80%); while Class C FA comes from lignite, and possesses both poz-zolanic and cementitious properties (SiO2 + Al203 + FeO3 ≥ 50%)24. As compared to other materials, the silicon dioxide (SiO2) content of BSA (14.62%) was in the range close to OPC (20.6%). In the presence of heat during curing, the silicate-based material reacts with calcium hydroxide (Ca(OH)2) generated by hydrating cement to form compounds possessing cementitious properties of better high strength performance25. Meanwhile, the calcium oxide (CaO) (4.12%) content of BSA in the current study was comparable to FA (3.32%)17,23, bottom ash (BA) (7.37%)17,23 and class F FA (5%)24. The chemical compositions of BSA such as SiO2 (14.62%) + Al2O3 (0.26%) + FeO3 (0.21%) was 15.09%. Accordingly, BSA is a pozzolan but cannot be classified according to ASTM standards classification for coal ash pozzolans because the percentage composition were below the standards. Nevertheless, BSA can be classified as SCM that contributes to the properties of hardened concrete through hydraulic or pozzolanic activity. SCM are often added to concrete to make concrete mixtures more economical, reduce permeability, increase strength, or influence other concrete properties. Banana skin is high in potassium (K) content followed by manganese (Mn), sodium (Na), calcium (Ca), iron (Fe), bromine (Br), rubidium (Rb), strontium (Sr), zirconium (Zr) and niobium (Nb) (mg/g)12,21. The ‘K’ content in the BSA was 43.15%, the highest compared to other non-oxides elements. The non-oxide element Na was not detected. However; the chemical composition was found to be lower than that reported by Anwahange et al.26. The ‘K’ and ‘Na’ are crucial for hydration reaction in cement mortar for the enhancement of strength properties. These chemicals react with calcium hydroxide to form potassium hydroxide (KOH) and sodium hydroxide (NaOH), which will accumulate in the aqueous phase of the solution and contribute to a change in the composition of the pore fluid. This leads to a change in the pH of the medium and accelerates the hydration of the cement27.
Blaine’s air permeability results for BSA and OPC are shown in Table 4. OPC has high surface area (1470.8 ± 12.73) as compared to BSA (1091.2 ± 46.66). The OPC size or its fineness provides wider surface area for hydration that contributes to the hydration rate. It leads to the increasing in compressive strength develop-ment and heat evolution rate. It also increases the drying shrinkage of concrete18,28,29. The volume obtained for the BSA and OPC at 20 g of mass were 36.32 ± 0.00 cm3 and 198.43 ± 0.00 cm3 respectively. At the same mass, the BSA possessed a higher bulk density as compared to OPC. However, bulk density can be changed depending on the material’s handling (i.e. loose or compact)30–33. Time taken for the manometer liquid to drop from the second to the third level of the manometer during the test (second, s) were 8.33 ± 0.70 s (BSA) and 15.10 ± 0.26 s (OPC).
(1)Y = β0 +∑k
i=1βi · xi +
∑k
i=1βii · x2i +
∑k
i≤j
k∑
j
βij · xi · xj + · · · + e
(2)Error (%) =∣
∣
∣
∣
Experimental Value− Predicted Value
ExperimentalValue× 100%
∣
∣
∣
∣
.
(3)r =∑n
i=1 (xi − x)(
yi − y)
√
∑ni=1 (xi − x)2
∑ni=1
(
yi − y)2
Table 2. Process variables and coded factors.
Process variables Coded factors Units Low actual High actual Low coded High coded
BSA A % 0 2.00 − 1 1
Curing days B Day 7 28 − 1 1
5
Vol.:(0123456789)
Scientific Reports | (2021) 11:12722 | https://doi.org/10.1038/s41598-021-92017-1
www.nature.com/scientificreports/
The value measured during testing is the time required to pass a certain volume of air through a packed bed of solids with given size and porosity. The surface area is directly proportional to
√t 34. The higher the surface area,
the shorter it takes for the time taken for air to flow through the compacted BSA and OPC beds.
Engineering properties of concrete. Concrete workability. The percentages of BSA (%), slump (mm) and types of slump are shown in Table 5. The control mix concrete (0% BSA) has the highest slump of more than 100 mm and can be classified as collapse type of slump. It showed that the workability of the control mix
Table 3. X-ray Fluorescence (XRF) analysis for BSA, (a) percentages of oxide elements (%) and (b) percentages of non-oxides element (%).
(a) Percentage of oxides element (%) Chemical formula
Current research Mohamad21 Kanning et al.15Beddu et al.17 and Abd Manan et al.23 ASTM24
BSABanana skin powder Banana leaves ash Fly ash Bottom ash OPC Class F fly ash Class C fly ash
Silicon dioxide SiO2 14.6222 55.98 48.7 46.8 50.75 20.6 52 35
Magnesium oxide MgO 8.891 1.08 1.15 0.34 2.2 – –
Sulphur trioxide SO3 1.817 0.10 0.53 0.75 2.7 0.8 4.1
Calcium oxide CaO 4.12 8.95 3.32 7.37 62.9 5 21
Potassium oxide K2O 51.977 28.75 1.34 2.68 0.5 2.0 0.7
Aluminium oxide Al2O3 0.256 2.71 2.6 18.41 17.91 4.4 23 18
Iron (II) oxide Fe2O3 0.211 1.36 1.4 6.08 17.94 3.3 11 6
Phosphorus pentoxide P2O5 4.728
Zinc oxide ZnO 4.711
Manganese (II) oxide MnO 0.728
Dysprosium (III) oxide Dy2O3 0.207
Rubidium oxide Rb2O 0.077
Barium oxide BaO 0.039
Strontium oxide SrO 0.038
Praseodymium (III) oxide Pr2O3 0.037
Yttrium oxide Y2O3 0.003
Sodium oxide Na2O - 0.21
(b) Percentage of non-oxides element (%) Chemical formula Current research
Anwanhange et al.26
Potassium K 43.149 39.9
Oxygen O 26.398
Chlorine Cl 7.4952
Silicon Si 6.8347
Magnesium Mg 5.3615
Zinc Zn 3.7847
Calcium Ca 2.9443 9.7
Phosphorus P 2.0635
Sulfur S 0.72751
Manganese Mn 0.56355 38.3
Dysprosium Dy 0.18079
Iron Fe 0.14779 0.3
Aluminium Al 0.13534
Rubidium Rb 0.070671 0.11
Bromine Br 0.042598 0.02
Barium Ba 0.032296
Strontium Sr 0.032296 0.02
Praseodymium Pr 0.031814
Yttrium Y 0.002491
Sodium Na – 12.2
Zirconium Zr – 0.01
Niobium Nb – 0.01
6
Vol:.(1234567890)
Scientific Reports | (2021) 11:12722 | https://doi.org/10.1038/s41598-021-92017-1
www.nature.com/scientificreports/
is high. The BSA was used to substitute the OPC in the concrete mix at 1 and 2% BSA. The slump values were observed to be decreasing at increasing percentages of BSA. The slump values were 19 ± 1.0 mm (1% of BSA), and 15 ± 0.0 mm (2% of BSA). The workability of concrete was reduced with BSA addition.
Theoretically, the increase of more water content in the concrete mix will not only increase its workability but also may increase the potential of segregation between coarse aggregate particles, bleeding, drying shrink-age and cracking as well as decrease in the concrete strength and durability35. Nevertheless, ash is a good water absorbent16,23,36. Adding ash will reduce water content in the concrete mix and its workability. Although work-ability of the concrete was reduced, further test such as compressive strength and SEM were conducted to measure the strength and to observe the microstructure changes upon BSA addition as SCM.
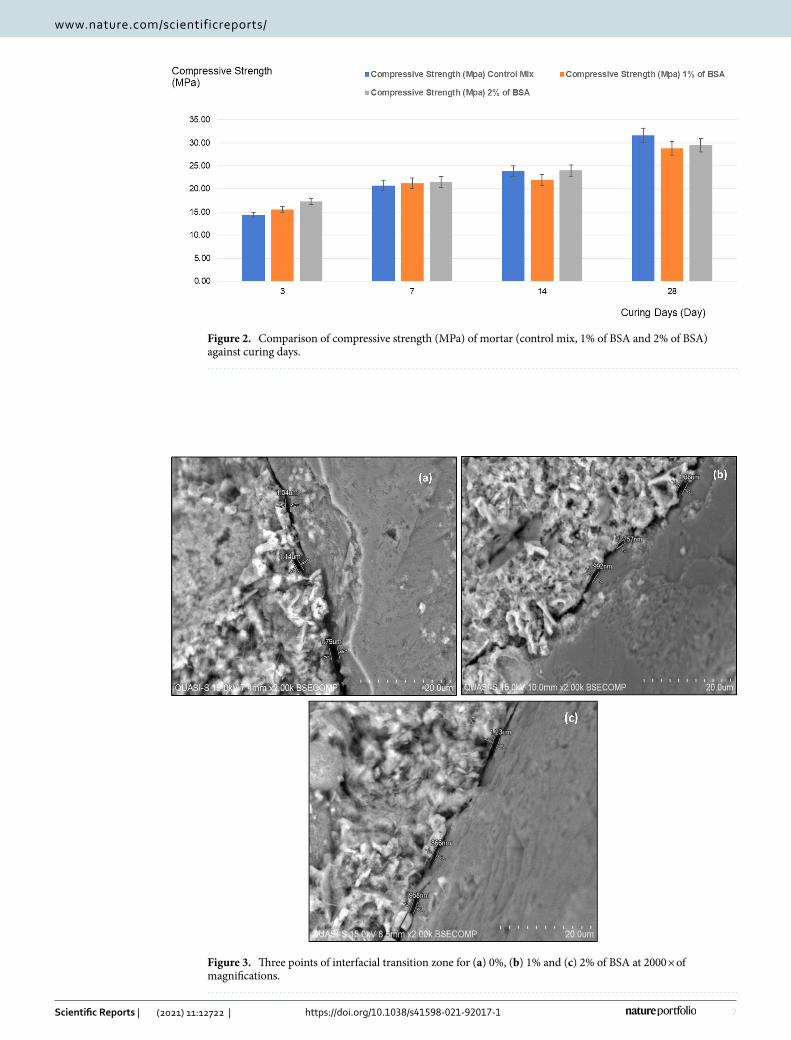
Concrete compressive strength. The percentages of BSA (%), ITZ (µm) and comparison of compressive strength (MPa) of mortar is shown in Table 6 and in Supplementary Material. The percentages of BSA against size of ITZ and compressive strength cover 0% (control mix), 1%, and 2% of BSA. As comparison of compressive strength (MPa) of mortar (0% (control mix), 1%, and 2% BSA) against curing days is shown in Fig. 2. The compressive strength for control was 14.42 ± 0.52 MPa (3 days), 20.76 ± 1.13 MPa (7 days), 23.86 ± 1.19 MPa (14 days) and 31.61 ± 1.60 MPa (28 days). The compressive strength for 1% BSA was 15.6 ± 0.58 MPa (3 days), 21.19 ± 1.16 MPa (7 days), 21.97 ± 1.20 MPa (14 days) and 28.77 ± 1.45 MPa (28 days). The compressive strength for 2% BSA was 17.3 ± 0.67 (3 days), 21.51 ± 1.18 (7 days), 24.00 ± 1.20 (14 days) and 29.50 ± 1.45 (28 days). The compressive strength was observed to increase with curing days duration to 28 days for all percentages of BSA studied.
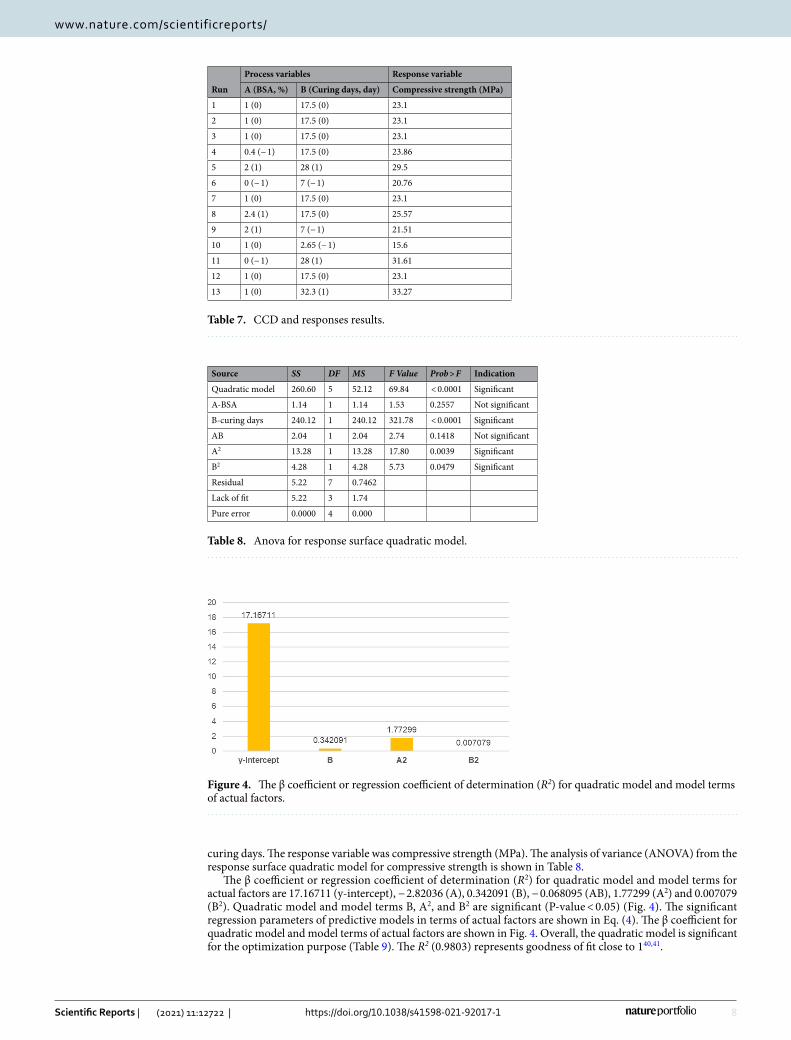
The sizes of ITZ obtained were 1.42 ± 0.38 µm (Control), 1.32 ± 0.33 µm (1% of BSA) and 1.02 ± 0.15 µm (2% of BSA) (Table 6). Figure 3 shows SEM images of ITZ in concrete containing BSA at 2000 × magnifications. Concrete contains aggregates and hydrated cement paste. A water cement ratio in a concrete develops around the aggregate particles during casting, bearing a different pattern of microstructure around the hydrated cement paste. The interfacial transition zone (ITZ) can be observed around the aggregate37,38. It has a strong influence on the mechanical properties of mortar and concrete37–39. BSA contains potassium that can enhance the properties of mortars in fresh and hardened conditions such as microstructure. The addition of BSA to mixture enhances the properties of the microstructure as the thickness of ITZ is decreased (Fig. 3).
Model optimization. The 13 experimental runs pertaining to 2 process and 1 response variables were con-ducted for the RSM process optimization using CCD (Table 7). The process variables were percentage of BSA (%) and number of curing days (day). The ranges of process variables were 0 (control) to 2% BSA and 7 to 28 for
Table 4. Blaine’s air permeability results for BSA and OPC. Results are presented in Mean ± Standard Deviation for triplicates.
Sample Blaine air permeability test (fineness test)Time taken for the manometer liquid to drop from the second to the third level of the manometer during the test (s) Specific surface of sample
BSAMass (g) 0.90 ± 0.00 20.0 ± 0.00
8.33 ± 0.70 1091.12 ± 46.66Volume (cm3) 1.63 ± 0.00 36.32 ± 0.00
OPCMass (g) 2.80 ± 0.00 20.0 ± 0.00
15.10 ± 0.26 1470.77 ± 12.73Volume (cm3) 8.93 ± 0.00 198.43 ± 0.00
Table 5. The percentages of BSA (%), slump (mm) and types of slumps. Results are presented in mean ± standard deviation for duplicates.
Percentages of BSA (%) Slump (mm) Type of slumps
0 > 100 Collapse
1 19 ± 1.0 True slump
2 15 ± 0.0 True slump
Table 6. Percentages of BSA (%), ITZ (µm) and comparison of compressive strength (MPa) of mortar. Results are presented in mean ± standard deviation for triplicates.
BSA (%) ITZ (µm)
Compressive strength (MPa) of mortar against curing days
3 7 14 28
0 1.42 ± 0.38 14.42 ± 0.52 20.76 ± 1.13 23.86 ± 1.19 31.61 ± 1.60
1 1.32 ± 0.33 15.6 ± 0.58 21.19 ± 1.16 21.97 ± 1.20 28.77 ± 1.45
2 1.02 ± 0.15 17.3 ± 0.67 21.51 ± 1.18 24.00 ± 1.20 29.50 ± 1.45
7
Vol.:(0123456789)
Scientific Reports | (2021) 11:12722 | https://doi.org/10.1038/s41598-021-92017-1
www.nature.com/scientificreports/
Figure 2. Comparison of compressive strength (MPa) of mortar (control mix, 1% of BSA and 2% of BSA) against curing days.
Figure 3. Three points of interfacial transition zone for (a) 0%, (b) 1% and (c) 2% of BSA at 2000 × of magnifications.
8
Vol:.(1234567890)
Scientific Reports | (2021) 11:12722 | https://doi.org/10.1038/s41598-021-92017-1
www.nature.com/scientificreports/
curing days. The response variable was compressive strength (MPa). The analysis of variance (ANOVA) from the response surface quadratic model for compressive strength is shown in Table 8.
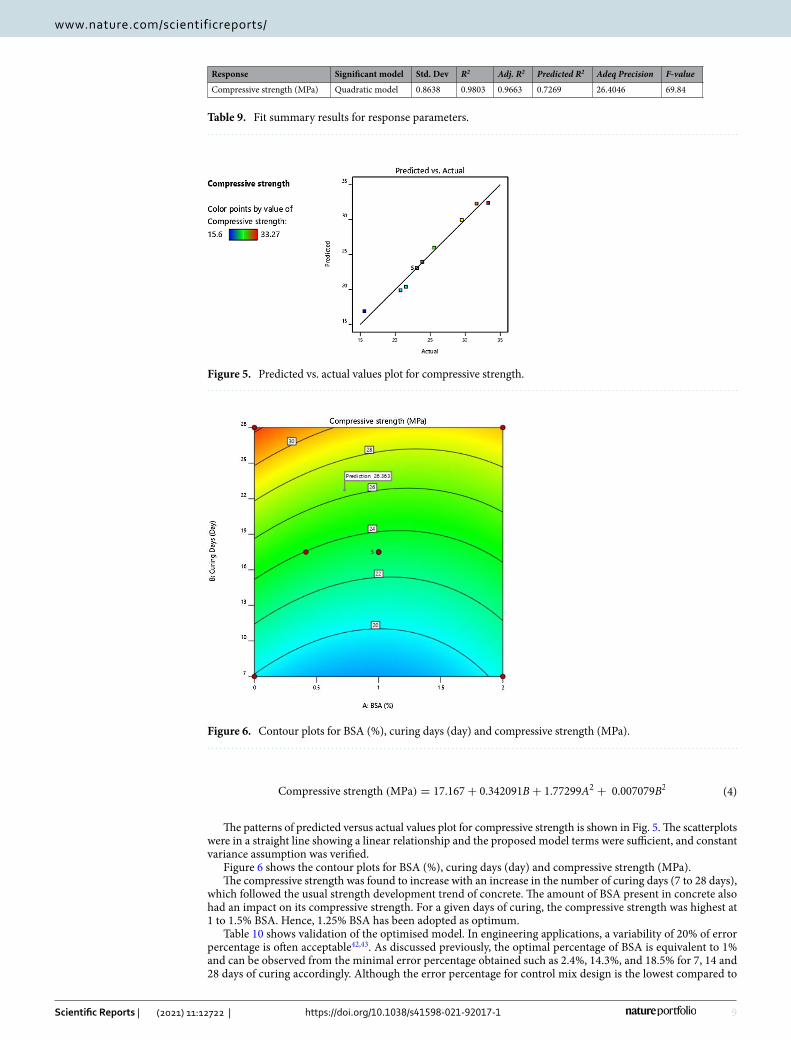
The β coefficient or regression coefficient of determination (R2) for quadratic model and model terms for actual factors are 17.16711 (y-intercept), − 2.82036 (A), 0.342091 (B), − 0.068095 (AB), 1.77299 (A2) and 0.007079 (B2). Quadratic model and model terms B, A2, and B2 are significant (P-value < 0.05) (Fig. 4). The significant regression parameters of predictive models in terms of actual factors are shown in Eq. (4). The β coefficient for quadratic model and model terms of actual factors are shown in Fig. 4. Overall, the quadratic model is significant for the optimization purpose (Table 9). The R2 (0.9803) represents goodness of fit close to 140,41.
Table 7. CCD and responses results.
Run
Process variables Response variable
A (BSA, %) B (Curing days, day) Compressive strength (MPa)
1 1 (0) 17.5 (0) 23.1
2 1 (0) 17.5 (0) 23.1
3 1 (0) 17.5 (0) 23.1
4 0.4 (− 1) 17.5 (0) 23.86
5 2 (1) 28 (1) 29.5
6 0 (− 1) 7 (− 1) 20.76
7 1 (0) 17.5 (0) 23.1
8 2.4 (1) 17.5 (0) 25.57
9 2 (1) 7 (− 1) 21.51
10 1 (0) 2.65 (− 1) 15.6
11 0 (− 1) 28 (1) 31.61
12 1 (0) 17.5 (0) 23.1
13 1 (0) 32.3 (1) 33.27
Table 8. Anova for response surface quadratic model.
Source SS DF MS F Value Prob > F Indication
Quadratic model 260.60 5 52.12 69.84 < 0.0001 Significant
A-BSA 1.14 1 1.14 1.53 0.2557 Not significant
B-curing days 240.12 1 240.12 321.78 < 0.0001 Significant
AB 2.04 1 2.04 2.74 0.1418 Not significant
A2 13.28 1 13.28 17.80 0.0039 Significant
B2 4.28 1 4.28 5.73 0.0479 Significant
Residual 5.22 7 0.7462
Lack of fit 5.22 3 1.74
Pure error 0.0000 4 0.000
Figure 4. The β coefficient or regression coefficient of determination (R2) for quadratic model and model terms of actual factors.
9
Vol.:(0123456789)
Scientific Reports | (2021) 11:12722 | https://doi.org/10.1038/s41598-021-92017-1
www.nature.com/scientificreports/
The patterns of predicted versus actual values plot for compressive strength is shown in Fig. 5. The scatterplots were in a straight line showing a linear relationship and the proposed model terms were sufficient, and constant variance assumption was verified.
Figure 6 shows the contour plots for BSA (%), curing days (day) and compressive strength (MPa).The compressive strength was found to increase with an increase in the number of curing days (7 to 28 days),
which followed the usual strength development trend of concrete. The amount of BSA present in concrete also had an impact on its compressive strength. For a given days of curing, the compressive strength was highest at 1 to 1.5% BSA. Hence, 1.25% BSA has been adopted as optimum.
Table 10 shows validation of the optimised model. In engineering applications, a variability of 20% of error percentage is often acceptable42,43. As discussed previously, the optimal percentage of BSA is equivalent to 1% and can be observed from the minimal error percentage obtained such as 2.4%, 14.3%, and 18.5% for 7, 14 and 28 days of curing accordingly. Although the error percentage for control mix design is the lowest compared to
(4)Compressive strength (MPa) = 17.167+ 0.342091B+ 1.77299A2 + 0.007079B2
Table 9. Fit summary results for response parameters.
Response Significant model Std. Dev R2 Adj. R2 Predicted R2 Adeq Precision F-value
Compressive strength (MPa) Quadratic model 0.8638 0.9803 0.9663 0.7269 26.4046 69.84
Figure 5. Predicted vs. actual values plot for compressive strength.
Figure 6. Contour plots for BSA (%), curing days (day) and compressive strength (MPa).
10
Vol:.(1234567890)
Scientific Reports | (2021) 11:12722 | https://doi.org/10.1038/s41598-021-92017-1
www.nature.com/scientificreports/
1% of BSA (4.1%, 2.4%, and 2.2% for 7, 14 and 28 days of curing accordingly), the microstructure was improved with concrete containing BSA. This improvement, reducing porosity and pore connectivity, leads to reduce the permeability and finally improve the durability38.
The Pearson proximity matrices for BSA (%), curing days (day), experimental and predicted values for com-pressive strength (MPa) is shown in Fig. 7. The correlation coefficients obtained were highly positive between curing days (day) and experimental value for compressive strength (MPa) (R2: 0.955) as well as between curing days (day) and predicted value for compressive strength (MPa) (R2: 0.871). The experimental and predicted values were positively correlated with R2 equals to 0.849 indicating the optimised model is validated.
ConclusionBanana skin is an agriculture waste and BSA possesses pozzolanic property. BSA has high ‘K’ content crucial for hydration in concrete mix. The XRF analysed oxides and non-oxides elements of BSA that contribute to strength enhancement. Slump test showed that the workability of concrete reduced with addition of BSA. At the same mass of 20 g, BSA (36.32 ± 0.00 cm3) has a higher bulk density than OPC (198.43 ± 0.00 cm3) indicating large surface area for water absorption. The compressive strength of concrete increased with the number of curing days. The ITZ improved with the increased in BSA (control: 1.42 ± 0.38 µm, 1% BSA: 1.32 ± 0.33 µm, 2% BSA: 1.02 ± 0.15 µm). Overall, the optimal percentage of BSA was 1.25% at which the with the compressive strength was maximum for all curing days studied. The optimal number of curing days obtained was 28 days. The estab-lished model for strength enhancement of concrete using BSA as SCM was statistically significant and showed that it adequately represented the design space. The Pearson’s proximity matrices showed correlation between curing days and compressive strength (both experimental and predicted). The established model can assist in the application of BSA in construction industries.
Received: 29 March 2021; Accepted: 4 June 2021
Table 10. Validation of optimised model.
VariablesResponse: compressive strength (MPa)
Error percentage (%)A: BSA (%) B: curing days (day) Experimental Predicted
0
7
20.76 19.90 4.1
1 21.19 21.70 2.4
2 21.51 27.00 25.5
0
14
23.86 23.30 2.4
1 21.97 25.10 14.3
2 24.00 30.50 27.1
0
28
31.61 32.30 2.2
1 28.77 34.10 18.5
2 29.50 39.40 33.6
Figure 7. Pearson proximity matrices for BSA (%), curing days (day), experimental and predicted values for compressive strength (MPa).
11
Vol.:(0123456789)
Scientific Reports | (2021) 11:12722 | https://doi.org/10.1038/s41598-021-92017-1
www.nature.com/scientificreports/
References 1. Malakahmad, A., Abd Manan, T. S. & Sivapalan, S. Detection methods of carcinogens in estuaries: A review. Int. J. Sustain. Dev.
Plan. 10, 601–619 (2015). 2. Malakahmad, A., Manan, T. S. B. A., Sivapalan, S. & Khan, T. Genotoxicity assessment of raw and treated water samples using
Allium cepa assay: Evidence from Perak River, Malaysia. Environ. Sci. Pollut. Res. https:// doi. org/ 10. 1007/ s11356- 017- 0721-8 (2018).
3. Malakahmad, A., Law, M. X., Ng, K.-W. & Manan, T. S. A. The fate and toxicity assessment of polycyclic aromatic hydrocarbons (PAHs) in water streams of Malaysia. Proc. Eng. https:// doi. org/ 10. 1016/j. proeng. 2016. 06. 572 (2016).
4. Abd Manan, T. S. B. et al. Step by step procedures: Degradation of polycyclic aromatic hydrocarbons in potable water using photo-Fenton oxidation process. Methods 6, 1701–1705 (2019).
5. Speight, J. G. Sources of water pollution. In Natural Water Remediation 165–198 (Elsevier, 2020). https:// doi. org/ 10. 1016/ b978-0- 12- 803810- 9. 00005-x.
6. Sany, S. B. T., Tajfard, M., Rezayi, M., Rahman, M. A. & Hashim, R. The west coast of peninsular Malaysia. In World Seas: An Environmental Evaluation Volume II: The Indian Ocean to the Pacific 437–458 (Elsevier, 2018). https:// doi. org/ 10. 1016/ B978-0- 08- 100853- 9. 00050-6.
7. Vu, H. T., Scarlett, C. J. & Vuong, Q. V. Phenolic compounds within banana peel and their potential uses: A review. J. Funct. Foods 40, 238–248 (2018).
8. Tibolla, H., Pelissari, F. M., Rodrigues, M. I. & Menegalli, F. C. Cellulose nanofibers produced from banana peel by enzymatic treatment: Study of process conditions. Ind. Crops Prod. 95, 664–674 (2017).
9. Cahyana, Y. et al. The effect of different thermal modifications on slowly digestible starch and physicochemical properties of green banana flour (Musa acuminata colla). Food Chem. 274, 274–280 (2019).
10. Khan, T., Azhari, M. A. B. & Chaudhuri, M. Banana Peel: A Low-Cost Adsorbent for Removal of Reactive Dye from Aqueous Solution - UTP Institutional Repository. In: Proceedings 2012 International Conference on Civil, Offshore and Environmental Engineering. Universiti Teknologi PETRONAS. ISBN 978-983-2271-77-2
11. Khan, T. et al. Artificial neural network (ANN) for modelling adsorption of lead (Pb (II)) from aqueous solution. Water. Air. Soil Pollut. 228, 1–15 (2017).
12. Ali, M. Natural fibres as construction materials*. J. Civ. Eng. Constr. Technol. 3, 80–89 (2012). 13. Awwad, E., Mabsout, M., Hamad, B., Farran, M. T. & Khatib, H. Studies on fiber-reinforced concrete using industrial hemp fibers.
Constr. Build. Mater. 35, 710–717 (2012). 14. Prakash, C. T., Solanki, G. S. & Singh, R. S. Application and analysis of banana stem fibre use as construction material. Int. J. Trend
Sci. Res. Dev. 2, 235–246 (2018). 15. Kanning, R. C., Portella, K. F., Bragança, M. O. G. P., Bonato, M. M. & Dos Santos, J. C. M. Banana leaves ashes as pozzolan for
concrete and mortar of Portland cement. Constr. Build. Mater. 54, 460–465 (2014). 16. Mohd Kamal, N. L. et al. Immobilization of heavy metals for building materials in the construction industry - An overview. in
Materials Today: Proceedings vol. 17 787–791 (Elsevier Ltd, 2019). https:// doi. org/ 10. 1016/j. matpr. 2019. 06. 363 17. Beddu, S. et al. Dataset on leaching properties of coal ashes from Malaysian coal power plant. Data Br. 31, 105843 (2020). 18. Mohamad, D. et al. Self-curing concrete using baby diapers polymer. Indian J. Sci. Technol. 10, 1–7 (2017). 19. Mohd Kamal, N. L., Shafiq, N., Alaloul, W. S., Beddu, S. & Abd Manan, T. S. B. Application of response surface methodology for
the optimization of mix design concrete using coal bottom ash as cement replacement material. Lect. Notes Civ. Eng. 132, 396–404 (2021).
20. Mohamad, N. et al. Effects of incorporating banana skin powder (BSP) and palm oil fuel ash (POFA) on mechanical properties of lightweight foamed concrete. Int. J. Integr. Eng. 10, 69–76 (2018).
21. Mohamad, N. et al. Effects of incorporating banana skin powder (BSP) and palm oil fuel ash (POFA) on mechanical properties of lightweight foamed concrete. Int. J. Integr. Eng. 10, 2 (2018).
22. Gauthier, T. D. & Hawley, M. E. Statistical methods. In Introduction to Environmental Forensics (ed. Morrison, R. D.) 129–183 (Elsevier Academic Press, 2007). https:// doi. org/ 10. 1016/ B978- 01236 9522-2/ 50006-3.
23. Abd Manan, T. S. et al. Physicochemical and leaching properties of coal ashes from Malaysian coal power plant. Chem. Phys. Lett. https:// doi. org/ 10. 1016/j. cplett. 2021. 138420 (2021).
24. American Society for Testing and Materials (ASTM). ASTM C618–05: Standard specification for coal fly ash and raw or calcined natural pozzolan for use as a mineral admixture in Portland cement concrete, in Annual book of ASTM standards, vol 04.02 1994 . (1994).
25. Wardhono, A. Comparison Study of Class F and Class C Fly Ashes as Cement Replacement Material on Strength Development of Non-Cement Mortar. in IOP Conference Series: Materials Science and Engineering vol. 288 012019 (Institute of Physics Publishing, 2018). https://iopscience.iop.org/article/10.1088/1757-899X/288/1/012019
26. Anwahange, B. A. Chemical Composition of Musa sapientum (Banana) Peels. J. Food Technol. 6, 263–266 (2008). 27. Sopov, V., Pershina, L., Butskaya, L., Latorets, E. & Makarenko, O. The role of chemical admixtures in the formation of the structure
of cement stone. 6th International Scientific Conference “Reliability and Durability of Railway Transport Engineering Structures and Buildings” (Transbud-2017). https:// doi. org/ 10. 1051/ matec conf/ 20171 160101
28. Muda, Z. C. et al. Impact resistance of sustainable construction material using light weight oil palm shells reinforced geogrid concrete slab. in IOP Conference Series: Earth and Environmental Science vol. 16 012062 (Institute of Physics Publishing, 2013).
29. Nuruddin, F., Kusbiantoro, A., Qazi, S. & Shafiq, N. The Effect of Natural Retarder On Fly Ash Based Geopolymer Concrete. In: International Conference on Sustainable Building and Infrastructure (ICSBI 2010), 15-17 June 2010, Kuala Lumpur Convention Centre. (2010).
30. Kamal, N. L. M. et al. Immobilization of heavy metals for building materials in the construction industry—An overview. In Materi-als Today: Proceedings Vol. 17 787–791 (Elsevier Ltd, 2019).
31. Itam, Z. et al. Extraction of iron from coal bottom ash by carbon reduction method. in AIP Conference Proceedings vol. 2030 020261 (American Institute of Physics Inc., 2018). https:// doi. org/ 10. 1063/1. 50669 02.
32. Beddu, S. et al. Investigation of natural fibers as ceiling material. Lect. Notes Civ. Eng. 53, 2 (2020). 33. Mohamad, D. et al. Effect of Laminate Properties on the Failure of Cross Arm Structure under Multi-Axial Load. in IOP Conference
Series: Materials Science and Engineering vol. 530 012029 (Institute of Physics Publishing, 2019). https:// iopsc ience. iop. org/ artic le/ 10. 1088/ 1757- 899X/ 530/1/ 012029
34. CTU Prague. Chapter 12-Testing of Cement-Part 1 12. TESTING OF CEMENT-PART 1. 12.1 Density. (2021). 35. Basham, K. Water in Concrete | For Construction Pros. https:// www. forco nstru ction pros. com/ concr ete/ equip ment- produ cts/ artic
le/ 11359 846/ water- in- concr ete (2021). 36. Itam, Z. et al. Extraction of metal oxides from coal bottom ash by carbon reduction and chemical leaching. In Materials Today:
Proceedings Vol. 17 727–735 (Elsevier Ltd, 2019). 37. Ollivier, J. P., Maso, J. C. & Bourdette, B. Interfacial transition zone in concrete. Adv. Cem. Based Mater. 2, 30–38 (1995). 38. Hilal, A. A. Microstructure of Concrete. in High Performance Concrete Technology and Applications (InTech, 2016). doi:https://
doi. org/ 10. 5772/ 64574. 39. San Nicolas, R. & Provis, J. L. The interfacial transition zone in alkali-activated slag mortars. Front. Mater. 2, 70 (2015).
12
Vol:.(1234567890)
Scientific Reports | (2021) 11:12722 | https://doi.org/10.1038/s41598-021-92017-1
www.nature.com/scientificreports/
40. Gauthier, T. D. & Hawley, M. E. Statistical Methods. inIntroduction to Environmental Forensics: Third Edition (2015). doi:https:// doi. org/ 10. 1016/ B978-0- 12- 404696- 2. 00005-9
41. Manan, T. S. B. A. et al. Application of response surface methodology for the optimization of polycyclic aromatic hydrocarbons degradation from potable water using photo-Fenton oxidation process. Sci. Total Environ. https:// doi. org/ 10. 1016/j. scito tenv. 2019. 02. 060 (2019).
42. Zhang, Z., Zhang, W., Zhai, Z. J. & Chen, Q. Y. Evaluation of various turbulence models in predicting airflow and turbulence in enclosed environments by CFD: Part 2—comparison with experimental data from literature. HVAC R Res. 13, 871–886 (2007).
43. Baji, H. The effect of uncertainty in material properties and model error on the reliability of strength and ductility of reinforced concrete members. School of Civil Engineering, the University of Queensland, Australia. (2014).
AcknowledgementsAuthors are thankful to Universiti Tenaga Nasional, Malaysia (J5100D4103-BOLDRefresh2025-Centre of Excel-lence; J510050002-BOLDRefresh2025-Centre of Excellence; BOLD2021 J510050002/2021012; RJO10517844/068) for providing financial supports for this study. Authors also would like to thank Professor Dr. Marzuki Bin Ismail from Institute of Tropical Biodiversity and Sustainable Development, Universiti Malaysia Terengganu; Miss Fatin Shahira Binti Abdullah (CE0100384), from College of Engineering, Universiti Tenaga Nasional; Miss Yusyawati Binti Yahaya ([email protected]) from Centralized analytical laboratory, Mr Johan Ariff, Mrs. Norhayama Ramli, Mr. Zaaba Mohammad, Mr. Khairul Anuar Jamaluddin from Lab Services and Facilities Unit, Universiti Teknologi PETRONAS for the technical supports.
Author contributionsN.L.M.K. conceived the project conceptualization, photographs, administration and writing original draft. S.B., N.L.M.K. and D.M. provided funding acquisition. S.B., T.S.B.A.M., and T.K. refined the methodology, results and discussion. D.M. arranged the software. A.S., H.J., N.A.N.B., and Z.I. were from investigation and resources team. W.H.M.W.M., M.H.I., N.S., A.A., and N.W.R. reviewed the manuscript and contributed equally.
Competing interests The authors declare no competing interests.
Additional informationSupplementary Information The online version contains supplementary material available at https:// doi. org/ 10. 1038/ s41598- 021- 92017-1.
Correspondence and requests for materials should be addressed to T.S.B.A.M., N.L.M.K. or S.B.
Reprints and permissions information is available at www.nature.com/reprints.
Publisher’s note Springer Nature remains neutral with regard to jurisdictional claims in published maps and institutional affiliations.
Open Access This article is licensed under a Creative Commons Attribution 4.0 International License, which permits use, sharing, adaptation, distribution and reproduction in any medium or
format, as long as you give appropriate credit to the original author(s) and the source, provide a link to the Creative Commons licence, and indicate if changes were made. The images or other third party material in this article are included in the article’s Creative Commons licence, unless indicated otherwise in a credit line to the material. If material is not included in the article’s Creative Commons licence and your intended use is not permitted by statutory regulation or exceeds the permitted use, you will need to obtain permission directly from the copyright holder. To view a copy of this licence, visit http:// creat iveco mmons. org/ licen ses/ by/4. 0/.
© The Author(s) 2021
Copyright © 2022 FDOKUMEN