response of reinforced concrete rectangular liquid containing
Upload
independentCategory
view
4download
0
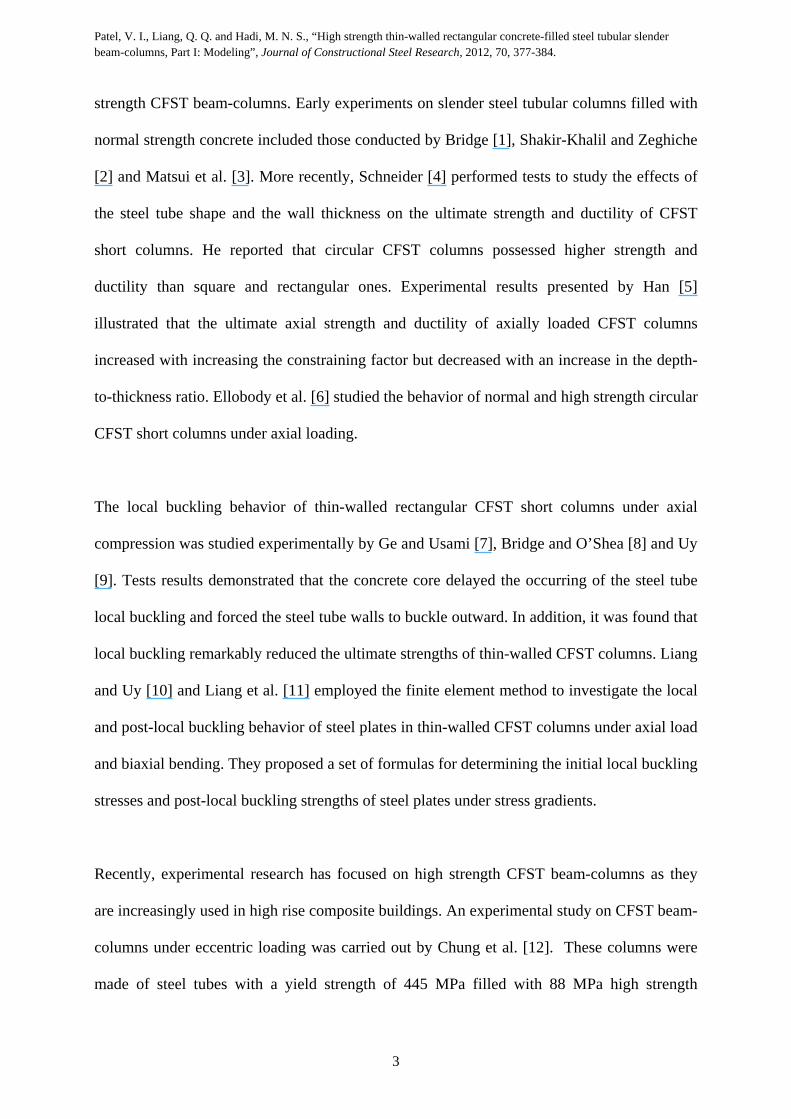
Patel, V. I., Liang, Q. Q. and Hadi, M. N. S., “High strength thin-walled rectangular concrete-filled steel tubular slender beam-columns, Part I: Modeling”, Journal of Constructional Steel Research, 2012, 70, 377-384.
1
High strength thin-walled rectangular concrete-filled steel tubular slender beam-columns, Part I: Modeling
Vipulkumar Ishvarbhai Patela, Qing Quan Lianga,*, Muhammad N. S. Hadib
aSchool of Engineering and Science, Victoria University, PO Box 14428, Melbourne, VIC 8001, Australia
bSchool of Civil, Mining and Environmental Engineering, University of Wollongong, Wollongong, NSW 2522, Australia
ABSTRACT
High strength thin-walled rectangular concrete-filled steel tubular (CFST) slender beam-
columns under eccentric loading may undergo local and overall buckling. The modeling of
the interaction between local and overall buckling is highly complicated. There is relatively
little numerical study on the interaction buckling of high strength thin-walled rectangular
CFST slender beam-columns. This paper presents a new numerical model for simulating the
nonlinear inelastic behavior of uniaxially loaded high strength thin-walled rectangular CFST
slender beam-columns with local buckling effects. The cross-section strengths of CFST beam-
columns are modeled using the fiber element method. The progressive local and post-local
buckling of thin steel tube walls under stress gradients is simulated by gradually redistributing
normal stresses within the steel tube walls. New efficient Müller’s method algorithms are
developed to iterate the neutral axis depth in the cross-sectional analysis and to adjust the
curvature at the columns ends in the axial load-moment interaction strength analysis of a
slender beam-column to satisfy equilibrium conditions. Analysis procedures for determining
the load-deflection and axial load-moment interaction curves for high strength thin-walled
* Corresponding author. Tel.: +61 3 9919 4134 E-mail address: [email protected]

Patel, V. I., Liang, Q. Q. and Hadi, M. N. S., “High strength thin-walled rectangular concrete-filled steel tubular slender beam-columns, Part I: Modeling”, Journal of Constructional Steel Research, 2012, 70, 377-384.
2
rectangular CFST slender beam-columns incorporating progressive local bucking and initial
geometric imperfections are presented. The new numerical model developed is shown to be
efficient for predicting axial load-deflection and axial load-moment interaction curves for
high strength thin-walled rectangular CFST slender beam-columns. The verification of the
numerical model and parametric studies are given in a companion paper.
Keywords: Concrete-filled steel tubes; High strength materials; Local and post-local
buckling; Müller’s method; Nonlinear analysis; Slender beam-columns.
1. Introduction
The local and overall instability problem is encountered in eccentrically loaded high strength
thin-walled rectangular concrete-filled steel tubular (CFST) slender beam-columns with large
depth-to-thickness ratios. The inelastic modeling of thin-walled CFST slender beam-columns
under axial load and bending is complicated not only because it must account for material and
geometric nonlinearities as well as associated second order effects but also the interaction
between progressive local and overall buckling. Although these composite beam-columns are
increasingly used in high rise composite buildings, their structural performance cannot be
accurately predicted without an accurate and efficient computer modeling tool. Currently,
there is a lack of such a modeling technique for thin-walled CFST slender beam-columns.
This paper describes the important development of a new numerical model that simulates the
behavior of high strength thin-walled CFST slender beam-columns incorporating the local
buckling effects of the steel tube walls under stress gradients.
Experiments have been undertaken by many researchers to study the behavior of normal
Patel, V. I., Liang, Q. Q. and Hadi, M. N. S., “High strength thin-walled rectangular concrete-filled steel tubular slender beam-columns, Part I: Modeling”, Journal of Constructional Steel Research, 2012, 70, 377-384.
3
strength CFST beam-columns. Early experiments on slender steel tubular columns filled with
normal strength concrete included those conducted by Bridge [1], Shakir-Khalil and Zeghiche
[2] and Matsui et al. [3]. More recently, Schneider [4] performed tests to study the effects of
the steel tube shape and the wall thickness on the ultimate strength and ductility of CFST
short columns. He reported that circular CFST columns possessed higher strength and
ductility than square and rectangular ones. Experimental results presented by Han [5]
illustrated that the ultimate axial strength and ductility of axially loaded CFST columns
increased with increasing the constraining factor but decreased with an increase in the depth-
to-thickness ratio. Ellobody et al. [6] studied the behavior of normal and high strength circular
CFST short columns under axial loading.
The local buckling behavior of thin-walled rectangular CFST short columns under axial
compression was studied experimentally by Ge and Usami [7], Bridge and O’Shea [8] and Uy
[9]. Tests results demonstrated that the concrete core delayed the occurring of the steel tube
local buckling and forced the steel tube walls to buckle outward. In addition, it was found that
local buckling remarkably reduced the ultimate strengths of thin-walled CFST columns. Liang
and Uy [10] and Liang et al. [11] employed the finite element method to investigate the local
and post-local buckling behavior of steel plates in thin-walled CFST columns under axial load
and biaxial bending. They proposed a set of formulas for determining the initial local buckling
stresses and post-local buckling strengths of steel plates under stress gradients.
Recently, experimental research has focused on high strength CFST beam-columns as they
are increasingly used in high rise composite buildings. An experimental study on CFST beam-
columns under eccentric loading was carried out by Chung et al. [12]. These columns were
made of steel tubes with a yield strength of 445 MPa filled with 88 MPa high strength

Patel, V. I., Liang, Q. Q. and Hadi, M. N. S., “High strength thin-walled rectangular concrete-filled steel tubular slender beam-columns, Part I: Modeling”, Journal of Constructional Steel Research, 2012, 70, 377-384.
4
concrete. In addition, Liu [13] undertook tests on eccentrically loaded high strength
rectangular CFST beam-columns with steel yield strength of 495 MPa and high strength
concrete of 60 MPa. His test results demonstrated that the ultimate loads of CFST slender
beam-columns were significantly reduced by increasing the load eccentricity ratio. Moreover,
Lue et al. [14] reported experimental results on rectangular CFST slender beam-columns with
concrete compressive strengths varying between 29 and 84 MPa.
Nonlinear analysis techniques are efficient and cost-effective performance simulation and
design tools for CFST columns compared to experimental methods [2]. Lakshmi and
Shanmugam [15] proposed a semi-analytical model for determining the behavior of CFST
slender beam-columns under biaxial bending. The limitation of their model is that it did not
account for the effects of local buckling, concrete confinement and concrete tensile strength.
The load-deflection analysis procedure presented by Vrcelj and Uy [16] could be used to
analyze axially loaded high strength square CFST slender beam-columns, but it has not
considered the progressive local buckling of the steel tube walls under stress gradients. Liang
[17, 18] developed a performance-based analysis (PBA) technique for predicting the ultimate
strength and ductility of thin-walled CFST short beam-columns under axial load and biaxial
bending, incorporating effective width formulas proposed by Liang et al. [11] to account for
the effects of progressive local buckling. Moreover, an efficient numerical model was created
by Liang [19, 20] that simulates the load-deflection responses and strength envelopes of high
strength circular CFST slender beam-columns.
This paper extends the numerical models developed by Liang [17, 19] to the nonlinear
analysis of high strength thin-walled rectangular CFST slender beam-columns under axial
load and uniaxial bending. Material constitutive models for concrete in CFST columns and for

Patel, V. I., Liang, Q. Q. and Hadi, M. N. S., “High strength thin-walled rectangular concrete-filled steel tubular slender beam-columns, Part I: Modeling”, Journal of Constructional Steel Research, 2012, 70, 377-384.
5
structural steels are presented. The modeling of cross-sectional strengths accounting for the
local buckling effects of the steel tube walls under stress gradients is formulated by the fiber
element method. New efficient computational algorithms based on the Müller’s method are
developed to obtain nonlinear solutions. Computational procedures for simulating the load-
deflection and axial load-moment interaction curves for high strength CFST slender beam-
columns are described in detail. The verification of the numerical model developed and its
applications are given in a companion paper [21].
2. Material stress-strain relationships
2.1 Stress-strain relationships for concrete
The rectangular steel tube provides confinement to the four corners of the concrete core in a
rectangular CFST column. This confinement does not have a significant effect on the
compressive strength of the concrete core so that it can be ignored in the analysis and design
of rectangular CFST columns. However, the ductility of the concrete core in rectangular
CFST columns is improved and is included in the concrete model. The stress-strain
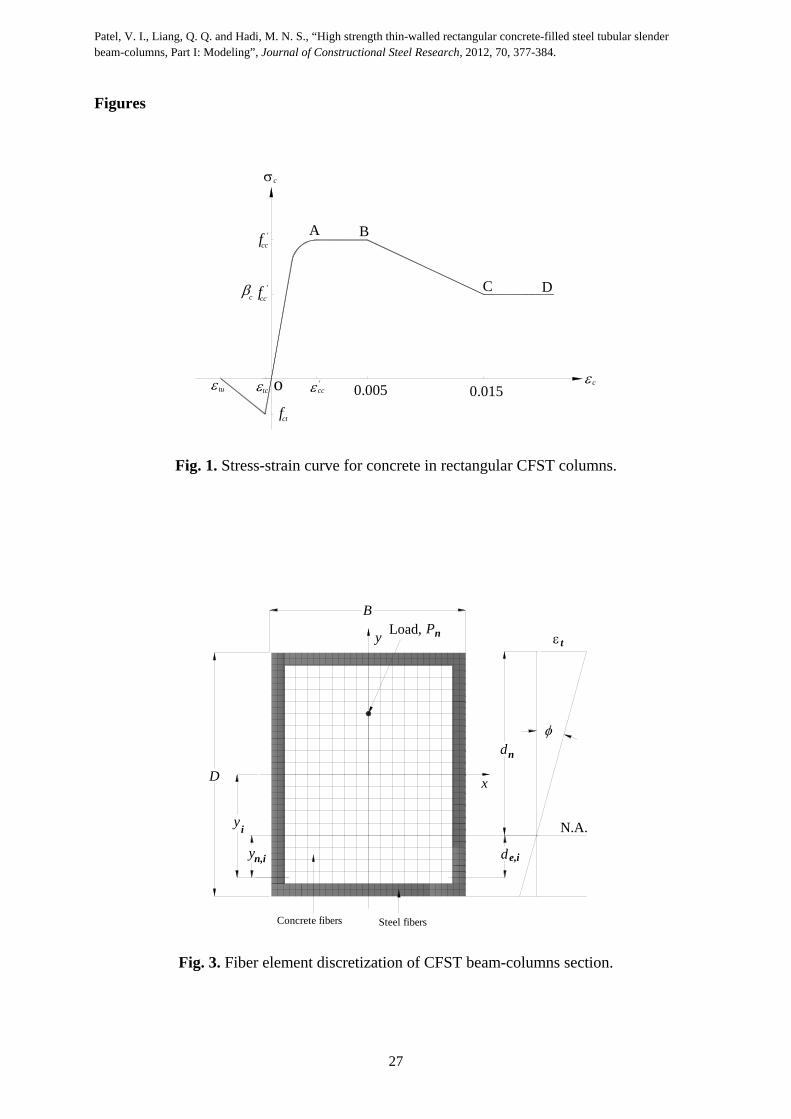
relationship for concrete in rectangular CFST columns is shown in Fig. 1. The concrete stress
from O to A is calculated based on the equations given by Mander et al. [22] as:
'
''
1cc
c
cc
ccc
c
f
(1)
'
'
cc
ccc
c
fE
E
(2)
Patel, V. I., Liang, Q. Q. and Hadi, M. N. S., “High strength thin-walled rectangular concrete-filled steel tubular slender beam-columns, Part I: Modeling”, Journal of Constructional Steel Research, 2012, 70, 377-384.
6
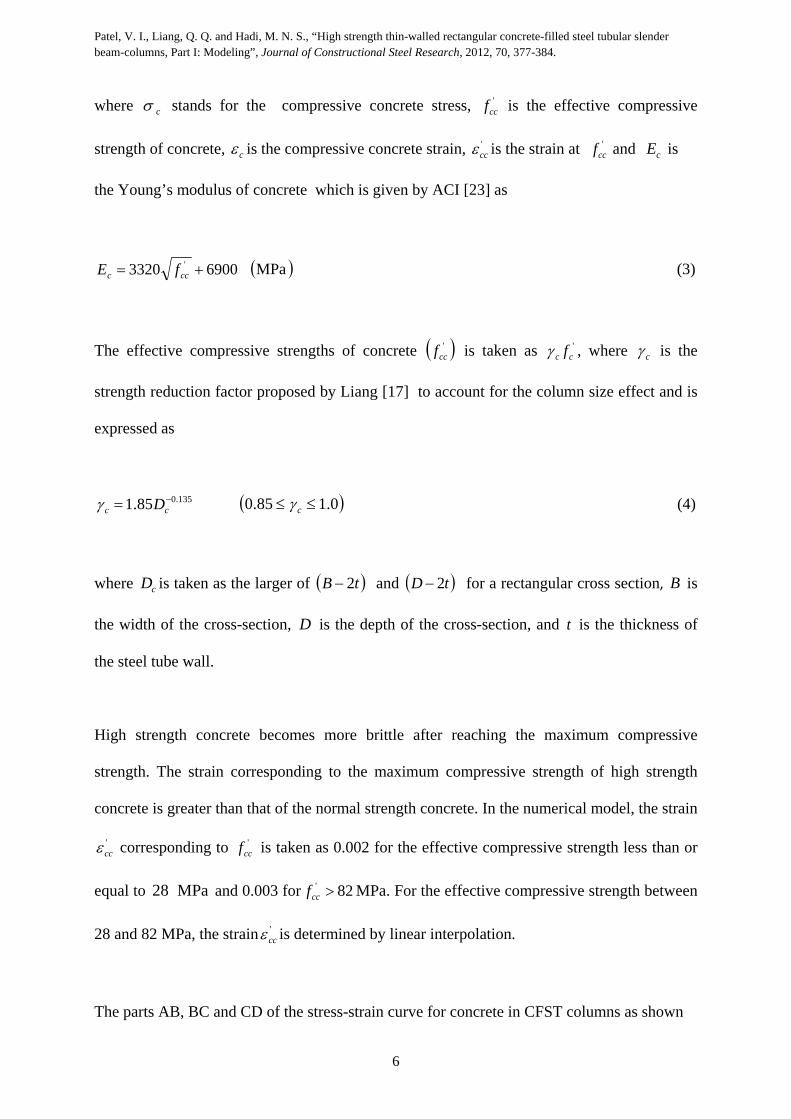
where c stands for the compressive concrete stress, 'ccf is the effective compressive
strength of concrete, c is the compressive concrete strain, 'cc is the strain at '
ccf and cE is
the Young’s modulus of concrete which is given by ACI [23] as
69003320 ' ccc fE MPa (3)
The effective compressive strengths of concrete 'ccf is taken as '
cc f , where c is the
strength reduction factor proposed by Liang [17] to account for the column size effect and is
expressed as
135.085.1 cc D 0.185.0 c (4)
where cD is taken as the larger of tB 2 and tD 2 for a rectangular cross section, B is
the width of the cross-section, D is the depth of the cross-section, and t is the thickness of
the steel tube wall.
High strength concrete becomes more brittle after reaching the maximum compressive
strength. The strain corresponding to the maximum compressive strength of high strength
concrete is greater than that of the normal strength concrete. In the numerical model, the strain
'cc corresponding to '
ccf is taken as 0.002 for the effective compressive strength less than or
equal to 28 MPa and 0.003 for 82' ccf MPa. For the effective compressive strength between
28 and 82 MPa, the strain 'cc is determined by linear interpolation.
The parts AB, BC and CD of the stress-strain curve for concrete in CFST columns as shown

Patel, V. I., Liang, Q. Q. and Hadi, M. N. S., “High strength thin-walled rectangular concrete-filled steel tubular slender beam-columns, Part I: Modeling”, Journal of Constructional Steel Research, 2012, 70, 377-384.
7
in Fig.1 are defined by the following equations given by Liang [17]:
015.0for
015.0005.0for015.0100
005.0for
'
'''
''
cccc
cccccccccc
ccccc
c
f
fff
f
(5)
where c was proposed by Liang [17] based on experimental results presented by Tomii and
Sakino [24] and is given by
48for5.0
4824for48
15.1
24for0.1
t
Bt
B
t
Bt
B
s
ss
s
c (6)
where sB is taken as the larger of B and D for a rectangular cross-section.
The tensile strength of concrete is taken as '6.0 ccf , which is much lower than its ultimate
compressive strength. The stress-strain relationship for concrete in tension is shown in Fig.1.
The concrete tensile stress is considered zero at the ultimate tensile strain. The concrete
tensile stress is directly proportional to the tensile strain of concrete up to concrete cracking.
After concrete carking, the tensile stress of concrete is inversely proportional to the tensile
strain of concrete up to the ultimate tensile strain due to concrete cracking. The ultimate
tensile strain is taken as 10 times of the strain at cracking.
2.2 Stress-strain relationships for steels

Patel, V. I., Liang, Q. Q. and Hadi, M. N. S., “High strength thin-walled rectangular concrete-filled steel tubular slender beam-columns, Part I: Modeling”, Journal of Constructional Steel Research, 2012, 70, 377-384.
8
Three types of the structural steels such as high strength structural steels, cold-formed steels
and mild structural steels are considered in the numerical model. The steel generally follows
the same stress-strain relationship under the tension and compression. The stress-strain
relationship for steel under uniaxial compression is shown in Fig. 2. The mild structural steels
have a linear stress-strain relationship up to the yield stress, however, it is assumed that high
strength steels and cold-formed steels have a linear stress-strain relationship up to syf9.0 ,
where syf is the steel yield strength. The rounded curve of the cold-formed structural steel can
be defined by the equation proposed by Liang [17]. The hardening strain st is assumed to be
0.005 for high strength and cold-formed steels and sy10 for mild structural steels in the
numerical model. The ultimate strain of steels is assumed to be 0.2.
3. Modeling of cross-sectional strengths
3.1 Strain calculations
In the fiber element method, the rectangular cross-section of a slender beam-column is
divided into small concrete fiber elements and steel fiber elements for the purpose of the fiber
element integration. The typical cross-section discretization is shown in Fig. 3. The strain of
each fiber element is calculated by multiplication of the curvature and the orthogonal distance
of the each fiber element from the neutral axis. In the numerical model, the compressive strain
is taken as positive and the tensile strain is taken as negative. The strain t at the top fiber of
the section in the composite cross-section can be determined by multiplication of the
curvature and the neutral axis depth nd .

Patel, V. I., Liang, Q. Q. and Hadi, M. N. S., “High strength thin-walled rectangular concrete-filled steel tubular slender beam-columns, Part I: Modeling”, Journal of Constructional Steel Research, 2012, 70, 377-384.
9
For bending about the x-axis, the strains in concrete and steel fibers can be calculated by the
following equations given by Liang [17]:
nin dD
y 2, (7)
iniie yyd ,, (8)
iniie
iniie
i yyd
yyd
,,
,.
for
for
where nd is the neutral axis depth, ied , is the orthogonal distance from the centroid of each fiber
element to the neutral axis, iy is the coordinates of the fiber i and i is the strain at the thi
fiber element and iny , is the distance from the centroid of each fiber element to the neutral
axis.
For bending about the y-axis, the strain in concrete and steel fibers can be calculated by the
following equations given by Liang [17]
nin d
Bx
2. (10)
iniie xxd ,. (11)
iniie
iniie
i xxd
xxd
,,
,,
for
for
(12)
where ix is coordinates of the fiber i and inx , is the distance from the centroid of each fiber
element to the neutral axis.

Patel, V. I., Liang, Q. Q. and Hadi, M. N. S., “High strength thin-walled rectangular concrete-filled steel tubular slender beam-columns, Part I: Modeling”, Journal of Constructional Steel Research, 2012, 70, 377-384.
10
3.2 Initial local buckling
Steel plates in thin-walled CFST columns with a large width-to-thickness ratio may buckle
locally outward, which reduces the strength and ductility of the beam-columns. The initial
local buckling stresses of steel plates depend on the width-to-thickness ratio, residual stresses,
geometric imperfections, the yield strength of steel plates, and the applied edge stress
gradients. Liang and Uy [10] reported that local buckling of a thin-walled steel plate may
occur when its width-to-thickness ( tb / ) ratio is greater than 30. Steel tube walls of a thin-
walled CFST column under axial load and bending are subjected to uniform or non-uniform
stresses. Therefore, steel tube walls under both uniform and non-uniform compressive stresses
must be taken into account in the interaction buckling analysis of a thin-walled CFST beam-
column under axial load and uniaxial bending. Liang et al. [11] proposed formulas for
determining the initial local buckling stresses of thin steel plates under stress gradients. These
formulas are incorporated in the numerical model to account for initial local buckling effects
on the behavior of high strength thin-walled rectangular CFST slender beam-columns.
3.3 Post-local buckling
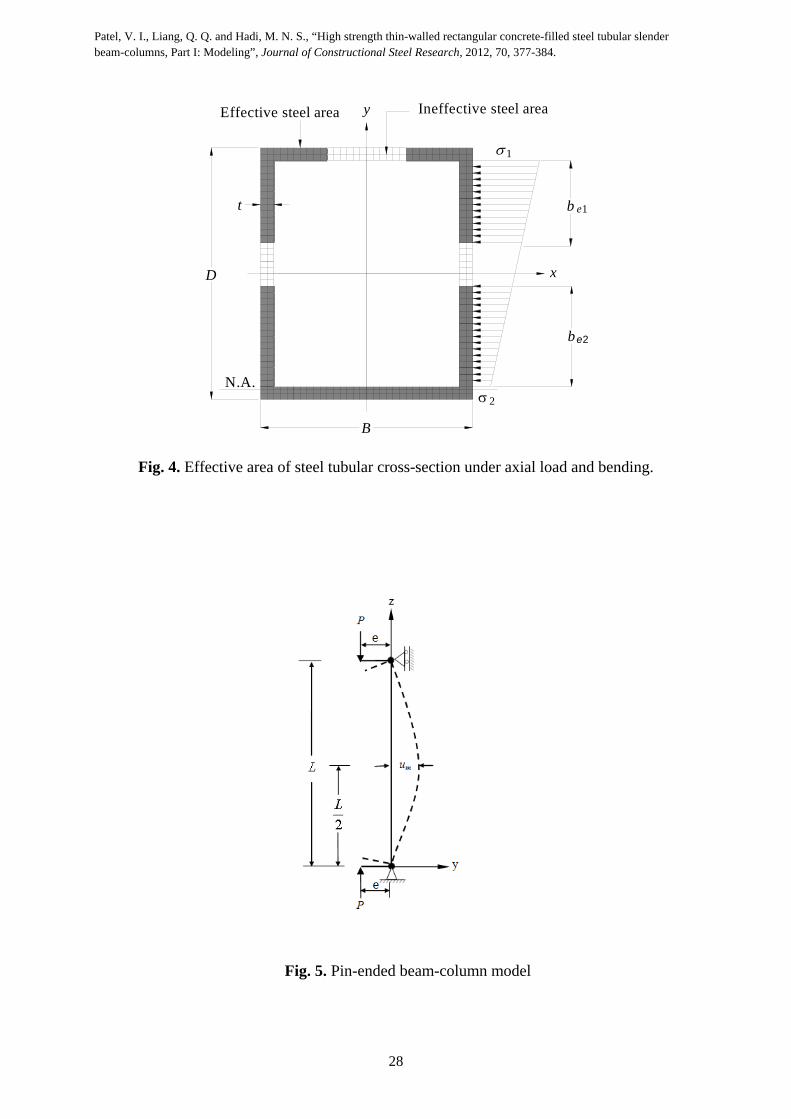
The post-local buckling strengths of thin steel plates can be determined using the effective
strength and width concept. Liang et al. [11] proposed effective strength and width formulas
for determining the post-local buckling strengths of steel plates in thin-walled CFST beam-
columns under axial load and biaxial bending. Their formulas are incorporated in the
numerical model to determine the ultimate strengths of thin steel plates under stress gradients.
Fig. 4 shows the effective and ineffective areas of a rectangular thin-walled CFST beam-

Patel, V. I., Liang, Q. Q. and Hadi, M. N. S., “High strength thin-walled rectangular concrete-filled steel tubular slender beam-columns, Part I: Modeling”, Journal of Constructional Steel Research, 2012, 70, 377-384.
11
column cross-section under axial compression and uniaxial bending. The effective widths 1eb
and 2eb shown in Fig. 4 are given by Liang et al. [11] as
0.0for10685.410355.5002047.04186.0
0.0for10605.910972.101019.02777.0
37
25
37
24
1
s
s
e
t
b
t
b
t
b
t
b
t
b
t
b
b
b
(13)
b
b
b
b es
e 12 2 (14)
where b is the clear width of a steel flange or web in a CFST column section, and 12 s
, where 2 is the minimum edge stress applied to the plate and 1 is the maximum edge stress
applied to the plate.
3.4 Simulation of progressive post-local buckling
The behavior of a thin steel plate under increasing loads is characterized by the progressive
post-local buckling. In the post-local buckling regime, stresses in the steel plate are gradually
redistributed from the heavily buckled region to the unloaded edges. This implies that the
heavily buckled central region in the plate carries lower stresses while the unloaded edges
withstand higher stresses. The effective width concept assumes that a steel plate attains its
ultimate strength when the maximum stress in the plate reaches its yield strength. The
ineffective width of a thin steel plate increases from zero to maximum value when the applied
load is increased from the initial local buckling load to the ultimate load. The maximum
ineffective width of each thin steel plate in a CFST beam-column at the ultimate load is
determined by

Patel, V. I., Liang, Q. Q. and Hadi, M. N. S., “High strength thin-walled rectangular concrete-filled steel tubular slender beam-columns, Part I: Modeling”, Journal of Constructional Steel Research, 2012, 70, 377-384.
12
21max, eene bbbb (15)
As suggested by Liang [17], the ineffective width between zero and max,neb can be
approximately calculated using linear interpolation based on the maximum stress level in the
steel plate, and it is given by
max,1
11ne
csy
cne b
fb
(16)
where c1 is the maximum edge stress in a steel tube wall when initial local buckling occurs.
If the maximum edge stress 1 in a steel plate with a tb ratio greater than 30 is larger than
the initial local buckling stress c1 , it is assumed that steel fiber elements within the
ineffective area do not carry any loads. Therefore, the normal stresses in those fibers are
assigned to zero. However, if the maximum edge stress 1 is greater than the yield strength of
the steel plate, stresses within the steel tube wall need to be reduced by a factor of syf1 to
make sure that the effective width concept is valid. The effective strength formulas proposed
by Liang et al. [11] are employed to determine the ultimate strength of the thin steel plate,
when the total effective width of the plate 21 ee bb is greater than its width b . If the
maximum edge stress of the thin steel plate is greater than the ultimate edge stress u1 of the
steel plate, the stresses within the steel plate are reduced by a factor of u11 .
3.5 Stress resultants

Patel, V. I., Liang, Q. Q. and Hadi, M. N. S., “High strength thin-walled rectangular concrete-filled steel tubular slender beam-columns, Part I: Modeling”, Journal of Constructional Steel Research, 2012, 70, 377-384.
13
The axial force and bending moments carried by a rectangular CFST beam-column cross-
section are determined as stress resultants in the cross-section as follows:
ns
i
nc
jjsjcisis AAP
1 1,,,, (17)
ns
i
nc
jjjcjciisisx yAyAM
1 1,,,, (18)
ns
i
nc
jjjcjciisisy xAxAM
1 1,,,, (19)
where P is the axial force, is, is the stress of steel fiber i , isA , is the area of steel fiber i ,
jc, is the stress of concrete fiber j , jcA , is the area of concrete fiber j , ix and iy are the
coordinates of steel element i , jx and jy are the coordinates of concrete element j , ns is the
total number of steel fiber elements and nc is the total number of concrete fiber elements.
4. Müller’s method algorithms
4.1 Determining the neutral axis depth
Computational algorithms based on the Müller’s method [25] are developed to iterate the
neutral axis depth in a composite cross-section with local bucking effects. The neutral axis
depth nd of the composite cross-section is iteratively adjusted to maintain the force
equilibrium in order to determine the internal moment carried by the section. The Müller’s
method algorithm requires three initial values of the neutral axis depth 1,nd , 2,nd and 3,nd to

Patel, V. I., Liang, Q. Q. and Hadi, M. N. S., “High strength thin-walled rectangular concrete-filled steel tubular slender beam-columns, Part I: Modeling”, Journal of Constructional Steel Research, 2012, 70, 377-384.
14
start the iterative process. The neutral axis depth nd is adjusted by using the following
proposed equations:
112
11
13,4,
4
2
cabb
cdd nn
(20)
3,2,3,1,2,1,
3,2,3,1,3,1,3,2,1
nnnnnn
pupunnpupunn
dddddd
rrddrrdda
(21)
3,2,3,1,2,1,
3,1,2
3,2,3,2,2
3,1,1
nnnnnn
pupunnpupunn
dddddd
rrddrrddb
(22)
3,1 purc (23)
where pur is the residual moment at the mid-height of the column that is given by
mimpu MuuePr o (24)
where ou is the initial geometric imperfection at the mid-height of the beam-column, mu is the
deflection at the mid-height of the beam-column, e is the eccentricity of the applied load as
shown in Fig. 5 and miM is the internal moment carried by the section.
The sign ( or ) of the square root term in the denominator of Eq.(20) is chosen to be the
same as the sign of 1b to keep 4,nd close to 3,nd . In order to obtain converged solutions, the
values of 1,nd , 2,nd and 3,nd and corresponding residual moments 1,pur , 2,pur and 3,pur need to be
exchanged. The values of 1,nd , 2,nd and 3,nd are temporarily stored in Tnd 1, , T
nd 2, and Tnd 3,

Patel, V. I., Liang, Q. Q. and Hadi, M. N. S., “High strength thin-walled rectangular concrete-filled steel tubular slender beam-columns, Part I: Modeling”, Journal of Constructional Steel Research, 2012, 70, 377-384.
15
respectively while the values of 1,pur , 2,pur and 3,pur are temporarily stored in Tpur 1, , T
pur 2, and Tpur 3,
respectively. The following computer codes are executed:
; ; ; ; ,AbsAbsIF 1,2,2,1,1,2,2,1,1,4,2,4,Tpupu
Tpupu
Tnn
Tnn
Tnn
Tnn rrrrdddddddd ;
; ;; ; ,AbsAbsIF 2,3,3,2,2,3,3,2,2,4,3,4,Tpupu
Tpupu
Tnn
Tnn
Tnn
Tnn rrrrdddddddd ;
4,3, nn dd ;
4,3, pupu rr .
Eq. (20) and the above codes are executed repetitively until the convergence criterion of
kpur is satisfied, where k is the convergence tolerance that is taken as 410 .
4.2 Determining the curvature at column ends
The maximum moment maxeM at the column ends for a given axial load nP needs to be
determined in order to generate the axial load-moment interaction diagram for the slender
beam-column. The curvature at the mid-height m of the beam-column under axial load and
uniaxial bending is initialized and gradually increased. For each curvature increment at the
mid-height of the beam-column, the curvature at the column ends e is iteratively adjusted by
the Müller’s method algorithm to maintain equilibrium between the internal moment miM and
the external moment meM at the mid-height of the beam-column. The Müller’s method
algorithm requires three initial values of the curvature at the column ends 1,e , 2,e and 3,e to
start the iterative process. The curvature e at the column ends is adjusted by using the
following proposed equations:

Patel, V. I., Liang, Q. Q. and Hadi, M. N. S., “High strength thin-walled rectangular concrete-filled steel tubular slender beam-columns, Part I: Modeling”, Journal of Constructional Steel Research, 2012, 70, 377-384.
16
22222
23,4,
4
2
cabb
cee
(25)
3,2,3,1,2,1,
3,2,3,1,3,1,3,2,2
eeeeee
pmpmeepmpmee rrrra
(26)
3,2,3,1,2,1,
3,1,2
3,2,3,2,2
3,1,2
eeeeee
pmpmeepmpmee rrrrb
(27)
3,2 pmrc (28)
where pmr is the residual moment at the mid-height of the column which is given by
mimnepm MuuPMr o (29)
The sign of the square root term in the denominator of Eq. (25) is taken as positive in order to
obtain converged solutions. Similar to the determination of nd , the values of 1,e , 2,e and 3,e
and corresponding 1,pmr , 2,pmr and 3,pmr need to be exchanged in order to obtain the true e . The
values of 1,e , 2,e and 3,e are temporarily stored in Te 1, , T
e 2, and Te 3, respectively and the values
of 1,pmr , 2,pmr and 3,pmr are temporarily stored in Tpmr 1, , T
pmr 2, and Tpmr 3, respectively. The following
computer codes are executed:
; ; ;; ,AbsAbsIF 1,2,2,1,1,2,2,1,1,4,2,4,Tpmpm
Tpmpm
Tee
Tee
Tee
Tee rrrr ;
; ; ;; ,AbsAbsIF 2,3,3,2,2,3,3,2,2,4,3,4,Tpmpm
Tpmpm
Tee
Tee
Tee
Tee rrrr ;
4,3, ee ;
4,3, pmpm rr .

Patel, V. I., Liang, Q. Q. and Hadi, M. N. S., “High strength thin-walled rectangular concrete-filled steel tubular slender beam-columns, Part I: Modeling”, Journal of Constructional Steel Research, 2012, 70, 377-384.
17
The curvature at the column ends is iteratively adjusted until convergence criterion of
kpmr is satisfied.
5. Modeling of load-deflection responses
5.1 Formulation
A new efficient numerical model has been developed to generate axial load- deflection curves
for high strength thin-walled rectangular CFST slender beam-columns under axial load and
uniaxial bending with local buckling effects. The deflected shape of the column is assumed to
be part of a sine wave as suggested by Shakir-Khalil and Zeghiche [2]. The deflection at any
point (y, z) along the column length is given by
L
zuu m
sin (30)
where L is the effective length of the beam-column.
The curvature along the length of the beam-column can be derived from Eq. (30) as
L
zu
Lz
um
sin2
2
2
(31)
The curvature at the mid-height of the beam-column is given by

Patel, V. I., Liang, Q. Q. and Hadi, M. N. S., “High strength thin-walled rectangular concrete-filled steel tubular slender beam-columns, Part I: Modeling”, Journal of Constructional Steel Research, 2012, 70, 377-384.
18
mm uL
2
(32)
The external bending moment at the mid-height of the beam-column with an initial geometric
imperfection ou and under eccentric loading can be calculated by
ouuePM mme (33)
5.2 Analysis Procedure
The axial load- deflection analysis procedure is started by first assuming a small value of the
mid-height deflection um in the slender beam-column under axial load with an eccentricity.
The curvature m at the mid-height of the slender beam-column is calculated for the given
mid-height deflection using Eq. (32). The proposed Müller’s method algorithms are used to
adjust the neutral axis depth in the composite cross-section to maintain the force equilibrium.
The internal bending moment miM is determined using the moment-curvature response of the
composite cross-section with local buckling effects. The mid-height deflection of the slender
beam-column is gradually increased and the process is repeated. A pair of applied axial load
and deflection is used to plot the axial load-deflection diagram. The flowchart of the axial
load-deflection analysis procedure is shown in Fig. 6. The key steps of the axial load-
deflection diagram are given as follows:
(1) Input the dimensions of the beam-column, material properties of the steel and
concrete, the loading eccentricity e and initial geometric imperfection ou .
(2) Divide the concrete core and steel tube into fiber elements.

Patel, V. I., Liang, Q. Q. and Hadi, M. N. S., “High strength thin-walled rectangular concrete-filled steel tubular slender beam-columns, Part I: Modeling”, Journal of Constructional Steel Research, 2012, 70, 377-384.
19
(3) Initialize the mid-height deflection: mm uu .
(4) Compute the curvature m at the mid-height of the beam-column from the given mid-
height deflection mu by using Eq. (32).
(5) Initialize three values of the neutral axis depth of the composite cross-section:
4/1, Ddn , 2/2, Ddn and Ddn 3, .
(6) Compute the stresses of steel and concrete using the stress-strain relationships.
(7) Check local buckling and redistribute stresses in steel fibers if local buckling occurs.
(8) Calculate the internal bending moment miM and the external bending moment meM
corresponding to 4/1, Ddn , 2/2, Ddn and Ddn 3, respectively.
(9) Compute the residual moments 1,pur , 2,pur and 3,pur corresponding to 4/1, Ddn ,
2/2, Ddn and Ddn 3, respectively.
(10) Calculate 1a , 1b and 1c and adjust the neutral axis depth nd using Eq. (20)
(11) Compute fiber element stresses and redistribute normal stresses in steel fibers if local
buckling occurs.
(12) Calculate the internal bending moment miM and external bending moment meM
corresponding to the neutral axis depth nd .
(13) Compute pur using Eq. (24) and repeat Steps (10)-(12) until the convergence condition
kpur is satisfied.
(14) Increase the deflection mu at the mid-height of the beam-column and repeat steps (4)-
(13) until the ultimate load nP is obtained or the deflection limit is reached.
(15) Plot the load-deflection curve.

Patel, V. I., Liang, Q. Q. and Hadi, M. N. S., “High strength thin-walled rectangular concrete-filled steel tubular slender beam-columns, Part I: Modeling”, Journal of Constructional Steel Research, 2012, 70, 377-384.
20
The convergence tolerance k is set to 410 in the analysis. The computational procedure
proposed can predict the complete axial load-deflection responses of uniaxially loaded
rectangular CFST slender beam-columns with local buckling effects.
6. Modeling of axial load-moment interaction diagrams
6.1 Formulation
The ultimate bending moment nM is calculated as the maximum applied moment maxeM at
the column ends for a given axial load nP to generate the axial load-moment interaction
diagram. The maximum moment maxeM is obtained when the external moment meM attains
the ultimate bending strength of the beam-column cross-section for the given axial load nP .
The curvature at the column ends is adjusted using the Müller’s method algorithms and the
corresponding moment eM at the column ends is calculated. The external moment at the mid-
height of the slender beam-column is calculated by
)( ouuPMM mneme (34)
The curvature at the mid-height of the slender beam-column is gradually increased to
calculate the maximum bending moment maxeM for a given axial load. For each curvature
increment at the mid-height of the beam-column, the mid-height deflection is calculated by
the following equation:

Patel, V. I., Liang, Q. Q. and Hadi, M. N. S., “High strength thin-walled rectangular concrete-filled steel tubular slender beam-columns, Part I: Modeling”, Journal of Constructional Steel Research, 2012, 70, 377-384.
21
mm
Lu
(35)
6.2 Analysis procedure
The axial load-moment interaction diagram for high strength thin-walled rectangular CFST
slender beam-column is determined by the numerical model developed. The axial load-
deflection analysis procedure incorporating local buckling effects is used to determine the
ultimate axial load oaP of the slender column under axial load alone. The applied axial load nP
is gradually increased. The curvature m at the mid-height is initialized and gradually
increased. The load-moment-curvature relationship incorporating local buckling effects is
used to determine the corresponding internal moment miM at the mid-height of the beam-
column. The proposed Müller’s method algorithms are used to adjust the curvature e at the
column ends to produce the moment eM that satisfies equilibrium at the mid-height of the
beam-column. The maximum moment maxeM at the column ends is obtained for each
increment of the applied axial load nP . A pair of the maximum moment maxeM at the column
ends and the given applied axial load nP is used to plot the axial load-moment interaction
diagram. Fig. 7 shows the flowchart for determining axial load-moment interaction diagrams
for rectangular CFST slender beam-column. The main steps of the analysis procedure are
given as follows:
(1) Input the geometry of the beam-column, material properties of the steel and concrete
and the initial geometric imperfection ou .
(2) Divide composite section into concrete and steel fiber elements.

Patel, V. I., Liang, Q. Q. and Hadi, M. N. S., “High strength thin-walled rectangular concrete-filled steel tubular slender beam-columns, Part I: Modeling”, Journal of Constructional Steel Research, 2012, 70, 377-384.
22
(3) Compute the ultimate axial load oaP of the axially loaded slender beam-column using
the load-deflection analysis procedure accounting for local buckling effects.
(4) Initialize the applied axial load: 0nP .
(5) Initialize the curvature at the mid-height of the beam-column: mm .
(6) Calculate the mid-height deflection mu using Eq. (35) from the mid-height curvature
m .
(7) Compute the internal moment miM for the given axial load nP using the MP
relationship accounting for local buckling effects.
(8) Initialize three values of the curvature at the column ends 101, 10e , 6
3, 10e
2/3,1,2, eee and calculate the corresponding 1,pmr , 2,pmr and 3,pmr .
(9) Calculate 2a , 2b and 2c and adjust the curvature at the columns end e using Eq. (25).
(10) Compute the moment eM at the column ends and the internal bending moment miM
using the MP relationship accounting for local buckling effects.
(11) Calculate pmr using Eq. (29) and repeat steps (9)-(10) until kpmr .
(12) Increase the curvature at the mid-height of the beam-column by mmm .
(13) Repeat steps (6)-(12) until the ultimate bending strength maxen MM at the column
ends is obtained.
(14) Increase the axial load by nnn PPP , where 10oaPPn .
(15) Repeat steps (5)-(14) until the maximum load increment is reached.
(16) Plot the axial load-moment interaction diagram.
Numerical analysis shows that the proposed Muller algorithms are very efficient for obtaining
converged solutions. The ultimate pure axial load oaP is calculated by specifying the

Patel, V. I., Liang, Q. Q. and Hadi, M. N. S., “High strength thin-walled rectangular concrete-filled steel tubular slender beam-columns, Part I: Modeling”, Journal of Constructional Steel Research, 2012, 70, 377-384.
23
eccentricity of the applied to zero in the axial load-deflection analysis. Similarly, the ultimate
pure bending strength of a slender beam-column is obtained by specifying the axial load to
zero in the axial load-moment interaction strength analysis.
7. Conclusions
This paper has presented a new numerical model for simulating the behavior of high strength
thin-walled rectangular CFST slender beam-columns under axial load and uniaxial bending.
The effects of local buckling, column slenderness, eccentricity of loading, high strength
materials, initial geometric imperfections and material and geometric nonlinearities are
considered in the numerical model developed. The numerical model for pin-ended CFST
slender beam-columns with equal end eccentricities and single curvature bending was
developed based on fiber element formulations. New Müller’s method algorithms were
developed to iterate the neutral axis depth in the composite cross-section and to adjust the
curvature at the column ends in the slender beam-column to satisfy equilibrium conditions.
The new numerical model is shown to be efficient for predicting the complete axial load-
deflection and axial load-moment interaction curves for high strength thin-walled rectangular
CFST slender beam-columns with local buckling effects. The comparison with corresponding
experimental results and parametric studies are given in a companion paper.
References
[1] Bridge RQ. Concrete filled steel tubular columns. School of Civil Engineering,
University of Sydney, Sydney, Australia, Research Report No. R 283, 1976.
[2] Shakir-Khalil H, Zeghiche J. Experimental behvaiour of concrete-filled rolled
rectangular hollow-section columns. The structural Engineer, 1989; 67(19): 346-53.

Patel, V. I., Liang, Q. Q. and Hadi, M. N. S., “High strength thin-walled rectangular concrete-filled steel tubular slender beam-columns, Part I: Modeling”, Journal of Constructional Steel Research, 2012, 70, 377-384.
24
[3] Matsui C, Tsuda K, Ishibashi Y. Slender concrete filled steel tubular columns under
combined compression and bending. The 4th Pacific Structural Steel Conference
Pergamon Singapore 1995; 3(10):29-36.
[4] Schneider SP. Axially loaded concrete-filled steel tubes. Journal of Structural
Engineering, ASCE 1998; 124(10):1125-38.
[5] Han LH. Tests on stub columns of concrete-filled RHS sections. Journal of
Constructional Steel Research 2002; 58(3): 353-72.
[6] Ellobody E, Young B, Lam D. Behaviour of normal and high strength concrete-filled
compact steel tube circular stub columns. Journal of Constructional Steel research 2006;
62(7): 706-15.
[7] Ge H, Usami T. Strength of concrete-filled thin-walled steel box columns: Experiment.
Journal of Structural Engineering, ASCE 1992; 118(11):3036-54.
[8] Bridge RQ, O’Shea MD. Behaviour of thin-walled steel box sections with or without
internal restraint. Journal of Constructional Steel Research 1998; 47(1-2): 73-91.
[9] Uy B. Strength of concrete filled steel box columns incorporating local buckling.
Journal of Structural Engineering, ASCE 2000; 126(3): 341-52.
[10] Liang QQ, Uy B. Theoretical study on the post-local buckling of steel plates in
concrete-filled box columns. Computers and structures 2000; 75(5):479-90.
[11] Liang QQ, Uy B, Liew JYR. Local buckling of steel plates in concrete-filled thin-
walled steel tubular beam-columns. Journal of Constructional Steel Research 2007;
63(3): 396-405.
[12] Chung J, Tsuda K, Matsui C. High-strength concrete filled square tube columns
subjected to axial loading. The Seventh East Asia-Pacific Conference on Structural
Engineering & Construction, Kochi, Japan 1999; Volume 2:955-60.

Patel, V. I., Liang, Q. Q. and Hadi, M. N. S., “High strength thin-walled rectangular concrete-filled steel tubular slender beam-columns, Part I: Modeling”, Journal of Constructional Steel Research, 2012, 70, 377-384.
25
[13] Liu D. Behaviour of eccentrically loaded high-strength rectangular concrete-filled steel
tubular columns. Journal of Constructional Steel Research 2006; 62(8): 839-46.
[14] Lue DM, Liu JL, Yen T. Experimental study on rectangular CFT columns with high-
strength concrete. Journal of Constructional Steel Research 2007; 63 (1): 37-44.
[15] Lakshmi B, Shanmugam NE. Nonlinear analysis of in-filled steel-concrete composite
columns. Journal of Structural Engineering, ASCE 2002; 128(7):922-33.
[16] Vrcelj Z, Uy B. Strength of slender concrete-filled steel box columns incorporating
local buckling. Journal of Constructional Steel Research 2002; 58(2):275-300.
[17] Liang QQ. Performance-based analysis of concrete-filled steel tubular beam-columns,
Part I: Theory and algorithms. Journal of Constructional Steel Research 2009; 65(2):
363-72.
[18] Liang QQ. Strength and ductility of high strength concrete-filled steel tubular beam-
columns. Journal of Constructional Steel Research 2009; 65(3): 687-98.
[19] Liang QQ. High strength circular concrete-filled steel tubular slender beam-columns,
Part I: Numerical analysis. Journal of Constructional Steel Research 2011; 67(2):164-
71.
[20] Liang QQ. High strength circular concrete-filled steel tubular slender beam-columns,
Part II: Fundamental behavior. Journal of Constructional Steel Research 2011;
67(2):172-80.
[21] Patel VI, Liang QQ, Hadi MNS. High strength thin-walled rectangular concrete-filled
steel tubular slender beam-columns, Part II: Behavior. Journal of Constructional Steel
Research 2012; 70:368-376.
[22] Mander JB, Priestly MNJ, Park R. Theoretical stress-strain model for confined concrete.
Journal of Structural Engineering, ASCE 1988; 114(8):1804-26.

Patel, V. I., Liang, Q. Q. and Hadi, M. N. S., “High strength thin-walled rectangular concrete-filled steel tubular slender beam-columns, Part I: Modeling”, Journal of Constructional Steel Research, 2012, 70, 377-384.
26
[23] ACI-318. Building Code Requirements for Reinforced Concrete. ACI, Detroit, MI,
2002.
[24] Tomii M, Sakino K. Elastic-plastic behavior of concrete filled square steel tubular
beam-columns. Transactions of the Architectural Institute of Japan 1979; 280:111-20.
[25] Müller DE. A method for solving algebraic equations using an automatic computer.
MTAC, 1956, 10:208-215.
Patel, V. I., Liang, Q. Q. and Hadi, M. N. S., “High strength thin-walled rectangular concrete-filled steel tubular slender beam-columns, Part I: Modeling”, Journal of Constructional Steel Research, 2012, 70, 377-384.
27
Figures
Fig. 1. Stress-strain curve for concrete in rectangular CFST columns.
Fig. 3. Fiber element discretization of CFST beam-columns section.
C D
A B
c
0.0150.005 cctc'
fct
tu
fcc'
c f
cc
'
c
o
B
y
y
D
Pn
x
y
n
e,i
t
i
n,i
Concrete fibers Steel fibers
N.A.
d
d
Load,
Patel, V. I., Liang, Q. Q. and Hadi, M. N. S., “High strength thin-walled rectangular concrete-filled steel tubular slender beam-columns, Part I: Modeling”, Journal of Constructional Steel Research, 2012, 70, 377-384.
28
Fig. 4. Effective area of steel tubular cross-section under axial load and bending.
Fig. 5. Pin-ended beam-column model
Ineffective steel areaEffective steel area
1
2
b e1
be2
D x
y
N.A.
B
t

Patel, V. I., Liang, Q. Q. and Hadi, M. N. S., “High strength thin-walled rectangular concrete-filled steel tubular slender beam-columns, Part I: Modeling”, Journal of Constructional Steel Research, 2012, 70, 377-384.
29
Fig. 6. Flowchart for determining the axial load-deflection curve for rectangular thin-walled CFST slender columns
Start
Divide composite section into fibers
Initialize
Calculate curvature
Initialize dn,1=D/4, dn,2=D/2, dn,3=D
Calculate fiber stresses and strains
Check local buckling and update steel stresses
Compute rpu,1, rpu,2, rpu,3
Calculate P, Mmi
Adjust dn using Eq.(20)
Calculate fiber stresses and strains
Compute P, Mmi
Check local buckling and update steel stresses
Plot P-um diagram
Increase
Is Pn obtained?or um > limit?
End
Input data
Yes
Yes
No
No
mmm uuu
mm uu
m
?kpur

Patel, V. I., Liang, Q. Q. and Hadi, M. N. S., “High strength thin-walled rectangular concrete-filled steel tubular slender beam-columns, Part I: Modeling”, Journal of Constructional Steel Research, 2012, 70, 377-384.
30
Fig. 7. Flowchart for determining the axial load-moment interaction diagram for rectangular thin-walled CFST slender beam-columns
Start
End
Input data
Divide composite section into fibers
Compute Poa using P-u analysis procedure including local buckling effects
Initialize
Initialize
Calculate um using Eq.(35)
Calculate Mmi using P-M- relationship accounting for local buckling effects
Initialize Compute
Adjust using Eq.(25)
Calculate Mmi and Me using P-M- relationship considering local buckling
effects
Is Pn < Poa?
Plot Pn-Mn diagram
Is Mn obtained?
Yes
No
No
No
Yes
Yes
mm
0nP
e
mmm
nnn PPP
?kpmr
,61,101 3,1, EE ee 3,2,1, ,, pmpmpm rrr 23,1,2, eee
Copyright © 2022 FDOKUMEN