strength characteristics of concrete made with stainless steel
21
1 Mechanical -strength characteristics of concrete made with stainless steel 1 industry wastes as binders 2 3 M. D. Rubio-Cintas 1 , S. J. Barnett 3 , F., Perez-García 2 , M. E. Parron-Rubio 1 , 4 1 Dpto. de Ingeniería Industrial y Civil, Universidad de Cádiz, 11202 Algeciras (Spain). 5 2 Dpto. de Ingeniería Civil, Materiales y Fabricación, Universidad de Málaga, 29071 Málaga (Spain) 6 3 School of Civil Engineering and Surveying, University of Portsmouth (United Kingdom) 7 8 * Correspondence: [email protected] 9 10 Abstract 11 One of the problems of steelworks, referring to the steel manufacture, is the generation of secondary 12 products, resulting in recent years in new types of industrial waste that, depending on the sustainability 13 of the environment, must be reused or treated. This paper analyzes the mechanical behaviour of 14 concrete samples with the addition of an industrial waste, such as ferritic fume dust produced by 15 electric arc furnaces (EAF) when the materials are melted and makes a comparison using other types 16 of additions of concrete such us silica fume. At the same time this paper studies the capacity of the 17 matrix to encapsulate this residue that eventually ends up deposited in a landfill. The results show that, 18 besides giving the concrete a greater resistance as it happens with silica fume, the use of this type of 19 waste as an addition to concrete is suitable since the material remains encapsulated in the concrete 20 matrix, thus not producing leaching of heavy metals which can be harmful to the environment and 21 therefore to the health of the human being. 22 Keywords: Concrete, Fume dust EAF, Compressive strength, Flexural strength 23 24 1. Introduction 25 One of the biggest problems today in the steel industry is the production of waste in varying amounts 26 depending on the type of scrap used and steel to be processed, generating various types of steel 27 including ferritic steel. Ferritic steel is a type of steel that is composed of less than 0.10% carbon. This 28 grade of steel was developed as a stainless steel group (ACERINOX) that can resist oxidation and 29 corrosion, specifically stress cracking corrosion (SCC). We will focus on the study of ferritic steel for 30 our study. These materials produce large amounts of waste that build up fume dust. Said dust is 31 generated in the combustion of the scrap inside the electric arc furnace (EAF). The powder evaporates 32 and is extracted, then deposited in baghouse dust collectors for its later removal and deposition into 33 landfill. These are expensive to recycle or reuse and difficult to transform into an inert waste. 34 Current steel production is about 1597 million tonnes according to International Iron and Steel Institute 35 (IISI) Conferences 2015 [1]. EAF fume dust is generated in appreciable quantities when casting steel. 36
-
Upload
khangminh22 -
Category
Documents
-
view
0 -
download
0
Transcript of strength characteristics of concrete made with stainless steel
1
Mechanical -strength characteristics of concrete made with stainless steel 1
industry wastes as binders 2
3
M. D. Rubio-Cintas1, S. J. Barnett3, F., Perez-García2, M. E. Parron-Rubio1, 4 1 Dpto. de Ingeniería Industrial y Civil, Universidad de Cádiz, 11202 Algeciras (Spain). 5 2 Dpto. de Ingeniería Civil, Materiales y Fabricación, Universidad de Málaga, 29071 Málaga (Spain) 6 3 School of Civil Engineering and Surveying, University of Portsmouth (United Kingdom) 7 8 * Correspondence: [email protected] 9
10
Abstract 11
One of the problems of steelworks, referring to the steel manufacture, is the generation of secondary 12 products, resulting in recent years in new types of industrial waste that, depending on the sustainability 13 of the environment, must be reused or treated. This paper analyzes the mechanical behaviour of 14 concrete samples with the addition of an industrial waste, such as ferritic fume dust produced by 15 electric arc furnaces (EAF) when the materials are melted and makes a comparison using other types 16 of additions of concrete such us silica fume. At the same time this paper studies the capacity of the 17 matrix to encapsulate this residue that eventually ends up deposited in a landfill. The results show that, 18 besides giving the concrete a greater resistance as it happens with silica fume, the use of this type of 19 waste as an addition to concrete is suitable since the material remains encapsulated in the concrete 20 matrix, thus not producing leaching of heavy metals which can be harmful to the environment and 21 therefore to the health of the human being. 22
Keywords: Concrete, Fume dust EAF, Compressive strength, Flexural strength 23
24
1. Introduction 25
One of the biggest problems today in the steel industry is the production of waste in varying amounts 26 depending on the type of scrap used and steel to be processed, generating various types of steel 27 including ferritic steel. Ferritic steel is a type of steel that is composed of less than 0.10% carbon. This 28 grade of steel was developed as a stainless steel group (ACERINOX) that can resist oxidation and 29 corrosion, specifically stress cracking corrosion (SCC). We will focus on the study of ferritic steel for 30 our study. These materials produce large amounts of waste that build up fume dust. Said dust is 31 generated in the combustion of the scrap inside the electric arc furnace (EAF). The powder evaporates 32 and is extracted, then deposited in baghouse dust collectors for its later removal and deposition into 33 landfill. These are expensive to recycle or reuse and difficult to transform into an inert waste. 34
Current steel production is about 1597 million tonnes according to International Iron and Steel Institute 35 (IISI) Conferences 2015 [1]. EAF fume dust is generated in appreciable quantities when casting steel. 36
2
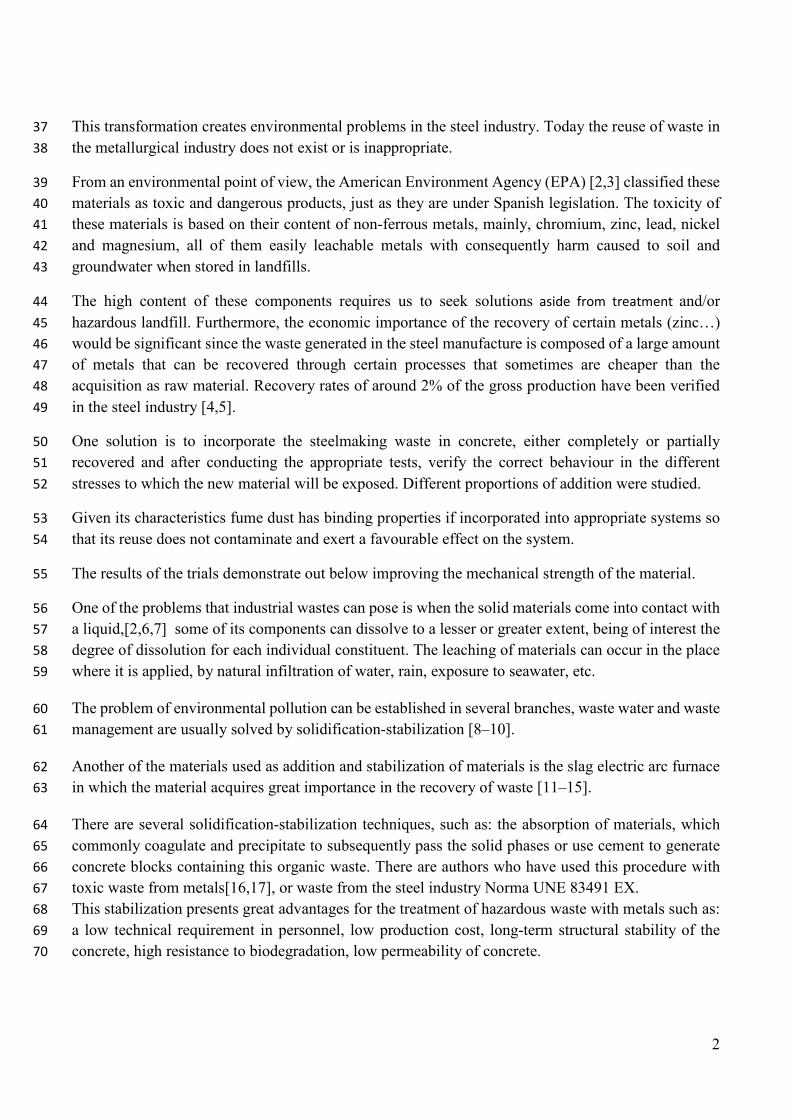
This transformation creates environmental problems in the steel industry. Today the reuse of waste in 37 the metallurgical industry does not exist or is inappropriate. 38
From an environmental point of view, the American Environment Agency (EPA) [2,3] classified these 39 materials as toxic and dangerous products, just as they are under Spanish legislation. The toxicity of 40 these materials is based on their content of non-ferrous metals, mainly, chromium, zinc, lead, nickel 41 and magnesium, all of them easily leachable metals with consequently harm caused to soil and 42 groundwater when stored in landfills. 43
The high content of these components requires us to seek solutions aside from treatment and/or 44 hazardous landfill. Furthermore, the economic importance of the recovery of certain metals (zinc…) 45 would be significant since the waste generated in the steel manufacture is composed of a large amount 46 of metals that can be recovered through certain processes that sometimes are cheaper than the 47 acquisition as raw material. Recovery rates of around 2% of the gross production have been verified 48 in the steel industry [4,5]. 49
One solution is to incorporate the steelmaking waste in concrete, either completely or partially 50 recovered and after conducting the appropriate tests, verify the correct behaviour in the different 51 stresses to which the new material will be exposed. Different proportions of addition were studied. 52
Given its characteristics fume dust has binding properties if incorporated into appropriate systems so 53 that its reuse does not contaminate and exert a favourable effect on the system. 54
The results of the trials demonstrate out below improving the mechanical strength of the material. 55
One of the problems that industrial wastes can pose is when the solid materials come into contact with 56 a liquid,[2,6,7] some of its components can dissolve to a lesser or greater extent, being of interest the 57 degree of dissolution for each individual constituent. The leaching of materials can occur in the place 58 where it is applied, by natural infiltration of water, rain, exposure to seawater, etc. 59
The problem of environmental pollution can be established in several branches, waste water and waste 60 management are usually solved by solidification-stabilization [8–10]. 61
Another of the materials used as addition and stabilization of materials is the slag electric arc furnace 62 in which the material acquires great importance in the recovery of waste [11–15]. 63
There are several solidification-stabilization techniques, such as: the absorption of materials, which 64 commonly coagulate and precipitate to subsequently pass the solid phases or use cement to generate 65 concrete blocks containing this organic waste. There are authors who have used this procedure with 66 toxic waste from metals[16,17], or waste from the steel industry Norma UNE 83491 EX. 67 This stabilization presents great advantages for the treatment of hazardous waste with metals such as: 68 a low technical requirement in personnel, low production cost, long-term structural stability of the 69 concrete, high resistance to biodegradation, low permeability of concrete. 70
3
There are a large number of factors that influence the relationship in which the constituents of a 71 material are dissolved from the matrix material. These factors can be divided into physical and 72 chemical. 73 Currently there are several legislations in the European regulations in which are found IV.39/9 34 74 2000/532/CE, by which a list of hazardous waste is established. 75 According to Spanish regulations, those listed in Annex 2 of Royal Decree 952/1997, of June 20, where 76 the list of hazardous waste approved by Decision 94/904 / EC, of the council, of 22 December, in 77 accordance with section 4 of article 1 of directive 91/689 / EEC 78
79 The treatments can be classified as: 80
• Stabilization: Treatment of the waste with chemical agents, such as lime or phosphoric 81
acid, to reduce the mobility of the components. 82
• Solidification: Confine in a matrix of low permeability. This improves the mechanical 83
properties and decreases the contact surface of the waste with the possible leachant. 84
• Chemical extraction: Treatment that involves washing the metals contained in the ashes 85
with different liquids. 86
87 This type of treatment is focused on the immobilization of metals, since organic molecules are not 88 easily incorporated into crystalline structures and it is more difficult for them to form insoluble 89 precipitates. Stabilization and solidification processes are widely used in the management of hazardous 90 waste. 91 When the waste has been treated, the efficiency of the treatment process must be evaluated, analyzing 92 the untreated and treated waste by chemical analysis, or the so-called leachate tests, which consist of 93 putting the sample in contact with a "leaching" agent during a certain period of time. In this way, the 94 total content of the waste can be compared with that of the treated matrix and what is actually released 95 in contact with the leachant. Let's see what materials make up the study. 96
97 98
2.Materials 99 100 In this section, the materials used for the development of the experiment are analyzed, these 101 being the following. 102 103 2.1 Ferritic Fume Dust (FFD). 104 105 Most of our steel industry uses collection and purification systems. The collection system is 106 mainly used in the aspiration through a fourth hole in the roof of the furnace, and subsequent 107 uptake by extractor bells installed in various parts of the mill, mainly above the ovens. The gases 108 captured by the hood are conducted through channels to the fourth filter or bag filters. Emissions 109 generated in the AOD converter (Decarburization converter with Oxygen and Argon) are also 110 captured and directed to the channel and filtered together with the gases of the electric furnace. 111
4
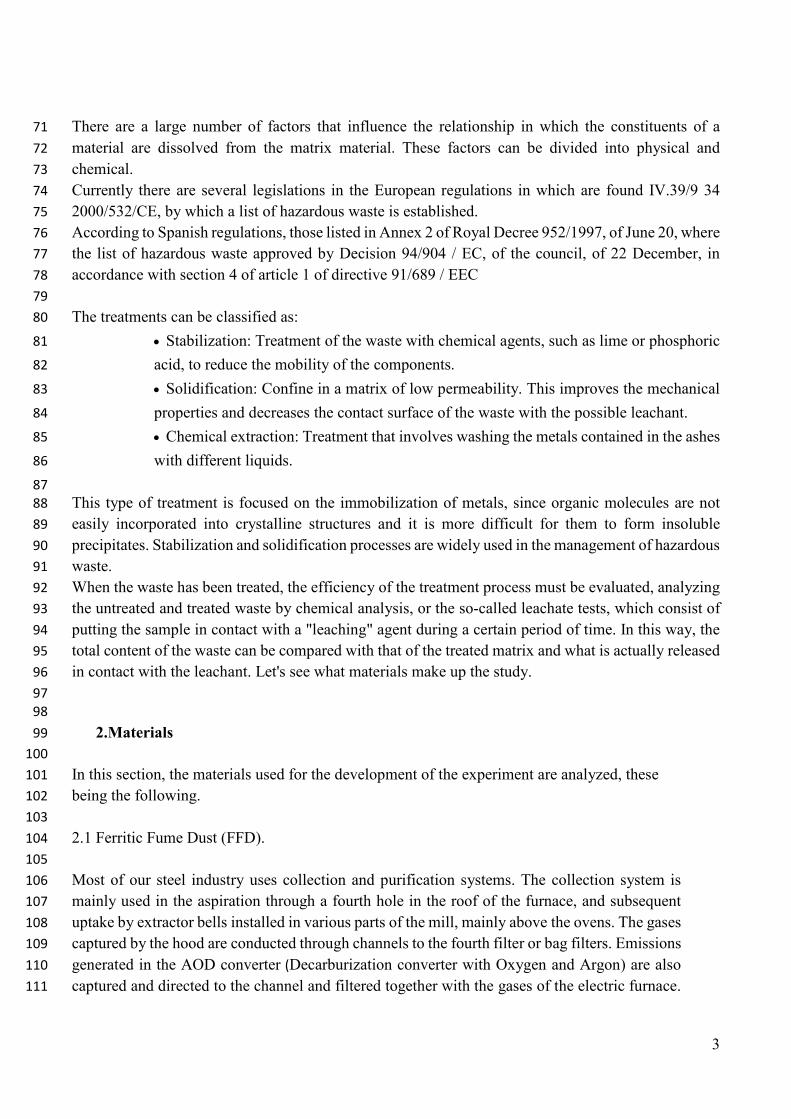
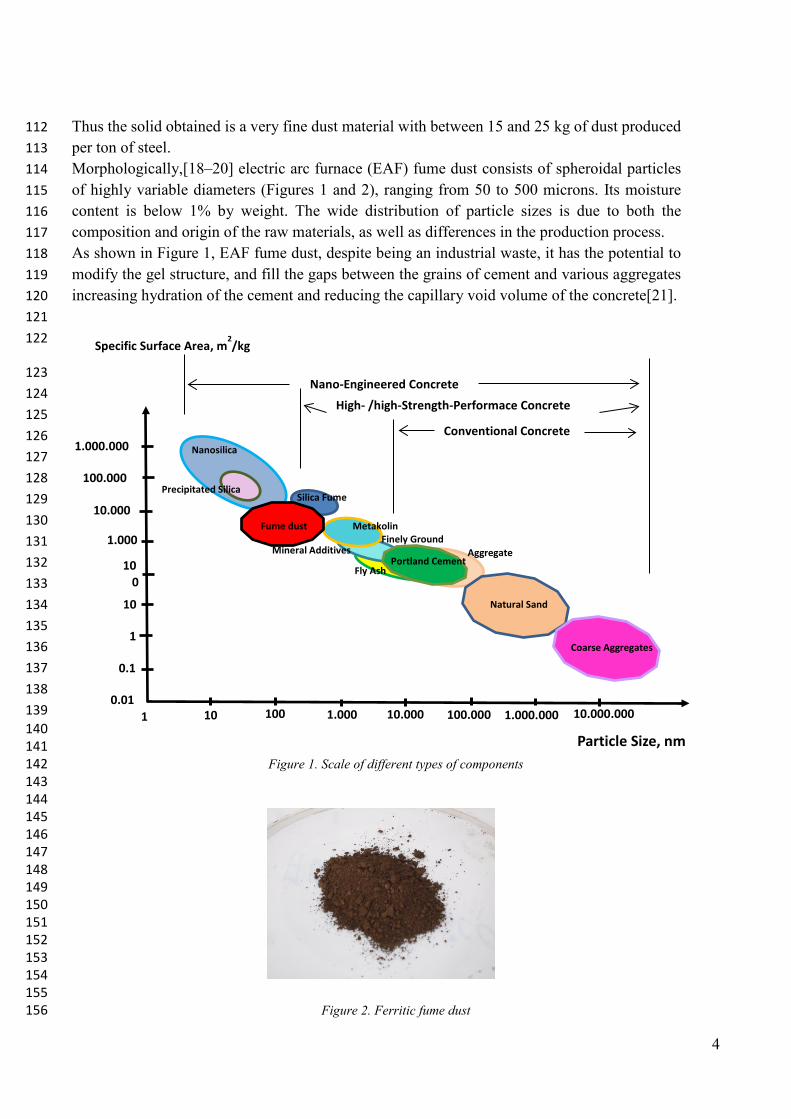
Thus the solid obtained is a very fine dust material with between 15 and 25 kg of dust produced 112 per ton of steel. 113 Morphologically,[18–20] electric arc furnace (EAF) fume dust consists of spheroidal particles 114 of highly variable diameters (Figures 1 and 2), ranging from 50 to 500 microns. Its moisture 115 content is below 1% by weight. The wide distribution of particle sizes is due to both the 116 composition and origin of the raw materials, as well as differences in the production process. 117 As shown in Figure 1, EAF fume dust, despite being an industrial waste, it has the potential to 118 modify the gel structure, and fill the gaps between the grains of cement and various aggregates 119 increasing hydration of the cement and reducing the capillary void volume of the concrete[21]. 120 121 122
123 124 125 126 127 128 129 130 131 132 133 134 135 136 137 138 139
140 141
Figure 1. Scale of different types of components 142 143 144
145 146 147 148 149 150 151 152 153 154
155 Figure 2. Ferritic fume dust 156
Specific Surface Area, m2/kg
Fines Mineral Additives
Finely Ground Metakolin
Silica Fume
Conventional Concrete High- /high-Strength-Performace Concrete
Nano-Engineered Concrete
Nanosilica
Particle Size, nm 1 10 100 1.000 10.000 100.000 1.000.000 10.000.000
1.000.000
100.000
10.000
1.000 10 0 10
1
0.1
0.01
Fly Ash Aggregate
Precipitated Silica
Natural Sand
Coarse Aggregates
Fume dust
Portland Cement
5
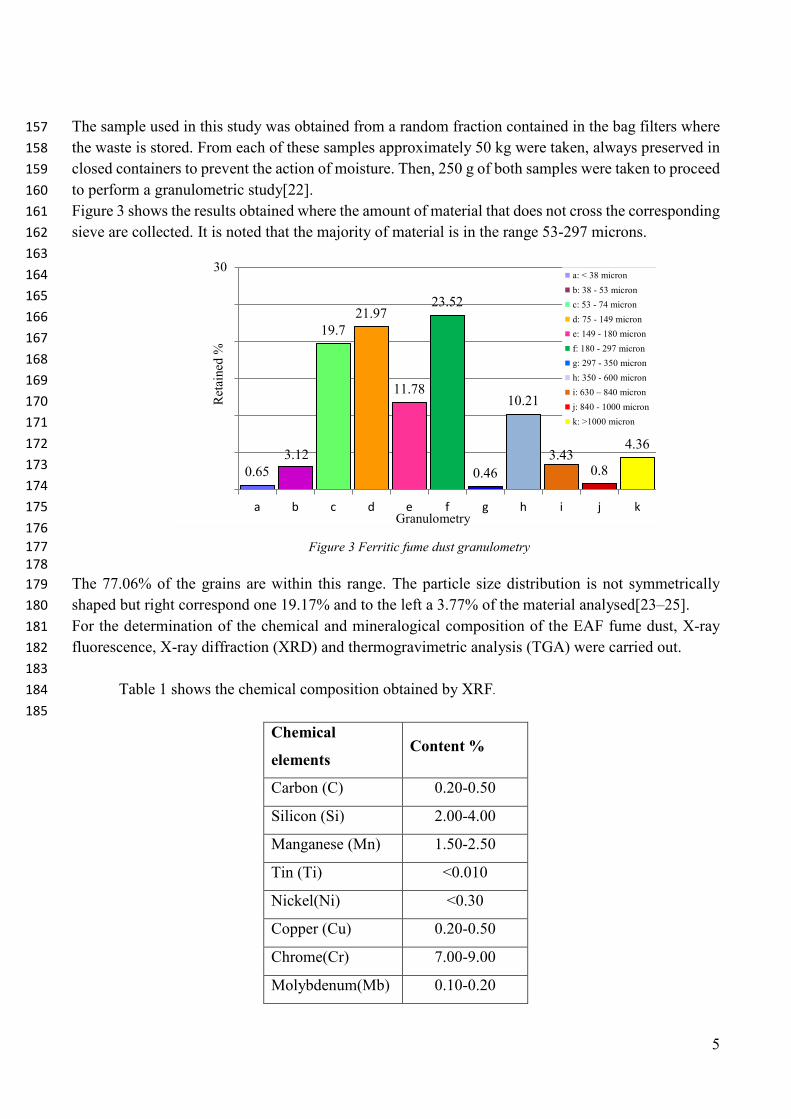
The sample used in this study was obtained from a random fraction contained in the bag filters where 157 the waste is stored. From each of these samples approximately 50 kg were taken, always preserved in 158 closed containers to prevent the action of moisture. Then, 250 g of both samples were taken to proceed 159 to perform a granulometric study[22]. 160 Figure 3 shows the results obtained where the amount of material that does not cross the corresponding 161 sieve are collected. It is noted that the majority of material is in the range 53-297 microns. 162
163 164 165 166 167 168 169 170 171 172 173 174 175 176
Figure 3 Ferritic fume dust granulometry 177 178
The 77.06% of the grains are within this range. The particle size distribution is not symmetrically 179 shaped but right correspond one 19.17% and to the left a 3.77% of the material analysed[23–25]. 180 For the determination of the chemical and mineralogical composition of the EAF fume dust, X-ray 181 fluorescence, X-ray diffraction (XRD) and thermogravimetric analysis (TGA) were carried out. 182
183 Table 1 shows the chemical composition obtained by XRF. 184 185
Chemical
elements Content %
Carbon (C) 0.20-0.50
Silicon (Si) 2.00-4.00
Manganese (Mn) 1.50-2.50
Tin (Ti) <0.010
Nickel(Ni) <0.30
Copper (Cu) 0.20-0.50
Chrome(Cr) 7.00-9.00
Molybdenum(Mb) 0.10-0.20
0.653.12
19.721.97
11.78
23.52
0.46
10.21
3.430.8
4.36
0
5
10
15
20
25
30
a b c d e f g h i j k
a: < 38 micron b: 38 - 53 micron c: 53 - 74 micron d: 75 - 149 micron e: 149 - 180 micron f: 180 - 297 micron g: 297 - 350 micron h: 350 - 600 micron i: 630 – 840 micron j: 840 - 1000 micron k: >1000 micron
Ret
aine
d %
Granulometry
6
Iron(Fe) 23.00-32.00
Calcium(Ca) 6.50-8.00
Lead (Pb) 1.00-1.50
Zinc (Zn) 10.00-20.00
Magnesium (Mg) 2.00-3.00 186
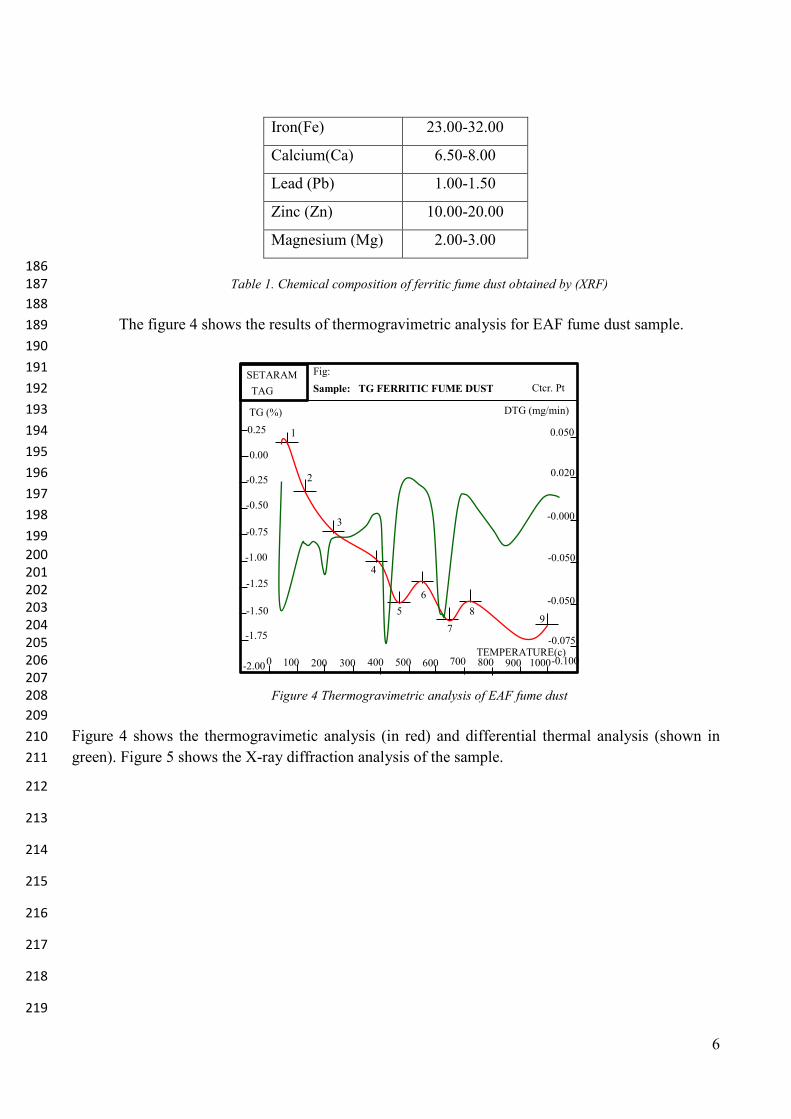
Table 1. Chemical composition of ferritic fume dust obtained by (XRF) 187 188 The figure 4 shows the results of thermogravimetric analysis for EAF fume dust sample. 189 190 191 192 193 194 195 196 197 198 199
200 201 202 203 204 205 206 207
Figure 4 Thermogravimetric analysis of EAF fume dust 208 209 Figure 4 shows the thermogravimetic analysis (in red) and differential thermal analysis (shown in 210 green). Figure 5 shows the X-ray diffraction analysis of the sample. 211
212
213
214
215
216
217
218
219
Sample: TG FERRITIC FUME DUST Ctcr. Pt Fig: SETARAM
TAG TG (%) DTG (mg/min)
TEMPERATURE(c)
0.25 0.00
-0.25 -0.50
-0.75 -1.00 -1.25
-1.50 -1.75
-2.00 0 100 200 300 400 500 600 700 800 900 1000 -0.100 -0.075
-0.050
-0.050
-0.000
0.020
0.050 1
2
3
4
5 6
7 8
9
7
220
221 222 223 224 225 226 227 228 229 230 231 232 233 234 235 236
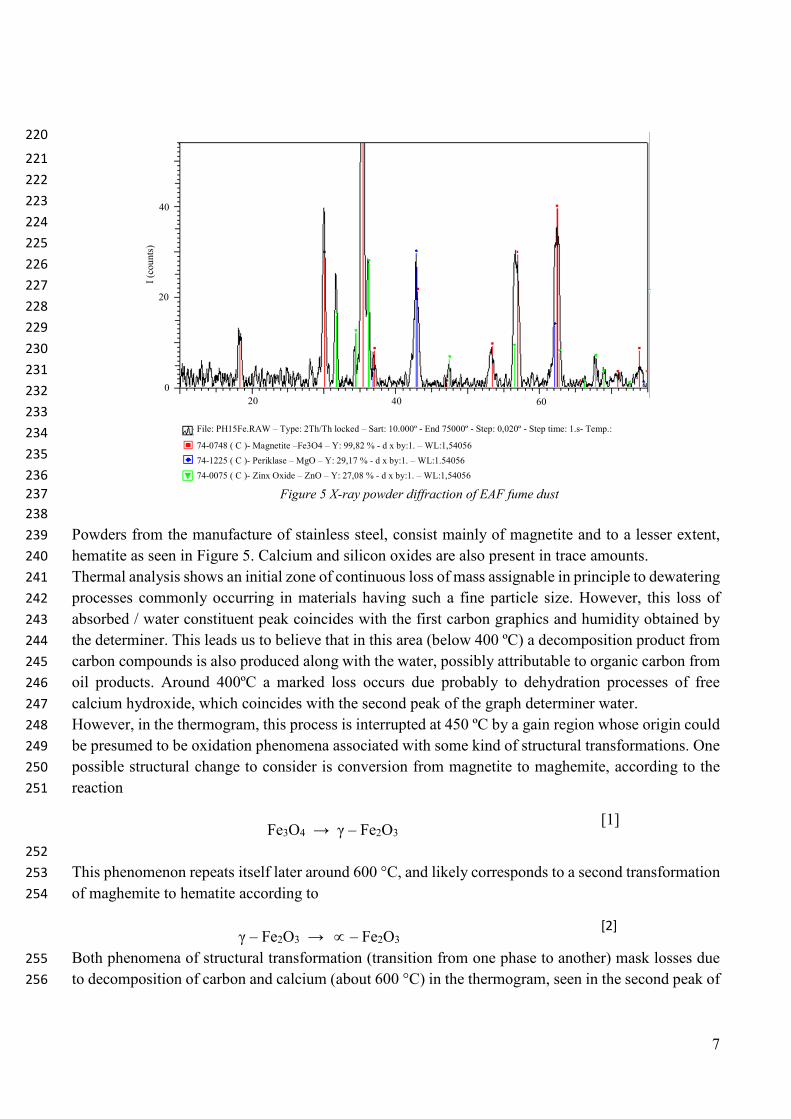
Figure 5 X-ray powder diffraction of EAF fume dust 237 238 Powders from the manufacture of stainless steel, consist mainly of magnetite and to a lesser extent, 239 hematite as seen in Figure 5. Calcium and silicon oxides are also present in trace amounts. 240 Thermal analysis shows an initial zone of continuous loss of mass assignable in principle to dewatering 241 processes commonly occurring in materials having such a fine particle size. However, this loss of 242 absorbed / water constituent peak coincides with the first carbon graphics and humidity obtained by 243 the determiner. This leads us to believe that in this area (below 400 ºC) a decomposition product from 244 carbon compounds is also produced along with the water, possibly attributable to organic carbon from 245 oil products. Around 400ºC a marked loss occurs due probably to dehydration processes of free 246 calcium hydroxide, which coincides with the second peak of the graph determiner water. 247 However, in the thermogram, this process is interrupted at 450 ºC by a gain region whose origin could 248 be presumed to be oxidation phenomena associated with some kind of structural transformations. One 249 possible structural change to consider is conversion from magnetite to maghemite, according to the 250 reaction 251
Fe3O4 → γ – Fe2O3
[1]
252 This phenomenon repeats itself later around 600 °C, and likely corresponds to a second transformation 253 of maghemite to hematite according to 254
γ – Fe2O3 → ∝ – Fe2O3
[2]
Both phenomena of structural transformation (transition from one phase to another) mask losses due 255 to decomposition of carbon and calcium (about 600 °C) in the thermogram, seen in the second peak of 256
File: PH15Fe.RAW – Type: 2Th/Th locked – Sart: 10.000º - End 75000º - Step: 0,020º - Step time: 1.s- Temp.: 74-0748 ( C )- Magnetite –Fe3O4 – Y: 99,82 % - d x by:1. – WL:1,54056
74-0075 ( C )- Zinx Oxide – ZnO – Y: 27,08 % - d x by:1. – WL:1,54056 74-1225 ( C )- Periklase – MgO – Y: 29,17 % - d x by:1. – WL:1.54056
I (co
unts
)
0
20
40
20 40 60
8
the graph, which gives information from the decomposition of alkali carbonates is at temperatures 257 around 800 °C. 258 The actual particle density (3.76 g/cm3) and bulk density (1.06 g/cm3) of the powder sample were 259 obtained using a pycnometer to subsequently make a comparison of densities in the compact. 260 261 2.2. Ordinary Portland Cement 262 263 The cement used as binder for every concrete mixture is an ordinary clinker Portland cement supplied 264 by a local company and categorized as type CEM I 52.5 R with a bulk density of 3.1 g/cm3, whose 265 main components are, calcium oxide, silicon oxide, aluminum oxide, iron oxide and magnesium oxide 266 in different proportions according to the manufacturer. 267 268 2.3. Silica Fume 269
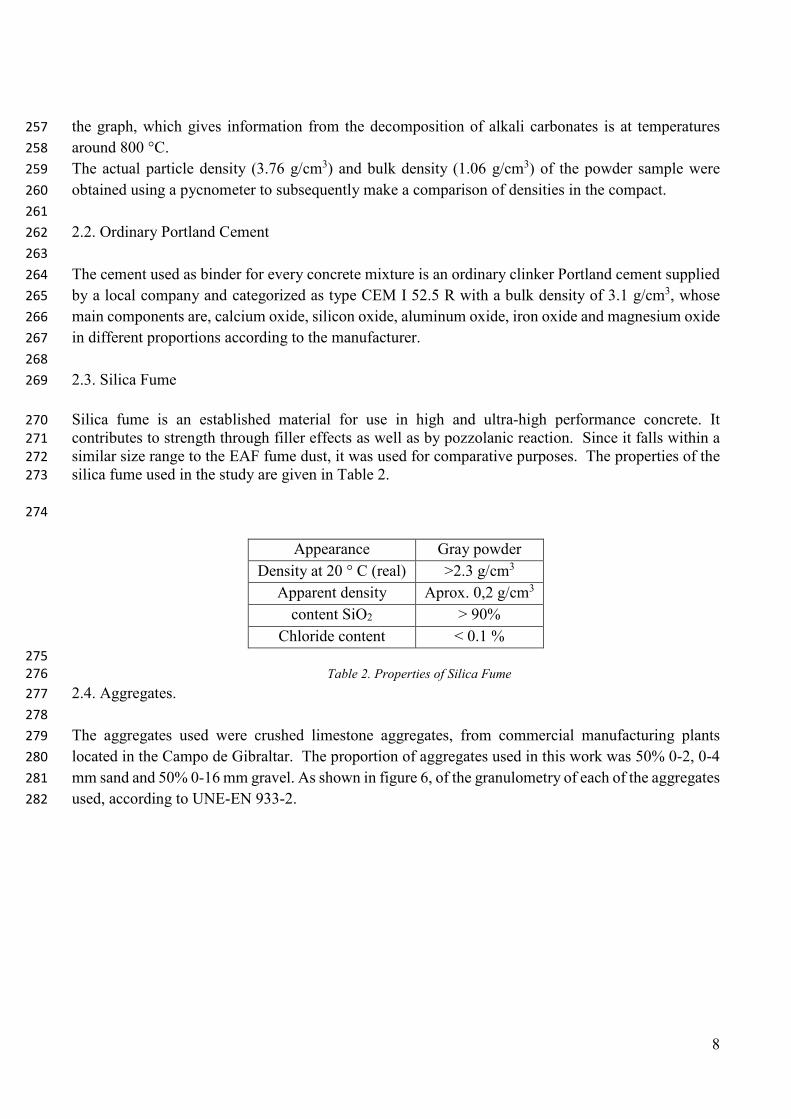
Silica fume is an established material for use in high and ultra-high performance concrete. It 270 contributes to strength through filler effects as well as by pozzolanic reaction. Since it falls within a 271 similar size range to the EAF fume dust, it was used for comparative purposes. The properties of the 272 silica fume used in the study are given in Table 2. 273
274
Appearance Gray powder Density at 20 ° C (real) >2.3 g/cm3
Apparent density Aprox. 0,2 g/cm3 content SiO2 > 90%
Chloride content < 0.1 % 275
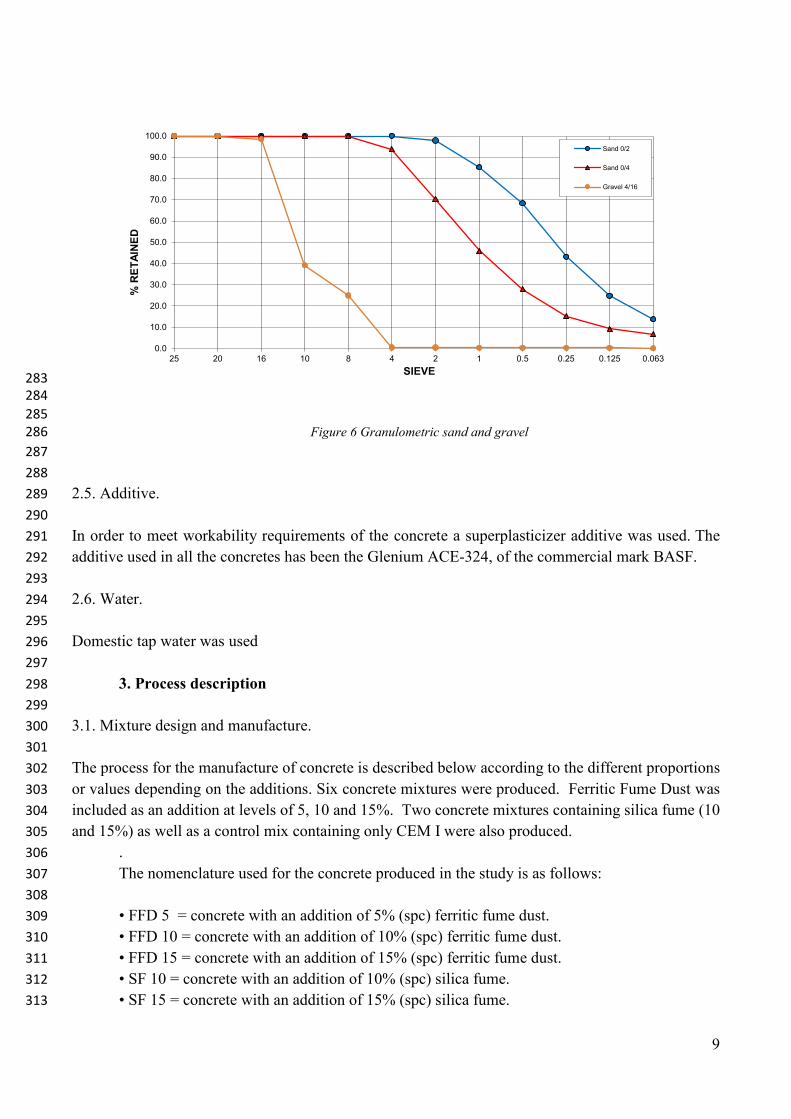
Table 2. Properties of Silica Fume 276 2.4. Aggregates. 277 278 The aggregates used were crushed limestone aggregates, from commercial manufacturing plants 279 located in the Campo de Gibraltar. The proportion of aggregates used in this work was 50% 0-2, 0-4 280 mm sand and 50% 0-16 mm gravel. As shown in figure 6, of the granulometry of each of the aggregates 281 used, according to UNE-EN 933-2. 282
9
283 284
285 Figure 6 Granulometric sand and gravel 286
287 288 2.5. Additive. 289 290 In order to meet workability requirements of the concrete a superplasticizer additive was used. The 291 additive used in all the concretes has been the Glenium ACE-324, of the commercial mark BASF. 292
293 2.6. Water. 294 295 Domestic tap water was used 296
297 3. Process description 298 299
3.1. Mixture design and manufacture. 300 301 The process for the manufacture of concrete is described below according to the different proportions 302 or values depending on the additions. Six concrete mixtures were produced. Ferritic Fume Dust was 303 included as an addition at levels of 5, 10 and 15%. Two concrete mixtures containing silica fume (10 304 and 15%) as well as a control mix containing only CEM I were also produced. 305
. 306 The nomenclature used for the concrete produced in the study is as follows: 307 308 • FFD 5 = concrete with an addition of 5% (spc) ferritic fume dust. 309 • FFD 10 = concrete with an addition of 10% (spc) ferritic fume dust. 310 • FFD 15 = concrete with an addition of 15% (spc) ferritic fume dust. 311 • SF 10 = concrete with an addition of 10% (spc) silica fume. 312 • SF 15 = concrete with an addition of 15% (spc) silica fume. 313
0.0
10.0
20.0
30.0
40.0
50.0
60.0
70.0
80.0
90.0
100.0
25 20 16 10 8 4 2 1 0.5 0.25 0.125 0.063
% R
ETAI
NED
SIEVE
Sand 0/2
Sand 0/4
Gravel 4/16
10
• NA = conventional concrete without addition. 314 315
The W/C that has been chosen, in all cases, was 0.5 as we can see in Table 3. The addition of both 316 ferritic smoke dust and silica smoke in small proportions according to UNE-83460-2. 317
318 Binder Aggregates
Mix Water (w/c
ratio)
Cement Dosage Kg/m3
Addition %
Additive %
Dosage Kg/m3
Sand 0-4 %
Gravel 4-16 %
NA
0.5 325 Kg/m3
0%
1.2% 2033.8 kg/m3 50% 50%
FFD 5 5% of FFD FFD 10 10% of FFD FFD 15 15% of FFD SF 10 10% of SF SF 15 15% of SF
319 Table 3. Concrete mixture proportion. 320
321 These concretes were manufactured in a mixer with rotating vertical axis and fixed blades, with a 322 capacity of 80 litres. A soft consistency of 7.1 was obtained according to the UNE-EN 12350-2 323 standard. 324
Once mixed the concretes were poured into die and vibrated for compaction, using a vibrating table at 325 a frequency of 42 Hz (2400 cycles per minute) according to UNE 12390-2[26]. 326
Specimens were covered with plastic for 24 hours and then were demoulded and brought into a moist 327 chamber for curing at a relative humidity not less than 95% and a temperature of 20 ± 2 º C. Finally 328 the samples were extruded according to norm UNE-EN 12390-4. 329 These specimens were kept in the chamber until use, 24 hours before testing. 330
331 3.2. Compression strength tests. 332
Compression testing was performed according to standard UNE-EN 12390-3 [27]: 333
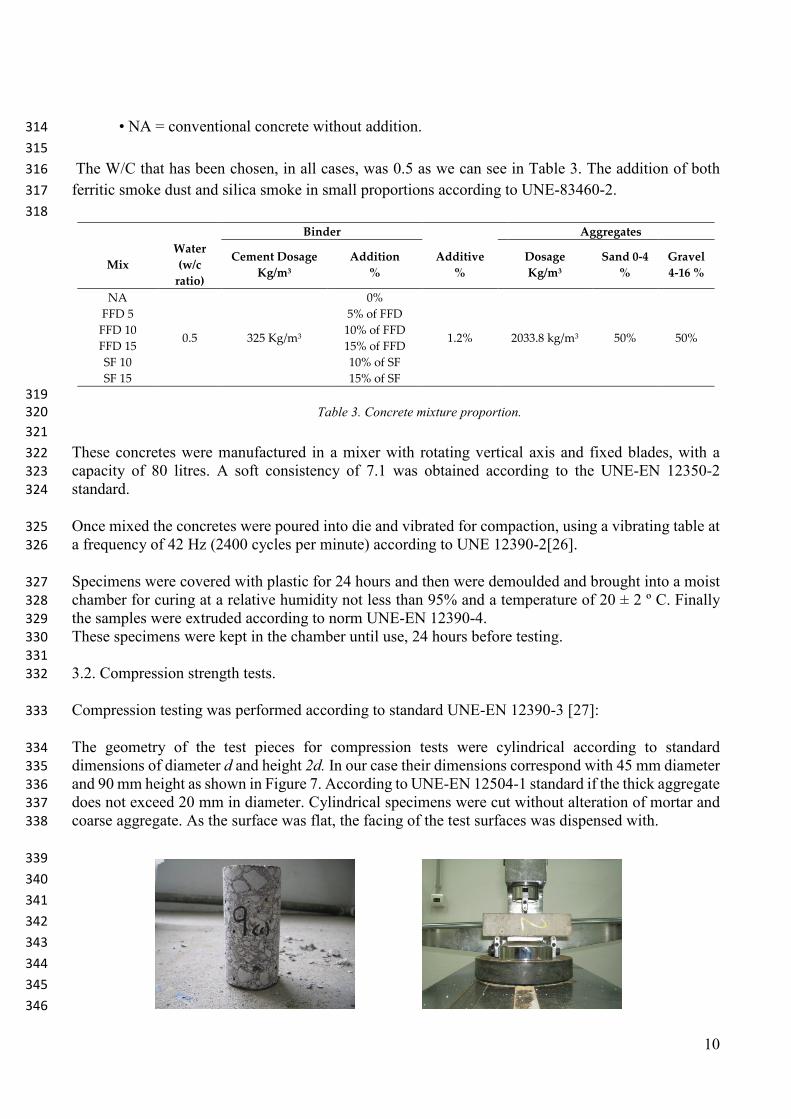
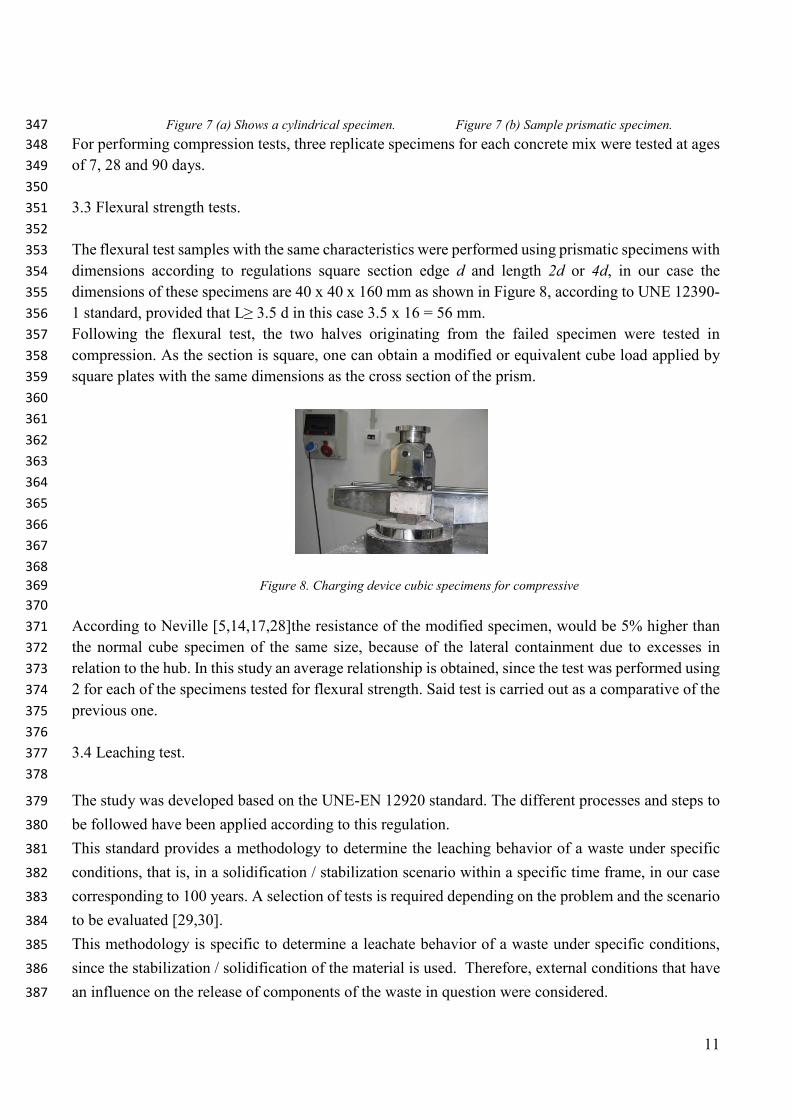
The geometry of the test pieces for compression tests were cylindrical according to standard 334 dimensions of diameter d and height 2d. In our case their dimensions correspond with 45 mm diameter 335 and 90 mm height as shown in Figure 7. According to UNE-EN 12504-1 standard if the thick aggregate 336 does not exceed 20 mm in diameter. Cylindrical specimens were cut without alteration of mortar and 337 coarse aggregate. As the surface was flat, the facing of the test surfaces was dispensed with. 338
339 340 341 342 343 344 345 346
11
Figure 7 (a) Shows a cylindrical specimen. Figure 7 (b) Sample prismatic specimen. 347 For performing compression tests, three replicate specimens for each concrete mix were tested at ages 348 of 7, 28 and 90 days. 349
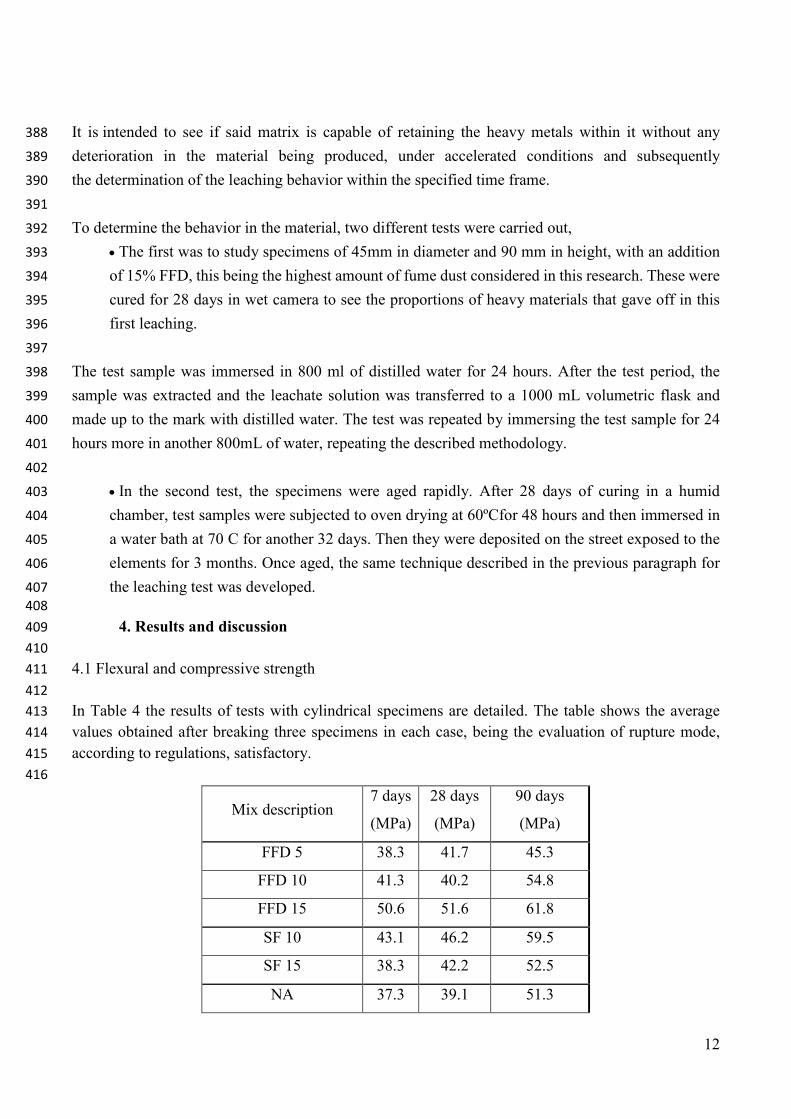
350 3.3 Flexural strength tests. 351 352 The flexural test samples with the same characteristics were performed using prismatic specimens with 353 dimensions according to regulations square section edge d and length 2d or 4d, in our case the 354 dimensions of these specimens are 40 x 40 x 160 mm as shown in Figure 8, according to UNE 12390-355 1 standard, provided that L≥ 3.5 d in this case 3.5 x 16 = 56 mm. 356 Following the flexural test, the two halves originating from the failed specimen were tested in 357 compression. As the section is square, one can obtain a modified or equivalent cube load applied by 358 square plates with the same dimensions as the cross section of the prism. 359
360 361 362 363 364 365 366 367 368
Figure 8. Charging device cubic specimens for compressive 369 370
According to Neville [5,14,17,28]the resistance of the modified specimen, would be 5% higher than 371 the normal cube specimen of the same size, because of the lateral containment due to excesses in 372 relation to the hub. In this study an average relationship is obtained, since the test was performed using 373 2 for each of the specimens tested for flexural strength. Said test is carried out as a comparative of the 374 previous one. 375 376 3.4 Leaching test. 377 378
The study was developed based on the UNE-EN 12920 standard. The different processes and steps to 379
be followed have been applied according to this regulation. 380
This standard provides a methodology to determine the leaching behavior of a waste under specific 381
conditions, that is, in a solidification / stabilization scenario within a specific time frame, in our case 382
corresponding to 100 years. A selection of tests is required depending on the problem and the scenario 383
to be evaluated [29,30]. 384
This methodology is specific to determine a leachate behavior of a waste under specific conditions, 385
since the stabilization / solidification of the material is used. Therefore, external conditions that have 386
an influence on the release of components of the waste in question were considered. 387
12
It is intended to see if said matrix is capable of retaining the heavy metals within it without any 388
deterioration in the material being produced, under accelerated conditions and subsequently 389
the determination of the leaching behavior within the specified time frame. 390
391
To determine the behavior in the material, two different tests were carried out, 392
• The first was to study specimens of 45mm in diameter and 90 mm in height, with an addition 393
of 15% FFD, this being the highest amount of fume dust considered in this research. These were 394
cured for 28 days in wet camera to see the proportions of heavy materials that gave off in this 395
first leaching. 396
397
The test sample was immersed in 800 ml of distilled water for 24 hours. After the test period, the 398
sample was extracted and the leachate solution was transferred to a 1000 mL volumetric flask and 399
made up to the mark with distilled water. The test was repeated by immersing the test sample for 24 400
hours more in another 800mL of water, repeating the described methodology. 401
402
• In the second test, the specimens were aged rapidly. After 28 days of curing in a humid 403
chamber, test samples were subjected to oven drying at 60ºCfor 48 hours and then immersed in 404
a water bath at 70 C for another 32 days. Then they were deposited on the street exposed to the 405
elements for 3 months. Once aged, the same technique described in the previous paragraph for 406
the leaching test was developed. 407 408 4. Results and discussion 409 410
4.1 Flexural and compressive strength 411 412
In Table 4 the results of tests with cylindrical specimens are detailed. The table shows the average 413 values obtained after breaking three specimens in each case, being the evaluation of rupture mode, 414 according to regulations, satisfactory. 415
416
Mix description 7 days
(MPa)
28 days
(MPa)
90 days
(MPa)
FFD 5 38.3 41.7 45.3
FFD 10 41.3 40.2 54.8
FFD 15 50.6 51.6 61.8
SF 10 43.1 46.2 59.5
SF 15 38.3 42.2 52.5
NA 37.3 39.1 51.3
13
417 Table 4. Results of compression tests. 418
419 Following the flexural test, the two halves originating from the tested specimen were tested in 420 compression. Results of flexural strength test at 28 days and compressive strength at 40 days are shown 421 in Table 5 and Table 6 respectively. 422
423 Sample 28 days (MPa)
FFD 5 13.9
FFD 10 12.6
FFD 15 11.1
SF 10 11.9
SF 15 11.1
NA 8.65
424 Table 5 Results of prismatic specimens, flexural tests. 425
426 427
Mixed description(%) Break to 40 days
(MPa)
FFD 5 55.71
FFD 10 54.80
FFD 15 70.25
SF 10 69.87
SF 15 57.54
NA 57.44
428
Table 6. Results of cubic specimens. Compression tests. 429 430
431 In various tests, particularly for cylindrical samples, compressive strength increased with increasing 432 amount of powder of ferritic fume dust in the concrete composition, while the addition of silica fume 433 decreases effect and Kadri referenced by Duval[31,32] . 434
435
14
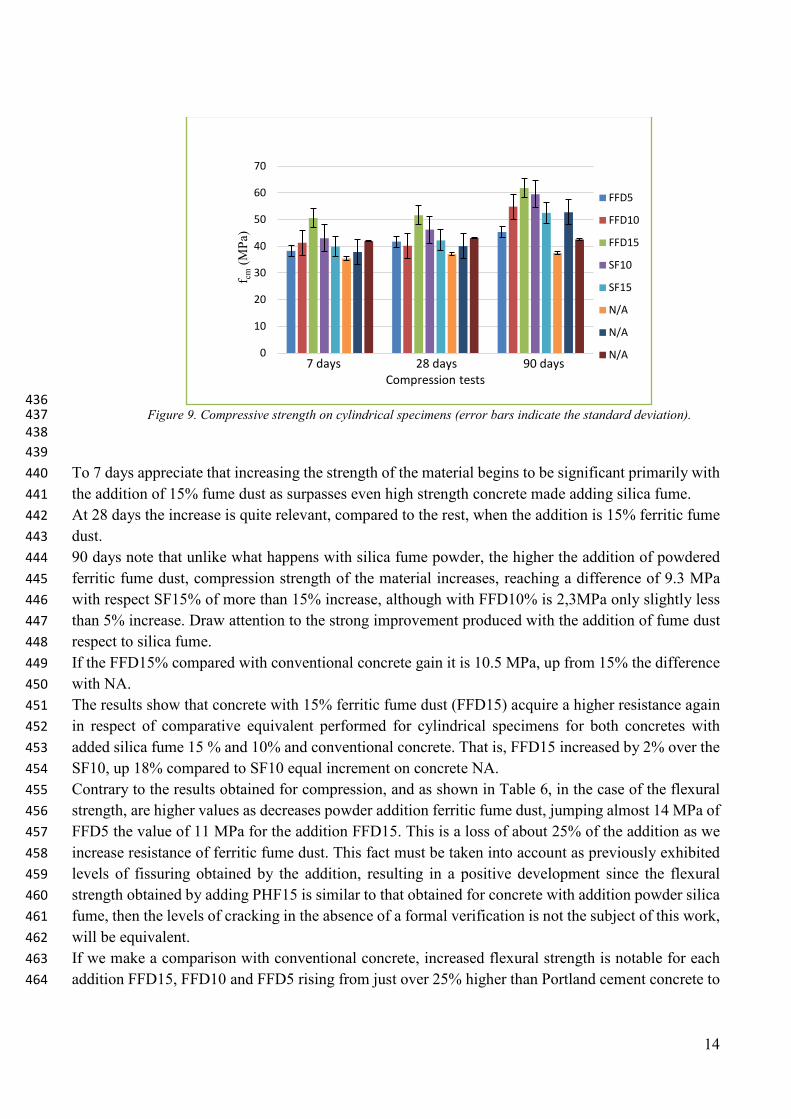
436 Figure 9. Compressive strength on cylindrical specimens (error bars indicate the standard deviation). 437
438 439
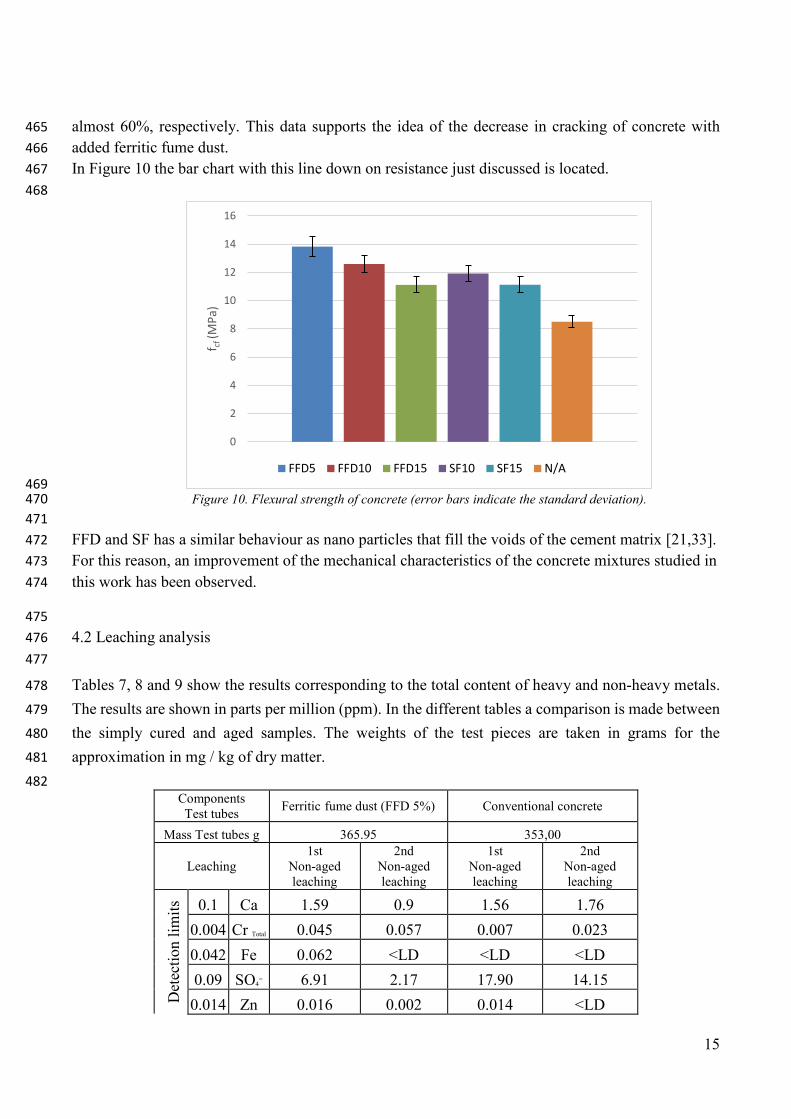
To 7 days appreciate that increasing the strength of the material begins to be significant primarily with 440 the addition of 15% fume dust as surpasses even high strength concrete made adding silica fume. 441 At 28 days the increase is quite relevant, compared to the rest, when the addition is 15% ferritic fume 442 dust. 443 90 days note that unlike what happens with silica fume powder, the higher the addition of powdered 444 ferritic fume dust, compression strength of the material increases, reaching a difference of 9.3 MPa 445 with respect SF15% of more than 15% increase, although with FFD10% is 2,3MPa only slightly less 446 than 5% increase. Draw attention to the strong improvement produced with the addition of fume dust 447 respect to silica fume. 448 If the FFD15% compared with conventional concrete gain it is 10.5 MPa, up from 15% the difference 449 with NA. 450 The results show that concrete with 15% ferritic fume dust (FFD15) acquire a higher resistance again 451 in respect of comparative equivalent performed for cylindrical specimens for both concretes with 452 added silica fume 15 % and 10% and conventional concrete. That is, FFD15 increased by 2% over the 453 SF10, up 18% compared to SF10 equal increment on concrete NA. 454 Contrary to the results obtained for compression, and as shown in Table 6, in the case of the flexural 455 strength, are higher values as decreases powder addition ferritic fume dust, jumping almost 14 MPa of 456 FFD5 the value of 11 MPa for the addition FFD15. This is a loss of about 25% of the addition as we 457 increase resistance of ferritic fume dust. This fact must be taken into account as previously exhibited 458 levels of fissuring obtained by the addition, resulting in a positive development since the flexural 459 strength obtained by adding PHF15 is similar to that obtained for concrete with addition powder silica 460 fume, then the levels of cracking in the absence of a formal verification is not the subject of this work, 461 will be equivalent. 462 If we make a comparison with conventional concrete, increased flexural strength is notable for each 463 addition FFD15, FFD10 and FFD5 rising from just over 25% higher than Portland cement concrete to 464
0
10
20
30
40
50
60
70
f cm(M
Pa)
7 days 28 days 90 daysCompression tests
FFD5
FFD10
FFD15
SF10
SF15
N/A
N/A
N/A
15
almost 60%, respectively. This data supports the idea of the decrease in cracking of concrete with 465 added ferritic fume dust. 466 In Figure 10 the bar chart with this line down on resistance just discussed is located. 467
468
469 Figure 10. Flexural strength of concrete (error bars indicate the standard deviation). 470
471 FFD and SF has a similar behaviour as nano particles that fill the voids of the cement matrix [21,33]. 472 For this reason, an improvement of the mechanical characteristics of the concrete mixtures studied in 473 this work has been observed. 474
475 4.2 Leaching analysis 476
477
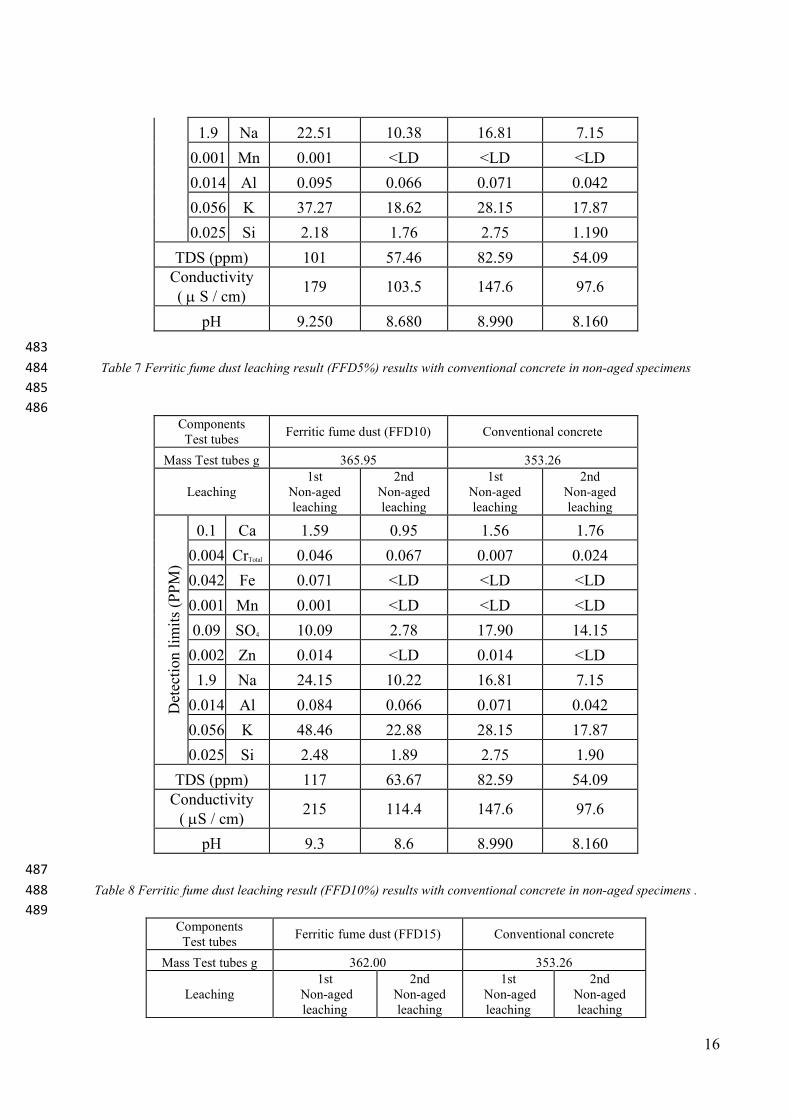
Tables 7, 8 and 9 show the results corresponding to the total content of heavy and non-heavy metals. 478
The results are shown in parts per million (ppm). In the different tables a comparison is made between 479
the simply cured and aged samples. The weights of the test pieces are taken in grams for the 480
approximation in mg / kg of dry matter. 481
482 Components Test tubes Ferritic fume dust (FFD 5%) Conventional concrete
Mass Test tubes g 365.95 353,00
Leaching 1st
Non-aged leaching
2nd Non-aged leaching
1st Non-aged leaching
2nd Non-aged leaching
Det
ectio
n lim
its
0.1 Ca 1.59 0.9 1.56 1.76 0.004 Cr Total 0.045 0.057 0.007 0.023 0.042 Fe 0.062 <LD <LD <LD 0.09 SO4
= 6.91 2.17 17.90 14.15 0.014 Zn 0.016 0.002 0.014 <LD
0
2
4
6
8
10
12
14
16f cf
(MPa
)
FFD5 FFD10 FFD15 SF10 SF15 N/A
16
1.9 Na 22.51 10.38 16.81 7.15 0.001 Mn 0.001 <LD <LD <LD 0.014 Al 0.095 0.066 0.071 0.042 0.056 K 37.27 18.62 28.15 17.87 0.025 Si 2.18 1.76 2.75 1.190
TDS (ppm) 101 57.46 82.59 54.09 Conductivity ( µ S / cm) 179 103.5 147.6 97.6
pH 9.250 8.680 8.990 8.160 483
Table 7 Ferritic fume dust leaching result (FFD5%) results with conventional concrete in non-aged specimens 484 485 486
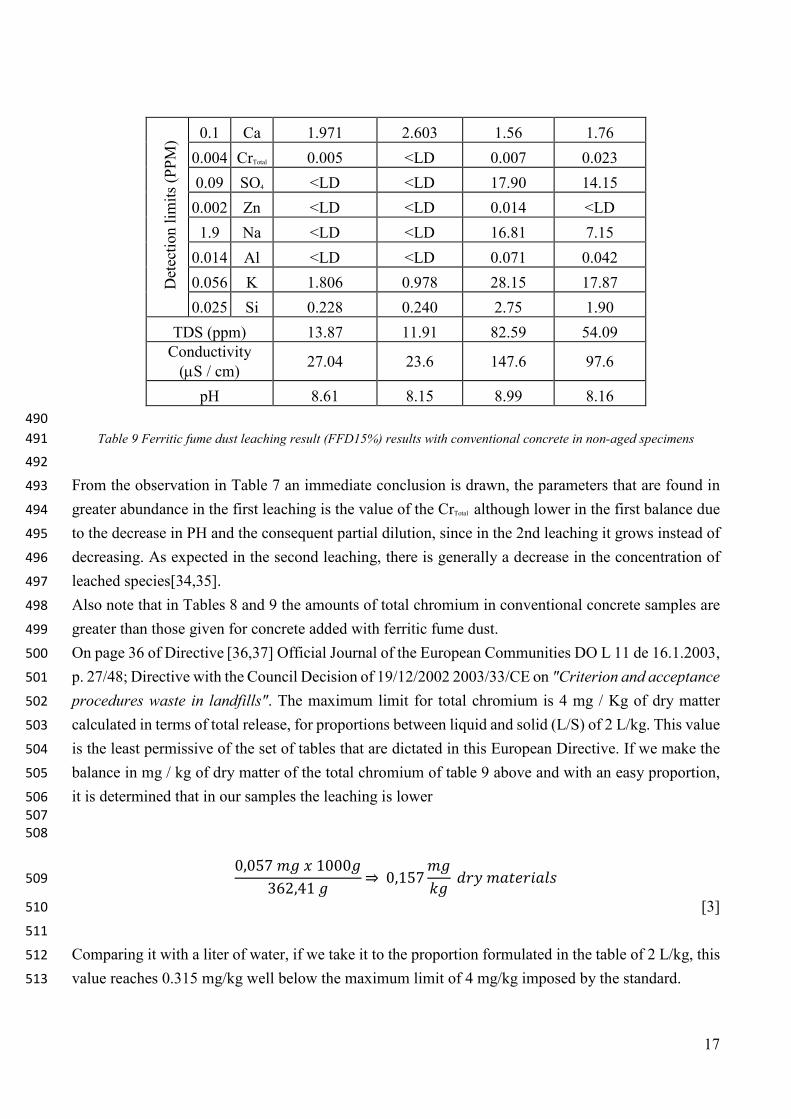
Components Test tubes Ferritic fume dust (FFD10) Conventional concrete
Mass Test tubes g 365.95 353.26
Leaching 1st
Non-aged leaching
2nd Non-aged leaching
1st Non-aged leaching
2nd Non-aged leaching
Det
ectio
n lim
its (P
PM)
0.1 Ca 1.59 0.95 1.56 1.76 0.004 CrTotal 0.046 0.067 0.007 0.024 0.042 Fe 0.071 <LD <LD <LD 0.001 Mn 0.001 <LD <LD <LD 0.09 SO4 10.09 2.78 17.90 14.15 0.002 Zn 0.014 <LD 0.014 <LD 1.9 Na 24.15 10.22 16.81 7.15
0.014 Al 0.084 0.066 0.071 0.042 0.056 K 48.46 22.88 28.15 17.87 0.025 Si 2.48 1.89 2.75 1.90
TDS (ppm) 117 63.67 82.59 54.09 Conductivity
( µS / cm) 215 114.4 147.6 97.6
pH 9.3 8.6 8.990 8.160 487
Table 8 Ferritic fume dust leaching result (FFD10%) results with conventional concrete in non-aged specimens . 488 489
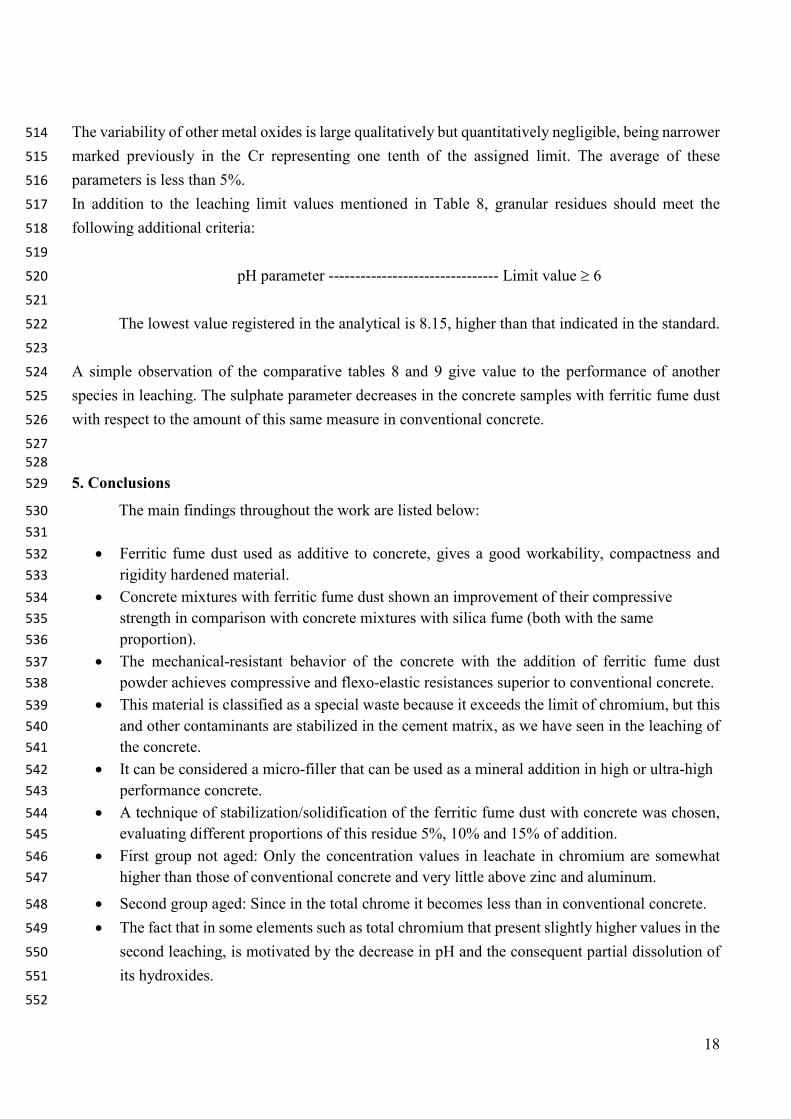
Components Test tubes Ferritic fume dust (FFD15) Conventional concrete
Mass Test tubes g 362.00 353.26
Leaching 1st
Non-aged leaching
2nd Non-aged leaching
1st Non-aged leaching
2nd Non-aged leaching
17
Det
ectio
n lim
its (P
PM) 0.1 Ca 1.971 2.603 1.56 1.76
0.004 CrTotal 0.005 <LD 0.007 0.023 0.09 SO4 <LD <LD 17.90 14.15 0.002 Zn <LD <LD 0.014 <LD 1.9 Na <LD <LD 16.81 7.15
0.014 Al <LD <LD 0.071 0.042 0.056 K 1.806 0.978 28.15 17.87 0.025 Si 0.228 0.240 2.75 1.90
TDS (ppm) 13.87 11.91 82.59 54.09 Conductivity
(µS / cm) 27.04 23.6 147.6 97.6
pH 8.61 8.15 8.99 8.16 490
Table 9 Ferritic fume dust leaching result (FFD15%) results with conventional concrete in non-aged specimens 491
492
From the observation in Table 7 an immediate conclusion is drawn, the parameters that are found in 493
greater abundance in the first leaching is the value of the CrTotal although lower in the first balance due 494
to the decrease in PH and the consequent partial dilution, since in the 2nd leaching it grows instead of 495
decreasing. As expected in the second leaching, there is generally a decrease in the concentration of 496
leached species[34,35]. 497
Also note that in Tables 8 and 9 the amounts of total chromium in conventional concrete samples are 498
greater than those given for concrete added with ferritic fume dust. 499
On page 36 of Directive [36,37] Official Journal of the European Communities DO L 11 de 16.1.2003, 500
p. 27/48; Directive with the Council Decision of 19/12/2002 2003/33/CE on "Criterion and acceptance 501
procedures waste in landfills". The maximum limit for total chromium is 4 mg / Kg of dry matter 502
calculated in terms of total release, for proportions between liquid and solid (L/S) of 2 L/kg. This value 503
is the least permissive of the set of tables that are dictated in this European Directive. If we make the 504
balance in mg / kg of dry matter of the total chromium of table 9 above and with an easy proportion, 505
it is determined that in our samples the leaching is lower 506 507
508
0,057 𝑚𝑚𝑚𝑚 𝑥𝑥 1000𝑚𝑚362,41 𝑚𝑚
⇒ 0,157𝑚𝑚𝑚𝑚𝑘𝑘𝑚𝑚
𝑑𝑑𝑑𝑑𝑑𝑑 𝑚𝑚𝑚𝑚𝑚𝑚𝑚𝑚𝑑𝑑𝑚𝑚𝑚𝑚𝑚𝑚𝑚𝑚 509
[3] 510
511
Comparing it with a liter of water, if we take it to the proportion formulated in the table of 2 L/kg, this 512
value reaches 0.315 mg/kg well below the maximum limit of 4 mg/kg imposed by the standard. 513
18
The variability of other metal oxides is large qualitatively but quantitatively negligible, being narrower 514
marked previously in the Cr representing one tenth of the assigned limit. The average of these 515
parameters is less than 5%. 516
In addition to the leaching limit values mentioned in Table 8, granular residues should meet the 517
following additional criteria: 518
519
pH parameter -------------------------------- Limit value ≥ 6 520
521
The lowest value registered in the analytical is 8.15, higher than that indicated in the standard. 522
523
A simple observation of the comparative tables 8 and 9 give value to the performance of another 524
species in leaching. The sulphate parameter decreases in the concrete samples with ferritic fume dust 525
with respect to the amount of this same measure in conventional concrete. 526
527 528
5. Conclusions 529
The main findings throughout the work are listed below: 530 531
• Ferritic fume dust used as additive to concrete, gives a good workability, compactness and 532 rigidity hardened material. 533
• Concrete mixtures with ferritic fume dust shown an improvement of their compressive 534 strength in comparison with concrete mixtures with silica fume (both with the same 535 proportion). 536
• The mechanical-resistant behavior of the concrete with the addition of ferritic fume dust 537 powder achieves compressive and flexo-elastic resistances superior to conventional concrete. 538
• This material is classified as a special waste because it exceeds the limit of chromium, but this 539 and other contaminants are stabilized in the cement matrix, as we have seen in the leaching of 540 the concrete. 541
• It can be considered a micro-filler that can be used as a mineral addition in high or ultra-high 542 performance concrete. 543
• A technique of stabilization/solidification of the ferritic fume dust with concrete was chosen, 544 evaluating different proportions of this residue 5%, 10% and 15% of addition. 545
• First group not aged: Only the concentration values in leachate in chromium are somewhat 546 higher than those of conventional concrete and very little above zinc and aluminum. 547
• Second group aged: Since in the total chrome it becomes less than in conventional concrete. 548
• The fact that in some elements such as total chromium that present slightly higher values in the 549
second leaching, is motivated by the decrease in pH and the consequent partial dissolution of 550
its hydroxides. 551
552
19
553
Author Contributions: all the authors participated in the planning and execution of the tests, and 554
analyzed the results; M.D.R.-C.,S.B, F.P.-G. and M.E.P.-R. performed the experiments. 555
556
Acknowledgements: The authors acknowledge to Acerinox S.A, Mª José Guio and Carmen 557
Janeiro for his contribution to this research. 558 559
Conflicts of Interest: The authors declare no conflict of interest. 560
Declaration statement: The data that support the findings of this study are available from the 561
corresponding author upon reasonable request. 562
563
564
Bibliography 565
566 [1] Instituto Nacional de Estadistica. (Spanish Statistical Office), (n.d.). https://www.ine.es/ 567
(accessed November 29, 2018). 568 [2] H.A. Colorado, E. Garcia, M.F. Buchely, White Ordinary Portland Cement blended with 569
superfine steel dust with high zinc oxide contents, Constr. Build. Mater. 112 (2016) 816–824. 570 doi:10.1016/j.conbuildmat.2016.02.201. 571
[3] M. Da, S. Magalhães, F. Faleschini, C. Pellegrino, K. Brunelli, Cementing efficiency of 572 electric arc furnace dust in mortars, (2017). doi:10.1016/j.conbuildmat.2017.09.074. 573
[4] A.Herrero; M.A. Parrón, Proceso de obtención de metal a partir de los óxidos metálicos 574 producidos durante la fabricación de aceros inoxidables, An. Ing. Mec. (2000). 575
[5] J. GMS Machado, F. Andrade Brehm, C. Alberto Mendes Moraes, C. Alberto dos Santos, A. 576 Cezar Faria Vilela, J. Batista Marimon da Cunha, Chemical, physical, structural and 577 morphological characterization of the electric arc furnace dust, J. Hazard. Mater. 136 (2006) 578 953–960. doi:10.1016/j.jhazmat.2006.01.044. 579
[6] F. Andrade Brehm, C. Alberto Mendes Moraes, R. Célia Espinosa Modolo, A. Cezar Faria 580 Vilela, D. Carpena Coitinho Dal Molin, Oxide zinc addition in cement paste aiming electric 581 arc furnace dust (EAFD) recycling, Constr. Build. Mater. 139 (2017) 172–182. 582 doi:10.1016/j.conbuildmat.2017.02.026. 583
[7] C.F. Pereira, Y.L. Galiano, M.A. Rodríguez-Piñero, J.V. Parapar, Long and short-term 584 performance of a stabilized/solidified electric arc furnace dust, J. Hazard. Mater. 148 (2007) 585 701–707. doi:10.1016/j.jhazmat.2007.03.034. 586
[8] C. Pellegrino, V. Gaddo, Mechanical and durability characteristics of concrete containing 587 EAF slag as aggregate, Cem. Concr. Compos. 31 (2009) 663–671. 588 doi:10.1016/j.cemconcomp.2009.05.006. 589
[9] M. Maslehuddin, F.R. Awan, M. Shameem, M. Ibrahim, M.R. Ali, Effect of electric arc 590 furnace dust on the properties of OPC and blended cement concretes, (2011). 591 doi:10.1016/j.conbuildmat.2010.06.024. 592
[10] G. Laforest, J. Duchesne, Stabilization of electric arc furnace dust by the use of cementitious 593 materials: Ionic competition and long-term leachability, (2006). 594
20
doi:10.1016/j.cemconres.2006.05.012. 595 [11] M. Parron-Rubio, F. Perez-García, A. Gonzalez-Herrera, M. Rubio-Cintas, M.E. Parron-596
Rubio, F. Perez-García, A. Gonzalez-Herrera, M.D. Rubio-Cintas, Concrete Properties 597 Comparison When Substituting a 25% Cement with Slag from Different Provenances, 598 Materials (Basel). 11 (2018) 1029. doi:10.3390/ma11061029. 599
[12] M.D. Rubio-Cintas, F. Parrón-Vera, M.A, Contreras-Villar, Method for producing cinder 600 concretee, n.d. ES20130000758 20130803. 3 June 2015. 601
[13] L. Coppola, A. Buoso, D. Coffetti, P. Kara, S. Lorenzi, Electric arc furnace granulated slag for 602 sustainable concrete, Constr. Build. Mater. 123 (2016) 115–119. 603 doi:10.1016/j.conbuildmat.2016.06.142. 604
[14] I. Arribas, A. Santamaría, E. Ruiz, V. Ortega-López, J.M. Manso, Electric arc furnace slag 605 and its use in hydraulic concrete, (2015). doi:10.1016/j.conbuildmat.2015.05.003. 606
[15] F. Faleschini, M. Alejandro Fernández-Ruíz, M.A. Zanini, K. Brunelli, C. Pellegrino, E. 607 Hernández-Montes, High performance concrete with electric arc furnace slag as aggregate: 608 Mechanical and durability properties, Constr. Build. Mater. 101 (2015) 113–121. 609 doi:10.1016/j.conbuildmat.2015.10.022. 610
[16] G. Salihoglu, V. Pinarli, N.K. Salihoglu, G. Karaca, Properties of steel foundry electric arc 611 furnace dust solidified/stabilized with Portland cement, J. Environ. Manage. 85 (2007) 190–612 197. doi:10.1016/j.jenvman.2006.09.004. 613
[17] D. De Domenico, F. Faleschini, C. Pellegrino, G. Ricciardi, Structural behavior of RC beams 614 containing EAF slag as recycled aggregate: Numerical versus experimental results, Constr. 615 Build. Mater. 171 (2018) 321–337. doi:10.1016/j.conbuildmat.2018.03.128. 616
[18] G. Adegoloye, A.-L. Beaucour, S. Ortola, A. Noumowe, Mineralogical composition of EAF 617 slag and stabilised AOD slag aggregates and dimensional stability of slag aggregate concretes, 618 (2016). doi:10.1016/j.conbuildmat.2016.04.036. 619
[19] N. Waijarean, S. Asavapisit, K. Sombatsompop, Strength and microstructure of water 620 treatment residue-based geopolymers containing heavy metals, Constr. Build. Mater. 50 621 (2014) 486–491. doi:10.1016/j.conbuildmat.2013.08.047. 622
[20] A.-G. Guézennec, J.-C. Huber, F. Patisson, P. Sessiecq, J.-P. Birat, D. Ablitzer, Dust 623 formation in Electric Arc Furnace: Birth of the particles, (2005). 624 doi:10.1016/j.powtec.2005.05.006. 625
[21] M.S. Amin, S.M.A. El-Gamal, F.S. Hashem, Effect of addition of nano-magnetite on the 626 hydration characteristics of hardened Portland cement and high slag cement pastes, J. Therm. 627 Anal. Calorim. 112 (2013) 1253–1259. doi:10.1007/s10973-012-2663-1. 628
[22] Ky. Kirichenko, V. Drozd, V. Chaika, A. Gridasov, A. Kholodov, K. Golokhvast, Nano- and 629 Microparticles in Welding Aerosol: Granulometric Analysis, Phys. Procedia. 86 (2017) 50–53. 630 doi:10.1016/j.phpro.2017.01.017. 631
[23] X. Lin, Z. Peng, J. Yan, Z. Li, J.-Y. Hwang, Y. Zhang, G. Li, T. Jiang, Pyrometallurgical 632 recycling of electric arc furnace dust, (2017). doi:10.1016/j.jclepro.2017.02.128. 633
[24] C.F. Pereira, M. Rodríguez-Piñero, J. Vale, Solidification/stabilization of electric arc furnace 634 dust using coal fly ash Analysis of the stabilization process, 2001. 635
[25] C. Fernández Pereira, Y. Luna, X. Querol, D. Antenucci, J. Vale, Waste 636 stabilization/solidification of an electric arc furnace dust using fly ash-based geopolymers, 637 Fuel. 88 (2008) 1185–1193. doi:10.1016/j.fuel.2008.01.021. 638
[26] F. Montagnaro, L. Santoro, Reuse of coal combustion ashes as dyes and heavy metal 639 adsorbents: Effect of sieving and demineralization on waste properties and adsorption 640 capacity, Chem. Eng. J. 150 (2009) 174–180. doi:10.1016/j.cej.2008.12.022. 641
[27] C. Atiş, F. Özcan, A. Kılıc, O. Karahan, … C.B.-B. and, undefined 2005, Influence of dry and 642 wet curing conditions on compressive strength of silica fume concrete, Elsevier. (n.d.). 643
21
[28] A.M. Neville, Properties of concrete, 4th and final edition. Harlow, Essex : Longman, 1995. 644 [29] P. Balfi~, Influence of solid state properties on ferric chloride leaching of mechanically 645
activated galena, 1996. 646 [30] D. Xia, C. Pickles, Microwave caustic leaching of electric arc furnace dust, Miner. 647
Engmeering. 13 (n.d.) 79–94. 648 [31] R. Duval, E.H. Kadri, Influencia of silica fume on the workability and the compressive 649
strength of high-performance concretes, 1998. 650 [32] H. Toutanji, N. Delatte, S. Aggoun, R. Duval, A. Danson, Effect of supplementary 651
cementitious materials on the compressive strength and durability of short-term cured 652 concrete, (n.d.). doi:10.1016/j.cemconres.2003.08.017. 653
[33] Y. Reches, Nanoparticles as concrete additives: Review and perspectives, Constr. Build. 654 Mater. 175 (2018) 483–495. doi:10.1016/j.conbuildmat.2018.04.214. 655
[34] P.E. Tsakiridis, P. Oustadakis, A. Katsiapi, S. Agatzini-Leonardou, Hydrometallurgical 656 process for zinc recovery from electric arc furnace dust (EAFD). Part II: Downstream 657 processing and zinc recovery by electrowinning, J. Hazard. Mater. 179 (2010) 8–14. 658 doi:10.1016/j.jhazmat.2010.04.004. 659
[35] P. Xanthopoulos, S. Agatzini-Leonardou, P. Oustadakis, P.E. Tsakiridis, Zinc recovery from 660 purified electric arc furnace dust leach liquors by chemical precipitation, J. Environ. Chem. 661 Eng. 5 (2017) 3550–3559. doi:10.1016/j.jece.2017.07.023. 662
[36] S. Donatello, M. Tyrer, C.R. Cheeseman, Recent developments in macro-defect-free (MDF) 663 cements, Constr. Build. Mater. 23 (2008) 1761–1767. doi:10.1016/j.conbuildmat.2008.09.001. 664
[37] Q. Wang, P. Yan, J. Yang, B. Zhang, Influence of steel slag on mechanical properties and 665 durability of concrete, Constr. Build. Mater. 47 (2013) 1414–1420. 666 doi:10.1016/j.conbuildmat.2013.06.044. 667
668