Shear Strength Model for Lightly Reinforced Concrete Columns
12
Shear Strength Model for Lightly Reinforced Concrete Columns Halil Sezen, M.ASCE, 1 and Jack P. Moehle, M.ASCE 2 Abstract: Parameters affecting the shear strength of reinforced concrete columns having a rectangular cross section and light transverse reinforcement are investigated using data from numerous column tests. A new model is proposed to predict the column shear strength based on theoretical formulations and experimental evidence. The proposed shear strength equation includes contributions from the concrete and transverse reinforcement. Primary parameters in the shear strength model are the column cross-sectional dimensions, concrete compressive strength, column aspect ratio, axial load, and displacement ductility demand. The proposed model is compared with other shear strength models using the available column test data and is shown to result in improved accuracy. A conservative shear strength model for use in design and assessment is proposed based on statistical evaluation of computed and actual shear strengths. DOI: 10.1061/(ASCE)0733-9445(2004)130:11(1692) CE Database subject headings: Shear strength; Concrete reinforced; Concrete columns; Transverse shear; Shear resistance; Earth- quake engineering; Earthquake damage; Buildings. Introduction Postearthquake reconnaissance and experimental research indi- cate that existing building columns with light and inadequately detailed transverse reinforcement are vulnerable to shear failure during earthquakes. Shear failure can lead to reduction in building lateral strength, change in inelastic deformation mechanism, loss of axial load-carrying capacity, and ultimately, building collapse. Recognizing the risk posed by column shear failure, engineers evaluating existing buildings or designing new buildings for seis- mic effects aim explicitly to avoid column shear failure (FEMA 273 1997; ACI 318 2002). Engineering models for column shear strength that include un- certainty measures are needed so that safe yet efficient evalua- tions and designs can be achieved. For evaluating older existing reinforced concrete buildings, models are needed that are sensi- tive to the details that are prevalent in those buildings. Of particu- lar interest in the study reported here is the shear strength under cyclic loading of columns with light and inadequately detailed transverse reinforcement. Such columns were prevalent in build- ings constructed prior to the mid-1970s in the seismically active west coast of the United States. This paper describes the characteristic details of columns in older existing reinforced concrete buildings and presents observa- tions on their performance in past earthquakes. Some shear strength models are presented, including a new model proposed as part of this work. Development of the proposed new model is guided by examination of test results from several sources, which allowed identification of key parameters that affect shear strength. The capacity of the various models to represent shear strength of older existing building columns is judged based on comparison with the experimental data, and recommendations are made for application in seismic evaluation of existing buildings. Column Configurations The adoption of the 1976 Uniform Building Code (ICBO 1976) resulted in important changes in the design and construction of reinforced concrete buildings in the seismically active western United States. The provisions of that code included new require- ments for column shear strength and column transverse reinforce- ment detailing aimed at reducing the likelihood of column shear failure during earthquakes. Buildings constructed prior to the adoption of that code, as well as many more recent buildings constructed in regions of lower seismicity and not subject to the ductile design provisions of that code, may contain columns whose proportions and details do not meet the more stringent seismic design requirements of the 1976 Uniform Building Code and later codes. Such older existing building columns may be susceptible to failure with relatively low ductility. Lynn (2001) reported a study of older existing building col- umns from the western United States. Lynn found a wide range of column proportions and details, with typical details including both 90 and 135° hooks at the end of column ties; hook exten- sions usually shorter than the lengths specified in current codes; 10--mm- or smaller-diameter column ties spaced at 250 mm or wider over the midheight of the column, with smaller spacing sometimes used near column ends; longitudinal reinforcement ra- tios ranging from 0.5 to 4.5%; longitudinal reinforcement lap splices just above the floor level with lengths ranging from 20 to 30 times the longitudinal bar diameter, d b ; specified concrete compressive strength of about 20 MPa; and specified yield 1 Assistant Professor, Dept. of Civil and Environmental Engineering and Geodetic Science, The Ohio State Univ, 470 Hitchcock Hall, 2070 Neil Ave., Columbus, OH 43210. 2 Professor and Director, Pacific Earthquake Engineering Research Center, Univ. of California, Berkeley, 1301 South 46th St., Richmond, CA 94804-4698. Note. Associate Editor: Yan Xiao. Discussion open until April 1, 2005. Separate discussions must be submitted for individual papers. To extend the closing date by one month, a written request must be filed with the ASCE Managing Editor. The manuscript for this paper was submitted for review and possible publication on July 31, 2003; approved on January 5, 2004. This paper is part of the Journal of Structural Engi- neering, Vol. 130, No. 11, November 1, 2004. ©ASCE, ISSN 0733-9445/ 2004/11-1692–1703/$18.00. 1692 / JOURNAL OF STRUCTURAL ENGINEERING © ASCE / NOVEMBER 2004
Transcript of Shear Strength Model for Lightly Reinforced Concrete Columns

t transversear strengths from thedimensions,pared with
ative shearstrengths.
ce; Earth-
Shear Strength Model for Lightly Reinforced ConcreteColumns
Halil Sezen, M.ASCE,1 and Jack P. Moehle, M.ASCE2
Abstract:Parameters affecting the shear strength of reinforced concrete columns having a rectangular cross section and lighreinforcement are investigated using data from numerous column tests. A new model is proposed to predict the column shebased on theoretical formulations and experimental evidence. The proposed shear strength equation includes contributionconcrete and transverse reinforcement. Primary parameters in the shear strength model are the column cross-sectionalconcrete compressive strength, column aspect ratio, axial load, and displacement ductility demand. The proposed model is comother shear strength models using the available column test data and is shown to result in improved accuracy. A conservstrength model for use in design and assessment is proposed based on statistical evaluation of computed and actual shear
DOI: 10.1061/(ASCE)0733-9445(2004)130:11(1692)
CE Database subject headings: Shear strength; Concrete reinforced; Concrete columns; Transverse shear; Shear resistanquake engineering; Earthquake damage; Buildings.
h indtelyailureilding, lossse.eerseis-
un-valuaistingsensiticu-underileduild-
ctive
ns inerva-
shearposedel ishich
ngth.gth ofrisone for
on ofternuire-force-hear
theingsthe
mnsgentodey be
ol-ge ofing
xten-odes;m oringnt ra-lap0 toe
ring2070
earchond,
l 1,rs. Tod withittedon
45/
Introduction
Postearthquake reconnaissance and experimental researccate that existing building columns with light and inadequadetailed transverse reinforcement are vulnerable to shear fduring earthquakes. Shear failure can lead to reduction in bulateral strength, change in inelastic deformation mechanismof axial load-carrying capacity, and ultimately, building collapRecognizing the risk posed by column shear failure, enginevaluating existing buildings or designing new buildings for smic effects aim explicitly to avoid column shear failure(FEMA273 1997; ACI 318 2002).
Engineering models for column shear strength that includecertainty measures are needed so that safe yet efficient etions and designs can be achieved. For evaluating older exreinforced concrete buildings, models are needed that aretive to the details that are prevalent in those buildings. Of parlar interest in the study reported here is the shear strengthcyclic loading of columns with light and inadequately detatransverse reinforcement. Such columns were prevalent in bings constructed prior to the mid-1970s in the seismically awest coast of the United States.
This paper describes the characteristic details of columolder existing reinforced concrete buildings and presents obs
1Assistant Professor, Dept. of Civil and Environmental Engineeand Geodetic Science, The Ohio State Univ, 470 Hitchcock Hall,Neil Ave., Columbus, OH 43210.
2Professor and Director, Pacific Earthquake Engineering ResCenter, Univ. of California, Berkeley, 1301 South 46th St., RichmCA 94804-4698.
Note. Associate Editor: Yan Xiao. Discussion open until Apri2005. Separate discussions must be submitted for individual papeextend the closing date by one month, a written request must be filethe ASCE Managing Editor. The manuscript for this paper was submfor review and possible publication on July 31, 2003; approvedJanuary 5, 2004. This paper is part of theJournal of Structural Engi-neering, Vol. 130, No. 11, November 1, 2004. ©ASCE, ISSN 0733-94
2004/11-1692–1703/$18.00.1692 / JOURNAL OF STRUCTURAL ENGINEERING © ASCE / NOVEMBER
i-
-
-
tions on their performance in past earthquakes. Somestrength models are presented, including a new model proas part of this work. Development of the proposed new modguided by examination of test results from several sources, wallowed identification of key parameters that affect shear streThe capacity of the various models to represent shear strenolder existing building columns is judged based on compawith the experimental data, and recommendations are madapplication in seismic evaluation of existing buildings.
Column Configurations
The adoption of the 1976 Uniform Building Code(ICBO 1976)resulted in important changes in the design and constructireinforced concrete buildings in the seismically active wesUnited States. The provisions of that code included new reqments for column shear strength and column transverse reinment detailing aimed at reducing the likelihood of column sfailure during earthquakes. Buildings constructed prior toadoption of that code, as well as many more recent buildconstructed in regions of lower seismicity and not subject toductile design provisions of that code, may contain coluwhose proportions and details do not meet the more strinseismic design requirements of the 1976 Uniform Building Cand later codes. Such older existing building columns masusceptible to failure with relatively low ductility.
Lynn (2001) reported a study of older existing building cumns from the western United States. Lynn found a wide rancolumn proportions and details, with typical details includboth 90 and 135° hooks at the end of column ties; hook esions usually shorter than the lengths specified in current c10--mm- or smaller-diameter column ties spaced at 250 mwider over the midheight of the column, with smaller spacsometimes used near column ends; longitudinal reinforcemetios ranging from 0.5 to 4.5%; longitudinal reinforcementsplices just above the floor level with lengths ranging from 230 times the longitudinal bar diameter,db; specified concret
compressive strength of about 20 MPa; and specified yield2004

500
ofFig.al collding
d todingstem
am-ple,
havetheloaddis-nder
strength of steel reinforcement varying between 200 andMPa. Fig. 1 illustrates some typical details.
Observed Earthquake Performance
The literature on postearthquake reconnaissance(e.g., Moehleand Mahin 1991, Sezen et al. 2003) contains many examplesfailures of concrete building columns with inadequate details.2 shows apparent bond and shear damage to one of severumns in a 1965 vintage, seven-story reinforced concrete bui
Fig. 1. Typical lightly reinfor
Fig. 2. Column failures in a hotel bu
JOURNAL O
-
in Van Nuys, Calif. Although the columns apparently continuecarry axial loads, concerns over safety of this existing builled not only to repairs but also to a complete structural syretrofit following the earthquake.
Fig. 3 shows an example of more severe building column dage during the 1999 Kocaeli, Turkey earthquake. For examthe column damage and loss of axial-load-carrying capacityresulted in significant column shortening. The stability ofbuilding at this point depends on both the residual axial-strength of the column and the capacity of the building to retribute internal actions to adjacent building components. U
lumn and cross-section details
in the 1994 Northridge, Calif. earthquake
ced co
ilding
F STRUCTURAL ENGINEERING © ASCE / NOVEMBER 2004 / 1693

, col-or the
sheaad-i968;and
1975;laraviorate
shearge to
h and
thethe
epth
ent1
hearngthanti-H18,r the
an be
test-ss attf
s, re-inuedca-
from
bond-likecol-nd offorce-cling
ngthsr thelatedtingd byredmo-likelyuredshearf ad-
r theuredot ofcross-
ade.of
ear-
ly in-
inalearhas
ratiotos-
ent.
pre-p-
e re-e-ein-vingr-
eeases
ure
more severe loading or with less redundant building systemsumn damage can lead to complete collapse of single storiesentire building.
Observed Laboratory Performance
Numerous experimental studies have examined the seismicstrength and deformability of reinforced columns having inequate and poorly detailed transverse reinforcement(e.g., Esak1996; Kokusho 1964; Kokusho and Fukuhara 1965; Ikeda 1Li et al. 1995; Lynn et al. 1996; Ohue et al. 1985; SaatciogluOzcebe 1989; Umemura and Endo 1970; Wight and SozenYalcin 1997; and Sezen 2002). The cited studies are of particuinterest because they include columns whose inelastic behtends initially to be dominated by flexure but whose ultimfailure and deformation capacity appears to be controlled bymechanisms. Columns such as these pose a difficult challenstructural engineers who must assess the column strengtdeformability under seismic loading.
Table 1 identifies key parameters of 51 test columns frompreviously cited experiments. The included columns satisfyfollowing criteria: column aspect ratio or shear span-to-dratio, 2.0øa/dø4.0; concrete strength, 13ø fc8ø45 MPa; longi-tudinal and transverse reinforcement nominal yield stress,fyl andfy, in the range of 300–650 MPa; longitudinal reinforcemratio, 0.01ørl ø0.04; transverse reinforcement index, 0.0fc8ørwfyø0.12fc8; cyclic lateral load reversals; and apparent sdistress at failure. Columns were tested by shearing a full-lecolumn in double curvature, or by loading one or a double clever in single curvature. Three test specimens, 3SL2SLH18, and 3SMD12 in Table 1 had short lap splices nea
Fig. 3. Loss of axial-load-carrying capacity due to column fail(1999 Kocaeli, Turkey earthquake)
bottom of the column as shown in Fig. 1. Details of the speci-
1694 / JOURNAL OF STRUCTURAL ENGINEERING © ASCE / NOVEMBER
r
mens, test setups, and reported load-deformation relations cfound in Sezen(2002).
Fig. 4 plots the load-deformation relation for a typicalcolumn tested by Sezen(2002). Yielding of the longitudinal reinforcement is evident by a reduction in the lateral load stiffnedrift ratio (lateral displacement divided by column clear heigh) ofaround 0.01(30 mm/2,950 mm). Inclined cracks indicative oshear distress begin to form upon further deformation cyclesulting subsequently in reduced lateral load resistance. Contdeformation cycles can result in loss of vertical-load-carryingpacity as identified in the figure. Fig. 5 shows photographsanother test column near the point of axial-load failure(Sezen2002). The damage pattern includes spalled concrete andsplitting cracks along the longitudinal reinforcement, not unthat seen in the building column in Fig. 2. Importantly, theumn hoops, which were constructed with 90° hooks at the ethe hoops, have opened, suggesting that the transverse reinment effectiveness in resisting shear has degraded with cyloading.
Fig. 6 plots ratios of measured to calculated shear streversus ratios of measured to calculated flexural strengths focolumns in Table 1. Flexural and shear strengths are calcuaccording to the procedures of ACI 318-2002, but substitumeasured material properties for nominal properties specifieACI 319-2002(Sezen 2002) [see Eqs.(1)–(3) for details of sheastrength equations]. Fig. 6 indicates that all columns developflexural moments approaching or exceeding the ACI nominalment strengths, suggesting that inelastic flexural response isto have occurred for most if not all of the columns. The measshear strengths hover about the ACI 318-2002 nominalstrength with considerable scatter; this will be the subject oditional analysis in this paper.
Fig. 7 plots the variation of measured shear strength focolumns in Table 1 as a function of different variables. Measshear strength is normalized by the product of the square rothe measured concrete compressive strength and the grosssectional area of the column. The following key points are m• Fig. 7(a) plots normalized shear strength as a function
P/Agfc8, where P5axial compressive force at time of shfailure; Ag5gross cross-sectional area; andfc85measured concrete compressive strength. Shear strength apparentcreases with increasing axial compression.
• Fig. 7(b) plots normalized shear strength versus longitudreinforcement ratio. Although a trend of increasing shstrength with increasing longitudinal reinforcement ratiobeen reported previously(ASCE-ACI Committee 426 1973) itis not apparent in the data reported here.
• Fig. 7(c) plots normalized shear strength versus aspecta/d, wherea5distance from point of maximum momentpoint of zero moment andd5distance from extreme compresion fiber to centroid of longitudinal tension reinforcemFor columns in the database loaded in contraflexure,a wastaken equal to half the column clear length. As reportedviously (ASCE-ACI Committee 426 1973), shear strength aparently decreases with increasinga/d.
• Fig. 7(d) plots normalized shear strength versus transversinforcement indexrwfy/Îfc8, whererw5transverse reinforcment ratio5Av /bs; Av5cross-sectional area of transverse rforcement oriented parallel to the applied shear and halongitudinal spacings; b5column cross-sectional width pependicular to the applied shear; andfy5yield stress of thtransverse reinforcement. Shear strength apparently incr
with increasing amounts of transverse reinforcement.2004

315
359
301
294
271
267
240
231
316
338
356
378
102
111
103
102
121
112
328
393
430
275
270
268
578
74
77
82
81
58
69
69
71
106
135
83
78
51
58
69
67
Table 1. Dimensions, Material Properties, and Other Details for Specimens Included in the Database
Specimen Referenceb
(mm)d
(mm)a
(mm)s
(mm)rl
(%)rw
(%)fyl
(MPa)fy
(MPa)fc8
(MPa)P
(kN) md
Vtest
(kN)
2CLD12 Sezen(2002)
457 394 1,473 305 2.5 0.17 447 469 21.1 667 2.88
2CHD12 457 394 1,473 305 2.5 0.17 447 469 21.1 2,669 1.29
2CVD12 457 394 1,473 305 2.5 0.17 447 469 20.9 2,224 2.72
2CLD12M 457 394 1,473 305 2.5 0.17 447 469 21.8 667 3.14
3CLH18 Lynnet al.(1996)
457 381 1,473 457 3.0 0.10 335 400 25.6 503 1.58
3SLH18 457 381 1,473 457 3.0 0.10 335 400 25.6 503 1.69
2CLH18 457 381 1,473 457 2.0 0.10 335 400 33.1 503 4.17
2SLH18 457 381 1,473 457 2.0 0.10 335 400 33.1 503 2.65
2CMH18 457 381 1,473 457 2.0 0.10 335 400 25.7 1,512 1.94
3CMH18 457 381 1,473 457 3.0 0.10 335 400 27.6 1,512 2.14
3CMD12 457 381 1,473 305 3.0 0.17 335 400 27.6 1,512 2.50
3SMD12 457 381 1,473 305 3.0 0.17 335 400 25.7 1,512 2.73
2D16RS Ohueet al.(1985)
200 175 400 50 2.0 0.57 376 322 32.1 183 1.74
4D13RS 200 175 400 50 2.7 0.57 377 322 29.9 183 2.42
H-2-1/5 Esaki(1996)
200 175 400 50 2.5 0.52 363 370 23.0 161 4.94
HT-2-1/5 200 175 400 75 2.5 0.52 363 370 20.2 161 4.32
H-2-1/3 200 175 400 40 2.5 0.65 363 370 23.0 269 4.50
HT-2-1/3 200 175 400 60 2.5 0.65 363 370 20.2 236 4.16
U-7 Liet al.(1995)
400 375 1,000 120 2.4 0.47 581 382 29.0 464 4.00
U-8 400 375 1,000 120 2.4 0.52 581 382 33.5 1,072 2.50
U-9 400 375 1,000 120 2.4 0.57 581 382 34.1 1,637 4.00
U1 SaatciogluandOzceb(1989)
350 305 1,000 150 3.3 0.30 430 470 43.6 0 3.12
U2 350 305 1,000 150 3.3 0.30 453 470 30.2 600 2.87
U3 350 305 1,000 75 3.3 0.60 430 470 34.8 600 2.81
BR-S1 Yalcin(1997)
550 482 1,485 300 2.0 0.10 445 425 45.0 1,800 2.88
43 Ikeda(1968)
200 173 500 100 2.0 0.28 434 558 19.6 78 4.13
44 200 173 500 100 2.0 0.28 434 558 19.6 78 2.56
45 200 173 500 100 2.0 0.28 434 558 19.6 156 1.74
46 200 173 500 100 2.0 0.28 434 558 19.6 156 1.26
62 200 173 500 100 2.0 0.28 348 476 19.6 78 5.96
63 200 173 500 100 2.0 0.28 348 476 19.6 156 4.00
64 200 173 500 100 2.0 0.28 348 476 19.6 156 4.82
205 UmemuraandEndo(1970)
200 180 600 100 2.0 0.28 462 324 17.7 156 2.51
207 200 180 400 100 2.0 0.28 462 324 17.7 156 1.60
208 200 180 400 100 2.0 0.28 462 324 17.7 392 2.99
214 200 180 600 200 2.0 0.14 462 324 17.7 392 1.73
220 200 180 400 120 1.0 0.11 379 648 32.9 156 7.83
231 200 180 400 100 1.0 0.13 324 524 14.8 156 8.42
232 200 180 400 100 1.0 0.13 324 524 13.1 156 6.40
233 200 180 400 100 1.0 0.13 372 524 13.9 156 4.50
234 200 180 400 100 1.0 0.13 372 524 13.1 156 5.33
JOURNAL OF STRUCTURAL ENGINEERING © ASCE / NOVEMBER 2004 / 1695

ed totionsable
th re-
erablels forsign ohese,aper,,
ild-
,
n, the
se re-
nsribu--with
entrete
alue.ngths
74
88
110
110
96
97
87
81
95
86
These and other trends in the experimental data will be usdevelop a model for shear strength of columns having condisimilar to those of the columns included in the database of T1. Prior to that development, some models for shear strengported in the literature will be described.
Previous Shear Strength Models
Shear strength of reinforced concrete has received considattention in research during the past century. Several modecolumn shear strength have been proposed and used for denew buildings and assessment of existing buildings. Among tthree existing models are selected for examination in this pthese being from ACI 318(2002) for design of new buildingsfrom FEMA 273(1997) for seismic assessment of existing buings, and from Priestley et al.(1994) for prediction of columnshear strength under seismic loading.
Fig. 4. Lateral load-displacement relations(Specimen 2CLD12 atested by Sezen 2002)
Table 1. (Continued.)
Specimen Referenceb
(mm)d
(mm)a
(mm)s
(mm)
372 Kokusho(1964)
200 170 500 100
373 200 170 500 100
452 KokushoandFukuharo(1965)
200 170 500 100
454 200 170 500 100
40.033a WightandSozen(1995)
152 254 876 127
40.033 152 254 876 127
25.033 152 254 876 127
00.033 152 254 876 127
40.048 152 254 876 89
00.048 152 254 876 89
1696 / JOURNAL OF STRUCTURAL ENGINEERING © ASCE / NOVEMBER
f
ACI 318-2002
According to the ACI 318-2002, the nominal shear strength,Vn, iscalculated as the summation of contributions from concreteVc,and the transverse reinforcement,Vs.
Vn = Vc + Vs s1d
For members subjected to shear and axial compressioconcrete contribution to the shear strength is given by
Vc = 0.166S1P
13.8AgDÎfc8bd sunits: MPad
s2d
Vc = 2S1 +P
2,000AgDÎfc8bd sunits: psid
where all variables are as defined previously. The transverinforcement contribution is calculated as
Vs =Avfyd
ss3d
Priestley et al. (1994)
Priestley et al.(1994) calculated the shear strength of columunder cyclic lateral load as the summation of strength conttions from concrete,Vc, a truss mechanism(effectively, the transverse reinforcement), Vs, and an arch mechanism associatedaxial load,Vp, as follows:
Vn = Vc + Vs + Vp s4d
The concrete component is given by
Vc = kÎfc8s0.8Agd sMPad s5d
in which the parameterk depends on the member displacemductility demand as defined in Fig. 8. As shown, the conccontribution is reduced to as low as one-third of the initial vas the displacement ductility demand reaches larger values
The contribution of transverse reinforcement to shear stre
rw
(%)fyl
(MPa)fy
(MPa)fc8
(MPa)P
(kN) md
Vtest
(kN)
0.31 524 352 19.9 156 4.12
0.31 524 352 20.4 156 2.78
0.31 359 317 21.9 392 2.53
0.31 359 317 21.9 392 2.32
0.33 496 344 34.7 189 4.19
0.33 496 344 33.6 178 3.62
0.33 496 344 33.6 111 2.65
0.33 496 344 32.0 0 3.67
0.48 496 344 26.1 178 3.38
0.48 496 344 25.9 0 2.45
rl
(%)
1.0
2.0
3.0
4.0
2.4
2.4
2.4
2.4
2.4
2.4
is based on a truss mechanism using a 30° angle between the
2004

. Formpo
r be-
tal
l ten-
ed onsub-. The
ate-from
alcu-and.withengthit ising
ment
diagonal compression struts and the column longitudinal axisrectangular-cross-section columns, the truss-mechanism conent is given by
Vs =AvfyD8
scot 30° s6d
in which D85distance measured parallel to the applied sheatween centers of the perimeter hoop.
The arch mechanism contribution is given by
Fig. 5. Column shear failure and associate
Fig. 6. Ratio of measured to calculated shear strength versus mo
JOURNAL O
- Vp =h − c
2aP s7d
in which c5neutral axis depth anda5shear span(distance frommaximum moment section to point of inflection). It is noted thathe neutral axis depth,c, varies with the curvature at the criticsection and, hence, displacement ductility. The effect of axiasile load on shear strength is not defined.
FEMA 273 Seismic Rehabilitation Guidelines (1997)
The column shear strength equations in FEMA-273 are basa review of available experimental data for existing columnsjected to axial load and reversed cyclic lateral displacementsconcrete contribution is calculated as
Vc = 0.29lSk +P
13.8AgDÎfc8bd sMPad
s8d
Vc = 3.5lSk +P
2,000AgDÎfc8bd spsid
in which k=1.0 for low ductility demand and 0.0 for moderand high ductility demand, andl=1.0 for normal-weight concrete. A demand-to-capacity ratio less than 2.0 calculatedlinear analysis or a displacement ductility of less than 2.0 clated from nonlinear analysis is defined as low ductility demThe relatively severe degradation of concrete contributionductility was based in part on the observation that shear strdegrades with inelastic cycling and partly on knowledge thatdifficult to accurately calculate the ductility demand for a yieldcolumn using approximate analysis methods. Axial loadP is
age(Specimen 2CHD12 as tested by Sezen 2002)
d damequal to zero for tension. The steel contribution to the shear
F STRUCTURAL ENGINEERING © ASCE / NOVEMBER 2004 / 1697

feffec-
h re-tionale re-ngthst to
e sa-ing
ed to
tribu-y Eq.
sifiedom-theof
t theonalationlong a
canorce-thens,col-cedllingdiag-
n anminalding
d
,ment
strength is computed from Eq.(3), except in yielding regions ocolumns where the transverse reinforcement is consideredtive only if sød/2 and hoops are anchored into the core.
Proposed Shear Strength Model
Data organized by Fig. 7 indicate that column shear strengtlates to several key parameters, including column cross-secdimensions, column aspect ratio, concrete quality, transversinforcement, and axial load. While various existing shear stremodels incorporate some of these variables, it was of intereexplore development of a new model that considered all thlient variables for columns of the type considered here. Followa review of available data and previous models, it was decid
Fig. 7. Relationship between no
Fig. 8. Concrete shear strength degradation with displaceductility (reprinted from Priestley et al. 1994)
1698 / JOURNAL OF STRUCTURAL ENGINEERING © ASCE / NOVEMBER
represent shear strength as being composed of additive contions from concrete and transverse reinforcement as given b(1).
Concrete Contribution
Shear failure for reinforced concrete columns can be classimplistically as either diagonal tension failure or diagonal cpression failure. Diagonal tension failure occurs followingformation of cracks inclined relative to the longitudinal axisthe column. As loading continues, crack opening can disrupload-carrying mechanism and lead eventually to failure. Diagcompression failure can occur either before or after the formof inclined cracks and appears as crushing of the concrete adiagonal compression strut. Diagonal compression failureoccur when either the column axial force or transverse reinfment ratio, or both, are relatively high, or alternatively ifaspect ratio is relatively low. In older existing building columeither type of failure is plausible. However, for the case ofumns witha/d.2 with axial loads near or below the balanpoint, diagonal tension failure seems the more likely contromechanism. For this reason, the proposed model focuses ononal tension capacity.
It is assumed that onset of diagonal tension cracking ielement under uniform stress state can be related to the noprincipal tension stress acting on the element. Assuming loawithin thex-y plane, the principle tension stresss1 can be definefrom equilibrium as
s1 =sx + sy
2+ÎSsx − sy
2D2
+ t2 s9d
in which sx,sy5normal tension stress in thex and y directions
ed shear strength and test parameters
rmalizrespectively, andt5shear stress acting on the faces having nor-
2004
, itthen theans-eere-rs
t the
set ofevelpre-
axialatureence
linedinedgerant.men-
th thee
f
shear
red as
the
e ofcon-thistion
mals in thex andy directions. In a reinforced concrete columnwill be assumed thatsx corresponds to the normal stress indirection of shear force and is therefore zero. This is based oassumption that the confinement effect of poorly detailed trverse reinforcement onsx is very small.sy corresponds to thnormal stress parallel to the column longitudinal axis and is thfore defined as −P/Ag. Assuming that tensile cracking occuwhen s1 reaches the nominal tensile strengthfct=0.5Îfc8 MPas=6Îfc8 psid, Eq. (9) can be solved to define the shear stress aonset of diagonal tension cracking as
t = 0.5Îfc8Î1 +P
0.5Îfc8Ag
sMPad
s10d
t = 6Îfc8Î1 +P
6Îfc8Ag
spsid
Eq. (10) anticipates that shear stress corresponding to ondiagonal tension cracking will increase as the axial load lincreases. This trend is consistent with that identified in theviously cited shear strength models(ACI 318, FEMA 273, andPriestley et al.) as well as the experimental data[Fig. 7(a)].
The stress state in a reinforced concrete column underand lateral loading is complicated by the nonhomogeneous nof reinforced concrete, and is further complicated by the presof flexural and bond cracks. Therefore Eq.(10) should not beexpected to provide a direct measure of the onset of inccracking but instead will consistently overestimate the inclcracking load. This will be especially true for columns with laraspect ratioa/d, as flexural cracking becomes more predominThis phenomenon can be identified in the trend of the experi
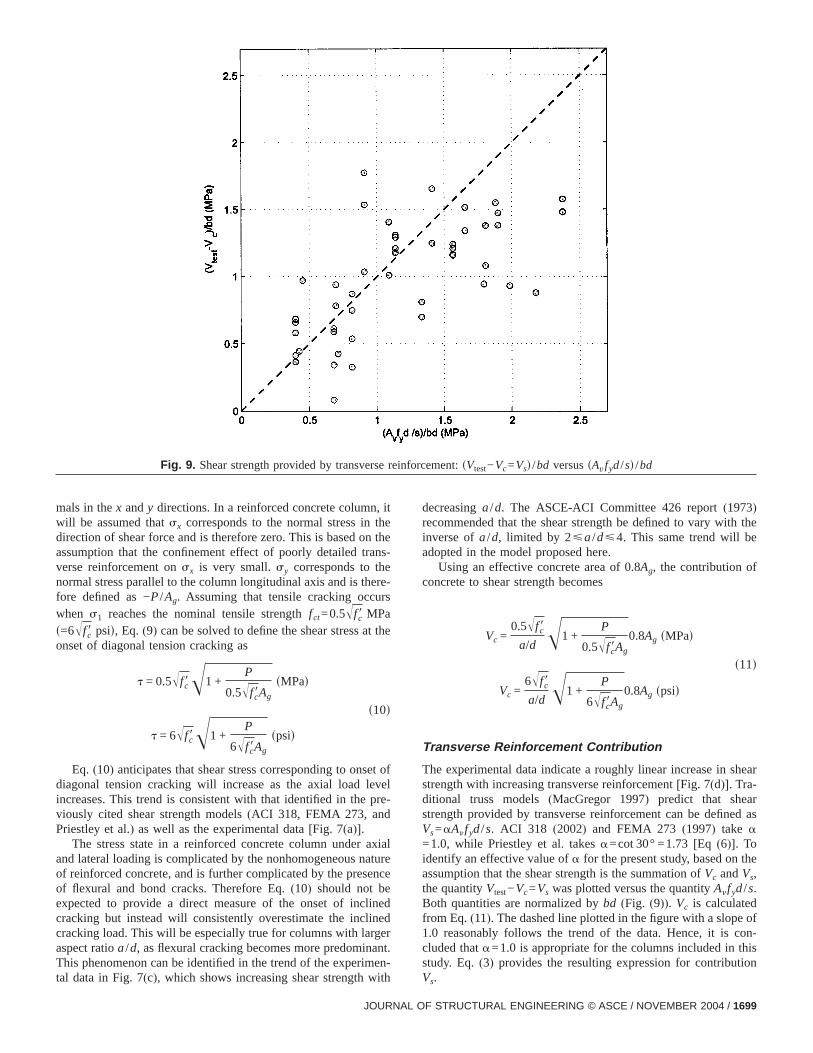
Fig. 9. Shear strength provided by transver
tal data in Fig. 7(c), which shows increasing shear strength with
JOURNAL O
decreasinga/d. The ASCE-ACI Committee 426 report(1973)recommended that the shear strength be defined to vary wiinverse ofa/d, limited by 2øa/dø4. This same trend will badopted in the model proposed here.
Using an effective concrete area of 0.8Ag, the contribution oconcrete to shear strength becomes
Vc =0.5Îfc8
a/dÎ1 +
P
0.5Îfc8Ag
0.8Ag sMPad
s11d
Vc =6Îfc8
a/dÎ1 +
P
6Îfc8Ag
0.8Ag spsid
Transverse Reinforcement Contribution
The experimental data indicate a roughly linear increase instrength with increasing transverse reinforcement[Fig. 7(d)]. Tra-ditional truss models(MacGregor 1997) predict that sheastrength provided by transverse reinforcement can be definVs=aAnfyd/s. ACI 318 (2002) and FEMA 273(1997) take a=1.0, while Priestley et al. takesa=cot 30° =1.73[Eq (6)]. Toidentify an effective value ofa for the present study, based onassumption that the shear strength is the summation ofVc andVs,the quantityVtest−Vc=Vs was plotted versus the quantityAnfyd/s.Both quantities are normalized bybd (Fig. (9)). Vc is calculatedfrom Eq.(11). The dashed line plotted in the figure with a slop1.0 reasonably follows the trend of the data. Hence, it iscluded thata=1.0 is appropriate for the columns included instudy. Eq.(3) provides the resulting expression for contribu
nforcement:sVtest−Vc=Vsd /bd versussAvfyd/sd /bd
se reiVs.
F STRUCTURAL ENGINEERING © ASCE / NOVEMBER 2004 / 1699

y etn toy de-l-ty de-mentdata
atepeci-thosea se-lation
dinghori-dis-
termi-
ty
d
1700 / JOURNAL OF STRUCTURAL ENGINEERING © ASCE / NOVEMBER
Effect of Displacement Ductility Demand
Some researchers(e.g., Aschheim and Moehle 1992; Priestleal. 1994) have proposed models in which concrete contributioshear strength reduces with increasing displacement ductilitmand. Others(e.g., Konwinski et al. 1995) have found that coumn shear strength was independent of displacement ductilimand. The relation between shear strength and displaceductility demand can be investigated using the column testreported in Table 1.
Displacement ductility is defined by the ratio of the ultimdisplacement to yield displacement. In Table 1 for some smens no experimental yield displacement was reported. Forspecimens, the yield displacement was defined as follows:cant was drawn to intersect the lateral load-displacement reat 70% of the maximum applied shear,Vtest (Fig. 4). This line wasextended to the intersection with a horizontal line corresponto the maximum applied shear, and then projected onto thezontal axis to obtain the yield displacement. The ultimateplacement is defined as the displacement corresponding to
placement ductility,(b) axial load ratio,(c) column aspect ratio, an
Fig. 10. Shear strength degradation with displacement ductili
Fig. 11. Variation of test to measured strength ratio as a function of(a) dis(d) transverse reinforcement index
2004

nt atplied
mentumefinede-
y de-
engthortr,
crackryingn ind toore toilarly,
alsorce-anism
con-enti-the
clud-da-
orlace-iate
r
nation of the test or the maximum measured displacemewhich the applied shear dropped to 80% of the maximum apshear.
Normalized shear is plotted as a function of the displaceductility in Fig. 10. Normalized shear is the ratio of the maximshear resisted by the column to the nominal shear strength dby Eqs.(1), (3), and (11). The plotted data show a trend of dcreasing shear strength with increasing displacement ductilitmand.
The previous result indicates that the proposed shear strmodel can be improved by introducing a ductility-related factksimilar to that used by Aschheim and Moehle(1992); Priestley eal. (1994); and FEMA 273(1997). It should be noted, howevethat those shear strength models apply the factork only to theconcrete contribution based on the understanding that aopening in the concrete leads to degradation of its load-carcapacity while the reinforcement does not degrade. As showFig. 5, concrete damage in the study columns is likely to lealoss of anchorage of the transverse reinforcement and therefsome degradation in its contribution to shear resistance. Simviewed in terms of a truss model, degradation of the concreteleads to reduction in bond capacity for the longitudinal reinfoment and transverse reinforcement, so that the truss mech
Fig. 12. Ratio of measured to calculated shea
strength is reduced. The available data do not clearly identify how
JOURNAL O
much degradation occurs in the individual concrete or steeltributions, if indeed such contributions can be separately idfied; lacking conclusive evidence it is decided to applyductility-related factork equally to both.
Eq. (12) expresses the proposed shear strength model ining the factork to account for ductility-related strength degration.
Vn = Vs + Vc = kAvfyd
s+ kS0.5Îfc8
a/dÎ1 +
P
0.5Îfc8AgD0.8Ag sMPad
s12d
Vn = Vs + Vc = kAvfyd
s+ kS6Îfc8
a/dÎ1 +
P
6Îfc8AgD0.8Ag spsid
As shown in Fig. 10, the factork is defined to be equal to 1.0 fdisplacement ductility less than 2, to be equal to 0.7 for dispment ductility exceeding 6, and to vary linearly for intermeddisplacement ductilities.
Comparison of Calculated and Measured Strengths
Fig. 11 plots the ratio of measured shear strength,Vtest, to shea
gth for different models versus displacement ductility
r strenstrength,Vn, calculated from the proposed Eq.(12) versus dis-
F STRUCTURAL ENGINEERING © ASCE / NOVEMBER 2004 / 1701

andmea-emen
entreaso
ngthACI
et2uredectly
oeffi-andfor
son-duc-
atesmayrovidelyosesmenhearn-log-
ngthth for
edIt isonlydis-is oforce
thete
hear
te thesult isThisoad-i-e-vesex-
etivelyown,ydatat ca-
eions.uiresch is
gu-sev-
ountand.g themodelorce-lts ofob-
ppli-ings.accu-
itivecon-n be, esti-model
e.
eringRe-under
rsity
,
on
placement ductility, column aspect ratio, axial load ratio,transverse reinforcement index. The correlation between thesured and calculated strengths across the range of displacductility, aspect ratio, axial load, and transverse reinforcemsuggests that the proposed model represents these effectsably well.
Fig. 12 plots the ratio of measured to calculated shear streversus displacement ductility demand for the models from318-2002(2002); Priestley et al.(1994); and FEMA 273(1997),as described previously. In Eq.(7) for the model by Priestleyal., the neutral axis depth,c, is calculated using the ACI 318-0flexural design procedure for the given axial load and measmaterial properties. The data in Fig. 12 can be compared dirwith similar results for the proposed model shown in Fig. 11(a).The mean ratio of measured to calculated strength and its ccient of variation are 1.05 and 0.15, 1.01 and 0.20, and 0.760.20 for the model proposed here, for ACI 318-2002, andPriestley et al., respectively. The FEMA 273 model does reaably well at representing shear strength up to displacementtility of 2.0, after which point the assumption thatVc=0 in somecolumns results in poor correlation.
Design and Assessment Implications
Comparison of available models with experimental data indicthat both the ACI 318-2002 model and the proposed modelbe suitable as design and assessment tools, with the latter ping marginally better statistical correlation. Given the relativlow ductility associated with shear failure of columns like thconsidered in this study, the strength used in design or assesnormally will correspond to a lower-bound estimate of the sstrength. FEMA 273(1997) defines this as the lower five percetile of strengths expected. By this definition, and assuming anormal distribution in the strength ratio, the design streshould be taken as 0.75 and 0.81 times the nominal strengthe ACI 318-2002 and proposed models, respectively.
In the proposed model[Eq. (12)], the shear strength is definas a function of the imposed column displacement ductility.important to recognize that the proposed model is intendedfor estimating the shear strength given information about theplacement ductility demand. For example, a nonlinear analysa structure may provide information on the column shear fdemand and column displacement ductility demand. Knowingdisplacement ductility demand, Eq.(12) can be used to estima
Fig. 13. Shear strength model: shear capacity-demand relati
the shear strength and, with knowledge of the shear demand and
1702 / JOURNAL OF STRUCTURAL ENGINEERING © ASCE / NOVEMBER
t
n-
-
t
statistics of the shear strength model, the probability of sfailure can be estimated.
The shear strength model should not be used to estimadisplacement at which shear failure occurs because the reoverly sensitive to small variations in the input parameters.is illustrated in Fig. 13. As shown, the expected nonlinear ldeformation response of the columnsVed is imposed on the nomnal shear strengthsVnd, which varies as a function of displacment ductility. The intersection of the two continuous curdefines the displacement at which shear failure nominally ispected to occur(shown asmd1). A relatively small error in thshear strength model or the shear demand results in a relalarge change in the point of intersection. In the example shvarying the shear strength from 0.8Vn to 1.2Vn, a range certainlwithin reasonable bounds considering the dispersion of therelative to the shear strength model, results in displacemenpacity estimates ranging frommd2 to md3, which in the examplshown is too broad a range to be useful for most applicatPredicting the displacement at which shear failure occurs reqan alternative approach to the problem. One such approareported by Elwood(2002).
Conclusions
Evaluation of experimental data from lightly reinforced rectanlar columns indicates that the shear strength is influenced byeral factors including the column aspect ratio, axial load, amof transverse reinforcement, and deformation ductility demAn alternative shear strength model is proposed considerineffects of these parameters. The proposed shear strengthincludes contributions from concrete and transverse reinfment, and is related to displacement ductility demand. Resuthe proposed model are found to correlate well with resultstained from laboratory tests. The model may be useful in acations to columns having similar configurations and loadThe shear strengths of test columns are predicted relativelyrately by the ACI 318-2002 method.
It was observed that shear strength was only mildly sensto the imposed displacement ductility demand. An importantclusion is that, whereas displacement ductility demand caused with the proposed model to estimate shear strengthmates of shear demand and shear strength based on thecannot be used to estimate the displacement at shear failur
Acknowledgments
This work was supported by the Pacific Earthquake EngineResearch(PEER) Center through the Earthquake Engineeringsearch Centers Program of the National Science FoundationAward No. EEC-9701568. The experiments by Sezen(2002) werecarried out in the research laboratories of PEER at the Univeof California, Berkeley.
Notation
The following symbols are used in this paper:Ag 5 gross area of section;Asl 5 total longitudinal reinforcement area;Av 5 transverse reinforcement area within a spacing
s, in the loading direction;
2004

r
;
rties;
I
by
al
r.
ts.n-
-nts.”,
rav-t. of
ley,
ofgi-
ko-t
alsoedn,
-al-
ing.”ss in
nsp.ch,
eteEn-
col-
ign
of
d de-89.
rmic
r
te
retentallif.
then and
oal-
ns
ed
a 5 shear span(distance from maximum momentsection to point of inflection);
b 5 width of column cross section;c 5 neutral axis depth;
D8 5 distance measured parallel to the applied sheabetween centers of the perimeter hoop;
d 5 distance from the extreme compression fiber tocentroid of tension reinforcement(sectiondepth);
db 5 longitudinal bar diameter;fc8 5 compressive strength of concrete;fct 5 concrete tensile stress capacity;fy 5 transverse reinforcement yield strength;fyl 5 longitudinal reinforcement yield strength;h 5 overall depth of the section;k 5 factor relating the concrete or transverse
reinforcement capacity to displacement ductilityMACI 5 moment strength calculated using the ACI
318-02 procedure and measured material propeP 5 axial load(compressive axial load is positive);s 5 transverse reinforcement spacing;
VACI 5 nominal shear strength calculated using the AC318-02 procedure[Eq. (1)];
Vc 5 nominal shear strength provided by concrete;Ve 5 nonlinear lateral load-deformation response;Vn 5 nominal shear strength;Vp 5 nominal shear strength enhancement provided
axial compression;Vs 5 nominal shear strength provided by transverse
reinforcement;Vtest 5 experimental(observed) shear strength;
dy 5 yield displacement;l 5 correction factor related to unit weight of
concrete;md 5 displacement ductility;rl 5 longitudinal reinforcement ratio,rl =Asl/Ag;
rw 5 transverse reinforcement ratio,rw=Av /bs;s1 5 principal tensile stress;sx 5 normal stress on plane parallel to the longitudin
axis of the member;sy 5 normal stress on plane perpendicular to the
longitudinal axis of the member; andt 5 shear stress on planes perpendicular to the
transverse and longitudinal axes of the membe
References
American Concrete Institute(ACI). (2002). “Building code requiremenfor structural concrete.”ACI Committee 318, Farmington Hills, Mich
ASCE-ACI Task Committee 426.(1973). “The shear strength of reiforced concrete members.”J. Struct. Div. ASCE, 99(6), 1091–1187.
Aschheim, A. M., and Moehle, J. P.(1992). “Shear strength and deformability of RC bridge columns subjected to inelastic displacemeTechnical Rep. No. UCB/EERC 92/04, Univ. of California at BerkeleyBerkeley, Calif..
Elwood, K. (2002). “Shake table tests and analytical studies on the gity load collapse of reinforced concrete frames.” PhD thesis, DepCivil and Environmental Engineering, Univ. of California at BerkeBerkeley, Calif.
JOURNAL O
Esaki, F.(1996). “Reinforcing effect of steel plate hoops on ductilityR/C square columns.”Proc., 11th World Conf. on Earthquake Enneering, Pergamon, Elsevier Science, New York,Paper No. 196.
Federal Emergency Management Agency(FEMA). (1997). “NEHRPguidelines for the seismic rehabilitation of buildings.”FEMA 273,Washington, D.C.
Ikeda, A.(1968). Rep., Training Institute for Engineering Teachers, Yohama National Univ., Japan, also in, Masaya, H.(1973). A list of pasexperimental results of reinforced concrete columns, Building Re-search Inst., Ministry of Construction, Japan.
International Conference of Building Officials(ICBO). (1976). UniformBuilding Code, Whittier, Calif.
Kokusho, S.(1964). Rep., Building Research Inst., Tsukuba, Japan,in Masaya, H.(1973). A list of past experimental results of reinforcconcrete columns, Building Research Inst., Ministry of ConstructioJapan.
Kokusho, S., and Fukuhara, M.(1965). Rep., Kokusho Lab., Tokyo Industrial Univ., also in Masaya, H.(1973). A list of past experimentresults of reinforced concrete columns, Building Research Inst., Ministry of Construction, Japan.
Konwinski, C. M., Ramirez, J. A., and Sozen, M. A.(1995). “Shearstrength of reinforced concrete columns subject to seismic loadProc., National Seismic Conf. on Bridges and Highways: ProgreResearch and Practice, San Diego, 10–13.
Li, X., Park, R., and Tanaka, H.(1995). “Reinforced concrete columunder seismic lateral force and varying axial load.”Research Re95-5, Dept. of Civil Engineering, Univ. of Canterbury, ChristchurNew Zealand.
Lynn, A. C. (2001). “Seismic evaluation of existing reinforced concrbuilding columns.” PhD thesis, Dep.t of Civil and Environmentalgineering, Univ. of California at Berkeley, Berkeley, Calif.
Lynn, A. C., Moehle, J. P., Mahin, S. A., and Holmes, W. T.(1996).“Seismic evaluation of existing reinforced concrete buildingumns.”Earthquake Spectra, 12(4), 715–739.
MacGregor, J. G.(1997). Reinforced concrete: Mechanics and des,Prentice-Hall, Upper Saddle River, N.J.
Moehle, J. P., and Mahin, S. A.(1991). “Observations on the behaviorreinforced concrete buildings during earthquakes.”ACI SP-127,Earthquake-resistant concrete structures inelastic response ansign, S. K. Ghosh, ed., American Concrete Institute, Detroit, 67–
Ohue, M., Morimoto, H., Fujii, S., and Morita, S.(1985). “The behavioof R. C. short columns failing in splitting bond-shear under dynalateral loading.”Trans. Jpn. Concr. Inst., 7, 293–300.
Priestley, M. J. N., Verma, R., and Xiao, Y.(1994). “Seismic sheastrength of reinforced concrete columns.”J. Struct. Eng., 120(8),2310–2329.
Saatcioglu, M., and Ozcebe, G.(1989). “Response of reinforced concrecolumns to simulated seismic loading.”ACI Struct. J., 86(1), 3–12.
Sezen, H.(2002). “Seismic behavior and modeling of reinforced concbuilding columns.” PhD thesis, Dept. of Civil and EnvironmeEngineering, Univ. of California at Berkeley, Berkeley, Cahttp://peer.berkeley.edu/~sezen/Files/thesis/
Sezen, H., Whittaker, A. S., Elwood, K. J., and Mosalam, K. M.(2003).“Performance of reinforced concrete and wall buildings duringAugust 17, 1999 Kocaeli, Turkey earthquake, and seismic desigconstruction practice in Turkey.”Eng. Struct., 25(1), 103–114.
Umemura, H., and Endo, T.(1970). Rep., Umemura Laboratory, TokyUniversity, also in Masaya, H.(1973). “A list of past experimentresults of reinforced concrete columns.” Building Research Inst., Ministry of Construction, Japan.
Wight, J. K., and Sozen, M. A.(1975). “Strength decay of RC columunder shear reversals.”J. Struct. Div. ASCE, 101(5), 1053–1065.
Yalcin, C. (1997). “Seismic evaluation and retrofit of existing reinforcconcrete bridge columns.” PhD thesis, Univ. of Ottawa, Ottawa.
F STRUCTURAL ENGINEERING © ASCE / NOVEMBER 2004 / 1703