In-Plane Seismic Behaviour of Slender Reinforced Masonry Shear Walls: Experimental Results
11
12 th Canadian Masonry Symposium Vancouver, British Columbia, June 2-5, 2013 In-Plane Seismic Behaviour of Slender Reinforced Masonry Shear Walls: Experimental Results B. Robazza 1 , K.J. Elwood 2 , D. L. Anderson 3 , and S. Brzev 4 1 Master's Student, Department of Civil Engineering, University of British Columbia, Vancouver, BC, V6T 1Z4, Canada, [email protected] 2 Associate Professor, Department of Civil Engineering, University of British Columbia, Vancouver, BC, V6T 1Z4, Canada, [email protected] 3 Professor Emeritus, Department of Civil Engineering, University of British Columbia, Vancouver, BC, V6T 1Z4, Canada, [email protected] 4 Faculty, Department of Civil Engineering, British Columbia Institute of Technology, Vancouver, BC, V5G 3H2, Canada, [email protected] ABSTRACT Reinforced concrete block masonry shear walls (RMSWs) often constitute the principal seismic force resisting system of masonry structures. During an earthquake, these walls experience the combined effects of gravity axial loading and in-plane overturning moments due to lateral seismic forces. This may precipitate an out-of-plane instability, especially when the vertical reinforcement in the wall end zones is subjected to cycles of high tensile strain. This failure mechanism forms the basis of the current height-to-thickness (h/t) ratio limits (ranging from 14 to 20) for ductile RMSWs stipulated by the Canadian masonry design standard CSA S304.1-04. A comprehensive two-phase research program is being conducted to investigate the key parameters associated with out-of-plane instability in RMSWs subjected to in-plane loading. The first phase involved the experimental testing of five full-scale reinforced masonry column-like specimens subjected to uniaxial cyclic tension-compression loading, which provided a valuable insight into the instability failure mechanism. The second phase of the program is currently in progress, and it consists of reversed cyclic testing of full-scale RMSW specimens. The paper focuses on the key findings of the experimental study for the first wall specimen, characterized by an (h/t) ratio of 27 exceeding CSA S304.1 limits, and its possible implications on the CSA S304 seismic design provisions. KEYWORDS: Reinforced masonry, concrete blocks, shear wall, out-of-plane stability, ductile performance, seismic loading INTRODUCTION CSA S304.1-04 [1] restricts RMSWs to (h/t) ratios of 14 to 20 to prevent the possibility of out- of-plane instability failure in these walls when subjected to in-plane seismic loading. These limits depend on the expected seismic performance and the corresponding ductility-related force modification factor R d stipulated by the National Building Code of Canada 2010 (NBCC 2010) [2] for different wall classes The maximum R d value of 2.0 corresponds to moderately ductile wall classes (note that R d = 1.0 corresponds to elastic performance). For example, Moderately Ductile Shear Walls (height/length ratio of 1.0 and higher) are limited to a maximum (h/t) ratio of 14, and Moderately Ductile Squat Shear Walls are restricted to an (h/t) ratio of 20. NBCC 2010 requires that post-disaster buildings be designed with an R d factor of 2.0 or higher
Transcript of In-Plane Seismic Behaviour of Slender Reinforced Masonry Shear Walls: Experimental Results

12th
Canadian Masonry Symposium Vancouver, British Columbia, June 2-5, 2013
In-Plane Seismic Behaviour of Slender Reinforced Masonry Shear Walls:
Experimental Results B. Robazza
1, K.J. Elwood
2, D. L. Anderson
3, and S. Brzev
4
1 Master's Student, Department of Civil Engineering, University of British Columbia, Vancouver, BC, V6T 1Z4,
Canada, [email protected]
2 Associate Professor, Department of Civil Engineering, University of British Columbia, Vancouver, BC, V6T 1Z4,
Canada, [email protected] 3 Professor Emeritus, Department of Civil Engineering, University of British Columbia, Vancouver, BC, V6T 1Z4,
Canada, [email protected] 4 Faculty, Department of Civil Engineering, British Columbia Institute of Technology, Vancouver, BC, V5G 3H2,
Canada, [email protected]
ABSTRACT
Reinforced concrete block masonry shear walls (RMSWs) often constitute the principal seismic
force resisting system of masonry structures. During an earthquake, these walls experience the
combined effects of gravity axial loading and in-plane overturning moments due to lateral
seismic forces. This may precipitate an out-of-plane instability, especially when the vertical
reinforcement in the wall end zones is subjected to cycles of high tensile strain. This failure
mechanism forms the basis of the current height-to-thickness (h/t) ratio limits (ranging from 14
to 20) for ductile RMSWs stipulated by the Canadian masonry design standard CSA S304.1-04.
A comprehensive two-phase research program is being conducted to investigate the key
parameters associated with out-of-plane instability in RMSWs subjected to in-plane loading. The
first phase involved the experimental testing of five full-scale reinforced masonry column-like
specimens subjected to uniaxial cyclic tension-compression loading, which provided a valuable
insight into the instability failure mechanism. The second phase of the program is currently in
progress, and it consists of reversed cyclic testing of full-scale RMSW specimens. The paper
focuses on the key findings of the experimental study for the first wall specimen, characterized
by an (h/t) ratio of 27 exceeding CSA S304.1 limits, and its possible implications on the CSA
S304 seismic design provisions.
KEYWORDS: Reinforced masonry, concrete blocks, shear wall, out-of-plane stability, ductile
performance, seismic loading
INTRODUCTION
CSA S304.1-04 [1] restricts RMSWs to (h/t) ratios of 14 to 20 to prevent the possibility of out-
of-plane instability failure in these walls when subjected to in-plane seismic loading. These
limits depend on the expected seismic performance and the corresponding ductility-related force
modification factor Rd stipulated by the National Building Code of Canada 2010 (NBCC 2010)
[2] for different wall classes The maximum Rd value of 2.0 corresponds to moderately ductile
wall classes (note that Rd = 1.0 corresponds to elastic performance). For example, Moderately
Ductile Shear Walls (height/length ratio of 1.0 and higher) are limited to a maximum (h/t) ratio
of 14, and Moderately Ductile Squat Shear Walls are restricted to an (h/t) ratio of 20. NBCC
2010 requires that post-disaster buildings be designed with an Rd factor of 2.0 or higher
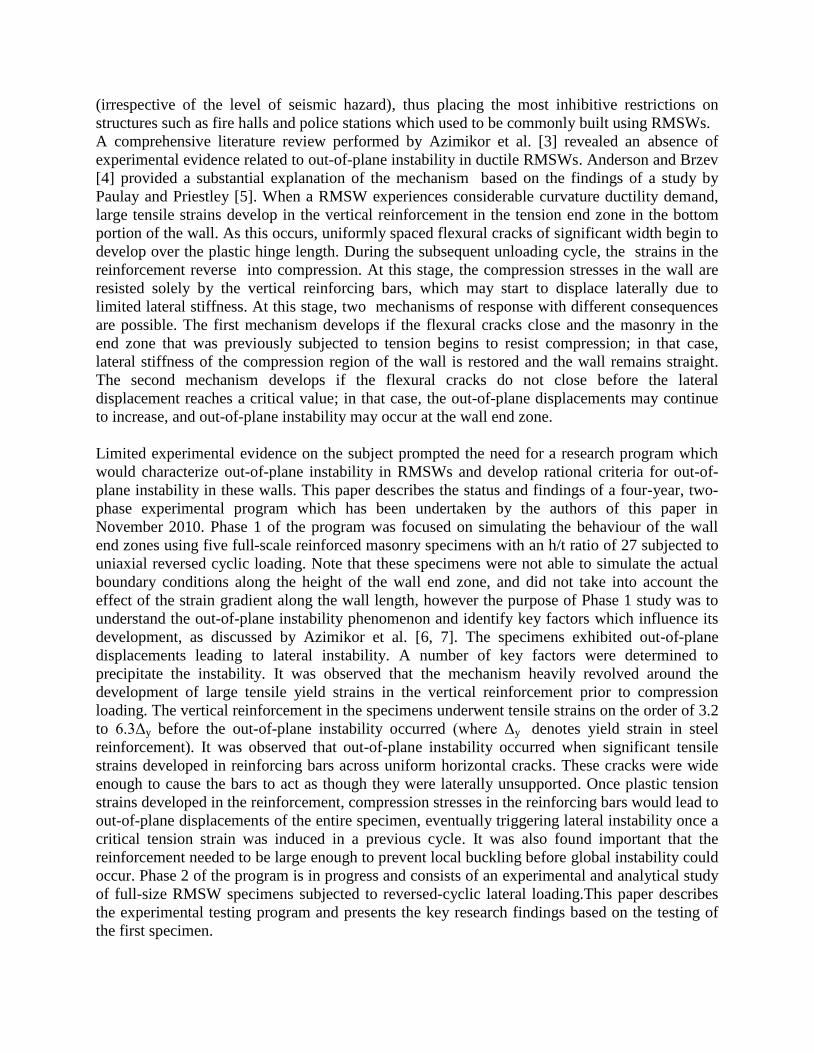
(irrespective of the level of seismic hazard), thus placing the most inhibitive restrictions on
structures such as fire halls and police stations which used to be commonly built using RMSWs.
A comprehensive literature review performed by Azimikor et al. [3] revealed an absence of
experimental evidence related to out-of-plane instability in ductile RMSWs. Anderson and Brzev
[4] provided a substantial explanation of the mechanism based on the findings of a study by
Paulay and Priestley [5]. When a RMSW experiences considerable curvature ductility demand,
large tensile strains develop in the vertical reinforcement in the tension end zone in the bottom
portion of the wall. As this occurs, uniformly spaced flexural cracks of significant width begin to
develop over the plastic hinge length. During the subsequent unloading cycle, the strains in the
reinforcement reverse into compression. At this stage, the compression stresses in the wall are
resisted solely by the vertical reinforcing bars, which may start to displace laterally due to
limited lateral stiffness. At this stage, two mechanisms of response with different consequences
are possible. The first mechanism develops if the flexural cracks close and the masonry in the
end zone that was previously subjected to tension begins to resist compression; in that case,
lateral stiffness of the compression region of the wall is restored and the wall remains straight.
The second mechanism develops if the flexural cracks do not close before the lateral
displacement reaches a critical value; in that case, the out-of-plane displacements may continue
to increase, and out-of-plane instability may occur at the wall end zone.
Limited experimental evidence on the subject prompted the need for a research program which
would characterize out-of-plane instability in RMSWs and develop rational criteria for out-of-
plane instability in these walls. This paper describes the status and findings of a four-year, two-
phase experimental program which has been undertaken by the authors of this paper in
November 2010. Phase 1 of the program was focused on simulating the behaviour of the wall
end zones using five full-scale reinforced masonry specimens with an h/t ratio of 27 subjected to
uniaxial reversed cyclic loading. Note that these specimens were not able to simulate the actual
boundary conditions along the height of the wall end zone, and did not take into account the
effect of the strain gradient along the wall length, however the purpose of Phase 1 study was to
understand the out-of-plane instability phenomenon and identify key factors which influence its
development, as discussed by Azimikor et al. [6, 7]. The specimens exhibited out-of-plane
displacements leading to lateral instability. A number of key factors were determined to
precipitate the instability. It was observed that the mechanism heavily revolved around the
development of large tensile yield strains in the vertical reinforcement prior to compression
loading. The vertical reinforcement in the specimens underwent tensile strains on the order of 3.2
to 6.3Δy before the out-of-plane instability occurred (where Δy denotes yield strain in steel
reinforcement). It was observed that out-of-plane instability occurred when significant tensile
strains developed in reinforcing bars across uniform horizontal cracks. These cracks were wide
enough to cause the bars to act as though they were laterally unsupported. Once plastic tension
strains developed in the reinforcement, compression stresses in the reinforcing bars would lead to
out-of-plane displacements of the entire specimen, eventually triggering lateral instability once a
critical tension strain was induced in a previous cycle. It was also found important that the
reinforcement needed to be large enough to prevent local buckling before global instability could
occur. Phase 2 of the program is in progress and consists of an experimental and analytical study
of full-size RMSW specimens subjected to reversed-cyclic lateral loading.This paper describes
the experimental testing program and presents the key research findings based on the testing of
the first specimen.
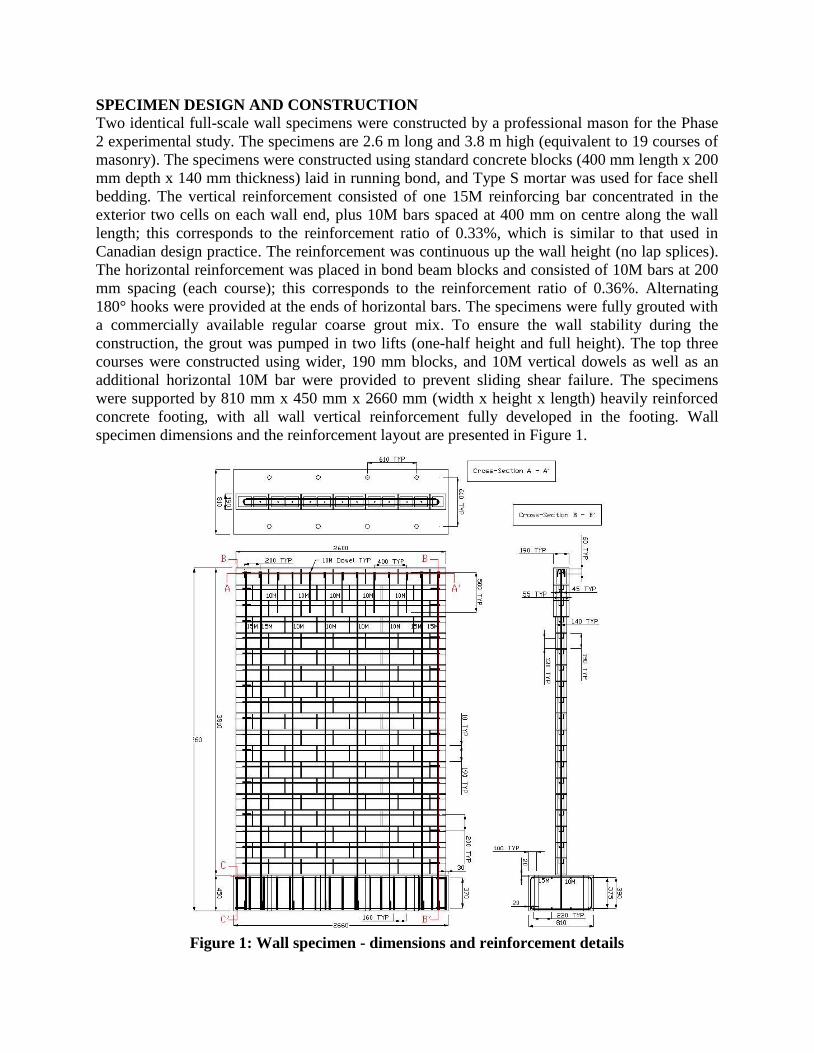
SPECIMEN DESIGN AND CONSTRUCTION
Two identical full-scale wall specimens were constructed by a professional mason for the Phase
2 experimental study. The specimens are 2.6 m long and 3.8 m high (equivalent to 19 courses of
masonry). The specimens were constructed using standard concrete blocks (400 mm length x 200
mm depth x 140 mm thickness) laid in running bond, and Type S mortar was used for face shell
bedding. The vertical reinforcement consisted of one 15M reinforcing bar concentrated in the
exterior two cells on each wall end, plus 10M bars spaced at 400 mm on centre along the wall
length; this corresponds to the reinforcement ratio of 0.33%, which is similar to that used in
Canadian design practice. The reinforcement was continuous up the wall height (no lap splices).
The horizontal reinforcement was placed in bond beam blocks and consisted of 10M bars at 200
mm spacing (each course); this corresponds to the reinforcement ratio of 0.36%. Alternating
180° hooks were provided at the ends of horizontal bars. The specimens were fully grouted with
a commercially available regular coarse grout mix. To ensure the wall stability during the
construction, the grout was pumped in two lifts (one-half height and full height). The top three
courses were constructed using wider, 190 mm blocks, and 10M vertical dowels as well as an
additional horizontal 10M bar were provided to prevent sliding shear failure. The specimens
were supported by 810 mm x 450 mm x 2660 mm (width x height x length) heavily reinforced
concrete footing, with all wall vertical reinforcement fully developed in the footing. Wall
specimen dimensions and the reinforcement layout are presented in Figure 1.
Figure 1: Wall specimen - dimensions and reinforcement details
The specimen height/length (h/l) ratio of 1.5 was chosen to ensure flexural behaviour
characterized by the formation of plastic hinges at the base of the wall, a prerequisite for the out-
of-plane instability. The wall height/thickness (h/t) ratio of 27, significantly higher than the
upper CSA S304 limit, was chosen to increase chances for out-of-plane instability. The vertical
reinforcement distribution was determined considering the criterion to maximize the length of
the compression zone, and the corresponding strains in concentrated 15M reinforcing bars at the
wall ends. The capacity design approach was followed to avoid the possibility of shear failure in
the specimen.
Masonry material testing was performed following the procedures outlined in pertinent Canadian
standards: CSA A165-04 for block testing, and CSA A179-04 for mortar and grout testing.
Average compressive strength for the blocks was 53.8 MPa for the net area, based on 5
specimens. Type S mortar was used, with the average compressive strength of 12.4 MPa (based
on 18 cubes). The average grout compressive strength was 35.4 MPa (based on 13 cylinders).
The average value for the masonry compressive strength, f'm, was 21.2 MPa, based on 10 two-
block-high grouted masonry prisms. Grade 400 reinforcing steel with the nominal yield strength
of 400 MPa was used. Tensile tests were conducted on 10M and 15M reinforcing bar specimens,
and the average yield strength was 505 MPa. The average yield strain for all specimens was
0.3%. The specimens were prepared and tested according to CSA G30.18-M92 (R2002)
standard.
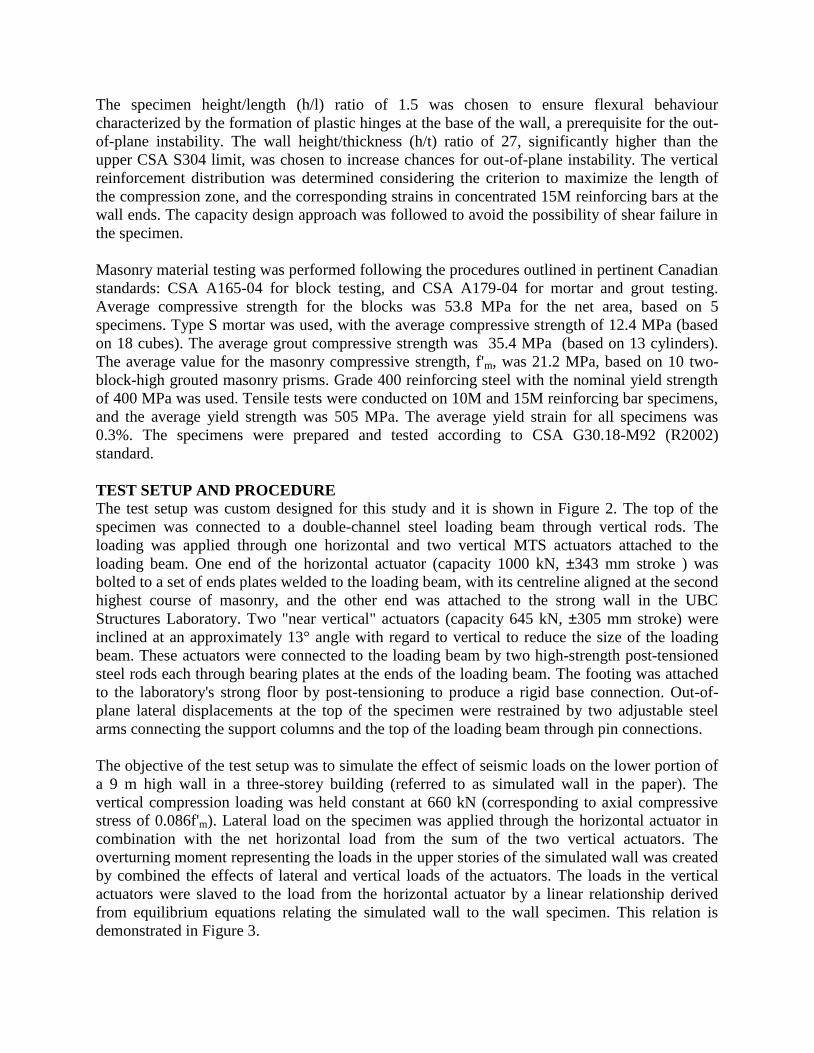
TEST SETUP AND PROCEDURE
The test setup was custom designed for this study and it is shown in Figure 2. The top of the
specimen was connected to a double-channel steel loading beam through vertical rods. The
loading was applied through one horizontal and two vertical MTS actuators attached to the
loading beam. One end of the horizontal actuator (capacity 1000 kN, ±343 mm stroke ) was
bolted to a set of ends plates welded to the loading beam, with its centreline aligned at the second
highest course of masonry, and the other end was attached to the strong wall in the UBC
Structures Laboratory. Two "near vertical" actuators (capacity 645 kN, ±305 mm stroke) were
inclined at an approximately 13° angle with regard to vertical to reduce the size of the loading
beam. These actuators were connected to the loading beam by two high-strength post-tensioned
steel rods each through bearing plates at the ends of the loading beam. The footing was attached
to the laboratory's strong floor by post-tensioning to produce a rigid base connection. Out-of-
plane lateral displacements at the top of the specimen were restrained by two adjustable steel
arms connecting the support columns and the top of the loading beam through pin connections.
The objective of the test setup was to simulate the effect of seismic loads on the lower portion of
a 9 m high wall in a three-storey building (referred to as simulated wall in the paper). The
vertical compression loading was held constant at 660 kN (corresponding to axial compressive
stress of 0.086f'm). Lateral load on the specimen was applied through the horizontal actuator in
combination with the net horizontal load from the sum of the two vertical actuators. The
overturning moment representing the loads in the upper stories of the simulated wall was created
by combined the effects of lateral and vertical loads of the actuators. The loads in the vertical
actuators were slaved to the load from the horizontal actuator by a linear relationship derived
from equilibrium equations relating the simulated wall to the wall specimen. This relation is
demonstrated in Figure 3.
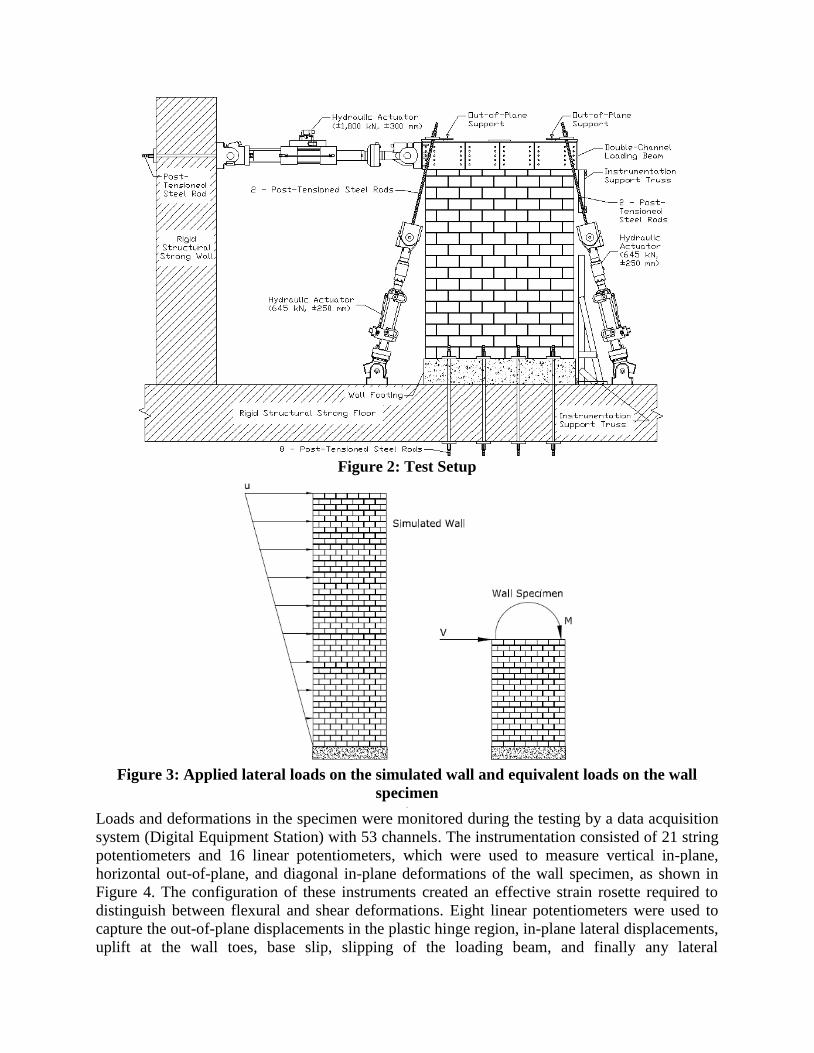
Figure 2: Test Setup
Figure 3: Applied lateral loads on the simulated wall and equivalent loads on the wall
specimen .
Loads and deformations in the specimen were monitored during the testing by a data acquisition
system (Digital Equipment Station) with 53 channels. The instrumentation consisted of 21 string
potentiometers and 16 linear potentiometers, which were used to measure vertical in-plane,
horizontal out-of-plane, and diagonal in-plane deformations of the wall specimen, as shown in
Figure 4. The configuration of these instruments created an effective strain rosette required to
distinguish between flexural and shear deformations. Eight linear potentiometers were used to
capture the out-of-plane displacements in the plastic hinge region, in-plane lateral displacements,
uplift at the wall toes, base slip, slipping of the loading beam, and finally any lateral
displacements of the support columns due to potential loading from the out-of-plane supports. In
addition, two inclinometers were utilized to capture the out-of-plane rotations of the plastic hinge
region and 8 strain gauges were monitored strains in the 15M reinforcing bars at the wall ends.
a) b)
Figure 4: Test Instrumentation: a) West face, and b) East face
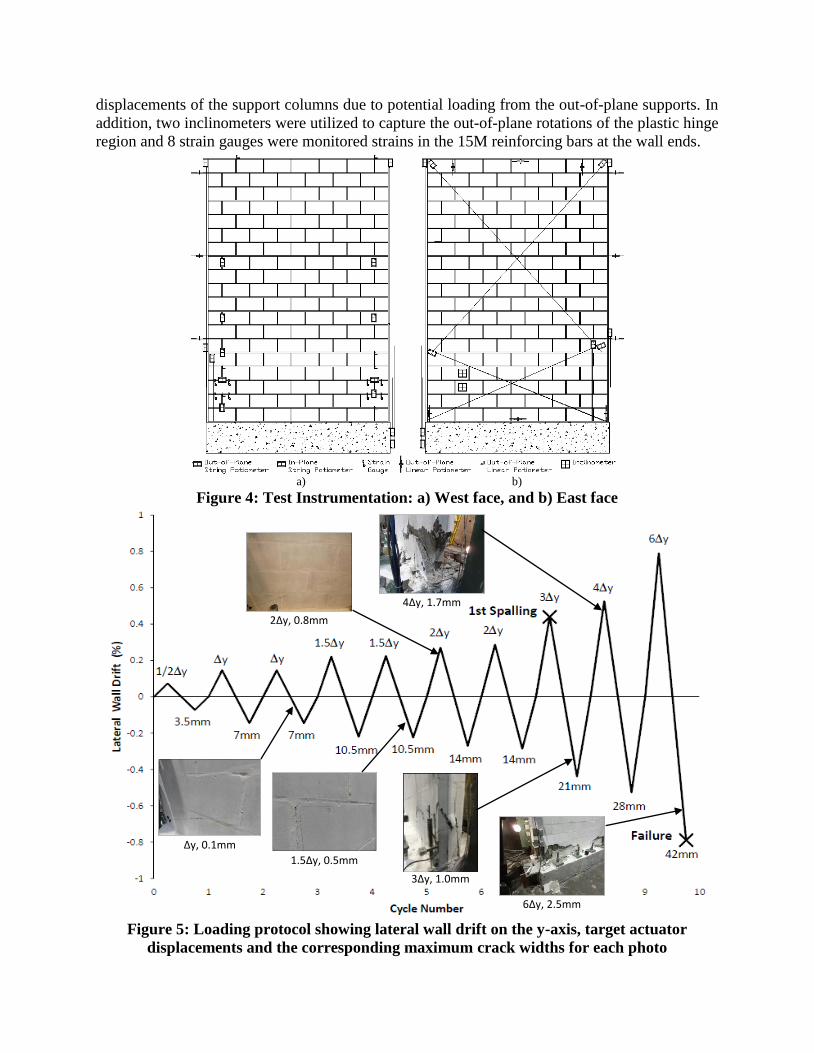
Figure 5: Loading protocol showing lateral wall drift on the y-axis, target actuator
displacements and the corresponding maximum crack widths for each photo
Δy, 0.1mm
1.5Δy, 0.5mm
2Δy, 0.8mm
3Δy, 1.0mm
4Δy, 1.7mm
6Δy, 2.5mm

The loading protocol is shown in Figure 5. The testing started after the initial vertical
compression load of 660 kN had been applied by the near vertical actuators. The loading
protocol was displacement-controlled, and it consisted of one or more cycles of incrementally
increasing lateral displacements. The target displacement for each cycle was expressed in terms
of Δy, the yield deflection in the outermost vertical reinforcing bars in the wall. The Δy value of 7
mm was determined by analysis and confirmed by the test data. It is important to note that the
target displacement levels shown in Figure 5 were used by the controls during the testing;
however, somewhat different displacement values are shown on the force-displacement
hysteresis curves in Figure 10. This difference is due to gap closing within the test setup and the
deflection of the strong wall.
TEST RESULTS
The specimen behaviour was elastic during the initial displacement cycles (0.5Δy and Δy). A
number of cracks were observed at the Δy displacement level. The cracks were mapped at the end
of each half-cycle (defined as the point of zero load). The cracks were located along the lower
half of the wall specimen, and were mostly in the form of minor stepped cracks along the bed
joints which originated at the wall ends. The maximum crack width of approximately 0.1 mm
was observed along the bed joints. Figures 6 displays the crack pattern recorded during the test.
Figure 6: Cracking patterns at increasing target displacement levels
At the 1.5Δy displacement level, the cracks observed at the end of the previous displacement
cycle (Δy) further propagated, and a few new cracks were noticed. The cracking pattern remained
primarily in the form of stepped cracks that originated at the ends of the specimen in its lower
half. There were two instances of diagonal cracks extending through the block units (see Figure
8), however most of cracking took place along the mortar joints. Maximum crack widths of 0.5
mm were observed at several locations at this stage.
During the 2Δy displacement cycle, additional cracking occurred along the end faces of the wall,
and relatively few mortar joints remained uncracked. Flexural horizontal cracks also began to
open along the North and South faces, as well as along the base of the specimen. At this point,
cracking was also observed in the footing but it was deemed not to affect the test results as the
crack width remained below 0.3 mm throughout the test. Maximum horizontal and vertical crack
widths of 0.8 mm and 0.1 mm, respectively, were measured along the existing cracks.
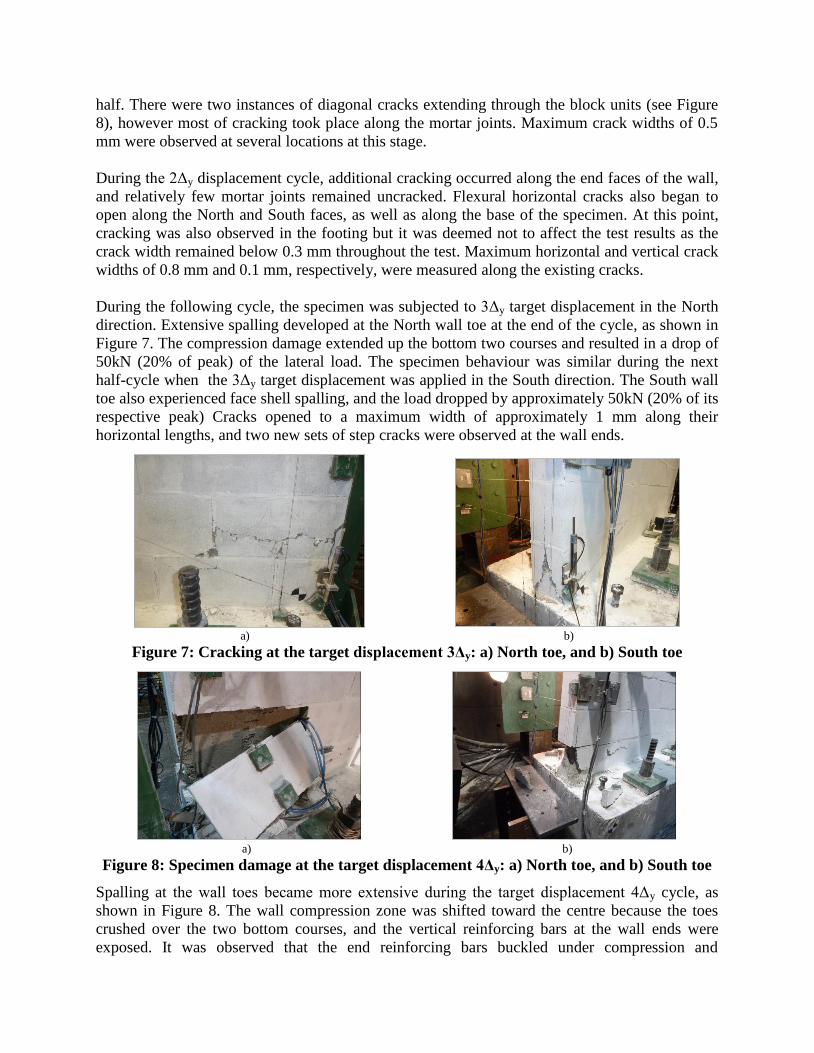
During the following cycle, the specimen was subjected to 3Δy target displacement in the North
direction. Extensive spalling developed at the North wall toe at the end of the cycle, as shown in
Figure 7. The compression damage extended up the bottom two courses and resulted in a drop of
50kN (20% of peak) of the lateral load. The specimen behaviour was similar during the next
half-cycle when the 3Δy target displacement was applied in the South direction. The South wall
toe also experienced face shell spalling, and the load dropped by approximately 50kN (20% of its
respective peak) Cracks opened to a maximum width of approximately 1 mm along their
horizontal lengths, and two new sets of step cracks were observed at the wall ends.
a) b)
Figure 7: Cracking at the target displacement 3Δy: a) North toe, and b) South toe
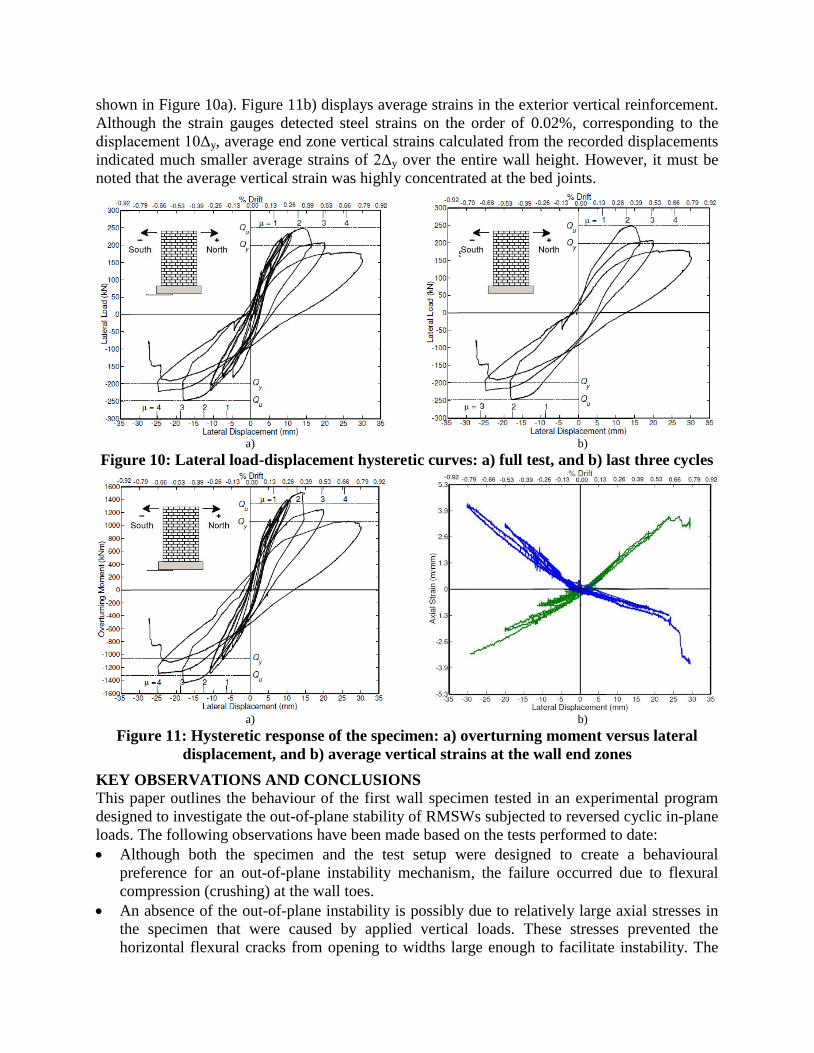
a) b)
Figure 8: Specimen damage at the target displacement 4Δy: a) North toe, and b) South toe
Spalling at the wall toes became more extensive during the target displacement 4Δy cycle, as
shown in Figure 8. The wall compression zone was shifted toward the centre because the toes
crushed over the two bottom courses, and the vertical reinforcing bars at the wall ends were
exposed. It was observed that the end reinforcing bars buckled under compression and

straightened under tension. The plastic hinge became apparent over approximately a 800 mm
height starting at the wall base (bottom 4 courses). Cracking along the bed joints at the North and
South wall ends extended up the lower 11 courses. Several major horizontal cracks were
observed on the West and East wall faces, with the maximum widths of up to 1.7 mm.
The final target displacement load cycle of 6Δy in both the North and South directions concluded
the test. Loss of integrity of the wall toes became very significant at this stage, as shown in
Figure 9. The specimen effectively lost the load-bearing capacity of approximately 1000 mm of
wall length (nearly 40% of the overall wall length) due to the compression failure at the North
end. It was observed from the spalled face shells that the interior face shell surface in contact
with the grout was clean and smooth, which is a sign of poor bond. During the same half-cycle,
the buckled reinforcement at the South wall end nearly straightened under tension. Cracks along
the horizontal bed joints opened to a maximum 2.5 mm width, while the vertical crack widths
remained within the 0.3 mm range. Besides additional large cracks at the wall toes, a new
stepping crack formed at the compression end in the upper portion of the wall. The specimen
demonstrated similar behaviour during the subsequent displacement half-cycle in the South
direction. At this stage, crushing occurred in the South wall toe subjected to compression, and
the reinforcement at the North end straightened under tension. Near the end of this half-cycle, a
major drop in the load of 115 kN (roughly 60% of this cycles peak load) was observed. This
effectively constituted failure of the wall specimen. After unloading to zero lateral load, the
presence of vertical loads caused crushing of the specimen near the base. It is estimated that an
effective loss of the load-bearing capacity at the wall toes over five or more block lengths
resulted in excessively high compressive stress (approximately 0.5f'm) at the centre of the wall.
a) b)
Figure 9: Specimen failure at the target displacement 6Δy: a) North toe, and b) South toe
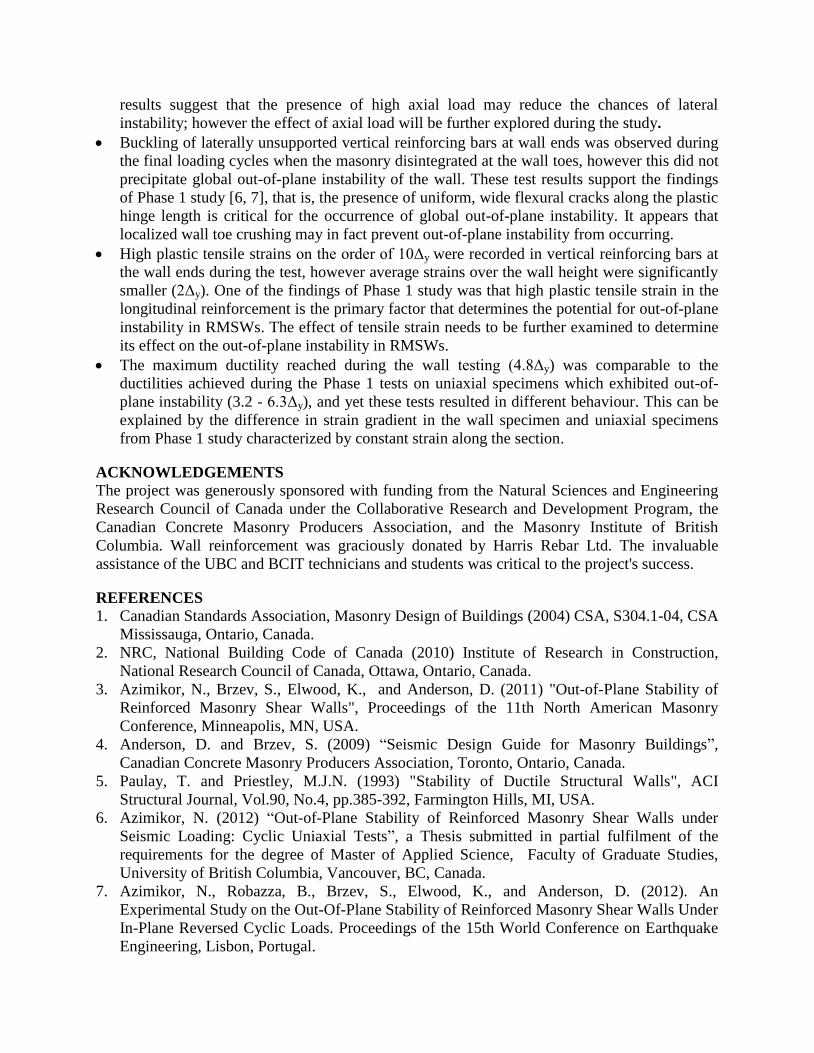
The load-displacement hysteresis curves are shown in Figure 10. The curves were obtained by
plotting the recorded lateral forces from the actuator load cell versus the displacement at the 18th
course. Figure 10a) demonstrates that the specimen displayed stable and relatively symmetrical
hysteretic behaviour until the maximum load, Qu, of 250 kN had been reached (corresponding to
the displacement cycle 3Δy). The corresponding drift ratio was 0.36%, and the displacement
ductility ratio () was 2.1. Note that the equivalent yield load, Qy, was approximately determined
from the hysteretic behaviour and supported by the strain gauge data. Figure 10b) shows the final
three load cycles before the failure. It can be seen that a 20% drop in load occurred at the 0.52%
drift level, and the corresponding value was 3.1. The maximum ductility ratio reached during
the test was 4.6, and the corresponding drift ratio was 0.79%. Figure 11a) shows the hysteresis
curves for overturning moment versus lateral displacement, which are very similar to the curves
shown in Figure 10a). Figure 11b) displays average strains in the exterior vertical reinforcement.
Although the strain gauges detected steel strains on the order of 0.02%, corresponding to the
displacement 10Δy, average end zone vertical strains calculated from the recorded displacements
indicated much smaller average strains of 2Δy over the entire wall height. However, it must be
noted that the average vertical strain was highly concentrated at the bed joints.
a) b)
Figure 10: Lateral load-displacement hysteretic curves: a) full test, and b) last three cycles
a) b)
Figure 11: Hysteretic response of the specimen: a) overturning moment versus lateral
displacement, and b) average vertical strains at the wall end zones
KEY OBSERVATIONS AND CONCLUSIONS
This paper outlines the behaviour of the first wall specimen tested in an experimental program
designed to investigate the out-of-plane stability of RMSWs subjected to reversed cyclic in-plane
loads. The following observations have been made based on the tests performed to date:
Although both the specimen and the test setup were designed to create a behavioural
preference for an out-of-plane instability mechanism, the failure occurred due to flexural
compression (crushing) at the wall toes.
An absence of the out-of-plane instability is possibly due to relatively large axial stresses in
the specimen that were caused by applied vertical loads. These stresses prevented the
horizontal flexural cracks from opening to widths large enough to facilitate instability. The
results suggest that the presence of high axial load may reduce the chances of lateral
instability; however the effect of axial load will be further explored during the study.
Buckling of laterally unsupported vertical reinforcing bars at wall ends was observed during
the final loading cycles when the masonry disintegrated at the wall toes, however this did not
precipitate global out-of-plane instability of the wall. These test results support the findings
of Phase 1 study [6, 7], that is, the presence of uniform, wide flexural cracks along the plastic
hinge length is critical for the occurrence of global out-of-plane instability. It appears that
localized wall toe crushing may in fact prevent out-of-plane instability from occurring.
High plastic tensile strains on the order of 10Δy were recorded in vertical reinforcing bars at
the wall ends during the test, however average strains over the wall height were significantly
smaller (2Δy). One of the findings of Phase 1 study was that high plastic tensile strain in the
longitudinal reinforcement is the primary factor that determines the potential for out-of-plane
instability in RMSWs. The effect of tensile strain needs to be further examined to determine
its effect on the out-of-plane instability in RMSWs.
The maximum ductility reached during the wall testing (4.8Δy) was comparable to the
ductilities achieved during the Phase 1 tests on uniaxial specimens which exhibited out-of-
plane instability (3.2 - 6.3Δy), and yet these tests resulted in different behaviour. This can be
explained by the difference in strain gradient in the wall specimen and uniaxial specimens
from Phase 1 study characterized by constant strain along the section.
ACKNOWLEDGEMENTS
The project was generously sponsored with funding from the Natural Sciences and Engineering
Research Council of Canada under the Collaborative Research and Development Program, the
Canadian Concrete Masonry Producers Association, and the Masonry Institute of British
Columbia. Wall reinforcement was graciously donated by Harris Rebar Ltd. The invaluable
assistance of the UBC and BCIT technicians and students was critical to the project's success.
REFERENCES
1. Canadian Standards Association, Masonry Design of Buildings (2004) CSA, S304.1-04, CSA
Mississauga, Ontario, Canada.
2. NRC, National Building Code of Canada (2010) Institute of Research in Construction,
National Research Council of Canada, Ottawa, Ontario, Canada.
3. Azimikor, N., Brzev, S., Elwood, K., and Anderson, D. (2011) "Out-of-Plane Stability of
Reinforced Masonry Shear Walls", Proceedings of the 11th North American Masonry
Conference, Minneapolis, MN, USA.
4. Anderson, D. and Brzev, S. (2009) “Seismic Design Guide for Masonry Buildings”,
Canadian Concrete Masonry Producers Association, Toronto, Ontario, Canada.
5. Paulay, T. and Priestley, M.J.N. (1993) "Stability of Ductile Structural Walls", ACI
Structural Journal, Vol.90, No.4, pp.385-392, Farmington Hills, MI, USA.
6. Azimikor, N. (2012) “Out-of-Plane Stability of Reinforced Masonry Shear Walls under
Seismic Loading: Cyclic Uniaxial Tests”, a Thesis submitted in partial fulfilment of the
requirements for the degree of Master of Applied Science, Faculty of Graduate Studies,
University of British Columbia, Vancouver, BC, Canada.
7. Azimikor, N., Robazza, B., Brzev, S., Elwood, K., and Anderson, D. (2012). An
Experimental Study on the Out-Of-Plane Stability of Reinforced Masonry Shear Walls Under
In-Plane Reversed Cyclic Loads. Proceedings of the 15th World Conference on Earthquake
Engineering, Lisbon, Portugal.