Seismic safety assessment of unreinforced masonry low-rise ...

Implications of the spandrel type on the lateral behavior ofunreinforced masonry walls
Fulvio Parisi*,†, Nicola Augenti and Andrea Prota
Department of Structures for Engineering and Architecture, University of Naples Federico II, Naples, Italy
SUMMARY
Seismic response of unreinforced masonry (URM) buildings is largely influenced by nonlinear behavior ofspandrels, which provide coupling between piers under in-plane lateral actions. Seismic codes do not appropri-ately address modeling and strength verification of spandrels, adapting procedures originally proposed for piers.Therefore, research on spandrels has received significant attention in some earthquake-prone countries, such asItaly and New Zealand. In the last years, the authors of this paper have performed both monotonic and cyclicin-plane lateral loading tests on full-scale masonry walls with single opening and different spandrel types. Thosetests were carried out in a static fashion and with displacement control. In this paper, experimental outcomes fortwo as-built specimens are presented and compared with those obtained in the past for another as-built specimenwith a wooden lintel above the opening. In both newly tested specimens, the masonry above the opening wassupported by a shallow masonry arch. In one of those specimens, a reinforced concrete (RC) bond beam wasrealized on top of the spandrel, resulting in a composite URM-RC spandrel. Then, the influence of spandrel typeis analyzed in terms of observed damage, force–drift curves, and their bilinear idealizations, which allowed tocompare displacement ductility and overstrength of wall specimens. Furthermore, effects of rocking behavior ofpiers are identified, highlighting their relationship with hysteretic damping and residual drifts. Copyright ©2014 John Wiley & Sons, Ltd.
Received 28 October 2013; Revised 25 March 2014; Accepted 1 May 2014
KEY WORDS: full-scale testing; in-plane lateral behavior; masonry walls; spandrels
1. INTRODUCTION
Destructive earthquakes have demonstrated that unreinforced masonry (URM) buildings can suffer heavydamage to spandrels, that is, horizontal strips connecting different piers (Figure 1(a)). This occursespecially if local out-of-plane mechanisms do not take place, and hence, walls are mainly subjected toin-plane lateral loads [1]. In this case, spandrels effectively participate to the global seismic response ofthe URM building, resulting in the need to incorporate them as primary structural components in thecapacity model of the structure. How to account for this is not appropriately an issue of seismic codes(e.g., [2–4]) where simplified procedures for modeling and strength verification of spandrels areprovided by just adapting those formulated for piers (e.g., [5–7]).
Different spandrel types can be identified in URM buildings, depending on the type of lintel above theopening, namely at the lower edge of the spandrel, and the presence/absence of tensile resistant elementson top of the spandrel. Dealing with existing URM buildings not designed for earthquake resistance,spandrels have only stone, masonry, wooden, or steel lintels above openings, which transfer gravityloads to piers. Especially in the case of old URM buildings with historical value, the masonry above the
*Correspondence to: Fulvio Parisi, Department of Structures for Engineering and Architecture, University of NaplesFederico II, via Claudio 21, 80125 Naples, Italy.†E-mail: [email protected]
Copyright © 2014 John Wiley & Sons, Ltd.
EARTHQUAKE ENGINEERING & STRUCTURAL DYNAMICSEarthquake Engng Struct. Dyn. 2014; 43:1867–1887Published online 28 May 2014 in Wiley Online Library (wileyonlinelibrary.com). DOI: 10.1002/eqe.2441

opening is supported by a regular arch (Figure 1(b)) or a flat arch (Figure 1(c)), which transfers gravityloads as both downward vertical forces and outward horizontal forces, the latter referred to as thrusts.Otherwise, wooden or steel lintels can be found in ancient URM buildings (Figure 1(d) and (e)). A steellintel is usually realized with two I-beams that are transversely connected by steel ties to avoid potentialtorsional-flexural buckling. In this case, lateral external space along the beams is filled with mortar justto provide flat surfaces. In most cases, earthquake damage mainly affects spandrel panels, namely theparts of spandrels between consecutive openings, whereas spandrel–pier intersection zones, also calledjoint panels [7], are usually found to be undamaged. Figure 2(a)–(c) shows damage to spandrel panelsafter the 2009 L’Aquila and 2012 Emilia-Romagna earthquakes in Italy.
Since the last century, reinforced concrete (RC) lintels have been constructed in most URMbuildings. When the importance of wall-to-wall and floor-to-wall connections to provide a global‘box-type’ seismic response was recognized after major seismic events, tensile resistant elements,for example, wooden/steel ties and RC bond beams, were inserted on top of spandrels. Particularly,RC bond beams provide the following types of seismic resistance to URM walls with openings: (i)out-of-plane bending resistance, because beams transfer most part of horizontal diaphragm actions tolongitudinal walls; and (ii) in-plane bending resistance, because their longitudinal reinforcing steelbars provide both tensile and compressive strengths to the spandrel, while concrete providesadditional compressive strength. Therefore, URM spandrels with masonry arches or wooden lintelsabove openings are typically observed in ancient URM buildings not designed for earthquakeresistance, whereas composite URM-RC spandrels are usually identified in modern URM buildingseither in as-built conditions or after seismic retrofitting.
Experimental programs on URM building models with different spandrel types have been carriedout in the last 15 years. Benedetti et al. [8] performed a pioneering research work based on shakingtable tests of 24 half-scale building models. In this case, some models were made of brick masonryand wooden lintels, whereas other models were made of stone masonry and regular arches aboveopenings. Those tests and subsequent energy evaluations [9] revealed a key concept of the seismicresponse of URM buildings, that is, their energy dissipation capacity can be maximized if damagedevelops within spandrels rather than piers. Bothara et al. [10] performed a shaking table test on a
(a) (c)(b)
Figure 2. Observed damage to spandrel panels: (a) partial collapse of regular arch; (b) flexural cracks closeto spandrel–pier intersection; and (c) diagonal shear cracks.
(c)(b)
(e)(d)(a)
Figure 1. Spandrel types in ancient unreinforced masonry walls with openings: (a) identification of spandrelsand piers; (b) spandrel with regular arch; (c) spandrel with flat arch; (d) spandrel with wooden lintel; and (e)
spandrel with steel lintel.
1868 F. PARISI, N. AUGENTI AND A. PROTA
Copyright © 2014 John Wiley & Sons, Ltd. Earthquake Engng Struct. Dyn. 2014; 43:1867–1887DOI: 10.1002/eqe

half-scale masonry building model with both wooden lintels and flat masonry arches. That testconfirmed that spandrels can experience not only diagonal shear cracking (Figure 2(c)) but alsovertical flexural cracks that originate at the location of opening corners and develop according tomasonry interlocking effects at spandrel–pier intersections (Figure 2(b)).
On the basis of observed postearthquake damage evidence and such preliminary experimental results,research programs have been underway for several years to investigate the mechanics of spandrels andtheir influence on nonlinear seismic behavior of URM buildings. The Italian Network of EarthquakeEngineering University Laboratories, whose Italian acronym is ReLUIS, have funded two researchprograms including specific tasks to investigate the role of spandrels in the in-plane behavior of URMwalls. Full-scale testing was believed to be the most effective solution to that end, so differentspandrel–pier systems in terms of geometry, masonry assemblage, and lintel type have been tested byseveral research groups [11–13]. In particular, the authors of this paper have investigated the influenceof masonry spandrels on the in-plane lateral behavior of tuff masonry walls with single opening,reproducing some of the typical spandrel types in Mediterranean countries. The first wall specimen hada wooden lintel above the opening and was tested in both as-built and predamaged conditions, as wellas after repair and external strengthening with an inorganic matrix–grid composite material [13]. Thisinvestigation was motivated by the large presence of tuff masonry constructions (including culturalheritage goods) in many earthquake-prone regions and consisted of quasistatic lateral loading tests indisplacement control. Furthermore, experimental testing was carried out on walls with openings, inorder to assess the influence of spandrels including spandrel–pier interaction effects, for example, themodification of boundary conditions to the spandrel as a result of damage to piers. This feature of realbehavior cannot be captured by testing single spandrel elements or spandrel–pier assemblages wherethe drift on the spandrel is directly imposed as differential vertical displacements or rotations to thepiers, which remain macroscopically undamaged over the entire test duration (e.g., [11, 12]).
In this work, the main experimental findings of two additional cyclic tests on full-scale tuff masonrywalls with an opening and a regular masonry arch above the opening, rather than a straight lintel, arepresented. One of those specimens also included a RC bond beam on top of the whole spandrel. Suchtests allow to increase knowledge about pros and cons of masonry arches and RC bond beams inspandrels, giving the chance to improve seismic codes for design and assessment of URM buildingstructures. Experimental results are compared with those previously obtained for the first specimen,in terms of crack patterns, force–drift curves, displacement ductility, overstrength, and rockingbehavior effects. Finally, hysteretic damping and residual drifts are discussed as they are related toenergy dissipation capacity and seismic loss assessment.
2. EXPERIMENTAL PROGRAM
Quasistatic in-plane lateral loading tests were carried out on two wall specimens with different spandreltypes. In view of a comparative assessment, the first wall specimen discussed by the authors in [13] isherein recalled specimen W. The additional specimens forming the core of this paper are labeled as Aand AB in the following. Specimen A had a regular masonry arch above the opening, whereasspecimen AB had both the regular arch and a RC bond beam running on top of the spandrel.
2.1. Description of specimens
Each specimen was a symmetrical tuff masonry wall with a central opening (Figure 3(a)–(c)). Tuffmasonry was composed of yellow tuff stones that were 100× 150× 300mm3 in size and were bondedby mortar joints with nominal thickness of 10mm. Tuff stone masonry layers were alternated along theheight of the specimen in a way to obtain discontinuous head joints and a running bond masonry. Theoverall geometry of specimens A and AB was equal to that of specimen W, which was defined on thebasis of the following: (i) mechanical characterization tests on tuff stones, mortar, and masonry as awhole; and (ii) numerical predictions provided by static pushover analysis of macroelement modelsaccording to [7]. Details on material testing and design of specimens can be found in [13–15]. It is onlyunderlined here that the design of specimens was aimed at developing most of damage within the
IMPLICATIONS OF THE SPANDREL TYPE ON THE LATERAL BEHAVIOR OF URM WALLS 1869
Copyright © 2014 John Wiley & Sons, Ltd. Earthquake Engng Struct. Dyn. 2014; 43:1867–1887DOI: 10.1002/eqe

spandrel, in order to capture its impact on the in-plane behavior of specimens. Because of the nonlinearityin the lateral behavior of walls with openings, the authors calibrated the magnitude of the initial axial loadsto apply on the piers before lateral loading (Section 2.3). That calibration was carried out by performingpushover analysis on macroelement models subjected to different axial load magnitudes and hencederiving a loading condition where the spandrel was expected to fail before the piers.
Each specimen can be regarded as an assemblage of two equal piers connected by a spandrel panel.Both the piers and the spandrel panel were 1.70m long, resulting in a total length of the specimen equalto 5.10m. Three tuff stone masonry layers were built over the spandrel, to obtain pier continuity inelevation with an ideal upper story. Indeed, specimens were supposed to be taken out from a typicalmultistory wall with openings. The total height of the specimen was then 3.62m, while its thicknesswas 0.31m, that is, the sum of two 0.15-m-thick masonry wythes with a collar mortar joint. In thecase of specimen W the height of the opening and spandrel was 2.30 and 1.00m, respectively.Therefore, the rise of masonry arches in specimens A and AB was set to 330mm in order to obtainthe intrados of the keystone at the same height of the wooden lintel in specimen W and hence aspandrel height at the specimen centerline of 1.00m for both specimens. The rise-to-length ratio ofthe arch was about 1/5, and the depth of the arch cross-section was equal to 300mm.
In the case of specimen AB, the RC bond beam was cast in place, and its cross-section was310× 230mm2. According to specifications of the past Italian Masonry Code (IMC) [16], practicerules, and also some current seismic codes [4, 17], the bond beam was reinforced with four longitudinalsteel bars (14mm in diameter) and 2-leg steel stirrups (8mm in diameter) with 200mm spacing. It isemphasized that the current Italian Building Code (IBC) [4] establishes that stirrups should be at least6mm in diameter, and their spacing should not be larger than 250mm. IMC provided the samedetailing rules, while allowing a stirrup spacing up to 300mm and increasing the minimum stirrupdiameter to 8mm in the case of URM buildings with more than six floors. No specifications about RCbond beams are provided by Eurocode 8 (EC8) part 1 [17] for new URM buildings.
The tuff stones and mortar used for the construction of specimens were experimentally characterizedthrough compression, tensile and direct shear tests [14, 15]. Tuff masonry as a whole was alsoinvestigated through both simple and diagonal compression tests to simulate lateral loading tests bymeans of macroelement pushover analysis. Masonry joints were made of a hydraulic mortar, whichwas a mixture of natural sand and pozzolana-like reactive aggregates with 1 : 6.25 water/sand ratioby weight. Mean unit weight of tuff stones and mortar was, respectively, equal to 11.72 kN/m3
(a)
(b) (c)
Figure 3. Geometry of (a) specimen W; (b) specimen A; and (c) specimen AB (dimensions in mm).
1870 F. PARISI, N. AUGENTI AND A. PROTA
Copyright © 2014 John Wiley & Sons, Ltd. Earthquake Engng Struct. Dyn. 2014; 43:1867–1887DOI: 10.1002/eqe

(with coefficient of variation CoV = 1.73%) and 16.92 kN/m3 (CoV = 0.65%). Mean values ofuniaxial compressive strength fc, uniaxial tensile strength ft, compressive Young’s modulus Ec,and shear modulus G are outlined in Table I along with their CoV in round parentheses.
Direct shear tests provided shear sliding strength at zero confining stress τ0,bj= 0.15MPa and initialfriction coefficient μ= 0.29 for the tuff stone-mortar interface (further properties of that interface can befound in [15]).
Finally, concrete and reinforcing steel bars employed to build the RC bond beam on top of the spandrelof specimen AB were experimentally characterized by displacement-controlled tests. In particular,compressive and three-point bending tests were carried out on concrete cubes and prismatic specimens,respectively. Tensile tests were carried out on steel bar specimens. Mean values and CoV (in roundparentheses) of mechanical properties of concrete and reinforcing steel bars are listed in Table II, wherefcc and fct are the cube compressive strength and uniaxial tensile strength of concrete; fy and ftu are theyielding and ultimate strengths of steel bars, respectively; Ecc is the compressive Young’s modulus ofconcrete; and Agt is the maximum elongation of steel bars.
Experimental results in Table II indicate that the concrete and reinforcing steel used for the RC bondbeam are very close to type C20/25 concrete and type B450C reinforcing steel, according to EC2 [18]and IBC [4], respectively. Actually, such concrete and steel types are also equivalent to the concretetype Rck250 and steel type Feb44k in the past Italian code on RC and metallic structures [19].
2.2. Test setup and instrumentation
The experimental setup employed for in-plane lateral loading tests is shown in Figure 4. First of all, Ω-shaped steel plates were bolted to squared holes of the laboratory strong floor at the location of piercorners, in the transverse direction of the specimen. Then, RC beams (200 × 310 × 1900mm3 in size)were cast in place over each couple of plates, in the longitudinal direction of the specimen. Shearkeys welded to the Ω-shaped plates ensured a rigid connection of the beams to the strong floor. TheRC beams were cured during 28 days, and the masonry piers were built up over them withoutsupplemental shear keys that is by realizing just a simple mortar joint as pier–beam connection. Thisis in agreement with past practice rules and codes (e.g., [16]). It is also noted that the RC beams atthe base of piers were made of the same concrete and reinforcing steel of the bond beam inspecimen AB. After each specimen was built up, two rigid steel beams were placed over the piers touniformly distribute vertical forces simulating gravity loads. Such forces were applied bybidirectional hydraulic jacks with 500 kN nominal capacity, which were placed over the steel beamsat the centerlines of the piers. Couples of polytetrafluoroethylene (PTFE) layers were installedbetween hydraulic jacks and rigid beams to minimize friction at their interface.
Table I. Mechanical properties of constituent materials of tuff masonry.
Material fc [MPa] ft [MPa] Ec [GPa] G [GPa]
Tuff stones 4.13 (18.54%) 0.23 (22.06%) 1.54 (6.43%) 0.44 (25.78%)Pozzolana-like mortar 2.50 (7.34%) 1.43 (6.23%) 1.52 (22.12%) 0.66 (10.66%)
Table II. Mechanical properties of constituent materials of reinforced concrete.
Material fcc [MPa] fct [MPa] Ecc [GPa] fy [MPa] ftu [MPa] ftu/fy Agt [%]
Concrete 35.29(14.31%)
2.82(9.48%)
27.86(10.18%)
— — — —
D8 reinforcing steel bars — — — 545.46(5.36%)
632.63(2.43%)
1.16(3.18%)
11.73(9.63%)
D14 reinforcing steel bars — — — 510.22(5.78%)
605.57(3.74%)
1.19(2.11%)
15.59(6.35%)
IMPLICATIONS OF THE SPANDREL TYPE ON THE LATERAL BEHAVIOR OF URM WALLS 1871
Copyright © 2014 John Wiley & Sons, Ltd. Earthquake Engng Struct. Dyn. 2014; 43:1867–1887DOI: 10.1002/eqe

Transverse steel frames were installed over the piers at the location of their centerlines, in order toprovide contrast against vertical loading. Cap beams of transverse frames were properly stiffened toavoid local buckling, and bolted connections were realized for both beam–column and column–baseconnections. The columns were connected by a couple of steel beams at each specimen side toprevent potential out-of-plane failure modes.
Finally, a second reaction system consisting of a nonprismatic steel wall was used to apply lateralloading to the specimen. The reaction wall was anchored to the laboratory strong floor by means offour steel bars, each pretensioned at 400 kN. Cyclic lateral loading was applied by a servocontrolledhydraulic actuator with 500 kN nominal compressive capacity, 290 kN nominal tensile capacity, and±250mm stroke. That actuator was bolted on top of the reaction wall and supported by anadditional cable-stayed system. The application of load reversals to the specimen was allowed by sixsteel bars (18mm in diameter), which were bolted to the rigid end plate of the actuator and toanother rigid plate at the opposite edge of the specimen. A spherical hinge was installed between theend of the horizontal actuator and its rigid plate, in order to apply in-plane lateral loading withoutany parasite out-of-plane action for the specimen. A load cell with nominal and maximum capacitiesequal to 200 and 250 kN, respectively, was used to measure the actual lateral load, which wasapplied to the specimen.
Two different types of displacement transducers were mounted over specimens: linear variabledifferential transformers (LVDTs) and wire potentiometer transducers (PTs). Joint panels were notinstrumented as they were expected to experience small deformations and no macroscopic cracksowing to the geometry of the specimens (assumption confirmed by tests). The typical arrangementof displacement transducers is shown in Figure 5. LVDTs were installed at end sections of piers andspandrel panel above the opening, to obtain data on flexural deformations, whereas PTs wereemployed to measure both shear and rocking-induced deformations.
In particular, four vertical LVDTs were installed at the base of the piers and put in contact against theRC beams (see the front side in Figure 5), in order to measure the width of potential tensile horizontalcracks induced by the rocking behavior of the piers. The four vertical PTs along the height of the piers(back side) were anchored to the RC beams as well, to include wire elongations related to rocking-induced cracks. In the case of specimen AB, the RC bond beam was instrumented as follows: eighthorizontal LVDTs over cross-sections located in the proximity of spandrel–pier intersections, an axialhorizontal LVDT at the mid section of the RC bond beam. The first group of LVDTs was installed tomeasure deformations at the location of potential plastic hinges, which were expected to be caused bylarge drift demands on the spandrel panel as a result of piers rocking. The horizontal LVDT wasmounted to measure axial deformations of the RC bond beam.
Figure 4. Experimental setup.
1872 F. PARISI, N. AUGENTI AND A. PROTA
Copyright © 2014 John Wiley & Sons, Ltd. Earthquake Engng Struct. Dyn. 2014; 43:1867–1887DOI: 10.1002/eqe
An additional potentiometer tagged as PT #1 was installed at the height of the horizontal actuatorbut on the opposite side with respect to it. That potentiometer allowed to measure actual lateraldisplacements experienced by the specimens. Real-time readings at the load cell and PT #1 wereassumed to be more reliable than load and stroke measurements provided by the actuator itself, toplot force–drift curves for each specimen.
2.3. Loading protocols
Lateral loading tests on specimens W, A, and AB were based on vertical loading of piers and then lateralloading applied at the height of the spandrel. Vertical loading consisted of two concentrated forces appliedat the top of the piers by the hydraulic jacks. After two initial load cycles were completed to obtaineffective contrast between jacks and piers, the magnitude of vertical forces was monotonicallyincreased up to 200 kN (corresponding to approximately 10% of the mean ultimate load of pier cross-sections). Then, vertical forces were kept constant, and the horizontal actuator began to apply lateralloading on the specimen in a quasistatic fashion and with displacement control, to capture the softenedpostpeak force–drift response under increasing deformation demand. Displacement-controlled loadingwas managed by the computer program of the data acquisition system, where a target displacementtime history was implemented. Therefore, the lateral force was changed at each time step in a way tomeasure the target displacement on the horizontal actuator. All measurements were recorded at asampling rate equal to 5Hz. The lateral loading stage of each test started with two displacement cyclesbetween 0.15 and 0.25mm to reach good contrast between specimen and actuator. After those cycleswere completed, lateral loading was imposed to the specimen in accordance to the target displacementtime history inputted in the computer program. The time history defined for specimen W was differentfrom those of specimens A and AB. Indeed, specimen W was tested under monotonically increasingdisplacements until a maximum displacement dmax=28mm was read at the actuator, whichcorresponded to the onset of damage to the spandrel. That stop was motivated by the need to assess thespecimen response also in predamaged and repaired-upgraded conditions, as discussed in [13]. On theother hand, both specimens A and AB were subjected to cyclic loading up to a near-collapseperformance level. Lateral loading was imposed in accordance to the target displacement time historyshown in Figure 6, which was composed of 17 cyclic displacement blocks, each of them consisting ofthree cycles at each amplitude peak, that is, a total number of 51 cycles leading to dmax=95.1mm. Thedisplacement rate was set to 0.70mm/s, whereas the displacement increment between consecutivegroups of three displacement cycles was equal to 5.6mm.
If the interstory drift ratio θw is introduced as lateral displacement d divided by the height of lateralloading line from the base of the piers (y0 = 3050mm), that is, θw= d/y0, it can be equivalently statedthat monotonic loading on specimen W was stopped at a maximum drift θmax=0.9%, whereas cyclicloading on specimens A and AB was defined in a way to reach θmax=3.1%. Nevertheless, cyclic testswere expected to be stopped at the attainment of near-collapse performance level for the specimen. Thetarget displacement time history was then followed up to actual maximum drifts that were different forspecimens A and AB, depending on the lateral strength drop measured by the horizontal actuator and
Figure 5. Typical instrumentation of specimens (dimensions in mm).
IMPLICATIONS OF THE SPANDREL TYPE ON THE LATERAL BEHAVIOR OF URM WALLS 1873
Copyright © 2014 John Wiley & Sons, Ltd. Earthquake Engng Struct. Dyn. 2014; 43:1867–1887DOI: 10.1002/eqe

the damage level observed during the test. The near-collapse performance level was associated with alateral strength drop of at least 20% on the postpeak branch of the force–drift envelope curve relatedeither to positive or negative loading orientation.
3. OBSERVED DAMAGE
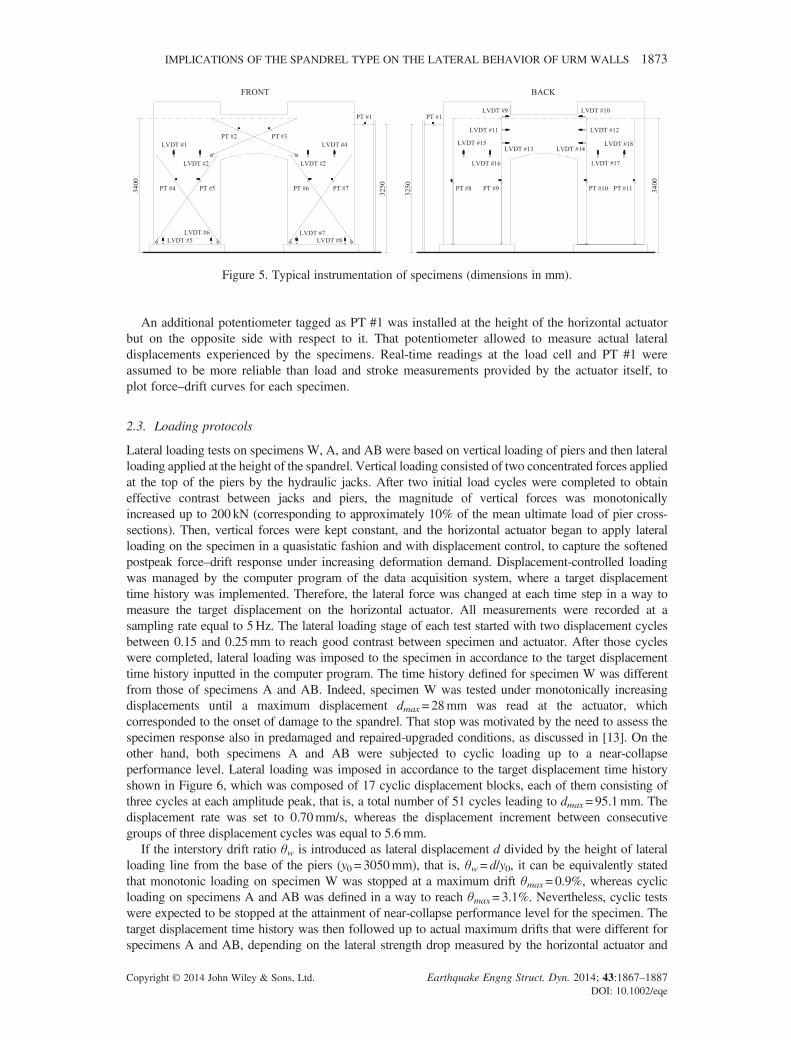
Crack patterns observed during any test were generated by a significant rocking response of thespecimen. No cracking was detected on spandrel–pier intersection zones, confirming theassumption of small deformations and no macroscopic cracks used for design and instrumentationof specimens (Section 2.2). With reference to Figure 7, the observed damage mainly consistedof the following: (i) both diagonal shear and flexural cracking in the spandrel panel above theopening; (ii) horizontal tensile cracks at the base of the piers due to their rocking response;and (iii) masonry crushing with transverse splitting at pier corners as near-collapse conditionswere attained. Those failure modes depended on the specimen geometry and magnitude ofaxial loads imposed to the piers. In fact, the moderate slenderness of both piers and spandrel,as well as low axial load levels on the piers, were expected to be associated with flexuralcracking even at low lateral force levels, according to analytical predictions by limit strengthdomains of URM cross-sections [6, 7]. Nevertheless, most part of damage concentrated in thespandrel panel.
Damage detected on specimen W is herein briefly discussed for comparative purposes. Horizontalflexural cracks were observed at the base of the piers at small drift levels (θw≈ 0.06%). As θw wasincreased, the spandrel panel suffered vertical flexural cracks at its end sections and a vertical crackclose to its midspan. Finally, diagonal shear cracking of the spandrel panel occurred at θw = 0.65%.
For specimen A, diagonal shear cracking started at drift levels smaller than those recorded forspecimen AB. Diagonal shear cracking originated at both lower ends of the spandrel panel, andthen, it propagated along diagonals involving both tuff stones and mortar joints. In this case, the firstportion of arch fell down at θw = 0.37%, which is a drift level close to half the drift measured in thecase of specimen AB at the cracking onset in the masonry arch. Diagonal cracks propagated until asecond part of arch collapsed at θw = 0.56%. That drift level also induced horizontal flexural cracksat the base of piers. Then, the spandrel panel totally failed in shear at θmax = 1.12%, which producedthe sudden loss of connection between the piers and hence a significant lateral resistance drop forthe entire specimen (it is noted that θmax is intended to be the maximum drift corresponding to thelateral displacement measured by potentiometer PT #1). After that failure, the upper triangularfraction of masonry above diagonal shear cracks did not provide any contribution to the lateralresistance, and the test was stopped.
As the spandrel of specimen AB included a masonry arch and a RC bond beam, the damageobserved at near-collapse (corresponding to θmax= 3.1%) was the result of a failure sequence, whichcan be summarized as follows:
-100
-50
0
50
100
0 5000 10000 15000d
[m
m]
t [s]
Figure 6. Target displacement time history for cyclic tests.
1874 F. PARISI, N. AUGENTI AND A. PROTA
Copyright © 2014 John Wiley & Sons, Ltd. Earthquake Engng Struct. Dyn. 2014; 43:1867–1887DOI: 10.1002/eqe
• formation of axial cracks in the arch at θw= 0.69% (Figure 8(a));• collapse of little central piece of arch at θw = 0.86% (Figure 8(b));• collapse of arch wedge at θw = 1.03%, after rocking beginning of piers (Figure 8(c));• collapse of third arch portion and early masonry crushing at the base of the piers at θw= 1.21%(Figure 8(d));
• collapse of fourth arch portion and early concrete cover spalling in the RC bond beam (top of endsection) at θw = 1.72% (Figure 8(e));
• complete concrete cover spalling at θw = 2.58%; and• collapse of first and second masonry layers above the arch (at the first and second displacementcycles, respectively) and plastic hinging of the RC bond beam at θw = 2.67% (Figure 8(f)).
Therefore, the spandrels of specimens A and AB were notably prone to damage, as a result of asignificant fragility of the masonry arch under differential displacements at its supports. Such adifference in displacements was caused by different rocking rotations of the piers and theassociated drift demand on the spandrel panel. In fact, the piers of a wall with openings canexperience a different response even if they are subjected to equal boundary conditions and axialload levels. This is generated by axial load variations resulting from a sort of frame behaviorunder a global overturning moment, as well as nonlinear behavior due to smeared cracking of
(a)
(b)
(c)
BACKFRONT
BACKFRONT
BACKFRONT
Figure 7. Crack patterns to (a) specimen W; (b) specimen A; and (c) specimen AB.
IMPLICATIONS OF THE SPANDREL TYPE ON THE LATERAL BEHAVIOR OF URM WALLS 1875
Copyright © 2014 John Wiley & Sons, Ltd. Earthquake Engng Struct. Dyn. 2014; 43:1867–1887DOI: 10.1002/eqe

masonry. The combination of such effects gives a dependence of pier flexibilities on both axialand lateral loads.
The rocking behavior of the piers was the source of large drift demands on the RC bond beam,which suffered plastic hinging even though shear cracks propagated from the masonry below. Thatpropagation highlights that the 200mm stirrup spacing was too large to favor full plastic hingingwithout shear cracking in the RC beam. This also means that, when designing a wall with openingswhere piers are expected to experience significant rocking, a complete exploitation of plasticresources of the RC bond beam is not guaranteed if specifications by the past IMC [16] and currentIBC [4] are met and also when seismic design is carried out according to EC8 part 1 [17]. This is atypical situation for modern URM buildings located in Italy and other European countries.
Figure 9(a)–(f) shows both overall damage to specimens and crack patterns suffered by theirspandrel panels at the maximum drift imposed during the tests. As the maximum drift level wasreached during the test, specimen W experienced small horizontal tensile cracks at the base of thepiers and moderate cracking of the spandrel. In fact, the latter suffered both flexural and diagonalcracking. Two types of vertical cracks were observed: cracks in the proximity of the spandrel–pierinterfaces, which were induced by the rocking behavior of the spandrel panel under lateral loading,and a vertical crack close to the mid section, which was chiefly caused by flexural deformation ofthe wooden lintel under masonry self-weight. Diagonal cracking formed only along a singlediagonal of the spandrel panel, as a result of monotonic loading from the left to the right (Figure 9(b)).
That loading orientation is denoted as positive in the case of cyclic tests on specimens A and AB.The lintel did not lose its supports even though the anchorage length was just 150mm, so themasonry above was effectively supported during the test.
The test on specimen A revealed a more brittle behavior resulting from diagonal shear cracking ofthe spandrel panel at small drift levels. Figure 9(d) reveals that diagonal shear cracks involved thewhole height of the spandrel panel and the complete loss of connection between the piers.
The cyclic in-plane loading test on specimen AB confirmed a significant rocking response of allthe walls, which caused heavy damage to both piers and spandrel. The onset and propagation ofdiagonal cracking from the masonry arch to the RC bond beam forced the masonry to fall downprogressively. Only two masonry layers did not collapse and did not lose their bond to the upperRC bond beam (Figure 9(f)). The lower edge of fractured masonry arch was found to be almostaligned with the diagonals of the spandrel panel. The latter did not behave as a simple rod able totransfer just axial loads, because it dissipated drift demands through plastic hinging at its ends. Itis emphasized that the RC beam lost its upper concrete cover and suffered shear cracking as aresult of partially effective transverse reinforcement. Although diagonal cracks verified for the
(a) (c)
(e)
(b)
(d) (f)
Figure 8. Damage to the spandrel of specimen AB under increasing drift levels: (a) θw = 0.69%; (b) θw=0.86%; (c) θw = 1.03%; (d) θw = 1.21%; (e) θw = 1.72%; and (f) θw= 2.67%.
1876 F. PARISI, N. AUGENTI AND A. PROTA
Copyright © 2014 John Wiley & Sons, Ltd. Earthquake Engng Struct. Dyn. 2014; 43:1867–1887DOI: 10.1002/eqe

spandrel panel of specimen AB almost completely reproduced those observed on specimen A, theRC bond beam had an important beneficial effect as it delayed the propagation of shear cracks tolarger drift levels.
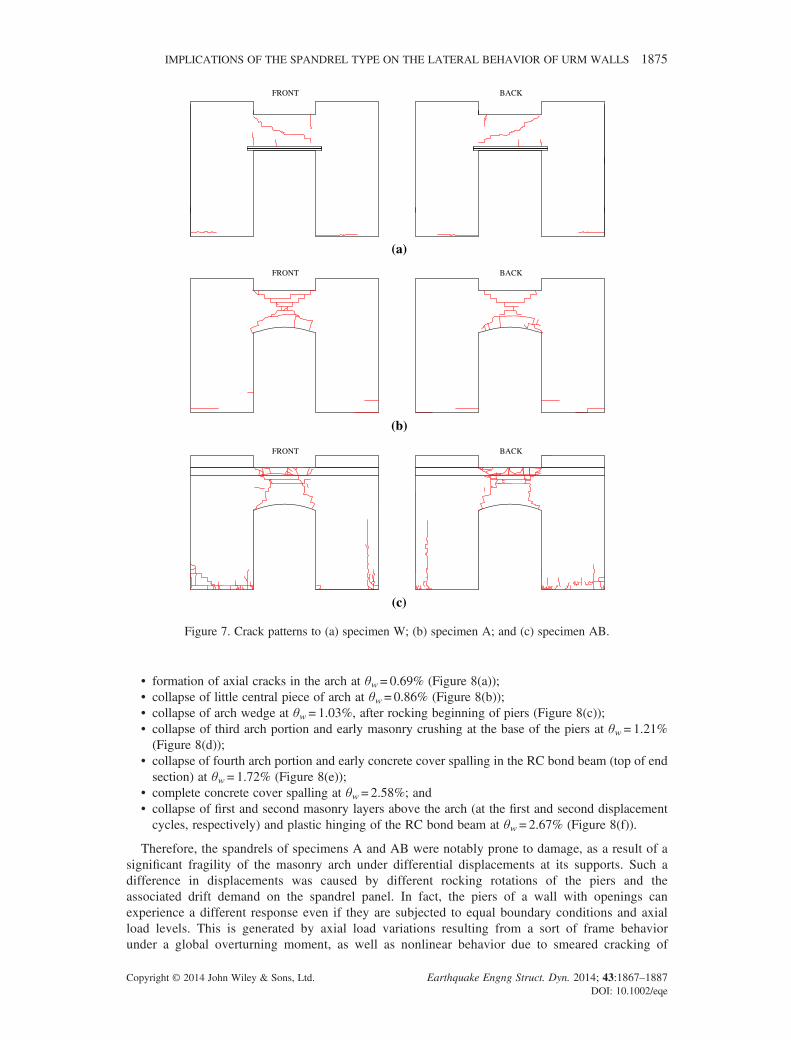
Specimens A and AB reached the near-collapse performance level as a result of different phenomena,namely, complete loss of connection between the piers when diagonal shear cracking developed along thewhole height of the spandrel panel, in the case of specimen A, and heavy crushing of masonry at the baseof the piers when the drift level attained θmax=3.1%, in the case of specimen AB. For this last specimen,Figure 10(a)–(d) demonstrates that the rocking response of the piers starts with a single tensile crack alonga bed joint and then results in a combination of transverse splitting and moderate-to-heavy crushing ofmasonry at the pier toes. In the case of specimen AB, the width of the horizontal crack exceeded30mm in the left pier (front side), while it reached approximately 15mm in the right pier. Transversesplitting of masonry was particularly evident in the left pier, where the vertical crack width was largerthan 50mm (Figure 10(c)). Conversely, in the case of specimens W and A, horizontal cracks at thebase of the piers reached a width smaller than 10mm.
Figure 9. Damage at maximum drift levels: (a) specimen W and (b) its spandrel (θmax= 0.9%); (c) specimenA and (d) its spandrel (θmax= 1.1%); and (e) specimen AB and (f) its spandrel (θmax= 3.1%).
IMPLICATIONS OF THE SPANDREL TYPE ON THE LATERAL BEHAVIOR OF URM WALLS 1877
Copyright © 2014 John Wiley & Sons, Ltd. Earthquake Engng Struct. Dyn. 2014; 43:1867–1887DOI: 10.1002/eqe
4. EXPERIMENTAL FORCE–DRIFT CURVES
Force and displacement readings recorded by the data acquisition system were processed in order toobtain force–drift curves, where the lateral resisting force and specimen drift were denoted by H andθw, respectively. A comparative analysis of such curves is performed herein, considering driftmeasurements corresponding to displacement readings of PT #1, that is, the wire potentiometerplaced at the height of the horizontal actuator.
A roughly bilinear (flexure-dominated) force–drift behavior up to the peak resistance was found inthe case of specimen W under monotonic lateral loading (Figure 11(a)), allowing to identify an idealcracking point, and hence both initial and postcracking lateral stiffness. When the peak lateralresisting force was attained, diagonal shear cracking occurred in the spandrel panel, and a 15% dropin the lateral resisting force was measured. As the lateral drift was further increased, the lateralresisting force raised again. The test was stopped at the attainment of θmax= 0.9% to allow furthercyclic testing in predamaged conditions, which is out of the scope of this paper ([13]).
Typical narrow force–drift loops for flexural response with both stiffness and strength degradation,as well as low energy dissipation capacity, were found for specimens A and AB. Figure 11(b) showsthat specimen A experienced very different drift levels depending on the orientation of lateral loading,even though the peak resisting levels were almost the same. A higher displacement capacity was foundin the case of specimen AB, which also experienced small residual drifts compared with maximumdrifts, namely, a significant recentering capacity (Figure 11(c)). It is noted that recentering capacityis the ability of the structure to return the center of mass to its initial position after unloading. Afterthe peak resisting force, specimen AB suffered a significant, but gradual, strength degradation as thelateral drift increased up to the maximum drift imposed during the test.
On the basis of the force–drift responses (their envelopes for cyclic tests), the following performancelevels were identified for each specimen: (i) cracking onset; (ii) peak resistance; and (iii) maximumdisplacement. Forces and drifts associated with such performance levels are listed in Table III. Thecracking point of the experimental force–drift curves was defined at a lateral stiffness reductionequal to 10%. That stiffness drop was captured by monitoring the ratio between secant lateralstiffness k and simple moving average stiffness ksma at each resisting force level. The secantstiffness was defined as the ratio of the measured resisting force H to the correspondingdisplacement d. The simple moving average stiffness at a given force level was defined as thearithmetic mean of the secant stiffness values ranging between the first nonzero value and thatcorresponding to the force level under consideration. In that way, significant variations in stiffnesswere identified, and secant lateral stiffness at cracking was defined as the ratio between theestimated cracking force Hcr and the displacement dcr (corresponding to the cracking drift θcr). Themaximum resisting force and its corresponding lateral drift are, respectively, denoted by Hmax andθHmax, whereas the maximum drift imposed during the test and the corresponding resisting force areindicated as θmax and Hθmax, respectively.
In the case of specimen W, the cracking resisting force was approximately 0.5 times the peakresisting force, whereas Hcr= 0.7Hmax is assumed by IBC [4]. The cracking drift was instead aboutone order of magnitude lower than the drift associated with peak resistance.
(a) (b) (d)(c)
Figure 10. Rocking response of the piers of specimen AB: (a) tensile crack close to the base of the left pier(front side) and (b) crack width measured and (c) masonry splitting and crushing of left pier and (d) masonry
splitting and crushing of right pier.
1878 F. PARISI, N. AUGENTI AND A. PROTA
Copyright © 2014 John Wiley & Sons, Ltd. Earthquake Engng Struct. Dyn. 2014; 43:1867–1887DOI: 10.1002/eqe

Specimen A suffered a significant stiffness reduction during lateral loading, even in the prepeakrange of force–drift curves. Indeed, on the basis of stiffness monitoring, cracking onset wasconventionally identified at resisting force and drift levels, that is, Hcr and θcr, which were almostequal to those measured in the case of specimen W but significantly lower than those recorded onspecimen AB. The ratio Hcr/Hmax was approximately equal to 0.6 and 0.5 in the positive andnegative loading orientations, respectively. Specimen A was also characterized by a significantlylower peak resistance compared with other specimens, as a result of the regular masonry arch,instead of the wooden lintel, above the opening. This caused that Hmax was 17% and 22% lowerthan that of specimen W in the positive and negative loading orientations, respectively.
In the case of specimen AB, the RC bond beam allowed to reach a peak resistance 46% and 57%higher than those computed for specimen A in the positive and negative orientations, respectively.Dealing with the rising branch of the force–drift envelope curve, the ratio Hcr/Hmax was about 0.6and 0.8 in the positive and negative loading orientations, respectively. The RC bond beam delayedthe 10% stiffness drop at force and drift levels notably higher than those related to specimen W. Thesecant lateral stiffness at cracking for specimen AB was approximately 10% lower than thatestimated for specimen W. This can be motivated by the presence of the masonry arch above theopening, which was less effective than the wooden lintel in connecting the piers, thus resulting in a
-250
-200
-150
-100
-50
0
50
100
150
200
250
H [
kN]
Specimen WSpecimen ASpecimen AB
-250
-200
-150
-100
-50
0
50
100
150
200
250
H [
kN]
0
50
100
150
200
250
-4 -3 -2 -1 0 1 2 3 4
0 1 2 3 4
H [
kN]
(a)
(d)
-250
-200
-150
-100
-50
0
50
100
150
200
250
-4 -3 -2 -1 0 1 2 3 4
-4 -3 -2 -1 0 1 2 3 4H
[kN
]
Cyclic response
Envelope
(b)
Cyclic response
Envelope
(c)
Figure 11. Force–drift curves: (a) specimen W; (b) specimen A; (c) specimen AB; and (d) envelopes.
Table III. Parameters of the experimental response of specimens.
SpecimenLoadingorientation Hcr [kN] θcr [%] Hmax [kN] θHmax [%] Hθmax [kN] θmax [%]
W Positive 99 0.06 184 0.65 172 0.89A Positive 96 0.06 153 0.38 141 0.59
Negative 73 0.07 143 0.62 84 1.10AB Positive 132 0.09 224 0.52 126 2.67
Negative 185 0.16 224 0.88 109 3.13
IMPLICATIONS OF THE SPANDREL TYPE ON THE LATERAL BEHAVIOR OF URM WALLS 1879
Copyright © 2014 John Wiley & Sons, Ltd. Earthquake Engng Struct. Dyn. 2014; 43:1867–1887DOI: 10.1002/eqe

lower lateral stiffness of the whole specimen. Specimen AB reached the same peak resistance in bothloading orientations, even though their corresponding drifts were different. In fact, in the case ofspecimens A and AB, the difference was that their first cracked loading was conditioned on crackingpreviously suffered in the opposite orientation. This interpretation of asymmetrical response atdifferent performance levels is also supported by nonlinearity effects because of masonry crackingand axial load variations in piers generated by global overturning moment corresponding to lateralloading. Therefore, asymmetrical cyclic behavior can occur even in the case of symmetricalspecimens in terms of geometry, loads, and external boundary conditions. The peak resistance ofspecimen AB was approximately 22% higher than that measured in the case of specimen W. Thegradual deterioration of the spandrel panel in the postpeak force–drift range caused a progressivereduction in the connection between the piers, resulting in a significant strength degradation(Figure 11(c)). As the maximum drift level was imposed to specimen AB, the lateral resisting forcewas found to be less than half the peak resistance.
Finally, the envelopes of hysteretic force–drift curves are compared in Figure 11(d), where the curveof specimen W is plotted in the positive quadrant only, because of monotonic loading. It can beobserved that specimen A had the lowest levels of displacement capacity and peak resistance. Therealization of the RC bond beam on top of the spandrel (specimen AB) considerably increased bothdisplacement capacity and peak resistance. The total vertical load V applied to specimens W, A, andAB was estimated to be 429, 468, and 470 kN, respectively, considering self-weight of constituentmaterials and initial axial loads of 200 kN on the piers. Such a computation allowed to compute theratio H/V (typically referred to as seismic coefficient), which was found to be approximately 43% inthe case of specimen W, 31–33% in the case of specimen A, and 48% in the case of specimen AB,at the peak resistance level.
5. BILINEAR IDEALIZATION OF FORCE–DRIFT CURVES
The envelopes of the experimental force–drift curves were approximated as bilinear diagrams tocharacterize the response of an idealized SDOF system, which is widely used to estimate seismicdemand on inelastic structures (e.g., [20]). Furthermore, idealized bilinear force–deformation diagramsare usually adopted to define the in-plane seismic capacity of masonry walls under lateral loading in asimplified way [6, 21]. In the case of walls with openings, the SDOF system approximation does notinduce major errors for single-story specimens (case under study). The methodology used in the past bythe authors for specimen W was also employed for specimens A and AB, in order to consistentlycompare their idealized SDOF models and to discuss current code values. Therefore, two bilinearidealization procedures according to Tomaževič [22], and both EC8 part 3 [3] and IBC [4], were used toestimate the following capacity features: (i) ultimate force Hu; (ii) yielding drift θe (corresponding to de);(iii) elastic stiffness ke; (iv) displacement pseudoductility μ; and (v) overstrength factor Ω. It isunderlined that, in this paper, the authors use drifts rather than displacements in order to providedimensionless deformation capacity estimates that do not depend on the height of specimens. Regardlessof the bilinear idealization procedure being used, displacement ductility was computed as μ = θu/θe,where θu is the ultimate drift. The latter was assumed to be the experimental drift corresponding to aresisting force level equal to Hθu=CSd Hmax, where CSd is the strength degradation factor. This factorwas assumed to be not lower than 0.8, that is, corresponding to a strength degradation not greater than20% on the postpeak falling branch of the force–drift envelope. This assumption derived from the factthat the tests were stopped at strength degradation levels usually lower than that typically considered inseismic codes, that is, 20%. Typically, the ultimate capacity point (θu,Hθu) of the force–drift curve wasdifferent from the experimental point at maximum deformation (θHmax,Hmax). By the way, it is alsoemphasized that the bilinear idealization for specimen W is presented only for comparative purposeswithout providing actual capacity estimates, because the lateral loading test on that specimen wasstopped when just a moderate damage was detected on the spandrel.
As far as lateral stiffness is concerned, the bilinear idealization procedure according to [22] sets keequal to the experimental secant stiffness at cracking (kcr). The experimental force and drift associatedwith kcr are denoted as Hcr and θcr, respectively. Conversely, in the procedures reported in [3, 4],
1880 F. PARISI, N. AUGENTI AND A. PROTA
Copyright © 2014 John Wiley & Sons, Ltd. Earthquake Engng Struct. Dyn. 2014; 43:1867–1887DOI: 10.1002/eqe

cracking is supposed to be associated with a force equal to 0.7Hmax so that elastic lateral stiffness isdefined as ke= 0.7Hmax/dcr, where dcr is the lateral displacement corresponding to 0.7Hmax on theforce–displacement envelope curve. In both bilinear idealization procedures, θe is derived byimposing equal areas below the envelope force–drift curve and idealized diagram, which means thatthe same energy dissipation capacity is assumed for the actual and idealized structural systems. Theultimate force of the idealized SDOF system was then derived as Hu = ke de. A graphical definitionof idealized force–drift diagrams according to both procedures is provided in Figure 12(a), wheredifferent estimates of cracking, elastic, and ultimate limits are pointed out.
According to IBC [4], the overstrength factor was defined as Ω =Hu/Hcr, which is a part of thestrength reduction factor to be used in linear equivalent seismic analysis (e.g., [23]). It is noted thatIBC [4] allows one to set Ω = 1.4 in the case of single-story URM buildings and Ω = 1.3 in the caseof single-story RM buildings.
As described in Section 2.2, two types of displacement readings were obtained during the tests,namely, stroke measurements provided by the horizontal actuator and displacements measured bypotentiometer PT #1. When displacement readings of potentiometer PT #1 were considered,the features of idealized SDOF systems corresponding to specimens were found to be those outlinedin Tables IV and V, which are, respectively, associated with the bilinear idealization proceduresaccording to [22] and [3, 4]. If the estimates related to positive and negative orientations of lateralloading are averaged (bracketed values), differences between results of the two bilinear idealizationprocedures tend to vanish. This gives the chance to identify the main effects of the spandrel type onthe in-plane seismic capacity. Nevertheless, the idealization procedure provided by EC8 part 3 [3]and IBC [4] was more sensitive to the postcracking branch of force–drift envelopes, overestimatingthe yielding drift and underestimating displacement ductility in the case of specimens W and A. Thelast was not the case of specimen AB, whose capacity estimates provided by both idealizationprocedures were almost the same. This occurred because postcracking stiffness of specimen AB was
(a) (b)
00
0.4
0.2
0.6
0.5 1 1.5 2 2.5 3
H/V
Figure 12. (a) Bilinear idealizations and (b) idealized in-plane capacity diagrams of specimens.
Table IV. Capacity features adopting procedure by Tomaževič.
SpecimenLoadingorientation Hu [kN] θe [%] θu [%] μ Ω
W Positive 162 0.10 0.89 8.51 1.64A Positive 147 0.09 0.59 6.44 1.53
Negative 136 0.13 1.04 7.74 1.85(142) (0.11) (0.82) (7.09) (1.69)
AB Positive 211 0.14 1.63 11.85 1.60Negative 212 0.18 1.47 8.00 1.14
(212) (0.16) (1.55) (9.93) (1.37)
IMPLICATIONS OF THE SPANDREL TYPE ON THE LATERAL BEHAVIOR OF URM WALLS 1881
Copyright © 2014 John Wiley & Sons, Ltd. Earthquake Engng Struct. Dyn. 2014; 43:1867–1887DOI: 10.1002/eqe
not significantly lower than the initial stiffness, resulting in the same estimate of ke after both bilinearidealizations. On the basis of such considerations, the estimates of specimen W and bracketed estimatesof specimens A and AB listed in Table IV can be preferentially used to compare seismic capacityfeatures of specimens, because their experimental response seems to be more accurately describedby the idealized SDOF system derived in accordance to Tomaževič [22]. Idealized force–driftdiagrams averaged over both loading orientations are plotted in Figure 12(b), where resisting forceH is replaced by the corresponding seismic coefficient H/V.
First of all, the yielding drift was found to be between 0.10% and 0.11% in the case of specimens Wand A, respectively, and 0.16% in the case of specimen AB, that is, 1.6 and 1.4 times those computedfor specimens W and A, respectively.
This indicates that the RC bond beam on top of the spandrel with masonry arch delayed theattainment of the elastic limit to larger drift levels. It is also worth noting that the spandrel withwooden lintel (specimen W) allowed to reach an average ultimate drift larger than that computed forthe spandrel with masonry arch above the opening (specimen A), even if strength degradation ofspecimen W at θu = θmax was lower than half that of specimen A. In other words, if specimen Wwould have been tested up to a maximum drift corresponding to a strength degradation factor equalto that of specimen A, the spandrel with wooden lintel would have favored an average value of θusignificantly larger than that actually measured in the case of spandrel with masonry arch. Thisremark is consistent with the fact that the wooden lintel was more effective than the arch inallowing the spandrel to behave as coupling beam for the piers. The realization of the RC bondbeam in the spandrel with masonry arch (specimen AB) almost doubled the average displacementcapacity, increasing θu from 0.82% to 1.55% (bracketed values in Table IV). In any case, ultimatedrift limits of piers provided by current codes were exceeded by those estimated for eachspecimen. In fact, EC8 part 3 [3] allows one to set θu to 0.4% and 0.8% H0/D for shear andflexural failure modes of piers, respectively, where H0 is the distance between the section whereflexural capacity of the pier is attained and the contraflexure point and D is the length of the pier.IBC [4] sets θu to 0.4% and 0.8% for shear and flexural failure modes, respectively, reducing theflexural limit value to 0.6% in the case of existing URM buildings. Such drift limits are related tothe same performance level, which is referred to as ‘significant damage’ in EC8 and ‘life safetyprevention’ in IBC.
The lowest displacement ductility was found for specimen A, whereas the highest estimate wasfound for specimen AB, showing a 40% increase in ductility induced by the addition of the RCbond beam to the spandrel with masonry arch. It is also noteworthy that the average displacementductility in the case of spandrel with wooden lintel (specimen W) was 20% higher than that relatedto the case of spandrel with masonry arch (specimen A).
Approximately, the same estimates of overstrength factor were found in the case of specimens Wand A, which were, respectively, 20% and 23% higher than that related to specimen AB.
Seismic coefficients corresponding to Hu were estimated to be 38%, 30%, and 45% in the case ofspecimens W, A, and AB, respectively. This means the following: (i) that the spandrel with woodenlintel contributed to resist a horizontal acceleration about 27% greater than that related to thespandrel with masonry arch; and (ii) that the RC bond beam doubled the seismic coefficient ofspecimen A. An increase in the seismic coefficient of walls can have great impact on the overall
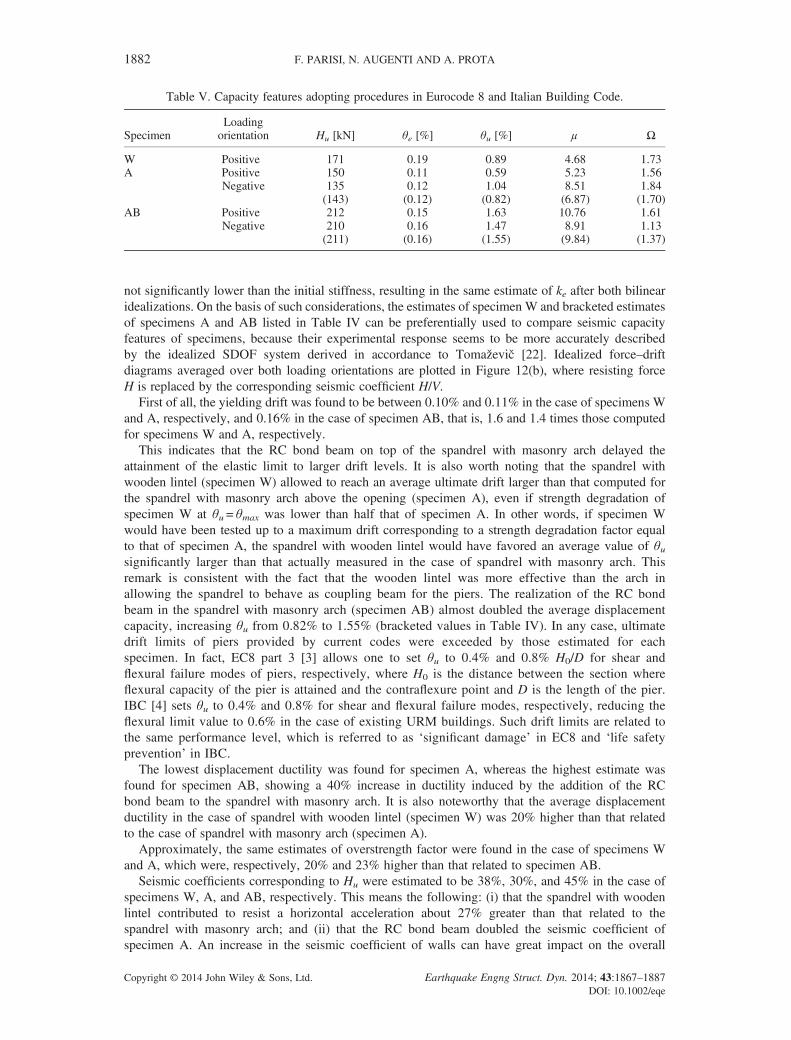
Table V. Capacity features adopting procedures in Eurocode 8 and Italian Building Code.
SpecimenLoadingorientation Hu [kN] θe [%] θu [%] μ Ω
W Positive 171 0.19 0.89 4.68 1.73A Positive 150 0.11 0.59 5.23 1.56
Negative 135 0.12 1.04 8.51 1.84(143) (0.12) (0.82) (6.87) (1.70)
AB Positive 212 0.15 1.63 10.76 1.61Negative 210 0.16 1.47 8.91 1.13
(211) (0.16) (1.55) (9.84) (1.37)
1882 F. PARISI, N. AUGENTI AND A. PROTA
Copyright © 2014 John Wiley & Sons, Ltd. Earthquake Engng Struct. Dyn. 2014; 43:1867–1887DOI: 10.1002/eqe

capacity of a masonry building, because higher horizontal seismic accelerations can be resisted withoutadditional structural mass. This can be an advantage not only in seismic design of URM buildings butalso in retrofit of existing buildings. In the case of substandard buildings without historical value,replacing masonry arches with wooden lintels above openings can be a low-cost seismic upgradingstrategy able to increase the in-plane resistance of walls. If masonry arches are to be preserved fortheir architectural value, lintels can be installed above them. Conversely, although the installation ofRC bond beams on top of existing spandrels is a more complex and invasive retrofit measure, it alsoconnects orthogonal walls favoring a box-type seismic response of the building.
6. DIFFERENTIAL PIER DRIFTS, HYSTERETIC DAMPING, AND RESIDUAL DRIFTS
Displacement readings provided by the horizontal actuator and PT #1 at opposite edges of eachspecimen allowed to estimate lateral drifts of both left and right piers (on the front side), that is, θleftand θright (note that the latter was previously assumed to be representative of the specimen drift θw).The difference between such drifts, which is denoted here by Δθ = θleft� θright, can be used as ameasure of the effectiveness of the spandrel in connecting the piers. In Figure 13, the lateralresisting force is plotted against Δθ, on the basis of the envelopes of experimental force–driftcurves in the positive loading orientation. When Δθ was not zero, the spandrel shortened as aresult of horizontal compression (up to the corner points on the rising branches of force–driftenvelopes) or its progressive failure. When spandrel shortening was caused by horizontalcompression, the spandrel was more able to transfer a fraction of horizontal force from the leftpier to the right pier. Otherwise, the progressive failure of the spandrel induced a gradual loss ofconnection between the piers. To associate the relative distance between the piers with given driftlevels of specimens, the ratio Δθ/θw is used herein. If the force–drift diagram of the wall withopenings is known, the ratio Δθ/θw allows to define the spandrel deformation and damage as thelateral drift changes.
In the case of specimen W, which was subjected to monotonic testing, the relationship between Hand Δθ was rather linear up to H = 120 kN (point CW in Figure 13), namely, the horizontal forcelevel associated with the corner point on the rising branch of the experimental force–drift curve(Figure 11(a)). Such a corner point was recorded when flexural cracks at the end sections of thespandrel panel were observed. In that condition, Δθ was approximately equal to 0.12%, because itwas associated with θleft and θright of about 0.22% and 0.10%, respectively. Therefore, the ratio Δθ/θw wasabout 1.2 at the first corner point of the experimental force–drift curve of specimen W. As Hincreased up to its maximum level and then decreased until the maximum drift was reached, Δθgradually reduced. This indicates a progressive reduction in shortening of the spandrel panel andhence an elongation up to its initial length. By contrast, if the vertical flexural crack on the right-
CW
CA
CAB
0
50
100
150
200
250
0 0.1 0.2 0.3 0.4 0.5 0.6
H [
kN]
Δθ [%]
Specimen WSpecimen ASpecimen AB
Figure 13. Lateral resisting force versus variation between pier drifts (positive orientation).
IMPLICATIONS OF THE SPANDREL TYPE ON THE LATERAL BEHAVIOR OF URM WALLS 1883
Copyright © 2014 John Wiley & Sons, Ltd. Earthquake Engng Struct. Dyn. 2014; 43:1867–1887DOI: 10.1002/eqe
hand side of Figure 9(b) is observed, the gradual reduction of Δθ to zero may be related to an effectivebehavior of the wooden lintel as a passive tie, because it was subjected to tension.
A different behavior was detected in the case of specimen A, where the masonry arch sufferedpremature failure and progressively collapsed as a result of diagonal cracking. The relationship betweenH and Δθ was rather linear until the lateral resisting force reached H=147 kN (corresponding toΔθ =0.15%), which is very close to the peak resistance Hmax=154 kN. The corner point CA inFigure 13 was then associated with the corner point of the force–drift envelope in Figure 11(b). In thiscase, Δθ =0.15% was associated with θw=0.21%, resulting in Δθ/θw=0.71. As specimen A wassubjected to larger lateral drifts in the positive loading orientation, H linearly reduced, and Δθincreased. When θw=0.59% was reached, Δθ was found to be 0.54% resulting in Δθ/θw=0.92. Thefirst part of arch fell down at θw=0.37%, that is, when the lateral resisting force was approaching Hmax.
As larger lateral drifts were imposed to specimen A, the masonry arch progressively collapsed,reducing both strength and stiffness of the spandrel. This means that, when specimen A was loadedin the positive orientation, the spandrel panel drastically shortened so the left pier experiencedlateral drifts notably larger than those of the right pier.
In the case of specimen AB, the relationship between H and Δθ was roughly linear up toHmax = 224 kN and Δθ = 0.21% (point CAB in Figure 13), which were associated with θHmax = 0.52%,that is, Δθ/θw = 0.40. Also in that case, the first cracks in the masonry arch were observed at a largerdrift level (Section 3), and the progressive collapse of the arch caused a significant drop in bothstrength and stiffness of the spandrel. As the lateral drift increased up to θw = 1.63%, Δθ reduced to0.20% at H = 184 kN (i.e., the peak resisting force measured in the case of specimen W), resulting inΔθ/θw = 0.12 at that stage of the test. As θw was further increased up to 2.67%, Δθ also increased upto 0.44% resulting in Δθ/θw = 0.16 at near-collapse.
The energy dissipation capacity of specimens was also investigated and indirectly measured throughthe hysteretic damping ratio, which is used in displacement-based design/assessment of structures [24].The flexural hysteretic response of specimens produced a very low energy dissipation capacityaccording to [6] and [24]. The hysteretic damping ratio of specimen W in as-built conditions was notestimated, because monotonic testing was carried out in that case. Therefore, specimen W wasconsidered in its predamaged conditions under cyclic testing ([13] for its experimental force–driftcurves). It is underlined that the equivalent damping ratio is typically regarded as the sum of twocomponents, as follows:
ξeq ¼ ξeq;e þ ξeq;h (1)
where ξeq,e is the equivalent damping ratio associated with elastic behavior and ξeq,h is the equivalentdamping ratio associated with hysteretic behavior. ξeq,h was computed by equating the energy Eh
dissipated in a hysteresis cycle of the actual specimen to the energy Es/4π dissipated by a viscousdamping cycle of an equivalent linear system [25], where Es is the strain energy. Therefore, it wasassumed:
ξeq;h ¼14π
Eh
Es(2)
which turns out to be:
ξeq;h ¼Eh
2πke θwcy0ð Þ2 (3)
where ke is the elastic stiffness, θwc is the maximum drift of the specimen in a cycle, and y0 is theheight at which lateral displacements were measured. Figure 14(a) shows the hysteretic dampingratio under varying drift for each specimen.
All curves outline a negative exponential trend because of the flexural hysteretic behavior ofspecimens. In near-collapse conditions, the hysteretic damping ratios of specimens A and AB werealmost the same. A higher value of ξeq,h was found in the case of specimen W, evidencing a higher
1884 F. PARISI, N. AUGENTI AND A. PROTA
Copyright © 2014 John Wiley & Sons, Ltd. Earthquake Engng Struct. Dyn. 2014; 43:1867–1887DOI: 10.1002/eqe
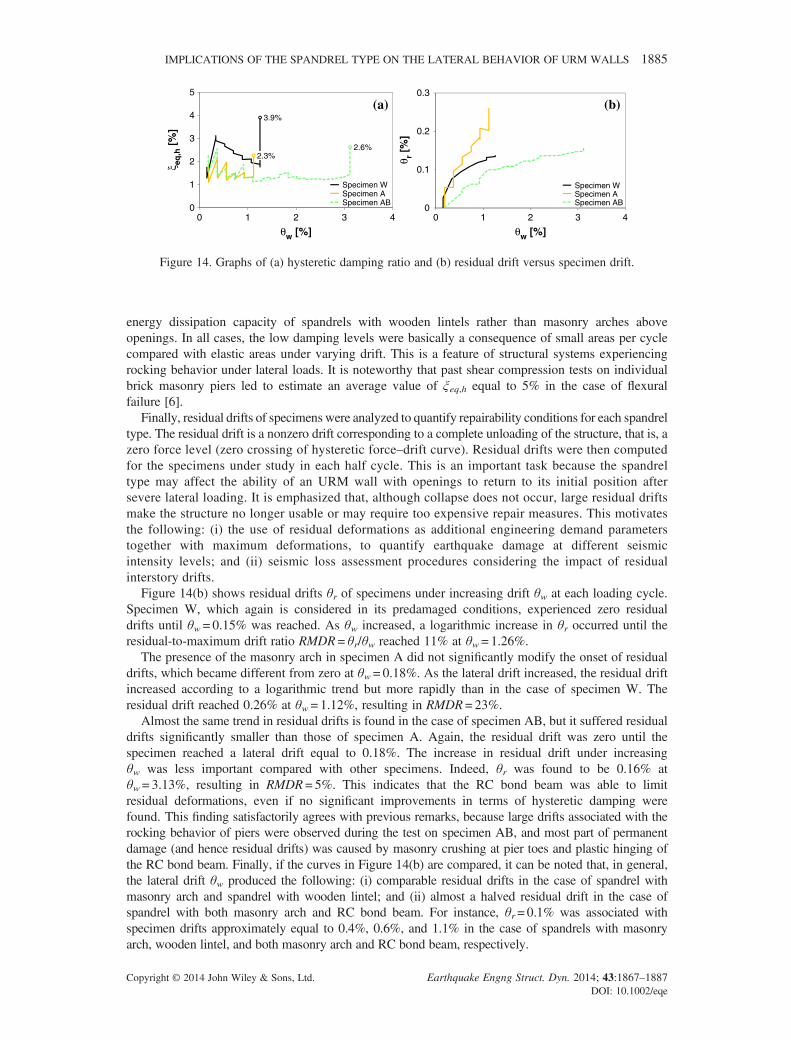
energy dissipation capacity of spandrels with wooden lintels rather than masonry arches aboveopenings. In all cases, the low damping levels were basically a consequence of small areas per cyclecompared with elastic areas under varying drift. This is a feature of structural systems experiencingrocking behavior under lateral loads. It is noteworthy that past shear compression tests on individualbrick masonry piers led to estimate an average value of ξeq,h equal to 5% in the case of flexuralfailure [6].
Finally, residual drifts of specimens were analyzed to quantify repairability conditions for each spandreltype. The residual drift is a nonzero drift corresponding to a complete unloading of the structure, that is, azero force level (zero crossing of hysteretic force–drift curve). Residual drifts were then computedfor the specimens under study in each half cycle. This is an important task because the spandreltype may affect the ability of an URM wall with openings to return to its initial position aftersevere lateral loading. It is emphasized that, although collapse does not occur, large residual driftsmake the structure no longer usable or may require too expensive repair measures. This motivatesthe following: (i) the use of residual deformations as additional engineering demand parameterstogether with maximum deformations, to quantify earthquake damage at different seismicintensity levels; and (ii) seismic loss assessment procedures considering the impact of residualinterstory drifts.
Figure 14(b) shows residual drifts θr of specimens under increasing drift θw at each loading cycle.Specimen W, which again is considered in its predamaged conditions, experienced zero residualdrifts until θw = 0.15% was reached. As θw increased, a logarithmic increase in θr occurred until theresidual-to-maximum drift ratio RMDR = θr/θw reached 11% at θw = 1.26%.
The presence of the masonry arch in specimen A did not significantly modify the onset of residualdrifts, which became different from zero at θw= 0.18%. As the lateral drift increased, the residual driftincreased according to a logarithmic trend but more rapidly than in the case of specimen W. Theresidual drift reached 0.26% at θw= 1.12%, resulting in RMDR = 23%.
Almost the same trend in residual drifts is found in the case of specimen AB, but it suffered residualdrifts significantly smaller than those of specimen A. Again, the residual drift was zero until thespecimen reached a lateral drift equal to 0.18%. The increase in residual drift under increasingθw was less important compared with other specimens. Indeed, θr was found to be 0.16% atθw= 3.13%, resulting in RMDR = 5%. This indicates that the RC bond beam was able to limitresidual deformations, even if no significant improvements in terms of hysteretic damping werefound. This finding satisfactorily agrees with previous remarks, because large drifts associated with therocking behavior of piers were observed during the test on specimen AB, and most part of permanentdamage (and hence residual drifts) was caused by masonry crushing at pier toes and plastic hinging ofthe RC bond beam. Finally, if the curves in Figure 14(b) are compared, it can be noted that, in general,the lateral drift θw produced the following: (i) comparable residual drifts in the case of spandrel withmasonry arch and spandrel with wooden lintel; and (ii) almost a halved residual drift in the case ofspandrel with both masonry arch and RC bond beam. For instance, θr=0.1% was associated withspecimen drifts approximately equal to 0.4%, 0.6%, and 1.1% in the case of spandrels with masonryarch, wooden lintel, and both masonry arch and RC bond beam, respectively.
3.9%
2.3%2.6%
0
1
2
3
4
5
ξ eq,h
[%
]
θw [%] θw [%]
Specimen WSpecimen ASpecimen AB
0
0.1
0.2
0.3
0 1 2 3 4 0 1 2 3 4
θ r [%
]
Specimen WSpecimen ASpecimen AB
(a) (b)
Figure 14. Graphs of (a) hysteretic damping ratio and (b) residual drift versus specimen drift.
IMPLICATIONS OF THE SPANDREL TYPE ON THE LATERAL BEHAVIOR OF URM WALLS 1885
Copyright © 2014 John Wiley & Sons, Ltd. Earthquake Engng Struct. Dyn. 2014; 43:1867–1887DOI: 10.1002/eqe
7. CONCLUSIONS
The main findings of two full-scale lateral loading tests on tuff masonry walls with an opening anddifferent spandrel types have been presented and compared with those obtained in the past foranother specimen. Comparisons have been carried out in terms of crack patterns, force–drift curves,capacity features of idealized SDOF systems, pier drifts, hysteretic damping, and residual drifts.
Three specimens with the following spandrel types have been compared: spandrel with woodenlintel (specimen W), spandrel with masonry arch (specimen A), and spandrel with masonry arch andRC bond beam (specimen AB). The geometry of specimens and the magnitude of axial loads on thepiers influenced the force–drift curves, which showed a stable hysteretic rocking behavior. Nodamage was detected on spandrel–pier intersection zones, confirming typical modeling assumptionsin macroelement methods. Large horizontal cracks formed at the base of piers because of rocking.The spandrel type influenced the observed damage as follows:
• The wooden lintel did not slip off from the piers, even if its anchorage length was small. After thespandrel panel suffered diagonal cracking, the lintel ensured the connection of the piers avoidingthe collapse of the masonry above.
• The spandrels with masonry arch progressively fell down at small drift levels as a result of thearch fragility against differential displacements at its supports, induced by rocking of piers.
• The RC bond beam on top withstood large drift demands by plastic hinging, delaying the com-plete loss of connection between piers at large drift levels. Nevertheless, to inhibit the propagationof shear cracks from the masonry to the RC bond beam, a stirrup spacing lower than those allowedby codes is suggested for beam sections close to spandrel–pier intersections.
The lowest resistance was found in the case of spandrel with only masonry arch. The RC bond beamon top favored a peak resistance increase of about 50%. In the case of spandrel with wooden lintel, thepeak resistance was up to 1.3 times that related to the spandrel with only masonry arch.
Bilinear idealizations of force–drift envelopes allow to suggest reference values for walls withrocking piers and different types of spandrels, as follows:
• The peak lateral resistance can be assumed to be 35%, 30%, and 45% of the total gravity load inthe case of spandrel with wooden lintel, only masonry arch, and both masonry arch and RC bondbeam, respectively.
• The yielding drift can be set to 0.1% in the case of spandrel with wooden lintel or masonry archand 0.16% in the presence of RC bond beam on top (corresponding to a 60% increase).
• The ultimate drift can be assumed to be 0.8% in the case of spandrel with wooden lintel or ma-sonry arch and 1.5% in the presence of RC bond beam.
• The displacement ductility can be set to 7, 8.5, and 9.5 in the case of spandrel with only masonryarch, wooden lintel, and both masonry arch and RC bond beam, respectively.
• The overstrength factor can be set to 1.6 in the case of spandrel with wooden lintel or masonryarch and 1.3 in the presence of RC bond beam.
The analysis of pier drifts has confirmed the effectiveness of the wooden lintel in connecting thepiers after spandrel failure and, by contrast, the gradual loss of connection induced by progressivecollapse of spandrels with masonry arches. Dealing with the energy dissipation capacity of wallswith openings and rocking piers, the authors suggest a hysteretic damping ratio equal to 2% in thecase of spandrels with masonry arch regardless of the presence of RC bond beam and 4% in thecase of spandrels with wooden lintel.
Finally, the analysis of residual drifts under varying lateral drift of specimens has allowed toinvestigate the influence of spandrels on recentering capacity of walls. The ratio between residualand maximum drift at near-collapse can be set to 10%, 20%, and 5% in the case of spandrel withwooden lintel, only masonry arch, and both masonry arch and RC bond beam, respectively.Different residual-to-maximum drift ratios show that the spandrel type also affects the ability ofURM walls to be repaired after severe in-plane lateral loading.
Further research is needed to assess the influence of the spandrel type in the case of piers subjectedto moderate-to-high compression levels, where rocking behavior may be less evident or even
1886 F. PARISI, N. AUGENTI AND A. PROTA
Copyright © 2014 John Wiley & Sons, Ltd. Earthquake Engng Struct. Dyn. 2014; 43:1867–1887DOI: 10.1002/eqe

negligible compared with that observed in this study. Moreover, lateral loading tests should be carriedout to investigate the in-plane lateral behavior of walls with steel ties in the spandrel and irregular wallswith openings.
ACKNOWLEDGEMENTS
This research was carried out in the framework of the ReLUIS-DPC 2010–2013 project (line AT1-1.1 –Evaluation of the Vulnerability of Masonry Buildings, Historical Centers and Cultural Heritage) and PON01–02324 PROVACI project (Technologies for Earthquake Protection and Valorization of Cultural HeritageSites), which were, respectively, funded by the Italian Civil Protection Department and the Italian Ministry ofEducation, University and Research.
REFERENCES
1. Augenti N, Parisi F. Learning from construction failures due to the 2009 L’Aquila, Italy, earthquake. Journal ofPerformance of Constructed Facilities 2010; 24(6):536–555.
2. FEMA 356. Prestandard and Commentary for the Seismic Rehabilitation of Buildings. American Technical Council:Washington, 2000.
3. Eurocode 8. Design of Structures for Earthquake Resistance – Part 3: Assessment and Retrofitting of Buildings(EN 1998-3). Comité Européen de Normalisation: Brussels, 2005.
4. Italian Building Code. D.M. 14.01.2008: Norme Tecniche per le Costruzioni. Italian Ministry of Infrastructures andTransportation: Rome, 2008 [in Italian].
5. Turnšek V, Čačovič F. Some experimental results on the strength of brick masonry walls. Proceedings of the 2ndInternational Brick & Block Masonry Conference, Stoke-on-Trent, 1970; 149–156.
6. Magenes G, Calvi GM. In-plane seismic response of brick masonry walls. Earthquake Engineering and StructuralDynamics 1997; 26(11):1091–1112.
7. Parisi F, Augenti N. Seismic capacity of irregular unreinforced masonry walls with openings. Earthquake Engineeringand Structural Dynamics 2013; 42(1):101–121.
8. Benedetti D, Carydis P, Pezzoli P. Shaking table test on 24 masonry buildings. Earthquake Engineering andStructural Dynamics 1998; 27(1):67–90.
9. Benedetti D, Carydis P, Limongelli MP. Evaluation of the seismic response of masonry buildings based on energyfunctions. Earthquake Engineering and Structural Dynamics 2001; 30(7):1061–1081.
10. Bothara JK, Dhakal RP, Mander JB. Seismic performance of an unreinforced masonry building: an experimentalinvestigation. Earthquake Engineering and Structural Dynamics 2010; 39(1):45–68.
11. Amadio C, Gattesco N, Dudine A, Franceschinis R, Rinaldin G. Structural performance of spandrels in stone masonrybuildings. Proceedings of the 15th World Conference on Earthquake Engineering, Lisbon, 2012; paper No. 5077.
12. Graziotti F, Magenes G, Penna A. Experimental cyclic behaviour of stone masonry spandrels. Proceedings of the15th World Conference on Earthquake Engineering, Lisbon, 2012; paper No. 3261.
13. Augenti N, Parisi F, Prota A, Manfredi G. In-plane lateral response of a full-scale masonry subassemblage with andwithout an inorganic matrix–grid strengthening system. Journal of Composites for Construction 2011; 15(4):578–590.
14. Augenti N, Parisi F. Constitutive models for tuff masonry under uniaxial compression. Journal of Materials in CivilEngineering 2011; 22(11):1102–1111.
15. Augenti N, Parisi F. Constitutive modelling of tuff masonry in direct shear. Construction and Building Materials2010; 25(4):1612–1620.
16. Italian Masonry Code. D.M. 20.11.1987: Norme Tecniche per la Progettazione, Esecuzione e Collaudo degli Edificiin Muratura e per il loro Consolidamento. Italian Ministry of Public Works: Rome, 1987 [in Italian].
17. Eurocode 8. Design of Structures for Earthquake Resistance – Part 1: General Rules, Seismic Actions and Rules forBuildings (EN 1998-1). Comité Européen de Normalisation: Brussels, 2004.
18. Eurocode 2. Design of Concrete Structures (EN 1993). Comité Européen de Normalisation: Brussels, 2004.19. D.M. 14.02.1992: Norme Tecniche per l’Esecuzione delle Opere in Cemento Armato Normale e Precompresso e per
le Strutture Metalliche. Italian Ministry of Public Works: Rome, 1992 [in Italian].20. Fajfar P. A nonlinear analysis method for performance-based seismic design. Earthquake Spectra 2000; 16(3):573–592.21. Vasconcelos G, Lourenço PB. In-plane experimental behavior of stone masonry walls under cyclic loading. Journal
of Structural Engineering 2009; 135(10):1269–1277.22. Tomaževič M. Earthquake-resistant design of masonry buildings. In Series on Innovation in Structures and
Construction vol. 1, Elnashai AS, Dowling PJ (eds). Imperial College Press: London, 2000.23. TomaževičM, Weiss P. Displacement capacity of masonry buildings as a basis for the assessment of behavior factor:
an experimental study. Bulletin of Earthquake Engineering 2010; 8(6):1267–1294.24. Priestley MJN, Calvi GM, Kowalsky MJ. Displacement-based Seismic Design of Structures. IUSS Press: Pavia, 2007.25. Chopra AK. Dynamics of Structures. Pearson Prentice-Hall: Upper Saddle River, 2006.
IMPLICATIONS OF THE SPANDREL TYPE ON THE LATERAL BEHAVIOR OF URM WALLS 1887
Copyright © 2014 John Wiley & Sons, Ltd. Earthquake Engng Struct. Dyn. 2014; 43:1867–1887DOI: 10.1002/eqe
Copyright © 2022 FDOKUMEN