Acceptance Criteria for Compressive Strength of Concrete as ...
Upload
khangminh22Category
view
1download
0
Materials 2022, 15, 2995. https://doi.org/10.3390/ma15092995 www.mdpi.com/journal/materials
Article
Research on Dynamic Strength and Inertia Effect of Concrete Materials Based on Large-Diameter Split Hopkinson Pressure Bar Test Bi Sun 1,2, Rui Chen 1, Yang Ping 3, ZhenDe Zhu 4, Nan Wu 5 and Zhenyue Shi 6,*
1 Harbin Institute of Technology (Shenzhen), Shenzhen 518055, China; [email protected] (B.S.); [email protected] (R.C.)
2 Shenzhen Water Planning and Design Institute Co., Ltd., Shenzhen 518001, China 3 PowerChina Eco-Environment Group Co., Ltd., Shenzhen 518102, China; [email protected] 4 Key Laboratory of Ministry of Education of Geomechanics and Embankment Engineering,
Hohai University, Nanjing 210098, China; [email protected] 5 Guangzhou University-Tamkang University Joint Research Centre for Engineering Structure Disaster
Prevention and Control, Guangzhou University, Guangzhou, 510006, China; [email protected] 6 College of Safety and Environmental Engineering (College of Safety and Emergency Management),
Shandong University of Science and Technology, Qingdao 266590, China * Correspondence: [email protected]
Abstract: The Split Hopkinson Pressure Bar (SHPB) test device is an important tool to study the dynamic characteristics of concrete materials. Inertial effect is one of the main factors that cause inaccurate results in SHPB tests of concrete materials. To solve this problem, Large-diameter SHPB tests on concrete and mortar were performed. A dynamic increase factor (DIF) model considering strain rate effect and inertia effect was established. This model provides a scientific reference for studying the dynamic mechanical properties of concrete materials. The experimental results indi-cate that the strain rate effect of concrete is more sensitive than that of mortar, but the inertia effect of mortar is more sensitive than that of concrete. Under the same strain rate, the energy utilization rate, average fragment size, and impact potentiality of mortar are higher than concrete.
Keywords: large-diameter SHPB; high strain rate; concrete material; strain rate effect; inertia effect; dynamic strength
1. Introduction Concrete materials, the largest and most widely used engineering building materials,
are affected by static loads and high strain rate dynamic loads such as earthquakes, im-pacts, and explosions. As a heterogeneous, anisotropic, and strain rate-sensitive multi-phase composite, concrete will show more complex dynamic mechanical characteristics under dynamic load than under static load, which has been one of the hot topics in recent years. Split Hopkinson Pressure Bar (SHPB) experimental technology is the most com-monly used test method for the dynamic performance of concrete [1–7]. For heterogene-ous materials, such as concrete, a specimen of considerable size is required to ensure a certain degree of homogeneity because concrete has a large aggregate size and has many microscopic defects. Ensuring a certain homogeneity in the SHPB test requires a fairly large specimen size. The pressure bar diameter of the SHPB device should also be in-creased correspondingly [8–10]. In the large-diameter SHPB test, the dynamic strength of the specimen is affected by the strain rate effect [11–13] and the inertia effect [14].
The dynamic increase factor (DIF), defined as the ratio of dynamic-to-static strength, is conventionally considered a material property [15,16]. A bilinear DIF model proposed by the Comité Euro-International du Béton (CEB) and the Fédération International de la
Citation: Sun, B.; Chen, R.; Ping, Y.;
Zhu, Z.; Wu, N.; Shi, Z. Research on
Dynamic Strength and Inertia Effect
of Concrete Materials Based on
Large Diameter Split Hopkinson
Pressure Bar Test. Materials 2022, 15,
2995. https://doi.org/10.3390/
ma15092995
Academic Editors:
Dario De Domenico
and Luís Filipe Almeida Bernardo
Received: 20 March 2022
Accepted: 18 April 2022
Published: 20 April 2022
Publisher’s Note: MDPI stays neu-
tral with regard to jurisdictional
claims in published maps and institu-
tional affiliations.
Copyright: © 2022 by the authors. Li-
censee MDPI, Basel, Switzerland.
This article is an open access article
distributed under the terms and con-
ditions of the Creative Commons At-
tribution (CC BY) license (https://cre-
ativecommons.org/licenses/by/4.0/).

Materials 2022, 15, 2995 2 of 16
Précontrainte (FIP) (CEB-FIP) [17] standard is the most representative achievement. Tedesco et al. [18] conducted SHPB tests on concrete specimens with a diameter and length of 51 mm, and presented a regression equation to describe the relationship between the DIF and log10 of strain rate. Based on the SHPB test of concrete and mortar, Grote et al. [19] suggested a nonlinear DIF model at a high strain rate with a 250~1700 s−1 range. Ngo et al. [20] established a new relationship model between DIF and strain rate. The model considers the effects of various factors on dynamic strength and is suitable for con-crete with a strength range of 32–160 MPa. Katayama et al. [21] adopted a quadratic equa-tion of logarithmic strain rate to express the DIF model by introducing it into Drucker–Prager’s equation. Hartmann et al. [22] used a power function to describe the relationship between DIF and strain rate.
With the progress of technology and the deepening of research, some scholars found that under high strain rate [23,24], the inertial effect is not eliminated, but dominant [25,26]. Under the axial dynamic load, part of the work of the external load is to provide kinetic energy to the particles so that the particles obtain axial acceleration. Due to the Poisson effect, particles will interact with adjacent particles, which will obtain radial ac-celeration. The load that provides acceleration to the particles is the inertial effect, which is part of the macro-bearing capacity [27]. Gorham [28] provided a relatively perfect iner-tia effect correction model based on the energy conservation law. Forrestal [14] also proved the existence of the inertia effect in theory. Guo et al. [29] considered that the radial inertia effect is significant only when the strain rate exceeds 110 s−1. Flores-Johnson et al. [30] believed that the lateral confinement effect of the SHPB specimen is the main reason for the structural effect of all concrete-like materials. Li et al. [31] considered that the lat-eral inertial confinement of a cylindrical specimen was higher than a cubic specimen at the same strain rate. Zhou et al. [32] expressed that the increase of material strength is due to the inertia effect rather than strain rate effect. A quadratic equation was used to describe the relationship between DIF and the log of the strain rate and quantitatively confirmed by Li et al. [33,34]. Hao et al. [35,36] proposed that the reason for the large discreteness of the experimental results is that the inertial effect is unaccounted for. The quadratic equa-tion was used to express the relationship between DIF and log of the strain rate. Xu et al. [37] presented semi-empirical equations for the concrete material DIF considering the in-ternal configuration effect, by adopting a hyperbolic tangent function. Al-Salloum [38] used a power function to express the DIF model. Lu et al. [27] established a nonlinear dynamic uniaxial strength criterion, called the S criterion, based on understanding the physical mechanisms. Lee et al. [39,40] described pure rate DIF with strain rate and inertial effect with strain acceleration. The sum of the two obtains apparent DIF.
Inertia effect is an important factor causing the inaccuracy of SHPB test results of concrete materials. In order to explore the influence of the inertia effect on the strength of concrete materials under the dynamic load, SHPB tests of concrete and mortar were car-ried out in this paper. A DIF model considering strain rate effect and inertia effect was established. The dynamic mechanical response characteristics of mortar and concrete were compared and analyzed, which provides a theoretical basis and scientific support for seismic design and safety evaluation of concrete engineering.
2. Research on Strain Rate and Inertia Effect 2.1. Strain Rate Effect Research
Some typical empirical formulas for DIF have been developed based on the SHPB test of mortar and concrete specimens. The formulae were either based on power-law var-iation or followed the logarithmic trends [38]. One of the most commonly used empirical formulas for DIF was given by the CEB [17]. The DIF of the strain rate-dependent behavior of mortar and concrete can be obtained by the following piecewise function:

Materials 2022, 15, 2995 3 of 16
1.026 1
1/3 1
( / ) 30 sDIF= =
( / ) 30 s
sscd
cs s s
ff
αε ε ε
γ ε ε ε
−
−
≤
>
(1)
where ε is the strain rate, csf and cdf are the unconfined compressive strength in quasi-static and dynamic loading, respectively, and (6.156 2.0)10 s
sαγ −= , 0=1/(5+9 / )s cs cf fα
, 0 =10 MPacf , -6=30 10 /s sε × . Equation (1) shows a nonlinear relationship between the dynamic strength of mortar and concrete and the high strain rate.
Tedesco and Ross [18] conducted a series of SHPB tests where the DIF rapidly in-creases with the strain rate. A logarithmic function can describe the relationship between DIF and strain rate:
1
1
0.00965log 1.058 1.0 63.1sDIF=
0.758log 0.289 2.5 63.1sε ε
ε ε
−
−
+ ≥ ≤
− ≤ >
(2)
Through explosion resistance tests of the ultra-high-strength concrete panel, Ngo et al. [20] also believed that there is a logarithmic relationship between DIF and strain rate at high strain rates with the formula:
1.026
1
1 2 1
DIF= =
ln( )
cds
cs
ff
A A
αε ε εε
ε ε ε
≤
− >
(3)
where -5 1=3 10 ssε
−× , 1 / (20 / 2)csfα = + , 2
1 0.0022 0.1989 46.137cs csf fε = − + , 1 0.0044 0.9866csA f= − + , 2 0.0128 2.1396csA f= − + .
Guo et al. [29] viewed that the CEB-FIP 2010 equation [41] is not suitable for high strength concrete through the SHPB test of concrete with different strength, and proposed the following formula:
0.014
10
( / )DIF=
log ( / )s TR
s TRA Bε ε ε ε
ε ε ε ε ≤
+ >
(4)
where TRε is the transition strain rate, and A and B are constants.
2.2. Inertial Effect Research Because the linear function cannot accurately describe the relationship between the
DIF and the logarithmic strain rate under high a strain rate, some scholars used quadratic or cubic equations to describe it. Grote et al. [19] tested the cement mortar specimens on SHPB with strain rates ranging from 250 to 1700 s−1 and gave the following equations:
1
3 2 1
0.0235log 1.07 1.0 266.0 sDIF=
0.882( log ) 4.4(log ) 7.22(log ) 2.64 266.0 sε ε
ε ε ε ε
−
−
+ ≥ ≤
− + − >
(5)
Li et al. [34] conducted experimental and numerical studies on mortar samples. Their research results confirmed quantitatively that the apparent dynamic strength enhance-ment of concrete-like materials in a SHPB test is caused by the lateral inertia confinement instead of the strain rate sensitivity of the tested material. The DIF model was proposed as:
1
2 1
0.03438( log 3) 1 100 sDIF=
1.729( log ) -7.1372log 8.5303 100 sε ε
ε ε ε
−
−
+ + ≤
+ >
(6)

Materials 2022, 15, 2995 4 of 16
Katayama et al. [21] believed that if the mass is retained, the inertia conservation and the spatial continuity of inertia can be maintained and presented another DIF model as:
2DIF=0.2583( log ) 0.05076log 1.021ε ε− + (7)
Hao et al. [35,36] regarded that the friction at the sample bar interface is an important factor affecting the lateral inertia effect of the specimen under high-speed impact. They proposed an empirical formula to remove the influence of end friction confinement on dynamic strength increment of concrete material as:
1 1
2 1 1
0.0419log +1.2165 1s 10 sDIF =
0.8988(log ) 2.8255(log ) 3.4907 30 s 1000 sMortar
ε ε
ε ε ε
− −
− −
< ≤
− + < ≤
(8)
1 1
2 1 1
0.0191log +1.2222 1s 220 sDIF =
1.6607(log ) 6.9122(log ) 8.346 220 s 1000 sAggregate
ε ε
ε ε ε
− −
− −
< ≤
− + < ≤
(9)
where DIFAggregate is the DIF of concretes with aggregates. Under a high strain rate, the inertia effect cannot be eliminated [23], and it dominates
[26,29]. However, there is no further study on the influence of the inertia effect in Equa-tions (5)–(9). Quadratic or cubic equations were used to fit the experimental data to obtain a higher fitting degree, leading to a non-conservative prediction [39]. Lee et al. [39,40] proposed a new concrete DIF that excludes inertia effects by considering the strain accel-eration and geometry of the specimens based on SHPB test results, described by the for-mula:
1
2 2
2 3
DIF =DIF
DIF =
apparent rate inertia
k
rates
s s s sinertia
cs cs
f
d lf k kf f
εε
ρ ρε ε
+ ∆
∆ = +
(10)
where DIFapparent , DIFrate , and inertiaf∆ are apparent DIF, pure rate DIF, and strength en-
hancement caused by inertia effects, respectively. ε , sρ , sd , and sl denote axial strain acceleration, density, the diameter of the specimen, and the initial specimen length, re-spectively. 1k , 2k , and 3k are the material parameters.
Under the high strain rate, the particles in the specimen will obtain axial acceleration, i.e., axial inertial force. In addition, lateral inertial force is also generated due to the influ-ence of Poisson’s ratio. The macroscopic resistance of concrete must balance the actual failure force, axial inertia force, and lateral inertia force [27], as shown in Figure 1 and Equation (11).
( )+ ( , )f dQ f I maσ µ= (11)
where Q is the macroscopic resistance, ( )ff σ is a function of the actual failure stress,
( , )dI ma µ is a function of the inertial force, m is the quality of the particle, a is the acceleration of the particle, and dµ is the dynamic Poisson’s ratio of the specimen.
Based on the previous research results, we propose a DIF model for high strain rate, as reflected in the following formula:
1 10 2 3DIF= log ( / )+sK K Kε ε ε + (12)

Materials 2022, 15, 2995 5 of 16
where 1K , 2K , and 3K are constants. The model considers the strain rate effect and the inertia effect. In order to verify the correctness of the model, SHPB experiments of mortar and concrete were carried out in this paper.
Hig
h st
rain
rate
load
ing
Lateral inertial force
Lateral inertial force
Axial inertia force
Transition force
Unit: N
Figure 1. Inertia mechanism of specimen.
3. Experimental Research 3.1. Prepare for the Experiment
Ordinary Portland cement (OPC) and potable laboratory tap water were used for the experiments. Conventional crushed stone with particle sizes between 8 and 12 mm and natural river sand with particle sizes between 0.25 and 0.5 mm were employed as coarse and fine aggregates, respectively. The concrete was mixed at the proportion of 0.52:1:1.67:2.47 (water/cement/sand/aggregate) and subsequently set standing for 24 h. The mold of the specimen was removed, and the specimen was placed in a constant tem-perature (20 °C) and humidity (95%) curing box for 28 days. The specimens were drilled and polished to smooth the end face after curing. The mortar specimens have the same composition and preparation as the cement paste in the concrete. The diameter and height of the mortar and concrete specimens used for the SHPB test were 71 × 71 mm, respec-tively, as shown in Figure 2.
(a) (b)
Figure 2. Specimens for SHPB test: (a) Mortar, (b) Concrete.
A quasi-static test was conducted before the dynamic load test. An RMT-150B multi-functional full-automatic rigid rock servo testing machine was used for the static load test. The specimen radius and height were 50 and 100 mm, respectively. There were 3 test

Materials 2022, 15, 2995 6 of 16
specimens of mortar and concrete, respectively. The average peak stresses of mortar and concrete specimens were 53.06 and 31.61 MPa, respectively, and their standard deviations were 2.31 and 1.91 MPa, respectively. In order to analyze the dynamic response charac-teristics of the two kinds of materials, the strain rates of mortar and concrete were ex-tracted in the test. The average strain rates of mortar and concrete specimens were 1.03 × 10⁻⁵ and 1.12 × 10⁻⁵/s, respectively, and their standard deviations were 4.71 × 10⁻⁸ and 2.16 × 10⁻⁷, respectively. The stress–strain curves of mortar and concrete specimens, whose stress peak value is close to the average value, are shown in Figure 3.
0.000 0.002 0.004 0.006 0.008 0.0100
10
20
30
40
50
60
Stre
ss (M
Pa)
Strain
Mortar Concrete
Figure 3. Stress–strain curve of the quasi-static test.
From Figure 3, the compressive strength and elastic modulus of mortar are signifi-cantly greater than that of concrete under quasi-static load. This is because the aggregate of the concrete specimen has little effect under low strain rate, while the interfacial transi-tion zone significantly reduces the bearing capacity. The compressive strength of mortar and concrete was 53.07 and 31.23 MPa, respectively. The strain rates of mortar and con-crete were 1.03 × 10⁻⁵ and 1.12 × 10⁻⁵/s, respectively.
3.2. SHPB Experimental Instrument Split Hopkinson Pressure Bar (SHPB) test technology is the most important and reli-
able test method to study the mechanical properties of materials under a high strain rate. The basic working principle of the SHPB test device [1] is that when the striker bar is pushed by air pressure to hit the incident pressure bar, an incident wave is produced in the bar. When the incident wave reaches the end, a portion is reflected to form a reflected wave. Another portion will penetrate the specimen and enter the transmission bar to be-come a transmission wave. The calculation formulas for strain ( )S tε , strain rate ( )S tε , and stress ( )S tσ of the specimen in the test are as follows:
00
0
( ) [ ( )- ( )- ( )]dt
S I R TCt t t t tl
ε ε ε ε= − ∫ (9)
0( ) [ ( )+ ( )+ ( )]2S I R T
S
AEt t t tA
σ ε ε ε= (14)
0
0
( ) [ ( )- ( )- ( )]S I R TCt t t tl
ε ε ε ε= − (15)
Materials 2022, 15, 2995 7 of 16
where: 0C is the P-wave velocity of compression bar, 0l is the length of the specimen, , SA A are the cross-sectional areas of compression bar and specimen, respectively, 0E is
the elastic modulus of the compression bar, and ( )I tε , ( )R tε , and ( )T tε are the strain signals of the incident, reflected waves, and transmission waves, respectively.
To obtain accurate and reliable data, a tapered incident bar with a diameter of 74 mm was used in the SHPB system as shown in Figure 4. The steel bars had a Young’s modulus
0E = 200 GPa and Poisson’s ratio υ = 0.3.
Striker bar Pulse shaper Incident bar Strain gauge Specimen Transmission barStrain gauge
600 3200 1800
37
74
Unit: mm
Figure 4. Schematic diagram of SHPB test.
There is severe waveform dispersion in the large diameter SHPB test. To prolong the rise time of the incident wave and filter its high-frequency oscillation, a pulse shaper was fixed on the end face of the incident bar in contact with the bullet [42,43]. The rectangular impact pulse was transformed into a triangular pulse to lengthen its rising edge by the pulse shaper. The wave dispersion can also be reduced by placing the strain gauge on the transmission bar as close to the specimen as possible. Vaseline was applied on both end faces of the sample to reduce the influence of the radial inertia effect by reducing friction. The brass and rubber shapers were tested with no specimen to examine the effect of dif-ferent pulse shapers. Both shapers had a 20 mm diameter.
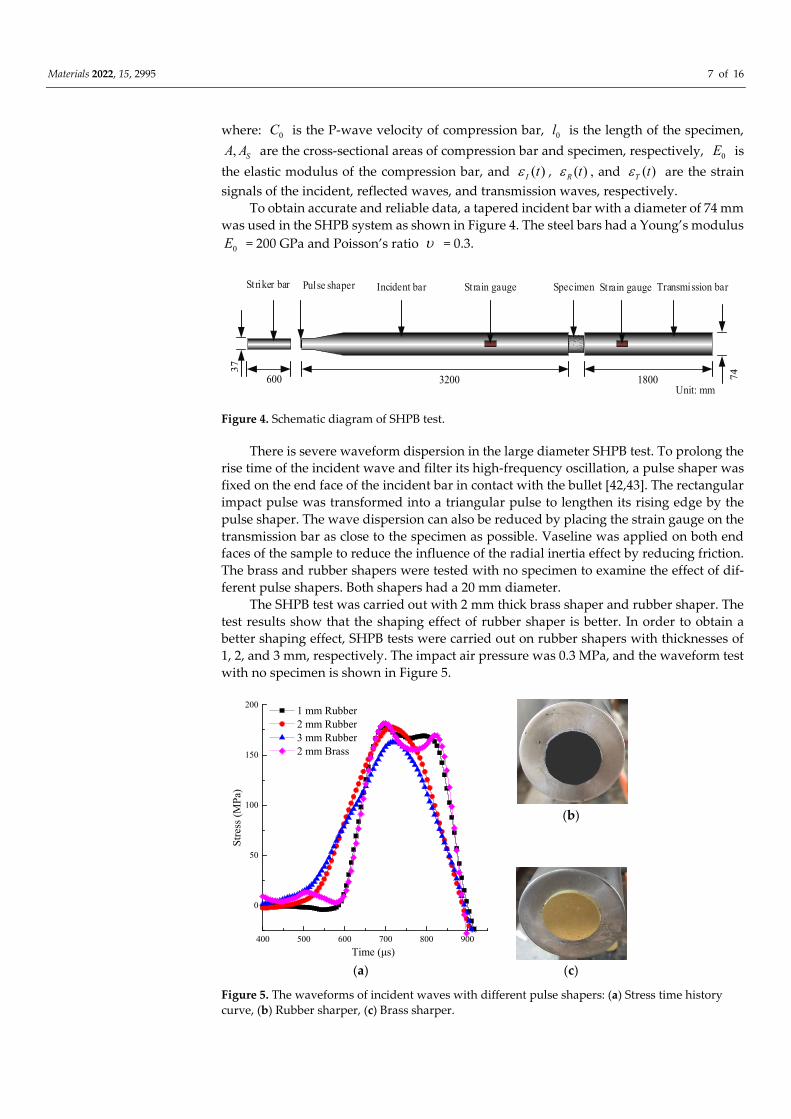
The SHPB test was carried out with 2 mm thick brass shaper and rubber shaper. The test results show that the shaping effect of rubber shaper is better. In order to obtain a better shaping effect, SHPB tests were carried out on rubber shapers with thicknesses of 1, 2, and 3 mm, respectively. The impact air pressure was 0.3 MPa, and the waveform test with no specimen is shown in Figure 5.
400 500 600 700 800 900
0
50
100
150
200
Stre
ss (M
Pa)
Time (μs)
1 mm Rubber 2 mm Rubber 3 mm Rubber 2 mm Brass
(b)
(a) (c)
Figure 5. The waveforms of incident waves with different pulse shapers: (a) Stress time history curve, (b) Rubber sharper, (c) Brass sharper.

Materials 2022, 15, 2995 8 of 16
Figure 5 depicts the stress wave curves monitored in the incident bar. The positive and negative values of the curve indicate the direction of stress. It shows that the wave-forms obtained by the brass shaper and 1 mm thick rubber shaper are relatively similar and both rectangular. The waveforms obtained by 2 and 3 mm thick rubber shapers are triangular waveforms, and the rise time is also long. When the incident waveform is a half-sine wave, the constant strain rate loading of the specimen is realized, and the inertia effect is greatly reduced [44]. At 0.25 MPa impact pressure, the 1 mm thickness rubber shaper was selected, and the 2mm thickness rubber shaper was selected in other cases.
3.3. SHPB Experimental The striker bar can obtain different initial velocities by different impact air pressures.
The selected five groups of impact pressures were 0.25, 0.3, 0.4, 0.5, and 0.6 MPa. When the impact air pressure is 0.25 MPa, a 1 mm thickness rubber shaper was selected because the current signal cannot be collected by a 2 mm thickness rubber shaper. A 2 mm thick rubber shaper was used in other cases. Each group was subjected to three impact tests. The data with a large error were removed. Then, a typical stress–strain curve was selected from each group to plot, as shown in Figure 6.
0.00 0.02 0.04 0.06 0.08 0.10 0.12 0.140
20
40
60
80
100
120
140
160
180
Stee
ss (M
Pa)
Strain
Strain rate 162.90 /s 189.26 /s 355.56 /s 466.29 /s 539.12 /s
0.00 0.02 0.04 0.06 0.08 0.10 0.12 0.140
20
40
60
80
100
120
140
160
180
Stre
ss (M
Pa)
Strain
Strain rate 162.85 /s 225.40 /s 357.39 /s 480.78 /s 553.72 /s
(a) (b)
Figure 6. Stress–strain curve: (a) Mortar, (b) Concrete.
Both graphs have the same scale on the x and y axes for comparison in Figure 6. It shows that the strain rate increases the peak stress of mortar and concrete samples. It in-dicates that mortar and concrete specimens have a noticeable strain rate effect. The corre-sponding strain rate time history curve is shown in Figure 6.
Figure 7 shows that high strain rates were obtained for the specimens by the SHPB test with a large-diameter bar. The maximum mortar and concrete strain reached 539.12 and 553.72/s, respectively. When the impact air pressure was 0.25 MPa, a 1 mm thickness rubber shaper was selected because a 2 mm thickness rubber shaper cannot collect the current signal. When the impact pressure was 0.25 MPa, the thickness of the rubber shaper was 1 mm, and when the slope of the rising edge of the strain rate time history curve was greater than at 0.30 MPa impact pressure, the thickness was 2 mm. Under a high strain rate, the duration of the constant strain rate is short, and the inertia effect is dominant.
When comparing the impact pressure of 0.25 and 0.30 MPa in Figures 4–6, the rubber shaper thickness was 1 mm and 2 mm, respectively. Although the impact pressure of 0.25 MPa is less than that of 0.30 MPa, the slope of the rising edge of the waveform obtained by 1 mm thick shaper is greater than that obtained by 2 mm. In the corresponding strain rate time history curve, the slope of the rising section with a 1 mm thick shaper is also

Materials 2022, 15, 2995 9 of 16
greater than that obtained with a 2 mm. The rising slope of the strain rate time history curve is defined as the strain acceleration [40]. The strain acceleration is directly propor-tional to the inertial effect [27]. It shows that different strain accelerations can be obtained by the thickness of the pulse shaper. The peak stress of the two cases is close in Figure 5, indicating that the inertia effect increases the dynamic strength of the sample. When the thickness of rubber shaper is the same, the peak stress and strain acceleration increase significantly with the impact pressure. It can also be seen from Figure 6 that under high strain rate, the duration of the constant strain rate is short, and the inertia effect is domi-nant.
0 50 100 150 200 250 300 350 4000
100
200
300
400
500
600
Stra
in ra
te (/
s)
Time (μs)
Strain rate 162.90 /s 189.26 /s 355.56 /s 466.29 /s 539.12 /s
0 50 100 150 200 250 300 350 400
0
100
200
300
400
500
600
Stra
in ra
te (/
s)
Time(μs)
Strain rate 162.85 /s 225.40 /s 357.39 /s 480.78 /s 553.72 /s
(a) (b)
Figure 7. Strain rate time history curve: (a) Mortar, (b) Concrete.
3.4. Dynamic Uniaxial Strength Criterion According to the analysis in Section 2.1, it is common to describe the relationship
between DIF and strain rate by logarithmic function under the high strain rate. Therefore, the logarithmic function was adopted to fit the relationship between DIF and strain rate. The fitting results are shown in Figure 8.
0.0
0.5
1.0
1.5
2.0
2.5
3.0
3.5
4.0
4.5
7.0 7.2 7.4 7.6 7.8 8.0
Mortar
Concrete
Linear fitting (Mortar)
Linear fitting (Concrete)
0.0
0.5
1.0
1.5
2.0
2.5
3.0
3.5
4.0
4.5
7.0 7.1 7.2 7.3 7.4 7.5 7.6 7.7 7.8
Mortar
Concrete
Linear fitting (Mortar)
Linear fitting (Concrete)
DIF
10Log ( / )sε ε
102
DIF 3.0837 log ( / ) 20.1540
0.7873Concrete s
R
ε ε= −
=
102
DIF 2.6501log ( / ) 17.9200
0.7337Mortar s
R
ε ε= −
=
Figure 8. Variation of DIF with logarithm of strain rate.

Materials 2022, 15, 2995 10 of 16
In Figure 8, the relationship between DIF and strain rate of mortar and concrete is expressed by a logarithmic function as:
210
210
DIF 2.6501log ( / ) 17.9200, 0.7337
DIF 3.0837 log ( / ) 20.1540, 0.7873Mortar s
Concrete s
R
R
ε ε
ε ε
= − =
= − =
(10)
where DIFMortar , DIFConcrete are dynamic increase factors of mortar and concrete, respec-tively. The logarithmic function can express the trend relationship between DIF and strain rate. The strain rate effect of concrete is more sensitive than that of mortar by comparing the coefficient of 10log ( / )sε ε . When 10log ( / ) 7.7sε ε > , the DIF of mortar and concrete has a noticeable sudden change (see the mark in Figure 8). Therefore, the logarithmic strain rate cannot accurately describe DIF under a high strain rate.
Next, the inertia effect was considered. SHPB test data were fitted by Equation (12). The abscissa was set as 1 10 2log ( / )+sK Kε ε ε to express the fitting relationship, and the fitting results are shown in Figure 9.
0.0
0.5
1.0
1.5
2.0
2.5
3.0
3.5
4.0
4.5
8 9 10 11 12 13 14
Mortar
Concrete
Linear fitting (Mortar)
Linear fitting (Concrete)
DIF
102
DIF =1.0260log ( / )+0.6501 7.2540
=0.8606Mortar s
R
ε ε ε −
102
DIF =1.5410log ( / )+0.4580 9.6820
=0.8477Concrete s
R
ε ε ε −
1 10 2log ( / )+sK Kε ε ε Figure 9. Variation of DIF with the logarithm of strain rate and strain acceleration.
In Figure 9, the DIF fitting function of mortar and concrete considering strain rate and strain acceleration is as follows:
210
210
DIF =1.0260log ( / )+0.6501 -7.2540, =0.8606
DIF =1.5410log ( / )+0.4580 -9.6820, =0.8477Mortar s
Concrete s
R
R
ε ε ε
ε ε ε
(11)
When compared with Equation (16), the fitting degree is improved. It indicates that Equation (12) is feasible to fit the DIF of mortar and concrete under a high strain rate. When comparing the 10log ( / )sε ε coefficient in Equation (17), the strain rate effect of concrete is more sensitive than that of mortar, which is consistent with the above analysis.

Materials 2022, 15, 2995 11 of 16
When compared with the ε coefficient, the inertia effect of mortar is more sensitive than that of concrete. Therefore, the strain rate effect of the material is more sensitive, but the inertia effect is not necessarily more sensitive.
4. Research on Energy Utilization and Fragmentation Morphology 4.1. Energy Utilization Research
The energy utilization was studied to compare the effect of strain rate on the energy utilization of mortar and concrete in large-diameter SHPB tests. The energy calculation formula of stress waves is:
20 0 0
20 0 0
( ) ( )d
( ) ( )d
t
I S I
t
T S T
W t E C A t t
W t E C A t t
ε
ε
= =
∫∫
(12)
where IW is incident energy and TW is the transmission energy. The calculation formula of energy utilization η is:
100%T
I
WW
η = ⋅ (13)
Figure 10 represents the energy utilization of mortar and concrete. The energy utili-zation of mortar and concrete increases with the strain rate, but the increase of mortar is faster. Under the same strain rate, the energy utilization of mortar is higher than that of concrete. Under the impact compression of large diameter SHPB, the energy utilization of mortar and concrete specimens is relatively low, and the highest is only 4.99%.
0.0
1.0
2.0
3.0
4.0
5.0
6.0
0 100 200 300 400 500 600
Mortar
Concrete
Liner fitting (Mortar)
Liner fitting (Concrete)
Strain rate (/s)
Ener
gy u
tiliz
atio
n (%
)
2
=0.0034 2.4708
0.6403Mortar
R
η ε +
=
2
=0.0019 0.3106
0.6241Concrete
R
η ε +
=
Figure 10. Relation between energy utilization and strain rate.
4.2. Fragmentation Morphology Research The fracture morphology is an important aspect of evaluating the impact potentiality
of concrete materials [45,46]. The pore sizes of classifying screens selected in this test were 2.0, 5.0, 10.0, 20, and 40 mm. The broken specimens were sieved into six groups with par-ticle size ranges of 0.0–2.0, 2.0–5.0, 5.0–10.0, 10.0–20.0, 20.0–40.0 , and 40–71 mm (71 mm is the diameter of the sample before fragmentation), respectively. The weighing instrument was a high-precision electronic scale with a measuring range of 1 kg and an accuracy of 0.1 g.
After impact, the broken specimens were collected, classified, and screened individ-ually. First, the classifying screens were stacked from high to low according to the pore

Materials 2022, 15, 2995 12 of 16
size. Then, the broken specimens were placed on the sieve with the largest mesh size on the uppermost layer, so that the specimens with different fragmentation degrees could be separated according to size. After screening, the fragmentation on each sieve was placed on the electronic scale for weighing, and the measurement results were recorded one by one. The screened fragmentations of mortar and concrete are shown in Figure 11.
Figure 11 shows the final fragmentation morphologies of mortar and concrete under the similar strain rate. It can be seen that the fragmentation morphologies of mortar and concrete specimens under impact load are different. The mortar sample was cracked along the axial direction. Although the mortar specimen was penetrated by cracks, the strip frag-ment still had high strength in the loading direction. The strips after impact splitting can still bear the impact load on the bar as a whole. However, the fragmentation degree of concrete specimen was very large, and the cracks mostly occurred in the interface transi-tion zone (ITZ) between mortar and aggregate. From the fact that the strength of concrete was lower than that of mortar, the aggregate plays a small role in dynamic loading, so the ITZ reduces the strength of concrete.
(a) (b)
Figure 11. Fragmentation morphologies of mortar and concrete: (a) Mortar (466.29/s), (b) Concrete (480.78/s).
To quantify the fragmentation degree of the specimen, the average fragment size of the broken specimen was adopted. The calculation formula is as follows:
i i
i
n XX
n= ∑∑
(20)
where X is the average fragment size of the broken specimen in mm, iX is the average
size of specimen fragmentation retained on the classifying screen of class i, in mm, and in
is the proportion of fragment mass with an average size iX in %. The median values of the average size of the fragmentation on each classifying screen
were taken according to the sieve diameter, which are 1, 3.5, 7.5, 15, 30, and 55.5 mm. The relationship between the average fragment size of mortar and concrete and strain rate is shown in Figure 12.
In Figure 12, MortarX and ConcreteX represent the average fragment size of mortar and concrete, respectively. With the increase of strain rate, the average fragment size of mortar and concrete decreases, but that of the concrete decreases faster. Under the same strain rate, the average fragment size of mortar is larger than that of concrete. The average frag-ment size of mortar is 42.03–52.36 mm, and that of concrete is 20.89–40.21 mm. Therefore, mortar is better than concrete in the storage performance of elastic strain energy, indicat-ing that the impact failure ability of mortar is stronger than that of concrete.

Materials 2022, 15, 2995 13 of 16
0
10
20
30
40
50
60
100 200 300 400 500 600
Mortar
Concrete
Liner fitting (Mortar)
Liner fitting (Concrete)
Ave
rage
size
of f
ragm
ents
(mm
)
Strain rate (/s)
2
0.0352 +41.9140
=0.6862ConcreteX
R
ε= −
2
0.0177 +53.9780
=0.6259MortarX
R
ε= −
Figure 12. Relation between average block size and strain rate of mortar and concrete.
5. Discussion Under high strain load, axial acceleration will be obtained by the grains in the speci-
men. The lateral acceleration will be obtained due to the Poisson effect. In the study of inertial effect, the lateral inertial force is often considered, while the axial inertial force is often ignored. Although the axial acceleration is consistent with the bearing capacity di-rection of the specimen, it is caused by the uneven stress of the sample. It is closely related to the slope of the rising edge of the loading waveform, and independent from the con-stant strain rate of the specimen. The axial acceleration is not a part of the real strength of the specimen. Therefore, the axial inertial force should also be taken into account in the study of inertial effect. The lateral strain or dynamic Poisson’s ratio should be taken as the monitored object during the SHPB test.
The inertial effect was studied by theoretical analysis or numerical simulation, but the data extraction of strain acceleration was often ignored. In the SHPB test, it was found that the rising edge of the incident wave can be changed by rubber shapers with different thicknesses, and the inertia effect can be changed accordingly. Therefore, the control var-iable method can be used in the indoor test, that is, the strain rate and strain acceleration can be controlled respectively to study the inertial effect. The test can be repeated in the laboratory. One of the highlights of this paper is in establishing a DIF model considering inertial effect by considering strain rate and strain acceleration. In the future research, digital image correlation (DIC), CT scanning, and other technologies could be used to re-trieve the strain, crack, and damage of the specimen under inertial effect [47,48]. It is help-ful to deeply understand the inertial effect, establish an accurate dynamic model, and pro-vide a theoretical basis for rock dynamics theory, disaster warnings, and safety assess-ments.
6. Conclusions In this paper, the large-diameter SHPB tests on concrete and mortar were performed,
the inertia effect was studied. The conclusions are as follows: (1) The macroscopic resistance of concrete material is composed of the actual failure
force, axial inertia force, and lateral inertia force. The dynamic growth factor (DIF) model was established. The DIF model comprehensively considers the influence of strain rate on the actual dynamic strength of concrete materials and the influence of strain acceleration on inertial effect.

Materials 2022, 15, 2995 14 of 16
(2) With the increase of bullet impact velocity, the influence of inertia effect becomes greater and greater. The strain rate effect of concrete is more sensitive than that of mortar, but the inertia effect of mortar is more sensitive than that of concrete.
(3) With the increase of strain rate, the energy utilization of mortar and concrete in-creases, while the average fragment size decreases. Under the same strain rate, the energy utilization rate, average fragment size, and impact potentiality of mortar are higher than that of concrete.
Author Contributions: Conceptualization, B.S., R.C., Z.Z. and N.W.; methodology, B.S. and Z.S.; software, B.S. and Z.S.; validation, B.S. and R.C.; formal Analysis, B.S., R.C. and N.W.; investigation, N.W. and Z.S.; resources, B.S., Y.P. and Z.Z.; data curation, B.S. and N.W.; writing—original draft preparation, B.S.; writing—review and editing, B.S., R.C., Z.Z., Y.P. and N.W.; visualization, Z.S.; supervision, R.C., Z.Z., Y.P. and N.W.; project administration, R.C.; funding acquisition, R.C., Z.Z., Y.P. and N.W. All authors have read and agreed to the published version of the manuscript.
Funding: This study was supported by the National Natural Science Foundation of China (Grant No. 52108448 and 51878249), and the Science and Technology Planning Project of Shenzhen Munic-ipality (Grant No. JCYJ20190806144603586).
Institutional Review Board Statement: Not applicable.
Informed Consent Statement: Not applicable.
Data Availability Statement: Not applicable.
Conflicts of Interest: The authors declare no conflict of interest. The funders had no role in the design of the study; in the collection, analyses, or interpretation of data; in the writing of the manu-script, and in the decision to publish the results.
References 1. Kolsky, H. An Investigation of the Mechanical Properties of Materials at very High Rates of Loading. Proc. Phys. Soc. Sect. B
1949, 62, 676–700. 2. Li, X.; Lok, T.; Zhao, J.; Zhao, P. Oscillation elimination in the Hopkinson bar apparatus and resultant complete dynamic stress–
strain curves for rocks. Int. J. Rock Mech. Min. Sci. 2000, 37, 1055–1060. https://doi.org/10.1016/s1365-1609(00)00037-x. 3. Yang, G.; Chen, X.; Xuan, W.; Chen, Y. Dynamic compressive and splitting tensile properties of concrete containing recycled
tyre rubber under high strain rates. Sādhanā 2018, 43, 178. https://doi.org/10.1007/s12046-018-0944-5. 4. Wu, N.; Fu, J.; Zhu, Z.; Sun, B. Experimental study on the dynamic behavior of the Brazilian disc sample of rock material. Int. J.
Rock Mech. Min. Sci. 2020, 130, 104326. https://doi.org/10.1016/j.ijrmms.2020.104326. 5. Wu, N.; Zhu, Z.; Zhang, C.; Luo, Z. Dynamic Behavior of Rock Joint under Different Impact Loads. KSCE J. Civ. Eng. 2019, 23,
541–548. https://doi.org/10.1007/s12205-018-0799-7. 6. Sun, B.; Ping, Y.; Zhu, Z.; Jiang, Z.; Wu, N. Experimental Study on the Dynamic Mechanical Properties of Large-Diameter Mortar
and Concrete Subjected to Cyclic Impact. Shock Vib. 2020, 2020, 8861197. https://doi.org/10.1155/2020/8861197. 7. Jankowiak, T.; Rusinek, A.; Voyiadjis, G.Z. Modeling and Design of SHPB to Characterize Brittle Materials under Compression
for High Strain Rates. Materials 2020, 13, 2191. 8. Merle, R.; Zhao, H. On the errors associated with the use of large diameter SHPB, correction for radially non-uniform distribu-
tion of stress and particle velocity in SHPB testing. Int. J. Impact Eng. 2006, 32, 1964–1980. https://doi.org/10.1016/j.ijim-peng.2005.06.009.
9. Malvern, L.E.; Ross, C.A. Dynamic Response of Concrete and Concrete Structures; Deptment of Engineering Sciences, Florida Uni-versity: Gainesville, FL, USA, 1986.
10. Huang, R.; Li, S.; Meng, L.; Jiang, D.; Li, P. Coupled Effect of Temperature and Strain Rate on Mechanical Properties of Steel Fiber-Reinforced Concrete. Int. J. Concr. Struct. Mater. 2020, 14, 48.
11. Li, S.H.; Zhu, W.C.; Niu, L.L.; Yu, M.; Chen, C.F. Dynamic Characteristics of Green Sandstone Subjected to Repetitive Impact Loading: Phenomena and Mechanisms. Rock Mech. Rock Eng. 2018, 51, 1921–1936. https://doi.org/10.1007/s00603-018-1449-6.
12. Zhang, X.; Yang, Z.-J.; Huang, Y.-J.; Wang, Z.-Y.; Chen, X.-W. Micro CT Image-based Simulations of Concrete under High Strain Rate Impact using a Continuum-Discrete Coupled Model. Int. J. Impact Eng. 2021, 149, 103775. https://doi.org/10.1016/j.ijim-peng.2020.103775.
13. Zhou, J.-K.; Ge, L.-M. Effect of strain rate and water-to-cement ratio on compressive mechanical behavior of cement mortar. J. Cent. South Univ. 2015, 22, 1087–1095. https://doi.org/10.1007/s11771-015-2620-9.
14. Forrestal, M.; Wright, T.; Chen, W. The effect of radial inertia on brittle samples during the split Hopkinson pressure bar test. Int. J. Impact Eng. 2007, 34, 405–411. https://doi.org/10.1016/j.ijimpeng.2005.12.001.

Materials 2022, 15, 2995 15 of 16
15. Huang, X.; Kong, X.; Chen, Z.; Fang, Q. A computational constitutive model for rock in hydrocode. Int. J. Impact Eng. 2020, 145, 103687. https://doi.org/10.1016/j.ijimpeng.2020.103687.
16. Hao, Y.; Hao, H.; Li, Z. Influence of end friction confinement on impact tests of concrete material at high strain rate. Int. J. Impact Eng. 2013, 60, 82–106. https://doi.org/10.1016/j.ijimpeng.2013.04.008.
17. Comite Euro-International du Beton. CEB-FIP Model Code 1990[S]; Redwood Books: Trowbridge, UK, 1993. 18. Tedesco, J.W.; Ross, C.A. Strain-Rate Dependent Constitutive Equations for Concrete. ASME J. Press. Vessel Technol. 1998, 120,
398–405. https://doi.org/10.1115/1.2842350. 19. Grote, D.L.; Park, S.W.; Zhou, M. Dynamic behavior of concrete at high strain rates and pressures: I. experimental characteriza-
tion. Int. J. Impact Eng. 2001, 25, 869–886. https://doi.org/10.1016/s0734-743x(01)00020-3. 20. Ngo, T.; Mendis, P.; Krauthammer, T. Behavior of Ultrahigh-Strength Prestressed Concrete Panels Subjected to Blast Loading.
J. Struct. Eng. 2007, 133, 1582–1590. https://doi.org/10.1061/(asce)0733-9445(2007)133:11(1582). 21. Katayama, M.; Itoh, M.; Tamura, S.; Beppu, M.; Ohno, T. Numerical analysis method for the RC and geological structures sub-
jected to extreme loading by energetic materials. Int. J. Impact Eng. 2007, 34, 1546–1561. https://doi.org/10.1016/j.ijim-peng.2006.10.013.
22. Hartmann, T.; Pietzsch, A.; Gebbeken, N. A Hydrocode Material Model for Concrete. Int. J. Prot. Struct. 2010, 1, 443–468. https://doi.org/10.1260/2041-4196.1.4.443.
23. Xing, H.; Zhang, Q.; Ruan, D.; Dehkhoda, S.; Lu, G.; Zhao, J. Full-field measurement and fracture characterisations of rocks under dynamic loads using high-speed three-dimensional digital image correlation. Int. J. Impact Eng. 2018, 113, 61–72. https://doi.org/10.1016/j.ijimpeng.2017.11.011.
24. Sun, X.; Wang, H.; Cheng, X.; Sheng, Y. Effect of pore liquid viscosity on the dynamic compressive properties of concrete. Constr. Build. Mater. 2020, 231, 117143. https://doi.org/10.1016/j.conbuildmat.2019.117143.
25. Xie, Y.-J.; Fu, Q.; Zheng, K.-R.; Yuan, Q.; Song, H. Dynamic mechanical properties of cement and asphalt mortar based on SHPB test. Constr. Build. Mater. 2014, 70, 217–225. https://doi.org/10.1016/j.conbuildmat.2014.07.092.
26. Rossi, P.; Toutlemonde, F. Effect of loading rate on the tensile behaviour of concrete: Description of the physical mechanisms. Mater. Struct. 1996, 29, 116–118. https://doi.org/10.1007/bf02486201.
27. Lu, D.; Wang, G.; Du, X.; Wang, Y. A nonlinear dynamic uniaxial strength criterion that considers the ultimate dynamic strength of concrete. Int. J. Impact Eng. 2017, 103, 124–137. https://doi.org/10.1016/j.ijimpeng.2017.01.011.
28. Gorham, D.A. Specimen inertia in high strain-rate compression. J. Phys. D Appl. Phys. 1989, 22, 1888–1893. https://doi.org/10.1088/0022-3727/22/12/014.
29. Guo, Y.; Gao, G.; Jing, L.; Shim, V. Response of high-strength concrete to dynamic compressive loading. Int. J. Impact Eng. 2017, 108, 114–135. https://doi.org/10.1016/j.ijimpeng.2017.04.015.
30. Flores-Johnson, E.A.; Li, Q.M. Structural effects on compressive strength enhancement of concrete-like materials in a split Hop-kinson pressure bar test. Int. J. Impact Eng. 2017, 109, 408–418.
31. Li, M.; Hao, H.; Cui, J.; Hao, Y.-F. Numerical investigation of the failure mechanism of cubic concrete specimens in SHPB tests. Def. Technol. 2022, 18, 1–11. https://doi.org/10.1016/j.dt.2021.05.003.
32. Zhou, X.; Hao, H. Modelling of compressive behaviour of concrete-like materials at high strain rate. Int. J. Solids Struct. 2008, 45, 4648–4661. https://doi.org/10.1016/j.ijsolstr.2008.04.002.
33. Li, Q.; Lu, Y.; Meng, H. Further investigation on the dynamic compressive strength enhancement of concrete-like materials based on split Hopkinson pressure bar tests. Part II: Numerical simulations. Int. J. Impact Eng. 2009, 36, 1335–1345. https://doi.org/10.1016/j.ijimpeng.2009.04.010.
34. Li, Q.M.; Meng, H. About the dynamic strength enhancement of concrete-like materials in a split Hopkinson pressure bar test. Int. J. Solids Struct. 2003, 40, 343–360. https://doi.org/10.1016/s0020-7683(02)00526-7.
35. Hao, Y.F.; Hao, H. Numerical Evaluation of the Influence of Aggregates on Concrete Compressive Strength at High Strain Rate. Int. J. Prot. Struct. 2011, 2, 177–206. https://doi.org/10.1260/2041-4196.2.2.177.
36. Hao, Y.F.; Hao, H.; Jiang, G.P.; Zhou, Y. Experimental confirmation of some factors influencing dynamic concrete compressive strengths in high-speed impact tests. Cem. Concr. Res. 2013, 52, 63–70. https://doi.org/10.1016/j.cemconres.2013.05.008.
37. Xu, H.; Wen, H. Semi-empirical equations for the dynamic strength enhancement of concrete-like materials. Int. J. Impact Eng. 2013, 60, 76–81. https://doi.org/10.1016/j.ijimpeng.2013.04.005.
38. Al-Salloum, Y.; Almusallam, T.; Ibrahim, S.; Abbas, H.; Alsayed, S. Rate dependent behavior and modeling of concrete based on SHPB experiments. Cem. Concr. Compos. 2015, 55, 34–44. https://doi.org/10.1016/j.cemconcomp.2014.07.011.
39. Kim, K.-M.; Lee, S.; Cho, J.-Y. Effect of maximum coarse aggregate size on dynamic compressive strength of high-strength concrete. Int. J. Impact Eng. 2019, 125, 107–116. https://doi.org/10.1016/j.ijimpeng.2018.11.003.
40. Lee, S.; Kim, K.-M.; Park, J.; Cho, J.-Y. Pure rate effect on the concrete compressive strength in the split Hopkinson pressure bar test. Int. J. Impact Eng. 2018, 113, 191–202. https://doi.org/10.1016/j.ijimpeng.2017.11.015.
41. CEB; FIP. FIB Model Code 2010; Wiley: Hoboken, NJ, USA, 2011. 42. Zhang, H.; Liu, Y.; Sun, H.; Wu, S. Transient dynamic behavior of polypropylene fiber reinforced mortar under compressive
impact loading. Constr. Build. Mater. 2016, 111, 30–42. https://doi.org/10.1016/j.conbuildmat.2016.02.049. 43. Luo, G.; Wu, C.; Xu, K.; Liu, L.; Chen, W. Development of dynamic constitutive model of epoxy resin considering temperature
and strain rate effects using experimental methods. Mech. Mater. 2021, 159, 103887. https://doi.org/10.1016/j.mechmat.2021.103887.

Materials 2022, 15, 2995 16 of 16
44. Jiang, T.; Xue, P.; Butt, H. Pulse shaper design for dynamic testing of viscoelastic materials using polymeric SHPB. Int. J. Impact Eng. 2015, 79, 45–52. https://doi.org/10.1016/j.ijimpeng.2014.08.016.
45. Gong, F.; Wang, Y.; Wang, Z.; Pan, J.; Luo, S. A new criterion of coal burst proneness based on the residual elastic energy index. Int. J. Min. Sci. Technol. 2021, 31, 553–563. https://doi.org/10.1016/j.ijmst.2021.04.001.
46. Gong, F.-Q.; Wang, Y.-L.; Luo, S. Rockburst proneness criteria for rock materials: Review and new insights. J. Central South Univ. 2020, 27, 2793–2821. https://doi.org/10.1007/s11771-020-4511-y.
47. Kucewicz, M.; Baranowski, P.; Małachowski, J. Dolomite fracture modeling using the Johnson-Holmquist concrete material model: Parameter determination and validation. J. Rock Mech. Geotech. 2021, 13, 335–350.
48. Baranowski, P.; Kucewicz, M.; Gieleta, R.; Stankiewicz, M.; Konarzewski, M.; Bogusz, P.; Pytlik, M.; Małachowski, J. Fracture and fragmentation of dolomite rock using the JH-2 constitutive model: Parameter determination, experiments and simulations. Int. J. Impact Eng. 2020, 140, 103543. https://doi.org/10.1016/j.ijimpeng.2020.103543.
Copyright © 2022 FDOKUMEN